Yeast Surface Display for SH2 Domain Binders: A Comprehensive Guide from Library Selection to Clinical Applications
This article provides a comprehensive methodological and practical guide for researchers and drug development professionals on employing yeast surface display (YSD) for selecting and engineering high-affinity binding proteins against Src...
Yeast Surface Display for SH2 Domain Binders: A Comprehensive Guide from Library Selection to Clinical Applications
Abstract
This article provides a comprehensive methodological and practical guide for researchers and drug development professionals on employing yeast surface display (YSD) for selecting and engineering high-affinity binding proteins against Src Homology 2 (SH2) domains. SH2 domains are pivotal phosphotyrosine-recognition modules in cellular signaling and are increasingly important therapeutic targets in oncology and immunology. We detail the entire workflow, from foundational library design and panning strategies specific to the conserved SH2 fold, to advanced troubleshooting, quantitative validation using deep sequencing and biophysical assays, and comparative analysis with alternative platforms like bacterial display and Affimer technologies. The content synthesizes recent advances, including the integration of next-generation sequencing (NGS) for quantitative specificity profiling and the application of selected binders as intracellular perturbagens, diagnostic reagents, and targeted therapeutics.
Understanding SH2 Domains and the Yeast Surface Display Platform
The Biological and Therapeutic Significance of SH2 Domains in Signaling and Disease
The Src Homology 2 (SH2) domain is a structurally conserved protein module of approximately 100 amino acids that serves as a critical "reader" of tyrosine phosphorylation, one of the most pivotal post-translational modifications in eukaryotic cell signaling [1] [2]. These domains function as key regulatory elements by specifically recognizing and binding to phosphotyrosine (pTyr) residues on target proteins, thereby facilitating the assembly of multiprotein signaling complexes that control cellular processes including growth, differentiation, survival, and immune activation [1] [3]. The fundamental importance of SH2 domains is evidenced by their presence in over 110 human proteins, including kinases, phosphatases, adaptor proteins, and transcription factors, making them one of the largest specialized domain families dedicated to phosphotyrosine recognition [2] [4] [5].
SH2 domains achieve cellular signaling specificity through their ability to recognize not only the phosphotyrosine moiety but also the amino acid residues flanking the phosphorylation site, particularly those C-terminal to the pTyr [1] [5]. This dual recognition mechanism allows different SH2 domains to discriminate between distinct phosphorylation motifs, enabling precise routing of signaling information through complex networks. The dysregulation of SH2-mediated interactions is implicated in numerous human diseases, including cancer, immunodeficiencies, and developmental disorders, positioning these domains as attractive targets for therapeutic intervention [2] [6]. This application note explores the biological significance of SH2 domains and details experimental protocols for investigating their function, with particular emphasis on yeast surface display methodologies for selecting and characterizing SH2-binding proteins.
Structural and Mechanistic Basis of SH2 Domain Function
Conserved Architecture and Phosphopeptide Recognition
All SH2 domains share a highly conserved structural fold consisting of a central anti-parallel β-sheet flanked by two α-helices, forming a compact structure that accommodates phosphopeptide ligands in two adjacent binding pockets [1] [6] [5]. The first pocket is highly conserved and contains a critical arginine residue (at position βB5) that forms bidentate hydrogen bonds with the phosphate moiety of phosphotyrosine, contributing approximately half of the total binding energy [1] [7] [5]. The second pocket, which is more variable, provides specificity by recognizing 3-5 amino acid residues C-terminal to the phosphotyrosine, with particular importance placed on residues at the pY+3 position for many SH2 domains [1] [8] [5]. This structural arrangement allows SH2 domains to bind with moderate affinity (typically Kd values ranging from 0.1-10 μM), which is essential for facilitating transient yet specific interactions in dynamic signaling processes [6] [5].
The following table summarizes key structural and biophysical properties of SH2 domains:
Table 1: Fundamental Characteristics of SH2 Domains
| Property | Description | Functional Significance |
|---|---|---|
| Size | ~100 amino acids [1] | Compact modular domain easily incorporated into multi-domain proteins |
| Conserved Residue | Arginine βB5 [1] [7] | Essential for phosphotyrosine coordination via salt bridge formation |
| Binding Affinity | 0.1 - 10 μM (Kd) [6] [5] | Enables transient interactions suitable for dynamic signaling |
| Specificity Determinant | Residues C-terminal to pTyr (pY+1 to pY+5) [1] [8] | Allows discrimination between different phosphorylation sites |
| Structural Motif | α-β sandwich with 7 β-strands and 2 α-helices [1] [6] | Provides stable scaffold for binding pocket formation |
Diversity and Classification of SH2 Domain-Containing Proteins
SH2 domain-containing proteins can be broadly classified into several functional categories based on their domain architecture and biological roles. The human genome encodes approximately 111 proteins containing 121 SH2 domains, representing a remarkable expansion that parallels the evolution of multicellularity and complex tissue organization in metazoans [2] [4]. These proteins include receptor and non-receptor tyrosine kinases, phosphatases, adaptor proteins, ubiquitin ligases, and transcription factors that collectively regulate virtually all aspects of cellular communication [2] [6]. Notably, SH2 domains are not found in yeast and first appear at the evolutionary boundary between protozoa and animalia in organisms such as the social amoeba Dictyostelium discoideum, highlighting their specialized role in complex multicellular signaling [1] [4].
Table 2: Major Functional Classes of SH2 Domain-Containing Proteins
| Protein Class | Representative Examples | Biological Functions |
|---|---|---|
| Tyrosine Kinases | Src, Abl, Fps, Fgr [2] | Catalyze tyrosine phosphorylation; often regulated by intramolecular SH2 interactions |
| Phosphatases | SHP1, SHP2 [2] [7] | Remove phosphate groups; SH2 domains regulate catalytic activity and substrate recruitment |
| Adaptor Proteins | Grb2, Crk, Shc, Nck [2] | Lack enzymatic activity but mediate complex assembly through multiple interaction domains |
| Transcription Factors | STAT family [2] [6] | SH2 domains mediate dimerization and nuclear translocation upon activation |
| Lipid-Modifying Enzymes | PI3K regulatory subunits, PLCγ [2] [7] | Connect tyrosine phosphorylation to lipid second messenger systems |
SH2 Domains in Cellular Signaling and Disease Pathogenesis
Role in Normal Cellular Signaling Networks
SH2 domains function as critical nodes in tyrosine kinase signaling pathways by recruiting downstream effector proteins to activated, autophosphorylated receptor tyrosine kinases (RTKs) [3] [5]. For example, upon growth factor stimulation and receptor activation, the SH2 domain of the adaptor protein Grb2 binds to specific phosphotyrosine sites on the receptor, thereby recruiting the SOS guanine nucleotide exchange factor to the membrane where it activates Ras signaling [3] [7]. Similarly, the SH2 domains of phospholipase Cγ (PLCγ) and the regulatory subunit of phosphoinositide 3-kinase (PI3K) mediate their recruitment to activated receptors, initiating downstream signaling cascades that control cell proliferation, metabolism, and survival [7] [5].
Beyond receptor proximal signaling, SH2 domains play crucial regulatory roles within individual signaling proteins. In the Src family kinases (SFKs), the SH2 domain mediates autoinhibition by engaging a C-terminal phosphotyrosine residue, maintaining the kinase in a closed, inactive conformation [8] [7]. Activation occurs when competing phosphoproteins with higher affinity for the SH2 domain displace this intramolecular interaction, relieving autoinhibition. Similar regulatory mechanisms operate in other tyrosine kinases including Abl and Fes, as well as in phosphatases such as SHP2, where SH2 domain engagement allosterically controls catalytic activity [7] [5].
Figure 1: SH2 domains in signal transduction. SH2 domains mediate downstream signaling by recruiting effector proteins to activated, phosphorylated receptor tyrosine kinases (RTKs).
Dysregulation in Human Disease
Given their central position in signaling networks, it is not surprising that dysregulation of SH2 domain function is implicated in numerous human diseases. Mutations that disrupt SH2 domain stability or phosphopeptide binding are directly linked to human immunodeficiencies, including X-linked agammaglobulinemia and severe combined immunodeficiency [1] [2]. In cancer, aberrant SH2 domain function can result from multiple mechanisms, including mutations in SH2 domains themselves, overexpression of SH2-containing proteins, or hyperactivation of upstream tyrosine kinases that enhance SH2-dependent interactions [2] [6]. For example, gain-of-function mutations in the SH2 domain of the phosphatase SHP2 are associated with Noonan syndrome and juvenile myelomonocytic leukemia, while mutations affecting the SH2 domain of the adaptor protein SLAM-associated protein (SAP) cause X-linked lymphoproliferative disease [2].
Recent research has revealed that intracellular pH sensing represents another layer of SH2 domain regulation with implications for disease. A computational pipeline identified conserved pH-sensitive structures in SH2 domains, including those of c-Src and SHP2, where protonation of key histidine residues at mildly acidic pH values (such as those found in tumor microenvironments) modulates SH2 domain function [9]. Cancer-associated mutations at these pH-sensitive sites abolish normal pH regulation, leading to constitutive activation that promotes uncontrolled cell proliferation [9]. Beyond cancer, altered pH dynamics affecting SH2 domain function are implicated in neurodegenerative diseases including Alzheimer's and Huntington's disease, diabetes, autoimmune disorders, and traumatic brain injury [9].
Experimental Approaches for SH2 Domain Research
Yeast Surface Display for SH2-Binding Protein Selection
Yeast surface display has emerged as a powerful platform for selecting and engineering SH2 domain-binding proteins, including monobodies (synthetic binding proteins based on the fibronectin type III scaffold) and other affinity reagents [8] [10]. This methodology enables the presentation of diverse protein libraries on the yeast cell surface while maintaining a physical link between the displayed protein and its encoding DNA, allowing for efficient screening and selection of high-affinity binders through fluorescence-activated cell sorting (FACS) [8] [10].
Protocol: Yeast Surface Display Selection of SH2 Domain-Binding Monobodies
Library Construction:
- Generate a combinatorial library in the yeast display vector pCTCON2, using either the "loop-only" or "side-and-loop" fibronectin type III (FN3) scaffold [8]. The side-and-loop library, which diversifies residues in both the BC and FG loops, has proven particularly effective for generating high-affinity SH2 binders.
- The library complexity should typically exceed 10^9 independent clones to ensure adequate diversity.
Yeast Transformation and Culture:
- Transform the library into Saccharomyces cerevisiae strain EBY100 using electroporation and plate onto selective medium (SDCAA) to maintain selection for the display plasmid.
- Grow transformed yeast in SDCAA medium at 30°C with shaking until mid-log phase (OD600 ≈ 4-6).
Induction of Surface Expression:
- Harvest cells by centrifugation and resuspend in induction medium (SGCAA) at OD600 ≈ 1.0.
- Incubate at 20°C with shaking for 20-48 hours to induce expression of the FN3 fusion protein under the control of the GAL1 promoter.
Selection Against SH2 Domains:
- Label induced yeast cells with biotinylated SH2 domain (typically 100-500 nM concentration) followed by staining with streptavidin-conjugated fluorophore (e.g., streptavidin-PE) and anti-c-Myc antibody conjugated to a different fluorophore (e.g., FITC) to detect displayed proteins.
- Perform FACS to isolate yeast populations exhibiting both strong c-Myc signal (indicating good display) and strong streptavidin signal (indicating SH2 domain binding).
- Collect the top 0.1-1% of double-positive cells for regrowth and further rounds of selection.
Affinity Maturation and Characterization:
- Typically, 2-3 rounds of selection are sufficient to enrich high-affinity binders.
- Isolate individual clones and characterize their binding affinity to the target SH2 domain using flow cytometric analysis or surface plasmon resonance.
- Determine binding specificity by testing against off-target SH2 domains, particularly closely related family members.
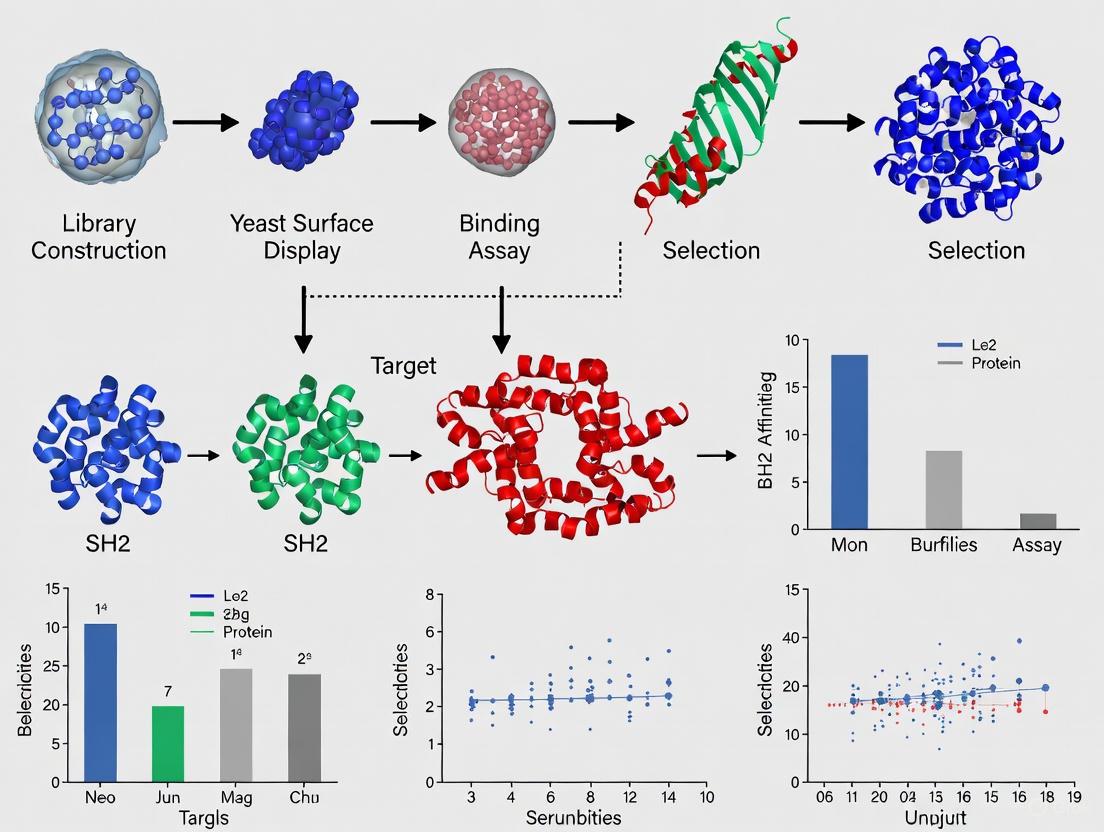
Figure 2: Yeast surface display workflow. Experimental pipeline for selecting high-affinity SH2 domain-binding proteins using yeast surface display technology.
Application Notes and Validation
This yeast surface display approach has been successfully employed to generate highly specific monobodies against six of the eight Src family kinase (SFK) SH2 domains, achieving nanomolar affinities (Kd values of 10-420 nM) and unprecedented selectivity between the highly conserved SrcA (Yes, Src, Fyn, Fgr) and SrcB (Lck, Lyn, Blk, Hck) subfamilies [8]. Structural characterization of monobody-SH2 complexes revealed distinct binding modes that rationalize the observed selectivity and enable structure-based engineering to modulate inhibitory properties [8]. These monobodies have proven to be excellent tools for dissecting SFK functions, as they can selectively activate recombinant kinases by disrupting autoinhibition or inhibit proximal signaling events downstream of immune receptors in cellular contexts [8].
Therapeutic Targeting of SH2 Domains
Emerging Targeting Strategies
The critical role of SH2 domains in disease pathogenesis, particularly in cancer and immune disorders, has stimulated extensive efforts to develop therapeutic agents that disrupt pathological SH2-mediated interactions. Several strategic approaches have emerged, each with distinct advantages and challenges:
Small Molecule Inhibitors: Traditional drug discovery efforts have focused on developing small molecules that target SH2 domain binding pockets. These compounds typically mimic the phosphotyrosine moiety and surrounding residues of natural ligands, but face challenges due to the highly conserved nature of the pTyr-binding pocket and the relatively large, shallow interaction surface of SH2 domains [8] [6].
Peptidomimetics and Macrocyclic Compounds: These approaches seek to stabilize peptide sequences in bioactive conformations, improving affinity and metabolic stability compared to natural peptide ligands. Several peptidomimetic inhibitors have reached clinical development, though achieving sufficient selectivity remains challenging [6].
Monobodies and Other Protein Therapeutics: As described in the experimental section, engineered binding proteins such as monobodies offer exceptional specificity and affinity for targeting SH2 domains. Their larger interaction surface compared to small molecules enables more precise discrimination between closely related SH2 domains, as demonstrated by the successful targeting of SFK SH2 domains [8].
Allosteric Modulation: Recent research has identified allosteric sites on SH2 domains that regulate their function. For example, the computational pipeline discussed earlier revealed pH-sensitive allosteric sites in Src and SHP2 that could be targeted by small molecules to restore native regulation rather than completely inhibit function [9].
Targeting Non-Canonical Functions: Emerging evidence indicates that SH2 domains can engage in interactions beyond phosphotyrosine recognition, including binding to phospholipids and participating in liquid-liquid phase separation (LLPS) [6]. These non-canonical functions represent novel targeting opportunities. For instance, targeting the lipid-binding activity of Syk kinase has shown promise as an alternative to ATP-competitive inhibition [6].
Research Reagent Solutions for SH2 Domain Studies
Table 3: Essential Research Tools for SH2 Domain Investigation
| Reagent/Category | Specific Examples | Function/Application |
|---|---|---|
| SH2 Domain Proteins | Recombinant SFK SH2 domains (Src, Lck, Hck) [8] | Targets for binding studies; structural biology; in vitro assays |
| Display Libraries | FN3 monobody libraries (loop-only, side-and-loop) [8] | Source of diverse binding scaffolds for selection experiments |
| Yeast Display System | S. cerevisiae EBY100; pCTCON2 vector [8] [10] | Platform for library display and selection |
| Detection Reagents | Anti-c-Myc antibody; streptavidin conjugates [8] [10] | Detection of displayed proteins and ligand binding in FACS |
| Structural Biology Tools | Crystallography; NMR; computational modeling [8] [9] | Determination of binding modes and mechanisms |
| Binding Assay Systems | Isothermal titration calorimetry; surface plasmon resonance [8] | Quantitative measurement of binding affinity and thermodynamics |
SH2 domains represent master regulators of tyrosine phosphorylation signaling whose dysregulation contributes to numerous human diseases. The integration of advanced technologies such as yeast surface display with structural biology and computational modeling has dramatically accelerated our ability to probe SH2 domain function and develop targeted therapeutic agents. The experimental protocols outlined herein provide robust methodologies for selecting and characterizing SH2-binding proteins with high affinity and exceptional specificity. As our understanding of SH2 domain biology continues to evolve, particularly regarding non-canonical functions, lipid interactions, and roles in phase separation, new therapeutic opportunities will undoubtedly emerge. The research tools and strategies discussed in this application note will support ongoing efforts to translate basic knowledge of SH2 domain function into novel therapeutic approaches for cancer, immune disorders, and other human diseases.
Yeast Surface Display (YSD) is a powerful protein engineering technique that enables the presentation of recombinant proteins on the surface of yeast cells, primarily Saccharomyces cerevisiae. This platform has become an indispensable tool for antibody engineering, protein affinity maturation, and the selection of functional binding proteins such as those targeting SH2 domains. By leveraging the eukaryotic processing machinery of yeast, YSD facilitates the proper folding, assembly, and post-translational modification of complex proteins, making it particularly suited for engineering mammalian therapeutic candidates. This application note details the core principles, advantages, and standard protocols for implementing YSD in research focused on SH2 domain binding protein selection.
Core Principles and Key Advantages
Yeast Surface Display is a "whole-cell" platform that tethers a protein of interest (POI) to the yeast cell wall via genetic fusion to a native anchor protein [11]. The most common system, pioneered by Boder and Wittrup, employs the a-agglutinin mating adhesion receptor, where the POI is fused to the C-terminus of the Aga2p subunit [12] [13]. The Aga2p protein then forms disulfide bonds with the β1,6-glucan-anchored Aga1p subunit, resulting in the surface display of up to 100,000 copies of the fusion protein per cell [12].
The fundamental construct for YSD typically includes two epitope tags (e.g., HA and c-myc) flanking the POI. These tags allow for normalization of protein function to surface expression levels using fluorescently labeled antibodies and flow cytometry [12].
The following diagram illustrates the molecular architecture of a typical yeast surface display system:
Diagram 1: Molecular architecture of the Aga2p-based yeast surface display system.
The principal advantages of YSD over other display technologies (e.g., phage or bacterial display) are summarized in the table below.
Table 1: Key Advantages of Yeast Surface Display for Eukaryotic Protein Expression
| Advantage | Technical Description | Impact on Protein Engineering |
|---|---|---|
| Eukaryotic Processing | Yeast perform post-translational modifications such as disulfide bond formation and glycosylation, similar to mammalian cells [12] [11]. | Enables proper folding and stability of complex mammalian proteins, including antibodies and SH2 domains. |
| Quantitative Screening | Compatibility with flow cytometry (FACS) allows simultaneous measurement of expression (via epitope tags) and function (via ligand binding) [12] [13]. | Enables high-throughput, quantitative screening and isolation of clones based on multiple parameters (affinity, stability). |
| Quality Control | The eukaryotic secretory pathway contains quality control mechanisms that ensure only properly folded proteins are transported to the cell surface [11]. | Reduces the number of non-functional clones in a library, enriching for well-behaved proteins. |
| GRAS Status | Yeast strains like S. cerevisiae and P. pastoris have a "Generally Recognized As Safe" status from the FDA [11]. | Simplifies the path for the development of therapeutic and diagnostic proteins. |
The Scientist's Toolkit: Essential Research Reagents
The effective implementation of a YSD platform requires careful selection of genetic components. The choice of promoter, secretion signal, and anchor protein can significantly impact the display efficiency and functionality of the POI [14].
Table 2: Key Research Reagent Solutions for Yeast Surface Display
| Reagent Component | Function | Common Examples & Notes |
|---|---|---|
| Promoter | Controls the expression level of the fusion gene. | Inducible: GAL1/GAL10 (strong, tight regulation). Constitutive: GAP, GPD, SED1 (stress-induced). Choice depends on required expression level and potential toxicity of the POI [11]. |
| Secretion Signal | Directs the fusion protein into the secretory pathway for surface display. | α-factor pre-pro sequence (from S. cerevisiae); Glucoamylase signal (from R. oryzae). Directed evolution of these signals can improve secretion efficiency [14] [11]. |
| Anchor Protein | Tethers the fusion protein to the yeast cell wall. | Aga1-Aga2: Most common; allows for N- or C-terminal display. GPI-anchored proteins (e.g., Sed1p, Cwp1p): Covalently linked to β-1,6 glucans. Choice affects POI accessibility and orientation [12] [11]. |
| Epitope Tags | Enable quantification of surface expression and normalization of function. | HA tag (located between Aga2p and POI). c-myc tag (C-terminal to the POI). Detected with fluorescent antibodies for flow cytometry [12]. |
| Host Strain | The yeast strain used for transformation and display. | S. cerevisiae (e.g., BY4741): Standard, GRAS organism. P. pastoris: Offers stronger promoters (AOX1) and higher cell densities [14] [11]. |
Experimental Protocol for SH2 Domain Binder Selection
This protocol outlines the process for generating and screening a library of binding proteins (e.g., nanobodies, monobodies, scFvs) against a target SH2 domain using YSD. The workflow involves library construction, yeast transformation, and iterative screening via FACS.
Diagram 2: A typical workflow for selecting high-affinity binders from a yeast-displayed library.
Protocol 1: Library Construction and Yeast Transformation
This protocol describes the creation of a genetic library and its introduction into yeast cells for surface display.
Materials:
- Plasmid vector for YSD (e.g., pCTCON2 or derivatives with Aga2p)
- Oligonucleotides for PCR amplification or randomized gene synthesis
- Saccharomyces cerevisiae strain (e.g., EBY100)
- Frozen EZ Yeast Transformation II Kit (Zymo Research) or standard LiAc protocol [14]
Method:
- Library Generation: Create diversity in your binding protein gene using methods such as error-prone PCR, DNA shuffling, or synthetic oligonucleotide pools encoding randomized complementarity-determining regions (CDRs) [12].
- Cloning: Clone the diversified gene pool into the YSD plasmid vector downstream of the Aga2p fusion partner, ensuring the correct reading frame.
- Yeast Transformation: Transform the plasmid library into competent yeast cells. For large libraries (>10⁶ variants), use high-efficiency transformation protocols to maximize library coverage [12] [14].
- Induction of Display: Inoculate transformed yeast into induction media (e.g., SGLCAA) containing galactose to induce expression from the GAL1 promoter. Incubate at 20-30°C for 24-48 hours with shaking [14].
Protocol 2: Screening by Magnetic-Activated Cell Sorting (MACS)
MACS provides a rapid, high-capacity method to reduce library complexity and enrich for binders before FACS.
Materials:
- Biotinylated target SH2 domain protein
- Streptavidin-conjugated magnetic beads (e.g., MACS MicroBeads)
- MACS LS Columns and a MACS separator
- Phosphate-buffered saline (PBS) with 1% bovine serum albumin (BSA)
Method:
- Incubation: Harvest induced yeast cells and wash. Resuspend the yeast library in PBS/BSA and incubate with a low-nanomolar concentration of biotinylated SH2 domain for 30-60 minutes on ice.
- Wash: Wash cells with cold PBS/BSA to remove unbound SH2 domain.
- Magnetic Capture: Incubate the yeast cell suspension with streptavidin magnetic beads. Pass the mixture through a MACS column placed in the magnetic field. Unbound, non-interacting cells are washed away.
- Elution: Remove the column from the magnet and elute the bound yeast cells. Culture the eluted cells to amplify the enriched pool for further analysis or FACS screening [12].
Protocol 3: Quantitative Screening by Fluorescence-Activated Cell Sorting (FACS)
FACS allows for quantitative, multi-parameter screening to isolate clones with high binding affinity and good expression.
Materials:
- Fluorescently labeled target SH2 domain (e.g., labeled with Alexa Fluor 647)
- Primary antibodies: mouse anti-HA tag, mouse anti-c-myc tag
- Fluorescently labeled secondary antibodies (e.g., AF488-conjugated anti-mouse IgG) or direct fluorescent conjugates
- Flow cytometer with sorting capability (e.g., BD FACS Aria)
Method:
- Staining: Aliquot approximately 10⁶ induced yeast cells from the library or MACS-enriched pool. Wash and resuspend in PBS/BSA.
- Labeling: Prepare a staining mixture containing:
- A concentration of fluorescent SH2 domain near the KD of the target interaction (for equilibrium screening) or a saturating concentration (for koff screening) [12].
- Fluorescent anti-epitope tag antibody (e.g., AF488-anti-HA) to quantify surface expression.
- Incubation: Incubate the yeast cells with the staining mixture for a time sufficient to reach equilibrium (typically 30-60 minutes) on ice.
- Washing and Sorting: Wash cells to remove unbound ligand and resuspend in cold PBS. Use a flow cytometer to sort the population, gating for cells that are double-positive for both fluorescence signals (high expression and high ligand binding).
- Recovery and Iteration: Collect sorted cells and culture them for plasmid recovery or regrowth for subsequent rounds of sorting. Typically, 2-4 rounds of FACS are performed, with increasing stringency (e.g., decreasing ligand concentration) in each round to select for the highest-affinity binders [12] [15].
Application in SH2 Domain Research and Data Analysis
YSD is exceptionally well-suited for profiling SH2 domain specificity and engineering inhibitors. A key application is the quantitative measurement of binding affinity for thousands of variants simultaneously, a technique known as deep mutational scanning [15] [16].
For SH2 domains, which recognize phosphotyrosine-containing peptides, YSD can be used to map critical residues for binding and selectivity. As demonstrated in related systems, yeast-displayed protein libraries can be incubated with a soluble, fluorescently labeled SH2 domain, and the binding affinity (KD,app) and expression levels can be measured via flow cytometry [15] [16]. This data can then be used to train computational models (e.g., using tools like ProBound) to predict binding free energy changes (ΔΔG) for any peptide sequence in the theoretical space, providing a powerful resource for predicting signaling network connectivity and the impact of disease-associated mutations [16].
Furthermore, YSD has been successfully employed to develop highly selective synthetic binding proteins, such as monobodies, against challenging targets like protein tyrosine phosphatase domains, illustrating its potential for creating research tools and therapeutic leads in tyrosine kinase signaling pathways [17].
Designing Diverse and Effective Synthetic Antibody and Scaffold Protein Libraries
The success of selecting high-affinity binding proteins against targets such as SH2 domains is fundamentally dependent on the initial design and quality of the library. A well-designed library presents a vast repertoire of structured, stable, and diverse protein variants, maximizing the probability of isolating binders with the desired specificity and affinity. Yeast surface display (YSD) has emerged as a premier platform for this purpose, as it functionally links a protein variant's genotype to its phenotype by tethering it to the yeast cell wall, enabling direct screening for binding interactions [18] [19]. This eukaryotic expression system offers the critical advantage of facilitating the display of complex proteins that require eukaryotic folding machinery and post-translational modifications [19].
The core challenge in library design lies in balancing two competing objectives: introducing sufficient sequence diversity to create a functional binding surface while maintaining the intrinsic stability and foldability of the underlying protein scaffold [20]. This article details protocols and application notes for constructing and selecting from diverse synthetic libraries using yeast surface display, with a specific focus on applications in SH2 domain research.
Library Scaffold Selection and Design Principles
The choice of scaffold is a primary determinant of library performance. An ideal scaffold is small, structurally robust, and amenable to extensive mutagenesis without compromising its structural integrity.
Alternative Scaffold Proteins
Non-antibody scaffolds often provide superior stability and expressibility compared to antibody fragments. The table below summarizes several prominent scaffolds used in synthetic library generation.
Table 1: Characteristics of Alternative Scaffold Proteins for Library Design
| Scaffold Name | Origin/Type | Size | Key Features | Example Applications |
|---|---|---|---|---|
| rcSso7d | Sulfolobus solfataricus | ~7 kDa | Highly thermostable, disulfide-free, small DNA-binding protein [21] [18]. | Engineered to target activated EGFR [21]. |
| FN3 (10th type III fibronectin) | Human fibronectin | ~10 kDa | Ig-like fold but lacks disulfide bonds; three solvent-exposed loops are amenable to randomization [18] [19]. | Used in YSD campaigns for binding and molecular switch engineering [18]. |
| WW Domain | Natural protein interaction module | ~4-5 kDa | Ultra-small, three β-sheet structure; loops can be extended and randomized [22]. | Phage display library selected against Human Serum Albumin (HSA) [22]. |
| CheY (Cheytins) | Thermotoga maritima | 13.2 kDa | Thermostable (Tm ~95°C), monomeric; four loops diversified for novel binding surfaces [20]. | Binders selected against Oplophorus luciferase Kaz domain via phage display [20]. |
| DARPins | Ankyrin repeats | Variable | Modular repeat proteins; high stability and solubility; commercially exploited [22] [19]. | Not specifically covered in the provided results. |
| VH / sdAb | Human heavy-chain-only | ~12-15 kDa | Single-domain antibodies; small size, high stability, and deep epitope access [23]. | Fully synthetic human sdAb (VHO) libraries generated for phage display [23]. |
Strategic Loop and Surface Diversification
Diversification strategies are focused on regions that are naturally involved in molecular recognition. For the WW domain, a synthetic scaffold (WWp5_4) was designed by extending and randomizing the loop regions while preserving the conserved β-sheet framework responsible for structural stability [22]. Molecular dynamics simulations confirmed that the designed mutants maintained structural integrity despite loop extensions [22].
Similarly, for the CheY-based library (Cheytins), four contiguous beta-to-alpha connecting loops were chosen for randomization, creating a flexible surface predicted to fit into pockets like enzyme active sites [20]. To enhance the library's interaction potential, the randomization was not uniform; it was biased toward amino acid frequencies observed in antibody CDR-H3 loops, with a high prevalence of tyrosine (25%), glycine (18.5%), and serine (8.5%) [20]. This strategy intentionally enriches the library with residues conducive to forming diverse molecular interactions.
Diagram 1: Library Design and Filtration Workflow. A successful library design strategy involves careful scaffold choice, targeted diversification, and a critical filtration step to enrich for folded and stable proteins before functional selection.
Experimental Protocols
Protocol 1: Yeast Surface Display Selection Campaign
This protocol is adapted from established methods for enriching binders from a yeast-displayed library, for example, to recognize ligand-bound receptors or specific SH2 domains [21] [18].
Materials & Reagents
- Yeast Library: e.g., EBY100 strain displaying a library of interest (e.g., rcSso7d, FN3).
- Induction Media: SG-CAA (contains galactose to induce protein expression).
- Selection Antigen: Purified, tagged SH2 domain protein.
- Magnetic Beads: Anti-tag magnetic beads (e.g., Anti-GSH, Anti-His).
- FACS Buffer: PBS pH 7.4, 0.1-1% BSA.
- Detection Reagents: Primary antibody (optional), fluorescently-labeled antigen, anti-c-myc antibody (e.g., for display normalization), and corresponding fluorescent secondary antibodies.
- Flow Cytometer: For analysis and sorting.
Procedure
- Library Thawing and Induction:
- Thaw frozen yeast library and dilute in SD-CAA medium to an OD600 of ~1. Ensure the number of cells is at least 10-fold the library diversity (e.g., for a 10^8 diversity library, use 10^9 cells) [18].
- Incubate overnight at 30°C with shaking (180 rpm).
- The next day, centrifuge cells and resuspend in SG-CAA medium to induce protein expression. Incubate for 16-24 hours at 20-30°C with shaking.
Magnetic Bead Selection (Round 1):
- Coat anti-tag magnetic beads with the purified, tagged SH2 domain antigen. Include a negative control (e.g., beads alone or with an irrelevant protein).
- Block the beads with FACS buffer containing 1% BSA.
- Incubate the induced yeast library with the antigen-coated beads for 30-60 minutes at room temperature with gentle rotation.
- Wash the beads multiple times with FACS buffer to remove non-specific binders.
- Elute bound yeast cells by adding fresh SD-CAA medium. Culture the eluted cells in SD-CAA medium for 1-2 days.
Flow Cytometric Sorting (Subsequent Rounds):
- Induce protein expression from the enriched culture as in Step 1.
- Label the yeast cells with a fluorescently-labeled SH2 domain antigen. Use a two-color strategy: one channel to detect antigen binding and another (e.g., anti-c-myc staining) to detect the display level [18].
- Use a flow cytometer to sort the population that is positive for both display and antigen binding. Gate stringently to select the highest-affinity binders.
- Sort directly into SD-CAA medium, then culture the sorted cells.
Affinity Maturation (Optional):
- If higher affinity binders are required, perform random mutagenesis on the enriched pool. This can be achieved via error-prone PCR (epPCR) of the displayed protein gene [18].
- Clone the mutated gene pool back into the yeast display vector and transform into yeast to create a new library.
- Repeat the induction and sorting process (Steps 1-3) with increasing stringency (e.g., lower antigen concentration).
Analysis of Enriched Clones:
- After 3-4 rounds of sorting, plate cells to obtain single colonies.
- Induce individual clones and analyze their binding to the SH2 domain via flow cytometry.
- Sequence the plasmid DNA from positive clones to identify enriched protein variants.
Protocol 2: Phage Display Library Filtration for Folded Proteins
This protocol is crucial for creating high-quality phage-displayed libraries enriched with folded and stable variants, as demonstrated with the Cheytin library [20].
Materials & Reagents
- Phagemid Vector: e.g., with TorA signal sequence for efficient display [20].
- E. coli. T1 phage-resistant strain.
- Helper Phage: For phage particle production.
- Filtration Matrix: Immobilized natural protein partner of the scaffold or a conformation-specific antibody.
- PEG/NaCl: For phage precipitation.
Procedure
- Initial Library Construction:
- Design and synthesize DNA encoding the diversified scaffold library (e.g., using trinucleotide cassettes to minimize codon bias and eliminate stop codons) [20].
- Clone the library into the phagemid vector and transform into E. coli to create the initial, naive library (e.g., Lib-Cheytins 1.0).
Filtration for Folded Proteins:
- Produce phage particles from the naive library by superinfection with a helper phage.
- Incubate the phage library with a matrix coated with the natural binding partner of the wild-type scaffold. This step selectively captures variants that have retained the overall folded structure of the scaffold.
- Wash the matrix thoroughly to remove non-binding (unfolded or misfolded) phage.
- Elute the bound phage, which represent the sub-library of folded protein variants.
Gene Shuffling and Final Library Production:
- Amplify the DNA from the eluted phage pool.
- Perform a gene shuffling step (e.g., using a single restriction enzyme like BbsI) to recombine the sequences of the folded variants, creating a new, highly diverse library that is enriched in stable sequences (e.g., Lib-Cheytins 2.1) [20].
- Clone the shuffled pool into the phagemid vector to produce the final, optimized phage display library ready for biopanning against targets like SH2 domains.
The Scientist's Toolkit: Essential Research Reagents and Materials
Table 2: Key Reagent Solutions for Library Construction and Selection
| Reagent / Material | Function / Application | Examples & Notes |
|---|---|---|
| Yeast Surface Display System | Display platform for eukaryotic expression and FACS-based screening. | S. cerevisiae EBY100 strain; pYD1 vector or similar with Aga2p fusion and GAL1 promoter [18] [19]. |
| Phagemid Display System | Display platform for high-diversity library construction and selection. | Vector with in-frame fusion to pIII coat protein; TorA signal sequence for TAT export can improve display [20]. |
| Trinucleotide Phosphoramidites | DNA synthesis for unbiased, stop-codon-free library construction. | Mixtures encoding 19 amino acids (no Cys); allows for tailored amino acid frequency (e.g., Tyr/Gly/Ser-rich) [20]. |
| Anti-tag Magnetic Beads | For initial, low-stringency enrichment of binders from large libraries. | Beads coated with anti-GSH, anti-His, etc., for capturing tagged antigens and bound yeast/phage [21] [18]. |
| Fluorescently-labeled Antigen | Critical reagent for detecting binding during FACS analysis and sorting. | Purified SH2 domain conjugated to a fluorophore (e.g., Alexa Fluor 647). Titrate for concentration-dependent sorting [18]. |
| Conformation-Specific Antibody | For detecting properly folded scaffolds or for library filtration. | Used to enrich for folded variants in a library (filtration) or to confirm structural integrity of displayed proteins [20] [19]. |
| Error-Prone PCR Kit | For introducing random mutations during affinity maturation. | Commercial kits allow control over mutation rate to optimize diversity versus function retention [18]. |
Data Analysis and Validation
Quantitative analysis is vital for evaluating library quality and selection progress. The table below outlines key performance metrics.
Table 3: Quantitative Metrics for Library and Binder Evaluation
| Parameter | Description | Target / Typical Value |
|---|---|---|
| Theoretical Library Size | Number of independent transformants after library construction. | >10^9 for YSD; >10^10 for Phage Display [18] [23]. |
| Functional Diversity (Post-Filtration) | Percentage of in-frame, folded sequences in the library. | >55% after initial build; >90% after stability filtration [20]. |
| CDR3/Paratope Diversity | Percentage of unique CDR3 sequences post-selection (indicates epitope diversity). | A good campaign yields >80% unique sequences for a diverse candidate pool [23]. |
| Display Level | Mean fluorescence intensity (MFI) from anti-tag staining in YSD. | Correlates with protein stability and expression; used to gate on "well-displayed" population [18] [19]. |
| Affinity (KD) | Equilibrium dissociation constant of selected binders. | Can be estimated via flow cytometry; nM range achievable after affinity maturation [18] [23]. |
Diagram 2: Display Technology Comparison. Yeast Surface Display (YSD) and Phage Display (PD) offer complementary advantages and limitations, making them suitable for different stages of the binder discovery pipeline.
Application Notes for SH2 Domain Targeting
SH2 domains are critical signaling modules that recognize phosphotyrosine (pY)-containing motifs. Selecting binders against SH2 domains requires special considerations.
- Competitive Elution Strategies: To isolate binders that compete with the natural phosphopeptide ligand, include a competitive elution step during selection using a high concentration of the cognate pY peptide. This strategy enriches for clones that bind the functionally relevant site.
- Conformation-Specific Binders: If the goal is to target a specific conformational state of an SH2 domain (e.g., in a protein), ensure that the antigen used for selection is in the correct conformation. Using a constrained, dimeric library scaffold like rcSso7d can be particularly effective for generating conformation-specific binders that recognize the ligand-bound state of receptors [21].
- Validation: Always validate selected binders in relevant functional assays, such as Western blotting, immunoprecipitation, or cellular assays, to confirm they modulate the intended SH2 domain-mediated signaling pathway [24].
Strategies for SH2 Domain Production and Purification for Panning Experiments
Within the context of a broader thesis on yeast surface display (YSD) for selecting binding proteins against Src homology 2 (SH2) domains, the production of high-quality, functional SH2 domain proteins is a critical prerequisite. SH2 domains are protein modules of approximately 100 amino acids that specifically recognize and bind phosphotyrosine (pY)-containing peptide sequences, playing fundamental roles in intracellular signal transduction [6]. Their function is to recruit specific signaling effectors by selectively recognizing proteins containing pY-peptide-binding motifs [6]. For panning experiments using YSD, the target SH2 domain must be produced in a pure, stable, and functionally active form to ensure the successful isolation of high-affinity binders, such as monobodies or other alternative binding scaffolds. This protocol details optimized strategies for the recombinant production and purification of SH2 domains, drawing from recent advances in the field.
SH2 Domain Background and Structural Considerations
Structural Basis for Function
All SH2 domains share a highly conserved fold comprising a central three-stranded antiparallel beta-sheet flanked by two alpha helices, forming a compact α-β sandwich structure [6]. The binding affinity and specificity for pY-peptides are characterized by a combination of high specificity toward cognate pY ligands with moderate binding affinity (Kd typically ranging from 0.1–10 µM) [6]. The binding interface consists of two primary pockets: a highly conserved pY pocket that coordinates the phosphotyrosine residue, and a more variable specificity pocket that engages residues C-terminal to the pY (typically pY+3), creating a "two-pronged plug two-hole socket" binding model [25]. This inherent specificity makes them attractive targets for developing inhibitors of protein-protein interactions.
Challenges in SH2 Domain Production
The high sequence conservation among the 120 human SH2 domains poses a significant challenge for their selective targeting and individual production [8]. Furthermore, some SH2 domains, such as that of Fyn, can exhibit stability issues under selection or purification conditions, while others, like Blk, may demonstrate nonspecific binding to chromatography matrices, complicating the purification process [8]. A robust production and purification strategy is therefore essential to overcome these hurdles.
Experimental Protocols
Construct Design and Cloning
Objective: To generate a plasmid for the recombinant expression of the SH2 domain as a fusion protein.
Detailed Methodology:
- SH2 Domain Delineation: Identify the SH2 domain boundaries within the parent protein using domain databases (e.g., Pfam, InterPro). Typically, the domain spans ~100 amino acids [6].
- Vector Selection: For initial screening and characterization, the pGEX series of vectors is widely used. These vectors allow for expression as a fusion with Glutathione-S-Transferase (GST), which enhances solubility and provides a handle for affinity purification [26]. Alternatively, vectors for His-tag fusion (e.g., pET series) can be employed.
- Primer Design and PCR Amplification: Design primers to amplify the SH2 domain coding sequence. Include restriction enzyme sites (e.g., BamHI and EcoRI) compatible with the chosen vector for directional cloning [26].
- Example Primer Set for Grb2 SH2 [26]:
- Forward Primer:
5'-GGCGGATCCCCACATCCGTGGTTTTTTGGCAAAATCCCC-3'(BamHI site underlined) - Reverse Primer:
5'-GGGAATTCACTGGACGTATGTCGGCTGCTGTGG-3'(EcoRI site underlined)
- Forward Primer:
- Example Primer Set for Grb2 SH2 [26]:
- Cloning: Amplify the SH2 domain via PCR, digest the PCR product and vector with the appropriate restriction enzymes, ligate, and transform into a cloning strain of E. coli. Verify the construct by colony PCR and sequencing.
Recombinant Expression inE. coli
Objective: To produce a high yield of soluble SH2 domain fusion protein.
Detailed Methodology:
- Transformation: Transform the verified plasmid into a suitable E. coli expression strain (e.g., BL21(DE3)) for high-yield protein production [26].
- Culture and Induction:
- Inoculate a starter culture of LB medium containing the appropriate antibiotic (e.g., ampicillin for pGEX vectors) and grow overnight at 37°C.
- Dilute the overnight culture 1:100 into fresh, pre-warmed medium. Grow at 37°C with vigorous shaking until the OD600 reaches 0.6-0.8.
- Induce protein expression by adding Isopropyl β-d-1-thiogalactopyranoside (IPTG) to a final concentration of 0.1-1.0 mM.
- Reduce the temperature to 18-25°C and continue shaking for 16-18 hours (overnight) to promote proper folding and solubility.
- Harvesting: Pellet the bacterial cells by centrifugation (e.g., 4,000 x g for 20 minutes at 4°C). Discard the supernatant. The cell pellet can be stored at -80°C or processed immediately.
Protein Purification
Objective: To isolate the functional SH2 domain from the E. coli lysate.
Detailed Methodology:
- Cell Lysis:
- Resuspend the cell pellet in ice-cold Lysis Buffer (e.g., 1x PBS, pH 7.4, supplemented with 1 mM DTT, and a protease inhibitor cocktail).
- Lyse the cells using a high-pressure homogenizer (e.g., French Press) or sonication on ice.
- Clarify the lysate by centrifugation at high speed (e.g., 16,000 x g for 30 minutes at 4°C) to remove insoluble debris.
- Affinity Chromatography:
- For GST-tagged proteins, incubate the clarified lysate with Glutathione-sepharose beads for 1-2 hours at 4°C with end-over-end mixing [26].
- Wash the beads extensively with Wash Buffer (e.g., 1x PBS) to remove non-specifically bound proteins.
- Elute the purified GST-SH2 fusion protein using Elution Buffer (e.g., 50 mM Tris-HCl, pH 8.0, containing 10-20 mM reduced Glutathione).
- Tag Cleavage (Optional):
- If a cleavable tag is used (e.g., GST with a PreScission protease site), incubate the eluted protein with the appropriate protease as per the manufacturer's instructions.
- Remove the cleaved tag and protease by passing the mixture back over the Glutathione-sepharose column.
- Buffer Exchange and Final Purification:
- Further purify the SH2 domain using size-exclusion chromatography (SEC; e.g., on a Superdex 75 column) equilibrated with a storage-compatible buffer (e.g., 20 mM HEPES, pH 7.5, 150 mM NaCl). This step removes aggregates and exchanges the protein into a suitable buffer for downstream applications.
- Concentrate the protein using centrifugal concentrators with an appropriate molecular weight cutoff.
Quality Control and Functional Validation
Objective: To confirm the integrity, stability, and functional activity of the purified SH2 domain.
Detailed Methodology:
- Purity and Molecular Weight Analysis: Analyze the purified protein by SDS-PAGE and Coomassie staining to confirm purity and estimated molecular weight.
- Stability Assessment: Monitor the protein's stability over time and under different conditions (e.g., temperature, pH) using techniques like differential scanning fluorimetry (DSF) or native PAGE. This is crucial, as unstable domains (like Fyn SH2) may not be suitable for panning [8].
- Functional Validation - Binding Assay:
- A solid-phase binding assay can be employed to confirm functional activity [26].
- Coat a 96-well plate with the purified SH2 domain (e.g., 300 ng/100 µL/well in PBS) by incubating overnight at 4°C [26].
- Block the wells with a blocking agent (e.g., 3% BSA) for 2 hours at room temperature.
- Incubate with a biotinylated or radiolabeled phosphopeptide ligand known to bind the specific SH2 domain (e.g., a peptide derived from Shc with a pYVNV sequence for Grb2 SH2) [26].
- Detect binding using streptavidin-HRP or scintillation counting. A successful preparation will show specific, saturable binding to its cognate phosphopeptide.
Key Data and Parameters
Table 1: Summary of SH2 Domain Production and Purification Parameters
| Parameter | Typical Range / Example | Protocol Reference / Note |
|---|---|---|
| Domain Size | ~100 amino acids [6] | Definition of SH2 domain boundaries |
| Expression System | E. coli (e.g., BL21(DE3)) | Standard for recombinant SH2 domains [26] |
| Expression Tag | GST or His-tag | GST enhances solubility and allows easy purification [26] |
| Induction Condition | 0.1-1.0 mM IPTG, 18-25°C, 16-18 hrs | Low temperature for solubility |
| Affinity Resin | Glutathione-sepharose (for GST) | Standard affinity purification [26] |
| Binding Affinity (Kd) | 0.1 - 10 µM (for natural pY ligands) [6] | Benchmark for functional validation |
| Coating Concentration | ~300 ng/100 µL/well [26] | For solid-phase binding assays |
Table 2: Troubleshooting Common Issues in SH2 Domain Production
| Problem | Potential Cause | Suggested Remedy |
|---|---|---|
| Low Solubility | Aggregation, improper folding | Reduce induction temperature, use solubility-enhancing tags (GST), optimize lysis buffer |
| Instability | Inherent domain property (e.g., Fyn SH2) [8] | Screen buffer conditions (pH, salts, additives), use immediately after purification |
| Non-specific Binding | Domain property (e.g., Blk SH2) [8] | Increase salt concentration in wash buffers, include non-ionic detergents |
| Low Functional Yield | Improper folding, inactive protein | Include a reducing agent (DTT) in buffers, validate with a functional assay |
The Scientist's Toolkit
Table 3: Essential Research Reagent Solutions for SH2 Domain Production
| Reagent / Material | Function / Application | Example / Specification |
|---|---|---|
| pGEX Vector Series | Bacterial expression vector for producing GST-tagged fusion proteins. | Provides high solubility and a standardized purification handle via GST [26]. |
| Glutathione-Sepharose | Affinity chromatography resin for purifying GST-tagged proteins. | High binding capacity for GST; used for both capture and tag removal after cleavage [26]. |
| Protease Inhibitor Cocktail | Prevents proteolytic degradation of the SH2 domain during lysis and purification. | Added to all lysis and initial purification buffers. |
| Size-Exclusion Chromatography (SEC) Resin | Final polishing step to remove aggregates and exchange buffer. | Resins like Superdex 75 increase sample homogeneity and stability [8]. |
| Phosphopeptide Ligands | Functional validation of purified SH2 domain activity. | e.g., pYVNVK for Grb2 SH2 validation; used in binding assays [26]. |
Workflow and Pathway Diagrams
SH2 Domain Production and Purification Workflow
SH2 Domain Structure and Binding Mechanism
The selection of high-affinity, specific binding proteins for Src Homology 2 (SH2) domains is crucial for probing intracellular signaling networks and developing therapeutic agents. SH2 domains, comprising approximately 120 members in the human genome, recognize phosphotyrosine motifs and mediate critical protein-protein interactions in cellular signaling pathways [27]. This application note provides a systematic benchmarking of four primary display technologies—Yeast Surface Display (YSD), Phage Display, Bacterial Display, and Affimer technology—for selecting binders against SH2 domains. We present quantitative performance comparisons, detailed experimental protocols, and contextualize these findings within the framework of SH2 domain binding protein research to guide platform selection for specific application needs.
Key Characteristics of Display Technologies
Table 1: Fundamental Characteristics of Display Platforms for SH2 Domain Binder Selection
| Platform | Display Scaffold | Library Size | Throughput Screening | Eukaryotic Processing | Primary Applications for SH2 Domains |
|---|---|---|---|---|---|
| Yeast Surface Display | Aga1-Aga2 fusion [11] | Up to 109 [19] | FACS-based sorting | Full eukaryotic folding & glycosylation [28] | Affinity maturation, stability engineering, epitope mapping [29] |
| Phage Display | pIII or pVIII coat protein fusion | 1010-1011 [30] | Panning & ELISA | Limited (prokaryotic expression) | scFv selection, antibody engineering [30] |
| Bacterial Display | Outer membrane protein fusion | 107-109 [31] | FACS or MACS | Limited (prokaryotic expression) | Peptide-binding specificity profiling [31] |
| Affimer Technology | Phytocystatin-derived scaffold [27] | ~1010 [27] | Panning & sequencing | Recombinant expression in E. coli | Intracellular inhibition, function modulation [32] |
Quantitative Performance Metrics for SH2 Domain Applications
Table 2: Performance Benchmarks Across Display Platforms for SH2 Domain Targeting
| Performance Metric | Yeast Surface Display | Phage Display | Bacterial Display | Affimer Technology |
|---|---|---|---|---|
| Affinity Range (KD) | pM-nM [29] | nM-pM (for scFvs) [30] | Not specified | nM range (e.g., Grb2 SH2: 1.22 µM IC50) [33] |
| Specificity Demonstration | Conformational specificity engineering [29] | 379 monospecific antibodies across 20 SH2 domains [30] | Accurate binding free energy prediction [31] | Specific targeting of individual SH2 domains (22/41 targeted) [33] |
| Intracellular Function | Limited (requires cytosolic expression) | Limited (requires cytosolic expression) | Not applicable | Demonstrated (modulation of Ras signaling) [32] [33] |
| Stability/Thermal | Improved stability via display correlation [29] | Variable | Not specified | High (Tm = 101°C) [27] |
| Development Timeline | 2-4 weeks (including yeast transformation) | 2-3 weeks (panning rounds) | 2-3 weeks (including ProBound analysis) | 2-3 weeks (selection & validation) |
Experimental Protocols for SH2 Domain Binder Selection
Yeast Surface Display Protocol for SH2 Domain Binders
Principle: The yeast display system utilizes the Aga1-Aga2 mating agglutinin complex, where Aga1 is anchored to the cell wall and Aga2 is fused to the protein of interest, enabling eukaryotic expression and surface display [28] [11].
Detailed Workflow:
Library Construction:
- Amplify binding protein genes (e.g., scFv, fibronectin domains) using error-prone PCR or DNA shuffling for diversification [19].
- Clone into yeast display vectors (e.g., pCTCON2) containing GAL1 promoter for inducible expression [11].
- Electroporate library into S. cerevisiae strain EBY100, achieving transformation efficiencies of 107-109 CFU/µg DNA [19].
Induction and Expression:
- Inoculate transformed yeast in TRP-/GLU media at 30°C until mid-log phase.
- Induce display by transferring cells to TRP-/GAL media (2% galactose) for 24-48 hours at 20°C [28].
Labeling and Sorting:
- Incubate 107 cells with biotinylated SH2 domain antigen (0.1-100 nM range) for 30-60 minutes on ice.
- Detect binding with streptavidin-conjugated fluorophores (e.g., Alexa Fluor 647).
- Counter-stain for expression using anti-c-myc FITC for Aga2 fusions [29].
- Sort using FACS (e.g., BD FACS Aria) with gating on double-positive populations.
Characterization:
- Determine binding affinity via titration and flow cytometric analysis.
- Calculate KD values using non-linear regression of fluorescence versus antigen concentration [29].
Phage Display Protocol for SH2 Domain Binders
Principle: Filamentous bacteriophage (M13) display binding proteins as fusions to minor coat protein pIII, enabling selection through biopanning against immobilized SH2 domains [30].
Detailed Workflow:
Library Panning:
- Immobilize purified SH2 domains (5-20 µg/mL) on immunotubes or streptavidin-coated plates for biotinylated targets.
- Block with 2% milk-PBS for 1 hour at room temperature.
- Incubate with phage library (1010-1012 CFU) for 1-2 hours with agitation.
- Wash with PBS-Tween (0.1%) 10 times to remove non-specific binders.
- Elute bound phage with 100 mM triethylamine or by trypsin cleavage.
- Amplify eluted phage in E. coli TG1 cells for subsequent rounds (typically 2-3 rounds total) [30].
Screening and Characterization:
- Perform polyclonal phage ELISA after round 2 to assess enrichment.
- Screen individual clones using monoclonal phage ELISA or surface plasmon resonance.
- Characterize specificity against panels of SH2 domains to identify cross-reactivity [30].
Bacterial Display with ProBound Analysis Protocol
Principle: Bacterial surface display of random peptide libraries coupled with next-generation sequencing and ProBound computational analysis enables quantitative modeling of SH2 domain binding specificity [31].
Detailed Workflow:
Library Design and Display:
- Generate random peptide libraries (complexity 106-107) flanking fixed phosphorylated tyrosine residue.
- Display on bacterial surface using appropriate anchor proteins (e.g., eCPX).
Affinity Selection:
- Incubate library with fluorescently labeled SH2 domains.
- Perform multiple rounds of FACS or magnetic sorting to enrich binding clones.
- Sequence input and output populations using NGS after each selection round.
Computational Analysis:
- Analyze NGS data using ProBound software to build sequence-to-affinity models.
- Generate additive models predicting binding free energy across theoretical sequence space.
- Validate model predictions using isothermal titration calorimetry or surface plasmon resonance [31].
Affimer Selection Protocol for SH2 Domains
Principle: Affimer proteins (Adhirons) are selected from a phage-displayed library based on a phytocystatin scaffold with randomized loops, providing high stability and specificity [32] [27].
Detailed Workflow:
Target Preparation:
- Express SH2 domains as N-terminal biotin acceptor peptide (BAP) fusions in E. coli.
- Perform in vivo biotinylation during expression for direct capture from lysates.
Phage Display Selection:
- Immobilize biotinylated SH2 domains on streptavidin-coated plates or magnetic beads.
- Perform 3 rounds of biopanning with negative selection against non-transformed cell lysates.
- Include negative selection against other SH2 domains in final round to enhance specificity.
Characterization:
- Express selected Affimers in E. coli and purify via immobilized metal affinity chromatography.
- Determine binding affinity using ELISA, biolayer interferometry, or surface plasmon resonance.
- Validate intracellular functionality by transfection into mammalian cells and monitoring signaling pathway modulation (e.g., ERK phosphorylation) [32] [33].
SH2 Domain Biology and Research Context
SH2 Domain Structure and Function
SH2 domains are protein interaction modules of approximately 100 amino acids that fold into characteristic β-sheet structures flanked by α-helices [30]. These domains specifically recognize phosphorylated tyrosine residues within specific sequence contexts, playing pivotal roles in tyrosine kinase signaling pathways [31]. Growth-factor-receptor-bound protein 2 (Grb2), a key adapter protein in Ras signaling, contains a single SH2 domain flanked by two SH3 domains, providing a critical link between activated receptors and Ras activation [32].
Research Reagent Solutions for SH2 Domain Studies
Table 3: Essential Research Reagents for SH2 Domain Binder Development
| Reagent/Category | Specific Examples | Function/Application | Technology Relevance |
|---|---|---|---|
| Display Scaffolds | Aga1-Aga2 (YSD) [11], pIII (phage) [30], eCPX (bacterial) [31], Adhiron (Affimer) [27] | Protein fusion partners for surface display | Platform-specific display efficiency |
| Expression Systems | S. cerevisiae EBY100 (YSD) [11], E. coli BL21 (phage/bacterial) [30], E. coli BL21 Star (Affimer) [32] | Recombinant protein production | Host-dependent folding and modifications |
| Selection Tools | FACS (YSD/bacterial) [29], Streptavidin beads (phage/Affimer) [32], MACS (bacterial) | Binder enrichment from libraries | Selection stringency and efficiency |
| SH2 Domain Production | BAP-tagged SH2 domains [27], GST-tagged SH2 domains [32] | Target protein for selection | Standardized target presentation |
| Analysis Methods | Flow cytometric titration (YSD) [29], ProBound modeling (bacterial) [31], Phage ELISA (phage) [30] | Affinity and specificity characterization | Quantitative binding assessment |
The optimal display technology for SH2 domain binder selection depends on the specific research objectives and application requirements. Yeast Surface Display excels in engineering binding proteins with high affinity and stability while leveraging eukaryotic folding machinery, making it ideal for therapeutic antibody development. Phage Display offers the largest library sizes and is well-established for scFv selection against diverse SH2 domain targets. Bacterial Display with ProBound analysis provides unparalleled quantitative modeling of binding specificity across peptide sequence space. Affimer Technology demonstrates superior intracellular functionality and high thermal stability, enabling direct modulation of SH2 domain-dependent signaling pathways in living cells.
For comprehensive SH2 domain research programs, we recommend a complementary approach: using YSD for high-affinity binder development, bacterial display for specificity profiling, and Affimer technology for intracellular functional studies. This integrated methodology accelerates the development of research tools and potential therapeutics targeting the diverse SH2 domain family.
A Step-by-Step Protocol for SH2 Binder Selection and Characterization
Within the context of a broader thesis on using yeast surface display (YSD) for selecting binding proteins against SH2 domains, robust library construction is a critical first step. The quality of the entire protein engineering campaign, from discovering high-affinity binders to characterizing selective interactions, hinges on the diversity and quality of the initial yeast library. This application note details established best practices for the transformation and induction stages of yeast culture, providing a foundational protocol to support research in signaling protein characterization and therapeutic development.
Protocol: Yeast Library Transformation
The following protocol describes a high-efficiency method for transforming a yeast display plasmid library into Saccharomyces cerevisiae, specifically tailored for the construction of diverse immune or synthetic libraries for binding protein selection [34] [35].
Materials and Reagents
- Yeast Strain: S. cerevisiae EBY100 (for surface display of Aga2p fusions) [34] [35].
- Display Vector: A yeast surface display plasmid (e.g., pCTCON2-based [36] or pNACP [34]) containing a tryptophan selection marker.
- DNA Library: The purified plasmid or linear DNA library to be transformed. Highly pure DNA is crucial [37].
- Growth Media:
- Transformation Reagents: Commercially available frozen competent yeast system or reagents for preparing electrocompetent cells (e.g., 100 mM lithium acetate, 1 M sorbitol, single-stranded carrier DNA).
Step-by-Step Procedure
Cell Preparation and Growth:
- Inoculate EBY100 yeast cells into YPD medium and grow overnight at 30°C with shaking.
- Dilute the overnight culture into fresh YPD to a final OD600 of 0.5-1.0 and continue growing until the culture reaches mid-logarithmic phase (OD600 ≈ 0.8-1.0), which provides the most transformable cells [37]. Cell densities within the range of 5 x 10^6 to 2 x 10^7 cells/mL are optimal [37].
Preparation of Electrocompetent Cells:
- Harvest cells by centrifugation.
- Wash the cell pellet thoroughly with sterile, cold water, followed by a wash with cold 1 M sorbitol. The washing procedure must remove all traces of salts and media components [38].
- Resuspend the final cell pellet in a small volume of cold 1 M sorbitol to create highly concentrated electrocompetent cells.
Transformation:
- Mix ~100 ng to 1 µg of the purified plasmid DNA library with 50 µL of electrocompetent cells in an electroporation cuvette [37]. For integrative transformation with linearized DNA, inputs of up to 5 µg are recommended [37].
- Apply an electrical pulse using optimized electroporation parameters (e.g., 2.5 kV for S. cerevisiae). The use of specialized electroporation cuvettes and buffer additives can enhance efficiency [38].
- Immediately add 1 mL of room-temperature YPD or 1 M sorbitol to the cuvette and recover the cells.
- Transfer the cell mixture to a tube and incubate with shaking at 30°C for 45 minutes to 1 hour [37].
Plating and Library Validation:
- Plate the transformed cells onto large SD/-Trp agar plates to select for transformants.
- Incubate the plates at 30°C for 2-3 days until colonies appear.
- Harvest the library by scraping colonies off the plates, pooling them, and creating glycerol stocks for long-term storage at -80°C.
- Determine the library size by colony counting and ensure a diversity of 10^7 to 10^9 unique transformants is achieved, which is typical for high-quality yeast display libraries [38] [34] [35].
Table 1: Key Parameters for Maximizing Yeast Transformation Efficiency
| Parameter | Optimal Condition | Rationale |
|---|---|---|
| Cell Growth Phase | Mid-log phase (OD600 0.8-1.0) [37] | Cell walls are most permeable [38] |
| DNA Input (Plasmid) | 100 ng - 1 µg [37] | Balance between efficiency and linearity |
| DNA Input (Linear) | Up to 5 µg [37] | Facilitates genomic integration |
| Heat Shock Duration | 45 minutes [37] | Essential for hardy yeast cell walls |
| Expected Efficiency | 10^4 - 10^6 CFU/µg (S. cerevisiae) [37] | Strain and protocol dependent |
Protocol: Induction of Protein Expression
Following successful library construction, the next critical step is the induction of protein expression and display on the yeast surface.
Materials and Reagents
- Induction Media: SG-based Minimal Medium: SG-base (or SD-base with glucose replaced by galactose) supplemented with appropriate dropout mix (lacking tryptophan) to activate the GAL1 promoter [34] [35]. The medium may be supplemented with 5.4 g/L Na₂HPO₄ and 8.6 g/L NaH₂PO₄ · H₂O to buffer the pH [35].
- Buffers: PBS or PBS/BSA for washing and staining cells.
Step-by-Step Procedure
Inoculation and Growth:
- Inoculate a sample of the transformed yeast library from the glycerol stock into SD/-Trp medium. Grow for ~16-24 hours at 30°C with shaking until saturation (OD600 > 5).
- This step ensures healthy, log-phase cells are available for induction.
Induction of Expression:
- Harvest the cells by centrifugation and wash once with sterile water or PBS to remove residual glucose.
- Resuspend the cell pellet to a final OD600 of ~1.0 in SG/-Trp induction medium. A typical induction volume is 2-10 mL, scaled according to needs.
- Incubate the culture at 20-30°C with shaking for ~20-24 hours to induce protein expression and display [34]. Lower temperatures (e.g., 20°C) can sometimes improve the display of complex proteins.
Monitoring Induction and Display:
- After induction, harvest a small aliquot of cells (e.g., 1 x 10^6 cells) to confirm surface display.
- For display level monitoring, label the induced yeast cells. This can be done via:
- Orthogonal ACP Labeling: Incubate cells with catalytic amounts of Sfp synthase and a fluorescent CoA derivative (e.g., CoA-547) for 1 hour [34].
- Conventional Antibody Staining: Use a primary antibody against a surface tag (e.g., c-Myc, HA) followed by a fluorescently-labeled secondary antibody.
- Analyze the labeled cells using flow cytometry to confirm successful surface display before proceeding to sorting or screening assays.
Table 2: Key Parameters for Successful Induction of Yeast Surface Display
| Parameter | Optimal Condition | Rationale |
|---|---|---|
| Induction Temperature | 20-30°C [34] | Balances protein expression and proper folding |
| Induction Duration | 20-24 hours [34] | Allows for maximal surface display |
| Induction OD600 | ~1.0 | Prevents over-crowding and ensures good aeration |
| Carbon Source | Galactose | Activates the GAL1 promoter driving expression |
Workflow Visualization
The following diagram illustrates the logical workflow from library construction to the induction of protein display, culminating in the analysis of the displayed library for binding function.
The Scientist's Toolkit: Research Reagent Solutions
Table 3: Essential Materials for Yeast Surface Display Library Construction
| Item | Function / Application | Example / Key Feature |
|---|---|---|
| Yeast Strain EBY100 | Display host; genetically modified for efficient surface display of Aga2p fusions [34] [35]. | MATa URA3-52 trp1 leu2Δ1 his3Δ200 pep4::HIS3 prb1Δ1.6R can1 GAL |
| Display Vector (e.g., pCTCON2) | Plasmid for displaying proteins as Aga2p fusions; contains inducible promoter and selection marker [36]. | Contains GAL1 promoter, Trp1 selection marker, c-Myc and HA epitope tags [21] [36]. |
| Golden Gate Assembly System | A one-step, highly efficient cloning strategy for constructing complex libraries by assembling multiple DNA fragments [35]. | Uses Type IIs restriction enzymes (e.g., BsaI) for seamless, directional assembly; ideal for building Fab libraries [35]. |
| Frozen-EZ Yeast Kit | Commercial kit for high-efficiency transformation, streamlining the process and improving reproducibility [37]. | Optimized for maximum transformation efficiency with minimal hands-on time. |
| Sfp Synthase & CoA Substrates | Enzymatic system for covalent, one-step fluorescent labeling of ACP-tagged displayed proteins [34]. | Enables robust, quantitative monitoring of display levels without antibodies [34]. |
| Fluorophore-Conjugated Antigens | Detection reagents for identifying yeast clones that display binders with specificity to the target of interest [8]. | Critical for Fluorescence-Activated Cell Sorting (FACS) to enrich specific binders from libraries. |
Magnetic-Activated Cell Sorting (MACS) and Fluorescence-Activated Cell Sorting (FACS) Panning Strategies
This application note provides a detailed protocol for the integrated use of Magnetic-Activated Cell Sorting (MACS) and Fluorescence-Activated Cell Sorting (FACS) in yeast surface display (YSD) campaigns aimed at selecting binding proteins against Src Homology 2 (SH2) domains. The strategic combination of these technologies leverages the high-throughput pre-enrichment capabilities of MACS with the high-precision, multi-parameter analysis of FACS. This hybrid approach is specifically designed to efficiently isolate specific binders from large, diverse yeast display libraries, which is critical for probing phosphotyrosine-signaling networks and developing novel research reagents or therapeutic candidates.
Technology Comparison and Strategic Implementation
The following table summarizes the core characteristics of MACS and FACS, highlighting their complementary roles in a screening workflow.
Table 1: Comparison of MACS and FACS Technologies in Yeast Surface Display
| Feature | Magnetic-Activated Cell Sorting (MACS) | Fluorescence-Activated Cell Sorting (FACS) |
|---|---|---|
| Throughput | Very High (>10⁹ cells/hour) [39] | High (~10⁷-10⁸ cells/hour) [39] |
| Principle | Bulk separation via magnetic column retention [39] | Single-cell analysis and deflection [39] |
| Key Strength | Ideal for initial "de-bulking" of naive libraries; rapid removal of non-binders [39] | Excellent for fine discrimination based on binding affinity and expression levels [39] |
| Purity Output | Enriched population (contains background binders) [39] | High-purity population (>95-98%) [39] |
| Quantitative Data | No | Yes (multi-parameter fluorescence) [39] |
| Cell Stress | Low (gentle process) [39] | Moderate (high pressure, lasers) [39] |
| Primary Role in Workflow | Pre-enrichment | Fine-specificity sorting and affinity maturation |
The Hybrid Workflow Strategy
The most effective screening campaigns leverage a hybrid workflow to isolate high-affinity binders from large naive libraries [39].
- Round 1 (MACS): The initial naive library (often containing 10⁹-10¹⁰ cells) is subjected to MACS selection. This step rapidly eliminates >99.9% of non-binding clones, efficiently solving the "needle in a haystack" problem and yielding an enriched pool of approximately 10⁶-10⁷ cells [39].
- Rounds 2+ (FACS): The enriched population from MACS is used for all subsequent rounds of sorting via FACS. At this stage, the precision of FACS is critical for performing fine-grained selections necessary for affinity maturation, such as titrating antigen concentration or normalizing binding signals to surface expression levels [39].
Experimental Protocols
Protocol 1: MACS Pre-enrichment of a Yeast Display Library
This protocol is designed for the first round of selection to enrich binders against a biotinylated SH2 domain.
Materials
- Yeast surface display library (e.g., induced in SG-CAA medium)
- Biotinylated target SH2 domain
- Streptavidin-conjugated magnetic microbeads (e.g., 50-100 nm diameter)
- MACS separation columns and a compatible permanent magnet
- Phosphate-Buffered Saline (PBS) with 1 mg/mL BSA (PBS-B)
Procedure
- Labeling: Incubate the yeast display library (approximately 10¹⁰ cells) with a sufficient concentration of biotinylated SH2 domain. This is typically performed in PBS-B for 30-60 minutes on ice to minimize internalization. Only yeast cells displaying a binder will capture the target [39].
- Washing: Pellet the cells and wash twice with cold PBS-B to remove unbound SH2 domain.
- Tagging: Resuspend the cell pellet in PBS-B and add streptavidin-conjugated magnetic microbeads. Incubate for 15-30 minutes on ice. The beads bind with high affinity to the biotinylated antigen, magnetically tagging the cells of interest [39].
- Separation: a. Place a MACS column in the magnetic field. b. Apply the cell-bead mixture to the column. Magnetically tagged cells are retained in the column, while the vast majority of non-binding cells flow through and are discarded [39]. c. Wash the column with several volumes of cold PBS-B to remove weakly bound, non-specific cells.
- Elution: Remove the column from the magnetic field and elute the enriched population of binders using an appropriate buffer (e.g., PBS). This entire process can be completed in under an hour [39].
- Expansion: Culture the eluted cells in SD-CAA medium to regrow the population for subsequent analysis or sorting rounds.
Protocol 2: FACS for Fine-Specificity Selection and Affinity Maturation
This protocol is for subsequent rounds after MACS pre-enrichment, to isolate high-affinity binders based on quantitative fluorescence.
Materials
- Enriched yeast population from MACS
- Biotinylated target SH2 domain
- Fluorescently-conjugated reagents (e.g., Streptavidin-Phycoerythrin (SA-PE))
- Primary antibody against an N- or C-terminal epitope tag on the displayed protein (e.g., anti-c-Myc), followed by a fluorescently-conjugated secondary antibody (e.g., Alexa Fluor 488) for detection of surface expression.
- FACS machine equipped with appropriate lasers and filters
Procedure
- Staining for Binding and Expression: Split the enriched yeast population into aliquots for staining.
- For each sample, incubate cells with varying concentrations of the biotinylated SH2 domain (antigen titration) in PBS-B for 30-60 minutes on ice.
- Include a negative control without antigen to assess background staining.
- Wash cells to remove unbound antigen.
- Incubate with SA-PE to detect bound SH2 domain.
- In parallel, stain a separate aliquot with antibodies against the surface expression tag (e.g., anti-c-Myc) to detect all library members, regardless of binding.
- FACS Analysis and Gating Strategy: a. Singlets Gate: Analyze the cells on the flow cytometer and gate on single cells based on forward scatter height (FSC-H) vs. area (FSC-A) to avoid aggregates [40]. b. Viability Gate: Gate on viable yeast cells based on scatter properties or a live/dead stain. c. Expression Gate: From the viable singlets, select cells that show positive staining for the surface expression tag (e.g., Alexa Fluor 488 positive). This ensures you are analyzing full-length displays. d. Binding Gate: Within the expressing population, set gates to isolate cells with the highest binding signal (SA-PE fluorescence). For affinity maturation, this gate can be set to select only the top 1-5% of binders at a low antigen concentration.
- Sorting: Sort the selected population of high-affinity binders directly into a sterile culture medium or collection tube.
- Expansion and Analysis: Culture the sorted cells for further rounds of sorting or for downstream validation using sequencing and biochemical assays.
Diagram 1: Hybrid MACS/FACS Yeast Display Workflow
The Scientist's Toolkit: Research Reagent Solutions
Table 2: Essential Reagents for SH2 Domain Binder Selection via YSD
| Reagent / Tool | Function / Description | Application Note |
|---|---|---|
| Biotinylated SH2 Domains | The target for selection; biotin allows coupling to magnetic beads or fluorescent streptavidin. | Critical for genotype-phenotype linkage. Recombinant production with site-specific biotinylation (e.g., AviTag) is recommended for uniformity [41]. |
| Streptavidin Microbeads | Reagent for MACS; binds biotinylated target on yeast surface, enabling magnetic separation. | The small size (50-100 nm) ensures efficient labeling and minimal steric hindrance [39]. |
| Fluorescent Streptavidin | Reagent for FACS detection; conjugates like SA-PE provide a bright signal for binding quantification. | Enables titration experiments to estimate binding affinity [39]. |
| Anti-Epitope Tag Antibodies | Primary antibodies (e.g., anti-HA, anti-c-Myc) to detect displayed protein fusion. | Essential for FACS gating to normalize binding to surface expression levels, critical for affinity-based selection [42]. |
| MACS Columns & Magnet | Hardware for the magnetic separation process. | Available in manual and automated formats (e.g., autoMACS) for increased throughput and reproducibility [43]. |
| Next-Generation Sequencing (NGS) | Analysis tool for deep sequencing of sorted library populations. | Used to track enrichment, identify dominant clones, and analyze library diversity. NGS sample preparation can be incorporated into the workflow [44]. |
Application in SH2 Domain Research
The hybrid MACS/FACS strategy is particularly powerful for selecting binding proteins, such as Affimers or monobodies, against SH2 domains. These domains are highly conserved, making the generation of specific inhibitors challenging [42]. High-throughput profiling using display technologies has enabled the quantitative modeling of SH2 domain specificity and the selection of binding reagents [16] [41].
For intracellular applications, selected binders can be subcloned into mammalian expression vectors for functional validation in cellular assays. For example, Affimer reagents targeting the Grb2 SH2 domain have been shown to inhibit its function, curtailing the nuclear translocation of phosphorylated ERK (pERK), a key event in MAPK signaling [42]. The workflow below illustrates this integrated discovery and validation pipeline.
Diagram 2: From Binder Selection to Functional Validation
Counter-Selection and Competitive Elution for Enhanced Specificity
Within the framework of developing high-performance binding proteins using yeast surface display (YSD), achieving exquisite specificity is often as critical as attaining high affinity. This is particularly true for research focused on Src Homology 2 (SH2) domains, a family of over 100 highly conserved domains in humans that recognize phosphotyrosine (pY) sites and are critical in cellular signaling [8]. The high sequence conservation among SH2 domains presents a significant challenge for selectively perturbing the interactions of even a single subfamily [8]. This application note details integrated protocols for counter-selection and competitive elution, two powerful techniques that can be employed during fluorescence-activated cell sorting (FACS) to isolate monobodies or other binding proteins with enhanced specificity from a yeast-displayed library. These methods are essential for discriminating between closely related SH2 domains and minimizing cross-reactivity with the wider SH2 family or other cellular components.
Key Concepts and Rationale
The selection of specific binders from a diverse library requires strategies that actively discriminate against clones with undesirable off-target binding.
- Counter-Selection aims to remove variants that bind to non-target molecules. By pre-incubating the library with off-target antigens (e.g., a related SH2 domain, the unphosphorylated ligand, or a common protein like ovalbumin [45]) and using a fluorescent label to mark binders, FACS can be used to deplete these non-specific clones, thereby enriching the library for binders specific to the target.
- Competitive Elution serves to isolate binders based on their affinity and the precise location of their epitope. During selection, the displayed library is bound to a labeled target. A high concentration of an unlabeled competitor (which could be the pure target protein, a known high-affinity peptide ligand, or a cross-reactive hapten [45]) is then introduced. Cells that release the labeled target upon competition are collected, as this indicates the binding is specific and targets the desired functional epitope.
Research Reagent Solutions
The following table details essential materials required for the protocols described in this note.
Table 1: Essential Research Reagents for YSD Specificity Selection
| Reagent | Function / Explanation |
|---|---|
| Yeast Strain EBY100 | A genetically engineered Saccharomyces cerevisiae strain with genomic integrations for inducible surface expression of Aga1p and the pDNL-6 display vector [45]. |
| Display Vector (e.g., pDNL-6) | Episomal plasmid for the inducible expression of a fusion protein consisting of Aga2p and the protein of interest (e.g., monobody, scFv) [45]. |
| Biotinylated Target Antigen | The molecule of interest (e.g., a specific SH2 domain). Biotin allows for efficient detection with fluorescently labeled streptavidin during FACS analysis [45]. |
| Counter-Antigen(s) | Off-target proteins or haptens used for counter-selection (e.g., a closely related SH2 domain from the same subfamily, metal-free chelator) [45]. |
| Competitor Molecule | The unlabeled version of the target antigen or a known high-affinity ligand used for competitive elution to isolate epitope-specific binders. |
| Anti-c-myc Antibody (9E10) | Mouse monoclonal antibody used to detect the C-terminal c-myc epitope tag on the displayed protein, enabling normalization for surface expression levels [45]. |
| Fluorescent Conjugates | Secondary antibodies (e.g., Phycoerythrin-goat anti-mouse) and streptavidin (e.g., Alexa-633-streptavidin) for dual-color flow cytometry [45]. |
Detailed Protocols
Protocol 1: Sequential Counter-Selection FACS
This protocol describes a method to isolate binders with high specificity by progressively increasing selection stringency [45].
A. Materials and Reagents
- Yeast-displayed library (e.g., monobody or scFv library) induced in SG/R-CAA medium.
- Biotinylated target antigen (e.g., SrcA family SH2 domain).
- Biotinylated counter-antigens (e.g., SrcB family SH2 domains, metal-free chelator [45]).
- Fluorescent detection reagents: Alexa-633-Streptavidin, mouse anti-c-myc antibody (9E10), Phycoerythrin (PE)-conjugated goat anti-mouse antibody.
- Phosphate-Buffered Saline (PBS) or HEPES-Buffered Saline (HBS) containing 0.1% BSA (FACS buffer).
- Fluorescence-Activated Cell Sorter (FACS).
B. Step-by-Step Procedure
- Induction and Preparation: Grow the yeast-displayed library in SG/R-CAA medium for 20-24 hours at 20°C to induce protein expression. Harvest ~1 x 10⁷ cells by centrifugation.
- Blocking: Wash cells twice with ice-cold FACS buffer. Resuspend the cell pellet in 1 mL of FACS buffer.
- Primary Staining (Counter-Selection): Incubate the library with a mixture of biotinylated counter-antigens (e.g., 100-500 nM each) for 30-60 minutes on ice. This marks cells that bind to undesirable off-targets.
- Secondary Staining (Counter-Selection): Wash cells twice to remove unbound counter-antigens. Resuspend in FACS buffer containing a pre-titrated, saturating concentration of Alexa-633-Streptavidin. Incubate on ice for 20 minutes protected from light. Cells binding counter-antigens will be fluorescent in the Alexa-633 channel.
- Primary Staining (Target Binding): Without washing, add the biotinylated target antigen (e.g., 250 nM) and the mouse anti-c-myc antibody to the cell suspension. Incubate for 30-60 minutes on ice.
- Secondary Staining (Target Binding & Expression): Wash cells twice to remove unbound target antigen and primary antibody. Resuspend in FACS buffer containing PE-conjugated goat anti-mouse antibody and a different fluorescent conjugate for the target antigen (if a different fluorophore than Alexa-633 is used for the target). Incubate on ice for 20 minutes protected from light.
- FACS Gating and Sorting: Analyze and sort cells using the following gating strategy:
- Gate on cells based on forward and side scatter.
- Select cells that are positive for the c-myc tag (PE signal), indicating full-length surface expression.
- Within the c-myc-positive population, select cells that are positive for the target antigen signal but negative for the Alexa-633 signal (counter-antigen binding).
- Recovery and Expansion: Collect the sorted cell population and expand them in SD-CAA medium for subsequent rounds of selection.
- Increasing Stringency: In subsequent sorting rounds, progressively decrease the concentration of the target antigen while simultaneously increasing the concentration and/or number of different counter-antigens [45].
C. Anticipated Results After 2-3 rounds of sequential counter-selection, the library should be enriched for clones that bind specifically to the target SH2 domain while showing minimal binding to the counter-selected SH2 domains. This results in selectors capable of discriminating between highly homologous proteins, such as the SrcA and SrcB subfamilies of SFKs [8].
Protocol 2: Competitive Elution FACS
This protocol isolates binders based on their affinity for a specific functional epitope by using a soluble competitor.
A. Materials and Reagents
- Yeast-displayed library, pre-enriched for target binders.
- Biotinylated target antigen.
- Unlabeled competitor (identical to the target antigen or a known high-affinity pY peptide ligand).
- Fluorescent detection reagents and buffers as in Protocol 1.
B. Step-by-Step Procedure
- Binding: Induce and prepare the yeast library as in Protocol 1. Incubate the cells with a saturating concentration of the biotinylated target antigen and the anti-c-myc antibody on ice for 60 minutes.
- Wash: Wash the cells twice with ice-cold FACS buffer to remove unbound antigen.
- Competitive Elution: Resuspend the cell pellet in FACS buffer containing a high concentration (e.g., 1-10 µM) of the unlabeled competitor. Incubate for 15-30 minutes at room temperature with gentle agitation.
- Secondary Staining: Without washing, add the fluorescent secondary reagents (PE-goat anti-mouse for expression and Alexa-633-Streptavidin for target binding). Incubate on ice for 20 minutes.
- FACS Gating and Sorting: Analyze and sort cells using the following strategy:
- Gate on c-myc-positive cells (successful display).
- Within this population, collect the cells that show a low or diminished signal for the bound, biotinylated target relative to a control sample that did not undergo competitive elution. These cells have released the target due to effective competition.
C. Anticipated Results Competitive elution selects for binders that target the functional epitope recognized by the soluble competitor. For SH2 domains, using a known pY peptide as a competitor ensures the isolation of monobodies that act as pY ligand antagonists, which is critical for perturbing kinase autoinhibition or substrate recognition [8].
Quantitative Data and Analysis
The effectiveness of specificity selections is quantified by measuring binding affinity and selectivity profiles.
Table 2: Example Binding Affinity (Kd) and Selectivity of Monobodies for SFK SH2 Domains [8]
| Monobody | On-Target SH2 | On-Target Kd (nM) | Off-Target SH2 | Off-Target Kd (nM) | Selectivity (Fold) |
|---|---|---|---|---|---|
| Mb(Src_2) | Src | ~150 | Lck | >1000 | >6.7 |
| Mb(Lck_1) | Lck | 10-20 | Src | >1000 | >50 |
| Mb(Hck_1) | Hck | ~150 | Yes | >1000 | >6.7 |
The data demonstrates that monobodies selected via these methods can achieve nanomolar affinity for their on-target SH2 domain while showing strong selectivity for either the SrcA (Yes, Src, Fyn, Fgr) or SrcB (Lck, Lyn, Hck) subgroup, with off-target affinities often 5-10 fold weaker or undetectable [8].
Workflow and Pathway Visualizations
YSD Specificity Selection Workflow
Yeast Surface Display System
The Src Homology 2 (SH2) domain is a critical phosphotyrosine-binding module found in over 120 human proteins, including kinases, adaptor proteins, and phosphatases [42]. These domains recognize short amino acid sequences containing phosphorylated tyrosine residues, facilitating protein-protein interactions that regulate fundamental cellular processes such as proliferation, differentiation, and apoptosis [16] [42]. Due to their pivotal role in intracellular signaling pathways, particularly in oncogenesis, SH2 domains represent promising therapeutic targets for cancer and other diseases [42].
Yeast surface display (YSD) has emerged as a powerful platform for selecting and engineering binding proteins against challenging targets like SH2 domains. This technology enables the presentation of recombinant proteins on the yeast cell surface while maintaining a physical link between the phenotype (displayed protein) and genotype (encoding DNA), allowing for efficient screening of complex libraries [46]. For SH2 domain research, YSD offers particular advantages in generating specific binding reagents that can distinguish between highly conserved domains, addressing a significant challenge in the field [42].
This application note provides detailed protocols for using yeast surface display to identify and characterize binding proteins targeting SH2 domains, from initial library screening to the production and validation of soluble hits.
Key Concepts and Biological Significance
SH2 Domain Structure and Function
SH2 domains are approximately 100 amino acids in length with a conserved structure consisting of a central anti-parallel β-sheet flanked by α-helices [42]. They contain two primary binding sites: a conserved phosphotyrosine (pTyr) binding pocket and a more variable pocket that recognizes residues C-terminal to the pTyr, typically engaging a four to seven amino acid motif [42]. This structural conservation across human SH2 domains presents a substantial challenge for developing specific inhibitors, as binding reagents must distinguish between highly similar surfaces [42].
Yeast Surface Display Technology
Yeast surface display typically utilizes the α-agglutinin yeast adhesion system, where proteins of interest are fused to the Aga2p subunit, which covalently links to the membrane-anchored Aga1p subunit [47] [48]. This system allows for efficient display of complex eukaryotic proteins, including antibodies, scaffolds, and peptide libraries. Recent advancements have expanded the YSD toolbox, including alternative display systems such as cysteine-free glycosylphosphatidylinositol (GPI) anchors that minimize undesirable disulfide bond formation in displayed cysteine-rich peptides [46].
Table: Comparison of Yeast Surface Display Systems
| Display System | Key Features | Advantages | Ideal Applications |
|---|---|---|---|
| Aga1/Aga2 System | Heterodimeric; covalent linkage via disulfide bonds | Well-established; high display levels | Antibody fragments; protein scaffolds |
| GPI Anchor System | Monomeric; cysteine-free anchor | Minimizes misfolding; compatible with disulfide-rich proteins | Macrocyclic peptides; cysteine-containing binders |
| Engineered Platforms | Customizable promoters & genetic controls | Precise regulation of display density | CAR-T cell activation studies; signaling research |
Experimental Protocols
Protocol 1: Library Construction for SH2 Domain Binders
Materials
- Yeast strain: EBY100 or equivalent for Aga1/Aga2 system [46]
- Display vector: pYD1 or equivalent with inducible promoter [46]
- Library oligonucleotides: Encoding diverse binding scaffolds (e.g., Affimer, monobody, macrocyclic peptide)
- Electroporation apparatus and recovery media
Method
- Vector preparation: Digest display vector with appropriate restriction enzymes to create cloning site. Purify linearized vector.
- Library DNA generation: Perform PCR amplification of library insert using degenerate oligonucleotides. Use "NNK" codons for randomization (where N = A/T/G/C, K = G/T) to encode all 20 amino acids with only one stop codon [46].
- Assembly and transformation: Combine insert and vector at 3:1 molar ratio and assemble using Gibson assembly or traditional ligation. Desalt DNA and transform into competent yeast cells via high-efficiency electroporation.
- Library validation: Plate serial dilutions to determine transformation efficiency. Harvest remaining cells and culture in appropriate selective media. The resulting library should contain >10⁸ individual clones to ensure sufficient diversity [46].
- Library storage: Cryopreserve library in 25% glycerol at -80°C in aliquots to prevent repeated freeze-thaw cycles.
For macrocyclic peptide libraries, designs may include "one ring" (CXₘC) or "two rings" (CXₘCXₙC) formats, where X represents randomized amino acids and m/n vary between 3-9 residues [46]. These designs enable the formation of constrained structures through disulfide bonding, potentially enhancing binding affinity and specificity.
Protocol 2: Screening by Fluorescence-Activated Cell Sorting (FACS)
Materials
- Target protein: Purified SH2 domain (e.g., Grb2, PI3K p85α) [42]
- Detection reagents: Primary labeling reagent (biotinylated target), secondary stain (streptavidin-conjugated fluorophore, e.g., Alexa Fluor 647)
- Expression detection: Anti-epitope tag antibody (e.g., anti-HA, anti-V5) with different fluorophore (e.g., Alexa Fluor 488)
- FACS instrument: Capable of 4-color detection and high-speed sorting
Method
- Induction of protein expression: Inoculate library into induction media (e.g., SG-CAA for GAL1 promoter) at OD₆₀₀ = 1.0. Incubate at 20-30°C with shaking for 24-48 hours [49].
- Yeast cell preparation: Harvest 10⁸ cells by centrifugation (3,000 × g, 2 min). Wash twice with PBSA (PBS + 0.1% BSA).
- Labeling with target: Resuspend cells in PBSA containing biotinylated SH2 domain at concentrations ranging from 1 nM to 100 nM. Incubate for 1-2 hours at room temperature with gentle rotation.
- Secondary staining: Wash cells twice with PBSA, then resuspend in PBSA containing streptavidin-conjugated fluorophore and anti-epitope antibody conjugated to different fluorophore. Incubate for 30 minutes at 4°C protected from light.
- FACS analysis and sorting: Resuspend cells in PBSA at ~10⁷ cells/mL. Sort using a stringent gating strategy:
- Gate on single cells based on FSC-A/FSC-H
- Select high-expression population based on epitope tag signal
- Sort cells with highest target binding to expression ratio
- Recovery and expansion: Collect sorted cells in recovery media. Expand populations for subsequent rounds of sorting or analysis.
For initial rounds, use lower stringency (higher target concentration) to retain diversity. Increase stringency in subsequent rounds by reducing target concentration (1-10 nM) or introducing competition with unlabeled target [46].
Protocol 3: Soluble Protein Production and Characterization
Materials
- Expression vector: pET or pPIC series for bacterial or yeast expression, respectively
- Expression host: E. coli (e.g., BL21(DE3)) or P. pastoris (e.g., X33) [49]
- Purification resins: Ni-NTA agarose for His-tagged proteins, streptavidin resin for biotinylated proteins
- Analytical equipment: SPR instrument (e.g., Biacore) or BLI instrument (e.g., Octet)
Method
- Subcloning: Amplify hit sequences from yeast display vector and clone into soluble expression vector with appropriate tags (e.g., His₆, AviTag).
- Small-scale expression testing: Transform expression vectors into appropriate hosts. Test expression in 5 mL cultures, screening for soluble protein production.
- Large-scale production: Inoculate 1 L culture with optimal expression conditions. Induce at appropriate OD with IPTG (bacterial) or methanol (yeast). Harvest cells after 12-24 hours post-induction.
- Protein purification: Lyse cells using mechanical disruption or enzymatic lysis. Purify soluble protein using affinity chromatography (e.g., Ni-NTA for His-tagged proteins). Further purify by size exclusion chromatography if needed.
- Binding characterization:
- Surface Plasmon Resonance (SPR): Immobilize SH2 domain on CMS chip. Measure binding kinetics of purified hits at multiple concentrations (0.1-100 nM).
- Bio-Layer Interferometry (BLI): Load biotinylated SH2 domain on streptavidin sensors. Dip into hit solutions to measure association, then transfer to buffer to measure dissociation.
- ELISA: Coat plates with SH2 domain. Incubate with serial dilutions of hits. Detect binding with tag-specific antibodies.
Table: Expected Binding Parameters for High-Quality SH2 Binders
| Parameter | Ideal Range | Significance |
|---|---|---|
| KD | Low nM (1-50 nM) [42] | Binding affinity |
| kon | >10⁴ M⁻¹s⁻¹ | Association rate |
| koff | <10⁻³ s⁻¹ | Dissociation rate |
| IC50 | 100 nM - 1 µM [42] | Functional inhibition |
| Specificity | ≤10% off-target binding [42] | Target selectivity |
Workflow Visualization
Yeast Display Screening Workflow
SH2 Domain Signaling and Inhibition
Research Reagent Solutions
Table: Essential Reagents for Yeast Display-Based SH2 Binder Discovery
| Reagent Category | Specific Examples | Function | Considerations |
|---|---|---|---|
| Display Systems | pYD1 vector; EBY100 yeast strain | Provides display platform | Compatibility with binding protein scaffold |
| SH2 Domain Targets | Grb2, p85α (PI3K), Lck, Src [42] | Screening targets | Require proper folding and post-translational modifications |
| Detection Reagents | Anti-HA-AF488; Streptavidin-PE; Anti-V5-PE [47] [46] | Detection of displayed proteins and binding | Minimal cross-reactivity; bright fluorophores |
| Expression Systems | pET vectors (E. coli); pPIC vectors (P. pastoris) [49] | Soluble protein production | Maintain binding affinity from displayed format |
| Affinity Measurement | SPR chips (CM5); BLI sensors (Streptavidin) | Binding kinetics | Label-free interaction analysis |
| Cell-Based Assay Tools | HEK293 cells; pERK antibodies; High-content imaging systems [42] | Functional validation | Pathway-specific readouts for SH2 function |
Expected Results and Data Interpretation
Successful implementation of these protocols should yield specific high-affinity binders against target SH2 domains. For Grb2 SH2 domain targeting, expect IC₅₀ values ranging from 270.9 nM to 1.22 µM with low nanomolar binding affinities [42]. In cellular assays, effective binders should demonstrate inhibition of SH2 domain-mediated functions, such as reducing nuclear translocation of pERK in the MAPK pathway [42].
Specificity should be rigorously validated using microarray or ELISA-based approaches, with optimal binders showing ≤10% off-target binding to related SH2 domains [42]. This high specificity is crucial given the structural conservation across the SH2 domain family.
The integration of yeast surface display with high-throughput screening methodologies enables the comprehensive exploration of SH2 domain function and inhibition. These protocols provide a roadmap for developing research reagents that can dissect complex signaling pathways and potentially inform therapeutic development for SH2 domain-related diseases.
Characterizing Binding Affinity and Kinetics Using Flow Cytometry and Biolayer Interferometry
The characterization of biomolecular interactions is a cornerstone of molecular biology and drug discovery, providing critical insights into the mechanisms that govern cellular signaling and enabling the development of targeted therapeutics. Within the context of Src homology 2 (SH2) domains—modular protein domains that recognize phosphotyrosine (pY) motifs and mediate critical signaling pathways in health and disease—the precise determination of binding affinity and kinetics is paramount [50] [8]. This application note details integrated methodologies employing yeast surface display (YSD) for ligand selection, flow cytometry for initial binding characterization, and biolayer interferometry (BLI) for rigorous kinetic analysis. The focus is applied to the identification and characterization of binding proteins, such as monobodies, targeting SH2 domains, framing these techniques within a complete workflow for researchers in drug development [8] [10].
Theoretical Background: SH2 Domains as Therapeutic Targets
SH2 domains are small modular protein-protein interaction domains found in over 100 human signaling proteins, including kinases, phosphatases, and adaptor proteins [8]. They recognize target proteins by binding to short amino acid sequences containing a phosphotyrosine (pY) residue [50]. The specificity of individual SH2 domains is mediated by interactions with amino acid residues immediately C-terminal to the phosphotyrosine [50].
The eight highly homologous Src family kinase (SFK) SH2 domains are particularly challenging targets. Their critical role in kinase autoinhibition and substrate recognition makes them attractive for therapeutic intervention, but their sequence conservation poses a significant challenge for achieving selective perturbation [8] [51]. Traditional affinity-based selections often identify ligands that cross-react with related SH2 domains, highlighting the need for techniques that can discriminate based on both affinity and specificity [50]. High-performance synthetic binding proteins, such as monobodies, have been developed to overcome this challenge, achieving nanomolar affinity and strong selectivity for either the SrcA (Yes, Src, Fyn, Fgr) or SrcB (Lck, Lyn, Blk, Hck) subgroup of SFKs [8] [51].
The following diagram illustrates the functional role and targeting of SFK SH2 domains:
Diagram 1: SH2 Domain Function and Targeting. SFK SH2 domains participate in intramolecular autoinhibition and intermolecular signaling via phosphotyrosine (pY) ligand recognition. Selective monobodies can competitively inhibit these interactions.
Experimental Platform: Yeast Surface Display for SH2 Binder Selection
Yeast surface display (YSD) is a powerful platform for engineering high-affinity protein binders. It involves the expression of recombinant proteins, such as monobody libraries, on the surface of Saccharomyces cerevisiae cells, fused to a-agglutinin mating protein [10]. This system allows for the selection of binders against specific targets, such as SH2 domains, while simultaneously enabling quantitative analysis of binding affinity directly on the yeast cell surface.
The general YSD workflow for selecting SH2-binding monobodies includes:
- Library Construction: A diverse library of monobody clones is generated on the fibronectin type III (FN3) scaffold. For SH2 domains, both "loop-only" and "side-and-loop" libraries have been successfully employed [8].
- Panning (Biopanning): The yeast-displayed library is incubated with the target SH2 domain (e.g., Src, Lck, Hck). Bound SH2 domain is typically detected using a tag-specific antibody (e.g., anti-GST) and a fluorescently labeled secondary antibody.
- Flow Cytometric Analysis and Sorting: Cells displaying monobodies that bind the SH2 domain are isolated using fluorescence-activated cell sorting (FACS). This process is typically repeated for multiple rounds to enrich for high-affinity binders.
- Affinity Screening: The binding affinity of selected clones for the on-target and off-target SH2 domains can be estimated directly on the yeast surface by performing binding titrations and analyzing the mean fluorescence intensity via flow cytometry, providing Kd estimations before moving to more detailed kinetic analysis [8].
Protocol 1: Binding Characterization via Flow Cytometry
Flow cytometry is an indispensable tool for the initial screening and quantitative analysis of protein-protein interactions in a high-throughput manner, such as characterizing monobodies selected via YSD.
Materials and Reagents
Table 1: Key Research Reagent Solutions for YSD and Flow Cytometry
| Reagent / Solution | Function / Description | Example / Note |
|---|---|---|
| Yeast Surface Display Library | Platform for displaying monobody variants for selection. | Constructed on FN3 scaffold; "side-and-loop" library effective for SH2 domains [8]. |
| SH2 Domain Protein | Target antigen for selection and binding assays. | Recombinantly produced; may be fused to tags (e.g., GST) for detection [8]. |
| Detection Antibodies | Label primary detection tag or protein. | Anti-GST primary; fluorophore-conjugated secondary (e.g., FITC, PE) [52]. |
| Flow Cytometry Buffer | Medium for dilution and washing steps. | PBS with 1% BSA is commonly used [50]. |
| Induction Media | For inducing monobody expression on yeast surface. | SGCAA or SGCRCAA media for galactose-induced expression. |
Detailed Step-by-Step Method
Induction of Monobody Expression:
- Inoculate yeast clones from the selected library into induction media.
- Incubate with shaking (e.g., 250 rpm) at a specific temperature (e.g., 20-30°C) for 18-24 hours to induce surface expression.
Preparation of Yeast Cells:
- Harvest yeast cells by centrifugation (e.g., 3,000 × g for 5 minutes).
- Wash cells twice with an appropriate buffer, such as PBS/1% BSA.
- Resuspend the cell pellet to a density of ~5 × 10^7 cells/mL in PBS/1% BSA.
Staining for Binding Analysis:
- Aliquot yeast cells into a 96-well plate or microcentrifuge tubes.
- Incubate cells with a range of concentrations of the biotinylated or tagged SH2 domain protein for 30-60 minutes at room temperature to achieve binding equilibrium [50] [8].
- Wash cells twice with ice-cold PBS/1% BSA to remove unbound protein.
- For detection, incubate cells with a fluorophore-conjugated streptavidin or tag-specific primary antibody for 20-30 minutes on ice, protected from light.
- If using a primary antibody, wash again and then incubate with a fluorophore-conjugated secondary antibody.
- Perform a final wash and resuspend cells in an appropriate volume for analysis.
Data Acquisition on Flow Cytometer:
- Use a calibrated flow cytometer. Record the laser lines and optical emission filters used for each fluorophore [52].
- Collect a sufficient number of events (e.g., 10,000-50,000 gated events) for robust statistical analysis.
- Properly compensate for spectral overlap between fluorophores using control samples [53] [52].
Data Analysis and Affinity Estimation:
- Gate on the live, single yeast cell population based on forward and side scatter properties.
- Analyze the fluorescence intensity of the population bound to the SH2 domain.
- Plot the mean or median fluorescence intensity (MFI) against the SH2 domain concentration.
- Fit the binding curve (e.g., with a one-site specific binding model) using software such as GraphPad Prism to estimate the apparent dissociation constant (Kd) [8].
The workflow and data analysis pipeline is summarized below:
Diagram 2: Flow Cytometry Binding Assay Workflow. Steps for characterizing monobody-SH2 domain binding affinity using yeast surface display and flow cytometry. MFI: Mean Fluorescence Intensity.
Protocol 2: Kinetic Analysis via Biolayer Interferometry (BLI)
BLI is a label-free optical technique that measures the interference pattern of white light reflected from a biosensor tip to monitor biomolecular binding in real-time [54] [55]. It is ideal for characterizing the kinetics of monobody-SH2 interactions after initial flow cytometry screening.
Materials and Reagents
Table 2: Key Research Reagent Solutions for BLI
| Reagent / Solution | Function / Description | Example / Note |
|---|---|---|
| BLI Instrument | Platform for performing kinetic measurements. | Octet systems (e.g., Octet K2, R4, R8) are widely used [56] [55]. |
| BLI Biosensors | Solid-supported dip probes that capture the ligand. | Anti-GSH (GST-tagged SH2) or NTA (His-tagged monobody/SH2) [8] [55]. |
| Kinetics Buffer | Baseline and dilution buffer for proteins/analytes. | HEPES or PBS-based buffer; may include additives like 0.01-0.1% surfactant [55]. |
| Ligand | Immobilized binding partner. | Purified SH2 domain or monobody with appropriate tag (GST, His). |
| Analyte | Binding partner in solution. | The complementary binding partner (monobody or SH2 domain) over a concentration series. |
Detailed Step-by-Step Method
Instrument and Sensor Preparation:
- Power on the BLI instrument (e.g., Octet K2) and pre-warm for at least 30 minutes. Set the operating temperature to the desired setpoint (e.g., 30°C) [55].
- Hydrate NTA or Anti-GSH biosensors in kinetics buffer for at least 15 minutes before the assay.
Experimental Setup and Plate Layout:
- Prepare a 96-well plate with solutions as needed for the following steps in a minimum volume of 200 µL per well:
- Column 1: Kinetics buffer for baseline.
- Column 2: Ligand solution (e.g., 5-25 µg/mL of His-tagged protein for NTA sensors) for loading.
- Column 3: Kinetics buffer for a second baseline.
- Columns 4-8: A concentration series of the analyte (e.g., 5-6 concentrations in a 2- or 3-fold dilution) for association.
- Column 9: Kinetics buffer for dissociation.
- Prepare a 96-well plate with solutions as needed for the following steps in a minimum volume of 200 µL per well:
Assay Step Sequence:
- Baseline (60 sec): Establish a stable baseline in kinetics buffer.
- Loading (300 sec): Immobilize the ligand onto the biosensor surface.
- Baseline 2 (60 sec): Wash away unbound ligand and re-stabilize the signal.
- Association (300 sec): Measure binding of the analyte to the immobilized ligand.
- Dissociation (600 sec): Monitor dissociation of the complex in kinetics buffer.
- Regeneration: After each cycle, regenerate sensors for re-use with a mild acidic solution (e.g., 10 mM Glycine, pH 1.7) followed by re-charging with NiCl2 for NTA sensors [55].
Data Analysis:
- In the analysis software, load the data file and assign experimental steps.
- Subtract the signal from a reference sensor (dipped in buffer only or loaded with a non-interacting protein).
- Fit the processed association and dissociation curves to a suitable binding model (e.g., 1:1 binding model) globally across all analyte concentrations.
- The software will report the association rate (kon), dissociation rate (koff), and the calculated equilibrium dissociation constant (Kd = koff / kon).
The following diagram illustrates the BLI process and data output:
Diagram 3: BLI Assay Steps and Output. Key stages of a BLI experiment and the resulting sensorgram used for kinetic parameter calculation.
Data Integration and Presentation
Integrating data from flow cytometry and BLI provides a comprehensive profile of a binding interaction, from initial affinity screening to detailed kinetic characterization.
Table 3: Exemplary Binding Data for SFK SH2 Domain Monobodies
| Monobody Target | Monobody Name | Flow Cytometry Kd (nM) | BLI / ITC Kd (nM) | kon (1/Ms) | koff (1/s) | Selectivity Profile |
|---|---|---|---|---|---|---|
| Lck SH2 | Mb(Lck_1) | 10-20 [8] | Low nanomolar (by ITC) [8] | - | - | SrcB subgroup selective [8] |
| Lyn SH2 | Mb(Lyn_2) | 10-20 [8] | Low nanomolar (by ITC) [8] | - | - | SrcB subgroup selective [8] |
| Src SH2 | Mb(Src_2) | 150-420 [8] | Low nanomolar (by ITC) [8] | - | - | SrcA subgroup selective [8] |
| Hck SH2 | Mb(Hck_1) | 150-420 [8] | Low nanomolar (by ITC) [8] | - | - | SrcB subgroup selective [8] |
Guidelines for Data Presentation
Flow Cytometry Data:
- Gating Strategy: Always include plots showing the sequential gating strategy used to identify the population of interest, including debris exclusion, singlets, and live cells [53] [52].
- Plot Presentation: Use contour or density dot plots for bivariate data. Label axes with the antibody/fluorochrome name (e.g., "Anti-GST-PE") rather than just the detector channel [52].
- Statistical Reporting: Report the percentage of gated populations and the statistics used for fluorescence intensity comparisons (e.g., mean or median) [53].
BLI Data:
- Sensorgram Presentation: Show all analyte concentrations used for the global fit on the same plot, including the fitted curves.
- Parameter Reporting: Report kinetic constants (kon, koff, Kd) with associated standard errors or confidence intervals from the curve fitting.
The synergistic use of yeast surface display, flow cytometry, and biolayer interferometry creates a powerful pipeline for the discovery and characterization of high-affinity, selective binders against challenging targets like SH2 domains. YSD enables the selection of specific monobodies, flow cytometry facilitates rapid quantitative screening and affinity estimation, and BLI provides detailed kinetic profiling in a label-free, quantitative manner. This integrated approach, as demonstrated by the generation of monobodies with unprecedented potency and selectivity for SFK SH2 domains, provides researchers with robust tools to dissect complex signaling pathways and advance therapeutic development [8].
Solving Common Challenges and Enhancing Selection Efficiency
Overcoming Issues with Low Diversity and Poor Library Representation
Yeast surface display (YSD) is a powerful technique for selecting and engineering binding proteins, making it particularly valuable for studying SH2 domain interactions with phosphotyrosine-containing peptides. However, the effectiveness of any YSD campaign is fundamentally constrained by the quality and diversity of the initial library. Low diversity and poor library representation can severely limit the exploration of sequence space, resulting in failed screens where no high-affinity binders are identified, or the selection of suboptimal clones that do not represent the best possible binders. This application note details practical strategies to overcome these challenges, enabling researchers to build more comprehensive libraries and obtain robust, reliable data for SH2 domain research and drug development.
Core Strategies for Enhancing Library Quality
The following strategies address the root causes of low diversity and poor representation in yeast surface display libraries.
Utilizing Highly Diverse Randomized Libraries
The use of degenerate oligonucleotide libraries with high theoretical diversity is crucial for comprehensively sampling sequence space. While libraries based on known proteome sequences (e.g., pTyr-Var libraries with ~10⁴ sequences) are useful for profiling, they are inherently limited to existing variations [41] [57]. For de novo discovery of novel binders, fully randomized synthetic libraries are superior.
Library Design Options:
- X5-Y-X5 Library: A library of 10⁶–10⁷ random 11-mer sequences with a central tyrosine residue. This design is ideal for profiling the specificity of tyrosine kinases and SH2 domains and for designing high-activity substrate sequences [41] [57].
- Fully Random X11 Library: A library where 11 consecutive residue positions are fully randomized. This unbiased design is less dependent on prior knowledge of the binding motif and can reveal unexpected specificities, though it may require more intensive sequencing and analysis [16].
Quantitative Analysis with Deep Sequencing: Combining these large libraries with deep sequencing allows for a quantitative comparison of enrichment across millions of sequences. This high-throughput profiling moves beyond simple yes/no binding assessments to generate rich datasets on relative binding affinities and specificities [41] [57].
Advanced Data Analysis with Free Energy Models
Traditional analysis methods, such as calculating position-specific enrichment scores, can be suboptimal and their outcomes dependent on library design [16]. Employing more sophisticated computational models can extract more accurate and library-agnostic binding information.
- ProBound Software: This statistical learning method can be configured to learn a free-energy matrix that describes how an SH2 domain interacts with a peptide subsequence. Unlike simple enrichment scores, the binding free energy parameters (ΔΔG/RT) estimated by ProBound are intrinsic properties of the SH2-peptide interface and show superior consistency across different library designs (e.g., X5YX5 vs. pTyr-Var libraries) [16].
- Benefits: This approach controls for sequence context and non-specific binding effects, leading to more robust predictions of binding affinity for any ligand sequence within the theoretical space covered by the library. This is invaluable for predicting signaling network connectivity and the impact of missense variants on SH2 binding [16].
Optimizing Yeast Surface Display Production Protocols
The efficiency of the YSD system itself is critical. A protocol optimized for the production of surface-displayed proteins ensures a higher fraction of cells properly express the full-length fusion protein, thereby increasing the functional diversity of the library.
- Key Optimization Parameters for Komagataella phaffii:
- Temperature: Shifting the induction temperature from 30°C to 25°C during the methanol phase can increase final volumetric activity [49].
- Cell Density at Induction: Inducing at a higher optical density (OD600 of ~25-30) can improve yields compared to lower densities [49].
- Cultivation Volume: Reducing the medium volume by half during the induction phase can increase volumetric activity, likely by improving aeration and nutrient availability [49].
- Sterilization and Storage: Treated cells can be sterilized and stored for at least 87 days without loss of activity, enabling batch production and quality control before large-scale screening [49].
Table 1: Summary of High-Diversity Library Designs for SH2 Domain Profiling
| Library Name | Design | Theoretical Diversity | Key Advantages | Best Use Cases |
|---|---|---|---|---|
| X5-Y-X5 [41] [57] | 11-mer, central tyrosine, degenerate N- and C-terminal flanks | 10⁶ – 10⁷ clones | Recapitulates known motifs; good balance of diversity and focus | Profiling kinase/SH2 specificity; designing optimal substrates |
| pTyr-Var [41] [57] | Defined sequences from human phosphoproteome & natural variants | ~10⁴ sequences | Directly assays physiological & disease-associated sequences | Understanding natural variation & mutational impact on signaling |
| Fully Random X11 [16] | 11 consecutive randomized residues | ~10¹³ (theoretical) | Unbiased; does not require pre-defined binding register | Discovering novel, non-canonical binding motifs |
Experimental Protocol: A Workflow for Robust SH2 Domain Ligand Selection
This protocol outlines the steps for using a high-diversity yeast surface display library to select SH2 domain-binding peptides, incorporating strategies to mitigate representation issues.
Step 1: Library Construction and Transformation
- Oligonucleotide Synthesis: Order a degenerate oligonucleotide library encoding your desired design (e.g., X5-Y-X5). Use trinucleotide synthesis to reduce codon bias and stop codons, which directly improves functional library diversity.
- Yeast Transformation: Clone the library into your YSD vector (e.g., pCTCon2) and transform into competent Saccharomyces cerevisiae EBY100 cells using a high-efficiency lithium acetate protocol. Aim for a transformation efficiency that yields a library size at least 10-fold greater than the theoretical diversity of the oligonucleotide pool to ensure adequate representation.
- Quality Control: Plate serial dilutions to determine the library size. Pick and sequence random clones to verify insert integrity and diversity.
Step 2: Induction and Surface Expression
- Inoculation: Inoculate the library into appropriate selective medium containing glucose and grow overnight at 30°C.
- Induction: Harvest cells and resuspend in induction medium containing galactose to induce expression of the surface display fusion protein. Follow optimized protocols, such as inducing at an OD600 of ~25-30 and incubating at 25°C for 18-24 hours to improve proper protein folding and display levels [49].
Step 3: In Vitro Phosphorylation and SH2 Domain Binding
- Phosphorylation Reaction: Wash the induced yeast cells and resuspend them in a kinase reaction buffer. Add a purified tyrosine kinase (e.g., Src kinase) and ATP to phosphorylate the displayed tyrosine residues. This step is critical for creating the ligand for SH2 domain binding [57].
- SH2 Domain Incubation: Wash the cells to terminate the phosphorylation reaction. Incubate the cells with a purified, biotinylated SH2 domain protein. The concentration and incubation time should be optimized to favor the selection of high-affinity binders.
Step 4: Affinity Selection and Analysis
- Magnetic-Activated Cell Sorting (MACS): Use streptavidin-conjugated magnetic beads to isolate yeast cells that have bound the biotinylated SH2 domain. This method allows for the benchtop processing of large libraries more readily than FACS [41] [57].
- Plasmid Recovery and Deep Sequencing: Isolate plasmid DNA from the sorted population. Amplify the library insert region and subject it to Illumina deep sequencing to determine the frequency of each peptide sequence before and after selection.
- Data Modeling with ProBound: Analyze the sequencing data using the ProBound software to build a quantitative model of SH2 domain specificity. This model will output a free-energy matrix that predicts the binding affinity for any peptide sequence within the sampled space [16].
Table 2: The Scientist's Toolkit: Key Reagents for YSD of SH2 Domains
| Reagent / Tool | Function / Description | Application in Protocol |
|---|---|---|
| Degenerate Oligo Library (e.g., X5-Y-X5) | Genetically-encoded source of peptide diversity | Provides the initial sequence pool for library construction (Step 1) |
| Yeast Strain (e.g., EBY100) | Engineered for efficient surface display (Aga1p/Aga2p system) | Host for displaying the peptide library (Steps 1-2) |
| YSD Vector (e.g., pCTCon2) | Plasmid for inducible expression of peptide-Aga2p fusion | Carries the library genes and enables controlled expression |
| Biotinylated SH2 Domain | "Bait" for affinity selection; biotin enables capture | Used to label cells displaying binding peptides (Step 3) |
| Tyrosine Kinase (e.g., Src) | Enzyme that phosphorylates tyrosine residues | Creates the phosphotyrosine ligand on displayed peptides (Step 3) |
| Streptavidin Magnetic Beads | Solid-phase capture matrix for biotinylated complexes | Isolates SH2-bound yeast cells (Step 4) |
| ProBound Software [16] | Statistical learning tool for binding data analysis | Models sequence-specific binding energy from sequencing data (Step 4) |
Overcoming the challenges of low diversity and poor library representation is not merely a technical exercise but a prerequisite for successful research and discovery using yeast surface display. By implementing the strategies outlined—employing highly diverse random libraries, adopting advanced computational models like ProBound for data analysis, and rigorously optimizing the display protocol—researchers can dramatically improve the quality and outcomes of their screens for SH2 domain binding proteins. This integrated approach ensures a more complete exploration of the sequence and binding landscape, leading to more reliable biological insights and a stronger foundation for drug development efforts.
Optimizing Panning Stringency to Combat Dominant Clones and Enrich Rare Binders
Yeast surface display (YSD) has emerged as a powerful platform for directed evolution of binding proteins, including SH2 domains, due to its eukaryotic expression machinery that supports proper folding of complex proteins and its compatibility with quantitative fluorescence-activated cell sorting (FACS) [19]. However, a significant challenge in library screening remains the emergence of dominant clones—highly expressed but often low-affinity variants that outcompete rare high-affinity binders during early selection rounds. This phenomenon is particularly problematic in SH2 domain engineering, where enriching true high-affinity phosphotyrosine binders requires careful manipulation of selection parameters [58].
The SCASA (Synthetic Cellular Advanced Signal Adapter) system exemplifies recent advances in YSD that enable precise control over antigen density, providing a tool for systematic assessment of binding interactions under defined conditions [48]. Such platforms highlight the critical importance of stringency control during panning to successfully isolate rare high-value binders from diverse variant libraries. This protocol details evidence-based strategies to optimize panning stringency specifically for SH2 domain and other binding protein selections using yeast surface display.
Theoretical Foundation: Principles of Stringency Optimization
Key Parameters Controlling Panning Stringency
Panning stringency refers to the selective pressure applied during library screening to favor binders with desired characteristics. Four primary parameters govern stringency in YSD experiments:
- Target concentration: Reduced concentration increases competition for binding sites, favoring higher-affinity clones [12]
- Incubation time: Shorter times favor binders with faster association rates (kon)
- Wash conditions: Increased wash volume, duration, and detergent concentration preferentially remove slower-dissociating binders [12]
- Competition: Including soluble competitors during washing or pre-incubation eliminates binders with fast dissociation rates (koff) [12]
Quantitative Relationship Between Selection Conditions and Binder Enrichment
Table 1: Selection Parameters and Their Impact on Binder Characteristics
| Parameter | Low Stringency Conditions | High Stringency Conditions | Primary Binder characteristic Selected |
|---|---|---|---|
| Target Concentration | 100-1000 nM | 0.1-10 nM | Affinity (KD) |
| Incubation Time | 60-120 minutes | 5-30 minutes | Association rate (kon) |
| Wash Volume | 1-5 mL | 10-50 mL | Dissociation rate (koff) |
| Wash Duration | 1-5 minutes | 10-60 minutes | Dissociation rate (koff) |
| Competitor Concentration | None | 10-1000x molar excess | Specificity & koff |
| Number of Selection Rounds | 2-3 rounds | 4-6 rounds | Overall stability & affinity |
For SH2 domains, which typically bind phosphotyrosine-containing peptides with micromolar affinities [58], initial rounds should employ lower stringency (100-1000 nM target) to preserve library diversity, with progressive stringency increases in subsequent rounds to isolate nanomolar-range "superbinders" [58].
Materials and Reagents
The Scientist's Toolkit: Essential Research Reagents
Table 2: Key Reagent Solutions for YSD Panning Optimization
| Reagent Category | Specific Examples | Function in Panning Optimization |
|---|---|---|
| Yeast Display System | pCTcon2 vector; EBY100 yeast strain [12] | Genotype-phenotype linkage via Aga2p fusion |
| Detection Reagents | Anti-c-myc FITC; Anti-HA PE [12] | Quantification of surface expression & normalization |
| Binding Target | Biotinylated pTyr peptides; Phosphorylated proteins [58] [41] | Selection antigen for SH2 domain libraries |
| Competitors | Soluble non-biotinylated pTyr peptides; Sulfotyrosine peptides [58] | Stringency control during washing steps |
| Magnetic Separation | Streptavidin magnetic beads [41] | Rapid separation of binders from non-binders |
| FACS Reagents | Propidium iodide; PBSA buffer [12] | Viability staining & cell sorting buffer |
Protocol: Sequential Stringency Optimization for SH2 Domains
Library Design and Diversity Estimation
Step 1: Library Construction
- For SH2 domains, randomize 8-15 residues in the phosphotyrosine binding pocket using Kunkel method or site-directed mutagenesis [58]
- Use codon-based randomization to minimize library bias [19]
- Achieve theoretical diversity of 108-109 transformants, with 10x oversampling for adequate coverage [12]
- Validate library quality by next-generation sequencing (5-6 million sequences recommended) [58]
Step 2: Yeast Transformation and Induction
- Employ EBY100 yeast strain with integrated Aga1p under GAL1 promoter [12]
- Use electroporation for highest transformation efficiency
- Induce with galactose-containing media at 20-30°C for 16-48 hours to display SH2 variants [12]
Tiered Panning Strategy with Progressive Stringency
Step 3: Round 1 - Low Stringency Panning
- Incubate 108 yeast cells with 100-500 nM biotinylated pTyr peptide in PBSA (PBS + 0.1% BSA) for 60 minutes at room temperature
- Use gentle rotation to maintain suspension
- Wash with 5mL ice-cold PBSA twice (2 minutes per wash)
- Elute binders with 1mL 20mM DTT or glycine (pH 2.2)
- Immediately neutralize with 150µL 1M Tris (pH 8.0)
- Amplify in SDCAA media at 30°C for 48 hours [12]
Step 4: Round 2 - Medium Stringency Panning
- Reduce target concentration to 10-50 nM
- Include 1-hour pre-incubation with non-biotinylated wild-type pTyr peptide (50x molar excess) to remove promiscuous binders
- Increase wash volume to 10mL with three washes
- Include 0.05% Tween-20 in wash buffer to reduce nonspecific binding
- Extend final wash to 10 minutes with gentle agitation [58]
Step 5: Round 3 - High Stringency Panning
- Decrease target concentration to 1-5 nM
- Include competition during wash phase (100x molar excess soluble competitor)
- Increase wash volume to 20mL with four washes
- Extend total wash time to 30-60 minutes
- Use magnetic bead separation for more stringent recovery [41]
Step 6: Round 4 - Counter-Selection Panning
- Pre-incubate library with non-target pTyr peptide or irrelevant phosphoprotein
- Remove binders to common epitopes or non-specific interactors
- Proceed with high stringency selection as in Round 3
- This step crucial for eliminating dominant clones with undesired specificities [58]
FACS-Based Stringency Control for Rare Binder Enrichment
Step 7: FACS Sorting for Highest-Affinity Binders
- Stain induced yeast library with:
- Anti-c-myc FITC (1:100) for expression normalization
- Biotinylated pTyr peptide (0.1-10 nM) for binding measurement
- Streptavidin-PE (1:200) for detection
- Include propidium iodide (1µg/mL) to exclude dead cells
- Sort using stringent gating strategy:
- Gate on single cells (FSC-A vs FSC-H)
- Gate on viable (PI-negative) cells
- Gate on high expressers (top 50% by FITC)
- Sort double-positive population (FITC+PE+) [12]
- For dissociation rate sorting, use kinetic competition:
- Saturate with labeled ligand, then incubate with 100x excess unlabeled ligand
- Sort cells retaining fluorescence after 1-24 hours [12]
Table 3: FACS Sorting Parameters for Affinity-Based Selection
| Sorting Strategy | Labeling Conditions | Gating Parameters | Expected Outcome |
|---|---|---|---|
| Equilibrium Sorting | 5-10x KD ligand concentration [12] | High PE/FITC ratio | Affinity (KD) enrichment |
| Kinetic Competition | Saturate, then compete with 100x unlabeled ligand [12] | High residual PE after competition | koff enrichment |
| Specificity Sorting | Target + 10x excess non-target peptide | High target signal with low non-target binding | Specificity enrichment |
| Expression Sorting | Anti-c-myc only | Highest 10% expression | Stability & expressibility |
Case Study: SH2 Superbinder Selection with Controlled Stringency
Application to Fyn SH2 Domain Engineering
A recent study demonstrating these principles randomized 8 variable residues in the Fyn SH2 domain phosphotyrosine binding pocket, creating a library with 1.27×10⁹ diversity [58]. The selection employed progressive stringency optimization:
Pre-panning negative selection significantly reduced dominant clones: the library was pre-incubated with nonphosphorylated peptide EPQYEEIPIYL immobilized on streptavidin plates, removing promiscuous binders before positive selection [58].
Controlled antigen density was achieved using the SCASA system, which regulates surface-displayed CD19 levels over >3 orders of magnitude, enabling precise tuning of selection pressure [48].
Result: After four rounds of increasingly stringent selection, researchers identified three novel SH2 superbinders (V3, V13, V24) with comparable binding affinities to previously reported superbinders but distinct sequence features and specificity profiles [58]. Notably, variant V3 displayed unique specificity—binding phosphotyrosine with high affinity but not sulfotyrosine—demonstrating the power of optimized stringency control to isolate rare clones with desirable functional characteristics [58].
Troubleshooting and Quality Control
Monitoring Library Diversity and Dominant Clone Emergence
- Sequence library pools after each round by NGS to track diversity
- Calculate frequency of top 10 clones—should not exceed 30% of population until final rounds
- If dominance emerges early: Implement more aggressive counter-selection or decrease stringency temporarily
- Monitor expression levels of sorted populations—significant drops may indicate selection of poorly folded variants
Validation of Selected Binders
- Characterize kinetics using biolayer interferometry or surface plasmon resonance
- Test specificity against related and unrelated phosphopeptides
- For SH2 domains, evaluate cross-reactivity with sulfotyrosine peptides [58]
- Determine structural integrity via circular dichroism or NMR where possible
Strategic control of panning stringency throughout sequential selection rounds is essential for overcoming the challenge of dominant clones in yeast surface display campaigns. By systematically manipulating target concentration, competition, and wash conditions while monitoring library diversity, researchers can effectively enrich rare high-affinity SH2 domain variants and other binding proteins that would otherwise be lost to more abundant but less desirable clones. The protocols outlined herein provide a framework for implementing these strategies in both academic and industrial drug discovery settings.
Addressing the High Conservation of SH2 Domains to Achieve Target Specificity
Src Homology 2 (SH2) domains represent a fundamental class of protein interaction modules that specifically recognize phosphotyrosine (pTyr) motifs, playing pivotal roles in intracellular signal transduction. With over 120 human SH2 domains embedded within 110 proteins, this family constitutes the largest class of pTyr recognition domains in the human proteome [59] [60]. Despite their critical functions in health and disease, the high degree of structural conservation among SH2 domains presents a substantial challenge for developing specific inhibitors. These domains typically bind short linear motifs of 4-7 amino acids containing a central phosphorylated tyrosine, with a conserved pTyr binding pocket and a more variable pocket that binds residues C-terminal to the pTyr [42]. This structural conservation means that closely related SH2 domains often share nearly identical binding sites, making the development of targeted inhibitors exceptionally difficult. The emergence of yeast surface display (YSD) as a powerful eukaryotic protein engineering platform provides a promising approach to overcome these challenges by enabling the selection of high-affinity binding proteins against individual SH2 domains with the requisite specificity for functional studies and therapeutic development.
Understanding SH2 Domain Recognition Landscapes
Structural Basis of SH2 Domain Specificity
SH2 domains are approximately 100 amino acids in length and share a conserved structural fold consisting of a central anti-parallel β-sheet flanked on both sides by α-helices [42]. This architecture forms two primary binding sites: a highly conserved pocket that binds the phosphotyrosine residue and a more variable pocket that engages residues C-terminal to the pTyr, typically recognizing a 4-7 amino acid motif [42]. While the pTyr binding pocket remains largely conserved across the SH2 domain family, the variable pocket provides the structural basis for specificity determination, with amino acid variations in this region influencing peptide binding preferences.
The recognition specificity of SH2 domains has been systematically profiled using various high-throughput technologies, revealing distinct preference classes. Research has demonstrated that SH2 domains can be clustered into approximately 17 specificity classes based on their binding preferences, yet the correlation between overall domain sequence homology and peptide recognition specificity is surprisingly poor (Pearson correlation coefficient = 0.30) [59]. This indicates that relatively minor sequence variations can significantly alter binding preferences, explaining how rapid evolutionary diversification of signaling networks has occurred despite structural conservation.
Quantitative Assessment of SH2 Binding Specificity
Recent advances in specificity profiling have enabled more quantitative assessments of SH2 domain binding. Bacterial peptide display coupled with deep sequencing has emerged as a powerful platform for profiling SH2 domain specificities on a large scale [16] [41]. This approach utilizes genetically encoded peptide libraries displayed on the surface of E. coli cells as fusions to engineered bacterial surface-display proteins, followed by phosphorylation and selection using bait proteins such as SH2 domains [41].
The ProBound computational method has demonstrated particular utility in modeling SH2-peptide interactions by learning a free-energy matrix that encodes how SH2 domains interact with peptide subsequences [16]. This approach produces significantly more consistent binding free energy parameters (ΔΔG/RT) across different library designs compared to simple enrichment-based metrics (r² = 0.81 vs. 0.56 for enrichment), indicating its superior robustness for predicting true binding affinities [16]. This quantitative framework is essential for distinguishing between closely related SH2 domains and designing specific inhibitors.
Table 1: Experimentally Determined Binding Affinities of SH2 Domains
| SH2 Domain | Binding Partner | Affinity (K_D) | Method | Reference |
|---|---|---|---|---|
| GAP SH2 | EGFR (phosphorylated) | Nanomolar range | Quantitative binding assay | [61] |
| p85 SH2 | EGFR (phosphorylated) | Nanomolar range | Quantitative binding assay | [61] |
| Grb2 SH2 | Specific Affimers | 270.9 nM - 1.22 µM (IC₅₀) | Competitive inhibition | [42] |
| Grb2 SH2 | Specific Affimers | Low nanomolar (binding affinity) | Pull-down assays | [42] |
Yeast Surface Display Platform for SH2 Domain Binder Selection
YSD System Fundamentals
Yeast surface display (YSD) employs the eukaryotic expression system of Saccharomyces cerevisiae to present recombinant proteins on the cell surface via genetic fusion to an abundant cell wall protein [12]. The most common YSD system utilizes the a-agglutinin mating protein system, where the protein of interest is fused to the C-terminus of the Aga2p subunit, which forms disulfide bonds with the β-1,6-glucan-anchored Aga1p protein [12]. This system typically displays up to 100,000 copies of the fusion protein on the surface of each yeast cell, creating a physical linkage between the displayed protein (phenotype) and its genetic encoding (genotype) that is essential for selection processes.
The standard YSD construct includes two epitope tags: a hemagglutinin (HA) tag between Aga2p and the N-terminus of the protein of interest, and a C-terminal c-myc tag [12]. These tags enable quantification of fusion protein expression levels using fluorescently labeled antibodies, allowing normalization of protein function to surface expression levels by flow cytometry. This normalization capability is particularly valuable for distinguishing binders that combine high expression with high affinity and specificity.
Advantages for SH2 Domain Targeting
YSD offers several distinct advantages for developing specific SH2 domain binders compared to other display technologies. As a eukaryotic expression system, YSD supports proper protein folding and the formation of disulfide bonds, which is essential for displaying complex binding scaffolds that may target structured SH2 domains [12]. The compatibility with flow cytometric analysis enables quantitative measurements of equilibrium binding constants, dissociation kinetics, and specificity without requiring soluble protein expression and purification [12]. Furthermore, YSD allows for discrimination between proteins with only 2-fold differences in affinity, providing the resolution necessary to distinguish between highly similar SH2 domains [12].
Diagram 1: Yeast surface display workflow for selecting specific SH2 domain binders. The process involves library construction, iterative selection using FACS, and comprehensive validation to ensure specificity against conserved SH2 domains.
Experimental Protocol: YSD Selection of SH2 Domain Binders
Library Generation and Diversity
The successful selection of specific SH2 domain binders begins with the creation of a diverse library of potential binding proteins. For SH2 domains, both random mutagenesis libraries and designed scaffold libraries have proven effective:
Library Design: Create a library of 10⁷–10⁹ protein variants using random mutagenesis or DNA shuffling of appropriate binding scaffolds [12]. For SH2 domains, scaffolds such as Affibodies, DARPins, or Affimers have demonstrated success, with Affimer reagents already shown to bind 22 out of 41 targeted SH2 domains [42].
Yeast Transformation: Transform the library into Saccharomyces cerevisiae using electroporation or chemical methods to achieve high transformation efficiency. Induce protein expression through the GAL promoter system for controlled surface display [12].
Quality Control: Verify library diversity by sequencing a representative sample of clones and confirm surface expression using anti-epitope tag antibodies (e.g., anti-HA for N-terminal tag, anti-c-myc for C-terminal tag).
Affinity Selection Using FACS
The selection process utilizes fluorescence-activated cell sorting (FACS) to isolate yeast displaying binders with the desired specificity and affinity characteristics:
Equilibrium Binding Approach: Incubate the yeast-displayed library with the target SH2 domain at a concentration approximately 5–10-fold greater than the expected K({}_{\text{D}}) of the highest affinity variants. Use at least a 10-fold excess of ligand relative to the number of yeast-displayed protein variants to prevent ligand depletion [12].
Kinetic Competition Approach: For higher affinity binders (K({}_{\text{D}}) < 1 nM), incubate the library with a saturating concentration of fluorescently labeled SH2 domain, wash, then incubate with 100-fold excess of unlabeled ligand or in a large volume of buffer to prevent rebinding [12].
Dual-Label Sorting: Use two-color fluorescence detection to simultaneously measure SH2 domain binding (via fluorescently labeled SH2 domain) and surface expression level (via fluorescent anti-epitope antibody). Gate on cells with high binding-to-expression ratios to select for clones with superior affinity and expression properties [12].
Iterative Sorting: Conduct multiple rounds of sorting with increasing stringency (e.g., reduced SH2 domain concentration or increased competitor concentration) to progressively enrich for higher affinity clones. Between rounds, amplify sorted populations by cell culture.
Specificity Screening and Validation
Given the high conservation among SH2 domains, rigorous specificity screening is essential:
Specificity Profiling: Screen candidate binders against a panel of closely related SH2 domains to identify cross-reactivity. Microarray-based approaches enable high-throughput specificity assessment, as demonstrated in studies where 35 different SH2 domains were arrayed for cross-screening [42].
Affinity Quantification: Determine precise binding constants for positive clones using quantitative flow cytometry with titration of fluorescently labeled SH2 domain. Calculate K({}_{\text{D}}) values by fitting the binding data to appropriate models.
Functional Validation: Test selected binders in cellular assays to confirm functional specificity. For example, assess inhibition of SH2-mediated signaling pathways using assays such as nuclear translocation of pERK in response to growth factor stimulation [42].
Table 2: Key Research Reagents for SH2 Domain Specificity Studies
| Reagent/Category | Specific Examples | Function/Application | Performance Metrics |
|---|---|---|---|
| Display Platforms | Yeast surface display, Bacterial peptide display | Library screening and affinity maturation | Discriminates 2-fold affinity differences [12] |
| SH2 Domain Resources | Purified SH2 domains (70+ available) | Specificity profiling and binder validation | 17 specificity classes identified [59] |
| Computational Tools | ProBound, Artificial Neural Networks | Binding affinity prediction and specificity modeling | ΔΔG/RT parameters (r²=0.81 between libraries) [16] |
| Validated Binders | Affimer reagents (22 SH2 domains targeted) | Specific inhibition and functional studies | IC₅₀: 270.9 nM - 1.22 µM; nanomolar affinities [42] |
| Peptide Libraries | X5YX5, pTyrVar, Proteome-derived libraries | Specificity profiling and motif identification | 10⁶–10⁷ diversity; covers human phosphoproteome [16] [41] |
Case Study: Successful Targeting of Grb2 SH2 Domain
A recent comprehensive study demonstrates the successful application of these principles to develop specific binders against the Grb2 SH2 domain [42]. Researchers generated Affimer reagents that bound the Grb2 SH2 domain with high specificity and affinity, demonstrating the feasibility of targeting individual SH2 domains despite conservation challenges.
The selected Grb2-binding Affimers exhibited impressive biochemical characteristics, including IC₅₀ values ranging from 270.9 nM to 1.22 µM in competitive inhibition assays and low nanomolar binding affinities [42]. These reagents effectively pulled down endogenous Grb2 from cell lysates, confirming their ability to engage the native SH2 domain in complex biological environments. In functional cellular assays, these Affimer reagents modulated signaling pathways dependent on Grb2 SH2 domain interactions, specifically affecting the nuclear translocation of phosphorylated ERK in response to EGFR signaling [42].
This success was achieved through a combination of rigorous specificity screening against a panel of 35 SH2 domains and functional validation in cellular assays, providing a template for targeting other SH2 domains with similar approaches.
Discussion and Future Perspectives
The conservation of SH2 domains presents both challenges and opportunities for drug development. While conservation complicates specific targeting, it also means that solutions developed for one SH2 domain may be adaptable to others with similar structural features. The integration of yeast surface display with complementary approaches like bacterial peptide display for specificity profiling [16] [41] and computational modeling using tools like ProBound [16] creates a powerful toolkit for addressing these challenges.
Future directions in this field will likely include the development of more sophisticated library design strategies that incorporate structural information about SH2 domain similarities and differences, enabling more focused diversity generation. Additionally, the combination of YSD with deep mutational scanning approaches could provide comprehensive maps of binding determinants, further illuminating the precise mechanisms of specificity despite conservation.
As these technologies mature, the systematic targeting of entire SH2 domain families becomes increasingly feasible, offering unprecedented opportunities for interrogating signaling networks and developing targeted therapeutic interventions for cancer and other diseases driven by aberrant tyrosine kinase signaling.
Diagram 2: Strategic approach to overcoming SH2 domain conservation. The high structural conservation of SH2 domains presents multiple challenges that can be addressed through integrated experimental and computational strategies, leading to specific inhibitors with therapeutic potential.
Improving Yeast Display Efficiency and Surface Expression of Scaffold Proteins
Yeast surface display (YSD) is a powerful biotechnology platform that transforms the yeast cell wall into a living catalytic material by using genetically engineered cell wall proteins as anchors for enzymes or scaffold proteins of interest [62]. For researchers focusing on SH2 domain binding protein selection, achieving high-efficiency surface expression of scaffold proteins is a critical prerequisite. These scaffolds can serve as precise backbones for presenting various binding domains, enabling the selection and characterization of high-affinity ligands against medically important targets like SH2 domains, which are crucial in phosphotyrosine signaling and oncogenesis [8] [16].
However, the efficient display of complex multi-component systems presents significant technical challenges. This application note provides detailed methodologies and data-driven strategies to overcome these bottlenecks, with specific consideration for applications in SH2 domain research.
Key Bottlenecks in Scaffold Protein Display
The journey to efficient scaffold display begins with recognizing the primary constraints. The finite capacity of yeast cells to produce heterologous proteins represents a major bottleneck [47]. This challenge is compounded when expressing multi-component systems, such as designer cellulosomes or scaffold-based binding platforms, where imbalances in component expression can lead to heterogeneous populations and suboptimal performance.
Single-cell analysis has revealed that only approximately 10% of a yeast population successfully produces all components of a multi-protein complex [47]. This heterogeneity stems from the mutual influence between the expression of different complex components, which can impact cellular fitness. Furthermore, the choice of genetic construct, selection of yeast strain, and the method of protein anchoring all significantly influence the final display efficiency [62].
Quantitative Assessment of Display Efficiency
Reporter Systems for Display Quantification
Accurate measurement of surface display is essential for optimization. β-lactamase serves as an excellent reporter enzyme due to its small size (29 kDa), absence of glycosylation sites, and easily measurable activity through nitrocefin hydrolysis, which produces a colorimetric change quantifiable at 482 nm [62].
Table 1: Comparison of Anchor Systems for Scaffold Protein Display
| Anchor Protein | Fusion Orientation | Cell Wall Linkage | Relative Activity | Key Advantages |
|---|---|---|---|---|
| Pir2 (Hsp150) | N-terminal | β-1,3-glucan (via glutamine residue) | 100% (reference) | Covalent attachment, stable display |
| Ccw12 | C-terminal | β-1,6-glucan (via GPI anchor) | Varies by construct | Alternative anchoring topology |
| Aga2 (a-agglutinin) | C-terminal | Non-covalent to Aga1 | High for monovalent display | Common for antibody fragments |
The data in Table 1 highlights how anchor selection impacts display efficiency, with different systems offering distinct advantages for various applications [62].
Advanced Detection Methods
For multi-component scaffolds, fluorescence-based detection provides superior resolution. Combining fluorescent docking proteins with immunofluorescence staining of scaffold components enables population-wide analysis via flow cytometry and single-cell visualization through confocal microscopy [47]. This approach revealed that newly emerging buds serve as hotspots for scaffoldin display, providing important insights for optimization strategies.
Figure 1: Key Factors Influencing Yeast Display Efficiency. Genetic construction, strain selection, and anchor systems collectively determine the final display output through their effects on expression and cellular health.
Optimization Strategies for Enhanced Display
Genetic Construct Design
Optimization begins at the DNA level. Genomic integration of display cassettes consistently outperforms plasmid-based systems, achieving up to 99.7% of cells displaying the target protein compared to more variable episomal expression [48] [62]. This approach enhances population homogeneity and reduces the metabolic burden associated with plasmid maintenance.
Promoter selection represents another critical parameter. While the GAL1 promoter offers strong inducible expression, the phosphate-responsive PHO5 promoter prevents growth defects during exponential phase by avoiding overloading of the secretory system [62]. For applications requiring external control, engineered systems using heterologous GPCRs and the pheromone response pathway can regulate surface display over >3 orders of magnitude [48].
Strain Engineering and Cellular Load Management
Distributing the expression burden across a synthetic yeast consortium can alleviate the limitations of single-strain systems [47]. This approach is particularly valuable for displaying complex scaffolds requiring multiple components.
Table 2: Research Reagent Solutions for Yeast Display Optimization
| Reagent/Category | Specific Examples | Function/Application | Key Features |
|---|---|---|---|
| Anchor Systems | Pir2tag, Ccw12tag, Aga2p | Protein cell wall attachment | Covalent (Pir) vs. non-covalent (Aga) anchoring |
| Expression Promoters | PGAL1, PTDH3, PFUS1 | Transcriptional control | Inducible, constitutive, and engineered regulation |
| Reporter Systems | β-lactamase, GFP, V5-epitope | Display quantification | Enzymatic activity, fluorescence, immuno-tagging |
| Selection Markers | HIS3, antibiotic resistance | Strain maintenance and selection | Auxotrophic complementation, drug resistance |
| Strain Backgrounds | BY4741, BYFUZA, aga2Δ0 | Host optimization | Engineered for enhanced display efficiency |
The reagents summarized in Table 2 provide a toolkit for systematic optimization of yeast display systems [63] [62] [47].
Experimental Protocol: Quantitative Assessment of Scaffold Protein Display
β-Lactamase-Based Display Measurement
This protocol enables precise quantification of surface-displayed proteins using β-lactamase as a reporter [62].
Materials:
- Saccharomyces cerevisiae strain with genomic integration of display construct
- Plasmids: pRSII423-Pir2tag-bla (N-terminal anchor) or pRSII423-Ccw12tag-bla (C-terminal anchor)
- Phosphate-rich defined medium (YNBP+/His⁻)
- Phosphate-free synthetic medium (P⁻/His⁻)
- Nitrocefin substrate solution (prepare fresh in DMSO)
- Spectrophotometer capable of measuring 482 nm
Method:
- Transform yeast strain with appropriate display construct and negative control (anchor without reporter)
- Grow transformants in phosphate-rich medium to mid-exponential phase (OD600 ≈ 0.8)
- Induce expression by transferring to phosphate-free medium for 16-24 hours
- Harvest cells by gentle centrifugation and wash with appropriate buffer
- Resuspend cells to OD600 = 1.0 in assay buffer
- Add nitrocefin to final concentration of 50 μM
- Immediately measure absorbance at 482 nm continuously for 10 minutes
- Calculate enzymatic activity from the linear portion of the time course
Data Interpretation: Specific display activity is calculated by subtracting the activity of the negative control from the experimental value. Results can be expressed as ΔA482/min/OD600 unit for comparative purposes.
Multi-Component Scaffold Display Assessment
For complex scaffolds, this protocol enables quantification of individual component expression [47].
Materials:
- Yeast strains expressing scaffold components
- Primary antibodies against epitope tags (e.g., anti-V5)
- Fluorescently-labeled secondary antibodies (e.g., PE-conjugated)
- Flow cytometry equipment
- Confocal microscopy equipment
Method:
- Induce expression of scaffold components as described in Section 5.1
- For flow cytometry, stain cells with primary antibody (1:100 dilution, 30 minutes)
- Wash and incubate with fluorescent secondary antibody (1:200 dilution, 30 minutes)
- Analyze using flow cytometry with appropriate laser/filter settings
- For microscopy, follow similar staining protocol and image using confocal microscope
- Use beads with defined PE levels to quantify absolute scaffold numbers per cell
Data Interpretation: Flow cytometry data should be analyzed for the percentage of double-positive cells (co-expressing all scaffold components). Single-cell microscopy reveals localization patterns and potential aggregation issues.
Figure 2: Workflow for Assessing Scaffold Protein Display. The process involves genetic construction, expression induction, multi-modal quantification, and iterative optimization based on quantitative data.
Applications in SH2 Domain Binding Protein Research
The optimization strategies described above enable advanced applications in SH2 domain research. Efficient scaffold display on yeast surfaces provides a platform for selecting and engineering binding proteins against SH2 domains, which are important targets in cancer and signaling research [8].
Monobodies (synthetic binding proteins based on fibronectin type III domain) have been developed against SFK SH2 domains with nanomolar affinity and strong selectivity for either SrcA or SrcB subgroups [8]. When displayed on yeast surfaces, these binding proteins can be further optimized through directed evolution approaches similar to those used for Grb2 and its SH2 domain in EGFR signaling research [63].
The quantitative display methods enable precise control over binding protein valency and orientation, critical factors for achieving the selectivity demonstrated by monobodies that discriminate between highly homologous SH2 domains [8]. This precision is particularly valuable for targeting SH2 domains in signaling networks where selective perturbation is required for specific research or therapeutic applications.
Improving yeast display efficiency for scaffold proteins requires a multifaceted approach addressing genetic constructs, cellular capacity, and quantification methods. The protocols and data presented here provide a roadmap for achieving high-efficiency display, with particular relevance for SH2 domain binding protein research. By implementing genomic integration, selecting appropriate anchor systems, and employing rigorous quantification methods, researchers can overcome the inherent limitations of yeast display systems and leverage this powerful platform for selecting high-affinity binding proteins against challenging targets like SH2 domains.
Leveraging Deep Sequencing to Monitor Library Enrichment and Diversity
Within the broader context of developing yeast surface display for SH2 domain-binding protein selection, the precise monitoring of library composition is paramount. SH2 domains are phosphotyrosine-specific binding modules whose affinity is strongly governed by the amino acid sequence flanking the central phosphotyrosine, making the quantitative assessment of sequence preferences critical for deciphering signaling networks [16]. Deep sequencing transforms display technologies from simple selection tools into powerful quantitative platforms by providing a high-resolution, data-rich readout of library composition before, during, and after selection. This application note details the protocols and analytical frameworks for integrating deep sequencing into yeast surface display campaigns to quantitatively track enrichment and diversity, thereby enabling the selection of high-affinity SH2 domain binders with defined specificities.
Experimental Workflow for Deep Sequencing in Yeast Display
The integration of deep sequencing begins with the construction of a high-quality yeast surface-displayed library. For SH2 domains, this typically involves displaying a library of potential peptide ligands, often centered on a tyrosine residue, as fusions to the Aga2p cell wall protein [12] [21]. The following workflow outlines the key steps from library construction to sequencing.
Figure 1. Integrated experimental workflow for deep sequencing in yeast surface display. Key steps include library construction, induction, staining, sorting, sample preparation, sequencing, and computational analysis.
Key Experimental Steps
- Library Transformation and Induction: The DNA library encoding the variant peptides or protein fragments is transformed into Saccharomyces cerevisiae. Expression of the Aga2p fusion protein is induced using a galactose-responsive promoter, leading to display on the yeast surface [12].
- Staining and Sorting: The displayed library is incubated with a fluorescently labeled target (e.g., an SH2 domain) and antibodies against epitope tags (e.g., c-myc) to normalize binding to expression levels. Cells are sorted using Fluorescence-Activated Cell Sorting (FACS) or pre-enriched using Magnetic-Activated Cell Sorting (MACS) to isolate binders [12] [21].
- Sample Preparation for Sequencing: Post-sorting, plasmid DNA is recovered from enriched yeast populations. The variable region of interest is amplified by PCR using primers that incorporate platform-specific sequencing adapters and sample barcodes (multiplexing indices) to allow pooling of multiple samples in a single sequencing run [64].
- Platform Selection and Sequencing: The amplified library is sequenced on an appropriate platform. The choice of platform involves a trade-off between read length, throughput, and cost, which must be aligned with the experimental goals [64].
Research Reagent Solutions
Table 1. Essential research reagents and materials for yeast surface display and deep sequencing.
| Item | Function | Example/Note |
|---|---|---|
| Yeast Display Vector | Genotype-phenotype linkage | Aga2p fusion system with N-terminal HA and C-terminal c-myc tags [12]. |
| Selection Markers | Post-sort cell growth and plasmid recovery | Auxotrophic markers (e.g., for amino acids) or antibiotic resistance [12]. |
| Fluorescent Probes | FACS detection & sorting | Labeled SH2 domain (binding signal) and anti-tag antibodies (expression signal) [12]. |
| Magnetic Beads | MACS pre-enrichment | Beads coated with target SH2 domain for efficient initial binder isolation [21]. |
| Barcoded Primers | Multiplexed sequencing | Primer with platform adapter, unique barcode (6-8 bp), and gene-specific region [64]. |
Data Analysis and Normalization Methods
The raw data from a deep sequencing run consists of millions of short DNA reads. Transforming this data into biologically meaningful insights requires a robust computational pipeline.
Core Analytical Workflow
The analysis pipeline involves mapping reads to a reference, followed by critical normalization steps to enable quantitative comparisons between selection rounds.
Figure 2. Core data analysis workflow for deep sequencing data, from raw read processing to final enrichment analysis.
- Quality Control and Mapping: Sequence reads are first subjected to quality control. A Phred quality score (Q-score) of Q30 is a common benchmark, indicating a 99.9% base-call accuracy [65]. High-quality reads are then mapped to the reference library used in the experiment using alignment algorithms [66].
- Normalization: After mapping, the data is organized into a count table where each row represents a unique sequence variant and each column represents a sample (e.g., pre- and post-selection). A critical next step is normalization to account for varying library sizes (total read counts per sample), which, if uncorrected, can make samples with more reads appear artificially more diverse [67].
Quantitative Data from Profiling Studies
Deep sequencing of selected libraries generates quantitative data on sequence enrichment, which can be used to model binding energetics and specificity.
Table 2. Key quantitative metrics and parameters from deep sequencing-based profiling.
| Metric/Parameter | Description | Application in SH2 Domain Research |
|---|---|---|
| Read Count / Frequency | The absolute or relative abundance of a sequence in a library. | Tracks the enrichment of specific peptide ligands across selection rounds [16]. |
| Fold-Enrichment | The ratio of a sequence's frequency post-selection to its frequency pre-selection. | Identifies high-affinity binders; however, can be library-design dependent [16]. |
| Binding Free Energy (ΔΔG/RT) | A biophysically interpretable parameter derived using computational models like ProBound [16]. | Provides a library-independent measure of the energetic contribution of each amino acid position; superior for predictive model building [16]. |
| Sequence Logo | A graphical representation of amino acid preference at each position in a binding motif. | Summarizes the consensus recognition motif for an SH2 domain [16] [41]. |
Normalization Techniques for Comparative Analysis
Because library sizes differ between samples, normalization is essential for meaningful comparison of diversity and for calculating enrichment. Two common approaches are used:
- Tags Per Million (TPM): This simple method scales the count for each sequence by the total number of mapped reads in the sample, multiplied by one million [66]. While straightforward, it can be sensitive to outliers if a few sequences are extremely highly abundant.
- Rarefaction: This technique involves randomly subsampling without replacement from each sample to a common, pre-defined library size [67]. This process controls for differences in sampling depth but involves discarding a portion of the data. To characterize the variation introduced by random subsampling, repeated rarefaction (performing the subsampling multiple times) is recommended. This generates a distribution of diversity metrics, allowing researchers to assess the stability of the results [67].
The choice of normalization strategy can influence the results of downstream diversity analysis, such as the calculation of alpha-diversity (richness, evenness) within a sample or beta-diversity (differences in composition) between samples [67].
The integration of deep sequencing with yeast surface display creates a powerful feedback loop that transforms the selection of SH2 domain binders from a qualitative process into a quantitative science. By implementing the detailed protocols for sequencing and the robust analytical frameworks for normalization and data interpretation outlined in this document, researchers can gain unprecedented insight into library dynamics. This enables not only the identification of lead candidates but also the construction of predictive models of SH2 domain specificity, thereby accelerating research in signal transduction and drug development.
Rigorous Validation and Comparative Analysis of Selected Binders
This application note details integrated methodologies for profiling the binding specificity of Src Homology 2 (SH2) domains, crucial modules in phosphotyrosine signaling. It provides step-by-step protocols for microarray-based interaction screening and next-generation sequencing (NGS)-based affinity selection, framed within the context of yeast surface display for selecting SH2 domain-binding proteins. The guidance is intended to enable researchers to map interaction networks with high specificity and quantitative accuracy, supporting drug discovery efforts targeting aberrant cellular signaling.
SH2 domains are protein interaction modules of approximately 100 amino acids that specifically bind to peptide sequences containing phosphorylated tyrosine (pY) [6]. The human genome encodes 120 SH2 domains within 110 proteins, making them primary organizers of signal transduction immediately downstream of protein tyrosine kinases [68] [8]. A typical SH2 domain fold consists of a central three-stranded β-sheet flanked by two α-helices, forming a binding pocket that accommodates the phosphotyrosine and recognizes specific residues at downstream positions, typically the +3 location [8] [6]. Selectivity arises from permissive residues that enhance binding and non-permissive residues that oppose it through steric clash or charge repulsion [68].
Understanding SH2 domain specificity is fundamental to deciphering cellular signaling networks and developing targeted therapies. This document outlines two powerful, complementary approaches for specificity profiling: SPOT peptide microarrays for high-throughput, semiquantitative interaction mapping [68], and NGS-coupled affinity selection on random peptide libraries for building quantitative, biophysical models of binding [31]. When combined with yeast surface display, these techniques provide a robust platform for selecting and characterizing high-affinity binding proteins, such as monobodies, against challenging SH2 domain targets [8] [10].
The Scientist's Toolkit: Research Reagent Solutions
Table 1: Essential Reagents for SH2 Domain Specificity Profiling
| Reagent / Material | Function / Application | Key Characteristics |
|---|---|---|
| GST-tagged SH2 Domains | Recombinant protein for binding assays. | Purified from E. coli; enables uniform immobilization and detection in microarray and solution assays [68]. |
| SPOT Peptide Membrane | Addressable cellulose membrane for synthesis of peptide libraries. | Used for semiquantitative interaction screening with 100+ physiological pY-peptides [68]. |
| Yeast Surface-Displayed cDNA Library | Library of human protein fragments for ligand discovery. | Identifies novel SH2-binding partners and pY-dependent interactions [10]. |
| Random Peptide Phage/Bacterial Library | Highly diverse library for comprehensive specificity profiling. | Genetically encoded; used with NGS to model binding energy landscapes [31]. |
| Fluorescence-Labeled pY-Peptides | Probes for quantitative binding measurements (e.g., Fluorescence Polarization). | Allows empirical determination of binding affinity (Kd) in solution [69]. |
| Monobodies (Synthetic Binding Proteins) | High-affinity, selective SH2 domain inhibitors. | Selected from fibronectin-based scaffold libraries; can achieve nanomolar affinity and subfamily selectivity [8]. |
Experimental Protocols
Protocol A: SPOT Peptide Microarray Analysis
This protocol describes a method for synthesizing a library of phosphopeptides on a membrane support and probing them with SH2 domains to semiquantitatively map interactions [68].
Procedure:
- Peptide Array Synthesis: Synthesize the desired library of 11-amino-acid peptides directly onto a nitrocellulose membrane using a robotic synthesizer (e.g., Intavis MultiPep). Incorporate phosphotyrosine at a central position (e.g., fifth residue). Estimate peptide yield via bromophenol blue staining and verify pY incorporation using anti-phosphotyrosine antibodies like 4G10 [68].
- Membrane Blocking: Incubate the synthesized membrane in a blocking buffer (e.g., 5% non-fat dry milk or BSA in TBST) for 1-2 hours at room temperature to prevent non-specific binding.
- SH2 Domain Probing: Incubate the blocked membrane with a solution of the recombinant, purified SH2 domain (e.g., as a GST-fusion protein, typically at 0.1–1 µM) for 1-2 hours. A positive control (known binding peptide) and negative control (non-phosphorylated peptide) should be included on the membrane [68].
- Detection: Wash the membrane to remove unbound protein. Detect bound SH2 domains using a primary antibody against the protein tag (e.g., anti-GST), followed by a horseradish peroxidase (HRP)-conjugated secondary antibody and chemiluminescent detection.
- Data Analysis: Quantify spot intensities using image analysis software. Interactions are typically classified as positive or negative based on signal intensity relative to controls.
Protocol B: NGS-Based Affinity Selection and Specificity Modeling
This protocol uses bacterial display of highly diverse random peptide libraries, affinity selection, and NGS to generate data for building quantitative models of SH2 domain binding [31].
Procedure:
- Library Construction: Create a genetically encoded bacterial display library where each cell presents a unique random peptide (e.g., 7-mer degeneracy) on its surface. The theoretical diversity should be >10^7 sequences.
- Enzymatic Phosphorylation: Treat the library with a tyrosine kinase (e.g., c-Src) to phosphorylate tyrosine residues within the displayed peptides, generating a library of pY-containing ligands [31].
- Affinity Selection: a. Incubate the phosphorylated library with the immobilized SH2 domain of interest. b. Wash to remove non-binders and weakly bound peptides. c. Elute and recover the bound, high-affinity peptides. d. Amplify the eluted pool and use it as input for subsequent rounds of selection (typically 2-4 rounds) to enrich high-affinity binders.
- Next-Generation Sequencing: Subject the input library and the output pools from each selection round to NGS to obtain count data for each peptide sequence.
- Computational Modeling with ProBound: Analyze the NGS count data from multiple selection rounds using the ProBound software suite. ProBound performs free-energy regression, fitting an additive model that predicts the binding free energy (ΔΔG) for any peptide sequence in the theoretical space, effectively converting sequence data into a quantitative affinity predictor [31].
The following workflow diagram illustrates the integrated experimental and computational pipeline for this protocol.
Data Presentation and Analysis
Data derived from the aforementioned protocols can be systematically summarized to compare the binding properties and technological performance of different SH2 domains.
Table 2: SH2 Domain Specificity Profiling Data Summary
| SH2 Domain | Primary Binding Motif | Profiling Method | Key Interacting Partners / Pathways | Reported Affinity (Kd) | Key Permissive/Non-Permissive Residues |
|---|---|---|---|---|---|
| SFK SrcA (Src, Fyn) | pYEEI | SPOT Microarray [68] | Receptor Tyrosine Kinases (e.g., FGFR) | 0.1 - 10 µM (physiological peptides) [6] | Glu at +1, +2 enhances binding; basic residues often non-permissive [68]. |
| SFK SrcB (Lck, Hck) | pY(E/D/D)X | Monobody Selection & ITC [8] | T-Cell Receptor (TCR) Signaling | ~10-400 nM (for monobodies) [8] | Selective for SrcB subgroup; distinct from SrcA binding profile [8]. |
| PLC-γ1 | pYXXP | Fluorescence Polarization [69] | FGFR1 (Tyr-767), c-Met | Varies by physiological peptide | Secondary contacts contribute ~20% binding energy [68]. |
| Tensin2 (C1-Ten) | Not specified | Yeast Surface Display [10] | Insulin Receptor Substrate-1 (IRS-1) | Not specified | Also binds PIP3 lipid for membrane recruitment [6]. |
Integration with Yeast Surface Display for Binder Selection
The specificity profiles generated are critical for designing selection strategies for SH2-binding proteins using yeast surface display. The following workflow integrates specificity data with the discovery of high-affinity binders like monobodies.
The combination of SPOT microarray screening and NGS-based affinity selection provides a powerful, multi-faceted framework for profiling SH2 domain specificity. These methods move beyond simple binding motifs to reveal the complex linguistics of peptide recognition, including the critical roles of contextual sequence and non-permissive residues [68] [31]. The quantitative models generated, particularly from NGS data, enable the accurate prediction of binding affinities for novel phosphosites and the impact of disease-associated mutations [31]. When this foundational knowledge is applied to selection platforms like yeast surface display, it facilitates the engineering of highly specific binding proteins (monobodies) with the potential to selectively perturb signaling pathways for therapeutic purposes [8].
Within the broader scope of developing binding proteins against Src Homology 2 (SH2) domains using yeast surface display, functional validation in cellular contexts represents a critical transition from in vitro characterization to confirming biological activity. SH2 domains are phosphotyrosine-binding modules found in over 120 human proteins, including kinases, adaptor proteins, and phosphatases, and they mediate critical protein-protein interactions in numerous intracellular signaling pathways [42]. Dysregulation of SH2-mediated signaling is implicated in various diseases, particularly cancer, making these domains attractive therapeutic targets [42]. While yeast surface display enables efficient selection of high-affinity binders, demonstrating that these binders can effectively disrupt specific signaling pathways in living cells is essential for establishing their therapeutic potential. This application note details integrated protocols for cellular functional validation, focusing on phenotypic assays that measure the downstream consequences of SH2 domain inhibition.
Key Concepts and Biological Rationale
The Role of SH2 Domains in Cellular Signaling
SH2 domains are approximately 100 amino acids in length and consist of a central anti-parallel β-sheet flanked on both sides by an α-helix [42]. They recognize phosphorylated tyrosine residues within specific sequence contexts, typically binding a four to seven amino acid motif [42]. This specific recognition allows SH2 domains to direct the formation of transient signaling complexes in response to extracellular stimuli. For example, in the Ras/Erk pathway, the adaptor protein Grb2 uses its SH2 domain to recruit the SOS nucleotide exchange factor to activated receptor tyrosine kinases, thereby initiating a cascade that ultimately regulates cell proliferation and differentiation [42]. The high degree of structural conservation among SH2 domains, coupled with sequence variations in their binding pockets, presents both a challenge for achieving specificity and an opportunity for targeted disruption [42].
Validation Strategy for SH2-Targeting Bind ers
The functional validation of SH2 domain-binding proteins (e.g., Affimers, DARPins, or monobodies) involves a multi-tiered approach:
- Cellular Penetration and Localization: Confirming the binder reaches its intracellular target.
- Target Engagement: Demonstrating specific interaction with the intended SH2 domain in a cellular environment.
- Pathway Disruption: Quantifying the functional consequences of SH2 domain inhibition on downstream signaling events.
- Phenotypic Output: Measuring ultimate cellular responses, such as changes in proliferation, survival, or migration.
The assays described herein focus on the latter two aspects, providing measurable readouts for binder efficacy.
Research Reagent Solutions
The table below summarizes key reagents essential for executing the functional validation protocols described in this note.
Table 1: Essential Research Reagents for Cellular Validation of SH2 Domain Binders
| Reagent Category | Specific Examples | Function in Validation Assays |
|---|---|---|
| SH2-Targeting Binders | Affimers (e.g., anti-Grb2 SH2) [42], Monobodies [42] | Domain-specific inhibitors used to disrupt protein-protein interactions. |
| Control Reagents | Non-targeting Affimer (e.g., Alanine variant) [42], Ras-inhibiting Affimer K6 [42] | Negative and positive controls for assay validation and benchmarking. |
| Cell Lines | HEK293 [42], Primary Human T Cells [70] | Cellular systems for pathway screening and primary cell signaling analysis. |
| Key Assay Reagents | Anti-pERK antibody [42], Anti-pAKT (S473) antibody [70], Anti-pS6 (S235/S236) antibody [70], Leniolisib (PI3Kδ inhibitor) [70] | Detection of phosphorylation as a measure of pathway activity and tool for rescue experiments. |
| Expression Vectors | pCMV6-tGFP [42], Plasmid encoding NG-ABE8e base editor [70] | Intracellular expression of binders and for genetic screening models. |
Protocol 1: Medium-Throughput Phenotypic Screening with High-Content Imaging
This protocol uses a nuclear translocation assay for phosphorylated ERK (pERK) as a phenotypic readout of upstream SH2 domain function, adaptable to a 96-well plate format [42].
The following diagram illustrates the key steps in the phenotypic screening protocol:
Detailed Procedure
Cell Seeding and Transfection:
- Seed HEK293 cells at an appropriate density (e.g., 10,000-20,000 cells per well) in a 96-well imaging plate.
- Perform reverse transfection of the SH2-binding protein constructs (e.g., Affimers cloned into pCMV6-tGFP [42]). Include controls: a non-targeting Affimer (negative control) and a Ras-inhibiting Affimer like K6 (positive control) [42].
Incubation and Stimulation:
- Incubate the transfected cells for 48 hours at 37°C, 5% CO₂ to allow for expression of the binding proteins.
- Stimulate the cells with EGF (e.g., 50-100 ng/mL for 10-15 minutes) or the relevant ligand for the pathway under investigation to activate signaling.
Immunostaining:
- Fix the cells with 4% paraformaldehyde for 15 minutes at room temperature.
- Permeabilize the cells using 0.1% Triton X-100 in PBS for 10 minutes.
- Block with 3% BSA in PBS for 1 hour.
- Incubate with a primary antibody against pERK (diluted in blocking buffer) for 2 hours at room temperature or overnight at 4°C.
- Wash the cells 3 times with PBS.
- Incubate with an appropriate fluorescently-labeled secondary antibody and DAPI (to stain nuclei) for 1 hour at room temperature, protected from light.
- Perform a final wash with PBS.
Image Acquisition and Analysis:
- Image the plates using a high-content imaging system or automated microscope.
- Use the accompanying software to quantify the translocation of pERK from the cytoplasm to the nucleus. This is typically measured by calculating the ratio of nuclear to cytoplasmic fluorescence intensity for the pERK channel.
- For each tested Affimer or binder, calculate a robust Z-score relative to the negative control (non-targeting Affimer) to identify significant inhibitors of the pathway. A Z-score less than -3 is typically considered a hit [42].
Protocol 2: Phospho-Flow Cytometry for Signaling Analysis in Primary Immune Cells
This protocol leverages flow cytometry to measure phosphorylation events in primary human T cells, providing a clinically relevant functional readout for binders targeting SH2 domains in immune signaling pathways, such as those involving PI3Kδ [70].
The following diagram outlines the process for phospho-specific flow cytometry in T cells:
Detailed Procedure
T Cell Preparation and Transfection:
- Isolate primary human T cells from healthy donor blood using standard Ficoll gradient separation and negative selection kits.
- Electroporate the T cells with the plasmid encoding the SH2-binding protein (e.g., a Grb2 SH2-specific Affimer). A plasmid encoding a fluorescent protein (like tGFP) is used to mark transfected cells.
Stimulation and Fixation:
- After 24-48 hours of culture, stimulate the T cells for 20 minutes with cross-linked soluble CD3 and CD28 antibodies to activate the T cell receptor and co-stimulatory pathways [70].
- Immediately following stimulation, fix the cells using pre-warmed 1.5%-4% paraformaldehyde for 10-15 minutes at 37°C. This halts signaling and preserves phosphorylation states.
Staining for Flow Cytometry:
- Permeabilize the fixed cells by adding ice-cold 100% methanol drop-wise while vortexing gently. Incubate on ice for at least 30 minutes.
- Wash the cells twice with staining buffer (e.g., PBS with 1% BSA).
- Stain the cells with fluorescently-conjugated antibodies against phospho-proteins central to the pathway of interest. For PI3Kδ signaling, use antibodies against pAKT (Ser473) and pS6 (Ser235/Ser236) [70]. Include viability dye to gate out dead cells.
- Incubate for 1 hour at room temperature, protected from light.
- Wash the cells twice and resuspend in staining buffer for acquisition.
Data Acquisition and Analysis:
- Acquire data on a flow cytometer capable of detecting at least 3 colors (e.g., tGFP, pAKT, pS6).
- Gate on live, single cells that are tGFP-positive (successfully transfected).
- Analyze the median fluorescence intensity (MFI) of pAKT and pS6 within this population. Compare the MFI in cells expressing the SH2-targeting binder to those expressing a non-targeting control. A successful binder will show a significant reduction in pAKT and/or pS6 MFI, indicating pathway disruption.
Data Interpretation and Analysis
Quantitative Analysis of Phenotypic Screening Data
Data from the high-content pERK screen should be analyzed for statistical significance and effect size. The table below provides a sample data structure from a successful screen identifying inhibitors of the MAPK pathway, where Grb2 is a known key player [42].
Table 2: Sample Data from a Phenotypic Screen of SH2-Binding Affimers
| Targeted SH2 Domain | Affimer ID | pERK Nuclear/Cytoplasmic Ratio (Mean ± SD) | Robust Z-Score | Classification |
|---|---|---|---|---|
| Non-targeting Control | Ala1 | 1.00 ± 0.15 | - | Negative Control |
| Ras-inhibiting Control | K6 | 0.45 ± 0.08 | -6.82 | Positive Control |
| Grb2 | A7 | 0.52 ± 0.10 | -5.89 | Hit |
| Grb2 | B2 | 0.61 ± 0.12 | -4.65 | Hit |
| Lck | C4 | 0.95 ± 0.14 | -0.48 | Inactive |
| p85α-N | D1 | 1.10 ± 0.16 | +0.89 | Inactive |
Troubleshooting and Validation
- Specificity Confirmation: The functional effect of a hit binder should be rescued by co-expressing the wild-type SH2 domain of the target protein, which can compete for binding to endogenous ligands.
- Off-Target Effects: Compare the effect of your binder to RNAi-mediated knockdown of the target SH2-containing protein. Concordant phenotypes increase confidence in specificity.
- Assay Quality Control: For screening assays, calculate the Z'-factor. A value of 0.52, as reported in a similar Affimer screen, indicates an excellent assay with a clear distinction between positive and negative controls [42].
- Context Dependence: Be aware that the functional consequence of inhibiting an SH2 domain can be cell-type and stimulation-dependent. Validate findings in multiple relevant cell models.
The selective disruption of protein-protein interactions remains a significant challenge in molecular biology and drug discovery. This is particularly true for the Src Homology 2 (SH2) domain family, a group of approximately 120 modular domains in the human proteome that recognize phosphotyrosine (pY) motifs and are central to tyrosine kinase signaling networks [71] [1]. The high degree of sequence conservation among SH2 domains poses a substantial obstacle for developing selective inhibitors or binders. Within this context, yeast surface display (YSD) has emerged as a powerful protein engineering tool for developing high-affinity binding proteins, such as monobodies, that can discriminate between even highly similar SH2 domains [8] [12]. However, the true power of this approach is unlocked only when combined with rigorous structural analysis techniques. This application note details a comprehensive workflow integrating computational interface analysis using CoDIAC with experimental crystallography to elucidate the structural basis of binding mechanisms, providing researchers with a protocol for understanding and optimizing engineered binding proteins targeting SH2 domains.
Background
SH2 Domains as Therapeutic Targets
SH2 domains are ~100 amino acid protein modules that bind to phosphorylated tyrosine residues on target proteins, thereby facilitating the assembly of signaling complexes [1]. They share a conserved fold comprising a central antiparallel β-sheet flanked by two α-helices [71]. Binding specificity is primarily determined by a deep pocket that engages the phosphotyrosine residue (invariantly involving a conserved arginine from the FLVR motif) and surrounding regions that recognize the amino acid sequence C-terminal to the phosphotyrosine [71] [1]. Their critical role in intracellular signaling, especially downstream of oncogenic kinases, makes them attractive therapeutic targets. However, achieving selectivity is difficult with traditional small molecules due to the high conservation of the pY-binding pocket across the family [8].
Yeast Surface Display for Binder Development
Yeast surface display allows for the engineering of selective binding proteins by presenting protein libraries on the yeast cell surface as fusions to the Aga2p subunit of the a-agglutinin mating complex [19] [12]. This platform provides a direct genotype-phenotype linkage and enables quantitative screening using flow cytometry. It has been successfully employed to generate monobodies (synthetic binding proteins based on the fibronectin type III domain scaffold) with nanomolar affinity and unprecedented selectivity for specific SFK SH2 subfamilies (SrcA: Yes, Src, Fyn, Fgr; SrcB: Lck, Lyn, Blk, Hck) [8]. The method allows simultaneous measurement of binding function (via fluorescent ligand) and surface expression (via epitope tags), facilitating the isolation of well-expressed, high-affinity variants [12].
Integrated Workflow for Structural Analysis
The following section outlines a synergistic approach combining computational and experimental structural biology to deconstruct the mechanisms underlying binder selectivity. Figure 1 below illustrates the integrated workflow.
Figure 1. Integrated workflow for structural analysis of SH2 domain binders. The pathway combines experimental structural biology (yellow) with computational interface analysis (green) to achieve mechanistic insight and validation (blue).
Protocol: Yeast Surface Display for Binder Selection
This protocol is adapted from methodologies that successfully generated selective monobodies against SFK SH2 domains [8] [12].
- Step 1: Library Generation. Create a library of monobody or alternative scaffold variants. For SH2 domains, both "loop-only" and "side-and-loop" libraries have been effective. Mutagenesis can be achieved via error-prone PCR or DNA shuffling to introduce diversity [19] [12].
- Step 2: Yeast Transformation and Display. Transform the Saccharomyces cerevisiae EBY100 strain with the library plasmid. Induce protein expression using galactose-containing media (SG-CAA). The expressed protein is displayed as a fusion to Aga2p, which covalently links to the anchored Aga1p subunit [12].
- Step 3: Screening by FACS. Incubate the yeast-displayed library with a biotinylated target SH2 domain. Use two-color fluorescence cytometry: one channel to detect binder expression (e.g., anti-c-myc antibody), and another to detect binding (e.g., streptavidin against the biotinylated SH2). Sort populations with high binding-to-expression ratios to isolate high-affinity, well-expressed clones [8] [12]. Perform multiple rounds of sorting, sometimes with increasing stringency (e.g., lower target concentration or competitive elution), to affinity mature the binders.
- Step 4: Characterization. Characterize selected clones by sequencing and determine binding affinity ((K_D)) via titration on the yeast surface or using isothermal titration calorimetry (ITC) with purified proteins [8].
Protocol: CoDIAC Computational Interface Analysis
CoDIAC (Comprehensive Domain Interface Analysis of Contacts) is a Python-based package for systematic mapping of domain interfaces from experimental and predicted structures [72]. Its application provides a residue-level understanding of binding contacts.
- Step 1: Installation and Setup. Install the CoDIAC package from GitHub (
https://github.com/NaegleLab/CoDIAC). Prepare input files specifying the SH2 domains and binding proteins of interest, referenced by their UniProt IDs or corresponding structures [72]. - Step 2: Data Aggregation. Run CoDIAC to aggregate all relevant structures from the PDB and AlphaFold predictions for the specified SH2 domain-binder complex. The pipeline will automatically identify domain boundaries and align sequences to a common reference [72].
- Step 3: Contact Map Extraction. Execute the contact mapping module. CoDIAC uses Arpeggio to identify non-covalent interatomic interactions (e.g., hydrogen bonds, van der Waals contacts) between the SH2 domain and the binder. The standard parameters for analysis include an interaction distance threshold of < 5 Å and requiring contacts to be present in at least 25% of relevant chains to ensure reliability [72].
- Step 4: Analysis and Visualization. Generate output files that detail which SH2 domain residues interact with the binder. Use the integrated Jalview visualization capability to map these interaction interfaces onto the SH2 domain sequence and structure. Cross-reference these contact maps with databases of post-translational modifications (PTMs) and natural variants to predict regulatory mechanisms or the functional impact of mutations [72].
Table 1: Key Research Reagent Solutions
| Reagent/Resource | Function in Workflow | Key Characteristics | Example Source |
|---|---|---|---|
| Yeast Strain EBY100 | Host for surface display | MATA genotype, contains integrated AGA1 gene under GAL promoter | [12] |
| pYD1 Vector | Display plasmid | Epitope tags (HA, c-myc), inducible GAL1 promoter, Aga2p fusion | [12] |
| CoDIAC Software | Computational contact mapping | Python-based, integrates PDB/Alphafold data, residue-level contact analysis | [72] |
| Fibronectin Type III (FN3) Scaffold | Monobody backbone | ~100 amino acids, no disulfides, stable β-sandwich fold | [8] [19] |
| Anti-c-myc Antibody (Clone 9E10) | Expression detection | Mouse monoclonal, conjugated to fluorophore (e.g., FITC) for FACS | [12] |
Protocol: Crystallography for Structure Determination
This protocol outlines the steps for determining a high-resolution crystal structure of an SH2 domain complexed with a selected monobody, based on current good practices [73].
- Step 1: Protein Production and Purification. Express the purified SH2 domain and monobody (e.g., in E. coli or mammalian cells). Form the complex in vitro and purify it to homogeneity using affinity and size-exclusion chromatography [8].
- Step 2: Crystallization. Screen for crystallization conditions using commercial sparse matrix screens and robotic liquid handling. Optimize initial hits by varying pH, precipitant concentration, and temperature. Aim for well-diffracting, single crystals.
- Step 3: X-ray Data Collection. For high-resolution data, collect diffraction data at a synchrotron beamline. Alternatively, use a laboratory source with monochromatic Cu Kα1 radiation and a capillary transmission geometry to minimize preferred orientation [73]. Cool crystals to ~150 K using an open-flow N2 cryostat to reduce radiation damage and improve signal-to-noise at high resolution. Collect a complete dataset to a resolution of at least 1.35 Å real-space resolution for detailed analysis, using a variable count time scheme to ensure adequate data quality at high diffraction angles [73].
- Step 4: Structure Solution and Refinement. Solve the structure by molecular replacement (MR) using a known SH2 domain structure and the monobody scaffold as search models. Refine the model iteratively using programs like phenix.refine or BUSTER, incorporating manual model building in Coot. Validate the final model using MolProbity and the PDB Validation Server [73].
Data Integration and Interpretation
The power of this integrated approach lies in the synthesis of data from YSD, CoDIAC, and crystallography. Table 2 summarizes quantitative binding and structural data from a seminal study that employed this strategy [8].
Table 2: Example Data from Structural Analysis of SFK SH2 Domain-Monobody Complexes
| Monobody Target | Apparent (K_D) (nM) * | Selectivity Group | Key Structural Findings from Crystallography/CoDIAC |
|---|---|---|---|
| Lck SH2 | 10 - 20 | SrcB (Lck, Lyn) | Binds via diversified CD and FG loops; distinct, overlapping binding mode rationalizes selectivity for SrcB subgroup. |
| Src SH2 | 150 - 420 | SrcA (Src, Yes, Fyn) | Binds primarily via a diversified FG loop with a wild-type CD loop; mode of binding differs from SrcB-targeting monobodies. |
| Hck SH2 | Low nanomolar (ITC) | SrcB (Hck, Lyn) | Mb(Hck1) derived from loop-only library; Mb(Hck2) from side-and-loop library with diversified CD/FG loops. |
Affinity determined via yeast surface display titration [8].
The structural data reveals the molecular basis for selectivity. For instance, crystal structures of monobody-SH2 complexes showed that monobodies achieve selectivity through distinct and only partly overlapping binding modes relative to the natural phosphotyrosine ligand and to each other [8]. CoDIAC analysis can further extend these insights by mapping these binding interfaces across the entire SH2 domain family, identifying conserved interaction "hotspots" and residues critical for specificity. This integrated view explains how monobodies can discriminate between SH2 domains with such high sequence conservation.
The logical flow of this integrative analysis is depicted in Figure 2.
Figure 2. Logic flow from raw data to mechanistic insight. Structural and computational data (green) are integrated with functional data from YSD (yellow) to generate key mechanistic insights (red).
The combination of yeast surface display, CoDIAC analysis, and X-ray crystallography forms a powerful, iterative pipeline for understanding and engineering selective protein-protein interactions. This application note provides a detailed protocol for researchers to deconstruct the binding mechanisms of engineered proteins, such as monobodies, against challenging targets like SH2 domains. The structural insights gained are not merely descriptive; they provide a blueprint for rational design of next-generation binders with enhanced potency, selectivity, and therapeutic potential. By following this integrated workflow, scientists can accelerate the development of high-precision tools to dissect complex signaling pathways and create novel therapeutic agents.
This application note provides a detailed comparative analysis of Yeast Surface Display (YSD), Bacterial Display, and Affimer technologies for the selection of binding proteins, with specific emphasis on SH2 domain research. We present quantitative performance data, detailed experimental protocols for key methodologies, and strategic recommendations to guide researchers in selecting the optimal platform for their specific project requirements. The data synthesized herein demonstrate that YSD offers superior performance for isolating high-affinity binders to complex eukaryotic targets like SH2 domains, while bacterial display provides exceptional library diversity and Affimer technology represents a promising alternative scaffold approach deserving further investigation for SH2 domain applications.
Table 1: Core Technology Comparison for SH2 Domain Binder Selection
| Feature | Yeast Surface Display (YSD) | Bacterial Display | Affimer Technology |
|---|---|---|---|
| Display System | Eukaryotic yeast cell (S. cerevisiae) [12] [74] | Prokaryotic bacterial cell (e.g., E. coli) [16] [75] | In vitro ribosome or phage display [19] |
| Library Size | 10⁷ - 10⁹ variants [12] [76] | Up to 10¹¹ variants [76] [16] | Information limited |
| Post-Translational Modifications | Yes (e.g., disulfide bond formation, glycosylation) [12] [74] [75] | Limited or none [76] [75] | Not applicable (in vitro selection) |
| Selection Method | Fluorescence-Activated Cell Sorting (FACS) [12] [74] | Magnetic-Activated Cell Sorting (MACS) or FACS [12] [16] | Panning [19] |
| Throughput & Resolution | Medium-high; quantitative screening, can discriminate 2-fold affinity differences [12] [76] | High throughput (panning); lower resolution for affinity discrimination [76] [75] | Information limited |
| Protein Folding Environment | Eukaryotic secretory pathway; supports complex proteins [12] [76] [19] | Bacterial cytoplasm/periplasm; may misfold eukaryotic proteins [76] [75] | In vitro folding |
| Key Advantage for SH2 Domains | Correct folding of SH2 domains and presentation of phosphorylated peptides for binder selection. [16] [77] | Rapid library generation and screening for peptide-level interactions. [16] | Potential for small, stable scaffolds to access cryptic epitopes. [19] |
Table 2: Quantitative Performance Metrics in Binder Selection
| Parameter | Yeast Surface Display (YSD) | Bacterial Display | Affimer Technology |
|---|---|---|---|
| Typical Affinity Range (K_D) | Low pM to nM range [12] | nM to μM range [16] | Information limited |
| Avidity Effects | High (10⁴ - 10⁵ copies/cell) [76] | Low (1-5 copies/cell) [76] | Monovalent (typically) |
| Selection Cycle Time | 1-2 weeks per round [12] | Days per round [16] [75] | Information limited |
| Best Suited For | Affinity maturation, engineering stable binders, eukaryotic protein targets [12] [19] | Rapid screening of large libraries, peptide-protein interactions [16] | Rapid development of stable, non-antibody binders [19] |
Experimental Protocols for SH2 Domain Binder Selection
Yeast Surface Display Protocol for SH2 Binder Selection
This protocol details the process for selecting high-affinity binders against SH2 domains using the Aga2p-based YSD system, leveraging its eukaryotic folding environment for optimal results [12] [74].
Research Reagent Solutions:
- Yeast Strain: Saccharomyces cerevisiae EBY100 [12] [74]
- Display Vector: pCTCON2 or similar with GAL1-inducible promoter [12] [78]
- Anchor Protein: Aga2p fusion system (N-terminal fusion to protein of interest) [12] [19]
- Epitope Tags: HA tag (for expression normalization), c-myc tag (for expression detection) [12]
- Induction Media: SG-CAA (for protein expression induction) [12]
- Staining Reagents: Fluorescently-labeled antigen (SH2 domain), anti-HA and anti-c-myc antibodies [12]
Step-by-Step Workflow:
Library Transformation & Induction:
- Transform the constructed scFv or nanobody library into EBY100 yeast cells via electroporation to achieve a library diversity of 10⁷–10⁹ clones [12].
- Induce protein expression by transferring cells from glucose-based (SD-CAA) to galactose-based (SG-CAA) medium and incubate at 20-30°C for 24-48 hours [12] [74].
Cell Labeling for FACS:
- For Equilibrium Screening: Incubate induced yeast cells with a concentration of biotinylated SH2 domain ~5-10 fold above the expected K_D of the highest-affinity variants. Use a 10-fold excess of ligand relative to displayed protein variants to prevent ligand depletion [12].
- For Off-Rate Screening (preferred for high-affinity maturation): Saturate cells with biotinylated SH2 domain, wash, and then incubate with a 100-fold excess of unlabeled SH2 domain or a large volume of buffer for a defined time to allow dissociation of weaker binders [12].
- Detect bound SH2 domain with a fluorescent streptavidin conjugate (e.g., SA-PE). Simultaneously stain for surface expression using anti-c-myc antibody followed by a fluorescently-labeled secondary antibody (e.g., Alexa Fluor 488) [12].
Fluorescence-Activated Cell Sorting (FACS):
- Analyze and sort labeled cells using a FACS instrument. Gate on the population of cells with high expression (Alexa Fluor 488 positive) and high binding (PE positive) to isolate clones with the highest affinity [12] [74].
- For the first sort, use a liberal gate to recover a larger population. In subsequent sorts, increase stringency to isolate the top 0.1-1% of binders [12].
Amplification and Analysis:
- Sort selected cells directly into growth medium, culture to amplify the population, and subject to further rounds of induction and sorting for affinity maturation [12].
- After 3-5 rounds of sorting, isolate single clones, and analyze binding affinity quantitatively by flow cytometry or sequence plasmids for characterization [12].
Bacterial Display Protocol for SH2-Peptide Interaction Profiling
This protocol is adapted from recent work profiling SH2 domain specificity using bacterial peptide display, ideal for mapping interactions with phosphorylated tyrosine peptides [16].
Research Reagent Solutions:
- Bacterial Strain: E. coli (e.g., MC1061 or other display-compatible strain)
- Display Vector: Plasmid system for surface display (e.g., using an outer membrane protein as anchor) [16] [75]
- Peptide Library: Degenerate oligonucleotide encoding X₁₁ peptide library (11 consecutive randomized residues) [16]
- Enzymes: Tyrosine kinase (for in vitro phosphorylation of displayed peptides) [16]
- Detection Reagent: Fluorescently-labeled SH2 domain
Step-by-Step Workflow:
Library Construction and Transformation:
Peptide Expression and Phosphorylation:
- Induce expression of the peptide-display fusion protein under appropriate conditions.
- Phosphorylate displayed peptides by incubating the bacterial cells with a tyrosine kinase and ATP to generate the central pTyr residue required for SH2 domain recognition [16].
Affinity Selection:
- Incubate the phosphorylated bacterial library with the purified, fluorescently-labeled SH2 domain.
- Wash cells to remove unbound SH2 domain.
- Either use Magnetic-Activated Cell Sorting (MACS) if the SH2 domain is biotinylated or proceed directly to FACS to isolate bacteria displaying high-affinity binding peptides [12] [16].
Deep Sequencing and Data Analysis:
- Extract plasmid DNA from the selected pool of binders.
- Amplify the displayed peptide sequence region by PCR and subject to deep sequencing.
- Analyze sequencing data with computational tools like ProBound to build quantitative models of SH2 domain binding specificity and affinity from the enrichment data [16].
Strategic Implementation for SH2 Domain Research
Technology Selection Guide
For SH2 Domain Characterization:
- Use Bacterial Display for high-throughput profiling of SH2 domain binding specificity using peptide libraries. Its ability to handle large library sizes (up to 10¹¹ variants) is ideal for exploring a vast sequence space and generating specificity models like position-specific scoring matrices (PSSMs) [16].
- Use Yeast Surface Display when selecting for high-affinity protein-based binders (e.g., scFvs, nanobodies, alternative scaffolds) against folded SH2 domains, especially when requiring eukaryotic post-translational modifications or when the selected binders are intended for intracellular applications [19].
For Binder Affinity Maturation:
- YSD is the superior platform due to its quantitative FACS screening capability, which can discriminate as little as 2-fold differences in affinity and directly correlate binding signals with surface expression levels [12] [76]. This allows for the efficient evolution of low nanomolar or even picomolar binders.
For Integrated Discovery Pipelines:
- A combined approach can be highly effective. For instance, a large naive library can first be screened using phage or bacterial display to isolate initial hits. These hits can then be subcloned into a YSD vector for quantitative affinity maturation and fine-specificity screening, leveraging the strengths of both systems [76].
Advanced YSD Methodologies for SH2 Research
Recent advancements in YSD offer powerful new tools for SH2 domain binder research:
SpyTag/SpyCatcher YSD: This system decouples the expression of the binding protein (fused to SpyTag) from the surface anchor (fused to SpyCatcher). They assemble via a spontaneous isopeptide bond upon co-expression in yeast. This is particularly valuable for integrating YSD with in vivo continuous evolution methods, as it avoids mutagenesis of the essential anchor protein gene, ensuring efficient display even of mutated binders [78].
Yeast Display of Non-Antibody Scaffolds: YSD has been successfully applied to engineer a wide range of alternative binding scaffolds against challenging targets. These include Adnectins, DARPins, and Affibodies. Their stability, small size, and high solubility often make them excellent candidates for targeting structured domains like SH2, potentially offering advantages over traditional antibodies in terms of expression and stability [19].
The selection of an optimal display technology is critical for the successful isolation of high-quality binders against SH2 domains. Yeast Surface Display stands out for its ability to produce well-folded, high-affinity binders thanks to its eukaryotic expression environment and quantitative screening capabilities. Bacterial display offers unparalleled throughput for mapping peptide-level interactions. While Affimer technology was not detailed in the available literature, its principle as a stable non-antibody scaffold suggests potential for future SH2 domain applications. By leveraging the protocols and strategic insights provided herein, researchers can effectively design and execute campaigns to generate functional binders for SH2 domain research and therapeutic development.
Src Homology 2 (SH2) domains are protein interaction modules that recognize phosphotyrosine (pTyr) motifs and play pivotal roles in intracellular signaling networks. As dysregulated SH2-mediated interactions are implicated in various cancers, these domains represent attractive therapeutic targets. This application note details how yeast surface display—a versatile protein engineering platform—has been successfully employed to develop specific binding reagents against oncogenic SH2 domains, with a focus on inhibitors targeting BCR::ABL1 and Grb2 in leukemogenic pathways.
Case Study 1: Targeting the BCR::ABL1 SH2 Domain in Leukemia
The BCR::ABL1 fusion kinase, the driving oncogene in Chronic Myeloid Leukemia (CML), contains a C-terminal SH2 domain that is critical for its full leukemogenic potential. Inhibition of this SH2 domain disrupts the protein's regulatory network and represents a promising therapeutic strategy.
Quantitative Profile of Developed Monobodies
Table 1: Characteristics of BCR::ABL1 SH2-Targeting Monobodies
| Monobody Clone | Target Domain | Binding Affinity | Reported Functional Outcome | Structural Feature |
|---|---|---|---|---|
| d-Monobody (Clone 1) | BCR::ABL1 SH2 | Nanomolar range | Inhibition of BCR::ABL1 kinase activity | Targets pY binding pocket via unconventional mode |
| d-Monobody (Clone 2) | BCR::ABL1 SH2 | Nanomolar range | Binding to BCR::ABL1 in CML cell lysates | Split-protein design without ligation |
| l-Monobody (Previous study) | BCR::ABL1 SH2 | High affinity | Inhibition of signaling & leukemogenesis | Diverse CD/FG loops from side-and-loop library |
Experimental Protocol: Yeast Surface Display for Monobody Selection
Procedure:
- Library Generation: A non-immune human fibronectin type III domain (FN3, monobody) "side-and-loop" phage-display library was constructed, diversifying residues in the BC, DE, and FG loops to create potential binding surfaces [79].
- Target Preparation: The mirror-image of the human BCR::ABL1 SH2 domain (d-Abl SH2) was produced via solid-phase peptide synthesis and native chemical ligation of two d-peptide fragments [79].
- Yeast Display Screening: The monobody library was transferred to a yeast display system. Four rounds of selection were performed against the immobilized d-Abl SH2 domain with decreasing target concentrations to enrich high-affinity binders [79].
- Clone Isolation & Characterization: Six unique monobody clones were isolated. Their binding affinity was characterized via flow cytometry, and their impact on kinase activity was tested in CML cell models [79].
Case Study 2: Targeting Grb2 in MAPK Signaling
Grb2 is an adaptor protein that links activated growth factor receptors, like EGFR, to the Ras-MAPK signaling pathway, which is frequently hyperactive in cancers.
Quantitative Profile of Grb2-Targeting Affimer Reagents
Table 2: Characteristics and Functional Impact of Grb2-Binding Affimers
| Reagent | Target | IC₅₀ Value | Binding Affinity | Reported Phenotypic Outcome |
|---|---|---|---|---|
| Grb2-binding Affimer 1 | Grb2 SH2 | 270.9 nM | Low nanomolar | Curtailed nuclear translocation of pERK |
| Grb2-binding Affimer 2 | Grb2 SH2 | 1.22 µM | Low nanomolar | Inhibition of EGFR signaling output |
| General Toolbox | 22 different SH2 domains | N/A | Varies per clone | Enabled medium-throughput phenotypic screening |
Experimental Protocol: Intracellular Screening with SH2-Binding Reagents
Procedure:
- Toolbox Generation: Affimer reagents (non-immunoglobulin binding proteins) were selected against 38 SH2 domains via phage display and validated for specificity using a protein microarray [42].
- Plasmid Construction: 119 selected SH2-binding Affimers were subcloned into a mammalian expression vector (pCMV6-tGFP) for intracellular expression [42].
- Cell-Based Screening: HEK293 cells were reverse-transfected with the Affimer constructs. After 48 hours, the nuclear translocation of phosphorylated ERK (pERK)—a key readout for MAPK pathway activity—was quantified via high-content imaging [42].
- Hit Validation: Affimers causing significant reduction in pERK nuclear translocation (Z-score < -3) were identified. The specific Grb2-binding Affimers were further characterized using pull-down assays from cell lysates and competitive binding measurements [42].
The Scientist's Toolkit: Key Research Reagents
Table 3: Essential Reagents for SH2 Domain Binder Development
| Reagent / Tool | Function / Description | Application Context |
|---|---|---|
| Yeast Surface Display System | Eukaryotic display platform using Aga2p fusion for protein expression. | Displaying monobody/Affimer libraries; enables FACS-based screening [29] [80]. |
| FN3 (Monobody) Scaffold | ~10 kDa fibronectin type III domain; a stable non-antibody scaffold. | Engineering binding proteins via loop diversification [79]. |
| Affimer Scaffold | Small, stable non-antibody scaffold based on the cystatin protein fold. | Generating specific binders against conserved SH2 domains [42]. |
| Streptavidin Magnetic Beads | Solid support for immobilizing biotinylated target antigens. | Performing positive/negative selections during yeast display screening [80]. |
| Fluorescence-Conjugated Antibodies | Anti-tag antibodies (e.g., anti-c-myc, Anti-HA) for detection. | Labeling displayed proteins on yeast for FACS analysis and quantification [80]. |
| pCMV6-tGFP Vector | Mammalian expression vector for intracellular protein expression. | Expressing SH2-binding reagents in cells for phenotypic screening [42]. |
Visualizing Workflows and Signaling Pathways
Diagram 1: BCR::ABL1 SH2 Inhibition Workflow
Diagram 2: Grb2-pERK Signaling & Inhibition
Yeast surface display has proven to be a powerful and adaptable platform for generating high-affinity, specific binding proteins against challenging intracellular targets like SH2 domains. The case studies on BCR::ABL1 and Grb2 demonstrate a direct path from binder development to functional validation in oncogenic signaling pathways. The protocols and reagents detailed herein provide a robust framework for researchers aiming to target SH2 domains in cancer and other diseases.
Conclusion
Yeast surface display stands as a powerful and versatile platform for generating high-quality, specific binding proteins against the challenging SH2 domain family. By integrating robust library design with sophisticated FACS-based screening and deep sequencing validation, researchers can successfully isolate reagents capable of not only binding but also potently inhibiting SH2 domain function. The selected binders, such as monobodies and Affimers, have proven invaluable as intracellular probes, diagnostic tools, and have immense potential as therapeutic agents, particularly in targeting dysregulated tyrosine kinase signaling in cancer. Future directions will focus on leveraging computational interface analysis like CoDIAC for rational design, engineering bispecific molecules, and advancing these highly selective binders into pre-clinical and clinical development, ultimately paving the way for a new class of targeted protein-protein interaction inhibitors.
References
- 1. SH2 domain [https://en.wikipedia.org/wiki/SH2_domain]
- 2. SH2 Domains: Folding, Binding and Therapeutical Approaches [https://pmc.ncbi.nlm.nih.gov/articles/PMC9783222/]
- 3. SH2/SH3 signaling proteins [https://pubmed.ncbi.nlm.nih.gov/8193536/]
- 4. Evolution of SH2 domains and phosphotyrosine signalling ... [https://pmc.ncbi.nlm.nih.gov/articles/PMC3415846/]
- 5. Phosphotyrosine recognition domains: the typical, the atypical ... [https://biosignaling.biomedcentral.com/articles/10.1186/1478-811X-10-32]
- 6. Update on Structure and Function of SH2 Domains [https://www.mdpi.com/1422-0067/26/18/9060]
- 7. SH2 Domain - an overview [https://www.sciencedirect.com/topics/biochemistry-genetics-and-molecular-biology/sh2-domain]
- 8. Selective Targeting of SH2 Domain–Phosphotyrosine ... [https://pmc.ncbi.nlm.nih.gov/articles/PMC5417323/]
- 9. New computational process could help condense decades of ... [https://research.nd.edu/news-and-events/news/new-computational-process-could-help-condense-decades-of-disease-biology-research-into-days/]
- 10. Construction and Application of a Yeast Surface-displayed ... [https://www.sciencedirect.com/science/article/pii/S153594762030373X]
- 11. Frontiers | Yeast Surface Display System: Strategies for Improvement and Biotechnological Applications [https://www.frontiersin.org/journals/bioengineering-and-biotechnology/articles/10.3389/fbioe.2021.794742/full]
- 12. Applications of yeast surface display for protein engineering - PMC [https://pmc.ncbi.nlm.nih.gov/articles/PMC4544684/]
- 13. Yeast display - Wikipedia [https://en.wikipedia.org/wiki/Yeast_display]
- 14. Evaluation of the yeast surface display system for ... [https://pmc.ncbi.nlm.nih.gov/articles/PMC7076106/]
- 15. Deep Mutational Scanning of SARS-CoV-2 Receptor Binding ... [https://pmc.ncbi.nlm.nih.gov/articles/PMC7418704/]
- 16. Accurate sequence-to-affinity models for SH2 domains from ... [https://pmc.ncbi.nlm.nih.gov/articles/PMC11703206/]
- 17. Monobody Inhibitor Selective to the Phosphatase Domain ... [https://www.sciencedirect.com/science/article/pii/S0022283623000669]
- 18. Engineering by Protein Yeast Surface Display [https://www.jove.com/t/66994/protein-engineering-by-yeast-surface-display]
- 19. Beyond antibody engineering: directed evolution of alternative binding ... [https://microbialcellfactories.biomedcentral.com/articles/10.1186/s12934-018-0881-3]
- 20. Design of an artificial phage-display library based on a ... [https://www.nature.com/articles/s41598-023-27710-4]
- 21. for engineering Protocol to recognize ligand- binding ... domains bound [https://pubmed.ncbi.nlm.nih.gov/39321026/]
- 22. Design and evolution of a synthetic small protein scaffold ... [https://pmc.ncbi.nlm.nih.gov/articles/PMC12095922/]
- 23. Guidelines in the Preparation of Fully Synthetic, Human Single ... [https://pmc.ncbi.nlm.nih.gov/articles/PMC12371903/]
- 24. Scalable High Throughput Selection From Phage ... [https://pmc.ncbi.nlm.nih.gov/articles/PMC4354533/]
- 25. Probing SH2-domains using Inhibitor Affinity Purification (IAP) [https://proteomesci.biomedcentral.com/articles/10.1186/1477-5956-12-41]
- 26. A screening method of SH2 domain ligands and blockers ... [https://www.sciencedirect.com/science/article/abs/pii/S030438359700284X]
- 27. Affimer proteins are versatile and renewable affinity reagents [https://elifesciences.org/articles/24903]
- 28. Protein Engineering and High‐Throughput Screening by ... [https://pmc.ncbi.nlm.nih.gov/articles/PMC11271970/]
- 29. Yeast surface display for protein engineering and ... [https://pmc.ncbi.nlm.nih.gov/articles/PMC4038029/]
- 30. Generating a panel of highly specific antibodies to 20 ... [https://pmc.ncbi.nlm.nih.gov/articles/PMC2841545/]
- 31. Accurate affinity models for SH2 domains from peptide binding ... [https://pmc.ncbi.nlm.nih.gov/articles/PMC12521615/]
- 32. Targeting Grb2 SH3 Domains with Affimer Proteins ... [https://www.mdpi.com/2218-273X/14/8/1040]
- 33. Generating and validating renewable affimer protein ... [https://ui.adsabs.harvard.edu/abs/2024NatSR..1428322H/abstract]
- 34. An improved yeast surface display platform for the ... [https://www.nature.com/articles/s41598-018-37212-3]
- 35. A novel one-step approach for the construction of yeast ... [https://microbialcellfactories.biomedcentral.com/articles/10.1186/s12934-017-0853-z]
- 36. Design, Construction, and Validation of a Yeast-Displayed ... [https://pmc.ncbi.nlm.nih.gov/articles/PMC11160716/]
- 37. How to Maximize Yeast Transformation Efficiency [https://www.zymoresearch.com/blogs/blog/how-to-maximize-yeast-transformation-efficiency?srsltid=AfmBOoqpQhDHAyRc9PaJSJNtcHFSzLOmukb0jbYgg1kbN1Tq1eUHTjPa]
- 38. Library Size Limitations in Yeast Display [https://www.ranomics.com/library-size-limitations-in-yeast-display-advanced-strategies-for-maximizing-diversity]
- 39. An Introduction to Magnetic-Activated Cell Sorting (MACS) ... [https://www.ranomics.com/beyond-facs-an-introduction-to-magnetic-activated-cell-sorting-macs-for-library-pre-enrichment]
- 40. A flow cytometry method for quantitative measurement and ... [https://www.nature.com/articles/s41598-024-72030-w]
- 41. High-throughput profiling of sequence recognition by ... [https://elifesciences.org/articles/82345]
- 42. Generating and validating renewable affimer protein ... [https://www.nature.com/articles/s41598-024-79357-4]
- 43. Basic Principles and Recent Advances in Magnetic Cell ... [https://www.mdpi.com/2312-7481/8/1/11]
- 44. Yeast Display Technology for Antibody Discovery [https://proteininnovation.org/yeast-display-course/]
- 45. Yeast Surface Display Platform for Rapid Selection of an ... [https://www.mdpi.com/2073-4468/11/4/61]
- 46. Screening macrocyclic peptide libraries by yeast display ... [https://www.nature.com/articles/s41467-025-60907-x]
- 47. Single-cell analysis of yeast surface display for designer ... [https://pmc.ncbi.nlm.nih.gov/articles/PMC12403707/]
- 48. A yeast surface display platform for characterizing CAR T ... [https://www.nature.com/articles/s41467-025-65236-7]
- 49. Optimizing Yeast Surface-Displayed Unspecific ... [https://pmc.ncbi.nlm.nih.gov/articles/PMC12383419/]
- 50. Specificity and affinity motifs for Grb2 SH2-ligand interactions [https://pmc.ncbi.nlm.nih.gov/articles/PMC124298/]
- 51. Selective Targeting of SH2 Domain–Phosphotyrosine ... [https://www.sciencedirect.com/science/article/pii/S0022283617301390]
- 52. Publishing flow cytometry data - PMC [https://pmc.ncbi.nlm.nih.gov/articles/PMC2822558/]
- 53. Guidelines for the Presentation of Flow Cytometric Data [https://www.sciencedirect.com/science/article/pii/S0091679X04750104]
- 54. Protein-Protein Binding by Kinetics Biolayer Interferometry [https://link.springer.com/chapter/10.1007/978-3-031-52193-5_6]
- 55. Analysis of a Protein-protein Complex to Determine its... Kinetic [https://pmc.ncbi.nlm.nih.gov/articles/PMC8443453/]
- 56. Octet® BLI Resources Library [https://www.sartorius.com/en/products/biolayer-interferometry/bli-resources]
- 57. High-throughput profiling of sequence recognition by tyrosine ... [https://pmc.ncbi.nlm.nih.gov/articles/PMC10065799/]
- 58. Revisiting the phosphotyrosine binding pocket of Fyn SH2 ... [https://pmc.ncbi.nlm.nih.gov/articles/PMC7888540/]
- 59. The SH2 domain interaction landscape - PMC - PubMed Central [https://pmc.ncbi.nlm.nih.gov/articles/PMC4110347/]
- 60. The SH2 Domain Interaction Landscape [https://www.sciencedirect.com/science/article/pii/S2211124713001083]
- 61. Quantitative analysis of SH2 domain binding. Evidence for ... [https://www.sciencedirect.com/science/article/pii/S0021925819496890]
- 62. Measuring the capacity of yeast for surface display of cell ... [https://pmc.ncbi.nlm.nih.gov/articles/PMC11961389/]
- 63. Screening of protein-based inhibitors for the intracellular ... [https://www.sciencedirect.com/science/article/abs/pii/S1389172324001968]
- 64. Deep sequencing in library selection projects: what insight ... [https://pmc.ncbi.nlm.nih.gov/articles/PMC4648538/]
- 65. How To Read & Analyze Sequencing Results [https://www.cosmosid.com/blog/how-to-read-analyze-sequencing-results/]
- 66. Methods for analyzing deep sequencing expression data [https://pmc.ncbi.nlm.nih.gov/articles/PMC2728533/]
- 67. Enhancing diversity analysis by repeatedly rarefying next ... [https://www.nature.com/articles/s41598-021-01636-1]
- 68. SH2 Domains Recognize Contextual Peptide Sequence ... [https://pmc.ncbi.nlm.nih.gov/articles/PMC2984226/]
- 69. Enhanced Prediction of Src Homology 2 (SH2) Domain ... [https://www.sciencedirect.com/science/article/pii/S1535947620343395]
- 70. Scalable generation and functional classification of genetic ... [https://pmc.ncbi.nlm.nih.gov/articles/PMC12514753/]
- 71. Update on Structure and Function of SH2 Domains [https://pmc.ncbi.nlm.nih.gov/articles/PMC12470777/]
- 72. CoDIAC: A comprehensive approach for interaction analysis ... [https://pmc.ncbi.nlm.nih.gov/articles/PMC11291013/]
- 73. A good-practice guide to solving and refining molecular ... [https://pmc.ncbi.nlm.nih.gov/articles/PMC12497095/]
- 74. Yeast Surface Display System: Strategies for Improvement ... [https://pmc.ncbi.nlm.nih.gov/articles/PMC8784408/]
- 75. Review An overview on display systems (phage, bacterial ... [https://www.sciencedirect.com/science/article/abs/pii/S0141813022005839]
- 76. Phage Display vs. Yeast Display [https://www.creative-biolabs.com/phage-display-vs-yeast-display.html]
- 77. SH2 Domain Binding: Diverse FLVRs of Partnership [https://www.frontiersin.org/journals/endocrinology/articles/10.3389/fendo.2020.575220/full]
- 78. Development of a yeast cell surface display method using ... [https://www.nature.com/articles/s41598-021-90593-w]
- 79. Development of mirror-image monobodies targeting the ... [https://www.nature.com/articles/s41467-024-54901-y]
- 80. Protocol for engineering binding domains to recognize ... [https://pmc.ncbi.nlm.nih.gov/articles/PMC11462054/]