Western Blotting: A Comprehensive Guide for Accurate Protein Detection in Research and Drug Development
This article provides a comprehensive guide to Western blotting, a cornerstone technique for specific protein detection.
Western Blotting: A Comprehensive Guide for Accurate Protein Detection in Research and Drug Development
Abstract
This article provides a comprehensive guide to Western blotting, a cornerstone technique for specific protein detection. Tailored for researchers, scientists, and drug development professionals, it covers foundational principles, detailed methodological protocols, advanced troubleshooting strategies, and rigorous validation approaches. The scope includes emerging trends such as total protein normalization for superior quantification, automation for enhanced reproducibility, and the technique's pivotal role in proteomics, biomarker discovery, and clinical diagnostics, offering a complete resource for optimizing accuracy and reliability in protein analysis.
Western Blot Fundamentals: Principles, History, and Core Components
The History and Evolution of Western Blotting from the 1970s to Modern Day
The western blot, sometimes called the protein immunoblot, is a widely used analytical technique in molecular biology and immunogenetics to detect specific proteins in a sample of tissue homogenate or extract [1]. Its core task is to separate a specific protein from a complex mixture using a three-element process: separation by size, transfer to a solid support, and marking the target protein using a primary and secondary antibody for visualization [1]. Since its inception in the late 1970s, western blotting has become a fundamental tool, with one analysis suggesting it has been mentioned in "the titles, abstracts, and keywords of more than 400,000 PubMed-listed publications" and may still be the most-used protein-analytical technique [1]. This application note traces its evolution from a qualitative technique to a modern quantitative method, detailing key protocols and applications for today's researchers.
Historical Development: From Conception to Commonplace
The late 1970s saw the first publicly reported use of the western blot [2]. The method was independently invented in 1979 by Jaime Renart, Jakob Reiser, and George Stark, and by Harry Towbin, Theophil Staehelin, and Julian Gordon at the Friedrich Miescher Institute in Basel, Switzerland [1]. The term "western blot" itself was given by W. Neal Burnette in 1981 [1]. The name is a playful reference to the Southern blot, a technique for DNA detection developed by Edwin Southern. By analogy, the detection of RNA is termed northern blotting [1] [3].
The original purpose of the technique was to determine the presence or absence of a protein of interest in a complex biological sample [2]. The Towbin group's implementation notably used secondary antibodies for detection, thus resembling the actual method that is almost universally used today [1]. Visualization methods have evolved significantly over time, starting with radio-labeled tags for detection, which then progressed to colorimetric and later to the more widely used chemiluminescent (ECL) methods [2].
Methodological Evolution and Quantitative Advancements
The journey of western blotting from a qualitative to a quantitative technique has been driven by advancements in detection technologies and a refined understanding of the methodology.
The Shift from Film to Digital Imaging
A significant breakthrough came with the advancement of western blotting using fluorescence, which allowed for the detection of subtle changes in protein expression, enabling true quantitative analyses [2]. Table 1 summarizes the core differences between film-based chemiluminescence and modern digital detection.
Table 1: Comparison of Historical Film-Based and Modern Digital Detection Methods
| Feature | Traditional Film-Based Chemiluminescence | Modern Digital Detection (Fluorescence & Digital Chemiluminescence) |
|---|---|---|
| Detection Principle | Enzymatic (HRP) reaction producing light captured on X-ray film [2] | Fluorescence emission or CCD/CMOS capture of chemiluminescence [4] |
| Dynamic Range | Low (~1 order of magnitude); signal saturates quickly [4] [5] | High (3-4 orders of magnitude); maintains linearity [4] [5] |
| Quantitative Capability | Semi-quantitative at best; approximation due to saturation [2] [5] | Truly quantitative; linear detection profile directly related to protein quantity [2] [4] |
| Multiplexing | Difficult; requires stripping and reprobing, which can damage the membrane [4] | Native; multiple targets can be detected simultaneously from the same blot [4] |
The limitations of film are a key reason why early western blotting was considered only semi-quantitative. The linear quantitative range of film is narrow and challenging to assess by eye, making reproducible results difficult [4] [5]. Camera-based imaging systems extended the linear dynamic range to about three to four orders of magnitude, permitting the generation of semi-quantitative data from chemiluminescence [4]. However, the development of sensitive fluorescent labels truly enabled the Quantifiable Fluorescence-based Western Blot (QFWB), which allows biologists to carry out comparative expression analysis with greater sensitivity and accuracy [2]. A direct comparison revealed that fluorescence detection could quantify a target over a 128-fold range, compared to only a 16-fold range for film [5].
Fluorescence vs. Chemiluminescence: A Modern Comparison
The choice between fluorescence and chemiluminescence remains relevant. Fluorescent western blotting uses a fluorescently labeled secondary antibody, generating a linear detection profile that is directly related to the quantity of protein [2]. In contrast, traditional ECL techniques can suffer from signal saturation, especially with highly expressed proteins [2]. Figure 1 illustrates the modern workflow that incorporates both detection methods.
Figure 1. Modern western blot workflow, highlighting the divergence at the detection stage for fluorescence and chemiluminescence methods. Fluorescence enables direct digital capture and multiplexing, while chemiluminescence requires an extra enzymatic step and carries a risk of signal saturation.
Fluorescence offers several key advantages, particularly for multiplexing. It permits the interrogation of multiple targets from the same sample without the need for stripping and reprobing the membrane, a process that can be time-consuming and can remove variable amounts of protein, leading to artefactual data [4]. A 2022 study directly comparing the two methods on identical membranes found that fluorescence provided a broader linear dynamic range and higher precision and accuracy between replicate data [4].
Essential Protocols for Modern Western Blotting
Standard Fluorescent Western Blot Protocol
This protocol is optimized for quantitative results using fluorescent secondary antibodies and a digital imager (e.g., LI-COR Odyssey) [2] [6].
Sample Preparation:
- Homogenization: Manually macerate tissue and homogenize in an appropriate extraction buffer (e.g., RIPA buffer) at approximately 1:10 w/v (tissue weight/buffer volume) until a smooth homogenate is produced [2].
- Centrifugation: Centrifuge samples at 20,000 x g for 20 min at 4°C. Collect the supernatant containing solubilized proteins [2].
- Protein Determination: Determine protein concentration using a BCA or Bradford assay. Ensure the standard curve has an R-squared value ≥ 0.99 for accurate determination [2].
- Sample Loading: Prepare samples by mixing protein (e.g., 15 µg for neuronal isolates) with loading buffer. Heat at 98°C for 2 minutes [2].
Electrophoresis and Transfer:
- Gel Electrophoresis: Load samples onto a 4-12% Bis-Tris gradient gel for broad molecular weight separation. Use MES or MOPS running buffer [2].
- Protein Transfer: Transfer proteins to a nitrocellulose or PVDF membrane. For PVDF, pre-wet in 100% methanol for 30 seconds, rinse in deionized water, and equilibrate in transfer buffer before use [6].
Immunodetection:
- Blocking: Incubate the membrane with a sufficient volume of filtered fluorescent-compatible blocking buffer (e.g., Blocker FL) for 30-60 minutes at room temperature with agitation. Do not add detergent, as this may increase background fluorescence [6].
- Primary Antibody: Dilute the primary antibody per supplier recommendations in blocking buffer. Incubate the membrane protein-side up in the primary antibody solution for 1 hour at room temperature or overnight at 2-8°C with agitation [6].
- Washing: Wash the membrane 3 times for 10 minutes each with Tris-buffered saline with 0.05% Tween 20 (TBST) with agitation [6].
- Secondary Antibody: Dilute the fluorescently labeled secondary antibody to 0.4 - 0.1 µg/mL (typically a 1:5,000 to 1:20,000 dilution) in wash buffer or blocking buffer. Incubate the membrane protein-side up in the secondary antibody solution for 1 hour at room temperature with agitation. Protect the membrane from bright light to prevent photobleaching [6].
- Final Washing: Wash the membrane 6 times for 5 minutes each in wash buffer to remove any unbound secondary antibodies. This step is crucial for reducing background [6].
Imaging:
- Image the blot using an appropriate imaging system with fluorescence detection mode. The blot can be imaged while still wet or after drying [6].
The Scientist's Toolkit: Key Research Reagent Solutions
Table 2: Essential materials and reagents for a successful fluorescent western blot
| Item | Function / Rationale | Examples / Notes |
|---|---|---|
| Lysis Buffer | Solubilizes proteins and prevents degradation during extraction. | RIPA buffer (whole cell, mitochondrial, nuclear); NP-40 (whole cell, membrane bound). Must be compatible with protein assay [2]. |
| Protease Inhibitors | Prevents proteolytic degradation of the target protein during and after extraction. | Added to the lysis buffer prior to sample isolation [2]. |
| Protein Assay | Accurately determines protein concentration for equal loading. | BCA or Bradford assay. All samples must be assayed against the same standard curve with R² ≥ 0.99 [2]. |
| Fluorescent Blocking Buffer | Blocks nonspecific binding sites on the membrane to reduce background. | Filtered, specialized buffers (e.g., Blocker FL). Avoid detergents in blocking buffer for fluorescence [6]. |
| Validated Primary Antibodies | Specifically binds to the protein of interest. | Critical for specificity. Validate using knockout controls if possible [3] [7]. Report supplier, catalog number, and RRID [7]. |
| Fluorescent Secondary Antibodies | Binds to the primary antibody and provides the signal for detection. | Highly cross-absorbed antibodies conjugated to fluorescent dyes (e.g., IRDye). Dilute to 0.1-0.4 µg/mL [6] [4]. |
| Digital Imaging System | Captures the fluorescent signal over a wide linear dynamic range for quantification. | Camera-based systems (e.g., LI-COR Odyssey). Avoids saturation issues of film [2] [4] [5]. |
Applications in Research and Diagnostics
Western blotting has maintained its relevance through diverse applications in both basic research and clinical diagnostics.
In basic research, it is a cornerstone for verifying protein production after cloning, assessing protein expression levels, and understanding post-translational modifications [1]. It is also essential for subcellular localization studies, aided by fractionation techniques [1]. Furthermore, it plays a role in epitope mapping, helping to identify the binding sites of antibodies on their target proteins, which is crucial for vaccine and therapeutic development [1].
In medical diagnostics, the western blot is used as a confirmatory test for several diseases. It is part of the confirmatory HIV test, the definitive test for variant Creutzfeldt-Jakob disease, and a key tool in the diagnosis of Lyme disease and tularemia [1]. It is also used to confirm Hepatitis B and Herpes Simplex Virus-2 (HSV-2) infections [1] [8].
In the pharmaceutical sector, western blotting is used to understand the molecular consequences of drug administration, such as measuring biomarker levels and validating the mechanism of action of new therapeutics [3]. For example, it has been used in clinical trials to demonstrate target inhibition by a drug in leukemia patients [3].
Current Challenges and Best Practices for Reporting
Despite its long history, western blotting faces ongoing challenges related to reproducibility and reporting. A systematic assessment of over 500 articles revealed that western blot figures and methods often omit essential details [7]. Common problems include:
- Excessive Cropping: Over 90% of published blots are cropped, and most do not provide source data, depriving readers of information on protein multiplicity or antibody specificity [7].
- Missing Molecular Weight Markers: More than 95% of published blots lack visible molecular weight markers, and many lack molecular weight labels, making it impossible to confirm the size of the detected protein [7].
- Incomplete Methods Reporting: Critical details are often omitted, including the amount of protein loaded (55-78% of papers), blocking duration, and detailed antibody identifiers (especially for secondary antibodies) [7].
To ensure the production of high-quality, reproducible data, researchers should adhere to the following best practices:
- Perform a Linear Dynamic Range Test: Load a dilution series of a representative sample to determine the protein load that yields a linear signal, avoiding saturation [4] [5].
- Use Total Protein Normalization: Normalize target protein signal to the total protein loaded in each lane, as this is more reliable than using a single housekeeping protein [4] [3].
- Report Completely: Provide full-length, uncropped blot images in supplements. Always include molecular weight markers and labels. In the methods, report the amount of protein loaded, detailed blocking conditions, and complete antibody information (supplier, catalog number, RRID, and dilution) for both primary and secondary antibodies [7].
From its inception in 1979 to the present day, western blotting has evolved from a qualitative technique for detecting proteins into a robust, quantitative tool capable of measuring subtle changes in protein expression. The advent of fluorescence-based detection and digital imaging has been pivotal in this transformation, offering greater sensitivity, a wider dynamic range, and multiplexing capabilities that were not possible with traditional film-based chemiluminescence. As the technique continues to be a cornerstone of protein research and diagnostics, a commitment to rigorous methodology and transparent reporting is essential to ensure the reliability and reproducibility of the data it generates.
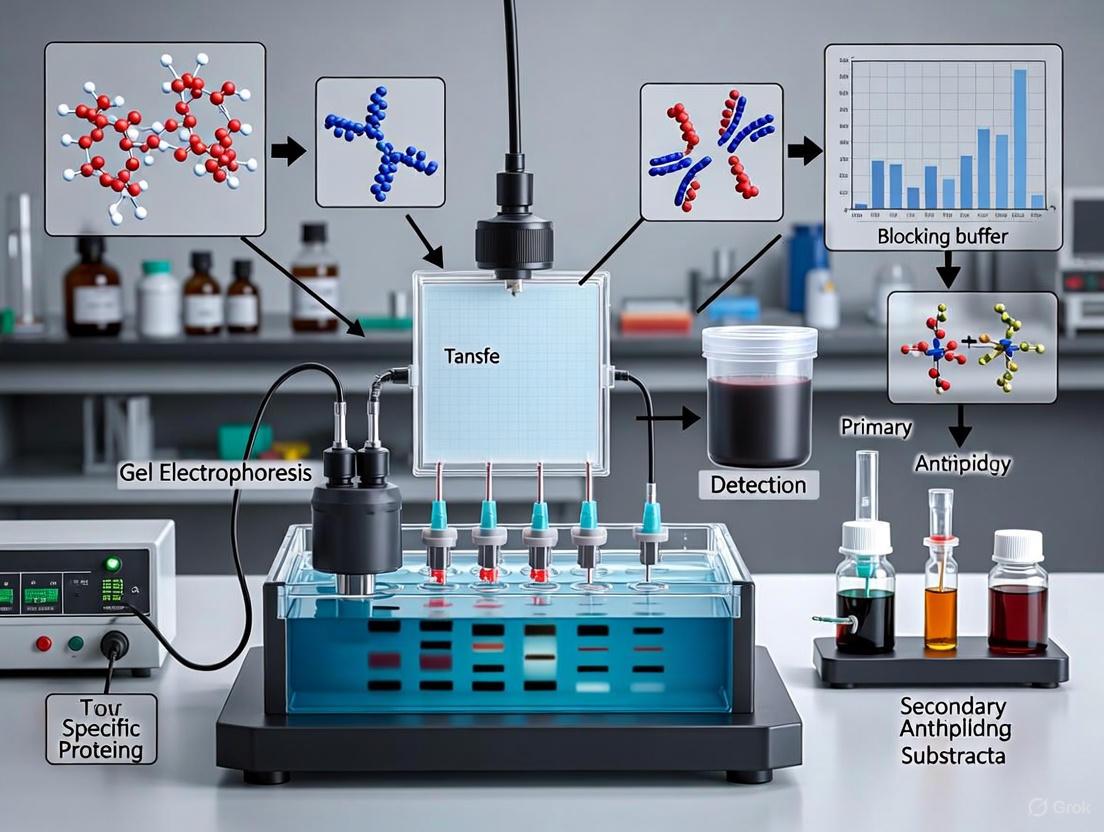
Western blotting is a cornerstone technique in molecular biology and biochemistry for the specific detection and analysis of proteins within a complex mixture [9]. The method combines the resolving power of gel electrophoresis with the specificity of antibody-based immunodetection, allowing researchers to confirm the presence, relative abundance, and molecular weight of a target protein [7] [9]. This protocol is indispensable in diverse settings, from academic research and biomarker validation to drug development and clinical diagnostics [10]. The core principle hinges on a series of interrelated steps: protein separation by size via SDS-PAGE, transfer of the separated proteins to a solid membrane support, and subsequent detection of a specific protein using a primary antibody and an enzyme- or fluorophore-conjugated secondary antibody [7] [9].
Core Procedural Workflow
The Western blotting procedure is a comprehensive process that can be divided into three major stages. The following diagram illustrates the logical sequence and key relationships between these critical stages.
Stage 1: SDS-PAGE (Polyacrylamide Gel Electrophoresis)
Principle and Objective
The primary objective of this stage is to separate denatured proteins based solely on their molecular weight [9]. SDS (sodium dodecyl sulfate) is a key reagent that denatures the proteins and confers a uniform negative charge along the polypeptide backbone. When an electric field is applied, these negatively charged proteins migrate through the polyacrylamide gel matrix towards the positive anode, with smaller proteins moving faster and thus farther than larger ones [9].
Detailed Protocol: Sample Preparation and Gel Loading
A. Materials Required
- Your protein sample (cell culture or tissue lysate) [9]
- Lysis Buffer (e.g., RIPA or non-denaturing buffer) [9]
- Protease Inhibitor Cocktail (to prevent protein degradation) [9]
- Phosphatase Inhibitor Cocktail (essential for preserving phosphorylated epitopes) [9]
- Loading Buffer (contains SDS and tracking dye) [9]
- Dithiothreitol (DTT) (a reducing agent to break disulfide bonds) [9]
- Protein Quantification Assay Kit (e.g., BCA or Bradford assay) [9]
- SDS-PAGE Gel (commercial or hand-cast) [9]
- Molecular Weight Ladder [9]
- Gel Running Apparatus and Power Supply [9]
- Running Buffer (e.g., Tris-Glycine, MES, MOPS) [9]
B. Step-by-Step Method
- Prepare Lysate: Lyse cells or tissue in an appropriate ice-cold lysis buffer supplemented with protease (and phosphatase) inhibitors. Keep samples on ice throughout to minimize degradation [9].
- Clarify Lysate: Centrifuge the lysate at 14,000–17,000 x g for 5-10 minutes at 4°C. Transfer the supernatant (which contains the soluble proteins) to a fresh tube and discard the pellet [9].
- Determine Protein Concentration: Use a BCA or Bradford assay to determine the precise protein concentration of the lysate. This is a critical step for ensuring equal loading across gel lanes [9].
- Prepare Samples for Loading: Dilute lysate aliquots in loading buffer containing DTT. A final protein concentration of 1–2 mg/mL is often suitable. Boil the samples at 100°C for 10 minutes to fully denature the proteins [9].
- Load the Gel: Load an equal amount of total protein (typically 10–40 µg for a lysate) into each well of the gel. Include a well for the molecular weight ladder [9].
- Run the Gel: Assemble the gel apparatus filled with running buffer and apply a constant voltage (e.g., 120-200V) until the dye front has migrated to the bottom of the gel. Running time and voltage should be optimized for the specific gel and protein size [9].
Gel Selection Guide
The choice of gel system depends on the molecular weight of your target protein, as detailed in the table below.
Table 1: Recommended SDS-PAGE Gel Conditions for Different Protein Sizes [9]
| Protein Size Range | Recommended Gel Chemistry | Recommended Running Buffer |
|---|---|---|
| 10 – 30 kDa | 4-12% acrylamide gradient Bis-Tris gel | MES |
| 31 – 150 kDa | 4-12% acrylamide gradient Bis-Tris gel | MOPS |
| > 150 kDa | 3-8% acrylamide gradient Tris-Acetate gel | Tris-Acetate |
Stage 2: Protein Transfer
Principle and Objective
After separation by SDS-PAGE, the proteins must be transferred from the gel onto a solid membrane support, creating the "blot." This step makes the proteins accessible for antibody probing. The most common method is electrotransfer, where an electric field drives the negatively charged proteins from the gel onto the membrane [9].
Detailed Protocol: Western Blot Transfer
A. Materials Required
- Transfer Buffer (typically Tris-Glycine with methanol)
- Membrane (Nitrocellulose or PVDF)
- Filter Paper
- Transfer Apparatus (wet or semi-dry system)
B. Step-by-Step Method
- Equilibrate: Following electrophoresis, briefly equilibrate the gel in transfer buffer.
- Prepare Membrane: If using PVDF membrane, activate it by briefly soaking in 100% methanol, then rinse in transfer buffer. Nitrocellulose can be placed directly into buffer.
- Assemble Transfer Stack: In a tray of transfer buffer, assemble the "transfer sandwich" in the following order: cathode (negative electrode), sponge, filter paper, gel, membrane, filter paper, sponge, anode (positive electrode). Ensure no air bubbles are trapped between the gel and membrane.
- Execute Transfer: Place the cassette into the transfer tank filled with cold buffer and apply a constant current (e.g., 300-400 mA) for 60-90 minutes. The system should be kept cool (in an ice bath or cold room) to prevent overheating.
- Verify Transfer: After transfer, proteins can be visualized on the membrane using reversible stains like Ponceau S to confirm successful and even transfer.
Stage 3: Immunodetection
Principle and Objective
This final stage utilizes the specificity of antibodies to detect the protein of interest immobilized on the membrane. The process involves blocking non-specific binding sites on the membrane, followed by sequential incubation with a primary antibody that recognizes the target protein, and a conjugated secondary antibody that recognizes the primary antibody. The signal from the secondary antibody is then detected, revealing the location and intensity of the target protein band [9].
Detailed Protocol: Blocking, Antibody Incubation, and Detection
A. Materials Required
- Blocking Buffer (e.g., 5% non-fat dry milk or BSA in TBST)
- Primary Antibody (specific for your target protein)
- Secondary Antibody (conjugated to HRP or a fluorophore, specific for the host species of the primary antibody)
- Wash Buffer (e.g., TBST or PBST)
- Detection Reagents (e.g., chemiluminescent substrate for HRP)
B. Step-by-Step Method
- Block the Membrane: Incubate the membrane in an ample volume of blocking buffer for 1 hour at room temperature with gentle agitation. This step saturates non-specific protein-binding sites on the membrane to minimize background [11].
- Incubate with Primary Antibody: Dilute the primary antibody to the appropriate concentration in blocking buffer or a dedicated antibody diluent. Incubate the membrane with the primary antibody solution for 1 hour at room temperature or overnight at 4°C with agitation [9].
- Wash the Membrane: Remove the primary antibody and wash the membrane 3-5 times for 5 minutes each with a large volume of wash buffer (e.g., TBST) to remove unbound antibody.
- Incubate with Secondary Antibody: Dilute the HRP- or fluorophore-conjugated secondary antibody in blocking buffer. Incubate the membrane with the secondary antibody solution for 1 hour at room temperature, protected from light if using a fluorescent dye.
- Wash the Membrane: Perform a second series of washes as in Step 3 to remove any unbound secondary antibody.
- Detect Signal:
- For Chemiluminescence: Mix the chemiluminescent substrate reagents according to the manufacturer's instructions. Incubate the membrane with the substrate and visualize using a CCD camera-based imaging system. Ensure the signal is within the linear dynamic range for quantification [12] [13].
- For Fluorescence: Image the membrane using a compatible fluorescence imager at the appropriate excitation/emission wavelengths [11].
Common Pitfalls and Data Reporting Standards
A systematic assessment of publications reveals that Western blot figures and methods often omit essential details, which limits reproducibility [7]. The table below summarizes frequent issues and current reporting standards.
Table 2: Common Western Blotting Pitfalls and Journal Publication Guidelines [7] [13]
| Aspect | Common Pitfall (Prevalence) | Recommended Practice for Publication |
|---|---|---|
| Image Cropping | Over 90% of published blots are tightly cropped [7]. | Provide full, uncropped images of the entire membrane and gel as supplemental data [7]. |
| Molecular Weight Markers | >95% of blots lack visible molecular weight markers; 30-38% lack any molecular weight labels [7]. | Always include visible molecular weight markers with clear labels on the blot image to confirm expected protein size [7]. |
| Antibody Reporting | Catalog numbers missing for 20-32% of primary and 66-75% of secondary antibodies; RRIDs rarely reported [7]. | Report supplier, catalog number, lot number, and RRID (Research Resource Identifier) for all antibodies [7]. |
| Protein Loading | 55-78% of papers omit the amount of protein loaded per lane [7]. | Always state the exact amount of total protein loaded per lane in the figure legend or methods [7]. |
| Normalization | Over-reliance on variable housekeeping proteins (HKPs) like GAPDH and β-actin [13]. | Use Total Protein Normalization (TPN) as the gold standard for more accurate quantification, as it is increasingly required by top journals [13]. |
| Image Manipulation | Use of editing tools that obscure original data. | Avoid any editing that misrepresents data (e.g., improper cloning, healing tools). Only adjust contrast/brightness uniformly across the entire image, as per journal policies [13]. |
The Scientist's Toolkit: Essential Research Reagent Solutions
Successful Western blotting relies on a suite of reliable reagents and tools. The following table details key solutions and their critical functions in the workflow.
Table 3: Essential Research Reagents and Materials for Western Blotting
| Reagent / Material | Critical Function in the Workflow |
|---|---|
| Protease/Phosphatase Inhibitors | Preserves protein integrity by preventing proteolytic degradation and maintaining post-translational modifications during lysate preparation [9]. |
| SDS-PAGE Gel Systems | Provides the matrix for size-based separation of denatured proteins. Gradient gels offer a broader separation range [9]. |
| Nitrocellulose or PVDF Membrane | Serves as the solid support for immobilized proteins after transfer, enabling subsequent antibody probing [11]. |
| Blocking Buffer (e.g., BSA, Milk) | Reduces nonspecific antibody binding to the membrane, a crucial step for minimizing background noise [11]. |
| Validated Primary Antibodies | The key to specificity; binds selectively to the target protein of interest. Proper validation is essential for reliable results [7] [11]. |
| HRP- or Fluorophore-conjugated Secondary Antibodies | Enables detection by binding to the primary antibody. Conjugates generate a measurable signal (chemiluminescent or fluorescent) [11]. |
| Total Protein Normalization (TPN) Reagents | Provides a superior method for normalization by staining the total protein in each lane, correcting for loading errors more reliably than housekeeping proteins [13]. |
Within the framework of research dedicated to detecting specific proteins, the Western blot remains an indispensable technique. Its reliability hinges on the precise selection and application of its core components: gels for separation, membranes for immobilization, and buffers for maintaining the biochemical environment. This guide details the essential characteristics, selection criteria, and protocols for these components, providing a foundation for robust, reproducible, and publication-ready protein analysis in research and drug development.
Protein Separation: Polyacrylamide Gels
The first critical step in Western blotting is the electrophoretic separation of proteins based on molecular weight using polyacrylamide gel electrophoresis (SDS-PAGE). Proteins are denatured and linearized, and their migration through the gel matrix is inversely proportional to the logarithm of their molecular mass [14]. The choice of gel composition directly impacts resolution.
Table 1: Gel Percentage Recommendations for Optimal Protein Separation
| Gel Percentage (% Acrylamide) | Optimal Molecular Weight Separation Range |
|---|---|
| 4-20% Gradient Gel | Broad range: 10 - 300 kDa |
| 6% Gel | High molecular weight: 50 - 300 kDa |
| 8% Gel | Medium-high molecular weight: 30 - 200 kDa |
| 10% Gel | Medium molecular weight: 20 - 100 kDa |
| 12% Gel | Medium-low molecular weight: 15 - 70 kDa |
| 15% Gel | Low molecular weight: 5 - 50 kDa |
For most applications, precast gradient gels (e.g., 4-20%) are recommended as they provide superior resolution across a wide mass range, simplify protocol optimization, and enhance reproducibility [14]. The following workflow diagram outlines the core steps of the Western blot process, from sample preparation to detection.
Membrane Selection: PVDF vs. Nitrocellulose
Following separation, proteins are transferred from the gel onto a solid support membrane. The two primary options are nitrocellulose and polyvinylidene difluoride (PVDF), each with distinct properties that influence protein binding, background signal, and detection performance [15] [16].
Table 2: Comprehensive Comparison of PVDF and Nitrocellulose Membranes
| Feature | PVDF Membrane | Nitrocellulose Membrane |
|---|---|---|
| Protein Binding Capacity | 150–300 µg/cm² [15] | 80–100 µg/cm² [15] |
| Binding Mechanism | Hydrophobic interactions [16] | Hydrophobic, H-bond, and ionic interactions [16] |
| Durability & Chemical Resistance | High; withstands stripping/re-probing [15] | Low; fragile and brittle [15] [16] |
| Pre-wetting Requirement | Requires activation in 100% methanol or ethanol [15] [16] | Ready to use; do not wet with methanol [15] |
| Background Noise | Can be high with standard PVDF [15] | Generally low [15] |
| Autofluorescence | High for standard PVDF; low for low-fluorescence PVDF [15] [16] | Low [16] |
| Optimal Detection Method | Chemiluminescence; low-fluorescence PVDF for fluorescence [15] [16] | Chemiluminescence and fluorescence [15] |
| Cost | High [15] | Low [15] |
| Pore Size (Common) | 0.2 µm (proteins <20 kDa), 0.45 µm (proteins >20 kDa) [15] | 0.2 µm (proteins <20 kDa), 0.45 µm (proteins >20 kDa) [15] |
Application-Based Membrane Selection Guide
- Choose a PVDF membrane when: Detecting low-abundance or high molecular weight proteins, multiple stripping and re-probing are required, or superior mechanical strength is needed for rigorous protocols [15] [16].
- Choose a nitrocellulose membrane when: Working with medium-to-low molecular weight proteins, minimizing background noise is a priority, or a cost-effective solution for routine detection is desired [15].
- Choose a low-fluorescence PVDF membrane when: Performing fluorescent Western blotting or total protein normalization with fluorescent labels, as it offers the lowest autofluorescence and highest signal-to-noise ratio [16].
Essential Buffers: Recipes and Protocols
The buffers used throughout the Western blot process are critical for success. Below are standard recipes and protocols for key steps [17].
Lysis Buffers for Protein Extraction
Choice of lysis buffer depends on protein localization and the need for denaturation.
Table 3: Lysis Buffer Selection Guide and Compositions
| Buffer Type | Target Protein Location | Key Components |
|---|---|---|
| RIPA Buffer | Membrane-bound, nuclear, whole-cell extracts [17] | 150 mM NaCl, 1% NP-40, 0.5% sodium deoxycholate, 0.1% SDS, 50 mM Tris-HCl, pH 8.0 [17] |
| NP-40 Buffer | Cytoplasmic, membrane-bound, whole-cell extracts [17] | 150 mM NaCl, 1.0% NP-40, 50 mM Tris-HCl, pH 8.0 [17] |
| Tris-HCl Buffer | Soluble cytoplasmic proteins [17] | 20 mM Tris-HCl, pH 7.5 [17] |
| Tris-Triton Buffer | Cytoskeletal-bound proteins [17] | 100 mM NaCl, 1% Triton X-100, 10 mM Tris, 0.1% SDS, 10% glycerol [17] |
Protocol: Protein Extraction with RIPA Buffer
- Prepare Lysis Buffer: Add fresh protease and/or phosphatase inhibitors to chilled RIPA buffer [17].
- Lyse Cells/Tissue: Add cold buffer to your sample (e.g., 500 µL per 5x10⁶ cells). Incubate on ice for 30 minutes with gentle vortexing every 5-10 minutes [17].
- Clarify Lysate: Centrifuge at 12,000-16,000 x g for 15-20 minutes at 4°C.
- Collect Supernatant: Transfer the supernatant (containing solubilized protein) to a new tube. Store at -80°C if not used immediately.
Electrophoresis and Transfer Buffers
- 2X Laemmli Loading Buffer: 4% SDS, 10% 2-mercaptoethanol, 20% glycerol, 0.004% bromophenol blue, 0.125 M Tris-HCl, pH 6.8 [17]. Mix 1:1 with protein lysate and denature at 95°C for 5 minutes.
- Running Buffer (10X Stock): 250 mM Tris base, 1.9 M glycine, 1% SDS. Dilute to 1X for use [17].
- Wet Transfer Buffer: 25 mM Tris base, 190 mM glycine, 20% methanol. For proteins >80 kDa, include SDS to 0.1% final concentration [17].
Blocking and Incubation Buffers
Blocking is crucial to prevent nonspecific antibody binding. A 5% solution of Bovine Serum Albumin (BSA) in TBST is often preferred for its low background, especially with phospho-specific antibodies [14].
- 10X Tris-Buffered Saline (TBS): 240 mM Tris base, 88 g/L NaCl, pH to 7.6 [17].
- TBST (1X): 1X TBS with 0.1% Tween-20 [17].
- Blocking Buffer: 3-5% BSA or non-fat dry milk in TBST [14] [17].
The Scientist's Toolkit: Key Research Reagent Solutions
Table 4: Essential Materials and Reagents for Western Blotting
| Item | Function & Rationale |
|---|---|
| Precast SDS-PAGE Gels | Provide consistent, reproducible protein separation without the need to pour gels, saving time and reducing variability. |
| PVDF/Nitrocellulose Membranes | Serve as a stable matrix to immobilize proteins after transfer, enabling subsequent probing with antibodies. |
| Enhanced Chemiluminescent (ECL) Substrate | A sensitive detection reagent that produces light upon reaction with HRP-conjugated antibodies, captured on film or digital imagers. |
| Primary Antibodies | Immunoglobulins that specifically bind to the protein of interest. Critical for assay specificity. |
| HRP- or Fluorophore-conjugated Secondary Antibodies | Bind the primary antibody and carry the label (enzyme or fluorophore) for detection, providing signal amplification. |
| Protein Ladder (Molecular Weight Marker) | A mixture of proteins of known sizes run alongside samples to estimate the molecular weight of the target protein. |
| Protease/Phosphatase Inhibitor Cocktails | Added to lysis buffers to prevent the degradation and dephosphorylation of proteins during and after extraction. |
| BSA (Bovine Serum Albumin) | A high-quality blocking agent that minimizes nonspecific binding, leading to lower background noise. |
| Methanol & Transfer Buffers | Methanol activates PVDF membranes and is a component of transfer buffers, facilitating protein movement and binding. |
| Digital Imaging System (CCD-based) | For capturing chemiluminescent or fluorescent signals; superior to film for quantitative analysis due to a wider linear dynamic range [13]. |
Advanced Quantitative Analysis and Publication Standards
For quantitative Western blotting, normalization is essential to distinguish true biological change from technical variability [13] [12]. The traditional method of using Housekeeping Proteins (HKPs) like GAPDH or β-actin is falling out of favor due to documented expression variability under different experimental conditions [13]. Total Protein Normalization (TPN) is now considered the gold standard, as it normalizes the target protein signal to the total protein loaded in each lane, providing a more accurate and reliable quantification [13].
Adherence to journal publication guidelines is critical. Key requirements often include [13]:
- Providing original, uncropped blot images in the supplemental information.
- Including molecular weight markers and labels on all blot images.
- Avoiding excessive image manipulation and brightness/contrast adjustments that misrepresent data.
- Clearly indicating where lanes have been spliced or rearranged from different parts of the same gel.
- Reporting antibodies with complete identifiers (company, catalog number, RRID).
In the realm of protein research, the western blot remains a cornerstone technique for the specific detection and analysis of proteins within complex biological samples [9] [18]. The core of this method's exceptional specificity and sensitivity lies in the strategic use of antibody-antigen interactions. The critical partnership between primary and secondary antibodies forms the backbone of immunodetection, enabling researchers to visualize and quantify specific proteins with precision [19]. This application note details the fundamental principles, selection criteria, and optimized protocols essential for leveraging antibodies to generate reproducible, high-quality data in western blotting, framed within the broader context of thesis research on specific protein detection.
Antibody Fundamentals and Selection Criteria
Primary Antibodies: Specificity and Types
Primary antibodies are immunoglobulins that bind directly to a unique epitope on the target protein. The choice of primary antibody is the primary determinant of specificity in a western blot [19].
Table 1: Comparison of Primary Antibody Types
| Feature | Polyclonal | Monoclonal | Recombinant |
|---|---|---|---|
| Definition | A collection of antibodies from different B cells that recognize multiple epitopes | A single antibody type produced by identical B cell clones that recognize one epitope | A single antibody derived from recombinant DNA |
| Key Advantages | High sensitivity; multiple epitope recognition can compensate for slight epitope masking | Superior lot-to-lot consistency; often well-characterized with extensive publication history | Superior long-term supply consistency; not susceptible to cell-line drift; defined sequence |
| Key Disadvantages | Potential for lot-to-lot variability; higher risk of non-specific bands | Sensitivity depends on a single epitope; potential for subtle cell-line drift over time | Specialized and epitope-dependent; longer development time; usually higher cost |
The selection of a primary antibody must be guided by validation for western blotting. Crucially, researchers must confirm that the antibody is specific towards the denatured protein, as the SDS-PAGE process unfolds proteins, potentially destroying conformation-dependent epitopes [19].
Secondary Antibodies: Signal Amplification and Detection
Secondary antibodies are directed against the immunoglobulins of the species in which the primary antibody was raised. They are typically conjugated to enzymes or fluorophores for detection and are responsible for signal generation [19]. The indirect detection method—using an unlabeled primary followed by a labeled secondary—offers significant signal amplification as multiple secondary antibodies can bind to a single primary antibody [19].
Table 2: Secondary Antibody Target Specificity
| Secondary Antibody Target | Advantages | Disadvantages |
|---|---|---|
| Heavy and Light Chain (H+L) | Most versatile; high signal amplification; recommended for most chemiluminescent and fluorescent applications [19]. | Possible cross-reactivity with light chains of other immunoglobulins; may saturate for highly abundant targets [19]. |
| Fc Fragment Specific | Binds only to the heavy chain; good for detecting mouse monoclonal primaries; useful after immunoprecipitation or for specific isotype detection [19]. | Generally less sensitive than H+L specific secondaries; potential for interference [19]. |
Experimental Design for Quantitative Western Blotting
Producing quantitative data requires a fundamental shift from simple detection to a rigorous, validated methodology [18]. Key considerations include:
Determining Linear Dynamic Range
A critical, often overlooked step is determining the linear dynamic range for each antibody-target pair. Loading a random amount of protein (e.g., 10-100 µg) often leads to overloading and saturation, producing non-linear, unreliable data [18]. To establish the optimal loading concentration:
- Create a 1:2 dilution series of a pooled sample, spanning at least 12 dilutions from a high starting concentration (e.g., 100 µg).
- Run, transfer, and blot the series.
- Plot the relative signal density against the protein load.
- Select the protein load that corresponds to the middle of the linear dynamic range for subsequent experiments [18].
Appropriate Normalization Strategies
Normalization corrects for minor variations in protein loading and transfer efficiency. While housekeeping proteins (HKPs) like GAPDH, actin, and tubulin are traditional choices, they can be unreliable as they are often overloaded and their expression can vary with experimental conditions [18]. Total protein normalization (TPN), which uses a stain to measure the total protein in each lane, has been shown to provide excellent data for quantitative analyses [18].
Multiplex Fluorescent Western Blotting
For multiplexing, where multiple targets are detected on the same blot, use primary antibodies raised in distantly related host species (e.g., rabbit and mouse, or rat and rabbit). This enables the use of species-specific secondary antibodies conjugated to different fluorophores, minimizing cross-reactivity and yielding clean, multi-target data from a single sample [19] [4]. Fluorescent detection avoids the need for stripping and reprobing, a process that can damage proteins and lead to artefacts [4].
The following diagram illustrates the critical decision points and workflow for a successful quantitative western blot experiment.
Detailed Experimental Protocols
Sample Preparation and Gel Electrophoresis
Materials & Reagents:
- Lysis Buffer (e.g., RIPA buffer: 1% NP-40 or Triton X-100, 1% sodium deoxycholate, 0.1% SDS, 150 mM NaCl, 50 mM Tris-HCl, pH 7.8, 1 mM EDTA) [18].
- Protease Inhibitor Cocktail [9].
- Phosphatase Inhibitor Cocktail (for phosphorylated proteins) [9].
- Loading Buffer (with SDS and reducing agent like DTT or β-mercaptoethanol) [9] [20].
- BCA or Bradford Protein Assay Kit [9].
Protocol:
- Cell Lysis: Wash cells with PBS. Lyse cells in ice-cold RIPA buffer supplemented with protease inhibitors. Scrape adherent cells and transfer the lysate to a microcentrifuge tube. Sonicate briefly (10-15 seconds) to complete lysis and shear DNA [18] [21].
- Clarification: Centrifuge the lysate at 14,000–17,000 x g for 5-10 minutes at 4°C. Transfer the supernatant (containing soluble proteins) to a new tube [9].
- Protein Quantification: Determine the protein concentration using a detergent-compatible assay (e.g., BCA or Bradford) [9] [18].
- Sample Denaturation: Dilute lysates in loading buffer containing a reducing agent (e.g., DTT). Heat samples at 95-100°C for 5 minutes to fully denature proteins [9] [21].
- Gel Electrophoresis: Load an equal amount of protein (the predetermined optimal mass) into each well of an SDS-PAGE gel. Include a prestained protein ladder.
- Run the gel at 100-150 V for 40-60 minutes in the appropriate running buffer until the dye front nears the bottom [22].
Protein Transfer, Blocking, and Immunoblotting
Materials & Reagents:
- Transfer Buffer (e.g., Tris-Glycine with methanol) [21].
- Membrane (Nitrocellulose or PVDF). Note: Pre-wet PVDF in 100% methanol. [20].
- Filter Paper and Sponges.
- Blocking Agent (5% w/v Non-fat Dry Milk or BSA in TBST) [21].
- Primary Antibody (validated for western blotting).
- HRP-conjugated or Fluorescent-conjugated Secondary Antibody.
- Wash Buffer (TBST or TBST) [21].
Protocol:
- Electrotransfer: Assemble the "transfer stack" in the following order (from anode to cathode): sponge, filter paper, gel, membrane, filter paper, sponge. Ensure no air bubbles are trapped. Perform wet transfer at constant voltage (e.g., 100V for 60-90 minutes) on ice [22].
- Blocking: Incubate the membrane in 25 mL of blocking buffer (e.g., 5% non-fat dry milk in TBST) for 1 hour at room temperature with gentle agitation [21].
- Primary Antibody Incubation:
- Dilute the primary antibody in the recommended buffer (often 5% BSA or milk in TBST) as specified on the product datasheet.
- Incubate the membrane with the primary antibody solution (e.g., 10 mL) with gentle agitation overnight at 4°C [21].
- Washing: Wash the membrane three times for 5 minutes each with 15 mL of TBST [21].
- Secondary Antibody Incubation:
- Dilute the HRP-conjugated or fluorescent-conjugated secondary antibody in blocking buffer (e.g., 1:2000-1:10000 for HRP).
- Incubate the membrane with the secondary antibody solution for 1 hour at room temperature with gentle agitation [21].
- Washing: Repeat the wash step three times for 5 minutes each with TBST [21].
Detection and Analysis
Materials & Reagents:
- Chemiluminescent Substrate (e.g., LumiGLO, SignalFire, Clarity) [21] [18].
- Fluorescent Imager or CCD-based Chemiluminescence Imager.
Protocol:
- Chemiluminescent Detection: For HRP-conjugated antibodies, mix the chemiluminescent substrate reagents as per manufacturer instructions. Incubate the membrane with the substrate for ~1 minute. Drain excess liquid and image using a CCD-based imager capable of capturing a digital image within the linear dynamic range [21] [4]. Avoid using film, which has a narrow linear range and saturates easily [18].
- Fluorescent Detection: For fluorescently conjugated antibodies, image the membrane directly using a compatible laser-based scanner with appropriate excitation/emission filters [4].
- Data Analysis:
- Use imaging software to perform background subtraction and quantify the densitometry of the bands.
- Normalize the target protein signal to the corresponding total protein or housekeeping protein signal in each lane.
- Perform statistical analysis on the normalized data from biological replicates.
The Scientist's Toolkit: Essential Reagents and Materials
Table 3: Key Research Reagent Solutions for Western Blotting
| Item | Function | Key Considerations |
|---|---|---|
| Lysis Buffer (RIPA) | Extracts soluble proteins from cells/tissues while maintaining integrity. | Must include protease inhibitors; ionic vs. non-ionic detergent choice impacts stringency [18]. |
| Protease Inhibitors | Prevents proteolytic degradation of target protein during extraction. | Essential for all sample preparation; use a broad-spectrum cocktail [9]. |
| BCA/Bradford Assay | Quantifies total protein concentration in lysates for equal loading. | Must be detergent-compatible [9] [18]. |
| SDS-PAGE Gels | Separates proteins by molecular weight under denaturing conditions. | Gel percentage must be matched to target protein size for optimal resolution [20]. |
| Transfer Buffer | Medium for electrophoretic transfer of proteins from gel to membrane. | Typically Tris-Glycine with methanol; composition affects efficiency [21]. |
| Blocking Agent (BSA/Milk) | Covers unused membrane binding sites to reduce non-specific antibody binding. | BSA is preferred for phospho-specific antibodies or biotin-streptavidin systems; milk is economical [20] [21]. |
| Validated Primary Antibody | Binds specifically to the target protein of interest. | Must be validated for western blot and for detection of denatured protein [19]. |
| Conjugated Secondary Antibody | Binds to the primary antibody and generates a detectable signal. | Host species must be matched to primary antibody; conjugate (HRP/fluor) determines detection method [19]. |
| Chemiluminescent Substrate | Generates light upon reaction with HRP enzyme for signal detection. | Sensitivity and signal duration vary between substrates [21]. |
Troubleshooting and Best Practices
- High Background: Ensure the membrane is fully blocked and that antibody concentrations are optimized. Increase the number and duration of washes. Consider using a different blocking agent (e.g., switch from milk to BSA) [20].
- Non-specific Bands: Confirm antibody specificity. These bands may indicate suboptimal blocking or antibody concentration but could also represent protein isoforms or degradation products. Optimize conditions and run appropriate controls [23].
- No Signal/Weak Signal: Confirm that the primary antibody recognizes the denatured epitope. Check antigen integrity and increase protein load (within the linear range). Ensure the detection substrate is active [20].
- Publication-Quality Data: Journals are increasingly stringent. Always save original, unprocessed images. Minimize cropping of blots to show relevant molecular weight markers and important lanes. Adjustments to brightness/contrast must be applied evenly across the entire image and must not alter the data interpretation [23]. Many journals now require full, uncropped blot images as supplementary information [23].
The critical role of antibodies in western blotting cannot be overstated. A deep understanding of primary and secondary antibody characteristics, coupled with a rigorously optimized and quantitative experimental workflow, is fundamental to achieving specific, sensitive, and reproducible results. By adhering to the principles and detailed protocols outlined in this application note—particularly the determination of the linear dynamic range and appropriate normalization—researchers can elevate western blotting from a simple qualitative tool to a robust quantitative method, thereby generating reliable data capable of supporting high-impact thesis research and drug development.
The Ubiquitous Role of Western Blotting in Biomedical Research and Diagnostics
Western blotting, also known as immunoblotting, is a cornerstone technique in molecular biology and biochemistry for identifying specific proteins in complex biological samples and analyzing their expression levels [8] [24]. This method combines the size-based separation of proteins with the specificity of antibody-antigen interactions, allowing researchers to determine the presence, absence, and relative abundance of a target protein, as well as its molecular weight [8] [25]. Its robustness and specificity have cemented its role as an indispensable tool in basic scientific research, drug development, and clinical diagnostics.
Principles of Western Blotting
The western blot technique operates on the principle of separating proteins by size through gel electrophoresis and then using antibodies for specific detection [25]. The process can be broken down into three core stages: separation by size, transfer to a solid support, and immunodetection [25].
The first step typically involves SDS-PAGE (sodium dodecyl sulfate-polyacrylamide gel electrophoresis). SDS denatures the proteins and imparts a uniform negative charge, ensuring that separation occurs based almost exclusively on molecular weight rather than native charge or structure [8] [9]. An electrical current applied across the gel causes the proteins to migrate, with smaller proteins moving faster through the gel matrix than larger ones [9].
Following separation, the proteins are transferred from the gel onto a solid membrane, usually nitrocellulose or PVDF (polyvinylidene fluoride), creating a replica of the gel's protein pattern [8] [6]. This transfer is essential because the gel matrix is poorly suited for the antibody incubations required for detection [25]. An electric current is applied again to drive the proteins from the gel onto the membrane [8].
The final stage, immunodetection, involves probing the membrane with antibodies to visualize the protein of interest. The membrane is first treated with a blocking agent like non-fat dry milk or bovine serum albumin (BSA) to prevent antibodies from binding non-specifically to the membrane [21] [26]. The membrane is then incubated with a primary antibody that is specific to the target protein. After washing, a secondary antibody that recognizes the primary antibody is applied. This secondary antibody is conjugated to a reporter enzyme, such as horseradish peroxidase (HRP), or a fluorophore, which enables detection [21] [25]. Alternatively, directly conjugated primary antibodies can be used to simplify the protocol by eliminating the secondary antibody step [25].
Detailed Experimental Protocol
A successful western blot requires meticulous attention to each step of the procedure. The following protocol, synthesized from industry leaders, provides a comprehensive guide for chemiluminescent detection, one of the most common methods [21] [9] [6].
Sample Preparation
Proper sample preparation is a crucial first step for an accurate western blot [8].
- Cell Lysis: Lyse cells or tissues in an appropriate ice-cold lysis buffer (e.g., RIPA buffer) supplemented with protease and phosphatase inhibitors to prevent degradation [9]. Keep samples on ice throughout.
- Protein Quantification: Determine the protein concentration of each lysate using an assay such as Bradford or BCA [8] [9]. This is critical for loading equal amounts of protein across samples for quantitative comparisons.
- Denaturation: Dilute lysates in SDS sample buffer containing a reducing agent like DTT. Heat samples at 95–100°C for 5 minutes to fully denature the proteins [21] [9].
- Storage: Aliquots can be stored at -80°C until use [9].
Gel Electrophoresis and Protein Transfer
- Gel Selection: Choose an appropriate SDS-PAGE gel based on the molecular weight of your target protein (see Table 1) [9]. Pre-cast gradient gels (e.g., 4-12% Bis-Tris) are suitable for a wide range of protein sizes.
- Loading and Running: Load an equal mass of total protein (typically 10-40 µg for cell lysates) per lane alongside a pre-stained protein molecular weight marker [21] [9]. Apply a constant voltage (e.g., 120-150V for mini-gels) until the dye front reaches the bottom of the gel.
- Membrane Preparation:
- Transfer: Assemble the "sandwich" in the order of sponge, filter paper, gel, membrane, filter paper, sponge. Remove all air bubbles by rolling a tube over the sandwich. Perform wet or semi-dry transfer according to the manufacturer's instructions [6].
Immunoblotting
- Blocking: Incubate the membrane in 25 mL of blocking buffer (e.g., 5% non-fat dry milk in TBST) for 1 hour at room temperature with gentle agitation to prevent nonspecific antibody binding [21] [26].
- Primary Antibody Incubation: Dilute the primary antibody in the recommended buffer (often 5% BSA or milk in TBST) [21]. Incubate the membrane with the primary antibody solution with gentle agitation, overnight at 4°C for optimal sensitivity [21].
- Washing: Wash the membrane three times for 5-10 minutes each with a large volume (e.g., 15 mL) of wash buffer (TBST or PBST) to remove unbound antibody [21] [6].
- Secondary Antibody Incubation: Dilute the HRP-conjugated secondary antibody in blocking or wash buffer (typical dilutions range from 1:2,000 to 1:100,000) [21] [6]. Incubate the membrane for 1 hour at room temperature with agitation [21].
- Final Washes: Wash the membrane six times for 5 minutes each with wash buffer to thoroughly remove any unbound secondary antibody, which is crucial for minimizing background [6].
Detection
For chemiluminescent detection, incubate the membrane with the working solution of an ECL substrate for approximately 1 minute [21] [6]. Drain excess reagent, wrap the membrane in plastic, and image using a system capable of detecting the emitted light, such as a digital imager or X-ray film [21]. The signal is most intense immediately following incubation and declines over the following few hours [21].
Table 1: Recommended Gel and Buffer Systems for Protein Separation [9]
| Protein Size Range | Recommended Gel Chemistry | Recommended Running Buffer |
|---|---|---|
| 10 - 30 kDa | 4-12% acrylamide gradient Bis-Tris gel | MES |
| 31 - 150 kDa | 4-12% acrylamide gradient Bis-Tris gel | MOPS |
| > 150 kDa | 3-8% acrylamide gradient Tris-Acetate gel | Tris-Acetate |
Table 2: Key Solutions and Reagents for Western Blotting [21] [9] [6]
| Solution/Reagent | Function | Example Composition |
|---|---|---|
| Lysis Buffer (e.g., RIPA) | Extracts and solubilizes proteins from cells or tissues. | Detergent, salt, buffer, protease inhibitors. |
| SDS Sample Buffer | Denatures proteins and confers negative charge for electrophoresis. | Tris buffer, SDS, glycerol, bromophenol blue, DTT. |
| Running Buffer | Conducts current and maintains pH during electrophoresis. | Tris, glycine, SDS. |
| Transfer Buffer | Conducts current and facilitates protein migration from gel to membrane. | Tris, glycine, methanol. |
| Blocking Buffer | Covers membrane surface to prevent non-specific antibody binding. | 5% non-fat dry milk or BSA in TBST. |
| Wash Buffer (e.g., TBST) | Removes unbound antibodies and reagents between steps. | Tris-buffered saline with 0.1% Tween 20. |
Detection Methods and Analysis
The choice of detection method depends on the required sensitivity, available equipment, and whether the goal is qualitative or quantitative analysis.
Detection Modalities
- Chemiluminescent Detection: This is the most common method [8]. An enzyme-linked secondary antibody (e.g., HRP) catalyzes a substrate, producing light as a by-product. The light signal can be captured on X-ray film or with a CCD camera. It offers high sensitivity and a dynamic range suitable for many applications [25].
- Fluorescent Detection: This method uses secondary antibodies conjugated to fluorophores. The fluorophore is excited by a light source, and the emitted light is detected with a specialized scanner. Fluorescent detection is gaining popularity for quantitative work as it provides a stable signal, allows for multiplexing (detecting multiple proteins on the same blot), and has a wide linear dynamic range [12] [25].
- Colorimetric Detection: Enzyme-conjugated antibodies convert a chromogenic substrate into an insoluble colored precipitate on the membrane. While less sensitive and not quantitative, it is simple and requires no specialized equipment for visualization [25].
Qualitative vs. Quantitative Analysis
The analytical goal dictates the stringency of the experimental workflow.
- Qualitative Western Blotting: The primary objective is to answer a binary question: "Is the target protein present or absent?" [12]. This approach is used for verifying protein expression, confirming gene knockdown, or simple screening. The key concern is ensuring band specificity to avoid false positives, and normalization is not required [12].
- Quantitative Western Blotting: The goal is to measure and compare the relative abundance of a target protein across different samples [12]. This demands a more rigorous approach. The most critical principle is normalization using a loading control, typically a housekeeping protein (e.g., GAPDH, β-actin) that is constitutively expressed. The signal intensity of the target band is divided by that of the loading control to correct for variations in protein loading and transfer efficiency [12]. For accurate quantification, it is essential that the signal for both the target and control proteins falls within the linear dynamic range of the detection system to avoid saturation [12].
Current Standards and Publication Guidelines
A systematic assessment of over 500 scientific publications revealed that western blot figures and methods often omit essential details, limiting a reader's ability to evaluate or reproduce the results [7]. Adhering to best practices is therefore critical for scientific integrity.
Common Pitfalls in Reporting
An analysis of neuroscience and cell biology journals found that [7]:
- Over 90% of published western blots are cropped, and most do not provide source data in the supplement.
- Over 95% of blots lack a visible molecular weight marker.
- Approximately 30% of blots lack any molecular weight labels.
- Methods sections frequently omit the amount of protein loaded (55-78% of papers), blocking duration, and detailed antibody information (especially for secondary antibodies) [7].
Recommendations for Reproducible Western Blots
To ensure transparency and reproducibility, researchers should [7] [23]:
- Minimize Cropping: Provide uncropped images, preferably full-length, in the supplementary information to show the entire lane and any potential non-specific bands or protein multiplicity [7].
- Include Molecular Weight Markers: Always include the molecular weight marker in the blot image and label the key weights adjacent to the blot to confirm the target protein is at the expected size [7].
- Report Key Methodological Details: The methods section must include:
- The amount of protein loaded per lane [7].
- The blocking reagent, concentration, and duration [7].
- Complete antibody information: supplier, catalog number, RRID (Research Resource Identifier), and lot number if possible for both primary and secondary antibodies [7].
- Antibody dilution and incubation conditions [7].
- Provide Original Images: Many journals, including those in the Nature portfolio, now require unprocessed images of blots and gels to be published as Supplementary Information [23].
Table 3: Journal-Specific Publication Guidelines for Western Blots (2024) [23]
| Journal/Publisher | Key Image Requirements | Data Submission Notes |
|---|---|---|
| Cell Press | Color images: 300 DPI at final print size. Fluorescent blots in RGB. | Western blots should be submitted as separate files, not embedded in text. |
| Nature Portfolio | Requires original, unprocessed images of all gels and blots. | Unprocessed images must be published as Supplementary Information. |
| Science | Follows general guidelines for file type and resolution. | Avoids excessive cropping and manipulation; adjustments must be documented. |
| Wiley | Specific requirements for resolution and color mode vary by journal. | Check individual journal guidelines for accepted file formats and sizes. |
Applications in Research and Diagnostics
The western blot assay has a multitude of applications, from basic research to applied clinical diagnostics [8].
Research Applications
In basic and translational research, western blotting is used for:
- Measuring Protein Expression: Comparing relative protein levels between different samples, such as treated vs. untreated cells or diseased vs. healthy tissues [8] [12].
- Analyzing Post-Translational Modifications: Detecting specific modifications like phosphorylation, glycosylation, or cleavage using modification-specific antibodies.
- Verifying RNAi or CRISPR Results: Confirming the successful knockdown or knockout of a target protein at the protein level.
- Biomarker Measurement: Used in the drug development process to measure potential biomarkers [8].
Diagnostic Applications
Western blotting's high specificity makes it a valuable confirmatory diagnostic tool. Notable examples include:
- Lyme Disease Diagnosis: The CDC recommends a two-tiered testing protocol where a positive or equivocal ELISA is followed by a western blot test to detect antibodies against Borrelia burgdorferi proteins, which improves diagnostic specificity [8].
- HIV Confirmation: The western blot was historically used as a confirmatory test after a positive HIV screening to detect antibodies to specific viral antigens, though it has largely been replaced by other methods.
- Herpes Simplex Virus (HSV) Typing: Researchers have developed an HSV western blot test to determine the presence of antibodies against herpes simplex virus-2 (HSV-2), which is considered a gold standard [8].
The Scientist's Toolkit: Essential Research Reagents
Table 4: Key Research Reagent Solutions for Western Blotting
| Reagent/Material | Critical Function | Technical Notes |
|---|---|---|
| Protease Inhibitors | Prevents proteolytic degradation of target proteins during sample preparation. | Added fresh to lysis buffer. Essential for preserving protein integrity. |
| Pre-cast Gels | Provides consistent, reproducible protein separation without the need to pour gels. | Available in various percentages and gradients (e.g., 4-12% Bis-Tris). |
| Nitrocellulose/PVDF Membrane | Serves as the solid support for immobilized proteins during immunodetection. | PVDF requires pre-wetting in methanol. Nitrocellulose is more common. |
| Validated Primary Antibodies | Binds specifically to the protein of interest. The key determinant of specificity. | Knockout (KO)-validated antibodies are ideal to confirm specificity [25]. |
| HRP-Conjugated Secondary Antibodies | Binds to the primary antibody and produces an amplifiable signal for detection. | Species-specific. Cross-adsorbed antibodies reduce background. |
| Chemiluminescent Substrate | Generates light signal upon reaction with the enzyme-conjugated secondary antibody. | Choice of substrate (e.g., Pico vs. Femto) depends on target abundance. |
Mastering the Western Blot Protocol: A Step-by-Step Workflow from Sample to Signal
Within the framework of western blotting for detecting specific proteins, sample preparation is the foundational step upon which all subsequent results depend. The quality of protein extraction and preservation directly dictates the accuracy, reproducibility, and interpretability of data related to protein expression, post-translational modifications, and protein-protein interactions [27]. Effective preparation involves the strategic disruption of cellular membranes to release proteins while simultaneously mitigating the immediate and relentless activity of endogenous enzymes. Upon cell lysis, compartmentally contained proteases and phosphatases are unleashed, capable of mass protein degradation and dephosphorylation, which can rapidly obliterate experimental results [28]. Therefore, the dual strategy of selecting an appropriate lysis buffer and employing a robust regimen of enzyme inhibitors is not merely a recommendation but a critical requirement for successful western blot analysis, particularly in drug development where quantifying specific protein targets or their phosphorylated states is essential [29].
Core Components of a Lysis Buffer
A lysis buffer is a chemically engineered solution designed to disrupt cell membranes and solubilize proteins while maintaining their integrity for analysis. Its composition is a careful balance of components, each serving a specific function.
- Buffer System: Compounds like Tris-HCl or HEPES maintain a stable physiological pH (typically 7.0-7.6), preventing protein precipitation and instability that can occur outside this range [30] [17].
- Salts: Ionic salts such as Sodium Chloride (NaCl) maintain the ionic strength of the solution, which is necessary to disrupt molecular interactions within the cell membrane. However, excessively high salt concentrations can cause protein precipitation or electrophoresis artifacts [30].
- Chaotropic Agents/Detergents: These surfactants are pivotal for solubilizing proteins by binding to their hydrophobic regions. Detergents are categorized based on their properties [30]:
- Ionic (e.g., SDS, Sodium Deoxycholate): Strong, anionic detergents that efficiently solubilize membranes but denature proteins and disrupt protein-protein interactions.
- Non-ionic (e.g., Triton X-100, NP-40): Milder detergents that solubilize membranes while preserving native protein structures and interactions.
- Zwitterionic (e.g., CHAPS): Exhibit properties of both ionic and non-ionic detergents and are useful for preserving protein function.
- Reducing Agents: Chemicals like Dithiothreitol (DTT) or β-Mercaptoethanol (BME) disrupt disulfide bonds, ensuring proteins are in their monomeric form and preventing oxidation damage caused by cysteine residues [30] [31].
Table 1: Common Detergents Used in Lysis Buffers and Their Properties
| Detergent | Type | Strength | Key Applications and Notes |
|---|---|---|---|
| SDS (Sodium Dodecyl Sulfate) | Ionic | Harsh | Excellent for solubilizing difficult proteins (e.g., membrane-bound, nuclear); fully denatures proteins [27] [30]. |
| Sodium Deoxycholate | Ionic | Harsh | Often used in RIPA buffer; helps disrupt protein-protein interactions [32] [30]. |
| Triton X-100 / NP-40 | Non-ionic | Mild | Ideal for whole-cell extracts and membrane-bound proteins; preserves protein-protein interactions [32] [33] [17]. |
| CHAPS | Zwitterionic | Mild | Useful for extracting functional proteins with minimal denaturation [33]. |
| Tween-20 | Non-ionic | Mild | More commonly used in washing buffers, but can be found in some mild lysis formulations [30]. |
Selecting the Optimal Lysis Buffer
The selection of a lysis buffer is primarily guided by the subcellular location of the target protein and the required state of the protein (native or denatured) for downstream analysis.
Buffer Selection Based on Protein Localization
The following workflow diagram outlines the decision-making process for selecting the most appropriate lysis buffer based on the protein of interest's subcellular location and the experimental requirements.
The logic presented in the workflow is supported by consistent recommendations across multiple technical resources [32] [31] [17]. RIPA buffer, with its combination of non-ionic and ionic detergents (NP-40, deoxycholate, and SDS), is particularly effective for hard-to-solubilize proteins found in the nucleus, mitochondria, or membrane compartments [32] [30]. For cytoplasmic proteins, the milder Tris-HCl buffer may be sufficient, while NP-40 is an excellent all-rounder for whole-cell extracts and membrane proteins when a non-denaturing environment is desired [32] [17].
Comparison of Common Lysis Buffers
Table 2: Common Lysis Buffer Compositions and Applications
| Buffer | Key Components | Best For | Considerations |
|---|---|---|---|
| RIPA Buffer [32] [30] | 50 mM Tris-HCl (pH 7.4), 150 mM NaCl, 1% NP-40/Triton X-100, 0.5% Sodium Deoxycholate, 0.1% SDS, 1 mM EDTA | Nuclear, mitochondrial, and membrane-bound proteins; difficult-to-solubilize targets. | Harsh; can disrupt some protein-protein interactions. The gold standard for many western blotting applications [30]. |
| NP-40 Buffer [32] [17] | 50 mM Tris-HCl (pH 7.4-8.0), 150 mM NaCl, 1% NP-40 | Whole-cell extracts, membrane-bound proteins (under mild conditions). | Milder than RIPA; better for preserving protein-protein interactions. |
| Tris-HCl Buffer [31] [17] | 20 mM Tris-HCl (pH 7.5) | Cytoplasmic, soluble proteins. | Very mild; no detergents, so it will not solubilize membrane-bound proteins without mechanical disruption. |
| 1% SDS Buffer [27] | 10 mM Tris-HCl (pH 8.0), 1% SDS | Strong solubilization of all proteins, including complexes and aggregates. | Highly denaturing; not suitable for studies of native protein interactions. |
The Critical Role of Protease and Phosphatase Inhibitors
Cell lysis disrupts the careful compartmentalization of enzymes, leading to the unregulated activity of proteases and phosphatases. This can cause rapid protein degradation, altered protein function, and a misrepresentation of protein activation states (e.g., phosphorylation levels), ultimately compromising data integrity [28] [29]. Therefore, the use of inhibitors is not optional but essential.
- Proteases are hydrolase enzymes that cleave peptide bonds. They are categorized into serine, cysteine, aspartic, and metalloproteases based on their catalytic mechanism [28] [29].
- Phosphatases remove phosphate groups from serine, threonine, or tyrosine residues, reversing kinase activity. This dephosphorylation is a rapid and dominant process upon cell lysis, making phosphatase inhibitors absolutely critical for phosphoprotein analysis [28] [29].
Classes of Inhibitors and Their Use
Effective inhibition requires a cocktail of compounds targeting different enzyme classes. Inhibitors can be reversible (forming temporary bonds) or irreversible (forming permanent covalent bonds) [29].
Table 3: Essential Protease and Phosphatase Inhibitors
| Inhibitor | Target Enzyme(s) | Mechanism | Recommended Working Concentration |
|---|---|---|---|
| AEBSF [28] [29] | Serine Proteases | Irreversible | 0.2 - 1.0 mM |
| PMSF [31] [17] | Serine, Cysteine Proteases | Irreversible | 0.1 - 1.0 mM (1 mM is common) |
| Aprotinin [28] [17] | Serine Proteases | Reversible | 2 µg/mL (or 100-200 nM) |
| Leupeptin [28] [31] | Serine & Cysteine Proteases | Reversible | 5 - 100 µM |
| E-64 [28] | Cysteine Proteases | Irreversible | 1 - 20 µM |
| Pepstatin A [28] [31] | Aspartic Proteases | Reversible | 1 - 20 µM |
| EDTA [28] [17] | Metalloproteases | Reversible (Chelator) | 1 - 5 mM |
| Sodium Fluoride [32] [17] | Serine/Threonine Phosphatases, Acidic Phosphatases | Irreversible | 5 - 20 mM |
| Sodium Orthovanadate [32] [17] | Tyrosine Phosphatases, Alkaline Phosphatases | Irreversible | 1 - 100 mM |
| β-Glycerophosphate [28] | Serine/Threonine Phosphatases | Reversible | 1 - 100 mM |
Practical Application of Inhibitors
- Preparation and Storage: Most inhibitors are supplied as powders or stock solutions. They should be reconstituted according to the manufacturer's instructions or standard protocols [17]. Stock solutions should be aliquoted and stored at -20°C. PMSF is unstable in aqueous solutions and must be added fresh from an ethanol or methanol stock [31] [17].
- Creating a Cocktail: For comprehensive protection, a broad-spectrum cocktail is necessary. This can be achieved by using commercial tablets or ready-made cocktails (e.g., Thermo Fisher Pierce tablets [28] [34]) or by preparing a homemade mix. A typical homemade cocktail might include PMSF (1 mM), Leupeptin (5-10 µg/mL), Aprotinin (2 µg/mL), Pepstatin A (1 µg/mL), and EDTA (1-5 mM), along with phosphatase inhibitors like Sodium Fluoride (10 mM) and activated Sodium Orthovanadate (1 mM) for phosphoprotein studies [31] [17].
- Addition to Lysis Buffer: Inhibitors must be added to the ice-cold lysis buffer immediately before use to ensure maximum effectiveness [32] [34].
Detailed Experimental Protocols
Workflow for Cell Lysate Preparation
The following diagram illustrates the complete workflow for preparing protein lysates from adherent cell culture, incorporating the critical steps for maintaining sample integrity.
Protocol: Lysate Preparation from Adherent Cell Culture
Materials:
- Ice-cold Phosphate-Buffered Saline (PBS)
- Lysis Buffer (e.g., RIPA Buffer) [32] [30]
- Freshly added protease and phosphatase inhibitors [34]
- Cell scraper
- Refrigerated microcentrifuge
- BCA or Bradford Protein Assay Kit
Method:
- Preparation: Place the cell culture dish on ice. Prepare lysis buffer and add protease and phosphatase inhibitors immediately before use [34].
- Washing: Aspirate the culture medium and wash the cells gently but thoroughly with ice-cold PBS to remove residual serum and media proteins [27] [34].
- Lysis: Aspirate the PBS. Add ice-cold lysis buffer (e.g., ~1 mL per 10⁷ cells or a 100 mm plate) [34]. Scrape the cells adherent cells swiftly and transfer the cell suspension to a pre-cooled microcentrifuge tube.
- Incubation: Agitate the lysate gently for 30 minutes on ice to ensure complete lysis. Vortex the tube occasionally [31].
- Sonication (Optional but Recommended): Sonicate the lysate on ice using short bursts (e.g., 3-5 seconds) with intervals to prevent heating. This shears genomic DNA and reduces sample viscosity [32] [27].
- Clarification: Centrifuge the lysate at approximately 14,000 x g for 15 minutes at 4°C to pellet insoluble cell debris, lipids, and nuclei [34].
- Collection: Carefully transfer the supernatant (the clarified protein lysate) to a new, pre-chilled tube. Avoid disturbing the pellet.
- Quantification: Determine the protein concentration of the lysate using a compatible protein assay (e.g., BCA assay) following the manufacturer's protocol. The BCA assay is often preferred over Bradford as it is less affected by detergents common in lysis buffers [34].
- Preparation for Electrophoresis: Mix the lysate with an equal volume of 2X Laemmli sample buffer [31] [17]. For denatured SDS-PAGE, boil the samples at 95-100°C for 5 minutes [31]. Cool briefly, centrifuge, and load onto the gel.
Protocol: Lysate Preparation from Tissue Samples
Materials:
- Liquid nitrogen and mortar & pestle or electric homogenizer
- Lysis Buffer (e.g., RIPA or T-PER Reagent) with fresh inhibitors [34]
Method:
- Dissection and Homogenization: Dissect the tissue of interest on ice and quickly wash with ice-cold PBS to remove excess blood. Weigh the tissue.
- For tough tissues, flash-freeze the tissue in liquid nitrogen and pulverize it to a fine powder using a mortar and pestle pre-cooled with liquid nitrogen [27]. Transfer the powder to a tube containing ice-cold lysis buffer (~500 μL to 1 mL per 10 mg tissue) [32].
- Alternatively, for softer tissues, add the tissue directly to lysis buffer in a tube and homogenize thoroughly using an electric homogenizer (e.g., Polytron) on ice [32] [27].
- Incubation and Clarification: Incubate the homogenate on ice for 30 minutes with occasional vortexing. Centrifuge at 10,000 - 15,000 x g for 15-20 minutes at 4°C [32] [34].
- Collection and Storage: Transfer the supernatant to a new tube. Quantify the protein concentration, aliquot, and store at -80°C or prepare for immediate electrophoresis [32].
The Scientist's Toolkit: Essential Research Reagents
Table 4: Key Reagents for Western Blot Sample Preparation
| Reagent / Kit | Function / Application | Example Products / Components |
|---|---|---|
| RIPA Lysis Buffer [30] [34] | Gold-standard buffer for total protein extraction, especially for nuclear, mitochondrial, and membrane-bound proteins. | 25-50 mM Tris, 150 mM NaCl, 1% NP-40, 0.5% Deoxycholate, 0.1% SDS. |
| Protease/Phosphatase Inhibitor Cocktails [28] [34] | Ready-to-use mixtures for broad-spectrum inhibition of degradative enzymes; convenient and consistent. | Halt Protease and Phosphatase Inhibitor Cocktail (Thermo Fisher); Pierce Protease and Phosphatase Inhibitor Tablets. |
| BCA Protein Assay Kit [34] | Accurate method for determining protein concentration; compatible with samples containing up to 5% detergent. | Pierce BCA Protein Assay Kit. |
| SDS Sample Buffer (Laemmli Buffer) [31] [17] | Denatures proteins, adds negative charge, and provides dye for tracking electrophoresis progress. | 4% SDS, 10% 2-Mercaptoethanol, 20% Glycerol, 0.004% Bromophenol Blue, 0.125 M Tris-HCl (pH 6.8). |
| M-PER / T-PER Reagent [34] | Mild, ready-to-use lysis reagents for mammalian cells or tissues, designed to retain protein-protein interactions. | M-PER Mammalian Protein Extraction Reagent; T-PER Tissue Protein Extraction Reagent. |
Troubleshooting Common Sample Preparation Issues
- Low Protein Yield: Ensure complete lysis by optimizing buffer volume and incubation time. Verify that inhibitors are fresh and effective. For tissues, ensure thorough homogenization. Re-homogenize the pellet if necessary [27] [33].
- High Background or Smearing on Blot: This can indicate incomplete lysis, insufficient centrifugation, or protein degradation. Always centrifuge lysates to remove insoluble material and use fresh inhibitors. Overloading the gel can also cause smearing [35].
- Protein Degradation: Evident by the disappearance of bands or appearance of lower molecular weight bands. The most common cause is ineffective or missing protease inhibitors. Ensure inhibitors are added fresh to the lysis buffer, and all steps are performed quickly on ice [33] [31].
- Inconsistent Results Between Samples: Standardize all steps, including cell scraping, incubation times, and sonication power. Accurate protein quantification and equal loading are crucial [35] [31].
- Loss of Phosphorylation Signal: This is a direct result of inadequate phosphatase inhibition. Use a combination of serine/threonine (e.g., Sodium Fluoride) and tyrosine phosphatase (e.g., activated Sodium Orthovanadate) inhibitors. Ensure Sodium Orthovanadate is properly activated before use [28] [17].
In protein research, particularly in Western blotting for detecting specific proteins, accurate protein quantification is a foundational step. Determining the exact concentration of protein in a sample is critical for loading equal amounts across gel lanes, which is a prerequisite for obtaining reliable and interpretable results. Inconsistent protein loading can lead to erroneous conclusions about protein expression levels, compromising the entire experiment [35]. Among the various methods available, the Bicinchoninic Acid (BCA) and Bradford assays are the two most prevalent colorimetric techniques used in laboratories today. The choice between them is not trivial, as it depends heavily on the specific sample composition and the experimental requirements. This application note provides a detailed comparison of these assays and offers standardized protocols to integrate robust quantification into your Western blot workflow, ensuring that your data on specific protein detection is both accurate and reproducible.
Understanding Protein Quantification Assays
BCA (Bicinchoninic Acid) Assay
The BCA assay is a two-step, copper-based method for total protein quantification. In the first step, proteins reduce copper ions (Cu²⁺ to Cu⁺) under alkaline conditions in a reaction known as the biuret reaction. This step involves peptide bonds within the protein structure [36] [37]. In the second step, bicinchoninic acid (BCA) reagent chelates the reduced cuprous ions (Cu⁺), forming a stable, purple-colored complex that exhibits a strong absorbance maximum at 562 nm [36] [38]. The intensity of the purple color is proportional to the protein concentration in the sample.
Key Advantages: A major strength of the BCA assay is its high tolerance to detergents, making it suitable for samples lysed with surfactants like SDS [36] [37]. It also demonstrates greater protein-to-protein uniformity compared to the Bradford assay, meaning the color response varies less between different proteins, leading to more consistent results [37] [39]. Furthermore, it provides a linear response curve over a wide dynamic range [37].
Key Limitations: The assay is susceptible to interference from reducing agents (e.g., DTT, β-mercaptoethanol) and chelating agents (e.g., EDTA), which can disrupt the copper reduction reaction [37] [38]. It also requires a longer incubation time than the Bradford assay, typically 30 minutes to 2 hours [36] [39].
Bradford Assay
The Bradford assay is a single-step, dye-binding method that is rapid and easy to perform. It relies on the shift in absorbance of Coomassie Brilliant Blue G-250 dye upon binding to proteins. In its free, cationic form, the dye is reddish-brown with an absorbance maximum at 465 nm. When it binds primarily to basic amino acids (arginine, lysine) and aromatic residues in proteins, it stabilizes the anionic, blue form of the dye, which has an absorbance maximum at 595 nm [36] [40]. The amount of blue complex formed is proportional to the protein concentration.
Key Advantages: The primary advantage of the Bradford assay is its speed; the dye-protein binding is rapid, and results can be obtained in about 5-10 minutes [36] [38]. It is also compatible with reducing agents, which do not interfere with the dye-binding mechanism [38]. The assay is generally more sensitive than the BCA assay, detecting concentrations as low as 1 µg/mL [36].
Key Limitations: A significant drawback is its sensitivity to detergents. Common surfactants like SDS and Triton X-100 can cause precipitation and interfere with the assay [36] [38]. It also shows high protein-to-protein variation due to its differential binding to specific amino acids, making the choice of a matching standard critical [37] [39].
Comparison of BCA and Bradford Assays
The table below provides a direct, quantitative comparison of the two assays to guide your selection.
Table 1: Comprehensive Comparison of BCA and Bradford Protein Quantification Assays
| Feature | BCA Assay | Bradford Assay |
|---|---|---|
| Fundamental Principle | Copper reduction & BCA chelation [36] [37] | Coomassie dye-binding shift [36] [40] |
| Absorbance Maximum | 562 nm [36] [37] | 595 nm [36] [40] |
| Sensitivity Range | 20–2000 µg/mL (standard); 0.5–20 µg/mL (micro) [37] | 1–20 µg/mL [36] |
| Dynamic Range | Broad [36] [37] | Narrower [36] |
| Assay Time | 30 min - 2 hours [36] [39] | 5–10 minutes [36] |
| Protein-to-Protein Uniformity | More consistent [36] [37] | High variability [36] [39] |
| Compatibility with Detergents | High tolerance [36] [37] | Low tolerance; causes interference [36] [38] |
| Compatibility with Reducing Agents | Low tolerance; causes interference [37] [38] | High tolerance [38] |
| Ideal Workflow | Samples with detergents; accurate quantification across proteins [36] | Rapid screening; educational labs [36] |
Assay Selection Workflow
The following diagram illustrates the decision-making process for selecting the appropriate protein quantification assay based on your sample and experimental needs.
Detailed Experimental Protocols
BCA Assay Protocol (Standard Tube Method)
This protocol is adapted for a standard curve using Bovine Serum Albumin (BSA) and is designed for a total volume of 1 mL per assay tube [37].
Research Reagent Solutions:
- Reagent A: Sodium carbonate, sodium bicarbonate, bicinchoninic acid, and sodium tartrate in an alkaline buffer [37].
- Reagent B: 4% copper sulfate solution [37].
- BCA Working Reagent (WR): Mix 50 parts of Reagent A with 1 part of Reagent B (50:1 ratio). Prepare fresh and use the same day.
- Protein Standard: Prepare a 2 mg/mL BSA standard in the same buffer as your samples. Serially dilute to create standards covering a range from 0 to 2000 µg/mL.
- Unknown Protein Samples: Prepare samples in a buffer compatible with the assay. If necessary, dilute samples to fit within the standard curve's linear range.
Procedure:
- Prepare Standard Curve: Pipette a known volume (e.g., 100 µL) of each BSA standard and unknown sample into clean test tubes or a 96-well microplate. Include a blank with buffer only.
- Add Working Reagent: Add 1 mL (or a proportional volume for microplate) of BCA WR to each tube and mix thoroughly by vortexing or pipetting.
- Incubate: Cover the tubes and incubate at 37°C for 30 minutes. Alternatively, incubation can be performed at room temperature for 2 hours, or at 60°C for 30 minutes for enhanced sensitivity [37].
- Cool and Measure: Allow all tubes to cool to room temperature. Measure the absorbance of each tube at 562 nm against the blank using a spectrophotometer or plate reader.
- Data Analysis: Plot the absorbance values of the standards against their known concentrations to generate a standard curve. Use the linear equation from the curve to calculate the protein concentration of the unknown samples.
Bradford Assay Protocol (Standard Tube Method)
This protocol uses Coomassie dye reagent and is optimized for speed [36] [39].
Research Reagent Solutions:
- Coomassie Dye Reagent: Commercially available Coomassie Brilliant Blue G-250 reagent.
- Protein Standard: Prepare a 1 mg/mL BSA or gamma-globulin standard. Serially dilute to create standards covering a range from 0 to 20 µg/mL.
- Unknown Protein Samples: Prepare and dilute samples as needed.
Procedure:
- Prepare Standard Curve: Pipette a known volume (e.g., 100 µL) of each protein standard and unknown sample into clean test tubes. Include a blank.
- Add Dye Reagent: Add 1 mL of Coomassie dye reagent to each tube. Mix immediately and thoroughly. The color change from brown to blue is rapid.
- Incubate: Incubate the mixture at room temperature for at least 5 minutes. The color is stable for up to one hour [38].
- Measure: Measure the absorbance of each tube at 595 nm against the blank within 60 minutes.
- Data Analysis: Generate a standard curve and calculate the unknown sample concentrations as described for the BCA assay.
Integration with Western Blot Workflow
Accurate protein quantification is the critical first step in a reliable Western blotting experiment. The entire process, from sample preparation to data analysis, is outlined below.
Following quantification, the Western blot protocol proceeds as follows:
- Sample Preparation: Lyse cells or tissues in an appropriate lysis buffer (e.g., RIPA buffer) containing protease and phosphatase inhibitors [41] [21]. Centrifuge to remove insoluble debris.
- Quantification & Normalization: Determine protein concentration using the BCA or Bradford assay. Normalize all samples to the same concentration using lysis buffer. Then, mix the normalized protein lysate with SDS sample buffer (e.g., Laemmli buffer) containing a reducing agent like DTT [41] [21].
- Electrophoresis and Transfer: Boil the samples, load equal amounts of total protein (e.g., 20-80 µg) onto an SDS-PAGE gel, and separate by molecular weight [21] [5]. Transfer the proteins from the gel to a nitrocellulose or PVDF membrane [42] [21].
- Immunodetection: Block the membrane with 5% non-fat milk or BSA in TBST to prevent non-specific antibody binding [21]. Incubate sequentially with a target-specific primary antibody (overnight at 4°C) and an HRP-conjugated secondary antibody (1 hour at room temperature), with thorough washes in between [41] [21].
- Detection & Quantification: Detect the signal using a chemiluminescent substrate and image with a digital imager or X-ray film [21]. For quantification, use densitometry software (e.g., ImageJ, ImageLab) to measure band intensities. Normalization of the target protein signal to a loading control (e.g., housekeeping proteins like Actin or GAPDH, or total protein stain) is essential for accurate interpretation of expression levels [35] [5].
Troubleshooting and Best Practices
- Sample Interference: Always be aware of your sample buffer composition. If your lysis buffer contains detergents, the BCA assay is preferred. If it contains reducing agents, the Bradford assay may be more suitable, or a specialized BCA kit compatible with reducing agents can be used [37] [38].
- Standard Selection: The protein used for the standard curve can affect the result, especially for the Bradford assay. Where possible, use a standard protein that is similar to your protein of interest (e.g., BSA for serum proteins, gamma-globulin for antibodies) [39].
- Linearity is Key: Ensure that the absorbance values of your unknown samples fall within the linear range of your standard curve. Samples outside this range must be diluted (if too concentrated) or concentrated (if too dilute) and re-assayed [5].
- Verify Linearity with Digital Detection: When quantifying Western blots, be aware that film-based detection has a very limited linear dynamic range and can easily become saturated, leading to inaccurate quantification. Using a digital imager provides a wider linear range and more reliable quantitative data [5].
Within the framework of research utilizing Western blotting for the detection of specific proteins, SDS-PAGE (Sodium Dodecyl Sulfate-Polyacrylamide Gel Electrophoresis) serves as the critical first step. The reliability of the final data is profoundly dependent on the quality of the initial protein separation. This protocol focuses on two foundational aspects of optimization: selecting the appropriate gel percentage for the target protein's molecular weight and establishing correct electrophoresis conditions to achieve sharp, well-resolved bands. Proper optimization minimizes artifacts such as smiling bands, streaking, or poor resolution, thereby ensuring that the subsequent transfer and detection phases are built upon a solid foundation [43] [44] [45].
Principles of SDS-PAGE Optimization
In SDS-PAGE, proteins are denatured and coated with the anionic detergent SDS, conferring a uniform negative charge. This allows separation to occur primarily based on molecular weight as proteins migrate through a polyacrylamide gel matrix under an electric field [45]. The pore size of this matrix, determined by the concentration of acrylamide, is the key variable governing which protein sizes can be effectively resolved [46]. Meanwhile, the electrophoresis conditions—operating in constant voltage, current, or power mode—control the speed of separation and the generation of heat, which is a major source of band distortion if not properly managed [43]. The overarching goal is to choose a gel percentage that provides optimal sieving for the target protein and to apply an electric field that yields rapid, uniform migration without generating excessive heat.
Optimization of Gel Percentage
The selection of the correct polyacrylamide concentration is the most decisive factor in determining the resolution of proteins. A higher acrylamide percentage creates a tighter meshwork of smaller pores, ideal for resolving low molecular weight proteins. Conversely, a lower percentage creates larger pores, allowing high molecular weight proteins to migrate effectively [46] [45].
Table 1: Guide to Gel Percentage Selection Based on Protein Size
| Target Protein Size (kDa) | Recommended Acrylamide Percentage (%) |
|---|---|
| 4 - 40 | 20 |
| 12 - 45 | 15 |
| 10 - 70 | 12.5 |
| 15 - 100 | 10 |
| 25 - 200 | 8 |
For projects involving proteins of unknown size or a wide range of sizes, gradient gels (e.g., 4-20%) are highly recommended. These gels provide a continuous gradient of pore sizes, sharpening protein bands and allowing a broad range of molecular weights to be resolved on a single gel [46] [44] [45]. It is also standard practice to use a two-part gel system: a low-percentage stacking gel (typically ~4%) that concentrates all protein samples into a sharp starting band, and a higher-percentage resolving gel (varying from 7% to 20%) where the actual size-based separation occurs [46] [48].
Optimization of Electrophoresis Conditions
The parameters for running the gel—voltage, current, and power—directly impact the quality of the separation and the integrity of the gel itself. Heat generation is a critical concern, as excessive heat can cause gel warping and the characteristic "smiling" bands where outer lanes curve upwards [43] [44].
Choosing Constant Voltage, Current, or Power
Most modern power supplies allow the user to set one parameter constant.
- Constant Voltage (V): This is a common and often preferred method. As the run progresses and resistance increases, the current will decrease, leading to a natural reduction in heat production later in the run. This can help prevent smiling bands [43].
- Constant Current (I): Under constant current, the voltage must increase to overcome rising resistance, which can lead to increased heat generation towards the end of the run. If using this mode, extra cooling is essential [43].
- Constant Power (W): Power is the product of voltage and current. This setting attempts to limit heat production while maintaining migration speed, but can be complex to optimize as both variables can change [43].
Recommended Running Parameters
A two-stage running protocol is generally most effective:
- Stacking Phase: Begin the run at a low voltage, typically 50-60 V, for about 30 minutes. This allows the proteins to migrate slowly through the stacking gel, forming a tight, sharp band before entering the resolving gel [43] [44].
- Resolving Phase: Once the proteins enter the resolving gel, the voltage can be increased. A general rule is 5-15 V per centimeter of gel length. For standard mini-gels, this typically translates to 100-150 V for 40-60 minutes, or until the dye front reaches the bottom of the gel [43] [44] [48]. Larger gels may require voltages approaching 200-300 V [43].
Table 2: Troubleshooting Common SDS-PAGE Issues
| Problem | Potential Causes | Solutions |
|---|---|---|
| Smiling Bands | Excessive heat during electrophoresis. | Use constant voltage mode; submerge gel apparatus in an ice bath or run in a cold room; ensure buffer is stirred with a magnetic stirrer [43] [44]. |
| Streaky Bands | Protein overload; incomplete denaturation; sample debris. | Reduce protein load (e.g., to 30 μg/lane for complex lysates); ensure samples are heated at 95°C for 5 min and centrifuged before loading [44] [49]. |
| Poor Resolution | Incorrect gel percentage; gel run too fast or too slow. | Choose gel % according to Table 1; ensure running time is optimized so dye front just reaches bottom [44] [45]. |
| Incomplete Separation | Insufficient run time; incorrect buffer composition. | Allow sufficient run time; check that SDS running buffer is correctly prepared and not exhausted [45]. |
Detailed SDS-PAGE Protocol
Recipe for Casting a 10% Resolving Gel
This recipe is for one mini-gel (approximately 5 mL volume). Adjust volumes proportionally for multiple gels.
| Component | Amount for 10% Resolving Gel | Amount for Stacking Gel |
|---|---|---|
| Acrylamide (30%) | 1.25 mL | 0.25 mL |
| Separating Buffer (1.5 M Tris, pH 8.8) | 1.25 mL | - |
| Stacking Buffer (0.5 M Tris, pH 6.8) | - | 0.625 mL |
| SDS (10% w/v) | 50 μL | 25 μL |
| Deionized Water | 2.5 mL | 1.625 mL |
| 10% Ammonium Persulfate (APS) | 50 μL | 25 μL |
| TEMED | 5 μL | 2.5 μL |
| Total Volume | ~5 mL | ~2.5 mL |
[48] [47] Note: APS and TEMED are polymerization catalysts and should be added last, immediately before pouring the gel.
Gel Casting and Electrophoresis Workflow
The following diagram outlines the key steps in preparing and running an SDS-PAGE gel.
Step-by-Step Procedure
- Assemble Casting Apparatus: Clean and assemble glass plates according to manufacturer's instructions to form a leak-proof cassette [47].
- Prepare Resolving Gel: Combine all components for the resolving gel except APS and TEMED in a small beaker. Add APS and TEMED last, mix gently, and pour the solution immediately into the gel cassette. Leave space for the stacking gel. Carefully overlay the gel with isopropanol or water to ensure a flat, even surface. Allow 30-45 minutes to polymerize completely [47].
- Prepare Stacking Gel: After polymerization, pour off the isopropanol, rinse the top of the gel with water, and wick away excess liquid. Prepare the stacking gel mixture, add APS and TEMED, and pour it on top of the resolved gel. Immediately insert a clean comb, avoiding air bubbles. Allow to polymerize for 20-30 minutes [47].
- Prepare Samples: Dilute protein samples in Laemmli sample buffer. Heat denature at 95°C for 5 minutes to fully unfold proteins. Centrifuge at maximum speed for 2-3 minutes to pellet any insoluble debris [44] [48].
- Load and Run Gel: Place the polymerized gel into the electrophoresis chamber and fill with running buffer. Carefully remove the comb. Load equal amounts of protein (e.g., 10-50 μg per lane for a complex lysate) and include an appropriate molecular weight marker [44] [48] [49]. Run the gel using the two-stage voltage protocol outlined in Section 4.2.
The Scientist's Toolkit: Essential Reagents and Materials
Table 3: Key Research Reagent Solutions for SDS-PAGE
| Reagent / Material | Function / Purpose |
|---|---|
| Acrylamide/Bis-acrylamide (30% stock) | Forms the polyacrylamide gel matrix that acts as a molecular sieve. The ratio of acrylamide to bis-acrylamide determines the pore size [46] [47]. |
| Tris-HCl Buffer (pH 6.8 & 8.8) | Provides the appropriate pH environment for gel polymerization and protein separation. Stacking gel (pH 6.8) and resolving gel (pH 8.8) create a discontinuous system [48] [47]. |
| Ammonium Persulfate (APS) & TEMED | Catalysts for the free-radical polymerization of acrylamide. TEMED should be added last to initiate the reaction [46] [47]. |
| SDS (Sodium Dodecyl Sulfate) | Anionic detergent that denatures proteins and confers a uniform negative charge, allowing separation based primarily on molecular weight [45]. |
| Laemmli Sample Buffer | Contains SDS, glycerol, Tris, and a tracking dye. Prepares the protein sample for electrophoresis by denaturing it and providing density for gel loading [48]. |
| Tris-Glycine-SDS Running Buffer | The conducting medium for electrophoresis. Provides the ions necessary to carry the current and maintains the pH required for protein migration [48]. |
| DTT or β-Mercaptoethanol (in reducing buffer) | Reducing agents that break disulfide bonds in proteins, ensuring complete denaturation and linearization [44]. |
Concluding Remarks
Optimizing SDS-PAGE by meticulously selecting the gel percentage and controlling electrophoresis conditions is non-negotiable for obtaining publication-quality Western blot data. A well-optimized gel separation, characterized by sharp, straight bands, is the prerequisite for a successful transfer and specific detection. The protocols and guidelines provided here serve as a robust starting point. However, researchers should be prepared to engage in iterative refinement, adjusting parameters like protein load, antibody concentration, and transfer conditions to achieve the highest signal-to-noise ratio for their specific protein of interest [49] [50].
Protein transfer is a critical step in western blot analysis that involves the electrophoretic movement of proteins separated by polyacrylamide gel electrophoresis (SDS-PAGE) to a solid support matrix, typically a nitrocellulose or polyvinylidene difluoride (PVDF) membrane [51]. This immobilization process facilitates subsequent protein detection using specific antibodies directed against target proteins of interest. Since its introduction by Towbin et al. in 1979, western blotting has evolved into a fundamental technique for protein analysis, capable of generating both qualitative and semi-quantitative data regarding protein expression in complex biological samples [51] [9].
The efficiency of protein transfer significantly impacts the quality and reproducibility of western blot results, affecting parameters such as detection sensitivity, signal linearity, and quantitative accuracy. Transfer efficiency can be influenced by multiple factors including gel chemistry and thickness, protein molecular weight, membrane type, transfer buffer composition, and the transfer method employed [51]. This application note provides a comprehensive comparison of the three primary electroblotting methods—wet, semi-dry, and dry transfer systems—along with detailed protocols optimized for research and drug development applications.
Protein Transfer Fundamentals
Principles of Electrophoretic Transfer
Electroblotting methods utilize the electrophoretic mobility of proteins to move them out of the gel matrix onto a membrane surface. The fundamental principle involves placing a protein-containing polyacrylamide gel in direct contact with a protein-binding membrane, sandwiching this assembly between electrodes, and applying an electric field [51]. Under this field, negatively charged proteins (due to SDS binding) migrate toward the positively charged anode, moving out of the gel and onto the membrane surface where they become tightly bound through hydrophobic interactions and other non-covalent binding forces [51].
The resulting membrane represents a replica of the protein separation pattern originally present in the polyacrylamide gel, enabling subsequent probing with antibodies for specific detection. The transfer process must achieve several key objectives: high efficiency for proteins across a broad molecular weight range, minimal band distortion, preservation of protein antigenicity, and reproducibility between experiments [51] [4].
Membrane Selection
The choice of transfer membrane significantly impacts binding capacity, background noise, and detection compatibility. The two primary membrane types used in western blotting are nitrocellulose and PVDF. Nitrocellulose membranes offer high affinity for proteins and straightforward handling characteristics, with pore sizes typically ranging from 0.2-0.45 μm [51]. PVDF membranes provide superior mechanical strength and higher binding capacity, particularly for low molecular weight proteins, but require pre-wetting in methanol or ethanol before use [22]. For fluorescent detection, special low-fluorescence PVDF membranes are recommended to minimize background autofluorescence [52].
Comparative Analysis of Transfer Methods
The three primary electroblotting methods—wet, semi-dry, and dry transfer—differ significantly in their instrumentation requirements, transfer efficiency, and suitability for different experimental applications. The table below provides a comprehensive comparison of their key characteristics:
Table 1: Comparison of Western Blot Transfer Methods
| Parameter | Wet Transfer | Semi-Dry Transfer | Dry Transfer |
|---|---|---|---|
| Transfer Time | 30-120 minutes [51] | 7-10 minutes [51] | As few as 3 minutes [51] |
| Buffer Requirements | Requires large volume (~1000 mL) of methanol-containing buffer [51] | Moderate volume (~200 mL) of methanol-free buffers [51] | No buffer required [51] |
| Throughput | High (multiple gels possible) [51] | High [51] | High [51] |
| Transfer Efficiency | Excellent for broad molecular weight range (14-116 kDa) [51] | Good, but may be lower for high molecular weight proteins (>300 kDa) [51] | Excellent, comparable to wet transfer [51] |
| Ease of Use | Moderate (extensive setup and cleanup) [51] | High (simpler setup) [51] | High (minimal setup and cleanup) [51] |
| Cooling Requirements | Often required for extended transfers [51] | Generally not required | Not required |
| Special Considerations | Risk of protein "stripping" or "blow-through" for low molecular weight proteins with extended transfer times [51] | Filter papers and membrane must be precisely cut to gel dimensions without overhang [51] | Requires specialized, pre-assembled transfer stacks [51] |
Application-Specific Recommendations
Wet transfer is particularly well-suited for difficult protein transfers, including high molecular weight proteins (>300 kDa) and transmembrane proteins that may require extended transfer times or specialized buffer conditions [51]. The method's compatibility with various buffer systems and ability to handle multiple gels simultaneously make it ideal for high-throughput applications where transfer consistency is paramount.
Semi-dry transfer offers an excellent balance between transfer quality and convenience, making it appropriate for routine applications with most protein types except very high molecular weight targets [51]. The reduced buffer volumes decrease waste disposal concerns, particularly when working with methanol-containing buffers.
Dry transfer systems provide the highest speed and convenience, with complete transfer achievable in as little as 3-7 minutes [51]. These systems are particularly valuable for time-sensitive experiments and laboratories seeking to minimize chemical usage and disposal. The specialized transfer stacks incorporate buffer components within a gel-like matrix, eliminating the need for liquid transfer buffers [51].
Experimental Protocols
General Transfer Buffer Formulations
Table 2: Common Transfer Buffer Compositions
| Buffer Type | Composition | Applications |
|---|---|---|
| Towbin Buffer | 25 mM Tris, 192 mM glycine, 20% methanol, pH 8.3 [51] | Standard wet transfer for most proteins |
| Methanol-Free Buffer | 25 mM Tris, 192 mM glycine, 0.1% SDS [51] | Semi-dry transfer; improves transfer of high molecular weight proteins |
| Bjerrum Buffer | 48 mM Tris, 39 mM glycine, 20% methanol, 0.0375% SDS [51] | Enhanced elution of high molecular weight proteins |
| Ethanol-Based Buffer | Traditional formulations with methanol replaced by ethanol [53] | Reduced toxicity while maintaining transfer efficiency |
Wet Transfer Protocol
Materials Required:
- Transfer apparatus (tank system)
- Transfer buffer (e.g., Towbin buffer: 25 mM Tris, 192 mM glycine, 20% methanol, pH 8.3)
- Membrane (nitrocellulose or PVDF)
- Filter paper
- Fiber pads or sponges
- Cooling unit or ice bath (for high-intensity transfers)
Procedure:
- Gel Equilibration: Following electrophoresis, carefully open the gel cassette and remove the gel. Equilibrate the gel in transfer buffer for 15-30 minutes to remove electrophoresis salts and prevent transfer artifacts [51].
Membrane Preparation: For nitrocellulose membranes, hydrate in transfer buffer for 5 minutes. For PVDF membranes, pre-wet in 100% methanol for 15 seconds, then hydrate in transfer buffer for 5 minutes [22].
Sandwich Assembly: On the cassette, assemble the transfer sandwich in the following order:
- Cathode core (+)
- Fiber pad/sponge
- Filter paper
- Gel
- Membrane
- Filter paper
- Fiber pad/sponge
- Anode core (-) [51] [22]
Ensure exact alignment of all components and carefully roll out any air bubbles between layers using a glass tube or roller, as trapped air will prevent protein transfer at those locations.
Transfer Process: Place the assembled cassette into the transfer tank filled with pre-chilled transfer buffer. For standard transfers, apply constant voltage (25-30 V) for 1-2 hours or constant current (0.1-1 A) overnight [51]. For high-intensity transfers, use higher voltage (up to 200 V) or current (up to 1.6 A) with cooling for 30-60 minutes [51].
Post-Transfer Processing: Following transfer, disassemble the sandwich and process the membrane for protein detection. To verify transfer efficiency, membranes can be briefly stained with Ponceau S or commercial total protein stains before proceeding to blocking steps [4].
Semi-Dry Transfer Protocol
Materials Required:
- Semi-dry transfer apparatus
- Transfer buffer (typically methanol-free)
- Membrane (nitrocellulose or PVDF)
- Extra-thick filter paper (approximately 3 mm thickness)
Procedure:
- Gel and Membrane Preparation: Cut the membrane and filter paper to the exact dimensions of the gel without overhang. Equilibrate the gel in transfer buffer for 10-15 minutes. Pre-wet PVDF membranes in methanol followed by transfer buffer; hydrate nitrocellulose directly in transfer buffer [51].
Sandwich Assembly: Soak the filter papers in transfer buffer. On the anode plate, assemble the transfer sandwich in the following order:
- Pre-wetted filter paper (2-3 sheets)
- Membrane
- Gel
- Pre-wetted filter paper (2-3 sheets) [51]
Ensure precise alignment and carefully roll out air bubbles as described in the wet transfer protocol.
Transfer Process: Close the apparatus with the cathode plate and connect to the power supply. Apply constant current (0.1-0.4 A) or voltage (10-25 V) for 30-60 minutes [51]. For rapid transfers, specialized systems can complete transfer in 5-10 minutes using optimized buffers and higher current settings [51].
Post-Transfer Processing: Disassemble the apparatus and process the membrane for detection as described in the wet transfer protocol.
Dry Transfer Protocol
Materials Required:
- Dry transfer system (e.g., Invitrogen iBlot system)
- Pre-assembled dry transfer stacks
- Membrane (system-specific compatible formats)
Procedure:
- System Setup: Place the bottom stack (anode) on the blotting base with the silver electrodes facing down [51].
Gel and Membrane Preparation: Following electrophoresis, carefully open the gel cassette. Place the membrane on the bottom stack, followed by the gel, ensuring complete contact without air bubbles.
Transfer Stack Completion: Place the top stack (cathode) over the gel with gold electrodes facing up, completing the transfer sandwich [51].
Transfer Process: Close the system lid and initiate the pre-programmed transfer protocol. Transfer times typically range from 3-7 minutes depending on the protein targets and system settings [51].
Post-Transfer Processing: Following transfer, disassemble the stack and process the membrane for detection as previously described.
Visualization of Transfer Workflows
The Scientist's Toolkit: Essential Research Reagents and Materials
Table 3: Essential Materials for Protein Transfer Experiments
| Item | Function | Selection Criteria |
|---|---|---|
| Transfer Membranes | Immobilize transferred proteins for antibody probing [51] | Nitrocellulose: general use; PVDF: high strength, low fluorescence variants for fluorescence detection [52] |
| Transfer Buffers | Conduct current and maintain protein stability during transfer [51] | Methanol-containing for standard proteins; SDS-added for high MW proteins; ethanol-based for reduced toxicity [51] [53] |
| Filter Papers | Create uniform contact between gel and membrane [22] | High wet strength, consistent thickness; extra-thick for semi-dry (3mm) [51] |
| Molecular Weight Markers | Monitor transfer efficiency and determine target protein size [9] | Prestained for transfer visualization; fluorescent for multiplex detection [22] |
| Protein Stains | Verify transfer efficiency and normalize data [13] [4] | Ponceau S for reversible staining; fluorescent total protein stains for normalization [4] |
| Transfer Apparatus | Provide controlled electric field for protein migration [51] | Tank systems for wet transfer; plate systems for semi-dry; dedicated instruments for dry transfer [51] |
Optimization Strategies for Quantitative Western Blotting
Ensuring Quantitative Transfer
For quantitative western blotting applications, particularly those intended for publication in high-impact journals, several optimization strategies are essential. Total protein normalization (TPN) has emerged as the preferred normalization method over traditional housekeeping proteins (HKPs) due to its superior accuracy and reduced variability [13]. TPN can be achieved through total protein staining of membranes using fluorescent dyes or specialized labeling reagents that do not interfere with subsequent immunodetection [13] [4].
The linear dynamic range for each target protein should be empirically determined by running a dilution series of pooled samples and plotting signal intensity against protein load [18]. This approach identifies the optimal loading concentration that falls within the quantitative range, avoiding both undersaturation and oversaturation of detection signals [4] [18]. Recent studies directly comparing fluorescence and chemiluminescence detection have demonstrated that fluorescent detection provides wider linear dynamic range and better precision for quantitative applications, while chemiluminescence offers higher sensitivity for low-abundance targets [4].
Troubleshooting Common Transfer Issues
Inefficient transfer of high molecular weight proteins can be addressed by incorporating SDS (0.0375-0.1%) in the transfer buffer, extending transfer times, using lower percentage gels, or employing specialized high molecular weight transfer protocols [51] [9]. Incomplete transfer or blotching often results from air bubbles trapped between gel and membrane; careful rolling during sandwich assembly is essential. Protein "blow-through" (loss of low molecular weight proteins through the membrane) can be minimized by reducing transfer time, using membranes with smaller pore sizes (0.2 μm), or adding methanol to the transfer buffer to enhance protein retention [51].
The selection of an appropriate protein transfer method represents a critical decision point in the western blot workflow that significantly impacts data quality, experimental throughput, and operational convenience. Wet transfer systems remain the gold standard for challenging applications involving high molecular weight proteins or when maximum transfer flexibility is required. Semi-dry transfer offers an excellent compromise between performance and convenience for routine applications, while dry transfer systems provide unprecedented speed and simplicity for high-throughput environments. By understanding the principles, advantages, and limitations of each transfer method, researchers can optimize their western blotting protocols to generate publication-quality data that meets the increasingly stringent requirements of modern scientific journals.
Within the broader thesis on Western blotting for detecting specific proteins, the stages of blocking, antibody incubation, and detection are critical for achieving specific, sensitive, and reproducible results. This protocol details the methodologies for these key steps, focusing on a direct comparison between the widely used chemiluminescence and the increasingly adopted fluorescence detection. The selection of an appropriate detection method significantly impacts the quantitative capacity, multiplexing potential, and overall success of protein analysis in research and drug development [54] [55].
Core Principles and Key Definitions
Blocking is a critical preparatory step that involves incubating the membrane with a protein solution (e.g., BSA or non-fat dry milk) to cover any remaining binding sites on the membrane. This prevents antibodies from attaching non-specifically, thereby reducing background noise and enhancing the signal-to-noise ratio for the specific target protein [21].
Antibody Incubation is the process of probing the membrane with antibodies to identify the protein of interest. It typically involves two steps:
- Primary Antibody Incubation: The membrane is incubated with an antibody specifically raised against the target protein [21].
- Secondary Antibody Incubation: The membrane is incubated with a labeled antibody that recognizes and binds to the primary antibody. This secondary antibody is conjugated to a reporter molecule that enables detection [56].
Detection refers to the method of visualizing the bound antibody-protein complex. The choice between chemiluminescence and fluorescence hinges on the reporter molecule conjugated to the secondary antibody [54].
Detection Methodologies: A Quantitative Comparison
The two primary detection methodologies, chemiluminescence and fluorescence, offer distinct advantages and limitations. The choice between them depends on experimental goals, such as the need for sensitivity, quantification, or multiplexing.
Table 1: Comparison of Western Blot Detection Methods
| Parameter | Chemiluminescence | Fluorescence |
|---|---|---|
| Principle | Enzyme-mediated light emission [55] | Direct light emission from fluorophores [54] |
| Sensitivity | High (can detect femtogram ranges) [55] | Generally high (picogram range), but can be lower than chemiluminescence in some cases [54] [55] |
| Dynamic Range | Narrow, non-linear (especially with film) [54] | Wide and linear, superior for quantification [54] [55] |
| Multiplexing | Not possible without stripping and re-probing [54] | Yes, with multiple fluorophores [56] [55] |
| Quantitation | Semi-quantitative; enzyme kinetics can vary [55] | Highly quantitative; signal is directly proportional to fluorophore amount [55] |
| Key Reagents | HRP or AP enzyme-conjugated antibodies, chemiluminescent substrate (e.g., luminol) [55] | Fluorophore-conjugated antibodies (e.g., Alexa Fluor dyes) [56] |
| Data Capture | X-ray film or CCD/CMOS camera [54] [55] | Laser or LED-based imaging system [54] |
Detailed Experimental Protocols
Standard Protocol: Blocking and Antibody Incubation (Indirect Detection)
The following protocol is adapted from general guidelines and is suitable for both chemiluminescent and fluorescent detection when using an unconjugated primary antibody [21].
Materials & Reagents:
- Blocking Buffer: 5% w/v Non-fat Dry Milk or Bovine Serum Albumin (BSA) in 1X TBST [21].
- Antibody Dilution Buffer: 1X TBST with 1-5% BSA or non-fat dry milk, as recommended by the antibody manufacturer [21].
- Wash Buffer: 1X Tris-Buffered Saline with 0.1% Tween 20 (TBST) [21].
- Primary Antibody: Specific to the target protein.
- Secondary Antibody: HRP-conjugated for chemiluminescence or fluorophore-conjugated for fluorescence, raised against the host species of the primary antibody.
Procedure:
- Blocking: After transfer, incubate the membrane in 25 mL of blocking buffer for 1 hour at room temperature with gentle agitation [21].
- Primary Antibody Incubation:
- Prepare the primary antibody at the recommended dilution in antibody dilution buffer.
- Incubate the membrane with the primary antibody solution with gentle agitation overnight at 4°C [21].
- Wash the membrane three times for 5 minutes each with 15 mL of TBST.
- Secondary Antibody Incubation:
- Prepare the labeled secondary antibody at the appropriate dilution (e.g., 1:2000 for HRP-conjugated) in blocking buffer.
- Incubate the membrane with the secondary antibody solution with gentle agitation for 1 hour at room temperature [21].
- Wash the membrane three times for 5 minutes each with 15 mL of TBST.
Protocol A: Chemiluminescent Detection
This protocol follows the standard antibody incubation steps above using an HRP-conjugated secondary antibody.
Additional Reagents:
- Chemiluminescent substrate (e.g., LumiGLO or SignalFire ECL Reagent) [21].
Procedure:
- Signal Development: Mix the chemiluminescent substrate components as per the manufacturer's instructions. Incubate the membrane with the substrate solution for approximately 1 minute at room temperature with gentle agitation [21].
- Image Capture:
- X-ray Film: Drain excess substrate, wrap the membrane in plastic wrap, and expose to film in a darkroom. An initial 10-second exposure can help determine optimal time [21].
- Digital Imager: Place the membrane in a CCD or CMOS-based imager. Capture the signal, noting that it is most intense immediately after incubation and declines over time [21] [55].
Protocol B: Fluorescent Detection
This protocol uses a fluorophore-conjugated secondary antibody.
Additional Reagents:
- Fluorophore-conjugated secondary antibody (e.g., Alexa Fluor Plus series) [56].
Procedure:
- Antibody Incubation: Follow the standard protocol using a fluorophore-conjugated secondary antibody. Note: Protect the membrane from light during and after secondary antibody incubation to prevent photobleaching.
- Image Capture:
- Use a laser or LED-based imaging system equipped with appropriate excitation and emission filters for your fluorophore(s).
- Set the scanner to the correct channel(s) for multiplex detection. For example, use different fluorophores with non-overlapping spectra, such as Alexa Fluor 488 (excited at ~488 nm) and Alexa Fluor 555 (excited at ~555 nm) [56] [54].
Diagram 1: Workflow for Blocking, Antibody Incubation, and Detection.
The Scientist's Toolkit: Essential Research Reagents
Successful execution of a Western blot depends on the quality and appropriate selection of key reagents. The following table details essential materials and their functions.
Table 2: Key Research Reagent Solutions for Western Blotting
| Reagent / Material | Function / Role in the Experiment |
|---|---|
| Blocking Agent (BSA or Non-fat Dry Milk) | Coats the membrane to prevent non-specific antibody binding, thereby reducing background noise [21]. |
| Primary Antibody | Binds specifically to the target protein of interest. Must be validated for Western blotting [56]. |
| HRP-Conjugated Secondary Antibody | Binds to the primary antibody. The Horseradish Peroxidase (HRP) enzyme catalyzes a reaction with a substrate to produce light for chemiluminescent detection [21] [55]. |
| Fluorophore-Conjugated Secondary Antibody | Binds to the primary antibody. The fluorophore (e.g., Alexa Fluor dye) emits light at a specific wavelength when excited by a laser, enabling fluorescent detection [56]. |
| Chemiluminescent Substrate (e.g., Luminol) | A solution that, when oxidized by HRP, produces light as a byproduct, which is captured on film or with a digital imager [55]. |
| Wash Buffer (TBST) | Removes unbound or weakly bound antibodies from the membrane after each incubation step, minimizing background [21]. |
Best Practices for Publication-Quality Results
To meet the stringent requirements of modern scientific journals, researchers must adhere to specific best practices in data presentation and methodology reporting.
Image Presentation and Data Integrity:
- Minimal Cropping: Avoid overly cropping blots. Journals and readers need to see the entire vertical context, including the presence or absence of non-specific bands, to assess antibody specificity [7].
- Molecular Weight Markers: Always include visible molecular weight markers with clear labels on the blot image. This serves as a critical scale bar to confirm the size of the detected protein [7].
- Image Manipulation: Adjustments to brightness or contrast must be applied evenly across the entire image and must not obscure, eliminate, or misrepresent any information present in the original data. Never use cloning or healing tools to alter images [13] [23].
Methods Reporting: Comprehensive reporting is essential for reproducibility. A 2022 systematic review found that critical methodological details are often omitted [7]. Ensure your methods section includes:
- The amount of protein loaded per lane (e.g., in µg) [7].
- Complete antibody information, including host species, catalog number, RRID (Research Resource Identifier), and the dilution or concentration used for both primary and secondary antibodies [7].
- Detailed blocking conditions, including the reagent, concentration, and duration [7].
- The type of detection method used (chemiluminescence/fluorescence) and the imaging system.
The detection of low-abundance proteins and post-translational modifications (PTMs) represents a significant challenge in protein research, requiring specialized optimization of the western blotting technique. Low-abundance targets may be present at femtogram to attogram levels, often necessitating signal amplification beyond the capabilities of standard protocols [57] [58]. These challenges are particularly relevant in drug development, where quantifying subtle changes in protein expression or modification status in response to therapeutic interventions can inform mechanism of action and biomarker identification. Successful detection hinges on a comprehensive strategy addressing every stage of the workflow, from sample preparation through to final detection, with particular attention to minimizing background noise while maximizing specific signal [57] [7].
Key Challenges in Low-Abundance Protein Detection
Primary Obstacles
The fundamental obstacles to detecting low-abundance proteins stem from both biological and technical limitations. Biologically, some proteins are intrinsically expressed at low levels within cells or are difficult to extract due to their subcellular localization [57]. Technically, the western blot process itself introduces multiple points where these already scarce targets can be lost or obscured.
Table 1: Key Challenges in Detecting Low-Abundance Proteins
| Challenge Category | Specific Limitations | Impact on Detection |
|---|---|---|
| Biological Factors | Low intrinsic expression levels; Localization in difficult-to-access compartments (e.g., nucleus, mitochondria) [57] [58] | Limited starting material for analysis |
| Sample Preparation | Inefficient protein extraction; Protease degradation during processing; Insufficient sample concentration [57] [9] | Reduced target protein yield and integrity |
| Separation & Transfer | Poor resolution on inappropriate gel matrices; Inefficient transfer from gel to membrane, especially for high MW proteins [57] | Target inaccessibility to antibodies; Band diffusion |
| Immunodetection | Antibodies with low specificity or affinity; Suboptimal antibody concentrations; High background noise [57] [7] [58] | Poor signal-to-noise ratio; False negatives/positives |
| Detection Sensitivity | Use of standard ECL substrates with limited sensitivity [57] [58] | Inability to generate detectable signal from faint targets |
Limitations in Current Reporting Practices
A systematic assessment of western blot reporting practices reveals significant methodological shortcomings that affect reproducibility. An analysis of 551 publications found that over 90% presented only cropped blots, while more than 95% lacked visible molecular weight markers, preventing readers from assessing antibody specificity [7]. Furthermore, critical methodological information is frequently omitted: approximately 55-78% of papers fail to report the amount of protein loaded, and details on secondary antibodies (company, catalog number) are missing in 40-48% of publications [7]. These deficiencies highlight the need for more rigorous reporting, especially when working with challenging low-abundance targets.
Optimized Experimental Protocols
Sample Preparation for Maximum Protein Recovery
Efficient extraction is the critical first step in detecting low-abundance proteins. The choice of lysis buffer must be tailored to the protein's subcellular localization.
Cell Culture Protocol:
- Wash and Harvest: Wash suspension cells twice with PBS by centrifugation (100–500 × g, 5 min, 4°C). For adherent cells, use enzymatic or mechanical detachment prior to washing [9].
- Lysis: Resuspend cell pellet in optimized, ice-cold lysis buffer (e.g., RIPA buffer for nuclear or mitochondrial proteins) containing broad-spectrum protease inhibitors and phosphatase inhibitors if studying phosphorylated proteins. Use approximately 1 mL lysis buffer per 1×10⁷ cells [57] [9].
- Incubation and Homogenization: Incubate cells in lysis buffer for 10 minutes at 4°C with rocking. Sonicate the suspension to ensure complete cell disruption, optimizing time and intensity for your instrument [9].
- Clarification: Centrifuge the suspension at 14,000–17,000 × g for 5-10 minutes at 4°C. Transfer the supernatant (your lysate) to a fresh tube on ice and discard the insoluble pellet [9].
- Quantification and Preparation: Determine protein concentration using a compatible assay (e.g., BCA or Bradford). Dilute aliquots in loading buffer containing DTT to a final concentration of 1–2 mg/mL. Denature samples at 100°C for 10 minutes before storage at -80°C or immediate use [9].
Tissue Sample Protocol:
- Dissection: Rapidly dissect tissue on ice with clean tools to minimize protease activity. For immediate processing, place ~200 mg of tissue in 1,200 µL of lysis buffer in tubes with glass beads [9].
- Homogenization: Lyse the tissue using an automated homogenizer for approximately 3 minutes at 4°C, pausing halfway to prevent overheating. Incubate for an additional 5 minutes at 4°C [9].
- Clarification and Storage: Centrifuge at 14,000–17,000 × g for 5-10 minutes at 4°C. Collect the supernatant (lysate) for immediate use or snap-freeze in liquid nitrogen for storage at -80°C [9].
Protein Separation and Transfer Optimization
Electrophoresis Protocol:
- Gel Selection: Choose the appropriate gel chemistry based on your target protein's molecular weight. For proteins 6-250 kDa, use Bis-Tris gels (neutral pH); for 40-500 kDa proteins, use Tris-Acetate gels; for small proteins (2.5-40 kDa), use Tricine gels for optimal resolution [57] [9].
- Apparatus Setup: Place the selected gel into the running apparatus and fill with appropriate running buffer (e.g., MES for 10-30 kDa proteins, MOPS for 31-150 kDa proteins, or Tris-Acetate for >150 kDa proteins) [57] [9].
- Sample Loading: Load an equal quantity of protein from each sample (recommended 10-40 µg for lysates, 10-500 ng for purified protein). Include an appropriate molecular weight ladder in one well. Avoid overloading wells to prevent spillover and distorted bands [9] [59].
- Electrophoresis: Run the gel according to manufacturer's instructions, typically starting at 80V for 20 minutes followed by 120V for 90 minutes. Perform electrophoresis in an ice bath to prevent heat-induced artifacts [60].
Transfer Protocol (Wet Transfer Method):
- Membrane Preparation: Cut PVDF or nitrocellulose membrane and filter paper to gel size. Activate PVDF membrane with 100% methanol for 30-60 seconds, then equilibrate both membrane and filter paper in transfer buffer [60] [58].
- Sandwich Assembly: Assemble the transfer stack in this order: cathode plate → sponge → filter paper → gel → membrane → filter paper → sponge → anode plate. Carefully eliminate all air bubbles between layers by rolling a glass tube over the stack [60].
- Transfer: Transfer at 300 mA, 85 V for 2 hours in an ice bath to maintain low temperature. For high molecular weight proteins (>150 kDa), consider extending transfer time or using specialized Tris-Acetate gels for improved efficiency [57] [60].
Immunodetection for Enhanced Sensitivity
Blocking and Antibody Incubation:
- Blocking: Incubate membrane in 5% skim milk in TBST for 1-2 hours at room temperature to reduce non-specific binding [60].
- Primary Antibody Incubation: Dilute primary antibody in appropriate diluent (refer to datasheet for recommended dilution). Incubate membrane at room temperature for 1-2 hours or overnight at 4°C for enhanced sensitivity. Wash membrane 3 times with TBST for 10 minutes per wash [60].
- Secondary Antibody Incubation: Dilute species-matched HRP-conjugated secondary antibody in TBST. When using high-sensitivity substrates, dramatically decrease secondary antibody concentration (e.g., 1:100,000 dilution) to minimize background. Incubate at room temperature for 1-2 hours. Wash 3 times with TBST for 10 minutes per wash [60] [58].
Signal Amplification Methods: For particularly challenging low-abundance targets, consider biotin-streptavidin amplification:
- Biotinylated Secondary Antibodies: Use biotin-conjugated secondary antibodies instead of HRP-conjugated antibodies.
- Streptavidin-HRP Incubation: Incubate membrane with streptavidin conjugated to HRP. The multiple biotin binding sites on streptavidin create an amplified signal.
- Detection: Proceed with chemiluminescent detection as described below. This Labeled Streptavidin-Biotin (LSAB) method offers higher specificity and sensitivity compared to traditional indirect detection [61].
High-Sensitivity Detection
Chemiluminescent Detection Protocol:
- Substrate Preparation: Mix enhanced chemiluminescent (ECL) substrate reagents A and B in a 1:1 ratio immediately before use. For low-abundance proteins, select high-sensitivity substrates capable of detecting femtogram to attogram levels (e.g., SuperSignal West Atto, SignalBright Max) [57] [58].
- Substrate Application: Drain excess TBST from membrane (do not let dry completely). Apply ECL substrate mixture evenly across the membrane and incubate for 1-2 minutes [60].
- Signal Capture: Image the membrane using a CCD-based imaging system capable of detecting low-light signals. Begin with short exposure times (5-30 seconds) and adjust based on initial signal intensity. For very low-abundance targets, multiple exposures of varying durations may be necessary to capture the linear range of the signal without saturation [57] [59].
Data Analysis and Normalization
Quantitative Western Blotting Considerations
Accurate quantification of low-abundance proteins requires careful attention to signal linearity and appropriate normalization. Traditional housekeeping proteins (e.g., β-actin, GAPDH, α-tubulin) often become saturated at common loading amounts (30-50 μg), making them poor choices for normalization in quantitative assays [59]. Total Protein Normalization (TPN) provides a superior alternative by normalizing the target signal to the total amount of protein loaded in each lane, using fluorescent labels like No-Stain Protein Labeling Reagent that exhibit a linear response across a wide dynamic range [59].
Table 2: Protein Load and Detection Linearity for Targets of Different Abundance
| Protein Abundance | Example Proteins | Recommended Lysate Load | Linearity Range |
|---|---|---|---|
| High-Abundance | HSP90, mu-calpain [59] | 1–3 µg | Narrow (saturates quickly) |
| Medium-Abundance | p23, cyclophilin B [59] | Up to 10–20 µg | Moderate |
| Low-Abundance | Ras10, transcription factors [59] | Up to 40 µg | Wide |
Troubleshooting Common Issues
- High Background with Sensitive Substrates: Often caused by antibody overconcentration, particularly secondary antibodies. Reduce secondary antibody dilution (e.g., to 1:100,000 or higher) when using high-sensitivity ECL substrates [58].
- Weak or No Signal: Ensure efficient transfer by verifying membrane activation (PVDF) and transfer stack assembly. Check antibody specificity using knockout/knockdown validated antibodies [58].
- Non-Specific Bands: Optimize antibody concentration and increase stringency of washes. Include molecular weight markers on blots to verify target size [7].
- Signal Saturation: Reduce protein load or use less sensitive ECL substrates when quantifying high-abundance proteins. Capture multiple exposures to ensure signals remain in the linear range [59].
Research Reagent Solutions
Table 3: Essential Reagents for Detecting Low-Abundance Proteins
| Reagent Category | Specific Examples | Function & Application Notes |
|---|---|---|
| Protein Extraction | RIPA lysis buffer [9] [58]; Protease inhibitor cocktail [9]; Phosphatase inhibitors [9] | Efficient release of target proteins; Preservation of protein integrity and PTMs during processing |
| Gel Electrophoresis | Bis-Tris gels (6-250 kDa) [57]; Tris-Acetate gels (40-500 kDa) [57]; Tricine gels (2.5-40 kDa) [57] | Optimal size-based separation with minimal protein modification; Neutral pH gels preserve protein integrity |
| Transfer Membranes | PVDF membrane [58]; Nitrocellulose membrane | High protein binding capacity; PVDF preferred for low-abundance targets due to higher binding capacity and lower non-specific binding |
| Blocking Reagents | 5% skim milk in TBST [60] | Reduction of non-specific antibody binding to minimize background |
| Primary Antibodies | Knockout/Knockdown validated antibodies [58] | Target-specific detection with confirmed specificity; Essential for reliable results |
| Secondary Antibodies | HRP-conjugated antibodies [57]; Biotin-conjugated antibodies [61] | Signal generation; Biotinylated antibodies enable additional amplification steps |
| Detection Substrates | SuperSignal West Atto [57]; SignalBright Max [58]; SuperSignal West Dura [59] | High-sensitivity chemiluminescent detection; Selection based on abundance level - ultra-sensitive for very low abundance |
| Normalization Reagents | No-Stain Protein Labeling Reagent [59]; Validated housekeeping antibodies | Accurate quantification through total protein normalization or traditional loading controls |
The detection of low-abundance proteins and post-translational modifications via western blotting requires a meticulously optimized, integrated approach across the entire workflow. Success hinges on: (1) efficient protein extraction and transfer that maximizes target availability; (2) careful selection of separation matrices tailored to protein size; (3) implementation of signal amplification strategies such as high-sensitivity ECL substrates or biotin-streptavidin systems; and (4) rigorous antibody validation and concentration optimization. Furthermore, appropriate normalization methods and comprehensive reporting of methodological details are essential for generating quantitative, reproducible data that meets the evolving standards of scientific rigor. By implementing these specialized protocols, researchers can reliably extend the sensitivity of western blotting to address critical questions in protein function, cellular signaling, and drug mechanism of action that involve low-abundance targets.
Troubleshooting Western Blots: Solving Common Problems and Optimizing for Publication-Quality Data
Western blotting remains a cornerstone technique in protein research, enabling the detection of specific proteins in complex biological samples. However, its multistep nature makes it susceptible to technical challenges that can compromise data integrity. For researchers and drug development professionals, achieving publication-ready results requires not only troubleshooting common problems but also adhering to evolving quantitative standards. This application note provides a detailed guide to diagnosing and resolving three pervasive Western blotting issues—no signal, high background, and unexpected bands—within the context of modern protein detection research. We incorporate current methodological advancements, including total protein normalization and fluorescent detection, to ensure your Western blot data meets the rigorous demands of contemporary scientific inquiry.
Troubleshooting No Signal or Weak Signal
A weak or absent signal is one of the most common and frustrating issues in Western blotting. It can result from problems at virtually any stage of the process, from sample preparation to detection.
Systematic Diagnosis and Solutions
The following table outlines the primary causes and recommended solutions for weak or no signal.
Table 1: Troubleshooting Guide for Weak or No Signal
| Category | Possible Cause | Recommended Solution |
|---|---|---|
| Transfer Issues | Inefficient transfer of proteins from gel to membrane [62] | Verify transfer efficiency using a reversible protein stain (e.g., Ponceau S) or total protein stain [62]. For high MW proteins (>100 kDa), add 0.01-0.05% SDS to transfer buffer. For low MW proteins (<30 kDa), add 20% methanol and use a smaller pore size membrane (0.22 µm) [62] [63]. |
| Antibody Issues | Inactive primary or secondary antibody; incorrect species [64] [63] | Perform a dot blot to test antibody activity [62] [63]. Always include a positive control (e.g., a known expressing cell lysate). Confirm the secondary antibody is targeted against the host species of the primary antibody [64]. |
| Antigen Issues | Low abundance of target protein; antigen masked by blocking buffer [62] [65] | Load more total protein (e.g., 30-80 µg). For very low abundance targets, enrich the protein via immunoprecipitation [63]. Try an alternative blocking buffer (e.g., BSA instead of milk) and reduce the blocking concentration or time [62] [63]. |
| Detection Issues | Inactive chemiluminescent substrate; presence of sodium azide (inhibits HRP) [62] | Use fresh substrate and test with a positive control. Ensure all buffers are free of sodium azide when using HRP-conjugated antibodies [62] [63]. Increase film exposure time or try a higher-sensitivity substrate [62]. |
Experimental Protocol: Verifying Transfer Efficiency
A critical step in troubleshooting "no signal" is confirming that your protein successfully transferred to the membrane.
Materials:
- Ponceau S stain or a fluorescent total protein stain (e.g., No-Stain Protein Labeling Reagent, Thermo Fisher) [13] or reversible protein stain kit [62].
- Imaging system compatible with your stain (standard scanner for Ponceau S, fluorescent imager for fluorescent stains).
Method:
- Post-Transfer Staining: Immediately after the transfer step, take your membrane and incubate it with the chosen protein stain according to the manufacturer's instructions.
- For Ponceau S: Incubate for 5 minutes with gentle agitation, then destain with water until bands are visible against a pink background.
- For fluorescent stains: Incubate and image as per protocol.
- Imaging: Capture an image of the stained membrane. You should see a uniform distribution of protein across all lanes, with clear molecular weight markers.
- Analysis: If the total protein stain is faint or absent in certain areas, this indicates an uneven or inefficient transfer. If the stain is strong, the problem likely lies downstream of the transfer step.
Resolving High Background
A high background, where the entire membrane is dark and obscures specific bands, is typically caused by non-specific antibody binding or suboptimal blocking.
Systematic Diagnosis and Solutions
The following table outlines the primary causes and recommended solutions for high background.
Table 2: Troubleshooting Guide for High Background
| Category | Possible Cause | Recommended Solution |
|---|---|---|
| Antibody Concentration | Antibody concentration is too high [64] [62] | Titrate both primary and secondary antibodies to find the optimal dilution. For secondary antibodies, a higher dilution (e.g., 1:10,000 to 1:20,000) is often effective [64] [62]. |
| Blocking Issues | Incompatible or insufficient blocking [62] | Increase blocking time to at least 1 hour at room temperature or overnight at 4°C. Use a different blocking agent (e.g., BSA or a commercial blocking buffer instead of milk, especially for phosphoproteins) [64] [62]. Ensure the blocking buffer is fresh and filtered. |
| Washing Issues | Inadequate washing [62] | Increase the number and volume of washes. Use a wash buffer (TBST or PBST) containing 0.05% Tween 20 to reduce non-specific binding [62]. |
| Membrane Handling | Membrane dried out during processing; contaminated buffers [64] [62] | Ensure the membrane remains covered with liquid at all times. Prepare fresh, filtered buffers and use clean equipment [64] [62]. |
Experimental Protocol: Optimized Blocking and Antibody Incubation
This protocol, adapted from fluorescent Western blot guidelines, is designed to minimize background [42].
Materials:
- TrueBlack WB Blocking Buffer or equivalent commercial blocker (#57443, Cell Signaling Technology) [42].
- TBST Wash Buffer: 20 mM Tris-Cl, pH 7.5, 150 mM NaCl, 0.05% Tween 20.
- Primary antibody diluted in TrueBlack WB Antibody Diluent (#78710, Cell Signaling Technology) [42].
- Fluorophore-conjugated or HRP-conjugated secondary antibody.
Method:
- Blocking: After transfer, incubate the membrane in 10 mL of TrueBlack Blocking Buffer for 45 minutes at room temperature with gentle agitation. This ready-to-use solution is optimized to minimize background.
- Primary Antibody Incubation: Dilute the primary antibody in TrueBlack Antibody Diluent. Incubate the membrane in this solution with gentle agitation overnight at 4°C.
- Washing: Wash the membrane five times for 10 minutes each with 15 mL of TBST.
- Secondary Antibody Incubation: Dilute the fluorophore- or HRP-conjugated secondary antibody in TrueBlack Antibody Diluent (1:5,000 to 1:25,000 for fluorescent secondaries). Incubate for 2 hours at room temperature, protected from light.
- Final Washes: Wash the membrane five times for 10 minutes each with 15 mL of TBST, protected from light.
- Imaging: For fluorescent blots, drain excess TBST and allow the membrane to dry completely before imaging [42].
Addressing Unexpected or Multiple Bands
The appearance of extra bands can stem from specific biological phenomena or technical artifacts, and distinguishing between the two is crucial for accurate data interpretation.
Systematic Diagnosis and Solutions
The following table outlines the primary causes and recommended solutions for unexpected or multiple bands.
Table 3: Troubleshooting Guide for Unexpected or Multiple Bands
| Category | Possible Cause | Recommended Solution |
|---|---|---|
| Protein Degradation | Protease activity in the sample [66] | Always add fresh protease inhibitors to lysis buffers. Use fresh lysate and keep samples on ice. The appearance of multiple lower molecular weight bands is a classic indicator of degradation [66]. |
| Post-Translational Modifications (PTMs) | Natural protein modifications (e.g., phosphorylation, glycosylation) [64] [66] | Check literature for known PTMs of your target. A diffuse band or a band at a higher molecular weight may indicate glycosylation. Treatment with specific enzymes (e.g., phosphatase) can confirm modifications [64]. |
| Non-Specific Antibody Binding | Antibody cross-reactivity with unrelated proteins [62] | Use antibodies that are affinity-purified. Include a knockout cell or tissue lysate control. This is the most definitive way to distinguish specific from non-specific bands [66]. |
| Protein Multimerization | Formation of dimers or trimers via disulfide bonds [66] | Ensure samples are sufficiently reduced by boiling for longer in Laemmli buffer with fresh reducing agents (DTT, β-mercaptoethanol) [66]. |
Experimental Protocol: Using Knockout Lysates for Specificity Control
To confirm that an observed band is your specific target, a knockout (KO) control is essential.
Materials:
- Wild-type (WT) cell lysate.
- Knockout (KO) cell lysate (lacking the target protein due to genetic manipulation).
- Validated primary antibody against your target.
Method:
- Sample Preparation: Prepare identical protein samples from both WT and KO cell lines, ensuring equal protein concentration.
- Gel Electrophoresis and Transfer: Load WT and KO lysates on the same gel, alongside a molecular weight marker. Perform electrophoresis and transfer using standard protocols.
- Western Blotting: Probe the membrane with your target antibody following an optimized protocol (as in Section 2.2).
- Analysis: Compare the blotting patterns. Bands present in the WT lane but absent in the KO lane are specific to your target protein. Any bands that remain in the KO lane are non-specific and should be ignored for quantification [66].
The Scientist's Toolkit: Essential Reagents for Quantitative Western Blotting
Producing high-quality, reproducible data requires the right tools. The following table details key reagents and their functions in a modern Western blot workflow.
Table 4: Key Research Reagent Solutions
| Reagent / Kit | Function / Application | Example Product |
|---|---|---|
| Total Protein Normalization (TPN) Reagents | Superior normalization method; labels all proteins on the membrane to control for loading and transfer variations, replacing housekeeping proteins [13] [4]. | No-Stain Protein Labeling Reagent (Thermo Fisher) [13] |
| Fluorescent Western Blotting Kits | Enable multiplexing (detecting multiple targets on one blot) and offer a wider linear dynamic range than chemiluminescence. Avoids the need for stripping and reprobing [4] [42]. | TrueBlack Western Blotting Kit (Cell Signaling Technology) [42] |
| High-Sensitivity Chemiluminescent Substrates | Detect low-abundance proteins when signal is weak. | SuperSignal West Femto Maximum Sensitivity Substrate (Thermo Fisher) [62] |
| Prestained Protein Markers | Visual monitor of electrophoresis and transfer efficiency; approximate molecular weight determination. | iBright Prestained Protein Ladder (Thermo Fisher) [62] |
| Optimized Blocking Buffers | Ready-to-use solutions designed to minimize background and be compatible with various targets (e.g., phosphoproteins). | StartingBlock or SuperBlock Buffers (Thermo Fisher) [62] |
Workflow and Data Analysis for Reliable Quantification
Achieving publication-quality data involves more than just clear bands; it requires rigorous experimental design and data analysis. Leading journals are increasingly advocating for total protein normalization (TPN) over traditional housekeeping proteins (HKPs) like GAPDH or actin, as HKP expression can vary significantly with experimental conditions [13].
The following diagram illustrates the critical path for obtaining reliable quantitative Western blot data, incorporating TPN and the troubleshooting points discussed.
Diagram 1: A critical path for quantitative Western blotting, highlighting key troubleshooting points. TPN provides a superior quality control and normalization step. Dashed red lines indicate common failure points and their associated problems.
Mastering Western blotting requires a systematic approach to troubleshooting and a commitment to updated quantitative practices. By understanding the root causes of no signal, high background, and unexpected bands, researchers can efficiently diagnose and resolve these issues. Furthermore, adopting modern techniques such as total protein normalization and fluorescent multiplexing will significantly enhance the reliability and reproducibility of your data. The protocols and guidelines provided here offer a concrete path to producing high-quality, publication-ready results that meet the stringent standards of today's top scientific journals and the rigorous demands of drug development research.
Optimizing Antibody Concentrations and Incubation Conditions via Titration
Within the framework of Western blotting research for detecting specific proteins, the reproducibility and clarity of results are paramount. A core determinant of a successful immunoblot is the specific binding of the primary and secondary antibodies to the target protein. However, the optimal antibody concentration is not a universal constant; it is dependent on the unique antibody-antigen pair, sample composition, and specific experimental conditions [67] [68]. Suboptimal concentrations are a frequent source of irreproducibility, leading to a range of common issues including weak or absent signals, nonspecific bands, high background, and even signal saturation [67] [68]. This application note details a systematic, evidence-based protocol for optimizing antibody concentrations and incubation conditions via titration, a critical procedure for ensuring reliable and quantitative data in protein research and drug development.
The Critical Need for Optimization
The affinity constant governing the antibody-antigen interaction is influenced by multiple factors, including the amount of antigen present, temperature, pH, and buffer constituents [68]. Furthermore, antibody performance can vary significantly between suppliers and even between different batches from the same supplier [69]. Consequently, the recommended dilution provided by a manufacturer should be considered a starting point rather than a definitive guide. As highlighted by Proteintech Group, antibody titration should be performed every time a new antibody is used or when experimental conditions change [70].
Failure to optimize can result in several analytical errors. Excessive antibody concentration often leads to high background, nonspecific bands, and speckled patterns on the membrane, as the antibody binds indiscriminately to non-target proteins and the membrane itself [67] [68]. Conversely, an insufficient antibody concentration may yield a weak or undetectable signal, potentially leading to false negative conclusions [68]. The table below summarizes the common pitfalls and their likely causes related to antibody concentration.
Table 1: Common Western Blot Problems and Their Causes Related to Antibody Usage
| Problem Observed | Potential Cause |
|---|---|
| Weak or No Signal | Antibody concentration too low; insufficient incubation time [68] [71] |
| High Background | Antibody concentration too high [70] [68] |
| Nonspecific Bands | Antibody concentration too high; insufficient antibody specificity [68] [69] |
| Speckled or Blotched Background | Antibody concentration too high; uneven antibody distribution [67] [68] |
| Saturated Band Signal | Antibody concentration too high, leading to loss of quantitative information [72] |
Optimization Methodologies
Two primary methodologies are employed for antibody titration: the dot blot technique and the membrane strip method. The dot blot approach is faster and more economical for initial screening, while the membrane strip method, which involves a full Western blot, provides information in the context of protein separation by molecular weight.
Dot Blot Protocol for Rapid Screening
The dot blot assay serves as an efficient preliminary screening tool to determine the approximate optimal dilution range without performing multiple full Western blots [67] [68].
- Membrane Preparation: Cut a nitrocellulose membrane into 1 cm strips. Label each strip with a pencil to denote the primary antibody dilution it will test [67] [68].
- Sample Application: Prepare a protein sample known to contain an abundance of your target antigen. Dot 1-5 µL of this sample onto the dry membrane strips. For larger volumes, apply multiple smaller volumes to the same spot, allowing the membrane to dry completely between applications. After dotting, let the strips dry for 10-15 minutes [67].
- Blocking: Block the membranes by soaking in an appropriate blocking buffer (e.g., 5% non-fat dry milk or BSA in TBST) for 1-2 hours at room temperature with gentle agitation [67] [21].
- Primary Antibody Incubation: Incubate each membrane strip with a different dilution of the primary antibody in blocking or washing buffer for 1 hour at room temperature on an orbital shaker. A typical starting range is 1:250 to 1:4000 (approximately 0.2 to 5.0 µg/mL for purified antibodies) [67] [68].
- Washing: Wash the strips thoroughly in wash buffer (e.g., TBST), typically four times for 5 minutes each [68].
- Secondary Antibody Incubation: Incubate the strips with dilutions of the HRP-conjugated secondary antibody for 1 hour. A common starting range is 1:2,500 to 1:40,000 [67] [68].
- Detection: Apply chemiluminescent substrate and expose to film or capture with a digital imaging system. The optimal concentration will yield a dark, clear dot with minimal background [67].
Membrane Strip Titration Protocol
For optimization within the context of gel electrophoresis, the membrane strip method is preferred.
- Gel Electrophoresis and Transfer: Run a standard SDS-PAGE gel with multiple lanes loaded with identical protein samples (20-50 µg of whole cell lysate is often suitable) and transfer to a single PVDF or nitrocellulose membrane [70] [68].
- Membrane Sectioning: After transfer, carefully cut the membrane into individual strips, each corresponding to one lane of the gel.
- Blocking: Block all strips simultaneously in blocking buffer for 1 hour at room temperature [21].
- Primary Antibody Titration: Incubate each strip with a different dilution of the primary antibody, prepared in an appropriate dilution buffer. Include a strip without primary antibody as a negative control. Incubation is typically performed with gentle agitation overnight at 4°C, though extended times may be beneficial for low-abundance targets [21] [71].
- Washing and Secondary Incubation: Wash all strips and incubate with a standardized dilution of the secondary antibody (e.g., 1:2000 for HRP-conjugated antibodies) for 1 hour at room temperature [21].
- Detection and Analysis: Detect the signal and compare the results across strips. The optimal dilution is the one that produces the strongest specific signal with the cleanest background.
The following workflow diagram illustrates the logical sequence of the membrane strip titration method.
Diagram 1: Experimental Workflow for Membrane Strip Titration
Advanced Optimization: Incubation Time and Kinetic Considerations
Traditional protocols often recommend 1-hour incubations, but research indicates that antibody-antigen binding kinetics are often slower than assumed. Time-course studies have demonstrated that for some antibodies, the interaction with either the immobilized antigen or the secondary antibody may not reach a plateau until after 48 hours of incubation [71]. This prolonged binding can occur without a corresponding increase in background, suggesting that for challenging targets with low abundance or low-affinity antibodies, extending incubation times can significantly enhance sensitivity [71].
A key factor limiting incubation speed is mass transport limitation (MTL), where a depletion layer of low antibody concentration forms near the membrane surface because antibody binding is faster than diffusion from the bulk solution [73]. Innovative methods like Cyclic Draining and Replenishing (CDR) can disrupt this layer. The CDR method, especially when combined with commercial immunoreaction enhancing agents, has been shown to reduce total antibody incubation times to as little as 5 minutes without sacrificing sensitivity [73].
Table 2: Quantitative Data from Incubation Time-Course Studies
| Antibody Target | Time to Reach Signal Plateau (Primary Ab Incubation) | Key Finding |
|---|---|---|
| GAPDH | 4-8 hours | Plateau reached relatively quickly [71] |
| HIF-1β | 4-8 hours | Plateau reached relatively quickly [71] |
| Bad | >48 hours | Signal continued to increase beyond 48 hours [71] |
| cMyc | >48 hours | Signal continued to increase beyond 48 hours [71] |
The Scientist's Toolkit: Research Reagent Solutions
The following table details essential materials and reagents required for performing antibody titration and optimization.
Table 3: Essential Reagents for Antibody Titration Experiments
| Item | Function/Description | Example Products/Catalogs |
|---|---|---|
| Nitrocellulose or PVDF Membrane | Solid support for protein immobilization after transfer. | Immobilon-P PVDF [73], UltraCruz Nitrocellulose [74] |
| Blocking Reagent | Reduces nonspecific antibody binding to the membrane. | Nonfat Dry Milk [21], Bovine Serum Albumin (BSA) [21], Odyssey Blocking Buffer [73] |
| Primary Antibody | The key reagent whose specificity and concentration are being optimized. | Target-specific antibodies from various vendors (e.g., CST, Santa Cruz, Proteintech). |
| HRP-conjugated Secondary Antibody | Binds to the primary antibody for detection. | Anti-rabbit IgG-HRP [21], Anti-mouse IgG-HRP [21] |
| Chemiluminescent Substrate | Generates light signal upon reaction with HRP enzyme. | LumiGLO [21], SignalFire [21], SuperSignal [71] |
| Immunoreaction Enhancer | Proprietary solutions that can improve antibody affinity and signal-to-noise ratio. | Can Get Signal Solution [73] |
| Wash Buffer | Removes unbound antibodies and reduces background. | Tris-Buffered Saline with Tween 20 (TBST) [21] |
| Protease/Phosphatase Inhibitors | Preserves protein integrity and modifications, especially in phospho-specific blots. | Phosphatase Inhibitor Cocktails [74] |
Validation and Controls
Optimization is not complete without proper validation and controls. Antibody specificity should be confirmed using genetic controls such as knockout cell lines or siRNA knockdowns, which is considered a gold standard for validation [69]. Furthermore, always include:
- Positive Control: A lysate from a cell line or tissue known to express your target protein confirms the protocol is working [69].
- Negative Control: A sample incubated without the primary antibody (secondary antibody only) identifies any background signal caused by the secondary antibody [68].
- Loading Control: An antibody for a constitutively expressed protein (e.g., GAPDH, β-actin) ensures equal loading across lanes, though note that newer titration-based Western blot (t-WB) methods can circumvent potential biases from variable loading controls by using serial sample dilutions [72].
The conceptual problem of mass transport limitation and the CDR solution are visualized below.
Diagram 2: Overcoming Mass Transport Limitation with CDR
In Western blotting, the blocking step is a fundamental prerequisite for successful protein detection. After proteins are transferred to a membrane, the membrane's high protein-binding affinity causes non-specific binding of detection antibodies, leading to excessive background noise and compromising data interpretation [75]. The primary function of a blocking buffer is to saturate these unoccupied sites on the membrane with non-reactive proteins or other molecules, thereby preventing the non-specific attachment of antibodies and improving the signal-to-noise ratio [75] [76]. Selecting an appropriate blocking buffer is not a one-size-fits-all decision; it is highly dependent on the specific experimental system, including the target protein, antibodies used, and detection method. Inadequate blocking results in high background, while excessive or inappropriate blocking can mask antibody-antigen interactions or inhibit detection enzymes, ultimately reducing the target signal [75]. This application note provides a detailed comparative analysis of common blocking buffers—milk, Bovine Serum Albumin (BSA), and serum-based options—to guide researchers in making an informed selection for their specific experimental context within protein research.
Comparative Analysis of Blocking Buffer Types
Blocking buffers can be broadly categorized by their composition. The most common agents are non-fat dry milk, Bovine Serum Albumin (BSA), and various purified protein-based solutions, each with distinct advantages and limitations. Table 1 summarizes the key characteristics of these buffers to facilitate a direct comparison.
Table 1: Comprehensive Comparison of Western Blot Blocking Buffers
| Blocking Buffer | Key Benefits | Key Considerations and Limitations | Ideal Use Cases |
|---|---|---|---|
| Skim Milk (2-5%) | Inexpensive; contains multiple types of proteins for effective blocking [77] [78]. | Contains biotin and phosphoproteins (e.g., casein), which interfere with streptavidin-biotin detection systems and the detection of phosphorylated target proteins. May mask some antigens and lower the detection limit [77] [75] [78]. | Routine, cost-effective detection of non-phosphorylated proteins when not using avidin-biotin systems. |
| Bovine Serum Albumin (BSA; 2-3%) | Good alternative to milk; compatible with biotin-streptavidin systems and probing for phosphoproteins; allows for higher sensitivity detection [77] [75] [76]. | Generally a weaker blocker than milk, which can result in more non-specific antibody binding; more expensive than milk; not compatible with lectin probes due to carbohydrates [77] [75] [78]. | Detecting phosphoproteins; experiments using avidin-biotin systems; sensitivity-critical applications for low-abundant proteins. |
| Purified Proteins (e.g., Casein) | Single-protein buffers provide fewer chances of cross-reaction than milk or serum; ideal when milk blocks antigen-antibody binding [77] [75]. | More expensive than traditional non-fat milk formulations [77] [75]. | Optimizing systems where traditional blockers give high background or when high specificity is required. |
| Specialized Commercial Buffers | Often serum- and biotin-free; blocks rapidly (e.g., in 10-15 minutes); performs well with a wide range of antibodies; compatible with streptavidin systems and fluorescent detection [75] [42]. | Cost can be higher than homemade solutions. | Optimizing a new system; fluorescent Western blotting; when quick blocking is desired; stripping and reprobing blots. |
The choice of buffer is highly system-dependent. For instance, in the detection of pAKT in 293T cell lysates, 2% BSA and a specialized commercial blocking buffer (StartingBlock) provided the highest sensitivity. However, 2% BSA exhibited weak blocking of non-specific binding, leading to non-specific bands, whereas 5% non-fat milk provided the lowest background but at the cost of detection sensitivity [75]. This highlights the frequent trade-off between sensitivity and background that researchers must navigate.
Detailed Experimental Protocols
Standard Blocking and Antibody Incubation Protocol
The following protocol is a generalized and robust method applicable to various blocking buffers, with critical decision points highlighted.
Materials Required:
- Transfer membrane (Nitrocellulose or PVDF)
- Blocking buffer (e.g., 5% non-fat milk or 2-3% BSA in TBST or PBST)
- Wash Buffer (1X TBST or PBST)
- Primary antibody specific to the target protein
- Horseradish peroxidase (HRP)-conjugated or fluorescently-labeled secondary antibody
- Optional: Tween-20 detergent
Procedure:
- Post-Transfer: Following protein transfer, briefly rinse the membrane with TBS or PBS for 5 minutes at room temperature to remove residual transfer buffer [42].
- Blocking: Incubate the membrane in a sufficient volume of selected blocking buffer (e.g., 10 ml for a 100 cm² membrane) for 1 hour at room temperature with gentle agitation. Blocking duration can be optimized from 30 minutes to 2 hours, and for some specialized buffers, blocking can be completed in as little as 10-15 minutes [75] [42].
- Primary Antibody Incubation:
- Dilute the primary antibody to the recommended concentration in the same blocking buffer or a dedicated antibody diluent [42].
- Incubate the membrane with the primary antibody solution with gentle agitation. This can be done for 1-2 hours at room temperature or, for enhanced sensitivity, overnight at 4°C [42].
- Washing: Remove the primary antibody and wash the membrane five times for 5 minutes each with a large volume (e.g., 15 ml for 100 cm²) of wash buffer (e.g., TBST). The detergent (e.g., Tween-20) in the wash buffer helps reduce non-specific binding [75] [42].
- Secondary Antibody Incubation:
- Dilute the enzyme-conjugated or fluorescently-labeled secondary antibody in blocking buffer or antibody diluent (typically 1:2000 to 1:25,000).
- Incubate the membrane with the secondary antibody solution for 1 hour at room temperature with gentle agitation, protected from light if using fluorescent antibodies [42].
- Final Washing: Repeat the washing step as in Step 4 with five washes for 5 minutes each [42].
- Detection: Proceed with appropriate chemiluminescent or fluorescent detection according to the manufacturer's instructions.
Protocol for Fluorescent Western Blotting
Fluorescent Western blotting requires specific considerations to minimize background. Particles and contaminants in buffers can create fluorescent artifacts, and common detergents can auto-fluoresce [75].
Specialized Materials:
- Fluorescent blocking buffer (e.g., TrueBlack WB Blocking Buffer) [42]
- Fluorophore-conjugated secondary antibodies (e.g., Alexa Fluor Plus 800 or 680) [75]
- TBST for washing
Procedure:
- Blocking: Incubate the membrane in 10 ml of fluorescent blocking buffer (e.g., TrueBlack) for 45 minutes at room temperature [42]. These buffers are often detergent-free to minimize auto-fluorescence [75].
- Antibody Incubation: Incubate with the primary antibody diluted in a dedicated antibody diluent (e.g., TrueBlack WB Antibody Diluent) overnight at 4°C [42].
- Washing and Secondary Antibody: Wash the membrane five times for 10 minutes each with TBST. Incubate with fluorophore-conjugated secondary antibody (diluted 1:5,000 to 1:25,000) in antibody diluent for 2 hours at room temperature, protected from light [42].
- Final Washing and Drying: Perform a final wash with five washes for 10 minutes each with TBST. A critical step for fluorescent detection is to drain excess buffer and allow the membrane to dry completely before imaging, as the membrane must be dry for optimal fluorescent staining [42].
- Imaging: Scan the dry membrane using a fluorescent scanner following the manufacturer's guidelines [42].
Visualizing the Blocking Buffer Selection Workflow
The following decision diagram provides a logical pathway for selecting the most appropriate blocking buffer based on key experimental parameters.
The Scientist's Toolkit: Essential Research Reagent Solutions
Successful Western blotting relies on a suite of carefully selected reagents beyond the blocking buffer. The following table outlines key materials and their functions in the experimental workflow.
Table 2: Essential Reagents for Western Blotting
| Reagent / Kit | Function / Purpose | Example Products |
|---|---|---|
| Lysis Buffer | To solubilize and extract proteins from cells or tissue samples while maintaining protein integrity. | RIPA Buffer, Non-denaturing Lysis Buffer [9] |
| Protease & Phosphatase Inhibitors | To prevent protein degradation and preserve post-translational modifications (e.g., phosphorylation) during lysis. | Protease Inhibitor Cocktail, Phosphatase Inhibitor Cocktail [9] |
| Protein Assay Kits | To accurately determine the protein concentration of lysates, ensuring equal loading across gel lanes. | BCA Assay, Bradford Assay [9] |
| SDS-PAGE Gels & Running Buffers | To denature and separate proteins based on their molecular weight via gel electrophoresis. | Tris-Glycine Gels, Bis-Tris Gels, MOPS/SDS Running Buffer [9] |
| Molecular Weight Marker | To verify electrotransfer efficiency and estimate the molecular weight of detected proteins. | Prestained Protein Markers [9] [42] |
| Blotting Membrane | To immobilize separated proteins for subsequent probing with antibodies. | Nitrocellulose, PVDF [75] [42] |
| Validated Primary Antibodies | To specifically bind to the target protein of interest. | Antibodies from validated suppliers with reported catalog numbers and RRIDs [79] |
| Secondary Antibodies (conjugated) | To bind the primary antibody and enable detection via an enzyme (e.g., HRP) or fluorophore. | HRP-conjugated, Alexa Fluor-conjugated [75] [42] |
| Detection Substrates / Imagers | To generate a measurable signal (chemiluminescent or fluorescent) for visualizing the target protein. | SuperSignal West Pico PLUS, Azure Biosystems Imagers [75] [23] |
Selecting the right blocking buffer is a critical, system-dependent step that significantly impacts the success of a Western blot experiment. As evidenced, milk is a cost-effective general-purpose blocker, BSA is essential for phosphorylated targets and biotin-streptavidin systems, and purified or specialized commercial buffers offer alternatives for challenging optimizations. Empirical testing of several blockers for a given system is often the most reliable path to achieving optimal signal-to-noise ratios [75].
Furthermore, rigorous reporting of methodological details is paramount for reproducibility. A systematic review of publications found that many western blot methods sections lack essential information, including the blocking reagent and incubation duration [79]. To enhance the reliability and transparency of research, scientists should:
- Report the specific type and concentration of the blocking reagent used.
- Specify the duration and temperature of the blocking step.
- Provide complete antibody identifiers, including company, catalog number, and RRID where available [79].
- Adhere to journal guidelines for figure presentation, which often require including uncropped blot images with visible molecular weight markers in supplementary information [79] [23].
By integrating these strategic selection and reporting practices, researchers can bolster the quality, interpretability, and reproducibility of their Western blot data, thereby strengthening the overall validity of protein research findings.
Western blotting remains an indispensable technique for semi-quantitative protein analysis in research and drug development. A critical yet often overlooked aspect of this method is the normalization strategy employed to control for technical variances in protein loading and transfer efficiency. For decades, the scientific community has relied heavily on housekeeping proteins (HKPs) such as β-actin, GAPDH, and β-tubulin as internal controls, operating under the assumption that these proteins are ubiquitously and constitutively expressed across all cell types and experimental conditions [80]. However, a growing body of evidence demonstrates that this assumption is fundamentally flawed, potentially compromising data accuracy and leading to erroneous biological interpretations [81] [82].
This application note examines the limitations of traditional HKP normalization and presents total protein normalization (TPN) as a scientifically superior alternative. Supported by recent research and technological advancements, TPN offers enhanced accuracy, greater dynamic range, and improved reliability for quantitative western blotting, particularly in the context of complex research and drug development applications where precise protein quantification is paramount.
Limitations of Housekeeping Protein Normalization
Fundamental Flaws and Variability
The conventional use of HKPs as loading controls is predicated on their presumed stable expression. However, numerous studies have documented significant variability in HKP expression under various experimental and pathological conditions:
- Pathological Conditions: β-actin expression increases more than twofold following spinal cord injury, while GAPDH and β-actin show extremely low expression in Alzheimer's disease brains compared to controls [80]. Renal tumor tissue exhibits increased levels of all three major HKPs (β-actin, GAPDH, and β-tubulin) compared to normal kidney tissue [80].
- Experimental Manipulations: Cell confluence significantly affects α-actin and GAPDH levels [80]. Transfection with Von Hippel Lindau (VHL) reduces GAPDH expression, and microRNA inhibition or overexpression can also alter HKP levels [80].
- Tissue-Specific Variability: β-actin decreases with age in leukocytes and rat muscle, while GAPDH is unstable in adipose tissue [80].
Technical Limitations in Detection
Beyond biological variability, HKPs present significant technical challenges that affect quantification accuracy:
- Narrow Dynamic Range: HKPs are typically highly abundant, requiring researchers to limit sample loading to keep the HKP signal within the linear detection range. This is particularly problematic when detecting low-abundance proteins of interest (POIs) that require higher sample loads [81] [83].
- Signal Saturation: The high abundance of HKPs often results in rapid signal saturation during detection, especially with chemiluminescence methods. Saturated signals lose their quantitative value, as the relationship between protein abundance and signal intensity is no longer linear [80] [83].
- Antibody Compatibility Issues: In multiplex western blots comparing phosphorylated and non-phosphorylated protein forms, generating primary and secondary antibodies from non-overlapping species for both the POI and HKP adds complexity and cost [81].
Table 1: Documented Variability of Common Housekeeping Proteins Under Different Conditions
| Housekeeping Protein | Pathological Conditions | Experimental Conditions | Tissue-Specific Variations |
|---|---|---|---|
| β-actin | ↑ in spinal injury [80]↓ in Alzheimer's brain [80]↑ in kidney tumor [80] | Inconsistent detection with higher protein loads [80]Variable in miRNA treatments [80] | ↓ with age in leukocytes [80]↓ in rat muscle with age [80] |
| GAPDH | ↓ in Alzheimer's brain [80]↑ in kidney tumor [80] | ↓ with VHL transfection [80]Variable in miRNA treatments [80]Affected by cell confluence [80] | Unstable in adipose tissue [80]↓ with age in leukocytes [80] |
| β-tubulin | Altered in schizophrenia brain regions [80] | Unreliable for total loading protein (0.9-7.5 μg) [80] | Unstable in adipose tissue [80] |
The Superiority of Total Protein Normalization
Theoretical Foundations and Advantages
Total protein normalization addresses the fundamental limitation of HKP normalization by using the entire protein content of each sample as the internal reference rather than relying on a single protein. This approach operates on the principle that the total protein mass in each lane provides the most accurate representation of sample loading, effectively controlling for pipetting errors and transfer efficiency variations [81] [84].
The theoretical advantages of TPN include:
- Biological Robustness: By averaging across all proteins in the sample, TPN is minimally affected by changes in individual protein expression [83].
- Wider Dynamic Range: Total protein stains typically exhibit a linear dynamic range that encompasses common loading concentrations (10-50 μg), accommodating both low- and high-abundance proteins without signal saturation [81] [85].
- Experimental Flexibility: TPN does not require prior validation of reference protein stability for each new experimental system, saving time and resources [86].
Quantitative Evidence Supporting TPN Superiority
Recent research provides compelling quantitative evidence supporting TPN as a superior normalization method:
A 2025 study examining primary mature human adipocytes demonstrated that "TP exhibited the lowest variance among technical replicates compared to all investigated housekeeping proteins and was a superior normalization reference for the chosen protein-of-interest" [87]. The study further showed that TP normalization aligned most closely with expected values in protein gradient experiments and consistently demonstrated lower intra- and inter-individual variability across metabolically similar individuals [87].
Additional studies have confirmed that total protein staining methods show superior linearity compared to HKPs. Research by Gilda & Gomes (2013) found that while β-actin detection showed poor linearity with increasing protein loads, total protein measurements maintained excellent linearity across the same range [83].
Table 2: Performance Comparison of Normalization Methods
| Parameter | Housekeeping Proteins | Total Protein Normalization |
|---|---|---|
| Linear Dynamic Range | Narrow [81] | Large [81] [85] |
| Variability Between Technical Replicates | High [87] | Low [87] |
| Susceptibility to Biological Variation | High (varies with diseases, experimental conditions, tissue types) [80] | Low (minimal change with experimental conditions) [81] |
| Compatibility with Different Sample Types | Limited (may not be consistent across cell lines and tissues) [80] [87] | High (constant across sample types) [81] |
| Impact on Low-Abundance Protein Detection | Problematic (limits sample loading) [81] | Enables higher sample loading without losing linearity [85] |
Implementation Strategies and Protocols
Total Protein Staining Methods
Several effective methods exist for implementing TPN in western blotting workflows:
Fluorescent Total Protein Stains
Fluorescent stains like AzureRed Fluorescent Total Protein Stain offer high sensitivity (detecting less than 1 ng of protein per band), full compatibility with downstream western blotting or mass spectrometry, and the advantage of being non-toxic and biodegradable [81]. These stains can be applied before immunodetection and imaged simultaneously with the protein(s) of interest, streamlining the workflow [81].
Protocol: Fluorescent Total Protein Staining
- Following protein transfer, wash the membrane briefly with deionized water.
- Incubate the membrane with the fluorescent total protein stain according to manufacturer's instructions (typically 5-30 minutes).
- Destain briefly (if required per protocol) and image using an appropriate fluorescence imaging system.
- Proceed with standard blocking and immunodetection protocols.
Stain-Free Technology
Stain-free technology represents a significant advancement in TPN, utilizing trihalo compounds incorporated directly into polyacrylamide gels that covalently bind to tryptophan residues in proteins upon UV activation [87] [85]. This creates a fluorescent complex with intensity proportional to protein amount, enabling rapid total protein detection without additional staining steps [85].
Protocol: Stain-Free Western Blotting
- Prepare samples using standard Laemmli buffer and separate proteins on stain-free enabled gels.
- Following electrophoresis, activate the gel by exposing it to UV light in a stain-free compatible imager (e.g., Bio-Rad ChemiDoc MP) for approximately 5 minutes [87] [85].
- Transfer proteins to a low-fluorescence PVDF membrane using standard transfer protocols.
- Image the activated membrane to capture total protein signal before proceeding with immunodetection [87].
- Align total protein and target protein images for analysis using manufacturer's software.
Stain-Free Western Blot Workflow
Data Analysis and Normalization Protocol
Proper analysis is crucial for accurate TPN. The following protocol ensures reliable quantification:
- Image Acquisition: Capture both total protein and target protein images using appropriate imaging systems. Ensure neither signal is saturated.
- Lane Detection: Define lanes and bands for both total protein and target protein signals using analysis software.
- Background Subtraction: Apply consistent background subtraction across all lanes.
- Normalization Calculation: For each lane, calculate the normalized target protein expression using the formula: > Normalized Target Protein = (Target Protein Signal) / (Total Protein Signal in Same Lane)
- Statistical Analysis: Compare normalized values across experimental conditions using appropriate statistical tests.
For stain-free technology, the software typically automatically aligns the total protein and target protein images, eliminating the need for manual alignment [81].
Essential Reagents and Equipment
Successful implementation of TPN requires specific reagents and equipment optimized for total protein detection:
Table 3: Essential Research Reagent Solutions for Total Protein Normalization
| Reagent/Equipment | Function | Examples/Specifications |
|---|---|---|
| Fluorescent Total Protein Stains | Stains total protein on membrane; compatible with immunodetection | AzureRed Fluorescent Total Protein Stain [81] |
| Stain-Free Gels | Gels containing trihalo compounds for UV-activated total protein detection | Mini-PROTEAN TGX Stain-Free Gels [87] |
| Fluorescence-Compatible Imager | Imaging system capable of detecting fluorescent total protein stains | Azure Imaging Systems [81], ChemiDoc MP [87] |
| Low-Fluorescence PVDF Membrane | Membrane for stain-free workflows with minimal background fluorescence | Low fluorescence (LF) PVDF membrane [87] |
| Total Protein Normalization Software | Software for analyzing and normalizing target protein to total protein | Image Lab Software (Bio-Rad) [85] |
Total protein normalization represents a paradigm shift in western blot normalization strategies, addressing fundamental limitations of traditional housekeeping protein approaches. The documented variability of HKPs across pathological states, experimental conditions, and tissue types undermines their reliability as normalization standards [80]. In contrast, TPN offers superior linear dynamic range, lower technical variability, and greater biological robustness [81] [87].
The implementation of TPN through fluorescent protein stains or stain-free technology provides researchers and drug development professionals with a more accurate, efficient, and reliable method for protein quantification. As the scientific community continues to prioritize data rigor and reproducibility, adopting total protein normalization represents a critical step toward enhancing the reliability of protein research outcomes.
For laboratories seeking to implement these advanced normalization strategies, initial investment in compatible reagents and equipment is offset by significant improvements in data quality, reduced need for optimization, and ultimately, more biologically meaningful results.
Membrane and Detection Optimization for Enhanced Sensitivity and Reproducibility
Within the framework of a broader thesis on specific protein detection, the western blot technique remains a cornerstone of protein research. Its utility, however, is often compromised by challenges in sensitivity and reproducibility. These challenges frequently originate from two critical stages: the efficient transfer of proteins to a solid-support membrane and the subsequent detection of the target protein [88]. In quantitative western blotting, variability arises from unequal protein concentrations, inconsistent sample loading, and irregularities during transfer [13]. This application note details a comprehensive and optimized methodology for membrane transfer and detection, designed to empower researchers, scientists, and drug development professionals to generate high-quality, publication-ready data.
Membrane Selection and Transfer Optimization
The choice of membrane and the efficiency of protein transfer are pivotal first steps that directly influence the success of all subsequent experiments.
Membrane Selection Criteria
The two primary membrane types used are Polyvinylidene Fluoride (PVDF) and nitrocellulose, each with distinct advantages [88] [70]. The decision matrix for membrane selection is outlined in the table below.
Table 1: Guide to Membrane Selection for Western Blotting
| Membrane Type | Best For | Key Characteristics | Pretreatment Required |
|---|---|---|---|
| PVDF | Lowly expressed proteins; Hydrophilic/polar/charged antigens [70]. | High binding capacity and mechanical strength; ideal for stripping and reprobing [88]. | Pre-wetting in 100% methanol [88]. |
| Nitrocellulose | Normal or highly expressed proteins; Hydrophobic/non-polar antigens [70]. | Strong protein binding affinity; traditional choice [88]. | No pre-wetting required [88]. |
For fluorescent detection, membranes with low autofluorescence should be selected. Standard nitrocellulose or specialty low-fluorescence PVDF membranes are recommended to minimize background noise [89].
Optimizing Protein Transfer
The transfer of proteins from the gel to the membrane must be optimized for different protein sizes. The two common methods are wet (tank) transfer and semi-dry transfer.
Table 2: Comparison of Protein Transfer Methods
| Parameter | Wet (Tank) Transfer | Semi-Dry Transfer |
|---|---|---|
| Efficiency | High; considered the gold standard [88]. | Variable; can be less efficient for large proteins [88]. |
| Speed | Slower (typically 1 hour to overnight) [88] [41]. | Faster (e.g., 7-15 minutes) [89] [90]. |
| Best Suited For | Large proteins (>100 kDa); highest transfer efficiency [88]. | Small to medium-sized proteins; when speed is a priority [88]. |
| Heat Generation | Low, especially when performed in a cold room [88]. | Can generate significant heat [88]. |
Key Optimization Factors:
- Buffer Composition: A standard Tris-glycine buffer with 10-20% methanol is common. Methanol helps remove SDS from proteins, enhancing their binding to the membrane [88] [90]. For high molecular weight proteins (>150 kDa), adding 0.01–0.05% SDS to the transfer buffer can help pull them from the gel [89].
- Preventing Artifacts: It is crucial to remove all air bubbles from the gel-membrane stack during cassette assembly to ensure uniform transfer [88].
The following workflow diagram summarizes the key decision points for achieving optimal transfer.
Detection Methodologies: Chemiluminescence vs. Fluorescence
The choice of detection system profoundly impacts sensitivity, dynamic range, and the ability to multiplex.
Direct Comparison of Detection Technologies
Table 3: Characteristics of Chemiluminescence and Fluorescence Detection
| Characteristic | Chemiluminescence (ECL) | Fluorescence |
|---|---|---|
| Principle | HRP enzyme catalyzes a light-producing reaction [88]. | Fluorophore is excited by light and emits at a specific wavelength [88]. |
| Sensitivity | Very high, capable of detecting attogram levels [89]. | High, but can be lower than high-sensitivity ECL for some targets [4]. |
| Signal Duration | Transient (signal decays over minutes) [88]. | Stable (signal lasts for hours to days) [88]. |
| Dynamic Range | ~1 order of magnitude (film); ~3-4 orders (digital imagers) [4]. | 3-4 orders of magnitude [88] [4]. |
| Multiplexing | Limited; requires stripping and reprobing [4]. | Excellent; simultaneous detection of multiple targets [88] [4]. |
| Quantification | Challenging due to transient signal [88]. | Highly accurate and reproducible [88] [4]. |
Guidance for Detection Method Selection
The decision between chemiluminescence and fluorescence depends on the experimental goals, as illustrated below.
Optimization Strategies for Enhanced Sensitivity and Reproducibility
The Critical Role of Normalization: Moving Beyond Housekeeping Proteins
For quantitative western blotting, normalization accounts for technical variability to reveal true biological changes. While housekeeping proteins (HKPs) like GAPDH and β-actin have been widely used, they are falling out of favor with top journals because their expression can vary with experimental conditions, cell type, and pathology [13].
Total Protein Normalization (TPN) is now considered the gold standard for quantitative western blots [13]. TPN normalizes the target protein signal to the total amount of protein present in each lane, making it unaffected by changes in individual control proteins. It provides a larger dynamic range and information about the quality of electrophoresis and transfer. TPN can be achieved with fluorescent total protein stains or labeling technologies, which are fast, sensitive, and provide a uniform signal with low background [13].
Blocking and Antibody Incubation Optimization
- Blocking Agent Selection: Inadequate blocking is a primary cause of high background.
- Non-fat milk (5%): Cost-effective and versatile, but contains phosphoproteins and biotin that can interfere with phospho-protein detection or streptavidin-based systems [88] [70].
- Bovine Serum Albumin (BSA) (3-5%): Preferred for phosphorylated proteins and fluorescence, as it lacks interfering compounds [88] [70].
- Specialized Commercial Blockers: Can offer superior performance for specific applications like fluorescence, providing high signal-to-noise ratios [89].
- Antibody Optimization: Antibody concentration and incubation time must be empirically determined.
- Titration: Perform a dilution series for each new antibody (e.g., from 1:500 to 1:20,000) to find the optimal signal-to-noise ratio [70].
- Incubation: Overnight incubation of the primary antibody at 4°C is common for maximum sensitivity [88] [41].
- Fluorescence-Specific Tips: When using fluorescence, avoid sample buffers containing bromophenol blue, as they fluoresce and increase background. Run the dye front off the gel before transfer [89].
Troubleshooting Common Problems
Table 4: Troubleshooting Guide for Common Western Blot Issues
| Problem | Potential Causes | Solutions |
|---|---|---|
| High Background | Inadequate blocking; too much antibody; insufficient washing [88]. | Increase blocking agent concentration; titrate antibody down; increase wash number/duration (e.g., 3 x 10 min) [88] [70]. |
| Weak or No Signal | Low protein/antibody concentration; poor transfer; inactive substrate [88]. | Check transfer efficiency with reversible stain; use higher sensitivity substrate; test substrate functionality [88] [89]. |
| Non-Specific Bands | Low antibody specificity; insufficient blocking [88]. | Titrate primary antibody; try different blocking buffer (e.g., BSA instead of milk); add detergent (0.05% Tween-20) to buffers [88] [89] [70]. |
Detailed Experimental Protocols
Protocol 1: Standard Western Blot with Optimized Membrane Transfer
This protocol is adapted from established methods [41] [90] and incorporates optimization strategies for robustness.
I. Protein Extraction and Sample Preparation
- Lysis: Resuspend cell pellets in ice-cold RIPA or NP-40 lysis buffer (200 µL for a 10-cm dish) supplemented with fresh 1x protease and phosphatase inhibitors [41] [90].
- Clarification: Incubate on ice for 20 min, then centrifuge at 12,000-13,000 × g for 15 min at 4°C. Collect the supernatant [41] [90].
- Quantification: Determine protein concentration using a BCA or similar assay [41] [90].
- Denaturation: Mix protein with SDS loading buffer and a reducing agent (e.g., DTT). Boil at 95°C for 5-10 min [90] [91].
II. Electrophoresis and Transfer
- Gel Loading: Load 0–50 µg of total protein per lane onto a precast or hand-cast SDS-polyacrylamide gel. Include a prestained protein ladder [70] [90].
- Electrophoresis: Run the gel at constant voltage (100-150 V) until the dye front reaches the bottom [41] [90].
- Membrane Preparation: Cut a PVDF membrane to the gel's size and activate it in 100% methanol for 5 min. Equilibrate both the membrane and gel in transfer buffer [90] [91].
- Transfer Assembly: Assemble the transfer stack in a cassette, ensuring no air bubbles are trapped. For wet transfer, submerge the cassette in a tank filled with cold Tris-glycine buffer with 10-20% methanol and transfer at 100 V for 1 hour or at 30 V overnight at 4°C [88] [41]. For semi-dry transfer, assemble the stack and transfer at constant current (e.g., 2.5 A) for 7-13 minutes [90].
III. Immunodetection
- Blocking: Incubate the membrane in 5% non-fat milk or 3-5% BSA in TBST for 1 hour at room temperature on a shaker [41] [90].
- Primary Antibody Incubation: Incubate membrane with primary antibody diluted in blocking buffer or BSA/TBST overnight at 4°C on a shaker [41] [90].
- Washing: Wash the membrane 3 times for 5-10 minutes each with TBST [41] [90].
- Secondary Antibody Incubation: Incubate with HRP- or fluorophore-conjugated secondary antibody (diluted 1:10,000 to 1:20,000 in blocking buffer) for 1 hour at room temperature [41] [90].
- Washing: Repeat washing step as above [41] [90].
IV. Detection and Analysis
- Chemiluminescence: Incubate membrane with ECL substrate for ~1 minute. Capture signal using a digital imager or X-ray film [41] [91].
- Fluorescence: Image the membrane using a fluorescence-capable imaging system with the appropriate excitation/emission settings [89] [4].
- Normalization and Quantification: Perform Total Protein Normalization for accurate quantitation. Use imaging software for densitometric analysis [13] [4].
Protocol 2: Total Protein Normalization (TPN) for Quantitative Westerns
This protocol can be integrated into Protocol 1 prior to blocking.
- After protein transfer, rinse the membrane briefly in deionized water or TBST.
- Incubate the membrane with a total protein stain (e.g., Swift Stain) or a fluorescent protein labeling reagent according to the manufacturer's instructions [13] [90].
- For a fluorescent label, image the membrane immediately to capture the total protein signal in all lanes.
- Proceed with the standard blocking and immunodetection steps (Protocol 1, Section III).
- During analysis, normalize the signal intensity of your target protein band to the total protein signal in the corresponding lane [13].
The Scientist's Toolkit: Essential Reagents for Optimization
Table 5: Key Research Reagent Solutions for Western Blot Optimization
| Reagent / Tool | Function | Example Products |
|---|---|---|
| High-Sensitivity ECL Substrate | Enables detection of low-abundance proteins; allows use of less antibody and sample [89]. | SuperSignal West Atto [89]. |
| Total Protein Normalization Reagent | Provides superior loading control for quantification by staining all proteins on the membrane [13]. | No-Stain Protein Labeling Reagent [13]. |
| Fluorescent Blocking Buffer | Specifically formulated to reduce background and cross-reactivity in fluorescence detection [89]. | Blocker FL Fluorescent Blocking Buffer [89]. |
| Automated Western System | Standardizes incubation and washing, reducing manual variability and saving antibody [89]. | iBind Western System [89]. |
| Fast Transfer Device | Enables efficient transfer of proteins, including high MW targets, in under 10 minutes [89]. | iBlot 2 Gel Transfer Device [89]. |
| Low-Fluorescence PVDF Membrane | Minimizes autofluorescence, a key factor for achieving low background in fluorescent Westerns [89]. | Thermo Scientific Low-Fluorescence PVDF Membrane [89]. |
Ensuring Specificity: Antibody Validation, Method Comparison, and Future Directions
Within the broader context of Western blot research for detecting specific proteins, the reproducibility of experimental findings is paramount. A significant source of irreproducibility stems from the use of poorly characterized antibodies, leading to inaccurate data and misinterpretation of biological mechanisms [69]. Antibody validation is the experimental proof and documentation that a particular antibody is suitable for its intended application, confirming its specificity (ability to recognize the target epitope) and selectivity (preference for the target in a complex mixture) within a defined assay context [69]. For Western blotting, the use of genetic strategies involving knockout (KO) and knockdown (KD) cells represents the most definitive "gold standard" for validating antibody specificity [92] [69]. This application note provides detailed methodologies and data interpretation guidelines for employing these critical negative controls, thereby fortifying the reliability of protein detection data in research and drug development.
The Critical Role of Genetic Controls in Antibody Validation
Genetic controls provide a direct method to test an antibody's specificity by removing or reducing the intended target protein. In a KO strategy, the gene encoding the target protein is permanently disrupted, preventing its expression. In a KD strategy, the messenger RNA (mRNA) of the target is degraded, leading to a reduction in protein levels [92] [93]. When a specific antibody is used in a Western blot against these genetically modified samples, a significant loss or complete absence of signal should be observed, confirming that the antibody is specifically binding to the target protein [92] [94].
The choice between knockout and knockdown methods depends on the experimental goals and constraints, each with distinct advantages.
Table 1: Comparison of Knockout and Knockdown Validation Methods
| Feature | Knockout (e.g., CRISPR-Cas9) | Knockdown (e.g., RNAi/siRNA) |
|---|---|---|
| Mechanism | Permanent gene disruption at the DNA level [92] | Degradation of target mRNA, reducing protein translation [92] [93] |
| Effect on Protein | Complete and permanent absence of the target protein [92] | Transient reduction of target protein levels (typically 50-90%) [95] [93] |
| Best For | Providing a definitive negative control; high-precision validation [93] | Validating antibodies for essential genes where knockout is lethal; testing when pre-designed RNAi reagents are available [93] |
| Limitations | Not suitable for essential genes required for cell survival [93] | Efficiency can vary; potential for off-target effects; residual protein signal may remain [93] |
The following workflow diagram outlines the critical decision points and steps for implementing these genetic validation strategies:
Experimental Protocols
Protocol 1: Antibody Validation Using CRISPR-Cas9 Knockout Cells
This protocol utilizes CRISPR-Cas9 to generate a definitive negative control cell line lacking the target protein [92].
Materials:
- CRISPR-Cas9 system (sgRNA targeting your gene of interest, Cas9 endonuclease)
- Appropriate cell line (e.g., SK-BR-3 for ErbB2 validation [92])
- Transfection reagent
- Selection antibiotic (e.g., puromycin)
- Lysis Buffer (e.g., RIPA buffer) with protease inhibitors [9]
- Standard Western blot apparatus and reagents
Method:
- sgRNA Design and Transfection: Design a non-coding single-guide RNA (sgRNA) molecule to direct the Cas9 endonuclease to your target gene. Transfect the sgRNA and Cas9 into your chosen cell model using standard methods [92].
- Selection and Cloning: Treat cells with a selection antibiotic (e.g., puromycin) to eliminate non-transfected cells. Isolate single cell clones and expand them to establish stable knockout lines.
- Confirmation of Knockout: Confirm the knockout at the genetic level by sequencing the target genomic locus. Functional knockout must be confirmed by Western blot using a validated antibody [92].
- Sample Preparation: Culture both control (wild-type) and knockout cells. Prepare whole cell extracts using a suitable lysis buffer (e.g., RIPA) supplemented with protease and phosphatase inhibitors. Determine protein concentration using a Bradford or BCA assay [9].
- Western Blot Analysis: Load equal amounts of protein (e.g., 30 µg) from control and knockout lysates onto an SDS-PAGE gel. After electrophoresis and transfer, probe the membrane with the antibody under validation. A specific antibody will show a clear loss of signal in the knockout lane compared to the control [92].
Table 2: Example Data from CRISPR-Cas9 Knockout Validation
| Target Protein | Cell Line | Control Signal | KO Signal | Observed Band Size | Antibody Specificity Conclusion |
|---|---|---|---|---|---|
| ErbB2 (HER-2) [92] | SK-BR-3 | Strong band at 185 kDa | Loss of signal | 185 kDa | Specific: Antibody signal is dependent on target presence. |
| EGFR [92] | A431 | Strong signal by immunofluorescence | Loss of signal | N/A | Specific: Antibody signal is dependent on target presence. |
Protocol 2: Antibody Validation Using RNAi Knockdown
This protocol uses RNA interference (RNAi) to transiently reduce target protein expression, serving as a robust negative control [92] [95] [93].
Materials:
- Validated siRNA or shRNA targeting the gene of interest
- Non-targeting scrambled siRNA control [92] [95]
- Transfection reagent optimized for your cell line
- Appropriate cell line (e.g., HeLa, SH-SY5Y [92])
- Lysis Buffer and Western blot reagents as in Protocol 1
Method:
- siRNA Transfection: Seed cells in a 96-well or larger plate format. The next day, transfert cells with a pool of target-specific siRNAs. Include controls: an untreated well and a well transfected with a non-targeting (scrambled) siRNA [92].
- Incubation: Culture the transfected cells for 48-72 hours to allow for degradation of the target mRNA and subsequent reduction of the target protein.
- Knockdown Efficiency Check (optional): Harvest a small portion of the cells to check knockdown efficiency at the mRNA level via RT-qPCR [92].
- Sample Preparation and Western Blot: Lyse the remaining cells from all conditions. Perform a Western blot as described in Protocol 1. Probe the membrane with the antibody under validation and a loading control antibody (e.g., against Actin or Tubulin). A specific antibody will show a significant reduction in signal intensity in the target siRNA lane compared to the untreated and scrambled controls [92] [95].
Table 3: Example Data from RNAi Knockdown Validation
| Target Protein | Cell Line | Control Signal | siRNA Signal | Reduction | Antibody Specificity Conclusion |
|---|---|---|---|---|---|
| SMAD2 [92] | HeLa | Strong band | Significant knockdown | >70% (by densitometry) | Specific: Signal reduction correlates with target knockdown. |
| CHD7 [92] | SH-SY5Y | Strong signal by immunofluorescence | Marked reduction | Visual loss of signal | Specific: Signal is dependent on target protein levels. |
| PPIB [95] | U-251 | Strong band | Significant knockdown | >50% (by densitometry) | Specific: Signal reduction confirms target specificity. |
The Scientist's Toolkit: Essential Research Reagents
Successful implementation of knockout and knockdown validation protocols requires a set of key reagents, each with a critical function.
Table 4: Key Reagent Solutions for Genetic Validation
| Reagent / Solution | Function & Importance | Examples & Notes |
|---|---|---|
| CRISPR-Cas9 System | Enables precise gene knockout by cleaving target DNA [92]. | Includes sgRNA and Cas9 nuclease. |
| Validated siRNA/shRNA | Triggers RNAi pathway to degrade target mRNA and knock down protein levels [92] [93]. | Use a pool of siRNAs or a validated shRNA vector. A non-targeting scrambled siRNA is a critical negative control [92]. |
| Lysis Buffer | Extracts soluble proteins from cells or tissues while maintaining protein integrity [9]. | RIPA or non-denaturing buffers, supplemented with protease and phosphatase inhibitors to prevent degradation [9]. |
| Loading Control Antibody | Detects a constitutively expressed protein to verify equal loading and transfer across lanes [92] [69]. | Antibodies against β-Actin, α-Tubulin, or GAPDH. Note: Housekeeping protein expression can vary, and total protein normalization is increasingly favored [13]. |
Data Interpretation and Troubleshooting
Interpreting the results from KO/KD experiments requires careful analysis. A clear loss of signal in the KO/KD lane is the primary indicator of a specific antibody [92]. However, several other factors must be considered:
- Multiple Bands: Multiple bands may represent splice variants, post-translational modifications, or protein degradation products. However, they could also indicate non-specific binding if they do not disappear in the KO/KD lane [69].
- Residual Signal: In knockdown experiments, some residual signal is expected due to the transient and often incomplete nature of protein suppression. A significant, reproducible reduction (e.g., >50% [95]) confirms specificity.
- Band Intensity Consistency: The intensities of bands used as loading controls should be consistent across all lanes. Inconsistent control bands suggest problems with sample loading, transfer, or loading control antibody performance, which must be addressed before interpreting the target signal [93].
Integrating genetic strategies like knockout and knockdown controls into antibody validation workflows is no longer optional for rigorous Western blot analysis. These methods provide the most direct evidence of antibody specificity, thereby enhancing data reliability and reproducibility. By adopting the detailed protocols and guidelines outlined in this application note, researchers and drug development professionals can make informed decisions about antibody quality, ultimately accelerating scientific discovery and the development of robust diagnostic and therapeutic products.
The detection and analysis of specific proteins are fundamental to advancing research in molecular biology, biomarker discovery, and drug development. Within this context, techniques such as Western blotting, Enzyme-Linked Immunosorbent Assay (ELISA), and Mass Spectrometry (MS) serve as critical tools, each with distinct principles and applications. Western blotting is a routine technique for protein analysis that combines gel electrophoresis with immunodetection to identify specific proteins within a complex mixture [14]. ELISA is a highly sensitive and specific plate-based immunoassay technique for quantitatively and qualitatively analyzing antibodies or antigens, including proteins, hormones, and peptides [96] [97]. Mass Spectrometry comprises a powerful set of analytical techniques that detect, characterize, and quantify various analytes based on their mass-to-charge ratio (m/z), playing an increasingly vital role in proteomics and biomarker validation [98] [99] [100]. This article provides a comparative analysis of these three techniques, detailing their methodologies, applications, and relative advantages to guide researchers in selecting the appropriate tool for protein detection in scientific and diagnostic endeavors.
Principles and Applications
Western Blotting
Western blotting operates on the principle of separating proteins by molecular weight using gel electrophoresis, transferring them to a membrane, and probing them with specific antibodies for detection [9] [14]. This process provides information on the presence, relative abundance, and approximate molecular weight of a target protein. Its key applications include confirming protein identity, analyzing protein expression changes, investigating post-translational modifications, and studying protein-protein interactions [96] [101]. It is particularly valuable as a confirmatory tool for results generated from other methods like ELISA [96].
ELISA
ELISA relies on the specific interaction between an antigen and an antibody, with the detection antibody typically conjugated to an enzyme that produces a measurable signal, usually a color change, upon adding a substrate [97] [101]. The signal intensity is proportional to the amount of target present in the sample. Its main applications span disease diagnosis (e.g., HIV, hepatitis, COVID-19), quantifying biomarkers, vaccine development and monitoring, drug testing, food safety analysis, and environmental monitoring [96] [97] [101]. Its high throughput makes it ideal for screening large numbers of samples.
Mass Spectrometry
Mass spectrometry identifies and quantifies molecules by measuring their mass-to-charge ratio. Advanced MS methods can characterize proteins, identify post-translational modifications, and perform quantitative proteomics in complex biological samples [98] [99]. Its applications include proteome-wide profiling, protein sequencing, post-translational modification analysis, drug target identification, and spatial mapping of molecules in tissues [98] [100]. MS is a cornerstone for discovery-based research and is increasingly used for precise quantification of proteins and metabolites.
Comparative Technical Specifications
Table 1: Comparative analysis of key technical parameters for Western blot, ELISA, and Mass Spectrometry.
| Parameter | Western Blot | ELISA | Mass Spectrometry |
|---|---|---|---|
| Detection Principle | Size-based separation & immunodetection [9] [14] | Antigen-antibody binding with enzymatic signal [96] [97] | Mass-to-charge ratio measurement [98] [99] |
| Quantitative Capability | Semi-quantitative [101] | Fully quantitative [96] [102] | Fully quantitative (targeted) [102] |
| Throughput | Low to medium (10-15 samples/gel) [101] | High (96- or 384-well plates) [96] [102] | Variable (Low for discovery, high for targeted) [98] |
| Sensitivity | Moderate | High (can detect nanomolar concentrations) [96] | Very High (femtomole to attomole) [100] |
| Multiplexing Capability | Low to Moderate (with fluorescent detection) [96] [14] | Low (unless multiplex ELISA panels) [102] | High (1000s of proteins in one run) [98] |
| Information Provided | Molecular weight, protein identity, modifications [96] [101] | Presence and concentration of target [96] | Molecular identity, sequence, modifications, structure [98] |
| Best Used For | Target confirmation, expression analysis, modification studies [96] [101] | High-throughput screening and precise quantification [96] [102] | Discovery proteomics, detailed characterization, biomarker ID [98] [102] |
Experimental Protocols
Western Blot Protocol
The following workflow outlines the key steps in a standard Western blot procedure for detecting specific proteins from cell culture or tissue samples [9] [14].
Detailed Methodology:
- Sample Preparation: Lyse cells or tissues in an appropriate buffer (e.g., RIPA) containing protease and phosphatase inhibitors. Determine protein concentration using a Bradford or BCA assay. Dilute lysates in loading buffer containing DTT and denature by heating at 95-100°C for 5-10 minutes [9].
- Gel Electrophoresis: Load an equal amount of protein (10-40 µg for lysates) onto an SDS-polyacrylamide gel. Include a molecular weight ladder. Run the gel at an appropriate voltage until the dye front reaches the bottom to separate proteins by size [9].
- Protein Transfer: Assemble a "sandwich" to transfer proteins from the gel to a nitrocellulose or PVDF membrane using wet, semi-dry, or dry electrotransfer systems [14].
- Blocking: Incubate the membrane in a blocking agent (e.g., BSA, non-fat dry milk, or commercial blocking buffers) for 1 hour at room temperature to prevent non-specific antibody binding [14].
- Antibody Incubation and Detection: Incubate the membrane with a primary antibody specific to the target protein, typically overnight at 4°C. After washing, incubate with an enzyme-conjugated secondary antibody (e.g., HRP-conjugated) for 1-2 hours at room temperature. After final washes, detect the signal using chemiluminescent, fluorescent, or colorimetric substrates and capture the image with film or a digital imager [9] [14].
ELISA Protocol
The Sandwich ELISA protocol, known for its high sensitivity, is detailed below [97] [101].
Note: For a direct Sandwich ELISA, the detection antibody is already enzyme-conjugated, so the "Enzyme-Linked Antibody Incubation" step is omitted [101].
Detailed Methodology:
- Coating: Dilute the capture antibody in a coating buffer and add it to a 96-well microplate. Incubate for one hour at 37°C or overnight at 4°C. Wash the plate with PBS or a similar buffer to remove unbound antibody [97].
- Blocking: Add a blocking solution (e.g., 1% BSA) to cover all unbound sites on the plate and incubate for 1-2 hours at room temperature. Wash the plate [97] [101].
- Sample and Detection Antibody Incubation: Add the sample or calibrator containing the antigen and incubate (e.g., 90 minutes at 37°C) to allow antigen binding to the capture antibody. Wash. Add the detection antibody and incubate. For indirect detection, wash and then add an enzyme-conjugated secondary antibody and incubate [97] [101].
- Signal Detection and Readout: After a final wash, add the enzyme substrate (e.g., TMB for HRP). Incubate in the dark for 15-30 minutes until color develops. Stop the reaction with an acid and measure the absorbance of each well with a plate reader [97].
Mass Spectrometry Workflow for Proteomics
While specific MS protocols vary greatly, a generalized workflow for a bottom-up proteomics analysis is described below [98] [99].
Detailed Methodology:
- Sample Preparation: Complex protein mixtures are extracted from cells or tissues. Proteins are denatured, reduced, and alkylated. They are then digested with a protease (typically trypsin) to generate peptides, which are more amenable to MS analysis [98].
- Chromatographic Separation: The complex peptide mixture is fractionated and separated by liquid chromatography (LC), typically using a reversed-phase column with a gradient of increasing organic solvent, which is coupled directly to the mass spectrometer (LC-MS/MS) [98].
- Ionization and Mass Analysis: Peptides are ionized, most commonly by electrospray ionization (ESI). The mass spectrometer first performs a survey scan (MS1) to determine the mass-to-charge ratio (m/z) of intact peptide ions. Then, it selectively fragments the most abundant peptide ions (MS2) [98] [100].
- Data Analysis and Protein Identification: The fragmentation spectra (MS2) are recorded and searched against protein sequence databases using specialized software algorithms to identify the amino acid sequences of the peptides and infer the original protein identities [98] [99].
Research Reagent Solutions
Table 2: Essential reagents and materials for Western Blot, ELISA, and Mass Spectrometry.
| Technique | Essential Reagents & Kits | Function |
|---|---|---|
| Western Blot | Lysis Buffer (e.g., RIPA) [9] | Extracts proteins from cells/tissues. |
| Protease/Phosphatase Inhibitors [9] | Preserves protein integrity during extraction. | |
| SDS-PAGE Gels & Running Buffer [9] | Separates proteins based on molecular weight. | |
| Transfer Membrane (Nitrocellulose/PVDF) [14] | Immobilizes separated proteins for probing. | |
| Blocking Buffer (e.g., BSA, milk) [14] | Prevents non-specific antibody binding. | |
| Primary & Secondary Antibodies [14] | Specifically bind and detect the target protein. | |
| Chemiluminescent/Fluorescent Substrate [9] | Generates detectable signal. | |
| ELISA | Coated Microplates [97] | Solid phase for antigen-antibody binding. |
| Coating Antigen/Antibody [97] [101] | The immobilized target-capture molecule. | |
| Detection Antibody (Matched Pair) [102] [101] | Binds to a different epitope on the captured antigen. | |
| Enzyme-Conjugated Secondary Antibody [97] | Binds to the detection antibody for signal generation. | |
| Enzyme Substrate (e.g., TMB, pNPP) [97] | Produces a measurable colorimetric, chemiluminescent, or fluorescent signal. | |
| Stop Solution [101] | Halts the enzyme-substrate reaction. | |
| Mass Spectrometry | Protease (e.g., Trypsin) [98] | Digests proteins into peptides for analysis. |
| Liquid Chromatography (LC) System [98] | Separates peptides prior to ionization. | |
| Mass Spectrometer [98] [100] | Ionizes and separates ions by m/z; detects fragments. | |
| Database Search Software [98] [99] | Identifies peptides/proteins from spectral data. |
The choice between Western blot, ELISA, and mass spectrometry is dictated by the specific research question, required throughput, desired level of quantification, and the need for multiplexing or detailed characterization.
Technique Selection Guidelines:
- Choose Western Blot when you need to confirm the identity of a specific protein, determine its molecular weight, investigate its post-translational modifications (e.g., phosphorylation), or analyze protein-protein interactions. It is best suited for low-to-medium throughput, qualitative, and semi-quantitative applications where visual confirmation of the target is valuable [96] [101].
- Choose ELISA when your goal is the precise, high-throughput quantification of a specific protein or antibody in a large number of samples, such as in clinical diagnostics, biomarker validation, or drug concentration monitoring. Its superior quantitative ability, sensitivity, and ease of use make it ideal for screening [96] [102] [97].
- Choose Mass Spectrometry for discovery-phase research, such as unbiased proteome profiling, identifying unknown proteins, characterizing complex post-translational modification patterns, or when absolute specificity and high sensitivity are required beyond what immunoassays can provide [98] [102].
In conclusion, Western blotting, ELISA, and mass spectrometry are complementary, not competing, technologies in the protein analysis toolkit. A robust research strategy often involves using them in concert; for example, using MS for initial biomarker discovery, followed by ELISA for high-throughput validation in large cohorts, and employing Western blot for subsequent mechanistic studies on confirmed targets. Understanding the comparative strengths and limitations of each technique, as outlined in this analysis, empowers researchers to design more effective experiments and accelerate scientific discovery and drug development.
Within the broader thesis on Western blot for detecting specific proteins, this application note details the critical technological evolution from traditional, manual procedures toward automated and multiplexed platforms. For researchers, scientists, and drug development professionals, mastering these advancements is no longer a luxury but a necessity for enhancing reproducibility, throughput, and data quality in protein analysis. The global market for Western blotting processors is experiencing significant growth, driven by these very technological expansions and an increasing demand in biomedical research and diagnostics [103]. This document provides a detailed overview of the market landscape, direct comparisons of automated systems, and robust protocols to facilitate the adoption of these powerful techniques in your research.
The Western blotting processors market is on a steady growth trajectory, underpinned by the widespread adoption of automation. The market is expected to register a Compound Annual Growth Rate (CAGR) of 5.7% from 2025 to 2031 [103]. In a related segment, the Automated Western Blotting Processors Market was valued at 9.81 billion in 2025 and is projected to grow at a much steeper CAGR of 12.8% from 2026 to 2033, reaching 20.21 billion by 2033 [104]. This growth is fueled by several key drivers: the rise in biomedical research for drug development, technological expansions that improve sensitivity and accuracy, and the rising demand for diagnostic applications for diseases like autoimmune disorders and viral infections [103].
Future trends point toward a greater shift toward automation to increase throughput and reproducibility, the integration of multi-analyte systems with other methods like ELISA or PCR, and the development of portable and compact systems for smaller laboratory spaces [103]. Key opportunities for researchers and industry players lie in the expansion into emerging markets, the development of multiplex assays for diagnostics and personalized medicine, and collaboration with diagnostic companies to integrate Western blotting into clinical testing systems [103].
Table 1: Western Blotting Processors Market Overview and Projections
| Metric | Value | Source / Segment |
|---|---|---|
| Market CAGR (2025-2031) | 5.7% | Western Blotting Processors Market [103] |
| Market CAGR (2026-2033) | 12.8% | Automated Western Blotting Processors Market [104] |
| Market Value (2025) | 9.81 Billion | Automated Western Blotting Processors Market [104] |
| Projected Market Value (2033) | 20.21 Billion | Automated Western Blotting Processors Market [104] |
| Key Growth Drivers | Increase in biomedical research, Technological expansions, Rising diagnostic applications [103] | |
| Key Future Trends | Shift toward automation, Integration of multi-analyte systems, Portable/compact systems [103] |
Comparison of Automated Western Blotting Systems
Automation in Western blotting ranges from semi-automated devices that handle specific steps to fully automated systems that integrate the entire process. A direct comparison of these methods reveals distinct advantages and trade-offs. A seminal 2023 study directly compared traditional Western blotting with two automated systems: the iBind Flex (semi-automated) and the JESS Simple Western (fully automated) [105].
The fully automated JESS Simple Western system demonstrated significant benefits in saving time and offering valuable sensitivity, which is particularly beneficial for limited sample amounts [105]. It automates all steps downstream of sample preparation and loading, including size separation, immunoblotting, imaging, and analysis within a capillary-based system [105] [106]. This eliminates the gel-to-membrane transfer step, a major source of variability in traditional Western blotting, thereby enhancing reproducibility and quantification [106]. The main downside is the higher cost of devices and reagents [105].
In contrast, the iBind Flex is a semi-automated system designed to perform the immunoblotting procedure (blocking, antibody incubations, and washes) [105]. It reduces hands-on time but leaves sample preparation, gel electrophoresis, membrane transfer, and imaging to the user [105]. While it requires higher antibody concentrations, it uses smaller volumes, reducing overall antibody consumption [105].
Table 2: Direct Comparison of Traditional and Automated Western Blotting Methods
| Parameter | Traditional WB | iBind Flex (Semi-Automated) | JESS Simple Western (Fully Automated) |
|---|---|---|---|
| Principle | Manual SDS-PAGE, membrane transfer, and immunoprobbing [105] | Sequential lateral flow for automated immunodetection after manual gel and transfer [105] | Fully automated capillary-based size separation and immunodetection [105] [106] |
| Hands-on Time | High (1-3 days) [105] | Reduced | Minimal ("load your samples and press start") [106] |
| Total Time to Results | 1-3 days [105] | Reduced hands-on time, but similar total time | ~3 hours [106] [107] |
| Sample Consumption | ~10-20 µg total protein [108] | Similar to Traditional WB | 3 µL of sample; low sample consumption [106] |
| Reproducibility | Subject to user variability | Improved for immunodetection step | High reproducibility due to full automation and no transfer [106] |
| Multiplexing Capability | Limited, requires stripping/reprobing [109] | Limited, requires stripping/reprobing | High-sensitivity multiplex in fluorescence channels [106] |
| Key Advantage | Low cost, well-established | Reduced hands-on time during immunoblotting | Speed, sensitivity, reproducibility, and quantification |
| Key Limitation | Time-consuming, variable, labor-intensive | Does not automate electrophoresis or transfer | Cost of device and reagents [105] |
Detailed Protocols for Automated and Multiplexed Western Blotting
Protocol: Automated Western Blotting Using JESS Simple Western
This protocol outlines the procedure for running a fully automated Western blot on the JESS Simple Western system (or similar capillary-based systems) for quantitative protein analysis [105] [106] [107].
Principle: The assay combines protein separation by capillary electrophoresis with subsequent immunodetection within the same capillary. Proteins are separated by size, immobilized to the capillary wall via photo-activated chemistry, and then probed with antibodies. Detection is achieved via chemiluminescence or fluorescence, with integrated imaging and analysis [107].
Materials:
- JESS Simple Western instrument (ProteinSimple, Bio-Techne) [106]
- Capillary cartridge and assay plate [106]
- Compass software [106]
- Samples (cell lysates, tissue lysates)
- Primary antibodies validated for Western blot
- HRP-conjugated or fluorescently conjugated secondary antibodies
- Fluorescent master mix (for sample preparation)
- Separation matrix, stacking matrix, and other reagents as per the manufacturer's kit (e.g., EZ standard pack) [105]
Method:
- Sample and Reagent Preparation: Prepare your samples and reagents as you would for a traditional Western blot.
- Dilute lysates to a total protein concentration of 0.1–0.5 µg/µL in a fluorescent master mix. A typical dilution is 1:1 in 2x fluorescent master mix [105].
- Prepare primary and secondary antibody dilutions in the provided diluent according to the manufacturer's recommendations and your optimization.
Plate Loading:
- Load 3 µL of each prepared sample into individual wells of the assay plate [106].
- Load the primary antibody, secondary antibody, chemiluminescent substrate (if applicable), and wash buffers into their designated wells on the same plate.
- If using, load the protein normalization reagent into its designated well for total protein load comparison between capillaries [107].
Instrument Setup and Run:
- Place the loaded assay plate and a capillary cartridge into the JESS Simple Western instrument.
- In the Compass software, select the appropriate assay method (size-based or charge-based, chemiluminescence or fluorescence).
- Start the run. The instrument will automatically perform all subsequent steps:
- Separation: Capillaries are filled with separation and stacking matrices. The sample is loaded, and voltage is applied to separate proteins by molecular weight [107].
- Immobilization: Proteins are cross-linked to the capillary wall using UV light [107].
- Immunoprobbing: The system automatically performs blocking, incubations with primary and secondary antibodies, and washes inside the capillary [107].
- Detection & Analysis: For chemiluminescence, the signal is recorded by a CCD camera. For fluorescence, fluorophores are excited and the emission is detected. The software generates electropherograms and provides quantitative data, including molecular weight and relative protein abundance [107].
Protocol: Multiplexed Fluorescent Western Blotting
Multiplexing allows for the simultaneous detection of multiple targets on the same blot, enabling precise quantification and normalization [110].
Principle: Different primary antibodies from unique host species (e.g., mouse and rabbit) are used to detect multiple proteins. They are visualized simultaneously using species-specific secondary antibodies conjugated to distinct fluorescent dyes with non-overlapping emission spectra [110].
Materials:
- Nitrocellulose membrane (exhibits lower autofluorescence than PVDF) [110]
- Primary antibodies from different species (e.g., mouse monoclonal and rabbit polyclonal)
- Highly cross-adsorbed secondary antibodies conjugated to infrared dyes (e.g., IRDye 680RD and 800CW) [110]
- Fluorescence-optimized blocking buffer
- Licor Odyssey CLx or similar fluorescent imaging system
Method:
- Gel Electrophoresis and Transfer:
- Perform standard SDS-PAGE according to your established protocol.
- Transfer proteins to a nitrocellulose membrane to minimize background autofluorescence [110].
Blocking:
- Block the membrane with fluorescence-optimized blocking buffer for 1 hour at room temperature. Avoid using milk-based blockers, as undissolved particles can create fluorescent artifacts [110].
Primary Antibody Incubation:
- Incubate the membrane with a cocktail of primary antibodies from different species, diluted in blocking buffer. The antibodies should be individually titrated for optimal signal-to-noise ratio [110].
- Incubate overnight at 4°C on a shaker.
Washing:
- Wash the membrane 4 times for 5 minutes each with TBST (Tris-buffered saline with 0.1% Tween-20).
Secondary Antibody Incubation:
- Incubate the membrane with a cocktail of highly cross-adsorbed secondary antibodies conjugated to different fluorescent dyes (e.g., IRDye 680RD donkey anti-rabbit and IRDye 800CW donkey anti-mouse), diluted in blocking buffer.
- Protect the membrane from light by wrapping it in aluminum foil during incubation.
- Incubate for 1 hour at room temperature on a rocker.
Washing and Imaging:
- Wash the membrane again as in step 4, keeping it protected from light.
- Image the membrane using a fluorescent scanner like the Licor Odyssey CLx. Use the appropriate channels for each fluorescent dye to capture the signals separately.
The Scientist's Toolkit: Essential Research Reagent Solutions
Successful implementation of automated and multiplexed Western blotting relies on a set of key reagents and materials. The following table details these essential components.
Table 3: Essential Research Reagent Solutions for Automated and Multiplexed Western Blotting
| Item | Function/Description | Example/Note |
|---|---|---|
| Capillary Cartridge & Assay Plate | Consumables for fully automated systems like JESS; the capillary replaces the gel and membrane, and the plate holds all reagents. | JESS Simple Western consumables [106] |
| Validated Primary Antibodies | Antibodies with confirmed specificity and performance in Western blot are critical for reliable results. | Over 6,000 antibodies have been validated for use on the Simple Western platform [106]. |
| Fluorescently-Conjugated Secondary Antibodies | Secondary antibodies conjugated to fluorophores (e.g., IRDye) for multiplex detection; must be highly cross-adsorbed to minimize cross-reactivity. | IRDye 680RD and 800CW [110] |
| Fluorescence-Optimized Blocking Buffer | A blocking solution formulated to minimize autofluorescence, which can cause high background. | Commercially available PBS- or TBS-based formulations [110] |
| Nitrocellulose Membrane | The preferred membrane for fluorescent Western blotting due to its low autofluorescence compared to standard PVDF. | Low-fluorescence PVDF is an alternative if PVDF is required [110]. |
| Protein Normalization Reagent | A fluorescent dye that reacts with total protein, allowing for normalization of target protein expression against total protein load within each capillary. | Used in JESS Simple Western for in-capillary total protein normalization [107]. |
| Microfluidic Chip | A glass or polymer device with etched channels for miniaturized separations, enabling high-resolution, multiplexed blotting. | Used in advanced multiplexed MCE-Western platforms [108]. |
Workflow and Signaling Pathway Diagrams
Automated Western Blotting Workflow
The following diagram illustrates the streamlined workflow of a fully automated capillary-based Western blotting system, highlighting the significant reduction in hands-on steps.
Multiplexed Detection Logic
This diagram outlines the decision-making process and experimental strategy for implementing multiplexing in Western blotting, whether on traditional or automated platforms.
Western blotting, a cornerstone technique for specific protein detection, is undergoing a transformative evolution driven by technological advancements. Three emerging trends are poised to significantly enhance the capabilities of researchers and clinicians: AI-powered image analysis, which introduces new levels of objectivity and depth in data interpretation; miniaturization, which reduces sample and reagent volumes while accelerating workflows; and the development of point-of-care devices, which decentralize protein analysis from central laboratories to clinical or field settings. These innovations are addressing long-standing challenges in traditional Western blotting, including subjective band quantification, lengthy procedural times, and the inaccessibility of sophisticated equipment in resource-limited environments. This document details these trends within the context of protein detection research, providing application notes and structured protocols to guide researchers, scientists, and drug development professionals in their implementation.
AI-Powered Western Blot Image Analysis
The application of Artificial Intelligence (AI), particularly through advanced large language models (LLMs) and sophisticated software, is revolutionizing the interpretation of Western blot imagery. This shift addresses critical issues of subjectivity, reproducibility, and analytical depth in traditional analysis.
Application Note: Comparative Analysis of AI Models
A 2024 study directly compared the capabilities of four major AI models—ChatGPT 4, Microsoft Copilot, Gemini, and Gemini Advanced—in analyzing Western blot images of the frameshift mutant ubiquitin B (UBB+1) from schizophrenia patient samples [111]. The models were provided with an image and the experimental protocol and asked to perform an analysis. The findings revealed distinct strengths and specializations, as summarized in Table 1.
Table 1: Performance of AI Models in Western Blot Image Analysis
| AI Model | Developer | Key Analysis Strengths | Notable Limitations |
|---|---|---|---|
| ChatGPT 4 | OpenAI | Comprehensive band interpretation, linked bands to patient samples and standards, provided biological context [111]. | — |
| Gemini Advanced | Google AI | Focused on specific band identification, particularly Ub-48UBB+1 dimers [111]. | — |
| Gemini | Google AI | Excelled in detailing the Western blot process and the biological significance of bands [111]. | — |
| Microsoft Copilot | Microsoft | Provided a basic overview of the blot with less technical detail [111]. | Less depth in technical analysis. |
This study demonstrates that these models can effectively serve as automated analysis tools, reducing interpreter bias and adding valuable biological context to the raw image data [111].
Protocol: AI-Assisted Image Analysis Workflow
Purpose: To utilize AI models for the objective interpretation and contextual analysis of a Western blot image. Materials: Western blot image (JPG or PNG format), detailed experimental protocol including sample preparation, antibodies used, and molecular weight markers. Software: Access to an AI model with image analysis capabilities (e.g., ChatGPT 4, Gemini Advanced).
Procedure:
- Image Preparation: Capture a high-resolution, in-focus image of your Western blot using a digital imaging system. Ensure labels are clear and the image is uncropped to provide maximum context.
- Protocol Documentation: Prepare a concise but comprehensive text summary of your experimental method. This should include:
- Sample origin (e.g., cell line, tissue type).
- Protein targets and the primary antibodies used (including clones and dilutions).
- Key steps like gel percentage, transfer method, and detection substrate.
- AI Interaction: a. Input the detailed experimental protocol into the AI model. b. Upload the Western blot image. c. Pose specific, directed questions such as: * "Could you analyze the attached Western blot photo?" * "Identify the protein bands in each lane and correlate them with the provided molecular weight marker." * "Provide a biological interpretation of the band intensities observed across the different patient samples."
- Analysis and Validation: a. Review the AI's analysis for consistency with expected results. b. Use dedicated image analysis software (e.g., AzureSpot Pro, see Section 2.3) to perform quantitative band density measurements for objective validation of the AI's qualitative assessment. c. Correlate findings with existing literature or control data.
Advanced Software for Quantitative Analysis
Specialized software packages complement generative AI models by providing robust, quantitative data. Tools like AzureSpot Pro image analysis software offer features essential for rigorous quantification [112]:
- Automatic Lane and Band Detection: Customizable algorithms to define lanes and detect bands, either automatically or manually.
- Multiplex Analysis: Capability to view and analyze individual channels or all channels simultaneously in a multiplex image.
- Background Subtraction: Multiple methods (e.g., rolling ball, image rectangle) to correct for background noise, crucial for accurate normalization.
- Molecular Weight Analysis: Tools for molecular weight calibration and quantity normalization using housekeeping proteins or total protein load [112].
Table 2: Key Features of AzureSpot Pro Software
| Feature | Function | Application in Western Blot Analysis |
|---|---|---|
| Automatic Band Detection | Identifies bands within lanes with customizable sensitivity [112]. | Reproducible quantification of band density and position. |
| Background Subtraction | Corrects for uneven background using methods like rolling ball [112]. | Improves signal-to-noise ratio for more accurate quantification. |
| Multiplex Analysis | Analyzes multiple proteins from a single blot by viewing separate channels [112]. | Enables normalization and co-expression studies. |
| Molecular Weight Analysis | Calibrates band size against a standard ladder [112]. | Verifies the identity of the target protein. |
A Note on AI Detection and Integrity
The ease of generating fake Western blot imagery with AI presents a challenge for research integrity. A 2025 study evaluated free AI-detection tools and found them unreliable for identifying AI-generated Western blots, showing low positive predictive values [113]. This underscores the continued importance of raw data stewardship and the use of established, quantifiable analysis software as part of a rigorous scientific process.
Miniaturization and Point-of-Care Western Blotting
The paradigm of protein analysis is shifting from centralized, benchtop protocols toward decentralized, rapid, and compact platforms. This trend is powered by advancements in microfluidics, biosensor technology, and novel molecular assays.
Application Note: Technological Drivers of Miniaturization
The movement towards point-of-care (POC) protein testing is driven by several convergent technological innovations, which are summarized in Table 3.
Table 3: Core Drivers of Miniaturization in Protein Diagnostics
| Driver | Description | Impact on Western Blotting & Protein Analysis |
|---|---|---|
| Microfluidics & Lab-on-a-Chip | Microscale channels that manipulate fluids, enabling rapid mixing and minimal reagent use [114]. | Replaces large gel boxes and transfer apparatus; integrates sample prep, separation, and detection on a single chip. |
| CMOS Biosensors | Ultra-compact, highly sensitive silicon-based detection modules [114]. | Allows for miniaturized optical or electrochemical detection of proteins without bulky instrumentation. |
| Isothermal Amplification | Molecular amplification methods (e.g., LAMP, RPA) that operate at constant temperature [114]. | Could enable ultrasensitive detection of protein biomarkers via nucleic acid proxies without the need for thermal cyclers. |
| CRISPR-Based Detection | CRISPR-Cas enzymes used to recognize target sequences with high sensitivity [114]. | Potential for highly specific and sensitive protein detection in a POC format. |
These drivers enable portable POC molecular diagnostics platforms that achieve laboratory-level accuracy within handheld devices, dramatically reducing diagnostic delays from hours to minutes [114]. This is particularly crucial for time-sensitive clinical decisions in conditions like sepsis or acute coronary syndrome.
Protocol: Conceptual Workflow for a Miniaturized Western Blot
Purpose: To outline the procedural steps for protein analysis using a hypothetical miniaturized, microfluidic POC device. Materials: Miniaturized POC protein analyzer, single-use test cartridge, liquid biological sample (e.g., blood, saliva).
Procedure:
- Sample Introduction: A small volume of sample (e.g., ≤50 µL of whole blood from a finger-prick) is applied directly to the inlet port of the disposable cartridge [114].
- On-Cartridge Processing: The cartridge, a self-contained lab-on-a-chip, automates the traditional Western blot steps:
- Lysis & Denaturation: Integrated reagents lyse cells and denature proteins.
- Separation: Proteins are electrophoretically separated by size within a microfluidic channel rather than a traditional gel [114].
- Transfer & Immobilization: Separated proteins are transferred and immobilized onto a functionalized surface within the chip.
- Immunodetection: The flow of primary and enzyme-conjugated secondary antibodies is controlled by the microfluidic system, with precise incubation times [114].
- Signal Detection & Readout: A CMOS biosensor within the handheld analyzer detects the chemiluminescent or electrochemical signal from the detection reaction [114]. Results are displayed on a screen within minutes and can be transmitted wirelessly to an electronic health record.
The Scientist's Toolkit: Research Reagent Solutions
Successful implementation of both traditional and emerging Western blot techniques relies on a foundation of high-quality reagents and materials. The following table details essential components.
Table 4: Essential Reagents and Materials for Western Blotting
| Item | Function | Example Products & Notes |
|---|---|---|
| Lysis Buffer | Extracts proteins from cells/tissues while maintaining integrity. | RIPA buffer; include protease/phosphatase inhibitors for phospho-proteins [9] [21]. |
| Protease Inhibitor Cocktail | Prevents protein degradation by endogenous proteases during extraction. | Added fresh to lysis buffer [9]. |
| Loading Buffer | Denatures proteins, adds charge for electrophoresis, and provides density and color for tracking. | Contains SDS, reducing agent (DTT or β-mercaptoethanol), and tracking dye (e.g., bromophenol blue) [22] [21]. |
| SDS-PAGE Gel | Medium for size-based separation of denatured proteins. | Pre-cast gels (Bis-Tris, Tris-Glycine) are recommended for consistency; choice of percentage depends on protein size [9] [22]. |
| Transfer Membrane | Solid support for immobilizing separated proteins for antibody probing. | Nitrocellulose or PVDF; PVDF requires pre-wetting in methanol [6] [21]. |
| Blocking Agent | Prevents non-specific antibody binding to the membrane. | 5% Non-fat dry milk or BSA in TBST [21]. BSA is preferred for phospho-specific antibodies [21]. |
| Primary Antibody | Binds specifically to the target protein. | Validated antibodies from manufacturers; use at manufacturer-recommended dilution in blocking buffer [21]. |
| Secondary Antibody (HRP-conjugated) | Binds to the primary antibody and carries the enzyme for detection. | Species-specific; used at dilutions from 1:2,000 to over 1:50,000 depending on system sensitivity [6] [21]. |
| Detection Reagent | Substrate for the enzyme (e.g., HRP) that produces a detectable signal. | Chemiluminescent (e.g., ECL), fluorescent, or colorimetric substrates [22] [21]. |
Integrated Experimental Protocol: From Sample to Data
This protocol combines traditional best practices with the potential integration points for emerging technologies.
Stage 1: Sample Preparation (Cell Culture)
Materials: Cell culture, ice-cold PBS, lysis buffer (e.g., RIPA) with protease inhibitors, BCA/Bradford assay kit, loading buffer with DTT. Procedure:
- Wash cells with ice-cold PBS and aspirate.
- Lyse cells directly on the plate by adding lysis buffer (e.g., 100 µL per well of a 6-well plate) [21]. Scrape and transfer the lysate to a microcentrifuge tube.
- Sonicate the lysate briefly (10-15 seconds) to shear DNA and reduce viscosity [21].
- Centrifuge at 14,000–17,000 x g for 5-10 minutes at 4°C to pellet insoluble debris. Transfer the supernatant to a new tube [9].
- Determine protein concentration using a BCA or Bradford assay.
- Dilute an aliquot of the lysate in loading buffer to a final concentration of 1-2 µg/µL. Denature by heating at 95-100°C for 5 minutes [22] [21].
Stage 2: Gel Electrophoresis and Transfer
Materials: Pre-cast SDS-PAGE gel, running buffer, prestained protein ladder, transfer buffer, nitrocellulose/PVDF membrane, filter paper, transfer apparatus. Procedure:
- Assemble the gel electrophoresis unit and fill with running buffer.
- Load equal amounts of protein (10-40 µg for lysates) and a prestained molecular weight ladder into the wells [9] [21].
- Run the gel at constant voltage (100-150 V) until the dye front approaches the bottom [22].
- Traditional Transfer: Assemble a "sandwich" in the order of: cathode (+), sponge, filter paper, gel, membrane, filter paper, sponge, anode (-). Ensure no air bubbles are trapped. Perform wet or semi-dry transfer at 100V for 60 minutes or as optimized [21].
- Future POC Integration: This entire step would be replaced by an automated, miniaturized separation and transfer process within a microfluidic cartridge [114].
Stage 3: Immunodetection
Materials: Blocking buffer (5% milk or BSA in TBST), primary antibody, HRP-conjugated secondary antibody, wash buffer (TBST). Procedure:
- Block the membrane in 25 mL blocking buffer for 1 hour at room temperature with gentle agitation [21].
- Incubate with primary antibody diluted in blocking buffer overnight at 4°C with gentle agitation [21].
- Wash the membrane 3 times for 5 minutes each with TBST.
- Incubate with HRP-conjugated secondary antibody (e.g., 1:2000 dilution in blocking buffer) for 1 hour at room temperature [21].
- Wash the membrane 3 times for 5 minutes each with TBST.
Stage 4: Detection and Analysis
Materials: Chemiluminescent substrate, digital imaging system or X-ray film, image analysis software, AI model access. Procedure:
- Incubate the membrane with chemiluminescent substrate for 1-5 minutes according to the manufacturer's instructions [6] [21].
- Image Acquisition: Capture the signal using a digital imager. Avoid over- or under-saturation.
- Data Analysis Path A (Traditional): Use software like AzureSpot Pro for automatic band detection, background subtraction, and densitometric quantification. Normalize target protein levels to a loading control [112].
- Data Analysis Path B (AI-Enhanced): Export the digital image and input it, along with a detailed description of the protocol and samples, into an AI model (e.g., ChatGPT 4) for qualitative interpretation, band identification, and contextual biological analysis [111].
The Critical Role of Western Blotting in Clinical Diagnostics and Biomarker Validation
Western blotting remains a cornerstone technique in clinical diagnostics and biomarker validation due to its unique ability to provide specific, direct detection of target proteins within complex biological mixtures. This technique, also known as immunoblotting, combines the resolving power of gel electrophoresis with the specificity of immunoassays, allowing researchers to confirm not just the presence but also the molecular weight and relative abundance of protein biomarkers. The fundamental principle relies on electrophoretic separation of proteins by size followed by immunodetection using antibodies specific to the protein of interest [115]. For clinical researchers and drug development professionals, Western blotting provides a critical tool for verifying disease mechanisms, assessing therapeutic targets, and validating biomarkers for diagnostic applications across diverse conditions including cancer, neurodegenerative diseases, and infectious diseases [116].
The enduring value of Western blotting in biomarker research stems from several key advantages. The technique offers high specificity through dual separation mechanisms—first by molecular weight during electrophoresis, then by antibody recognition during detection. This dual verification significantly reduces false-positive results compared to immunoassays alone. Additionally, Western blotting requires only basic laboratory equipment yet provides robust qualitative and semi-quantitative data on protein expression, post-translational modifications, and protein integrity [9]. When optimized and properly validated, Western blotting can detect specific proteins in complex samples like cell lysates, tissue homogenates, and biological fluids, making it indispensable for both exploratory research and clinical applications [9] [117].
Fundamental Principles of Western Blotting for Biomarker Detection
The Western blotting procedure involves a multi-stage process that ensures specific detection of target proteins amidst complex protein mixtures. The procedure refers to the comprehensive process described in technical protocols, encompassing all steps from protein separation to detection [9]. The method relies on separating proteins by size using SDS-PAGE, transferring them to a membrane, and probing with antibodies specific to the target protein [9].
The foundational mechanism of Western blotting centers on protein denaturation and uniform charge application. In the initial sample preparation phase, proteins are denatured using sodium dodecyl sulfate (SDS) and reducing agents like beta-mercaptoethanol (BME) or dithiothreitol (DTT) [115] [9]. This process disrupts secondary and tertiary protein structures, rendering linear polypeptides that bind SDS in a consistent ratio—approximately one SDS molecule per two amino acid residues [118]. The SDS confers a uniform negative charge to all proteins, effectively neutralizing their inherent charge differences and ensuring that separation during electrophoresis occurs primarily based on molecular weight rather than native charge or structure [9]. This fundamental principle allows researchers to accurately estimate protein size by comparing migration distance to protein standards of known molecular weight.
The subsequent immunodetection phase leverages the specificity of antibody-antigen interactions. After separation and transfer to a membrane, target proteins are identified using primary antibodies that recognize specific amino acid sequences (epitopes) of the protein biomarker [115]. The selectivity of this interaction enables detection of specific proteins even in samples containing thousands of different proteins. Secondary antibodies conjugated to detection systems (such as horseradish peroxidase or fluorescent dyes) then bind to the primary antibodies, providing signal amplification and enabling visualization [21]. This multi-step process creates a highly specific detection system that can distinguish between closely related protein isoforms and post-translationally modified variants, which is particularly valuable when characterizing disease-specific biomarkers that may differ from their native forms by subtle modifications.
Western Blotting Workflow for Biomarker Validation
The complete Western blotting workflow for biomarker validation encompasses multiple critical stages from sample preparation to data analysis, each requiring careful optimization to ensure reliable, reproducible results. The following diagram illustrates the comprehensive workflow:
Sample Preparation
Proper sample preparation is foundational to successful biomarker detection. Samples must be collected, lysed, and prepared in a manner that preserves protein integrity while making the target biomarker accessible for detection. Key considerations include:
- Sample Types: Western blotting can be performed on diverse sample types including cell cultures, tissue specimens, serum, and other biological fluids [116] [9]. For tissue samples, rapid processing on ice is essential to prevent protease degradation [9].
- Lysis Conditions: Lysis buffer selection depends on the sample type and protein localization. RIPA buffer is commonly used for total cell lysates, while specialized buffers may be required for subcellular fractions [9]. Lysis buffers must be supplemented with protease and phosphatase inhibitors to preserve protein integrity and post-translational modifications, which is particularly critical when analyzing phosphorylated biomarkers [116] [9].
- Protein Quantification: Accurate protein quantification using Bradford or BCA assays ensures equal loading across gels, which is essential for valid comparisons between disease and control groups [116] [9]. Recommendations typically suggest loading 10-40 µg of protein from lysates or 10-500 ng of purified protein per lane [9].
- Denaturation: Samples are diluted in loading buffer containing SDS and reducing agents (DTT or BME), then heated to 95-100°C for 5-10 minutes to fully denature proteins [9] [21]. This ensures uniform charge and separation based solely on molecular weight.
Gel Electrophoresis
Separation of proteins by molecular weight using SDS-PAGE (sodium dodecyl sulfate-polyacrylamide gel electrophoresis) is the next critical step:
- Gel Selection: The appropriate gel composition depends on the target protein size. Bis-Tris gels with MES buffer are ideal for proteins between 10-30 kDa, while MOPS buffer works well for 31-150 kDa proteins, and Tris-Acetate gels are recommended for large proteins >150 kDa [9]. Gradient gels (e.g., 4-12% acrylamide) provide superior resolution across a broad molecular weight range.
- Electrophoresis Conditions: Samples and molecular weight markers are loaded into wells, and current is applied. The negative charge from SDS causes proteins to migrate toward the positive electrode, with smaller proteins moving faster through the gel matrix [115]. Running conditions (voltage, time) should be optimized according to the gel system and target protein size.
Protein Transfer
After separation, proteins must be transferred from the gel to a solid membrane support for antibody probing:
- Membrane Selection: PVDF (polyvinylidene difluoride) and nitrocellulose are the most common membrane materials, each with advantages and disadvantages that should be considered based on the application [115]. PVDF typically offers higher protein binding capacity and mechanical strength.
- Transfer Methods: Both semi-dry and wet transfer systems are used clinically. The transfer process uses an electric field to move proteins from the gel onto the membrane [115]. Proper transfer efficiency must be confirmed using pre-stained molecular weight markers [21].
Immunodetection
The detection phase utilizes antibodies to identify the specific biomarker of interest:
- Blocking: Membranes are incubated with blocking solutions containing BSA or non-fat dry milk (3-5% in TBST) to prevent nonspecific antibody binding [116] [21]. This critical step reduces background noise and improves specific signal detection.
- Antibody Incubation: Membranes are sequentially incubated with (1) a primary antibody specific to the target biomarker, typically overnight at 4°C [21], and (2) a species-specific secondary antibody conjugated to an enzyme (usually HRP) for detection [116] [21]. Antibody concentrations and incubation times should follow manufacturer recommendations or be optimized empirically.
- Washing: Thorough washing between antibody steps with TBST (Tris-buffered saline with Tween 20) removes unbound antibodies and reduces non-specific background [21].
Detection and Analysis
The final stage involves visualization and quantification of the target biomarker:
- Signal Detection: HRP-conjugated secondary antibodies are typically detected using chemiluminescent substrates that produce light when exposed to the enzyme [116] [21]. This signal can be captured using X-ray film or digital imaging systems.
- Quantification: Band intensity is quantified using densitometry software and normalized to loading controls (e.g., β-actin, GAPDH) to account for variations in protein loading [116]. This normalization enables accurate comparison of biomarker expression levels across different samples and conditions.
Essential Reagents and Materials for Western Blotting
Successful Western blotting requires carefully selected reagents and materials optimized for each step of the process. The following table summarizes the key components of the "Researcher's Toolkit" for biomarker detection using Western blotting:
Table 1: Essential Research Reagent Solutions for Western Blotting
| Reagent Category | Specific Examples | Function & Importance |
|---|---|---|
| Lysis Buffers | RIPA buffer, Non-denaturing lysis buffers | Extracts proteins from cells/tissues while maintaining integrity; choice depends on protein localization and experimental needs [9] |
| Protease Inhibitors | Protease inhibitor cocktails | Prevents protein degradation during sample preparation; critical for preserving labile biomarkers [9] |
| Phosphatase Inhibitors | Phosphatase inhibitor cocktails | Preserves phosphorylation states; essential when detecting phospho-specific biomarkers [9] |
| Loading Buffers | SDS sample buffer with DTT | Denatures proteins and provides density for loading; reducing agents break disulfide bonds [9] [21] |
| Gel Systems | Tris-Glycine, Bis-Tris, Tris-Acetate gels | Separates proteins by molecular weight; choice depends on target protein size [9] |
| Membranes | PVDF, Nitrocellulose | Immobilizes proteins for antibody probing; PVDF offers higher binding capacity [115] |
| Blocking Agents | BSA, Non-fat dry milk | Prevents nonspecific antibody binding; reduces background noise [116] [21] |
| Antibodies | Target-specific primary antibodies, HRP-conjugated secondary antibodies | Enables specific detection of biomarkers; validation is critical for reliable results [116] [117] |
| Detection Substrates | Chemiluminescent substrates (e.g., LumiGLO) | Generates detectable signal for visualization; choice affects sensitivity and dynamic range [21] |
Validation Requirements for Clinical Biomarker Assays
For Western blotting to transition from research tool to clinically applicable method, rigorous validation is essential. Recent guidelines from the AAPS (American Association of Pharmaceutical Scientists) outline fit-for-purpose validation approaches for Western blot biomarker assays [117]. The requirements differ based on the context of use (COU), with two primary paths defined:
Table 2: Western Blot Biomarker Assay Validation Requirements
| Validation Parameter | Path 1: Exploratory Research | Path 2: Regulated Environment |
|---|---|---|
| Intended Use | Internal decision-making, exploratory research | Clinical decision making, dose determination, drug response [117] |
| Specificity | Demonstration of target band at expected molecular weight | Comprehensive characterization including interference studies [117] |
| Sensitivity | Qualitative or semi-quantitative assessment | Defined limit of detection (LOD) and lower limit of quantification (LLOQ) [117] |
| Precision | Minimal replication, qualitative assessment | Rigorous precision testing including intra- and inter-assay variability [117] |
| Accuracy | Comparison to known positives/negatives | Spike/recovery experiments using reference standards [117] |
| Linearity | Not required | Defined dynamic range with demonstration of linearity [117] |
| Robustness | Basic optimization of critical parameters | Formal testing of assay robustness to variable conditions [117] |
| Documentation | Laboratory notebook records | Comprehensive documentation for regulatory review [117] |
The validation process must also include appropriate housekeeping protein validation to ensure consistent expression across all experimental conditions [119]. Commonly used loading controls include β-actin and GAPDH, but their expression stability must be verified for each specific experimental context [119]. Quantitative Western blot analysis software can assist in this validation process by enabling precise comparison of band intensities across multiple samples [119].
Advanced Applications in Biomarker Research
Case Studies in Drug Development
Western blotting provides critical insights throughout the drug development pipeline, from target validation to pharmacodynamic assessment:
Biomarker Validation for Compound Activity: Traditional Western blotting enables evaluation of biomarker responses to drug compounds in a dose-dependent manner. In one case study, researchers used optimized protein extraction and transfer conditions to detect target protein responses across increasing compound concentrations, providing crucial insights into the compound's mechanism of action [120]. This approach demonstrates the adaptability of traditional Western blotting for nuanced exploratory research where parameters require extensive optimization.
In Vivo Compound Activity Assessment: Combining traditional Western blotting with automated systems like JESS Simple Western provides comprehensive analysis of protein post-translational modifications in preclinical models. In a representative study, traditional blotting confirmed initial findings in mouse tissue samples, while the JESS system provided quantitative, high-throughput analysis of key biomarkers across multiple timepoints and dose levels [120]. This dual approach ensured robust, reproducible data that informed dosing strategies for preclinical studies.
Mitochondrial Protein Analysis: Automated Western blotting systems offer advantages for analyzing challenging protein classes, such as mitochondrial markers. In one application, researchers achieved precise, quantitative detection of mitochondrial proteins even with limited sample quantities, facilitating research into cellular bioenergetics and mitophagy [120]. The automated system's high sensitivity allowed clear differentiation between nuclear and mitochondrially-encoded proteins.
Emerging Technologies and Automated Systems
While traditional Western blotting remains valuable for low-throughput, customized workflows, automated systems are advancing the field:
- JESS Simple Western System: This automated platform uses capillary electrophoresis to separate proteins by size or charge, followed seamlessly by immunodetection [115] [120]. The system eliminates manual steps including gel pouring, sample loading, and transfer, providing higher reproducibility and quantitative data with minimal hands-on time [120].
- Enhanced Reproducibility: Automated systems significantly reduce inter-assay variability through standardized protocols and elimination of manual transfer steps, addressing a key limitation of traditional Western blotting [120].
- Applications in Regulated Environments: Automated Western blotting systems are particularly valuable for biomarker validation in regulated environments due to their standardized protocols, complete data tracking, and consistent performance [120].
The following diagram illustrates the comparative workflow and advantages of automated versus traditional Western blotting systems:
Western blotting maintains a critical position in clinical diagnostics and biomarker validation, bridging the gap between exploratory research and clinically applicable assays. The technique's unique capacity to provide specific protein detection with molecular weight confirmation makes it indispensable for verifying disease mechanisms, assessing therapeutic targets, and validating protein biomarkers across diverse pathological conditions. While traditional Western blotting continues to offer unparalleled flexibility for customized protocols and exploratory research, automated systems are expanding the applications of this foundational technology in regulated environments and high-throughput settings.
The future of Western blotting in clinical biomarker research will likely involve increased integration of automated platforms for standardized validation studies while maintaining traditional methods for exploratory investigations. As biomarker discovery advances toward clinical implementation, the principles of fit-for-purpose validation—with appropriate stringency based on context of use—will ensure that Western blotting continues to provide reliable, reproducible data for critical decision-making in drug development and clinical diagnostics. By adhering to rigorous validation standards and leveraging technological advancements, researchers can fully exploit the potential of Western blotting to advance personalized medicine through robust protein biomarker analysis.
Conclusion
Western blotting remains an indispensable, highly specific technique for protein analysis, continuously evolving through technological advancements. The key to reliable data lies in rigorous antibody validation, optimized protocols, and the adoption of superior normalization methods like total protein analysis. Future directions point toward increased automation, integration with AI and machine learning for data analysis, and the development of miniaturized, high-throughput systems. These innovations will solidify Western blotting's role in accelerating drug discovery, advancing personalized medicine, and meeting the growing demands of proteomics and clinical diagnostics, ensuring its relevance for years to come.
References
- 1. Western blot - Wikipedia [https://en.wikipedia.org/wiki/Western_blot]
- 2. A Guide to Modern Quantitative Fluorescent Western with... Blotting [https://www.jove.com/t/52099/a-guide-to-modern-quantitative-fluorescent-western-blotting-with]
- 3. Western Blotting: A Go-To Tool for Identifying Proteins in Pharmaceutical Studies | Lab Manager [https://www.labmanager.com/western-blotting-a-go-to-tool-for-identifying-proteins-in-pharmaceutical-studies-4248]
- 4. A critical path to producing high quality, reproducible data from quantitative western blot experiments | Scientific Reports [https://www.nature.com/articles/s41598-022-22294-x]
- 5. A Defined Methodology for Reliable Quantification of Western Blot Data - PMC [https://pmc.ncbi.nlm.nih.gov/articles/PMC3840294/]
- 6. and Recipes | Thermo Fisher Scientific - ZA Western Blot Protocols [https://www.thermofisher.com/za/en/home/life-science/protein-biology/protein-biology-learning-center/protein-gel-electrophoresis-information/western-blot-protocols.html]
- 7. Blind spots on western blots: Assessment of common problems in western blot figures and methods reporting with recommendations to improve them - PMC [https://pmc.ncbi.nlm.nih.gov/articles/PMC9518894/]
- 8. Western Blot Protocol, Troubleshooting, and Applications | The Scientist [https://www.the-scientist.com/western-blot-protocol-troubleshooting-and-applications-71995]
- 9. | Abcam Western blot protocol [https://www.abcam.com/en-us/technical-resources/protocols/western-blot]
- 10. System in the Real World: 5 Uses You'll... Western Blot Quantitative [https://www.linkedin.com/pulse/western-blot-quantitative-system-real-world-5-uses-youll-380vf]
- 11. Developing a 3-Color Western Blot [https://www.licorbio.com/support/contents/applications/western-blots/developing-a-3-color-western.html]
- 12. vs. Qualitative Quantitative Analysis: What You Need to... Western Blot [https://www.labx.com/resources/quantitative-vs-qualitative-western-blot-analysis-what-you-need-to-know/5569]
- 13. 2024 Western Blot Publication Guide - Life in the Lab [https://www.thermofisher.com/blog/life-in-the-lab/2023-guide-to-quantitative-western-blot-publication/]
- 14. Overview of Western | Thermo Fisher Scientific - TR Blotting [https://www.thermofisher.com/tr/en/home/life-science/protein-biology/protein-biology-learning-center/protein-biology-resource-library/pierce-protein-methods/overview-western-blotting.html]
- 15. vs PVDF for Nitrocellulose – 2025 Expert... Membrane Western Blot [https://cobetter.com/technical/pvdf-membrane-vs-nc-membrane.html]
- 16. vs PVDF ? How to Choose a Nitrocellulose Blot Membrane [https://www.thermofisher.com/blog/life-in-the-lab/pvdf-vs-nitrocellulose-how-to-choose-a-blot-membrane/]
- 17. and stock solutions for Buffers | Abcam western blot [https://www.abcam.com/en-us/technical-resources/guides/western-blot-guide/buffers-and-stock-solutions]
- 18. The Design of a Quantitative Western Blot Experiment - PMC [https://pmc.ncbi.nlm.nih.gov/articles/PMC3971489/]
- 19. for Antibodies | Thermo Fisher Scientific - IN Western Blotting [https://www.thermofisher.com/in/en/home/life-science/protein-biology/protein-assays-analysis/western-blotting/detect-proteins-western-blot/western-blot-detection-reagents/western-blot-antibodies.html]
- 20. Principle & Protocol Guide | Boster Bio Western Blotting [https://www.bosterbio.com/protocol-and-troubleshooting/western-blot-principle]
- 21. Procedure | Cell Signaling Technology Western Blot [https://www.cellsignal.com/learn-and-support/protocols/protocol-western]
- 22. Experimental Protocol for Western | AAT Bioquest Blotting [https://www.aatbio.com/resources/application-notes/experimental-protocol-for-western-blotting]
- 23. 2024 Scientific Publication Requirements for Western Blots and Gels - Azure Biosystems [https://azurebiosystems.com/blog/publication-requirements-for-western-blots-and-gels/]
- 24. : a powerful staple in scientific and biomedical... Western blotting [https://pubmed.ncbi.nlm.nih.gov/35775367/]
- 25. An introduction to western blot | Abcam [https://www.abcam.com/en-us/technical-resources/guides/western-blot-guide/introduction-to-western-blot]
- 26. A quantitative technique using TMB: western with... blot Comparison [https://pubmed.ncbi.nlm.nih.gov/33340122/]
- 27. Lysate preparation protocol for western | Abcam blotting [https://www.abcam.com/en-us/technical-resources/protocols/lysate-preparation-for-western-blot]
- 28. and Protease ... | Thermo Fisher Scientific - UK Phosphatase Inhibitor [https://www.thermofisher.com/uk/en/home/life-science/protein-biology/protein-biology-learning-center/protein-biology-resource-library/protein-biology-application-notes/protease-phosphatase-inhibitor-tablets.html]
- 29. and Protease in... - Creative Proteomics Phosphatase Inhibitors [https://www.creative-proteomics.com/resource/protease-phosphatase-inhibitors-protein-preparation.htm]
- 30. Lysate Preparation: Why is RIPA Buffer Best for Western Blot | Proteintech Group [https://www.ptglab.com/news/blog/lysate-preparation-why-is-ripa-buffer-best-for-western-blot/]
- 31. Sample Preparation Protocol Western Blot [https://www.novusbio.com/support/support-by-application/western-blot-sample-preparation]
- 32. Choosing The Right Lysis Buffer | Proteintech Group [https://www.ptglab.com/support/western-blot-protocol/choosing-the-right-lysis-buffer/]
- 33. Western Blotting Sample Preparation [https://www.sigmaaldrich.com/US/en/technical-documents/protocol/protein-biology/western-blotting/western-blotting-sample-preparation]
- 34. Western Blot Sample Preparation Protocol | Thermo Fisher Scientific - US [https://www.thermofisher.com/us/en/home/life-science/protein-biology/protein-biology-learning-center/protein-gel-electrophoresis-information/western-blot-protocols/western-blot-sample-preparation.html]
- 35. Guide to western blot quantification | Abcam [https://www.abcam.com/en-us/knowledge-center/western-blot/western-blot-quantification]
- 36. vs Bradford : Which to Choose? BCA Assay [https://opentrons.com/applications/bradford-assay/bradford-vs-bca]
- 37. and Lowry BCA | Thermo Fisher Scientific - MD Assay Assays [https://www.thermofisher.com/md/en/home/life-science/protein-biology/protein-assays-analysis/protein-assays/bca-protein-assays.html?icid=linchpin16-bca-protein-assays]
- 38. Methods: Protein vs. Quantification - MetwareBio BCA Bradford [https://www.metwarebio.com/bca-vs-bradford-protein-quantification-methods/]
- 39. or BCA Protein Assay: Choosing Between the Two Bradford [https://info.gbiosciences.com/blog/bca-or-bradford-protein-assay-choosing-between-the-two]
- 40. , Comparing , and UV protein quantification methods for... BCA Bradford [https://www.ptglab.com/news/blog/comparing-bca-bradford-and-uv-protein-quantification-methods-for-scientists/]
- 41. Western Blot Protocol | OriGene Technologies Inc. [https://www.origene.com/support/learning-resources/protocols/westernblotprotocol]
- 42. Western Blotting Protocol (Fluorescent) | Cell Signaling Technology [https://www.cellsignal.com/learn-and-support/protocols/protocol-western-fluorescent]
- 43. How current, voltage, and power settings affect SDS-PAGE – Bioss [https://blog.biossusa.com/blogs/iggy-the-bioss-dragon/how-current-voltage-and-power-settings-affect-sds-page]
- 44. Tips for Optimal SDS - PAGE Separation | Rockland [https://www.rockland.com/resources/tips-for-optimal-sds-page-separation/]
- 45. SDS-PAGE guide: Sample preparation to analysis | Abcam [https://www.abcam.com/en-us/knowledge-center/western-blot/sds-page-guide]
- 46. of Electrophoresis Optimization Concentration | AAT Bioquest Gel [https://www.aatbio.com/resources/application-notes/optimization-of-electrophoresis-gel-concentration]
- 47. An Easy SDS - PAGE Recipe & 10-Step Protocol Gel [https://bitesizebio.com/59429/sds-page-gel-recipe/]
- 48. and Western Blot Protocol | Boston BioProducts SDS PAGE [https://www.bostonbioproducts.com/resources/western-blotting-protocol/]
- 49. 7 Tips For Optimizing Your Western Blotting Experiments | Proteintech Group [https://www.ptglab.com/news/blog/7-tips-for-optimizing-your-western-blotting-experiments/]
- 50. Optimization of western blotting for the detection of proteins of different molecular weight - PMC [https://pmc.ncbi.nlm.nih.gov/articles/PMC7333534/]
- 51. Methods | Thermo Fisher Scientific - US Western Blot Transfer [https://www.thermofisher.com/us/en/home/life-science/protein-biology/protein-biology-learning-center/protein-biology-resource-library/pierce-protein-methods/western-blot-transfer-methods.html]
- 52. How To Choose the Right Western Blot Detection Method [https://www.technologynetworks.com/analysis/how-to-guides/how-to-choose-the-right-western-blot-detection-method-323714]
- 53. Comprehensive Optimization of Western Blotting - PubMed [https://pubmed.ncbi.nlm.nih.gov/37623107/]
- 54. Detection Methods Western Blot [https://blog.benchsci.com/western-blot-detection-methods]
- 55. Common Western Questions, Answered - Azure Biosystems Blotting [https://azurebiosystems.com/blog/what-is-western-blotting/]
- 56. for Antibodies | Thermo Fisher Scientific - PR Western Blotting [https://www.thermofisher.com/pr/en/home/life-science/protein-biology/protein-assays-analysis/western-blotting/detect-proteins-western-blot/western-blot-detection-reagents/western-blot-antibodies.html]
- 57. ... | Thermo Fisher Scientific - UK Detecting Low Abundance Proteins [https://www.thermofisher.com/uk/en/home/life-science/protein-biology/protein-biology-learning-center/protein-biology-resource-library/pierce-protein-methods/detecting-low-abundance-proteins-in-western-blotting.html]
- 58. via Western Blot | Proteintech... Detecting low abundance proteins [https://www.ptglab.com/news/blog/detecting-low-abundance-proteins-via-western-blot/]
- 59. | Thermo Fisher Scientific - CA Quantitative Western Blot Analysis [https://www.thermofisher.com/ca/en/home/life-science/protein-biology/protein-biology-learning-center/protein-biology-resource-library/pierce-protein-methods/quantitative-western-blot-analysis.html]
- 60. From Beginner to Pro: The Ultimate Western Guide for... Blot [https://antibodysystem.com/archive/365.html]
- 61. Biotinylated secondary antibodies: detect - low abundance proteins [https://www.abcam.com/en-us/technical-resources/product-overview/detect-low-abundance-proteins-with-biotinylated-antibodies]
- 62. Troubleshooting | Thermo Fisher Scientific - DE Western Blot [https://www.thermofisher.com/de/de/home/life-science/protein-biology/protein-biology-learning-center/protein-gel-electrophoresis-information/western-blot-troubleshooting.html]
- 63. Troubleshooting: Weak/ Western & Other | Proteintech... Blot No Signal [https://www.ptglab.com/support/western-blot-protocol/western-blot-troubleshooting-weak-no-signal-other/]
- 64. All 8 Western failures and how to prevent them ( blot Guide) 2025 [https://www.linkedin.com/pulse/8-western-blot-failures-how-prevent-them-2025-guide-wildtypeone-wvvde]
- 65. Why do I get a weak signal or no at all on my signal and... western blot [https://www.aatbio.com/resources/faq-frequently-asked-questions/why-do-i-get-a-weak-signal-or-no-signal-at-all-on-my-western-blot-and-what-should-i-do]
- 66. or multiple Unexpected in bands | Abcam western blot [https://www.abcam.com/en-us/technical-resources/troubleshooting/unexpected-multiple-bands-western-blot]
- 67. | Boster Bio Western Blotting Antibody Concentration Optimization [https://www.bosterbio.com/protocol-and-troubleshooting/western-blotting-optimization/antibody-concentration]
- 68. Antigen and Optimize for Antibody Concentration Western Blots [https://info.gbiosciences.com/blog/optimize-antigen-and-antibody-concentration-for-western-blots]
- 69. Antibody validation for Western blot: By the user, for the user - PMC [https://pmc.ncbi.nlm.nih.gov/articles/PMC6983856/]
- 70. How To Optimize Your Western | Proteintech Group Blot [https://www.ptglab.com/support/western-blot-protocol/how-to-optimize-your-western-blot/]
- 71. Prolonged Incubation and Stacked Film Exposure Improve Sensitivity in Western Blotting - PMC [https://pmc.ncbi.nlm.nih.gov/articles/PMC3204169/]
- 72. Titration-WB: A methodology for accurate quantitative protein determination overcoming reproducibility errors - PMC [https://pmc.ncbi.nlm.nih.gov/articles/PMC12161570/]
- 73. Ultra-high-speed western blot with the aid of immunoreaction enhancing technology - PMC [https://pmc.ncbi.nlm.nih.gov/articles/PMC8504990/]
- 74. Western (Immuno-) Blotting [https://www.scbt.com/resources/protocols/western-immuno-blotting]
- 75. for Blocking and... | Thermo Fisher Scientific - CI Buffers Western Blot [https://www.thermofisher.com/ci/en/home/life-science/protein-biology/protein-biology-learning-center/protein-biology-resource-library/pierce-protein-methods/blocking-buffers-western-blot-elisa.html?icid=linchpin2-blocking-buffers-western-blot-elisa]
- 76. Optimization | Boster Bio Western Blot Blocking Buffer [https://www.bosterbio.com/protocol-and-troubleshooting/western-blotting-optimization/blocking]
- 77. of Comparison . | AAT Bioquest blocking buffers for western blotting [https://www.aatbio.com/data-sets/comparison-of-blocking-buffers-for-western-blotting]
- 78. - Western vs blotting for Milk - CiteAb BlogCiteAb Blog BSA blocking [https://blog.citeab.com/milk-bsa-blocking/]
- 79. Blind spots on western blots: Assessment of common problems in western blot figures and methods reporting with recommendations to improve them - PMC [https://www.ncbi.nlm.nih.gov/pmc/articles/PMC9518894/]
- 80. An old method facing a new challenge: re-visiting housekeeping proteins as internal reference control for neuroscience research - PMC [https://pmc.ncbi.nlm.nih.gov/articles/PMC3614345/]
- 81. How to Normalize for a Protein - Azure Biosystems Western Blot [https://azurebiosystems.com/blog/quantitative-westerns-what-is-the-best-way-to-normalize-your-western-blot/]
- 82. The necessity of and strategies for improving confidence in the... [https://pmc.ncbi.nlm.nih.gov/articles/PMC4791038/]
- 83. Antibodies 101: Normalization and Loading Controls for Western Blots [https://blog.addgene.org/antibodies-101-normalization-and-loading-controls-for-western-blots]
- 84. The How and Why of Normalizing Your Western | Bio-Radiations Blots [https://www.bioradiations.com/the-how-and-why-of-normalizing-your-western-blots/]
- 85. How Stain-Free Western Contributes... | Technology Networks Blotting [https://www.technologynetworks.com/analysis/blog/how-stain-free-western-blotting-contributes-to-laboratory-efficiency-388067]
- 86. What's best? Housekeeping genes or total protein for Western blot loading controls [https://info.gbiosciences.com/blog/whats-best-housekeeping-genes-or-total-protein-for-western-blot-loading-controls]
- 87. Superior normalization using total for protein analysis... western blot [https://journals.plos.org/plosone/article?id=10.1371/journal.pone.0328136]
- 88. Transfer and Optimizing in Protein Detection Western Blotting [https://www.labx.com/resources/optimizing-protein-transfer-and-detection-in-western-blotting/5568]
- 89. Tips and Tricks | Thermo Fisher Scientific - US [https://www.thermofisher.com/us/en/home/life-science/protein-biology/protein-biology-learning-center/protein-gel-electrophoresis-information/western-blot-tips-tricks.html]
- 90. Western Blot protocol [https://www.protocols.io/view/western-blot-protocol-deqq3dvw.html]
- 91. Mastering Western : Principles, Workflow and... - MetwareBio Blot [https://www.metwarebio.com/western-blot-guide-principles-workflow-optimization/]
- 92. and Knockout Knockdown Antibody Validation [https://www.thermofisher.com/us/en/home/life-science/antibodies/invitrogen-antibody-validation/knockout-knockdown-antibody-validation.html]
- 93. siRNA Knockdown | Proteintech Group [https://www.ptglab.com/support/sirna-knockdown/]
- 94. for Antibody | Validation Signaling Technology Western Blotting Cell [https://www.cellsignal.com/about-us/our-approach-process/antibody-validation-western-blotting]
- 95. - Atlas Western Blot Antibodies [https://www.atlasantibodies.com/antibody-applications/western-blot/]
- 96. vs ELISA : When to Use Each Immunoassay Technique Western Blot [https://www.thermofisher.com/blog/life-in-the-lab/western-blot-or-elisa/]
- 97. Enzyme Linked Immunosorbent Assay - StatPearls - NCBI Bookshelf [https://www.ncbi.nlm.nih.gov/books/NBK555922/]
- 98. Mass spectrometry method development [https://www.nature.com/collections/cfjebecbdi]
- 99. MSMCE: A novel representation module for classification of raw mass spectrometry data - PMC [https://pmc.ncbi.nlm.nih.gov/articles/PMC12327681/]
- 100. Advanced Mass Spectrometry Methods for Trace Detection | NIST [https://www.nist.gov/programs-projects/advanced-mass-spectrometry-methods-trace-detection]
- 101. vs. Western | Abcam blotting ELISA [https://www.abcam.com/en-us/knowledge-center/western-blot/elisa-vs-western-blot]
- 102. vs ELISA : Choosing a Protein Quantitation Method Mass Spectrometry [https://blog.cellsignal.com/tools-for-screening-and-quantifying-proteins]
- 103. Processors Western Analysis by Size, Share... Blotting Market [https://www.theinsightpartners.com/reports/western-blotting-processors-market]
- 104. Processors Automated by Applications... Western Blotting Market [https://www.linkedin.com/pulse/automated-western-blotting-processors-market-sxwkf]
- 105. of Comparison and Traditional Automated ... Western Blotting [https://pmc.ncbi.nlm.nih.gov/articles/PMC10142486/]
- 106. Simple Western Automated Western Blot Systems | Bio-Techne [https://www.bio-techne.com/instruments/simple-western]
- 107. Jess ProteinSimple - Learn More About Automated Western Blots | Bio-Techne [https://www.bio-techne.com/resources/videos/meet-jess-simple-western-protein-analysis-solution]
- 108. Multiplexed Western Blotting Using Microchip Electrophoresis - PMC [https://www.ncbi.nlm.nih.gov/pmc/articles/PMC5113996/]
- 109. Recent Advances in Microscale Western Blotting - PMC [https://pmc.ncbi.nlm.nih.gov/articles/PMC5383213/]
- 110. Fluorescent western blot | Abcam [https://www.abcam.com/secondary-antibodies/multiplexing-in-fluorescent-western-blotting]
- 111. AI-Powered Western Blot Interpretation: A Novel Approach to Studying the Frameshift Mutant of Ubiquitin B (UBB+1) in Schizophrenia [https://www.mdpi.com/2076-3417/14/10/4149]
- 112. Western Blot Image Analysis Software - Azure Biosystems [https://azurebiosystems.com/software/azurespotpro/]
- 113. AI detectors are poor western blot classifiers: a study of accuracy and predictive values - PMC [https://pmc.ncbi.nlm.nih.gov/articles/PMC11847483/]
- 114. Testing Technology Advancements Point of Care 2025 [https://iconiferz.com/point-of-care-testing-technology-advancements-2025/]
- 115. How to Run a Western Blot Assay: An Illustrated Diagram | Bio-Techne [https://www.bio-techne.com/applications/western-blotting/western-blot-illustrated-assay]
- 116. How to Use Western to Detect Disease Blotting Biomarkers [https://www.linkedin.com/pulse/how-use-western-blotting-detect-disease-biomarkers-huang-md-phd-qi0af]
- 117. Recommendations for Development and Validation of... [https://pubmed.ncbi.nlm.nih.gov/39060472/]
- 118. Western blotting | PPTX [https://www.slideshare.net/slideshow/western-blotting-227257184/227257184]
- 119. : HKP Validation ( Quantitative Bands) Western Blot Compare [https://www.licor.com/bio/support/contents/software/empiria-studio/quantitative-western-blot/housekeeping-protein-compare-bands.html]
- 120. Advancing Therapeutic Research with Protein-Level Insights: Western ... [https://www.massbio.org/news/member-news/advancing-therapeutic-research-with-protein-level-insights-western-blotting-and-jess/]