Two-Dimensional Gel Electrophoresis (2D-PAGE): A Comprehensive Guide from Principles to Advanced Applications in Biomedical Research
This article provides a comprehensive overview of two-dimensional gel electrophoresis (2D-PAGE), a foundational technique in proteomics that separates complex protein mixtures based on isoelectric point (pI) and molecular weight.
Two-Dimensional Gel Electrophoresis (2D-PAGE): A Comprehensive Guide from Principles to Advanced Applications in Biomedical Research
Abstract
This article provides a comprehensive overview of two-dimensional gel electrophoresis (2D-PAGE), a foundational technique in proteomics that separates complex protein mixtures based on isoelectric point (pI) and molecular weight. Tailored for researchers, scientists, and drug development professionals, it covers the core principles of IEF and SDS-PAGE integration, detailed methodological protocols, and applications in biomarker discovery and drug development. It also addresses common troubleshooting challenges and explores advanced, validated techniques like 2D-DIGE and native PAGE, offering insights into future trends such as automation and AI-integration that are shaping the field.
The Foundations of 2D-PAGE: Unraveling Protein Complexity with IEF and SDS-PAGE
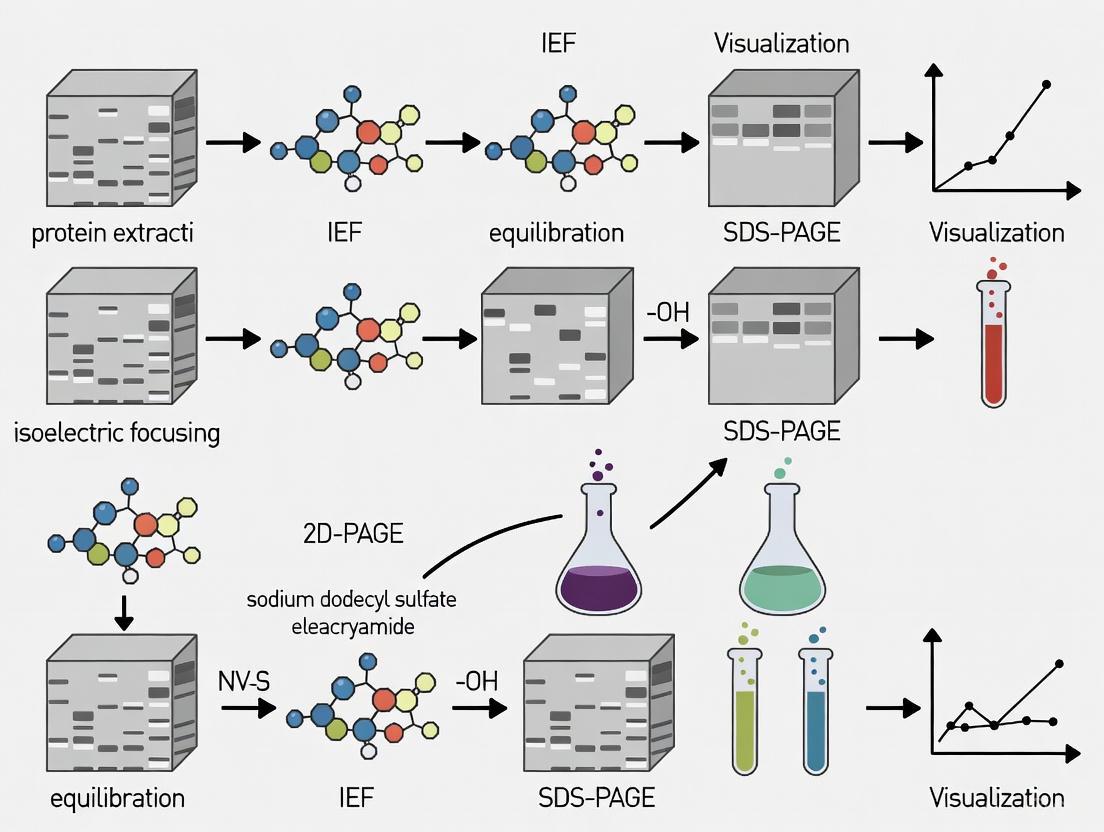
Two-dimensional polyacrylamide gel electrophoresis (2D-PAGE) is a powerful analytical technique for the high-resolution separation of complex protein mixtures. The method was first introduced in 1975 by O'Farrell and Klose, representing a revolutionary advancement in protein analysis by separating proteins based on two independent physicochemical properties: isoelectric point (pI) and molecular weight [1] [2]. This orthogonal separation approach provides a comprehensive visual map of the proteome, enabling researchers to simultaneously resolve hundreds to thousands of proteins from biological samples such as cells, tissues, or other biological specimens [3]. In modern proteomics research, 2D-PAGE serves as a fundamental separation tool that bridges the gap between protein extraction and identification techniques such as mass spectrometry, playing a crucial role in biomarker discovery, disease research, and the analysis of post-translational modifications [4] [5] [6].
The core principle of 2D-PAGE lies in its sequential application of two complementary electrophoretic techniques: isoelectric focusing (IEF) separates proteins according to their native isoelectric point in the first dimension, followed by sodium dodecyl sulfate-polyacrylamide gel electrophoresis (SDS-PAGE), which separates proteins by molecular mass in the second dimension [7] [8]. This dual-separation mechanism provides significantly superior resolution compared to one-dimensional techniques, allowing researchers to detect subtle changes in protein expression, identify isoforms, and characterize post-translational modifications that would otherwise remain unresolved in complex biological samples [1] [2].
Fundamental Separation Principles
First Dimension: Separation by Isoelectric Point
Isoelectric focusing (IEF), the first dimension of 2D-PAGE, separates protein molecules based on their intrinsic isoelectric point (pI). The isoelectric point is defined as the specific pH at which a protein carries no net electrical charge, resulting from the balance between positively and negatively charged amino acid side chains, the N-terminal amino group, and the C-terminal carboxyl group [3]. In this technique, proteins are placed within a stable, continuous pH gradient and subjected to an electric field. Each protein initially migrates through the gradient based on its net charge at the starting pH—proteins with a positive net charge migrate toward the cathode, while those with a negative net charge move toward the anode [1] [3].
As a protein migrates through the pH gradient, it continuously encounters changing pH environments until it reaches the region where the ambient pH equals its unique pI value. At this precise location, the protein's net charge becomes zero, causing migration to cease and the protein to become "focused" into a sharp, stationary band [1] [8]. This focusing effect results in high-resolution separation where proteins with minute differences in pI (as small as 0.01 pH units) can be effectively resolved [3]. The creation of the pH gradient is typically achieved using either carrier ampholytes (amphoteric compounds that distribute themselves to form a continuous pH gradient under an electric field) or immobilized pH gradient (IPG) strips, which feature a predefined gradient covalently fixed within the polyacrylamide matrix, offering enhanced reproducibility and stability during high-voltage runs [5] [6] [3].
Second Dimension: Separation by Molecular Weight
Following IEF, the second dimension employs SDS-PAGE to separate proteins according to their molecular mass under denaturing conditions. The focused strip from the first dimension is first equilibrated in a buffer containing sodium dodecyl sulfate (SDS), an anionic detergent that denatures proteins and binds to the polypeptide backbone in a constant weight ratio (approximately 1.4 g SDS per 1 g of protein) [7] [3]. This SDS binding confers a uniform negative charge density to all proteins, effectively masking their native charges and ensuring that migration during electrophoresis depends solely on molecular size rather than charge or shape [7].
The equilibrated IEF strip is then positioned horizontally atop a vertical SDS-polyacrylamide gel and sealed with agarose. When an electric field is applied, the SDS-protein complexes migrate into the gel matrix toward the anode. The polyacrylamide gel acts as a molecular sieve, with smaller proteins experiencing less frictional resistance and migrating faster through the porous network, while larger proteins move more slowly [1] [7]. The relationship between protein mobility and molecular weight is logarithmic, enabling the estimation of protein mass by comparing migration distances to those of known standards [3]. A discontinuous buffer system, typically using Tris-glycine-SDS buffers, further enhances resolution by concentrating proteins at the stacking gel-resolving gel interface before entering the main separation zone [7] [3].
Orthogonal Separation Mechanism
The powerful resolving capability of 2D-PAGE stems from its orthogonal separation mechanism, where two independent protein properties—charge (pI) and size (molecular weight)—are exploited sequentially to distribute proteins across a two-dimensional plane rather than a single line [9]. This approach dramatically increases the total number of proteins that can be resolved from a complex mixture. While one-dimensional SDS-PAGE might separate 50-100 distinct protein bands, 2D-PAGE can resolve thousands of individual protein spots from the same sample, each representing a unique combination of isoelectric point and molecular weight [6].
This orthogonal characteristic makes 2D-PAGE particularly valuable for detecting post-translational modifications (PTMs) that alter protein charge without significantly affecting mass. For example, phosphorylation or deamidation events shift a protein's pI to a more acidic position, while glycosylation can cause both pI and molecular weight changes [1] [2]. These modified protein variants appear as distinct spots horizontally or diagonally shifted from their unmodified counterparts on the final 2D gel, enabling researchers to identify and characterize PTMs that would be indistinguishable using one-dimensional separation methods [2].
Table 1: Key Parameters for Optimal 2D-PAGE Separation
| Parameter | First Dimension (IEF) | Second Dimension (SDS-PAGE) |
|---|---|---|
| Separation Principle | Isoelectric point (pI) | Molecular weight |
| Separation Matrix | Polyacrylamide with ampholytes or IPG strip | Polyacrylamide gel |
| Typical pH Range | 3-10 (linear or nonlinear) | N/A |
| Gel Dimensions | Tube gel or strip (1-5 mm wide) | Slab gel (typically 20 × 20 cm) |
| Running Conditions | 5,000-100,000 V·hours | Constant current (20-40 mA/gel) |
| Key Reagents | Urea, nonionic detergents, reducing agents | SDS, Tris, glycine, acrylamide |
| Critical Factors | Voltage, focusing time, ampholyte quality | Acrylamide concentration, crosslinker ratio |
Detailed Experimental Protocol
Sample Preparation
Proper sample preparation is critical for successful 2D-PAGE separation, as it directly impacts protein solubility, stability, and resolution. Protein extraction begins with cell or tissue lysis using an appropriate buffer, typically containing 8-9 M urea, 2-4% CHAPS or NP-40 nonionic detergent, 50-100 mM dithiothreitol (DTT) as a reducing agent, and 0.5-2% carrier ampholytes [4] [5]. This composition helps maintain proteins in a solubilized state while disrupting non-covalent interactions and preventing oxidation of thiol groups. For membrane proteins or particularly insoluble fractions, additional strategies such as sonication, increased detergent concentrations (including SDS with subsequent dilution), or alternative solubilization cocktails may be necessary [5].
Following extraction, clarification by centrifugation (typically at 10,000-20,000 × g for 15-30 minutes) removes insoluble debris, nucleic acids, and other particulate matter that could interfere with the separation [1]. The resulting supernatant is then subjected to protein quantification using sensitive assays compatible with detergents and reducing agents, such as the Bradford or bicinchoninic acid (BCA) assay [1]. Accurate quantification ensures consistent protein loading across multiple gels, which is essential for reproducible results and reliable comparative analyses. Aliquots of the prepared sample are typically stored at -80°C to prevent protein degradation and modification until electrophoresis.
First Dimension: Isoelectric Focusing
The first dimension separation begins with isoelectric focusing, which can be performed using either tube gels with carrier ampholytes or commercially available immobilized pH gradient (IPG) strips. The protocol for IPG strips, which have become the standard due to their superior reproducibility, involves rehydrating the dry strips with the protein sample dissolved in rehydration buffer (typically containing 8 M urea, 2% CHAPS, 50 mM DTT, and 0.5% carrier ampholytes) for 6-12 hours [6] [3]. Active rehydration, which incorporates low voltage (30-50 V) during the rehydration process, can improve protein entry into the gel matrix, particularly for high molecular weight proteins.
After rehydration, IEF is performed using a programmed voltage sequence in a specialized IEF apparatus equipped with temperature control (typically 20°C). A representative protocol for a 18-cm pH 3-10 nonlinear IPG strip would include: (1) step-and-hold at 500 V for 30 minutes to allow proteins to enter the strip; (2) gradient from 500 V to 1000 V over 60 minutes; (3) gradient from 1000 V to 10,000 V over 180 minutes; and (4) step-and-hold at 10,000 V until reaching 60,000-80,000 V·hours total [3]. The specific conditions must be optimized for different sample types, pH ranges, and strip lengths. Upon completion, IPG strips can be stored at -80°C or immediately prepared for the second dimension.
Gel Equilibration
Between the two dimensions, the focused IPG strips must be equilibrated to prepare proteins for SDS-PAGE. This critical step serves two primary functions: (1) replacing the IEF buffer with SDS-PAGE buffer, and (2) reducing and alkylating proteins to maintain complete denaturation and prevent disulfide bond formation. Equilibration is typically performed in two steps, each lasting 10-15 minutes with gentle agitation [1] [3].
The first equilibration solution contains 6 M urea, 2% SDS, 50-100 mM Tris-HCl (pH 6.8), 30% glycerol, and 1% DTT. The urea and SDS maintain protein solubility while the glycerol prevents diffusion and improves protein transfer. DTT reduces disulfide bonds, ensuring complete protein unfolding. The second equilibration solution has identical composition except that DTT is replaced with 2.5-5% iodoacetamide, which alkylates free thiol groups to prevent reformation of disulfide bonds during electrophoresis. This two-step process minimizes point streaking and artifacts in the final 2D pattern, significantly improving spot resolution [3].
Second Dimension: SDS-PAGE
Following equilibration, the IPG strip is carefully positioned on top of a pre-cast SDS-polyacrylamide gel and sealed in place with molten agarose (0.5-1% in SDS running buffer containing bromophenol blue tracking dye) [3]. Both vertical slab gels and horizontal systems can be used, though vertical setups are more common for traditional 2D-PAGE. The acrylamide concentration in the resolving gel determines the separation range—typically 10-12% for standard separations (10-200 kDa), with gradient gels (e.g., 8-16%) providing enhanced resolution across broader molecular weight ranges [7].
Electrophoresis is performed using a discontinuous buffer system, typically with Tris-glycine-SDS running buffer (25 mM Tris, 192 mM glycine, 0.1% SDS, pH 8.3) at constant current (20-40 mA per gel) with temperature regulation (10-20°C) to prevent overheating and minimize diffusion [3]. The run continues until the tracking dye reaches the bottom of the gel (typically 4-6 hours for standard format gels). For optimal resolution of complex mixtures, large-format gels (20 × 20 cm or larger) are recommended, as their increased separation distance significantly enhances spot resolution and capacity [7].
Table 2: Troubleshooting Common 2D-PAGE Issues
| Problem | Potential Causes | Solutions |
|---|---|---|
| Horizontal Streaking | Incomplete IEF, sample overloading, salt contamination | Increase focusing time, desalt samples, reduce protein load |
| Vertical Streaking | Incomplete equilibration, protein aggregation | Optimize equilibration time, improve solubilization |
| Poor Spot Resolution | Incorrect pH gradient, inappropriate acrylamide concentration | Select appropriate IPG range, optimize gel percentage |
| Missing Spots | Protein precipitation, inadequate transfer | Improve solubilization, optimize agarose sealing |
| Background Staining | Incomplete destaining, contaminated reagents | Extend destaining time, use high-purity reagents |
Visualization, Detection, and Analysis
Protein Detection Methods
Following the second dimension separation, proteins distributed across the 2D gel must be visualized using sensitive detection methods. The choice of staining technique depends on the specific application requirements, including sensitivity, quantitative linearity, and compatibility with downstream protein identification methods such as mass spectrometry [6].
Coomassie Brilliant Blue staining provides a cost-effective detection method with good reproducibility and MS compatibility, though it has limited sensitivity (approximately 50-100 ng per protein spot) [1]. The protocol typically involves fixing proteins in the gel with 40% ethanol/10% acetic acid for 30-60 minutes, staining with 0.1% Coomassie R-250 in 40% ethanol/10% acetic acid for 1-2 hours, and destaining with multiple changes of 10% ethanol/5% acetic acid until background is clear [1]. Silver staining offers significantly higher sensitivity (0.1-1 ng per spot) but has a narrower dynamic range and can be problematic for mass spectrometry unless specifically modified [6]. Fluorescent stains such as SYPRO Ruby provide an excellent balance of sensitivity (1-10 ng), wide dynamic range, and MS compatibility, though they require specialized imaging equipment [6].
Image Acquisition and Analysis
After staining, gels are digitized using high-resolution imaging systems—laser or LED scanners for fluorescent stains, and high-dynamic-range CCD cameras or flatbed scanners for colorimetric stains [6]. The resulting digital images are then analyzed using specialized 2D analysis software packages such as Progenesis SameSpots, PDQuest, or Delta2D, which typically perform spot detection, background subtraction, spot matching across multiple gels, and quantitative comparisons [5] [6].
The analysis workflow generally includes: (1) automated spot detection and quantification; (2) gel-to-gel matching to align corresponding spots across different samples; (3) normalization to correct for variations in total protein load and staining efficiency; and (4) statistical analysis to identify significantly differentially expressed protein spots [6]. For comparative studies, the use of internal standards and appropriate experimental design with sufficient biological replicates is essential to distinguish true biological variation from technical artifacts [6].
Advanced Applications and Modifications
Two-Dimensional Difference Gel Electrophoresis (2D-DIGE)
A significant advancement in 2D-PAGE technology is two-dimensional difference gel electrophoresis (2D-DIGE), which enables multiplexed analysis of multiple samples on the same gel, thereby eliminating gel-to-gel variability and improving quantitative accuracy [6]. In this approach, different protein samples are labeled with spectrally distinct fluorescent cyanine dyes (Cy2, Cy3, and Cy5) before IEF. The dyes contain an N-hydroxysuccinimidyl ester reactive group that covalently binds to the ε-amino group of lysine residues in proteins [6]. The labeled samples are then mixed and separated on the same 2D gel, with each sample visualized using specific excitation/emission wavelengths.
A key feature of DIGE is the inclusion of an internal standard, typically created by pooling equal amounts of all experimental samples and labeled with one of the dyes (usually Cy2) [6]. This internal standard is run on every gel in an experiment, facilitating accurate cross-gel spot matching and normalization. The DIGE approach provides superior quantitative precision compared to traditional post-staining methods, with typical coefficients of variation of 10-20% for technical replicates compared to 20-50% for conventional 2D-PAGE [6]. This enhanced reproducibility makes DIGE particularly valuable for detecting subtle protein expression changes in complex experimental systems, such as disease progression studies or drug response profiling.
Integration with Downstream Protein Identification
Following 2D-PAGE separation and analysis, protein identification is typically performed by excising spots of interest from the gel and subjecting them to in-gel digestion with proteolytic enzymes (usually trypsin) followed by mass spectrometric analysis [5]. The excised gel plugs are destained, reduced and alkylated, and digested with trypsin, which cleaves proteins at lysine and arginine residues. The resulting peptides are extracted and analyzed by matrix-assisted laser desorption/ionization time-of-flight (MALDI-TOF) mass spectrometry for peptide mass fingerprinting or by liquid chromatography-tandem mass spectrometry (LC-MS/MS) for sequence-based identification [5].
For western blotting applications following 2D-PAGE, proteins are transferred from the gel onto a nitrocellulose or PVDF membrane, which is then probed with specific antibodies to detect proteins of interest [5]. This 2D western blotting approach is particularly powerful for characterizing post-translational modifications, protein isoforms, and immune responses against specific protein variants, providing complementary information to staining-based approaches [5].
Table 3: Essential Research Reagent Solutions for 2D-PAGE
| Reagent Category | Specific Examples | Function in 2D-PAGE |
|---|---|---|
| Denaturants | Urea, Thiourea | Disrupt hydrogen bonds, maintain protein solubility |
| Detergents | CHAPS, NP-40, Triton X-100, SDS | Solubilize hydrophobic proteins, prevent aggregation |
| Reducing Agents | DTT, DTE, TCEP | Break disulfide bonds, maintain reduced state |
| Alkylating Agents | Iodoacetamide, Acrylamide | Block thiol groups, prevent reoxidation |
| Ampholytes | Carrier ampholytes, IPG buffers | Establish and maintain pH gradient |
| Protease Inhibitors | PMSF, Complete Mini cocktail | Prevent protein degradation during processing |
| Staining Reagents | Coomassie R-250, SYPRO Ruby, Silver nitrate | Visualize separated protein spots |
2D-PAGE remains an essential tool in proteomics research, providing unparalleled resolution for complex protein mixtures through its orthogonal separation mechanism based on isoelectric point and molecular weight. While the technique demands careful attention to protocol details and has limitations for certain protein classes, its ability to visualize thousands of proteins simultaneously, detect post-translational modifications, and provide quantitative protein expression data ensures its continued relevance in modern biological research. Ongoing advancements in instrumentation, fluorescent labeling strategies, and integration with mass spectrometry continue to expand the applications and capabilities of this foundational separation methodology, maintaining its position as a cornerstone technology for comprehensive proteome analysis in both basic research and drug development contexts.
Two-dimensional polyacrylamide gel electrophoresis (2D-PAGE) represents a cornerstone technique in the field of proteomics, enabling the simultaneous separation and analysis of complex protein mixtures from tissues, cells, and other biological samples [10]. This powerful method, which combines isoelectric focusing (IEF) and SDS-PAGE, became substantially more powerful after the high-resolution modification introduced by O'Farrell in 1975, allowing the technique to resolve up to 5,000 proteins in a single gel with high accuracy [10]. 2D-PAGE has served as one of the leading drivers in the expansion of proteomics, providing the critical first step for further protein analysis through mass spectrometry and immunological validation [10]. Within the broader context of two-dimensional electrophoresis research, this technique has been instrumental in revealing physiological mechanisms, identifying disease-associated proteins, and facilitating biomarker discovery across diverse fields including cancer research, drug discovery, and clinical diagnostics [10].
Basic Principles and Historical Development
Fundamental Separation Mechanisms
The exceptional resolving power of 2D-PAGE stems from its orthogonal approach to protein separation, fractionating complex protein mixtures based on two independent physicochemical properties [10]. The technique consists of two sequential separation dimensions:
First Dimension - Isoelectric Focusing (IEF): Protein separation occurs based on isoelectric point (pI), the specific pH at which a protein carries no net electrical charge [10] [11]. Proteins are applied to a gel containing a stable pH gradient and subjected to an electric field, causing them to migrate until they reach the pH region matching their pI, where they become focused into sharp bands [11].
Second Dimension - SDS-PAGE: Separation is performed based on molecular weight using SDS-PAGE under denaturing conditions [10] [7]. The SDS-bound proteins migrate through a polyacrylamide gel matrix toward the positively charged electrode, with smaller proteins moving more rapidly than larger ones due to the sieving effect of the gel [7].
The critical innovation of 2D-PAGE lies in the fact that it is improbable for different protein molecules to share identical physicochemical properties (both pI and molecular weight), thus enabling significantly superior resolution compared to one-dimensional electrophoresis methods [10].
O'Farrell's Seminal Contribution
The pioneering work of O'Farrell in 1975 marked a watershed moment for protein separation technologies [10]. Prior to his modifications, 2D electrophoresis techniques suffered from limited resolution and reproducibility. O'Farrell's key advancements included optimization of the pH gradient system, sample preparation protocols, and the interface between the first and second dimensions, enabling proteins to be separated in an even two-dimensional distribution with unprecedented resolution [10]. This foundational work established 2D-PAGE as a premier analytical tool for protein complex fractionation and laid the groundwork for subsequent developments in proteomics.
Evolution of Immobilized pH Gradients
A significant technical advancement addressing the reproducibility limitations of early 2D-PAGE came with the development of immobilized pH gradients (IPG) [10]. The original method used carrier ampholytes in unsupported tube gels, which were prone to cathodic drift (progressive loss of basic proteins during electrofocusing) and batch-to-batch variability [10]. The implementation of IPG strips, where the pH gradient is covalently immobilized within the gel matrix, dramatically improved the stability, reproducibility, and ease of use of the first dimension separation, making 2D-PAGE a more robust and accessible technology for the broader scientific community [10].
Applications and Research Utilities
2D-PAGE serves as a versatile platform with diverse applications across multiple scientific disciplines, particularly in basic research, clinical diagnostics, and drug development [10].
Table 1: Key Application Areas of 2D-PAGE in Biomedical Research
| Application Area | Specific Uses | Research Utility |
|---|---|---|
| Proteome Analysis | Whole proteome mapping [10], Protein expression profiling [10] | Provides direct visual confirmation of changes in protein abundance and post-translational modifications [10] |
| Biomarker Discovery | Disease marker identification [10], Cancer research [10], Bacterial pathogenesis [10] | Facilitates detection of proteins associated with clinical pathologies for diagnostic and prognostic applications [10] |
| Post-Translational Modifications (PTMs) | Detection of phosphorylation, glycosylation, and other modifications [10] | Reveals protein modifications that cannot be predicted from genomic sequences alone [10] |
| Drug Development | Drug discovery [10], Product characterization [10] | Enables monitoring of protein expression changes in response to therapeutic compounds |
| Functional Studies | Cell differentiation [10], Protein-protein interactions [10] | Provides insights into protein function and molecular mechanisms in biological processes |
Specialized Research Applications
Beyond these broad categories, 2D-PAGE has proven particularly valuable in several specialized research contexts:
Clinical Diagnostics: The technique is extensively used for identifying and characterizing disease-related proteins and isoenzymes, with notable applications in hemoglobinopathies such as sickle cell anemia and thalassemia [11]. IEF can separate different hemoglobin variants based on their pI, enabling accurate diagnosis and classification of blood disorders [11].
Biomarker Validation: 2D-PAGE plays a crucial role in the discovery and validation of protein biomarkers for disease detection and prognosis through comparative analysis of protein profiles in patient samples [11].
Therapeutic Protein Development: In the biotechnology industry, 2D-PAGE is employed to characterize and ensure the purity of therapeutic proteins and biologics, helping monitor product consistency and detect undesirable variants or contaminants that could impact efficacy or safety [11].
Experimental Protocols and Methodologies
Comprehensive 2D-PAGE Protocol
Table 2: Detailed Experimental Protocol for 2D-PAGE Analysis
| Protocol Step | Key Parameters | Technical Considerations |
|---|---|---|
| Sample Preparation | Protein extraction via homogenization or cell lysis [11]; Solubilization in appropriate sample buffer [11] | Use denaturating solutions (urea, thiourea) with zwitterionic detergents (CHAPS) for better solubilization [10]; Optimize protein concentration to avoid overloading [11] |
| First Dimension (IEF) | IPG strip selection (pH range and length) [10]; Active rehydration; Step-wise voltage programming [11] | Incorporate ampholytes to establish stable pH gradient [11]; Monitor focusing time to prevent cathodic drift [10] |
| Strip Equilibration | Reduction and alkylation; SDS exposure [7] | Two-step equilibration in SDS-containing buffers; First with DTT, then with iodoacetamide [7] |
| Second Dimension (SDS-PAGE) | Gel percentage selection [7]; Electrophoresis conditions [7] | Use gradient gels (e.g., 4-20%) for broader molecular weight range [7]; Maintain cooling during electrophoresis [7] |
| Protein Detection | Staining method selection (Coomassie, silver, fluorescent) [10] | Consider compatibility with downstream MS analysis [10]; Silver staining requires modification for MS compatibility [10] |
| Image Analysis | Spot detection; Quantification; Gel matching [10] | Use advanced software for accurate spot identification and quantification [10] |
Critical Technical Considerations
Successful implementation of 2D-PAGE requires careful attention to several technical aspects:
Protein Solubilization: Effective solubilization of complex protein mixtures, particularly hydrophobic membrane proteins, remains challenging. The use of optimized solubilization cocktails containing chaotropes (urea and thiourea) and zwitterionic detergents (CHAPS, SB 3-10) has significantly improved protein recovery [10]. Specialized detergents such as Triton X-114 and cationic detergents like benzyldimethyl-n-hexadecylammonium chloride have shown particular efficacy for hydrophobic proteins [10].
Dynamic Range Enhancement: The limited dynamic range of 2D-PAGE presents a significant challenge, as highly abundant proteins can mask less abundant species. This limitation can be addressed through several strategies: depletion of highly abundant proteins (e.g., albumin, immunoglobulin), utilization of highly sensitive fluorescent dyes (SYPRO-Ruby, Deep Purple), and application of large-format gels (24 cm) with increased protein loading capacity [10].
Reproducibility Optimization: Technical variability in 2D-PAGE can be minimized through implementation of immobilized pH gradients, standardized protocols, and the use of differential in-gel electrophoresis (DIGE) technology, which enables multiplexing of samples labeled with different fluorescent cyanine dyes on the same gel [10].
Visualization and Workflow Diagrams
2D-PAGE Experimental Workflow
2D-PAGE Experimental Workflow
Protein Separation Principles
2D-PAGE Separation Principles
Research Reagent Solutions
Table 3: Essential Research Reagents for 2D-PAGE Experiments
| Reagent Category | Specific Examples | Function and Application |
|---|---|---|
| Chaotropes | Urea, Thiourea [10] | Disrupt hydrogen bonds to denature proteins while maintaining solubility for IEF [10] |
| Detergents | CHAPS, Triton X-114, SB 3-10 [10] | Solubilize hydrophobic proteins, particularly membrane proteins [10] |
| Reducing Agents | DTT, DTE, 1,4-dithioethanol [10] [7] | Cleave disulfide bonds to ensure complete protein denaturation [7] |
| Alkylating Agents | Iodoacetamide [7] | Prevent reformation of disulfide bonds after reduction [7] |
| Ampholytes | Carrier ampholytes [10] [11] | Establish stable pH gradients for isoelectric focusing [11] |
| IPG Strips | Immobilized pH gradient strips [10] | Provide reproducible first dimension separation with minimized cathodic drift [10] |
| Staining Reagents | Coomassie Brilliant Blue, SYPRO Ruby, Silver nitrate [10] | Visualize separated protein spots with varying sensitivity and MS compatibility [10] |
Technical Limitations and Advancements
Despite its powerful capabilities, conventional 2D-PAGE faces several technical limitations that researchers must consider in experimental design:
Reproducibility Challenges: Early 2D-PAGE methods suffered from gel-to-gel variability, though this has been substantially addressed through implementation of IPG strips and standardized protocols [10]. Recent multi-laboratory studies demonstrate that 70-93% of protein spots can be detected with coefficients of variation less than 20% within the same laboratory, and 72% across different laboratories [10].
Hydrophobic Protein Separation: Membrane-bound hydrophobic proteins remain challenging to separate using standard 2D-PAGE protocols due to solubility issues [10]. Highly acidic or basic proteins are also difficult to extract and solubilize effectively [10]. Advanced solubilization cocktails incorporating novel detergents have shown improved recovery of hydrophobic proteins [10].
Throughput Constraints: 2D-PAGE is labor-intensive with relatively low throughput compared to some modern proteomic approaches, presenting challenges for large-scale clinical studies requiring analysis of numerous samples [10]. The procedure can require up to three days for completion when using larger format gels [10].
Recent Methodological Innovations
Several technological advances have addressed these limitations and expanded the applications of 2D-PAGE:
2D-DIGE (Differential In-Gel Electrophoresis): This advanced implementation uses multiplexed fluorescent dyes (Cy2, Cy3, Cy5) to label different protein samples, which are then co-separated on the same gel [10]. This approach minimizes gel-to-gel variability and enables more accurate quantitative comparisons between samples [10].
Sensitivity Enhancements: Development of highly sensitive fluorescent protein stains (e.g., SYPRO Ruby, Deep Purple) has extended the dynamic range of detection to below 1 ng, significantly improving the visualization of low-abundance proteins [10].
Integrated Workflows: Improved compatibility with downstream analytical techniques, particularly mass spectrometry, has been achieved through modifications to staining protocols and the development of specialized equipment for spot excision and processing [10].
Two-dimensional polyacrylamide gel electrophoresis (2D-PAGE) remains a cornerstone technique in proteomics for the high-resolution separation of complex protein mixtures. First developed by O'Farrell in 1975, this powerful method separates proteins based on two independent molecular properties: isoelectric point (pI) in the first dimension and molecular weight in the second [1]. The resulting two-dimensional protein maps enable researchers to analyze thousands of protein spots simultaneously, facilitating comparative expression profiling, biomarker discovery, and the study of post-translational modifications [12]. This application note provides a detailed, step-by-step protocol for generating high-quality 2D gel maps, framed within the context of a broader thesis on two-dimensional electrophoresis research, to guide researchers and drug development professionals in implementing this technique effectively.
Sample Preparation and Lysis
Proper sample preparation is the most critical step in the 2D-PAGE workflow, as it directly impacts the resolution and quality of the final gel image. The primary goal is to completely disrupt cellular structures, solubilize all proteins, and maintain them in a state that is compatible with isoelectric focusing (IEF), while preventing degradation or modification.
Cell Lysis Protocol
For bacterial samples, the following protocol ensures effective disruption and solubilization [13]:
- Starting Material: Begin with a pelleted bacterial sample.
- Initial Solubilization: Add four times the pellet volume of a solution containing 2% SDS and 65 mM Dithioerythritol (DTE).
- Disruption: Sonicate the sample three times for 2–20 seconds depending on sample volume. Brief centrifugation can be used to collect the sample.
- Heat Treatment: Resuspend any pellet that may have formed, then boil the sample for 5 minutes. Allow it to cool afterward.
- Lysis Buffer Addition: Add 8 volumes of lysis buffer to 1 volume of the SDS extract. A typical lysis buffer for IEF contains chaotropes and detergents, such as 7 M urea, 2 M thiourea, 4% CHAPS, and a reducing agent [14] [15].
- Final Processing: Sonicate three more times for 5 seconds each, cooling between sonications. Place the sample on a rocking table for 30 minutes.
- Clarification: Centrifuge at 20,000×g for 15 minutes and collect the supernatant.
- Assessment and Storage: Determine the protein concentration using a compatible assay (e.g., Bradford). The sample can be used for IEF immediately or stored at –70°C for several months.
Contaminant Removal and Cleanup
Common contaminants like salts, nucleic acids, and polysaccharides can severely compromise the first-dimension IEF separation, leading to horizontal streaking and poor resolution [13].
- Precipitation: Trichloroacetic acid (TCA)/acetone precipitation is highly effective for removing salts and other contaminants. Add 10% TCA in ice-cold acetone with 20 mM DTE to the sample, incubate at –20°C for 2 hours, centrifuge at 10,000×g for 10 min, wash the pellet with cold acetone containing 20 mM DTE, and finally resuspend the dried pellet in lysis buffer [13].
- Nuclease Treatment: For samples with high viscosity due to nucleic acids, enzymatic digestion is recommended. Add 1/10 volume of a solution containing 1 mg/mL DNase I, 0.25 mg/mL RNase A, and 50 mM MgCl₂, then incubate on ice for 20 minutes [13].
Table 1: Key Reagents for Sample Solubilization in 2D-PAGE
| Component | Function | Recommended Concentration |
|---|---|---|
| Urea/Thiourea | Protein denaturation and solubilization; thiourea is particularly helpful for membrane proteins. | 8–9 M Urea; or 5–8 M Urea with 2 M Thiourea [12] |
| Non-ionic/ Zwitterionic Detergent (e.g., CHAPS) | Protein solubilization and stabilization, prevents hydrophobic interactions. | 0.5–4% [12] |
| Reducing Agent (e.g., DTT, DTE) | Reduces disulfide bonds, linearizes proteins. | 20–100 mM [12] |
| Carrier Ampholytes | Aids protein solubility and helps maintain the pH gradient during IEF. | 0.2–2% [12] |
| Protease Inhibitors | Prevents protein degradation during sample preparation. | As recommended by manufacturer [13] |
First Dimension: Isoelectric Focusing (IEF)
The first dimension of 2D-PAGE, isoelectric focusing (IEF), separates proteins based on their intrinsic isoelectric point (pI). Proteins are applied to a gel strip containing an immobilized pH gradient (IPG) and, under an electric field, they migrate until they reach the position where the gradient pH matches their pI, at which point they carry no net charge and focus into sharp bands [1] [12].
IEF Running Protocol
The following protocol utilizes a commercial IPG strip system for high reproducibility [14]:
- Rehydration: Rehydrate a 24 cm pH 3–10 IPG strip at 20°C for 15 hours with the protein sample (0.7 mg) in 300 µL of rehydration buffer (7 M urea, 4% CHAPS, 2 M thiourea, 1% DTT, 0.2% carrier ampholytes).
- Isoelectric Focusing: Perform IEF using a stepped voltage procedure in a dedicated IEF device:
- Gradually increase to 50 V for 14 hours.
- Increase to 250 V for 30 minutes.
- Increase to 1000 V for 1 hour.
- Step up to 10,000 V for 5 hours.
- Hold at 10,000 V until 60 kVh is reached.
- Finally, hold at 500 V for 2 hours.
Gel Equilibration and Second Dimension: SDS-PAGE
Following IEF, the focused proteins within the IPG strip must be treated to ensure optimal separation in the second dimension, which resolves proteins based on their molecular weight.
Gel Equilibration Protocol
The IPG strip must be equilibrated to introduce SDS and prepare the proteins for SDS-PAGE [14]:
- First Equilibration: Equilibrate the strip for 10 minutes in a buffer containing 6 M urea, 5% SDS, 30% glycerol, and a reducing agent (e.g., DTT). This step denatures the proteins and allows SDS to bind, conferring a uniform negative charge.
- Second Equilibration: Perform a second 10-minute equilibration in the same urea/SDS/glycerol buffer, but replacing the reducing agent with 2.5% iodoacetamide. This alkylates the cysteine residues to prevent reformation of disulfide bonds, which can cause vertical streaking.
SDS-PAGE Protocol
- Gel Casting: Prepare or use a pre-cast polyacrylamide gel (e.g., 12%) for SDS-PAGE. The concentration can be adjusted or a gradient gel can be used to optimize separation for a specific molecular weight range.
- Transfer and Embedding: Place the equilibrated IPG strip directly onto the surface of the SDS-PAGE gel, ensuring full contact along the entire length.
- Electrophoresis: Perform SDS-PAGE in a suitable electrophoresis cell according to the manufacturer's recommendations. Protein molecular weight markers are typically loaded via a filter paper piece wedged next to the IPG strip for calibration [14].
- Completion: Run the gel until the dye front has migrated to the bottom of the gel.
Protein Visualization and Image Analysis
After the second dimension, the separated proteins are visualized as spots distributed across a two-dimensional map.
Staining and Detection
The choice of staining method depends on the required sensitivity, compatibility with downstream mass spectrometry (MS), and available equipment [15] [12].
Table 2: Common Protein Stains for 2D Gels
| Protein Stain | Approximate Sensitivity | Compatibility with Mass Spectrometry | Staining Time |
|---|---|---|---|
| Coomassie Brilliant Blue | > 7 ng [12] | Good | Standard: ~135 min [12] |
| SYPRO Ruby | 0.25–1 ng [12] | Excellent | Standard: Overnight [12] |
| Silver Staining | 0.3 ng [12] | Variable (requires MS-compatible protocol) | Standard: ~1.5 hours [12] |
For example, a gel can be stained with Coomassie Brilliant Blue R-350 and destained with 5% acetic acid for visualization [14]. For higher sensitivity, silver staining or fluorescent stains like SYPRO Ruby are employed.
Image Acquisition and Computational Analysis
Software-based image analysis is a crucial step for the biological interpretation of 2D gel experiments [16].
- Image Acquisition: The stained gel is digitized using a scanner or CCD camera system.
- Spot Detection and Quantification: Dedicated software (e.g., Delta2D, PDQuest) is used to detect protein spots, quantify their intensity (volume), and account for background.
- Gel Matching and Statistical Analysis: Spots across multiple gels in an experiment are matched. Advanced software uses techniques like image warping to correct for run-to-run variations, creating a consensus spot pattern for reliable statistical analysis to identify differentially expressed proteins [16].
The Researcher's Toolkit: Essential Reagents and Equipment
Table 3: Key Research Reagent Solutions for 2D-PAGE
| Item | Function | Specific Examples / Notes |
|---|---|---|
| IPG Strips | First-dimension separation based on pI. | Available in various pH ranges (e.g., 3-10 linear/non-linear, 4-7, 5-6) to optimize resolution [12]. |
| Chaotropes | Denature proteins and improve solubility. | Urea and Thiourea [12]. |
| Zwitterionic Detergents | Solubilize proteins, especially hydrophobic ones, without interfering with IEF. | CHAPS [14] [12]. |
| Reducing Agents | Break disulfide bonds. | Dithiothreitol (DTT) or DTE [13] [12]. |
| Alkylating Agent | Prevents reformation of disulfide bonds after reduction. | Iodoacetamide [14]. |
| Carrier Ampholytes | Establish and stabilize the pH gradient in the IPG strip. | Added to the rehydration buffer [14] [17]. |
| IEF Device | Platform for performing the first-dimension separation. | e.g., Protein i12 IEF Cell [14]. |
| SDS-PAGE System | Platform for performing the second-dimension separation. | e.g., PROTEAN Plus Dodeca Cell [14]. |
The following diagram summarizes the complete 2D-PAGE workflow from sample preparation to analysis.
Within the framework of proteomics research, two-dimensional polyacrylamide gel electrophoresis (2D-PAGE), which combines isoelectric focusing (IEF) and SDS-PAGE, remains a cornerstone technology for the high-resolution separation of complex protein mixtures [18] [7]. Its unparalleled ability to directly visualize and quantify thousands of proteins, including their modified isoforms, makes it an indispensable tool for researchers and drug development professionals. This application note details the key advantages of 2D-PAGE, with a specific focus on its resolution and visualization capabilities, and provides optimized protocols to harness its full potential in discovery-driven protein analysis, biomarker identification, and biopharmaceutical quality control.
Key Advantages and Quantitative Performance
The power of 2D-PAGE stems from its orthogonal separation mechanism. In the first dimension, proteins are resolved based on their native isoelectric point (pI) via IEF. Subsequently, in the second dimension, they are separated by their molecular mass using SDS-PAGE [7]. This two-step process transforms a complex protein sample into a two-dimensional map where each spot ideally corresponds to a unique protein species, including different post-translationally modified isoforms.
The table below summarizes the core performance metrics of standard 2D-PAGE, demonstrating its capacity for comprehensive proteome profiling.
Table 1: Performance Metrics of High-Resolution 2D-PAGE
| Performance Metric | Specification | Research Benefit |
|---|---|---|
| Spot Capacity | Up to 10,000 proteins per gel [19] | Comprehensive profiling of complex samples (e.g., cell lysates, tissues). |
| Detection Sensitivity | Low nanogram range (silver stain); ~5 µg (Coomassie) [20] | Ability to detect low-abundance proteins with sensitive stains. |
| Quantitative Accuracy | Comparative analysis of spot density across samples [18] | Enables measurement of changes in protein expression and abundance. |
| Isoform Resolution | Detection of pI and molecular weight shifts [19] | Direct visualization of post-translational modifications (PTMs) and splice variants. |
This high-resolution separation is quantitatively superior to one-dimensional methods. For instance, an optimization study for rice caryopsis proteome demonstrated that using a 17 cm IPG strip with a pH 5-8 gradient allowed for the detection of 1,051 protein spots, a significant increase over the 851 spots detected with a pH 4-7 strip under the same conditions [20]. Furthermore, the same study highlighted the critical impact of sample loading, with 130 µg of protein load yielding an optimal 1,235 detectable spots, outperforming both lower and higher loading quantities [20].
Detailed Experimental Protocol for Optimized 2D-PAGE
The following section provides a detailed methodology for achieving high-resolution 2D-PAGE, incorporating key optimizations to enhance reproducibility, sensitivity, and spot resolution.
The following diagram illustrates the complete end-to-end workflow for a 2D-PAGE analysis, from sample preparation to protein identification.
Diagram 1: 2D-PAGE Workflow
Step-by-Step Protocol
Step 1: Sample Preparation
- Protein Extraction: Homogenize cells or tissue in an appropriate lysis buffer. For tissues, flash-freezing in liquid nitrogen and powdering is recommended [21].
- Solubilization Buffer: Use a buffer containing 7 M urea, 2 M thiourea, 4% (w/v) CHAPS, and 1% (v/v) carrier ampholytes [21]. The inclusion of thiourea and deionized urea significantly improves the solubility of hydrophobic proteins and minimizes streaking.
- Protease Inhibition: Always include a complete protease inhibitor cocktail to prevent protein degradation during extraction [21].
- Cleanup and Quantification: Remove interfering substances (e.g., salts, lipids, nucleic acids) and quantify protein concentration using a compatible assay (e.g., 2D-Quant Kit).
Step 2: First Dimension - Isoelectric Focusing (IEF)
- IPG Strip Selection: Choose an immobilized pH gradient (IPG) strip based on your sample's needs. A 17 cm, nonlinear pH 5-8 strip is often optimal for broad-range profiling, though narrow-range strips provide higher resolution for specific pI regions [20].
- Sample Loading: Apply the protein sample (e.g., 130 µg for a 17 cm strip with silver staining) via in-gel rehydration [20].
- IEF Protocol: Perform IEF using a stepped or gradient protocol on a dedicated IEF device. A typical program might be: 300 V for 1 hr (step-n-hold), 1000 V for 1 hr (gradient), 8000 V for 8 hrs (gradient), and 8000 V for 60,000 Vhr (step-n-hold), all at 20°C.
Step 3: Gel Equilibration
- Reduction and Alkylation: Incubate the focused IPG strip in two equilibration buffers.
- Equilibration Buffer I: 6 M Urea, 2% SDS, 0.375 M Tris-HCl (pH 8.8), 20% Glycerol, and 2% DTT. Incubate for 15 min with gentle agitation.
- Equilibration Buffer II: Same as Buffer I, but replace DTT with 2.5% iodoacetamide. Incubate for 15 min. This step alkylates the proteins to prevent reformation of disulfide bonds.
Step 4: Second Dimension - SDS-PAGE
- Gel Casting: Pour large-format SDS-PAGE gels (e.g., 40 cm x 30 cm) with an appropriate acrylamide percentage or gradient (e.g., 10-15%) [21].
- Transfer and Sealing: Place the equilibrated IPG strip onto the surface of the SDS-PAGE gel. Seal it in place with agarose solution containing a trace of bromophenol blue.
- Electrophoresis: Run the gel using a discontinuous Tris-Glycine-SDS buffer system. For large formats, use a constant current (e.g., 10 mA/gel for 1 hr, then 40 mA/gel for ~5 hrs) until the dye front reaches the bottom.
Step 5: Protein Visualization
- Staining Protocol Selection: The choice of stain depends on the required sensitivity and downstream applications like mass spectrometry.
- Silver Staining (High Sensitivity): Use a protocol with sensitization in a solution containing glacial acetic acid, sodium acetate, and sodium thiosulfate for superior resolution [20].
- Coomassie Staining (MS-Compatible): A colloidal Coomassie Brilliant Blue G-250 method with ammonium sulfate and phosphoric acid offers low background and high compatibility with mass spectrometry [20].
- Imaging: Acquire high-resolution digital images (≥ 300 dpi) of the gel using a calibrated scanner or imaging system.
Step 6: Image and Data Analysis
- Use specialized 2D analysis software (e.g., ImageMaster 2D Platinum, PDQuest) for spot detection, background subtraction, and normalization.
- For comparative studies, normalize spot volumes to the total density of valid spots or use a total protein normalization (TPN) strategy for accurate quantitation [22].
- Statistically analyze spot intensities across replicate gels to identify differentially expressed proteins or isoforms.
Step 7: Protein Identification
- Manually or robotically excise protein spots of interest from the gel.
- Destain, digest with trypsin, and extract the peptides.
- Identify the proteins using Mass Spectrometry (LC-MS/MS) and database searching.
The Scientist's Toolkit: Essential Research Reagents
Successful 2D-PAGE relies on a suite of specialized reagents and equipment. The following table catalogs the essential solutions for the protocol described above.
Table 2: Key Research Reagent Solutions for 2D-PAGE
| Reagent / Equipment | Function / Role | Specification / Notes |
|---|---|---|
| IPG Strips | First-dimension IEF separation. | 17 cm, pH 5-8 recommended for optimal resolution of many proteomes [20]. |
| Urea & Thiourea | Protein denaturant and solubilizing agent. | Use 7 M Urea + 2 M Thiourea in sample buffer for improved solubility [21]. |
| CHAPS | Non-ionic detergent. | 4% (w/v) in sample buffer to aid protein solubilization and prevent aggregation [21]. |
| Carrier Ampholytes | Generate a stable pH gradient for IEF. | A mixture of broad-range and specific pH-range ampholytes ensures a linear gradient [21]. |
| DTT & IAA | Reducing and alkylating agents. | Critical for breaking and blocking disulfide bonds during equilibration [7]. |
| SYPRO Ruby / No-Stain Label | Fluorescent total protein stain. | Enables Total Protein Normalization (TPN), the gold standard for quantitative Western blotting [22]. |
| Precast Large Gels | Second-dimension SDS-PAGE separation. | Large format (e.g., 40 cm x 30 cm) gels provide superior resolution of thousands of spots [21]. |
Separation Principle and Isoform Detection
The core strength of 2D-PAGE lies in its orthogonal separation principle, which is visually summarized in the following diagram.
Diagram 2: Separation Principle
This principle allows for the direct detection of protein isoforms. Post-translational modifications (PTMs) such as phosphorylation or glycosylation often alter a protein's net charge (pI), causing a horizontal shift on the 2D gel. Modifications that add significant mass (e.g., ubiquitination) can also cause a vertical shift [19]. This results in characteristic "trains" of spots representing different modified states of the same protein, enabling researchers to study PTM dynamics directly.
Two-dimensional polyacrylamide gel electrophoresis (2D-PAGE), combining isoelectric focusing (IEF) and SDS-PAGE, has been a cornerstone of proteomics research since its development by O'Farrell in 1975 [23]. This technique separates complex protein mixtures based on two independent physicochemical parameters: isoelectric point (pI) in the first dimension and molecular weight in the second [24] [1]. Despite its powerful resolving capacity, capable of separating thousands of proteins from a single sample [23], 2D-PAGE faces significant inherent limitations that restrict its utility for comprehensive proteome analysis. The most critical challenges include the immense dynamic range of protein concentrations in biological samples and the limited loading capacity of the gels, which collectively hinder the detection of low-abundance proteins [25] [26]. This application note examines these limitations through quantitative data and provides detailed methodologies to address these challenges in research and drug development contexts.
The Dynamic Range Challenge in Proteomics
The fundamental limitation of 2D-PAGE stems from the enormous concentration range of proteins within biological systems, which can span up to 12 orders of magnitude [26]. In practice, a few highly abundant proteins dominate the staining profile, effectively masking the detection of less abundant species. For example, in leaf extracts from Arabidopsis thaliana, Rubisco constitutes up to 40% of total leaf protein, while in seed endosperm, storage proteins are present in massive amounts [26]. This dynamic range problem consistently prevents researchers from detecting medium to low-abundance proteins using standard 2D-PAGE protocols.
Quantitative Evidence of Detection Limitations
Table 1: Protein Detection Limits in Yeast Proteome Analysis by 2D-PAGE
| Experimental Parameter | Standard 2D-PAGE | Fractionation-Enhanced Approach |
|---|---|---|
| Protein Load | 500 μg total soluble protein | 50 mg total protein |
| Separation Technique | Narrow-range IPG (pH 4.9-5.7) | 1D SDS-PAGE pre-fractionation |
| Proteins Visualized | >1,500 spots (silver stain) | Not specified |
| Low-Abundance Protein Detection | No proteins from genes with codon bias <0.1 | Proteins from genes with codon bias <0.1 detected |
| Codon Bias Range of Detected Proteins | ≥0.1 | <0.1 (lower abundance proteins) |
| Reference | [25] | [25] |
The data in Table 1, derived from a systematic evaluation of the 2D-PAGE approach, demonstrates that despite high sample loads and extended electrophoretic separation, proteins from lower abundance classes remain undetectable without additional fractionation techniques [25]. This finding is particularly significant given that approximately one-half of all yeast genes fall into this low-abundance range (codon bias <0.1), highlighting a substantial coverage gap in standard 2D-PAGE workflows.
Methodologies for Enhancing Low-Abundance Protein Detection
Approach 1: Combinatorial Peptide Ligand Libraries (CPLL)
Combinatorial hexapeptide ligand libraries (commercially available as ProteoMiner) provide a powerful pre-fractionation method to reduce the dynamic range of protein concentrations in complex samples [26]. This technology employs beads with immobilized hexapeptides that bind proteins based on their physicochemical properties, with capacity-restrained conditions ensuring that high-abundance species saturate their ligands while low-abundance proteins are completely bound.
Protocol: CPLL for Plant Leaf Extracts [26]
- Sample Preparation: Extract proteins from Arabidopsis thaliana leaves using lysis buffer with polyvinylpolypyrrolidone treatment to remove phenolic compounds. Employ size-exclusion chromatography to desalt and remove metabolites. Precipitate proteins with ammonium sulfate for concentration.
- CPLL Incubation: Incubate 10 mg of protein with 100 μL of CPLL bead slurry in a final volume of 1 mL. Extend incubation time to facilitate binding of diluted proteins.
- Washing: Remove unbound proteins with four washing steps.
- Elution: Elute bound proteins using 8 M urea, 2% CHAPS, or hot SDS/dithiothreitol (DTT) solution.
- Downstream Analysis: Analyze eluates by 1D/2D electrophoresis or mass spectrometry.
Performance Metrics: Application of CPLL to Arabidopsis leaf extracts enabled identification of 1,192 proteins in control samples plus an additional 512 proteins exclusively after CPLL treatment, demonstrating a 43% increase in proteome coverage [26].
Approach 2: Pre-Electrophoresis Fractionation Strategies
Large-scale fractionation prior to 2D-PAGE provides an alternative pathway to enhance detection of low-abundance proteins.
Protocol: SDS-PAGE Pre-fractionation for Yeast Proteome [25]
- Sample Load: Load 50 mg of soluble yeast protein in loading buffer into a single large well (10 cm in length) of a 10% polyacrylamide gel slab (150 × 120 × 15 mm).
- Electrophoresis: Run at constant 40 mA until adequate separation achieved.
- Gel Sectioning: Excise a strip (3 mm × 100 mm) corresponding to the molecular weight range of interest (e.g., 68-85 kDa).
- In-Gel Digestion: Dice the gel strip into 1-mm³ pieces and subject to in-gel tryptic digestion.
- Peptide Separation: Lyophilize extracted peptides, resolubilize in buffer A, and fractionate by strong cation-exchange chromatography using a 60-minute linear gradient from 0-100% buffer B.
- MS Analysis: Analyze collected fractions by microcapillary LC-MS/MS with extended gradients.
Approach 3: PEPPI-MS for Enhanced Protein Recovery
The Passively Eluting Proteins from Polyacrylamide Gels as Intact Species for MS (PEPPI-MS) workflow addresses the challenge of efficient protein recovery from gels for subsequent analysis.
Protocol: PEPPI-MS Workflow [27]
- Gel Separation: Separate proteins by SDS-PAGE using standard protocols.
- Gel Sectioning: Excise gel regions of interest based on molecular weight markers.
- Protein Extraction: Homogenize gel pieces in a disposable plastic homogenizer. Incubate with shaking for 10 minutes in 0.05% SDS/100 mM ammonium bicarbonate solution containing Coomassie Brilliant Blue as an extraction enhancer.
- Protein Purification: Precipitate recovered proteins using organic solvents.
- MS Analysis: Analyze by LC-MS systems.
Performance Metrics: PEPPI-MS demonstrates a mean protein recovery rate of 68% for proteins below 100 kDa and 57% for proteins above 100 kDa, significantly improving upon traditional electroelution and passive extraction methods [27].
Workflow Integration Diagrams
Optimization of Standard 2D-PAGE Protocols
Beyond pre-fractionation approaches, methodological adjustments to core 2D-PAGE protocols can improve performance for challenging samples.
Reduction and Alkylation Timing
The conventional two-step after-IEF equilibration for reduction and alkylation can cause protein loss (5-25%) and may contribute to horizontal streaking artifacts [28]. As an alternative, performing reduction and alkylation before IEF addresses the problem of thiol re-oxidation during focusing.
Protocol: Pre-IEF Reduction and Alkylation [28]
- Protein Extraction: Solubilize proteins in lysis buffer (e.g., 9.5 M urea, 2% NP-40, 2% ampholytes, 5% β-mercaptoethanol).
- Reduction: Incubate with 65 mM DTT or 5% 2-mercaptoethanol for 30 minutes at room temperature.
- Alkylation: Add iodoacetamide to 135 mM final concentration and incubate for 30 minutes in the dark.
- Isoelectric Focusing: Directly apply reduced and alkylated samples to IPG strips.
- SDS-PAGE: Omit after-IEF equilibration or perform brief equilibration (<10 minutes) before second-dimension separation.
The Scientist's Toolkit: Essential Research Reagents
Table 2: Key Reagents for 2D-PAGE and Low-Abundance Protein Detection
| Reagent/Category | Function/Purpose | Specific Examples |
|---|---|---|
| Combinatorial Ligand Libraries | Reduces dynamic range by equalizing protein concentrations | ProteoMiner (Bio-Rad) [26] |
| Chaotropes | Protein denaturation and solubilization | Urea (8-9.5 M), Thiourea (2 M) [23] |
| Detergents | Enhances protein solubility | NP-40 (2%), CHAPS (2-4%), SDS (1-2%) [23] [1] |
| Reducing Agents | Breaks disulfide bonds | DTT (50-65 mM), β-mercaptoethanol (5%), Tributylphosphine [28] |
| Alkylating Agents | Prevents reformation of disulfide bonds | Iodoacetamide (135 mM) [28] |
| Ampholytes | Creates pH gradient for IEF | Carrier ampholytes (1-2%) [23] |
| Staining Dyes | Protein visualization and extraction enhancement | Coomassie Brilliant Blue, Silver stain, SYPRO Ruby [27] |
| Protease Inhibitors | Prevents protein degradation during extraction | PMSF, Complete Protease Inhibitor Cocktail [1] |
Throughput Limitations and Complementary Technologies
The labor-intensive nature of 2D-PAGE and its limited capacity for high-throughput analysis present additional challenges for drug development applications where rapid screening of multiple samples is often required. Gel-free proteomic approaches, particularly those based on liquid chromatography coupled with mass spectrometry (LC-MS), have emerged as complementary technologies that address some of these throughput limitations [27]. However, 2D-PAGE maintains distinctive advantages for analyzing intact proteoforms and detecting post-translational modifications that alter protein charge or mass [29] [28].
While 2D-PAGE remains a valuable tool for proteomic analysis, particularly for resolving protein isoforms and post-translational modifications, its inherent limitations regarding low-abundance protein detection and throughput must be acknowledged in research and drug development contexts. The methodologies detailed in this application note—including CPLL pre-fractionation, SDS-PAGE pre-fractionation, and optimized protein recovery techniques—provide practical approaches to extend the utility of 2D-PAGE for more comprehensive proteome analysis. By integrating these enhanced protocols with emerging mass spectrometry technologies, researchers can overcome traditional limitations and leverage the unique strengths of 2D-PAGE for sophisticated proteomic applications.
Optimized 2D-PAGE Workflows and Cutting-Edge Applications in Drug Discovery and Diagnostics
Within the framework of proteomics research utilizing two-dimensional gel electrophoresis (2D-PAGE), the precision of the final results is heavily contingent on the initial stages of sample preparation. The processes of cell lysis, protein quantification, and solubilization constitute a critical foundation, directly influencing the resolution and quality of the subsequent separation by isoelectric focusing (IEF) and SDS-PAGE [13] [15]. Inadequate preparation can introduce contaminants or compromise protein integrity, leading to artifacts such as horizontal streaking, smearing, or the incomplete resolution of protein spots [13]. This application note details standardized, optimized protocols for preparing bacterial and tissue samples to ensure reproducible and high-quality 2D-PAGE results for researchers and drug development professionals.
Fundamental Principles and Contaminant Management
The overarching goal of sample preparation for 2D-PAGE is to extract the entire proteome of interest into a solution that is compatible with the first dimension (IEF), while maintaining the native charge of the proteins for accurate separation. A primary challenge is the management of common contaminants that can severely disrupt the electrophoresis process [13].
- Salts and Ionic Compounds: High concentrations of salts can enhance conductivity during IEF, causing horizontal streaks in the final gel. The salt concentration should ideally be below 10 mM when samples are loaded by strip rehydration [13].
- Nucleic Acids: These can clog the gel matrix, bind proteins via electrostatic interactions, and cause general smearing, particularly with silver staining. Treatment with DNase/RNase may be necessary if ultracentrifugation is insufficient [13].
- Lipids and Polysaccharides: These can clog the gel and complex with proteins, particularly hydrophobic ones, preventing their proper solubilization [13].
- Proteases: Protein degradation during prolonged purification steps can alter the proteomic profile. The use of protease inhibitors is recommended if such manipulations are unavoidable [13].
Detailed Experimental Protocols
Cell Lysis and Initial Solubilization
An effective lysis protocol must completely disrupt cells and inactivate proteases, while preserving the native state of the proteins for IEF. The following protocol is adapted for bacterial pellets but can be modified for other cell types [13].
General Solubilization Protocol for Bacterial Samples:
- Starting Material: Begin with a pelleted sample of bacteria.
- Lysis Solution: Add four times the pellet volume of a solution containing 2% SDS and 65 mM Dithioerythritol (DTE).
- Disruption: Sonicate the sample three times for 2–20 seconds, depending on the sample volume.
- Collection: Briefly centrifuge the tube to collect the sample at the bottom.
- Resuspension: Resuspend any pellet that may have formed.
- Denaturation: Boil the sample for 5 minutes to enhance protein solubilization.
- Cooling: Allow the sample to cool to room temperature.
- Dilution: Add 8 volumes of IEF-compatible lysis buffer to 1 volume of the SDS extract. This lysis buffer typically contains chaotropes like urea and thiourea, and non-ionic or zwitterionic detergents like CHAPS to replace the SDS, which is not compatible with IEF [13] [15].
- Mixing: Sonicate three times for 5 seconds, cooling the sample between sonications.
- Incubation: Leave the sample on a rocking table for 30 minutes.
- Clarification: Centrifuge at 20,000×g for 15 minutes and collect the supernatant.
- Quantification: Assess the protein concentration (see Section 3.2).
- Storage: Run the first dimension immediately or store the sample at –70°C for several months [13].
For complex tissue samples, such as breast carcinoma biopsies, an alternative single lysis solution (e.g., CLB1) has been demonstrated to provide excellent solubilization for both 2D-PAGE and array-based proteomics, facilitating multi-platform studies [30]. The use of 20-30 cryostat sections of frozen tissue resuspended in lysis buffer is an effective preparatory technique [30].
Protein Quantification and Sample Purification
Accurate protein quantification is essential for loading consistent amounts of protein across gels, which is a prerequisite for reliable comparative analysis. Precipitation methods are also highly effective for removing contaminants like salts and polysaccharides.
TCA/Acetone Precipitation Protocol:
- Precipitation: Add 10% Trichloroacetic Acid (TCA) in ice-cold acetone with 20 mM DTE to the protein sample.
- Incubation: Leave at –20°C for a minimum of 2 hours.
- Pellet Formation: Centrifuge at 10,000×g for 10 minutes.
- Washing: Wash the pellet with cold acetone containing 20 mM DTE.
- Repeat Wash: Perform the wash step a second time.
- Drying: Let the pellet air-dry to remove all residual acetone.
- Resolubilization: Resuspend the dried pellet directly in IEF-compatible lysis buffer [13].
DNase/RNase Treatment Protocol:
If the sample is viscous, indicating high nucleic acid content:
- Add 1/10 of the sample volume of a solution containing 1 mg/mL DNase I, 0.25 mg/mL RNase A, and 50 mM MgCl₂.
- Incubate on ice for 20 minutes [13].
Workflow Visualization and Reagent Specifications
The following diagram and tables summarize the key steps and components of the sample preparation process.
Table 1: Critical Reagents for Sample Preparation in 2D-PAGE
| Reagent | Function | Key Considerations |
|---|---|---|
| Urea & Thiourea [15] [17] | Chaotropic agents that denature proteins and enhance solubility by disrupting hydrogen bonds. | Urea can carbamylate proteins; avoid heating solutions above 37°C. |
| CHAPS [15] | Zwitterionic detergent that solubilizes proteins without interfering with IEF. | An IEF-compatible alternative to ionic detergents like SDS. |
| DTT or DTE [13] | Reducing agents that cleave disulfide bonds, fully denaturing proteins. | Prevents unwanted oxidation and mixed disulfide formation. |
| Protease Inhibitors [13] | Cocktails that prevent proteolytic degradation during sample preparation. | Essential for prolonged manipulation steps at non-denaturing temperatures. |
| Carrier Ampholytes [17] [31] | Molecules that establish a stable pH gradient in the gel during IEF. | Available in wide (pH 3-10) and narrow ranges for higher resolution. |
| SDS [13] [7] | Ionic detergent used for initial, harsh solubilization. | Must be diluted and exchanged for IEF-compatible detergents before IEF. |
Table 2: Troubleshooting Common Sample Preparation Issues
| Problem | Potential Cause | Recommended Solution |
|---|---|---|
| Horizontal Streaking | High salt concentration [13] | Desalt via precipitation (TCA/acetone) or spin dialysis. |
| Sample Viscosity | High nucleic acid content [13] | Treat with DNase/RNase cocktail. |
| Protein Precipitation | Low solubility at pI; ineffective lysis buffer [15] | Optimize detergent blend (e.g., use specialized solubilizers). |
| Poor Focusing | Presence of contaminants; inadequate reduction [13] | Ensure complete reduction with DTT/DTE and purify sample. |
| Vertical Streaks | Incomplete removal of SDS [13] | Ensure proper dilution with IEF lysis buffer and verify components. |
Meticulous execution of the lysis, quantification, and solubilization protocols detailed herein is a non-negotiable prerequisite for success in 2D-PAGE-based research. The integrity of the entire proteomic analysis hinges on these initial steps. By systematically managing contaminants, accurately quantifying protein content, and achieving complete protein solubilization in an IEF-compatible solution, researchers can lay a solid foundation for obtaining high-resolution, reproducible 2D gels. This, in turn, enables robust comparative analyses and reliable biomarker discovery, which are fundamental to advancing both basic biological research and drug development initiatives.
Isoelectric focusing (IEF) is a powerful high-resolution analytical technique used primarily for the separation of proteins and other biomolecules based on their isoelectric points (pI). The isoelectric point of a protein is the specific pH at which the molecule carries no net electrical charge, a fundamental property that enables precise separation and analysis of proteins in complex biological samples [11]. As the first dimension in two-dimensional polyacrylamide gel electrophoresis (2D-PAGE), IEF provides the critical charge-based separation that, when combined with molecular weight-based separation in the second dimension, allows for comprehensive analysis of complex proteomes [32] [23].
The technique was pioneered in the 1970s and has since evolved into an indispensable tool in biochemistry, molecular biology, and clinical diagnostics [11]. The development of IEF marked a significant advancement over one-dimensional separation methods, enabling researchers to resolve protein mixtures with exceptional precision. When O'Farrell first combined IEF with SDS-PAGE in 1975, he created a powerful system capable of resolving up to 5,000 different proteins from a single sample, establishing the foundation for modern proteomics [23] [10].
In the context of 2D-PAGE research, IEF serves as the crucial first separation step, determining the overall resolution and quality of the final two-dimensional protein map. Its ability to distinguish between protein isoforms with differences as small as 0.01 pH units makes it particularly valuable for detecting post-translational modifications and charge heterogeneities that would be impossible to resolve using separation techniques based solely on molecular weight [33].
Fundamental Principles of IEF
The Isoelectric Point (pI) Concept
The core principle underlying isoelectric focusing revolves around the isoelectric point (pI), a unique physicochemical property of every protein. The pI is defined as the specific pH value at which a protein has an equal number of positive and negative charges, resulting in a net charge of zero [11]. Proteins are amphoteric molecules containing both acidic and basic functional groups; their net charge varies with the pH of their environment. Below its pI, a protein carries a net positive charge and will migrate toward the cathode in an electric field. Above its pI, the protein carries a net negative charge and will migrate toward the anode [11] [33].
This charge-pH relationship forms the basis of IEF separation. When placed in a pH gradient under an electric field, proteins will migrate until they reach the position where the pH matches their pI. At this precise location, the protein becomes electrically neutral and ceases migration, effectively "focusing" into sharp, stable bands [11]. This focusing action continues even if proteins diffuse away from their pI position, as they will regain charge and be pulled back by the electric field, resulting in exceptionally high resolution [33].
Establishment of pH Gradients
The creation of a stable pH gradient is essential for successful IEF. Two primary methods exist for establishing this gradient:
Ampholyte-Based Gradients: Carrier ampholytes are small, multi-charged molecules that distribute themselves along an electric field to create a continuous pH gradient. These synthetic molecules are complex mixtures of polyamino-polycarboxylic acids with different pI values that cover specific pH ranges [11]. When voltage is applied, ampholytes arrange themselves in order of their pI values, creating a smooth pH transition from anode to cathode.
Immobilized pH Gradients (IPG): IPG strips represent a significant technical advancement where the buffering groups are covalently bonded to the acrylamide gel matrix. This immobilization prevents pH gradient drift during extended focusing times, particularly in the basic region, and greatly improves reproducibility [10]. IPG strips are now widely adopted in 2D-PAGE research due to their superior stability and consistency [1].
The choice between these gradient systems depends on the specific application, with ampholyte-based IEF being more flexible for method development and IPG strips providing higher reproducibility for comparative proteomic studies [10].
Table 1: Comparison of pH Gradient Systems in IEF
| Parameter | Ampholyte-Based Gradients | Immobilized pH Gradients (IPG) |
|---|---|---|
| Composition | Mobile carrier ampholytes | Immobilized buffering groups covalently bound to gel matrix |
| Stability | Prone to cathodic drift | Highly stable, no drift |
| Reproducibility | Moderate | High |
| pH Range Flexibility | High - easily customized | Limited to commercial available strips |
| Common Applications | Analytical IEF, initial method development | 2D-PAGE, comparative proteomics |
Experimental Setup and Protocol
Materials and Equipment
The successful implementation of IEF requires specific materials and equipment optimized for creating stable pH gradients and applying electric fields. The core components include:
IEF Gel Matrix: Typically composed of polyacrylamide or agarose, forming a support medium for the pH gradient. The matrix must be chemically inert to prevent protein interactions while providing appropriate pore sizes for protein migration [11].
Ampholytes or IPG Strips: Commercial ampholyte mixtures come in various pH ranges (broad range 3-10, or narrow ranges for higher resolution). IPG strips are available in multiple lengths (7-24 cm) with linear or nonlinear pH gradients [1].
Electrode Solutions: Anolyte (acidic, typically phosphoric acid) and catholyte (basic, typically sodium hydroxide) solutions that maintain stable terminal pH values at the electrodes [23].
Power Supply: A specialized unit capable of delivering high voltages (up to 8000-10000 V) with precise temperature control, often featuring programmable methods with stepwise voltage increases [11].
Sample Loading Accessories: Sample applicators, cups, or rehydration trays for introducing protein samples onto the IEF gel or strip [1].
The specific equipment requirements vary between tube gel IEF systems, which use traditional cylindrical gels, and flatbed systems that employ IPG strips on cooling platforms. Modern 2D-PAGE workflows predominantly use IPG strips due to their superior reproducibility and ease of handling [10].
Sample Preparation Protocol
Proper sample preparation is critical for successful IEF separation. The following protocol outlines the key steps for preparing protein samples for IEF in a 2D-PAGE context:
Protein Extraction:
- Homogenize cells or tissues in appropriate lysis buffer (typically containing 8-9 M urea, 2-4% CHAPS, 40-50 mM DTT or TCEP) [23] [1].
- Include protease and phosphatase inhibitors to prevent protein degradation and maintain modification states.
- For difficult-to-solubilize proteins (particularly membrane proteins), consider including thiourea (2 M) and alternative detergents such as ASB-14 or sulfobetaines [10].
Sample Clarification:
- Centrifuge lysates at 15,000-20,000 × g for 15-30 minutes at 4-15°C to remove insoluble debris.
- Transfer supernatant to a fresh tube, being careful not to disturb the pellet.
Protein Quantification:
- Determine protein concentration using compatible assays (Bradford, BCA, or 2D-Quant kit).
- Ensure quantification method is compatible with lysis buffer components.
Sample Buffer Preparation:
- Dilute protein extract in IEF-compatible sample buffer to achieve final concentrations:
Sample Cleanup (if necessary):
- For samples with high salt or contaminant content, perform protein precipitation (acetone/TCA) and resuspend in appropriate sample buffer.
- Alternatively, use commercial desalting columns or dialysis.
The prepared samples should be used immediately or stored at -80°C in small aliquots to avoid multiple freeze-thaw cycles and urea decomposition [1].
Diagram 1: Sample preparation workflow for IEF
Step-by-Step IEF Protocol
The following protocol describes the standard procedure for running IEF using IPG strips, which is the most common method in contemporary 2D-PAGE research:
IPG Strip Rehydration:
- Apply appropriate volume of sample (containing 50-500 μg total protein depending on analytical or preparative goals) to strip holder.
- For passive rehydration: Carefully place IPG strip (gel side down) onto sample solution, avoiding bubble formation. Cover strip with immersion oil to prevent evaporation and urea crystallization.
- For active rehydration: Apply low voltage (30-50 V) for 10-12 hours during rehydration to enhance protein entry into the gel matrix [1].
IEF Running Conditions:
- After rehydration, run IEF using a stepwise or gradient voltage program optimized for the specific IPG strip length and pH range:
- Step 1: 500 V for 1 hour (step-and-hold)
- Step 2: 1000 V for 1 hour (step-and-hold)
- Step 3: Gradient to 8000-10000 V over 1-2 hours
- Step 4: 8000-10000 V for multiple hours until appropriate volt-hours (Vh) are reached [1]
- The total Vh product (voltage × time) is strip and pH-range dependent, typically ranging from 20,000 to 80,000 Vh for 24 cm strips.
- After rehydration, run IEF using a stepwise or gradient voltage program optimized for the specific IPG strip length and pH range:
Post-IEF Processing:
- After focusing, strips can be stored at -80°C or immediately processed for second-dimension SDS-PAGE.
- Equilibrate strips for 15-20 minutes in SDS-containing buffer (typically Tris-HCl, pH 8.8, containing urea, glycerol, SDS, and iodoacetamide) to prepare proteins for second-dimension separation [1].
Temperature control during IEF is critical, with most protocols recommending 20°C to prevent urea crystallization while minimizing protein degradation. Monitoring current throughout the run is also important, as a significant current increase may indicate urea breakdown or salt contamination [1].
Table 2: Typical IEF Running Conditions for Different IPG Strip Lengths
| Strip Length | Sample Volume | Total Protein Load | Maximum Voltage | Total Volt-Hours |
|---|---|---|---|---|
| 7 cm | 125-250 μL | 10-100 μg | 5000 V | 10,000-15,000 Vh |
| 11 cm | 185-300 μL | 50-200 μg | 8000 V | 30,000-40,000 Vh |
| 17 cm | 300-450 μL | 100-500 μg | 10000 V | 50,000-70,000 Vh |
| 24 cm | 450-600 μL | 200-1000 μg | 10000 V | 70,000-100,000 Vh |
The Scientist's Toolkit: Essential Research Reagents
Successful implementation of IEF requires specific reagents optimized for creating stable pH gradients and maintaining protein solubility throughout the separation process. The following table details essential reagents and their functions in IEF protocols:
Table 3: Essential Research Reagents for IEF
| Reagent | Function | Typical Concentration | Notes |
|---|---|---|---|
| Urea | Primary chaotrope that disrupts hydrogen bonds, denatures proteins, and neutralizes hydrophobic interactions | 7-9 M | Must be fresh; avoid heating above 37°C to prevent cyanate formation |
| Thiourea | Enhanced chaotrope particularly effective for membrane proteins | 0-2 M | Often combined with urea (2 M thiourea + 5-7 M urea) |
| CHAPS | Zwitterionic detergent that solubilizes proteins while maintaining IEF compatibility | 2-4% | Superior to non-zwitterionic detergents for IEF |
| DTT/DTE/TCEP | Reducing agents that break disulfide bonds and maintain sulfhydryl groups in reduced state | 20-100 mM | TCEP more stable than DTT; prevents reoxidation |
| Ampholytes | Establish and stabilize pH gradient; improve protein solubility | 0.5-2% | Match pH range to sample requirements; reduce protein precipitation |
| Iodoacetamide | Alkylating agent that prevents reformation of disulfide bonds after reduction | 0.05-0.1 M | Used post-IEF during equilibration before second dimension |
| Glycerol | Increases sample density; reduces electroendosmosis | 5-20% | Helps position sample in well during loading |
| Bromophenol Blue | Tracking dye that visualizes migration front | Trace | Does not interfere with separation; migrates toward anode |
The quality and freshness of these reagents, particularly urea and reducing agents, significantly impact IEF performance. Urea solutions should be prepared fresh or stored frozen in aliquots to prevent isocyanate formation, which can cause protein carbamylation and artificial charge heterogeneity [23] [1].
Advanced IEF Applications in 2D-PAGE Research
Proteomic Analysis and Protein Characterization
IEF serves as the foundational separation technique in comprehensive proteomic studies using 2D-PAGE. Its exceptional resolution enables detailed characterization of complex protein mixtures from various biological sources. Key applications include:
Whole Proteome Analysis: IEF-based 2D-PAGE can resolve thousands of proteins simultaneously, providing a global view of proteome composition under different physiological or experimental conditions [10]. The technique has been successfully applied to organisms ranging from bacteria to mammalian tissues, with demonstrated resolution of up to 5,000 protein spots from a single sample [23].
Detection of Protein Isoforms and Post-Translational Modifications (PTMs): IEF is particularly sensitive to changes in protein charge caused by PTMs such as phosphorylation, acetylation, glycosylation, and deamidation [11] [33]. These modifications typically cause horizontal shifts in the 2D gel pattern, allowing for direct visualization of modified protein species. For example, the addition of a single phosphate group changes the protein's net charge, resulting in a discernible shift along the IEF axis [33].
Biomarker Discovery: Comparative 2D-PAGE analysis using IEF has been instrumental in identifying disease-specific protein biomarkers in cancer, neurodegenerative disorders, and infectious diseases [10]. The ability to visualize quantitative changes in protein expression patterns between control and disease samples makes IEF-based 2D-PAGE a powerful discovery tool.
Biopharmaceutical Quality Control
The principles of IEF have been adapted into advanced capillary-based formats that play critical roles in biopharmaceutical development and quality control:
Charge Variant Analysis: Imaged capillary IEF (icIEF) has emerged as the gold standard for monitoring charge heterogeneity in therapeutic proteins, including monoclonal antibodies, antibody-drug conjugates, and biosimilars [34]. Charge variants resulting from deamidation, sialylation, glycation, or C-terminal lysine processing can significantly impact drug efficacy, stability, and immunogenicity.
Critical Quality Attribute (CQA) Monitoring: Regulatory agencies require thorough characterization of CQAs throughout biotherapeutic development. icIEF provides high-resolution profiling of charge variants, serving as both identity and purity assays for lot release testing and stability studies [34].
Process Development and Consistency: IEF-based methods are used to monitor consistency in biomanufacturing processes and to assess comparability after process changes. The unique charge heterogeneity profile of a biotherapeutic serves as a fingerprint for product identity and quality [34].
Diagram 2: Key application areas of IEF technology
Troubleshooting and Method Optimization
Even with careful execution, IEF can present technical challenges that affect separation quality. The following table outlines common issues, their potential causes, and recommended solutions:
Table 4: Troubleshooting Guide for Common IEF Problems
| Problem | Possible Causes | Solutions |
|---|---|---|
| Horizontal Streaking | Incomplete focusing; insufficient volt-hours | Increase focusing time; extend final high-voltage step |
| Sample precipitation at pI | Increase ampholyte concentration; add thiourea; optimize detergent | |
| Salt contamination | Desalt sample; include extra focusing steps at low voltage | |
| Poor Resolution | Inappropriate pH range | Select narrower pH range IPG strips centered on protein of interest |
| Protein overload | Reduce sample load; use more sensitive detection | |
| Inadequate focusing conditions | Increase Vh product; ensure proper power settings | |
| Missing Protein Spots | Inefficient sample entry | Use active rehydration; extend rehydration time |
| Protein degradation | Add fresh protease inhibitors; work at lower temperatures | |
| Poor solubilization | Optimize lysis buffer; include alternative detergents | |
| Vertical Streaks in 2D | Incomplete equilibration | Extend equilibration time; ensure proper SDS uptake |
| Protein aggregation | Improve reduction/alkylation; include fresh urea | |
| Keratin contamination | Maintain clean work area; use filtered solutions |
Beyond addressing specific problems, several strategic approaches can optimize IEF performance in 2D-PAGE workflows:
pH Range Selection: Choose IPG strip pH ranges based on the proteins of interest. Broad-range strips (pH 3-10) provide overviews, while narrow-range strips (e.g., pH 4-7 or 5-6) provide higher resolution for specific regions [1].
Sample Load Optimization: Balance detection sensitivity with resolution. Overloading causes streaking and spot overlapping, while underloading may prevent detection of low-abundance proteins. For analytical purposes, 50-100 μg is typical for minigels, while preparative runs may use 500-1000 μg [1].
Prefractionation Techniques: For complex samples, consider prefractionation methods such as liquid-phase IEF, chromatographic separation, or cellular compartment isolation to reduce sample complexity and enhance detection of low-abundance proteins [10].
Advanced techniques such as 2D-DIGE (Difference Gel Electrophoresis) further enhance IEF applications by allowing multiple samples labeled with different fluorescent cyanine dyes to be separated on the same gel, minimizing gel-to-gel variability and improving quantitative accuracy [10].
Recent Advances and Future Perspectives
IEF technology continues to evolve with several significant advancements enhancing its capabilities and applications:
Imaged Capillary IEF (icIEF): This automated approach combines the principles of traditional IEF with capillary electrophoresis and whole-column imaging detection [34]. icIEF offers rapid analysis (3-10 minutes), high resolution, excellent reproducibility, and quantitative capabilities, making it ideal for biopharmaceutical quality control environments. The technique has been formally recognized in the European Pharmacopoeia as a horizontal method for analyzing monoclonal antibody-based drugs [34].
Enhanced Detection Methods: Traditional staining methods (Coomassie, silver stain) are being supplemented or replaced by highly sensitive fluorescent dyes (SYPRO Ruby, Deep Purple) that offer wider dynamic ranges and better compatibility with mass spectrometry [10]. Fluorescent detection enables more accurate quantification and improves the detection of low-abundance proteins.
Integration with Mass Spectrometry: While 2D-PAGE has long been coupled with MS for protein identification, recent developments focus on improving this interface. Advances include better in-gel digestion protocols, improved peptide recovery methods, and compatibility with downstream MS analysis [10].
Microfluidic IEF Platforms: Miniaturized IEF devices are emerging for applications requiring minimal sample volumes or high-throughput analysis. These systems offer rapid separation times and potential for integration with other analytical modules [34].
As proteomics continues to advance toward analyzing increasingly complex samples and detecting lower-abundance proteins, IEF remains an essential tool in the multidimensional separation arsenal. Its unique ability to resolve proteins based on their fundamental charge properties ensures its continued relevance in both basic research and applied biotechnological contexts.
In the established framework of two-dimensional polyacrylamide gel electrophoresis (2D-PAGE), the execution of the second dimension via SDS-PAGE is a critical step that enables the high-resolution separation of complex protein mixtures based on molecular weight. Following first-dimension separation by isoelectric focusing (IEF), which resolves proteins according to their isoelectric point (pI), SDS-PAGE provides an orthogonal separation parameter that is largely independent of pI [23]. This powerful combination allows proteins to be distributed across a two-dimensional gel rather than along a diagonal, dramatically increasing resolution and enabling the simultaneous analysis of hundreds to thousands of protein components from complex biological sources [23] [35]. The reproducibility of this technique is sufficient to permit matching of protein spots across different separations, making it an invaluable tool for comparative proteomic studies aimed at identifying differentially expressed proteins in various physiological conditions or disease states [23] [36].
The core principle of SDS-PAGE separation lies in the binding of sodium dodecyl sulfate (SDS) to denatured proteins, which confers a uniform negative charge density, effectively masking the proteins' intrinsic charge [37] [38] [39]. When subjected to an electric field within a polyacrylamide gel matrix, these SDS-coated proteins migrate toward the anode at rates inversely proportional to the logarithm of their molecular weights, enabling precise size-based separation [38]. This technique has proven exceptionally valuable for proteomic profiling, with the capacity to resolve up to 1100 different components from Escherichia coli and potentially capable of resolving a maximum of 5000 proteins [23]. For proteomic studies of solid tumors and other complex tissues, optimization of the SDS-PAGE dimension is particularly crucial for achieving acceptable resolution and reproducibility [36].
Fundamental Principles of SDS-PAGE Separation
Molecular Mechanisms of Size-Based Separation
The exceptional resolving power of SDS-PAGE stems from two interconnected biochemical processes that standardize protein physical properties prior to electrophoretic separation. First, the anionic detergent SDS binds to denatured proteins at a consistent ratio of approximately 1.4 grams of SDS per 1 gram of protein, creating a uniform negative charge along the polypeptide backbone that effectively neutralizes the protein's intrinsic charge [37] [38]. This SDS binding occurs through hydrophobic interactions between the alkyl chain of SDS and hydrophobic regions of the denatured protein, while the sulfate groups project outward, creating the negatively charged coat [38]. The result is a consistent charge-to-mass ratio across all proteins, ensuring that electrophoretic mobility depends solely on molecular size rather than charge or structural conformation [37] [39].
Second, the polyacrylamide gel matrix serves as a molecular sieve with tunable pore sizes determined by the concentrations of acrylamide and bisacrylamide cross-linker [37] [38]. During electrophoresis, smaller proteins navigate these pores more readily and migrate rapidly through the gel, while larger proteins encounter greater resistance and migrate more slowly [39]. The relationship between migration distance and molecular weight is logarithmic, enabling molecular weight estimation through comparison with standardized protein markers [38] [40]. The discontinuous buffer system developed by Laemmli further enhances resolution by initially concentrating proteins into sharp bands within a stacking gel before they enter the separating gel where size-based separation occurs [41] [37].
The Discontinuous Buffer System
The Laemmli buffer system employs a two-layer gel structure with differing pH levels and pore sizes to achieve superior protein resolution [37] [38]. The stacking gel (typically pH 6.8 with 4-5% acrylamide) utilizes the differential mobility of chloride (leading) and glycine (trailing) ions to concentrate protein samples into extremely narrow zones before they enter the resolving gel [37]. This stacking effect produces sharp, well-defined protein bands that are essential for high-resolution separation. The separating gel (typically pH 8.8 with 7.5-20% acrylamide) provides the molecular sieving environment where proteins separate according to molecular weight [38] [40]. The higher pH in this region causes glycine to become fully deprotonated, increasing its electrophoretic mobility and driving the stacked proteins into the separating gel matrix where size-based separation occurs [37].
Materials and Reagents
Research Reagent Solutions for SDS-PAGE
The following table details essential reagents and materials required for performing SDS-PAGE as the second dimension in 2D-PAGE analysis:
Table 1: Essential Reagents and Materials for SDS-PAGE
| Reagent/Material | Function and Purpose | Typical Composition/Properties |
|---|---|---|
| Acrylamide-Bis Solution | Forms the polyacrylamide gel matrix; pore size determines separation range | 29:1 or 37.5:1 ratio of acrylamide to bisacrylamide; concentration varies from 7.5-20% for separating gel [38] [40] |
| SDS (Sodium Dodecyl Sulfate) | Anionic detergent that denatures proteins and confers uniform negative charge | 10-20% stock solution; binds to proteins at ~1.4g SDS per 1g protein [37] [38] |
| Tris-HCl Buffers | Maintains pH during electrophoresis; discontinuous system enhances resolution | 1.5M Tris-HCl (pH 8.8) for separating gel; 0.5M Tris-HCl (pH 6.8) for stacking gel [23] [40] |
| Ammonium Persulfate (APS) & TEMED | Catalyzes acrylamide polymerization | APS (10% solution) provides free radicals; TEMED accelerates polymerization [37] [40] |
| Sample Loading Buffer | Prepares proteins for electrophoresis; ensures denaturation and visibility | Contains SDS, reducing agent (DTT or β-mercaptoethanol), glycerol, tracking dye, and Tris buffer [23] [38] |
| Running Buffer | Provides conducting medium and maintains pH during electrophoresis | Tris-glycine buffer with 0.1% SDS; 25mM Tris, 192mM glycine, 0.1% SDS [23] [38] |
| Molecular Weight Standards | Reference for estimating protein molecular weights | Pre-stained or unstained proteins of known molecular weights [38] [39] |
| Staining Solutions | Visualizes separated proteins after electrophoresis | Coomassie Brilliant Blue, SYPRO Ruby, or silver stain; choice depends on sensitivity requirements [35] [40] |
Equipment Requirements
The basic instrumentation for SDS-PAGE includes a gel casting apparatus (glass plates, spacers, combs), an electrophoresis chamber with buffer tanks, and a power supply capable of providing constant voltage or current [38] [40]. For optimal 2D-PAGE results, specialized equipment for the second dimension may include larger format gel boxes to accommodate IPG strips from the first dimension IEF separation [36]. Post-electrophoresis analysis typically requires gel imaging systems such as white light transilluminators for colorimetric stains or specialized scanners for fluorescent detection [35] [40].
Detailed SDS-PAGE Protocol for 2D-PAGE
Gel Preparation and Casting
The preparation of polyacrylamide gels with appropriate acrylamide concentrations is critical for achieving optimal protein separation in the second dimension of 2D-PAGE:
Assemble glass plates and spacers in the gel casting apparatus according to manufacturer specifications, ensuring a leak-proof seal [40].
Prepare separating gel mixture based on desired acrylamide concentration (typically 10-12% for broad-range protein separation):
- 30% Acrylamide-bisacrylamide solution (29:1)
- 1.5 M Tris-HCl (pH 8.8)
- 10% SDS
- Deionized water
- 10% Ammonium persulfate (freshly prepared)
- TEMED [40]
Pour separating gel into assembled plates to approximately 2 cm below the top of the shorter plate. Carefully overlay with deionized water or isobutanol to create a flat interface and exclude oxygen, which inhibits polymerization [40].
Allow complete polymerization (approximately 30 minutes at room temperature), then remove overlay solution, rinse with deionized water, and thoroughly drain [40].
Prepare stacking gel mixture (typically 4-5% acrylamide):
- 30% Acrylamide-bisacrylamide solution
- 0.5 M Tris-HCl (pH 6.8)
- 10% SDS
- Deionized water
- 10% Ammonium persulfate
- TEMED [40]
Pour stacking gel immediately over the polymerized separating gel and insert appropriate comb, avoiding air bubbles. Allow to polymerize completely (at least 1 hour at room temperature) [40].
Sample Preparation from IEF Strips
Proper equilibration of IEF strips between the first and second dimensions is essential for successful transfer and separation:
Equilibrate focused IPG strips in SDS equilibration buffer to ensure complete denaturation and SDS coating of proteins. The equilibration buffer typically contains:
- 6 M Urea
- 75 mM Tris-HCl (pH 8.8)
- 30% Glycerol
- 2% SDS
- Tracking dye (bromophenol blue) [36]
Perform reduction and alkylation (either during or after IEF) to disrupt disulfide bonds and prevent reformation. This step typically involves:
- Incubation with 1% DTT in equilibration buffer for 15 minutes (reduction)
- Subsequent incubation with 2.5% iodoacetamide in equilibration buffer for 15 minutes (alkylation) [36]
Rinse strips briefly with SDS running buffer and place on top of the prepared SDS-PAGE gel, ensuring complete contact between the IPG strip and the stacking gel surface [36].
Seal IPG strips in place with agarose sealing solution (0.5-1% agarose in running buffer containing tracking dye) to prevent movement during electrophoresis [23] [36].
Electrophoresis Conditions
Optimal electrophoretic separation requires careful control of voltage and running conditions:
Assemble gel apparatus according to manufacturer instructions and fill both chambers with freshly prepared running buffer (25 mM Tris, 192 mM glycine, 0.1% SDS) [40].
Apply low initial voltage (90-100 V) until samples have migrated through the stacking gel and dye front enters the separating gel [40].
Increase voltage to 150-200 V for the remainder of the separation, continuing until the dye front approaches the bottom of the gel (typically 45-60 minutes for mini-gels, several hours for large-format 2D gels) [40].
Maintain constant temperature during electrophoresis (typically 15-20°C) using a circulating water bath or controlled environment to ensure reproducible migration patterns [36].
Protein Detection and Visualization
Following electrophoresis, separated proteins must be visualized using appropriate detection methods:
Carefully remove gels from glass plates and place in appropriate fixation solution (typically 40% ethanol, 10% acetic acid) for at least 30 minutes to precipitate proteins and remove SDS [35] [40].
Select staining method based on sensitivity requirements and downstream applications:
- Coomassie Brilliant Blue: Detect 8-30 ng protein; wide linear dynamic range; excellent MS compatibility [35]
- SYPRO Ruby: Detect 1-2 ng protein; wide linear dynamic range; excellent for quantitation [35]
- Silver Staining: Detect 0.1-0.5 ng protein; limited dynamic range; variable MS compatibility [35]
Destain gels appropriately to reduce background staining while retaining protein signal intensity [40].
Image gels using appropriate documentation systems (white light transilluminator for colorimetric stains, laser scanner for fluorescent stains) [35] [40].
Quantitative Performance of Detection Methods
The selection of an appropriate protein detection method following SDS-PAGE is critical for accurate quantification in proteomic applications. Different staining techniques offer varying sensitivities, dynamic ranges, and compatibilities with downstream protein identification methods such as mass spectrometry.
Table 2: Performance Characteristics of Common Protein Stains for SDS-PAGE
| Staining Method | Detection Limit | Linear Dynamic Range | Inter-protein Variability | MS Compatibility | Primary Applications |
|---|---|---|---|---|---|
| Colloidal Coomassie | 8-16 ng [35] | 30-500 ng [35] | Low inter-protein variability [35] | Excellent peptide recovery after destaining [35] | Routine analysis; protein purification monitoring; MS sample preparation |
| SYPRO Ruby | 1-2 ng [35] | 3 decades [35] | Moderate variability [35] | Excellent compatibility [35] | Quantitative proteomics; low-abundance protein detection; 2D-PAGE analysis |
| Silver Staining | 0.1-0.5 ng [35] | 1-2 decades (non-linear) [35] | High variability between proteins [35] | Variable (requires MS-compatible protocols) [35] | Maximum sensitivity detection; analytical applications not requiring MS |
| Deep Purple | ~1 ng [35] | 3 decades [35] | Lower variability than Silver stain [35] | Good compatibility [35] | Fluorescent detection with standard UV transilluminators |
| Coomassie R-250 | 10-30 ng [35] | 10-200 ng [35] | 11.5-26.7% variability between proteins [35] | Good with proper destaining [35] | Teaching laboratories; routine protein analysis |
Applications in Proteomic Research and Drug Development
Protein Characterization in Complex Biological Samples
SDS-PAGE as the second dimension in 2D-PAGE enables comprehensive protein profiling of complex biological samples, providing critical information about protein expression patterns, post-translational modifications, and molecular weight distributions [23] [35]. In proteomic studies of solid tumor tissues, optimized 2D-PAGE protocols have enabled detection of 20% more protein spots compared to standard conditions, significantly enhancing the ability to identify novel disease biomarkers and molecular drug targets [36]. The technique's capacity to resolve proteins differing by a single charge makes it particularly valuable for detecting charge-altering post-translational modifications such as phosphorylation and for identifying proteins affected by missense mutations [23].
Food Science and Allergen Detection
In food science applications, SDS-PAGE serves as a fundamental analytical tool for protein characterization across diverse food products, including cereals, pulses, dairy products, meats, seafood, and plant-based alternatives [41]. The technique enables protein profiling, allergen detection, and quality assessment by providing detailed information about protein composition, structural changes induced by food processing, and the presence of potential adulterants [41]. Reducing SDS-PAGE conditions are particularly valuable for analyzing disulfide-cross-linked protein subunits and evaluating protein purity in functional food ingredients [41].
Medical Diagnostics and Therapeutic Development
SDS-PAGE finds important applications in medical diagnostics, including HIV testing where viral proteins are separated by SDS-PAGE and subsequently detected by Western blotting using patient-derived HIV-specific antibodies [40]. The technique also enables proteinuria analysis by determining the relative amounts of various serum proteins in urine, providing clinically relevant information for diagnosing kidney disorders [40]. In drug development, SDS-PAGE supports critical characterization of therapeutic proteins, assessment of protein drug purity, and analysis of protein-protein interactions through techniques such as immunoprecipitation followed by electrophoretic separation [40].
Troubleshooting and Optimization Strategies
Common Technical Issues and Solutions
Several factors can impact the accuracy and resolution of SDS-PAGE separations in the second dimension of 2D-PAGE:
Horizontal Streaking: Often caused by protein oxidation during IEF; can be minimized through pre-reduction and alkylation of protein samples prior to IEF [36].
Poor Spot Resolution: May result from insufficient focusing in the first dimension; optimize focusing time (typically 40,000-80,000 Vhr for 24 cm strips) to improve 2D image quality and reproducibility [36].
Vertical Streaking: Frequently caused by incomplete protein solubilization; enhance protein extraction using bead mill-based methods with urea/thiourea lysis buffers [36].
Inconsistent Molecular Weight Estimation: Can arise from improper buffer preparation or inaccurate acrylamide concentrations; standardize reagent preparation and use freshly made solutions.
Enhancing Reproducibility in 2D-PAGE
Achieving reproducible protein separation patterns across multiple gels is essential for comparative proteomic studies. Key strategies include:
Standardized Protein Extraction: Utilize bead mill-based extraction methods which provide higher protein yields with minimal processing time compared to sonication, grinding, or homogenization techniques [36].
Controlled Staining and Destaining: Implement consistent staining protocols with precise timing and solution composition to minimize gel-to-gel variation [35] [40].
Temperature Regulation: Maintain constant temperature during electrophoresis to ensure reproducible protein migration rates [36].
Reference Standards: Include internal protein standards in each gel to normalize protein patterns and facilitate cross-gel comparisons [38] [35].
Through careful attention to these technical details and systematic optimization of electrophoretic conditions, SDS-PAGE serves as a robust and reliable second dimension in comprehensive 2D-PAGE analyses, enabling researchers to obtain high-quality proteomic data with exceptional resolution and reproducibility.
Within the framework of two-dimensional electrophoresis (2D-PAGE) research, which combines isoelectric focusing (IEF) and SDS-PAGE, the selection of a detection method is a critical determinant of experimental success [42] [32]. This technique separates complex protein mixtures first by their isoelectric point and then by molecular weight, creating a map of thousands of proteins [32]. Visualizing this map requires highly sensitive and reliable methods to detect proteins across a wide dynamic range of abundances. For decades, colorimetric stains like Coomassie Blue and Silver have been the cornerstone of protein detection in gels [43] [44]. More recently, fluorescent tags and stains have emerged as powerful alternatives, offering enhanced sensitivity and compatibility with downstream analyses [45] [46]. This article provides detailed application notes and protocols for these key visualization techniques, contextualized within the specific demands of 2D-PAGE-based proteomic profiling.
Established Staining Techniques: Principles and Protocols
Coomassie Brilliant Blue Staining
Coomassie Brilliant Blue (CBB) is a triphenylmethane dye that binds non-covalently to proteins primarily through hydrophobic interactions and ionic interactions with basic amino acids (arginine, lysine, and histidine) [44]. Upon binding, the dye shifts from a reddish-brown to a bright blue anionic form, creating distinct bands against a clear background [44]. It is a robust, cost-effective method often used for routine protein visualization and quantification, with a typical detection sensitivity of 0.1 - 0.5 µg of protein per band [44]. A significant advantage in a proteomic context is its excellent compatibility with mass spectrometry (MS), as it does not cause extensive protein cross-linking [44].
Table 1: Key Characteristics of Protein Detection Methods in 2D-PAGE
| Feature | Coomassie Brilliant Blue | Silver Staining | Fluorescent Staining |
|---|---|---|---|
| Mechanism | Non-covalent binding to basic residues [44] | Reduction of protein-bound silver ions to metallic silver [43] | Non-covalent binding of fluorophores or intrinsic fluorescence [45] [46] |
| Sensitivity | ~0.1 - 0.5 µg/band [44] | ~0.1 - 1 ng/band [43] [47] | ~7 ng/band (varies by dye) [45] |
| MS Compatibility | High [44] | Low (traditional); High (modified protocols) [48] [43] | High (for many dyes) |
| Dynamic Range | ~10-20 fold [44] | Narrow [43] | Wide [45] |
| Primary Application in 2D-PAGE | General profiling, purity checks, MS-preparative gels [44] | Detection of low-abundance proteins [43] | High-sensitivity quantification, fluorescent fusion protein detection [45] [46] |
Detailed Protocol for Coomassie Blue Staining
The following protocol is designed for a standard 1-1.5 mm thick polyacrylamide gel.
Materials:
- Coomassie Blue Stain: 0.1% (w/v) Coomassie Brilliant Blue R-250 or G-250, 40% methanol, 10% acetic acid [44].
- Destaining Solution: 20-40% methanol, 10% acetic acid in water [44].
- Fixing Solution (Optional): 50% ethanol, 10% acetic acid [44].
- Washing Solution: 50% methanol, 10% acetic acid [44].
- Equipment: Staining tray, orbital shaker, microwave oven (optional).
Procedure:
- Fixing & Washing: After electrophoresis, transfer the gel to a clean tray. Immerse it in a fixing solution or directly in the washing solution. Agitate gently on an orbital shaker for at least 30 minutes or overnight to fix proteins and remove SDS and buffers. This step reduces background staining [44].
- Staining: Decant the washing solution. Submerge the gel in Coomassie Blue stain. For rapid staining, heat the tray in a microwave oven for 20-30 seconds and then agitate for 5-15 minutes. Without heating, agitate for 1-2 hours or longer [44].
- Destaining: Pour off the stain solution. Rinse the gel with distilled water and add destaining solution. Agitate gently, changing the destaining solution every 10-15 minutes until the background is clear and protein bands are sharply visible. A paper towel placed in the tray can absorb eluted dye and speed up the process [44].
- Storage: For permanent storage, preserve the gel in 5% acetic acid or dry it between cellophane sheets [44].
Troubleshooting:
- Weak Bands: Increase protein load or optimize staining time.
- High Background: Ensure complete washing before staining; increase the number of destaining steps.
- Uneven Staining: Ensure the gel is fully immersed and agitation is consistent [44].
Silver Staining
Silver staining offers a significant increase in sensitivity, capable of detecting protein levels as low as 0.1 ng/band, making it 20-200 times more sensitive than Coomassie Blue [43] [47]. The process involves the binding of silver ions to protein functional groups (e.g., carboxylic acids, sulfhydryls, amines), which are then reduced to metallic silver by formaldehyde in an alkaline developer, depositing dark brown or black deposits at the site of the protein [43]. A critical consideration for proteomics is that traditional silver staining protocols using glutaraldehyde or formaldehyde are incompatible with mass spectrometry due to protein cross-linking [48] [43]. However, modified, MS-compatible protocols omit these aldehydes, substituting them with reagents like sodium thiosulfate [48] [43].
Detailed Protocol for Mass Spectrometry-Compatible Silver Staining
This protocol is adapted from the Rockefeller University Proteomics Resource Center and is designed for MS-compatibility [48].
Materials:
- Fixation Solution: 50% methanol, 5% acetic acid.
- Sensitizing Solution: 0.02% (w/v) sodium thiosulfate (e.g., 30 mg in 150 mL water).
- Silver Nitrate Solution: 0.1% (w/v) silver nitrate, 0.04% formaldehyde (37%) (e.g., 150 mg AgNO₃ + 120 µL formaldehyde in 150 mL water).
- Developing Solution: 2% (w/v) sodium carbonate, 0.04% formaldehyde (37%) (e.g., 6 g Na₂CO₃ + 120 µL formaldehyde in 300 mL water). Make fresh.
- Stop Solution: 5% acetic acid.
- Preserving Solution: 8.8% (v/v) glycerol in water.
- Equipment: Clean glass or plastic trays, clean gloves, orbital shaker.
Procedure:
- Fixation: Following electrophoresis, fix the gel in 50% methanol / 5% acetic acid for 20 minutes with agitation. This immobilizes proteins and removes interfering substances [48].
- Washing: Wash the gel in 50% methanol for 10 minutes, followed by a 10-minute wash in high-purity water [48].
- Sensitizing: Incubate the gel with 0.02% sodium thiosulfate for exactly 1 minute. This step enhances sensitivity and contrast [48] [43].
- Rinsing: Rinse the gel with water twice, for 1 minute each [48].
- Silver Reaction: Submerge the gel in the 0.1% silver nitrate / 0.04% formaldehyde solution for 20 minutes [48].
- Rinsing: Rinse with water twice, for 1 minute each, to remove unbound silver [48].
- Developing: Incubate the gel with the fresh developing solution. Monitor closely until the desired band intensity is achieved. If the developer turns yellow, replace it with fresh solution. This step typically takes a few minutes [48].
- Stopping: Stop the development by transferring the gel to the 5% acetic acid solution for 10 minutes [48].
- Washing: Wash the gel in water for 5 minutes [48].
- Preserving (Optional): Incubate the gel in the preserving solution for 20 minutes for long-term storage [48].
Critical Factors for Success:
- Cleanliness: Use impeccably clean glassware and high-purity water to prevent background staining [48] [43].
- Reagent Purity: High-quality reagents are essential for low background [43].
- Time and Temperature: Precisely control incubation times; higher temperatures can increase background staining [43].
Fluorescent Detection Methods
Fluorescent detection represents a modern approach with several advantages for 2D-PAGE analysis. These methods use reagents that non-covalently bind proteins and fluoresce under specific wavelengths [45]. They often provide a wide dynamic range for quantification, high sensitivity rivaling silver staining, and excellent compatibility with mass spectrometry [45]. Furthermore, specific protocols enable the detection of fluorescent fusion proteins, such as Green Fluorescent Protein (GFP), even after full denaturation on SDS-PAGE.
In-gel Fluorescence Detection of Denatured GFPs
A common challenge is that SDS denatures GFPs, abolishing their fluorescence. A recent innovative protocol allows for the in-gel refolding of fully denatured GFPs after electrophoresis.
Principle: After SDS-PAGE, SDS is removed from the gel and proteins by washing with a solution containing cyclodextrin and methanol. This facilitates the refolding of the GFP chromophore, restoring its fluorescence without the need for antibodies [46].
Protocol Workflow:
- Electrophoresis: Run the SDS-PAGE as usual with heat-denatured samples.
- Washing/Refolding: Incubate the gel in a refolding buffer containing cyclodextrin and 20% methanol to remove SDS and aid protein refolding.
- Detection: Visualize the gel using a standard gel documentation system with a blue light transilluminator or laser scanner equipped with appropriate filters for GFP fluorescence [46].
This method is compatible with subsequent total protein staining or western blotting, allowing for multiplexed analysis from a single gel [46].
The following diagram illustrates the workflow and key decision points for selecting a protein detection method in a 2D-PAGE experiment.
The Scientist's Toolkit: Essential Reagents and Materials
Successful protein detection in 2D-PAGE relies on high-quality reagents and materials. The following table details essential items for the featured experiments.
Table 2: Essential Research Reagent Solutions for Protein Detection
| Reagent/Material | Function/Application | Key Considerations |
|---|---|---|
| Coomassie Brilliant Blue R-250 | Protein stain for SDS-PAGE and IEF gels [44]. | Binds via hydrophobic/ionic interactions; detection limit ~0.1-0.5 µg [44]. |
| Silver Nitrate (AgNO₃) | Source of silver ions for silver staining [48] [43]. | Reduces to metallic silver on proteins; requires high purity to minimize background [48] [43]. |
| Sodium Thiosulfate | Sensitizing agent in silver staining [48] [43]. | Enhances staining sensitivity and contrast; critical for MS-compatible protocols [48] [43]. |
| Formaldehyde (37%) | Reducing agent in silver stain developer [48] [43]. | Reduces Ag⁺ to Ag⁰; avoid in MS-sample preparation unless concentration is very low [48] [43]. |
| Sodium Carbonate | Component of alkaline developing solution for silver staining [48]. | Provides the alkaline pH required for the reduction of silver by formaldehyde [48]. |
| Methanol & Acetic Acid | Components of fixing, washing, and destaining solutions [48] [44]. | Precipitate and fix proteins in gel; remove SDS and other interferents [48] [44]. |
| Fluorescent Dye (e.g., Dye 1) | Non-covalent protein stain for SDS-PAGE [45]. | Offers rapid staining (e.g., 15 min), high sensitivity (~7 ng), and MS compatibility [45]. |
| Cyclodextrin | SDS-removing agent for in-gel refolding of GFP [46]. | Essential for stripping SDS from proteins post-electrophoresis to allow GFP chromophore refolding [46]. |
The choice of detection method in 2D-PAGE research is a strategic decision that balances sensitivity, quantitative capability, and downstream applicability. Coomassie Blue remains a reliable, cost-effective, and MS-compatible workhorse for abundant proteins. When maximum sensitivity is required for detecting low-abundance species, silver staining is unparalleled, provided that MS-compatible protocols are used if subsequent protein identification is planned. Fluorescent stains and specialized techniques for fluorescent proteins offer modern, versatile tools with high sensitivity and excellent compatibility with multiple downstream analyses. By understanding the principles, advantages, and limitations of each method, researchers can optimally configure their 2D-PAGE workflows to meet the specific demands of their proteomic studies.
Two-dimensional polyacrylamide gel electrophoresis (2D-PAGE) is a powerful analytical technique that separates complex protein mixtures based on two independent physicochemical properties: isoelectric point (pI) in the first dimension and molecular weight in the second dimension [49] [1]. Originally developed in the 1970s by O'Farrell, this method remains a cornerstone of proteomics research due to its ability to resolve thousands of proteins simultaneously from a single sample [1] [3]. The technique sequentially combines isoelectric focusing (IEF), which separates proteins according to their pI in a pH gradient, with SDS-PAGE, which separates denatured proteins based on molecular size [8] [3]. This orthogonal separation approach provides a high-resolution visual map of the proteome, enabling researchers to detect subtle changes in protein expression, post-translational modifications, and protein isoforms that are often critical for understanding disease mechanisms and ensuring biopharmaceutical quality [49] [1].
Table 1: Core Principles of 2D-PAGE Separation
| Dimension | Separation Principle | Key Reagents | Physical Basis |
|---|---|---|---|
| First Dimension | Isoelectric Focusing (IEF) | Carrier ampholytes or IPG strips, urea, nonionic detergents | Protein net charge at different pH values |
| Second Dimension | SDS-PAGE | SDS, polyacrylamide, Tris-glycine buffer | Molecular size through gel matrix porosity |
Application in Biomarker Discovery
Experimental Protocol for Comparative Proteomics in Oncology
Sample Preparation:
- Extract proteins from matched tissue samples (e.g., cancerous vs. normal) using a lysis buffer containing 9.5 M urea, 2% IGEPAL CA-630, 5% beta-mercaptoethanol, and 2% carrier ampholytes (1.6% pH 5-7, 0.4% pH 3-10) [50]. Maintain samples at 4°C throughout preparation.
- Determine protein concentration using Bradford or BCA assay [1]. For large-format gels (20×22 cm), load 100 μg for silver staining or 500 μg for Coomassie Blue staining [50].
- For complex tissues, add nuclease solution (50 μg/mL RNase, 100 μg/mL DNase) to reduce viscosity and protease inhibitors (1% 100X stock containing AEBSF, leupeptin, E-64, EDTA, benzamidine) to prevent degradation [50].
Isoelectric Focusing:
- Use immobilized pH gradient (IPG) strips (e.g., pH 3-10, 18 cm) for improved reproducibility [3].
- Actively rehydrate IPG strips with sample in urea buffer for 12 hours at 20°C.
- Perform IEF using a stepwise voltage protocol: 500 V for 1 hour, 1000 V for 1 hour, and 8000 V until reaching 50,000 Vhr total [3].
SDS-PAGE:
- Equilibrate focused IPG strips for 15-30 minutes in SDS-containing buffer with dithiothreitol (DTT) to saturate proteins with SDS [3].
- Place equilibrated strip horizontally on top of a vertical SDS-polyacrylamide gel (8-12% acrylamide) and seal with agarose.
- Run electrophoresis at constant current (20-40 mA per gel) until tracking dye reaches the bottom [3].
Visualization and Analysis:
- Stain gels with SYPRO Ruby or Coomassie Blue for protein detection [50].
- Scan gels and analyze images using software such as PDQuest or Progenesis for spot detection, quantification, and statistical analysis [49].
- Excise differentially expressed protein spots for identification by mass spectrometry [49] [51].
Representative Data from Cancer Biomarker Studies
Table 2: Exemplary Biomarkers Discovered Using 2D-PAGE
| Cancer Type | Biomarker Candidate | Expression Change | Functional Role | Validation Method |
|---|---|---|---|---|
| Breast Cancer | Protein panel identified by SELDI-TOF MS | Upregulated in patient serum | Distinguishes cancer from benign disease | Immunoassays [51] |
| Various Cancers | Phosphorylated signaling proteins | Hyperphosphorylation in cancer cells | Cell proliferation and survival pathways | RPPA, Western blot [51] |
| Alzheimer's Disease | Tau protein and amyloid-beta peptides | Altered expression and modification | Neuronal dysfunction and aggregation | Immunoblotting after 2D-PAGE [49] |
Application in Drug Target Validation
Experimental Protocol for Drug Mechanism of Action Studies
Cell Culture and Treatment:
- Culture relevant cell lines (e.g., cancer cells for oncology drug development) under standard conditions.
- Treat experimental groups with drug candidate at various concentrations (e.g., IC50, 2×IC50) and time points (e.g., 6, 12, 24 hours). Include vehicle-treated controls.
- Harvest cells at each time point using appropriate lysis buffer (SDS or urea-based) with protease and phosphatase inhibitors [50].
Protein Separation and Analysis:
- Perform 2D-PAGE as described in Section 2.1, running treated and control samples in parallel.
- For phosphorylation studies, use phosphoprotein-specific stains such as Pro-Q Diamond before total protein staining [49].
- Conduct differential analysis using specialized software to identify protein spots with significant intensity changes (typically >2-fold change, p<0.05).
Target Identification and Validation:
- Excise protein spots of interest and digest with trypsin for mass spectrometry analysis.
- Identify proteins using MALDI-TOF or LC-MS/MS and database searching.
- Validate potential drug targets through orthogonal methods such as Western blotting, immunoprecipitation, or functional assays.
Key Research Reagent Solutions for Drug Target Validation
Table 3: Essential Reagents for 2D-PAGE in Drug Development
| Reagent Category | Specific Products | Function in Protocol | Application Context |
|---|---|---|---|
| Protein Solubilization | SDS Boiling Buffer (5% SDS, 5% BME, 10% glycerol) or Urea Sample Buffer (9.5 M urea, 2% IGEPAL) | Complete protein dissolution, denaturation | General proteomics; membrane protein studies [50] |
| Protease Inhibition | 100X PI Stock (AEBSF, leupeptin, E-64, EDTA, benzamidine) | Prevents protein degradation during processing | All sample types, especially tissues [50] |
| Phosphatase Inhibition | Phosphatase Inhibitor Cocktails (EMD Biosciences #524624, #524625) | Preserves phosphorylation states | Drug mechanism studies, signaling analysis [50] |
| First Dimension | IPG Strips (pH 3-10, various lengths) | Creates stable pH gradient for IEF | All applications; improves reproducibility [3] |
| Detection | SYPRO Ruby, Pro-Q Diamond Phosphoprotein Stain | Fluorescent detection of total or phosphorylated proteins | Quantitative analysis; PTM studies [49] [50] |
Application in Quality Control for Biopharmaceuticals
Experimental Protocol for Purity and Charge Variant Analysis
Sample Preparation for Therapeutic Proteins:
- Dilute biopharmaceutical product (e.g., monoclonal antibody, recombinant protein) to 1-2 mg/mL in appropriate buffer.
- For reduced samples, add dithiothreitol (DTT) to 5 mM and incubate at 60°C for 30 minutes.
- For charge variant analysis, use urea sample buffer without SDS to preserve native charge properties [50].
High-Resolution 2D-PAGE:
- Use narrow-range IPG strips (e.g., pH 5-8 for antibodies) for enhanced resolution of charge variants [3].
- Perform IEF with extended focusing time to achieve optimal separation (up to 100,000 Vhr for complex samples).
- Transfer IPG strip to SDS-PAGE gel with appropriate acrylamide concentration (e.g., 8% for antibodies, 12% for smaller proteins).
Detection and Quantification:
- Stain with mass spectrometry-compatible silver stain or Coomassie Blue.
- Use advanced imaging systems with high dynamic range for accurate quantification.
- Analyze spot patterns against reference standards for batch-to-batch consistency.
Regulatory Considerations and Data Reporting
Quality Assessment Parameters:
- Identity confirmation through position on 2D reference map
- Purity assessment by percentage of total protein in main spot
- Charge heterogeneity evaluation by spot distribution pattern
- Detection of product-related impurities (deamidated, oxidized, truncated variants)
Table 4: 2D-PAGE Quality Control Parameters for Biopharmaceuticals
| Quality Attribute | 2D-PAGE Measurement | Acceptance Criteria | Regulatory Reference |
|---|---|---|---|
| Identity | Consistent position (pI/MW) with reference standard | Position within predetermined range | ICH Q6B [52] |
| Purity | Percentage of main protein spot intensity | >95% for main product form | ICH Q6B [52] |
| Charge Variants | Pattern and intensity of acidic/basic variants | Consistent with reference standard | ICH Q6B [52] |
| Degradation Products | Appearance of new spots or streaks | Below specified thresholds | ICH Q1A(R2) [52] |
| Batch Consistency | Similarity of 2D pattern between batches | High correlation coefficient (>0.9) | ICH Q5C [52] |
Integrated Workflows and Complementary Technologies
2D-PAGE Coupled with Mass Spectrometry
The integration of 2D-PAGE with mass spectrometry (2D-GE-MS) creates a powerful platform for comprehensive protein characterization [49]. Following 2D separation, protein spots of interest are excised, digested with trypsin, and identified using MALDI-TOF or LC-MS/MS [49] [51]. This approach combines the superior separation capabilities of 2D-PAGE with the precise identification power of MS, enabling researchers to not only detect differentially expressed proteins but also confidently identify them for further validation.
Advanced Applications with DIGE and Bioinformatics
Difference Gel Electrophoresis (DIGE) represents a significant advancement in 2D-PAGE technology, allowing multiplexed analysis of multiple samples on the same gel using fluorescent cyanine dyes (Cy2, Cy3, Cy5) [50]. This methodology minimizes gel-to-gel variation and improves quantitative accuracy, particularly valuable for biomarker discovery and drug development applications [3]. Furthermore, sophisticated bioinformatics tools have been developed for automated image analysis, spot detection, and statistical analysis, enabling robust processing of large datasets generated in proteomic studies [49] [51].
Troubleshooting 2D-PAGE: Solving Common Problems for Reproducible High-Resolution Gels
Two-dimensional polyacrylamide gel electrophoresis (2D-PAGE), which combines isoelectric focusing (IEF) and SDS-PAGE, remains a cornerstone technique for high-resolution protein separation in proteomics research [53] [54]. Despite its powerful separation capabilities, researchers frequently encounter technical challenges that compromise data quality, with poor resolution and streaking representing the most prevalent artifacts affecting 2D gel analysis. These issues predominantly originate from suboptimal conditions during IEF and inadequate sample preparation, leading to incomplete protein separation and horizontal or vertical streaking across the final 2D gel image [4] [55].
The persistence of these artifacts significantly impacts downstream analysis by obscuring critical protein information, reducing the number of quantifiable protein spots, and complicating protein identification through mass spectrometry. Within the broader context of 2D-PAGE research, optimizing these initial steps is paramount for achieving reliable, reproducible results in applications ranging from biomarker discovery to drug development [56] [57]. This application note provides detailed methodologies for troubleshooting and optimizing IEF and sample cleanup protocols to overcome these persistent challenges.
Systematic Troubleshooting Framework
A methodical approach is essential for diagnosing and resolving the root causes of poor resolution and streaking. The following workflow provides a logical pathway for identifying and addressing the most common issues.
Optimizing Sample Preparation and Cleanup
Effective sample preparation is the critical first step in preventing resolution artifacts. Sample-related problems often manifest as horizontal streaking and poor focusing due to protein aggregation, precipitation, or the presence of interfering substances.
Protein Extraction and Solubilization Protocols
The following protocol, optimized for challenging plant tissues but applicable to various sample types, addresses common extraction issues:
Materials:
- Lysis Buffer: 7 M Urea, 2 M Thiourea, 4% CHAPS, 30 mM Tris-HCl [55]
- Protease Inhibitor Cocktail (e.g., PMSF) [55]
- Reducing Agent: 50 mM DTT or 2% β-mercaptoethanol [55]
- Precipitation Solution: TCA/Acetone (10% TCA in acetone) [55]
Procedure:
- Homogenization: Rapidly homogenize tissue or cells in cold lysis buffer (1:5 w/v ratio) using a pre-chilled mortar and pestle or mechanical homogenizer. Maintain samples at 4°C throughout the process to minimize protease activity [55].
- Clarification: Centrifuge the homogenate at 15,000 × g for 20 minutes at 4°C. Transfer the supernatant to a fresh tube, avoiding the pellet and any floating lipid layer [4].
- Precipitation: For samples with high interfering substance content, add 4 volumes of TCA/acetone precipitation solution to 1 volume of clarified supernatant. Incubate at -20°C for 1 hour, then centrifuge at 15,000 × g for 15 minutes [55].
- Washing: Wash the resultant protein pellet twice with cold acetone containing 0.07% β-mercaptoethanol to remove residual TCA and other contaminants [55].
- Resolubilization: Air-dry the pellet briefly and resuspend in appropriate IEF-compatible lysis buffer. Use gentle vortexing and occasional sonication in a cold water bath to aid complete solubilization [4].
Sample Cleanup and Quality Assessment
Effective removal of interfering substances is crucial for preventing streaking:
Interfering Substances and Removal Methods
| Interfering Substance | Primary Effects on IEF | Recommended Removal Method |
|---|---|---|
| Phenolic Compounds | Protein complexation, streaking | Acetone precipitation, phenolic extraction [55] |
| Nucleic Acids | Increased viscosity, smearing | Nuclease treatment, ultracentrifugation [4] |
| Lipids | Protein trapping, streaking | Acetone wash, organic solvent extraction [55] |
| Salts (High Conc.) | Current distortion, slow focusing | Desalting columns, dialysis, precipitation [58] |
| Detergents (Non-IEF) | Charge interference, streaking | Acetone precipitation, detergent exchange [56] |
Quality Control Assessment: Before IEF, assess sample quality by:
- Measuring protein concentration using Bradford or compatible assays
- Checking conductivity (should be <1 mS/cm for IEF) [58]
- Running a small 1D-SDS-PAGE gel to verify protein integrity and absence of excessive degradation
IEF Parameter Optimization
The IEF separation quality directly determines the first-dimension resolution in 2D-PAGE. The following parameters require systematic optimization to prevent vertical streaking and poor focusing.
Critical IEF Parameters and Optimization Strategies
Table: IEF Parameter Optimization for Improved Resolution
| Parameter | Effect on Resolution | Optimal Settings | Troubleshooting Tips |
|---|---|---|---|
| pH Gradient Range | Determines protein separation window | Narrow-range IPG strips for higher resolution | Use overlapping narrow-range strips for complex samples [58] |
| Voltage Program | Affects focusing time & completeness | Step-wise increase to final high voltage (8000 V) | Extend focusing time at low voltage for salty samples [58] |
| Sample Loading | Impacts protein entry & distribution | Rehydration loading for most samples | Cup loading for problematic samples; avoid overloading [58] |
| Temperature Control | Affects pH gradient stability | 20°C constant temperature | Consistent temperature prevents gradient distortion [56] |
| Focusing Time | Determines migration to pI | 20-40 kVh total, depending on strip length | Use current monitoring to determine completion [58] |
Recommended IEF Protocol for High-Resolution Separation
Materials:
- Immobilized pH Gradient (IPG) strips appropriate for sample pH range [58]
- Rehydration buffer: 8 M Urea, 2% CHAPS, 15 mM DTT, 0.5% carrier ampholytes [4]
- IEF apparatus with programmable power supply and temperature control [58]
Procedure:
- Strip Rehydration: Apply samples diluted in rehydration buffer to IPG strips. Actively rehydrate for 6-12 hours at 20°C with low voltage (30-50 V) to enhance protein entry into the gel [58].
- Voltage Programming: Use a step-wise voltage program:
- Step 1: 250 V for 30 minutes (slow sample entry)
- Step 2: 500 V for 1 hour (removal of salts)
- Step 3: 1000 V for 1 hour (transition phase)
- Step 4: 8000 V gradient over 30 minutes (rapid focusing)
- Step 5: 8000 V constant until 20-40 kVh reached (final focusing) [58]
- Temperature Control: Maintain consistent temperature at 20°C throughout the run to ensure pH gradient stability [56].
- Completion Check: Monitor current; successful focusing is indicated by a significant drop in current (to <100 μA per strip) at the final voltage step [58].
Post-IEF Processing: After focusing, immediately equilibrate strips in SDS-containing buffer for the second dimension or store at -80°C to prevent protein degradation and diffusion.
Detection Methods for Optimized 2D Gels
Appropriate staining is essential for visualizing the improved resolution achieved through optimized protocols. The choice of detection method involves trade-offs between sensitivity, dynamic range, and compatibility with downstream mass spectrometry.
Table: Comparison of Protein Detection Methods for 2D Gels
| Staining Method | Detection Limit | Linear Dynamic Range | Compatibility with MS | Key Advantages |
|---|---|---|---|---|
| Coomassie Brilliant Blue | 8-25 ng [59] | ~1 order of magnitude [35] | Excellent [59] | Cost-effective, simple procedure, MS compatible |
| Colloidal Coomassie | 1-10 ng [35] | ~1.5 orders of magnitude [35] | Excellent [35] | Higher sensitivity, low background |
| Silver Staining | 0.25-0.5 ng [59] | <1 order of magnitude [35] | Limited (with modification) [59] | Highest sensitivity |
| SYPRO Ruby | 0.25-0.5 ng [59] | 3-4 orders of magnitude [35] | Excellent [59] | Wide dynamic range, MS compatible |
| Zinc/Reverse Staining | 10-50 ng [59] | ~1 order of magnitude [59] | Good [59] | Rapid visualization, MS compatible |
The Scientist's Toolkit: Essential Research Reagents
Table: Key Reagent Solutions for 2D-PAGE Optimization
| Reagent Category | Specific Examples | Function in 2D-PAGE | Optimization Tips |
|---|---|---|---|
| Chaotropes | Urea, Thiourea [55] | Protein denaturation & solubilization | Use fresh urea solutions (<2 weeks old); avoid heating above 37°C |
| Surfactants | CHAPS, ASB-14 [55] | Membrane protein solubilization | Test different surfactants for challenging samples |
| Reducing Agents | DTT, DTE, TCEP [55] | Disulfide bond reduction | Use fresh DTT; TCEP offers better stability |
| Carrier Ampholytes | pH 3-10, narrow ranges [58] | pH gradient formation | Match ampholyte range to IPG strip pH |
| Protease Inhibitors | PMSF, Complete Mini [55] | Prevent protein degradation | Use cocktail inhibitors for broad-spectrum protection |
| IPG Strips | Immobilized pH gradients [58] | First dimension separation | Store properly with desiccant; avoid repeated freeze-thaw |
Implementing these optimized protocols for sample preparation and IEF parameters systematically addresses the primary causes of poor resolution and streaking in 2D-PAGE. The synergistic combination of proper sample cleanup, optimized IEF conditions, and appropriate detection methods enables researchers to achieve significantly improved protein separation, leading to more reliable and reproducible proteomic analysis. These refinements are particularly valuable in drug development contexts where detecting subtle protein expression changes is critical for biomarker identification and mechanistic studies.
Managing High Salt Concentrations and Protein Solubility Issues
In two-dimensional polyacrylamide gel electrophoresis (2D-PAGE), which combines isoelectric focusing (IEF) and SDS-PAGE, high salt concentrations present a significant challenge to achieving high-resolution protein separation [56]. The presence of excess salts disrupts the fundamental processes of 2D-PAGE by interfering with the IEF step, where salts can carry current and create localized heating, leading to protein precipitation and streaking [60]. This issue is particularly relevant when analyzing samples derived from physiological buffers or salt-rich extraction protocols, necessitating specialized sample preparation techniques to ensure optimal protein solubility and separation. This application note provides detailed protocols for managing high salt concentrations within the context of 2D-PAGE-based proteomic research, enabling researchers to overcome these common obstacles.
Impact of Salt on 2D-PAGE Separation Dynamics
Mechanisms of Interference
High salt concentrations adversely affect both dimensions of 2D-PAGE separation. During IEF, salts compete with proteins for current carrying capacity, which can prevent the formation of a stable pH gradient and cause localized overheating that denatures proteins and creates horizontal streaking across the gel [60]. In the subsequent SDS-PAGE dimension, residual salts can cause band distortion and wavy migration fronts, compromising molecular weight determination and comparative analysis between samples [61]. These effects are particularly problematic when working with samples extracted from salt-rich environments or those requiring buffered conditions for stability.
Quantitative Effects on Protein Solubility
Recent studies on protein behavior in salt-rich environments provide insight into the challenges faced in 2D-PAGE. Research on pea protein-stabilized emulsions demonstrated that high NaCl concentrations (0.5-1 M) induced extensive protein aggregation worsened by heating, primarily due to charge screening effects that disrupt electrostatic stabilization [62]. This aggregation phenomenon directly correlates with the precipitation issues observed in 2D-PAGE when high-salt samples are loaded directly onto IEF strips. The table below summarizes the effects of increasing salt concentrations on key 2D-PAGE parameters:
Table 1: Impact of Salt Concentration on 2D-PAGE Performance Parameters
| Salt Concentration | IEF Performance | Protein Solubility | Gel Image Quality |
|---|---|---|---|
| Low (<50 mM) | Stable pH gradient | Optimal | Minimal streaking, sharp spots |
| Moderate (50-100 mM) | Slightly distorted gradient | Slightly reduced | Mild streaking, decreased resolution |
| High (>100 mM) | Unstable gradient, localized heating | Significant precipitation, aggregation | Severe streaking, spot smearing |
Salt Removal and Protein Precipitation Protocols
Acetone Precipitation Method
Acetone precipitation effectively removes salts, detergents, and other interfering substances while concentrating protein samples. This method is particularly suitable for plant and tissue extracts that often contain high levels of interfering compounds [60].
Protocol:
- Add four volumes of pre-chilled (-20°C) acetone to one volume of protein sample
- Vortex mix thoroughly and incubate at -20°C for a minimum of 2 hours (overnight incubation yields highest recovery)
- Centrifuge at 15,000 × g for 15 minutes at 4°C to pellet precipitated proteins
- Carefully decant supernatant without disturbing the pellet
- Air-dry the pellet for 5-10 minutes to remove residual acetone (do not over-dry as this will reduce resolubilization efficiency)
- Resuspend the pellet in appropriate IEF-compatible rehydration buffer containing 8 M urea, 2 M thiourea, 4% CHAPS, and 50 mM DTT
- Vortex vigorously for 1 minute, then incubate at room temperature for 30 minutes with occasional mixing
- Centrifuge at 15,000 × g for 10 minutes to remove any insoluble material before IEF loading
Application Notes: For difficult-to-solubilize proteins, extend the resuspension incubation time to 1-2 hours and consider using alternative chaotropes such as 2-4 M urea in combination with thiourea. Sonication in a water bath for 30-60 seconds can also enhance resolubilization.
TCA/Acetone Precipitation
TCA/acetone precipitation provides more stringent protein precipitation, effectively removing salts and concentrating dilute samples, making it ideal for samples with very high salt content or complex contaminants.
Protocol:
- Add one volume of pre-chilled 20% TCA in acetone to four volumes of protein sample
- Mix thoroughly by vortexing and incubate at -20°C for 4 hours or overnight
- Centrifuge at 15,000 × g for 15 minutes at 4°C
- Carefully decant supernatant and wash pellet twice with ice-cold acetone containing 0.07% β-mercaptoethanol
- Air-dry pellet for 10-15 minutes until no acetone odor remains
- Resuspend in IEF-compatible rehydration buffer as described in the acetone precipitation protocol
- Centrifuge at 15,000 × g for 10 minutes to remove insoluble material before IEF
Application Notes: This method is particularly effective for plant tissues and microbial samples but may be less suitable for membrane proteins, which can be difficult to resolubilize after TCA precipitation.
Dialysis and Desalting Columns
For salt-sensitive proteins or when maintaining protein native state is important, dialysis or desalting columns provide gentler salt removal.
Protocol:
- Dialysis Method:
- Place protein sample in dialysis membrane with appropriate molecular weight cutoff (typically 3.5-14 kDa)
- Dialyze against 500 volumes of IEF-compatible buffer (containing urea, thiourea, and CHAPS but lacking salts) for 4 hours at room temperature with constant stirring
- Change dialysis buffer and continue dialysis for an additional 4 hours or overnight at 4°C
- Desalting Columns:
- Equilibrate desalting column (e.g., Sephadex G-25) with IEF-compatible rehydration buffer
- Apply protein sample according to manufacturer's recommended volume (typically 5-30% of column bed volume)
- Elute with IEF-compatible buffer and collect protein-containing fractions
Table 2: Comparison of Salt Removal Methods for 2D-PAGE Sample Preparation
| Method | Salt Removal Efficiency | Protein Recovery | Hands-on Time | Best For |
|---|---|---|---|---|
| Acetone Precipitation | High | 70-90% | Moderate | High-salt samples, concentration |
| TCA/Acetone Precipitation | Very High | 60-80% | Moderate | Complex samples, plant tissues |
| Dialysis | Moderate to High | >90% | Low (but lengthy) | Salt-sensitive proteins |
| Desalting Columns | High | 80-95% | Low | Rapid processing, multiple samples |
Optimized Protein Extraction for Challenging Samples
Enhanced Solubilization Buffer Formulations
Optimized extraction and solubilization buffers are critical for maintaining protein solubility after salt removal. The following formulations have demonstrated efficacy in 2D-PAGE applications, particularly for challenging samples such as membrane proteins and tissue extracts [4] [60].
Standard Solubilization Buffer:
- 8 M Urea
- 2 M Thiourea
- 4% (w/v) CHAPS or ASB-14
- 40 mM Tris base
- 50 mM DTT or 5 mM TCEP
- 2% (v/v) Pharmalyte (pH 3-10)
- Protease inhibitors (e.g., 1 mM PMSF, 2 μg/ml Aprotinin)
Enhanced Solubilization Buffer (for membrane proteins):
- 7 M Urea
- 2 M Thiourea
- 2-4% (w/v) CHAPS
- 2% (w/v) SB 3-10
- 40 mM Tris
- 50 mM DTT
- 1% (v/v) Triton X-100
- Protease and phosphatase inhibitors
Application Notes: The combination of urea and thiourea has been shown to improve solubility of membrane proteins significantly compared to urea alone. For optimal results, never heat samples containing urea above 37°C to prevent protein carbamylation. DTT should be added fresh just before use.
Sample Preparation Workflow for High-Salt Starting Materials
The following workflow diagram illustrates the decision process for selecting the appropriate sample preparation method based on initial sample characteristics:
The Scientist's Toolkit: Essential Reagents for 2D-PAGE
Table 3: Research Reagent Solutions for Managing Salt and Solubility Issues
| Reagent Category | Specific Examples | Function in 2D-PAGE | Optimized Concentration |
|---|---|---|---|
| Chaotropes | Urea, Thiourea | Disrupt hydrogen bonds, improve protein solubility | 7-9 M Urea, 2 M Thiourea |
| Detergents | CHAPS, ASB-14, Triton X-100 | Solubilize membrane proteins, prevent aggregation | 2-4% (w/v) |
| Reducing Agents | DTT, DTE, TCEP | Break disulfide bonds, maintain reduced state | 50-100 mM |
| Carrier Ampholytes | Pharmalyte, Bio-Lyte | Enhance solubility during IEF, prevent precipitation | 0.5-2% (v/v) |
| Protease Inhibitors | PMSF, Aprotinin, EDTA | Prevent protein degradation during processing | Manufacturer recommended |
| Precipitation Agents | Acetone, TCA, Methanol | Remove salts, concentrate proteins | Varies by protocol |
Effective management of high salt concentrations and protein solubility issues is essential for successful 2D-PAGE analysis. The protocols and methodologies presented in this application note provide researchers with practical tools to overcome these common challenges, enabling high-resolution separation and accurate analysis of complex protein samples. By implementing these optimized sample preparation techniques, scientists can significantly improve the quality and reproducibility of their 2D-PAGE results, advancing proteomic research and drug development efforts.
Eliminating Horizontal and Vertical Streaking for Clearer Spot Detection
Two-dimensional polyacrylamide gel electrophoresis (2D-PAGE) remains a powerful technique for the separation of complex protein mixtures, combining isoelectric focusing (IEF) and SDS-PAGE to resolve proteins by both charge and molecular weight [63]. However, the technique is susceptible to artifacts, with horizontal and vertical streaking representing the most common impediments to clear spot detection and accurate quantification [64]. These streaks can obscure critical data, compromise reproducibility, and hinder downstream analysis such as mass spectrometry. This application note, framed within broader 2D-PAGE research, details the underlying causes of these streaking artifacts and provides optimized, actionable protocols for their elimination, enabling researchers and drug development professionals to achieve superior gel quality.
Understanding and Troubleshooting Streaking Artifacts
Streaking in 2D gels can be systematically diagnosed and addressed by understanding its origin in the two-dimensional separation process. Horizontal streaking is typically associated with problems during the first dimension (IEF), while vertical streaking is most often related to the second dimension (SDS-PAGE) or the transition between the two [64].
Horizontal Streaking: Causes and Remedies
Horizontal streaking occurs when proteins fail to focus sharply at their isoelectric points (pI). The table below summarizes the primary causes and corresponding solutions.
Table 1: Troubleshooting Horizontal Streaking
| Cause | Description | Solution |
|---|---|---|
| Incomplete Focusing | Proteins have not reached their pI, often due to insufficient focusing time or high ionic strength. | Optimize IEF parameters; ensure total volt-hours are adequate; remove salts via dialysis or cleanup kits [64] [65]. |
| Sample Overloading | Excess total protein or dominant abundant proteins cause aggregation and "pI fallout." | Reduce protein load; for complex samples, consider abundant protein depletion [64]. |
| Inadequate Reduction | Disulfide bonds reform during IEF, creating heterogeneous protein forms. | Implement pre-IEF reduction and alkylation [63]; use fresh DTT (20-40 mM) or alternative agents like TBP [66]. |
| Poor Solubilization | Insufficient disruption of protein-protein interactions leads to aggregation. | Optimize rehydration buffer (RB) with chaotropes (7 M Urea, 2 M Thiourea) and detergents (1-2% CHAPS, ASB-14) [66] [64]. |
| Contaminants | Presence of salts, nucleic acids, or lipids increases conductivity and interferes with focusing. | Treat samples with nucleases; use ultracentrifugation or commercial cleanup kits to remove contaminants [64] [65]. |
A critical advancement in preventing horizontal streaking is performing protein reduction and alkylation before IEF, rather than during the traditional post-IEF equilibration step. This approach prevents the re-oxidation of thiol groups during IEF itself, which can cause horizontal tailing and smearing that subsequent reduction cannot remedy [63]. One optimized protocol uses 60 mM acrylamide in the rehydration buffer for alkylation after initial protein solubilization with DTT [66].
Vertical Streaking: Causes and Remedies
Vertical streaking manifests as smears extending downward from well-resolved spots and is primarily related to protein solubility and transfer issues between dimensions.
Table 2: Troubleshooting Vertical Streaking
| Cause | Description | Solution |
|---|---|---|
| Ineffective Equilibration | Incomplete coating of proteins with SDS prevents their solubilization for SDS-PAGE. | Ensure equilibration buffer contains ≥2% SDS, 20% glycerol, and a buffering agent (pH ~8.8); shake/rock for 15-45 min [64]. |
| Protein Overloading | Abundant proteins do not fully solubilize in SDS, leading to precipitation and streaking. | Decrease protein load; use more sensitive detection methods (e.g., fluorescent stains) [64]. |
| Overfocusing | Prolonged IEF can promote isoelectric precipitation of proteins within the IPG strip. | Ensure IEF is not conducted longer than necessary; avoid exceeding ~100,000 Vhr [64]. |
| Protein Oxidation | Oxidative cross-linking during SDS-PAGE can cause high-MW smears. | Ensure thorough alkylation with iodoacetamide (IAA) after reduction to block free cysteine residues [63] [64]. |
A significant drawback of the traditional two-step post-IEF equilibration (reduction followed by alkylation) is the potential for protein loss, with reports of 5-25% of focused proteins leaching out of the IPG strip [63]. This not causes vertical streaking due to incomplete transfer but also introduces gel-to-gel variability.
Experimental Protocols for Streak-Free 2D-PAGE
Optimized Protocol for Pre-IEF Reduction and Alkylation
This protocol is designed to be incorporated into the initial sample preparation stage to prevent disulfide bond artifacts [63] [66].
- Protein Solubilization: Solubilize the protein pellet in a rehydration buffer (RB) containing 7 M Urea, 2 M Thiourea, 1.2% (w/v) CHAPS, 0.4% (w/v) ASB-14, 40 mM DTT, and 0.5% (v/v) carrier ampholytes. Gently vortex and incubate at room temperature for 1-2 hours.
- Alkylation (Pre-IEF): Add acrylamide to the solubilized sample to a final concentration of 60 mM. Incubate in the dark at room temperature for 1 hour. Note: Acrylamide is used as the alkylating agent here due to the incompatibility of IAA with thiourea in the RB [66].
- Isoelectric Focusing: Load the prepared sample onto IPG strips (via in-gel rehydration or cup loading) and perform IEF according to the manufacturer's guidelines for the specific pH range and strip length.
- Brief Equilibration: Following IEF, equilibrate the IPG strip for 10 minutes in a standard Tris-SDS buffer (pH 8.8) containing 2% SDS, 20% glycerol, and 6 M Urea. This step is primarily to coat proteins with SDS for the second dimension, as reduction and alkylation are already complete.
- Second Dimension SDS-PAGE: Place the equilibrated IPG strip directly onto the SDS-PAGE gel and commence electrophoresis.
Taguchi-Optimized Rehydration Buffer Protocol
Systematic optimization of the rehydration buffer (RB) is crucial for maximizing protein solubility. The Taguchi method provides a robust framework for this multi-parameter optimization [66]. The following protocol is derived from such an optimization.
- Base Buffer: Prepare a base solution of 7 M Urea and 2 M Thiourea. Gently warm the solution to avoid denaturation-induced carbamylation.
- Add Detergents and Ampholytes: To the base buffer, add the optimized concentrations of detergents and ampholytes:
- CHAPS: 1.2% (w/v)
- ASB-14: 0.4% (w/v)
- Carrier Ampholytes: 0.25% (v/v)
- Add Reducing Agent: Add DTT to a final concentration of 40 mM from a fresh 1 M stock solution.
- Sample Rehydration: Use this optimized RB to solubilize protein samples for IEF. The resulting solution significantly improves protein solubility, leading to a higher number of detected spots and reduced streaking, especially for membrane proteins [66].
Table 3: Optimized Rehydration Buffer Composition
| Component | Final Concentration | Function |
|---|---|---|
| Urea | 7 M | Chaotrope, denatures proteins and disrupts hydrogen bonds. |
| Thiourea | 2 M | Enhances solubilization of hydrophobic proteins, used with urea. |
| CHAPS | 1.2% | Zwitterionic detergent, prevents protein aggregation. |
| ASB-14 | 0.4% | Sulfobetaine detergent, improves solubilization of membrane proteins. |
| DTT | 40 mM | Reducing agent, breaks disulfide bonds. |
| Carrier Ampholytes | 0.25% | Establishes pH gradient and enhances protein solubility near pI. |
The Scientist's Toolkit: Essential Reagents and Materials
Table 4: Key Research Reagent Solutions for 2D-PAGE
| Reagent | Function & Rationale |
|---|---|
| Urea & Thiourea | Chaotropic agents used to denature proteins and maintain solubility during IEF. |
| CHAPS & ASB-14 | Zwitterionic detergents critical for solubilizing hydrophobic and membrane proteins without introducing charge. |
| Dithiothreitol (DTT) | Reducing agent used to break intra- and intermolecular disulfide bonds. |
| Iodoacetamide (IAA) / Acrylamide | Alkylating agents that permanently block cysteine thiol groups to prevent reoxidation and disulfide bond formation. |
| Carrier Ampholytes | A mixture of amphoteric molecules that create a stable pH gradient for IEF and improve protein solubility. |
| ReadyPrep 2-D Cleanup Kit (Bio-Rad) | For efficient removal of interfering contaminants like salts, lipids, and detergents from protein samples. |
| ReadyPrep Reduction-Alkylation Kit (Bio-Rad) | Provides a standardized and optimized protocol for performing reduction and alkylation, minimizing artifacts. |
Workflow and Strategic Decision Diagram
The following diagram illustrates the optimized 2D-PAGE workflow integrating the key strategies discussed in this note for preventing streaking artifacts.
Strategic Workflow for Streak-Free 2D-PAGE
Achieving high-resolution, reproducible 2D-PAGE results requires meticulous attention to sample preparation and protocol parameters. The persistent challenges of horizontal and vertical streaking can be systematically eliminated by adopting two key strategies: (1) performing reduction and alkylation prior to IEF to prevent disulfide bond artifacts that cause horizontal smearing, and (2) using an optimized rehydration buffer formulated through systematic approaches like the Taguchi method to ensure complete protein solubility. By integrating these evidence-based protocols into their workflows, researchers can significantly enhance the clarity of spot detection, improve the reliability of quantitative analyses, and strengthen the overall validity of their proteomic research and biopharmaceutical development.
Preventing Protein Degradation and Oxidation with Proper Additives
In the realm of proteomics, two-dimensional polyacrylamide gel electrophoresis (2D-PAGE) remains a powerful tool for the separation and analysis of complex protein mixtures. This technique combines isoelectric focusing (IEF), which separates proteins based on their isoelectric point (pI), with SDS-PAGE, which resolves proteins according to their molecular weight [67] [68]. The integrity of this separation process is critically dependent on maintaining proteins in a stable, non-degraded state throughout the experimental workflow. Protein degradation and oxidation represent significant challenges that can compromise 2D-PAGE results by introducing artifacts such as horizontal and vertical streaking, spot smearing, and the appearance of spurious protein spots [63] [64]. These issues are particularly problematic in drug development and basic research, where accurate protein expression profiling is essential for discovering biomarkers and understanding disease mechanisms.
The prevention of protein degradation and oxidation requires a strategic approach incorporating specific chemical additives at various stages of sample preparation and electrophoresis. Disulfide bond formation between cysteine residues represents a common form of protein modification that can create various artifacts on 2D gels, including spot widening, streaking tails, phantom spots, and missing spots [64]. Oxidation of susceptible amino acids can similarly alter protein charge and mobility, leading to decreased resolution and erroneous conclusions about protein expression changes. This application note provides detailed protocols and methodologies for incorporating proper additives to maintain protein integrity throughout 2D-PAGE workflows, with particular emphasis on strategies for preventing degradation and oxidation artifacts that commonly plague this powerful separation technique.
Key Chemical Additives for Protein Stabilization
The following table summarizes the primary additives used to prevent protein degradation and oxidation in 2D-PAGE workflows, along with their mechanisms of action and effective concentration ranges:
Table 1: Key Additives for Preventing Protein Degradation and Oxidation in 2D-PAGE
| Additive | Primary Function | Mechanism of Action | Effective Concentration | Compatibility Considerations |
|---|---|---|---|---|
| Dithiothreitol (DTT) | Reduction | Cleaves disulfide bonds; maintains cysteine residues in reduced state | 50-100 mM | Migrates toward anode during IEF, may require replenishment |
| 2-Mercaptoethanol | Reduction | Reduces disulfide bonds; prevents improper folding | 0.1-0.5% (v/v) | Less stable than DTT; requires higher concentrations |
| Iodoacetamide (IAA) | Alkylation | Permanently blocks thiol groups; prevents reoxidation | 0.05-0.1 M | Must follow reduction; alkylates free thiols irreversibly |
| Urea | Chaotrope | Denatures proteins; disrupts hydrogen bonding | 7-9 M | Can form cyanate ions that carbamylate proteins; avoid heating |
| Thiourea | Chaotrope | Enhances solubilization of membrane proteins | 2 M | Often combined with urea (e.g., 7M urea, 2M thiourea) |
| CHAPS | Zwitterionic detergent | Solubilizes proteins while maintaining IEF compatibility | 2-4% (w/v) | Does not interfere with IEF; better than ionic detergents |
| ASB-14 | Zwitterionic detergent | Solubilizes hydrophobic/membrane proteins | 2% (w/v) | Particularly effective for membrane proteins |
The strategic application of these additives at appropriate stages of the 2D-PAGE workflow is essential for maintaining protein solubility and preventing artifacts. Reduction and alkylation steps are particularly critical for preventing horizontal streaking caused by disulfide bond formation [64]. Chaotropic agents like urea and thiourea work synergistically with zwitterionic detergents to solubilize hydrophobic proteins, especially membrane proteins that are notoriously difficult to resolve by standard 2D-PAGE [67]. Proper combination and timing of these additives significantly improves protein resolution and minimizes streaking artifacts that can obscure data interpretation.
Experimental Protocols for Additive Implementation
Protocol 1: Pre-IEF Reduction and Alkylation
This protocol, adapted from Herbert et al. (2001) and Brubacher et al. (2003), performs reduction and alkylation prior to IEF to prevent disulfide bond reformation during the first dimension [63].
Step 1: Sample Preparation
- Prepare protein extract in lysis buffer containing 7M urea, 2M thiourea, 4% CHAPS, and 30mM Tris-HCl, pH 8.5.
- Clarify by centrifugation at 15,000 × g for 15 minutes at 4°C to remove insoluble material.
Step 2: Reduction
- Add DTT to the supernatant to a final concentration of 100mM.
- Incubate at room temperature for 1 hour with gentle agitation.
Step 3: Alkylation
- Add iodoacetamide to a final concentration of 0.1M.
- Incubate in the dark at room temperature for 1 hour with gentle agitation.
Step 4: IEF
- Dilute sample with rehydration buffer (7M urea, 2M thiourea, 4% CHAPS, 0.5% IPG buffer) to achieve desired protein concentration.
- Load onto IPG strips and perform IEF according to standard protocols for the specific pH range used.
This approach has been shown to significantly reduce horizontal streaking caused by thiol oxidation during IEF, as it permanently blocks cysteine residues before they can participate in disulfide bond formation [63].
Protocol 2: Standard Post-IEF Equilibrium Reduction and Alkylation
This traditional protocol performs reduction and alkylation between the first and second dimensions and remains widely used [63] [64].
Step 1: Post-IEF Reduction
- Following IEF, transfer IPG strip to equilibration buffer (6M urea, 2% SDS, 30% glycerol, 50mM Tris-HCl, pH 8.8).
- Add DTT to a final concentration of 1% (w/v) (approximately 65mM).
- Incubate with gentle agitation for 15-30 minutes.
Step 2: Post-IEF Alkylation
- Transfer IPG strip to fresh equilibration buffer containing 2.5% iodoacetamide (w/v) (approximately 0.14M).
- Incubate in the dark with gentle agitation for 15-30 minutes.
Step 3: SDS-PAGE
- Rinse IPG strip with SDS-PAGE running buffer to remove excess equilibration buffer.
- Place IPG strip onto the second-dimension gel and perform SDS-PAGE.
While this method helps prevent vertical streaking during SDS-PAGE, it cannot remedy oxidation that occurs during IEF and may result in protein loss of 5-25% due to wash-off effects during the extended equilibration steps [63].
Protocol 3: Optimized Sample Preparation for Problematic Tissues
This protocol incorporates additives specifically designed to address challenging sample types, such as tissues rich in proteases or oxidative enzymes.
Step 1: Protease Inhibition
- Add protease inhibitor cocktail (PIC) to extraction buffer immediately upon tissue homogenization.
- Include 1mM PMSF as a serine protease inhibitor for broader protection.
Step 2: Enhanced Solubilization Buffer
- Use 7M urea, 2M thiourea, 4-5% CHAPS or ASB-14, 40mM Tris, 1% DTT.
- Include 0.5-2% carrier ampholytes appropriate for the pH range being studied.
Step 3: Nucleic Acid Digestion
- Add benzonase (25-50 U/mL) or DNase/RNase mixture to digest nucleic acids that can cause horizontal streaking by binding proteins [64].
- Incubate on ice for 15-30 minutes.
Step 4: Clean-up Procedure (Optional)
- For samples with high ionic strength or contaminating substances, use precipitation clean-up kits (e.g., ReadyPrep 2-D cleanup kit) following manufacturer's instructions [64].
- Resuspend cleaned pellet in appropriate rehydration buffer.
Diagram 1: 2D-PAGE workflow with additive integration points. The diagram highlights critical decision points for implementing reduction and alkylation strategies to prevent protein degradation and oxidation.
The Scientist's Toolkit: Essential Research Reagents
Successful implementation of 2D-PAGE workflows requires specific reagents optimized for preventing protein degradation and oxidation. The following table details essential solutions and their functions:
Table 2: Essential Research Reagent Solutions for Protein Stabilization in 2D-PAGE
| Reagent Solution | Composition | Primary Function | Application Notes |
|---|---|---|---|
| Lysis/Solubilization Buffer | 7M urea, 2M thiourea, 4% CHAPS, 40mM Tris, 1% DTT | Protein extraction and denaturation | Prevents protease activity; maintains reduced state; DTT should be added fresh |
| Rehydration Buffer | 7M urea, 2M thiourea, 2% CHAPS, 0.5% IPG buffer, 0.002% bromophenol blue | Hydrates IPG strips; delivers proteins into first dimension | May include 0.2-0.5% DTT for additional reduction during IEF |
| Equilibration Buffer | 6M urea, 2% SDS, 30% glycerol, 50mM Tris-HCl, pH 8.8 | Prepares proteins for second dimension | Base solution for reduction/alkylation steps; glycerol prevents diffusion |
| Reduction Solution | Equilibration buffer + 1% DTT | Reduces disulfide bonds reformed during IEF | Critical for preventing vertical streaking in second dimension |
| Alkylation Solution | Equilibration buffer + 2.5% iodoacetamide | Blocks thiol groups permanently | Must be prepared fresh and used in the dark to prevent degradation |
| Protease Inhibitor Cocktail (PIC) | Various formulations targeting different protease classes | Prevents protein degradation during sample preparation | Essential for tissues with high protease activity (e.g., pancreas) |
| ReadyPrep Reduction-Alkylation Kit | Optimized reagents for reduction and alkylation | Standardized protocol for thiol management | Commercial solution ensuring reproducibility [64] |
Troubleshooting Common Artifacts Related to Protein Degradation
Despite proper additive use, artifacts may still appear in 2D gels. The following table addresses common problems related to protein degradation and oxidation, along with targeted solutions:
Table 3: Troubleshooting Protein Degradation and Oxidation Artifacts in 2D-PAGE
| Artifact | Probable Cause | Solutions | Preventive Additives |
|---|---|---|---|
| Horizontal Streaking | Disulfide bond formation during IEF; incomplete focusing | Perform pre-IEF reduction/alkylation; ensure adequate focusing time; remove ionic contaminants | Increase DTT concentration (up to 100mM); add carrier ampholytes; use thiourea in solubilization buffer |
| Vertical Streaking | Incomplete solubilization during equilibration; protein oxidation during SDS-PAGE | Increase equilibration time (up to 45 min); ensure SDS concentration ≥2%; include glycerol in equilibration buffer | Add stronger detergents (ASB-14); perform alkylation step; use fresh DTT in equilibration |
| Missing Spots | Protein precipitation; proteolytic degradation; overalkylation | Reduce protein load; add protease inhibitors; optimize IAA concentration and time | Include PIC in extraction buffer; reduce IAA concentration if overalkylation suspected |
| Spot Tailing/Smearing | Protein-protein interactions; insufficient reduction | Increase DTT concentration; use alternative reductants (tributylphosphine); increase detergent concentration | Add combination of CHAPS and SB-3-10; include thiourea for hydrophobic proteins |
| Charge Trains (Multiple spots for single protein) | Carbamylation; partial oxidation | Use high-purity urea (avoid heating); prepare fresh urea solutions; ensure complete alkylation | Use mixed-bed ion exchange resins to remove cyanate; increase IAA concentration |
Proper management of protein degradation and oxidation through strategic additive implementation is fundamental to successful 2D-PAGE research. The protocols and methodologies presented in this application note provide researchers with specific approaches for maintaining protein integrity throughout the electrophoretic process. The decision between pre-IEF versus post-IEF reduction and alkylation represents a critical methodological consideration, with pre-IEF treatment offering distinct advantages for preventing horizontal streaking caused by disulfide bond reformation during isoelectric focusing [63]. Similarly, the combination of chaotropic agents and zwitterionic detergents in optimized ratios significantly improves protein solubility, particularly for challenging membrane proteins [67].
For researchers in drug development and proteomics, consistent implementation of these additive strategies enhances the reliability of 2D-PAGE data, enabling more accurate protein expression profiling and biomarker discovery. The essential reagent solutions and troubleshooting guidelines provided herein serve as a practical laboratory resource for minimizing artifacts related to protein degradation and oxidation. As proteomics continues to evolve toward the analysis of increasingly complex samples, these fundamental principles of protein stabilization remain essential for generating high-quality, reproducible 2D gel data that can withstand rigorous scientific scrutiny.
Systematic Troubleshooting for Common IEF and SDS-PAGE Equipment Issues
Within the framework of two-dimensional gel electrophoresis (2D-PAGE) research, the reproducibility and quality of results are paramount. The technique's power to separate complex protein mixtures by isoelectric point (pI) and molecular weight can be compromised by a range of equipment-related issues in its first dimension (Isoelectric Focusing, IEF) and second dimension (SDS-PAGE). This application note provides a systematic troubleshooting guide for researchers, scientists, and drug development professionals, detailing common equipment and instrumental problems, their causes, and validated solutions to ensure the integrity of proteomic data.
IEF Equipment and Instrumentation Issues
Isoelectric focusing is a sensitive technique where equipment performance is critical for successful protein separation and focusing.
Table 1: Troubleshooting Common IEF Equipment Issues
| Problem | Possible Cause | Suggested Solution |
|---|---|---|
| Power Supply Automatically Shuts Off [65] | Current drop below 1 mA triggers "No Load" error. | Disable the "Load Check" feature on the power supply. |
| Bubble Formation in IEF Gel [65] | CO2 outgassing from the gel as it concentrates in the acidic region. | Degas cathode buffer thoroughly; perform IEF in a cold room. |
| Crooked or Distorted Band Migration [65] | Buffer contamination (anode/cathode mix) or high salt concentration in sample. | Prevent buffer splash-over; desalt samples to ≤10 mM. |
| Poor Strip Rehydration [65] | Insufficient rehydration buffer volume or time. | Ensure strip is fully covered; extend rehydration time to overnight if needed. |
| Incomplete Circuit / Poor Run [65] | Poor electrode contact; gel not exposed at cassette ends. | Add specified water to electrode wicks; ensure proper cassette assembly. |
The following workflow outlines a systematic approach to diagnosing and resolving these IEF equipment issues:
SDS-PAGE Equipment and Running Issues
The second dimension separation can be affected by several instrumental factors related to the gel apparatus and power supply.
Table 2: Troubleshooting Common SDS-PAGE Equipment Issues
| Problem | Possible Cause | Suggested Solution |
|---|---|---|
| Smeared Bands [69] [70] [71] | Voltage too high; excessive heat. | Run gel at 10-15 V/cm; use lower voltage for longer time; use cooling system. |
| "Smiling" or "Frowning" Bands [69] [72] | Uneven heat distribution (smile); air bubbles at gel bottom (frown). | Run in cold room or with cooling; remove air bubbles during assembly. |
| Edge Effect (Distorted Peripheral Lanes) [69] | Empty wells at gel periphery. | Load all wells with sample or buffer; do not leave wells empty. |
| Protein Ran Off Gel [69] [70] | Excessive run time. | Stop run when dye front reaches bottom; adjust time for target protein size. |
| Slow Migration / Unusually Long Run Time [70] | Buffer over-concentration; low current. | Dilute buffer if necessary; increase voltage. |
| Leaking Upper Buffer Chamber [70] | Chamber overfilled; improper assembly. | Do not overfill; reassemble casting apparatus correctly. |
| Gel Detachment from Plates [72] | Unclean glass plates. | Meticulously clean plates with methanol before casting. |
The relationship between SDS-PAGE problems and their primary instrumental causes is summarized in the following diagnostic diagram:
Integrated Experimental Protocols
Protocol 1: Systematic IEF Equipment Check and Operation
This protocol ensures IEF equipment is properly configured to prevent common issues [65].
- Pre-run Setup: Confirm anode and cathode buffers are distinct and correctly assigned. Even a small contamination can cause improper runs.
- Instrument Assembly: Verify that electrode wicks are moistened with the appropriate volume (e.g., 600 µL deionized water). Ensure the gel is exposed at both the anodic and cathodic ends of the cassette for a complete circuit.
- Power Supply Configuration: Set the 'Load Check' feature to 'off' to allow the power supply to operate at the low currents (<1 mA) typical of IEF.
- Sample Application: Ensure no liquid is present in the inner chamber of the cassette. Check for leaks.
- Run Initiation and Monitoring: Start the run and monitor for bubble formation. If bubbles appear early in the run, degas the cathode buffer more thoroughly for subsequent runs.
Protocol 2: SDS-PAGE Apparatus Assembly and Running Conditions
This protocol standardizes SDS-PAGE setup to minimize equipment-related artifacts [69] [70] [72].
- Gel Cassette Preparation: Clean glass plates with methanol or ethanol and ensure they are completely dry to prevent gel detachment during electrophoresis.
- Apparatus Assembly: Assemble the casting apparatus correctly. Avoid overtightening clamp screws, as excessive pressure can distort the gel plates and lead to skewed bands. Use a spirit level to ensure the apparatus is even.
- Leak Check: After pouring the gel, perform a leak check by filling the upper chamber with water before loading samples.
- Well Preparation: Rinse wells with running buffer before sample loading to remove air bubbles and unpolymerized acrylamide.
- Electrophoresis Conditions: Run the gel at a constant voltage of 10-15 V/cm. For standard mini-gels, 150V is typical. If overheating occurs, reduce the voltage or perform the run in a cold room. Stop the run when the dye front is ~1 cm from the bottom of the gel.
Protocol 3: Post-Electrophoresis Visualization and Staining
Optimal staining and destaining are crucial for visualizing results and diagnosing issues [73].
- Fixation: After electrophoresis, immerse the gel in a fixing solution (e.g., 50% ethanol, 10% acetic acid) for 10 minutes to 1 hour to precipitate proteins and prevent diffusion.
- Coomassie Staining: Incubate the gel in Coomassie Brilliant Blue staining solution (e.g., 0.1% CBB R-250, 20% methanol, 10% acetic acid) with gentle agitation for a minimum of 3 hours.
- Destaining: Remove excess stain by washing the gel in a destaining solution (e.g., 50% methanol, 10% acetic acid) with multiple solution changes until bands are clear against a low background. Alternatively, for G-250, water alone can be used.
- Preservation: Incubate the gel in 5% acetic acid for at least one hour for preservation. Seal the gel in a polyethylene bag to prevent dehydration.
The Scientist's Toolkit: Research Reagent Solutions
Table 3: Essential Materials for IEF and SDS-PAGE
| Item | Function / Purpose |
|---|---|
| Carrier Ampholytes [65] [8] | Generate the pH gradient required for IEF. Using specific brands can minimize staining background. |
| Ultrapure Urea (8 M) [65] | A key solubilization reagent in IEF sample buffer that denatures proteins while maintaining solubility. |
| Non-ionic Detergent (e.g., NP-40) [8] | Works in concert with urea to solubilize proteins during IEF, preventing aggregation. |
| Dithiothreitol (DTT) or β-Mercaptoethanol [65] [71] | Reducing agents that break disulfide bonds to ensure complete protein denaturation. |
| Precast IEF Gels & IPG Strips [65] | Provide reproducibility and consistency for the first-dimension separation. |
| TEMED & Ammonium Persulfate (APS) [70] [72] | Catalyze the polymerization of acrylamide gels. Must be fresh for consistent results. |
| High-Purity SDS [71] | Denatures proteins and confers a uniform negative charge for SDS-PAGE separation. |
| Coomassie Brilliant Blue Dye [73] | A robust, cost-effective dye for staining proteins fixed in polyacrylamide gels. |
| Methanol & Acetic Acid [73] | Key components of standard fixation, staining, and destaining solutions. |
A systematic approach to troubleshooting equipment in 2D-PAGE is fundamental for obtaining high-quality, reproducible proteomic data. By understanding the common instrumental failures in both IEF and SDS-PAGE systems, researchers can quickly diagnose problems, apply targeted solutions, and validate the performance of their electrophoresis setup. The protocols and guidelines provided here serve as a critical resource for maintaining the integrity of the separation process, from initial sample focusing to final protein visualization.
Beyond Traditional 2D-PAGE: Validating Advanced Techniques and Comparative Analysis
Two-dimensional polyacrylamide gel electrophoresis (2D-PAGE), combining isoelectric focusing (IEF) and SDS-PAGE, has long been a fundamental tool in proteomics for separating complex protein mixtures. However, traditional 2D-PAGE approaches using visible stains have been limited by gel-to-gel variability, lack of reproducibility, and limited quantitative capabilities [6]. These technical challenges have been particularly problematic for neuroscience research and drug development, where accurate measurement of subtle protein expression changes is critical for understanding disease mechanisms and therapeutic effects [6].
The development of two-dimensional difference gel electrophoresis (2D-DIGE) represents a methodological evolution in 2D-PAGE that addresses these fundamental limitations [74]. This innovative approach incorporates fluorescent cyanine dyes (CyDyes) and an internal standard methodology to overcome the variability inherent in traditional 2D-PAGE [6] [75]. By enabling multiple samples to be separated on the same gel with an internal reference, 2D-DIGE provides statistical confidence in quantitative proteomics that was previously unattainable with conventional 2D-PAGE methods [76].
Principle of 2D-DIGE: Multiplexing and Internal Standardization
The fundamental innovation of 2D-DIGE lies in its use of spectrally resolvable, size- and charge-matched fluorescent cyanine dyes (Cy2, Cy3, and Cy5) to label protein samples prior to electrophoresis [75]. These dyes carry an N-hydroxysuccinimidyl ester reactive group that covalently binds to the ε-amino groups of lysine residues in proteins [6]. The labeling strategy is "minimal," meaning dye concentrations are kept low enough that approximately only one dye molecule labels each protein, ensuring that proteins migrate as single spots rather than trains of spots with different modification states [74].
Internal Standard Strategy
A cornerstone of the 2D-DIGE methodology is the incorporation of a pooled internal standard, which typically consists of equal aliquots of all biological samples in the experiment labeled with Cy2 [74] [75]. This internal standard is run on every gel in the experiment alongside experimental samples labeled with Cy3 or Cy5. Since the internal standard contains all proteins present in all samples, it provides a consistent reference pattern for every gel, facilitating accurate spot matching and normalization across multiple gels [75]. Quantitative comparisons are then made based on the ratio of each protein spot's intensity in the experimental samples to its corresponding spot in the internal standard, effectively canceling out gel-to-gel variations [74].
Comparative Advantages of 2D-DIGE Over Traditional 2D-PAGE
2D-DIGE offers several significant advantages that address the key limitations of traditional 2D-PAGE, particularly for applications in drug development and clinical research where quantitative accuracy is paramount.
Table 1: Quantitative Comparison Between Traditional 2D-PAGE and 2D-DIGE
| Parameter | Traditional 2D-PAGE | 2D-DIGE |
|---|---|---|
| Inter-gel variability | High (20-30% coefficient of variation) [74] | Significantly reduced (uses internal standard) [6] |
| Quantitative capability | Limited, not truly quantitative [76] | Highly accurate quantitative ratios [77] |
| Sample throughput | One sample per gel | 2-3 samples per gel [78] |
| Spot matching | Complex, between gels | Simplified, within same gel [75] |
| Detection sensitivity | Moderate (silver stain) to low (Coomassie) [6] | High (comparable to silver staining) [6] |
| Statistical confidence | Lower, requires more replicates | Higher, robust statistical analysis [6] |
| Dynamic range | Limited | Wide dynamic range [78] |
Key Technical Advantages
The implementation of 2D-DIGE provides researchers with several distinct technical benefits:
Reduced Variability: By co-separating multiple samples on the same gel, 2D-DIGE eliminates gel-to-gel variation, a major source of error in traditional 2D-PAGE [6].
Improved Quantitation: The internal standard approach allows for precise measurement of protein abundance changes as ratios, providing more reliable quantitative data than between-gel comparisons [74].
Enhanced Reproducibility: The pooled internal standard facilitates normalization of each spot across all gels in an experiment, improving reproducibility especially in comprehensive studies requiring multiple gels [6].
Post-Translational Modification Detection: 2D-DIGE can detect various post-translational modifications such as phosphorylation, ubiquitination, and palmitoylation, which often play key roles in modulating protein function [6].
Detailed 2D-DIGE Experimental Protocol
The following section provides a comprehensive methodological framework for implementing 2D-DIGE in proteomics research.
Sample Preparation and Labeling
Proper sample preparation is critical for successful 2D-DIGE analysis. The protocol typically requires 100-300 µg of total protein per sample for each gel [79].
Protein Extraction and Cleanup: Extract proteins using appropriate lysis buffers (e.g., 30 mM Tris-HCl, 2 M thiourea, 7 M urea, 4% CHAPS, pH 8.5) [74]. Remove interfering substances using cleanup kits if necessary [74].
Protein Quantitation: Precisely determine protein concentration using a compatible assay such as the 2D-Quant kit [74].
Fluorescent Labeling:
- Prepare CyDye working solutions by dissolving dyes in high-purity dimethylformamide (DMF) [74].
- Label 50 µg of each protein sample with 100-300 pmol of Cy3 or Cy5 [74].
- Label the pooled internal standard with Cy2 using the same protein-to-dye ratio [74].
- Incubate on ice in the dark for 30 minutes [74].
- Quench the reaction by adding 10 mM lysine [74].
Sample Pooling: Combine labeled samples including the internal standard for co-separation on the same 2D gel [74].
Two-Dimensional Electrophoresis
The separation methodology follows the established 2D-PAGE approach but with optimized conditions for fluorescently labeled samples.
First Dimension: Isoelectric Focusing
Strip Equilibration: Equilibrate focused IPG strips in SDS-containing buffer to prepare for second-dimension separation [6].
Second Dimension: SDS-PAGE
Image Acquisition and Analysis
Proper image acquisition is essential for obtaining high-quality quantitative data from 2D-DIGE experiments.
Fluorescence Scanning: Scan gels using a laser scanner capable of exciting each CyDye at its specific wavelength:
Image Analysis Workflow:
- Perform differential in-gel analysis (DIA) to normalize Cy3 and Cy5 signals to the Cy2 internal standard within each gel [74].
- Conduct biological variation analysis (BVA) to compare normalized spot abundances across multiple gels [74].
- Identify statistically significant changes using appropriate statistical tests (e.g., t-tests, ANOVA) [74].
Essential Research Reagents and Equipment
Successful implementation of 2D-DIGE requires specific reagents and instrumentation optimized for the methodology.
Table 2: Essential Research Reagent Solutions for 2D-DIGE
| Item | Function | Specific Examples/Notes |
|---|---|---|
| CyDye DIGE Fluor dyes | Fluorescent labeling of protein samples | Cy2, Cy3, Cy5; minimal dyes for lysine labeling [75] |
| IPG Strips | First dimension separation by isoelectric point | Immobiline DryStrips (pH 3-10, 4-7, or 6-9) [74] |
| Sample Buffer | Protein solubilization and denaturation | 2 M thiourea, 7 M urea, 4% CHAPS [74] |
| Rehydration Buffer | Hydrating IPG strips with samples | May include destreak reagent to improve IEF [74] |
| Fluorescence Scanner | Detection of separated protein spots | Requires multiple laser/filter sets for Cy2, Cy3, Cy5 [78] [74] |
| Image Analysis Software | Spot detection, matching, and quantitation | DeCyder, Progenesis, or SameSpots [78] [74] |
Applications in Biomedical Research and Drug Development
2D-DIGE has been successfully applied to address diverse research questions in biomedicine, particularly in the context of disease mechanism elucidation and biomarker discovery.
Case Study: Lung Cancer Subtype Characterization
A recent application of 2D-DIGE in non-small-cell lung cancer (NSCLC) research demonstrates the power of this technology. Researchers compared protein profiles between tumor center and tumor margin tissues in adenocarcinoma (ADC) and squamous cell carcinoma (SCC) subtypes [80]. The study identified:
- 26 significant canonical pathways in ADC, including Rho signaling and epithelial adherens junction signaling [80].
- 9 significant canonical pathways in SCC, including hypoxia-inducible factor-1α signaling and phagosome maturation [80].
- Proteins linked to cancer invasion and progression, including those involved in cell migration, adhesion, cytoskeletal structure, and anaerobic metabolism [80].
This application highlights how 2D-DIGE can reveal molecular differences between disease subtypes and regions within tumors, providing potential biomarkers and therapeutic targets [80].
Neuroscience and Neurological Disorders
In neuroscience, 2D-DIGE has been particularly valuable for studying protein expression changes in neurological diseases such as Alzheimer's disease, Parkinson's disease, and Huntington's disease [6]. The ability to examine hundreds or thousands of proteins simultaneously enables a more holistic view of cellular processes underlying these conditions [6].
Technical Considerations and Limitations
While 2D-DIGE represents a significant advancement over traditional 2D-PAGE, researchers should be aware of certain limitations and considerations:
Protein Characteristics: The technique has reduced separation efficiency for hydrophobic proteins, very high or low molecular weight proteins, and proteins with extreme pI values [74] [77].
Labeling Bias: Proteins with low lysine content may be underrepresented due to the labeling mechanism [74].
Equipment Requirements: 2D-DIGE requires specialized fluorescence scanners and analysis software, which can represent a significant investment [77].
Low-Abundance Proteins: Despite high sensitivity, detection of very low-abundance proteins remains challenging and may require additional fractionation or enrichment strategies [74].
2D-DIGE represents a significant methodological advancement in the field of two-dimensional electrophoresis, successfully addressing major limitations of traditional 2D-PAGE through the implementation of fluorescent CyDye labeling and an internal standard methodology. The technology provides researchers with a robust, quantitative platform for protein expression profiling with applications spanning basic research, biomarker discovery, and drug development.
By enabling multiple samples to be compared on the same gel with high statistical confidence, 2D-DIGE offers unparalleled accuracy in detecting subtle protein expression changes that underlie physiological processes and disease states. While the methodology requires specialized equipment and has some inherent limitations, its quantitative advantages make it an invaluable tool in the proteomics research arsenal, particularly for studies requiring high confidence in measured protein abundance changes.
Protein-protein interactions (PPIs) are fundamental to cellular homeostasis, and their dysregulation is a key driver in many diseases [81]. For decades, the study of native protein complexes, particularly those involving multimeric assemblies and membrane proteins, presented significant challenges due to the limitations of denaturing electrophoresis techniques [82]. Blue-Native Polyacrylamide Gel Electrophoresis (BN-PAGE), pioneered by Schägger and colleagues, revolutionized the field by enabling the separation of intact, native protein complexes under non-denaturing conditions [82]. This protocol, and its variant Clear-Native PAGE (CN-PAGE), has become an indispensable tool for characterizing the composition, assembly, and stoichiometry of multi-subunit complexes. When integrated into a two-dimensional (2D) electrophoresis workflow, Native PAGE provides a powerful platform for proteomic research, bridging the gap between native complex separation and high-resolution analysis of individual subunits [4]. This Application Note details the validation of a robust BN-/CN-PAGE protocol, framing it within the context of a broader 2D-PAGE research strategy that combines isoelectric focusing (IEF) with SDS-PAGE for comprehensive protein complex analysis.
Principles of Native PAGE
Native PAGE separates proteins based on a combination of their inherent charge, molecular size, and three-dimensional shape, preserving their native state and biological activity. The key distinction from denaturing techniques is the absence of ionic detergents like SDS, which would dismantle non-covalent interactions and destroy complex integrity.
- BN-PAGE (Blue-Native PAGE): This method utilizes the anionic dye Coomassie Blue G-250, which binds to hydrophobic protein surfaces. The dye confers a negative charge shift, forcing even basic proteins to migrate toward the anode during electrophoresis. It also prevents protein aggregation by keeping hydrophobic membrane proteins soluble [82].
- CN-PAGE (Clear-Native PAGE): A high-resolution variant where Coomassie dye is replaced by mixtures of anionic and neutral detergents in the cathode buffer. These mixed micelles similarly induce a charge shift to facilitate migration. A primary advantage of CN-PAGE is the absence of dye interference, making it the preferred method for downstream in-gel enzyme activity assays [82].
The choice between BN-PAGE and CN-PAGE depends on the downstream application. BN-PAGE is often preferred for its robust performance in separating complex mixtures, while CN-PAGE is ideal for direct in-gel activity staining.
Experimental Protocols
Protocol 1: Sample Preparation for Mitochondrial OXPHOS Complexes
This validated protocol is optimized for the analysis of mitochondrial oxidative phosphorylation (OXPHOS) complexes from small patient samples, such as cultured fibroblasts or tissue biopsies [82].
Materials
- Lysis Buffer: 1.5 M 6-Aminocaproic acid, 50 mM Bis-Tris-HCl, pH 7.0.
- Detergents: Choose one based on the target complex:
- n-Dodecyl-β-d-maltoside: For solubilizing individual OXPHOS complexes.
- Digitonin: A milder detergent for preserving respiratory chain supercomplexes (respirasomes).
- Protease Inhibitor Cocktail.
- Coomassie Blue G-250 Dye Solution (for BN-PAGE): A 5% (w/v) stock in 750 mM 6-aminocaproic acid.
Method
- Mitochondrial Isolation: Isolate mitochondria from your sample (e.g., by differential centrifugation).
- Membrane Solubilization:
- Suspend the mitochondrial pellet in lysis buffer containing protease inhibitors.
- Add the chosen detergent from a 10-20% (w/v) stock solution. A typical starting point is a detergent-to-protein ratio of 2-4 g/g.
- Incubate on ice for 10-15 minutes with gentle mixing.
- Clarification: Centrifuge the lysate at 20,000 × g for 15-30 minutes at 4°C to remove insoluble material.
- Sample Preparation for Loading:
- Mix the supernatant with a 10X BN-PAGE sample buffer (for BN-PAGE, this contains Coomassie dye) or a native sample buffer without dye (for CN-PAGE).
- The sample is now ready for loading onto a native gel.
Protocol 2: One-Dimensional BN-/CN-PAGE
This protocol describes the manual casting of native mini-gels and the electrophoretic separation [82].
Materials
- Gel Casting System: Mini-Protean Tetra Vertical Electrophoresis Cell system (Bio-Rad) or equivalent.
- Gradient Maker: A four-way exponential gradient maker is recommended for casting linear gradient gels.
- Acrylamide Solutions: For a 3-13% linear gradient gel, prepare light and heavy acrylamide/bis-acrylamide solutions in gel buffer (1.5 M 6-aminocaproic acid, 150 mM Bis-Tris-HCl, pH 7.0).
- Catalysts: Ammonium persulfate (APS) and N,N,N',N'-Tetramethylethylenediamine (TEMED).
- Cathode Buffers:
- BN-PAGE Cathode Buffer: 50 mM Tricine, 15 mM Bis-Tris, 0.02% Coomassie Blue G-250, pH 7.0.
- CN-PAGE Cathode Buffer: 50 mM Tricine, 15 mM Bis-Tris, 0.05% sodium deoxycholate, 0.02% dodecylmatoside, pH 7.0.
- Anode Buffer: 50 mM Bis-Tris-HCl, pH 7.0.
Method
- Gel Casting:
- Assemble the gel cassette.
- Prepare light and heavy acrylamide solutions, add catalysts, and pour the gradient using the gradient maker.
- Overlay with water-saturated butanol for a flat interface.
- Allow the gel to polymerize completely (approximately 1 hour).
- Electrophoresis:
- Assemble the gel in the electrophoresis unit.
- Fill the upper and lower chambers with the appropriate cathode and anode buffers, respectively.
- Load the prepared samples.
- Run the gel at a constant voltage (e.g., 100 V) for about 30-45 minutes until the samples have entered the stacking gel, then continue at a constant current (e.g., 10-15 mA) for 3-5 hours at 4°C. Stop the run when the dye front has migrated to the bottom of the gel.
Protocol 3: Two-Dimensional BN/SDS-PAGE
This protocol combines the separation of native complexes in the first dimension with high-resolution denaturing separation of their subunits in the second dimension [82] [4].
Materials
- Equilibration Buffer: 65 mM DTT, 2% SDS, 62.5 mM Tris-HCl, pH 6.8.
- Agarose Solution: 1% Agarose in 1X SDS-PAGE running buffer, with a trace of Bromophenol Blue.
Method
- First Dimension (BN-PAGE): Perform BN-PAGE as described in Protocol 2.
- Gel Strip Excission: After the first-dimension run, carefully excise a single lane from the BN-PAGE gel.
- Denaturing Equilibration: Incubate the excised gel strip in equilibration buffer for 15-30 minutes with gentle agitation. This step reduces disulfide bonds and coats the proteins with SDS.
- Second Dimension (SDS-PAGE):
- Place the equilibrated gel strip horizontally on top of a standard SDS-PAGE gel.
- Secure it in place by overlaying with the warm agarose solution.
- Proceed with standard SDS-PAGE electrophoresis.
Protocol 4: In-Gel Enzyme Activity Staining
A key advantage of Native PAGE is the ability to assay enzymatic activity directly in the gel after separation [82].
Complex I (NADH:Ubiquinone Oxidoreductase) Activity
- Staining Solution: 0.14 mM NADH, 1.0 mg/mL Nitrotetrazolium Blue (NBT), 0.1 mg/mL Ubiquinone-50, in 5 mM Tris-HCl, pH 7.4.
- Method: Incubate the gel in the staining solution in the dark at room temperature. Complex I activity appears as a dark blue-purple formazan band.
Complex IV (Cytochrome c Oxidase) Activity
- Staining Solution: 0.1% DAB (3,3'-Diaminobenzidine), 0.1% Cytochrome c, 20 mM Tris-HCl, 0.02% Catalase, pH 7.4.
- Method: Incubate the gel in the staining solution in the dark. Complex IV activity produces brown-colored bands.
Complex V (F1Fo-ATPase) Activity
- Staining Solution: 50 mM Glycine, 5 mM MgCl2, 2.5 mM ATP, 0.2% Pb(NO3)2, 0.12% Tris-HCl, pH 8.3.
- Method: Incubate the gel in the staining solution. A published enhancement step for this protocol markedly improves sensitivity, leading to the formation of white lead phosphate precipitate bands [82].
Table 1: Key Reagents for Native PAGE and Their Functions
| Research Reagent Solution | Function in the Protocol |
|---|---|
| 6-Aminocaproic Acid | Zwitterionic salt; provides a shielding effect during membrane solubilization, supports electrophoresis at neutral pH without interfering with migration [82]. |
| Coomassie Blue G-250 | Anionic dye (BN-PAGE); binds hydrophobic protein surfaces, induces negative charge shift, prevents protein aggregation [82]. |
| n-Dodecyl-β-d-maltoside | Mild, non-ionic detergent; solubilizes membrane proteins while preserving individual OXPHOS complexes [82]. |
| Digitonin | Mild, non-ionic detergent; used for gentle solubilization that preserves higher-order supercomplexes (e.g., respirasomes) [82]. |
| Mixed Detergents (e.g., Sodium Deoxycholate & Dodecylmatoside) | Charge-shift agents (CN-PAGE); form mixed micelles that impose negative surface charge on proteins, replacing Coomassie dye [82]. |
| Nitrotetrazolium Blue (NBT) | Tetrazolium salt; used in in-gel activity staining for Complex I, reduced by electron transfer to form an insoluble purple formazan precipitate [82]. |
Data Analysis and Validation
Quantitative Analysis of OXPHOS Complexes
BN-/CN-PAGE provides semi-quantitative data on complex abundance and integrity. After electrophoresis and staining (e.g., with Coomassie, western blot, or activity stain), bands can be quantified using densitometry software. This allows for the comparison of complex levels between different samples, such as healthy versus diseased tissues, or the assessment of assembly defects in genetic models.
Table 2: Expected Migration and Activity Staining of OXPHOS Complexes
| Protein Complex | Approx. Native Mass (kDa) | Detergent for Solubilization | In-Gel Activity Stain |
|---|---|---|---|
| Complex I | ~1,000 | n-Dodecyl-β-d-maltoside | Yes (NADH-NBT) |
| Complex II | ~140 | n-Dodecyl-β-d-maltoside | Yes (Succinate-NBT) |
| Complex III Dimer | ~500 | n-Dodecyl-β-d-maltoside | No (lacks reliable assay) |
| Complex IV | ~200 | n-Dodecyl-β-d-maltoside | Yes (Cytochrome c oxidase) |
| Complex V | ~600 | n-Dodecyl-β-d-maltoside | Yes (ATPase) |
| Respirasome (I-III2-IV) | ~1,700 | Digitonin | Can exhibit combined activities |
Validation within a 2D-PAGE Research Context
The integration of Native PAGE as the first dimension in a 2D workflow significantly enhances proteomic analysis [4]. While traditional 2D-PAGE combining IEF and SDS-PAGE is powerful for resolving complex protein mixtures from whole-cell lysates, it is limited in its ability to analyze membrane proteins and native complexes. The BN/SDS-PAGE approach directly addresses this limitation.
- Workflow Synergy: The first dimension (BN-PAGE) separates the functional units—the intact complexes. The second dimension (SDS-PAGE) dissociates these complexes into their individual subunits, revealing their composition and identifying co-migrating proteins. This orthogonal separation provides a far more comprehensive view of the proteome, particularly the membrane-associated subproteome.
- Application in Drug Discovery: This validated protocol is applicable beyond basic research. For instance, the hub protein 14-3-3, which has hundreds of client proteins, forms structured interfaces upon binding that can be targeted by "molecular glues" to stabilize specific PPIs. BN-PAGE and related techniques are crucial for validating the stabilization of such target complexes in drug discovery programs [81].
Workflow and Signaling Diagrams
Diagram 1: Native PAGE and 2D Workflow.
Diagram 2: Respiratory Supercomplex Formation & Solubilization.
The validated BN-/CN-PAGE protocols detailed herein provide a robust, semi-quantitative, and reproducible framework for the analysis of native protein complexes, with a specific focus on the mitochondrial OXPHOS system. By enabling the study of complex assembly, stability, and enzymatic activity, these methods offer critical insights into fundamental biological processes and disease mechanisms. The integration of Native PAGE as a first-dimension separation in a 2D-PAGE workflow, followed by denaturing SDS-PAGE, creates a powerful tool for comprehensive proteomic profiling. This approach is particularly valuable for characterizing the "undruggable" space of protein-protein interactions, opening new avenues for chemical biology and therapeutic intervention, as demonstrated by the systematic development of molecular glues for PPI stabilization [81]. This protocol is adaptable for a wide range of applications, from basic research on protein interactions to applied drug discovery and diagnostic development.
Within the field of proteomics, the selection of a separation technique is pivotal to the success and scope of any analytical undertaking. For decades, two-dimensional polyacrylamide gel electrophoresis (2D-PAGE), which combines isoelectric focusing (IEF) and SDS-PAGE, has been a cornerstone of protein separation [83] [84]. However, the proteomics landscape has been reshaped by the emergence of gel-free shotgun proteomics and advanced capillary-based methods [85] [86]. This application note provides a detailed comparative analysis of these core technologies, presenting structured quantitative data, detailed experimental protocols, and visualization to guide researchers in selecting the most appropriate methodology for their specific research context in drug development and biomedical science.
The following workflow diagrams illustrate the fundamental procedural differences between 2D-PAGE and shotgun proteomics.
2D-PAGE Workflow
Shotgun Proteomics Workflow
Quantitative Performance Comparison
The following tables summarize the core characteristics and performance metrics of each technique, providing a basis for objective comparison.
Table 1: Core Characteristics and Applications
| Parameter | 2D-PAGE | Shotgun Proteomics | Capillary Electrophoresis |
|---|---|---|---|
| Separation Principle | Charge (pI) → Molecular Weight | Chromatography → m/z | Electrophoretic mobility |
| Analysis Focus | Intact Proteoforms | Peptides (Inference to Proteins) | Peptides/Proteins |
| Key Strength | Visualization of PTMs & isoforms [85] | Deep proteome coverage [87] | High speed & automation [88] |
| Typical Analysis Depth | ~800 gene products (≥ 2500 spots) [85] | Thousands of proteins | Highly variable |
| Throughput | Low (1-2 days) | Medium to High | Very High (minutes) [88] |
| Quantitative Accuracy | High linearity (DIGE) | Varies with method; Bayesian inference improves FC accuracy [87] | Moderate |
Table 2: Practical Considerations for Implementation
| Parameter | 2D-PAGE | Shotgun Proteomics | Capillary Electrophoresis |
|---|---|---|---|
| Sample Consumption | Moderate to High (µg-mg) | Low (ng-µg) | Low (nL volumes) |
| Technical Reproducibility | Moderate (Improved with IPG strips) [84] | High (with stable labels) | Can suffer reproducibility issues [88] |
| Ease of Use | Labor-intensive; requires expertise | High after setup; complex data analysis | Highly automated [88] |
| Cost | Low to Moderate (equipment/reagents) | High (MS instrumentation) | Moderate (instrumentation) |
| Spot/Peptide-to-Protein | Direct from spot (1 major protein/spot common) [85] | Complex protein inference ("protein ambiguity groups") [85] | Direct for pure analytes |
Detailed Experimental Protocols
Protocol for 2D-PAGE Analysis
Sample Preparation for 2D-PAGE [12] [84]:
- Lysis: Solubize tissue or cell samples in a buffer containing 8-9 M urea (or 5-8 M urea with 2 M thiourea for membrane proteins), 0.5-4% non-ionic or zwitterionic detergent (e.g., CHAPS), 20-100 mM reducing agent (DTT or DTE), and 0.2-2% carrier ampholytes.
- Clearing: Centrifuge at high speed (e.g., 15,000 × g) to remove insoluble debris. The supernatant's protein concentration should be determined before loading.
First Dimension: Isoelectric Focusing (IEF) [12]:
- Rehydration: Apply the protein sample (typically 5-200 µg depending on stain and IPG strip pH range) to an Immobilized pH Gradient (IPG) strip via active or passive rehydration. For a 7 cm strip, a volume of 140-155 µL is standard.
- Focusing: Perform IEF using a high-voltage power supply under controlled temperature (e.g., 20°C). A typical program for a 7 cm IPG strip might involve step-wise voltage increases, culminating in a final focusing at 4000-5000 V for a total of 10,000-20,000 Vhrs. The ZOOM IPGRunner System can complete this step in ~3 hours [12].
Strip Equilibration [12] [84]:
- Incubate the focused IPG strip in an equilibration buffer (e.g., containing Tris-HCl, urea, glycerol, and SDS) first with a reducing agent (e.g., DTT) and then with an alkylating agent (e.g., iodoacetamide) to denature proteins and alkylate cysteines.
Second Dimension: SDS-PAGE [12]:
- Gel Casting: Use a polyacrylamide gel (e.g., NuPAGE Bis-Tris) for separation. Gradient gels (e.g., 4-12%) are excellent for resolving a broad range of molecular weights.
- Transfer and Running: Place the equilibrated IPG strip onto the SDS-PAGE gel. Embed it with agarose to ensure good contact. Run the gel using an appropriate buffer system (e.g., MES or MOPS) at constant voltage until the dye front reaches the bottom.
Post-Electrophoresis Analysis [12]:
- Staining: Visualize proteins using sensitive stains like SYPRO Ruby (0.25-1 ng sensitivity), silver stain (e.g., ~0.3 ng), or Coomassie.
- Imaging and Spot Picking: Scan the gel and analyze images with specialized software. Spots of interest can be excised robotically or manually.
- In-Gel Digestion: Destain, reduce, and alkylate gel spots. Digest proteins with trypsin and extract peptides for mass spectrometric identification.
Protocol for Shotgun Proteomics (Label-Free)
Sample Preparation and Digestion [86]:
- Denaturation and Reduction: Denature the protein mixture in a buffer (e.g., 8 M urea or 0.1% RapiGest) and reduce disulfide bonds with DTT or TCEP.
- Alkylation: Alkylate cysteine residues with iodoacetamide.
- Digestion: Dilute the sample to a urea concentration compatible with trypsin (< 2 M) and digest with sequencing-grade trypsin (typically 1:50 enzyme-to-protein ratio) overnight at 37°C. The digestion can be stopped by adding acid.
Liquid Chromatography (LC) [86]:
- Separation: Desalt the peptide mixture and separate it using reversed-phase nano-liquid chromatography (nano-LC). Peptides are typically loaded onto a trap column and then separated on an analytical C18 column using a gradient of increasing organic solvent (e.g., acetonitrile) in water with 0.1% formic acid, over 60-120 minutes.
Mass Spectrometric Analysis [87] [86]:
- Data-Dependent Acquisition (DDA): The eluting peptides are ionized (e.g., by electrospray ionization) and introduced into a tandem mass spectrometer. The instrument continuously cycles between a full MS1 scan (to record peptide masses and intensities) and subsequent MS2 scans (to fragment the most abundant ions from the MS1 scan) for identification.
- Database Search: The generated MS/MS spectra are searched against a protein sequence database using algorithms like Mascot, MaxQuant, or FragPipe [87].
- Quantification and Protein Inference: For label-free quantification, peptide peak areas from MS1 spectra are extracted and aligned across runs. The software then infers protein identities and abundances from the identified peptides, a process that can be challenging due to shared peptides [85].
The Scientist's Toolkit: Essential Research Reagents
Table 3: Key Reagents and Their Functions in Proteomic Workflows
| Reagent / Kit | Primary Function | Typical Application |
|---|---|---|
| Urea / Thiourea | Protein denaturation and solubilization | 2D-PAGE Sample Buffer [12] |
| CHAPS / CHAPSO | Non-ionic detergent for protein stabilization | 2D-PAGE Sample Buffer [12] |
| DTT / DTE | Reduction of disulfide bonds | 2D-PAGE Sample Buffer; Shotgun sample prep [12] |
| IPG Strips | First-dimension separation by isoelectric point | 2D-PAGE IEF [12] |
| Carrier Ampholytes | Establish and stabilize pH gradient | 2D-PAGE IEF [12] |
| ZOOM IPGRunner System | Integrated platform for mini-gel 2D electrophoresis | 2D-PAGE [12] |
| Sequencing-Grade Trypsin | Proteolytic digestion of proteins into peptides | Shotgun Proteomics [86] |
| MS-Grade Solvents | Mobile phase for LC-MS; minimizes background | Shotgun Proteomics / MS |
Application Scenarios and Decision Framework
The following decision diagram outlines a logical pathway for selecting the most suitable proteomics method based on research goals and sample properties.
Scenario 1: Biomarker Discovery from Biofluids For deep mining of plasma or serum to discover potential disease biomarkers, shotgun proteomics is the preferred choice. Its superior depth and sensitivity allow for the identification of low-abundance proteins in highly complex mixtures [86]. While 2D-PAGE has a narrower dynamic range, it can be valuable for targeted validation of specific biomarker isoforms.
Scenario 2: Monitoring Host-Cell Proteins (HCPs) in Biologics A recent systematic benchmark of MS/MS search tools for HCP monitoring using label-free shotgun proteomics demonstrated its high precision and ability to achieve the highest number of quantifiable peptides [87]. FragPipe, in particular, was noted for its high precision in this context.
Scenario 3: Studying Post-Translational Modifications 2D-PAGE excels in applications where changes in protein charge or mass are central, such as monitoring phosphorylation, deamidation, or proteolytic processing. The technique's ability to resolve and directly visualize different proteoforms of the same gene product is a unique advantage [85] [12]. A charge shift can be detected in the first dimension (IEF) and a mass shift in the second (SDS-PAGE), allowing for the direct observation of modified protein species.
The paradigm in proteomics has shifted from a one-method-fits-all approach to an informed, question-driven selection of technology. 2D-PAGE remains a powerful, robust, and highly visual method for the separation of intact proteoforms, making it ideal for focused studies of PTMs and protein isoforms [85] [84]. In contrast, shotgun proteomics is the undisputed leader for achieving maximum analysis depth and high-throughput identification from complex mixtures, as evidenced by its central role in modern biomarker discovery and system biology [87] [86]. Capillary electrophoresis offers a complementary niche where extreme speed and automation are paramount for analytical or quality control purposes [88]. The most powerful research strategies often integrate these techniques, leveraging their respective strengths to move from initial discovery to rigorous validation.
Integrating 2D-PAGE with Mass Spectrometry for Protein Identification
Two-dimensional polyacrylamide gel electrophoresis (2D-PAGE), which combines isoelectric focusing (IEF) and SDS-PAGE, remains a cornerstone technique in proteomics for separating complex protein mixtures [10]. When integrated with mass spectrometry (MS), it provides a powerful platform for protein identification, characterization of post-translational modifications (PTMs), and biomarker discovery [89] [10]. This application note details established protocols and emerging methodologies for effectively coupling 2D-PAGE with MS, providing researchers and drug development professionals with practical guidance for in-depth structural proteomics.
2D-PAGE Separation Fundamentals
Core Principle and Workflow
The exceptional resolving power of 2D-PAGE stems from its orthogonal separation process. Proteins are first separated according to their isoelectric point (pI) via IEF in the first dimension, followed by separation based on molecular weight (Mr) via SDS-PAGE in the second dimension [89] [10]. It is highly improbable for two different proteins to share identical pI and molecular weight, allowing thousands of proteins to be resolved in a single gel [10]. A standard workflow involves sample preparation, first-dimension IEF, strip equilibration, second-dimension SDS-PAGE, and finally, protein detection through staining.
Critical Reagents for 2D-PAGE
Successful 2D-PAGE relies on specific reagents to maintain protein solubility and integrity during the separation process. The table below summarizes key components used in sample preparation for the first dimension (IEF).
Table 1: Essential Reagents for 2D-PAGE Sample Preparation
| Component | Function | Typical Concentration |
|---|---|---|
| Urea/Thiourea | Protein denaturation and solubilization | 8-9 M Urea; 5-8 M Urea + 2 M Thiourea (for membrane proteins) |
| Non-ionic Detergent (e.g., CHAPS) | Protein solubilization and stabilization | 0.5–4% |
| Reducing Agent (e.g., DTT) | Reduces disulfide bonds | 20 mM–100 mM |
| Carrier Ampholytes | Aid protein solubilization and maintain pH gradient | 0.2–2% |
Ionic detergents like SDS and high salt concentrations interfere with IEF and must be avoided in the first-dimension sample buffer [12].
Mass Spectrometry Identification Strategies
Following 2D-PAGE separation and staining, protein spots of interest are excised, digested, and identified by MS. The two primary MS approaches are Peptide Mass Fingerprinting (PMF) and tandem MS (MS/MS).
Peptide Mass Fingerprinting (PMF) with MALDI-TOF-MS
In PMF, the unknown protein is digested with a protease (e.g., trypsin) to generate a set of peptides. The masses of these peptides are measured using Matrix-Assisted Laser Desorption/Ionization Time-of-Flight Mass Spectrometry (MALDI-TOF-MS) to create a unique "mass fingerprint." This fingerprint is then compared against theoretical digests of proteins in databases for identification [89]. This method is high-throughput and relatively simple but can struggle with complex mixtures or proteins from organisms with incomplete genomic data.
Liquid Chromatography Tandem MS (LC-MS/MS)
For spots that cannot be identified by MALDI-TOF-MS, Liquid Chromatography Tandem Mass Spectrometry (LC-MS/MS) provides a more powerful and sensitive alternative [89]. In this method, peptides are separated by liquid chromatography before being introduced into the mass spectrometer. Individual peptides are isolated, fragmented, and the resulting MS/MS spectra are used to determine peptide sequence information. This sequence data provides a higher confidence identification and is essential for characterizing PTMs [89]. While more laborious and difficult to automate than PMF, LC-MS/MS can successfully identify a larger proportion of excised protein spots [89].
Table 2: Comparison of MS Methods for Protein Identification from 2D-PAGE
| Parameter | MALDI-TOF-MS (PMF) | LC-MS/MS | MALDI-Ion Trap MS/MS |
|---|---|---|---|
| Analytical Principle | Peptide mass matching | Peptide sequencing via fragmentation | Peptide sequencing via fragmentation |
| Typical Instrument | MALDI-TOF | ESI-Quadrupole-TOF or Orbitrap | MALDI-Ion Trap |
| Throughput | High | Moderate | High |
| Sensitivity | High | Very High | Comparable to LC-MS/MS for many proteins |
| Tolerance to Mixtures | Low | High | High |
| Ability to Characterize PTMs | Limited | Excellent | Excellent |
| Key Advantage | Speed, simplicity | Identification confidence, sensitivity | Speed and accuracy comparable to LC-MS/MS |
A comparative study noted that a low-resolution MALDI-Ion Trap MS/MS system offered protein identification accuracy comparable to a high-resolution LC-MS/MS system, with the significant advantage of a dramatically reduced analysis time, albeit while identifying fewer low-abundance proteins [90].
Advanced Integrated Workflows
GeLC-MS and PEPPI-MS for Top-Down Proteomics
While standard 2D-PAGE is typically coupled with bottom-up MS (analyzing digested peptides), recent advances facilitate its integration with top-down proteomics, where intact proteins are analyzed. The traditional GeLC-MS workflow, where an entire SDS-PAGE lane is fractionated and analyzed, has been limited for intact proteins due to low recovery efficiency from polyacrylamide gels.
This challenge was overcome with the development of PEPPI-MS (Passively eluting proteins from polyacrylamide gels as intact species for MS), an innovative passive extraction method that uses Coomassie Brilliant Blue (CBB) as an extraction enhancer [27]. This technique allows for highly efficient recovery of intact proteins across a wide molecular weight range (mean recovery of ~68% for proteins under 100 kDa) in just 10 minutes of shaking [27]. PEPPI-MS enables a simple and inexpensive GeLC-MS workflow for top-down proteomics, allowing researchers to characterize proteoforms directly from gel-based separations.
Virtual 2D Gel/MS
The virtual 2D gel/MS platform represents a novel integration that combines the high-resolution IEF separation of classic 2D-PAGE with the accurate mass measurement of MALDI-MS [91]. In this method:
- Complex protein mixtures are separated by IEF using IPG strips.
- The entire strip is incubated with MALDI matrix and dried into a "xerogel."
- Resolved proteins are directly desorbed and ionized from the xerogel for intact mass measurement using MALDI-TOF MS, which replaces SDS-PAGE as the second dimension [91].
This platform permanently links the intact molecular mass and isoelectric point of a protein, making it exceptionally powerful for detecting and characterizing protein isoforms and PTMs that cause subtle mass or pI shifts [91].
Essential Research Reagent Solutions
Table 3: Key Research Reagent Solutions for 2D-PAGE and MS Integration
| Item | Function/Application | Key Examples |
|---|---|---|
| IPG Strips (Immobilized pH Gradient) | First-dimension IEF separation; provide stable and reproducible pH gradients. | ZOOM IPG Strips (pH 3-10, 4-7, etc.) [12] |
| Protein Stains | Visualize separated protein spots post-electrophoresis; must be compatible with downstream MS. | SYPRO Ruby (fluorescent, high sensitivity), SimplyBlue SafeStain (CBB-based, ready-to-use) [12] |
| Proteases | Enzymatically digest proteins into peptides for mass analysis. | Trypsin (most common) |
| MALDI Matrix | Absorb laser energy and facilitate desorption/ionization of peptide or protein samples for MALDI-MS. | α-cyano-4-hydroxycinnamic acid (CHCA) for peptides |
Experimental Protocol: A Standard 2D-PAGE/MS Workflow
Sample Preparation
- Extract proteins using a method appropriate for your sample (e.g., acetone/TCA precipitation for plant leaves [89]).
- Resuspend the protein pellet in a compatible IEF sample buffer containing urea, a non-ionic detergent (CHAPS), a reducing agent (DTT), and carrier ampholytes [12].
- Determine protein concentration using an assay like Bradford.
First Dimension: Isoelectric Focusing (IEF)
- Load the prepared sample onto an IPG strip (e.g., 7 cm ZOOM IPG Strip with a pH range of 3-10) via passive rehydration.
- Perform IEF using an oil-free system like the ZOOM IPGRunner. A typical protocol can be completed in approximately 3 hours with settings such as: 175 V for 15 min, 175-2000 V gradient for 45 min, and 2000 V for 30 min [12].
Second Dimension: SDS-PAGE
- After IEF, equilibrate the IPG strip in a buffer containing LDS sample buffer and a reducing agent to prepare proteins for the second dimension.
- Place the equilibrated strip onto a pre-cast NuPAGE Bis-Tris gel.
- Run the SDS-PAGE at constant voltage (e.g., 200 V) until the dye front has migrated to the bottom of the gel.
Protein Visualization and Spot Excision
- Stain the gel using an MS-compatible stain like Coomassie Brilliant Blue G-250 or SYPRO Ruby [89] [12].
- Image the gel and excise protein spots of interest using a sterile pipette tip or spot picker.
- Destain the gel pieces and digest the proteins in-gel with trypsin.
Mass Spectrometry Analysis
- For PMF, mix the extracted peptides with MALDI matrix and spot onto a target plate. Acquire mass spectra using a MALDI-TOF mass spectrometer and search the resulting peak list against a protein database using an engine like Mascot [89].
- For LC-MS/MS, separate the extracted peptides by nano-liquid chromatography and analyze them online with an ESI tandem mass spectrometer. Use the acquired MS/MS spectra for database searching.
Workflow and Data Analysis Diagrams
Diagram 1: Standard 2D-PAGE/MS workflow for protein identification.
Diagram 2: Virtual 2D Gel/MS workflow for intact protein analysis.
Two-dimensional polyacrylamide gel electrophoresis (2D-PAGE), which separates complex protein mixtures by independent parameters of isoelectric point and molecular weight, remains a cornerstone technique in proteomics [8]. However, the field is undergoing a significant transformation driven by technological convergence. Automation, Artificial Intelligence (AI), and miniaturization are collectively addressing long-standing challenges in reproducibility, throughput, and data complexity, thereby expanding the application of 2D-PAGE in modern drug development and biomarker discovery.
This document provides detailed application notes and protocols, framing these advancements within the context of a broader thesis on 2D-PAGE research. It is designed to equip researchers, scientists, and drug development professionals with the methodologies and strategic insights needed to leverage these trends.
Quantitative Market and Technology Trends
The following tables summarize key quantitative data reflecting the growth and technological shifts in the broader electrophoresis and related markets, which directly influence 2D-PAGE development and adoption.
Table 1: Electrophoresis Market Size and Growth Projections [92]
| Market Segment | 2025 Market Value (USD Million) | 2035 Projected Market Value (USD Million) | CAGR (2025-2035) |
|---|---|---|---|
| Global Electrophoresis Market | 2,477.5 | 3,702.8 | 4.1% |
Table 2: Key Technology Shifts in the Electrophoresis Market (2020-2035) [92]
| Period | Technological Focus | Key Market Drivers |
|---|---|---|
| 2020-2024 | Automated and high-resolution systems improving accuracy and workflow efficiency. | Genetic studies, forensic sciences, and drug discovery. |
| 2025-2035 | AI-driven platforms, nanopore sequencing, and lab-on-a-chip systems for point-of-care diagnostics. | Personalized medicine, AI-enabled diagnostics, and portable systems. |
The integration of AI is proving to be a transformative force, akin to its impact on adjacent fields. AI aids in the discovery and synthesis of new materials and enhances quality control by identifying defects invisible to the human eye, thereby improving quality and reducing wastage [93]. In the realm of research and development, AI assists in simulating and testing properties under various conditions, reducing the need for physical testing and speeding up the development process [93].
Detailed Experimental Protocols
Protocol 1: Classical 2D-PAGE Combining IEF and SDS-PAGE
This protocol is based on the established method described in Nature Methods [8].
- Objective: To separate a complex protein mixture based on isoelectric point (pI) in the first dimension and molecular weight in the second dimension for high-resolution protein analysis.
- Sample Preparation:
- Lyse cells or tissue in a suitable buffer containing 9.5 M Urea, 2% Nonidet P-40, and carrier ampholytes.
- Centrifuge at high speed to remove insoluble debris.
- Determine protein concentration using a compatible assay (e.g., Bradford assay).
- First Dimension: Isoelectric Focusing (IEF) [8]:
- Gel Preparation: Cast a long, thin tube gel (1.2-mm diameter) composed of 2.7% acrylamide, 9.5 M Urea, 2% Nonidet P-40, and carrier ampholytes to form a pH gradient.
- Loading: Load the solubilized protein sample onto the top of the IEF gel.
- Focusing: Apply a high voltage to focus the proteins until they reach their isoelectric point (no net charge). Monitor the voltage and current to ensure proper focusing.
- Gel Equilibration [8]:
- Following IEF, briefly equilibrate the gel in a sodium dodecyl sulfate (SDS) buffer. This step prepares the proteins for the second dimension and should be completed in a few minutes to minimize diffusion and maintain spot resolution.
- Second Dimension: SDS-PAGE [8]:
- Gel Preparation: Prepare a standard SDS-polyacrylamide slab gel of an appropriate acrylamide concentration for the target protein molecular weight range.
- Transfer: Place the equilibrated IEF gel directly onto the top edge of the SDS-PAGE slab gel, ensuring full contact without air bubbles.
- Electrophoresis: Apply a constant current to separate the proteins based on molecular weight.
- Detection:
- After electrophoresis, stain the gel using a preferred method (e.g., Coomassie Brilliant Blue, silver stain, or fluorescent dyes) to visualize the protein spots.
Protocol 2: Automated and AI-Assisted 2D-PAGE Workflow
This protocol outlines the integration of emerging technologies into the classical workflow.
- Objective: To perform 2D-PAGE with enhanced reproducibility, throughput, and data analysis fidelity through automation and AI.
- Automated Sample Preparation and IEF:
- Utilize robotic liquid handlers for highly reproducible sample preparation and loading.
- Employ integrated IEF systems that automatically manage focusing parameters and gel handling, minimizing manual intervention.
- High-Throughput Second Dimension:
- Use multi-gel tank systems or rapid electrophoresis devices to run multiple slabs in parallel, significantly increasing throughput.
- AI-Powered Imaging and Analysis:
- Image Acquisition: Use high-resolution digital imagers to capture gel images.
- Spot Detection and Matching: Process images using AI-driven software. Machine learning algorithms are trained to accurately detect protein spots, even in cases of low contrast, streaking, or overlapping spots, which are common challenges in traditional analysis [94] [93].
- Quantitative and Statistical Analysis: The software automatically quantifies spot intensities and performs statistical analysis (e.g., to identify differentially expressed proteins between control and test samples) with greater precision and less bias than manual methods.
Visualizing the Integrated Automated Workflow
The following diagram illustrates the logical workflow of the automated and AI-assisted 2D-PAGE protocol, highlighting the critical decision points and automated processes.
The Scientist's Toolkit: Essential Research Reagents and Materials
Table 3: Key Research Reagent Solutions for 2D-PAGE [8]
| Item | Function in Protocol |
|---|---|
| Urea | A chaotropic agent used at high concentration (e.g., 9.5 M) in the IEF gel to denature proteins and maintain solubility. |
| Nonionic Detergent (e.g., Nonidet P-40) | Critical for solubilizing hydrophobic proteins and preventing aggregation during the IEF step. |
| Carrier Ampholytes | A mixture of small, multifunctional molecules that form a stable pH gradient within the IEF gel when an electric field is applied. |
| Acrylamide/Bis-acrylamide | The monomer and crosslinker used to form the porous polyacrylamide gel matrix for both IEF and SDS-PAGE dimensions. |
| Sodium Dodecyl Sulfate (SDS) | A denaturing detergent that binds to proteins uniformly, imparting a negative charge and masking the protein's native charge for separation by molecular weight. |
| AI-Enhanced Analysis Software | Software utilizing machine learning algorithms for automated, high-accuracy spot detection, matching, and quantification, overcoming limitations of traditional software [93]. |
The integration of automation, AI, and miniaturization is propelling 2D-PAGE from a traditionally labor-intensive technique to a robust, high-throughput platform essential for modern proteomics. The presented protocols and trends highlight a clear pathway for researchers to achieve higher reproducibility, manage complex data, and accelerate discovery in drug development. As these technologies mature, their convergence will further solidify the role of 2D-PAGE in the multi-omics landscape, enabling deeper insights into proteome dynamics and facilitating the development of novel therapeutics and biomarkers.
Conclusion
Two-dimensional gel electrophoresis remains an indispensable tool in the proteomics toolbox, offering unparalleled resolution for visualizing complex protein populations and their post-translational modifications. Its unique ability to separate thousands of proteins simultaneously continues to drive discoveries in biomarker identification, drug development, and fundamental biological research. While challenges related to throughput and sensitivity persist, the evolution of the technique—through advancements like 2D-DIGE for superior quantitation, integration with mass spectrometry, and the ongoing development of automated, AI-driven platforms—ensures its continued relevance. The future of 2D-PAGE lies in its adaptation towards greater accessibility, higher throughput, and its synergistic use with complementary omics technologies, solidifying its role in the advancement of personalized medicine and systems biology.
References
- 1. Overview of Two-Dimensional Gel Electrophoresis [https://www.creative-proteomics.com/resource/overview-of-two-dimensional-gel-electrophoresis.htm]
- 2. Two-Dimensional Gel Electrophoresis: Overview & ... [https://www.excedr.com/resources/two-dimensional-gel-electrophoresis]
- 3. Two-dimensional gel electrophoresis [https://grokipedia.com/page/Two-dimensional_gel_electrophoresis]
- 4. A systematic evaluation of sample preparation and 2-D gel ... [https://www.sciencedirect.com/science/article/pii/S2215016124001316]
- 5. 2D SDS PAGE in Combination with Western Blotting and ... [https://link.springer.com/chapter/10.1007/978-3-030-15950-4_33]
- 6. 2-D Fluorescence Difference Gel Electrophoresis (DIGE) in ... [https://www.ncbi.nlm.nih.gov/books/NBK56019/]
- 7. Overview of Protein Electrophoresis [https://www.thermofisher.com/us/en/home/life-science/protein-biology/protein-biology-learning-center/protein-biology-resource-library/pierce-protein-methods/overview-electrophoresis.html]
- 8. Two-dimensional gel electrophoresis of proteins [https://www.nature.com/articles/nmeth0105-83]
- 9. Two dimensional gel electrophoresis is a technique for ... [https://www.letstalkacademy.com/two-dimensional-gel-electrophoresis-technique-for-separating-proteins/]
- 10. Basics and recent advances of two dimensional [https://pmc.ncbi.nlm.nih.gov/articles/PMC3996944/]
- 11. Isoelectric Focusing: Principles, Applications, Advantages ... [https://www.creative-proteomics.com/resource/isoelectric-focusing-principles-applications-advantages-limitations.htm]
- 12. 2D Gel Electrophoresis [https://www.thermofisher.com/us/en/home/life-science/protein-biology/protein-gel-electrophoresis/protein-gels/specialized-protein-gels/2d-gel-electrophoresis.html]
- 13. Protocols for Preparation of Bacterial Samples for 2-D PAGE [https://www.creative-proteomics.com/resource/protocols-for-preparation-of-bacterial-samples-for-2-d-page.htm]
- 14. 4.6. Two-Dimensional Isoelectric Focusing (2D-IEF)/SDS- ... [https://bio-protocol.org/exchange/minidetail?id=4222893&type=30]
- 15. How Does 2D Gel Electrophoresis Work? [https://bitesizebio.com/9606/how-does-2d-gel-electrophoresis-work/]
- 16. The state of the art in the analysis of two-dimensional gel ... [https://pmc.ncbi.nlm.nih.gov/articles/PMC2279157/]
- 17. Protein Gel 2D Electrophoresis Support—Getting Started [https://www.thermofisher.com/us/en/home/technical-resources/technical-reference-library/protein-electrophoresis-western-blotting-support-center/protein-gel-2d-electrophoresis-support/protein-gel-2d-electrophoresis-support-getting-started.html]
- 18. Advantages and Disadvantages of 2D Gel Electrophoresis ... [https://www.mtoz-biolabs.com/advantages-and-disadvantages-of-2d-gel-electrophoresis-image.html]
- 19. 2D Electrophoresis Service – High-Resolution Protein ... [https://www.creative-proteomics.com/services/2d-electrophoresis-2.htm]
- 20. Evaluation of Protocols Used in 2-D Electrophoresis for ... [https://pmc.ncbi.nlm.nih.gov/articles/PMC5054159/]
- 21. Optimization of Large Gel 2D Electrophoresis for Proteomic ... [https://pmc.ncbi.nlm.nih.gov/articles/PMC3822429/]
- 22. 2024 Guide to Quantitative Western Blot Publication [https://www.thermofisher.com/blog/life-in-the-lab/2023-guide-to-quantitative-western-blot-publication/]
- 23. High Resolution Two-Dimensional Electrophoresis of ... [https://pmc.ncbi.nlm.nih.gov/articles/PMC2874754/]
- 24. Two-dimensional gel electrophoresis (2D-GE) [https://www.letstalkacademy.com/two-dimensional-gel-electrophoresis-2d-ge/]
- 25. Evaluation of two-dimensional gel electrophoresis-based ... [https://pmc.ncbi.nlm.nih.gov/articles/PMC16874/]
- 26. Detection of Low-Abundance Proteins in Leaf Extracts ... [https://pmc.ncbi.nlm.nih.gov/articles/PMC3387715/]
- 27. In-depth structural proteomics integrating mass ... [https://www.frontiersin.org/journals/analytical-science/articles/10.3389/frans.2022.1107183/full]
- 28. Reduction and Alkylation of Proteins in 2D Gel ... [https://www.frontiersin.org/journals/chemistry/articles/10.3389/fchem.2017.00059/full]
- 29. Two-Dimensional Gel Electrophoresis-Based Proteomic ... [https://www.nature.com/articles/srep36961]
- 30. A single lysis solution for the analysis of tissue samples ... - PMC [https://pmc.ncbi.nlm.nih.gov/articles/PMC5527781/]
- 31. Principle and Protocol of Isoelectric Focusing Electrophoresis [https://www.creativebiomart.net/resource/principle-protocol-principle-and-protocol-of-isoelectric-focusing-electrophoresis-437.htm]
- 32. The Essential Guide to 2D Electrophoresis - TotalLab [https://totallab.com/resources/guide-to-2d-electrophoresis/]
- 33. Focus on Isoelectric Focusing [https://bitesizebio.com/10912/focus-on-isoelectric-focussing/]
- 34. Exploring imaged capillary isoelectric focusing parameters ... [https://www.frontiersin.org/journals/chemistry/articles/10.3389/fchem.2025.1536222/full]
- 35. Quantitative proteomics: assessing the spectrum of in-gel ... [https://pmc.ncbi.nlm.nih.gov/articles/PMC3022124/]
- 36. Optimization of 2-dimensional gel electrophoresis ... [https://www.spandidos-publications.com/10.3892/mmr.2013.1815]
- 37. SDS-PAGE: A Cornerstone of Protein Analysis in Modern ... [https://www.metwarebio.com/sds-page-protein-analysis/]
- 38. Overview of SDS-PAGE [https://www.creative-proteomics.com/resource/overview-of-sds-page.htm]
- 39. How SDS-PAGE Separates Proteins [https://azurebiosystems.com/blog/how-sds-page-separates-proteins/]
- 40. SDS-PAGE Protocol [https://neutab.creative-biolabs.com/sds-page-analysis.htm]
- 41. Deciphering food proteins: The applications of SDS-PAGE ... [https://www.sciencedirect.com/science/article/abs/pii/S2212429225003025]
- 42. Comparison of in-gel protein separation techniques ... [https://pmc.ncbi.nlm.nih.gov/articles/PMC4234072/]
- 43. Mastering Silver Staining for Protein Gel Analysis [https://www.abcam.com/en-us/knowledge-center/western-blot/silver-staining-protein-gel-detection-guide]
- 44. Coomassie blue staining - Proteins and protein analysis [https://www.abcam.com/en-us/knowledge-center/proteins-and-protein-analysis/coomassie-blue-staining]
- 45. Rapid and easy protein staining for SDS-PAGE using an ... [https://pubmed.ncbi.nlm.nih.gov/16944465/]
- 46. In-gel refolding allows fluorescence detection of fully ... [https://www.sciencedirect.com/science/article/pii/S0003269725000995]
- 47. Silver staining [https://en.wikipedia.org/wiki/Silver_staining]
- 48. Protocol for Silver Staining [https://www.rockefeller.edu/proteomics/protocol-silver-staining/]
- 49. Applications of 2D Gel Electrophoresis [https://www.creative-proteomics.com/resource/applications-of-2d-gel-electrophoresis.htm]
- 50. 2D Gel Electrophoresis Sample Preparation [https://kendricklabs.com/sample-preparation/]
- 51. The Role of Proteomics in Oncology Biomarker Discovery [https://blog.crownbio.com/role-of-proteomics-in-oncology-biomarker-discovery]
- 52. Regulatory Guidelines for the Analysis of Therapeutic ... [https://pmc.ncbi.nlm.nih.gov/articles/PMC11806371/]
- 53. Global Two-dimensional Electrophoresis Market Trends ... [https://infinitymarketresearch.com/report/two-dimensional-electrophoresis-market/18005]
- 54. Quantitative Protein Profiling Using Two-dimensional Gel ... [https://www.sciencedirect.com/science/article/pii/S1535947620346703]
- 55. High-Efficiency Protein Extraction From Lupine Roots [https://pmc.ncbi.nlm.nih.gov/articles/PMC12514137/]
- 56. Comparing Isoelectric Focusing with Gradient SDS-PAGE ... [https://eureka.patsnap.com/report-comparing-isoelectric-focusing-with-gradient-sds-page-efficiency]
- 57. The Two-dimensional Electrophoresis Market Size [https://www.globalgrowthinsights.com/market-reports/two-dimensional-electrophoresis-market-115217]
- 58. Optimize Isoelectric Focusing Parameters for Protein Purification [https://eureka.patsnap.com/report-optimize-isoelectric-focusing-parameters-for-protein-purification]
- 59. Protein Gel Staining: Coomassie, Silver, Fluorescent & More [https://www.creative-proteomics.com/resource/protein-gel-staining-methods.htm]
- 60. Protocols for Preparation of Plant Protein Samples for 2-D ... [https://www.creative-proteomics.com/resource/protocols-for-preparation-of-plant-protein-samples-for-2-d-page.htm]
- 61. Western Blot: The Complete Guide [https://www.antibodies.com/applications/western-blotting]
- 62. On the stability of acid-soluble pea protein ... - RSC Publishing [https://pubs.rsc.org/en/content/articlehtml/2025/ra/d4ra06899h]
- 63. Reduction and Alkylation of Proteins in 2D Gel ... [https://pmc.ncbi.nlm.nih.gov/articles/PMC5559430/]
- 64. Tips to Prevent Streaking on 2-D Gels [https://www.americanlaboratory.com/914-Application-Notes/30736-Tips-to-Prevent-Streaking-on-2-D-Gels/]
- 65. Protein Gel 2D Electrophoresis Support—Troubleshooting [https://www.thermofisher.com/us/en/home/technical-resources/technical-reference-library/protein-electrophoresis-western-blotting-support-center/protein-gel-2d-electrophoresis-support/protein-gel-2d-electrophoresis-support-troubleshooting.html]
- 66. Optimisation of the two-dimensional gel electrophoresis ... [https://pmc.ncbi.nlm.nih.gov/articles/PMC517948/]
- 67. Basics and recent advances of two dimensional [https://clinicalproteomicsjournal.biomedcentral.com/articles/10.1186/1559-0275-11-16]
- 68. Two-Dimensional Gel Electrophoresis - an overview [https://www.sciencedirect.com/topics/neuroscience/two-dimensional-gel-electrophoresis]
- 69. Troubleshooting SDS-PAGE Gel Running Issues [https://www.goldbio.com/blogs/articles/troubleshooting-sds-page-gel-running-issues?srsltid=AfmBOopuHoDyhWsYrHuo4b7tr2SCHT86lxRPPJYkVaUmFaUhtvovYY16]
- 70. Troubleshooting Sodium Dodecyl Sulfate- Polyacrylamide ... [https://www.hycultbiotech.com/sds-page/troubleshooting/]
- 71. SDS-PAGE Troubleshooting: Why Are My Protein Bands ... [https://synapse.patsnap.com/article/sds-page-troubleshooting-why-are-my-protein-bands-fuzzy]
- 72. Trouble Shooting of SDS PAGE Analysis | PDF [https://www.slideshare.net/slideshow/trouble-shooting-of-sds-page-analysis/4778793]
- 73. Coomassie Staining SDS-PAGE: Common Issues & Fixes [https://thesiliconreview.com/2025/05/troubleshooting-coomassie-blue-staining-in-sds-page-common-issues-and-fixes]
- 74. Two-dimensional fluorescence difference gel ... [https://pmc.ncbi.nlm.nih.gov/articles/PMC2001252/]
- 75. DIGE - Technique, advantages and application in Melanie [https://2d-gel-analysis.com/starters-guides/dige-guide/]
- 76. 2D fluorescence difference gel analysis technology [https://pubmed.ncbi.nlm.nih.gov/15900442/]
- 77. Advantages and Disadvantages of 2D-DIGE-Based Protein ... [https://www.mtoz-biolabs.com/advantages-and-disadvantages-of-2d-dige-based-protein-quantification.html]
- 78. Two-Dimensional Difference Gel Electrophoresis (2D DIGE) [https://azurebiosystems.com/western-blotting-applications/2d-dige/]
- 79. 2D Gel Electrophoresis [https://www.appliedbiomics.com/2d-dige/2d-gel-different-staining/]
- 80. Application of two-dimensional difference gel electrophoresis ... [https://journals.plos.org/plosone/article?id=10.1371/journal.pone.0268073]
- 81. Stabilization of Native Protein–Protein Interactions with ... [https://pmc.ncbi.nlm.nih.gov/articles/PMC12444995/]
- 82. and clear-native polyacrylamide gel electrophoresis protocols ... [https://journals.plos.org/plosone/article?id=10.1371/journal.pone.0332065]
- 83. Comparative Skeletal Muscle Proteomics Using Two ... [https://pmc.ncbi.nlm.nih.gov/articles/PMC5217355/]
- 84. Two-dimensional gel electrophoresis in the light of new ... [https://www.sciencedirect.com/science/article/abs/pii/S0165993613002380]
- 85. What Room for Two-Dimensional Gel-Based Proteomics in ... [https://www.mdpi.com/2227-7382/8/3/17]
- 86. High-throughput proteomics: a methodological mini-review [https://www.nature.com/articles/s41374-022-00830-7]
- 87. Comparative analysis of MS/MS search algorithms in label- ... [https://www.sciencedirect.com/science/article/pii/S2949771X25000337]
- 88. Capillary Gel Electrophoresis: An Alternative to SDS-PAGE? [https://bitesizebio.com/24080/capillary-gel-electrophoresis-an-alternative-to-sds-page/]
- 89. Separation and identification of soybean leaf proteins by ... [https://www.sciencedirect.com/science/article/abs/pii/S0031942206005668]
- 90. Comparison of MS/MS Methods for Protein Identification ... [https://pubmed.ncbi.nlm.nih.gov/16944941/]
- 91. Combining High-throughput MALDI-TOF Mass ... [https://pmc.ncbi.nlm.nih.gov/articles/PMC4930893/]
- 92. Electrophoresis Market Size & Industry Demand 2025-2035 [https://www.futuremarketinsights.com/reports/electrophoresis-market]
- 93. 2D Materials Market Report | Global Forecast From 2025 ... [https://dataintelo.com/report/2d-materials-market]
- 94. 2D Barcode Reader Market 2025: Artificial Intelligence ... [https://www.linkedin.com/pulse/2d-barcode-reader-market-2025-artificial-intelligence-0fpqf]