The Molecular Mechanism of SDS: How Denaturation and Uniform Charge Enable Protein Analysis
This article provides a comprehensive examination of how Sodium Dodecyl Sulfate (SDS) denatures proteins and imparts a uniform negative charge, a foundational process in techniques like SDS-PAGE.
The Molecular Mechanism of SDS: How Denaturation and Uniform Charge Enable Protein Analysis
Abstract
This article provides a comprehensive examination of how Sodium Dodecyl Sulfate (SDS) denatures proteins and imparts a uniform negative charge, a foundational process in techniques like SDS-PAGE. Tailored for researchers, scientists, and drug development professionals, we explore the foundational biophysics of SDS-protein interactions, detail methodological applications and protocols, address common troubleshooting scenarios, and validate the mechanism through comparative analysis with alternative techniques. By synthesizing current research and practical insights, this resource aims to enhance experimental design and data interpretation in protein analysis for biomedical and clinical research.
The Biophysics of SDS: Unraveling Denaturation and Charge Mechanisms
Molecular Structure and Fundamental Properties
Sodium dodecyl sulfate (SDS), also known as sodium lauryl sulfate, is an organic compound with the chemical formula CH₃(CH₂)₁₁OSO₃Na and the linear structure H₃C−(CH₂)11−O−S(=O)2−O−Na⁺ [1]. As an anionic surfactant, SDS possesses a distinct amphiphilic structure consisting of a 12-carbon hydrocarbon tail (hydrophobic) and a sulfate group connected via an ester linkage to a sodium counter-ion (hydrophilic headgroup) [1]. This fundamental architecture is responsible for its widespread utility in cleaning products, hygiene formulations, and scientific research.
The hydrophobic alkyl chain interacts favorably with non-polar substances, while the hydrophilic sulfate group confers water solubility and surface-active properties. The sodium counter-ion dissociates in aqueous solution, rendering the headgroup strongly anionic. This amphiphilic nature enables SDS to interact with biological membranes, proteins, and lipids, facilitating its role as a powerful detergent and denaturant [2].
Table 1: Key Physicochemical Properties of Sodium Dodecyl Sulfate
| Property | Value / Description | Reference |
|---|---|---|
| Molar Mass | 288.372 g/mol | [1] |
| Appearance | White or cream-colored solid, odorless | [1] |
| Melting Point | 206 °C (403 °F; 479 K) | [1] |
| Critical Micelle Concentration (CMC) | 8.2 mM at 25 °C | [1] |
| Aggregation Number | ~62 molecules per micelle at CMC | [1] |
| Micelle Ionization Fraction (α) | ~0.3 (30%) | [1] |
The critical micelle concentration (CMC)—the concentration at which surfactant monomers spontaneously assemble into micelles—is a fundamental property of SDS [1]. Below the CMC, SDS molecules exist as monomers, while above it, they form spherical or cylindrical aggregates called micelles, with the hydrophobic tails oriented inward and the hydrophilic heads facing the aqueous environment. This micelle formation is crucial for many of its applications, particularly in protein denaturation.
The Mechanism of SDS-Induced Protein Denaturation
Molecular Interaction and Unfolding
The denaturation of proteins by SDS occurs through a multi-stage process driven by specific molecular interactions. The mechanism is concentration-dependent, involving discrete steps from initial binding to complete unfolding [3] [4] [5]. At low, submicellar concentrations, SDS monomers initially bind to proteins primarily through hydrophobic interactions with non-polar amino acid residues [3] [5]. This initial binding disrupts some tertiary structure but may not cause complete unfolding.
As the SDS concentration increases to micellar levels (above ~8 mM), the interaction becomes predominantly hydrophobic and more extensive [3]. SDS micelles asymmetrically attack the protein structure, leading to further disruption of non-covalent bonds—including hydrogen bonds and hydrophobic interactions—that maintain secondary and tertiary structures [4] [6]. The polypeptide chain progressively unfolds, wrapping around or decorating the surface of the micelles in a core-shell arrangement, rather than being surrounded by micelles (the "beads-on-a-string" model) [4]. Current research, combining small-angle X-ray scattering (SAXS) and molecular dynamics simulations, decisively supports this core-shell model where the denatured protein covers the micelle surface [4].
Charge Impartation and Electrophoretic Mobility
A critical consequence of SDS binding is the impartation of a uniform negative charge to proteins. SDS binds to the hydrophobic backbone of proteins in a near-constant ratio of approximately 1.4 g of SDS per 1 g of protein, which translates to roughly one SDS molecule per two amino acid residues [2]. Each SDS molecule contributes a strong negative charge via its sulfate group, effectively overwhelming the intrinsic charge of the protein [6] [2].
This results in a consistent charge-to-mass ratio across different polypeptides. When subjected to an electric field, these SDS-protein complexes migrate through a polyacrylamide gel matrix at rates inversely proportional to the logarithm of their molecular mass, forming the basis for molecular weight determination via SDS-Polyacrylamide Gel Electrophoresis (SDS-PAGE) [6] [2]. The expanded, rod-like conformation of the denatured protein complex further ensures that separation is based primarily on polypeptide chain length rather than native charge or shape [2].
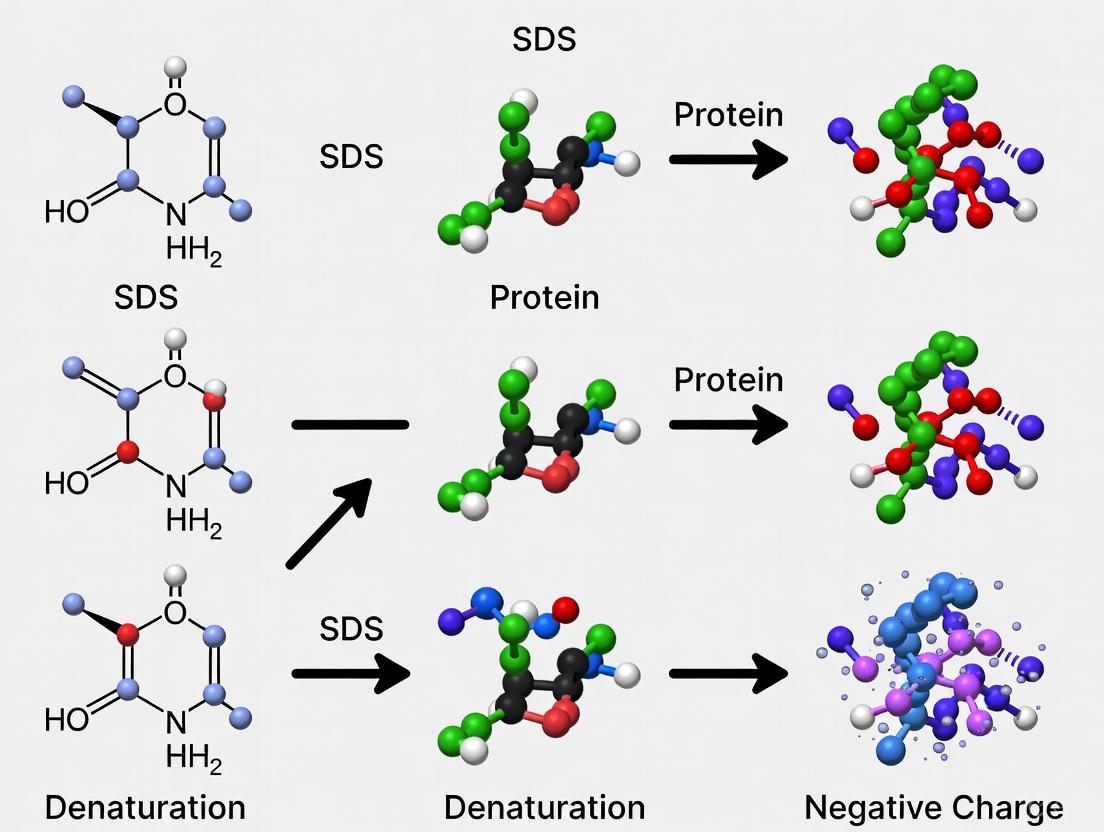
Diagram 1: Mechanism of SDS-induced protein denaturation and charge impartation.
Experimental Protocols and Methodologies
Standard SDS-PAGE Protocol for Protein Separation
SDS-Polyacrylamide Gel Electrophoresis (SDS-PAGE) is the quintessential application for separating proteins based on subunit molecular weight [6] [2]. The following protocol details the standard denaturing method.
Sample Preparation:
- Denaturation: Mix the protein sample with an SDS-containing sample loading buffer. A common formulation includes 2% SDS, 50-100 mM Tris buffer (pH ~6.8), 10% glycerol (for density), 0.02% Bromophenol Blue (tracking dye), and 1-5% 2-mercaptoethanol or DTT (reducing agent) [7] [2].
- Heating: Heat the mixture at 70-100 °C for 5-10 minutes. This heat, combined with SDS and reducing agents, disrupts hydrogen bonds, hydrophobic interactions, and disulfide bridges, ensuring complete denaturation and reduction of the protein into its constituent polypeptides [7] [2].
Gel Preparation:
- Matrix: Prepare a discontinuous polyacrylamide gel system, typically consisting of a resolving gel (e.g., 10-12% acrylamide) overlaid with a stacking gel (e.g., 4-5% acrylamide) [7] [6]. The resolving gel has a higher acrylamide concentration and a defined pore size for molecular sieving, while the stacking gel has larger pores to concentrate all proteins into a sharp band before entering the resolving gel.
- Buffers: The running buffer is typically Tris-based and contains 0.1% SDS and glycine, maintaining a pH (~8.3) conducive to electrophoresis [7].
Electrophoresis and Visualization:
- Run: Load the denatured samples into the wells and apply a constant voltage (150-200 V). The negatively charged SDS-protein complexes migrate toward the anode. Smaller polypeptides migrate faster through the gel matrix [6].
- Stain: After electrophoresis, proteins are visualized using stains like Coomassie Brilliant Blue or silver stain, appearing as distinct bands on the gel [6].
Diagram 2: SDS-PAGE experimental workflow for protein separation.
Native SDS-PAGE for Functional Analysis
A modification of the standard protocol, termed Native SDS-PAGE (NSDS-PAGE), allows for high-resolution separation while retaining protein function and bound metal ions [7]. This method involves:
- Sample Buffer: Omitting SDS and EDTA from the sample buffer and removing the heating step [7].
- Running Buffer: Reducing the SDS concentration from the standard 0.1% to 0.0375% and deleting EDTA [7].
- Result: This gentle treatment preserves the native state of proteins, with studies showing zinc retention increasing from 26% to 98% and most model enzymes retaining their activity post-electrophoresis [7].
Studying Denaturation Kinetics
Stopped-flow kinetic experiments coupled with techniques like SAXS can probe the dynamics of SDS-induced unfolding [3] [4]. The methodology involves:
- Rapid Mixing: Using a stopped-flow apparatus to rapidly mix a protein solution with an SDS solution.
- Time-Resolved Data Collection: Immediately collecting time-resolved structural data via SAXS or fluorescence.
- Analysis: The data reveals an asymmetric attack by SDS micelles on the protein, followed by distribution of the unfolded chain around the micelle, with compactness continuing to evolve at higher SDS concentrations [4].
Research Reagents and Materials
Table 2: Essential Research Reagents for SDS-Based Experiments
| Reagent / Material | Function / Application | Technical Notes |
|---|---|---|
| SDS (Powder/Pellets) | Primary denaturant and charge provider. | Available in various purity grades; prepare 10-20% (w/v) stock solutions [2]. |
| Acrylamide/Bis-acrylamide | Form the porous gel matrix for SDS-PAGE. | Crosslinker ratio controls pore size; a 29:1 or 37.5:1 ratio of acrylamide to bis-acrylamide is common [6]. |
| Tris Buffers | Maintain pH during electrophoresis. | Different pH for stacking (∼6.8) and resolving (∼8.8) gels create a discontinuous system [7]. |
| 2-Mercaptoethanol (2-ME) or DTT | Reducing agents that break disulfide bonds. | Ensures proteins are fully denatured into individual polypeptide chains [2]. |
| Coomassie Brilliant Blue R-250 | Protein stain for visualizing bands post-electrophoresis. | Binds non-specifically to proteins; detection limit ~100 ng [6]. |
| Pre-stained Protein Standards | Molecular weight markers for estimating protein size. | Contain proteins of known mass conjugated to visible dyes for tracking migration. |
| Non-ionic Detergents (e.g., Triton X-100) | Used to refold SDS-denatured proteins. | Strip SDS from proteins by forming mixed micelles, allowing refolding studies [4]. |
Advanced Research Applications
SDS finds utility beyond standard protein denaturation, enabling sophisticated research applications:
- Fractionation of Protein Aggregates: Low concentrations of SDS (e.g., 0.1%) are effective in separating soluble and insoluble neuropathological fibrillar proteins, such as tau, without causing complete dissolution [5]. This facilitates the study of protein aggregation associated with neurodegenerative diseases.
- Decellularization: Tissues and organs for grafting can be treated with low-concentration SDS to remove host cell-derived proteins and nucleic acids while preserving the native extracellular matrix (ECM) architecture. This reduces immune response in recipients and promotes tissue regeneration [5].
- Refolding Studies: SDS denaturation is often reversible. Adding non-ionic surfactants can absorb SDS into mixed micelles, freeing the protein to refold. This provides a model system for studying protein folding pathways and mechanisms [4].
- CLARITY Technique: In neuroscience, SDS is used to remove lipids from brain tissue fixed in a hydrogel mesh. This process renders the tissue quasi-transparent for optical microscopy while preserving macromolecular structures, enabling high-resolution 3D imaging [1].
- Material Science: The air-entraining performance of proteins in construction materials like cement can be enhanced by pre-unfolding them with SDS or lignin. This controlled denaturation alters protein surface activity and foaming properties, improving freeze-thaw durability in the final material [8].
Sodium dodecyl sulfate remains an indispensable tool in scientific research due to its unique structural properties and predictable interactions with biomolecules. Its ability to uniformly denature proteins and impart charge underpins foundational techniques like SDS-PAGE, while nuanced applications at different concentrations continue to expand its utility in biochemistry, structural biology, and biotechnology. The core-shell model of SDS-protein complexes provides a robust mechanistic framework for understanding and exploiting this molecule's behavior, ensuring its continued relevance in protein research and drug development.
Sodium dodecyl sulfate (SDS) stands as one of the most powerful and ubiquitous denaturing agents in protein science. Its ability to systematically dismantle native protein structures and impart a uniform negative charge underpins foundational techniques like SDS-PAGE. This whitepaper delves into the molecular mechanisms by which SDS achieves protein denaturation, examining the stoichiometric and micellar binding interactions that disrupt secondary and tertiary structures. Furthermore, we explore the nuanced effects of SDS concentration, revealing that low concentrations can facilitate unique applications like protein fractionation and decellularization without complete unfolding. Through a synthesis of recent research, biophysical analyses, and molecular dynamics simulations, this guide provides a comprehensive technical resource for researchers leveraging SDS in protein analysis, characterization, and drug development.
Sodium dodecyl sulfate (SDS) is an anionic surfactant featuring a 12-carbon alkyl tail attached to a sulfate head group, granting it amphiphilic properties [5] [9]. This molecular structure is fundamental to its protein-denaturing capabilities. SDS is arguably the most widely used detergent in molecular biology and biotechnology, with applications spanning cell lysis, protein solubilization, gel electrophoresis, and suppression of protein aggregation [5]. Its most renowned application is in SDS-polyacrylamide gel electrophoresis (SDS-PAGE), where it denatures proteins and confers a negative charge proportional to their molecular weight, enabling separation based primarily on size [10] [11].
The interaction between SDS and proteins is complex and concentration-dependent. At high concentrations (typically 1-2%), which are well above the critical micelle concentration (CMC), SDS fully denatures and dissociates proteins, making it indispensable for analytical techniques requiring complete unfolding [5]. In contrast, lower concentrations of SDS (e.g., 0.1%) can be employed for more subtle manipulations, such as decellularization and fractionation of aggregated proteins, highlighting the nuanced application of this detergent based on understanding its mechanism [5]. The CMC of SDS varies with ionic strength but typically lies around 4.3 mM in standard electrophoresis buffers [12]. This concentration threshold marks the shift from molecular to micellar interactions, which have distinct effects on protein structure.
Molecular Mechanisms of SDS-Induced Denaturation
The Dual-Phase Mechanism of SDS Binding
The denaturation of proteins by SDS proceeds through a coordinated, multi-stage mechanism primarily driven by hydrophobic and ionic interactions. The process can be conceptually divided into two major and discrete events: tertiary structure unfolding in the submicellar concentration range, and protein chain expansion at micellar concentrations [3].
Initial Binding and Tertiary Unfolding: At concentrations below the CMC, monomeric SDS molecules bind to the protein through predominantly hydrophobic interactions. The alkyl chains of SDS associate with hydrophobic patches on the protein surface, while the anionic sulfate groups interact with positively charged amino acid side chains (e.g., lysine, arginine) [9]. This initial binding disrupts the delicate balance of forces maintaining the tertiary structure, leading to the loss of native conformation. Studies on ferrocytochrome c demonstrate that this submicellar binding is sufficient to cause tertiary structure unfolding without complete loss of secondary structure [3].
Micellar Binding and Chain Expansion: As SDS concentration increases above the CMC, the nature of the interaction shifts. Protein-bound SDS micelles form, creating extensive hydrophobic domains that further disrupt protein organization. At this stage, the binding becomes exclusively hydrophobic [3]. The protein chain undergoes substantial expansion driven by coulombic repulsion between the negatively charged protein-bound micelles and anionic amino acid side chains [3]. This repulsive force stretches the polypeptide chain into an extended conformation, completing the denaturation process.
Structural Consequences of SDS Binding
Table 1: Structural Consequences of SDS Binding at Different Concentrations
| SDS Concentration | Binding Mode | Structural Impact | Resulting Protein State |
|---|---|---|---|
| Below CMC (< 4.3 mM) | Monomeric, stoichiometric | Disruption of tertiary structure | Molten globule-like state with retained secondary structure |
| Near CMC | Mixed monomeric and micellar | Loss of some secondary structure | Partially unfolded intermediate states |
| Above CMC (> 8.2 mM) | Predominantly micellar | Complete unfolding and chain expansion | Extended polypeptide chain with rod-like geometry |
The binding of SDS to proteins results in a characteristic structural transformation. Research indicates that SDS can induce or stabilize α-helical structures in certain proteins, particularly at concentrations near the CMC [9]. For instance, studies on human ubiquitin have shown that increasing SDS counts in ubiquitin-SDS complexes (e.g., ubiquitin-SDS({11}), ubiquitin-SDS({25})) increases the alpha-helical content relative to the native structure [9].
However, under the forcing conditions of standard SDS-PAGE (typically 2% SDS, ≈70 mM), most proteins converge to a similar extended structure where their electrophoretic mobility becomes largely proportional to their molecular size [5] [12]. In this final state, proteins bind approximately 1.4 g of SDS per gram of protein, corresponding to roughly one SDS molecule per two amino acids [12]. This extensive coating with SDS molecules is crucial for imparting a uniform negative charge density, which enables molecular weight estimation during electrophoresis.
Diagram 1: Molecular mechanism of SDS-induced protein denaturation. The process proceeds through distinct stages of binding and structural disruption, culminating in a fully unfolded, negatively charged state.
Quantitative Aspects of SDS-Protein Interactions
Concentration-Dependent Effects
The effects of SDS on protein structure are profoundly concentration-dependent, a principle that enables diverse applications across protein science. The table below summarizes key transitions and their experimental implications based on SDS concentration.
Table 2: SDS Concentration-Dependent Effects on Proteins
| SDS Concentration | Molar Equivalent | Physicochemical Effect | Protein Structural State | Primary Applications |
|---|---|---|---|---|
| 0.01-0.1% | ~0.35-3.5 mM | Selective hydrophobic binding; minimal charge neutralization | Native-like with possible localized unfolding | Membrane protein studies; antigen extraction with epitope retention [5] |
| 0.1% | ~3.5 mM | Intermediate binding between negligible and extensive | Stable intermediate states; partial unfolding | Decellularization; fractionation of aggregated proteins [5] |
| Critical Micelle Concentration (CMC) | 4.3-8.2 mM* | Micelle formation begins; cooperative binding | Significant secondary structure changes | Study of folding intermediates; intrinsically disordered proteins [5] [12] |
| 0.1-1% | ~3.5-35 mM | Mixed monomeric and micellar binding | Progressive unfolding with stable intermediates | Capillary electrophoresis studies; kinetic unfolding analysis [12] |
| 1-2% | ~35-70 mM | Saturated micellar binding; complete coating | Fully unfolded and extended polypeptides | Standard SDS-PAGE; proteomic analysis [5] [11] |
*CMC varies with buffer composition, ionic strength, and temperature [12].
The diversity of protein responses to SDS is remarkable. Capillary electrophoresis studies have revealed that proteins differ significantly in the SDS concentrations at which they denature, in their rates of unfolding, and in the profiles of their denaturation pathways [12]. Some proteins undergo complete unfolding, while others form stable intermediate states or exhibit specific association patterns with SDS. These differences can be exploited to characterize and differentiate proteins in complex mixtures.
Kinetics and Pathways of Unfolding
The unfolding of proteins in SDS is not always instantaneous but can proceed through distinct kinetic pathways. The rate of unfolding varies significantly between proteins, with some undergoing rapid denaturation while others maintain intermediate states for extended periods [12]. This kinetic complexity provides valuable information about protein stability and folding landscapes.
The hysteresis observed in equilibrium folding titrations of some membrane proteins highlights the kinetic barriers to (un)folding in the presence of SDS. For instance, studies on outer membrane proteins (OMPs) have shown that negative charges in extracellular loops and periplasmic turns can create significant energy barriers to folding and unfolding [13]. Neutralization of these charges, either by low pH or mutation, can collapse this hysteresis by reducing the energetic penalty of transferring charged groups through the hydrophobic membrane core [13].
Experimental Methodologies and Applications
Standard SDS-PAGE Protocol
SDS-PAGE remains the cornerstone application of SDS in protein science. The following detailed protocol ensures effective denaturation and separation of protein mixtures:
Sample Preparation:
- Denaturation Buffer: Combine protein sample with 5x SDS-PAGE sample buffer (typically containing 2% SDS, 5-10% glycerol, 62.5 mM Tris-HCl pH 6.8, 0.01% bromophenol blue) [11].
- Reducing Agent: Add fresh β-mercaptoethanol (5%) or dithiothreitol (DTT, 0.2 M) to reduce disulfide bonds [10].
- Heat Denaturation: Boil samples at 95°C for 5-10 minutes to ensure complete denaturation [11].
- Cooling and Loading: Briefly centrifuge samples to consolidate condensation before loading into gel wells.
Gel Preparation and Electrophoresis:
- Gel Composition: Prepare discontinuous gels with stacking gel (pH ~6.8) and resolving gel (pH ~8.8) at appropriate acrylamide concentrations for target protein sizes [11].
- Electrophoresis Conditions: Run gels at constant voltage (200V for minigels) until dye front reaches bottom, using MOPS or Tris-glycine running buffer with 0.1% SDS [7] [11].
Troubleshooting Common Issues:
- Smeared Bands: Ensure fresh reducing agents and complete denaturation; avoid high salt concentrations (>500 mM) [10].
- Unexpected Bands: Include protease inhibitors to prevent degradation; use phosphatase inhibitors if studying phosphoproteins [10].
- "Smiling" Bands: Check running buffer composition and run at appropriate voltage to prevent overheating [10].
Native SDS-PAGE (NSDS-PAGE)
A significant advancement in SDS-based methodologies is the development of Native SDS-PAGE (NSDS-PAGE), which achieves high-resolution separation while retaining native protein features. This modification involves:
Key Modifications to Standard Protocol:
- Reduced SDS: Running buffer contains 0.0375% SDS instead of 0.1% [7].
- Elimination of Denaturing Steps: Omission of SDS and EDTA from sample buffer and removal of the heating step [7].
- Alternative Sample Buffer: 100 mM Tris HCl, 150 mM Tris base, 10% glycerol, 0.01875% Coomassie G-250, 0.00625% Phenol Red, pH 8.5 [7].
Applications and Advantages: NSDS-PAGE enables retention of Zn²⁺ in metalloproteins (increasing from 26% to 98% compared to standard SDS-PAGE) and preserves enzymatic activity in 7 of 9 model enzymes tested [7]. This method bridges the gap between the high resolution of denaturing SDS-PAGE and the native state preservation of BN-PAGE, making it particularly valuable for metalloprotein analysis and functional studies.
The Scientist's Toolkit: Essential Reagent Solutions
Table 3: Key Research Reagent Solutions for SDS-Based Protein Analysis
| Reagent Solution | Standard Composition | Function in Protein Analysis | Technical Considerations |
|---|---|---|---|
| 5x SDS-PAGE Sample Buffer | 2% SDS, 10% glycerol, 62.5 mM Tris-Cl pH 6.8, 0.01% bromophenol blue [11] | Denatures proteins and provides tracking dye for electrophoresis | Add fresh reducing agent (DTT/β-mercaptoethanol) before use; boil samples 5-10 min |
| 30% Acrylamide/Bis Solution | 30% acrylamide, 0.8% bis-acrylamide [11] | Forms polyacrylamide gel matrix for molecular sieving | Neurotoxic when unpolymerized; degas and filter for consistent polymerization |
| Electrophoresis Running Buffer | 25 mM Tris, 192 mM glycine, 0.1% SDS, pH 8.3 [10] | Provides conductive medium for protein separation | Can be reused 2-3 times; SDS concentration critical for charge uniformity |
| NSDS-PAGE Running Buffer | 50 mM MOPS, 50 mM Tris Base, 0.0375% SDS, pH 7.7 [7] | Enables separation with retained native features | Lower SDS concentration preserves some native structure and metal binding |
| Coomassie Staining Solution | 0.05% Coomassie Brilliant Blue R-250, 40% ethanol, 10% acetic acid [11] | Visualizes separated protein bands after electrophoresis | Less sensitive than silver stain but quantitative; compatible with downstream analysis |
Diagram 2: Experimental workflow for SDS-based protein analysis. The method branches at the gel selection stage to accommodate either denaturing or native separation objectives, culminating in application-specific analysis.
Advanced Research Applications and Innovations
Novel Applications of Low SDS Concentrations
While high SDS concentrations are well-established for complete denaturation, recent research has revealed valuable applications of low SDS concentrations (0.01-0.1%) that exploit partial or selective denaturation:
Protein Fractionation and Aggregate Separation: Low concentration SDS (0.1%) demonstrates unique capabilities in fractionating aggregated proteins while retaining partial structure and function. This approach has proven particularly valuable for handling neuropathological fibrillar proteins, including tau and other microtubule-associated proteins [5].
Decellularization for Tissue Engineering: In tissue decellularization protocols, 0.1% SDS effectively removes host cell-derived proteins and nucleic acids from donor tissues without damaging the extracellular matrix (ECM) [5]. This application capitalizes on the intermediate binding effects of SDS at this concentration, which appears to be sufficient for cellular component removal while preserving structural ECM components for grafting procedures.
Antigen Extraction with Epitope Preservation: The extraction of antigens with low SDS concentration can retain antigenic epitopes that would be destroyed by complete denaturation [5]. This application is particularly valuable in immunology and antibody development, where maintaining native structural elements is essential for generating specific immunological responses.
Biophysical Insights from Molecular Dynamics Simulations
Recent molecular dynamics (MD) simulation studies have provided atomistic-level insights into SDS-protein interactions. Simulations of human ubiquitin in SDS solutions at different temperatures revealed that:
- At 300 K, ubiquitin retains its native-like structure in the presence of SDS and pure water [9].
- At elevated temperatures (370 K), SDS molecules disrupt the first hydration shell and expand the hydrophobic core of ubiquitin, resulting in complete protein unfolding [9].
- Both SDS and elevated temperature are required to induce a completely unfolded state under ambient conditions [9].
These simulations also demonstrated that SDS self-assembly and the resulting protein conformation significantly affect partial atomic charges, highlighting the complex electrostatic interplay in SDS-protein complexes [9].
Charge Neutralization as a Fundamental Principle
The mechanism of SDS denaturation extends beyond simple detergent action to encompass fundamental principles of charge neutralization. Research on reflectin proteins has demonstrated that charge neutralization—whether achieved by anionic screening with salt, pH titration, or phosphorylation—serves as the proximate driver of protein assembly [14]. The precise proportionality between assembly size and charge neutralization enables fine-tuned biological regulation, with implications for nanostructured biological machines and adaptive materials [14].
This charge regulation principle provides a unifying framework for understanding diverse protein-denaturant interactions. The effectiveness of divalent cations like Ca²⁺ in driving reflectin assembly at half the concentration required for monovalent Na⁺ unequivocally demonstrates that charge screening, rather than specific chemical interactions, drives the assembly process [14].
Sodium dodecyl sulfate remains an indispensable tool in protein science, with its denaturing power stemming from a sophisticated interplay of hydrophobic binding and charge interactions. The molecular mechanism proceeds through defined stages—initial hydrophobic binding, tertiary structure disruption, micellar complex formation, and finally chain expansion through coulombic repulsion. This systematic denaturation process, coupled with uniform charge conferral, enables high-resolution protein separation by SDS-PAGE.
The concentration-dependent effects of SDS reveal remarkable nuance, with low concentrations facilitating specialized applications like protein fractionation and decellularization, while higher concentrations achieve complete denaturation for analytical purposes. Innovations like Native SDS-PAGE demonstrate that modified SDS protocols can preserve metal binding and enzymatic activity while maintaining high-resolution separation.
Advanced biophysical techniques, including molecular dynamics simulations and careful equilibrium studies, continue to refine our understanding of SDS-protein interactions. The emerging recognition of charge neutralization as a fundamental driver of protein assembly and denaturation provides a unifying principle with broad implications for both basic protein science and applied drug development. As research progresses, the strategic application of SDS across concentration gradients will undoubtedly yield further insights into protein folding, stability, and function.
Sodium Dodecyl Sulfate-Polyacrylamide Gel Electrophoresis (SDS-PAGE) stands as a cornerstone technique in molecular biology and biochemistry, enabling the separation of proteins based almost exclusively on their molecular weight. [15] This separation is made possible by the unique properties of the anionic detergent sodium dodecyl sulfate (SDS), which binds to proteins in a consistent weight ratio of approximately 1.4 grams of SDS per 1 gram of protein. [16] [17] This critical binding ratio is responsible for conferring a uniform negative charge density to denatured polypeptides, effectively masking the proteins' intrinsic electrical charges and creating a near-identical charge-to-mass ratio across different protein species. [15] [18] Within the context of protein denaturation research, this binding ratio represents a fundamental mechanistic principle that enables the transformation of complex three-dimensional protein structures into linear, negatively charged SDS-polypeptide complexes whose electrophoretic mobility depends primarily on polypeptide chain length rather than native conformation or intrinsic charge. [3] [9]
Molecular Mechanism of SDS-Induced Protein Denaturation
Stages of SDS-Protein Interaction
The denaturation of proteins by SDS occurs through a multi-stage process that begins with initial surfactant binding and progresses through complete unfolding and micelle formation. Research by Bhuyan (2010) demonstrates that tertiary structure unfolding in the submicellar range and chain expansion in the micellar range of SDS concentrations represent two major discrete events in the perturbation of protein structure. [3]
Table: Stages of SDS-Protein Interaction
| Interaction Stage | SDS Concentration Range | Molecular Events | Structural Outcome |
|---|---|---|---|
| Initial Binding | Below CMC (~1-2 mM) | SDS monomers bind hydrophobic patches; electrostatic interactions with positive residues [5] [9] | Partial unfolding; retention of some secondary structure |
| Cooperative Unfolding | Near CMC (~2-4 mM) | Cooperative binding exposes hydrophobic core; disruption of tertiary structure [16] | Loss of native conformation; secondary structure transitions |
| Micellar Binding | Above CMC (~4-8 mM) | SDS micelles bind polypeptide chain; maximal SDS binding achieves 1.4:1 ratio [16] [17] | Complete unfolding; formation of rod-like protein-SDS complexes |
The denaturation process begins with the disruption of the protein's native structure. SDS molecules initially interact with hydrophobic patches on the protein surface through their aliphatic chains while the sulfate head groups form electrostatic interactions with positively charged amino acid residues. [9] As SDS binding progresses, the protein undergoes cooperative unfolding, exposing its hydrophobic core and allowing additional SDS molecules to bind. Molecular dynamics simulations reveal that SDS molecules disrupt the first hydration shell and expand the hydrophobic core of proteins, resulting in complete unfolding, particularly at elevated temperatures. [9]
Driving Forces Behind the 1.4g/g Binding Ratio
The remarkable consistency of the 1.4:1 SDS-to-protein binding ratio across most globular proteins stems from the amphipathic nature of SDS and the fundamental structure of polypeptides. This binding ratio corresponds to approximately one SDS molecule per two amino acid residues. [18] The hydrophobic effect provides the major driving force for this interaction, with SDS aliphatic chains associating with nonpolar protein segments, while the sulfate head groups remain exposed to the aqueous environment. [3] Notably, studies with charge-neutralized proteins have demonstrated that SDS can unfold proteins completely lacking charged side chains, indicating that formal protein charges are not absolutely required for SDS-induced unfolding, though they significantly influence binding kinetics. [16]
At the molecular level, the 1.4:1 binding ratio represents a saturation point where the polypeptide chain becomes fully coated with SDS molecules, forming a rod-like protein-SDS complex with a consistent charge-to-mass ratio. The expansion of the protein chain at micellar SDS concentrations is primarily driven by coulombic repulsion between the protein-bound micelles and anionic amino acid side chains. [3]
SDS Denaturation Mechanism: This diagram illustrates the sequential process of protein denaturation by SDS.
Quantitative Evidence for the 1.4g/g Binding Ratio
Experimental Determinations of SDS Binding
The fundamental 1.4:1 SDS-to-protein binding ratio has been consistently demonstrated across multiple experimental techniques and protein systems. Isothermal titration calorimetry (ITC) studies provide direct measurements of SDS binding stoichiometries, with saturation typically occurring at approximately 1.1-1.4 g SDS per gram of protein for most globular proteins. [16] These measurements reveal complex titration behaviors with multiple distinctive binding phases below or at the critical micelle concentration (CMC), with the final saturation level corresponding to the characteristic 1.4:1 ratio. [16]
Table: Experimental Evidence for SDS Binding Ratio
| Experimental Method | Proteins Studied | Observed SDS:Protein Ratio | Key Findings |
|---|---|---|---|
| Isothermal Titration Calorimetry (ITC) | EXG:CBM variants [16] | ~1.1 g/g (β-sheet proteins) | Four distinctive binding phases; similar stoichiometry for charged and uncharged variants |
| Equilibrium Dialysis | Various globular proteins [5] | ~1.4 g/g (average) | Consistent binding ratio across different protein families and structures |
| Capillary Electrophoresis | Therapeutic monoclonal antibodies [17] | 1.4 g/g (standard) | Uniform charge-to-hydrodynamic volume ratio enables size-based separation |
| Small-Angle X-Ray Scattering | EXG:CBM-SDS complexes [16] | N/A (structure) | Protein-decorated SDS micelles form at saturation binding |
The slight variations in binding ratios observed between different protein families (e.g., β-sheet proteins typically binding slightly less SDS than α-helical proteins) highlight how protein structure influences the precise saturation point. [16] The presence of disulfide bonds may also restrict complete exposure of the polypeptide chain to SDS micelles in the unfolded state, potentially reducing the final binding ratio. [16] Nevertheless, the consistency of the 1.4:1 ratio across most protein systems underscores its fundamental role in creating the uniform charge-to-mass ratio essential for SDS-PAGE separations.
Experimental Protocols for Validating SDS Binding
Isothermal Titration Calorimetry (ITC) for SDS Binding Stoichiometry
Principle: ITC directly measures the heat released or absorbed during molecular binding events, providing both stoichiometric and thermodynamic parameters of SDS-protein interactions. [16]
Protocol:
- Sample Preparation: Prepare protein solution in appropriate buffer (typically 20-50 μM concentration in phosphate or Tris buffer, pH 7.0-7.5). Dialyze extensively against buffer. Prepare SDS solution in identical dialysis buffer to minimize heats of dilution.
- Instrument Setup: Load protein solution into sample cell (typically 1.4 mL volume). Fill reference cell with dialysis buffer. Load SDS solution into injection syringe.
- Titration Parameters: Set temperature constant at 25°C or 37°C. Program successive injections of SDS solution (typically 2-10 μL per injection) with 120-180 second intervals between injections to allow return to baseline. Continue injections until well beyond saturation (typically 20-30 injections).
- Data Analysis: Integrate heat signals for each injection. Subtract control titration of SDS into buffer. Fit binding isotherm to appropriate model (frequently multiple set of sites model for complex SDS binding). Determine stoichiometry (n), binding constant (K), and thermodynamic parameters (ΔH, ΔS). [16]
Interpretation: SDS-protein interactions typically display complex multiphasic titration curves with two maxima and two minima below or at the CMC. The final transition provides the saturation stoichiometry corresponding to the 1.4:1 ratio. [16]
Capillary Gel Electrophoresis (SDS-CGE) for Binding Validation
Principle: SDS-CGE separates protein-SDS complexes based on size under denaturing conditions, with migration time reflecting the uniform charge-to-mass ratio achieved through consistent SDS binding. [19] [17]
Protocol:
- Sample Preparation: Dilute protein to 0.5-2 mg/mL in SDS sample buffer. Add 2-mercaptoethanol (5% v/v) for reduction. Heat at 70°C for 10 minutes. Cool to room temperature. [17]
- Capillary Conditioning: Rinse capillary sequentially with 0.1 M NaOH (3 min), 0.1 M HCl (1 min), HPLC-grade water (1 min), and SDS-MW gel buffer (10 min) at high pressure (70-80 psi). [17]
- Sample Injection: Electrokinetically inject samples at 5 kV for 20 seconds. Include appropriate molecular weight standards.
- Separation: Apply electric field of 500 V/cm in reversed polarity mode (anode at detection side). Use effective capillary length of 20-30 cm. Maintain constant temperature (25°C or optimized between 45-90°C). [17]
- Detection: Monitor UV absorbance at 220 nm. Analyze electropherograms for peak migration and resolution.
Interpretation: Successful achievement of the 1.4:1 binding ratio is indicated by migration times that correlate precisely with logarithmic molecular weight when compared to standards. Deviation from linearity suggests incomplete SDS binding or protein modifications. [19] [17]
The Scientist's Toolkit: Essential Reagents and Materials
Table: Essential Research Reagents for SDS Binding Studies
| Reagent/Material | Specifications | Function in SDS Binding Studies |
|---|---|---|
| Sodium Dodecyl Sulfate (SDS) | High-purity, ≥99% (electrophoresis grade); molecular weight 288.38 g/mol [5] [15] | Primary denaturant that binds proteins at 1.4:1 ratio; confers uniform negative charge |
| SDS-PAGE Sample Buffer | Tris-HCl or phosphate buffer (pH 6.8), 1-2% SDS, 5% glycerol, 0.004% bromophenol blue [15] [20] | Denatures proteins and maintains reduced state; provides density for gel loading |
| Reducing Agents | β-mercaptoethanol (5% v/v) or DTT (10-100 mM) [15] [17] | Reduces disulfide bonds to ensure complete unfolding and SDS accessibility |
| Molecular Weight Markers | Pre-stained or unstained protein ladders (e.g., 10-250 kDa range) [18] | Reference standards for validating size-based separation and SDS binding |
| SDS-MW Gel Buffer | Tris-Glycine-SDS buffer (pH 8.3-8.8) with sieving matrix [17] | Provides appropriate pH and conductivity for electrophoretic separation |
| Polyacrylamide Gels | Gradient or fixed percentage (e.g., 8-16%); bis-acrylamide crosslinker [15] [18] | Molecular sieve that separates SDS-protein complexes by size |
SDS-PAGE Workflow: This diagram outlines the key steps in protein analysis using SDS-PAGE.
Applications in Protein Research and Biopharmaceutical Development
Molecular Weight Determination and Purity Assessment
The uniform 1.4:1 SDS binding ratio enables accurate molecular weight determination across diverse protein systems. In SDS-PAGE, proteins migrate through the polyacrylamide gel matrix at rates inversely proportional to the logarithm of their molecular masses, allowing size estimation within approximately 5-10% accuracy when compared with appropriate standards. [21] [15] This application is particularly valuable for verifying recombinant protein expression, assessing proteolytic processing, and identifying post-translational modifications that alter polypeptide molecular weight. [21] The technique also provides a critical quality control measure in biopharmaceutical development, where monitoring the integrity and purity of therapeutic proteins is essential. [19]
Advanced Electrophoresis Techniques
The fundamental principle of uniform SDS binding underpins several advanced electrophoretic methods. Capillary SDS gel electrophoresis (SDS-CGE) has emerged as an automated, quantitative alternative to traditional slab gel SDS-PAGE, offering superior reproducibility and the ability to multiplex analyses. [19] [17] In the biopharmaceutical industry, SDS-CGE provides robust characterization of therapeutic antibodies, with the consistent 1.4:1 binding ratio ensuring accurate quantification of heavy and light chain fragments and detection of size variants. [17] Similarly, two-dimensional electrophoresis (2D-PAGE), which combines isoelectric focusing with SDS-PAGE, relies on the uniform charge conferred by SDS binding in the second dimension to separate complex protein mixtures with high resolution. [18]
The 1.4g SDS/g protein binding ratio represents a fundamental biochemical principle that enables one of the most widely used techniques in protein research. This consistent binding stoichiometry achieves complete charge uniformity across diverse protein species, allowing separation based primarily on molecular weight rather than intrinsic charge or structural features. Through predominantly hydrophobic interactions with polypeptide backbones, SDS molecules effectively mask native charge differences and transform complex three-dimensional structures into linear, negatively charged complexes with nearly identical charge-to-mass ratios. The remarkable consistency of this binding ratio across most globular proteins, as demonstrated through multiple experimental approaches, underscores its fundamental role in protein denaturation science and continues to support critical applications ranging from basic research to biopharmaceutical development.
The denaturation of proteins by sodium dodecyl sulfate (SDS) represents a fundamental process with critical applications across molecular biology, particularly in SDS-polyacrylamide gel electrophoresis (SDS-PAGE). While it is established that SDS binding imparts a uniform negative charge to proteins, the precise molecular mechanisms driving the initial unfolding remain a subject of intensive investigation. This whitepaper examines the competing theories regarding the primary driving force behind SDS-induced protein denaturation: direct hydrophobic binding versus electrostatic repulsion. Through synthesis of current research, biophysical studies, and molecular dynamics simulations, we analyze the evidence for both mechanisms and propose a unified, sequential model that reconciles these perspectives. This framework is essential for researchers in drug development and protein science to optimize experimental protocols and interpret data accurately.
Sodium dodecyl sulfate (SDS) is an anionic surfactant with a hydrophobic 12-carbon tail and a hydrophilic sulfate head group [5] [22]. Its ability to denature proteins and impart a uniform negative charge is the foundational principle behind SDS-PAGE, a ubiquitous technique in biochemistry and molecular biology for separating proteins by molecular weight [22] [23]. In this process, proteins are unfolded and coated with SDS molecules, resulting in a complex where the protein's intrinsic charge is masked and replaced by a consistent charge-to-mass ratio [22]. This allows separation based primarily on polypeptide chain length rather than native structure or isoelectric point [23].
The interaction between SDS and proteins is complex and concentration-dependent [5]. At low, submicellar concentrations (below the critical micelle concentration of 7-10 mM), SDS binds to proteins as monomers [3] [22]. At higher, micellar concentrations, SDS molecules form complexes with proteins that can involve both monomeric and micellar interactions [5]. A key observation is that approximately 1.4 grams of SDS bind per gram of protein, corresponding to roughly one SDS molecule per two amino acid residues [22]. While the outcome of complete protein denaturation is well-characterized, the specific mechanisms and relative contributions of different molecular forces during the unfolding process continue to be debated within the scientific community, forming the focus of this analysis.
The Hydrophobic Binding Hypothesis
The hydrophobic binding hypothesis posits that the initial driving force for SDS-induced denaturation is the hydrophobic effect, where SDS monomers preferentially interact with nonpolar regions of the protein.
Mechanistic Basis and Experimental Evidence
This mechanism begins with the binding of individual SDS monomers to hydrophobic patches on the protein surface via its aliphatic chain [9]. This binding is considered predominantly hydrophobic in the submicellar concentration range [3]. Notably, research on ferrocytochrome c has demonstrated that SDS interacts with even highly denatured and negatively charged forms of the protein, suggesting the interaction is largely independent of the protein's structure, conformation, and ionization state [3]. This points to a strong, inherent tendency for hydrophobic association.
Molecular dynamics simulations of human ubiquitin support this view, showing that SDS molecules initially disrupt the protein's first hydration shell and penetrate its hydrophobic core [9]. The simulations further indicate that the hydrophobic tails of SDS align with nonpolar amino acid side chains, while the sulfate head groups remain exposed to the solvent. This process is enhanced at elevated temperatures, which increase the mobility of SDS molecules and facilitate their penetration into the protein core [9].
Role of SDS Aggregation on Protein Surface
As SDS binding proceeds, the protein-bound detergent molecules can begin to form aggregates or micelle-like clusters on the protein surface. The hydrophobic effect is believed to be the exclusive driving force for interactions at micellar SDS concentrations [3]. The formation of these anionic clusters on the protein surface creates localized regions of high negative charge, setting the stage for the subsequent role of electrostatic forces in the complete unfolding process.
The Electrostatic Repulsion Model
In contrast to the hydrophobic hypothesis, the electrostatic repulsion model emphasizes the role of charge-charge interactions in protein denaturation, particularly in the later stages of unfolding.
Mechanism of Charge-Mediated Unfolding
This model proposes that the negatively charged sulfate head groups of bound SDS molecules generate strong electrostatic repulsion between different segments of the protein chain [3]. In the micellar concentration range, this repulsion occurs between protein-bound micelles as well as between these micelles and anionic amino acid side chains [3]. This repulsive force works against the attractive forces that maintain the protein's tertiary structure, effectively causing the polypeptide chain to expand and unfold to minimize charge repulsion.
The expansion of the protein chain at micellar SDS concentrations is explicitly described as being "driven by coulombic repulsion" [3]. This charge-driven mechanism is particularly effective because the dense clustering of negative charge on the protein surface creates a powerful unfolding force that is difficult for the protein's native stabilizing interactions to overcome.
Evidence from Structural Studies
Experimental results from various systems consistently identify tertiary structure unfolding and chain expansion as discrete events that occur after initial SDS binding [3]. This temporal sequence supports the concept that electrostatic repulsion becomes significant only after a critical threshold of SDS binding has occurred. The observation that SDS can induce α-helical structure in some proteins [9] also aligns with the electrostatic model, as the alignment of charged head groups could potentially stabilize certain secondary structures even while disrupting tertiary interactions.
A Unified Sequential Model
The debate between these two mechanisms is most effectively resolved by a unified sequential model that incorporates both hydrophobic and electrostatic effects in a time- and concentration-dependent manner.
Stages of SDS-Induced Denaturation
Table 1: Sequential Model of SDS-Induced Protein Denaturation
| Stage | SDS Concentration | Primary Driving Force | Structural Consequence |
|---|---|---|---|
| 1. Initial Binding | Submicellar (below CMC) | Hydrophobic interactions | SDS monomers bind to hydrophobic patches on native protein surface |
| 2. Partial Unfolding | Near CMC | Combined hydrophobic & initial electrostatic | Exposure of buried hydrophobic regions; secondary structure perturbation |
| 3. Cooperative Unfolding | Low micellar | Electrostatic repulsion between bound SDS clusters | Disruption of tertiary contacts; chain expansion |
| 4. Complete Denaturation | Above CMC | Predominantly hydrophobic (micellar binding) & electrostatic repulsion | Formation of rod-like protein-SDS complexes with uniform charge |
Research suggests that "tertiary structure unfolding in the submicellar and chain expansion in the micellar range of SDS concentrations are the two major and discrete events" [3]. This indicates that the mechanism evolves as more SDS molecules bind to the protein, with different forces dominating distinct stages of the process.
Visualization of the Sequential Denaturation Process
The diagram above illustrates the proposed sequential mechanism, showing the transition from hydrophobic-driven binding to electrostatic-mediated unfolding, culminating in a fully denatured protein-SDS complex with uniform charge distribution.
Experimental Approaches and Methodologies
Key Techniques for Investigating SDS-Protein Interactions
Table 2: Experimental Methods for Studying SDS Denaturation Mechanisms
| Method | Application | Key Measurable Parameters | Insights Provided |
|---|---|---|---|
| Stopped-Flow Kinetics [3] | Time-resolved unfolding | Unfolding rates, intermediate states | Distinguishes discrete events in unfolding pathway |
| Molecular Dynamics Simulations [24] [9] | Atomic-level interaction analysis | SDS binding sites, hydration shell changes, protein dynamics | Reveals initial hydrophobic penetration and later charge effects |
| Circular Dichroism (CD) Spectroscopy [9] | Secondary structure monitoring | α-helix, β-sheet content | Quantifies structural changes during denaturation |
| Equilibrium Binding Studies [3] | Binding affinity and stoichiometry | SDS molecules bound per protein, binding constants | Determines concentration dependence of interactions |
| FTIR Spectroscopy [25] | Conformational analysis | Secondary structure loss, aggregated states | Tracks sequential structural changes under denaturation |
Standard Protocol for SDS-Induced Denaturation Studies
A typical experimental workflow for investigating SDS denaturation mechanisms includes:
Sample Preparation: Protein solutions are prepared in appropriate buffers (typically phosphate or Tris buffer at neutral pH). SDS stock solutions are prepared at varying concentrations both below and above the CMC (1-10 mM for submicellar studies, 10-100 mM for micellar studies) [3] [22].
Complex Formation: Protein and SDS solutions are mixed at specific ratios, with common SDS:protein molar ratios ranging from 5:1 to 50:1 for monomeric binding studies, and higher for micellar interactions [5]. Incubation is typically performed at 25-37°C for 15-30 minutes to reach equilibrium.
Denaturation Kinetics: For time-resolved studies, stopped-flow apparatus rapidly mixes protein and SDS solutions while monitoring spectroscopic changes (fluorescence, CD) at millisecond resolution [3]. Temperature is controlled precisely, as SDS-induced unfolding is temperature-dependent [9].
Structural Analysis: Following incubation, samples are analyzed using multiple complementary techniques:
- Far-UV CD spectroscopy (190-250 nm) to quantify secondary structure changes
- Intrinsic tryptophan fluorescence to monitor tertiary structure disruption
- ANS fluorescence to detect exposed hydrophobic clusters
- Dynamic light scattering to measure hydrodynamic radius increases
Data Analysis: Unfolding curves are fitted to binding models to determine stoichiometry and cooperativity. Kinetic traces are analyzed to identify unfolding intermediates and rates.
The Scientist's Toolkit: Essential Research Reagents
Table 3: Key Reagents for SDS Denaturation Research
| Reagent | Specifications | Function in Research | Technical Notes |
|---|---|---|---|
| SDS (Ultra-Pure) | ≥99% purity, low UV absorbance | Primary denaturant; studied at varying concentrations below and above CMC | Critical to use consistent lot; CMC varies with temperature and buffer (7-10 mM in water) [22] |
| Reducing Agents | DTT (1-100 mM), β-mercaptoethanol (5% v/v) | Break disulfide bonds to ensure complete unfolding | Essential for studying multimeric proteins; must be fresh prepared [22] [23] |
| Buffers | Tris, phosphate, Bis-Tris (pH 6.4-8.8) | Maintain pH during denaturation studies | Choice affects CMC and unfolding kinetics; Tris-glycine common for electrophoresis [22] |
| Molecular Weight Markers | Pre-stained or unstained protein ladders | Size reference for denatured states | Used to calibrate hydrodynamic size changes during unfolding [23] |
| Spectroscopic Probes | ANS, Nile Red, extrinsic fluorophores | Report on hydrophobic exposure and conformational changes | ANS fluorescence increases upon binding hydrophobic patches |
| Chaotropic Salts | LiBr, Guanidine HCl (1-8 M) | Comparative denaturation studies | LiBr disrupts water network structure [25]; useful for mechanistic comparisons |
Research Implications and Applications
Understanding the precise mechanism of SDS denaturation has significant practical implications for drug development and biotechnology. The concentration-dependent effects of SDS inform its use in protein purification, refolding, and formulation [5]. Low SDS concentrations (0.1%) can selectively extract membrane proteins or fractionate protein aggregates while preserving certain structural features, whereas higher concentrations (1-2%) achieve complete denaturation for electrophoretic analysis [5].
In biopharmaceutical development, the detailed knowledge of surfactant-protein interactions guides the selection of excipients for stabilizing protein therapeutics. The recognition that SDS can preserve antigenic epitopes at low concentrations while denaturing proteins at high concentrations is particularly valuable for vaccine development and immunoassay design [5]. Furthermore, the temperature dependence of SDS denaturation [9] informs storage and handling conditions for protein-based therapeutics.
Recent research on alternative denaturation methods, such as concentrated LiBr solutions that disrupt water structure through an entropy-driven mechanism [25], provides comparative systems for understanding the unique aspects of SDS-induced unfolding. These insights contribute to the development of more sustainable protein processing methods with applications in biomaterials and tissue engineering.
The debate regarding hydrophobic versus electrostatic interactions as the primary driving force in SDS-induced protein denaturation reveals a complex, multi-stage process that incorporates both mechanisms sequentially. Current evidence supports a model where initial hydrophobic binding of SDS monomers to the native protein is followed by electrostatic repulsion-driven unfolding as SDS clusters form on the protein surface, culminating in complete denaturation stabilized by both micellar hydrophobic interactions and charge repulsion.
This nuanced understanding moves beyond simplistic either/or explanations and provides a comprehensive framework for interpreting experimental results across different protein systems and denaturation conditions. For researchers in drug development and protein science, this model offers predictive power for optimizing protein manipulation protocols, interpreting electrophoretic analyses, and designing stable protein formulations. Future research using advanced single-molecule techniques and time-resolved structural methods will continue to refine our understanding of these fundamental interactions and their applications in biotechnology and medicine.
Sodium dodecyl sulfate (SDS) is one of the most widely used anionic surfactants in biochemical research, primarily known for its powerful protein-denaturing capabilities [5]. Its role in techniques like SDS-Polyacrylamide Gel Electrophoresis (SDS-PAGE) is foundational to modern proteomics, enabling protein separation based primarily on molecular weight [26] [6]. The canonical understanding attributes this separation to SDS imparting a uniform negative charge to proteins while unfolding them into linear chains [27]. However, this model primarily applies to proteins with standard amino acid compositions. This review examines the mechanistic evidence from model systems for a more nuanced question: how does SDS interact with and denature proteins that inherently lack charged residues, and what are the implications for the broader thesis of how SDS denatures proteins and imparts negative charge?
Mechanistic Basis of SDS-Protein Interactions
Fundamental Driving Forces
The interaction between SDS and proteins is governed by two primary forces: hydrophobic interactions and coulombic repulsion. In the submicellar concentration range, the nature of the interaction is predominantly hydrophobic, with SDS molecules binding individually to the polypeptide chain [3]. As the SDS concentration increases to micellar levels, the interaction becomes exclusively hydrophobic, leading to significant protein chain expansion [3]. This expansion is primarily driven by coulombic repulsion between protein-bound micelles and anionic amino acid side chains, even in proteins initially low in such residues [3].
Contemporary Structural Models
Recent structural, kinetic, and computational studies have decisively resolved historical controversies regarding the structure of SDS-protein complexes. The "beads-on-a-string" model, which proposed unfolded proteins surrounded by surfactant micelles, has been largely invalidated [4]. Current evidence unambiguously supports the core-shell model (or protein-decorated micelles), in which the denatured protein chain covers the surface of SDS micelles [4]. Depending on the SDS:protein ratio and protein molecular mass, these structures can range from multiple partly unfolded protein molecules surrounding a single shared micelle to a single polypeptide chain decorating multiple micelles [4].
Table 1: Key Models for SDS-Protein Complex Architecture
| Model Name | Structural Description | Experimental Support | Status |
|---|---|---|---|
| Core-Shell | Denatured protein covers the surface of SDS micelles [4] | Calorimetry, SAXS, Molecular Dynamics [4] | Firmly Established |
| Beads-on-a-String | Unfolded proteins surrounded by surfactant micelles [4] | Historical interpretations | Largely Ruled Out |
Evidence from Model Protein Systems
Studies on Ferrocytochrome c
Comprehensive research on ferrocytochrome c under neutral and strongly alkaline conditions provides critical insights into SDS interactions independent of protein charge characteristics. Equilibrium and stopped-flow kinetic results consistently identify two major discrete events in SDS-induced perturbation: (1) tertiary structure unfolding in submicellar SDS concentrations, and (2) chain expansion in the micellar range of SDS concentrations [3]. Most significantly, SDS demonstrates robust interaction with a highly denatured and negatively charged form of ferrocytochrome c, indicating that the binding interaction is independent of the native structure, conformation, and ionization state of the protein [3]. This finding fundamentally supports the capacity for SDS to interact with proteins lacking inherent charge.
Insights from Bacterial Collagenase
Investigations with bacterial collagenase G (ColG) further illuminate surfactant-protein interactions. Spectroscopy, molecular docking, and molecular dynamics simulations reveal that anionic surfactants like SDS inhibit ColG primarily by occupying the enzyme's active site and inducing conformational changes in the catalytic region [28]. These interactions occur through specific binding interactions that alter the protein's secondary structure, as confirmed by circular dichroism spectroscopy showing changes in α-helix and β-sheet content upon SDS binding [28].
Quantitative Analysis of SDS Binding
The binding relationship between SDS and proteins follows predictable patterns, even when considering charge-deficient proteins. The number of SDS molecules binding to a protein is proportional to the number of amino acids constituting the protein, typically approaching 1.4 grams of SDS per 1 gram of protein [26]. This binding ratio is sufficient to overwhelm any inherent charge the protein may possess.
Table 2: Quantitative Parameters of SDS-Protein Interactions
| Parameter | Value/Range | Significance | Experimental Basis |
|---|---|---|---|
| Critical Micelle Concentration (CMC) | Varies with ionic strength [5] | Determines monomeric vs. micellar binding | Equilibrium studies [5] |
| Typical SDS:Protein Binding Ratio | ~1.4 g SDS / 1 g protein [26] | Ensures charge masking | SDS-PAGE optimization [26] |
| SDS Micelle Aggregation Number | ~60-70 molecules | Determines denaturation efficiency | Structural studies [4] |
| Key Binding Force at Micellar Concentration | Exclusively hydrophobic [3] | Drives chain expansion | Hydrophobic interaction analysis [3] |
Experimental Methodologies for Investigating SDS-Protein Interactions
Spectroscopic Techniques
Circular Dichroism (CD) Spectroscopy effectively monitors surfactant-induced conformational changes in proteins. Experiments are performed by recording CD spectra of protein solutions (e.g., 0.5 mg/mL) under various surfactant concentrations using a pathlength quartz cell (typically 1.0 mm), scanning from 250 to 185 nm [28]. Data analysis using programs like SELCON3 determines the relative content of secondary structure elements (α-helix, β-sheet, random coil) [28].
Fluorescence Spectroscopy probes tertiary structural changes and surfactant binding. Measurements utilize protein solutions (e.g., 80 μg/mL) with varying surfactant concentrations incubated at optimal temperature (e.g., 40°C for 30 minutes) [28]. Emission spectra (300-500 nm) are recorded following excitation at 280 nm, with synchronous fluorescence spectra providing additional resolution by scanning at fixed wavelength intervals (Δλ = 15 nm and 60 nm) between excitation and emission [28].
Structural and Computational Approaches
Small-Angle X-Ray Scattering (SAXS) provides structural information on SDS-protein complexes in solution, enabling discrimination between competing structural models [4]. Time-resolved SAXS analysis has revealed that SDS micelles attack proteins asymmetrically during early unfolding stages [4].
Molecular Dynamics (MD) Simulations complement experimental approaches by modeling surfactant-protein interactions at atomic resolution. Simulations have revealed that SDS, with its multivalent sulfate headgroup, forms numerous intimate contacts with viral spike proteins that markedly perturb their electrostatic environment [29]. These computational approaches confirm the predominance of the core-shell model for SDS-protein complexes [4].
SDS Depletion for Native Analysis
KCl Precipitation effectively removes SDS from membrane protein preparations to facilitate downstream analysis. Optimized protocols utilize high pH (especially pH 12) and urea addition to improve membrane protein recovery and reduce SDS interference during mass spectrometry analysis [30]. This method enables high-quality mass spectrometry analysis of otherwise hard-to-detect membrane proteoforms by precipitating SDS while preserving protein integrity [30].
The Scientist's Toolkit: Essential Research Reagents
Table 3: Key Reagents for Studying SDS-Protein Interactions
| Reagent/Chemical | Function/Application | Technical Notes | References |
|---|---|---|---|
| SDS (Sodium Dodecyl Sulfate) | Primary denaturant; binds proteins via hydrophobic interactions and charge contribution | CMC varies with ionic strength; purity critical for reproducibility | [3] [5] |
| Sarkosyl (N-Lauroylsarcosine) | Mild anionic detergent comparison for SDS; smaller aggregation number | Useful for fractionating aggregated proteins | [5] |
| Sodium N-Lauroyl Glutamate (SLG) | Mild anionic detergent with different head group | Effects similar to low-concentration SDS in certain applications | [5] |
| Polyacrylamide/Bis-acrylamide | Gel matrix for electrophoretic separation | Pore size controlled by concentrations (%T and %C) | [31] |
| Beta-Mercaptoethanol (BME) | Reducing agent for disulfide bond cleavage | Essential for complete denaturation in sample buffer | [6] |
| Tris-Glycine Buffer System | Discontinuous electrophoresis buffer | pH-dependent glycine charge state enables stacking | [27] |
| Potassium Chloride (KCl) | SDS depletion via precipitation | Particularly useful for membrane protein preparation | [30] |
| Coomassie Brilliant Blue | Protein staining and visualization | Standard for detecting proteins after separation | [6] |
Visualizing Experimental Workflows
SDS-Protein Interaction Analysis Workflow
Core-Shell Model of SDS-Protein Complex
Research Implications and Applications
The evidence from model systems examining SDS interactions with chargeless proteins has profound implications for multiple research domains. In drug development, understanding these mechanisms informs formulation strategies involving surfactants as excipients to prevent protein aggregation [5]. For membrane protein research, optimized SDS depletion protocols enable high-quality structural and mass spectrometry analyses [30]. In industrial enzymology, insights into surfactant-enzyme interactions guide process optimization in leather-making and other biotechnology applications [28]. Furthermore, these principles extend to virology, where SDS-induced alterations of viral surface properties affect virus behavior in environmental systems [29].
Evidence from model systems unequivocally demonstrates that SDS interacts with and denatures proteins through mechanisms that operate effectively even when proteins lack substantial inherent charge. The process initiates with hydrophobic binding of SDS monomers in submicellar concentrations, progresses through cooperative micellar binding following the core-shell model, and culminates in protein unfolding driven by coulombic repulsion from the accumulated negative charge on the SDS molecules themselves. This comprehensive understanding of SDS-protein interactions, particularly with chargeless proteins, reinforces the versatility of SDS as a biochemical tool while providing critical insights for applications ranging from basic proteomics to industrial biotechnology and pharmaceutical development. The mechanistic framework established through these model systems continues to inform experimental design and interpretation across diverse scientific disciplines.
Within the broader investigation into how sodium dodecyl sulfate (SDS) denatures proteins and imparts a negative charge, the formation and action of micelles represent a critical mechanistic step. This whitepaper synthesizes current research to detail the process by which SDS micelles induce protein chain expansion primarily through Coulombic repulsion. The discussion is framed around two established models—the core-shell (protein-decorated micelle) model and the beads-on-a-string model—with decisive evidence from recent structural, kinetic, and computational studies supporting the former. This document provides a technical guide for researchers and drug development professionals, summarizing quantitative data, experimental protocols, and essential reagents to facilitate further investigation and application in fields such as protein separation and biopharmaceutical formulation.
The denaturation of proteins by sodium dodecyl sulfate (SDS) is a cornerstone technique in biochemical analysis, most notably in SDS-polyacrylamide gel electrophoresis (SDS-PAGE) [26] [32]. The process relies on two fundamental actions: the binding of SDS to impart a uniform negative charge, and the disruption of native protein structure to achieve a linearized state. While monomeric SDS binding occurs at low concentrations, the critical micellar concentration (CMC) marks a threshold where cooperative SDS micelles drive extensive, and often complete, protein unfolding [33] [5]. The prevailing question has been the precise mechanism by which these micelles orchestrate chain expansion. Recent experimental and computational work has clarified that the process is not one of simple coating, but involves the formation of specific protein-SDS complexes where Coulombic repulsion between bound micelles provides the driving force for expanding the polypeptide chain [3] [4]. This whitepaper delves into the role of micelles in this process, examining the governing principles, the transition from stoichiometric to cooperative binding, and the resultant structural consequences for the protein.
Mechanistic Models of SDS-Protein Interaction
Two primary models have been proposed to describe the structure of SDS-protein complexes at denaturing concentrations.
The Core-Shell Model (Protein-Decorated Micelle)
This model, strongly supported by a combination of calorimetric, small-angle X-ray scattering (SAXS), and molecular dynamics simulation data, posits that the unfolded protein chain decorates the surface of SDS micelles [4]. In this structure, the hydrophobic cores of the micelles are intact, while the hydrophilic heads interact with the aqueous solvent and the polypeptide chain wraps around the micelle surface. The protein molecule is shared between multiple micelles, leading to a structure where the protein's hydrophobic residues associate with the micelle core, and its hydrophilic parts, along with the anionic SDS headgroups, face the water. This arrangement is now considered the most accurate representation of the SDS-denatured state [4].
The Beads-on-a-String Model
This older model suggests that the unfolded polypeptide chain is surrounded by individual SDS micelles, which bind along its length like beads on a string. However, recent experimental evidence, particularly from SAXS analysis, has rendered this model less favorable. The data do not support the existence of discrete micellar "beads" encircled by the protein chain; instead, they confirm a core-shell structure [4].
Table 1: Comparison of SDS-Protein Interaction Models.
| Feature | Core-Shell Model | Beads-on-a-String Model |
|---|---|---|
| Established Name | Protein-decorated micelle | Rod-like complex |
| SDS Micelle Structure | Intact, spherical core | Disrupted, arranged along chain |
| Protein Orientation | Wrapped around micelle surface | Surrounded by micelles |
| Complex Structure | Multiple protein molecules can share a single micelle; a single chain can decorate multiple micelles | One protein chain linearized with multiple micelles bound |
| Current Support | Strong, from SAXS, ITC, and MD simulations [4] | Weakened by modern structural data |
Visualizing the Core-Shell Mechanism
The following diagram illustrates the established stepwise mechanism of protein denaturation by SDS micelles, culminating in the core-shell structure.
The Driving Force: Chain Expansion and Coulombic Repulsion
The initial binding of SDS to a protein involves a combination of hydrophobic and electrostatic interactions. However, at concentrations exceeding the CMC, the mechanism of chain expansion is driven predominantly by Coulombic repulsion.
Two-Stage Denaturation Process
Research on model proteins like ferrocytochrome c reveals a discrete, two-stage process [3]:
- Tertiary Structure Unfolding: At sub-micellar SDS concentrations, binding of monomeric SDS molecules disrupts the native tertiary structure of the protein.
- Chain Expansion: At micellar concentrations, the protein chain undergoes a significant expansion. This expansion is driven by the Coulombic repulsion between the negatively charged SDS micelles bound to the protein chain and the anionic side chains of the protein itself [3].
The Role of Micellar Binding
In the core-shell model, the unfolded polypeptide chain decorates multiple SDS micelles. Each micelle carries a high density of negative charge from its dodecyl sulfate headgroups. As these charged micelles bind along the protein chain, the strong electrostatic repulsion between them forces the polypeptide to expand into a linearized conformation [3] [4]. This repulsive force is sufficient to overcome the intrinsic folding preferences of the protein, resulting in a fully denatured state.
Table 2: Key Forces in SDS-Mediated Protein Denaturation.
| Stage | Dominant Interaction | Result |
|---|---|---|
| Initial Binding (Below CMC) | Hydrophobic interactions; Electrostatic attraction between SDS headgroups and positive protein patches | Disruption of tertiary structure; partial unfolding |
| Micellar Binding (Above CMC) | Cooperative hydrophobic binding in micellar form | Saturation of the polypeptide chain with SDS |
| Chain Expansion | Coulombic repulsion between bound micelles and anionic amino acids | Full linearization of the protein chain |
Experimental Analysis and Protocols
The study of micelle-induced protein denaturation relies on techniques capable of probing structural changes and kinetic parameters.
Key Methodologies
- Stopped-Flow Kinetics: This technique is used to monitor the rapid kinetics of protein unfolding upon rapid mixing with SDS. By following changes in fluorescence or absorbance, researchers can quantify the rates of the initial unfolding and subsequent chain expansion phases [3].
- Small-Angle X-Ray Scattering (SAXS): SAXS provides low-resolution structural information about the shape and size of protein-SDS complexes in solution. It has been instrumental in distinguishing between the core-shell and beads-on-a-string models and in observing the asymmetric attack of micelles [4].
- Isothermal Titration Calorimetry (ITC): ITC measures the heat changes associated with SDS binding to proteins. It can determine the stoichiometry, affinity, and thermodynamics (enthalpy, entropy) of the interaction, revealing details of the binding process across different concentration regimes [4].
- Capillary Electrophoresis (CE): CE can be used to examine the influence of different factors, such as cation type, on the rates of protein denaturation by SDS. It allows for the separation and analysis of different protein-surfactant complexes based on their charge and size [33].
Protocol: Investigating Denaturation Kinetics via Stopped-Flow
This protocol outlines a general approach for studying the kinetics of SDS-induced protein denaturation.
Objective: To determine the rate of unfolding of a model protein (e.g., ferrocytochrome c) upon mixing with SDS at concentrations above the CMC.
Reagents:
- Purified protein in a suitable buffer (e.g., Tris-Gly, pH 8.0-8.5).
- SDS solution in the same buffer, at a concentration well above the CMC (e.g., 10-50 mM).
- Reference buffer without SDS.
Procedure:
- Sample Preparation: Prepare solutions of the protein and SDS in the same buffer. Degas solutions if necessary to prevent bubble formation in the instrument.
- Instrument Setup: Load the protein and SDS solutions into separate syringes of the stopped-flow instrument. Set the temperature control to the desired temperature (e.g., 25°C).
- Data Acquisition: Program the instrument to mix equal volumes of protein and SDS solutions rapidly and trigger data collection immediately. Monitor a signal that reports on protein conformation, such as:
- Intrinsic Tryptophan Fluorescence: Unfolding often exposes hydrophobic residues to a more polar environment, quenching their fluorescence.
- FRET: If the protein is labeled with donor and acceptor fluorophores, unfolding increases the distance between them, altering the FRET efficiency.
- Absorbance: Changes in the UV absorbance spectrum can report on the burial/exposure of aromatic residues.
- Data Analysis: Average several traces to improve the signal-to-noise ratio. Fit the resulting kinetic trace to an appropriate model (e.g., a single or double exponential function) to extract observed rate constants (kobs) for the unfolding process.
- Variation of Conditions: Repeat the experiment at different SDS concentrations or pH values to determine how these factors influence the unfolding rate.
Research Reagent Solutions
The following table details essential materials used in the featured experiments on SDS-protein interactions.
Table 3: Essential Reagents for Studying SDS-Protein Interactions.
| Reagent/Chemical | Function & Application in Research |
|---|---|
| Sodium Dodecyl Sulfate (SDS) | Anionic detergent; core denaturant used to unfold proteins and impart uniform negative charge for techniques like SDS-PAGE [26] [32]. |
| Tetra-n-alkylammonium Salts | Used as counter-cations (e.g., NMe₄⁺, NEt₄⁺) for DS⁻ to study cation hydrophobicity's effect on denaturation kinetics and CMC [33]. |
| Dithiothreitol (DTT) / β-Mercaptoethanol | Reducing agents; added to sample buffers to break disulfide bonds, ensuring complete protein denaturation and linearization [32]. |
| Tris-Glycine Buffer | Common electrophoretic buffer; its ionic strength and pH influence the CMC of SDS and the efficiency of protein separation [33] [32]. |
| Coomassie Brilliant Blue / SYPRO Ruby | Protein stains; used for visualizing separated protein bands on gels post-electrophoresis [7] [32]. |
| Molecular Weight Standards | Pre-stained or unstained protein ladders; essential for calibrating gels and estimating the molecular weight of unknown proteins [32]. |
Applications and Implications in Research
Understanding the detailed mechanism of SDS denaturation has practical implications beyond basic protein biochemistry.
- Protein Separation and Analysis: The core principle of SDS-PAGE relies on the uniform charge imparted by SDS and the sieving effect of the gel. The finding that the final denatured state involves a core-shell complex explains the high efficiency of this method in separating proteins by molecular weight [32].
- Drug Delivery Systems: Micellar solubilization is a powerful technique for delivering hydrophobic drugs in aqueous environments. Understanding how micelles interact with biological macromolecules like proteins can inform the design of more effective drug carriers and optimize drug bioavailability [34] [35].
- Biopharmaceutical Formulations: Surfactants are critical components in protein therapeutic formulations to prevent aggregation and surface adsorption. A deep understanding of surfactant-protein interactions helps in selecting the right excipients to ensure drug stability and safety [5].
- Refolding and Renaturation: The discovery that SDS denaturation can be reversed by adding nonionic surfactants (which form mixed micelles and strip SDS from the protein) provides a valuable tool for recovering functional proteins from inclusion bodies or after analytical procedures [4].
The role of micelles in SDS-induced protein denaturation is decisively centered on the mechanism of chain expansion driven by Coulombic repulsion. A preponderance of evidence from advanced biophysical techniques confirms the core-shell model, in which the unfolded protein decorates one or more SDS micelles. The repulsive forces between these negatively charged complexes are the primary driver for the linearization of the polypeptide chain, which is essential for techniques like SDS-PAGE. This detailed mechanistic understanding, framed within the broader thesis of SDS-protein interactions, provides researchers and drug development professionals with a refined framework for manipulating these interactions in analytical biochemistry, pharmaceutical formulation, and biotechnology.
SDS-PAGE in Action: From Sample Prep to Precise Separation
Sodium Dodecyl Sulfate-Polyacrylamide Gel Electrophoresis (SDS-PAGE) remains a cornerstone technique in biochemical research for separating proteins based on their molecular weight. This in-depth technical guide details the complete SDS-PAGE workflow, from fundamental principles to advanced applications. Framed within broader research on how SDS denatures proteins and imparts negative charge, this whitepaper provides researchers, scientists, and drug development professionals with detailed methodologies, optimized protocols, and practical troubleshooting strategies. The comprehensive protocol covers gel preparation, sample preparation, electrophoresis, and protein visualization, enabling precise protein analysis for diverse applications from basic research to pharmaceutical development.
SDS-PAGE revolutionized protein analysis when Ulrich Laemmli refined the method in 1970, creating a system that separates proteins primarily by molecular weight while eliminating influences from native protein charge or structure [15] [22]. The technique's power stems from its elegant simplification of protein complexity through controlled denaturation and charge normalization.
The core innovation lies in the synergistic action of sodium dodecyl sulfate (SDS), an anionic detergent that performs two critical functions. First, SDS denatures proteins by breaking non-covalent bonds—including hydrogen bonds, hydrophobic interactions, and ionic bonds—disrupting secondary and tertiary structures [15] [32]. Second, SDS binds quantitatively to the unfolded polypeptide chains at approximately 1.4 grams of SDS per gram of protein, imparting a uniform negative charge that overwhelms any intrinsic charge the protein may possess [26] [22]. This creates a consistent charge-to-mass ratio across all proteins, ensuring separation occurs solely based on molecular size rather than charge or shape [36] [32].
The denaturation mechanism involves both SDS monomers and micelles. SDS monomers bind to proteins via hydrophobic interactions, while SDS micelles (which form above the critical micellar concentration of 7-10 mM) do not adsorb proteins but maintain the denaturing environment [22]. This process is so effective that in SDS concentrations above 1 mM, most proteins are completely denatured [22]. The resulting linearized, negatively charged polypeptides then migrate through a polyacrylamide gel matrix under an electric field, with smaller proteins moving faster through the pores than larger ones [26].
Figure 1: Protein Denaturation and Charge Impartation by SDS. This diagram illustrates the transformational process where native globular proteins become linearized, negatively charged polypeptides capable of size-based separation.
Fundamental Mechanisms: How SDS Confers Uniform Charge and Enables Size-Based Separation
Molecular Interactions Between SDS and Proteins
SDS molecules contain a hydrophobic hydrocarbon tail (12-carbon chain) and a hydrophilic sulfate head group [36]. The hydrophobic regions interact strongly with hydrophobic patches on proteins, while the ionic sulfate groups disrupt non-covalent interactions that maintain protein structure [15]. Each SDS molecule contributes two negative charges, and the number of SDS molecules binding to a protein is proportional to its number of amino acids, typically achieving approximately one SDS molecule per two amino acid residues [26] [22].
This binding relationship ensures all proteins obtain a consistent charge-to-mass ratio. The 1.4:1 SDS-to-protein binding ratio means that even proteins with vastly different native structures and isoelectric points become uniformly negatively charged [22]. The denaturing process is typically enhanced by heating samples to 95°C for 5 minutes, which further disrupts hydrogen bonds, and by adding reducing agents like β-mercaptoethanol or dithiothreitol (DTT) to break disulfide bonds [15] [22].
Polyacrylamide Gel as a Molecular Sieve
The polyacrylamide gel matrix serves as a molecular sieve with tunable pore sizes controlled by adjusting acrylamide and bis-acrylamide concentrations [32]. The gel consists of two distinct regions: a stacking gel (typically 4-5% acrylamide, pH ~6.8) that concentrates proteins into sharp bands before entry into the resolving gel (typically 7.5-20% acrylamide, pH ~8.8) where actual separation occurs [36] [32]. The discontinuous buffer system creates a stacking effect at the interface between the two gel regions, dramatically improving resolution by compressing protein bands before separation begins [22].
Table 1: Optimal Acrylamide Concentrations for Separating Proteins of Different Size Ranges
| Acrylamide Percentage | Separation Range (kDa) | Best For |
|---|---|---|
| 6% | 50-150 | Very large proteins |
| 8% | 25-200 | Large proteins |
| 10% | 15-100 | Standard separation |
| 12% | 10-70 | Intermediate proteins |
| 15% | 5-50 | Small proteins |
Comprehensive SDS-PAGE Workflow
Gel Preparation and Casting
Polyacrylamide gels are formed through free-radical polymerization of acrylamide and bis-acrylamide cross-linker, typically in a ratio of about 1:35 [36]. The process is catalyzed by ammonium persulfate (APS) and tetramethylethylenediamine (TEMED), which generate free radicals to initiate the chain reaction [36] [22].
Detailed Protocol:
- Prepare resolving gel solution: Mix appropriate volumes of acrylamide/bis-acrylamide stock, Tris-HCl buffer (pH 8.8), and SDS. Add TEMED last to initiate polymerization [22].
- Cast resolving gel: Pour solution between glass plates, layer with isopropanol or water-saturated butanol to exclude oxygen and create a flat surface, and wait 15-45 minutes for complete polymerization [36] [22].
- Prepare and cast stacking gel: After removing the alcohol layer, pour stacking gel solution (lower acrylamide concentration, Tris-HCl pH 6.8) over the polymerized resolving gel, insert a comb to create sample wells, and allow to polymerize [36] [22].
Table 2: Standard Gel Formulations for SDS-PAGE
| Component | Resolving Gel (12%) | Stacking Gel (4%) |
|---|---|---|
| Acrylamide/Bis | 12% | 4% |
| Tris-HCl | 0.375 M, pH 8.8 | 0.125 M, pH 6.8 |
| SDS | 0.1% | 0.1% |
| APS | 0.05% | 0.05% |
| TEMED | 0.05% | 0.1% |
Sample Preparation
Proper sample preparation is critical for successful SDS-PAGE separation. The sample buffer typically contains SDS to denature proteins and confer negative charge, reducing agents to break disulfide bonds, glycerol to increase density for well loading, and tracking dye to monitor migration [32].
Detailed Protocol:
- Mix protein sample with loading buffer: Use a 3:1 or 4:1 ratio of sample to 4X Laemmli buffer (final concentration: 62.5 mM Tris-HCl pH 6.8, 2% SDS, 10% glycerol, 0.01% bromophenol blue) with 5% β-mercaptoethanol or 100 mM DTT as reducing agent [22].
- Denature proteins: Heat samples at 95°C for 5 minutes or 70°C for 10 minutes to complete denaturation [22].
- Centrifuge: Briefly spin samples to collect condensation and ensure uniform solution.
Electrophoresis
The electrophoresis process moves negatively charged protein-SDS complexes through the polyacrylamide gel matrix under an electric field toward the positive anode [36].
Detailed Protocol:
- Assemble electrophoresis apparatus: Place cast gel into chamber, fill with running buffer (25 mM Tris, 192 mM glycine, 0.1% SDS, pH 8.3) [22].
- Load samples: Carefully pipette prepared samples and molecular weight markers into wells.
- Run electrophoresis: Apply constant voltage of 100-150 V for mini-gels (approximately 40-60 minutes) or until tracking dye reaches bottom of gel [15].
- Monitor progress: Track migration using bromophenol blue dye front.
Figure 2: Complete SDS-PAGE Workflow. This diagram outlines the key stages in the SDS-PAGE process from initial setup to final analysis.
Protein Visualization and Analysis
After electrophoresis, proteins must be fixed and stained for visualization and analysis [26].
Detailed Protocol:
- Fix proteins: Incubate gel in fixative solution (e.g., 25% acetic acid, 40% ethanol) for 30 minutes to prevent diffusion [26].
- Stain proteins:
- Coomassie Brilliant Blue: Sensitive to ~50-100 ng/protein band; stain 30-60 minutes, destain until background clears [26] [15].
- Silver stain: Sensitive to ~0.1-1 ng/protein band; more complex multi-step protocol [15].
- Fluorescent stains (SYPRO Ruby): Sensitive to ~1-10 ng; compatible with mass spectrometry [15].
- Image and analyze: Document with gel imaging system, compare band migration to molecular weight standards, perform densitometry for quantification [15].
Research Reagent Solutions: Essential Materials for SDS-PAGE
Table 3: Essential Reagents and Equipment for SDS-PAGE Experiments
| Item | Function | Examples/Alternatives |
|---|---|---|
| Acrylamide/Bis-acrylamide | Gel matrix formation | 30% stock solution, 29:1 or 37.5:1 ratios |
| SDS (Sodium Dodecyl Sulfate) | Protein denaturation and charge impartation | 10-20% stock solution [26] |
| Tris buffers | Maintain pH during electrophoresis and gel polymerization | Tris-HCl pH 6.8 (stacking), pH 8.8 (resolving) [22] |
| TEMED and Ammonium Persulfate | Catalyze acrylamide polymerization | Fresh APS solution recommended [36] |
| β-mercaptoethanol or DTT | Reduce disulfide bonds | DTT preferred for less odor [22] |
| Glycine | Running buffer component | Tris-glycine-SDS buffer system [22] |
| Molecular weight standards | Size estimation of unknown proteins | Pre-stained or unstained protein ladders [32] |
| Coomassie Brilliant Blue | Protein staining | R-250 or G-250 formulations [26] |
| Gel electrophoresis apparatus | Housing for gel during electrophoresis | Mini- or midi-gel systems with power supply [32] |
Advanced Applications and Modifications
Gradient Gels and Two-Dimensional Electrophoresis
For complex protein mixtures, gradient gels with increasing acrylamide concentration (typically 4-20%) provide superior resolution across a broad molecular weight range [15]. The decreasing pore size creates a sieving effect that sharpens protein bands as they migrate. Two-dimensional electrophoresis combines isoelectric focusing (first dimension) with SDS-PAGE (second dimension), dramatically enhancing resolution for proteomic studies [15].
Western Blotting and Protein Identification
SDS-PAGE is frequently coupled with western blotting for specific protein detection. After separation, proteins are transferred to a membrane and probed with specific antibodies [15]. For protein identification, bands can be excised and analyzed by mass spectrometry, though special precautions are needed with staining methods compatible with downstream MS analysis [15].
Native SDS-PAGE (NSDS-PAGE)
A modified approach called Native SDS-PAGE (NSDS-PAGE) reduces SDS concentration (0.0375% in running buffer), eliminates EDTA, and omits heating steps [7]. This method maintains certain functional properties and metal cofactors in proteins while still providing high-resolution separation, with studies showing zinc retention increasing from 26% to 98% compared to standard SDS-PAGE [7].
Troubleshooting and Optimization
Common issues in SDS-PAGE include smiling or frowning bands (caused by uneven heating or buffer distribution), incomplete protein separation (insufficient run time or incorrect acrylamide concentration), and gel polymerization problems (improper TEMED/APS amounts or oxygen inhibition) [15]. Optimization strategies include adjusting acrylamide concentration based on target protein size, modifying voltage and run time, and ensuring fresh preparation of catalysts and buffers.
For proteins with unusual structures or modifications that affect mobility, additional optimization may be required. Post-translational modifications like glycosylation can shift apparent molecular weights, while highly hydrophobic or extreme pH proteins may require specialized protocols [15].
SDS-PAGE remains an indispensable technique in protein research due to its robust separation mechanism, relatively simple implementation, and adaptability to diverse research needs. The fundamental process of SDS-mediated protein denaturation and charge normalization enables reliable size-based separation that forms the foundation for countless applications in biochemistry, molecular biology, and drug development. As research evolves, modifications like NSDS-PAGE demonstrate the technique's continuing relevance, bridging the need for high-resolution separation with preservation of protein function. This comprehensive workflow provides researchers with the detailed protocols and theoretical understanding necessary to implement SDS-PAGE effectively in their experimental designs, from basic protein characterization to complex proteomic analyses.
In the realm of protein research, particularly in studies involving Sodium Dodecyl Sulfate-Polyacrylamide Gel Electrophoresis (SDS-PAGE), the fundamental question of how SDS denatures proteins and imparts a uniform negative charge is central to reliable protein separation and analysis [6] [15]. The integrity of this process is wholly dependent on the precise function of key laboratory reagents. While SDS unfolds proteins and masks their intrinsic charges, enabling separation by molecular weight, its action is supported and refined by a suite of other critical components [15]. Reducing agents ensure complete protein denaturation by breaking disulfide bonds, buffers maintain a stable pH environment to preserve protein structure and gel integrity, and tracking dyes allow visual monitoring of electrophoretic progress. This technical guide provides an in-depth examination of these essential reagents—reducing agents, buffers, and tracking dyes—framed within the context of SDS-PAGE methodology. We will explore their individual chemistries, specific roles in experimental protocols, and synergistic functions that together ensure the success of protein separation techniques fundamental to biochemical research and drug development.
The Mechanism of SDS in Protein Denaturation and Charge Impartation
SDS (Sodium Dodecyl Sulfate) serves a dual, critical function in protein biochemistry, acting as both a powerful denaturant and a charge-modifying agent [15]. Its mechanism of action is fundamental to the success of SDS-PAGE, a cornerstone technique in protein analysis.
Protein Denaturation: SDS molecules possess a hydrophobic hydrocarbon tail and a hydrophilic sulfate head group. When introduced to a protein sample, these molecules interact with the protein's hydrophobic regions, disrupting the non-covalent bonds—including hydrogen bonds and hydrophobic interactions—that maintain the protein's secondary and tertiary structures [6] [15]. This interaction effectively unfolds the protein into a linear polypeptide chain. The process involves the formation of SDS micelles, around which the denatured proteins wrap, creating a core-shell structure that ensures complete unfolding [15].
Imparting Uniform Negative Charge: As SDS denatures the protein, it binds to the polypeptide backbone at a remarkably consistent ratio of approximately 1.4 g of SDS per 1.0 g of protein [15]. This extensive coating covers the entire length of the unfolded protein. Since SDS is anionic, its sulfate groups confer a strong, uniform negative charge along the entire polypeptide chain. This process effectively "masks" the protein's intrinsic charge, rendering charge-based differences negligible. Consequently, during electrophoresis, all proteins migrate toward the anode (positive electrode), and their separation through the polyacrylamide gel matrix is determined primarily by their molecular size, with smaller proteins migrating faster than larger ones [6] [15].
The following diagram illustrates this denaturation and charge-imparting process:
Figure 1: SDS-Mediated Protein Denaturation and Charge Impartation
Reducing Agents in Protein Research
Chemical Principles and Key Types
In redox (reduction-oxidation) reactions, a reducing agent (or reductant) is a chemical species that donates electrons to another compound, thereby itself becoming oxidized [37] [38]. In the context of protein biochemistry, this electron-donating capability is harnessed to break disulfide bonds (-S-S-), which are covalent linkages that stabilize a protein's tertiary and quaternary structures [15]. By reducing these bonds, reducing agents ensure proteins are fully denatured into their constituent polypeptides, which is a prerequisite for accurate molecular weight determination via SDS-PAGE.
Common reducing agents used in protein research include [39]:
- β-mercaptoethanol (BME)
- Dithiothreitol (DTT)
- Tris(2-carboxyethyl)phosphine (TCEP)
TCEP is often favored for its stability and because it does not form mixed disulfides, unlike DTT and BME [39].
Application in SDS-PAGE Protocols
In standard SDS-PAGE sample preparation, a reducing agent is added to the loading buffer. The sample is then heated to 95°C for 5-10 minutes to ensure complete denaturation and reduction [15]. This step breaks all intra- and inter-molecular disulfide bonds, allowing the protein to unfold fully and be coated evenly by SDS. For protocols requiring the preservation of disulfide bonds to study protein oligomerization or interactions, a non-reducing SDS-PAGE is performed, where the reducing agent is simply omitted from the buffer [15].
Quantitative Data on Common Reducing Agents
Table 1: Characteristics of Common Reducing Agents in Biochemistry
| Reducing Agent | Typical Working Concentration | Key Properties | Advantages | Disadvantages |
|---|---|---|---|---|
| β-mercaptoethanol (BME) | 1-5% (v/v) | Strong odor; less potent than DTT | Inexpensive; widely available | Volatile; unpleasant odor; oxidizes easily |
| Dithiothreitol (DTT) | 1-10 mM | Odorless; standard for most procedures | More potent than BME; reduces itself | Can oxidize over time; may need fresh preparation |
| Tris(2-carboxyethyl)phosphine (TCEP) | 1-10 mM | Odorless; stable in buffer; stronger than DTT | Does not oxidize readily; no mixed disulfides | More expensive than DTT or BME |
Buffers in Biological Systems
Fundamental Principles of Buffering
A buffer is a solution that resists changes in pH upon the addition of small amounts of acid or base [40] [41]. It typically consists of a weak acid (HA, the proton donor) and its conjugate base (A⁻, the proton acceptor) in equilibrium. When a strong acid (H⁺ ions) is added, the conjugate base (A⁻) neutralizes it to form more weak acid (HA). When a strong base (OH⁻) is added, the weak acid (HA) neutralizes it to form water and the conjugate base (A⁻). This reversible absorption of ions maintains a stable hydrogen ion concentration, which is critical for most biological and chemical processes [40].
The effectiveness of a buffer is described by the Henderson-Hasselbalch equation: pH = pKa + log₁₀([A⁻]/[HA]) The buffering capacity is optimal when the pH of the solution is within ±1 unit of the buffer's pKa (the dissociation constant of the weak acid) [40] [41].
Criteria for Selecting Biological Buffers
In 1966, Norman Good and colleagues established a set of criteria for effective biological buffers, now known as "Good's Buffers" [40] [41]. These criteria ensure the buffer supports, rather than interferes with, biochemical reactions:
- pKa between 6.0 and 8.0: The optimal pH for most biological reactions lies within this range [41].
- High water solubility: The buffer should remain in the aqueous medium of the biological system [40].
- Membrane impermeability: The buffer should not accumulate inside cellular compartments [40] [41].
- Minimal salt effects: The buffer should not adversely affect the ionic composition of the system [40].
- Minimal impact of concentration and temperature: The pKa should not shift significantly with normal experimental changes in concentration or temperature [40].
- Low metal-binding capability: The buffer should not chelate metal ions required for enzymatic reactions [40] [41].
- Chemical and enzymatic stability: The buffer should not degrade or participate in the reactions it is buffering [40].
- Minimal light absorption: The buffer should not absorb UV or visible light, which would interfere with spectrophotometric assays [41].
Buffer Compositions in Electrophoresis Protocols
Different electrophoretic techniques require specific buffer systems to maintain the correct pH and ionic strength for optimal protein separation and stability.
Table 2: Buffer Compositions for Different PAGE Methodologies
| Electrophoretic Method | Sample Buffer Composition | Running Buffer Composition | Key Purpose |
|---|---|---|---|
| SDS-PAGE (Denaturing) | 106 mM Tris HCl, 141 mM Tris Base, 0.51 mM EDTA, 2% LDS, pH 8.5 [7] | 50 mM MOPS, 50 mM Tris Base, 1 mM EDTA, 0.1% SDS, pH 7.7 [7] | Denatures proteins; separation by size only |
| BN-PAGE (Native) | 50 mM BisTris, 50 mM NaCl, 10% Glycerol, pH 7.2 [7] | Cathode: 50 mM BisTris, 50 mM Tricine, 0.02% Coomassie, pH 6.8.Anode: 50 mM BisTris, 50 mM Tricine, pH 6.8 [7] | Preserves native structure & function |
| NSDS-PAGE (Native SDS) | 100 mM Tris HCl, 150 mM Tris Base, 10% Glycerol, 0.0185% Coomassie G-250, pH 8.5 [7] | 50 mM MOPS, 50 mM Tris Base, 0.0375% SDS, pH 7.7 [7] | High resolution with retained activity |
The interplay of reagents in an SDS-PAGE workflow, from sample preparation to separation, can be visualized as follows:
Figure 2: SDS-PAGE Workflow with Key Reagent Integration
Tracking Dyes in Electrophoresis
Purpose and Function
Tracking dyes serve a simple but vital role in gel electrophoresis: they provide a visual marker to monitor the progress of the run [42]. These colored compounds are mixed with the protein sample before loading onto the gel. As electrophoresis proceeds, the dye migrates toward the anode, forming a visible front. This allows the researcher to:
- Estimate migration: Determine how far the proteins have separated.
- Prevent over-run: Stop the electrophoresis before the proteins of interest migrate off the end of the gel.
- Standardize runs: Ensure consistency between different experiments by stopping the run when the dye front reaches a predetermined point, typically the bottom of the gel [15].
Common Dyes and Their Properties
The most common tracking dye in SDS-PAGE is Bromophenol Blue, which is typically included in the SDS-PAGE sample loading buffer [7]. It migrates at a rate equivalent to a small peptide (approximately 5 kDa). In native PAGE systems, dyes like Coomassie G-250 or Ponceau S are used [7]. For live-cell tracking applications unrelated to electrophoresis, hydrophobic dyes that become fluorescent upon entering cells and being modified by cellular esterases are available [42].
Integrated Experimental Protocol: SDS-PAGE
A detailed, step-by-step protocol for SDS-PAGE is provided below, highlighting the critical roles of the reagents discussed.
Sample Preparation
- Prepare Sample Buffer: Create a 2X Laemmli sample buffer containing:
- 106 mM Tris HCl
- 141 mM Tris Base
- 2% (w/v) SDS (Denaturant)
- 10% (v/v) Glycerol (Adds density for loading)
- 0.51 mM EDTA (Metal chelator)
- 0.02% (w/v) Bromophenol Blue (Tracking dye)
- Adjust to pH 6.8 [7].
- Add Reducing Agent: To the sample buffer, add a reducing agent immediately before use. For example, Dithiothreitol (DTT) to a final concentration of 50-100 mM, or β-mercaptoethanol to 5% (v/v) [15].
- Mix and Denature: Combine the protein sample with an equal volume of the 2X sample buffer in a microcentrifuge tube. Vortex briefly to mix. Heat the mixture at 70-95°C for 5-10 minutes to ensure complete denaturation and reduction of disulfide bonds [7] [15].
- Centrifuge: Briefly centrifuge the heated samples to collect condensation and ensure all liquid is at the bottom of the tube.
Gel Preparation and Electrophoresis
- Assemble Gel Apparatus: Set up a polyacrylamide gel cassette in the electrophoresis chamber. Pre-cast gels with various percentages of acrylamide (e.g., 8%, 10%, 12%) are commonly used for optimal separation of different protein size ranges [15].
- Prepare Running Buffer: Fill the inner and outer chambers of the gel apparatus with 1X running buffer, typically composed of:
- 25 mM Tris Base
- 192 mM Glycine
- 0.1% (w/v) SDS
- pH ~8.3 [15].
- Load Samples and Markers: Using a micropipette, load the denatured protein samples and a pre-stained protein molecular weight marker into the wells of the gel.
- Run Electrophoresis: Connect the power supply and run the gel at a constant voltage. A standard setting is 100-150 volts for 40-60 minutes, or until the Bromophenol Blue tracking dye front has reached the bottom of the gel [15].
Post-Electrophoresis Analysis
- Staining: Once the run is complete, carefully open the cassette and remove the gel. Place the gel in a staining solution, such as Coomassie Brilliant Blue or a more sensitive silver stain, to visualize the separated protein bands [15].
- Destaining (if using Coomassie): After staining, incubate the gel in a destaining solution (e.g., methanol, acetic acid, and water) to remove background stain and enhance band visibility [15].
- Imaging and Analysis: Capture an image of the stained gel using a gel documentation system. Analyze the band patterns and molecular weights by comparing the migration distance of protein bands to those of the molecular weight standard [15].
Table 3: Essential Reagents for Protein Electrophoresis and Analysis
| Reagent Category | Specific Examples | Primary Function | Key Considerations for Use |
|---|---|---|---|
| Denaturing Agent | Sodium Dodecyl Sulfate (SDS) | Unfolds proteins and imparts uniform negative charge [6] [15]. | Critical for mass-based separation; standard concentration is 0.1-1% in buffers [7] [15]. |
| Reducing Agents | DTT, TCEP, β-mercaptoethanol | Breaks disulfide bonds for complete denaturation [15] [39]. | Add fresh; TCEP is more stable than DTT; omit for non-reducing PAGE [39]. |
| Biological Buffers | Tris, MOPS, HEPES, Bis-Tris | Maintains stable pH for optimal protein stability & separation [40] [43]. | Choose based on pKa and experimental compatibility (e.g., metal binding) [41]. |
| Tracking Dyes | Bromophenol Blue, Coomassie G-250 | Visual monitor of electrophoretic progress [7] [42]. | Migrates at known size; do not let it run off the gel [15]. |
| Gel Stains | Coomassie Blue, Silver Stain, Fluorescent Dyes | Visualizes separated protein bands post-electrophoresis [15]. | Sensitivity varies: Silver > Fluorescent > Coomassie; MS-compatible stains available [15]. |
In the realm of protein research, sodium dodecyl sulfate-polyacrylamide gel electrophoresis (SDS-PAGE) stands as a cornerstone technique for separating proteins by molecular weight. The efficacy of this method hinges on the polyacrylamide gel matrix, a synthetic polymer whose nanoscale pore structure acts as a molecular sieve. This whitepaper delves into the science of polyacrylamide polymerization, examining the precise chemical and physical parameters that govern pore architecture. This knowledge is framed within the critical context of understanding how SDS denatures proteins and imparts a uniform negative charge, a process that transforms intrinsic protein properties and allows separation to be based primarily on molecular size. Mastery of gel polymerization is not merely academic; it is essential for researchers and drug development professionals to optimize resolution, accurately determine molecular weights, and generate reproducible, high-quality data for applications ranging from proteomics to quality control of biopharmaceuticals.
The Chemistry of Polyacrylamide Polymerization
The formation of a polyacrylamide gel is a process of free-radical polymerization that creates a cross-linked, three-dimensional network. This network is built from two primary constituents: acrylamide monomers, which form the backbone of the polymer chains, and bisacrylamide (N,N'-methylenebisacrylamide), a cross-linking agent that connects the linear polymer chains [44] [45].
The polymerization reaction is initiated by a system comprising two components: ammonium persulfate (APS) and N,N,N',N'-tetramethylethylenediamine (TEMED) [22] [45]. TEMED catalyzes the decomposition of APS to generate free radicals. These radicals then activate the acrylamide monomers, converting them into free-radical states that react with other monomers to form growing polymer chains. The bisacrylamide molecules, which contain two acrylamide functional groups, incorporate into these chains and create covalent bridges between them, resulting in a cross-linked mesh [45]. The polymerization process is highly sensitive to oxygen, which can quench the free radicals and inhibit gel formation. To prevent this, solutions are often degassed or polymerized in sealed containers [45].
The physical properties of the final gel are profoundly influenced by the polymerization conditions. The concentration of the catalysts (APS and TEMED) affects the chain length of the polymer; excess catalyst can lead to the formation of many short, brittle chains, whereas insufficient catalyst results in a weak, overly porous gel [45]. Furthermore, the temperature of polymerization must be carefully controlled, with an optimum around 23-25°C. Higher temperatures accelerate the reaction but can produce brittle and opaque gels, while lower temperatures delay gelation and create opaque, inelastic matrices [45].
Controlling Pore Size for Biomolecular Separation
The pore size of the polyacrylamide gel is the critical parameter that dictates its sieving properties, and it is precisely controlled by adjusting the concentrations of the starting materials.
Mathematical Determination of Pore Size
The pore size is determined by two key variables: the total concentration of acrylamide (%T) and the degree of cross-linking (%C). These are defined as follows [45]:
- %T (Total monomer concentration): The mass of both acrylamide and bisacrylamide in grams per 100 mL of solution. Formally, T = (a + b)/V x 100%, where
ais the mass of acrylamide,bis the mass of bisacrylamide, andVis the total volume. - %C (Cross-linker concentration): The percentage of the total monomer mass that is made up by the cross-linker. Formally, C = b/(a + b) x 100%.
As a general rule, increasing %T decreases the average pore size of the gel, creating a denser matrix that is more effective at retarding the migration of larger molecules [44] [45]. The %C also has a parabolic effect on pore size; the smallest pores are formed at a %C of about 5%, with pore size increasing at both higher and lower cross-linker concentrations [44] [45]. For most protein separations, a %C of 3% is standard, while for nucleic acids, a %C of 5% is typical [45].
Table 1: Standard Polyacrylamide Gel Formulations for Protein Separation by Molecular Weight
| Percentage Acrylamide (%T) | Effective Separation Range (kDa) | Common Application |
|---|---|---|
| 15% | 10 – 50 kDa | Low molecular weight peptides and proteins |
| 12% | 40 – 100 kDa | Standard separation for many proteins |
| 10% | 70 kDa and larger | High molecular weight proteins |
| 4-20% Gradient | 5 – 200 kDa | Broad-range separation without pre-casting multiple gels |
Advanced Methods for Pore Size Engineering
Beyond simply adjusting %T and %C, more advanced methodologies exist to engineer gel pore structure. One innovative approach involves carrying out the polymerization within a lyotropic surfactant template [46] [47]. A study demonstrated that using the nonionic surfactant TERIC BL8 at concentrations above 10% (w/v) during polymerization leads to the formation of a gel with a significantly more open and larger-pore structure, even while maintaining a high cross-link density. This results in membranes that possess both large pore sizes and high mechanical strength, which is advantageous for the separation of very large biomolecules. In contrast, the ionic surfactant SDS was found to have little effect on the pore size at concentrations up to 4% (w/v) [46] [47].
The properties of the gel can also be altered by additives. While denaturants like SDS can be added without drastically altering the gel's matrix, other additives like urea and formamide not only denature the sample molecules but also disrupt hydrogen bonding between acrylamide monomers, leading to a gel with an effectively smaller pore size [45].
The Role of SDS in Protein Denaturation and Charge Impartation
For SDS-PAGE to separate proteins based solely on size, the proteins must be denatured and endowed with a uniform charge-to-mass ratio. This is the function of Sodium Dodecyl Sulfate (SDS).
Mechanism of SDS-Induced Protein Denaturation
The mechanism of SDS denaturation is a complex, multi-stage process. SDS is an amphipathic molecule, consisting of a hydrophobic 12-carbon tail and a hydrophilic sulfate head group [9]. Its interaction with proteins begins at low, sub-micellar concentrations, where SDS monomers bind to proteins predominantly via hydrophobic interactions [3]. This binding disrupts the protein's tertiary structure, leading to its initial unfolding [3] [9].
As the concentration of SDS increases to levels above its critical micelle concentration (CMC), which is between 7-10 mM, the nature of the interaction changes [22]. At these concentrations, SDS forms micelles and the unfolding process enters a phase of chain expansion. This expansion is driven by two factors: the continued binding of SDS to the hydrophobic regions of the now-unfolded polypeptide chain, and the coulombic repulsion between the negatively charged sulfate groups of the bound SDS micelles, as well as between these micelles and the anionic side chains of the protein itself [3]. A molecular dynamics simulation study on human ubiquitin revealed that at elevated temperatures (370 K), SDS molecules disrupt the protein's first hydration shell and expand its hydrophobic core, resulting in complete unfolding [9].
Imparting a Uniform Negative Charge
Upon boiling a protein sample in the presence of SDS and a reducing agent (which breaks disulfide bonds), the protein is fully denatured into a linear polypeptide chain. SDS binds to the polypeptide backbone at a relatively constant ratio of approximately 1.4 g SDS per 1 g of protein, which translates to about one SDS molecule for every two amino acid residues [22]. This saturation coating masks the protein's intrinsic charge, whether positive or negative. The result is that all SDS-bound protein complexes are endowed with a very similar, high negative charge-to-mass ratio [22] [44]. This transformation is crucial, as it ensures that when an electric field is applied, all proteins will migrate towards the anode with a mobility dependent almost entirely on their ability to navigate the pores of the polyacrylamide gel, which is a function of their molecular size.
Diagram 1: Mechanism of SDS-Mediated Protein Denaturation and Charge Impartation
Experimental Protocols for Gel Polymerization and Analysis
This section provides a detailed methodology for preparing and utilizing polyacrylamide gels for protein separation, incorporating key experimental considerations.
Protocol: Casting a Discontinuous SDS-Polyacrylamide Gel
Principle: Discontinuous gel systems use a stacking gel (lower %T, pH ~6.8) and a resolving gel (higher %T, pH ~8.8) to first concentrate proteins into a sharp band before they enter the resolving gel for separation based on size [22] [10].
Reagents:
- 30% Acrylamide/Bis-acrylamide solution (29:1 ratio for 3.3% C)
- 1.5 M Tris-HCl, pH 8.8 (Resolving Gel buffer)
- 0.5 M Tris-HCl, pH 6.8 (Stacking Gel buffer)
- 10% Sodium Dodecyl Sulfate (SDS)
- 10% Ammonium Persulfate (APS) - prepared fresh
- N,N,N',N'-Tetramethylethylenediamine (TEMED)
- Water-saturated butanol or isopropanol
- Distilled water
Procedure:
- Assemble Gel Caster: Clean and dry two glass plates and spacers. Assemble the cassette according to the manufacturer's instructions and ensure it is sealed and level.
- Prepare Resolving Gel: Choose a %T based on your target protein sizes (see Table 1). For a 12% resolving gel, mix the following in a beaker: 4.0 mL of 30% Acrylamide/Bis mix, 2.5 mL of 1.5 M Tris-HCl (pH 8.8), 3.4 mL distilled water, 100 µL of 10% SDS. Degas the solution for 10-15 minutes under a vacuum to remove dissolved oxygen.
- Initiate Polymerization: Add 50 µL of 10% APS and 5 µL of TEMED to the degassed resolving gel solution. Swirl gently to mix. Note: Polymerization will begin immediately; work swiftly.
- Pour and Overlay: Immediately pipette the resolving gel solution into the gel cassette. Leave space for the stacking gel. Carefully overlay the gel solution with a few hundred microliters of water-saturated butanol or isopropanol to exclude air and create a flat meniscus.
- Polymerize: Allow the gel to polymerize completely for 30-45 minutes at room temperature. A distinct refractive interface will appear between the gel and the overlay.
- Prepare and Pour Stacking Gel: Once polymerized, pour off the overlay and rinse the top of the gel with distilled water. In a new beaker, mix: 670 µL of 30% Acrylamide/Bis mix, 1.25 mL of 0.5 M Tris-HCl (pH 6.8), 3.0 mL distilled water, 50 µL of 10% SDS. Degas briefly. Add 25 µL of 10% APS and 5 µL of TEMED, mix, and pipette onto the top of the resolving gel.
- Insert Comb: Immediately insert a clean sample comb without introducing bubbles. Allow the stacking gel to polymerize for 20-30 minutes.
Protocol: Protein Denaturation and Electrophoresis
Principle: Proteins are denatured and reduced to their primary structure, coated with SDS, and then separated electrophoretically [22] [44].
Reagents:
- 2X or 5X Laemmli Sample Buffer (containing SDS, glycerol, bromophenol blue, and Tris-HCl; for reducing conditions, also contains β-mercaptoethanol or DTT)
- SDS-PAGE Running Buffer (e.g., 25 mM Tris, 192 mM Glycine, 0.1% SDS, pH ~8.3)
- Prestained Protein Molecular Weight Marker
- Heating block (95-100 °C)
Procedure:
- Sample Preparation: Mix protein sample with an equal volume of 2X Laemmli sample buffer. For reducing conditions, ensure the sample buffer contains a reducing agent like dithiothreitol (DTT) at 10-100 mM [22] [48].
- Denaturation: Heat the sample-protein mixture at 95-100 °C for 5 minutes [22]. This heat treatment disrupts hydrogen bonds and secondary structure, ensuring complete denaturation in the presence of SDS.
- Loading and Electrophoresis: Assemble the gel in the electrophoresis tank filled with running buffer. Carefully remove the comb and load the denatured samples and molecular weight marker into the wells. Run the gel at a constant voltage (typically 100-150 V for mini-gels) until the dye front reaches the bottom of the gel.
Table 2: Research Reagent Solutions for SDS-PAGE
| Reagent | Function | Key Considerations |
|---|---|---|
| Acrylamide/Bis-acrylamide | Monomer and cross-linker for gel matrix formation. | Neurotoxin in monomeric form; handle with gloves. Standard C-value is 3% for proteins. |
| Ammonium Persulfate (APS) | Free radical initiator for polymerization. | Prepare fresh solutions for consistent results. |
| TEMED | Catalyst that accelerates free radical generation from APS. | Concentration affects polymerization rate and gel quality. |
| SDS (Sodium Dodecyl Sulfate) | Denatures proteins and imparts uniform negative charge. | Binds ~1.4g per 1g of protein; use high-purity grade. |
| Tris-Glycine Buffer | Discontinuous buffer system for stacking and separation. | pH gradient (6.8/8.8) is critical for stacking effect. |
| Dithiothreitol (DTT) | Reducing agent that breaks disulfide bonds. | Essential for analyzing quaternary structure; use fresh. |
Diagram 2: SDS-PAGE Gel Casting and Sample Preparation Workflow
The polymerization of polyacrylamide gels is a precise science where chemistry and physics converge to create a tailored separation matrix. A deep understanding of how %T and %C dictate pore size, coupled with insights into advanced engineering techniques like surfactant templating, empowers researchers to design gels for specific applications. This control over the gel matrix is fundamentally intertwined with the action of SDS, which homogenizes proteins into linear, negatively charged entities. Together, the scientifically-designed gel and the predictable behavior of SDS-protein complexes enable the powerful and ubiquitous technique of SDS-PAGE. For drug development professionals and researchers, mastering this interplay is not a mere technicality but a prerequisite for generating robust, reliable, and interpretable protein data, ultimately fueling discovery and innovation.
The discontinuous buffer system, a cornerstone of sodium dodecyl sulfate-polyacrylamide gel electrophoresis (SDS-PAGE), is a sophisticated electrophoretic technique that enables high-resolution separation of polypeptides primarily by molecular weight. This methodology is fundamental to protein research, providing a critical tool for analyses ranging from purity assessment to western blotting. The system's efficacy hinges on a two-stage gel matrix—comprising distinct stacking and resolving zones—and a complementary Tris-glycine buffer system that collectively concentrate protein samples into sharp bands before their size-based separation. Framed within the broader context of protein denaturation mechanisms, this technique leverages the uniform negative charge imparted by SDS to nullify intrinsic charge differences between proteins, ensuring that separation reflects polypeptide chain length rather than native charge or structure. This whitepaper details the underlying principles, precise methodologies, and key reagents of the discontinuous buffer system, providing researchers and drug development professionals with an in-depth technical guide to its application and optimization.
SDS-PAGE is an indispensable laboratory technique for separating proteins with molecular masses between approximately 5 and 250 kDa [22]. The method relies on the powerful anionic detergent sodium dodecyl sulfate (SDS) to denature proteins and confer upon them a uniform negative charge. This process effectively eliminates the influence of a protein's native three-dimensional structure and intrinsic charge, allowing separation based almost exclusively on polypeptide chain length [18] [49].
The denaturation mechanism of SDS is twofold. First, SDS disrupts virtually all non-covalent interactions—including hydrogen bonds and hydrophobic interactions—that stabilize secondary and tertiary protein structures [6]. This interaction unfolds proteins into linear polypeptide chains. Second, SDS binds to the denatured polypeptides in a constant weight ratio of approximately 1.4 g SDS per 1 g of polypeptide, which corresponds to approximately one SDS molecule per two amino acid residues [18] [22]. This uniform binding coats the proteins with negative charges, overwhelming any intrinsic charge the protein may possess and ensuring all SDS-polypeptide complexes migrate toward the anode during electrophoresis [50] [26]. The discontinuous nature of the buffer system, utilizing both stacking and resolving gels with different pore sizes and pH values, further enhances resolution by concentrating samples into sharp bands before separation occurs [22].
Core Principles of the Discontinuous Buffer System
The discontinuous buffer system, pioneered by Ulrich Laemmli, employs differences in gel composition and pH to achieve superior protein separation compared to continuous systems [22]. This system is "discontinuous" in three key aspects: the gel structure, the buffer ions, and the pH environment.
The Two-Gel Structure: Stacking and Resolving Gels
The polyacrylamide gel consists of two distinct sections layered atop one another:
The Stacking Gel: This upper gel layer features a lower percentage of acrylamide (typically 4-6%) [22] with larger pores, creating a low-resistance path for protein migration. It is cast at a lower pH (approximately pH 6.8) [18] [22]. Its primary function is to concentrate the protein samples from the relatively large volume loaded into the wells into extremely sharp, tight bands before they enter the resolving gel. This concentration step occurs within the first few minutes of electrophoresis and is crucial for achieving high-resolution separation [50].
The Resolving Gel: Also called the separating gel, this lower layer has a higher acrylamide concentration (typically 10-12%, though gradient gels are also used) [22] with smaller pores. It is cast at a higher pH (approximately pH 8.8) [18] [22]. This gel acts as a molecular sieve, where the actual separation of proteins based on molecular weight occurs. Smaller polypeptides navigate the porous matrix more easily and migrate farther, while larger polypeptides are retarded [18].
The Role of Buffer Ions and pH
The process relies on a carefully orchestrated interplay between different ions within the Tris-glycine-chloride buffer system [22]:
- Chloride Ions (Cl⁻): Present in the gel buffers and running buffer, these are highly mobile "leading" ions that migrate rapidly ahead of the proteins toward the anode.
- Glycinate Ions (NH₂CH₂COO⁻): From the running buffer, these initially act as "trailing" ions in the low-pH stacking gel, where they exist predominantly in a zwitterionic form with reduced mobility.
- Proteins: The SDS-coated proteins possess a strong negative charge and mobility that places them between the fast-moving chloride ions and the slower glycinate ions.
The critical stacking effect occurs at the interface between the stacking and resolving gels. As the ions reach the higher-pH resolving gel, the glycinate ions shed their protons, becoming more negatively charged and highly mobile. They overtake the proteins, which are then left to migrate through the resolving gel based solely on their size. This transition zone creates a sharp boundary that compresses the protein samples into fine bands, a phenomenon known as the "stacking effect" [22].
Table 1: Composition and Properties of Stacking vs. Resolving Gels
| Parameter | Stacking Gel | Resolving Gel |
|---|---|---|
| Function | Concentrates protein samples into sharp bands [50] | Separates proteins based on molecular weight [18] |
| Typical Acrylamide Concentration | 4% - 6% [22] | 10% - 12% (or gradients from 4-20%) [51] [22] |
| pH | ~6.8 [18] [22] | ~8.8 [18] [22] |
| Pore Size | Larger | Smaller, acts as a molecular sieve [18] |
| Ionic Environment | Glycinate is trailing ion; proteins are intermediate | Glycinate becomes leading ion; separation begins [22] |
Experimental Protocol for Discontinuous SDS-PAGE
The following detailed methodology ensures reliable and reproducible protein separation using the discontinuous buffer system.
Gel Preparation and Casting
The gel is produced by free radical polymerization within a mold, typically consisting of two glass plates separated by spacers [22].
- Assemble Gel Cassette: Thoroughly clean glass plates with ethanol and assemble the gel casting mold with spacers [49].
- Prepare and Pour Resolving Gel: Mix acrylamide (gel-former), bisacrylamide (cross-linker), Tris-HCl buffer (pH 8.8), SDS, and water. To initiate polymerization, add the catalyst TEMED (N,N,N',N'-Tetramethylethylenediamine) and the radical initiator ammonium persulfate (APS) [18] [22]. Pour the solution between the glass plates immediately.
- Overlay with Solvent: To exclude oxygen (which inhibits polymerization) and create a flat gel surface, layer the resolving gel solution with a barely water-soluble alcohol such as isopropanol or water-saturated butanol [22] [49]. Allow polymerization to complete (typically 20-30 minutes).
- Prepare and Pour Stacking Gel: After discarding the overlay, prepare a second solution with a lower percentage of acrylamide and Tris-HCl buffer (pH 6.8). Add APS and TEMED, then pour this stacking gel solution onto the polymerized resolving gel.
- Insert Comb: Carefully insert a sample comb without trapping air bubbles. After polymerization, remove the comb to reveal the sample wells [22] [49].
Sample Preparation
Proper sample preparation is critical for successful denaturation and separation.
- Mix with Sample Buffer: Combine the protein sample with an equal volume of 2X SDS-PAGE sample buffer. A standard sample buffer contains: SDS (for denaturation and charge), Tris-Cl (as buffer), glycerol (to increase density), a reducing agent (DTT or β-mercaptoethanol to break disulfide bonds), and a tracking dye (bromophenol blue) [51] [52].
- Denature Proteins: Heat the samples at 95°C for 5 minutes (or 70°C for 10 minutes) [51] [22]. Heating disrupts hydrogen bonds and completes the denaturation process, ensuring proteins are linearized [50].
- Centrifuge: After heating, centrifuge the samples briefly (e.g., 3 minutes in a microcentrifuge) to pellet any insoluble debris [51].
Electrophoresis
- Assemble Apparatus: Mount the gel cassette in the electrophoresis chamber and fill both the inner and outer chambers with running buffer (e.g., Tris-glycine-SDS buffer) [51].
- Load Samples: Using a micropipette, load the prepared samples and molecular weight markers into the wells [49].
- Apply Current: Connect the power supply, applying a constant voltage of 100-150 V. The dye front (bromophenol blue) will migrate through the gel, indicating progress [51] [22].
- Terminate Run: Turn off the power when the dye front reaches the bottom of the gel [51] [49].
Post-Electrophoresis Analysis
- Protein Detection: After electrophoresis, proteins can be visualized in the gel using stains such as Coomassie Brilliant Blue or silver stain [6].
- Western Blotting: Alternatively, separated proteins can be transferred from the gel onto a membrane for immunodetection (western blotting) [53] [18].
Key Visualization Workflows
SDS-PAGE Separation Workflow
Ion Migration in Discontinuous System
The Scientist's Toolkit: Essential Research Reagents
Successful execution of discontinuous SDS-PAGE requires precise preparation and use of specific reagents, each serving a critical function in the denaturation, separation, and visualization processes.
Table 2: Essential Reagents for Discontinuous SDS-PAGE
| Reagent | Function | Key Details |
|---|---|---|
| SDS (Sodium Dodecyl Sulfate) | Denatures proteins by disrupting non-covalent bonds; imparts uniform negative charge [50] [6] | Binds at ~1.4 g per 1 g of polypeptide; overcomes intrinsic protein charge [18] [22] |
| Acrylamide/Bis-acrylamide | Forms the cross-linked polyacrylamide gel matrix that acts as a molecular sieve [18] [22] | Bis-acrylamide is the cross-linker; total concentration and ratio determine gel pore size [18] |
| APS & TEMED | Initiates and catalyzes gel polymerization [18] [22] | APS (Ammonium Persulfate) generates free radicals; TEMED catalyzes the reaction [50] |
| Tris-HCl Buffers | Maintains required pH in stacking (pH ~6.8) and resolving (pH ~8.8) gels [18] [22] | pH discontinuity is crucial for the stacking effect and proper ion mobility [22] |
| Reducing Agent (DTT/BME) | Cleaves disulfide bonds to complete protein denaturation [52] [50] | Dithiothreitol (DTT) or β-mercaptoethanol (BME) reduces cysteine bridges [51] [52] |
| Glycine | Key trailing/leading ion in the running buffer for the discontinuous system [22] | Mobility changes with pH, enabling stacking at the gel interface [22] |
| Tracking Dye | Visualizes electrophoresis progress [52] | Bromophenol blue migrates ahead of most proteins; marks buffer front [22] |
The discontinuous buffer system, with its strategic use of stacking and resolving gels, remains a foundational technique in molecular biology and proteomics. By leveraging the denaturing power of SDS to impart a uniform negative charge and employing a discontinuous ionic and pH environment, this method achieves high-resolution separation of polypeptides based primarily on molecular weight. The detailed protocols and reagent knowledge provided in this guide empower researchers to consistently perform this technique, enabling critical advancements in protein characterization, expression analysis, and drug development. As protein research continues to evolve, the principles of the discontinuous buffer system will undoubtedly remain integral to the scientist's analytical toolkit.
The accurate determination of protein molecular weight is a cornerstone of biochemical research and biopharmaceutical development. Sodium dodecyl sulfate-polyacrylamide gel electrophoresis (SDS-PAGE) remains the most widely employed technique for this purpose, relying on the denaturing action of SDS to impart a uniform negative charge and unfold proteins into linear chains. This technical guide provides an in-depth examination of the methodology for determining protein molecular weight using protein ladders and standard curves, framed within the context of how SDS denatures proteins and imparts negative charge. We detail experimental protocols, data analysis techniques, and troubleshooting approaches to enable researchers to obtain precise molecular weight estimates, a critical parameter in protein characterization, quality control, and drug development pipelines.
The fundamental principle enabling molecular weight determination by SDS-PAGE is the predictable denaturation of proteins by sodium dodecyl sulfate (SDS). This anionic detergent plays a dual role: it unfolds proteins into linear polypeptides and confers upon them a uniform negative charge density.
Mechanism of SDS-Induced Protein Denaturation
SDS denatures proteins through a multi-step process that disrupts higher-order protein structures. The hydrophobic tail of SDS interacts strongly with hydrophobic regions of the protein, while the sulfate head group confers charge. This interaction disrupts hydrogen bonds and hydrophobic interactions that maintain secondary and tertiary structures [6]. Research demonstrates that SDS can unfold proteins even in the absence of formal protein charges, indicating that hydrophobic interactions primarily drive the initial binding and unfolding process [54]. At micellar concentrations, coulombic repulsion between protein-bound SDS micelles and anionic amino acid side chains further drives polypeptide chain expansion [3].
The result is that most proteins bind SDS in a constant weight ratio of approximately 1.4 g SDS per 1 g of protein [55]. This extensive coating masks the protein's intrinsic charge and creates a uniform charge-to-mass ratio. Consequently, when subjected to an electric field, all SDS-bound proteins migrate toward the anode with mobility dependent primarily on molecular size rather than native charge [26].
Essential Reagents and Materials
Successful molecular weight determination requires careful selection and preparation of reagents. The table below summarizes key research reagent solutions and their functions in the SDS-PAGE process.
Table 1: Essential Research Reagents for SDS-PAGE Molecular Weight Determination
| Reagent/Solution | Composition | Primary Function |
|---|---|---|
| Sample Loading Buffer | Tris-HCl, SDS, glycerol, bromophenol blue, reducing agents (BME or DTT) [55] [10] | Denatures proteins, provides density for loading, includes tracking dye |
| Running Buffer | Tris, glycine, SDS [55] | Conducts current, maintains pH, continues protein denaturation |
| Stacking Gel | Low-concentration acrylamide, Tris-HCl (pH ~6.8) [10] | Concentrates proteins into sharp bands before resolving gel |
| Resolving Gel | Varying acrylamide concentrations, Tris-HCl (pH ~8.8) [10] | Separates proteins based on molecular size |
| Protein Ladders | Purified proteins of known molecular weight [56] [57] | Provides calibration standards for molecular weight estimation |
Experimental Protocol
Sample Preparation
- Dilution: Dilute protein samples and standards in appropriate buffer. For total protein concentration determination, use assays such as Bradford, Lowry, or BCA [10].
- Denaturation: Mix protein sample with 4X reducing sample buffer (e.g., Laemmli buffer) containing SDS and β-mercaptoethanol or DTT. Typical ratio is 3:1 (sample:buffer) [7].
- Heating: Heat samples at 70-100°C for 5-10 minutes to ensure complete denaturation and reduction of disulfide bonds [7] [10].
Electrophoresis
- Gel Selection: Choose appropriate acrylamide concentration based on target protein size:
- 15%: optimal for 10-50 kDa proteins
- 12%: optimal for 40-100 kDa proteins
- 10%: optimal for proteins >70 kDa [10]
- Loading: Load equal volumes of pre-stained or unstained protein ladder and unknown protein samples into separate wells. For precise determination, load 5-25 μg of total protein per well [7].
- Electrophoresis Conditions: Run gels at constant voltage (150-200V) until the dye front reaches the bottom of the gel (typically 45-90 minutes) [7].
Protein Detection
- Fixation: Immerse gel in acetic acid/methanol solution to precipitate and fix proteins in the gel matrix [26].
- Staining: Incubate with Coomassie Blue R250 or silver stain to visualize protein bands [26] [6].
- Destaining: Remove excess stain through repeated washing with destaining solution (typically acetic acid/methanol/water) [26].
Data Analysis and Standard Curve Construction
Measuring Migration Distances
- Following electrophoresis and staining, measure the migration distance of each protein band in the ladder and unknown samples from the top of the resolving gel.
- Calculate the relative front (Rf) for each band using the formula: Rf = Migration distance of protein / Migration distance of dye front [58]
Preparing Standard Curves
Protein ladders typically contain multiple proteins of known molecular weight. Common standard mixtures include:
Table 2: Example Protein Standard Mixtures for Molecular Weight Calibration
| Protein Standard | Molecular Weight (kDa) | Source |
|---|---|---|
| Myosin | 200,000 | Porcine muscle |
| β-Galactosidase | 116,000 | E. coli |
| Phosphorylase B | 97,400 | Rabbit muscle |
| Bovine Serum Albumin | 66,000 | Bovine |
| Ovalbumin | 45,000 | Chicken egg white |
| Carbonic Anhydrase | 29,000 | Bovine erythrocytes |
| Trypsin Inhibitor | 20,100 | Soybean |
| α-Lactalbumin | 14,200 | Bovine milk [56] |
- Plot the logarithm of molecular weight (log MW) against Rf for each standard protein.
- Generate a standard curve using linear regression. The resulting plot typically produces a sigmoidal curve, though the central region is often linear for appropriately sized proteins within the gel's separation range [56] [58].
Calculating Unknown Molecular Weights
- Determine the Rf value for the unknown protein band.
- Locate this Rf value on the standard curve and read the corresponding log MW value.
- Calculate the molecular weight using the formula: MW = 10^(log MW)
For example, if an unknown protein has an Rf of 0.7084 and the standard curve equation is y = -2.0742x + 2.8, then: Log(MW) = (-2.0742 × 0.7084) + 2.8 = 1.3305 MW = 10^1.3305 = 21.4 kDa [58]
Advanced Considerations and Troubleshooting
Factors Affecting Accuracy
- Gel System Variations: Protein mobilities differ between SDS-PAGE buffer systems (e.g., Bis-Tris vs. Tris-glycine) due to pH effects on SDS binding [57]. Always use appropriate molecular weight standards matched to your gel system.
- Post-Translational Modifications: Glycosylation or phosphorylation can alter SDS binding and migration, leading to inaccurate molecular weight estimates [55] [58].
- Linear Range: Ensure unknown proteins fall within the linear range of the standard curve for accurate interpolation [58].
Troubleshooting Common Issues
Table 3: Troubleshooting Common SDS-PAGE Problems
| Issue | Possible Cause | Solution |
|---|---|---|
| Smiling Bands | Buffer/gel heating during electrophoresis | Check running buffer composition; reduce voltage [10] |
| Smeared Bands | Incomplete denaturation; high salt concentration | Add fresh reducing agent; boil samples 5+ minutes; reduce salt concentration [10] |
| Multiple Bands | Protein degradation or modification | Use protease inhibitors; include phosphatase inhibitors [10] |
| Weak/Faint Bands | Incorrect protein concentration | Determine protein concentration before loading; adjust loading amount [10] |
Comparison with Native Techniques
While SDS-PAGE provides excellent resolution for molecular weight determination under denaturing conditions, alternative methods preserve native protein properties:
- Blue Native (BN)-PAGE: Maintains protein function and non-covalently bound cofactors but offers lower resolution than SDS-PAGE [7].
- Native PAGE: Separates proteins based on both charge and size, preserving oligomeric structures but complicating molecular weight interpretation [10].
Recent advancements include Native SDS-PAGE (NSDS-PAGE), which modifies standard SDS-PAGE conditions by reducing SDS concentration and eliminating heating steps. This approach retains zinc ions in metalloproteins and preserves enzymatic activity in 7 of 9 model enzymes while maintaining high resolution separation [7].
The determination of protein molecular weight using protein ladders and standard curves in SDS-PAGE remains an essential technique in biochemical research and drug development. The fundamental process relies on the predictable denaturation of proteins by SDS, which imparts a uniform negative charge and linearizes polypeptides. Through careful experimental execution, appropriate standard curve construction, and awareness of methodological limitations, researchers can obtain accurate molecular weight estimates with typical accuracy of 5-10% [58]. As protein therapeutics continue to grow in importance, precise molecular weight determination remains critical for characterizing biologics, ensuring quality control, and advancing pharmaceutical development.
Sodium Dodecyl Sulfate-Polyacrylamide Gel Electrophoresis (SDS-PAGE) serves as a cornerstone technique in biochemical research, providing a robust method for separating proteins based on their molecular weight. This technical guide explores the fundamental principles of how SDS denatures proteins and imparts a uniform negative charge, facilitating precise electrophoretic separation. We examine the critical applications of SDS-PAGE in protein purity assessment and its indispensable role as a preliminary step in Western blotting. The whitepaper provides detailed methodologies for core experiments, troubleshooting guidance, and advanced technical modifications, offering researchers and drug development professionals comprehensive protocols for implementing these techniques in experimental workflows.
The development of SDS-PAGE in the 1970s by Ulrich Laemmli revolutionized protein analysis by introducing a system that could separate proteins primarily based on molecular weight [15]. This breakthrough transformed protein research by providing a reproducible, high-resolution method for analyzing complex protein mixtures. The technique's enduring relevance stems from its ability to simplify protein complexity through a carefully engineered denaturation process that masks intrinsic protein properties.
At the core of SDS-PAGE functionality lies the synergistic action of SDS and reducing agents. SDS, an anionic detergent, plays a dual role: it disrupts hydrogen bonds and hydrophobic interactions that maintain secondary and tertiary protein structures, and it binds to the unfolded polypeptide chains in a constant weight ratio of approximately 1.4g SDS per 1g of protein [10] [59]. This binding equates to approximately one SDS molecule per two amino acid residues, creating a uniform negative charge density along the polypeptide backbone [59]. Simultaneously, reducing agents such as β-mercaptoethanol or DTT break disulfide bonds that stabilize tertiary and quaternary structures, ensuring complete protein unfolding into linear chains [60].
This process effectively neutralizes the influence of a protein's native charge and three-dimensional conformation, creating a near-linear relationship between a protein's electrophoretic mobility and the logarithm of its molecular weight [15]. The result is a powerful separation technique where migration distance through the polyacrylamide gel matrix inversely correlates with molecular size, enabling accurate protein characterization.
Fundamental Principles of SDS-PAGE
Mechanism of SDS-Protein Interaction
SDS denatures proteins through a multi-stage process that fundamentally alters protein structure. Initially, SDS micelles interact with hydrophobic regions of the protein, creating a core-shell structure where proteins coat the micelle surface [15]. This interaction disrupts non-covalent interactions including hydrogen bonds, hydrophobic interactions, and van der Waals forces that maintain secondary and tertiary structures. The denaturation process unfolds proteins into linear polypeptide chains, with the extent of denaturation influenced by SDS concentration, pH, and specific protein characteristics [15].
The binding of SDS to proteins occurs with remarkable consistency across different protein types when optimal conditions are maintained. Critical parameters for effective SDS binding include:
- Maintaining SDS monomer concentration greater than 1mM to ensure sufficient binding [61]
- Using a weight ratio of SDS to protein of 3:1 to 4:1 to guarantee saturation [61]
- Ensuring low ionic strength in sample buffer (typically 10-100mM) to maintain high SDS monomer concentration [61]
- Complete reduction of disulfide bonds using agents like β-mercaptoethanol or DTT [60]
The resulting SDS-polypeptide complexes adopt a rod-like shape with similar charge-to-mass ratios, allowing separation to proceed primarily based on molecular size rather than intrinsic charge or shape [10] [62].
Electrophoresis and Molecular Sieving
During electrophoresis, an electric field applied across the polyacrylamide gel creates a force that drives the negatively charged SDS-protein complexes toward the anode [10]. The polyacrylamide gel matrix acts as a molecular sieve, with pore sizes determined by the concentration of acrylamide and bisacrylamide cross-linkers [10]. Smaller proteins navigate through these pores more easily and migrate faster, while larger proteins encounter greater resistance and migrate more slowly [15].
The relationship between protein size and migration distance forms the basis for molecular weight determination. By comparing the migration distance of an unknown protein to a standard curve generated by proteins of known molecular weight (MW markers), researchers can estimate the molecular weight of proteins in their samples [10] [15]. This fundamental application makes SDS-PAGE invaluable for protein characterization and identification.
Figure 1: SDS-PAGE Workflow from Protein Denaturation to Separation
SDS-PAGE in Protein Purity Assessment
Principles of Purity Evaluation
SDS-PAGE provides a powerful qualitative method for assessing protein sample purity by visualizing potential contaminants through differential migration patterns. In a pure protein preparation, staining after electrophoresis should reveal a single predominant band corresponding to the protein of interest, while impurities appear as additional bands at different molecular weights [15]. The sensitivity of detection depends on the staining method employed, with Coomassie brilliant blue detecting approximately 50ng, silver staining 1ng, and fluorescent stains offering broad dynamic ranges for precise quantification [15].
The resolution required for effective purity assessment depends on selecting appropriate gel percentages. As shown in Table 1, different acrylamide concentrations optimize separation for specific molecular weight ranges. Gradient gels, which contain varying acrylamide concentrations, can separate proteins across a broad molecular weight spectrum (e.g., 4%-20% gels for 10-200kDa proteins) in a single run, making them particularly valuable for initial purity assessment of unknown samples [10] [62].
Table 1: Gel Percentage Selection Guide for Optimal Protein Separation
| Gel Percentage | Optimal Separation Range | Primary Applications |
|---|---|---|
| 8% | 25-200 kDa | High molecular weight proteins |
| 10% | 15-100 kDa | Standard protein separation |
| 12% | 10-70 kDa | Intermediate molecular weight proteins |
| 15% | 10-50 kDa | Low molecular weight proteins |
| 4-20% Gradient | 10-200 kDa | Broad range separation, purity analysis |
Experimental Protocol: Purity Assessment
Sample Preparation:
- Prepare protein samples in lysis buffer appropriate for your protein localization (e.g., NP-40 for cytoplasmic/nuclear proteins, stronger detergents for membrane proteins) [60].
- Quantify protein concentration using Bradford, Lowry, or BCA assays to ensure equal loading [10].
- Mix protein sample with 2X Laemmli sample buffer (containing SDS and β-mercaptoethanol or DTT) at a 1:1 ratio [62]. Final SDS concentration should ensure a 3:1 to 4:1 SDS:protein weight ratio [61].
- Heat samples at 95°C for 5 minutes to ensure complete denaturation [62].
- Centrifuge at 14,000 × g for 3 minutes to pellet insoluble debris [62].
Gel Electrophoresis:
- Select appropriate gel percentage based on protein size (refer to Table 1) or use gradient gels for broad separation [10] [62].
- Load molecular weight markers (5μL) and samples (5-35μL, containing 1-17.5μg total protein) into wells [62].
- Assemble electrophoresis chamber and fill with 1X running buffer (e.g., Tris-glycine-SDS) [62].
- Run gel at constant voltage (100-150V for mini-gels) until dye front reaches bottom (approximately 45-90 minutes) [62] [15].
Visualization and Analysis:
- Carefully remove gel from plates and stain with appropriate dye:
- Destain gel to remove background staining using methanol-acetic acid solution (Coomassie) or specific destaining solutions [15].
- Image gel using documentation system and analyze band patterns.
- Assess purity by examining presence of additional bands beyond the protein of interest.
Troubleshooting Purity Assessment
Common issues in purity assessment include:
- Multiple bands in purified samples: May indicate protein degradation (use protease inhibitors), incomplete denaturation (fresh reducing agents), or presence of protein modifications [10].
- Smearing: Can result from insufficient reduction/denaturation, protein aggregation, or overloading [10].
- Unexpected molecular weights: May indicate post-translational modifications, alternative splicing, or proteolytic cleavage [63].
SDS-PAGE as a Foundation for Western Blotting
The SDS-PAGE/Western Blot Continuum
Western blotting builds directly upon the separation achieved through SDS-PAGE, transferring the resolved proteins to a solid membrane support for specific immunodetection [60]. The denaturing conditions of SDS-PAGE are particularly advantageous for Western blotting as they expose epitopes that might otherwise be buried in native protein conformations, enhance antibody accessibility, and ensure proteins are separated primarily by molecular weight, facilitating accurate identification [60].
The transition from SDS-PAGE to Western blotting requires careful optimization, as the presence of SDS can sometimes interfere with antibody binding. While SDS is essential for separation, its concentration in the transfer buffer must be balanced (typically 0.01-0.1%) to maintain protein denaturation without disrupting protein-membrane binding or antigen-antibody interactions [60]. For certain applications, particularly detection of post-translational modifications like phosphorylation, reduced SDS concentrations or alternative buffer systems may be necessary to preserve antibody recognition [60].
Integrated SDS-PAGE/Western Blot Protocol
Protein Separation by SDS-PAGE:
- Extract proteins using appropriate lysis buffer supplemented with protease and phosphatase inhibitors to prevent degradation and maintain modification states [60].
- Quantify protein concentration and adjust to ensure equal loading across lanes (typically 20-30μg per lane for complex mixtures) [10] [63].
- Prepare samples in 2X reducing sample buffer, heat at 95°C for 5 minutes, and centrifuge [62].
- Load samples and molecular weight markers (pre-stained markers recommended for transfer monitoring) [10].
- Perform electrophoresis using conditions optimized for your protein size (see Section 3.2).
Protein Transfer:
- Following electrophoresis, equilibrate gel in transfer buffer for 15 minutes [60].
- Prepare PVDF membrane by activating in methanol for 1 minute, then equilibrate in transfer buffer [60].
- Assemble transfer stack in the following order (from anode to cathode):
- Filter paper
- PVDF membrane
- Gel
- Filter paper
- Remove all air bubbles between layers by rolling with a glass rod as air bubbles prevent efficient transfer [60].
- Transfer using wet or semi-dry systems:
- Wet Transfer: 100V for 60 minutes or 30V overnight at 4°C
- Semi-dry Transfer: 15-25V for 30-45 minutes
- Verify transfer efficiency using reversible stains like Ponceau S or by visualizing pre-stained markers [10].
Immunodetection:
- Block membrane with 5% non-fat dry milk or BSA in TBST for 1 hour at room temperature to prevent non-specific antibody binding [60].
- Incubate with primary antibody diluted in blocking buffer (optimize concentration through titration) for 1 hour at room temperature or overnight at 4°C [60].
- Wash membrane 3-5 times for 5 minutes each with TBST.
- Incubate with HRP-conjugated secondary antibody specific to primary antibody host species, diluted in blocking buffer for 1 hour at room temperature [60].
- Wash membrane 3-5 times for 5 minutes each with TBST.
- Detect using enhanced chemiluminescence (ECL) substrates and visualize with imaging system [60].
Figure 2: Integrated Western Blot Workflow Following SDS-PAGE Separation
Essential Controls for Western Blotting
Appropriate controls are critical for validating Western blot results:
- Loading Controls: Housekeeping proteins (e.g., β-actin, GAPDH) confirm equal loading across lanes and normalize quantification [10].
- Negative Controls: Tissues or cells known not to express the target protein identify non-specific antibody binding [10].
- No-Primary Antibody Controls: Omission of primary antibody detects secondary antibody non-specificity [10].
- Positive Controls: Samples known to contain the target protein confirm antibody functionality [10].
Technical Optimization and Troubleshooting
Optimizing Separation Conditions
Several factors influence SDS-PAGE resolution and require optimization for specific applications:
Gel Composition:
- Standard Tris-glycine gels provide excellent separation for 10-300kDa proteins but have limited shelf life [61].
- Bis-Tris gels (Mops/Mes buffer systems) offer improved stability and sharper bands, with Mops optimizing 15-250kDa separation and Mes optimizing 3.5-160kDa separation [61].
- Tricine buffer systems enhance separation of small peptides (1-30kDa) [10] [61].
- Tris-acetate systems improve resolution of large proteins (up to 500kDa) [61].
Electrophoresis Conditions:
- Voltage: 100-150V for standard mini-gels; higher voltages reduce run time but may cause heating artifacts [62] [15].
- Temperature: Run at 4°C or with cooling apparatus to prevent "smiling" bands caused by uneven heating [10].
- Run time: Continue until dye front reaches bottom (approximately 45-90 minutes); excessive run times can cause loss of small proteins from gel bottom [15].
Troubleshooting Common Issues
Table 2: Troubleshooting Common SDS-PAGE and Western Blot Problems
| Problem | Possible Causes | Solutions |
|---|---|---|
| "Smiling" or "Frowning" Bands | Uneven buffer distribution, excessive voltage, temperature gradients | Ensure uniform buffer levels, reduce voltage, run in cold room or with cooling [10] [15] |
| Poor Separation/ Smeared Bands | Incomplete denaturation, insufficient reducing agent, protein degradation | Add fresh reducing agent, boil samples 5+ minutes, use protease inhibitors [10] [63] |
| High Background (Western) | Inadequate blocking, antibody concentration too high, insufficient washing | Optimize blocking conditions (milk vs. BSA), titrate antibodies, increase wash stringency [63] |
| No Signal (Western) | Insensitive detection, transfer failure, inactive antibodies | Verify transfer with Ponceau staining, use positive controls, try more sensitive ECL [63] |
| Multiple Non-specific Bands | Antibody cross-reactivity, protein aggregation, degradation | Include negative controls, optimize antibody concentration, use fresh protease inhibitors [10] [63] |
Advanced Applications and Future Directions
Native SDS-PAGE for Functional Analysis
A significant limitation of conventional SDS-PAGE is the complete denaturation of proteins, destroying functional properties including enzymatic activity and non-covalently bound cofactors [7]. Native SDS-PAGE (NSDS-PAGE) addresses this limitation by modifying standard conditions - reducing SDS concentration in running buffer (0.0375% vs. standard 0.1%), eliminating EDTA from buffers, and omitting the heating step during sample preparation [7].
This modified approach maintains high resolution separation while preserving functional properties. Research demonstrates that Zn²⁺ retention in proteomic samples increases from 26% with standard SDS-PAGE to 98% with NSDS-PAGE, with seven of nine model enzymes retaining activity after separation [7]. This advancement enables electrophoretic separation coupled with functional analysis, particularly valuable for metalloprotein research and activity-based proteomics.
Two-Dimensional Electrophoresis
For analyzing complex protein mixtures, two-dimensional electrophoresis (2-DE) combines isoelectric focusing (IEF) with SDS-PAGE to separate proteins based on both isoelectric point and molecular weight [15]. This technique can resolve thousands of proteins in a single gel, enabling comprehensive proteomic analysis, detection of post-translational modifications, and identification of protein isoforms [15]. Recent advances have improved 2-DE reproducibility, resolution, and compatibility with downstream mass spectrometry analysis.
Automated Western Blotting Systems
Technological advancements have led to the development of automated Western blotting systems such as the Simple Western platform, which uses capillary electrophoresis to separate samples followed by automated immunodetection [60]. These systems offer fully quantitative and reproducible results with reduced hands-on time, total protein normalization, and flexible multiplex detection strategies [60]. While maintaining the specificity of traditional Western blotting, automated systems enhance throughput, reproducibility, and quantification capabilities.
Essential Reagent Toolkit
Table 3: Key Research Reagents for SDS-PAGE and Western Blotting
| Reagent Category | Specific Examples | Function and Application Notes |
|---|---|---|
| Detergents & Denaturants | SDS, LDS | Denatures proteins and confers negative charge; LDS offers enhanced solubility for membrane proteins [7] |
| Reducing Agents | β-mercaptoethanol, DTT, TCEP | Breaks disulfide bonds; DTT and TCEP more stable than β-mercaptoethanol [62] |
| Gel Matrix Components | Acrylamide, Bis-acrylamide | Forms porous gel matrix; concentration determines separation range [10] [61] |
| Polymerization Initiators | Ammonium persulfate (APS), TEMED | Catalyzes acrylamide polymerization; TEMED accelerates APS free radical formation [10] [61] |
| Buffer Systems | Tris-glycine, Bis-Tris, Tricine, Tris-acetate | Maintain pH and conductivity; choice affects resolution range and gel stability [61] |
| Membranes | Nitrocellulose, PVDF | Binds separated proteins for immunodetection; PVDF offers higher protein binding capacity [60] |
| Detection Reagents | ECL, fluorescent substrates | Generates detectable signal from enzyme-conjugated antibodies; ECL offers high sensitivity [60] |
SDS-PAGE remains an indispensable technique in protein research, providing the foundation for both protein purity assessment and Western blot analysis. The fundamental process of SDS-mediated protein denaturation and charge manipulation enables precise molecular weight-based separation that has become a gold standard in biochemistry and molecular biology. Through continued technical refinements including native SDS-PAGE, two-dimensional electrophoresis, and automation, the applications of this foundational technique continue to expand. The protocols, troubleshooting guides, and technical considerations presented in this whitepaper provide researchers with comprehensive resources for implementing these powerful techniques in their experimental workflows, ensuring accurate and reproducible protein analysis in both basic research and drug development contexts.
Troubleshooting SDS-PAGE: Optimizing Conditions for Clear Results
Sodium Dodecyl Sulfate–Polyacrylamide Gel Electrophoresis (SDS-PAGE) serves as a fundamental technique in biochemical research and biopharmaceutical development, enabling the separation of complex protein mixtures by molecular weight. The foundation of this technique rests on the precise interaction between SDS and protein structures. As an anionic detergent, SDS unfolds proteins by disrupting non-covalent bonds and binds to the polypeptide backbone with high affinity, effectively coating proteins with negative charges [64]. This process confers a relatively consistent charge-to-mass ratio across different proteins, allowing separation to occur primarily based on molecular size rather than inherent charge properties [64]. Understanding the mechanism of SDS-induced protein denaturation provides the essential framework for diagnosing and troubleshooting common electrophoretic artifacts that compromise data quality and interpretation in research and analytical contexts.
The binding of SDS to proteins occurs through both hydrophobic and electrostatic interactions, with predominantly hydrophobic interactions occurring at micellar SDS concentrations [3]. This interaction is largely independent of the protein's structure, conformation, and ionization state, making it broadly applicable across diverse protein systems [3]. However, deviations from optimal SDS-protein binding, sample preparation, or electrophoretic conditions can introduce artifacts that obscure results and lead to erroneous conclusions. This guide examines the molecular origins of these artifacts within the context of SDS-protein interactions and provides evidence-based methodologies for their resolution, with particular emphasis on applications relevant to drug development professionals requiring robust analytical data.
Fundamental Principles of SDS-Protein Interactions
Mechanism of SDS-Induced Protein Denaturation
The denaturation of proteins by SDS follows a complex mechanism involving discrete stages of structural perturbation. In the submicellar concentration range (typically below 1-2 mM), SDS initially disrupts tertiary structure contacts through cooperative binding, leading to protein unfolding while maintaining some secondary structure elements [3]. As SDS concentrations approach and exceed the critical micelle concentration (approximately 8.2 mM for pure SDS), the interaction becomes exclusively hydrophobic, with protein-bound SDS micelles facilitating complete chain expansion driven by coulombic repulsion between the negatively charged micelles and anionic amino acid side chains [3].
Quantitative studies using Taylor Dispersion Analysis have determined the minimal SDS concentrations required for denaturation of specific model proteins: 4.3 × 10⁻⁴ M for β-lactoglobulin and transferrin, and 2.3 × 10⁻⁴ M for insulin [65]. These thresholds represent the transition point where SDS binding induces significant conformational changes detectable through alterations in diffusion coefficients, consistent with observations from electronic circular dichroism and dynamic light scattering methodologies [65]. The completeness of this denaturation process directly impacts electrophoretic resolution, as incomplete unfolding or variable SDS binding produces heterogeneous protein populations that migrate as diffuse bands or smears.
Charge Equilibration and Molecular Sieving
Following denaturation, the linearized SDS-polypeptide complexes migrate through the polyacrylamide matrix according to principles of molecular sieving. The polyacrylamide gel forms a porous network whose effective pore size is determined by the percentage of acrylamide and the degree of cross-linking. Higher acrylamide percentages create smaller pores that retard protein migration, providing better resolution for lower molecular weight proteins, while lower percentages with larger pores are more suitable for separating high molecular weight proteins [64] [66]. This molecular sieving effect, combined with the consistent negative charge imparted by SDS binding, enables molecular weight estimation with typical accuracy between 5-10% when properly calibrated.
The discontinuous buffer system fundamental to SDS-PAGE exploits the pH-dependent charge states of glycine to concentrate protein samples into sharp bands before they enter the resolving gel [64]. In the stacking gel at pH 6.8, glycine exists primarily as zwitterions with minimal mobility, while proteins display intermediate mobility between highly mobile chloride ions and slow glycine zwitterions. This configuration creates a sharp voltage gradient that stacks proteins into a thin zone. Upon reaching the resolving gel at pH 8.8, glycine gains negative charge and migrates rapidly ahead of the proteins, which then separate according to size in the uniform pore structure of the resolving gel [64].
Diagnostic and Troubleshooting Guide for Common Artifacts
"Smiling" or "Frowning" Bands (Lane-to-Lane Migration Artifacts)
Artifacts characterized by curved band migration patterns represent uneven electrical field distribution or temperature gradients across the gel plane. "Smiling" bands, where samples in outer lanes migrate faster than those in center lanes, typically result from excessive heat generation during electrophoresis [66]. Conversely, "frowning" patterns often indicate poor buffer circulation or temperature differentials.
Table 1: Troubleshooting "Smiling" or "Frowning" Bands
| Cause | Underlying Mechanism | Solution | Preventive Measures |
|---|---|---|---|
| Excessive Voltage/Current | Rapid heat generation creates temperature gradients between center (warmer) and outer (cooler) lanes, altering migration rates [66]. | Reduce voltage to 100-150V; use constant voltage instead of constant current [66]. | Implement built-in cooling systems; perform electrophoresis in temperature-controlled environment. |
| Inefficient Heat Dissipation | Poor thermal transfer from gel to buffer creates uneven resistance across gel surface. | Use magnetic stirrer in outer buffer chamber to eliminate temperature gradients [66]. | Ensure complete buffer immersion of gel apparatus; pre-cool running buffer to 4°C. |
| Non-uniform Gel Polymerization | Inconsistent cross-linking creates regional variations in pore size and electrical resistance. | Prepare fresh ammonium persulfate and TEMED catalysts; degas acrylamide solution before polymerization. | Standardize gel pouring protocols; validate polymerization completeness before use. |
Vertical Smearing and Poor Resolution
Smearing appears as diffuse, vertical streaks extending from the well downward and typically indicates incomplete denaturation, protein aggregation, or proteolytic degradation. These artifacts fundamentally stem from heterogeneous protein populations migrating at varying rates due to differences in SDS binding, complex stability, or molecular size.
Table 2: Troubleshooting Vertical Smearing and Poor Resolution
| Cause | Underlying Mechanism | Solution | Experimental Validation |
|---|---|---|---|
| Incomplete Denaturation | Insufficient SDS binding creates folded intermediates with anomalous mobility [67] [66]. | Heat samples at 95°C for 5 minutes; ensure SDS:protein ratio >3:1 [66]. | Compare heated vs. unheated samples; vary SDS concentration systematically. |
| Protein Aggregation | Hydrophobic interactions persist despite SDS, forming high molecular weight complexes [67]. | Add reducing agents (DTT, β-mercaptoethanol); include urea (4-8M) for hydrophobic proteins [67]. | Perform centrifugation (12,000×g, 10 min) before loading; test multiple reducing agents. |
| Overloading | Excess protein exceeds gel separation capacity, causing trailing and saturation [66]. | Load ≤2 µg purified protein or ≤20 µg complex mixtures per well [66]. | Perform loading titration (1-25 µg); use sensitive detection (silver stain, fluorescence). |
| Proteolysis | Endogenous proteases remain active despite SDS, creating heterogeneous fragments. | Add protease inhibitors (PMSF, complete mini-tablets); keep samples on ice prior to denaturation. | Compare samples with/without inhibitors; test different preparation temperatures. |
| Incorrect Gel Percentage | Pore size mismatched to target protein size range impairs molecular sieving [64] [66]. | Use 4-8% gels for proteins >200 kDa; 8-12% for 10-200 kDa; 12-20% for <10 kDa [66]. | Test gradient gels (4-20%) for unknown targets; optimize for specific weight ranges. |
Horizontal Bands and Aberrant Migration
Unexpected horizontal banding patterns, including missing bands or irregular spacing between molecular weight markers, often indicate problems with sample preparation, buffer composition, or electrophoretic conditions.
Table 3: Troubleshooting Horizontal Banding and Aberrant Migration
| Observed Artifact | Potential Causes | Troubleshooting Strategies |
|---|---|---|
| Missing Bands | Sample leakage from wells; protein precipitation; insufficient sensitivity [67]. | Check glycerol concentration (10-20%) in loading buffer; rinse wells with buffer to remove air bubbles; avoid overfilling wells (>3/4 capacity) [67]. |
| Diffuse Bands | Inadequate current or running time; improper buffer formulation; old reagents. | Run until dye front reaches gel bottom (typically 40-60 min at 100-150V) [66]; prepare fresh running buffer; check pH of buffers. |
| Incorrect Molecular Weight Estimation | Incomplete reduction; post-translational modifications; unusual SDS binding [64]. | Use fresh DTT/β-mercaptoethanol; consider glycosylation/phosphorylation effects; test alternative denaturation conditions. |
Advanced Methodologies for SDS-ProAGE Analysis
Native SDS-PAGE (NSDS-PAGE) for Functional Analysis
Standard SDS-PAGE intentionally denatures proteins, destroying functional properties including enzymatic activity and non-covalently bound metal ions [7]. Native SDS-PAGE (NSDS-PAGE) represents a modified approach that preserves protein function while maintaining high resolution separation. This methodology reduces SDS concentration in running buffer from 0.1% to 0.0375%, eliminates EDTA from buffers, and omits the heating step during sample preparation [7].
Experimental validation demonstrates that NSDS-PAGE dramatically increases zinc retention in proteomic samples from 26% to 98% compared to standard denaturing conditions [7]. Furthermore, seven of nine model enzymes, including four zinc-binding proteins, retained activity after separation by NSDS-PAGE, whereas all were denatured during conventional SDS-PAGE [7]. This preservation of functional properties enables simultaneous assessment of protein migration and biochemical activity, particularly valuable for metalloprotein analysis and enzyme characterization during drug development.
Denaturing Mass Photometry for Rapid Optimization
Denaturing Mass Photometry (dMP) represents an emerging technological innovation that addresses limitations of SDS-PAGE for analyzing cross-linked protein complexes. This method employs a two-step denaturation protocol achieving 95% irreversible denaturation within 5 minutes using urea or guanidine hydrochloride, followed by mass analysis via interferometric scattering microscopy [68].
Comparative studies demonstrate significant advantages of dMP over SDS-PAGE, including accurate mass identification across a broad range (30 kDa–5 MDa), direct label-free quantification of coexisting cross-linked species, minimal sample requirement (20–100× less material), and dramatically reduced analysis time (3 minutes per triplicate versus hours for SDS-PAGE) [68]. This methodology enables rapid screening of multiple cross-linking conditions—approximately 20 different conditions can be evaluated within one hour—providing detailed characterization of protein-protein interactions and complex stoichiometries that complement traditional electrophoretic approaches [68].
Research Reagent Solutions for SDS-PAGE Optimization
Table 4: Essential Reagents for SDS-PAGE and Protein Denaturation Studies
| Reagent/Category | Function | Technical Considerations |
|---|---|---|
| SDS (Sodium Dodecyl Sulfate) | Denatures proteins by disrupting non-covalent bonds; confers negative charge [64] [3]. | Critical micelle concentration ~8.2 mM; purity affects background; optimal binding at >3:1 ratio with protein. |
| DTT (Dithiothreitol) | Reduces disulfide bonds; prevents protein aggregation [67] [66]. | Less odor than β-mercaptoethanol but less stable; prepare fresh solutions or freeze aliquots. |
| β-mercaptoethanol | Reducing agent breaks disulfide bonds [64] [66]. | Strong odor but stable over freeze-thaw cycles; standard concentration: 5% in loading buffer. |
| Tris Buffers | Maintains pH in stacking (pH 6.8) and resolving (pH 8.8) gels [64]. | pKa of 8.1 ideal for biological systems; ensures proper glycine charge transition between gel layers. |
| Glycine | Mobile ion in discontinuous buffer system; enables protein stacking [64]. | Zwitterionic at pH 6.8 (stacking); negatively charged at pH 8.8 (resolving); critical for voltage gradient. |
| Acrylamide/Bis-acrylamide | Forms porous gel matrix for molecular sieving [64]. | Percentage determines resolution range; degas before polymerization to ensure even cross-linking. |
| Ammonium Persulfate (APS) | Initiates acrylamide polymerization radical reaction [64]. | Prepare fresh solutions weekly; concentration affects polymerization rate and gel structure. |
| TEMED | Catalyst for acrylamide polymerization [64]. | Accelerates radical formation; concentration controls gel setting time; sensitive to oxidation. |
| Cyclodextrin (SCASP Method) | Binds SDS to form insoluble complexes; enables SDS removal for mass spectrometry [69]. | Alternative to acetone precipitation; maintains protein solubility during detergent removal. |
| Potassium Chloride (KCl) | Precipitates SDS as potassium dodecyl sulfate (KDS) [70]. | KDS solubility ~1.4 mM vs. SDS >700 mM; effective for membrane protein preparations. |
Experimental Protocols for Method Validation
Protocol 1: NSDS-PAGE for Metal-Binding Protein Analysis
This protocol modifies standard SDS-PAGE conditions to preserve metal binding and enzymatic activity during electrophoretic separation [7].
Sample Preparation: Mix 7.5 μL protein sample with 2.5 μL 4× NSDS sample buffer (100 mM Tris HCl, 150 mM Tris base, 10% glycerol, 0.0185% Coomassie G-250, 0.00625% phenol red, pH 8.5). Do not heat the sample [7].
Gel Pre-treatment: Pre-run precast NuPAGE Novex 12% Bis-Tris 1.0 mm mini-gels at 200V for 30 minutes in double-distilled H₂O to remove storage buffer and unpolymerized acrylamide [7].
Running Buffer Preparation: Prepare NSDS-PAGE running buffer (50 mM MOPS, 50 mM Tris Base, 0.0375% SDS, pH 7.7). Note the significantly reduced SDS concentration compared to standard SDS-PAGE (0.1% SDS) [7].
Electrophoresis: Load samples and run at constant voltage (200V) for approximately 45 minutes or until dye front reaches gel bottom. Maintain temperature between 10-20°C [7].
Post-electrophoresis Analysis: For zinc detection, incubate gel in 10 μM TSQ (N-(6-methoxy-8-quinolyl)-p-toluenesulfonamide) fluorescent dye solution for 15 minutes, followed by destaining in 100 mL of 100 mM sodium acetate, pH 5.0, for 30 minutes. Visualize with UV transillumination [7].
Protocol 2: KCl-Mediated SDS Depletion for Membrane Proteins
This protocol effectively removes SDS from membrane protein samples while maintaining protein solubility, facilitating downstream mass spectrometry analysis [70].
Sample Preparation: Solubilize membrane proteins in SDS-containing buffer (typically 1-2% SDS). Ensure complete solubilization by gentle vortexing and incubation at room temperature for 30 minutes [70].
KCl Precipitation: Add KCl to a final concentration of 300 mM while maintaining pH at 12 using sodium hydroxide. Vortex immediately and incubate on ice for 15 minutes [70].
Pellet Formation: Centrifuge at 14,000 × g for 10 minutes at 4°C to pellet precipitated SDS (as potassium dodecyl sulfate).
Supernatant Collection: Carefully transfer supernatant to a fresh tube without disturbing the pellet. The supernatant contains SDS-depleted proteins.
Protein Recovery Assessment: Determine protein concentration using Bradford or BCA assay. Compare to initial concentration to calculate recovery efficiency (typically >70% for membrane proteins) [70].
Downstream Processing: The SDS-depleted sample can proceed to tryptic digestion for bottom-up proteomics or intact mass analysis by mass spectrometry. For particularly hydrophobic proteins, add urea to 4 M final concentration to maintain solubility [70].
Schematic Representation of SDS-PAGE Artifact Diagnosis
The following workflow provides a systematic approach for diagnosing and resolving common SDS-PAGE artifacts, connecting observed abnormalities to their root causes and appropriate remedial actions.
Effective diagnosis and resolution of SDS-PAGE artifacts requires systematic investigation of the fundamental interactions between SDS and protein structures. The artifacts described—including smiling bands, smearing, and poor resolution—frequently originate from deviations in the delicate balance of protein denaturation, charge equilibration, and molecular sieving that underpin this ubiquitous technique. By understanding how SDS concentration, reducing conditions, buffer composition, and electrophoretic parameters influence protein migration, researchers can implement targeted solutions that restore separation quality and ensure reliable data interpretation. The integration of complementary methodologies such as NSDS-PAGE for functional analysis and denaturing mass photometry for rapid optimization further expands the analytical capabilities available to scientists engaged in protein characterization for research and biopharmaceutical applications. Through application of the principles and protocols outlined in this guide, researchers can achieve the reproducible, high-resolution separations essential for rigorous protein analysis.
Sodium dodecyl sulfate-polyacrylamide gel electrophoresis (SDS-PAGE) remains a cornerstone technique in biochemical analysis, enabling researchers to separate complex protein mixtures with high resolution. The efficacy of this separation hinges on selecting an appropriate polyacrylamide gel concentration matched to the molecular weight of target proteins. This technical guide examines the fundamental mechanism of SDS-induced protein denaturation and provides evidence-based protocols for optimizing gel composition to achieve superior separation across diverse molecular weight ranges. Within the broader context of protein denaturation research, we present a structured framework for gel percentage selection, detailed methodological protocols, and practical considerations for researchers and drug development professionals engaged in protein characterization.
SDS-PAGE is a discontinuous electrophoretic system that separates proteins based primarily on their molecular mass. The technique relies on two critical components: sodium dodecyl sulfate (SDS) to denature proteins and impart a uniform charge, and a polyacrylamide gel matrix that acts as a molecular sieve. When properly optimized, this method allows for precise separation of proteins with molecular masses between 5 and 250 kDa, making it indispensable for protein purification, analysis, and western blotting [22].
The fundamental principle governing SDS-PAGE is that the polyacrylamide gel forms a porous matrix through which proteins migrate under an electric field. The pore size of this matrix is directly determined by the concentration of acrylamide; higher percentages create smaller pores that retard the movement of larger proteins, while lower percentages with larger pores allow bigger proteins to migrate more freely [71]. This relationship between gel concentration and protein size separation forms the basis for optimization strategies discussed in this guide.
The Mechanism of SDS-Mediated Protein Denaturation
Molecular Interactions Between SDS and Proteins
SDS (sodium dodecyl sulfate) is an anionic surfactant that plays two crucial roles in protein denaturation: disrupting higher-order protein structures and conferring a uniform negative charge. SDS molecules consist of a hydrophobic 12-carbon tail and a hydrophilic sulfate group, allowing them to interact with both nonpolar and polar regions of proteins [22]. The mechanism unfolds through several stages:
- Initial Binding: SDS monomers bind to hydrophobic patches on the protein surface via hydrophobic interactions, initiating the unfolding process [3].
- Structural Disruption: At concentrations above 0.1 mM, SDS disrupts hydrogen bonds and hydrophobic interactions that maintain secondary and tertiary structures, causing proteins to unfold into linear chains [22].
- Complete Denaturation: At typical working concentrations (≥1 mM), SDS thoroughly denatures most proteins, forming rod-like protein-SDS complexes [22].
Approximately 1.4 grams of SDS bind per gram of protein, corresponding to roughly one SDS molecule per two amino acid residues [22]. This extensive coating masks the protein's intrinsic charge and creates a uniform negative charge density along the polypeptide backbone.
Contemporary Model of SDS-Protein Complexes
Recent structural, kinetic, and computational studies have clarified the architecture of SDS-protein complexes, decisively supporting the core-shell model (protein-decorated micelles) over the alternative beads-on-a-string model [4]. In the core-shell model:
- Denatured proteins surround shared SDS micelles rather than being encircled by them
- The number of protein molecules per micelle depends on the SDS:protein ratio and protein molecular mass
- Unfolding begins with asymmetric micellar attack followed by distribution of unfolded protein around the micelle
- Protein compactness continues evolving at higher SDS concentrations despite complete tertiary structure denaturation
This denaturation process can be reversed by adding nonionic surfactants, which form mixed micelles with SDS and liberate proteins to refold—except at low pH conditions where charge neutralization leads to irreversible superclusters of protein-surfactant complexes [4].
Optimizing Acrylamide Concentration for Target Protein Sizes
Principles of Gel Pore Size and Protein Migration
Polyacrylamide gels form through the polymerization of acrylamide monomers cross-linked by N,N'-methylenebisacrylamide. The resulting mesh-like matrix acts as a molecular sieve, with pore size determined by the concentrations of both acrylamide and bisacrylamide [6]. During electrophoresis, linearized SDS-protein complexes migrate through this matrix at rates inversely proportional to their molecular weights, as smaller proteins navigate the pores more easily than larger ones [49].
The relationship between acrylamide concentration and effective separation range follows a predictable pattern, allowing researchers to select optimal gel formulations for their specific targets. Using inappropriate concentrations can result in poor resolution—too low percentage gels allow small proteins to co-migrate rapidly, while too high percentage gels excessively retard large proteins, compressing the separation window [72].
Gel Concentration Selection Tables
Table 1: Recommended acrylamide concentrations for separating proteins by molecular weight
| Protein Size (kDa) | Gel Percentage (%) | Separation Characteristics |
|---|---|---|
| 4 - 40 | 20 | Optimal for very small proteins and peptides |
| 12 - 45 | 15 | High resolution for lower molecular weight proteins |
| 10 - 70 | 12 - 12.5 | Standard range for many cytoplasmic proteins |
| 15 - 100 | 10 | Broad range for mixed protein samples |
| 25 - 200 | 7.5 - 8 | Effective for larger proteins |
| >200 | 4 - 6 | Essential for very high molecular weight proteins |
Data compiled from [72] and [73]
Table 2: Alternative gel percentage recommendations for protein separation
| Protein Size (kDa) | Gel Percentage (%) |
|---|---|
| 4 - 40 | Up to 20% |
| 12 - 45 | 15% |
| 10 - 70 | 12.5% |
| 15 - 100 | 10% |
| 50 - 200 | 8% |
| >200 | 4 - 6% |
Source: [73]
For samples containing proteins with diverse molecular weights, gradient gels (typically 4-12% or 4-20%) provide superior resolution across a broader size range compared to single-concentration gels. Gradient gels produce sharper bands and better separate similarly-sized proteins due to the increasing sieving effect along the migration path [74].
Experimental Protocols for SDS-PAGE Optimization
Gel Preparation Protocol
Table 3: Recipes for polyacrylamide resolving gels (10ml total volume)
| Reagent | Order | 20% | 15% | 12% | 10% | 7.5% | 5% |
|---|---|---|---|---|---|---|---|
| dH₂O | 1 | 0.93ml | 2.34ml | 3.28ml | 3.98ml | 4.78ml | 5.61ml |
| 1.5M Tris-HCl pH 8.8 | 2 | 2.5ml | 2.5ml | 2.5ml | 2.5ml | 2.5ml | 2.5ml |
| 10% SDS | 3 | 100µl | 100µl | 100µl | 100µl | 100µl | 100µl |
| 30% Acrylamide/Bis (29.2:0.8) | 4 | 6.7ml | 5ml | 4ml | 3.3ml | 2.5ml | 1.67ml |
| 10% APS | 5 | 50µl | 50µl | 50µl | 50µl | 50µl | 50µl |
| TEMED | 6 | 5µl | 5µl | 5µl | 5µl | 5µl | 5µl |
Source: Adapted from [72]
Step-by-Step Procedure:
- Assemble gel casting apparatus: Thoroughly clean glass plates with ethanol, then assemble with spacers to create a leak-proof mold [49].
- Prepare resolving gel solution: Combine reagents in the order listed in Table 3, adding ammonium persulfate (APS) and TEMED last to initiate polymerization. Mix without creating bubbles.
- Pour resolving gel: Immediately transfer acrylamide solution to the gel cassette, leaving space for the stacking gel (approximately 1cm below the comb teeth) [72].
- Overlay with solvent: Carefully layer water-saturated butanol or isopropanol over the acrylamide to exclude oxygen and create a flat interface. Allow complete polymerization (20-60 minutes) [72].
- Prepare and pour stacking gel: After removing the overlay liquid, prepare stacking gel solution using the formula in Table 4. Insert sample comb without introducing bubbles and allow to polymerize for 30 minutes.
- Store prepared gels: Polymerized gels can be wrapped in moist paper towels, sealed in plastic bags, and refrigerated for several days, though fresh preparation is recommended for optimal results.
Table 4: Stacking gel formulation (5ml total volume)
| Reagent | Order | Volume |
|---|---|---|
| dH₂O | 1 | 3.05ml |
| 0.5M Tris-HCl pH 6.8 | 2 | 1.25ml |
| 10% SDS | 3 | 50µl |
| 30% Acrylamide/Bis (29.2:0.8) | 4 | 650µl |
| 10% APS | 5 | 25µl |
| TEMED | 6 | 10µl |
Source: [72]
Sample Preparation and Electrophoresis
Sample Preparation Protocol:
- Combine with sample buffer: Mix protein samples with Laemmli buffer (standard 2X or 4X concentration) containing SDS, glycerol, bromophenol blue, and reducing agents [71].
- Denature proteins: Heat samples at 95-100°C for 3-5 minutes or 70°C for 10 minutes to complete denaturation [49] [22].
- Reduce disulfide bonds: Include β-mercaptoethanol (5% v/v) or dithiothreitol (10-100 mM) in sample buffer to break disulfide linkages [22].
- Clarify by centrifugation: Centrifuge samples at 15,000 rpm for 1 minute to pellet insoluble material [49].
Electrophoresis Procedure:
- Assemble apparatus: Mount gel in electrophoresis chamber, remove combs, and fill upper and lower chambers with running buffer (25 mM Tris, 192 mM glycine, 0.1% SDS, pH 8.3) [73].
- Load samples: Carefully pipette prepared samples and molecular weight markers into wells (typically 10-50 μg total protein per lane for cell lysates) [73].
- Apply voltage: Run gel at constant voltage (100V for mini-gels) until dye front reaches bottom (approximately 1-2 hours) [73].
- Terminate run: Turn off power supply before dye front exits the gel to prevent loss of small proteins.
Diagram 1: SDS denaturation separates proteins by size.
The Scientist's Toolkit: Essential Reagents and Materials
Table 5: Key research reagents for SDS-PAGE
| Reagent/Material | Function | Critical Considerations |
|---|---|---|
| Acrylamide/Bis-acrylamide | Gel matrix formation | Neurotoxin in monomer form; use with gloves; pre-mixed solutions reduce risk |
| Ammonium Persulfate (APS) | Polymerization initiator | Use fresh aliquots; store at -20°C; incomplete polymerization indicates degradation |
| TEMED | Polymerization catalyst | Works with APS to catalyze free radical polymerization |
| SDS (Sodium Dodecyl Sulfate) | Protein denaturation & charge conferral | Binds protein backbone at constant ratio; purity affects performance |
| Tris-HCl Buffer | pH maintenance | Different pH for stacking (6.8) and resolving (8.8) gels enables discontinuous system |
| Glycine | Running buffer component | Charge state changes with pH enable stacking effect |
| β-Mercaptoethanol or DTT | Disulfide bond reduction | Essential for complete unfolding; DTT is more stable and less odorous |
| Bromophenol Blue | Tracking dye | Monitors migration progress; migrates at ~5 kDa front |
| Molecular Weight Markers | Size calibration | Pre-stained markers allow real-time tracking; broad range recommended |
Information compiled from multiple sources [49] [72] [22]
Diagram 2: Discontinuous gel system separates by size.
Advanced Optimization Strategies
Troubleshooting Common Issues
Several factors can compromise SDS-PAGE resolution despite optimal gel percentage selection:
- Smeared bands: Often caused by protein overload or excess salt in samples. Desalt samples or reduce loading concentration [75].
- Atypical migration: Post-translational modifications (phosphorylation, glycosylation) can alter SDS binding and mobility. Consider special buffer systems [71].
- Poor polymerization: Results from degraded APS or TEMED. Prepare fresh aliquots and ensure proper storage [75].
- Vertical band streaking: Caused by incomplete denaturation. Ensure adequate heating time and reducing agent concentration [22].
Specialized Applications
For specific research needs, modified SDS-PAGE systems offer enhanced capabilities:
- Gradient gels: Provide superior resolution across broad molecular weight ranges by continuously varying acrylamide concentration (e.g., 4-20%) [74].
- Tricine-SDS-PAGE: Replaces glycine with tricine in the running buffer to improve separation of small proteins (1-100 kDa) [22].
- Blue Native PAGE: Uses Coomassie dye instead of SDS to preserve native protein structure while providing size-based separation.
Optimizing acrylamide gel concentration represents a critical parameter in SDS-PAGE experimental design, directly determining resolution quality and separation efficacy. The systematic approach outlined in this guide—combining understanding of SDS denaturation mechanisms with evidence-based gel selection criteria—empowers researchers to make informed decisions for their specific protein separation needs. As SDS-PAGE continues to evolve through technical refinements and improved understanding of surfactant-protein interactions, the fundamental principle remains unchanged: matching gel pore size to target protein dimensions yields the highest quality separations. By implementing these optimization strategies, research and drug development professionals can maximize the utility of this foundational technique in protein characterization.
Sodium Dodecyl Sulfate-Polyacrylamide Gel Electrophoresis (SDS-PAGE) serves as a fundamental tool in biochemical research for separating proteins based on molecular weight. The precision of this separation is highly dependent on the optimization of operational parameters—voltage, run time, and temperature. This technical guide delves into the underlying mechanism of SDS-induced protein denaturation and charge impartation, providing a detailed framework for systematically fine-tuning electrophoresis conditions. Within the context of drug development and basic research, we present standardized protocols, quantitative data comparisons, and practical strategies to achieve superior resolution, reproducibility, and reliability in protein analysis.
SDS-PAGE is a discontinuous electrophoretic system that separates proteins primarily by molecular mass, typically within a range of 5 to 250 kDa [22]. The technique's power lies in its ability to negate the influence of a protein's native shape and intrinsic charge, facilitating separation based almost exclusively on size [23] [18]. This is achieved through the synergistic action of the anionic detergent Sodium Dodecyl Sulfate (SDS) and the sieving properties of the polyacrylamide gel matrix.
The procedure is foundational to numerous applications in molecular biology, biotechnology, and medical diagnostics. These include estimating molecular weight, assessing protein purity, analyzing polypeptide composition, performing peptide mapping, studying post-translational modifications, and preparing for western blotting [23] [18]. Its role is particularly critical in drug development, where analyzing protein expression, purity, and complex subunit composition is routine.
The core principle of SDS-PAGE hinges on two functions of SDS:
- Protein Denaturation: SDS disrupts hydrogen bonds and hydrophobic interactions, unfolding proteins into linear polypeptide chains [76] [3].
- Charge Impartation: SDS binds to the polypeptide backbone at a relatively constant ratio (approximately 1.4 g SDS per 1 g of protein), conferring a uniform negative charge density [22] [18].
This creates SDS-polypeptide complexes that have similar charge-to-mass ratios and shapes, ensuring that during electrophoresis, their migration through the polyacrylamide gel is dependent solely on molecular size [23] [76]. The gel acts as a molecular sieve, allowing smaller proteins to migrate faster than larger ones [18].
The Core Mechanism: How SDS Denatures Proteins and Imparts Charge
A deep understanding of how SDS acts on proteins is essential for intelligently fine-tuning electrophoresis parameters. The mechanism is a two-stage process involving hydrophobic interactions and electrostatic repulsion.
SDS-Induced Protein Denaturation
SDS is an amphipathic molecule, possessing a hydrophobic hydrocarbon "tail" and a hydrophilic sulfate "head" [76]. This structure allows it to interact with both polar and non-polar regions of a protein.
- Initial Unfolding: In sub-micellar concentrations (above 1 mM), SDS monomers bind to proteins via hydrophobic interactions, unfolding the secondary and tertiary structures [3]. The ionic part of SDS disrupts non-covalent interactions within the protein, while the hydrophobic region interacts with and unfolds hydrophobic protein domains [76].
- Complete Linearization: To ensure complete denaturation, protein samples are typically heated to 95-100°C for several minutes in the presence of SDS and a reducing agent [22] [77] [78]. Heating destroys hydrogen bonds that stabilize secondary structures [76]. Reducing agents like β-mercaptoethanol (BME) or dithiothreitol (DTT) break disulfide bonds, facilitating the full denaturation of the protein into its primary structure [23] [77].
Imparting a Uniform Negative Charge
As SDS binds to the unfolded polypeptide chain, it does so at a nearly constant ratio of one SDS molecule per two amino acid residues [22]. This massive, uniform coating of negatively charged SDS molecules overwhelms the protein's intrinsic charge based on its amino acid sequence. Consequently, all SDS-polypeptide complexes carry a strong net negative charge, proportional to their molecular mass [18]. When an electric field is applied, these complexes migrate towards the positively charged anode (positive electrode), with separation governed by the sieving effect of the gel pore size [76].
The following diagram illustrates this denaturation and charge-imparting process:
Key Parameters for Optimization
The quality of SDS-PAGE separation is highly sensitive to three interdependent electrical and environmental parameters: voltage, run time, and temperature. Understanding their relationship, governed by Ohm's Law (V = I × R), is crucial for optimization [79].
Voltage, Current, and Power Settings
Most modern power supplies allow control over voltage (V), current (I), or power (P). The choice of which parameter to keep constant significantly impacts the run.
- Constant Current: Setting a constant current ensures a constant sample migration rate, allowing for predictable run times and sharper bands. However, as resistance (R) in the system increases (e.g., from buffer ion depletion), voltage (V) must rise to maintain the current, leading to increased power (P = I² × R) and significant Joule heating [79].
- Constant Voltage: With constant voltage, the current decreases as resistance increases. This produces less heat, making it a safer option, but results in slower migration rates and longer, more variable run times, which can cause band diffusion [79].
- Constant Power: A less common option, constant power aims to maintain a consistent level of heat generation. While this prevents overheating, both voltage and current fluctuate, making the sample migration rate unpredictable and often leading to extended run times [79].
Recommended Starting Settings: A standard vertical mini-gel is often run at a constant voltage of 100-150 V, or at a constant current of 20-30 mA per gel [7] [78]. For a 1-mm-thick gel, a general guideline is 5-15 V/cm of gel length [79].
Run Time
Run time is intrinsically linked to the voltage/current setting and is typically monitored by the migration of a small anionic dye front (e.g., bromophenol blue) loaded with the samples. Electrophoresis is stopped once this dye front reaches the bottom of the gel [22]. Under standard constant voltage conditions (150 V), run times for a mini-gel are approximately 45-90 minutes [78].
Temperature Control and Joule Heating
The passage of current through the buffer and gel generates heat, a phenomenon known as Joule or Ohmic heating [79]. This heat can have several effects:
- Moderate Heating can aid in denaturing proteins that were not fully unfolded during sample preparation.
- Excessive Heating causes gels to swell and run unevenly, leading to distorted, "smiling" bands (where bands curve upwards at the edges). It can also denature proteins of interest, rendering them undetectable in subsequent western blotting and producing smeary bands [79].
Managing this heat is a primary concern. Strategies include:
- Using an ice pack or running the electrophoresis in a cold room or refrigerator.
- Ensuring adequate buffer circulation in some tank designs.
- Being cautious not to over-cool, as lower temperatures increase resistance and can drastically prolong run times [79].
The table below summarizes the pros and cons of different electrical settings:
Table 1: Optimization of Electrical Parameters for SDS-PAGE
| Parameter Mode | Pros | Cons | Recommended Starting Settings |
|---|---|---|---|
| Constant Current | Predictable run time; sharper bands [79] | High risk of Joule heating; not suitable for multiple different gels on one pack [79] | 20-30 mA per mini-gel [79] |
| Constant Voltage | Safer (less heat); multiple chambers can run from one power pack [79] | Longer run times; diffuse bands [79] | 100-150 V for a mini-gel [7] [78] |
| Constant Power | Consistent heat production; safe [79] | Unpredictable migration rate; long run times [79] | Varies by system |
| Temperature Control | Prevents band distortion & smiling; protects protein integrity | Over-cooling increases resistance & run time [79] | Run on ice pack or in cold room if overheating occurs [79] |
Experimental Protocols for Parameter Optimization
Here, we outline a core protocol for SDS-PAGE and a specific methodology for investigating the effects of voltage and temperature.
Standard SDS-PAGE Protocol
Materials & Reagents:
- Polyacrylamide gel (pre-cast or hand-cast)
- Protein ladder (molecular weight markers)
- SDS-PAGE Running Buffer (e.g., Tris-Glycine-SDS)
- Laemmli Sample Buffer (with SDS and DTT/BME)
- Heating block
- Vertical electrophoresis apparatus and power supply
Procedure:
- Sample Preparation: Mix protein sample with an equal volume of 2X Laemmli sample buffer. For reducing conditions, include a reducing agent like BME or DTT. Heat the mixture at 95-100°C for 5 minutes to denature proteins fully [77] [78].
- Gel Setup: Place the polyacrylamide gel in the electrophoresis chamber and fill the inner and outer chambers with 1X running buffer [78].
- Loading: Load the denatured samples and molecular weight markers into the wells [22].
- Electrophoresis: Attach the lid, connecting the electrodes. Set the power supply to the desired parameters (e.g., constant voltage of 150 V). Run the gel until the dye front approaches the bottom [78].
- Analysis: Turn off the power, dismantle the setup, and process the gel for staining (e.g., Coomassie Blue) or western blotting [23] [77].
Protocol: Optimizing Voltage and Temperature
Objective: To determine the ideal voltage and temperature conditions for resolving a specific protein complex.
Methodology:
- Sample: Use a consistent, well-defined protein mixture or cell lysate across all runs.
- Variables: Run identical gels at different constant voltages (e.g., 100 V, 125 V, 150 V) under two temperature conditions: room temperature and with active cooling (e.g., in a cold room or with an ice pack).
- Analysis: Compare the resulting gels for:
- Band Sharpness: Assess resolution of closely sized proteins.
- Band Straightness: Check for "smiling" or "frowning" effects.
- Migration Time: Record the time for the dye front to reach the bottom.
- Background: Note any smearing or high background after staining.
The workflow for this optimization experiment is summarized below:
The Scientist's Toolkit: Essential Reagents and Materials
Successful and reproducible SDS-PAGE relies on a suite of high-quality reagents and materials.
Table 2: Essential Research Reagent Solutions for SDS-PAGE
| Reagent/Material | Function | Key Considerations |
|---|---|---|
| SDS (Sodium Dodecyl Sulfate) | Denatures proteins and imparts uniform negative charge [76] [3] | Purity is critical; forms micelles above critical micelle concentration (CMC) [22] |
| Acrylamide/Bis-Acrylamide | Forms the cross-linked polyacrylamide gel matrix that acts as a molecular sieve [18] | Ratio and total percentage determine pore size (e.g., 12% for 10-70 kDa proteins) [77] |
| TEMED & APS | Catalyze (TEMED) and initiate (APS) the free-radical polymerization of the gel [76] [18] | Fresh APS is crucial for consistent and timely gel polymerization |
| Reducing Agents (DTT, BME) | Break disulfide bonds to fully linearize polypeptides [23] [76] | DTT is more stable and less odorous than BME [22] |
| Tris-based Running Buffer | Provides ions to conduct current and maintains stable pH during electrophoresis [22] | Common system: Discontinuous Tris-Glycine-SDS buffer [22] |
| Protein Molecular Weight Marker | Provides reference bands of known mass for estimating sample protein sizes [18] | Available pre-stained (for tracking) or unstained (for accuracy) [78] |
Fine-tuning electrophoresis by systematically controlling voltage, run time, and temperature is not a matter of anecdotal protocol but a scientific necessity. The interplay of these parameters, grounded in the fundamental principles of SDS-mediated protein denaturation and Ohm's Law, directly dictates the resolution and quality of the final result. The optimal conditions will vary depending on the specific equipment, gel composition, and protein samples used. Therefore, researchers are encouraged to use the guidelines and experimental frameworks provided here as a starting point for empirical optimization in their own laboratories. Mastering this fine-tuning is a critical step towards achieving robust, reproducible, and high-quality data in protein biochemistry and drug development workflows.
Addressing Gel Polymerization Issues and Sample Preparation Pitfalls
The efficacy of protein gel electrophoresis is fundamentally rooted in the precise manipulation of protein structure by sodium dodecyl sulfate (SDS). Understanding the mechanism by which SDS denatures proteins and imparts a uniform negative charge is not merely academic; it is essential for diagnosing and resolving the technical pitfalls that compromise experimental reproducibility. This guide integrates contemporary mechanistic insights into SDS-protein interactions with practical protocols, providing a framework for researchers to optimize protein separation, particularly in drug development contexts where analytical rigor is paramount.
Recent structural, kinetic, and computational work has decisively resolved the long-standing controversy regarding the nature of SDS-protein complexes, firmly supporting the core-shell model (protein-decorated micelles) over the older beads-on-a-string hypothesis [4]. In this model, the denatured polypeptide chain covers the surface of SDS micelles. The process begins with an asymmetric attack by SDS micelles on the protein, followed by distribution of the increasingly unfolded protein around the micelle. This unfolding is highly pH-dependent and can be reversed by adding nonionic surfactants, which strip SDS via mixed micelle formation, allowing the protein to refold [4]. This detailed mechanism explains the dual function of SDS: it disrupts non-covalent bonds maintaining tertiary structure, and it binds to the polypeptide backbone in a consistent mass ratio, conferring a uniform negative charge that is proportional to molecular weight [26] [80].
The Mechanism of Protein Denaturation and Charge Impartation by SDS
Molecular Interaction Pathway
The denaturation of proteins by SDS is a coordinated process that can be visualized as a sequential pathway. The following diagram illustrates the key stages from initial native protein to final separation by electrophoresis.
Quantitative Basis for Separation
The binding of SDS to protein occurs in a highly cooperative manner, leading to a near-constant charge-to-mass ratio across different proteins. This is the fundamental principle that allows separation to be based almost exclusively on molecular size.
Table 1: Key Quantitative Aspects of SDS-Protein Interaction
| Parameter | Typical Value or Ratio | Functional Significance |
|---|---|---|
| SDS Binding Ratio | ~1.4 g SDS / 1 g protein [4] | Ensures a uniform negative charge per unit mass. |
| Binding Stoichiometry | Approximately one DS⁻ ion per two amino acid residues [33] | Overwhelms the protein's intrinsic charge, standardizing the charge-to-mass ratio. |
| Critical Micelle Concentration (cmc) | 4.0 mM for Na⁺DS⁻ in Tris-Gly buffer [33] | Defines the concentration threshold for cooperative binding and efficient denaturation. |
The core-shell model indicates that depending on the SDS-to-protein ratio and the protein's molecular mass, the final structures can range from multiple partly unfolded proteins surrounding a single shared micelle to a single polypeptide chain decorating multiple micelles [4]. The kinetics of denaturation above the cmc are governed by the concentration of monomeric DS⁻, which can be influenced by the cation present (e.g., Na⁺ vs. tetraalkylammonium ions) [33].
Troubleshooting Gel Polymerization
Polyacrylamide gel formation is a critical first step, and its failure invariably leads to experimental collapse. The gel matrix is formed via a vinyl addition polymerization reaction catalyzed by free radicals [81]. The monomeric acrylamide and the cross-linker bisacrylamide form a porous mesh under the initiation of ammonium persulfate (APS) and the catalyst N,N,N',N'-Tetramethylethylenediamine (TEMED).
Table 2: Common Gel Polymerization Issues and Solutions
| Problem | Possible Cause | Recommended Solution |
|---|---|---|
| Long Polymerization Time | Insufficient APS or TEMED; Old reagents; Low temperature [82] | Increase amounts of APS/TEMED; Use fresh reagents; Cast gels at room temperature. |
| Gel Does Not Polymerize | APS or TEMED omitted from mixture [82] | Check protocol and add both initiator and catalyst. |
| Gel is Too Soft | Poor quality acrylamide/bis; Too little cross-linker (bisacrylamide) [82] | Use high-quality reagents; Increase the amount of bisacrylamide. |
| Gel Turns White | Concentration of bisacrylamide is too high [82] | Recheck and correct the amount of bisacrylamide used. |
| Gel Cracks During Polymerization | Excess heat generation [82] | Use cooled reagents during preparation. |
It is crucial to distinguish this polymerization process from the gellation of agarose gels, which are formed by cooling a heated solution and setting via non-covalent hydrogen bonds and electrostatic interactions [81]. A common error in laboratory vernacular is to confuse these two distinct formation mechanisms.
Overcoming Sample Preparation Pitfalls
Sample preparation is the most frequent source of irreproducibility. Errors introduced at this stage cascade through the entire experiment, wasting resources and time [83].
The Scientist's Toolkit: Essential Reagents for SDS-PAGE
Table 3: Key Research Reagent Solutions for SDS-PAGE
| Reagent | Function | Technical Notes |
|---|---|---|
| SDS (Sodium Dodecyl Sulfate) | Denatures proteins; imparts uniform negative charge [80]. | Use in excess (e.g., in sample buffer); typical running buffer contains 0.1% SDS [7]. |
| Tris-based Buffers | Maintains stable pH during electrophoresis. | Common for both sample and running buffers; pH is critical for protein charge and migration. |
| Reducing Agents (DTT, β-mercaptoethanol) | Breaks disulfide bonds to fully unfold proteins. | Must be fresh; incomplete reduction causes band doublets [82]. |
| Glycerol | Adds density to sample for easy gel loading. | Included in sample buffer. |
| Tracking Dye (Bromophenol Blue) | Visualizes migration progress during the run. | Included in sample buffer. |
| Polyacrylamide/Bis-acrylamide | Forms the sieving matrix of the gel. | Ratio of acrylamide to bis-acrylamide determines pore size [81]. |
| APS & TEMED | Initiator and catalyst for gel polymerization [81]. | Must be fresh for efficient and consistent polymerization [82]. |
| Coomassie Blue | Stains proteins for visualization after electrophoresis. |
Troubleshooting Sample-Related Electrophoresis Defects
The quality of the final electrophoretogram is directly determined by sample integrity and preparation.
Table 4: Troubleshooting Sample Preparation and Electrophoresis
| Observed Problem | Root Cause | Corrective Action |
|---|---|---|
| Weak or Missing Bands | Protein degraded by proteases; quantity below detection limit [82]. | Use protease inhibitors; concentrate sample or use more sensitive stain. |
| Poor Band Resolution | Incorrect gel percentage; sample too concentrated; excess salt [82]. | Use gradient or appropriate % gel; dilute sample; desalt via dialysis or column. |
| Band Smearing | Voltage too high; protein concentration too high [82]. | Reduce voltage by 25-50%; load less protein onto the gel. |
| Band Streaking | Protein precipitation; insufficient SDS [82]. | Centrifuge sample before loading; ensure adequate SDS in buffer. |
| "Smile" Effect | Uneven gel heating in the center [82]. | Decrease power setting; use a cooled apparatus. |
| Doublet Bands | Partial protein re-oxidation or incomplete reduction [82]. | Use fresh reducing agent (DTT/β-mercaptoethanol) and increase its concentration. |
| Protein Aggregation/Precipitation in Well | Insufficient reducing agent; hydrophobic proteins [82]. | Prepare new sample buffer; add 4-8 M urea to the sample. |
A critical but often overlooked factor is the cation paired with dodecyl sulfate. While sodium is standard, research shows that substituting tetraalkylammonium cations for sodium can systematically alter the cmc and the kinetics of protein denaturation, offering a potential "knob" for manipulating separations [33].
Advanced Experimental Protocol: Native SDS-PAGE for Metalloprotein Analysis
A significant limitation of standard SDS-PAGE is the complete denaturation of proteins, destroying functional properties like enzymatic activity and non-covalently bound metal ions. An advanced modification, Native SDS-PAGE (NSDS-PAGE), has been developed to address this [7].
Detailed NSDS-PAGE Methodology
This protocol is designed for the separation of proteomic mixtures with retention of native enzymatic activity and metal cofactors, crucial for drug discovery efforts focused on metalloenzymes.
- Sample Preparation: Mix 7.5 µL of protein sample with 2.5 µL of 4X NSDS sample buffer. The sample buffer consists of 100 mM Tris HCl, 150 mM Tris base, 10% (v/v) glycerol, 0.0185% (w/v) Coomassie G-250, and 0.00625% (w/v) Phenol Red at pH 8.5. Crucially, this buffer contains no SDS or EDTA, and the sample is not heated [7].
- Gel Pre-Electrophoresis: Pre-cast NuPAGE Novex Bis-Tris gels are run at 200V for 30 minutes in double-distilled H₂O to remove storage buffer and any unpolymerized acrylamide [7].
- Running Buffer and Electrophoresis: The running buffer is composed of 50 mM MOPS, 50 mM Tris Base, and a significantly reduced 0.0375% SDS (compared to 0.1% in standard protocols), with no EDTA, at pH 7.7. Electrophoresis is then performed under standard conditions [7].
Outcome and Validation
This method results in a dramatic increase in the retention of bound zinc in proteomic samples, from 26% with standard SDS-PAGE to 98% with NSDS-PAGE. Furthermore, the majority of model enzymes tested (seven out of nine, including four zinc proteins) retained their activity after separation by NSDS-PAGE, whereas all were denatured during standard SDS-PAGE [7]. This protocol provides a powerful tool for high-resolution analysis of functional protein states.
A deep and mechanistic understanding of how SDS denatures proteins is the most powerful tool for troubleshooting gel electrophoresis. The core-shell model provides a modern framework for interpreting common problems, from aggregation and smearing to poor resolution. By coupling this knowledge with rigorous attention to sample preparation protocols and gel polymerization chemistry, researchers can significantly enhance the reliability and reproducibility of their protein analyses. This is especially critical in drug development, where the integrity of analytical data directly informs decision-making.
The anionic surfactant sodium dodecyl sulfate (SDS) serves as a cornerstone for modern protein separation techniques by acting as a highly efficient denaturant. Its fundamental mechanism involves binding to proteins through predominantly hydrophobic interactions, effectively unfolding both polar and nonpolar protein sections to form protein-decorated micelles in a core-shell structure [3] [4]. This process masks the proteins' intrinsic charges and confers a uniform negative charge proportional to polypeptide chain length, with approximately 1.4 grams of SDS binding per gram of protein—equivalent to about one SDS molecule per two amino acids [22]. This charge uniformity is crucial for separation techniques, as it ensures that protein migration depends solely on molecular size rather than inherent charge or structure [22]. The denaturing action begins at SDS concentrations above 0.1 mM, with most proteins becoming fully denatured above 1 mM [22]. This denaturation process can be reversed under specific conditions, such as through the addition of nonionic surfactants or amphipathic cosolvents like 2-methyl-2,4-pentanediol (MPD), which can strip SDS via mixed micelle formation and allow proteins to refold into their native states [4] [84].
Theoretical Foundation: Key Principles of Protein Separation
SDS-PAGE: Separation by Molecular Weight
SDS-PAGE (sodium dodecyl sulfate-polyacrylamide gel electrophoresis) operates on the principle of separating denatured proteins based exclusively on their molecular mass. The polyacrylamide gel matrix creates a molecular sieving effect where smaller proteins migrate more rapidly through the porous network, while larger proteins experience greater resistance and move more slowly [11] [22]. The discontinuous buffer system commonly employed enhances resolution through a stacking effect that concentrates proteins into sharp bands before they enter the separating gel [22]. This technique enables precise protein separation within the molecular mass range of approximately 5-250 kDa, with the linear separation range adjustable by varying the acrylamide concentration [22].
Two-Dimensional Electrophoresis: Orthogonal Separation
Two-dimensional gel electrophoresis (2D-GE) represents a powerful advancement by combining two independent separation parameters: isoelectric point (pI) and molecular weight [85] [86]. This orthogonal approach first separates proteins by their charge through isoelectric focusing (IEF), then by size via SDS-PAGE in the second dimension [87]. The combination of these unrelated separation phenomena provides exceptionally high resolution, capable of resolving over 1,000 distinct protein spots from a complex mixture in a single analysis [87]. The technique was revolutionized by O'Farrell in 1975 and has since undergone refinements including immobilized pH gradients (IPG-Dalt) that improve reproducibility, resolution, and loading capacity for preparative purposes [86] [87].
Technical Implementation: Methodologies and Procedures
Gradient Gel Electrophoresis
Principles and Advantages of Gradient Gels
Polyacrylamide gradient gels feature a continuous increase in acrylamide concentration, typically from 4% to 12% or higher, creating a pore size distribution that expands the effective separation range for proteins of diverse molecular weights [22]. Unlike fixed-concentration gels optimized for specific size ranges, gradient gels enable simultaneous high-resolution separation of both high and low molecular weight proteins within a single run. The decreasing pore size encountered by migrating proteins creates a sharpening effect on bands, as proteins slow differentially when reaching pores too small for easy passage [22]. This extends the linear separation range and improves resolution across a broad mass spectrum, making gradient gels particularly valuable for complex protein mixtures with unknown composition.
Gradient Gel Fabrication and Specifications
Gradient gels are produced using a gradient mixer that continuously adjusts the ratio of high and low acrylamide solutions during gel casting [22]. The table below summarizes the separation properties of various acrylamide concentrations and their applications in both standard and gradient formats:
Table 1: Acrylamide Gel Concentrations and Separation Ranges
| Acrylamide Concentration (%) | Linear Separation Range (kDa) | Primary Applications |
|---|---|---|
| 5.0 | 57-212 | High molecular weight proteins |
| 7.5 | 36-94 | Medium to high molecular weight proteins |
| 10.0 | 16-68 | Medium molecular weight proteins |
| 12.0 | 12-43 | Low to medium molecular weight proteins |
| 4-12 (Gradient) | ~10-300 | Broad range separation of complex mixtures |
Commercial pre-cast gradient systems often utilize Bis-tris methane buffer at pH 6.4-7.2 for both stacking and separating gels, enhancing stability and storage life through reduced polyacrylamide hydrolysis at nearly neutral pH [22]. These continuous buffer systems sacrifice some stacking effect but provide consistent performance over weeks of storage.
Detailed Gradient Gel Protocol
The fabrication of gradient gels requires specialized equipment and precise execution:
Gel Casting Setup: Assemble glass plates with spacers (typically 0.75 mm or 1.5 mm thickness) in a casting apparatus with sealed bottom [22].
Gradient Solution Preparation: Prepare high-percentage (e.g., 12%) and low-percentage (e.g., 4%) acrylamide solutions containing appropriate bis-acrylamide crosslinker (usually 0.8%), separating gel buffer (e.g., 1.875 M Tris-Cl, pH 8.8), 0.1% SDS, and water [11] [22].
Polymerization Initiation: Add catalysts TEMED (N,N,N',N'-tetramethylethylenediamine) and ammonium persulfate (APS) immediately before pouring [22].
Gradient Formation: Using a gradient mixer, continuously deliver an increasing concentration of acrylamide between the glass plates, avoiding bubble formation [22].
Gel Polymerization: Overlay with water-saturated butanol or isopropanol to eliminate oxygen inhibition, allow polymerization for 15 minutes to several hours depending on catalyst concentration and temperature [22].
Stacking Gel Addition: After polymerization, discard alcohol, rinse and dry the gel surface, then pour a stacking gel (typically 4-6% acrylamide) with comb inserted to form sample wells [11].
For sample preparation, proteins are diluted in loading buffer containing SDS (e.g., 2% final concentration), reducing agents (β-mercaptoethanol or DTT), glycerol, and tracking dye [11] [88]. Samples are heated to 95°C for 5 minutes to ensure complete denaturation before loading [88]. Electrophoresis typically runs at constant voltage (100-150V) until the dye front reaches the gel bottom [88].
Two-Dimensional Gel Electrophoresis (2D-GE)
Fundamental Principles of 2D-GE
Two-dimensional gel electrophoresis achieves unparalleled resolution by combining two orthogonal separation techniques: isoelectric focusing (IEF) based on protein charge in the first dimension, followed by SDS-PAGE based on molecular weight in the second dimension [85] [86]. In the first dimension, proteins migrate through a pH gradient until they reach their isoelectric point (pI)—the specific pH where their net charge becomes zero—resulting in focused protein bands [85] [87]. For the second dimension, the entire IEF strip is equilibrated with SDS buffer and applied to an SDS-PAGE gel, where proteins are separated according to molecular mass [86]. This sequential orthogonal separation transforms complex protein mixtures into a two-dimensional array of spots, with each spot representing a unique protein species defined by specific pI and molecular weight coordinates [87].
Comprehensive 2D-GE Workflow
The following diagram illustrates the complete two-dimensional gel electrophoresis procedure:
Detailed 2D-GE Experimental Protocol
Sample Preparation
- Protein Extraction: Lyse cells or tissues using appropriate buffers containing detergents (e.g., Nonidet P-40), salts, and protease inhibitors to prevent degradation while maintaining solubility [86].
- Reduction and Alkylation: Treat proteins with reducing agents (β-mercaptoethanol or dithiothreitol) to break disulfide bonds, followed by alkylation with iodoacetamide to prevent reformation [86].
- Protein Quantification: Determine protein concentration using Bradford, BCA, or Lowry assays to ensure consistent loading [86].
- Sample Dilution: Dilute proteins in IEF-compatible buffer containing ampholytes (for pH gradient formation) and 9.5 M urea to maintain solubility [89].
First Dimension: Isoelectric Focusing
- Gel Preparation: Cast IEF gels containing carrier ampholytes (establishing pH gradient, typically pH 3.5-11.5), 2.7% acrylamide, 9.5 M urea, and 2% nonionic detergent (Nonidet P-40) [89].
- Sample Application: Load protein samples onto IEF gel using sample applicators or focusing cups [86].
- Focusing Conditions: Apply electric field (500-1000V) for several hours to overnight, until proteins migrate to their isoelectric points and focus into sharp bands [86] [89].
Second Dimension: SDS-PAGE
- Gel Equilibration: After IEF, incubate the gel strip in SDS equilibration buffer (containing SDS, reducing agent, and Tris-Cl) to denature proteins and impart negative charge [86].
- Gel Transfer: Place the equilibrated IEF strip horizontally on top of an SDS-PAGE gel (typically 10-20% acrylamide), ensuring complete contact without air bubbles [85] [86].
- Electrophoresis: Apply constant current or voltage until dye front reaches gel bottom (typically 4-6 hours) [86].
Visualization and Analysis
- Protein Staining: Detect separated proteins using Coomassie Brilliant Blue (detection limit ~10 ng), silver staining (~0.5 ng), or fluorescent dyes (SYPRO Ruby, Deep Purple) [86] [87].
- Destaining: Remove background stain through multiple washes with destaining solution (40% ethanol, 10% acetic acid) [11].
- Image Acquisition: Scan gels using dedicated imaging systems and analyze with specialized software for spot detection, quantification, and comparative analysis [86].
Table 2: Critical Reagents for Two-Dimensional Gel Electrophoresis
| Reagent Category | Specific Examples | Function and Purpose |
|---|---|---|
| Detergents | SDS, Nonidet P-40 | Protein denaturation and solubilization |
| Denaturants | Urea (9.5 M), Thiourea | Disrupt hydrogen bonds, maintain solubility |
| Reducing Agents | DTT, β-mercaptoethanol | Break disulfide bonds |
| Alkylating Agents | Iodoacetamide | Prevent disulfide bond reformation |
| Ampholytes | Carrier ampholytes | Establish and stabilize pH gradient |
| Staining Agents | Coomassie Blue, Silver nitrate, SYPRO Ruby | Visualize separated proteins |
| Buffers | Tris-glycine, Bis-tris | Maintain pH during electrophoresis |
Applications and Advancements in Protein Analysis
Research and Diagnostic Applications
These advanced electrophoretic techniques serve crucial roles across multiple scientific domains:
- Proteomics Research: 2D-GE enables comprehensive protein profiling, identification of post-translational modifications, and comparative analysis of protein expression across different biological states [86] [87].
- Biomarker Discovery: Comparative 2D-GE analysis of healthy versus diseased tissue facilitates identification of differentially expressed proteins as potential disease biomarkers [86].
- Protein Purity Assessment: Gradient SDS-PAGE provides rapid evaluation of protein sample purity and integrity during purification procedures [88].
- Diagnostic Applications: SDS-PAGE forms the foundation for diagnostic western blotting, including HIV testing where viral proteins are separated and detected with patient antibodies [88].
- Protein Characterization: These techniques enable determination of molecular weights, isoelectric points, stoichiometry of complexes, and detection of protein isoforms [88].
Technical Limitations and Solutions
Despite their powerful capabilities, both gradient gels and 2D-GE present specific challenges with corresponding solutions:
- Limited Dynamic Range: Abundant proteins can obscure low-abundance species. Solution: Employ prefractionation techniques and high-sensitivity fluorescent stains [87].
- Membrane Protein Under-representation: Hydrophobic membrane proteins often precipitate during IEF. Solution: Incorporate specialized detergents and organic solvents in sample buffers [87].
- Gel-to-Gel Variability: Slight procedural differences affect reproducibility. Solution: Implement multiplexed fluorescent difference gel electrophoresis (DIGE) with internal standards [87].
- Resolution Limitations: Proteins with extreme pI or molecular weight may be poorly resolved. Solution: Use narrow-range pH gradients and specialized gel systems for specific protein classes [87].
- Technical Complexity: Both methods require significant expertise. Solution: Follow standardized protocols meticulously and utilize pre-cast gels where available [86].
Gradient gel electrophoresis and two-dimensional electrophoresis represent sophisticated analytical tools that build upon the fundamental principle of SDS-mediated protein denaturation. By leveraging the uniform charge conferral by SDS and combining orthogonal separation parameters, these techniques enable researchers to resolve complex protein mixtures with high resolution and precision. The comprehensive protein maps generated by 2D-GE, complemented by the broad separation range of gradient gels, continue to make invaluable contributions to proteomics, biomarker discovery, and basic protein characterization. While newer technologies have emerged, these electrophoretic methods maintain their relevance through continuous refinement and their unparalleled ability to provide a global view of proteome composition and dynamics within the broader context of SDS-protein interaction research.
Validating the Mechanism: SDS-PAGE vs. Alternative Protein Analysis Techniques
Polyacrylamide Gel Electrophoresis (PAGE) is a foundational technique in biochemistry, molecular biology, and biotechnology used to separate biological macromolecules like proteins and nucleic acids. This separation is based on properties such as molecular size, shape, mass, and charge as they migrate through a polyacrylamide gel matrix under the influence of an electric field [90]. The polyacrylamide gel itself is a cross-linked polymer that offers a consistent pore size and superior resolving power compared to alternatives like agarose, making it ideal for separating most proteins [90] [18].
Within PAGE methodologies, two primary techniques stand in contrast: SDS-PAGE (Sodium Dodecyl Sulfate-Polyacrylamide Gel Electrophoresis) and Native-PAGE. The core distinction lies in the treatment of the protein's native structure. SDS-PAGE is a denaturing technique that uses the anionic detergent SDS to unfold proteins and mask their intrinsic charge, resulting in separation based almost exclusively on molecular weight [90] [91]. In contrast, Native-PAGE is a non-denaturing technique that preserves the protein's higher-order structure (secondary, tertiary, and quaternary), resulting in separation based on a combination of the protein's inherent charge, size, and shape [91] [92]. The choice between these techniques is critical and depends on the experimental objective, particularly when framed within research on how SDS denatures proteins and imparts a uniform negative charge.
Fundamental Principles and Key Differences
The Mechanism of SDS-Induced Protein Denaturation and Charge Impartation
The effectiveness of SDS-PAGE hinges on the unique properties of sodium dodecyl sulfate (SDS). SDS is an anionic surfactant composed of a hydrophobic hydrocarbon tail and a hydrophilic sulfate head group [93]. Its mechanism of action involves two discrete, critical steps:
- Protein Denaturation: SDS disrupts the non-covalent forces—including hydrogen bonds, hydrophobic interactions, and van der Waals forces—that maintain a protein's tertiary structure [94] [95]. This interaction "unfolds" the folded, native protein, converting it into a linear polypeptide chain [93].
- Charge Impartation and Masking: The unfolded polypeptide chain is then uniformly coated with SDS molecules. The hydrophobic tails of SDS associate with the hydrophobic regions of the polypeptide backbone, while the negatively charged sulfate head groups project outward into the solution [94]. This binding occurs in a constant weight ratio of approximately 1.4 g of SDS per 1 g of protein [18] [95]. Consequently, the intrinsic positive and negative charges of the amino acid side chains are overwhelmed and masked by the uniform negative charge provided by SDS [90] [93]. This gives all SDS-bound proteins a similar charge-to-mass ratio, ensuring their migration through the gel during electrophoresis is dependent solely on molecular size due to the sieving effect of the polyacrylamide matrix [91] [18].
At micellar concentrations, the protein-bound SDS micelles can cause further chain expansion driven by coulombic repulsion between the bound micelles and anionic amino acid side chains [3].
Principles of Native-PAGE
Native-PAGE operates on the principle of separating proteins in their biologically active, folded state. No denaturing agents are used in the gel or sample buffer [96] [92]. Consequently, a protein's migration is determined by a combination of factors:
- Net Charge: The protein's inherent charge at the running buffer's pH dictates its electrophoretic mobility and direction. Proteins with a higher negative charge density will migrate faster toward the anode [18].
- Size and Shape: The gel matrix acts as a molecular sieve, where larger or more asymmetrically shaped proteins experience greater frictional resistance and migrate slower than smaller, more compact proteins of the same charge [18] [92].
A critical consideration in Native-PAGE is the isoelectric point (pI) of the target proteins. For acidic proteins (pI < 7), standard alkaline buffer systems (e.g., pH 8.8) are used, and proteins migrate toward the anode. For basic proteins (pI > 7), low-pH buffer systems are employed, which cause the proteins to carry a net positive charge, requiring the cathode and anode to be reversed so the proteins migrate toward the cathode [96] [92].
The table below summarizes the core differences between these two electrophoretic techniques.
Table 1: Comprehensive Comparison of SDS-PAGE and Native-PAGE
| Criteria | SDS-PAGE | Native-PAGE |
|---|---|---|
| Description | Denaturing technique separating proteins by molecular mass [90] [97]. | Non-denaturing technique separating proteins by size, charge, and shape [90] [97]. |
| Gel Nature | Denaturing gel containing SDS [90]. | Non-denaturing gel; no SDS [90] [96]. |
| Sample Preparation | Heated with buffer containing SDS and a reducing agent (e.g., BME, DTT) [97]. | Not heated; buffer lacks SDS and reducing agents [97] [92]. |
| Basis of Separation | Molecular weight of polypeptide chains [90] [18]. | Native charge, size, and shape of the protein [91] [18]. |
| Net Charge on Proteins | Uniform negative charge from SDS coating [94]. | Intrinsic charge (can be positive or negative) [97]. |
| Protein State | Denatured and linearized [93] [95]. | Native, folded conformation [90] [92]. |
| Protein Function Post-Electrophoresis | Lost due to denaturation [97]. | Largely retained [97] [18]. |
| Protein Recovery & Stability | Proteins are unstable and typically cannot be recovered in a functional state [90]. | Proteins are stable and can be recovered in an active form [90] [18]. |
| Typical Running Temperature | Room Temperature [97]. | 0-4°C to minimize denaturation and proteolysis [97] [92]. |
| Primary Applications | Molecular weight determination, purity checking, protein expression analysis [97]. | Study of native structure, subunit composition, enzyme activity assays, and functional purification [90] [18]. |
Experimental Protocols
SDS-PAGE Protocol
The following protocol, based on the discontinuous buffer system pioneered by Laemmli, is standard for most SDS-PAGE applications [97] [94].
I. Reagent Preparation
- Resolving Gel Buffer: 1.5 M Tris-HCl, pH 8.8.
- Stacking Gel Buffer: 0.5 M Tris-HCl, pH 6.8.
- Running Buffer (10X): 0.25 M Tris, 1.92 M Glycine, 1% (w/v) SDS, pH ~8.3.
- 2X Sample Loading Buffer (Laemmli Buffer): 0.125 M Tris-HCl (pH 6.8), 4% (w/v) SDS, 20% (v/v) Glycerol, 0.02% Bromophenol Blue. Add 2-5% β-mercaptoethanol (BME) or 100 mM DTT as a reducing agent just before use [94].
- Gel Solutions: Acrylamide/Bis-acrylamide mixture (typically 29:1 or 37.5:1), 10% Ammonium Persulfate (APS), and TEMED.
II. Gel Casting
- Prepare the Resolving Gel: Mix acrylamide/bis solution, resolving gel buffer, water, 10% SDS, and 10% APS. Add TEMED last to catalyze polymerization and immediately pour the solution between glass plates, leaving space for the stacking gel. Overlay with water or isopropanol to create a flat interface.
- Prepare the Stacking Gel: Once the resolving gel has polymerized, pour off the overlay. Mix acrylamide/bis solution, stacking gel buffer, water, 10% SDS, and 10% APS. Add TEMED, pour on top of the resolving gel, and immediately insert a well comb.
III. Sample Preparation
- Mix the protein sample with an equal volume of 2X Sample Loading Buffer.
- Heat the mixture at 70-100°C for 5-10 minutes to ensure complete denaturation [18].
- Centrifuge briefly to collect condensation.
IV. Electrophoresis
- Assemble the gel cassette in the electrophoresis unit and fill the tanks with 1X Running Buffer.
- Carefully load the prepared samples and a molecular weight marker into the wells.
- Apply a constant voltage: 80-100V through the stacking gel, then 120-150V through the resolving gel until the dye front reaches the bottom.
V. Post-Electrophoresis Analysis
- Staining: Visualize separated proteins using Coomassie Blue, silver stain, or other fluorescent dyes.
- Western Blotting: For immunodetection, proteins are transferred from the gel onto a membrane.
- Molecular Weight Determination: Compare the migration distance of unknown proteins to a standard curve generated from the molecular weight marker.
Native-PAGE Protocol
The Native-PAGE protocol requires modifications to preserve protein native structure.
I. Reagent Preparation (for Acidic Proteins, High pH System)
- Resolving Gel Buffer: 1.5 M Tris-HCl, pH 8.8.
- Stacking Gel Buffer: 0.5 M Tris-HCl, pH 6.8.
- Running Buffer (10X): 0.25 M Tris, 1.92 M Glycine, no SDS, pH ~8.3-8.8 [92].
- Native Sample Loading Buffer: 0.5 M Tris-HCl (pH 6.8), 50% Glycerol, 0.02% Bromophenol Blue. No SDS or reducing agents [92].
- Gel Solutions: Acrylamide/Bis-acrylamide mixture, 10% APS, and TEMED. No SDS is added to any gel solution [96].
II. Gel Casting and Sample Preparation
- The process is similar to SDS-PAGE, but all solutions are devoid of SDS and other denaturants.
- Critical: The protein sample is mixed with Native Sample Loading Buffer without heating [97] [92].
III. Electrophoresis
- Pre-chill the running buffer and assemble the apparatus in a cold room or use a cooling unit. The entire run should be performed at 0-4°C to maintain protein stability [97] [92].
- Load the samples.
- Apply a constant current or voltage. To minimize heat generation, use lower currents/voltages than in SDS-PAGE (e.g., 100V constant) [92].
- For Basic Proteins: Use a low-pH gel and buffer system and reverse the electrodes [96] [92].
IV. Post-Electrophoresis Analysis
- Activity Staining: If studying an enzyme, the gel can be incubated with a specific substrate to produce a colored precipitate at the location of the active enzyme band.
- Protein Recovery: Proteins can be passively eluted or electro-eluted from the gel for downstream functional studies [18].
The Scientist's Toolkit: Essential Reagents and Materials
Successful execution of PAGE experiments requires specific biochemical reagents. The table below details key solutions and their functions.
Table 2: Essential Research Reagent Solutions for PAGE
| Reagent / Material | Function / Purpose | Key Considerations |
|---|---|---|
| SDS (Sodium Dodecyl Sulfate) | Denatures proteins and imparts a uniform negative charge, enabling separation by size [93] [94]. | The core of SDS-PAGE; absent in Native-PAGE. Purity is critical for consistent results. |
| Acrylamide / Bis-acrylamide | Forms the cross-linked polyacrylamide gel matrix that acts as a molecular sieve [18]. | Total concentration (%T) and cross-linking (%C) determine gel pore size. Handle with care as neurotoxic before polymerization. |
| APS & TEMED | Catalysts for the polymerization of acrylamide (APS provides free radicals, TEMED is a catalyst) [94] [18]. | Fresh APS solution is required for efficient and timely gel polymerization. |
| Tris-HCl Buffers | Provides the appropriate pH environment for gel polymerization and electrophoresis [94]. | Discontinuous system uses different pH in stacking (pH 6.8) and resolving (pH 8.8) gels. |
| Tris-Glycine Running Buffer | Conducts current and provides the ionic environment for protein migration [94]. | Glycine's charge-shifting behavior is key to the stacking effect in SDS-PAGE [94]. |
| β-Mercaptoethanol (BME) / DTT | Reducing agents that break disulfide bonds, ensuring complete protein denaturation and subunit dissociation [90] [95]. | Used only in SDS-PAGE. DTT is less pungent and often preferred. |
| Glycerol | Added to sample buffers to increase density, preventing diffusion and ensuring samples settle at the bottom of wells [90] [94]. | Used in both SDS-PAGE and Native-PAGE sample buffers. |
| Coomassie Blue / Silver Stain | Dyes for visualizing protein bands post-electrophoresis [18] [92]. | Coomassie is simpler; silver stain is more sensitive. |
Workflow and Mechanism Visualization
The following diagrams, generated using Graphviz, illustrate the core procedural workflow and the underlying mechanism of SDS action.
PAGE Experimental Workflow
Diagram 1: PAGE Experimental Workflow Decision Tree.
SDS Protein Denaturation and Charge Impartation Mechanism
Diagram 2: Molecular Mechanism of SDS-Induced Protein Denaturation.
Discussion and Concluding Remarks
SDS-PAGE and Native-PAGE are complementary techniques, each with distinct advantages and limitations dictated by their core principles. SDS-PAGE is the workhorse for determining molecular weight and analyzing protein purity and expression levels in complex mixtures. Its power derives from the ability of SDS to normalize protein charge and conformation, simplifying analysis to a single variable—size [18] [95]. However, this strength is also its primary weakness: the destruction of native structure and function.
Native-PAGE's principal advantage is the preservation of the protein's biological activity, making it indispensable for studying functional aspects of proteins, such as enzyme activity, protein-protein interactions in multimeric complexes, and native conformation [18] [92]. The trade-off is a more complex analysis, as migration depends on multiple variables (size, charge, shape), making it difficult to deduce molecular weight directly.
Within the context of research on protein denaturation, SDS-PAGE serves as both a tool and a subject. It is a direct application of the fundamental principle that a uniform charge-to-mass ratio can be imposed on diverse polypeptides, allowing size-based separation. Understanding the mechanism of SDS-induced denaturation and charge impartation is therefore critical not only for properly executing the technique but also for interpreting its results, especially for proteins with atypical SDS-binding characteristics, such as heavily glycosylated or membrane proteins [94] [95].
In conclusion, the choice between SDS-PAGE and Native-PAGE is fundamental and should be guided by the research question. If the goal is to analyze polypeptide chains based on mass, SDS-PAGE is the unequivocal choice. If the goal is to probe a protein's function, interactions, or native state, Native-PAGE is the required method. A comprehensive protein characterization strategy will often employ both techniques in tandem to build a complete picture of a protein's properties.
Within the broader investigation of how sodium dodecyl sulfate (SDS) denatures proteins and imparts a uniform negative charge, the need for robust validation techniques is paramount. SDS-PAGE operates on the fundamental principle that SDS, an anionic surfactant, disrupts hydrogen bonds and van der Waals forces, effectively unraveling higher-order protein structures into linear polypeptides [98] [99]. Concurrently, SDS molecules bind to the polypeptide backbone with high affinity, coating the protein in negative charges that swamp its intrinsic charge, resulting in a consistent charge-to-mass ratio [99]. This process allows separation primarily by molecular weight in a polyacrylamide gel matrix. However, this simplistic view can be complicated by differential SDS binding due to protein hydrophobicity or post-translational modifications, which may subtly influence migration [99]. Furthermore, the technique provides no direct information on protein identity or solution-state conformation. Therefore, orthogonal techniques like Mass Spectrometry (MS) and Small-Angle X-Ray Scattering (SAXS) are critical for validating and extracting deeper structural and identity information from SDS-PAGE-separated proteins, moving beyond mere apparent molecular weight to a comprehensive characterization.
Integrating Mass Spectrometry with SDS-PAGE
Mass spectrometry has become an indispensable partner to SDS-PAGE, transforming it from a simple separation technique into a powerful tool for protein identification and characterization. The typical workflow involves separating a complex protein mixture via SDS-PAGE, excising protein bands of interest, and then subjecting them to in-gel digestion and MS analysis.
GeLC-MS/MS Workflow and Protocol
The GeLC-MS/MS workflow is a well-established methodology for in-depth proteomic analysis [100]. Following SDS-PAGE separation, the entire gel lane is typically sliced into 5-20 fractions, which are then processed for in-gel digestion [100]. A key advancement in this workflow is the "Whole Gel" (WG) processing procedure, which significantly streamlines the labor-intensive steps of in-gel digestion. In this optimized protocol, washing, reduction, and alkylation steps are performed on the intact gel prior to slicing, drastically reducing hands-on time and improving reproducibility for large-scale studies [100]. The specific steps for in-gel digestion are as follows [101]:
- Gel Washing: Excised gel bands are destained and washed with alternating steps of water and acetonitrile to remove contaminants.
- Reduction and Alkylation: Proteins within the gel matrix are reduced using dithiothreitol (DTT) to break disulfide linkages, followed by alkylation with iodoacetamide (IAA) to cap cysteine residues and prevent reformation of disulfide bonds [101].
- In-Gel Digestion: Gel pieces are subjected to tryptic digestion. The protease, typically modified porcine trypsin, diffuses into the gel and cleaves proteins at the carboxyl side of lysine and arginine residues, generating peptides for MS analysis [101].
- Peptide Extraction: The resulting peptides are extracted from the gel matrix using solutions such as acetonitrile and formic acid, then concentrated for LC-MS/MS analysis.
For top-down proteomic analyses, where intact proteins are analyzed, an efficient protein recovery method is crucial. The Passively eluting proteins from polyacrylamide gels as intact species for MS (PEPPI-MS) method uses Coomassie Brilliant Blue as an extraction enhancer, allowing high recovery rates (mean of 68% for proteins <100 kDa) from a wide molecular weight range after just 10 minutes of shaking [102].
Figure 1: GeLC-MS/MS Workflow for Protein Identification.
Applications and Data Interpretation
This integrated approach is powerful for identifying proteins in complex mixtures. A study on chickpea seed proteins, for instance, used SDS-PAGE followed by high-resolution mass spectrometry to identify and characterize about 360 different proteins, providing the most detailed description of the chickpea seed proteome to date [101]. The analysis revealed that legumin subunits were found at 45–65 kDa as whole subunits and also at lower mass ranges, while vicilins were spread across multiple bands between 65 and 23 kDa, indicating extensive proteolytic processing [101].
When analyzing results, a key consideration is that discrepancies between observed molecular weight on the gel and the theoretical weight from MS data can provide valuable biological insights. These discrepancies may indicate the presence of proteolytic processing, alternative splicing, or post-translational modifications such as phosphorylation and glycosylation, which can alter a protein's migration by affecting SDS binding [99].
Validating Protein Structures with Small-Angle X-Ray Scattering (SAXS)
While MS excels at identifying protein identity and modifications, Small-Angle X-Ray Scattering (SAXS) provides a complementary solution-based method for obtaining low-resolution structural information and validating protein conformations. SAXS is particularly valuable in the context of SDS-PAGE because it can assess the global structure, oligomeric state, and flexibility of proteins in their native solution state, free from the crystallization constraints of X-ray crystallography or the denaturing conditions of SDS-PAGE.
SAXS Principles and Workflow for Validation
SAXS data is collected by exposing a purified protein solution to an X-ray beam and measuring the elastic scattering of X-rays at small angles [103]. This scattering pattern, recorded as intensity (I) versus scattering angle (q), contains information about the protein's overall shape and size because it arises from the distribution of all electron pair distances within the molecule [103]. The resulting data can be transformed into a real-space distribution function, the pair-distance distribution function P(r), from which parameters like the maximum particle dimension (Dmax) can be derived [103].
The workflow for using SAXS to validate protein structures, including those separated by SDS-PAGE, involves several key steps [103]:
- Sample Preparation and Data Collection: Protein samples must be purified, monodisperse (non-aggregated), and at an appropriate concentration (typically 0.5–20 mg/ml). Data can be collected in high-throughput (HT-SAXS) mode or, for challenging samples, using Size-Exclusion Chromatography coupled to SAXS (SEC-SAXS) to ensure monodispersity.
- Obtaining a 3D Model: An atomic model of the protein is required for comparison. This can be a predicted structure from servers like AlphaFold2, a homology model, or a crystal structure.
- Comparison and Validation: The theoretical scattering curve of the atomic model is calculated and compared to the experimental SAXS data. A close match supports the validity of the model. Significant discrepancies suggest differences in solution conformation, dynamics, or oligomeric state.
- Model Improvement: If the initial model does not fit the SAXS data, it can be altered. Computational servers can test ensembles of altered models to find a conformation or assembly that agrees with the solution data.
Figure 2: SAXS Workflow for Protein Structure Validation.
Leveraging SAXS with Modern Protein Structure Predictions
The recent revolution in machine learning-based protein structure prediction, exemplified by AlphaFold2, has made SAXS even more relevant [103]. These predictions are highly accurate for globular domains but have limitations, including a bias toward crystal structures and potential inaccuracies in exposed, flexible regions or for proteins with few homologous sequences [103]. SAXS data provides an ideal experimental benchmark to test these computational predictions against biologically relevant solution states.
A match between the predicted structure's theoretical scattering and the experimental SAXS curve validates the prediction. Conversely, a mismatch can reveal important biology. For example, the solution structure might be an ensemble of multiple conformations, or the protein's oligomeric state in solution might differ from the predicted monomeric unit. SAXS is highly sensitive to oligomeric states, and studies suggest over half of all proteins form homo-oligomers, a factor often overlooked in initial analyses [103].
Comparative Analysis of Techniques
The integration of SDS-PAGE, MS, and SAXS creates a powerful pipeline for protein analysis, with each technique providing a distinct and complementary piece of the puzzle. The following table summarizes the primary information delivered by each method and how they collectively contribute to a comprehensive understanding of protein systems.
Table 1: Orthogonal Techniques for Protein Analysis
| Technique | Primary Information | Key Metrics | Sample Requirements | Limitations / Complementary Role |
|---|---|---|---|---|
| SDS-PAGE | Apparent molecular weight, purity, abundance | Migration distance (Rf) | Denatured, SDS-coated proteins | Does not confirm identity; migration can be influenced by PTMs [99]. |
| Mass Spectrometry | Identity, sequence, post-translational modifications, precise molecular weight | Peptide mass/fragmentation (m/z), spectral counts | Peptides or intact proteins | Confirms identity; explains aberrant migration on gels [101] [102]. |
| SAXS | Solution-state structure, oligomeric state, flexibility, global shape | Rg, Dmax, P(r) distribution | Purified, monodisperse protein in solution | Validates native conformation/oligomerization; independent of crystallization [103]. |
The Scientist's Toolkit: Essential Reagents and Materials
Successful implementation of these orthogonal techniques relies on a suite of specific reagents and materials. The following table details key components and their functions in the workflows.
Table 2: Essential Research Reagent Solutions
| Reagent/Material | Function | Application |
|---|---|---|
| SDS (Sodium Dodecyl Sulfate) | Denatures proteins by disrupting non-covalent bonds; imparts uniform negative charge by binding polypeptide backbone. | SDS-PAGE [98] [99] |
| β-mercaptoethanol or DTT | Strong reducing agent that breaks disulfide bonds between cysteine residues, ensuring complete protein unfolding. | Sample preparation for SDS-PAGE and MS [98] [99] |
| Acrylamide/Bis-acrylamide | Forms a cross-linked polyacrylamide gel matrix upon polymerization; pore size determines resolution range. | SDS-PAGE Gel Formation [98] [61] |
| TEMED & Ammonium Persulfate (APS) | Catalytic system (TEMED) and initiator (APS) that generates free radicals to drive acrylamide polymerization. | SDS-PAGE Gel Formation [98] [61] |
| Trypsin (Protease) | Enzymatically cleaves proteins at specific residues (Lys/Arg) to generate peptides for mass spectrometry analysis. | In-gel digestion for GeLC-MS/MS [101] |
| Cross-linkers (e.g., DSSO, BS3) | Chemically cross-link proximal amino acids in interacting proteins; cross-link sites identified by MS reveal interaction interfaces. | Cross-linking Mass Spectrometry (XL-MS) [102] |
| Coomassie Brilliant Blue | Reversible protein stain for visualizing bands in gels; also acts as an extraction enhancer for intact protein recovery. | Gel staining & PEPPI-MS [102] |
The journey from a simple SDS-PAGE gel to a comprehensive understanding of a protein's identity, structure, and function is facilitated by the powerful orthogonal techniques of mass spectrometry and Small-Angle X-Ray Scattering. While SDS-PAGE provides an initial separation based on the fundamental principles of SDS-induced denaturation and charge impartation, MS definitively identifies proteins and characterizes their modifications, and SAXS validates their native solution-state structures. This integrated approach moves beyond the limitations of any single method, enabling researchers in proteomics and drug development to build robust, multi-faceted models of protein behavior. As protein structure predictions become increasingly accurate and accessible, the role of experimental techniques like SAXS in validating and refining these models for biologically relevant states will only grow in importance.
Sodium Dodecyl Sulfate-Polyacrylamide Gel Electrophoresis (SDS-PAGE) is a cornerstone technique in molecular biology and biochemistry, lauded for its ability to separate complex protein mixtures with high resolution based on molecular weight [48]. The method, pioneered by Laemmli, relies on the anionic detergent SDS to denature proteins, linearize them, and impart a uniform negative charge, thereby allowing separation through a polyacrylamide gel matrix under an electric field based primarily on polypeptide chain length [48] [104]. This principle of charge normalization is the source of both its widespread utility and its significant limitations. Despite its robustness, the assumption that SDS binding is uniform across all protein types is a critical oversimplification. When research questions extend beyond mere molecular weight estimation to inquiries about native structure, functional states, protein complexes, or post-translational modifications, the standard SDS-PAGE protocol can yield misleading results [7] [4]. This guide details the specific scenarios where SDS-PAGE proves unreliable, provides experimental evidence of its constraints, and outlines alternative methodologies to ensure accurate protein characterization.
The Molecular Basis of SDS Denaturation: A Double-Edged Sword
The Core Mechanism: Denaturation and Charge Conferment
The efficacy of SDS-PAGE hinges on two fundamental actions of the SDS detergent: protein denaturation and charge conferment. SDS molecules possess a hydrophobic tail and a polar, anionic sulfate head group [104] [105]. When a protein sample is prepared with SDS and reducing agents (e.g., DTT or BME) and heated, the detergent disrupts hydrophobic interactions and hydrogen bonds, while the reducing agents break disulfide bridges [105]. This process unfolds the protein into a linear polypeptide chain. Crucially, SDS binds to the hydrophobic regions of the unfolded polypeptide in a constant mass ratio of approximately 1.4 g SDS per 1.0 g of protein [104]. This extensive binding coats the protein in negative charges, effectively overwhelming the molecule's intrinsic charge and creating a uniform charge-to-mass ratio [104] [105]. Consequently, during electrophoresis, all proteins migrate towards the anode, and their separation through the sieving matrix of the polyacrylamide gel becomes a function of molecular size alone.
The "Core-Shell" Model of Protein-SDS Complexes
The traditional "beads-on-a-string" model, which suggested that unfolded polypeptide chains are decorated with micellar SDS clusters, has been superseded by more sophisticated structural analyses. A combination of small-angle X-ray scattering (SAXS), isothermal titration calorimetry (ITC), and molecular dynamics simulations now decisively supports the core-shell model (also known as the protein-decorated micelle model) [4]. In this model, the SDS molecules form a micellar core, while the denatured polypeptide chain wraps around the surface of this micelle. The formation of this complex is preceded by the asymmetric binding of small numbers of SDS molecules, which grow by accretion, ultimately leading to the fully denatured core-shell complex [4]. This refined understanding explains the efficiency of SDS in masking a protein's native charge and structure but also hints at the potential for variability in this process, which can be a source of anomalous migration.
Diagram 1: The mechanism of SDS-mediated protein denaturation and complex formation, leading to gel migration.
Non-Uniform SDS Binding and Aberrant Migration
The foundational assumption of uniform SDS binding is frequently violated, leading to inaccurate molecular weight determinations. Several protein characteristics can interfere with SDS binding:
- Hydrophobic Proteins: Excessively hydrophobic proteins may bind more SDS than average, increasing their negative charge density and causing them to migrate faster than expected, resulting in an underestimation of molecular weight [104].
- Post-Translational Modifications (PTMs): Proteins with substantial glycosylation or phosphorylation bind less SDS because the modifying groups occupy space and can electrostatically repel the anionic detergent [104]. This reduced SDS binding leads to a lower net negative charge, slower migration, and an overestimation of molecular weight.
- Highly Basic Proteins: Proteins with a high isoelectric point (pI) have a strong inherent positive charge, which may not be fully neutralized by SDS, also resulting in slower migration [9].
Table 1: Protein Characteristics Leading to Aberrant Migration in SDS-PAGE
| Protein Characteristic | Effect on SDS Binding | Impact on Gel Migration | Resulting MW Estimate |
|---|---|---|---|
| High Hydrophobicity | Increased binding | Faster than expected | Underestimated |
| Glycosylation | Decreased binding | Slower than expected | Overestimated |
| Phosphorylation | Decreased binding | Slower than expected | Overestimated |
| High Basic Residue Content | Incomplete charge masking | Slower than expected | Overestimated |
Loss of Native Structure and Functional Information
A primary limitation of SDS-PAGE is its deliberate destruction of higher-order protein structure. While this is essential for molecular weight-based separation, it obliterates critical functional information:
- Destruction of Quaternary Structures: The combination of SDS and reducing agents dissociates multi-subunit complexes into individual polypeptides [48]. A functional oligomer will appear on a denaturing gel as multiple bands corresponding to its subunits, making it impossible to assess the native oligomeric state or stoichiometry.
- Loss of Enzymatic Activity: The denaturing process destroys the protein's active conformation. As demonstrated in studies, standard SDS-PAGE denatures enzymes, rendering them inactive, whereas native electrophoresis techniques can preserve activity [7].
- Dissociation of Non-Covalent Cofactors: Metal ions and other non-covalently bound cofactors are stripped from proteins during SDS denaturation [7]. For metalloproteins, this means the functional, metal-bound form cannot be distinguished from the apoprotein using standard SDS-PAGE.
Inability to Resolve Proteins with Similar Molecular Weights
SDS-PAGE separates based on the hydrodynamic size of the denatured polypeptide, not the mass of the native complex. Consequently, proteins with very similar or identical molecular weights may co-migrate as a single band, falsely implying homogeneity [106]. This lack of resolution is a significant constraint when analyzing complex proteomes, where many proteins may fall within a narrow molecular weight range. While 2D-PAGE, which separates by charge (pI) in the first dimension and size in the second, can overcome this, it is a more labor-intensive and technically challenging protocol [106].
Challenges with Extreme Molecular Weights and Hydrophobicity
The polyacrylamide gel matrix has a finite range of effective pore sizes, limiting the separation of proteins at the extremes of the molecular weight spectrum.
- Very Large Proteins (>250 kDa): These proteins may not enter the gel matrix effectively or may migrate in a compressed high-molecular-weight region with poor resolution [11].
- Very Small Proteins and Peptides (<10 kDa): Small peptides may co-migrate with the dye front or be lost during the staining and destaining process [48]. Techniques such as Tricine-SDS-PAGE, which uses a modified buffer system to improve the separation of lower molecular weight species, are recommended for this application [48].
- Integral Membrane Proteins: These proteins are inherently hydrophobic and can aggregate or precipitate during sample preparation, even in the presence of SDS, leading to poor entry into the gel or smeared bands [107].
Experimental Evidence: Quantitative Data on SDS-PAGE Limitations
Empirical studies have quantified the extent to which SDS-PAGE can misrepresent protein state and function. Key experimental findings are summarized below.
Metal Retention and Enzymatic Activity
A critical study directly compared standard SDS-PAGE, Blue Native (BN)-PAGE, and a modified "Native SDS-PAGE" (NSDS-PAGE) that used reduced SDS and omitted EDTA and heating. The results were striking:
Table 2: Comparative Analysis of Electrophoresis Methods on Protein Function [7]
| Method | Zn²⁺ Retention in Proteome | Enzymatic Activity Retention (Model Zn²⁺ Enzymes) | Key Characteristic |
|---|---|---|---|
| Standard SDS-PAGE | 26% | 0 of 9 enzymes active | Fully denaturing, high resolution |
| BN-PAGE | Not Reported | 9 of 9 enzymes active | Native state, lower resolution |
| NSDS-PAGE | 98% | 7 of 9 enzymes active | Semi-native, high resolution |
This experiment provides quantitative evidence that standard SDS-PAGE conditions destroy metal-binding capacity and enzymatic function, which can be largely preserved with modified, milder conditions without completely sacrificing resolution [7].
Detailed Protocol: Evaluating Metal Retention Post-Electrophoresis
Objective: To assess the retention of non-covalently bound metal ions (e.g., Zn²⁺) in proteins after electrophoresis using Laser Ablation-Inductively Coupled Plasma-Mass Spectrometry (LA-ICP-MS) [7].
Methodology:
- Sample Preparation: Prepare proteomic samples or purified metalloproteins in a non-chelating buffer (e.g., 5 mM Tris-Cl, pH 8.0). Avoid EDTA.
- Electrophoresis:
- Standard SDS-PAGE: Use a standard Laemmli protocol with sample buffer containing SDS and EDTA, and a heating step (70-95°C for 10 min) [7] [11].
- NSDS-PAGE: Use a modified sample buffer (100 mM Tris HCl, 150 mM Tris base, 10% glycerol, 0.0185% Coomassie G-250, pH 8.5) without EDTA or a heating step. Use a running buffer with reduced SDS (0.0375%) and no EDTA [7].
- Gel Processing: After electrophoresis, proteins are fixed in the gel without using heavy metal-based stains like Coomassie if subsequent metal analysis is planned.
- Metal Detection:
- LA-ICP-MS: The dried gel is directly ablated by a laser, and the aerosolized particles are transported to the ICP-MS to quantify metal content (e.g., ⁶⁶Zn) in the protein bands [7].
- Fluorophore Staining: As a complementary method, use a metal-specific fluorophore like TSQ (N-(6-Methoxy-8-quinolyl)-p-toluenesulfonamide) to visually detect Zn²⁺-bound proteins in the gel under UV light.
Interpretation: A strong signal for the metal in the NSDS-PAGE gel, contrasted with a weak or absent signal in the standard SDS-PAGE gel, confirms the loss of metal cofactors during standard denaturing procedures.
Molecular Dynamics Insights into SDS-Protein Interactions
Computational studies have illuminated the molecular details of SDS-induced unfolding. Molecular dynamics simulations of human ubiquitin show that:
- At ambient temperatures (300 K), SDS can stabilize a native-like structure or induce α-helical structures, rather than promoting complete unfolding [9].
- Complete unfolding requires a combination of both high SDS concentration and elevated temperature (370 K), where SDS molecules disrupt the first hydration shell and expand the hydrophobic core [9].
- The unfolding process is initiated by an asymmetric attack of SDS micelles on the protein structure [4].
These findings demonstrate that SDS denaturation is a complex process dependent on specific conditions and protein identity, challenging the simplistic view of uniform and complete denaturation.
The Scientist's Toolkit: Reagents and Alternative Methods
Research Reagent Solutions
Table 3: Essential Reagents for Evaluating and Overcoming SDS-PAGE Limitations
| Reagent / Method | Function | Consideration / Alternative Use |
|---|---|---|
| DTT / β-Mercaptoethanol | Reduces disulfide bonds to fully linearize proteins. | Essential for complete denaturation but destroys native quaternary structure. Omit for non-reducing PAGE to preserve disulfide-linked complexes. |
| Urea (4-8 M) | Chaotrope that aids solubilization and denaturation. | Add to lysis buffer to prevent aggregation of hydrophobic proteins [107]. |
| Tricine Buffer | Alternative to glycine in running buffer. | Improves resolution of low molecular weight proteins (< 30 kDa) [48]. |
| Nonionic Detergents (e.g., DDM) | Mild detergents for membrane protein solubilization. | Can strip SDS from proteins and facilitate refolding when added after SDS denaturation [4] [9]. |
| Crosslinkers (e.g., Glutaraldehyde) | Chemically crosslinks interacting subunits. | Can be used to stabilize weak protein complexes prior to SDS-PAGE analysis. |
Strategic Workflow for Method Selection
Choosing the appropriate electrophoretic method depends entirely on the research question. The following workflow diagram guides this decision-making process.
Diagram 2: A decision workflow for selecting the appropriate electrophoretic method based on research goals.
SDS-PAGE remains an indispensable tool for the preliminary analysis of proteins, but its application must be guided by a thorough understanding of its limitations. The technique can be misleading when interpreting molecular weights of modified or hydrophobic proteins, assessing native oligomeric states, detecting enzymatic activity, or studying metal-binding proteins. The experimental evidence is clear: standard denaturing conditions obliterate functional properties that can be preserved with modified protocols. For research that extends beyond molecular weight determination, alternative and complementary techniques such as BN-PAGE, NSDS-PAGE, and 2D-PAGE are essential for building an accurate and comprehensive understanding of protein structure and function. A sophisticated approach, leveraging the strengths of each method while acknowledging their constraints, is paramount for rigorous scientific discovery in protein science.
Sodium dodecyl sulfate (SDS) is one of the most ubiquitous reagents in molecular biology, primarily known for its powerful denaturing capabilities in SDS-polyacrylamide gel electrophoresis (SDS-PAGE). Its mechanism of action involves strong micellar binding to proteins, which disrupts nearly all non-covalent molecular interactions. This provides the advantage of separating individual protein components based on molecular weight but comes with the significant disadvantage of destroying native protein structures and biological functions [108] [5]. The interaction between SDS and proteins is complex, beginning with specific binding to cationic sites on the protein surface via its negatively charged sulfate group, followed by hydrophobic interactions that disrupt the native structure, ultimately leading to the formation of protein-detergent complexes with extensive alpha-helical character [5] [109].
For research applications where preserving biological function is crucial—such as functional proteomics, enzyme studies, or therapeutic protein development—this denaturing characteristic poses a significant limitation. In response to this challenge, two milder anionic detergents with structural similarities to SDS have gained attention: sodium lauroyl sarcosine (Sarkosyl) and sodium N-lauroyl glutamate (SLG) [108] [110]. These detergents share an identical 12-carbon aliphatic chain with SDS but differ in their hydrophilic head groups, which significantly alters their interactions with proteins and their resulting effects on protein structure and function.
Comparative Analysis of Detergent Properties
Structural Characteristics and Physical Properties
The fundamental differences between these three detergents stem from their distinct hydrophilic head groups, which dramatically influence their behavior toward proteins. SDS possesses a sulfate group, Sarkosyl features a sarcosine residue, and SLG contains a glutamate moiety. Although all three detergents are anionic and share the same hydrophobic tail, their bulkier head groups and differing chemical properties result in markedly different interactions with protein structures [108] [110].
Table 1: Physical Properties of SDS, Sarkosyl, and Sodium Lauroyl Glutamate
| Detergent | Full Name | Head Group Chemistry | Critical Micelle Concentration (CMC) | Aggregation Number | Protein Denaturation Tendency |
|---|---|---|---|---|---|
| SDS | Sodium dodecyl sulfate | Sulfate | 7-10 mM [5] | ~62 [110] | Strong |
| Sarkosyl | Sodium lauroyl sarcosine | Sarcosine | 9-15 mM [110] | ~2 [110] | Moderate |
| SLG | Sodium lauroyl glutamate | Glutamate | 0.5-2 mM [110] | ~80 [110] | Weak |
Sarkosyl is particularly unique due to its reportedly small aggregation number of approximately 2, suggesting it may not form true micelles like SDS and SLG. This characteristic may contribute to its milder effects on proteins, though this unusual property may require further verification [110]. SLG demonstrates the lowest CMC among the three detergents, indicating strong surface activity but with surprisingly weak protein denaturation potential.
Functional Characterization and Protein Interactions
The functional consequences of these structural differences become apparent when examining how each detergent interacts with protein structures. Recent research utilizing agarose native gel electrophoresis and circular dichroism spectroscopy has provided direct comparative data on their binding properties and effects on protein conformation [108] [111].
Table 2: Functional Characteristics Based on Experimental Evidence
| Detergent | Strength of Protein Binding | Impact on Protein Structure | Recovery of Native IL-6 After 2% Treatment | Dissociation from Proteins |
|---|---|---|---|---|
| SDS | Strong | Extensive denaturation and unfolding | 0% (based on lauroyl ether sulfate) [110] | Difficult, often irreversible |
| Sarkosyl | Moderate | Partial structure alteration | 38% [110] | Moderate ease |
| SLG | Weak | Minimal structure change | 100% [110] | Readily dissociates |
Experimental evidence demonstrates that SDS influences the electrophoretic mobilities of model proteins more strongly than Sarkosyl or SLG, indicating its stronger propensity for protein binding and subsequent structural alterations. Circular dichroism analysis confirms that SDS causes significant disruption to secondary and tertiary protein structures, while Sarkosyl and SLG show progressively less disruptive effects [108]. Notably, when diluted from 2% solutions, SLG allows for complete recovery of native interleukin-6 structure, whereas Sarkosyl permits only partial recovery, and SDS (or its close analog) prevents recovery entirely [110].
Experimental Approaches for Evaluating Detergent Effects
Agarose Native Gel Electrophoresis
Methodology Overview: Agarose native gel electrophoresis provides a simple yet powerful technology to evaluate detergent-protein interactions based on electrophoretic mobility shifts. The protocol involves preparing protein samples (e.g., bovine serum albumin, IgG, lysozyme) at 1 mg/mL in 0.1 M His/0.1 M MES buffer at pH 6.1. These samples are mixed with detergent solutions at varying concentrations (typically 0.1% and 1%), then loaded onto a 1% UltraPure agarose gel in the same buffer system. Electrophoresis is performed with running buffer containing 50 mM His/50 mM MES at pH 6.1, maintaining a constant voltage of 50V for 60-90 minutes [108].
Interpretation Framework: The electrophoretic mobility observed in this system reflects the ease of dissociation of bound detergents from proteins during migration. When detergents remain bound to proteins, they contribute additional negative charge, increasing electrophoretic mobility toward the anode. If detergents dissociate readily during electrophoresis, proteins resume their native charge characteristics and exhibit normal mobility patterns. Therefore, stronger detergents like SDS cause significant mobility shifts even at low concentrations, while milder alternatives like SLG show minimal effects on mobility, indicating rapid dissociation and weaker binding [108].
Circular Dichroism Spectroscopy
Structural Analysis Protocol: Circular dichroism (CD) spectroscopy serves as a complementary technique to directly monitor changes in protein secondary and tertiary structure induced by detergent interactions. For these experiments, proteins such as bovine serum albumin or lysozyme are prepared in appropriate buffers (e.g., 10 mM sodium phosphate, pH 7.0) at concentrations optimized for CD detection. Detergents are added at varying concentrations (typically 0.01% to 1%), with special attention to potential UV absorbance interference, particularly with SLG [108].
Far-UV CD spectra (190-250 nm) provide information about secondary structural elements (α-helices, β-sheets), while near-UV CD spectra (250-320 nm) offer insights into tertiary structure through aromatic amino acid environments. For SDS, CD analysis typically reveals extensive unfolding with loss of native spectral features. Sarkosyl produces intermediate structural perturbations, while SLG shows minimal alteration to CD spectra, particularly at lower concentrations, indicating preservation of native structure [108] [110].
Gel Filtration Chromatography Under Native Conditions
Functional Assessment Approach: Gel filtration chromatography provides a method to evaluate the functional reversibility of detergent effects on proteins. In this protocol, proteins are exposed to detergent solutions (e.g., 2% concentration), then applied to size-exclusion columns (such as Superdex-75) equilibrated with detergent-free buffers. The elution profile and recovery of native protein are monitored by UV absorbance [110].
The key measurement is the percentage recovery of native protein based on peak area comparison with untreated controls. This method directly tests whether detergent effects are reversible upon removal, with SLG typically showing complete recovery, Sarkosyl showing partial recovery, and SDS showing minimal recovery of native protein [110].
Experimental Workflow for Detergent Characterization
Research Reagent Solutions: Essential Materials
Table 3: Key Research Reagents for Detergent-Protein Interaction Studies
| Reagent/Category | Specific Examples | Function/Application |
|---|---|---|
| Model Proteins | Bovine serum albumin (BSA), lysozyme, IgG, interleukin-6 (IL-6), GFP-fusion proteins | Representative proteins for evaluating detergent effects on structure and function |
| Anionic Detergents | Sodium dodecyl sulfate (SDS), Sarkosyl (sodium lauroyl sarcosine), sodium lauroyl glutamate (SLG) | Test surfactants with varying denaturing capabilities |
| Analytical Instruments | Agarose gel electrophoresis system, circular dichroism spectrophotometer, FPLC/HPLC with gel filtration columns | Equipment for structural and functional characterization |
| Buffer Components | His/MES buffer (pH 6.1), sodium phosphate buffer (pH 7.0), Tris-based buffers | Maintenance of optimal pH and ionic conditions for experiments |
| Detection Reagents | Coomassie Blue stain, UV/VIS spectrophotometry, fluorescence detectors | Visualization and quantification of proteins and their activities |
Mechanisms of Action: Molecular Interactions
The differential effects of these detergents can be understood through their distinct molecular interactions with proteins. SDS binding follows a cooperative mechanism where initial specific binding to positively charged amino acid residues is followed by extensive hydrophobic interactions that disrupt native protein folding. This leads to the formation of rod-like protein-SDS complexes where the polypeptide chain assumes a largely alpha-helical conformation surrounded by SDS molecules [5] [109].
In contrast, Sarkosyl and SLG exhibit progressively weaker binding patterns. The bulkier head groups of these detergents, particularly the glutamate moiety of SLG, create steric hindrance that limits extensive hydrophobic binding. Additionally, the different chemical properties of these head groups likely reduce the cooperativity of binding, resulting in fewer detergent molecules bound per protein and consequently less structural disruption [108] [110]. This mechanistic understanding explains why these milder detergents can solubilize proteins while maintaining native-like structures and biological activities.
Molecular Interaction Mechanisms of Anionic Detergents
Practical Applications in Protein Science
Inclusion Body Solubilization and Protein Refolding
One of the most valuable applications of milder detergents is in the solubilization of inclusion bodies and refolding of recombinant proteins. Traditional approaches using strong denaturants like 6-8 M urea or guanidine hydrochloride often require complex refolding procedures with low efficiency. Sarkosyl has demonstrated effectiveness in solubilizing inclusion bodies while preserving biological activity in many cases, particularly for actin-binding proteins expressed in E. coli [110] [109].
SLG has shown particular promise in protein refolding applications, often in combination with arginine as a folding assisting agent. The mechanism involves SLG's ability to solubilize aggregated proteins while readily dissociating during the refolding process, allowing proteins to assume their native conformations. This approach has been successfully applied to refold single-chain antibodies and other therapeutic proteins with higher efficiency than traditional denaturation-refolding methods [110].
Cell Lysis for Functional Proteomics
For applications requiring preservation of native protein functions, such as enzyme activity assays or protein-protein interaction studies, SLG offers significant advantages as a component of lysis buffers. Its strong surface activity enables effective membrane disruption while its weak protein binding preserves biological activities. Research has demonstrated that SLG interferes less with protein structure and function compared to SDS or even Sarkosyl, making it particularly suitable for functional proteomics where maintaining native protein conformation is essential [108] [110].
Fractionation of Protein Complexes and Amyloid Fibrils
Sarkosyl has found specialized application in the fractionation of neuropathological protein fibrils, including tau and other amyloid proteins. Many amyloid fibrils exhibit differential resistance to detergents, allowing separation from detergent-sensitive proteins and complexes. This application leverages the intermediate denaturing capability of Sarkosyl to selectively solubilize certain protein components while leaving resistant fibrils intact [108] [5]. Similarly, low concentrations of SDS (0.1%) have been used for decellularization and protein fractionation applications where its effects are intermediate between negligible and extensive binding [5].
Sarkosyl and sodium N-lauroyl glutamate represent valuable alternatives to SDS for research applications where preservation of protein structure and function is essential. Their progressively milder effects on proteins, coupled with strong surface activity, make them particularly suitable for inclusion body solubilization, cell lysis for functional proteomics, and specialized fractionation techniques. The experimental approaches outlined in this review—particularly agarose native gel electrophoresis and circular dichroism spectroscopy—provide robust methodologies for evaluating detergent-protein interactions and selecting appropriate surfactants for specific research needs. As protein science continues to advance toward more functional and therapeutic applications, these milder detergents will play an increasingly important role in bridging the gap between efficient protein solubilization and preservation of biological activity.
The interaction between proteins and sodium dodecyl sulfate (SDS) represents a cornerstone phenomenon in biochemical research with profound implications for structural biology, pharmaceutical development, and biotechnology. The "necklace and bead" model provides a compelling structural framework for understanding how anionic surfactants like SDS denature proteins and form complexes that are fundamental to techniques such as SDS-Polyacrylamide Gel Electrophoresis (SDS-PAGE). Within the broader context of understanding how SDS denatures proteins and imparts a negative charge, this model explains the fundamental mechanism at a molecular level. Grounded in extensive experimental evidence from techniques including small-angle X-ray scattering (SAXS), cryo-electron microscopy, and neutron scattering, this model describes SDS-protein complexes as unfolded polypeptide chains decorated with micelle-like surfactant clusters [112] [113]. This review synthesizes the current structural evidence supporting this model, detailing the experimental methodologies, key parameters of the complexes, and the implications for protein research and drug development.
The Theoretical Framework of the Necklace and Bead Model
Fundamental Principles and Binding Mechanism
The necklace and bead model conceptualizes protein-SDS complexes as comprising two key structural elements: the "beads" (micelle-like SDS clusters) and the "necklace" (the unfolded polypeptide chain connecting these clusters) [113]. This arrangement results from a cooperative binding process that unfolds the native protein structure. The binding mechanism follows a characteristic multi-stage isotherm, with SDS monomers initially binding to specific sites on the protein, primarily at oppositely charged amino acid residues [112]. In this initial specific binding region, surfactant molecules bind to cationic sites on the protein while their hydrophobic tails associate with nearby hydrophobic protein segments, causing minimal conformational disruption [112].
As SDS concentration increases, binding enters a cooperative region where the protein undergoes extensive unfolding. In this phase, SDS molecules form micelle-like clusters along the hydrophobic patches of the progressively unfolding protein backbone [112]. The driving forces for this process combine hydrophobic interactions between surfactant tails and non-polar protein regions with electrostatic attractions between anionic sulfate head groups and cationic amino acid side chains [3]. The cooperative binding culminates in a saturation region where all available binding sites are occupied, and excess SDS forms free micelles in solution [112]. Throughout this process, the extensive binding of SDS—approximately one molecule per two amino acid residues—imparts a uniform negative charge that masks the protein's intrinsic charge, enabling separation by molecular weight in electrophoretic applications [6] [114].
Key Structural Features of the Complexes
The necklace and bead structure exhibits several distinctive characteristics that have been quantified through structural analysis. The micellar "beads" in the complex maintain a remarkably consistent diameter of approximately 6.2 nm, slightly larger than pure SDS micelles which measure approximately 5.7 nm [113]. This consistency suggests a preferred, thermodynamically stable SDS aggregation state when bound to proteins. The number of micellar beads per protein chain correlates with molecular mass; while larger proteins form multi-micellar complexes, proteins with molecular masses below approximately 20 kDa typically form complexes with just a single SDS micelle [113]. For multi-micellar complexes, the center-to-center intermicellar distances typically range between 7.0 and 12.0 nm [113]. The polypeptide chain itself is not merely stretched between micelles but interacts intimately with the micellar structure, predominantly situated at the interface between the sulfate head groups and hydrocarbon core, partially penetrating into the core rather than extending outward from the surface [113].
Experimental Evidence and Methodologies
Multiple complementary biophysical techniques have provided direct structural evidence supporting the necklace and bead model. The following experimental workflows illustrate the primary approaches used to characterize protein-SDS complexes.
Small-Angle Scattering Techniques
Figure 1: SAXS/SANS Workflow for Studying Protein-SDS Complexes
Small-angle X-ray scattering (SAXS) and small-angle neutron scattering (SANS) have been instrumental in characterizing the overall structure and dimensions of protein-SDS complexes. These techniques analyze the elastic scattering of X-rays or neutrons by dissolved macromolecules, producing radially averaged one-dimensional curves from which structural parameters can be extracted [115]. The scattering intensity I(s) is measured as a function of the scattering angle, described by the equation:
[ I(s) = \langle A(s)A^*(s) \rangle_\Omega ]
where the scattering amplitude A(s) is a Fourier transformation of the excess scattering length density, averaged over all orientations (Ω) [115].
In practice, SAXS experiments on protein-SDS complexes involve preparing solutions at specific protein-to-surfactant ratios, typically in the L1 phase of the phase diagram where clear solutions form [116]. The scattered intensity distribution is measured and processed to obtain the pair distance distribution function, which provides model-independent information about particle size and shape [116]. For SDS complexes with flexible proteins like bovine serum albumin (BSA), SAXS data fit well to the necklace and bead model, showing micelle-like clusters randomly distributed along the unfolded polypeptide chain [116]. However, studies on smaller, more rigid proteins like lysozyme have revealed limitations of this model, suggesting alternative structures such as partially embedded swollen micelles where the protein penetrates the micellar core [116]. This protein-dependent structural variation highlights the importance of sample characteristics in experimental design.
Cryo-Electron Microscopy Approach
Figure 2: Cryo-EM Workflow for Protein-SDS Complexes
Cryo-electron microscopy (cryo-EM) provides direct visual evidence for the necklace and bead structure by preserving hydrated samples in vitreous ice without staining artifacts. In a seminal study by Samso et al., cryo-EM was combined with SAXS to analyze ten different SDS-protein complexes [113]. The experimental protocol involves applying protein-SDS complexes to EM grids, rapidly freezing them in liquid ethane to form vitreous ice, and imaging using transmission electron microscopy at cryogenic temperatures [113]. The resulting micrographs directly reveal the necklace-like arrangement of spherical micelles dispersed along what appears to be unfolded peptide chains.
This approach confirmed several key structural parameters: the constant diameter of micelles in complexes (approximately 6.2 nm), the relationship between protein molecular mass and number of micelles per complex, and the surface roughness of the micellar beads [113]. Cryo-EM has also proven valuable for explaining anomalous electrophoretic behavior in SDS-PAGE, such as that observed with histone H5, which forms complexes with unusually large micelles that alter migration patterns [113]. This direct visualization technique provides crucial validation for structures inferred from scattering data and offers insights into sample heterogeneity and structural variations between different protein-surfactant systems.
Supplementary Biophysical Methods
Additional biophysical techniques provide complementary information that supports the necklace and bead model. Circular dichroism (CD) spectroscopy monitors changes in protein secondary structure during surfactant binding by measuring differential absorption of left- and right-handed circularly polarized light [117]. Far-UV CD (190-250 nm) quantifies shifts in α-helix and β-sheet content, while near-UV CD (250-300 nm) provides information about tertiary structural changes [117]. Nuclear magnetic resonance (NMR) spectroscopy can characterize protein-surfactant complexes in micelle environments, though it requires rapid molecular reorientation for line-narrowing, typically limiting applications to smaller proteins or peptides [118]. Fluorescence spectroscopy probes changes in the local environment of tryptophan residues and other fluorophores, providing insights into protein unfolding and surfactant binding events [3] [117].
Quantitative Structural Parameters
The structural characterization of protein-SDS complexes has yielded consistent quantitative parameters across multiple experimental techniques and protein systems, as summarized in the tables below.
Table 1: Micellar Parameters in Protein-SDS Complexes
| Parameter | Value in Complexes | Value in Pure SDS Micelles | Measurement Technique | Reference |
|---|---|---|---|---|
| Micelle diameter | ~6.2 nm | ~5.7 nm | Cryo-electron microscopy | [113] |
| Core diameter | ~3.5 nm | ~3.0 nm | Small-angle X-ray scattering | [116] |
| Shell thickness | ~1.8-2.0 nm | ~1.35 nm | Small-angle X-ray scattering | [116] |
| Surface characteristics | Rough texture | Smooth surface | Cryo-electron microscopy | [113] |
| Micelle aggregation number | Slightly increased | ~62 (in pure SDS) | Small-angle neutron scattering | [116] |
Table 2: Protein-SDS Complex Characteristics by Protein Size
| Parameter | Small Proteins (<20 kDa) | Large Proteins (>20 kDa) | Measurement Technique |
|---|---|---|---|
| Number of micelles per complex | 1 | 2-4 (depending on size) | Cryo-electron microscopy, SAXS |
| Center-to-center intermicellar distance | Not applicable | 7.0-12.0 nm | Cryo-electron microscopy |
| Polypeptide conformation | Partially unfolded, may penetrate micelle core | Extensive unfolding, wraps around micelles | SAXS, SANS, CD spectroscopy |
| Complex molecular weight | Proportional to protein size | Proportional to protein size | Analytical ultracentrifugation |
Table 3: Thermodynamic and Binding Parameters
| Parameter | Value/Range | Conditions | Measurement Technique |
|---|---|---|---|
| Binding isotherm regions | 4 distinct regions | Varying SDS concentration | Equilibrium dialysis, spectroscopy |
| Cooperative binding onset | ~0.5-1.0 mM SDS | Varies by protein | Isothermal titration calorimetry |
| Saturation binding | ~1.4 g SDS/g protein | Above CMC | Sedimentation equilibrium |
| Free micelle formation | Above ~5-8 mM | Varies by system | Surface tension, fluorescence |
Research Reagents and Experimental Solutions
Table 4: Essential Research Reagents for Studying Protein-SDS Complexes
| Reagent/Solution | Composition | Function in Research | Example Application |
|---|---|---|---|
| SDS Stock Solution | 1-10% (w/v) sodium dodecyl sulfate in buffer or water | Induces protein unfolding and complex formation | Binding studies, complex preparation |
| SAXS/SANS Buffer | Typically low-salt buffers (e.g., Tris-HCl, phosphate) | Maintains consistent ionic environment during scattering experiments | Structural analysis by small-angle scattering |
| Cryo-EM Grid Preparation Solutions | Protein-SDS complexes in appropriate buffers | Sample preparation for direct visualization | Vitrification and EM imaging |
| CD Spectroscopy Buffer | Low-absorbance buffers (e.g., phosphate, fluoride) | Enables UV transmission for secondary structure analysis | Monitoring conformational changes |
| NMR Micelle Solutions | SDS, DPC, or DHPC in buffered solutions | Provides membrane-mimetic environment for solution NMR | Structural studies of small proteins/peptides |
Discussion: Implications and Applications
Mechanistic Insights into Protein Denaturation
The necklace and bead model provides a mechanistic foundation for understanding SDS-induced protein denaturation, a process critical to numerous biochemical techniques. The model explains how SDS binding proceeds through distinct stages, beginning with specific site binding followed by cooperative unfolding as surfactant concentration increases [112] [3]. This denaturation mechanism combines both hydrophobic and electrostatic interactions, with the hydrophobic effect driving micelle formation along the polypeptide chain and electrostatic repulsion between anionic head groups contributing to chain expansion [3]. The model further accounts for the uniform charge conferral that enables molecular weight-based separation in SDS-PAGE, as the extensive SDS binding (approximately one molecule per two amino acids) masks the protein's intrinsic charge distribution [6] [114].
Recent research has revealed intriguing subtleties in this denaturation mechanism, including evidence that surfactant-induced unfolding may be reversible under certain conditions. Studies demonstrate that combining ionic surfactants like SDS with nonionic surfactants can promote protein refolding, likely through the formation of mixed micelles that preferentially bind surfactants rather than maintaining protein-surfactant complexes [112]. This refolding phenomenon highlights the dynamic nature of protein-surfactant interactions and suggests potential applications in protein renaturation protocols.
Relevance to Electrophoretic Techniques
The necklace and bead model directly explains the fundamental principles underlying SDS-PAGE, one of the most widely used protein analytical techniques in biochemical research. According to this model, the complete unfolding of proteins and formation of complexes with similar charge-to-mass ratios enables separation primarily based on molecular size rather than intrinsic charge [6] [114]. The constant micelle size observed across different protein complexes [113] contributes to consistent hydrodynamic properties that correlate with polypeptide chain length.
Recent modifications to traditional SDS-PAGE methodology further support the necklace and bead model. The development of native SDS-PAGE (NSDS-PAGE), which reduces SDS concentration and eliminates denaturing steps, demonstrates that partially folded states can retain functionality while still forming fundamental complexes with SDS [7]. This modified technique maintains excellent resolution while preserving enzymatic activity and metal cofactors in many proteins, confirming that the basic necklace structure can accommodate varying degrees of protein folding [7].
Applications in Drug Development and Biotechnology
Understanding protein-surfactant interactions through the necklace and bead model has significant implications for pharmaceutical development and biotechnology. Surfactant-driven modifications of protein structure can guide heat-induced gelation, enabling the design of protein-based materials with tailored mechanical properties [112]. In biopharmaceutical formulation, surfactants commonly serve as stabilizers against protein aggregation, with their mechanisms of action interpretable through the necklace model framework [112] [117].
The model also informs membrane protein studies, where surfactants like SDS facilitate solubilization and analysis of these challenging targets [118]. While the necklace structure differs in lipid bilayer environments, the fundamental principles of surfactant interaction provide insights for developing membrane mimetics that maintain protein function. Additionally, the ability of surfactants to induce controlled unfolding and refolding suggests applications in protein renaturation strategies for recombinant protein production [112].
The necklace and bead model remains the predominant structural framework for understanding protein-SDS complexes, supported by converging evidence from multiple high-resolution techniques. While variations exist depending on protein characteristics and solution conditions, the core concept of micelle-like clusters arranged along unfolded polypeptide chains consistently explains experimental observations across diverse systems. Ongoing research continues to refine this model, exploring nuances in binding cooperativity, structural transitions, and applications in protein science. For researchers and drug development professionals, this model provides not only a mechanistic explanation for fundamental techniques like SDS-PAGE but also a foundation for innovative approaches in protein manipulation, formulation, and analysis.
Conclusion
The ability of SDS to denature proteins and confer a uniform negative charge remains a cornerstone of modern protein science. This dual mechanism, driven by a combination of hydrophobic and electrostatic interactions, enables the reliable separation of proteins by molecular weight via SDS-PAGE. For researchers in drug development and biomedical fields, a deep understanding of this process is crucial not only for routine analysis but also for troubleshooting and innovating new methodologies. Future directions will likely focus on refining detergent-based applications for membrane proteins and intrinsically disordered proteins, and on integrating SDS-PAGE with high-throughput proteomic technologies to accelerate biomarker discovery and therapeutic development.
References
- 1. Sodium dodecyl sulfate - Wikipedia [https://en.wikipedia.org/wiki/Sodium_dodecyl_sulfate]
- 2. Sodium Dodecyl Sulfate - an overview | ScienceDirect Topics [https://www.sciencedirect.com/topics/biochemistry-genetics-and-molecular-biology/sodium-dodecyl-sulfate]
- 3. On the mechanism of SDS-induced protein denaturation [https://pubmed.ncbi.nlm.nih.gov/19802818/]
- 4. How do surfactants unfold and refold proteins? [https://www.sciencedirect.com/science/article/pii/S0001868622001567]
- 5. SDS protein interactions [https://www.sciencedirect.com/science/article/abs/pii/S0301462225001462]
- 6. Mechanism of SDS-PAGE in Protein Separation [https://www.mtoz-biolabs.com/mechanism-of-sds-page-in-protein-separation.html]
- 7. Native SDS-PAGE: High Resolution Electrophoretic ... [https://pmc.ncbi.nlm.nih.gov/articles/PMC4517606/]
- 8. Effect of Protein Denaturation on Air-Entraining Function [https://pubmed.ncbi.nlm.nih.gov/40956247/]
- 9. The Molecular Basis of the Sodium Dodecyl Sulfate Effect ... [https://www.nature.com/articles/s41598-018-20669-7]
- 10. Western blotting guide: Part 2, Protein separation by SDS- ... [https://www.jacksonimmuno.com/secondary-antibody-resource/technical-tips/western-blotting-guide-part-2/]
- 11. Protein analysis SDS PAGE [https://www.qiagen.com/us/knowledge-and-support/knowledge-hub/bench-guide/protein/protein-analysis/protein-analysis-sds-page]
- 12. Differentiation of proteins based on characteristic patterns ... [https://pmc.ncbi.nlm.nih.gov/articles/PMC1472413/]
- 13. Negative charge neutralization in the loops and turns of ... [https://pmc.ncbi.nlm.nih.gov/articles/PMC5823272/]
- 14. Protein Charge Neutralization Is the Proximate Driver ... [https://www.mdpi.com/1422-0067/25/16/8954]
- 15. SDS-PAGE guide: Sample preparation to analysis [https://www.abcam.com/en-us/knowledge-center/western-blot/sds-page-guide]
- 16. Can a Charged Surfactant Unfold an Uncharged Protein? [https://pmc.ncbi.nlm.nih.gov/articles/PMC6289093/]
- 17. High throughput multi-capillary SDS gel electrophoresis of ... [https://sciex.com/tech-notes/ce/high-throughput-multi-capillary-sds-gel-electrophoresis-of-prote]
- 18. Overview of Protein Electrophoresis [https://www.thermofisher.com/us/en/home/life-science/protein-biology/protein-biology-learning-center/protein-biology-resource-library/pierce-protein-methods/overview-electrophoresis.html]
- 19. Monitoring of low-molecular-weight protein aggregation by ... [https://www.sciencedirect.com/science/article/abs/pii/S073170852300290X]
- 20. How to Master SDS-PAGE Gel & Western Blot [https://www.neobiotechnologies.com/resources/sds-page-gel-western-blot/?srsltid=AfmBOor109z_tXUGR1JXETeo_tHyfqEmYzDQFJahpVKNfmeeIiJpyzZT]
- 21. Applications and Advantages of SDS-PAGE in Protein ... [https://www.mtoz-biolabs.com/applications-and-advantages-of-sds-page-in-protein-molecular-weight-determination.html]
- 22. SDS-PAGE [https://en.wikipedia.org/wiki/SDS-PAGE]
- 23. PAGE: Principle, Protocol & Key Applications Explained SDS [https://www.vedantu.com/biology/sds-page]
- 24. The Behavior of the Hydrophobic Effect under Pressure ... [https://pmc.ncbi.nlm.nih.gov/articles/PMC2856145/]
- 25. Entropy-driven denaturation enables sustainable protein ... [https://www.nature.com/articles/s41467-025-61959-9]
- 26. SDS-Page - Ask A Biologist [https://askabiologist.asu.edu/sds-page]
- 27. SDS-PAGE: The science behind all those bubbles [https://www.antibodiesinc.com/pages/sds-page-demystified?srsltid=AfmBOor-cV3bMKiBS_shymnO0cz9PuvwanRsD16YrnyGc5cSd7zj5p7v]
- 28. Effects of anionic surfactants SDS and SDBS on the ... [https://jlse.springeropen.com/articles/10.1186/s42825-025-00222-9]
- 29. Ionic surfactants alter virus surface properties and electrostatic ... [https://pmc.ncbi.nlm.nih.gov/articles/PMC12452283/]
- 30. SDS Depletion from Intact Membrane Proteins by KCl ... [https://www.mdpi.com/2227-7382/13/3/30/review_report]
- 31. SDS-PAGE Analysis of proteins: Principles, methodology ... [https://deepscienceresearch.com/dsr/catalog/book/107/chapter/407]
- 32. Overview of SDS-PAGE [https://www.creative-proteomics.com/resource/overview-of-sds-page.htm]
- 33. Denaturation of Proteins by SDS and by Tetra ... [https://pmc.ncbi.nlm.nih.gov/articles/PMC3172379/]
- 34. Micellar solubilization of drugs. [https://sites.ualberta.ca/~csps/JPPS8(2)/C.Rangel-Yagui/solubilization.htm]
- 35. Formation of Polymeric Micelle -Mixed Micelles : The... | IntechOpen [https://www.intechopen.com/chapters/1188306]
- 36. Protein Electrophoresis Using SDS-PAGE: A Detailed ... [https://www.goldbio.com/blogs/articles/protein-electrophoresis-sds-page-overview?srsltid=AfmBOopBZdcNOBPMYrBXIezRYQkTtLikSEZe-q9ouQ8rp0-TMuQrbBIL]
- 37. Reducing agent [https://en.wikipedia.org/wiki/Reducing_agent]
- 38. Oxidizing and Reducing Agents [https://chem.libretexts.org/Bookshelves/Analytical_Chemistry/Supplemental_Modules_(Analytical_Chemistry)/Electrochemistry/Redox_Chemistry/Oxidizing_and_Reducing_Agents]
- 39. Reducing Agent - an overview [https://www.sciencedirect.com/topics/medicine-and-dentistry/reducing-agent]
- 40. Buffers for Biochemical Reactions [https://www.promega.com/resources/guides/lab-equipment-and-supplies/buffers-for-biochemical-reactions/]
- 41. What is a Biological Buffer and How to Choose the Best ... [https://www.goldbio.com/blogs/articles/what-is-a-biological-buffer-and-how-to-choose-the-best-buffer-for-your-experiment?srsltid=AfmBOoowyLFwYMo2bgA4aPEexj8ZxHNs90lMjI3lbsbIb75Iq-6_SPGn]
- 42. Cell Tracking Dye Kit - Blue - Cytopainter (ab138890) [https://www.abcam.com/en-us/products/assay-kits/cell-tracking-dye-kit-blue-cytopainter-ab138890]
- 43. The Role of Buffers in Biological and Chemical Experiments [https://www.msesupplies.com/blogs/news/the-role-of-buffers-in-biological-and-chemical-experiments?srsltid=AfmBOooke6Y4DGW7IlyLrRlXtNPZdw-8nLiZZA-awdydmzshdbjLvH7i]
- 44. gel electrophoresis - Wikipedia Polyacrylamide [https://en.wikipedia.org/wiki/Polyacrylamide_gel_electrophoresis]
- 45. Gel Electrophoresis - Conduct Science Polyacrylamide [https://conductscience.com/polyacrylamide-gel-electrophoresis/]
- 46. Protein transfer through polyacrylamide hydrogel membranes... [https://pubmed.ncbi.nlm.nih.gov/15360267/]
- 47. (PDF) Protein Transfer through Polyacrylamide Hydrogel Membranes... [https://www.academia.edu/58822003/Protein_Transfer_through_Polyacrylamide_Hydrogel_Membranes_Polymerized_in_Lyotropic_Phases]
- 48. Deciphering food proteins: The applications of SDS-PAGE ... [https://www.sciencedirect.com/science/article/abs/pii/S2212429225003025]
- 49. The principle and method of polyacrylamide gel ... [https://www.mblbio.com/bio/g/support/method/sds-page.html]
- 50. Protein Electrophoresis Using SDS-PAGE: A Detailed ... [https://www.goldbio.com/blogs/articles/protein-electrophoresis-sds-page-overview?srsltid=AfmBOooYTbtcLzy40brht7xT79ul_M0FOlncqD2OiFINBtg8pwSdf6jG]
- 51. SDS-PAGE Protocol [https://www.rockland.com/resources/sds-page-protocol/?srsltid=AfmBOorn6FZ5ZR8Hm8x_7cSbxBzF2HBcjlrZS7N5OBlWKY-6dJlynrsc]
- 52. Preparing protein samples for sds-page [https://www.ruf.rice.edu/~bioslabs/studies/sds-page/denature.html]
- 53. How SDS-PAGE Separates Proteins [https://azurebiosystems.com/blog/how-sds-page-separates-proteins/]
- 54. Can a Charged Surfactant Unfold an Uncharged Protein? [https://www.sciencedirect.com/science/article/pii/S0006349518312116]
- 55. SDS-PAGE: The science behind all those bubbles [https://www.antibodiesinc.com/pages/sds-page-demystified?srsltid=AfmBOor03DD5QuDoLQNJfqUIEGC9hmvLX8nfzwUIVmf_euUSjA9uS2Aw]
- 56. Example of a standard curve for molecular mass [https://www.ruf.rice.edu/~bioslabs/studies/sds-page/mw.html]
- 57. Protein Standards and Ladders Selection Guide [https://www.thermofisher.com/us/en/home/life-science/protein-biology/protein-gel-electrophoresis/protein-standards-ladders/protein-standards-ladders-selection-guide.html]
- 58. Determining Protein Molecular Weight with SDS-PAGE [https://info.gbiosciences.com/blog/bid/196974/determining-protein-molecular-weight-with-sds-page-an-overview-of-the-process]
- 59. SDS-PAGE and Western Blotting [https://pubmed.ncbi.nlm.nih.gov/21337110/]
- 60. How to Master SDS-PAGE and Western Blot in 5 Easy Steps [https://www.neobiotechnologies.com/resources/sds-page-western-blot/?srsltid=AfmBOopioXZRN8tnPQNHP8OyvmR5qYRyQei_35LVhQE2HjIk_dMTfRNk]
- 61. SDS-PAGE - 蛋白质电泳 - 欣伯玉生物 [https://www.x-biotech.com/SDS-PAGE?article_id=34]
- 62. SDS-PAGE Protocol [https://www.rockland.com/resources/sds-page-protocol/?srsltid=AfmBOooAOZbpU0Ah2R47gM-Hh2oG0TEomuMF9vuImL_6qr8h5L2vQZGf]
- 63. Western Blot常见问题分析 [https://www.affbiotech.com/article/2020/07/09/52.html]
- 64. SDS-PAGE: The science behind all those bubbles [https://www.antibodiesinc.com/pages/sds-page-demystified?srsltid=AfmBOopCWB7NS0ylKwHMgqx26QQHVj-Ccsl_o7yi7Z7j5n2m5I0tdfwY]
- 65. Denaturation of proteins by surfactants studied by the ... [https://pmc.ncbi.nlm.nih.gov/articles/PMC5398553/]
- 66. Tips for Optimal SDS-PAGE Separation [https://www.rockland.com/resources/tips-for-optimal-sds-page-separation/?srsltid=AfmBOooYxWW_wJWqyf3fM8OAefESAt4YjCtVst-GepJezIVtVVwV56as]
- 67. Troubleshooting SDS-PAGE Sample Preparation Issues [https://www.goldbio.com/blogs/articles/troubleshooting-sds-page-sample-preparation-issues?srsltid=AfmBOorD7yeNb0R9pvBDWinKAvuqdwjy3eEDBuv7WtDtSQ-ODT5V11bo]
- 68. Denaturing mass photometry for rapid optimization of ... [https://pmc.ncbi.nlm.nih.gov/articles/PMC11045720/]
- 69. SCASP: A Simple and Robust SDS-Aided Sample ... [https://www.sciencedirect.com/science/article/pii/S1535947621000244]
- 70. SDS Depletion from Intact Membrane Proteins by KCl ... [https://pmc.ncbi.nlm.nih.gov/articles/PMC12286100/]
- 71. SDS-PAGE: The science behind all those bubbles [https://www.antibodiesinc.com/pages/sds-page-demystified?srsltid=AfmBOorcD7wn7GoMgnGqBah36BKNSzzsB_OE83z4jjiEM-Wh3pe9bwZ6]
- 72. How to choose an acrylamide gel concentration for western ... [https://hellobio.com/how-to-choose-an-acrylamide-gel-concentration-for-western-blot/]
- 73. Western Blot SDS-PAGE [https://www.novusbio.com/support/support-by-application/western-blot-sds-page?srsltid=AfmBOooSk46bispHwZ7tOqQPCTQJiw3TPHCeL6NB8t-n7nGecWbHvHcg]
- 74. Optimization of Electrophoresis Gel Concentration [https://www.aatbio.com/resources/application-notes/optimization-of-electrophoresis-gel-concentration]
- 75. Running agarose and polyacrylamide gels [https://eu.idtdna.com/page/support-and-education/decoded-plus/running-agarose-and-polyacrylamide-gels/]
- 76. Protein Electrophoresis Using SDS-PAGE: A Detailed ... [https://www.goldbio.com/blogs/articles/protein-electrophoresis-sds-page-overview?srsltid=AfmBOoofd-NXDc5QIPPHi8fglq2AlEPmNdumh_pwZJx2IaOPCAbBW5o7]
- 77. General Western Blot Protocol Overview [https://www.novusbio.com/support/support-by-application/western-blot/protocol.html?srsltid=AfmBOoptgookl4Kim4CtuPWtVnlX-Lp0Pkk0NFSGnWpLopecYOum9-pq]
- 78. -PAGE Protocol | Rockland SDS [https://www.rockland.com/resources/sds-page-protocol/]
- 79. Constant Current or Voltage in SDS -PAGE: The Great Debate! [https://bitesizebio.com/51744/constant-current-or-voltage-in-sds-page/]
- 80. What Is the Role of SDS in Protein Gel Electrophoresis? [https://synapse.patsnap.com/article/what-is-the-role-of-sds-in-protein-gel-electrophoresis]
- 81. Agarose Gels Do Not Polymerise! [https://bitesizebio.com/10248/agarose-gels-do-not-polymerise/]
- 82. Troubleshooting Sodium Dodecyl Sulfate- Polyacrylamide ... [https://www.hycultbiotech.com/sds-page/troubleshooting/]
- 83. Help for Your New Lab Techs: Avoiding Sample Prep ... [https://blog.omni-inc.com/blog/help-for-your-new-lab-techs-avoiding-sample-prep-mistakes]
- 84. Refolding SDS-denatured proteins by the addition of ... [https://pubmed.ncbi.nlm.nih.gov/18083190/]
- 85. Two-dimensional gel electrophoresis (2D-GE) [https://www.letstalkacademy.com/two-dimensional-gel-electrophoresis-2d-ge/]
- 86. Overview of Two-Dimensional Gel Electrophoresis [https://www.creative-proteomics.com/resource/overview-of-two-dimensional-gel-electrophoresis.htm]
- 87. Two-Dimensional Gel Electrophoresis - an overview [https://www.sciencedirect.com/topics/neuroscience/two-dimensional-gel-electrophoresis]
- 88. SDS-PAGE Protocol [https://neutab.creative-biolabs.com/sds-page-analysis.htm]
- 89. Two-dimensional gel electrophoresis of proteins [https://www.nature.com/articles/nmeth0105-83]
- 90. SDS PAGE vs Native PAGE [https://byjus.com/biology/difference-between-sds-page-and-native-page/]
- 91. What is the difference between PAGE and SDS-PAGE? [https://www.aatbio.com/resources/faq-frequently-asked-questions/What-is-the-difference-between-PAGE-and-SDS-PAGE]
- 92. 非变性凝胶电泳简述_北京六一 [http://www.liuyi17.com/jishu/330.html]
- 93. 十二烷基硫酸钠(简介,如何使蛋白质变性,作用是什么) [http://www.bio-fount.com/cn/content/1318.html]
- 94. SDS-PAGE: The science behind all those bubbles [https://www.antibodiesinc.com/pages/sds-page-demystified?srsltid=AfmBOooefCjGXnS-2fuOW5vFgNVBGL_J1tio7hLd6ci_O-JWobz2VLyq]
- 95. 蛋白质电泳sds作用| 百度健康·医学科普 [https://health.baidu.com/m/detail/ar_6599666943734168116]
- 96. Native-PAGE和SDS-PAGE的比较 [https://www.mycs.cn/news/industry/974]
- 97. Differences between SDS PAGE and Native PAGE [https://www.geeksforgeeks.org/biology/differences-between-sds-page-and-native-page/]
- 98. SDS-PAGE电泳的基础原理和实验步骤 [https://www.detaibio.com/topics/sds-page-technology.html]
- 99. SDS-PAGE: The science behind all those bubbles [https://www.antibodiesinc.com/pages/sds-page-demystified?srsltid=AfmBOoqKf56fOMaNd4giI929RSq1ASzlszEnWjzbY_rXLQPQukta_fR8]
- 100. Whole gel processing procedure for GeLC-MS/MS based ... [https://proteomesci.biomedcentral.com/articles/10.1186/1477-5956-11-17]
- 101. Mass Spectrometry Characterization of the SDS-PAGE Protein ... [https://pmc.ncbi.nlm.nih.gov/articles/PMC10969193/]
- 102. In-depth structural proteomics integrating mass ... [https://www.frontiersin.org/journals/analytical-science/articles/10.3389/frans.2022.1107183/full]
- 103. Applying Small Angle X-Ray Scattering (SAXS) To Protein ... [https://pmc.ncbi.nlm.nih.gov/articles/PMC10132260/]
- 104. SDS-PAGE: The science behind all those bubbles [https://www.antibodiesinc.com/pages/sds-page-demystified?srsltid=AfmBOopvpxJMA-TASIPTCrAB_wLakYPFpX-AyH5ZO837CCrdjxCaVEv7]
- 105. Protein Electrophoresis Using SDS-PAGE: A Detailed ... [https://www.goldbio.com/blogs/articles/protein-electrophoresis-sds-page-overview?srsltid=AfmBOopzXrcHjkncfOWghWIbf952pV1euuiNQyjj-jZpXLhJ_uYY7YCP]
- 106. Comparison of in-gel protein separation techniques ... [https://pmc.ncbi.nlm.nih.gov/articles/PMC4234072/]
- 107. Troubleshooting SDS-PAGE Sample Preparation Issues [https://www.goldbio.com/blogs/articles/troubleshooting-sds-page-sample-preparation-issues?srsltid=AfmBOoo9IbAS1gOJZgnYmOZOlpYmNuhzhgglR9s_BVPa6NwsBDGADDPG]
- 108. Effects of sodium dodecyl sulfate, Sarkosyl and ... [https://www.sciencedirect.com/science/article/abs/pii/S0301462224001455]
- 109. Use of anionic denaturing detergents to purify insoluble ... [https://pmc.ncbi.nlm.nih.gov/articles/PMC3536628/]
- 110. Sodium Dodecyl Sulfate Analogs as a Potential Molecular ... [https://www.mdpi.com/1467-3045/46/1/40]
- 111. Effects of sodium dodecyl sulfate, Sarkosyl and ... [https://pubmed.ncbi.nlm.nih.gov/39168056/]
- 112. Surfactant-driven modifications in protein structure [https://pubs.rsc.org/en/content/articlehtml/2025/sm/d5sm00207a]
- 113. Evidence for Sodium Dodecyl sulfate/protein Complexes ... [https://pubmed.ncbi.nlm.nih.gov/7588721/]
- 114. SDS-PAGE: The science behind all those bubbles [https://www.antibodiesinc.com/pages/sds-page-demystified?srsltid=AfmBOoo38q9TbV4hm1EKLstmN35xmTttyMoblUp6IDeBz2B-h87ZRAwJ]
- 115. Structural characterization of proteins and complexes using ... [https://www.sciencedirect.com/science/article/abs/pii/S1047847710001905]
- 116. A small-angle X-ray scattering study of the structure ... [https://www.sciencedirect.com/science/article/abs/pii/S0021979708011302]
- 117. Unfolding and Refolding of Bovine Serum Albumin Induced ... [https://pmc.ncbi.nlm.nih.gov/articles/PMC1305498/]
- 118. NMR structural studies of membrane proteins - PMC [https://pmc.ncbi.nlm.nih.gov/articles/PMC3282058/]