The Laemmli Method for SDS-PAGE: A Complete Guide from Principle to Practice
This article provides a comprehensive resource on the Laemmli method for discontinuous SDS-PAGE, a foundational technique for protein analysis used ubiquitously in molecular biology and drug development.
The Laemmli Method for SDS-PAGE: A Complete Guide from Principle to Practice
Abstract
This article provides a comprehensive resource on the Laemmli method for discontinuous SDS-PAGE, a foundational technique for protein analysis used ubiquitously in molecular biology and drug development. Tailored for researchers and scientists, the content spans from the core principles and historical context of the method to detailed, step-by-step protocols for sample preparation and buffer formulation. It further delivers essential troubleshooting guidance for common issues like smearing and poor separation, and discusses validation strategies to ensure experimental reliability. By synthesizing foundational knowledge with advanced methodological and optimization insights, this guide aims to empower professionals in obtaining precise, reproducible results in protein characterization, western blotting, and biomedical research.
Understanding Laemmli Buffer: The Foundation of Discontinuous SDS-PAGE
Historical Context and the Laemmli Breakthrough
In the late 1960s, molecular biologists faced a significant analytical challenge: the inability to effectively separate and characterize complex mixtures of structural proteins from biological assemblies like viruses. While discontinuous polyacrylamide gel electrophoresis had been invented by Davis and Ornstein [1] [2], these early systems separated proteins based on their native charge and required proteins to remain in their folded state. This presented a fundamental limitation for studying structural proteins that formed strong non-covalent bonds within viral capsids [1] [2]. The critical breakthrough came from Jacob V. Maizel Jr.'s work with poliovirus, which demonstrated that the detergent sodium dodecyl sulfate (SDS) could dissociate viral particles and unfold polypeptide chains, creating uniform protein-SDS complexes [1] [2]. However, these early SDS gels produced broad migrating bands that offered inadequate resolution for complex systems like bacteriophage T4, which contained dozens of structural proteins [1] [2]. It was within this technical landscape that Ulrich K. Laemmli made his transformative contribution.
The Laemmli Breakthrough: A Technical Innovation
Scientific Context and Motivation
Ulrich K. Laemmli developed his high-resolution SDS polyacrylamide gel electrophoresis in 1970 while working as a postdoctoral fellow in Aaron Klug's virus structural group at the Medical Research Council Laboratory of Molecular Biology (MRC LMB) in Cambridge, UK [1] [2] [3]. His specific research aim was to analyze the structural proteins of the capsid of bacteriophage T4, which were insoluble in aqueous buffers and could not be dissociated under native conditions [1] [2]. The scientific environment at MRC LMB was particularly conducive to this innovation, with Laemmli working alongside Jacob V. Maizel Jr. (visiting on sabbatical) and Jonathan King, who provided technical assistance [1] [2]. Laemmli's Swiss technical education provided him with deeper knowledge of electrochemistry than many of his contemporary molecular biologists, enabling him to recognize that the stacking phenomena of discontinuous buffer systems could potentially be adapted to work with SDS-polypeptide complexes [1] [2].
The development was intimately connected to advances in T4 phage genetics. The groups of R. H. Epstein and Edward Kellenberger in Geneva and R. S. Edgar at Caltech had developed conditional lethal mutants (temperature-sensitive and amber nonsense mutants) of phage T4 that blocked viral assembly and caused accumulation of morphogenetic intermediates [1] [2]. Laemmli's prior work in Kellenberger's group had characterized capsid-related structures accumulating in cells infected with head assembly mutants, but the protein composition of these structures remained unknown due to analytical limitations [1] [2].
Core Technical Innovation
Laemmli's fundamental insight was recognizing that the stacking phenomenon in discontinuous buffer systems could be adapted to work with SDS-polypeptide complexes under denaturing conditions [1] [2]. His systematic approach involved experimenting with numerous buffer and gel solutions to find a pair of buffers in which the SDS-polypeptide chains would concentrate and stack at a buffer interface in a stacking gel above the separating gel [1] [2]. The original methodology was laborious, involving casting gels in glass tubes, running samples, then cracking open the tubes with a hammer before slicing, drying, and staining the gel slices [1] [2] [4]. The process exposed researchers to significant health hazards, including neurotoxic acrylamide absorbed through the skin and SDS aerosols breathed during gel preparation [1] [2].
The key to Laemmli's system was the combination of a stacking gel with a different pH and composition than the separating gel, which created a discontinuous buffer system that concentrated protein samples into extremely sharp bands before they entered the separating gel [5]. This stacking effect, combined with the molecular sieving properties of the polyacrylamide matrix, enabled unprecedented resolution of complex protein mixtures. The system leveraged the fact that in the presence of SDS, polypeptide chains unfold and bind SDS at a constant ratio (approximately 1.4g SDS per 1g protein), creating complexes with uniform charge-to-mass ratios that migrated strictly according to molecular weight [5].
Table 1: Key Advantages of Laemmli's SDS-PAGE System Over Previous Methods
| Analytical Feature | Pre-Laemmli Methods | Laemmli's System | Impact on Protein Research |
|---|---|---|---|
| Resolution | Broad bands, limited separation [1] [2] | Sharp, focused bands [1] [2] | Enabled analysis of complex protein mixtures |
| Sample Handling | Limited dissociation of structural complexes [1] [2] | Complete denaturation and dissociation [1] [2] | Allowed study of insoluble structural proteins |
| Molecular Weight Determination | Approximate, influenced by native charge [1] | Accurate, based primarily on size [1] [2] | Standardized protein characterization |
| Reproducibility | Variable between experiments | Highly consistent results | Facilitated comparative studies |
Figure 1: SDS-PAGE Experimental Workflow. The diagram illustrates the key steps in Laemmli's discontinuous gel electrophoresis system, from sample preparation through final analysis.
Methodology and Technical Specifications
Laemmli Buffer Composition and Function
The Laemmli buffer is a critical component of the system, specifically formulated to prepare protein samples for optimal separation in the discontinuous gel system. Each component serves precise biochemical functions that collectively enable high-resolution protein separation [6] [5].
Table 2: Laemmli Buffer Components and Their Functions
| Component | Standard Concentration | Primary Function | Mechanism of Action |
|---|---|---|---|
| SDS (Sodium Dodecyl Sulfate) | 2-4% [5] | Protein denaturation and charge uniformity | Disrupts non-covalent bonds, imparts uniform negative charge [5] |
| Reducing Agent (β-mercaptoethanol or DTT) | 5% β-ME or 100mM DTT [5] | Reduction of disulfide bonds | Thiol groups break covalent disulfide linkages [5] |
| Glycerol | 10-20% [5] | Density agent for loading | Increases sample density for easy well loading [5] |
| Tris Buffer | 62.5-250mM, pH 6.8 [6] [5] | pH control and enzyme inhibition | Maintains optimal pH for stacking, inhibits proteases [5] |
| Bromophenol Blue | 0.0025-0.01% [5] | Tracking dye | Visualizes migration front during electrophoresis [5] |
Gel Composition and Buffer Systems
The discontinuous nature of Laemmli's system relies on precisely formulated stacking and separating gels with different pore sizes and pH values. The standard protocol involves a two-layer gel system [7].
Table 3: Standard Laemmli Gel Formulations
| Component | Stacking Gel (5%) | Separating Gel (7-15%) |
|---|---|---|
| Acrylamide/Bis Solution | 0.67 mL [7] | Varies by desired resolution |
| Tris-HCl Buffer | 0.38 mL, 1.0 M, pH 6.8 [7] | 2.5 mL, 1.5 M, pH 8.8 [7] |
| SDS (10%) | 0.03 mL [7] | 0.1 mL [7] |
| Ammonium Persulfate (10%) | 0.03 mL [7] | 0.1 mL [7] |
| TEMED | 0.003 mL [7] | 0.004 mL [7] |
| Deionized Water | 2.1 mL [7] | 2.3 mL [7] |
Detailed Experimental Protocol
Gel Preparation
The separating gel is prepared first by combining all components except TEMED and ammonium persulfate. After adding these polymerization catalysts, the solution is quickly transferred between glass plates in a casting chamber. A small layer of absolute ethanol is added on top to create a flat meniscus and remove bubbles. Once polymerized, the ethanol is removed and the stacking gel solution (similarly prepared without catalysts initially) is added. A comb is inserted to create wells, and the gel is allowed to polymerize completely [7].
Sample Preparation
Protein samples are combined with Laemmli buffer at an appropriate dilution (typically 1:1 for 2X buffer or 1:3 for 4X buffer). For reducing conditions, the buffer includes β-mercaptoethanol or DTT. The mixture is heated to 95-100°C for 5-10 minutes to ensure complete denaturation, then cooled to room temperature before loading [6] [7]. Critical considerations include using fresh reducing agents (which degrade over time) and avoiding excessive salt concentrations that can interfere with separation [6].
Electrophoresis Conditions
The polymerized gel is placed in an electrophoresis chamber filled with running buffer (typically Tris-Glycine with 0.1% SDS). Samples are loaded into wells, and electrophoresis begins at constant voltage (80V) until the dye front reaches the separating gel, then increased to 100-120V until the dye front approaches the bottom of the gel [7]. The entire process typically takes 1-2 hours depending on gel concentration and apparatus size.
Protein Detection
Following electrophoresis, proteins are detected using staining methods appropriate for sensitivity requirements. Coomassie Blue staining detects approximately 0.2μg of protein per band, while silver staining can detect as little as 5ng of protein [7]. For specific detection, proteins can be transferred to membranes for Western blotting analysis [6].
Impact and Evolution of the Technology
Immediate Scientific Applications
Laemmli's SDS-PAGE system immediately revolutionized the study of bacteriophage T4 assembly. The technique allowed Laemmli to demonstrate that T4 heads were assembled from more than six different proteins and to identify them as products of specific T4 genes [1]. The method also revealed striking proteolytic processing events during head maturation, including the complete proteolysis of the gene 22 product (the major scaffolding protein), which was absent from mature virions [1]. Jonathan King immediately applied the gel system to identify T4 proteins required for tail and tail fiber assembly, revealing the sequential protein-protein interactions controlling viral self-assembly pathways [1] [2]. The technique further enabled discovery of chaperone requirements in phage assembly, such as the non-structural protein gp31 needed for proper folding of the major capsid protein, later identified as a phage-specific replacement of the GroES subunit of the GroEL/S chaperonin system [1].
Methodological Evolution and Improvements
Several key improvements followed Laemmli's original tube gel methodology. The development of slab gels by William Studier and Pat O'Farrell dramatically improved efficiency by enabling simultaneous analysis of multiple samples [1] [4]. Two-dimensional gel electrophoresis combined isoelectric focusing with SDS-PAGE to provide unprecedented resolution of complex protein mixtures. Downstream applications like Western blotting (for protein detection) and Northern blotting (for nucleic acids) leveraged the stable separations achieved in acrylamide gels [1]. Modern innovations include one-step casting methods that save time by incorporating glycerol in the separating gel to create density differences enabling simultaneous casting of both gel layers [8].
Transition to Modern Capillary Electrophoresis
While SDS-PAGE remains widely used, capillary electrophoresis SDS (CE-SDS) has emerged as a superior technology for many applications, particularly in biopharmaceutical development. CE-SDS, pioneered by Stellan Hjertén and enhanced by James W. Jorgenson and Krynn D. Lukacs, provides automated separation in narrow-bore capillaries [4]. This technology offers significant advantages including higher resolution, superior reproducibility, quantitative precision, higher throughput, and reduced use of toxic reagents compared to traditional SDS-PAGE [4]. Commercial systems like the Maurice platforms now enable CE-SDS analysis with results in as little as 5.5 minutes per sample, making this technology particularly valuable for quality control in biotherapeutic development [4].
Table 4: Comparison of SDS-PAGE and Modern CE-SDS Technologies
| Characteristic | Traditional SDS-PAGE | Modern CE-SDS |
|---|---|---|
| Automation Level | Manual process [4] | Fully automated [4] |
| Hands-on Time | Significant (gel casting, staining) [4] | Minimal (pre-filled capillaries) [4] |
| Reproducibility | Variable between gels [4] | Highly consistent [4] |
| Detection Method | Band intensity (subjective) [4] | Peak integration (quantitative) [4] |
| Analysis Time | 1-2 hours plus staining [7] | 5.5-25 minutes [4] |
| Toxic Waste | Significant (acrylamide, staining reagents) [4] | Minimal [4] |
| Sample Throughput | Limited by gel size | High (96 samples automated) [4] |
The Scientist's Toolkit: Essential Research Reagents
Table 5: Key Research Reagent Solutions for Laemmli SDS-PAGE
| Reagent/Category | Specific Examples | Function & Importance |
|---|---|---|
| Laemmli Buffer Formulations | Reducing (BP-110R, BP-111R) and Non-Reducing (BP-110NR, BP-111NR) [6] | Sample preparation for SDS-PAGE; choice depends on need to preserve or reduce disulfide bonds [6] |
| Acrylamide/Bis Solution | 30% Acrylamide/Bis solution (Bio-Rad #161-0158) [7] | Forms the polyacrylamide gel matrix; concentration determines pore size and separation range [7] |
| Polymerization Catalysts | Ammonium Persulfate (APS) and TEMED [7] | Initiate and catalyze acrylamide polymerization; fresh preparation critical for consistent gel formation [7] |
| Electrophoresis Buffers | Tris-Glycine-SDS Running Buffer [7] | Provides conductive medium for electrophoresis and maintains appropriate pH for separation [7] |
| Protein Molecular Weight Markers | Pre-stained and unstained standards [7] | Enable molecular weight estimation and tracking electrophoresis progress [7] |
| Detection Reagents | Coomassie Blue, Silver Stain, Western Blotting reagents [7] | Visualize separated proteins with varying sensitivity levels from 0.2μg (Coomassie) to 5ng (Silver) [7] |
Ulrich Laemmli's development of high-resolution SDS-PAGE represents a paradigm-shifting advancement in protein biochemistry with extraordinary scientific impact, evidenced by nearly 300,000 citations of his original 1970 Nature paper [2] [9]. The technique's enduring value lies in its elegant integration of fundamental principles of electrochemistry and protein chemistry to solve a pressing analytical challenge in molecular biology. While the original methodology has evolved significantly—from tube gels to slab gels to modern capillary systems—the core discontinuous buffer system developed by Laemmli remains conceptually fundamental to protein separation technologies. The technique continues to enable discoveries across biological disciplines, from basic mechanisms of viral assembly to characterization of therapeutic proteins, demonstrating the profound impact that methodological innovations can have on accelerating scientific progress. As protein design emerges as a distinct scientific discipline with the establishment of dedicated research centers [10], the analytical principles established by Laemmli continue to provide essential tools for characterizing engineered proteins and validating computational designs.
The Five Critical Components and Their Biochemical Roles
The Laemmli buffer system, developed by Professor Ulrich K. Laemmli in 1970, represents a cornerstone technique in modern molecular biology and biochemistry [2]. This method for discontinuous sodium dodecyl sulfate polyacrylamide gel electrophoresis (SDS-PAGE) revolutionized the ability to separate complex protein mixtures with high resolution according to their molecular weights [1]. The technique was born out of Laemmli's work on T4 phage head assembly at the Medical Research Council Laboratory of Molecular Biology, where he sought to analyze structural proteins that were insoluble under native conditions [2]. The system's ingenious design lies in its five critical components, each performing specific biochemical roles that collectively enable precise protein separation, a capability that has made it one of the most cited methodologies in scientific history with approximately 300,000 citations to date [2]. This technical guide examines the biochemical foundation of each component and their integrated function within the Laemmli method.
Component 1: Sodium Dodecyl Sulfate (SDS)
Biochemical Role: SDS serves as a powerful ionic detergent and denaturing agent that fundamentally transforms protein structure and charge characteristics [5] [11].
Mechanism of Action: SDS molecules possess a hydrophobic hydrocarbon tail and a hydrophilic anionic sulfate head group [5]. This amphipathic nature allows SDS to bind tenaciously to the hydrophobic regions of proteins via its hydrocarbon tail, while the sulfate group faces outward into the aqueous environment. SDS binds to proteins at a nearly constant ratio of approximately 1.4 grams of SDS per 1 gram of protein [5] [11] [12]. This extensive binding coat disrupts virtually all non-covalent interactions—including hydrogen bonds, hydrophobic interactions, and van der Waals forces—that maintain secondary, tertiary, and quaternary protein structures [5]. The result is the complete unfolding of proteins into linear polypeptide chains shrouded by SDS molecules.
The bound SDS molecules impart a strong uniform negative charge to all proteins that effectively swamps their intrinsic electrical charges [5] [13]. This creates protein-SDS complexes with identical charge-to-mass ratios, ensuring that separation during electrophoresis depends solely on molecular size rather than native charge differences [12] [13]. This fundamental principle enables accurate molecular weight estimation through comparison with protein standards.
Component 2: Reducing Agent
Biochemical Role: Reducing agents, typically β-mercaptoethanol (BME) or dithiothreitol (DTT), specifically target and cleave covalent disulfide bonds that SDS alone cannot break [5].
Mechanism of Action: The thiol (-SH) groups of reducing agents are the key functional elements responsible for reducing disulfide linkages [5]. These thiol groups donate protons to disulfide bonds (-S-S-), reducing them to free thiol groups (-SH) [5]. The mechanism involves the deprotonated form of the thiol group (thiolate anion) attacking one of the sulfur atoms in the disulfide bond, ultimately resulting in the reduction of the disulfide bond into two separate thiol groups and oxidation of the reducing agent [5].
This reduction process is crucial for complete protein denaturation, as disulfide bonds can maintain tertiary and quaternary structures even in the presence of SDS [5]. By breaking these covalent cross-links, reducing agents ensure that multimeric proteins dissociate into their constituent polypeptide subunits and that individual polypeptides achieve complete linearization [6]. This allows for accurate molecular weight determination of protein subunits rather than intact complexes.
Table 1: Common Reducing Agents in Laemmli Buffer
| Reducing Agent | Chemical Properties | Mechanism | Stability Considerations |
|---|---|---|---|
| β-mercaptoethanol (BME) | Contains thiol (-SH) groups [5] | Labile proton in thiol group attacks disulfide bonds [5] | More stable than DTT; can be stored in buffer at 4°C for extended periods [5] |
| Dithiothreitol (DTT) | Contains thiol (-SH) groups [5] | Similar mechanism to BME via thiolate formation [5] | Less stable; requires regular replenishment in stored buffers [5] |
Component 3: Tris Buffer
Biochemical Role: Tris (tris-hydroxymethyl-aminomethane) functions as the primary pH buffer that maintains precise hydrogen ion concentration throughout the electrophoretic process, creating optimal conditions for protein separation [5] [14].
Mechanism of Action: The Laemmli buffer system employs a discontinuous pH system with critical implications for separation efficiency. The sample buffer itself is maintained at pH 6.8, which matches the pH of the stacking gel [5] [13]. This specific pH is strategically selected because it is close to the isoelectric point of glycine (pI ≈ 6.08), one of the key ions in the running buffer [5]. At this pH, glycine exists primarily as a zwitterion with minimal net charge and thus low mobility in an electric field [13].
Tris functions as a conventional buffer, resisting pH changes by sequestering excess H+ or OH- ions that may arise from chemical degradation or atmospheric CO2 absorption [5]. Additionally, Tris can inhibit numerous enzymatic activities, including proteases that might otherwise degrade protein samples during preparation [5]. The careful maintenance of pH 6.8 in the sample and stacking gel is essential for creating the stacking phenomenon that concentrates proteins into sharp bands before they enter the separating gel, a crucial step for achieving high resolution [5].
Component 4: Glycerol
Biochemical Role: Glycerol serves as a density-enhancing agent that facilitates sample loading and prevents diffusion into the running buffer [5] [6].
Mechanism of Action: With a density of 1.26 g/cm³—significantly higher than water (1.0 g/cm³)—glycerol increases the overall density of the protein sample when mixed with Laemmli buffer [5]. When this dense mixture is loaded into the sample wells of the polyacrylamide gel, it sinks to the bottom rather than diffusing into the less dense electrophoresis running buffer [5]. This physical property ensures that the entire protein sample remains concentrated within the well when the electric current is applied, maximizing the amount of protein that enters the gel matrix and improving detection sensitivity.
The high viscosity of glycerol also contributes to stabilizing the protein samples and preventing convection currents that could lead to sample mixing between adjacent wells [6]. Practical protocols often recommend measuring glycerol by mass rather than volume due to its high viscosity, which makes accurate pipetting challenging [5].
Component 5: Tracking Dye
Biochemical Role: The tracking dye, typically bromophenol blue, provides visual monitoring of electrophoretic progress and demarcates the ion front [5] [6].
Mechanism of Action: Bromophenol blue is a small, highly charged molecule that migrates rapidly through the gel matrix when an electric field is applied [5]. Its intense blue color allows researchers to visualize the sample during loading and track the progression of electrophoresis in real-time [5] [6]. The dye molecules congregate at the ion front—the boundary between leading and trailing ions—forming a visible line known as the "dye front" [5].
Since bromophenol blue migrates faster than even the smallest proteins, its continued presence on the gel indicates that proteins are still separating within the matrix [5]. The dye front provides a reference point for estimating when electrophoresis should be terminated to achieve optimal separation without losing proteins of interest from the gel [6]. Additionally, the dye's color in the sample buffer helps confirm proper pipetting into the wells and can serve as a crude pH indicator, with yellow coloration suggesting incorrect pH [13].
Table 2: Comprehensive Summary of Laemmli Buffer Components
| Component | Biochemical Role | Mechanism of Action | Critical Parameters |
|---|---|---|---|
| SDS | Denaturant and charge provider | Binds proteins (1.4g SDS:1g protein); masks intrinsic charge; linearizes proteins [5] [11] | Concentration: 1-2% in 1X buffer; purity essential [5] [14] |
| Reducing Agent | Disulfide bond cleavage | Thiol groups reduce S-S bonds to -SH groups; fully linearizes proteins [5] [6] | BME: 5% or DTT: 100mM in 1X buffer; freshness critical [5] [14] |
| Tris Buffer | pH control and enzyme inhibition | Maintains pH 6.8 for stacking; buffers against pH changes [5] [14] | Concentration: 62.5mM in 1X buffer; precise pH essential [5] [14] |
| Glycerol | Density agent | Increases sample density (1.26 g/cm³) for loading [5] | Concentration: 10% in 1X buffer; improves loading precision [5] [14] |
| Bromophenol Blue | Visual tracking | Migrates with leading ion front; visual progress indicator [5] [6] | Concentration: 0.001-0.002% in 1X buffer [14] |
Integrated Biochemical Mechanism in Discontinuous Electrophoresis
The five components of Laemmli buffer function within a sophisticated discontinuous electrophoresis system that separates proteins through a two-phase process: stacking and separation [13]. The system employs three different pH environments: the sample and stacking gel at pH 6.8, the separating gel at pH 8.8, and the running buffer at pH 8.3 [13].
During the stacking phase, the critical interaction occurs between the leading chloride ions (from Tris-HCl in the gel buffers) and the trailing glycine ions (from the running buffer) [13]. At pH 6.8 in the stacking gel, glycine exists primarily as a zwitterion with minimal net charge and thus low electrophoretic mobility [5] [13]. The highly mobile chloride ions race ahead, creating a zone of high voltage gradient that sweeps the protein-SDS complexes into an extremely sharp band between the chloride and glycine fronts [13]. This stacking effect concentrates proteins from relatively large sample volumes into microscopic thin discs, dramatically enhancing resolution before proteins enter the separating gel [13].
When the protein stack reaches the separating gel at pH 8.8, the environmental change triggers the second phase [13]. The increased pH causes glycine to lose protons and become negatively charged, increasing its mobility [13]. Meanwhile, the smaller pore size of the separating gel retards protein movement according to molecular size [13]. The glycine ions now overtake the proteins, eliminating the steep voltage gradient and allowing size-based separation to occur in a uniform electric field [13]. Throughout this process, the SDS-protein complexes maintain identical charge-to-mass ratios, ensuring migration velocity depends solely on molecular size [12] [13].
Experimental Protocols and Methodologies
Standard Laemmli Buffer Preparation
The following protocol details the preparation of standard 2X and 4X Laemmli buffer solutions for routine protein separation:
Table 3: Laemmli Buffer Formulations [14]
| Component | Molecular Weight | 1X Concentration | 2X Concentration | Amount for 50 mL 2X | Amount for 50 mL 4X |
|---|---|---|---|---|---|
| Tris base | 121.14 g/mol | 0.0625 M | 0.125 M | 0.747 g | 1.514 g |
| SDS | 288.37 g/mol | 2% (w/v) | 4% (w/v) | 2 g | 4 g |
| Glycerol | 92.09 g/mol | 10% (v/v) | 20% (v/v) | 10 mL | 20 mL |
| β-mercaptoethanol | 78.13 g/mol | 5% (v/v) | 10% (v/v) | 5 mL | 10 mL |
| Bromophenol blue | 691.94 g/mol | 0.002% (w/v) | 0.004% (w/v) | 100 mg | 200 mg |
Preparation Procedure:
- Dissolve the specified amount of Tris base in approximately 10 mL deionized water using a magnetic stirrer [14].
- Adjust the pH to 6.8 precisely using concentrated HCl, taking care not to overshoot the target pH [14].
- Add the measured volume of glycerol and mix thoroughly [14].
- Add the specified amounts of SDS and bromophenol blue, stirring until completely dissolved [14].
- For reducing buffer: Add β-mercaptoethanol and adjust to final volume with deionized water [14].
- For non-reducing buffer: Omit β-mercaptoethanol and adjust to final volume [14].
- Aliquot and store at -20°C for reducing buffer or 4°C for non-reducing buffer [14].
Critical Notes:
- β-mercaptoethanol is toxic and irritant; handle in a fume hood with appropriate personal protective equipment [14].
- SDS and bromophenol blue require sufficient stirring time for complete dissolution [14].
- For maximum reducing activity, β-mercaptoethanol can be added fresh immediately before use rather than during buffer preparation [14].
Sample Preparation and Electrophoresis Protocol
- Sample Dilution: Mix protein sample with an equal volume of 2X Laemmli buffer (or appropriate ratio for other concentrations) [6] [11].
- Denaturation: Heat the mixture at 95-100°C for 5 minutes to ensure complete protein denaturation and reduction [6] [11].
- Cooling and Centrifugation: Briefly cool samples on ice and centrifuge at 12,000 × g for 1 minute to collect condensation and particulates [11].
- Gel Loading: Load 10-50 μL per well depending on protein concentration and detection method [11].
- Electrophoresis: Run at constant voltage: 80V through stacking gel, then 120V through separating gel until dye front reaches bottom [11].
- Detection: Proceed with Coomassie blue, silver staining, or western blot transfer as required [11].
The Scientist's Toolkit: Essential Research Reagents
Table 4: Research Reagent Solutions for Laemmli SDS-PAGE
| Reagent/Category | Specific Examples | Function/Purpose | Technical Notes |
|---|---|---|---|
| Reducing Agents | β-mercaptoethanol (BME), Dithiothreitol (DTT), Tris(2-carboxyethyl)phosphine (TCEP) | Cleave disulfide bonds; complete protein denaturation | DTT more potent but less stable; TCEP more stable at neutral pH [5] [6] |
| Detergents | Sodium dodecyl sulfate (SDS) | Protein denaturation; uniform charge impartation | Critical purity; can precipitate with KCl [5] [13] |
| Buffering Systems | Tris-HCl, Tris-glycine | pH control; discontinuous electrophoretic separation | Precise pH essential; multiple pH values required [5] [13] |
| Tracking Dyes | Bromophenol blue, Pyronin Y | Visual monitoring of electrophoretic progress | Small size migrates ahead of proteins; indicates ion front [5] [6] |
| Density Agents | Glycerol, Sucrose, Ficoll | Increase sample density for well loading | Glycerol most common; measure by mass for accuracy [5] [6] |
| Commercial Formulations | 4X/6X reducing and non-reducing buffers (e.g., BP-110R, BP-111NR) | Standardized, ready-to-use solutions | Ensure freshness of reducing agents; check pH before use [6] |
Technical Considerations and Troubleshooting
Several technical considerations are essential for optimal results with Laemmli buffer systems. Protein loading capacity typically ranges from 0.1 μg for single-band Coomassie detection to 40 μg for complex protein mixtures, with excess leading to poor resolution [13]. Sample composition must be considered, as high salt concentrations (particularly KCl) can cause SDS precipitation and aberrant migration [13]. The choice between reducing versus non-reducing conditions depends on experimental goals: reducing conditions provide complete denaturation for accurate molecular weight estimation, while non-reducing conditions preserve disulfide-dependent tertiary and quaternary structures [6].
Common issues include protein smearing (from incomplete denaturation, protease activity, or excessive loading), vertical streaking (from air bubbles or particulates), and aberrant migration (from improper buffer pH or degraded SDS) [6] [11]. These can be addressed by ensuring fresh reducing agents, proper heating, using protease inhibitors, degassing solutions, and preparing reagents correctly [6] [11].
The five critical components of Laemmli buffer—SDS, reducing agents, Tris buffer, glycerol, and tracking dye—function in precise biochemical concert to enable high-resolution protein separation. Their integrated action within the discontinuous electrophoresis system creates the conditions for proteins to be denatured, charged uniformly, concentrated into sharp bands, and separated according to molecular size with exceptional resolution. The enduring legacy of Laemmli's methodology, developed over five decades ago to solve the challenge of analyzing T4 phage structural proteins, continues to underpin countless advances in molecular biology, biochemistry, and drug development. Its robust principles and adaptable protocols ensure it remains an indispensable tool in the researcher's arsenal, facilitating everything from basic protein characterization to complex proteomic analyses in both academic and industrial settings.
The Principle of Protein Denaturation and Charge Uniformity
Core Mechanism of SDS Action
The principle of protein denaturation and charge uniformity is the foundational event that enables sodium dodecyl sulfate-polyacrylamide gel electrophoresis (SDS-PAGE) to separate proteins precisely by molecular weight. This process, central to the Laemmli method, involves the complete dismantling of a protein's native structure and endowing it with a uniform charge-to-mass ratio, effectively transforming a complex mixture of diverse protein shapes and charges into a population of linear polypeptides whose migration in an electric field depends solely on size [15] [16] [17].
The key agent in this transformation is sodium dodecyl sulfate (SDS), an anionic detergent. SDS denatures proteins by binding to the polypeptide backbone and disrupting the various non-covalent interactions that maintain secondary and tertiary structures. Specifically, SDS micelles interact with proteins to form a core-shell structure, which disrupts hydrogen bonds, hydrophobic interactions, and ionic bonds, leading to the unfolding of the protein into a linear form [16] [17]. Concurrently, most protocols include a reducing agent, such as β-mercaptoethanol or dithiothreitol (DTT), which breaks disulfide bonds, thereby dismantling the protein's quaternary structure and ensuring complete dissociation into individual subunits [16] [6].
Crucially, SDS binds to proteins at a nearly constant ratio of approximately 1.4 grams of SDS per gram of protein [16]. This extensive coating masks the protein's intrinsic positive and negative charges and imparts a large, uniform negative charge from the sulfate groups of the detergent. Since the amount of charge is directly proportional to the length of the polypeptide chain (i.e., its molecular weight), the charge-to-mass ratio becomes constant across all proteins in the sample [15] [16] [17]. This uniformity ensures that when an electric field is applied, all proteins will migrate towards the positive anode (anode) at a rate determined only by their ability to navigate the pores of the polyacrylamide gel, which acts as a molecular sieve [18] [15].
The Laemmli Method Context
The Laemmli method, a discontinuous gel electrophoresis system, is engineered to leverage the principles of denaturation and charge uniformity for high-resolution separation. Developed by Ulrich Laemmli in 1970, this system incorporates a two-layer gel with different pH levels and pore sizes to first concentrate proteins into sharp bands before separating them by size [9] [17].
The process begins when SDS-treated protein samples are loaded onto a stacking gel. This gel has a lower acrylamide concentration (typically 4-5%) and a pH of approximately 6.8. The glycinate ions in the running buffer have a lower mobility in the stacking gel, creating a zone where proteins are "stacked" into very thin, well-defined bands before they enter the separating gel. This step is critical for achieving sharp, resolvable bands [16] [17].
Once the stacked proteins reach the separating gel (or resolving gel), the conditions change significantly. This gel has a higher acrylamide concentration (e.g., 12.5%) and a higher pH (around 8.8). The increased pH alters the charge state of glycinate ions, allowing them to overtake the proteins. The higher acrylamide concentration creates a tighter mesh with smaller pores. As the uniformly charged proteins enter this matrix, their migration is impeded based on their size. Smaller proteins navigate the pores more easily and migrate faster, while larger proteins are more hindered and migrate more slowly [18] [16] [17]. This differential migration results in the separation of proteins based almost exclusively on their molecular weight.
Table 1: Key Components of the Laemmli Sample Buffer and Their Functions
| Component | Function | Rationale |
|---|---|---|
| SDS (Sodium Dodecyl Sulfate) | Denatures proteins and provides uniform negative charge | Masks intrinsic charge; ensures migration is based on size [16] [6] [17] |
| Reducing Agent (e.g., DTT, β-mercaptoethanol) | Breaks disulfide bonds | Disassembles quaternary structure; ensures complete denaturation [16] [6] |
| Glycerol | Increases sample density | Allows sample to sink to the bottom of the loading well [16] [6] |
| Tris-HCl Buffer | Controls pH | Critical for maintaining proper charge on proteins and ions during electrophoresis [6] |
| Bromophenol Blue | Tracking dye | Visualizes migration progress during the run [16] [6] |
Experimental Protocols for Validation
Standard Protocol for Protein Denaturation and SDS-PAGE
The following detailed methodology, based on the Laemmli method, is used to achieve protein denaturation and charge uniformity for SDS-PAGE analysis [19] [16] [17].
Required Materials and Reagents:
- Vertical electrophoresis unit with glass plates, spacers, and a comb
- Power supply
- Laemmli sample buffer (e.g., 4X or 6X concentration, reducing or non-reducing)
- Reducing agent (e.g., β-mercaptoethanol or DTT) if not pre-mixed
- Polyacrylamide gel components (acrylamide, bis-acrylamide, Tris-HCl, SDS, ammonium persulfate, TEMED)
- Running buffer (e.g., Tris-Glycine buffer with SDS)
- Heat block or water bath
- Centrifuge
Procedure:
- Sample Preparation:
- Mix the protein sample with an appropriate volume of Laemmli sample buffer to achieve a 1X working concentration. A common ratio is 3 volumes of sample to 1 volume of 4X buffer [6].
- If using a separate reducing agent, add it at this stage (e.g., 5% v/v β-mercaptoethanol).
- Vortex the mixture thoroughly and then heat at 95-100°C for 5 minutes to ensure complete denaturation [19] [6].
- Centrifuge the sample briefly (e.g., 5 minutes at 16,000 x g) to pellet any insoluble debris.
Gel Preparation:
- Assemble the gel casting apparatus.
- Prepare the separating gel solution with the desired acrylamide percentage (e.g., 12% for separating 15-100 kDa proteins). Add the catalyst (ammonium persulfate) and TEMED last to initiate polymerization. Pour the gel and overlay with water or isopropanol to create a flat surface. Allow it to polymerize for 20-30 minutes [19].
- Prepare the stacking gel (typically 4-5% acrylamide). After the separating gel has set, pour off the overlay, add the stacking gel solution, and immediately insert the comb. Allow it to polymerize for another 20-30 minutes [19].
Electrophoresis:
- Assemble the gel in the electrophoresis tank and fill the chambers with running buffer.
- Load the prepared protein samples and a molecular weight standard (protein ladder) into the wells.
- Connect the power supply and run the gel at a constant voltage (e.g., 100-150 V) until the tracking dye front reaches the bottom of the gel [17].
Protocol for Investigating Alkali-Induced Denaturation
This protocol, adapted from a study on rice glutelin, demonstrates how denaturation and structural changes can be induced and analyzed using SDS-PAGE in a research context [20].
Methodology:
- Alkali Treatment: Disperse the protein of interest (e.g., rice glutelin) in NaOH solutions of varying concentrations (e.g., 0.08-0.5 mol/L) to create a 5% (w/v) dispersion.
- Incubation: Stir the dispersion at room temperature for 30 minutes, followed by incubation in a 70°C water bath for 60 minutes to induce denaturation and deamidation.
- Sample Neutralization and Preparation: After treatment, rapidly cool the samples. Neutralize the pH using 0.5 mol/L HCl, then dialyze to remove salts. Freeze-dry the resulting protein.
- SDS-PAGE Analysis: Redissolve the treated protein samples in a standard SDS-PAGE sample buffer and analyze using the standard protocol above. The gel can reveal subunit degradation and the formation of high-molecular-weight aggregates due to alkaline treatment [20].
Table 2: Quantitative Data from Alkali-Induced Denaturation of Rice Glutelin
| NaOH Concentration (mol/L) | Observed Structural and Functional Changes |
|---|---|
| ≥ 0.08 | Complete protein denaturation; clear subunit degradation and formation of large molecular aggregates [20]. |
| ≥ 0.10 | Onset of significant deamidation; increase in glutamic acid content; correlation between solubility, surface hydrophobicity, and deamidation degree [20]. |
| 0.5 (for 120 min) | Optimal improvement in emulsifying and foaming properties; excessive treatment destroys these functional capacities [20]. |
Research Reagent Solutions
The following table details essential materials and reagents required for experiments involving protein denaturation and SDS-PAGE.
Table 3: Essential Research Reagents for Protein Denaturation and Electrophoresis
| Reagent / Material | Function and Importance in Research |
|---|---|
| SDS (Sodium Dodecyl Sulfate) | The primary denaturant responsible for unfolding proteins and conferring a uniform negative charge; critical for molecular weight-based separation [16] [17]. |
| Laemmli Sample Buffer | A ready-to-use formulation containing SDS, buffer, tracking dye, and often a reducing agent; standardizes sample preparation for reproducible SDS-PAGE [6]. |
| Reducing Agents (DTT, β-mercaptoethanol) | Breaks covalent disulfide bonds to fully dissociate protein complexes into individual subunits; essential for accurate molecular weight determination of polypeptides [16] [6]. |
| Acrylamide / Bis-Acrylamide | Monomers that copolymerize to form the porous polyacrylamide gel matrix, which acts as a molecular sieve during electrophoresis [19] [16]. |
| TEMED & Ammonium Persulfate | Catalysts that initiate and accelerate the free-radical polymerization of acrylamide to form a stable gel [19]. |
| Tris-Glycine-SDS Running Buffer | Provides the ions necessary to carry current and maintain the pH required for proper protein migration in the discontinuous Laemmli system [16]. |
| Molecular Weight Standards | A mixture of pre-stained or unstained proteins of known molecular weights; run alongside samples to calibrate the gel and estimate the size of unknown proteins [15] [16]. |
| Urea-containing Lysis Buffer | A powerful denaturant (e.g., at 7-9 M concentration) used for difficult-to-solubilize proteins, particularly in sample preparation for isoelectric focusing in 2D-PAGE; prevents protein carbamylation by avoiding the need for heat [21]. |
Denaturation and Electrophoresis Workflow
The following diagram illustrates the logical sequence of events from native protein to separated bands in SDS-PAGE, highlighting the critical role of denaturation and charge uniformity.
The discontinuous gel electrophoresis system, central to the Laemmli method of SDS-PAGE, represents a pivotal innovation in protein separation technology. By employing a discontinuous buffer system with stacking and resolving gel phases, this technique achieves unprecedented resolution of complex protein mixtures. Developed by Ulrich K. Laemmli in 1970, the method exploits differences in pH and gel porosity to concentrate protein samples into sharp bands before separation by molecular weight. This technical guide examines the underlying electrochemistry, provides detailed methodologies, and explores the system's applications in modern biological research and drug development, framing this discussion within the context of ongoing research into the Laemmli method for discontinuous gel electrophoresis.
Discontinuous electrophoresis, also referred to as disc-electrophoresis, employs buffers of different pH and composition to create a moving boundary that concentrates protein samples into extremely narrow bands before they enter the separating gel matrix. This stacking phenomenon addresses a fundamental limitation of continuous buffer systems where proteins migrate as diffuse zones, resulting in poor resolution. The Laemmli method specifically combines this discontinuous buffer approach with sodium dodecyl sulfate (SDS) denaturation, which masks proteins' intrinsic charges and confers a uniform charge-to-mass ratio [22] [13]. The resulting separation depends almost exclusively on molecular size rather than charge or shape.
The historical development of this technique is intimately connected to investigations of virus assembly in phage-infected cells. Laemmli, working at the MRC Laboratory of Molecular Biology in Cambridge, sought to resolve the numerous structural proteins of phage T4 capsids [1] [2]. Previous SDS-polyacrylamide gel systems, such as those used by Maizel for poliovirus proteins, produced broad bands adequate for simple viruses with few components but insufficient for complex systems like T4 with dozens of proteins [1]. Laemmli's breakthrough was recognizing that the stacking phenomena of Ornstein and Davis could be adapted to work with SDS-polypeptide complexes, theoretically enabling high resolution under denaturing conditions [1].
Theoretical Foundations of Discontinuous Systems
Fundamental Principles
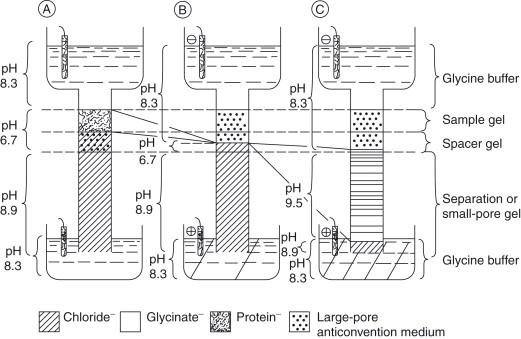
The discontinuous system operates through the strategic manipulation of ion mobility and pH transitions to create a stacking effect. Three critical components establish the necessary conditions: (1) a stacking gel with a relatively low percentage of polyacrylamide (typically 4-5%) buffered at pH 6.8, (2) a separating gel with higher polyacrylamide concentration (typically 10-12%) buffered at pH 8.8, and (3) an electrode buffer containing glycine at pH 8.3-8.8 [22] [13]. The key innovation lies in exploiting the pH-dependent charge states of glycine molecules to create a moving boundary that concentrates proteins.
When voltage is applied, the system establishes electrical discontinuities at the interfaces between different buffer regions. Highly mobile chloride ions from the Tris-HCl buffer in the stacking gel form the leading ions, while glycine from the electrode buffer initially exists primarily as zwitterions with minimal net charge, functioning as trailing ions [13]. Proteins, with their SDS-derived negative charges, exhibit intermediate mobility between these ions. This configuration creates a steep voltage gradient that compresses the protein samples into extremely thin discs (approximately 20-50 μm thick) at the boundary between leading and trailing ions [1].
The Stacking Process Mechanics
The stacking mechanism operates through these precise electrochemical events:
- In the stacking gel (pH 6.8): Glycine molecules remain predominantly in their zwitterionic form (NH₃⁺-CH₂-COO⁻) with a net charge near zero, resulting in low electrophoretic mobility [13].
- Leading ions: Chloride ions from Tris-HCl buffer are fully ionized and maintain high mobility throughout the system.
- Protein-SDS complexes: Carry negative charges proportional to their mass and migrate with intermediate mobility.
- Voltage gradient formation: The low concentration of glycinate ions creates a zone of high electrical resistance at the top of the stacking gel, concentrating the applied voltage across a narrow region [13].
- Protein compression: All protein-SDS complexes migrate within this high-field-strength zone, forming sharp discs that cannot overtake the chloride front nor be overtaken by the slow glycine zwitterions.
Transition to Separation
As the moving boundary reaches the interface between stacking and separating gels, critical changes occur:
- The increased pH (8.8) of the separating gel promotes deprotonation of glycine amino groups, converting zwitterions to glycinate ions (NH₂-CH₂-COO⁻) with increased negative charge and mobility [13].
- Glycinate ions now overtake the protein-SDS complexes, eliminating the stacking effect.
- Proteins enter the higher-density polyacrylamide matrix where molecular sieving becomes the dominant separation mechanism.
- With uniform charge-to-mass ratios imparted by SDS, proteins separate strictly according to molecular size as they migrate through the gel pores [22].
The following diagram illustrates this electrophoretic process:
Comparative Analysis of Gel Composition and Buffer Systems
The effectiveness of discontinuous electrophoresis relies on precise formulation of gel compositions and buffer systems. The following tables summarize the critical components and their functions:
Table 1: Composition of Stacking and Resolving Gels in Discontinuous SDS-PAGE
| Component | Stacking Gel | Resolving Gel | Function |
|---|---|---|---|
| Acrylamide | 4-5% | 10-12% (variable) | Forms porous matrix for molecular sieving [22] |
| pH | 6.8 (Tris-HCl) | 8.8 (Tris-HCl) | Creates pH discontinuity for stacking effect [13] |
| Buffer | Tris-HCl | Tris-HCl | Maintains pH environment for electrophoresis |
| SDS | 0.1% | 0.1% | Maintains protein denaturation and charge uniformity |
Table 2: Electrode Buffer and Sample Preparation Components
| Component | Concentration | Function |
|---|---|---|
| Tris-Glycine Buffer | 25mM Tris, 192mM glycine, pH 8.3 | Electrode buffer providing trailing ion (glycine) [22] |
| SDS in Electrode Buffer | 0.1% | Maintains protein denaturation during electrophoresis |
| Tris-HCl in Sample Buffer | 62.5mM, pH 6.8 | Maintains sample at stacking gel pH [14] |
| SDS in Sample Buffer | 2% | Denatures proteins and provides uniform charge [22] [14] |
| Glycerol in Sample Buffer | 10% | Adds density to sink samples into wells [13] [14] |
| β-mercaptoethanol | 5% | Reduces disulfide bonds [22] [14] |
| Bromophenol blue | 0.001-0.0025% | Tracking dye visualizes migration front [13] [14] |
Materials and Reagent Solutions
The successful implementation of discontinuous gel electrophoresis requires specific research reagents with precise formulations:
Table 3: Essential Research Reagent Solutions for Discontinuous SDS-PAGE
| Reagent/Solution | Composition | Function in Experimental Process |
|---|---|---|
| Laemmli Sample Buffer | 62.5mM Tris-HCl (pH 6.8), 2% SDS, 10% glycerol, 5% β-mercaptoethanol, 0.002% bromophenol blue [14] | Denatures proteins, adds tracking dye, provides density for loading [22] |
| Stacking Gel Solution | 0.125M Tris-HCl (pH 6.8), 4-5% acrylamide/bis-acrylamide, 0.1% SDS, 0.1% APS, 0.1% TEMED [22] | Forms large-pore gel for protein stacking |
| Resolving Gel Solution | 0.375M Tris-HCl (pH 8.8), 10-12% acrylamide/bis-acrylamide, 0.1% SDS, 0.1% APS, 0.1% TEMED [22] | Forms separating gel with molecular sieving properties |
| Running Buffer | 25mM Tris, 192mM glycine, 0.1% SDS, pH 8.3 [22] | Provides conducting medium and buffer ions for electrophoresis |
| Acrylamide/Bis Solution | 29:1 or 37.5:1 acrylamide:bis-acrylamide ratio | Forms cross-linked polyacrylamide matrix when polymerized |
Detailed Experimental Protocol
Gel Preparation
The preparation of discontinuous gels requires meticulous attention to formulation and polymerization conditions:
Resolving Gel Assembly: Clean glass plates are assembled with spacers (typically 0.75-1.5mm thickness) in a casting stand [22]. The resolving gel solution is prepared by mixing appropriate volumes of:
- 30% acrylamide/bis-acrylamide stock solution
- 1.5M Tris-HCl (pH 8.8)
- 10% SDS solution
- Deionized water
Polymerization Initiation: Add ammonium persulfate (APS) and TEMED (N,N,N',N'-Tetramethylethylenediamine) to initiate free radical polymerization [22]. APS concentration typically ranges from 0.05-0.1%, while TEMED is used at 0.05-0.1%. The solution is immediately poured between the glass plates, leaving space for the stacking gel.
Surface Deaeration: Carefully overlay the gel solution with a thin layer of water-saturated butanol or isopropanol to exclude oxygen, which inhibits polymerization, and to create a flat meniscus [22]. Polymerization typically completes within 30 minutes at room temperature.
Stacking Gel Application: After polymerization, discard the alcohol overlay and rinse the gel surface with deionized water. Remove residual liquid with filter paper. Prepare stacking gel solution containing:
- 4-5% acrylamide/bis-acrylamide
- 0.125M Tris-HCl (pH 6.8)
- 0.1% SDS
Comb Insertion: Add APS and TEMED to initiate polymerization, pour the stacking gel solution over the resolving gel, and immediately insert a sample comb without introducing bubbles [22]. After complete polymerization (approximately 30 minutes), carefully remove the comb to reveal sample wells.
Sample Preparation
Proper sample preparation is critical for successful separation:
Protein Denaturation: Mix protein samples with Laemmli sample buffer at the recommended dilution (typically 1:1 for 2X buffer) [14]. The final concentration of SDS in the mixture should be at least 1% to ensure complete denaturation and charge masking [22].
Heat Denaturation: Heat samples at 95-100°C for 5 minutes or 70°C for 10-15 minutes to disrupt secondary and tertiary structures [22]. Heating is essential for complete unfolding and SDS binding.
Reduction of Disulfide Bonds: Include reducing agents such as β-mercaptoethanol (5%) or dithiothreitol (DTT, 10-100mM) in the sample buffer to break disulfide linkages [22]. For non-reducing conditions, omit these agents.
Centrifugation: Briefly centrifuge heated samples (10-15 seconds at 10,000×g) to collect condensation and ensure uniform sample distribution.
Electrophoresis Conditions
Optimal separation requires controlled electrophoretic conditions:
Apparatus Assembly: Place the polymerized gel into the electrophoresis chamber and fill both upper and lower reservoirs with running buffer [22]. Ensure no air bubbles are trapped at the bottom of the gel.
Sample Loading: Load prepared samples into wells using micropipettes. Include molecular weight markers in at least one lane for size estimation [22]. Typical protein loads range from 0.1μg (minimum for Coomassie detection) to 40μg (maximum for complex mixtures) per lane [13].
Electrophoresis Parameters: Apply constant voltage of 100-150V for mini-gel systems (approximately 8×10cm) [22]. The bromophenol blue tracking dye should form a sharp front that migrates through the entire gel length.
Process Completion: Terminate electrophoresis when the tracking dye front reaches approximately 0.5-1cm from the bottom of the gel. Typical run times range from 45-90 minutes depending on gel concentration and voltage.
Technical Considerations and Optimization Strategies
Gel Composition Variations
The standard Laemmli method can be modified to address specific separation needs:
Gradient Gels: Polyacrylamide gradients (e.g., 4-12% or 5-20%) provide expanded separation ranges for complex protein mixtures [22]. These are prepared using gradient makers that mix high and low acrylamide solutions during gel casting.
Alternative Buffer Systems: For improved resolution of small proteins and peptides (0.5-50kDa), the Tris-tricine buffer system developed by Schägger and von Jagow replaces glycine with tricine as the trailing ion [22] [18].
Continuous Systems: Simplified systems using identical buffers in gels and electrode chambers omit the stacking gel but sacrifice resolution for convenience in certain applications [18].
Troubleshooting Common Issues
Several technical challenges may arise during discontinuous electrophoresis:
Poor Stacking: Inadequate stacking often results from incorrect pH in stacking gel or sample buffer, insufficient chloride ions, or improper glycine concentration in running buffer [13].
Band Distortion: Smiling or frowning band patterns typically indicate uneven heat distribution during electrophoresis, often remedied by reduced voltage or active cooling.
Anomalous Migration: Certain proteins (e.g., tubulin, glycoproteins) may exhibit abnormal mobility due to atypical SDS binding or post-translational modifications [13]. Apparent molecular weights from SDS-PAGE should be interpreted with caution, with typical errors of ±10% [22].
Applications in Research and Drug Development
The discontinuous electrophoresis system has become foundational to modern biological research:
- Protein Purity Assessment: Verification of recombinant protein homogeneity during biopharmaceutical development [18].
- Molecular Weight Determination: Estimation of protein sizes using calibrated molecular weight markers [22].
- Immunoblotting (Western Blot): Initial separation step for protein detection using specific antibodies [22].
- Diagnostic Applications: Detection of disease-specific protein markers in clinical samples [23].
- Food Authenticity Testing: Protein profiling for authentication of agricultural products like saffron [23].
The discontinuous stacking and resolving gel system developed by Laemmli represents an elegant solution to the fundamental challenge of protein separation. By exploiting electrochemical principles to concentrate samples before separation, the method achieves resolution unattainable with continuous buffer systems. Four decades after its development, the Laemmli method remains the gold standard for protein separation worldwide, with applications spanning basic research, diagnostic medicine, and pharmaceutical development. Its enduring utility testifies to the robust theoretical foundation and practical effectiveness of discontinuous electrophoresis technology. Future innovations in electrophoretic separations will undoubtedly build upon these fundamental principles while adapting to emerging needs in proteomics and biotechnology.
Within the framework of Laemmli method for discontinuous gel electrophoresis, the specific pH of the Tris buffer in the sample and stacking gels is not an arbitrary choice but the foundational pillar enabling high-resolution protein separation. This technical guide delves into the electrochemistry of discontinuous buffer systems, explaining how a precisely maintained pH of 6.8 orchestrates the stacking of proteins into sharp zones prior to separation. Directed at researchers and drug development professionals, this whitepaper synthesizes historical context, underlying principles, and quantitative data to illustrate why deviation from this critical pH can compromise the entire electrophoretic process, affecting the accuracy and reproducibility of protein analysis in both academic and industrial settings.
The Laemmli method for sodium dodecyl sulfate-polyacrylamide gel electrophoresis (SDS-PAGE), developed by Ulrich K. Laemmli in 1970, revolutionized the field of molecular biology by providing a high-resolution means to separate complex protein mixtures based on molecular weight [1] [9]. The method's power lies in its discontinuous buffer system, which employs buffers of different pH and composition to concentrate protein samples into extremely sharp bands before they enter the separating gel. This initial concentration step is paramount for achieving high resolution, and it is entirely governed by the precise pH of the Tris buffers used.
The sample and stacking gels are buffered with Tris to a pH of 6.8, a value critically chosen for its proximity to the isoelectric point (pI) of glycine [5]. This pH is not optimal for Tris's own buffering capacity, which is strongest between pH 7 and 9, but is selected specifically to control the electrophoretic mobility of glycine ions in the running buffer [14]. Understanding the chemistry of this specific Tris buffering is essential for troubleshooting and optimizing SDS-PAGE protocols, a technique that remains a cornerstone in laboratories worldwide, from basic research to the quality control of biotherapeutics [4].
The Electrochemical Principle of Discontinuous Gel Electrophoresis
The Laemmli system is termed "discontinuous" because it uses differing buffer ions and pH in the stacking versus the resolving gel. This setup creates an ion mobility gradient that focuses the protein samples. The system hinges on three key ions: the fast-moving chloride (Cl⁻) ions from the gel buffer, the slow-moving glycine (Gly⁻) ions from the running buffer, and the Tris⁺ (Tris(hydroxymethyl)aminomethane) ions that serve as the common cation throughout the system [24].
At the initiating stage of electrophoresis, the glycine ions entering the stacking gel (pH 6.8) exist in an equilibrium between their neutral (NH₂CH₂COOH) and anionic (NH₂CH₂COO⁻) forms. This is because the pH 6.8 is very close to glycine's pI of approximately 6.0, resulting in only a partial negative charge. Consequently, glycine's electrophoretic mobility is low. In contrast, the chloride ions are fully dissociated and possess a high electrophoretic mobility, while the SDS-coated proteins, bearing a uniform negative charge, have an intermediate mobility [5].
This disparity in mobility creates a steep voltage gradient at the interface between the leading chloride ions and the trailing glycine ions. The protein-SDS complexes, with their intermediate mobility, are compressed into a very narrow zone within this moving boundary, a process known as stacking. The following diagram illustrates this ion dynamics and the resulting stacking effect.
Once this stacked protein zone reaches the separating gel, the environment changes dramatically. The separating gel has a higher pH (typically 8.8). At this alkaline pH, glycine ions become fully deprotonated, gaining a strong negative charge and thus a high electrophoretic mobility. The glycine ions now overtake the stacked proteins, which are then released into the homogeneous pH of the separating gel where separation by molecular size occurs through the polyacrylamide matrix [5] [24]. The entire process, from sharp stacking to clean separation, is therefore initiated and controlled by the carefully set pH of 6.8 in the stacking gel.
The Critical Rationale for pH 6.8
Optimization of Glycine Charge and Mobility
The primary reason for selecting pH 6.8 is to manipulate the charge state of glycine. Glycine has two pKa values (pK₁ = 2.34, pK₂ = 9.6) and an isoelectric point (pI) of about 6.0. At the stacking gel pH of 6.8, the glycine molecules exist predominantly as zwitterions, with a net charge very close to zero. This state dramatically reduces their electrophoretic mobility, allowing them to function as the effective trailing ion in the discontinuous system [5]. If the pH were significantly higher, glycine would be more charged and mobile, failing to create the necessary trailing boundary. If the pH were lower, the system's efficiency could be compromised, and the risk of protein hydrolysis increases.
Protein Integrity and System Stability
While the pH of 6.8 is slightly below the optimal buffering range of Tris (pKa ~8.1), it is a deliberate compromise that serves multiple functions. A near-neutral pH is crucial for preserving peptide bonds and sample integrity. Excessively low pH can lead to acid hydrolysis of peptide bonds, while very high pH could disrupt the activity of thiol-based reducing agents like beta-mercaptoethanol or dithiothreitol (DTT) added to the sample buffer [14]. Furthermore, Tris at this pH helps inhibit a number of enzymes, including proteases, thereby protecting protein analytes from degradation during sample preparation [5].
Compatibility with the Discontinuous System
The pH 6.8 is perfectly suited to create the stacking effect at the interface between the sample or stacking gel and the separating gel. It matches the requirements of the Ornstein-Davis discontinuous system that Laemmli adapted for SDS-PAGE, ensuring that the voltage gradient is sharp and the protein zones are compressed efficiently before entering the resolving phase [1]. This precise pH control is what allows the Laemmli method to resolve proteins with such high clarity compared to earlier continuous buffer systems.
Quantitative Composition of Laemmli Sample Buffer
The Laemmli sample buffer is a precise mixture of components, each with a specific function, and is typically prepared as a concentrated stock (e.g., 2X or 4X) for convenience. The table below summarizes the standard composition and the role of each reagent.
Table 1: Standard Composition and Function of Laemmli Sample Buffer (1X)
| Reagent | Molecular Weight | Final Concentration (1X) | Primary Function |
|---|---|---|---|
| Tris base | 121.14 g/mol | 62.5 mM | Buffering agent; maintains system at critical pH 6.8 [5] [14] [25]. |
| SDS (Sodium Dodecyl Sulfate) | 288.37 g/mol | 2% (w/v) | Denatures proteins and imparts uniform negative charge [5]. |
| Glycerol | 92.09 g/mol | 10% (v/v) | Increases density for easy gel loading; adds visual weight to sample [5] [14]. |
| Bromophenol Blue | 691.94 g/mol | 0.008-0.02% (w/v) | Tracking dye; visualizes sample migration during run [5] [25]. |
| Reducing Agent(e.g., β-mercaptoethanol or DTT) | 78.13 / 154.25 g/mol | 5% / 100 mM | Breaks disulfide bonds for complete polypeptide separation [5] [24] [25]. |
Detailed Experimental Protocol for Buffer Preparation and Use
Adhering to a standardized protocol is critical for achieving reproducible results in SDS-PAGE. The following methodology details the preparation of Laemmli buffer and its use in sample preparation.
Preparation of 50 mL of 2X Laemmli Sample Buffer
Table 2: Formulation for 50 mL of 2X Laemmli Buffer
| Reagent | Amount to Add for 50 mL of 2X Buffer |
|---|---|
| Tris base | 0.747 g |
| SDS | 2.0 g |
| Glycerol | 10 mL |
| Bromophenol Blue | ~100 mg |
| Deionized Water | To ~45 mL (before final adjustment) |
Procedure:
- Dissolve Tris: In a beaker, dissolve the precise amount of Tris base (0.747 g) in approximately 10 mL of deionized water. Use a magnetic stirrer to facilitate dissolution.
- Adjust pH: Carefully adjust the pH of the Tris solution to 6.8 using concentrated HCl. This step is critical and should be performed in a fume hood. Avoid overshooting the target pH.
- Add Glycerol and SDS: Add 10 mL of glycerol to the Tris solution and mix well. Then, add 2.0 g of SDS and ~100 mg of Bromophenol Blue. Stir the solution until all components are completely dissolved.
- Final Volume and Aliquoting: Bring the total volume to 50 mL with deionized water. This creates a 2X buffer stock without the reducing agent.
- Storage: For stable, long-term storage, aliquot the buffer without the reducing agent and store at 4°C or -20°C. The reducing agent (e.g., β-mercaptoethanol or DTT) should be added to the aliquot just before use to a final concentration of 5% or 100 mM, respectively, as they are less stable [14].
Sample Preparation Protocol for Cell Lines
- Wash Cells: Wash adherent or suspension cells three times with ice-cold phosphate-buffered saline (PBS).
- Lysate Collection: Place the cell culture plate on ice and add cold Laemmli sample buffer (typically 1X final concentration) at a ratio of 5 × 10⁶ cells per mL of buffer. Scrape the dish to collect the lysate into a microtube [25].
- Denaturation: Boil the sample at 95-100°C for 5 minutes to ensure complete denaturation. Note: Some protocols recommend 85°C for 2 minutes to prevent excessive proteolysis [24].
- Clarification: Sonicate the boiled sample briefly (5-10 seconds) and then centrifuge at 14,000 rpm for 5-10 minutes at 4°C.
- Storage: Transfer the clear supernatant to a new tube. The prepared samples can be stored at -80°C or loaded directly onto the gel [25].
Essential Research Reagent Solutions
Successful execution of the Laemmli method relies on a suite of specific reagents beyond the sample buffer itself. The following table lists key materials required for the procedure.
Table 3: Key Reagent Solutions for Laemmli Discontinuous Gel Electrophoresis
| Reagent / Material | Typical Composition | Function in the Protocol |
|---|---|---|
| Tris-Glycine SDS Running Buffer | 25 mM Tris, 192 mM Glycine, 0.1% SDS, pH ~8.3 [24] | Provides the medium for ion conduction and supplies glycine as the trailing ion during stacking. |
| Polyacrylamide Gel Matrix | Stacking gel: Lower % acrylamide, Tris-HCl, pH 6.8.Resolving gel: Higher % acrylamide, Tris-HCl, pH ~8.8 [24]. | Porous matrix that separates proteins by size; the discontinuous pH is fundamental to the method. |
| Reducing Agent | Dithiothreitol (DTT, 100 mM) or β-Mercaptoethanol (5%) [5] [25]. | Breaks covalent disulfide bonds in proteins to ensure analysis of individual polypeptide chains. |
| Protein Molecular Weight Marker | Mixture of pre-stained or unstained proteins of known molecular weight. | Serves as a standard for estimating the molecular weight of unknown proteins in the sample. |
The critical pH of 6.8 in the Laemmli sample and stacking gel buffers is a masterpiece of electrochemical design, not a mere procedural step. It is the key parameter that enables the stacking phenomenon of the discontinuous buffer system, which in turn is responsible for the high-resolution separation that has made SDS-PAGE an indispensable technique for over five decades. By precisely controlling the charge and mobility of the glycine trailing ion, this specific pH ensures that proteins enter the separating gel as sharply defined zones, allowing for accurate determination of molecular weight and analysis of complex protein mixtures. A deep understanding of this principle empowers researchers to troubleshoot effectively, optimize protocols for specific needs, and reliably generate high-quality data critical for both basic research and biopharmaceutical development.
Practical Protocols: Preparing and Using Laemmli Buffer for SDS-PAGE
Step-by-Step Guide to Preparing 2X and 4X Laemmli Buffer
The Laemmli buffer, named after its inventor Professor Ulrich K. Laemmli, is an essential reagent for preparing protein samples for sodium dodecyl sulfate-polyacrylamide gel electrophoresis (SDS-PAGE) [14] [5]. This discontinuous buffer system revolutionized protein analysis by enabling high-resolution separation of polypeptides based on molecular weight [14]. The formulation of Laemmli buffer creates specific physicochemical conditions necessary for optimal protein denaturation, charge uniformity, and precise migration through polyacrylamide gels [5]. Within the broader context of Laemmli method research, the sample buffer preparation represents a critical foundational step that directly impacts experimental reproducibility, band sharpness, and separation accuracy in biochemical and drug development applications [6] [18].
The Principle Behind Laemmli Buffer
The Laemmli buffer system operates through the coordinated functions of its individual components, which together create conditions for effective protein separation in SDS-PAGE [5]. The discontinuous nature of the Laemmli method utilizes differing pH conditions between stacking and resolving gels to create a stacking effect that concentrates proteins into sharp bands before they enter the resolving gel [13]. This process, fundamentally a form of transient isotachophoresis, ensures proteins begin separation simultaneously in narrow zones, significantly improving resolution [26]. The buffer's pH of 6.8 is strategically chosen to match the stacking gel pH while being close to glycine's isoelectric point, facilitating the stacking mechanism that precedes separation in the resolving gel [14] [5].
Components and Functions
The Laemmli buffer contains five critical components, each serving specific functions in protein preparation and separation [5]:
Component Functions in Laemmli Buffer
| Component | Function | Mechanism of Action |
|---|---|---|
| Tris/HCl | Buffering capacity; controls pH | Maintains system at pH 6.8; preserves peptide bonds and enables stacking effect [14] [5]. |
| SDS (Sodium Dodecyl Sulfate) | Protein denaturation; uniform charge assignment | Binds proteins linearly; masks intrinsic charge for pure size-based separation [5] [13]. |
| Reducing Agent (β-mercaptoethanol/DTT) | Disulfide bond reduction | Breaks covalent disulfide bonds; ensures complete polypeptide dissociation [14] [5]. |
| Glycerol | Sample density increase | Adds density for well loading; prevents sample diffusion into running buffer [14] [5]. |
| Bromophenol Blue | Visual tracking | Colors sample; migrates ahead of proteins to monitor electrophoresis progress [14] [5]. |
Composition Tables
The Laemmli buffer is typically prepared as concentrated stock solutions (2X or 4X) and diluted to 1X working concentration when mixed with protein samples [14].
Composition for 2X and 4X Laemmli Buffer
| Reagent | Molecular Weight | 1X Concentration | 2X Concentration | 4X Concentration | Quantity for 50 mL of 2X | Quantity for 50 mL of 4X |
|---|---|---|---|---|---|---|
| Tris base | 121.14 g/mol | 0.0625 M | 0.125 M | 0.250 M | 0.747 g | 1.514 g |
| SDS | 288.37 g/mol | 2% | 4% | 8% | 2 g | 4 g |
| Glycerol | 92.09 g/mol | 10% | 20% | 40% | 10 mL | 20 mL |
| β-mercaptoethanol | 78.13 g/mol | 5% | 10% | 20% | 5 mL | 10 mL |
| Bromophenol blue | 691.94 g/mol | 0.02% | 0.04% | 0.08% | 100 mg | 200 mg |
Alternative Formulations: Reducing vs. Non-Reducing
| Buffer Type | Reducing Agent | Application Context |
|---|---|---|
| Reducing Buffer | Contains β-mercaptoethanol or DTT | Complete denaturation for molecular weight analysis [6]. |
| Non-Reducing Buffer | No reducing agent | Preserves disulfide bonds for studying protein complexes [27] [6]. |
Preparation Protocol
Materials Required
- Tris base (FW: 121.14)
- SDS (Sodium Dodecyl Sulfate)
- Glycerol
- β-mercaptoethanol
- Bromophenol blue
- Hydrochloric acid (HCl) and/or Sodium hydroxide (NaOH) for pH adjustment
- Deionized water
- Measuring cylinders, beakers, and pH meter
- Magnetic stirrer and stir bar
Step-by-Step Preparation
The following workflow outlines the complete procedure for preparing Laemmli buffer:
Step 1: Dissolve Tris Base - Weigh the appropriate amount of Tris base (0.747 g for 2X or 1.514 g for 4X buffer for 50 mL final volume) and dissolve in approximately 10 mL deionized water in a beaker [14]. Use a magnetic stirrer to facilitate dissolution.
Step 2: Adjust pH - Carefully adjust the pH to 6.8 using concentrated HCl [14]. Use a fume hood for this step as HCl fumes are dangerous. Avoid overshooting the target pH.
Step 3: Add Glycerol - Measure the required glycerol volume (10 mL for 2X or 20 mL for 4X buffer for 50 mL final volume) using a cylinder and add to the Tris solution [14]. Mix well to ensure complete incorporation.
Step 4: Add SDS and Tracking Dye - Add the measured amounts of SDS (2 g for 2X or 4 g for 4X buffer) and bromophenol blue (100 mg for 2X or 200 mg for 4X buffer) to the solution [14]. Stir until completely dissolved, which may take several minutes.
Step 5: Reducing Agent Addition (Two Options)
- Option 1 (Complete Preparation): Add β-mercaptoethanol (5 mL for 2X or 10 mL for 4X buffer) and adjust the final volume to 50 mL with deionized water [14]. Aliquot and store at -20°C. Best for immediate use.
- Option 2 (Storage-Stable): Adjust the volume to approximately 45 mL with deionized water (leaving space for reducing agent) [14]. Aliquot and store without β-mercaptoethanol. Add reducing agent just before use. Recommended for better long-term results.
The Scientist's Toolkit
Essential Research Reagent Solutions
| Reagent/Category | Specific Examples | Function in Experiment |
|---|---|---|
| Buffering Systems | Tris-glycine, Tris-tricine, Tris-acetate | Provide appropriate pH environment for separation; different systems optimized for specific protein size ranges [26]. |
| Reducing Agents | β-mercaptoethanol, Dithiothreitol (DTT) | Break disulfide bonds to fully denature proteins; DTT offers better stability in some formulations [24] [5]. |
| Detergents | Sodium Dodecyl Sulfate (SDS) | Denature proteins and impart uniform negative charge proportional to molecular weight [5] [13]. |
| Pre-Cast Gels | Novex Tris-Glycine Gels | Provide consistent, ready-to-use separation matrices with modified Laemmli system for maximum performance [24]. |
| Protein Markers | Molecular weight standards | Enable estimation of protein size based on migration distance [24]. |
| Running Buffers | Tris-glycine-SDS buffer | Create conduction pathway and maintain pH during electrophoresis [24] [13]. |
Storage and Stability
- Laemmli buffer containing reducing agents (β-mercaptoethanol) should be stored at -20°C to prevent oxidation [14] [6].
- Without reducing agents, the buffer can be stored at room temperature or 4°C [14].
- Concentrated Laemmli buffer (4X or 6X) can be stored at 4°C for at least a year without significant effectiveness loss [5].
- For reducing buffers, frequent freeze-thaw cycles should be avoided; aliquoting is recommended [6].
Troubleshooting Common Issues
Troubleshooting Guide for Laemmli Buffer Applications
| Problem | Possible Cause | Solution |
|---|---|---|
| Poor band separation | Incomplete denaturation, wrong pH | Use reducing buffer with heat denaturation; verify buffer pH is 6.8 [6]. |
| Sample smearing | Protein overload, high salt content | Reduce protein loading; desalt sample or dialyze; use fresh reagents [6]. |
| Multiple bands for single protein | Disulfide bonds not broken (non-reducing buffer) | Switch to reducing formulation; add fresh reducing agent [6]. |
| Weak signal in detection | Too much dye, low protein concentration | Concentrate sample; verify buffer quality; reduce interfering substances [6]. |
| Yellow sample buffer | Incorrect pH | Adjust pH with NaOH or fresh buffer preparation [13]. |
Applications in Research and Drug Development
The Laemmli buffer system serves as a fundamental tool in numerous research contexts beyond basic protein separation [14] [6]. In immunoprecipitation workflows, the buffer is used to resuspend beads before SDS-PAGE analysis [14]. For western blotting, properly prepared Laemmli buffer ensures efficient protein transfer and antibody detection [6]. In drug development, the method enables assessment of protein purity, verification of subunit composition, and monitoring of therapeutic protein integrity [18]. Recent advancements include modifications using thermal gels for native protein separations, demonstrating how the core Laemmli principle continues to evolve for specialized applications [26].
The preparation of 2X and 4X Laemmli buffer represents a cornerstone technique in protein biochemistry with enduring relevance in modern research and drug development. By understanding the precise function of each component, following the detailed preparation protocol, and implementing appropriate troubleshooting measures, researchers can ensure optimal performance of this essential reagent. The discontinuous buffer system developed by Laemmli continues to provide the foundation for protein separation methodologies more than five decades after its introduction, with ongoing modifications and improvements expanding its utility for contemporary analytical challenges.
Choosing Between Reducing and Non-Reducing Formulations
The discontinuous buffer system for sodium dodecyl sulfate-polyacrylamide gel electrophoresis (SDS-PAGE), developed by Ulrich K. Laemmli, revolutionized the resolution of complex protein mixtures by molecular weight [2] [1]. The sample buffer is a critical component of this system, and the decision to use a reducing or non-reducing formulation is a fundamental experimental choice that directly impacts protein structure, separation, and analytical results. This choice determines whether intramolecular and intermolecular disulfide bonds are preserved, thereby influencing the protein's tertiary and quaternary structure during analysis [6]. Understanding the biochemical basis and consequences of this decision is essential for accurate data interpretation, particularly in drug development where protein conformation can affect function, immunogenicity, and therapeutic efficacy.
Core Principles: The Role of Buffer Components
Laemmli sample buffer creates the physicochemical conditions necessary for denaturing protein samples to ensure separation primarily by molecular weight [5]. The standard components and their functions are detailed below.
Table 1: Core Components of Laemmli Sample Buffer and Their Functions
| Component | Function | Mechanistic Basis |
|---|---|---|
| SDS (Sodium Dodecyl Sulfate) | Denatures proteins and imparts a uniform negative charge [6] [5]. | Binds to polypeptide backbones (∼1.4g SDS/g protein), disrupting hydrophobic interactions and masking intrinsic charge [5]. |
| Reducing Agent (e.g., DTT, BME) | Breaks disulfide bonds, linearizing proteins [6]. | Thiol groups nucleophilically attack and reduce cysteine disulfide bridges (S-S) to sulfhydryl groups (-SH) [5]. |
| Glycerol | Increases sample density [6]. | Provides density greater than water, allowing sample to sink into gel wells during loading [5]. |
| Tris Buffer | Controls pH of the sample buffer [6]. | Maintains stable pH (∼6.8) for optimal stacking and to inhibit some proteases [5]. |
| Tracking Dye (e.g., Bromophenol Blue) | Visualizes sample migration [6]. | Migrates ahead of proteins, marking the electrophoresis front [5]. |
The presence or absence of a reducing agent is the defining difference between the two formulations. In a reducing buffer, agents like dithiothreitol (DTT) or β-mercaptoethanol (BME) fully linearize proteins by cleaving covalent disulfide bonds [6]. In contrast, a non-reducing buffer omits these agents, thereby preserving the disulfide bonds that contribute to a protein's native conformation [6].
Decision Framework: Reducing vs. Non-Reducing Conditions
The choice between reducing and non-reducing formulations hinges on the experimental goal: whether the objective is to analyze a protein's primary sequence (molecular weight) or its higher-order structure.
When to Use Reducing Formulations
Reducing buffers are the default for most analytical SDS-PAGE experiments where the goal is accurate molecular weight determination [6]. Use a reducing formulation when your aim is to:
- Determine Accurate Molecular Weight: Disulfide bonds can cause proteins to migrate anomalously. Reducing them ensures the protein is fully unfolded, allowing for a more reliable size estimate [6].
- Analyze Protein Primary Structure: Reducing conditions break inter-polypeptide disulfide bonds, allowing individual subunits to be resolved [6].
- Study Monomeric Forms: To investigate the composition of a protein complex, reduction breaks the covalent links between subunits, revealing the individual monomers [6].
When to Use Non-Reducing Formulations
Non-reducing conditions are specialized for experiments where the integrity of disulfide bonds is critical to the biological question. Use a non-reducing formulation to [6]:
- Study Protein Quaternary Structure or Complexes: Analyze intact oligomeric structures held together by disulfide bonds.
- Investigate Conformational Epitopes: For western blotting, if an antibody recognizes an epitope dependent on disulfide-bonded loops, non-reducing conditions preserve that conformation.
- Examine Disulfide-Linked Aggregates: Identify the presence of high molecular weight aggregates that are covalent in nature.
The following workflow provides a systematic method for making this critical experimental decision:
Experimental Protocols and Methodologies
Standard Sample Preparation Protocol
A robust sample preparation method is vital for reproducible results. The following protocol is adapted for both reducing and non-reducing conditions.
- Determine Protein Concentration: Quantify the protein sample using an assay like BCA [28]. For Coomassie Blue staining, load 0.5–4.0 µg for purified proteins or 40–60 µg for crude samples [29].
- Mix Sample with Buffer: Combine the protein sample with the appropriate (reducing or non-reducing) Laemmli buffer. A 1:1 to 1:5 (buffer-to-sample) ratio is common, but a 3:1 mass ratio of SDS to protein should be maintained for complete denaturation [29] [5]. Critical step: For reducing buffers, ensure the reducing agent (DTT/BME) is fresh to prevent oxidation artifacts [6].
- Denature the Sample: Heat the mixture at 95–100°C for 5 minutes [6] [30]. Exception: If the protein contains acid-labile Asp-Pro bonds, heating at 75°C for 5 minutes is sufficient to inactivate proteases and avoid bond cleavage [29].
- Centrifuge and Load: Briefly centrifuge the sample (e.g., 2 minutes at 17,000 x g) to pellet any insoluble material. Load the supernatant into the gel well to prevent streaking [29].
A Pilot Experiment for Direct Comparison
When characterizing a new protein system, running a pilot experiment with both buffer types is highly informative.
- Experimental Design: Prepare two aliquots of the same protein sample. Mix one with reducing buffer and the other with non-reducing buffer. Denature and load them into adjacent wells on the same gel [6].
- Expected Results and Interpretation:
- Identical Migration: Suggests the protein lacks significant disulfide bonding.
- Faster Migration under Reduction: Indicates the breaking of inter-chain disulfides, separating subunits.
- Slower Migration under Reduction: Can occur if intra-chain disulfides are broken, allowing the protein to unfold more completely and migrate according to its linearized length.
- High-MW Aggregates in Non-Reducing Conditions: Suggests the presence of disulfide-linked oligomers that are reduced to monomers in the other lane [6].
Troubleshooting Common Artifacts
Missteps in sample preparation can introduce artifacts that confound interpretation. The table below outlines common issues, their causes, and solutions.
Table 2: Troubleshooting Common Artifacts in Reducing and Non-Reducing SDS-PAGE
| Problem | Potential Cause | Solution |
|---|---|---|
| Multiple bands or smearing | Protease activity (if sample is not heated immediately); Keratin contamination [29]. | Heat sample immediately after adding buffer; Avoid skin contact with samples/buffers; Run a buffer-only control [29]. |
| Protein aggregation or poor separation | Incomplete denaturation (non-reducing buffer used when reduction is needed); Insufficient SDS [6] [29]. | Switch to a reducing formulation; Add urea (6-8 M) or a non-ionic detergent for difficult proteins (e.g., membrane proteins) [29]. |
| Weak or no signal | Overloading of tracking dye; Low protein concentration [6]. | Concentrate dilute samples via TCA/acetone precipitation; Verify protein concentration and buffer dilution [6] [29]. |
| Distorted bands across lanes | Overloading of protein; Viscosity from nucleic acids in crude extracts [29]. | Reduce protein load; Treat sample with Benzonase nuclease or sonicate to shear nucleic acids [29]. |
The Scientist's Toolkit: Essential Reagent Solutions
Successful execution of SDS-PAGE relies on high-quality reagents. The following table lists key solutions and their specifications.
Table 3: Essential Research Reagent Solutions for Laemmli Gel Electrophoresis
| Reagent / Solution | Critical Function | Key Specifications & Notes |
|---|---|---|
| Laemmli Sample Buffer (4X or 6X) | Denatures and prepares proteins for loading [6]. | Choose concentration based on sample volume (6X for limited samples). Reducing agents degrade; aliquot and store at -20°C [6]. |
| SDS Running Buffer | Provides ions for current and defines pH for migration [31]. | Typically Tris-Glycine-SDS, pH ~8.3. Ensure correct dilution for optimal conductivity and buffering [5]. |
| Polyacrylamide Gels | Matrix for size-based separation [32]. | Precast gels offer reproducibility. Choose Tris-Glycine for Laemmli-style, Bis-Tris for stability, or Tris-Acetate for high MW proteins [32]. |
| Reducing Agents (DTT/BME) | Breaks disulfide bonds in reducing buffers [6]. | DTT is more stable than BME in buffer pH >7.0, but both should be added fresh for maximum efficacy [6] [5]. |
| Protein Molecular Weight Standard | Allows estimation of sample protein size [30]. | Pre-stained or unstained. Must be prepared with the same buffer condition (reducing/non-reducing) as samples. |
The decision between reducing and non-reducing Laemmli buffer formulations is a foundational step in experimental design that directly tests hypotheses about protein structure and function. Reducing conditions are indispensable for deconstructing proteins to their primary subunits, while non-reducing conditions are a powerful tool for probing the native, disulfide-stabilized architectures that are often critical to biological activity. By applying the systematic framework, protocols, and troubleshooting guides provided herein, researchers and drug development professionals can make informed choices, avoid common pitfalls, and generate robust, interpretable data that advances our understanding of protein biochemistry.
The Laemmli method for discontinuous SDS-polyacrylamide gel electrophoresis (SDS-PAGE), developed by Ulrich Laemmli in 1970, remains a cornerstone technique for separating proteins by molecular weight [1]. Its enduring success relies not only on the electrophoretic process itself but also on the critical, often determinative, steps of sample preparation. Proper execution of mixing, boiling, and loading is paramount to achieving high-resolution separation, accurate molecular weight determination, and reproducible results. This guide details the established best practices and underlying principles for these foundational steps, providing a robust framework for researchers in biochemistry, molecular biology, and drug development.
Theoretical Principles of Sample Denaturation
The Role of SDS in Protein Denaturation
Sodium dodecyl sulfate (SDS) is an anionic detergent that binds to proteins in a constant mass ratio of approximately 1.4 grams of SDS per gram of protein [22]. This uniform coating masks the proteins' intrinsic charges and confers a relatively consistent negative charge-to-mass ratio [17] [22]. Simultaneously, SDS disrupts hydrophobic interactions and unfolds the protein's secondary and tertiary structures, breaking hydrogen bonds and creating polypeptide chains that are largely linear [17] [33]. This process is fundamental because it ensures that separation during electrophoresis occurs primarily on the basis of molecular size rather than native charge or conformation [33].
The Function of Reducing Agents
To achieve complete linearization, it is necessary to break disulfide bonds, which are covalent linkages that stabilize tertiary and quaternary structures. Reducing agents such as 2-mercaptoethanol (β-ME) or dithiothreitol (DTT) are added to the sample buffer for this purpose [34] [6]. They work by reducing the disulfide bridges (-S-S-) between cysteine residues, converting them into sulfhydryl groups (-SH) [33]. The choice between a reducing and a non-reducing formulation is a critical experimental consideration, dictated by the research objective and the properties of the protein and antibody being studied [6].
Table 1: Comparison of Reducing and Non-Reducing Conditions
| Condition | Sample Loading Buffer | Gel Running Buffer | Primary Use Cases |
|---|---|---|---|
| Reduced & Denatured | SDS + β-ME or DTT [34] | SDS [34] | Standard molecular weight analysis; full denaturation for epitope exposure [6]. |
| Oxidized & Denatured | SDS, No β-ME or DTT [34] | SDS [34] | Studying disulfide-bonded complexes; antibodies sensitive to reducing agents [34]. |
| Oxidized & Native | No SDS and No β-ME or DTT [34] | No SDS [34] | Analyzing native conformation, quaternary structure, and conformational epitopes [34]. |
Laemmli Sample Buffer Composition and Function
The Laemmli sample buffer is a precisely formulated mixture designed to prepare the protein sample for electrophoresis. Each component serves a specific, vital function [6] [33].
Table 2: Components and Functions of Laemmli Sample Buffer
| Component | Standard Concentration (2X) | Primary Function |
|---|---|---|
| SDS (Sodium Dodecyl Sulfate) | 4% [34] [33] | Denatures proteins and provides a uniform negative charge [6] [33]. |
| Reducing Agent (e.g., 2-Mercaptoethanol) | 5-10% [34] [33] | Breaks disulfide bonds for complete protein linearization [6] [33]. |
| Glycerol | 10-20% [34] [33] | Increases sample density to ensure it sinks to the bottom of the well during loading [34] [33]. |
| Bromophenol Blue | 0.004% [34] [33] | A small, anionic tracking dye that visualizes migration progress during the run [34] [33]. |
| Tris-HCl (Buffer) | 0.125 M, pH ~6.8 [34] [33] | Provides buffering capacity to maintain the correct pH for the stacking gel system [6]. |
Step-by-Step Experimental Protocol
Sample and Buffer Mixing
- Determine Protein Concentration: After cell or tissue lysis, accurately determine the protein concentration of your lysate using an assay such as Bradford, BCA, or Lowry [34] [33]. This is crucial for loading equal amounts of protein across lanes.
- Dilute and Mix with Buffer: Mix the protein lysate with an equal volume of 2X Laemmli sample buffer (a 1:1 ratio) [34] [33]. If sample volume is limited, a more concentrated 4X or 6X buffer can be used with appropriate adjustment of the dilution factor [6]. To ensure homogeneity, vortex the mixture thoroughly before and after the heating step [34].
Boiling (Heat Denaturation)
- Heat the Samples: Denature the protein-SDS complexes by heating the samples at 95–100 °C for 5 minutes [34] [22] [33].
- Consider Alternatives: For multi-pass membrane proteins that may aggregate upon boiling, a milder heating condition of 70 °C for 5–10 minutes can be used as an acceptable alternative [34].
- Cool and Centrifuge: After heating, cool the samples to room temperature. Briefly centrifuge the tubes to collect any condensation from the caps and walls, ensuring no sample loss during loading [34].
Gel Loading
- Load the Appropriate Amount: Pipette the recommended amount of protein (typically 10–50 μg per lane for mini-gels) into the bottom of the well [33]. Always include a molecular weight marker (size standard) in at least one lane [22].
- Employ Proper Pipetting Technique: Use a steady hand to avoid introducing air bubbles into the wells. Ensure the pipette tip is placed just inside the well and expel the sample slowly and steadily [35].
- Avoid Overloading: Overloading wells with too much protein or volume is a common cause of smearing and poor band resolution [35]. The maximum load volume for a 1.0 mm thick gel is typically around 20-25 μL per well, but this can vary with well format [36].
The following workflow diagram summarizes the key stages of the sample preparation process:
Troubleshooting Common Issues
Even with careful execution, issues can arise. The table below outlines common problems, their probable causes, and recommended solutions.
Table 3: Troubleshooting Guide for Sample Preparation
| Problem | Possible Causes | Solutions |
|---|---|---|
| Smearing Bands | Overloading wells; running gel too fast; degraded samples; old or poor-quality SDS [35] [34]. | Reduce protein load; ensure fresh, high-quality SDS; run gel at lower voltage; check sample integrity [35] [6]. |
| Poor Band Separation / Odd Migration | Incomplete denaturation; incorrect buffer pH; insufficient or degraded reducing agent [6]. | Ensure fresh buffer and reducing agents; check buffer pH; use reducing buffer + heat [6]. |
| Protein Aggregates / Multiple Bands | Disulfide bonds not broken (if using non-reducing); over-reduction; incomplete solubilization [6]. | Switch to reducing buffer; optimize reducing agent concentration; ensure proper lysis [6]. |
| Weak or No Signal | Too much sample buffer dye; interfering substances; low protein concentration; samples not boiled sufficiently [6]. | Concentrate sample; verify buffer quality and dilution; ensure proper heating [34] [6]. |
| "Smiling" or "Frowning" Bands | Uneven heating during electrophoresis; uneven gel polymerization; improper loading [17]. | Ensure adequate buffer levels to dissipate heat; monitor voltage; re-pour gel if polymerization is uneven [35] [17]. |
The Scientist's Toolkit: Essential Research Reagents
A successful experiment depends on the quality and suitability of its core reagents. The following table details essential materials for sample preparation using the Laemmli method.
Table 4: Essential Research Reagent Solutions
| Reagent / Kit | Function / Description | Example Product / Component |
|---|---|---|
| Laemmli Sample Buffer | Ready-to-use buffer for denaturing and reducing proteins. Available in reducing/non-reducing and 4X/6X concentrations [6]. | BP-110R (Reducing, 4X) [6]. |
| Protease & Phosphatase Inhibitor Cocktails | Added fresh to lysis buffers to prevent protein degradation and post-translational modification loss during preparation [34] [33]. | Aprotinin, Leupeptin, PMSF, Sodium Fluoride, Orthovanadate [33]. |
| Protein Assay Kits | For precise determination of protein concentration prior to loading to ensure equal loading across lanes [34] [33]. | Bradford, BCA (Bicinchoninic Acid), or Lowry Assay Kits [34] [33]. |
| Molecular Weight Markers | Pre-stained or unstained protein ladders of known molecular weight for estimating the size of unknown proteins in the sample [22]. | Pre-stained Protein Standard. |
| Specialized Lysis Buffers | Buffers tailored to the sub-cellular localization of the target protein to optimize solubilization and yield [33]. | RIPA Buffer (nucleus, membrane), NP-40 Buffer (whole cell), Tris-HCl (cytoplasm) [33]. |
Alternative Modern Systems
While the traditional Laemmli system is robust, modern alternatives like the NuPAGE Bis-Tris Electrophoresis System (Thermo Fisher Scientific) offer advantages for certain applications [36]. This system operates at a neutral pH instead of the highly alkaline pH of the Laemmli separating gel. This neutral environment minimizes protein modifications (e.g., deamination), reduces gel hydrolysis for a longer shelf life (up to 12 months for pre-cast gels), and eliminates the cleavage of Asp-Pro bonds that can occur during boiling in Laemmli buffer [36]. The sample buffer for this system uses lithium dodecyl sulfate (LDS) and requires milder heating conditions (70°C for 10 minutes) [36]. The choice between traditional and modern systems should be guided by the specific needs of the experiment, including the sensitivity of the target protein and the requirements for downstream analysis.
The Laemmli method for discontinuous gel electrophoresis stands as a foundational technique in molecular biology, enabling the high-resolution separation of complex protein mixtures by molecular weight. Its true utility, however, is realized through its compatibility with downstream applications, particularly western blotting and immunodetection. This combination allows researchers to not only separate proteins but also specifically identify and characterize them within a complex sample. The efficacy of the entire workflow—from gel electrophoresis to final detection—is profoundly influenced by choices made at each stage, including the type of membrane, transfer method, and detection strategy. This guide provides an in-depth technical examination of these critical parameters, offering optimized protocols and data-driven recommendations to ensure maximum compatibility and success in western blotting and immunodetection following SDS-PAGE.
Membrane Selection for Western Blotting
The transfer membrane is the critical interface between protein separation and immunodetection. Its choice directly impacts protein binding capacity, retention, and compatibility with subsequent staining and detection methods.
Polyvinylidene difluoride (PVDF) membranes are one of the most popular choices for western blotting. They are hydrophobic and require pre-wetting in methanol or ethanol prior to use to facilitate buffer penetration. PVDF offers high mechanical strength and protein binding capacity, making it suitable for a wide range of applications [37]. Its chemical stability also makes it compatible with protein sequencing techniques like Edman degradation, allowing for the determination of a protein's primary structure [37].
Nitrocellulose membranes are another widely used option, prized for their high affinity for proteins and their suitability for colorimetric, chemiluminescent, and fluorescent detection methods. The pore size of a membrane is a crucial consideration. While 0.45 µm is standard for many proteins, 0.22 µm pore sizes are recommended for better retention of lower molecular weight proteins (<20 kDa) to prevent "blow-through," where small proteins pass completely through the membrane [38]. A comparative study demonstrated that a 0.22 µm PVDF membrane had a significantly stronger interception capability for small-molecular-weight proteins like Cytochrome C (CyC, 15 kDa) and CD81 compared to standard 0.45 µm PVDF or nitrocellulose membranes [38].
Table 1: Comparison of Western Blotting Membrane Properties
| Membrane Type | Binding Mechanism | Key Advantages | Ideal For | Considerations |
|---|---|---|---|---|
| PVDF | Hydrophobic | High mechanical strength; compatible with protein sequencing (Edman) [37] | General protein analysis; protein characterization | Requires pre-wetting in alcohol |
| Nitrocellulose | Non-covalent | High protein affinity; versatile detection | Standard immunoblotting | Can be brittle; less durable |
| 0.22 µm Pore Size | Size exclusion | Superior retention of low MW proteins (<20 kDa) [38] | Peptides and small proteins | May require longer transfer times |
Protein Transfer Methodologies
Electroblotting is the standard method for transferring proteins from a polyacrylamide gel to a membrane. The choice of transfer system affects efficiency, time, and suitability for different protein types.
Wet (Tank) Transfer involves submerging the gel-membrane sandwich in a tank filled with transfer buffer. It is a robust and reliable method, capable of high-efficiency transfer (80-100%) for proteins between 14-116 kDa [39]. Its main advantage is consistent performance, especially for high-molecular-weight proteins. However, it is time-consuming (30 minutes to overnight), requires large volumes of buffer, and may need a cooling system to manage heat generated during extended transfers [39].
Semi-Dry Transfer utilizes buffer-saturated filter papers directly in contact with plate electrodes. This method is faster (7-60 minutes) and uses less buffer than wet transfer [39]. A modified semi-dry transfer buffer that replaces toxic methanol with ethanol has been shown to maintain transfer efficiency while reducing toxicity [38]. However, transfer efficiency can decrease for proteins larger than 300 kDa.
Dry Transfer systems use pre-assembled stacks with integrated buffer matrices, eliminating the need for liquid transfer buffers. This method is the fastest, with transfers possible in as little as 3 minutes, and involves minimal cleanup [39]. Systems like the Invitrogen iBlot provide performance comparable to traditional wet transfer [39].
Optimal transfer time varies with protein size. For low-abundance proteins, a transfer time of 15 minutes is sufficient for small proteins (10-25 kDa), while 30-35 minutes is recommended for larger proteins (70-130 kDa) to ensure complete transfer from the gel [38].
Table 2: Comparison of Electroblotting Methods for Western Blotting
| Parameter | Wet Transfer | Semi-Dry Transfer | Dry Transfer |
|---|---|---|---|
| Transfer Time | 30 min to overnight [39] | 7 to 60 min [39] | As few as 3 min [39] |
| Buffer Volume | High (~1000 mL) [39] | Low (~200 mL) [39] | None required [39] |
| Throughput | High (multiple gels) | High | High |
| Efficiency for High MW Proteins | Excellent [39] | Lower [39] | Excellent [39] |
| Ease of Use & Cleanup | Moderate (extensive cleanup) [39] | High (light cleanup) [39] | Very High (minimal cleanup) [39] |
Immunodetection Strategies
Following transfer and blocking, the immobilized protein is probed with antibodies for specific detection. The detection strategy can be indirect, using labeled secondary antibodies, or direct, using labeled primary antibodies.
Indirect Detection is the most common approach. It involves a two-step process: first, an unlabeled primary antibody binds to the target protein; second, a labeled secondary antibody that recognizes the host species of the primary antibody is applied. The key advantage of this method is signal amplification, as multiple secondary antibodies can bind to a single primary antibody, enhancing sensitivity [40]. It also offers flexibility, as the same labeled secondary antibody can be used with any primary antibody from the same host species.
Direct Detection utilizes a primary antibody that is directly conjugated to a label (e.g., an enzyme or fluorophore). This method simplifies the workflow by reducing the number of steps and incubation times. It enables multiplexing, as multiple proteins of different molecular weights can be probed simultaneously on the same blot without cross-reactivity of secondary antibodies [40]. However, it requires the availability of conjugated primary antibodies or the capability to label them in-house, which can be more costly and less flexible than indirect methods.
Quantitative Normalization in Western Blotting
Accurate normalization is critical for generating reliable quantitative western blot data. Traditional methods rely on housekeeping proteins (e.g., GAPDH, β-actin), but their expression can vary under experimental conditions, and their signals often saturate at higher protein loads, leading to inaccurate normalization [41].
Total Protein Normalization (TPN) has emerged as a superior alternative. TPN uses the total protein signal in each lane as a loading control, correcting for variations in sample concentration, loading, and transfer efficiency. The Invitrogen No-Stain Protein Labeling Reagent is a covalent fluorescent label that binds lysine residues on proteins, either in the gel or on the membrane after transfer [41]. The protocol is rapid (10-minute incubation), sensitive (detection down to 20 ng per band), and compatible with downstream immunodetection on PVDF and nitrocellulose membranes [41].
This method provides a broad linear dynamic range (1–80 µg total protein load) and a more accurate linear relationship between signal intensity and sample load compared to housekeeping proteins. Data demonstrates that the No-Stain reagent has a near-perfect linear regression value (R² = 0.9990), whereas housekeeping proteins like β-actin, GAPDH, and α-tubulin show lower linearity (R² values of 0.8851, 0.9438, and 0.8332, respectively) due to signal saturation [41].
Automated and Alternative Western Blotting Platforms
To address issues of reproducibility and time consumption in traditional western blotting, several automated and alternative platforms have been developed.
Semi-Automated Systems, such as the iBind Flex, automate the immunodetection steps (blocking, antibody incubations, and washes) using a sequential lateral flow technology [42]. This reduces hands-on time and uses smaller antibody volumes, though it may require higher antibody concentrations.
Fully Automated Systems, such as the JESS Simple Western, represent a paradigm shift by replacing gels and membranes with capillaries [42]. In this system, samples are loaded, size-separated, and immunoblotted within individual capillaries. All downstream steps, including imaging and analysis, are performed automatically. This technology offers significant benefits: it saves time, uses minute amounts of sample (3 µL), and greatly enhances reproducibility by automating all critical steps [42]. The main drawback is the higher initial cost of the device and reagents.
Capillary Electrophoresis-SDS (CE-SDS) is an advanced separation technology that offers several advantages over traditional SDS-PAGE. CE-SDS provides higher resolution, superior reproducibility, and quantitative precision with integrated detection [4]. It is automated, reducing hands-on time and user variability, and generates less toxic waste by eliminating the need for acrylamide gels and staining/destaining solutions [4]. Data analysis software can present results in a virtual gel format for easy comparison to traditional methods, making it a powerful tool for biopharmaceutical development [4].
Optimized Experimental Protocols
Rapid Western Blotting Protocol
A comprehensively optimized protocol can reduce the total time before primary antibody incubation to under 80 minutes [38].
- Gel Preparation (10 min): Simplify by using pre-mixed reagents (deionized water, 30% Acr-Bis, Tris, 10% SDS, TEMED) stored at 4°C. Add 10% ammonium persulfate (AP) last to catalyze polymerization. This pre-mixed system is stable for a month and shows no difference in signal-to-noise ratio compared to traditionally cast gels [38].
- Electrophoresis (35 min): Use a modified running buffer (38.1 mM Tris, 266.7 mM glycine, 21.0 mM HEPES, 3.5 mM SDS, pH 8.3) and run at 200 V at room temperature to complete separation in 35 minutes [38].
- Electrotransfer (15-35 min): Use a semi-dry system with a methanol-free transfer buffer (Tris 36.9 mM, glycine 39.1 mM, SDS 1.3 mM, 20% ethanol). Adjust transfer time based on protein molecular weight: 15 min for 10-25 kDa, 20 min for 25-55 kDa, 25 min for 55-70 kDa, and 30-35 min for 70-130 kDa proteins [38].
- Blocking (10 min): Block with polyvinylpyrrolidone-40 (PVP-40) in PBS for 10 minutes at room temperature [38].
Total Protein Normalization Protocol
- Post-Transfer Labeling:
- After transfer, wash the PVDF or nitrocellulose membrane twice for 2 minutes with ultrapure water on a rotating platform.
- Prepare the 1X No-Stain Labeling Solution by mixing the No-Stain Activator and Derivatizer with the appropriate volume of 1X No-Stain Labeling Buffer (e.g., 10 mL for a mini membrane).
- Incubate the membrane in the labeling solution for 10 minutes on a rotating platform.
- Wash the membrane three times for 2 minutes with water.
- Image the membrane using a compatible imaging system (e.g., iBright FL1500) with ~488 nm excitation and 590 nm emission to capture the total protein signal [41].
- Downstream Immunodetection: Proceed with standard blocking, antibody incubation, and detection steps. The total protein signal is used for lane normalization during data analysis [41].
The Scientist's Toolkit: Essential Research Reagents
Table 3: Key Reagent Solutions for Western Blotting and Immunodetection
| Reagent / Kit | Function | Key Feature |
|---|---|---|
| Laemmli Sample Buffer [6] | Denatures proteins and imparts uniform negative charge for SDS-PAGE. | Contains SDS; reducing formulations include DTT or 2-mercaptoethanol to break disulfide bonds. |
| Invitrogen No-Stain Protein Labeling Reagent [41] | Covalently labels proteins on gels or membranes for total protein normalization. | 10-minute protocol; compatible with immunodetection; superior linearity vs. housekeeping proteins. |
| Lightning-Link Antibody Labeling Kit [40] | Rapidly conjugates antibodies with enzymes or fluorophores for direct detection. | 30-second hands-on time; enables multiplexing by allowing direct antibody labeling. |
| Pre-mixed Gel Reagents [38] | Simplified and accelerated polyacrylamide gel preparation. | Stable for >1 month at 4°C; reduces gel polymerization time. |
| Modified Electrotransfer Buffer [38] | Facilitates protein transfer from gel to membrane in semi-dry systems. | Replaces methanol with less toxic ethanol while maintaining transfer efficiency. |
Workflow and Pathway Diagrams
Western Blotting and Immunodetection Workflow
Normalization Method Comparison
Safe Handling and Storage of Critical Reagents like β-Mercaptoethanol
The Laemmli method for discontinuous gel electrophoresis, developed by Ulrich Laemmli in 1970, represents a cornerstone technique in modern molecular biology and proteomics [1]. This method enables the high-resolution separation of proteins based on their molecular weight by employing sodium dodecyl sulfate (SDS) to denature proteins and impart a uniform charge-to-mass ratio. A critical, yet often hazardous, component of this protein denaturation process is β-Mercaptoethanol (β-ME). This reducing agent is integral to the Laemmli protocol, where it functions by reducing disulfide bonds in proteins, thereby ensuring their complete unfolding and facilitating accurate molecular weight determination [43]. Its role is so fundamental that it is mentioned as a standard component in contemporary descriptions of SDS-PAGE methodology for aiding denaturation [43].
Framing safety protocols within this specific research context is paramount. The original development of SDS-PAGE involved significant hands-on manipulation of toxic chemicals, including breathing SDS aerosols and regular skin exposure to neurotoxic acrylamide, with unknown long-term health consequences [1]. This historical context underscores the necessity for rigorous, modern safety standards. This guide provides an in-depth technical overview of the safe handling, storage, and disposal of β-Mercaptoethanol, ensuring that researchers can leverage its critical biochemical functions while minimizing risks to personal health and laboratory safety.
Hazard Identification and Properties of β-Mercaptoethanol
A thorough understanding of the physicochemical and hazardous properties of β-Mercaptoethanol is the foundation of all subsequent safety procedures. β-Mercaptoethanol (CAS No.: 60-24-2) is an organic sulfur compound with a characteristically foul, pungent odor, often described as that of rotten cabbage. Its small molecular size and volatility contribute significantly to its primary exposure routes: inhalation and dermal absorption.
Table 1: Physicochemical and Hazardous Properties of β-Mercaptoethanol
| Property | Specification | Safety Implication |
|---|---|---|
| Chemical Formula | C₂H₆OS | Basis for toxicity and reactivity. |
| Molecular Weight | 78.13 g/mol | Relatively volatile liquid. |
| Appearance | Colorless liquid | Can be easily spilled if not contained. |
| Odor | Pungent, disagreeable | Warning property, but poor due to high toxicity. |
| Vapor Pressure | Relatively high | High risk of inhalation exposure; mandates use in a fume hood. |
| Flash Point | ~85 °C (185 °F) | Combustible liquid. |
| Primary Hazards | Toxic, Flammable, Corrosive | Acute and chronic health effects. |
The health hazards associated with β-ME exposure are severe and multi-faceted. Acute exposure can cause irritation to the eyes, skin, and respiratory tract, with potential for corneal damage and skin burns. Inhalation can lead to headaches, dizziness, nausea, and respiratory distress. Chronic exposure poses more serious risks, including potential damage to the central nervous system, liver, and kidneys. Its volatility means that creating an aerosol or vapor, akin to the SDS aerosols described during Laemmli's original work [1], presents a significant inhalation risk. Furthermore, its ability to be absorbed through the skin necessitates robust personal protective equipment (PPE) during all handling activities.
Safe Handling Procedures and Experimental Protocols
Integrating β-Mercaptoethanol into laboratory workflows, particularly for SDS-PAGE sample preparation, requires a methodical approach to minimize exposure. All procedures must be conducted in a certified chemical fume hood to ensure vapor containment and to protect the respiratory tract, a lesson learned from the historical unsafe practices of earlier electrophoresis work [1].
Sample Preparation Protocol for SDS-PAGE
The following methodology details the safe incorporation of β-ME into a standard Laemmli-style protein denaturation protocol.
Method Name: Safe Protein Denaturation and Reduction for Discontinuous SDS-PAGE
Principle: This protocol involves the use of a sample buffer containing SDS and β-Mercaptoethanol to denature protein samples. SDS unfolds the proteins and confers a negative charge, while β-ME reduces disulfide bonds, ensuring linearized polypeptide chains for accurate molecular weight separation on a polyacrylamide gel [43].
Materials:
- Protein sample
- 2X Laemmli Sample Buffer (typically containing Tris-HCl, SDS, glycerol, bromophenol blue)
- β-Mercaptoethanol (≥98%)
- Microcentrifuge tubes (heat-resistant)
- Heating block or water bath (95-100°C)
- Micropipettes and aerosol-barrier tips
- Personal Protective Equipment (PPE): Nitrile gloves, lab coat, safety goggles
Procedure:
- PPE and Environment: Don appropriate PPE (gloves, lab coat, safety goggles). Ensure all work is conducted within a functioning fume hood.
- Calculate Volumes: Determine the required volume of sample buffer. A typical formulation is 5% (v/v) β-Mercaptoethanol in Laemmli Sample Buffer. For example, to prepare 1 mL of reducing sample buffer, add 50 µL of β-ME to 950 µL of sample buffer.
- Prepare Reducing Buffer: In the fume hood, carefully aliquot the calculated volume of β-ME and add it to the stock sample buffer vial. Cap the vial immediately and mix by inversion. Label the buffer clearly as "Contains β-ME - Toxic."
- Mix Sample: Combine the protein sample with an equal volume of the freshly prepared reducing sample buffer in a heat-resistant microcentrifuge tube.
- Denature Protein: Securely cap the tubes and vortex briefly to mix. Heat the samples at 95-100°C for 5-10 minutes to achieve complete denaturation and reduction.
- Cool and Centrifuge: Briefly centrifuge the heated samples to collect condensation and any liquid from the cap and walls of the tube.
- Load Gel: The samples are now ready for loading onto a polyacrylamide gel for electrophoretic separation.
Safety Notes:
- The heating step can volatilize β-ME; therefore, tube caps must be secure, and this step should ideally be performed in a fume hood or a dedicated, well-ventilated heating block.
- Always use aerosol-barrier pipette tips when handling the sample buffer or prepared samples to prevent aerosol contamination of pipettors.
Workflow for Safe Handling
The following diagram illustrates the logical workflow for safely handling β-Mercaptoethanol during experimental procedures.
Storage, Stability, and Disposal
Proper storage is critical for maintaining the chemical integrity of β-Mercaptoethanol and ensuring laboratory safety. Adherence to the following protocols mitigates the risks of degradation, fire, and accidental exposure.
Storage and Stability Specifications
Table 2: Storage Conditions and Stability of β-Mercaptoethanol
| Parameter | Recommended Condition | Rationale |
|---|---|---|
| Temperature | 2-8°C (Refrigerated) | Slows chemical degradation and reduces vapor pressure. |
| Container | Sealed, amber glass bottle in secondary containment | Protects from light, prevents leakage, and contains spills. |
| Atmosphere | Inert gas (e.g., N₂) blanket (optional for small bottles) | Precludes oxidation by air, which can form disulfides. |
| Shelf Life | ~12 months from opening (monitor for discoloration) | Degradation leads to decreased reducing efficiency. |
| Labelling | "Toxic," "Flammable," "Date Received," "Date Opened" | Critical information for risk assessment and inventory control. |
| Location | Ventilated, flammable storage cabinet | Isolates flammability and toxicity hazards. |
β-Mercaptoethanol should be stored in its original, tightly sealed container within a dedicated, ventilated flammable liquids cabinet. The container must be placed in secondary containment, such as a polyethylene tray, to contain any potential leaks or breakage. The storage area must be clearly marked with appropriate hazard signage and should be away from oxidizers, strong acids, and heat sources.
Waste Disposal Protocol
Waste streams containing β-Mercaptoethanol, including used sample buffers, contaminated tips, and gloves, must be treated as hazardous chemical waste.
Procedure:
- Segregate Waste: Collect all β-ME-continated waste in a non-combustible, chemically compatible container (e.g., a glass or high-density polyethylene jar) with a tight-fitting lid.
- Label Clearly: The waste container must be labeled with a hazardous waste tag identifying the contents (e.g., "Hazardous Waste - Contains β-Mercaptoethanol").
- Neutralization (if applicable): For concentrated liquid waste, contact your institution's Environmental Health and Safety (EHS) department. Some protocols may recommend chemical neutralization before disposal, but this should only be performed by trained personnel following institutional guidelines.
- Document and Dispose: Maintain an inventory of waste generated. disposal must be handled by a licensed hazardous waste disposal contractor in accordance with all local, state, and federal regulations. Never dispose of β-Mercaptoethanol down the drain.
Emergency Procedures and First Aid
Despite all precautions, preparedness for accidental exposure is essential. The following first-aid measures should be implemented immediately, followed by professional medical attention.
Table 3: First Aid Measures for β-Mercaptoethanol Exposure
| Exposure Route | Immediate First Aid | Additional Notes |
|---|---|---|
| Inhalation | Immediately move person to fresh air. | Seek medical attention; administer oxygen if breathing is difficult. |
| Skin Contact | Remove contaminated clothing. Wash area with plenty of soap and water for at least 15 minutes. | Do not use creams or ointments. Seek medical attention for significant exposure. |
| Eye Contact | Rinse immediately with copious amounts of water or eyewash solution for at least 15 minutes, holding eyelids open. | Urgent medical attention is required due to risk of corneal injury. |
| Ingestion | Do NOT induce vomiting. Rinse mouth with water. Seek immediate medical attention. | Never give anything by mouth to an unconscious person. |
In the event of a spill, immediately evacuate non-essential personnel and alert those in the vicinity. Ventilate the area if it is safe to do so. Don appropriate PPE, including a lab coat, gloves, and goggles. For small spills, absorb the liquid with an inert, non-combustible material like vermiculite or sand, place it in a sealed container for hazardous waste, and thoroughly decontaminate the surface. For large spills, contact your institutional EHS or emergency response team.
The Scientist's Toolkit: Research Reagent Solutions
Within the framework of Laemmli discontinuous gel electrophoresis, several reagents work in concert with β-Mercaptoethanol to achieve effective protein separation. The following table details these key components.
Table 4: Essential Reagents for Laemmli Discontinuous Gel Electrophoresis
| Reagent | Function in the Protocol | Key Properties & Hazards |
|---|---|---|
| β-Mercaptoethanol | Reducing agent that cleaves disulfide bonds in proteins, ensuring complete unfolding. | Toxic, flammable, volatile. Requires fume hood use. [43] |
| Sodium Dodecyl Sulfate (SDS) | Anionic detergent that denatures proteins and confers a uniform negative charge. | Irritant (dust/inhalation); harmful to aquatic life. [1] [43] |
| Acrylamide/Bis-acrylamide | Monomer and crosslinker that form the porous polyacrylamide gel matrix for separation. | Neurotoxin (monomer); skin and inhalation hazard. Handle with gloves. [1] [43] |
| Glycine | Component of the electrophoresis buffer; serves as the trailing ion in the discontinuous system for protein stacking. | Low hazard. |
| Tris(hydroxymethyl)aminomethane (Tris) | Buffering agent used in both the gel and running buffer to maintain stable pH. | Irritant to eyes, respiratory system, and skin. |
| Coomassie Blue | Dye used for staining proteins after electrophoresis by binding non-specifically to polypeptide chains. | Derived from textile dyes; low toxicity. [1] |
Troubleshooting Common Issues and Optimizing Your Protein Separation
Diagnosing and Fixing Poor Band Separation and Smearing
The discontinuous buffer system developed by Ulrich K. Laemmli in 1970 revolutionized protein biochemistry by enabling high-resolution separation of complex protein mixtures based on molecular weight [2]. This method remains a cornerstone technique in molecular biology and biochemistry laboratories worldwide, with the original paper cited nearly 300,000 times [2]. The Laemmli system employs a discontinuous pH and gel pore structure to concentrate protein samples into extremely narrow zones before they enter the separating gel, thereby facilitating superior resolution [2]. However, researchers frequently encounter two interrelated challenges that compromise data quality: poor band separation and smearing. These issues can obscure critical experimental results, leading to inaccurate molecular weight determinations, compromised purity assessments, and failed experiments downstream. This technical guide examines the root causes of these common electrophoretic artifacts within the context of the Laemmli method and provides evidence-based protocols for their diagnosis and resolution, equipping researchers with systematic approaches to optimize protein separation fidelity.
Core Principles of Discontinuous SDS-PAGE
The Laemmli Buffer System Mechanism
The exceptional resolving power of the Laemmli method stems from its ingenious use of discontinuity in both pH and gel composition. The system comprises a stacking gel (pH ~6.8) and a resolving gel (pH ~8.8) operating within a Tris-glycine-SDS running buffer (pH ~8.3) [44]. This configuration creates a critical phenomenon where glycine molecules in the running buffer exist primarily as glycinate anions at pH 8.3 but transition to zwitterions upon entering the lower pH environment of the stacking gel [44]. The different mobilities of chloride ions (leading ions) from the Tris-HCl gel buffer and the glycine zwitterions (trailing ions) establish a steep voltage gradient that compresses protein samples into extremely narrow zones before they enter the resolving gel [44]. This stacking mechanism ensures all proteins begin separation simultaneously from a unified starting point, which is fundamental to achieving high resolution.
Molecular Sieving and Protein Migration
Following stacking, proteins enter the resolving gel where separation occurs primarily by molecular size through a polyacrylamide matrix that acts as a molecular sieve [17]. The anionic detergent sodium dodecyl sulfate (SDS) plays a crucial role by binding to proteins at approximately 1.4g SDS per 1g protein, conferring a uniform negative charge density that masks proteins' inherent charges [17] [44]. This SDS coating ensures polypeptide chains unfold into rod-shaped complexes whose migration rates correlate inversely with the logarithm of their molecular masses [17]. Smaller proteins navigate the crosslinked polyacrylamide meshwork more readily than larger counterparts, resulting in differential migration based primarily on size [17]. The acrylamide concentration determines pore size, with higher percentages creating smaller pores that better resolve lower molecular weight proteins, while lower percentages facilitate the separation of larger proteins [17] [44].
Systematic Diagnosis of Separation Issues
Troubleshooting Workflow
The following decision tree provides a systematic approach for diagnosing the root causes of poor band separation and smearing in SDS-PAGE:
Quantitative Optimization Parameters
The table below summarizes key experimental parameters that require optimization to prevent separation issues, along with their typical optimal ranges and deviation effects:
Table 1: Critical SDS-PAGE Parameters Influencing Band Resolution
| Parameter | Optimal Range | Effects of Deviation | Diagnostic Cues |
|---|---|---|---|
| Voltage | 10-15 V/cm [45] | High voltage causes smearing and overheating; low voltage causes band diffusion and long run times | Smeared bands, excessive buffer heating, distorted band shapes |
| Acrylamide % | 8-12% (depending on protein size) [17] | Too high % impedes protein migration; too low % causes poor resolution of small proteins | Poor separation, compressed bands, missing bands in specific MW ranges |
| Run Time | Until dye front reaches bottom (~40-60 min at 150V) [45] [17] | Too short: incomplete separation; too long: loss of low MW proteins off gel | Unresolved bands, missing lower molecular weight bands |
| Buffer Composition | Correct Tris-glycine-SDS concentrations [45] | Improper ion concentration disrupts current flow and pH maintenance | Poor band resolution, uneven running, variable migration |
| Sample Load | 1-12 µg/band (Coomassie) [36] | Overloading causes smearing and distorted bands; underloading causes faint bands | Smeared bands, distorted band shapes, overlapping bands |
Experimental Protocols for Problem Resolution
Protocol 1: Correcting Smeared Bands
Principle: Electrophoretic smearing primarily results from excessive voltage generating heat that denatures proteins unevenly or disrupts the stacking interface [45].
Voltage Optimization:
Temperature Control:
Sample Preparation Verification:
Protocol 2: Resolving Poor Band Separation
Principle: Incomplete separation manifests as blurred, overlapping bands and stems from incorrect gel composition, insufficient run time, or buffer issues [45].
Gel Percentage Optimization:
Electrophoresis Duration:
Buffer System Integrity:
Protocol 3: Addressing Artifact Bands and Distortions
Principle: Band distortions including smiling effects and edge artifacts arise from heat gradients and improper gel handling [45].
Preventing Smiling Bands:
- Reduce running voltage and implement active cooling as in Protocol 1 [45].
- Ensure uniform gel thickness by using properly aligned glass plates during casting.
- Verify that the gel apparatus is level during operation.
Eliminating Edge Effects:
Ensuring Complete Polymerization:
Research Reagent Solutions
The table below catalogues essential reagents for troubleshooting SDS-PAGE issues, with specific attention to their roles in preventing separation artifacts:
Table 2: Essential Reagents for Optimizing SDS-PAGE Resolution
| Reagent | Function | Troubleshooting Application |
|---|---|---|
| SDS (Sodium Dodecyl Sulfate) | Denatures proteins and confers uniform negative charge [17] [44] | Prevents smearing from incomplete denaturation; ensures migration by size |
| Acrylamide/Bis-acrylamide | Forms porous matrix for molecular sieving [17] [44] | Adjust concentration to resolve specific molecular weight ranges |
| Tris-Glycine Buffer System | Creates discontinuous pH for stacking [44] | Maintain proper ion concentration for sharp bands; fresh buffer prevents poor resolution |
| β-Mercaptoethanol or DTT | Reduces disulfide bonds [44] | Prevents smearing from incomplete unfolding; essential for multimeric proteins |
| Ammonium Persulfate (APS) & TEMED | Catalyzes acrylamide polymerization [17] [44] | Ensures uniform gel matrix; prevents polymerization artifacts |
| Coomassie Blue/Silver Stains | Visualizes separated protein bands [30] [17] | Detects faint bands; silver staining offers higher sensitivity for low-abundance proteins |
Advanced Technical Considerations
Methodological Limitations and Alternatives
While the Laemmli system remains the predominant SDS-PAGE method, researchers should recognize its limitations, including high pH-induced protein modifications and gel matrix instability at alkaline pH [36]. Contemporary alternatives like the NuPAGE system operate at neutral pH (7.0) using Bis-Tris or Tris-Acetate gels, offering enhanced protein stability and sharper band resolution, particularly for sensitive proteins or those prone to modifications [36]. This system provides longer gel shelf life (8-12 months versus 4-6 weeks for Laemmli gels) and minimizes protein deamination and aspartic acid cleavage artifacts [36]. For specialized applications requiring native protein separation, Blue Native PAGE or Clear Native PAGE preserve protein complexes and enzymatic activities, though with different separation mechanisms based on both charge and size [17].
Specialized Electrophoresis Techniques
For complex protein mixtures, two-dimensional electrophoresis (2-DE) combines isoelectric focusing (first dimension) with SDS-PAGE (second dimension) to resolve thousands of proteins simultaneously [17]. This technique provides unparalleled resolution for proteomic studies but introduces additional technical challenges including sample preparation complexity and inter-gel reproducibility [17]. When investigating specific protein-protein interactions under non-denaturing conditions, native PAGE offers valuable insights but requires optimization of buffer systems without SDS to maintain protein structure and function [17]. For extremely large protein complexes or DNA fragments, pulse-field electrophoresis with alternating electric field directions enables separation of macromolecules up to 50 kb [46].
Optimal band resolution in SDS-PAGE requires meticulous attention to both theoretical principles and practical execution. The discontinuous Laemmli system, while fundamentally sound, presents multiple potential failure points including voltage-induced heating, inappropriate gel composition, and buffer inconsistencies. Through systematic diagnosis and methodical optimization of electrophoretic conditions, researchers can overcome common artifacts like smearing and poor separation. The protocols presented herein provide a comprehensive framework for troubleshooting, while advanced alternative methodologies offer solutions for specialized applications. As protein analysis continues to evolve within drug development and biomedical research, mastery of these foundational techniques remains essential for generating reproducible, high-quality data.
Addressing Protein Aggregation and Artifacts in Reducing vs. Non-Reducing Gels
The Laemmli method for discontinuous gel electrophoresis, developed in 1970, remains the foundational technique for protein separation based on molecular weight [47] [17]. This system employs a stacking gel and a resolving gel with different pore sizes and pH levels to concentrate protein samples into sharp bands before separation, thereby enhancing resolution [48] [17]. Within this framework, the choice between reducing and non-reducing conditions represents a critical experimental decision that directly influences protein structure, migration patterns, and the potential for aggregation artifacts.
Understanding protein aggregation and electrophoretic artifacts is particularly crucial in drug development and biomedical research, where accurate characterization of protein therapeutics, biomarkers, and drug targets is essential. The presence of aggregates can affect activity, immunogenicity, and stability of biopharmaceuticals, while artifacts can lead to misinterpretation of experimental results. This guide provides an in-depth technical examination of these phenomena within the context of Laemmli electrophoresis, offering detailed methodologies for identification, troubleshooting, and resolution.
Fundamental Principles: Reducing vs. Non-Reducing SDS-PAGE
Core Mechanistic Differences
SDS-PAGE separates proteins primarily by molecular weight through the binding of sodium dodecyl sulfate (SDS), an anionic detergent that denatures proteins and confers a uniform negative charge [49] [17]. This process masks proteins' intrinsic charges, enabling separation based primarily on size as proteins migrate through the polyacrylamide gel matrix toward the anode [48]. The distinguishing feature between reducing and non-reducing systems is the inclusion or exclusion of reducing agents that break disulfide bonds.
- Reducing SDS-PAGE: Incorporates reducing agents such as β-mercaptoethanol or dithiothreitol (DTT) that break disulfide bonds, fully linearizing proteins and disrupting quaternary structures [6] [49]. This provides accurate molecular weight determination of individual polypeptide subunits.
- Non-Reducing SDS-PAGE: Excludes reducing agents, thereby preserving disulfide bonds and some aspects of tertiary and quaternary structure [6]. Proteins migrate based on both size and shape, with complexes linked by disulfide bonds remaining intact.
Figure 1: Decision pathway for protein denaturation in reducing versus non-reducing SDS-PAGE
Comparative Analysis of Gel Systems
Table 1: Characteristics of Reducing vs. Non-Reducing SDS-PAGE
| Parameter | Reducing SDS-PAGE | Non-Reducing SDS-PAGE | Native-PAGE |
|---|---|---|---|
| Reducing Agent | Present (β-mercaptoethanol or DTT) | Absent | Absent |
| Disulfide Bonds | Broken | Preserved | Preserved |
| Protein Structure | Fully denatured linear subunits | Partial denaturation, native disulfides intact | Native conformation maintained |
| Separation Basis | Molecular weight only | Molecular weight & shape | Size, charge, and shape |
| Migration Effects | Faster migration for subunits | Slower migration for complexes | Variable based on native charge |
| Applications | Subunit molecular weight determination, purity assessment | Studying disulfide-linked complexes, conformational epitopes | Native protein analysis, activity studies |
Protein Aggregation: Mechanisms and Experimental Implications
Origins of Aggregation in Sample Preparation
Protein aggregation represents a significant challenge in electrophoresis, manifesting as high-molecular-weight smears, poorly resolved bands, or material trapped in the well [17]. The second virial coefficient (SVC), which quantifies protein-protein interactions, provides a thermodynamic understanding of this phenomenon [50]. A negative SVC indicates net attractive interactions between protein molecules that promote aggregation, while a positive SVC reflects repulsive interactions that maintain protein solubility [50].
During sample preparation, several factors can induce aggregation:
- Insufficient or Improper Denaturant: Inadequate SDS concentration fails to fully denature proteins, exposing hydrophobic regions that promote aggregation [29] [17]. Most polypeptides bind SDS at a constant weight ratio of 1.4g SDS:1g polypeptide for proper denaturation [48].
- Incompatible Buffer Conditions: The presence of salts, ionic detergents, or other interfering substances can compete with SDS binding or shield protein charges [29] [17].
- Protein Concentration Effects: High protein concentrations increase molecular interactions, particularly during refolding or denaturation steps where aggregative intermediates may form [50]. This is especially problematic when refolding proteins from inclusion bodies.
- Improper Heating: Excessive heating can cause cleavage at specific sites (such as Asp-Pro bonds) or promote hydrophobic interactions [29], while insufficient heating fails to fully denature proteins.
Disulfide-Mediated Aggregation in Non-Reducing Conditions
In non-reducing systems, incorrectly formed or intermolecular disulfide bonds represent a major source of aggregation. Without reducing agents, sulfhydryl groups can form non-physiological disulfide linkages that crosslink proteins into high-molecular-weight aggregates [6]. This frequently occurs during sample preparation when proteins are denatured but not reduced, exposing reactive cysteine residues that would normally be buried in the native structure.
The migration patterns of these aggregates differ significantly between reducing and non-reducing conditions. Under non-reducing conditions, disulfide-linked aggregates appear as high-molecular-weight smears near the top of the gel, while under reducing conditions, these aggregates dissociate into their constituent subunits [6] [49]. This differential migration provides a diagnostic tool for identifying disulfide-mediated aggregation.
Common Artifacts and Contaminants in Gel Electrophoresis
Sample-Derived Artifacts
- Proteolytic Degradation: Endogenous proteases not fully inactivated during sample preparation can cause protein degradation, appearing as multiple lower molecular weight bands or smearing [29]. As little as 1pg of protease can cause significant degradation if samples are not heated immediately after addition to SDS buffer [29].
- Asp-Pro Bond Cleavage: Heating proteins at 95-100°C for extended periods can cleave acid-labile Asp-Pro bonds [29]. This artifact can be avoided by heating at 75°C for 5 minutes, which still effectively inactivates proteases [29].
- Keratin Contamination: Human skin and hair keratins frequently contaminate samples, appearing as bands at 55-65kDa on reducing gels [29]. This contamination is particularly problematic in silver-stained gels due to their high sensitivity [29].
Reagent and Handling Artifacts
- Urea Carbamylation: Urea solutions contain ammonium cyanate that can carbamylate lysine residues, adding 43Da per modification and creating charge heterogeneity [29]. This can be mitigated by using fresh urea, including scavengers like glycinamide, or adding ammonium salts to shift the equilibrium [29].
- Leachables from Plasticware: Chemicals like oleamide used in plastic manufacturing can leach into samples, potentially affecting protein migration [29]. Pre-rinsing plasticware with methanol or DMSO can remove these contaminants [29].
- Improper Buffer Composition: Incorrect pH, ionic strength, or SDS concentration in sample buffers leads to poor resolution, smiling bands, or incomplete separation [6] [17]. Tris-glycine running buffer should maintain pH 8.3-8.5 for proper stacking and separation [24].
Table 2: Troubleshooting Common Electrophoresis Artifacts
| Artifact | Appearance | Potential Causes | Solutions |
|---|---|---|---|
| Horizontal Smiling/Frowning Bands | Curved band pattern across gel | Uneven current distribution, excessive heating, improper buffer ionic strength | Ensure uniform buffer volume, reduce voltage, check buffer composition |
| Vertical Smiling | Curved bands within a single lane | Sample overload, salt contamination, protein aggregation | Reduce protein load, desalt samples, add urea or increasing SDS |
| Poor Resolution | Bands close together, incomplete separation | Incorrect gel percentage, insufficient run time, improper buffer pH | Match gel percentage to protein size, extend run time, verify buffer pH |
| High Background Staining | Overall gel staining with poor contrast | Incomplete destaining, contaminated reagents, insufficient washing | Extend destaining time, use fresh staining solutions, increase wash steps |
| Multiple Extra Bands | Unexplained bands in purified samples | Protease degradation, protein modifications, contaminating antigens | Use fresh protease inhibitors, heat samples immediately, check antibody specificity |
Experimental Protocols for Aggregation Analysis
Comparative Reducing/Non-Reducing Gel Analysis
Objective: To identify disulfide-mediated aggregation and complexes by comparing protein migration under reducing versus non-reducing conditions.
Materials:
- Protein sample (crude or purified)
- 2X Reducing Laemmli Sample Buffer (with β-mercaptoethanol or DTT)
- 2X Non-Reducing Laemmli Sample Buffer (without reducing agent)
- Pre-cast or hand-cast polyacrylamide gels
- Electrophoresis system with power supply
- Molecular weight markers
Procedure:
- Divide protein sample into two equal aliquots (typically 10-20μL each).
- Add an equal volume of 2X Reducing Laemmli Buffer to one aliquot and 2X Non-Reducing Laemmli Buffer to the other.
- Heat samples at 85°C for 2-5 minutes for denaturing gels [24]. Note: Do not heat samples for native electrophoresis.
- Briefly centrifuge samples (2 minutes at 17,000 x g) to pellet any insoluble material [29].
- Load equivalent protein amounts (typically 20-60μg for crude samples, 0.5-4μg for purified proteins with Coomassie staining) into adjacent but not adjoining wells [29] [24].
- Run gel at constant voltage (100-150V) until dye front reaches bottom.
- Stain with Coomassie Blue or transfer for western blotting.
Interpretation: Disulfide-linked complexes will appear as higher molecular weight bands under non-reducing conditions that disappear or are replaced by lower molecular weight subunits under reducing conditions [49]. True aggregates may persist under both conditions.
Sample Preparation Optimization Protocol
Objective: To minimize aggregation artifacts during sample preparation through proper denaturation and reduction.
Key Considerations:
- SDS Ratio: Maintain 3:1 ratio of SDS to protein for complete denaturation [29].
- Reducing Agent Freshness: Use fresh DTT or β-mercaptoethanol as they oxidize over time [6].
- Heating Conditions: Heat at 85°C for 2-5 minutes to balance denaturation with minimizing Asp-Pro cleavage [29] [24].
- Additives for Problematic Proteins: For membrane proteins or histones, add 6-8M urea or nonionic detergents like Triton X-100 to improve solubility [29].
- Viscosity Reduction: For viscous samples (e.g., crude extracts), treat with Benzonase Nuclease or briefly sonicate to degrade nucleic acids [29].
Figure 2: Optimal sample preparation workflow to minimize aggregation artifacts
The Scientist's Toolkit: Essential Reagents and Materials
Table 3: Research Reagent Solutions for Aggregation Studies
| Reagent/Material | Function | Application Notes |
|---|---|---|
| Dithiothreitol (DTT) | Reducing agent for disulfide bond breakage | More stable and less odorous than β-mercaptoethanol; use fresh solutions [6] [24] |
| β-Mercaptoethanol | Alternative reducing agent | Common reducing agent; strong odor; typically used at 2.5% final concentration [24] |
| L-Arginnine | Aggregation suppressor in refolding | Shifts second virial coefficient to positive values, suppressing aggregation [50] |
| Benzonase Nuclease | Nucleic acid degradation | Reduces sample viscosity from DNA/RNA without proteolytic activity [29] |
| Mixed-Bed Resin | Urea deionization | Removes cyanate contaminants from urea solutions to prevent protein carbamylation [29] |
| 4-20% Gradient Gels | Broad-range protein separation | Single gel capable of resolving proteins from 6-200kDa; no stacking gel required [48] [17] |
| Molecular Weight Markers | Size reference standards | Essential for molecular weight determination and tracking gel progression |
Advanced Technical Considerations
Buffer Additives for Aggregation Prevention
Several specialized additives can help prevent aggregation during sample preparation:
- L-Arginnine HCl (500mM): Shifts the second virial coefficient from negative to positive, creating repulsive interactions between partially folded protein molecules and significantly increasing refolding yields [50].
- Nonionic Detergents: Triton X-100 or NP-40 can help solubilize membrane proteins without interfering with SDS binding [29].
- Urea (6-8M): Supplemental urea can improve denaturation of difficult proteins but requires careful handling to prevent carbamylation artifacts [29].
- Mixed Disulfides: Formation of mixed disulfides prior to refolding increases protein solubility and suppresses aggregation without requiring L-arginine [50].
Methodological Recommendations for Drug Development Applications
For researchers in pharmaceutical and biotech settings, where reproducibility and regulatory compliance are essential:
- Standardize Heating Conditions: Implement consistent heating protocols (85°C for 2-5 minutes) rather than variable higher temperatures to minimize cleavage artifacts [29] [24].
- Avoid Reduced/Non-Reduced Sample Proximity: When running both reduced and non-reduced samples on the same gel, separate them to prevent reducing agent diffusion into non-reduced lanes [24].
- Implement Aggregation QC Assays: Include comparative reducing/non-reducing gels as part of quality control for protein therapeutics to monitor disulfide-mediated aggregation.
- Control Keratin Contamination: Establish dedicated areas for sample preparation, use filtered tips, and store sample buffers in aliquots to prevent keratin contamination that can interfere with sensitive detection methods [29].
Within the framework of Laemmli discontinuous gel electrophoresis, understanding and addressing protein aggregation and artifacts requires systematic approach to experimental design and sample preparation. The critical choice between reducing and non-reducing conditions enables researchers to distinguish between disulfide-linked complexes and true aggregates, while proper attention to heating conditions, buffer composition, and potential contaminants ensures accurate interpretation of electrophoretic results. As drug development increasingly relies on sophisticated protein characterization, these fundamental methodologies remain essential tools for ensuring data quality and reproducibility in biomedical research.
Optimizing Buffer Concentration (4X vs. 6X) for Limited Sample Volumes
In the context of Laemmli method development for discontinuous gel electrophoresis, sample preparation remains a fundamental yet often overlooked variable in experimental success. For researchers working with precious, volume-limited protein samples—such as those isolated from primary cell cultures, biopsies, or sophisticated purification protocols—the selection of an appropriate sample buffer concentration becomes paramount. The choice between standard 4X and concentrated 6X Laemmli buffer directly impacts protein loading efficiency, detection sensitivity, and ultimately, data reliability [6]. This technical guide examines the optimization of buffer concentration for limited sample scenarios, providing evidence-based methodologies to maximize data quality while conserving valuable biological material.
The Laemmli buffer system, foundational to SDS-PAGE, creates the physicochemical conditions necessary for protein denaturation, charge uniformity, and size-based separation [5]. While its components remain consistent across formulations, their final working concentration when mixed with protein samples determines the buffer's effectiveness. For limited sample volumes, concentrated buffer formulations enable researchers to maintain critical reagent concentrations while minimizing the dilution of precious protein samples, thereby preserving signal intensity in downstream detection applications like Western blotting [6] [51].
Technical Composition: Laemmli Buffer Components and Functions
Core Components and Their Roles in Electrophoresis
Laemmli buffer functions through the coordinated activity of five critical components, each serving a specific purpose in protein preparation and separation [5]:
- SDS (Sodium Dodecyl Sulfate): This anionic detergent denatures proteins by disrupting non-covalent bonds and imparts a uniform negative charge proportional to polypeptide length, enabling separation primarily by molecular weight rather than inherent charge [51] [5].
- Reducing Agent (β-mercaptoethanol or DTT): These thiol-containing compounds break covalent disulfide bonds that SDS cannot disrupt, effectively separating polypeptide chains and eliminating tertiary and quaternary structures [6] [5].
- Glycerol: This dense compound increases sample density, ensuring solutions sink properly into gel wells during loading and preventing diffusion into the running buffer [6] [5].
- Tris Buffer: Maintaining a stable pH of 6.8, Tris creates optimal conditions for protein stability and the stacking gel phenomenon essential for sharp band resolution [5] [14].
- Tracking Dye (Bromophenol Blue): This visible marker enables researchers to monitor sample migration during electrophoresis and prevents sample run-off by providing a visual front [6] [51].
Concentration Variants: Compositional Comparisons
The fundamental difference between 4X and 6X Laemmli buffers lies in their component concentrations, as detailed in Table 1. A 6X formulation contains 50% higher concentrations of all components compared to a 4X buffer when at their respective stock concentrations [6].
Table 1: Quantitative Comparison of 4X vs. 6X Laemmli Buffer Components
| Component | Function | 4X Concentration | 6X Concentration |
|---|---|---|---|
| Tris-HCl | pH stabilization (~6.8) | 0.25 M [14] | ~0.375 M (estimated*) |
| SDS | Protein denaturation & charge | 4-8% [14] | ~6-12% (estimated*) |
| Glycerol | Density agent | 20-40% [14] | ~30-60% (estimated*) |
| Reducing Agent | Disulfide bond reduction | 10-20% [14] | ~15-30% (estimated*) |
| Bromophenol Blue | Migration tracking | 0.02-0.04% [14] | ~0.03-0.06% (estimated*) |
*Note: Exact 6X concentrations not specified in search results; values estimated based on 50% increase from 4X concentrations.
Practical Implementation: Methodologies for Limited Sample Volumes
Sample Preparation Protocols for Volume-Limited Scenarios
When working with limited sample volumes, researchers should employ optimized protocols to maximize protein loading without compromising separation quality. The following methodology has been specifically adapted for precious samples:
Modified Sample Preparation Protocol:
- Determine protein concentration using compatible assays (BCA, Bradford, or Lowry) [51] [52].
- Calculate required volume to achieve desired protein mass (typically 10-50 μg per lane) [51].
- Select appropriate buffer concentration based on available sample volume:
- Denature proteins using appropriate heating conditions:
- Briefly centrifuge (10-15 seconds) to collect condensation before loading [53].
Buffer Selection Decision Framework
The workflow in the diagram below outlines a systematic approach for selecting optimal buffer concentration based on sample characteristics and research goals.
Comparative Analysis: 4X vs. 6X Buffer Performance
Quantitative Advantages in Volume-Limited Applications
The primary advantage of 6X Laemmli buffer becomes evident when examining the dilution factors required to achieve 1X working concentration. As illustrated in Table 2, 6X buffer allows researchers to dedicate a greater proportion of the final volume to the protein sample itself, significantly enhancing final protein concentration in the loaded sample.
Table 2: Buffer Dilution Factors and Final Sample Composition
| Parameter | 4X Laemmli Buffer | 6X Laemmli Buffer |
|---|---|---|
| Mixing Ratio | 1 volume buffer : 3 volumes sample [6] | 1 volume buffer : 5 volumes sample [6] |
| Final Dilution Factor | 4-fold | 6-fold |
| Sample Proportion in Final Mix | 75% | 83.3% |
| Recommended Use Case | Ample sample volume [6] | Limited sample volume or low protein concentration [6] |
| Maximum Protein Load Potential | Standard | Enhanced (due to less sample dilution) |
Experimental Considerations and Limitations
While 6X buffers offer clear advantages for volume-limited applications, researchers should consider several practical aspects:
- Viscosity Challenges: Higher glycerol concentrations in 6X formulations may increase viscosity, potentially affecting pipetting accuracy [6]. Using positive-displacement pipettes can mitigate this issue.
- SDS Precipitation: Concentrated SDS solutions may precipitate at lower temperatures [54] [55]. Gently warming buffers to room temperature and mixing thoroughly before use ensures complete dissolution.
- Reducing Agent Stability: Thiol-based reducing agents degrade over time, particularly in stored working solutions [6] [54]. For optimal results, add fresh β-mercaptoethanol or DTT immediately before use rather than storing prepared buffer with reducing agents [14] [55].
- Alternative Buffer Systems: For specific applications, alternative concentrated buffer systems like NuPAGE LDS Sample Buffer (4X) may offer advantages, including improved solubility of detergent components at neutral pH [55].
The Scientist's Toolkit: Essential Research Reagent Solutions
Successful implementation of optimized buffer strategies requires access to quality reagents and understanding their specific functions. Table 3 details essential research solutions for Laemmli-based protein electrophoresis.
Table 3: Essential Research Reagent Solutions for Protein Electrophoresis
| Reagent / Solution | Function | Application Notes |
|---|---|---|
| Laemmli Sample Buffer (4X/6X) | Protein denaturation, charge uniformity, and tracking | Choose reducing vs. non-reducing based on epitope requirements [6] |
| Protease Inhibitor Cocktails | Prevent protein degradation during lysis | Add fresh to lysis buffer; specific inhibitors target different protease classes [51] [52] |
| Phosphatase Inhibitors | Preserve phosphorylation states | Essential for phosphoprotein analysis; sodium fluoride for Ser/Thr phosphatases, orthovanadate for tyrosine phosphatases [51] [52] |
| RIPA Lysis Buffer | Effective solubilization of membrane proteins | Contains multiple detergents for challenging protein targets [51] [52] |
| NP-40/Triton X-100 Lysis Buffer | Milder extraction for soluble proteins | Ideal for cytoplasmic proteins and preserving protein complexes [51] [52] |
| BCA/Bradford Protein Assays | Quantitative protein concentration determination | BCA compatible with detergents; Bradford compatible with reducing agents [51] [52] |
Advanced Applications and Specialized Methodologies
Handling Challenging Protein Targets
Certain protein classes require specialized handling regardless of buffer concentration selection:
- Large Proteins (>150 kDa): These prone to aggregation at high temperatures. Modified denaturation at 70°C for 5-10 minutes improves solubility and gel entry [53].
- Phosphorylated Proteins: Heat sensitivity may damage phosphorylation epitopes. For these targets, consider room temperature incubation for 15-30 minutes instead of heating [53].
- Membrane Proteins: Difficult to solubilize targets may benefit from alternative detergents or hybrid detergent systems, which have shown promise in increasing unique protein identifications in proteomic studies [56].
Troubleshooting Common Issues in Volume-Limited Applications
Even with optimized buffer concentrations, researchers may encounter specific challenges:
- Smearing or Streaking: Often caused by incomplete denaturation, excessive salt, or protein degradation. Ensure proper heating conditions, desalt samples if necessary, and use fresh protease inhibitors [6].
- Poor Band Separation: May result from incorrect pH, outdated SDS, or insufficient reducing agent. Check buffer pH, prepare fresh reagents, and verify reducing agent activity [6].
- Weak Signal Intensity: In volume-limited applications, this frequently stems from insufficient protein loading. Concentrate samples prior to buffer addition or utilize 6X buffer to maximize protein load [6] [51].
The strategic selection between 4X and 6X Laemmli buffer concentrations represents a critical methodological consideration for researchers working with volume-limited protein samples. Through understanding the quantitative relationships between buffer concentration, dilution factors, and final protein loading capacity, scientists can significantly enhance detection sensitivity without modifying core experimental designs. The 6X buffer formulation offers distinct advantages in scenarios where sample conservation is paramount, enabling researchers to dedicate over 83% of the final loaded volume to their precious protein sample while maintaining essential denaturing conditions. As protein electrophoresis continues to evolve within biological research and drug development, these optimization strategies ensure that limited sample availability need not compromise data quality or experimental outcomes.
In the context of broader research on the Laemmli method for discontinuous gel electrophoresis, the integrity of experimental data is fundamentally dependent on the quality and freshness of reagents. The Laemmli SDS-PAGE technique, developed by Ulrich K. Laemmli in 1970, remains a cornerstone methodology in molecular biology and biochemistry for separating proteins based on molecular weight [1] [9]. This technique's reproducibility and resolution, however, are exceptionally vulnerable to reagent degradation and improper formulation. This technical guide provides an in-depth examination of the critical considerations for maintaining the three most stability-sensitive components of the Laemmli buffer system: Sodium Dodecyl Sulfate (SDS), reducing agents, and the Tris-based buffer at its specified pH. For researchers and drug development professionals, systematic management of these reagents is not merely a procedural formality but a crucial practice ensuring the accuracy of protein analysis across diverse applications from structural biology to quality control in food bioscience [47].
The Laemmli Buffer System: Composition and Function
The Laemmli buffer is a multi-component system where each reagent serves a specific, critical function in preparing protein samples for electrophoresis. Understanding the role of each component is a prerequisite for diagnosing issues related to their degradation.
Core Components and Their Roles
Table 1: The Five Critical Components of Laemmli Buffer and Their Functions
| Component | Primary Function | Concentration in Standard Recipes |
|---|---|---|
| SDS (Sodium Dodecyl Sulfate) | Denatures proteins and imparts a uniform negative charge [5]. | 2-8% (w/v) [5] [57] [58] |
| Reducing Agent (e.g., DTT, BME) | Breaks disulfide bonds to fully denature proteins [5]. | DTT: 200 mM; BME: 4-6% (v/v) [57] [58] |
| Glycerol | Increases density for easy gel loading [5]. | 10-40% (v/v) [5] [57] [58] |
| Tris-HCl Buffer | Maintains stable pH (6.8) for optimal stacking [5]. | 62.5-250 mM [5] [57] [58] |
| Tracking Dye (Bromophenol Blue) | Visualizes sample migration during electrophoresis [5]. | 0.05-0.1% (w/v) [5] [57] [58] |
The system operates on a discontinuous buffer principle. The stacking gel, running buffer, and sample buffer work in concert to concentrate proteins into a sharp band before they enter the resolving gel, a process that is highly sensitive to the pH and ionic composition of the buffers [5] [1]. Any deviation in the sample buffer's composition can disrupt this delicate electrochemical process, leading to poor resolution and band smearing.
Reagent-Specific Stability Concerns and Management
Sodium Dodecyl Sulfate (SDS)
SDS is an anionic detergent that binds to proteins at a relatively constant ratio, coating them in negative charge and linearizing them for separation strictly by size [5]. The primary risk to SDS integrity is recrystallization at low temperatures. While this does not typically degrade the chemical, it renders the buffer unusable until the SDS is fully and uniformly redissolved.
Storage and Handling:
- Storage Condition: Store at room temperature (15-25°C). Suppliers explicitly note that the product can solidify when cold and must be warmed to redissolve all components completely [57].
- Precipitation Recovery: If precipitation occurs, warm the buffer to approximately 25-37°C and mix thoroughly until the solution is completely clear and homogeneous. Brief sonication in a warm water bath can assist in redissolving crystals.
- Solution Preparation: For lab-made buffers, 20% SDS stock solutions in water are standard and stable for years at room temperature. Avoid refrigerating these stocks.
Reducing Agents
Reducing agents are the most labile components of Laemmli buffer. Their oxidation over time renders them incapable of breaking disulfide bonds, leading to incomplete protein denaturation, aberrant migration, and the persistence of protein complexes.
Table 2: Comparison of Common Reducing Agents
| Agent | Standard Concentration | Stability & Handling | Key Considerations |
|---|---|---|---|
| β-Mercaptoethanol (BME) | 4-6% (v/v) [57] | More stable; included in commercial buffers stored at >25°C [57]. | Has a strong, unpleasant odor. Can be stored as part of a 4X buffer for at least a year at 4°C [5]. |
| Dithiothreitol (DTT) | 100-200 mM [58] | Less stable; requires replenishment in lab-made buffers [5]. | Preferred for its lower odor. Commercial buffers with DTT are stored at -20°C and are stable for one year [58]. |
Storage and Handling:
- Aliquoting: Aliquot reducing agent stocks and prepared buffers to minimize freeze-thaw cycles and exposure to oxygen.
- Buffer Preparation: For lab-made buffers intended for long-term storage, it is often advisable to omit the reducing agent and add it fresh just before use. Commercial suppliers ship reducing buffers on ice and recommend storage at -20°C for long-term stability [58].
- Usage: Add reducing agent to the sample buffer immediately prior to heating and loading the sample to ensure maximum efficacy [24]. Avoid storing reduced samples, as reoxidation can occur even in frozen conditions [24].
Tris Buffer and pH
The Tris-HCl buffer in Laemmli sample buffer is critical for maintaining a pH of 6.8 ± 0.2 [57]. This specific pH is essential for the proper function of the discontinuous gel system, as it matches the stacking gel pH and ensures glycine exists in the correct charge state for effective protein stacking [5]. A shift in pH can destroy the stacking effect, resulting in diffuse bands and loss of resolution.
Storage and Handling:
- Stability: Tris itself is highly stable. However, the pH of the prepared buffer can be affected by absorption of atmospheric CO₂, which can acidify the solution over time.
- Quality Control: The pH of commercial buffers is rigorously tested (e.g., pH 6.80 ± 0.20 for 1X buffer [57]). For lab-made buffers, the pH should be verified with a calibrated pH meter after preparation and periodically during long-term storage.
- Storage: Store buffers in sealed containers to minimize gas exchange.
Glycerol and Tracking Dye
- Glycerol (10-40% v/v): This component is chemically stable and requires no special handling outside of protecting it from excessive evaporation by keeping containers sealed.
- Bromophenol Blue (0.01-0.1% w/v): The dye is also stable. A change in its color from blue to green or yellow can indicate a significant shift in pH, serving as a useful visual indicator of potential buffer issues.
Quantitative Stability Data and Storage Guidelines
Synthesizing data from commercial suppliers and technical literature provides clear guidelines for reagent shelf life.
Table 3: Summary of Stability and Storage Conditions for Laemmli Buffer Components
| Component / Formulation | Recommended Storage | Documented Shelf Life | Key Stability Indicators |
|---|---|---|---|
| 4X Laemmli Buffer (with BME) | > 25°C (Room Temp) [57] | >1 year at 4°C [5] | Solidification at low temp; reversible by warming [57]. |
| 2X Laemmli Buffer (with DTT) | -20°C [58] | 1 year at -20°C [58] | Presence of precipitate; requires complete dissolution before use [58]. |
| SDS (20% Stock Solution) | Room Temperature | >1 year | Crystal formation; re-dissolve with warming. |
| DTT (Solid or Stock) | -20°C (desiccated) | 1+ years (solid) | Oxidation; liquid stocks turn yellow and develop a foul odor. |
| Tris Buffer (1M Stock, pH 6.8) | Room Temperature | >1 year | pH drift; verify with pH meter. |
Experimental Protocols for Quality Control
Implementing simple QC protocols allows researchers to proactively verify reagent functionality.
Visual Inspection and pH Verification
- Inspection: Examine the buffer for any precipitate or discoloration. A yellow tint may indicate oxidation or pH shift.
- Redissolving: If crystals are present (SDS precipitation), warm the buffer to 25-37°C and vortex until completely clear.
- pH Check: For lab-made buffers, measure the pH of a diluted (1X) sample. The acceptable range is pH 6.6 - 7.0. A color change of the bromophenol blue from blue to green is a visual cue of acidification.
Functional Test with Control Proteins
The most reliable method to test buffer freshness is to run a known protein standard.
- Sample Preparation:
- Dilute a well-characterized control protein (e.g., BSA or a commercial protein ladder) in the suspect buffer and a fresh buffer (positive control).
- Add reducing agent if not present.
- Heat the samples at 85°C for 2-5 minutes [24].
- Electrophoresis:
- Load equal amounts of each sample on an SDS-PAGE gel.
- Run using a standard Tris-Glycine SDS running buffer (pH ~8.3) at 125V constant [24].
- Analysis:
- Sharpness of Bands: Compare the sharpness and resolution of the bands.
- Presence of Oligomers: In the test sample, high molecular weight smears or oligomers indicate ineffective reduction.
- Dye Front: A crisp, straight dye front suggests proper buffer function, while a wavy or distorted front can indicate buffer or salt issues.
The Scientist's Toolkit: Research Reagent Solutions
Table 4: Essential Materials for Laemmli SDS-PAGE Experiments
| Item | Function / Description | Example Supplier & Catalog Number |
|---|---|---|
| Laemmli SDS-Sample Buffer (4X, Reducing) | Ready-to-use buffer for protein denaturation. Contains SDS, Tris, Glycerol, Bromophenol Blue, and BME [57]. | Boston BioProducts (BP-110R) [57] |
| SDS-PAGE Protein Loading Buffer (2X, Reducing) | A ready-to-use 2X solution with DTT as the reducing agent. Requires storage at -20°C [58]. | Boster Bio (AR0131-20) [58] |
| NuPAGE Reducing Agent (10X) | A stabilized, ready-to-use liquid DTT solution (500 mM) for adding fresh reducing agent to samples [24]. | Thermo Fisher Scientific [24] |
| Tris-Glycine SDS Running Buffer (10X) | The concentrated running buffer for the Laemmli system, diluted to 1X before use [24]. | Thermo Fisher Scientific [24] |
| Pre-Cast Tris-Glycine Gels | Polyacrylamide gels cast in a stable format, based on the Laemmli system with minor modifications. Stored at 4°C [24]. | Thermo Fisher Scientific (Novex) [24] |
| Protein Molecular Weight Marker | A mixture of pre-stained or unstained proteins of known molecular weight for calibrating gels and monitoring electrophoresis progress. | Various Suppliers |
The reliability of data generated via the Laemmli SDS-PAGE method is inextricably linked to the freshness and proper management of key reagents. SDS, reducing agents, and Tris buffer each present unique stability challenges that, if unaddressed, can compromise experimental outcomes. By integrating the storage guidelines, quantitative stability data, and quality control protocols outlined in this guide, researchers can establish a robust framework for reagent management. This proactive approach ensures the generation of high-resolution, reproducible protein separation data, thereby upholding the integrity of scientific research and drug development processes that depend on this foundational technique.
Solving Problems with Weak Signal, High Background, and Sample Diffusion
Within the framework of thesis research on the Laemmli method for discontinuous gel electrophoresis, a primary challenge is the interpretation of gels compromised by technical artifacts. These issues—weak or absent signals, high background staining, and sample diffusion—can obfuscate results and derail scientific progress. This technical guide provides researchers and drug development professionals with a targeted, evidence-based approach to diagnosing and resolving these common problems, ensuring the generation of high-quality, reproducible data essential for rigorous scientific inquiry.
Troubleshooting Core SDS-PAGE Issues
A systematic approach to troubleshooting is critical. The table below outlines the primary symptoms, their root causes, and validated solutions.
Table 1: Troubleshooting Guide for Common SDS-PAGE Problems
| Problem & Symptom | Primary Cause | Recommended Solution | Supporting Experimental Protocol |
|---|---|---|---|
| Weak or No Signal [59] | Insufficient protein loaded. | Load a known amount of a purified protein control. Increase total protein load; a good starting point is 10 µg per well [60]. | Prepare sample with standard Laemmli buffer, denature at 95°C for 5 min [61] [62]. |
| Protein aggregation/precipitation in the well. | Add reducing agents (DTT or β-mercaptoethanol) to lysis buffer. Heat lysate. For hydrophobic proteins, add 4-8M urea to the lysate [60]. | ||
| High Background [59] | Incomplete removal of SDS from the gel. | Increase number and volume of washes with ultrapure water before staining. Pre-fix gel in 25% isopropanol/10% acetic acid or 12% trichloroacetic acid. | For Coomassie staining, destain with 5% methanol/10% acetic acid [61] or 25% methanol until background clears [59]. |
| Gel overdeveloped (Silver stain). | Reduce development time. Use fresh developer solution. Stop development with fresh 5% acetic acid, replacing it twice in the first minutes [59]. | ||
| Sample Diffusion & Leaking [60] | Insufficient glycerol in loading buffer. | Check and increase glycerol concentration in the 2X SDS sample buffer to standard 25% (v/v) to increase sample density [60] [61]. | Standard Laemmli sample buffer: 62.5 mM Tris-HCl (pH 6.8), 2% SDS, 25% glycerol, 0.01% bromophenol blue, 5% β-mercaptoethanol [61]. |
| Air bubbles in wells or overfilling. | Rinse wells with running buffer to dislodge bubbles before loading. Do not load a well beyond 3/4 of its capacity. Load all wells with an equal volume [60]. | ||
| Poor visualization of transparent wells. | Implement a colored stacking gel by adding an acidic dye (e.g., tartrazine) to the stacking gel solution during casting [63]. | Add an acidic dye to the stacking gel solution during gel polymerization. Performance is comparable to non-colored gels [63]. |
Advanced Visualization and Workflow
The following decision tree provides a logical workflow for diagnosing and acting upon the issues outlined in Table 1.
Experimental Protocols for Key Solutions
Protocol: Quantitative Analysis via SDS-PAGE and Densitometry
This protocol, adapted from validated methodologies, allows for the transition from qualitative to quantitative analysis [61] [62].
- Sample Preparation: Dilute purified protein standard (e.g., BSA) to create a calibration series (e.g., 5-50 µg/spot). Prepare unknown samples in the same buffer. Mix samples with an equal volume of 2X SDS sample buffer containing β-mercaptoethanol [61].
- Denaturation: Heat samples at 95°C for 5 minutes [61] [62].
- Gel Electrophoresis: Load samples and a broad-range protein standard onto a polyacrylamide gel (e.g., 13% resolving gel). Run at constant current (20 mA) and voltage (200 V) for 30-40 minutes, or until the dye front reaches the bottom [61].
- Staining and Destaining: Stain gel with Coomassie Blue solution (0.25% Coomassie, 50% methanol, 10% acetic acid) for at least 1 hour. Destain with a solution of 5% methanol and 10% acetic acid with gentle agitation, changing the solution until the background is clear and bands are sharp [61] [59].
- Imaging and Analysis: Capture a high-resolution, uniformly lit image of the gel. Process the image using densitometry software (e.g., Chrom & Spec, Image Lab) to convert band intensity into peak areas. Generate a calibration curve from the standard series and use it to quantify protein in unknown samples [62].
Protocol: Mitigating Sample Leakage with a Colored Stacking Gel
This simple modification significantly improves loading accuracy [63].
- Prepare Stacking Gel Solution: Follow a standard Laemmli stacking gel recipe (e.g., 5% acrylamide).
- Add Acidic Dye: Introduce a safe, non-interfering acidic dye such as tartrazine, brilliant blue FCF, or new coccine directly into the stacking gel solution prior to casting. The concentration should be sufficient for clear visibility.
- Cast the Gel: Pour the colored stacking gel solution onto the polymerized resolving gel and insert the comb. Allow it to polymerize completely.
- Load and Run: The colored wells will be clearly visible, facilitating smooth sample loading and preventing air bubble-related leaks. The performance is comparable to standard transparent gels [63].
The Scientist's Toolkit: Essential Research Reagents
The following table details key reagents and their critical functions in ensuring successful and reproducible SDS-PAGE experiments.
Table 2: Essential Reagents for SDS-PAGE Troubleshooting
| Reagent | Function | Technical Notes |
|---|---|---|
| Dithiothreitol (DTT) / β-mercaptoethanol | Reducing agent that breaks disulfide bonds, preventing protein aggregation and ensuring linearization. | Added to Laemmli sample buffer; critical for complete denaturation [60] [61]. |
| Glycerol | Increases density of sample solution, ensuring it sinks properly to the bottom of the well and prevents leakage. | Standard component of 2X loading buffer at ~25% (v/v) [60] [61]. |
| Acidic Dyes (Tartrazine) | Visual aid added to the stacking gel for clear well demarcation, enabling precise sample loading. | Does not interfere with electrophoresis performance or downstream analysis [63]. |
| Urea | Chaotropic agent that disrupts hydrophobic interactions, solubilizing aggregated or hydrophobic proteins. | Use at 4-8M concentration in lysis buffer for challenging samples [60]. |
| Coomassie Brilliant Blue R-250 | A standard protein stain that binds non-specifically to proteins, allowing visualization after destaining. | Requires a destaining solution (MeOH/Acetic acid) to remove unbound dye and reduce background [61] [59] [62]. |
| Trichloroacetic Acid (TCA) / Isopropanol | Fixative solution that precipitates and immobilizes proteins in the gel prior to staining, reducing background. | Pre-fixing is a critical step for colloidal Coomassie protocols to remove SDS [59]. |
Validation Strategies and Comparative Analysis with Alternative Methods
Abstract Within the framework of Laemmli's discontinuous SDS-PAGE research, the validation of protein separation is a critical step for ensuring data accuracy and reproducibility. This in-depth technical guide explores the indispensable role of molecular weight markers in this process. We provide a detailed examination of marker classes, structured quantitative data for selection, step-by-step experimental protocols for integration and analysis, and advanced troubleshooting methodologies. This whitepaper is designed to equip researchers and drug development professionals with the knowledge to rigorously validate their electrophoretic separations, thereby reinforcing the reliability of downstream analyses in western blotting and mass spectrometry.
1 Introduction
The development of Sodium Dodecyl Sulfate-Polyacrylamide Gel Electrophoresis (SDS-PAGE) by Ulrich Laemmli in 1970 revolutionized the field of protein science by providing a reliable method to separate polypeptides based on their molecular weight [1]. The Laemmli method employs a discontinuous buffer system that stacks proteins into sharp bands before they enter the resolving gel, leading to high-resolution separation [64] [1]. The integrity of this separation, however, must be empirically validated for each experiment. It is in this context that molecular weight markers (also known as protein ladders or standards) serve as an critical experimental control. These complexes of pre-stained or un-stained proteins of known molecular weights are essential for calibrating the gel, estimating the molecular weight of unknown proteins, confirming the efficiency of protein transfer in western blotting, and monitoring the progress of the electrophoretic run [65]. This guide details the pivotal role of these markers within the Laemmli system, providing a foundational resource for robust protein analysis.
2 The Fundamentals of Molecular Weight Markers in SDS-PAGE
2.1 Core Principle and Function
In SDS-PAGE, the detergent SDS binds to and denatures proteins, imparting a uniform negative charge that allows separation to be based primarily on polypeptide chain length within the porous polyacrylamide matrix [64]. Molecular weight markers are a mixture of purified proteins that have been pre-characterized with defined molecular masses. When run alongside experimental samples, they create a standard curve that relates the migration distance of a protein to its molecular weight. This curve is fundamental for validating that the separation has occurred as expected and for identifying proteins of interest. The most common method for visualizing these markers, along with separated proteins, is through staining with dyes like Coomassie Blue or Silver Stain, each offering different levels of sensitivity [66].
2.2 Classes of Molecular Weight Markers
Choosing the appropriate class of marker is vital for experimental success. The selection is primarily dictated by the downstream application.
Table 1: Classes of Molecular Weight Markers and Their Applications
| Marker Class | Description | Primary Applications | Key Considerations |
|---|---|---|---|
| Unstained Markers | Native proteins without conjugated dyes. | • General protein separation.• Mass spectrometry analysis.• Protein quantification via densitometry. | • Require post-electrophoresis staining for visualization.• Provide highest accuracy for molecular weight determination. |
| Pre-stained Markers | Proteins covalently linked to fluorescent or colored dyes. | • Real-time monitoring of electrophoresis.• Verifying protein transfer efficiency in western blotting.• Approximating protein migration. | • Dye conjugation can alter protein mobility, reducing MW accuracy.• Essential for standardizing western blot transfer. |
| Pre-stained, Broad-Range Markers | Pre-stained markers covering a wide molecular weight spectrum. | • Experiments where target protein size is unknown.• Western blotting for diverse protein targets. | • Offer a balance of convenience and broad applicability.• Mobility may still be shifted compared to unstained standards. |
The following workflow diagram illustrates the decision process for selecting and using molecular weight markers in a typical SDS-PAGE and western blot experiment:
Diagram 1: Workflow for Molecular Weight Marker Selection and Use.
3 Experimental Protocol: Integration and Analysis
This section provides a detailed methodology for the incorporation of molecular weight markers into a standard SDS-PAGE protocol based on the Laemmli system.
3.1 Materials and Reagents
The "Scientist's Toolkit" for this protocol includes several key reagent solutions:
Table 2: Research Reagent Solutions for SDS-PAGE with Molecular Weight Markers
| Reagent/Solution | Function | Key Components | Example Commercial Kits |
|---|---|---|---|
| Laemmli Sample Buffer | Denatures proteins and confers negative charge. | • SDS• Tris-HCl• Glycerol• Bromophenol Blue• DTT or β-mercaptoethanol (reducing agent) [64] | |
| Running Buffer | Provides ions to carry current and maintains pH. | • Tris base• Glycine• SDS [64] [67] | |
| Molecular Weight Markers | Provides size standards for calibration. | • Purified proteins of known mass (e.g., 10-250 kDa range).• May contain dye conjugates (pre-stained). | • Precision Plus Protein Standards [67] |
| Polyacrylamide Gel | Sieving matrix for separation. | • Acrylamide/Bis-acrylamide.• Tris-HCl (pH 8.8 for resolving gel).• APS and TEMED (polymerization catalysts). | • Mini-PROTEAN TGX Precast Gels [65] |
| Staining Solution | Visualizes separated proteins. | • Coomassie Blue G-250/R-250 [66]• Silver nitrate [66]• Fluorescent dyes (e.g., SYPRO Ruby) | • SimplyBlue SafeStain [66]• Pierce Silver Stain Kit [66] |
3.2 Step-by-Step Procedure
- Gel Preparation: Prepare a discontinuous polyacrylamide gel consisting of a stacking gel (typically 4-5% acrylamide) and a resolving gel (typically 8-16% acrylamide, depending on the target protein size) [64]. Precast commercial gels, such as TGX gels, offer excellent reproducibility and convenience [65].
- Sample and Marker Preparation: Dilute the molecular weight marker and your protein samples according to the manufacturer's instructions. Mix the protein samples and marker with an equal volume of 2x Laemmli sample buffer. For reduced samples, the buffer should contain DTT or β-mercaptoethanol to break disulfide bonds [64]. Heat the mixtures at 95-100°C for 3-5 minutes to fully denature the proteins.
- Loading and Electrophoresis: Carefully load the denatured samples and prepared marker into separate wells of the stacking gel. A pre-stained marker can be loaded in a well flanking the samples for visual tracking. Assemble the electrophoresis apparatus and fill the chambers with running buffer. Run the gel at a constant voltage (e.g., 80-120V for mini-gels) until the dye front (bromophenol blue) migrates to the bottom of the gel [64] [67].
- Visualization: Upon completion, proceed with visualization.
- For unstained markers, the gel must be stained. Transfer the gel to a container with an appropriate protein stain (e.g., Coomassie Blue, Silver Stain, or a fluorescent stain) and follow the specific protocol for that stain [66]. For example, SimplyBlue SafeStain can detect as little as 5-7 ng of protein and is compatible with mass spectrometry [66].
- For pre-stained markers, the colored or fluorescent bands will be visible in the gel during and after the run. These can be directly visualized under white light or an appropriate laser scanner.
3.3 Data Analysis and Standard Curve Generation
- Measure Migration Distance: After visualization, measure the migration distance of each band in the molecular weight marker from the top of the resolving gel to the center of the band.
- Plot Standard Curve: Plot the logarithm of the molecular weight (Log10MW) of each marker protein against its migration distance (in cm or Rf value). The result should be a linear regression curve, typically with smaller proteins migrating farther.
- Estimate Unknown Molecular Weights: Measure the migration distance of unknown protein bands from your samples. Use the standard curve equation to calculate their apparent molecular weights.
4 Advanced Applications and Troubleshooting
4.1 The Role of Markers in Western Blotting
In western blotting, pre-stained markers are indispensable. They allow researchers to track the progress of electrophoresis in real-time and, most importantly, confirm that proteins have been efficiently transferred from the gel to the membrane. After transfer, the marker bands should be clearly visible on the membrane, providing a spatial reference for the location of target proteins and verifying that the transfer was uniform and complete [65]. Newer technologies, such as the Stain Free method, which uses trihalo compounds and UV light to visualize proteins in gels, can also be used to assess total protein before transfer, but molecular weight markers remain the gold standard for size calibration [65].
4.2 Troubleshooting Common Issues
Even with a robust method like Laemmli SDS-PAGE, issues can arise. Molecular weight markers are the first line of defense in diagnosing these problems.
Table 3: Troubleshooting Guide with Molecular Weight Markers
| Observation | Potential Cause | Solution |
|---|---|---|
| Smearing or distorted bands in marker and samples | Improper gel polymerization; excessive heat during run; protein degradation. | Ensure fresh APS and TEMED are used; use a cooling system during electrophoresis [67]; check sample integrity. |
| Unexpected molecular weight estimate for target protein | Post-translational modifications (e.g., glycosylation, phosphorylation); irregular marker migration. | Be aware that modifications alter mobility. Use a different gel percentage or buffer system for better resolution [67]. |
| Poor transfer of high molecular weight proteins in western blot | Incomplete transfer from gel to membrane. | Extend transfer time; use a different transfer buffer; consider using a pre-stained marker to optimize and confirm transfer conditions. |
| Horizontal banding ("smiling effect") | Uneven heating across the gel. | Use a powerful cooling plate to ensure even temperature distribution during electrophoresis [67]. |
| Marker bands are faint or absent | Insensitive stain; expired or improperly stored markers; insufficient loading. | Use a more sensitive stain (e.g., switch from Coomassie to Silver Stain [66]); check marker expiration date; increase the amount of marker loaded. |
5 Conclusion
Molecular weight markers are far more than a simple convenience in SDS-PAGE; they are a fundamental component of the Laemmli method that enables rigorous validation of protein separation. From providing a quantitative standard curve for molecular weight determination to serving as a critical diagnostic tool in western blotting, their proper selection and use underpin the generation of reliable and interpretable data. As electrophoretic techniques continue to evolve with innovations such as improved horizontal systems with double-deck electrodes [67] and more sensitive staining methods [66], the role of these essential standards will remain constant: to provide the certainty and confidence required in modern protein research and drug development.
Comparing Laemmli Buffer with Alternative Formulations (e.g., Morris Buffer, Phosphate Modifications)
In the context of proteomic research and biopharmaceutical development, the Laemmli method for discontinuous gel electrophoresis represents a foundational technique for protein separation. Central to this method is the sample buffer, a critical reagent that prepares protein analytes for electrophoretic separation by establishing the requisite physicochemical conditions. The Laemmli buffer, named after Professor Ulrich K. Laemmli who refined the SDS-PAGE procedure in the 1970s, remains the most widely adopted formulation for denaturing protein samples [5]. This technical guide examines the standard Laemmli buffer in comparison with alternative formulations, specifically the Morris buffer and phosphate-modified buffers, providing researchers with a scientific basis for selecting appropriate sample preparation protocols for their specific applications. Understanding the nuances between these formulations is essential for optimizing protein separation, particularly when working with sensitive samples or when pursuing specific research outcomes in drug development.
The discontinuous buffer system pioneered by Laemmli employs differences in pH and gel composition to stack proteins into sharp bands before they enter the resolving gel, thereby enhancing separation resolution [68]. The sample buffer works in concert with this system by denaturing proteins, imparting a uniform charge, and maintaining reduced states for accurate molecular weight determination. While the Laemmli formulation has demonstrated remarkable longevity in laboratory practice, specific research applications have prompted modifications to its standard composition, leading to alternative buffers that address particular limitations. This whitepaper provides an in-depth comparison of these formulations, presenting both quantitative composition data and experimental protocols to guide researchers in selecting and implementing the most appropriate sample buffer for their electrophoretic needs.
Composition and Function of Standard Laemmli Buffer
The standard Laemmli buffer represents a precisely balanced chemical system designed to prepare protein samples for optimal separation in SDS-PAGE. Each component serves specific biochemical functions that collectively ensure proteins migrate primarily according to molecular weight rather than inherent charge or structural characteristics.
Core Components and Their Biochemical Functions
Tris (tris-hydroxymethyl-aminomethane): The buffer system utilizes Tris at a concentration of 0.0625 M in 1X formulation, adjusted to pH 6.8 [14]. This pH is strategically selected as it falls below the buffering capacity of Tris (typically pH 7-9) but serves critical functions. The slightly acidic pH helps minimize hydrolysis of peptide bonds while maintaining the effectiveness of thiol reducing agents [14] [5]. In the broader context of discontinuous electrophoresis, the pH 6.8 of the sample buffer matches that of the stacking gel, facilitating the stacking phenomenon where proteins are concentrated between chloride ions (from Tris-HCl in the gel) and glycine zwitterions (from the running buffer) [68].
SDS (Sodium Dodecyl Sulfate): This anionic detergent, typically at 2% (0.07 M) in 1X buffer, performs dual critical functions [14]. First, it denatures proteins by disrupting non-covalent bonds, effectively linearizing polypeptide chains and destabilizing secondary, tertiary, and quaternary structures [5]. Second, it imparts a uniform negative charge to all proteins by binding to polypeptide backbones in a constant weight ratio (approximately 1.4g SDS per 1g protein) [5] [48]. This charge uniformity ensures that proteins migrate toward the anode during electrophoresis with mobility determined primarily by molecular size rather than intrinsic charge properties.
Reducing Agent (Beta-mercaptoethanol or DTT): The standard formulation includes 5% beta-mercaptoethanol, though dithiothreitol (DTT) may be substituted at concentrations typically ranging from 100-500 mM [14] [69]. These thiol-containing compounds break disulfide bonds that covalently stabilize protein quaternary structures and tertiary folds [5]. By reducing cysteine residues, these agents ensure complete protein denaturation into individual polypeptides, enabling accurate molecular weight determination. Beta-mercaptoethanol must be handled with care due to its toxicity and irritating properties, preferably in a fume hood [14].
Glycerol: At 10% concentration in 1X buffer, glycerol increases the density of the sample solution [14]. This elevated density ensures that samples sink to the bottom of loading wells rather than diffusing into the running buffer when loaded onto the gel [5]. The density of glycerol (1.26 g/cm³) makes it particularly effective for this purpose, though its viscosity can present pipetting challenges that may be addressed by mass-based measurement rather than volumetric [5].
Bromophenol Blue: This tracking dye provides visual monitoring of sample migration during electrophoresis [14]. The small molecular weight dye migrates ahead of most proteins through the gel matrix, forming a visible "dye front" that indicates electrophoresis progress and helps researchers determine when to terminate the run before proteins migrate off the gel [5] [68].
Table 1: Standard Composition of Laemmli Buffer at Different Concentrations
| Reagent | Molecular Weight | 1X Concentration | 2X Concentration | 4X Concentration |
|---|---|---|---|---|
| Tris base | 121.14 g/mol | 0.0625 M | 0.125 M | 0.250 M |
| SDS | 288.37 g/mol | 2% (0.07 M) | 4% (0.14 M) | 8% (0.28 M) |
| Glycerol | 92.09 g/mol | 10% | 20% | 40% |
| Beta-mercaptoethanol | 78.13 g/mol | 5% | 10% | 20% |
| Bromophenol blue | 691.94 g/mol | 0.02% | 0.04% | 0.08% |
Standard Preparation Protocol
The preparation of Laemmli buffer requires careful attention to component addition order and safety precautions, particularly when handling hazardous chemicals like beta-mercaptoethanol and SDS powder [14].
Tris Solution Preparation: Dissolve the appropriate amount of Tris base (0.747g for 50ml of 2X buffer) in approximately 10ml of deionized water using a magnetic stirrer [14].
pH Adjustment: Carefully adjust the pH to 6.8 using concentrated HCl. This step should be performed in a fume hood to avoid exposure to HCl fumes, with care taken not to overshoot the target pH [14].
Glycerol Addition: Add the required volume of glycerol (10ml for 50ml of 2X buffer) to the Tris solution and mix thoroughly [14].
SDS and Dye Addition: Add the measured amounts of SDS (2g for 50ml of 2X buffer) and bromophenol blue (100mg for 50ml of 2X buffer). Stir until completely dissolved, which may require extended mixing time due to the slow dissolution of SDS [14].
Reducing Agent Addition: Two approaches exist for adding beta-mercaptoethanol:
- Option 1: Add the reducing agent (5ml for 50ml of 2X buffer) and adjust the final volume to 50ml with deionized water. Aliquot and store at -20°C [14].
- Option 2: Adjust the volume to approximately 45ml, aliquot, and store without reducing agent. Add beta-mercaptoethanol just before use. This approach preserves reducing agent efficacy during storage and is recommended for long-term storage [14].
Storage Conditions: Aliquots containing reducing agents should be stored at -20°C to maintain efficacy, while buffers without reducing agents can be stored at room temperature or 4°C [14] [5].
Alternative Buffer Formulations: Modifications and Improvements
While the standard Laemmli buffer performs satisfactorily for most routine applications, specific research needs have prompted the development of alternative formulations that address particular limitations. These modifications range from subtle compositional adjustments to complete buffer system changes that optimize performance for specialized applications.
Phosphate-Modified Laemmli Buffer
The phosphate modification of Laemmli buffer represents one significant alternative that addresses stability concerns with the traditional Tris-based system. This formulation replaces Tris with a phosphate buffer system, offering enhanced buffering capacity at the standard pH 6.8 [14].
The primary advantage of this modification lies in its superior buffering capacity at the working pH, which reduces unexpected protein cleavage that can sometimes occur in traditional Laemmli buffer [14]. The phosphate system maintains a more stable pH environment during sample preparation and the initial electrophoresis phases, particularly important for labile proteins or extended procedures. The biochemical basis for this improvement stems from the pKa of phosphate buffers (pKa₂ = 7.2) being much closer to the working pH of 6.8 compared to Tris (pKa = 8.1), providing more effective buffering against pH fluctuations that could promote peptide bond hydrolysis [14].
Preparation of phosphate-modified buffer follows a similar protocol to standard Laemmli buffer but substitutes phosphate compounds for Tris. Researchers typically use combinations of sodium phosphate monobasic and dibasic to achieve the desired pH 6.8, with other components (SDS, glycerol, reducing agent, and tracking dye) remaining identical in concentration and function. This modification demonstrates how targeted adjustment of a single buffer component can address specific limitations while maintaining the overall efficacy of the sample preparation system.
Morris SDS-PAGE Sample Buffer
The Morris SDS-PAGE sample buffer represents another alternative formulation with composition very similar to the traditional Laemmli buffer [14]. While detailed compositional differences are not extensively documented in the available literature, the Morris buffer shares the same fundamental components and principles while potentially varying in exact concentrations or including minor modifying agents.
The similarity between Laemmli and Morris buffers suggests that the Morris formulation likely represents a subtle optimization rather than a radical departure from the standard composition. Such alternative formulations often emerge to address specific methodological needs or to optimize performance for particular protein types or experimental conditions. Researchers may find that the Morris buffer offers slightly different performance characteristics with certain protein classes, though both systems operate on the same fundamental principles of protein denaturation, charge normalization, and disulfide bond reduction.
Tris-Acetate SDS-PAGE System
For specific challenging separations, particularly of high-molecular-weight proteins like monoclonal antibodies, the Tris-acetate SDS-PAGE system has demonstrated superior performance compared to the traditional Tris-glycine system used with Laemmli buffer [70].
A comparative study examining the separation of IgG1 and IgG2 monoclonal antibodies found that a modified Tris-acetate system in a 6-20% gradient gel provided sharper bands, more accurate molecular weight determination, and higher resolution compared to the traditionally used Tris-glycine method [70]. The results obtained with the Tris-acetate system more closely aligned with those from capillary gel electrophoresis, considered a gold standard for protein characterization in biopharmaceutical development [70].
The enhanced performance of the Tris-acetate system for large proteins stems from several factors. The acetate ions in the running buffer have higher electrophoretic mobility compared to glycine, allowing more efficient transfer of proteins through the gel matrix. Additionally, the Tris-acetate system typically operates at a lower pH (approximately 8.6 versus 8.8-9.0 for Tris-glycine), which may reduce protein aggregation or improve SDS binding to hydrophobic regions common in antibody molecules. For researchers working with monoclonal antibodies or other large protein complexes, the Tris-acetate system represents a valuable alternative to traditional methodologies.
Table 2: Comparison of Buffer Formulations and Their Applications
| Buffer Formulation | Key Components | Advantages | Limitations | Ideal Applications |
|---|---|---|---|---|
| Standard Laemmli | Tris-HCl (pH 6.8), 2% SDS, 10% glycerol, 5% β-mercaptoethanol, 0.02% bromophenol blue | Well-established, compatible with Tris-glycine systems, effective for most proteins | Suboptimal buffering at pH 6.8, potential protein cleavage | Routine protein separation, educational laboratories, standard western blotting |
| Phosphate-Modified | Phosphate buffer (pH 6.8), SDS, glycerol, reducing agent, tracking dye | Better buffering capacity, reduced protein cleavage | Less common, may require optimization | Labile proteins, prolonged electrophoresis, specialized research applications |
| Morris Buffer | Very similar to Laemmli with potential minor modifications | Potentially optimized for specific protein classes | Limited documentation in literature | Applications where standard Laemmli shows limitations |
| Tris-Acetate System | Tris-acetate buffer, higher SDS concentrations possible | Superior for high molecular weight proteins, sharper bands | Requires different running buffer, less established | Monoclonal antibodies, protein complexes, high molecular weight proteins |
Experimental Protocols for Comparative Analysis
Protocol for Detecting Electrophoretic Mobility Shifts
Recent research has adapted Laemmli buffer formulations for specialized detection methods, such as identifying histidine polyphosphate modifications (HPM) in proteins. The following protocol demonstrates how modified Laemmli buffer can be used in detecting electrophoretic mobility shifts:
Lysis Buffer Composition: 50 mM Tris pH 8, 250 mM NaCl, 5% glycerol, 3 mM 2-mercaptoethanol, supplemented with lysozyme (100 μg mL⁻¹) [69].
Sample Preparation: Resuspend cell pellets in a 1:1 ratio of lysis buffer and 2X Laemmli Buffer (120 mM Tris pH 6.8, 100 mM DTT, 20% glycerol, 4% SDS, 0.2% bromophenol blue) [69]. Note the use of DTT as an alternative reducing agent to beta-mercaptoethanol in this formulation.
Denaturation: Vortex samples briefly followed by boiling at 95°C for 5 minutes [69].
Electrophoresis: Perform using precast NuPAGE gels with appropriate buffers to detect mobility shifts indicative of post-translational modifications [69].
This protocol highlights how the fundamental Laemmli formulation can be modified by adjusting reducing agents (DTT instead of beta-mercaptoethanol) and Tris concentrations for specialized applications while maintaining the core principles of protein denaturation and charge normalization.
Protocol for Monoclonal Antibody Analysis Using Tris-Acetate System
For researchers requiring optimized separation of monoclonal antibodies, the following protocol based on Tris-acetate SDS-PAGE has demonstrated superior results compared to traditional Laemmli-based systems:
Gel Preparation: Prepare 6-20% gradient gels using Tris-acetate buffer system instead of Tris-glycine [70].
Sample Preparation: Dilute protein samples in Laemmli buffer (standard composition) but note that the running buffer system differs from traditional methodologies.
Electrophoresis Conditions: Run at constant current appropriate for the gel format, typically 30-35 mA for mini-gel systems until the dye front approaches the gel bottom.
Analysis: Compare results with traditional Tris-glycine systems, noting improvements in band sharpness, resolution, and molecular weight accuracy relative to capillary electrophoresis standards [70].
This protocol demonstrates how alternative running buffer systems can be paired with standard Laemmli sample buffer to address specific separation challenges while maintaining the sample preparation benefits of the Laemmli formulation.
Diagram 1: Experimental workflow of protein separation using Laemmli buffer and discontinuous gel electrophoresis
Research Reagent Solutions: Essential Materials for Electrophoresis
Successful implementation of protein electrophoresis requires specific research reagents optimized for each step of the process. The following table details essential materials and their functions for comparative buffer studies.
Table 3: Essential Research Reagents for Protein Electrophoresis
| Reagent Category | Specific Examples | Function in Experimental Protocol | Technical Considerations |
|---|---|---|---|
| Buffering Agents | Tris base, phosphate buffers | Maintain pH stability during sample preparation and initial electrophoresis | Phosphate buffers offer superior buffering at pH 6.8; Tris standard for most applications |
| Denaturing Agents | SDS (sodium dodecyl sulfate) | Linearize proteins and impart uniform negative charge | Critical for mass-based separation; binding may vary with protein hydrophobicity or PTMs |
| Reducing Agents | Beta-mercaptoethanol, DTT, DTT | Break disulfide bonds for complete denaturation | DTT more stable but may require fresh addition; BME toxic requiring fume hood use |
| Density Agents | Glycerol, sucrose | Increase sample density for well loading | Glycerol (10%) standard; measure by mass for accuracy due to viscosity |
| Tracking Dyes | Bromophenol blue | Visualize sample migration during electrophoresis | Migrates ahead of most proteins; indicates run progress |
| Gel Matrices | Acrylamide/bis-acrylamide | Create molecular sieve for size-based separation | Pore size determined by acrylamide percentage; gradients optimize resolution range |
| Catalysts | APS, TEMED | Initiate and accelerate acrylamide polymerization | Fresh APS solution recommended for consistent polymerization |
| Running Buffers | Tris-glycine, Tris-acetate | Conduct current and establish pH for separation | Tris-acetate superior for high molecular weight proteins |
The comparative analysis of Laemmli buffer and its alternative formulations reveals a nuanced landscape of protein sample preparation methodologies for discontinuous gel electrophoresis. The standard Laemmli buffer remains the appropriate choice for most routine applications, offering proven performance, widespread compatibility, and established protocols. However, specific research challenges warrant consideration of alternative formulations. The phosphate-modified buffer provides enhanced buffering capacity that reduces protein cleavage artifacts, while the Tris-acetate system demonstrates clear advantages for separating high-molecular-weight proteins like monoclonal antibodies.
For researchers in drug development and proteomics, selection of appropriate sample buffer should be guided by specific experimental needs rather than defaulting to standard protocols. The continued evolution of electrophoresis methodologies underscores the importance of understanding both the historical foundations and contemporary innovations in protein separation science. As electrophoretic techniques remain fundamental to protein characterization in biomedical research, informed selection and potential customization of sample buffer formulations will continue to enhance experimental outcomes across diverse applications.
Within the framework of Laemmli method-based research, SDS-PAGE stands as a foundational technique for protein separation by molecular weight. However, in modern proteomics, its true power is unlocked through integration with advanced downstream analyses. Cross-method validation, the process of correlating SDS-PAGE results with other proteomic techniques, transforms simple separation into a gateway for comprehensive protein characterization, providing robust verification through orthogonal methods. This guide details established workflows and experimental protocols for correlating SDS-PAGE data with cutting-edge mass spectrometry (MS) approaches, enabling researchers to achieve unprecedented specificity, sensitivity, and quantitative accuracy in protein analysis.
Correlative Workflows: From SDS-PAGE Bands to Protein Data
The following diagram illustrates the primary pathways for correlating SDS-PAGE with downstream proteomic techniques, which are detailed in the subsequent sections.
GeLC-MS/MS: Bridging Separation and Identification
Core Methodology and Experimental Protocol
GeLC-MS/MS represents a direct correlation workflow where proteins separated by SDS-PAGE are subsequently identified and quantified by mass spectrometry [71]. The methodology involves the following key steps:
- Protein Separation and Staining: Following SDS-PAGE, separate the gel lanes and visualize proteins using Coomassie Brilliant Blue R250 or compatible stains.
- Gel Excision: Excise gel slabs covering the mass range of approximately ±20 kDa around the target protein's molecular weight.
- In-Gel Digestion: Destain, reduce, and alkylate the proteins within the gel matrix. Digest proteins into peptides using trypsin (e.g., Trypsin Gold, mass spectrometry grade) [71].
- Peptide Extraction and Analysis: Recover tryptic peptides from the gel pieces and analyze them by nanoflow LC-MS/MS.
- Data Processing: Match MS/MS spectra to peptides and proteins using search engines (e.g., Mascot) against a customized database containing target protein sequences.
Application for Absolute Quantification: MS Western
A powerful application of this correlation is MS Western, a method that provides multiplexed, absolute (molar), antibody-free quantification of dozens of user-selected proteins from unlabeled cell and tissue lysates [71]. It combines the sample preparation versatility of conventional SDS-PAGE Western blotting with the specificity and accuracy of LC-MS/MS.
- Quantification Principle: MS Western quantifies proteins by in-gel co-digestion with an isotopically labeled QconCAT protein chimera. This chimera is composed of concatenated proteotypic peptides from the target proteins [71].
- Performance Advantages: In comparative experiments, MS Western outperformed immunofluorescence Western blotting in protein detection specificity, linear dynamic range, and sensitivity of protein quantification [71]. It accurately determines molar abundance at the sub-femtomole level.
Table 1: Key Characteristics of Correlative Techniques
| Technique | Primary Correlation with SDS-PAGE | Key Information Gained | Quantitative Capability |
|---|---|---|---|
| GeLC-MS/MS (MS Western) | Bands excised for in-gel digestion and MS analysis | Protein identity & absolute molar abundance [71] | Absolute quantification (sub-femtomole level) |
| Cross-Linking MS (XL-MS) | Analysis of cross-linked proteins after separation | Protein-protein interactions & 3D structure (low-nanometer resolution) [72] | Relative quantification (QCLMS) possible [73] |
| 2D-DIGE | Second-dimension SDS-PAGE separation after IEF | Differential protein expression across samples [74] | High-precision relative quantification |
Cross-Linking Mass Spectrometry (XL-MS) for Structural Proteomics
Workflow and Reagent Strategies
Cross-linking mass spectrometry (XL-MS) correlates the migration of cross-linked protein complexes on SDS-PAGE with structural information. Proteins are first cross-linked in their native state, then separated by SDS-PAGE, and finally analyzed by MS to identify the cross-linked sites, providing distance constraints for 3D modeling [75].
- Cross-Linking Chemistry: The most common cross-linkers (e.g., DSS, BS3) target primary amines on lysine residues. They are N-hydroxysuccinimidyl esters connected by a spacer arm [75].
- Advanced MS-Cleavable Linkers: Reagents like disuccinimidyl sulfoxide (DSSO) are cleaved during MS analysis, simplifying the identification of cross-linked peptides by producing signature fragmentation patterns [72].
- Data Analysis: Specialized search engines (e.g., Scout, xiSEARCH, MaxLynx) are required to identify cross-linked peptides from the complex MS data. Scout, for instance, uses artificial neural networks for high sensitivity and speed [72].
Quantitative Cross-Linking MS (QCLMS)
The correlation can be extended to quantification. Quantitative Cross-Linking Mass Spectrometry (QCLMS) reveals structural details on altered protein states in solution [73].
- Data-Independent Acquisition (DIA): The introduction of DIA to QCLMS (DIA-QCLMS) has improved the reproducibility and throughput of quantitative measurements compared to data-dependent acquisition (DDA). It enables the detection of changing abundances of cross-linked peptides even in complex mixtures [73].
- Performance: In a study of a seven-protein mixture cross-linked with BS3, DIA-QCLMS quantified 70% of identified unique residue pairs across triplicates with a coefficient of variation (CV) of 10%, a significant improvement over DDA [73].
2D-DIGE: Correlation for Differential Expression
Integrating SDS-PAGE with Isoelectric Focusing
Two-dimensional differential gel electrophoresis (2D-DIGE) is a high-precision quantitative technique where SDS-PAGE serves as the second dimension for separation. Proteins are first separated by their isoelectric point (pI) using isoelectric focusing and then by their molecular mass using SDS-PAGE [74].
- Quantification Principle: Samples are labeled with different fluorescent dyes (Cy3, Cy5) and run on the same gel with an internal standard (Cy2), minimizing gel-to-gel variation and enabling accurate spot matching and quantification [74].
- Correlation Challenge: A key challenge is identifying low-abundant proteins in differentially expressed spots. A computational prioritization approach can be used, which exploits a spot's estimated pI and Mw (from its 2D coordinates) and functional similarities to already identified proteins to rank candidate proteins [74].
The Scientist's Toolkit: Essential Reagents and Solutions
Successful cross-method validation relies on a suite of specialized reagents and materials. The following table details key components for the featured experiments.
Table 2: Research Reagent Solutions for Correlative Proteomics
| Reagent / Material | Function / Application | Technical Notes |
|---|---|---|
| MS-Cleavable Cross-linkers (e.g., DSSO) | Provides residue-to-residue connectivity for structural MS; cleavable spacer simplifies data analysis [72]. | Enables proteome-wide XL-MS studies by reducing search space complexity. |
| Isotopically Labeled QconCAT | Artificial protein standard with concatenated proteotypic peptides for absolute quantification in MS Western [71]. | Allows multiplexed quantification of dozens of proteins without antibody or standard purification. |
| Fluorescent Dyes (Cy2, Cy3, Cy5) | Differential labeling of protein samples for 2D-DIGE analysis [74]. | An internal standard (Cy2) is critical for high-precision cross-gel quantification. |
| Trypsin Gold (MS Grade) | High-purity protease for specific in-gel protein digestion into peptides for LC-MS/MS analysis [71]. | Ensures efficient and reproducible digestion, minimizing non-specific cleavages. |
| Strong Cation Exchange (SCX) Resin | Fractionation of complex peptide mixtures post-digestion to reduce sample complexity for LC-MS/MS [72]. | Particularly useful in XL-MS workflows to enrich for cross-linked peptides. |
Correlating SDS-PAGE with advanced mass spectrometry techniques transforms it from a simple separation tool into a powerful node in a comprehensive proteomics pipeline. Whether the goal is absolute quantification via GeLC-MS/MS, structural insight via XL-MS, or sensitive differential expression monitoring via 2D-DIGE, these correlative approaches provide a multi-dimensional view of the proteome. The experimental protocols and reagent solutions detailed in this guide provide a robust foundation for researchers to design and implement these powerful cross-method validation strategies, thereby maximizing the informational yield from their Laemmli-based electrophoretic separations.
Assessing the Impact of Buffer Variations on Experimental Reproducibility
The pursuit of reproducible research represents a cornerstone of the scientific method, yet it remains a significant challenge in laboratory practice. It is estimated that the annual cost of irreproducible preclinical research may be as high as $28 billion, with biological reagents and buffers identified as a key source of this variability [76]. Within the context of protein research utilizing the Laemmli method for discontinuous gel electrophoresis, buffer composition emerges as a critical, yet often overlooked, variable that can profoundly impact experimental outcomes.
The discontinuous buffer system developed by Laemmli, fundamental to SDS-PAGE, relies on precise physicochemical conditions to achieve high-resolution separation of proteins [14] [5]. This article provides a systematic analysis of how variations in buffer components and preparation affect data reproducibility, offers diagnostic protocols for quality assessment, and proposes standardized practices to enhance reliability in electrophoretic separations and subsequent analyses like western blotting.
The Laemmli Discontinuous Buffer System: Principles and Components
Core Mechanism of Discontinuous Electrophoresis
The Laemmli method employs a discontinuous buffer system to concentrate protein samples into sharp bands before they enter the separating gel, a process essential for high-resolution separation. This system creates two distinct regions within the gel—a stacking gel and a resolving gel—each with different pH and acrylamide concentrations [77]. The fundamental principle relies on the creation of a steep voltage gradient and differential mobility of ions.
The key to this process is the differential mobility of chloride ions (Cl⁻) from the gel, glycinate ions from the running buffer, and the protein-SDS complexes. In the stacking gel (pH 6.8), chloride ions (leading ions) have high electrophoretic mobility, while glycine exists primarily as zwitterions (trailing ions) with minimal charge and low mobility [77]. Protein-SDS complexes, with intermediate mobility, become concentrated between these two ion fronts. When this ion front reaches the resolving gel (pH 8.8), the increased pH causes glycine to become predominantly negatively charged, allowing it to migrate faster and overtake the proteins. The proteins, now in a uniform sharp band at the top of the resolving gel, separate based on molecular weight as they migrate through the polyacrylamide matrix [77].
Figure 1: The Laemmli Discontinuous Buffer System Workflow. This diagram illustrates the sequential process of protein separation, highlighting the critical role of pH transition between stacking and resolving gels.
Critical Buffer Components and Their Functions
The Laemmli sample buffer contains five essential components that work in concert to prepare proteins for optimal separation. Understanding the specific function of each reagent is crucial for recognizing how variations can impact experimental reproducibility.
Table 1: Core Components of Laemmli Buffer and Their Functions
| Component | Primary Function | Concentration in 2X Buffer | Impact of Variation |
|---|---|---|---|
| Tris-HCl | Buffering capacity at pH 6.8; maintains system pH for proper stacking | 0.125 M [14] | Incorrect pH disrupts glycine charge transition, impairing stacking |
| SDS (Sodium Dodecyl Sulfate) | Denatures proteins; imparts uniform negative charge [5] | 4% (w/v) [14] | Insufficient SDS causes incomplete denaturation and charge heterogeneity |
| Reducing Agent (β-mercaptoethanol/DTT) | Breaks disulfide bonds; linearizes proteins [6] | 10% (v/v) β-ME [14] | Incomplete reduction preserves higher-order structure, affecting mobility |
| Glycerol | Increases sample density for loading; prevents diffusion from wells [5] | 20% (v/v) [14] | Low density causes sample leakage; high viscosity impedes pipetting |
| Bromophenol Blue | Tracking dye; visualizes migration progress [14] | ~0.02% (w/v) [14] | Serves as visual quality control for electrophoretic process |
Compositional Variations and Their Consequences
Even minor deviations in buffer composition can significantly impact protein separation and downstream analysis. Different research goals may necessitate buffer modifications, but these alterations must be deliberate and documented.
Reducing vs. Non-Reducing Formulations: The inclusion or exclusion of reducing agents represents one of the most significant methodological choices. Reducing buffers (containing β-mercaptoethanol or DTT) break disulfide bonds, fully linearizing proteins to provide accurate molecular weight estimation [6]. In contrast, non-reducing buffers preserve disulfide bonds and higher-order structures, which may be essential for studying protein complexes or conformational epitopes in western blotting [6]. The choice between these formulations should align with experimental objectives, as they can produce dramatically different banding patterns.
Alternative Methodologies: Recent methodological innovations demonstrate how controlled buffer modifications can expand application scope. The Native SDS-PAGE (NSDS-PAGE) method, which eliminates SDS from the sample buffer and omits the heating step, enables high-resolution separation while preserving enzymatic activity and metal cofactors in many proteins [78]. This approach retains the resolution of traditional SDS-PAGE while maintaining protein function, demonstrating how strategic buffer modifications can address specific research needs.
Metal Interactions: The choice of buffer components significantly affects metal-protein interactions. Traditional Laemmli buffer with EDTA can chelate metal ions, potentially disrupting metalloprotein structure [78]. As shown in Table 2, different buffers exhibit varying capacities for metal complexation, which must be considered when studying metal-dependent biological systems [76].
Table 2: Buffer Compatibility with Metal Ions and Experimental Applications
| Buffer System | Metal Interaction Profile | Protein Solubilization Efficiency | Recommended Applications |
|---|---|---|---|
| Traditional Laemmli | EDTA chelates metal ions; not suitable for metalloprotein studies [78] | Excellent for most cytosolic proteins; poor for membrane-associated complexes [79] | Standard molecular weight determination; western blotting |
| RIPA Lysis + Laemmli | Variable metal retention depending on specific composition | Efficient for soluble proteins; inconsistent for cytoskeletal proteins (tubulin, lamin) [79] | Whole-cell extraction for signaling studies |
| NSDS-PAGE | Minimal metal chelation; preserves 98% of Zn²⁺ in proteomic samples [78] | Maintains native protein structure while providing high-resolution separation | Functional studies of metalloenzymes; native protein analysis |
| BN-PAGE | Minimal metal disruption; preserves protein-metal interactions | Maintains intact protein complexes; lower resolution than SDS-PAGE [78] | Analysis of protein complexes; oligomeric state determination |
Preparation and Storage Considerations
The stability and performance of Laemmli buffer depend critically on proper preparation and storage conditions. Reducing agents represent the most labile components, with β-mercaptoethanol and DTT subject to oxidation over time [14]. For optimal results, aliquoting buffers without reducing agents and adding fresh reducing agents immediately before use is recommended [14]. This practice prevents oxidation-related artifacts and ensures consistent disulfide bond reduction across experiments.
Storage conditions significantly impact buffer performance. Complete Laemmli buffer with reducing agents should be stored at -20°C, while buffers without reducing agents remain stable at 4°C or room temperature [14]. The age of the buffer should be documented, and signs of deterioration (such as color changes or precipitate formation) should prompt fresh preparation.
Water quality represents another often-overlooked variable. High-purity water free from metal ions, organic matter, and particulates is essential for buffer preparation, particularly for sensitive applications [76]. Inconsistent water quality can introduce contaminants that affect electrophoretic mobility and band sharpness.
Diagnostic Approaches for Assessing Buffer Performance
Serial Dilution for Linearity Assessment
A robust method for evaluating the quantitative performance of any electrophoresis system involves running a serial dilution of a standardized protein extract. This diagnostic approach assesses whether band intensity remains linearly proportional to protein abundance, which is essential for accurate quantitative comparisons [79].
The protocol involves preparing an extended twofold serial dilution series from an overloaded sample (e.g., 200 µg) to one below the detection limit (e.g., 100 ng) [79]. These samples are then separated using standard electrophoretic conditions and detected with relevant antibodies or protein stains. The resulting band intensities should demonstrate zero-intercept linearity (y = bx), where y represents quantified band intensity and x represents protein abundance [79]. Nonlinear relationships or saturation effects indicate problems with detection sensitivity or antibody affinity that can lead to inaccurate fold-change estimations in comparative experiments.
This diagnostic approach can reveal how different transfer conditions affect quantitative accuracy. For example, transfer buffers containing 20% methanol may produce brighter, crisper bands but frequently shift the detection of multiple targets from a linear regime to hyperbolic saturation compared to lower methanol concentrations (10%) [79].
Solubility and Recovery Assessment
Different lysis buffers exhibit variable efficiency in solubilizing specific protein classes, which can dramatically affect quantitative results. Systematic comparison of protein recovery across different buffer systems provides critical validation for experimental conclusions.
As illustrated in Figure 2, diagnostic experiments have demonstrated that RIPA buffer efficiently solubilizes many cytoplasmic proteins (GAPDH, Hsp90) and signaling proteins but shows substantial losses for cytoskeletal proteins (tubulin, lamin A) and certain transcription factors (GATA2) into the insoluble fraction [79]. In contrast, direct lysis with Laemmli sample buffer followed by DNA shearing provides more comprehensive protein recovery, including proteins tightly associated with DNA such as histones [79].
Figure 2: Buffer-Dependent Protein Solubility Profiles. Different lysis buffers recover distinct subsets of the proteome, potentially leading to contradictory experimental conclusions.
This variability becomes particularly problematic when proteins shift between soluble and insoluble fractions in a stimulus-dependent manner. For example, during FAS death receptor activation, cleaved forms of caspase-8 are only detected in Laemmli sample buffer preparations, not in RIPA or NP-40 buffers [79]. Such methodology-dependent detection failures can lead to fundamentally incorrect biological conclusions.
The Scientist's Toolkit: Essential Reagents and Solutions
Table 3: Research Reagent Solutions for Reproducible Electrophoresis
| Reagent Category | Specific Examples | Critical Function | Quality Considerations |
|---|---|---|---|
| Buffering Agents | Tris base, Tris-HCl, Bis-Tris | Maintain precise pH in stacking (6.8) and resolving (8.8) gels [77] | High purity; correct pKa for desired pH range; minimal lot-to-lot variability [76] |
| Denaturing Agents | SDS, LDS | Unfold proteins; impart uniform charge density for size-based separation [5] | High purity; appropriate chain length; fresh preparation to prevent degradation |
| Reducing Agents | β-mercaptoethanol, DTT, TCEP | Break disulfide bonds; ensure complete protein linearization [6] | Fresh aliquots; protection from oxidation; concentration verification |
| Stabilizing Agents | Glycerol, sucrose | Increase sample density for well loading; prevent pre-run diffusion [5] | High purity; concentration accuracy; viscosity considerations for pipetting |
| Tracking Dyes | Bromophenol Blue, Coomassie G-250 | Visualize migration front; monitor electrophoresis progress [14] | Consistent concentration; minimal protein binding; appropriate for detection method |
| Protease/Phosphatase Inhibitors | PMSF, protease inhibitor cocktails, sodium orthovanadate | Preserve protein modifications and prevent degradation during preparation [79] | Target specificity; stability in buffer; compatibility with downstream applications |
Best Practices for Enhanced Reproducibility
Standardized Buffer Preparation Protocols
Consistent buffer preparation is fundamental to experimental reproducibility. The following standardized protocol for 50 mL of 2X Laemmli buffer ensures minimal inter-batch variability:
- Tris Solution Preparation: Dissolve 0.747 g Tris base in 10 mL deionized water using a magnetic stirrer [14].
- pH Adjustment: Carefully adjust to pH 6.8 with concentrated HCl, avoiding overshoot [14].
- Glycerol Addition: Add 10 mL glycerol to the Tris solution and mix thoroughly [14].
- SDS and Dye Addition: Add 2 g SDS and 100 mg bromophenol blue, with continued stirring until complete dissolution [14].
- Volume Adjustment: Bring the total volume to approximately 45 mL with deionized water [14].
- Aliquoting and Storage: Divide into convenient aliquots and store at -20°C [14].
- Reducing Agent Addition: Add 5 mL β-mercaptoethanol immediately before use (final volume 50 mL) [14].
This protocol incorporates option 2 for reducing agent addition, which preserves reducing activity and is recommended for optimal results [14]. All steps involving volatile or toxic components (HCl, β-mercaptoethanol) should be performed in a fume hood with appropriate personal protective equipment [14].
Quality Control and Documentation
Implementing rigorous quality control measures for buffer preparation and use significantly enhances experimental reproducibility:
- Batch Documentation: Maintain detailed records for each buffer preparation, including component lot numbers, preparation date, and expiration dates.
- Performance Validation: Regularly test buffer performance using standardized protein samples and established reference separations.
- Storage Monitoring: Implement temperature monitoring for storage units and avoid repeated freeze-thaw cycles by using appropriate aliquoting.
- Component Verification: Periodically verify critical component concentrations, particularly for labile reagents like reducing agents.
Troubleshooting common buffer-related issues requires systematic investigation. Band smearing may indicate outdated reducing agents or insufficient SDS [6]. Poor stacking often results from incorrect pH in the sample buffer [77]. Horizontal band distortion ("smiling") typically indicates excessive heat generation during electrophoresis, which can be mitigated by reduced voltage or external cooling [80]. Vertical band distortion ("edge effects") occurs when peripheral wells are left empty and can be resolved by loading reference samples in all wells [80].
Buffer composition represents a fundamental variable in electrophoretic separations that directly impacts data quality and experimental reproducibility. The discontinuous nature of the Laemmli buffer system creates precise physicochemical conditions that must be carefully maintained to ensure optimal protein separation. Through understanding component functions, recognizing sources of variability, implementing diagnostic assessments, and adhering to standardized preparation protocols, researchers can significantly enhance the reliability of their protein analysis data. As the scientific community continues to address challenges in research reproducibility, attention to these fundamental methodological details becomes increasingly critical for generating robust, verifiable scientific knowledge.
The development of SDS polyacrylamide gel electrophoresis by Ulrich Laemmli in 1970 revolutionized protein science, providing a method to separate complex protein mixtures by molecular weight under denaturing conditions [1]. This discontinuous electrophoretic system, which concentrated proteins at a buffer interface before separation, enabled high-resolution analysis of proteins that was previously impossible [1] [22]. While traditional Western blotting derived from this method has long been useful for qualitative protein detection, contemporary research demands precise quantification of protein abundance [81]. The transition from qualitative assessment to quantitative measurement requires rigorous validation of protein integrity throughout the experimental workflow. Within the context of ongoing Laemmli method research, this whitepaper examines critical case studies and methodologies for validating protein integrity specifically for quantitative Western blotting applications, addressing the needs of researchers, scientists, and drug development professionals who require accurate protein quantification for their work.
Theoretical Framework: From Qualitative to Quantitative Analysis
The Fundamental Shift in Data Interpretation
Traditional Western blotting provides valuable qualitative data—confirming the presence or absence of a specific protein and offering semi-quantitative assessment of expression changes [81]. However, quantitative Western blotting represents a paradigm shift, generating precise numerical data on protein abundance through advanced imaging, sophisticated software algorithms, and standardized protocols [82]. This quantitative approach enables researchers to detect subtle differences in protein expression levels that may have biological or clinical significance.
The core principle of SDS-PAGE remains essential to both approaches: proteins are denatured and coated with sodium dodecyl sulfate (SDS), imparting a uniform negative charge that allows separation by molecular size rather than intrinsic charge or structure [22]. In quantitative applications, this separation provides the foundation for precise measurement rather than simple detection.
Critical Methodological Considerations for Quantitation
Several technical factors must be optimized to ensure accurate quantification:
Signal Saturation Avoidance: When chemiluminescent signals become saturated, the relationship between signal intensity and protein abundance is lost, making accurate quantification impossible [81]. This can be addressed by optimizing protein loading amounts and antibody concentrations.
Appropriate Normalization Strategies: Normalization corrects for experimental variations in sample loading, transfer efficiency, and other technical variables [81]. Traditional housekeeping proteins often exhibit signal saturation and variable expression, while total protein normalization (TPN) typically provides more reliable results [83].
Linear Dynamic Range Establishment: The relationship between protein amount and detection signal must be linear across the experimental range. Both high-abundance and low-abundance proteins require optimization to maintain this linearity [81].
The diagram below illustrates the historical development and key considerations for transitioning from qualitative to quantitative Western blotting:
Critical Validation Parameters for Protein Integrity
Normalization: The Foundation of Accurate Quantification
Normalization is required to accurately assess differences in target protein abundance, as it corrects for unavoidable experimental errors during the Western blot process [81]. The choice of normalization method significantly impacts result reliability:
Housekeeping Protein Normalization traditionally relies on proteins like β-actin, GAPDH, and α-tubulin as loading controls. However, these proteins frequently exhibit signal saturation at common lysate loading amounts (e.g., 30-50 μg/well), resulting in nonlinear responses that compromise quantification accuracy [81]. Analysis of sample-to-sample variations using housekeeping proteins reveals substantial inconsistencies, with studies reporting average variations of approximately 48.2% [83].
Total Protein Normalization (TPN) has emerged as a superior alternative, now recognized as the gold standard for quantitative Westerns [83]. This method normalizes the target signal to the total amount of protein loaded in each lane, typically using fluorescent labeling reagents that covalently label all proteins. TPN demonstrates a linear response curve with a wide dynamic range and significantly reduced experimental variation, with studies reporting overall average variation of only 7.7% [83].
Optimization of Key Experimental Parameters
Three parameters have the greatest impact on quantitative Western blotting accuracy:
Protein Loading Optimization: The amount of protein loaded must be optimized based on target protein abundance to avoid signal saturation. High-abundance proteins may show linear detection only with very small loads (1-3 μg), while low-abundance targets may require higher loads (up to 40 μg) for adequate detection [81]. Determining precise protein concentration before electrophoresis using assays like the Qubit Protein BR Assay or Pierce Rapid Gold BCA Protein Assay is essential [81].
Antibody Dilution Optimization: Both primary and secondary antibody concentrations significantly impact signal linearity. Excessive antibody can cause signal variability, high background, and short signal duration, while insufficient antibody may reduce detection sensitivity. Systematic testing of antibody dilution combinations is necessary to achieve optimal quantitation [81].
Detection System Selection: The choice of chemiluminescent or fluorescent substrate must align with the target abundance. Ultrasensitive substrates may cause saturation with high-abundance targets, while standard substrates may lack sensitivity for low-abundance proteins. Ideal substrates provide sensitive, linear signals over a broad protein concentration range with wide dynamic range and long half-life [81].
Case Study: Total Protein Normalization Versus Traditional Housekeeping Proteins
Experimental Design and Methodology
A comprehensive biological validation study compared traditional housekeeping protein normalization with total protein normalization using a novel staining reagent [83]. The experimental design incorporated:
- Cell Lines: Multiple cell backgrounds to assess method robustness
- Protein Load Range: Serial dilutions to evaluate linear dynamic range
- Normalization Methods:
- Traditional housekeeping proteins (β-actin, GAPDH, α-tubulin)
- Total protein normalization with novel staining reagent
- Analysis Metrics: Signal linearity (R² values), sample-to-sample variation, signal saturation points
Protein separation was performed using the Laemmli discontinuous SDS-PAGE system with Bolt 4-12% Bis-Tris Plus gels and MES running buffer [81]. Proteins were transferred to PVDF membranes using an iBlot 2 Gel Transfer Device, followed by total protein labeling or traditional immunodetection with housekeeping protein antibodies [81].
Quantitative Results and Comparative Analysis
Table 1: Performance Comparison of Normalization Methods
| Normalization Method | Linearity (R²) | Average Variation | Saturation Point | Optimal Load Range |
|---|---|---|---|---|
| Total Protein Normalization | 0.9990 | 7.7% | No saturation observed | 10-50 μg |
| β-actin | 0.8851 | ~48.2% | 30-50 μg | <20 μg |
| GAPDH | 0.9438 | ~48.2% | 30-50 μg | <25 μg |
| α-tubulin | 0.8332 | ~48.2% | 30-50 μg | <15 μg |
The data clearly demonstrate the superiority of total protein normalization across all metrics. While traditional housekeeping proteins exhibited significant signal saturation and nonlinear responses at higher protein loads, total protein normalization maintained excellent linearity throughout the tested range [81] [83].
Implications for Experimental Outcomes
The dramatic difference in variability between methods (48.2% for housekeeping proteins versus 7.7% for TPN) has profound implications for experimental interpretation and reproducibility [83]. The high variability associated with housekeeping protein normalization increases the likelihood of both false positive and false negative results, potentially leading to erroneous conclusions about treatment effects or biological differences.
Table 2: Impact of Normalization Method on Experimental Interpretation
| Experimental Scenario | Housekeeping Protein Result | Total Protein Normalization Result | Interpretation |
|---|---|---|---|
| Drug Treatment (2-fold effect) | High variability may obscure real effect | Clear detection of significant change | TPN reduces false negatives |
| Biomarker Validation | Potential false positives due to normalization artifacts | Reliable quantification of protein levels | TPN increases validation accuracy |
| Time Course Experiment | Inconsistent normalization across time points | Consistent internal control across all samples | TPN provides stable baseline |
Antibody Validation Strategies for Quantitative Western Blotting
Comprehensive Antibody Validation Framework
Antibody validation confirms that an antibody recognizes the target protein with minimal cross-reactivity, which is essential for quantitative accuracy [84]. The International Working Group for Antibody Validation recommends at least two of these four strategies for Western blotting applications [84]:
Genetic Strategies: Utilizing cell lines or tissues in which the target protein has been knocked out (using CRISPR-Cas9) or knocked down (using RNAi). Any signal detected in knockout samples indicates cross-reactivity [84].
Orthogonal Strategies: Comparing antibody-based quantification results with antibody-independent methods (e.g., targeted proteomics) for correlation [84].
Independent Antibody Strategies: Using two or more antibodies against different epitopes of the same target protein. Correlation between results increases confidence in specificity [84].
Expression of Tagged Proteins: Expressing the target protein with an affinity tag (FLAG, v5) or fluorescent protein (GFP, YFP) and matching antibody signal with tag detection [84].
Implementation in Quantitative Workflows
For quantitative Western blotting, antibody validation must include confirmation that the signal intensity maintains a linear relationship with protein amount. This requires testing antibody performance across a range of protein loads and concentrations [81]. Additionally, antibody dilution must be optimized for each target, as excessive antibody can cause signal saturation, while insufficient antibody reduces sensitivity [81].
The workflow diagram below illustrates the integrated process of protein integrity validation for quantitative Western blotting:
Advanced Applications: Quantitative Western Blotting in Research and Diagnostics
Current Implementation Across Sectors
Quantitative Western blotting has become essential across multiple scientific domains:
Biomarker Validation: Precise measurement of protein levels helps determine their relevance to disease states. In cancer research, labs accurately quantify tumor-associated proteins to validate diagnostic markers, with a reported 30% increase in biomarker validation projects using quantitative systems over two years [82].
Drug Development & Pharmacodynamics: Pharmaceutical companies monitor how drugs influence protein expression, enabling better understanding of dose-response relationships and mechanisms of action. Approximately 65% of new drug candidates now incorporate Western blot quantification in preclinical assessments [82].
Disease Diagnostics & Monitoring: Clinicians detect and quantify disease-related proteins in patient samples, such as tau or amyloid-beta in neurodegenerative diseases. Clinical adoption is growing at approximately 20% annually [82].
Quality Control in Biomanufacturing: Manufacturers of biologics and vaccines ensure batch-to-batch consistency by verifying product purity and potency through precise protein quantification [82].
Integration with Laemmli Method Fundamentals
While advanced detection systems have evolved, the fundamental Laemmli SDS-PAGE method remains the separation backbone for quantitative Western blotting [1] [22]. The discontinuous buffer system that concentrates proteins before separation continues to provide the high-resolution separation necessary for accurate quantification. Modern implementations often use pre-cast gels with Bis-tris buffers at nearly neutral pH (6.4-7.2) to enhance stability and reduce cysteine modifications, but these remain variations of the original Laemmli method [22].
Essential Reagents and Research Solutions
Table 3: Key Research Reagent Solutions for Quantitative Western Blotting
| Reagent Category | Specific Examples | Function in Quantitative Workflow |
|---|---|---|
| Protein Separation | Bolt 4-12% Bis-Tris Plus gels, MES running buffer | High-resolution protein separation based on Laemmli method |
| Transfer System | iBlot 2 Gel Transfer Device, PVDF membranes | Efficient protein transfer from gel to membrane |
| Normalization Reagents | No-Stain Protein Labeling Reagent | Total protein normalization with linear dynamic range |
| Detection Substrates | SuperSignal West Dura Extended Duration Substrate | Chemiluminescent detection with wide dynamic range |
| Antibody Dilution | TrueBlack WB Antibody Diluent | Optimal antibody performance with minimal background |
| Blocking Buffers | TrueBlack WB Blocking Buffer | Reduced background fluorescence for improved sensitivity |
| Validation Tools | CRISPR-Cas9 knockout cell lines, siRNA | Antibody specificity confirmation through genetic strategies |
Validation of protein integrity remains fundamental to quantitative Western blotting, building upon the separation foundation established by Laemmli's discontinuous SDS-PAGE method. As the technique evolves toward increased automation, AI-driven data analysis, and point-of-care applications, the core principles of proper normalization, antibody validation, and signal linearity will continue to ensure data reliability [82]. The integration of total protein normalization and comprehensive antibody validation strategies represents a significant advancement over traditional approaches, enabling researchers to generate quantitative protein data with confidence across diverse applications from basic research to clinical diagnostics.
Conclusion
The Laemmli method remains a cornerstone technique in protein science due to its robust and reliable mechanism for denaturing and separating polypeptides by molecular weight. Its enduring relevance is rooted in a clever biochemical principle that leverages specific buffer components to ensure uniform charge and complete denaturation. Mastery of this method involves not only following the protocol but also understanding the 'why' behind each step, enabling effective troubleshooting and optimization for diverse sample types. As biomedical research advances, the Laemmli method continues to be an indispensable first step in protein analysis, forming the foundation for downstream applications like western blotting that are critical for drug development and clinical diagnostics. Future directions will likely see its continued integration with advanced proteomic workflows, including mass spectrometry and high-throughput screening, ensuring its place in the researcher's toolkit for years to come.
References
- 1. Ulrich Laemmli's Development of SDS Polyacrylamide Gel ... [https://fnl.mit.edu/ulrich-laemmlis-development-of-sds-polyacrylamide-gel-electrophoresis/]
- 2. Using T4 genetics and Laemmli's development of high ... [https://pmc.ncbi.nlm.nih.gov/articles/PMC9576892/]
- 3. Ulrich K. Laemmli [https://en.wikipedia.org/wiki/Ulrich_K._Laemmli]
- 4. The Evolution of SDS-Based Protein Separation [https://www.bio-techne.com/resources/blogs/advantages-of-ce-sds]
- 5. Laemmli Buffer: The 5 Critical Components [https://bitesizebio.com/44540/laemmli-buffer-what-is-it-for-anyway/]
- 6. Laemmli Sample Buffers: A Practical Guide [https://www.bostonbioproducts.com/overview-laemmli-sample-buffers/]
- 7. SDS-PAGE Gel Electrophoresis [https://www.protocols.io/view/sds-page-gel-electrophoresis-7hnhj5e.html]
- 8. One-step casting of Laemmli discontinued sodium dodecyl ... [https://pubmed.ncbi.nlm.nih.gov/22037291/]
- 9. Using T4 genetics and Laemmli's development of high- ... [https://www.sciencedirect.com/science/article/pii/S0021925822009061]
- 10. New protein design center in Copenhagen by Novo Nordisk [https://www.linkedin.com/posts/nisal1_new-center-in-copenhagen-to-pioneer-the-future-activity-7344325433355550742-m-mw]
- 11. How Does SDS-PAGE Work? A Comprehensive Guide [https://www.metwarebio.com/how-sds-page-works-guide/]
- 12. Overview of Electrophoresis | Thermo Fisher Scientific - CN [https://www.thermofisher.com/cn/en/home/life-science/protein-biology/protein-biology-learning-center/protein-biology-resource-library/pierce-protein-methods/overview-electrophoresis.html]
- 13. SDS-PAGE - Mullins Lab - [https://mullinslab.ucsf.edu/sds-page/]
- 14. Laemmli buffer: Preparation (1x,2x & 4x) and principle [https://sharebiology.com/laemmli-buffer-preparation/]
- 15. How SDS-PAGE Separates Proteins [https://azurebiosystems.com/blog/how-sds-page-separates-proteins/]
- 16. Overview of SDS-PAGE [https://www.creative-proteomics.com/resource/overview-of-sds-page.htm]
- 17. SDS-PAGE guide: Sample preparation to analysis [https://www.abcam.com/en-us/knowledge-center/western-blot/sds-page-guide]
- 18. One-dimensional SDS gel electrophoresis of proteins [https://pubmed.ncbi.nlm.nih.gov/18432979/]
- 19. PAGE简介— 基于分子大小的蛋白质分离 [https://www.sigmaaldrich.com/SG/zh/technical-documents/protocol/protein-biology/gel-electrophoresis/sds-page?srsltid=AfmBOorpASaMA6rylxz7Daj1qrTrJoWJDn26AlEerzG_LstHv-ECpESp]
- 20. 大米谷蛋白的碱致变性和结构表征 [https://www.spkx.net.cn/fileup/HTML/2017-38-21-007.shtml]
- 21. CN101865796A - 一种蛋白标样的制备方法及蛋白裂解液 [https://patents.google.com/patent/CN101865796A/zh]
- 22. SDS-PAGE [https://en.wikipedia.org/wiki/SDS-PAGE]
- 23. Gel Electrophoresis - an overview | ScienceDirect Topics [https://www.sciencedirect.com/topics/agricultural-and-biological-sciences/gel-electrophoresis]
- 24. One-Dimensional SDS and Non-Denaturing Gel ... [https://www.thermofisher.com/us/en/home/references/protocols/proteins-expression-isolation-and-analysis/sds-page-protocol/one-dimensional-sds-and-non-denaturing-gel-electrophoresis.html]
- 25. Sample Preparation for Cell Lines [https://www.alomone.com/info/sample-preparation-for-cell-lines?srsltid=AfmBOooJk8iGpB9cq4KQ5WFbXGB9fW903CvH_ZhBZZ0EooqGrQyhDUBn]
- 26. Controlling the separation of native proteins with ... [https://pmc.ncbi.nlm.nih.gov/articles/PMC10033466/]
- 27. Laemmli Sample Buffer(4X), Non-Reducing [https://gendepot.com/products/laemmli-sample-buffer4x-non-reducing]
- 28. Measurement | TJI-Seoul - iGEM 2025 [https://2025.igem.wiki/tji-seoul/measurement]
- 29. Common artifacts and mistakes made in electrophoresis [https://pmc.ncbi.nlm.nih.gov/articles/PMC7295095/]
- 30. Utilization of gel electrophoreses for the quantitative ... [https://www.sciencedirect.com/science/article/pii/S1319016416300767]
- 31. SDS-PAGE: Laemmli System: Solutions | PDF [https://www.scribd.com/doc/233541207/Laemmli-SDS-PAGE-doc]
- 32. Precast Protein Gels | Thermo Fisher Scientific - BR [https://www.thermofisher.com/br/en/home/life-science/protein-biology/protein-gel-electrophoresis/protein-gels.html]
- 33. Western Blot Sample Preparation Protocol [https://www.novusbio.com/support/support-by-application/western-blot-sample-preparation?srsltid=AfmBOorSQG5JPrzbl3ATfdKEnm6wx39uooE4set1CeREgeqdg9BQbjvk]
- 34. Sample preparation for western blot [https://www.abcam.com/en-us/technical-resources/guides/western-blot-guide/sample-preparation-for-western-blot]
- 35. Mastering Gel Electrophoresis: 10 Tips and Tricks for ... [https://americanlaboratorytrading.com/mastering-gel-electrophoresis-10-tips-and-tricks-for-successful-results/?srsltid=AfmBOooAQIpTtbGSFayN4UaOQOF2Ybc5GxnQbaSmyBquvzc3YGbsOc-T]
- 36. One-Dimensional SDS Gel Electrophoresis of Proteins with ... [https://www.thermofisher.com/us/en/home/references/protocols/proteins-expression-isolation-and-analysis/sds-page-protocol/one-dimensional-sds-gel-electrophoresis-of-proteins-pre-cast-gels-.html]
- 37. Using PVDF Membranes and Its Western ... Blotting Downstream [https://pubmed.ncbi.nlm.nih.gov/26044005/]
- 38. Comprehensive Optimization of Western Blotting - PMC [https://pmc.ncbi.nlm.nih.gov/articles/PMC10453944/]
- 39. Transfer Western | Thermo Fisher Scientific - TW Blot Methods [https://www.thermofisher.com/tw/en/home/life-science/protein-biology/protein-biology-learning-center/protein-biology-resource-library/pierce-protein-methods/western-blot-transfer-methods.html]
- 40. - the principles and a Western of indirect vs... blotting comparison [https://www.slideshare.net/slideshow/western-blotting-the-principle/49129100]
- 41. Total Protein Normalization Reagent for Western Blotting [https://www.thermofisher.com/jp/ja/home/life-science/protein-biology/protein-assays-analysis/western-blotting/detect-proteins-western-blot/total-protein-normalization.html]
- 42. of Automated and Traditional Comparison ... Western Blotting Methods [https://pmc.ncbi.nlm.nih.gov/articles/PMC10142486/]
- 43. SDS-PAGE Analysis of proteins: Principles, methodology, ... [https://deepscienceresearch.com/dsr/catalog/book/107/chapter/407]
- 44. SDS-PAGE: The science behind all those bubbles [https://www.antibodiesinc.com/pages/sds-page-demystified?srsltid=AfmBOorjPXBRz_EqhBCRYtJCs8MtZ3QMe1o8mVBVvPMX7MrggcgxGJgv]
- 45. Troubleshooting SDS-PAGE Gel Running Issues [https://www.goldbio.com/blogs/articles/troubleshooting-sds-page-gel-running-issues?srsltid=AfmBOopl2iKT9Fb5FdVViIHP7OncRKsHK6G1xOAYSmR7SQRRi1vSED8G]
- 46. sciencedirect.com/topics/neuroscience/ gel - electrophoresis [https://www.sciencedirect.com/topics/neuroscience/gel-electrophoresis]
- 47. Deciphering food proteins: The applications of SDS-PAGE ... [https://www.sciencedirect.com/science/article/abs/pii/S2212429225003025]
- 48. Overview of Protein Electrophoresis [https://www.thermofisher.com/us/en/home/life-science/protein-biology/protein-biology-learning-center/protein-biology-resource-library/pierce-protein-methods/overview-electrophoresis.html]
- 49. Gel Electrophoresis, PAGE, SDS - Biochemistry [https://www.medschoolcoach.com/gel-electrophoresis-page-sds-page-mcat-biochemistry/]
- 50. The likelihood of aggregation during protein renaturation can ... [https://pmc.ncbi.nlm.nih.gov/articles/PMC2323847/]
- 51. Western Blot Sample Preparation Protocol: Lysis, Inhibitors ... [https://www.bio-techne.com/applications/western-blotting/western-blot-sample-preparation]
- 52. Western Blot: The Complete Guide [https://www.antibodies.com/applications/western-blotting]
- 53. Boiling Proteins for Western Blotting: Optimal Conditions ... [https://www.assaygenie.com/blog/boiling-proteins-for-western-blotting-optimal-conditions-and-best-practices/?srsltid=AfmBOooX6UZH-_Dhs-dTlIVZgGWikbckixOzpaEjVOBOOeikGv2oBWOY]
- 54. 4X Protein Loading Buffer [https://www.licorbio.com/support/contents/reagents/loading-buffer/4x-protein-loading-buffer.html]
- 55. NuPAGE™ LDS Sample Buffer (4X), 250mL - FAQs [https://www.thermofisher.com/store/v3/products/faqs/NP0008]
- 56. Detergent Screening With Hybrid Detergents Increases ... [https://pmc.ncbi.nlm.nih.gov/articles/PMC12329390/]
- 57. Laemmli SDS-Sample Buffer (4X, Reducing) [https://www.bostonbioproducts.com/products/laemmli-sds-sample-buffer-4x-reducing-bp-110r]
- 58. SDS-PAGE Protein Loading Buffer 2X (Reducing) [https://www.bosterbio.com/sds-page-protein-loading-buffer-2x-reducing-ar0131-boster.html?srsltid=AfmBOor5_bPJ0d4Bw08Vsyal2JtL3D7w9Ye64LjdlDGeThBGO9cXcfzU]
- 59. Protein Stains Support—Troubleshooting [https://www.thermofisher.com/us/en/home/technical-resources/technical-reference-library/protein-electrophoresis-western-blotting-support-center/protein-stains-support/protein-stains-support-troubleshooting.html]
- 60. Troubleshooting SDS-PAGE Sample Preparation Issues [https://www.goldbio.com/blogs/articles/troubleshooting-sds-page-sample-preparation-issues?srsltid=AfmBOoqxBM7JSaZR4ozofd-ppQrzbdOZByoLR0PeiCL0g2CTXnsr28ZI]
- 61. Utilization of gel electrophoreses for the quantitative ... [https://pmc.ncbi.nlm.nih.gov/articles/PMC5357110/]
- 62. On the Applicability of Electrophoresis for Protein ... [https://pmc.ncbi.nlm.nih.gov/articles/PMC8625784/]
- 63. Sodium dodecyl sulfate-polyacrylamide gel electrophoresis ... [https://www.sciencedirect.com/science/article/pii/S000326972200207X]
- 64. SDS-PAGE知多少 - 天津卡梅德科技发展有限公司 [https://www.kmd-bioscience.cn/protein-expression-platform1/258.html]
- 65. Western Blot 中的新技术、新仪器 - 每日生物评论 [https://www.bio-review.com/western-blot-zhongdexinjishuxinyiqi/]
- 66. 蛋白质染色技术支持| Thermo Fisher Scientific - CN - 赛默飞 [https://www.thermofisher.cn/cn/zh/home/technical-resources/technical-reference-library/protein-electrophoresis-western-blotting-support-center/protein-stains-support/protein-stains-support-getting-started.html]
- 67. Improved Separation in Horizontal Protein SDS-PAGE with ... [https://www.mdpi.com/2409-9279/6/6/106]
- 68. SDS-PAGE: The science behind all those bubbles [https://www.antibodiesinc.com/pages/sds-page-demystified?srsltid=AfmBOoo9oSll0LRK6fgIiDwqcNTRfIZLitysO92FdAe-oocq5QCkR5v6]
- 69. Protocol for detecting histidine polyphosphate modification ... [https://pmc.ncbi.nlm.nih.gov/articles/PMC10943961/]
- 70. Improving SDS-PAGE method for monoclonal antibodies [https://pubmed.ncbi.nlm.nih.gov/33596474/]
- 71. MS Western, a Method of Multiplexed Absolute Protein ... [https://pmc.ncbi.nlm.nih.gov/articles/PMC5795399/]
- 72. Proteome-scale recombinant standards and a robust high- ... [https://www.nature.com/articles/s41592-024-02478-1]
- 73. Data-independent Acquisition Improves Quantitative Cross ... [https://www.sciencedirect.com/science/article/pii/S1535947620318417]
- 74. Candidate prioritization for low-abundant differentially ... [https://bmcbioinformatics.biomedcentral.com/articles/10.1186/s12859-015-0455-x]
- 75. Probing Native Protein Structures by Chemical Cross- ... [https://pmc.ncbi.nlm.nih.gov/articles/PMC2938055/]
- 76. Reproducibility with Biological Buffers [https://www.sigmaaldrich.com/US/en/technical-documents/technical-article/protein-biology/gel-electrophoresis/reproducibility-with-biological-buffers?srsltid=AfmBOopfFXODC4CuBO38ib_k88VgGgYVlGYaqx3K-xl8rV_xK0cg7pTS]
- 77. SDS-PAGE: The science behind all those bubbles [https://www.antibodiesinc.com/pages/sds-page-demystified?srsltid=AfmBOoo0gCqvaf38SupEaWh2xplG2TdLgwn9rJZZGxhTCvy1SD1BiMLW]
- 78. Native SDS-PAGE: High Resolution Electrophoretic ... [https://pmc.ncbi.nlm.nih.gov/articles/PMC4517606/]
- 79. An Analysis of Critical Factors for Quantitative Immunoblotting - PMC [https://pmc.ncbi.nlm.nih.gov/articles/PMC4401487/]
- 80. Troubleshooting SDS-PAGE Gel Running Issues [https://www.goldbio.com/blogs/articles/troubleshooting-sds-page-gel-running-issues?srsltid=AfmBOopeyrIq0R34eiZNnDrsYAxeiUidsMjGBy_pw4Z2g4kZcyYjqNNv]
- 81. Quantitative Western Blot Analysis [https://www.thermofisher.com/us/en/home/life-science/protein-biology/protein-biology-learning-center/protein-biology-resource-library/pierce-protein-methods/quantitative-western-blot-analysis.html]
- 82. System in the Real World: 5 Uses You'll... Western Blot Quantitative [https://www.linkedin.com/pulse/western-blot-quantitative-system-real-world-5-uses-youll-380vf]
- 83. Biological validation of a novel process and product for quantitating... [https://pubmed.ncbi.nlm.nih.gov/33373626/]
- 84. : How and why you should Quantitative ... Western Blotting validate [https://azurebiosystems.com/blog/quantitative-western-blotting-how-and-why-you-should-validate-your-antibodies/]