Targeting STAT SH2 Domains: A Computational Guide to pY and pY+3 Pocket Docking for Drug Discovery
This article provides a comprehensive resource for researchers and drug development professionals on employing molecular docking to target the phosphotyrosine (pY) and pY+3 pockets of STAT SH2 domains.
Targeting STAT SH2 Domains: A Computational Guide to pY and pY+3 Pocket Docking for Drug Discovery
Abstract
This article provides a comprehensive resource for researchers and drug development professionals on employing molecular docking to target the phosphotyrosine (pY) and pY+3 pockets of STAT SH2 domains. It covers the foundational structural biology of these domains, detailed methodological protocols for virtual screening and pose prediction, strategies for troubleshooting common docking challenges, and frameworks for the biochemical validation of predicted inhibitors. By integrating the latest computational and experimental research, this guide aims to bridge in silico predictions with successful biological outcomes, accelerating the development of novel therapeutics for cancer and immune disorders driven by aberrant STAT signaling.
Decoding the STAT SH2 Domain: Structural Blueprint of the pY and pY+3 Pockets
The Src Homology 2 (SH2) domain is a protein interaction module of approximately 100 amino acids that specifically recognizes phosphotyrosine (pTyr) motifs, playing a pivotal role in cellular signaling networks [1] [2]. First identified in the v-Src oncoprotein, SH2 domains have since been found in over 110 human proteins, including kinases, phosphatases, adaptors, and transcription factors [1] [3] [2]. Their primary function is to recruit proteins to tyrosine-phosphorylated sites, thereby inducing proximity between enzymes and their substrates and facilitating the assembly of signaling complexes downstream of receptor tyrosine kinases and cytokine receptors [1]. This application note details the structural features of the canonical SH2 fold, compares its manifestations in prototypical SRC and STAT families, and provides practical methodologies for investigating SH2 domain interactions, with an emphasis on applications in molecular docking and drug discovery.
The Canonical SH2 Domain Structure
All SH2 domains adopt a highly conserved three-dimensional fold, despite significant sequence variation among family members [1] [2]. The core structure consists of a central anti-parallel β-sheet flanked by two α-helices, forming an αβββα sandwich [1] [4] [2]. The major secondary structural elements are denoted as αA-βA-βB-βC-βD-αB, with many SH2 domains containing additional β-strands (βE, βF, and βG) [1] [2]. The N-terminal region, particularly the βB strand, is highly conserved and forms the pTyr-binding pocket. The C-terminal region is more variable and contributes to ligand specificity [1] [2].
Table 1: Core Structural Elements of the Canonical SH2 Domain Fold
| Structural Element | Description | Functional Role |
|---|---|---|
| Central β-Sheet | Three-stranded anti-parallel sheet (βB-βC-βD) [4] | Scaffold for peptide binding |
| Flanking α-Helices | αA and αB helices [4] | Form binding surfaces |
| pTyr Binding Pocket | Located near βB strand, contains FLVR motif [1] [2] | Binds phosphorylated tyrosine |
| Specificity Pocket | Formed by αB, βG, and loops [5] | Recognizes C-terminal residues |
The Phosphotyrosine Binding Mechanism
SH2 domains engage their ligands through a characteristic bidentate, "two-pronged plug" interaction [5]. The domain recognizes two key features of the target peptide:
- The phosphorylated tyrosine residue (pTyr) itself.
- The amino acid side chain, typically at the +3 position C-terminal to the pTyr, which confers binding specificity [5].
The phosphate moiety of pTyr is coordinated by a deeply conserved arginine residue at position βB5, which is part of the signature FLVR motif [1] [5]. This arginine forms critical bidentate hydrogen bonds with the phosphate, contributing up to half of the total binding free energy [5]. Mutations of this arginine can reduce binding affinity by up to 1,000-fold [5]. Additional basic residues at positions αA2 or βD6 often assist in phosphate coordination, defining two major SH2 classes: Src-like (basic at αA2) and SAP-like (basic at βD6) [5].
Figure 1: The canonical "two-pronged plug" binding mechanism of SH2 domains. The phosphotyrosine residue docks into a conserved pocket containing the FLVR arginine, while the specificity residue (e.g., at +3 position) engages a separate hydrophobic pocket.
Comparative Analysis: SRC vs. STAT SH2 Domains
SRC Family SH2 Domains
SRC-family kinases (e.g., SRC, FYN, LCK) are non-receptor tyrosine kinases that contain SH2 domains crucial for their regulation and function [6] [7]. In these proteins, the SH2 domain participates in intramolecular autoinhibition. In the inactive state, the SH2 domain binds a C-terminal phosphotyrosine residue, while the SH3 domain engages a proline-rich linker, together locking the kinase in a repressed conformation [6] [7]. Release of the SH2 domain from the pTyr, upon dephosphorylation or competitive binding, activates the kinase [6] [7].
Studies on the Fyn SH2 domain reveal that information about ligand binding at the pTyr pocket is communicated to distal sites, such as the linkers connecting to the SH3 and kinase domains, via a network of dynamically correlated residues, enabling allosteric control without large conformational changes [7].
STAT Family SH2 Domains
STAT (Signal Transducer and Activator of Transcription) proteins are transcription factors whose activation is directly mediated by their SH2 domains [4] [8] [9]. The STAT SH2 domain performs two essential functions:
- Receptor Recruitment: It binds to phosphorylated tyrosine residues on activated cytokine or growth factor receptors [8] [9].
- Dimerization: It mediates reciprocal SH2-pTyr interaction between two STAT monomers, forming an active dimer that translocates to the nucleus [4] [9].
STAT SH2 domains are structurally distinct, classified as the STAT-type, which lack the βE and βF strands and have a split αB helix compared to the SRC-type [2]. This adaptation is thought to facilitate the specific dimerization function [2].
Table 2: Functional Comparison of SRC-family and STAT-family SH2 Domains
| Feature | SRC-family SH2 Domains | STAT-family SH2 Domains |
|---|---|---|
| Primary Role | Intramolecular regulation of kinase activity [6] [7] | STAT dimerization and nuclear translocation [4] [9] |
| Binding Partners | C-terminal pTyr (auto-inhibition), other signaling proteins [6] | Cytokine receptors, other STAT monomers [8] [9] |
| Structural Type | SRC-type [2] | STAT-type (lacks βE, βF strands; split αB helix) [2] |
| Key Binding Site | pTyr and +3 hydrophobic residue [5] | pTyr+0 and pY+1 pockets (e.g., pY705 and L706 in STAT3) [4] |
| Therapeutic Targeting | Oncology, immune disorders | Oncology (e.g., STAT3 inhibitors in cancer) [4] [9] |
Experimental Protocols for SH2 Domain Research
Molecular Docking to STAT SH2 Domains: A Computational Protocol
Targeting the SH2 domain of STAT3, a highly validated oncology target, is a prime application of molecular docking. The following protocol is adapted from recent virtual screening studies [4] [9].
Objective: To identify small-molecule inhibitors of the STAT3 SH2 domain using structure-based virtual ligand screening.
Workflow Overview:
Figure 2: Computational workflow for virtual screening of STAT3 SH2 domain inhibitors.
Step-by-Step Procedure:
Protein Structure Preparation
- Retrieve the STAT3 SH2 domain crystal structure (e.g., PDB ID: 6NJS, resolution 2.70 Å) [4].
- Use a protein preparation wizard to add hydrogen atoms, assign bond orders, and fill missing side chains or loops.
- Optimize the hydrogen-bonding network and perform energy minimization using a force field like OPLS3e [4].
Ligand Library Preparation
- Obtain a database of natural compounds or small molecules (e.g., ZINC15 database).
- Prepare ligands using LigPrep or similar tools: generate 3D structures, possible ionization states at physiological pH (7.4 ± 0.5), and stereoisomers [4].
Receptor Grid Generation
- Define the docking grid around the SH2 domain's pTyr binding pocket. Use the coordinates of a co-crystallized ligand as a reference (e.g., center at X:13.22, Y:56.39, Z:0.27) [4].
- Set the inner box size to fit the ligand (e.g., 10 Å) and the outer box size to 20 Å.
- Validate the grid by redocking the native ligand and ensuring the root-mean-square deviation (RMSD) of the pose is acceptable (<2.0 Å) [4].
Hierarchical Docking and Screening
- Perform High-Throughput Virtual Screening (HTVS) of the entire library to rapidly filter out poor binders.
- Subject top hits from HTVS to more accurate Standard Precision (SP) docking.
- Finally, dock the best SP compounds using Extra Precision (XP) mode for a refined assessment of binding poses and scores [4]. Focus on compounds that form key interactions with residues in the pY+0 pocket (e.g., Arg609, Ser611, Ser613, Ser636) and the pY+1 pocket (e.g., Leu706) of STAT3 [4].
Binding Free Energy Calculation
- For the top-ranked poses, calculate the binding free energy (ΔG~Binding~) using Molecular Mechanics/Generalized Born Surface Area (MM-GBSA).
- Use the formula: ΔG~Binding~ = G~Complex~ - (G~Receptor~ + G~Ligand~). More negative values indicate stronger binding [4].
Molecular Dynamics (MD) Simulation
- Solvate the protein-ligand complex in an explicit water model (e.g., TIP3P) and add ions to neutralize the system.
- Equilibrate the system and run an MD production simulation (e.g., 50-100 ns) to evaluate complex stability, ligand pose retention, and key interaction persistence over time [9]. Using an averaged structure from the MD trajectory for docking can account for domain flexibility and improve hit rates [9].
The Scientist's Toolkit: Research Reagent Solutions
Table 3: Essential Reagents and Tools for SH2 Domain Research
| Reagent / Tool | Function / Application | Example / Note |
|---|---|---|
| Recombinant SH2 Domains | In vitro binding assays (SPR, ITC), structural studies | Cloned from human SH2 domains (120 domains identified) [3] |
| Oriented Peptide Array Libraries (OPAL) | Define SH2 domain binding specificity and motifs [3] | Phosphotyrosine peptide libraries |
| STAT3 SH2 Domain Inhibitors | Positive controls for functional assays; lead compounds | Stattic, SD-36, CJ-887 (peptidomimetic) [4] [9] |
| Phosphopeptide Ligands | Specific SH2 domain probes in binding & competition assays | Derived from known interactors (e.g., STAT3 pY705 peptide) [9] |
| Computational Software Suites | Molecular docking, dynamics, and virtual screening | Schrödinger Maestro Suite, GLIDE [4] |
The canonical SH2 domain fold exemplifies how a conserved structural scaffold can be adapted for diverse biological functions, from the allosteric regulation of SRC-family kinases to the dimerization-driven activation of STAT transcription factors. Understanding the nuanced structural and functional differences between these families is paramount for rational drug design. The experimental protocols detailed here, particularly the computational approach for targeting the STAT3 SH2 domain, provide a robust framework for advancing research and therapeutic development. As techniques like molecular dynamics and virtual screening continue to evolve, they will undoubtedly yield more potent and selective inhibitors, ultimately translating this fundamental knowledge into clinical applications.
The Src Homology 2 (SH2) domain is a approximately 100-amino-acid modular unit that is fundamental to phosphotyrosine-mediated signaling in metazoans, playing a critical role in assembling specific protein complexes in response to extracellular stimuli [10] [2]. In Signal Transducers and Activators of Transcription (STAT) proteins, the SH2 domain is indispensable for canonical activation, facilitating both recruitment to phosphorylated cytokine receptors and the subsequent dimerization of STAT monomers through reciprocal phosphotyrosine-SH2 domain interactions [10] [11]. This dimerization is a prerequisite for nuclear translocation and the transcriptional activation of genes involved in proliferation, survival, and immune responses [4] [11]. The critical role of STAT proteins, particularly STAT3 and STAT5, in cancer progression and immune disorders has made their SH2 domains a prominent target for therapeutic intervention [4] [10]. A deep understanding of the anatomy of the SH2 binding site, specifically its defined sub-pockets, is therefore essential for rational drug design within the broader context of molecular docking research.
All SH2 domains share a conserved fold characterized by a central anti-parallel β-sheet flanked by two α-helices, forming an αβββα motif [10] [2]. However, STAT-type SH2 domains possess unique features that distinguish them from Src-type domains. Most notably, the STAT-type SH2 domain lacks the βE and βF strands and has a split αB helix, which is an adaptation believed to facilitate its primary function in dimerization [2]. The binding site for phosphopeptides is located on the surface of this conserved fold and is functionally partitioned into key sub-pockets that determine binding affinity and specificity.
Structural Definition of the Key Sub-Pockets
The SH2 domain binding cleft is structurally and functionally divided into specific sub-pockets that accommodate residues of the phosphorylated peptide ligand. The primary pockets are designated relative to the position of the phosphotyrosine (pY) residue.
The pY (Phosphotyrosine) Pocket
The pY pocket, also referred to as the pY+0 site, is the primary and most conserved binding site within the SH2 domain [12] [13]. It is a deep, positively charged pocket that specifically recognizes and binds the phosphotyrosine moiety of the ligand [2]. This pocket is formed by the αA helix, the BC loop, and one face of the central β-sheet [10]. A nearly invariant arginine residue (e.g., Arg609 in STAT3) located at position βB5 within the FLVR motif forms a critical salt bridge with the phosphate group, providing a substantial portion of the binding enthalpy [4] [2]. Due to its high conservation across STAT family members, this pocket is a primary driver of binding affinity but can also be a source of cross-reactivity for small-molecule inhibitors [12].
The pY+3 (Specificity) Pocket
Located C-terminal to the pY pocket, the pY+3 pocket is a major determinant of binding specificity [10]. This pocket is formed by the opposite face of the central β-sheet, residues from the αB helix, and the CD and BC* loops [10]. It is designed to accommodate the amino acid residue located three positions C-terminal to the phosphotyrosine (pY+3) in the peptide ligand [10]. The structural composition and electrostatic properties of this pocket vary between different SH2 domain-containing proteins, allowing them to discriminate between different phosphopeptide sequences and thus ensuring signaling fidelity. In STAT proteins, this pocket is critical for stabilizing the specific interactions required for STAT dimerization.
Table 1: Key Characteristics of SH2 Domain Sub-Pockets
| Sub-Pocket | Alternative Names | Primary Function | Key Structural Components | Conservation |
|---|---|---|---|---|
| pY / pY+0 | Phosphate-binding pocket | Binds the phosphotyrosine (pY) moiety; provides major binding affinity | αA helix, BC loop, central β-sheet, invariant Arg (e.g., STAT3 R609) | High |
| pY+3 | Specificity pocket | Binds the pY+3 residue; determines binding specificity | Opposite face of β-sheet, αB helix, CD and BC* loops | Low to Moderate |
| pY-X | Side pocket, Hydrophobic pocket | Unique to STAT3; enhances inhibitor selectivity | Formed by hydrophobic residues; not found in other SH2 proteins [13] | Very Low (STAT3-specific) |
The STAT3-Specific pY-X Pocket
In addition to the canonical pY and pY+3 pockets, the SH2 domain of STAT3 contains a unique hydrophobic sub-pocket known as the pY-X or side pocket [13]. This pocket is not found in other SH2 domain-containing proteins, making it an attractive target for achieving selective inhibition of STAT3 over other STAT family members (e.g., STAT1) or unrelated proteins with SH2 domains [13]. Ligands designed to occupy the pY-X pocket in addition to the pY pocket have demonstrated improved selectivity profiles, as this dual engagement exploits a topological feature unique to STAT3 [13].
The following diagram illustrates the overall architecture of the STAT SH2 domain and the spatial relationship between its key sub-pockets.
Quantitative Characterization of Sub-Pocket Properties
The functional characterization of the SH2 sub-pockets reveals distinct energetic contributions and binding preferences, which are critical for inhibitor design.
Energetic Contributions and Binding Affinities
The pY+0 pocket provides the largest favorable binding enthalpy due to the strong electrostatic interactions between the invariant arginine and the phosphate group, making it the primary contributor to binding affinity [13]. While the pY+3 and pY-X pockets contribute less to the overall binding energy, they are crucial for determining specificity and selectivity, respectively [13]. The affinity of SH2 domains for their cognate phosphopeptide ligands typically falls in the moderate range, with dissociation constants (Kd) between 0.1 and 10 µM, allowing for specific yet readily reversible interactions that are essential for dynamic signaling [2].
Key Residues for Molecular Recognition
The binding specificity and affinity are mediated by specific amino acid residues within each sub-pocket. Mutations in these residues can profoundly disrupt STAT3 signaling and activation [4].
Table 2: Key Residues in the STAT3 SH2 Domain Sub-Pockets
| Sub-Pocket | Key Residues (STAT3) | Role in Binding and Function | Impact of Mutation |
|---|---|---|---|
| pY / pY+0 | Arg609, Lys591, Ser611, Ser614, Glu594 | Arg609 forms salt bridge with phosphate; others stabilize binding [4]. | R609G mutation causes AD-HIES [10]. S611 and S614 mutations are linked to AD-HIES and leukemias [10]. |
| pY+3 | Tyr657, Gln644, Thr640, Glu638, Trp623 [4] | Forms hydrophobic and polar contacts with the pY+3 residue of the peptide. | Critical for stabilizing STAT dimers; mutations can impair dimerization and nuclear translocation. |
| pY-X | Hydrophobic residues (e.g., Ile634) [14] | Creates a unique hydrophobic environment for selective inhibitor binding. | Targeting this pocket minimizes off-target effects on other STAT family members [13]. |
Experimental Protocols for Sub-Pocket Analysis
This section provides detailed methodologies for key experiments used to characterize ligand binding to the STAT SH2 domain sub-pockets.
Computational Docking and Virtual Screening Protocol
Objective: To identify and rank potential small-molecule inhibitors targeting the pY, pY+3, and pY-X pockets of the STAT3 SH2 domain in silico.
Protein Preparation:
- Retrieve the STAT3 SH2 domain crystal structure (e.g., PDB ID: 6NJS) from the Protein Data Bank.
- Use a protein preparation wizard (e.g., Schrödinger's Protein Preparation Wizard) to add hydrogen atoms, assign bond orders, fill in missing side chains and loops, and correct protonation states at pH 7.4.
- Perform energy minimization using a force field (e.g., OPLS3e) to relieve steric clashes and obtain a stable, low-energy protein structure.
Ligand Library Preparation:
- Retrieve a database of natural or synthetic compounds (e.g., ZINC15).
- Prepare ligands using a tool (e.g., LigPrep) to generate 3D structures, optimize geometries, and generate possible ionization states and tautomers at physiological pH (7.4 ± 0.5).
Receptor Grid Generation:
- Define the binding site by creating a grid box centered on the co-crystallized ligand or the known binding cleft. Typical coordinates for STAT3 are centered near X:13.22, Y:56.39, Z:0.27 with a box size of 20 Å.
- Validate the grid by redocking the native ligand and ensuring the root-mean-square deviation (RMSD) of the generated pose from the original is acceptably low (< 2.0 Å).
Docking Simulations:
- Perform hierarchical docking using a tool like GLIDE: a. High-Throughput Virtual Screening (HTVS): Rapidly screen the entire compound library. b. Standard Precision (SP): Re-dock the top-scoring compounds from HTVS for more accurate scoring. c. Extra Precision (XP): Dock the best compounds from SP to generate a refined list of top hits with high binding affinity (e.g., docking score < -6.5 kcal/mol) [4].
Analysis:
Molecular Dynamics (MD) Simulation and Analysis Protocol
Objective: To evaluate the stability of protein-ligand complexes identified from docking and investigate the dynamic behavior of the sub-pockets.
System Setup:
- Solvate the protein-ligand complex in an orthorhombic water box (e.g., TIP3P water model) with a buffer distance of at least 10 Å.
- Add counterions to neutralize the system's charge.
Simulation Run:
- Use an MD simulation package (e.g., Desmond) with an appropriate force field (e.g., OPLS3e).
- Equilibrate the system using a standard protocol (minimization, NVT, NPT equilibration).
- Run a production simulation for a sufficient timescale (typically 50-100 ns or longer) at constant temperature (310 K) and pressure (1 atm).
Trajectory Analysis:
- Root-Mean-Square Deviation (RMSD): Calculate the RMSD of the protein backbone and the ligand to assess the overall stability of the complex. A stable complex will reach a plateau.
- Root-Mean-Square Fluctuation (RMSF): Calculate the RMSF of protein residues to identify flexible regions. The binding site should show relatively low fluctuation if the ligand is stably bound.
- Residue-Contact Frequency Analysis: Use tools like
mdciaoto compute the frequency of specific contacts (e.g., < 4.5 Å) between the ligand and key sub-pocket residues throughout the simulation trajectory [15]. This quantifies the persistence of critical interactions. - Binding Free Energy Calculation: Perform Molecular Mechanics with Generalized Born and Surface Area solvation (MM-GBSA) calculations on simulation frames to estimate the binding free energy (ΔG~Binding~) and confirm the binding affinity predicted by docking [4].
The workflow for the integrated computational approach is summarized below.
Fluorescence Polarization (FP) Competitive Binding Assay
Objective: To experimentally validate direct binding of inhibitors to the SH2 domain and measure their ability to disrupt phosphopeptide interactions.
Sample Preparation:
- Express and purify the recombinant STAT3 SH2 domain protein.
- Acquire a fluorescently labeled phosphopeptide that is a known high-affinity ligand for the STAT3 SH2 domain (e.g., FITC-GpYLPQTV).
Assay Procedure:
- Prepare a series of concentrations of the test compound.
- In a microplate, mix a fixed, low concentration of the fluorescent peptide with the purified SH2 domain protein to form a complex. The concentration of the protein should be around its Kd for the peptide to ensure sensitive competition.
- Add increasing concentrations of the test inhibitor to the wells.
- Incubate the plate in the dark to allow for competitive binding equilibrium.
Data Acquisition and Analysis:
- Measure the fluorescence polarization (mP units) for each well using a plate reader.
- Plot the polarization value against the logarithm of the inhibitor concentration.
- Fit the data to a sigmoidal dose-response curve to determine the IC50 value, which represents the concentration of inhibitor required to displace 50% of the fluorescent peptide [11]. A lower IC50 indicates a higher binding affinity for the SH2 domain.
The Scientist's Toolkit: Research Reagent Solutions
Table 3: Essential Reagents for STAT SH2 Domain Research
| Research Reagent | Function and Application | Example Use Case |
|---|---|---|
| Recombinant STAT3 SH2 Domain Protein | Purified protein for in vitro binding assays (FP, SPR) and crystallization studies. | Used as the direct target in FP competitive binding assays to measure inhibitor affinity [11]. |
| Fluorescent Phosphopeptide (e.g., FITC-GpYLPQTV) | High-affinity tracer ligand for fluorescence polarization (FP) and FRET-based binding assays. | Competes with small-molecule inhibitors for binding to the pY pocket in FP assays [11]. |
| Stattic | Well-characterized small-molecule STAT3 inhibitor; used as a reference compound and positive control. | Benchmark for comparing the potency and efficacy of novel inhibitors in cellular and biochemical assays [12] [13]. |
| S3I-201 | A commercial STAT3 SH2 domain inhibitor; used as a reference compound in mechanistic studies. | Served as a comparator in co-immunoprecipitation and luciferase reporter assays to evaluate novel compounds [11]. |
| Schrödinger Maestro Suite | Integrated software for structure-based drug design, including molecular docking, MM-GBSA, and MD simulations. | Utilized for virtual screening of natural compound libraries against the STAT3 SH2 domain [4]. |
| GROMACS / Desmond | Molecular dynamics simulation software for studying protein-ligand complex stability and dynamics. | Employed to run 50-100 ns simulations to validate the stability of docked complexes and calculate RMSD/RMSF [4]. |
| mdciao Python API | A tool for accessible analysis of MD simulation data, focusing on residue-residue contact frequencies. | Used to compute and visualize the persistence of contacts between an inhibitor and key sub-pocket residues over an MD trajectory [15]. |
The precise structural and functional definition of the pY, pY+3, and pY-X sub-pockets within the STAT SH2 domain provides a critical roadmap for rational drug design. The pY pocket serves as the primary anchor for binding, the pY+3 pocket dictates specificity, and the STAT3-unique pY-X pocket offers a strategic avenue for achieving selective inhibition. The integrated application of computational protocols—ranging from hierarchical docking and binding free energy calculations to molecular dynamics simulations—enables the efficient identification and optimization of small-molecule inhibitors. When coupled with experimental validation through techniques like fluorescence polarization, this structured approach to targeting defined sub-pockets significantly advances the development of targeted therapies against STAT-driven diseases, particularly in oncology.
The Src Homology 2 (SH2) domain is a crucial protein module that specifically recognizes phosphotyrosine (pY) motifs, thereby playing an indispensable role in cellular signal transduction. Approximately 120 SH2 domains are encoded in the human genome, all sharing a highly conserved fold yet exhibiting remarkable diversity in ligand specificity [16] [2] [17]. This specificity determines their function in various physiological processes and disease pathways, making them attractive therapeutic targets. While the phosphotyrosine-binding pocket is largely conserved, the molecular mechanism enabling different SH2 domains to select distinct sequence motifs has been extensively investigated. Emerging evidence indicates that the EF and BG loops, which are variable in sequence and conformation, serve as critical determinants of specificity by controlling access to key binding pockets [16]. This application note explores the structural basis of this mechanism and provides detailed protocols for investigating loop-mediated specificity, with a particular focus on applications in STAT SH2 domain research and drug discovery.
Structural Architecture of SH2 Domains and Their Loops
The Conserved SH2 Fold
All SH2 domains adopt a conserved fold comprising a central anti-parallel β-sheet flanked by two α-helices, forming a characteristic αβββα motif [2] [4] [17]. The N-terminal region is highly conserved and contains a deep pocket that binds the phosphate moiety of phosphotyrosine. This pocket features an invariant arginine residue (ArgβB5) that forms a salt bridge with the phosphate, a interaction critical for phosphotyrosine recognition [2] [17]. The C-terminal region exhibits greater variability and contributes to ligand specificity.
Defining the EF and BG Loops
The loops connecting secondary structural elements, particularly the EF loop (joining β-strands E and F) and the BG loop (joining the α-helix B and β-strand G), are crucial for SH2 domain function [16] [2]. Although these loops display significant sequence variation across different SH2 domains, they maintain conserved structural features that govern binding pocket accessibility [16].
- EF Loop: This loop often contains bulky residues that can physically block certain binding subsites, thereby influencing peptide conformation and recognition.
- BG Loop: This flexible loop can adopt different conformations that either permit or restrict access to hydrophobic binding pockets, directly impacting ligand selectivity.
Table 1: Key Structural Elements of SH2 Domains
| Structural Element | Description | Functional Role |
|---|---|---|
| Central β-sheet | Three-stranded anti-parallel β-sheet | Provides structural scaffold for the domain |
| αA and αB helices | Two α-helices flanking the β-sheet | Contribute to structural stability and pY binding |
| pY binding pocket | Formed by βB, βC, βD, αA, and BC loop | Binds phosphotyrosine via conserved ArgβB5 |
| EF loop | Connects β-strands E and F | Controls access to P+2/P+3 binding pockets |
| BG loop | Connects α-helix B and β-strand G | Controls access to P+3/P+4 binding pockets |
Molecular Mechanism: How Loops Control Pocket Accessibility and Specificity
The Gating Mechanism of Binding Pockets
Structural analyses of SH2 domain complexes have revealed that the EF and BG loops function as molecular gates that control ligand access to key binding subsites. Research indicates that SH2 domains contain up to three binding pockets that exhibit selectivity for the three residues C-terminal to the phosphotyrosine (P+1 to P+3) [16]. The conformation and composition of the EF and BG loops define the accessibility and shape of these pockets through several mechanisms:
Steric Blockade: Bulky residues in the EF loop can physically occupy binding pockets, preventing their engagement with peptide residues. For instance, in the Grb2 SH2 domain (group IC), a tryptophan residue in the EF loop (EF1-Trp) occupies the P+3 hydrophobic pocket, forcing the bound peptide to adopt a β-turn conformation and shifting specificity toward asparagine at P+2 [16].
Conformational Flexibility: The BG loop exhibits considerable flexibility, allowing it to adopt "open" or "closed" conformations that either permit or block access to adjacent binding pockets. In the BRDG1 SH2 domain, the BG loop retracts to expose a hydrophobic "pentagon basket" that accommodates residues at the P+4 position [16].
Pocket Definition: The spatial arrangement of these loops molds the architecture of binding cavities, creating distinct chemical environments that favor specific amino acid side chains.
Structural Basis of Specificity Groups
The loop-controlled gating mechanism explains how different SH2 domain classes achieve distinct binding specificities:
- Group IA, IB, IIA, IIB SH2 domains: Feature accessible P+3 hydrophobic pockets defined by the EF and BG loops, selecting for peptides with hydrophobic residues at P+3 [16].
- Group IC SH2 domains: Contain an EF loop that blocks the P+3 pocket, creating instead a specialized P+2 binding site that recognizes asparagine [16].
- Group IIC SH2 domains (BRDG1, BKS, Cbl): Exhibit a unique conformation where both EF and BG loops are positioned to expose a P+4 binding pocket, enabling recognition of hydrophobic residues at the P+4 position [16].
- STAT-type SH2 domains: Represent a distinct structural subclass that lacks the EF loop entirely and features an open BG loop, resulting in a different binding mode that facilitates STAT dimerization [2].
Diagram: Mechanism of Loop-Controlled Pocket Accessibility in SH2 Domains. The EF and BG loops function as molecular gates that control access to specific binding pockets, thereby determining ligand specificity.
Experimental Protocols for Investigating Loop Function
Protocol 1: Computational Analysis of Loop Conformations and Pocket Accessibility
Purpose: To characterize the structural role of EF and BG loops in STAT SH2 domains and identify potential allosteric binding sites.
Workflow:
- Protein Structure Preparation:
- Retrieve STAT SH2 domain structures from PDB (e.g., 6NJS for STAT3)
- Use Protein Preparation Wizard (Schrödinger) to add hydrogen atoms, assign bond orders, and fill missing side chains
- Optimize hydrogen bonding networks and minimize structure using OPLS3e force field
Molecular Dynamics Simulations:
- Solvate the system in explicit water model (TIP3P) with 150 mM NaCl
- Equilibrate using NPT ensemble (310 K, 1 atm) for 100 ns
- Analyze root mean square fluctuation (RMSF) of EF and BG loops
- Calculate pocket volume changes during simulation using MDTraj
Binding Pocket Analysis:
- Identify subpockets (pY+X, pY+0, pY+1) using FPocket algorithm
- Map electrostatic surfaces using APBS tools
- Calculate druggability scores for each subpocket
Molecular Docking:
- Generate grid boxes centered on pY and pY+3 pockets
- Perform high-throughput virtual screening (HTVS) followed by standard precision (SP) and extra precision (XP) docking
- Validate docking protocol by redocking native ligands (RMSD < 2.0 Å)
Applications: This protocol enables identification of natural compounds targeting STAT3-SH2 domain, such as ZINC67910988, which demonstrated superior stability in molecular dynamics simulations [4].
Protocol 2: Loop Engineering and Specificity Profiling
Purpose: To experimentally validate the role of specific loop residues in controlling binding specificity through mutagenesis and biophysical characterization.
Workflow:
- Site-Directed Mutagenesis:
- Design loop swap mutations based on multiple sequence alignment
- Introduce point mutations in EF (e.g., Trp→Ala) and BG loop residues using QuikChange protocol
- Verify mutations by Sanger sequencing
Protein Expression and Purification:
- Express WT and mutant SH2 domains in E. coli BL21(DE3)
- Purify using Ni-NTA affinity chromatography followed by size exclusion chromatography
- Confirm purity and monodispersity by SDS-PAGE and analytical SEC
Binding Affinity Measurements:
- Synthesize phosphopeptides representing cognate ligands
- Determine binding kinetics using surface plasmon resonance (Biacore T200)
- Use single-cycle kinetics mode with 5 concentrations (0.1-10 × KD)
- Calculate KD, kon, and koff values using 1:1 Langmuir binding model
Specificity Profiling:
- Screen mutant SH2 domains against oriented peptide array library (OPAL)
- Identify sequence motifs using custom Perl scripts
- Compare specificity profiles to wild-type domain
Applications: This approach has successfully engineered novel SH2 domain specificities by modifying loop sequences, demonstrating the critical role of loops in determining ligand recognition [16].
Protocol 3: Structural Characterization of SH2-Peptide Complexes
Purpose: To determine high-resolution structures of SH2 domain complexes and elucidate conformational changes in EF/BG loops upon ligand binding.
Workflow:
- Crystallization:
- Concentrate SH2 domain to 10-15 mg/mL in 20 mM HEPES pH 7.5, 150 mM NaCl
- Set up crystallization screens using commercial kits (Hampton Research)
- Optimize hits using additive screens and seeding
- Co-crystallize with phosphopeptides at 1:5 molar ratio
X-ray Data Collection and Structure Determination:
- Flash-cool crystals in liquid nitrogen with 20% glycerol as cryoprotectant
- Collect data at synchrotron source (resolution target <2.5 Å)
- Process data with XDS or HKL-2000
- Solve structures by molecular replacement using known SH2 domain as search model
- Refine with iterative cycles in Phenix and Coot
Structural Analysis:
- Measure loop conformational changes by calculating RMSD values
- Analyze binding interfaces with PISA server
- Map water networks and hydrogen bonding patterns
Applications: This protocol enabled determination of the SOCS2-ElonginB-ElonginC complex with phosphorylated peptides from growth hormone receptor, revealing how the EF loop captures different conformations via specific hydrophobic interactions [18].
Table 2: Key Research Reagents for SH2 Domain Studies
| Reagent / Method | Specifications | Application | Reference Example |
|---|---|---|---|
| STAT3 SH2 domain | PDB ID: 6NJS, Resolution: 2.70 Å | Molecular docking and dynamics | [4] |
| Oriented Peptide Array Library (OPAL) | Library of pY-containing peptides | Specificity profiling | [16] |
| Surface Plasmon Resonance | Biacore T200, CMS chips | Binding kinetics measurement | [18] |
| Natural compound library | ZINC15 database (182,455 compounds) | Virtual screening | [4] |
| Crystallization screens | Hampton Research Index screen | Structure determination | [18] |
Application in STAT SH2 Domain-Targeted Drug Discovery
Targeting the STAT3 SH2 Domain for Cancer Therapy
The STAT3 SH2 domain represents a particularly promising therapeutic target due to its essential role in STAT3 activation through tyrosine phosphorylation (Y705) and subsequent dimerization [4]. Unlike conventional SH2 domains, STAT-type SH2 domains lack the EF loop and feature a more open BG loop configuration, creating a unique binding landscape [2]. Disrupting STAT3 dimerization by targeting its SH2 domain has emerged as a viable strategy for cancer therapy, particularly for tumors with constitutive STAT3 activation.
Key residues involved in STAT3 SH2 domain function include Arg609, Glu594, Lys591, Ser636, Ser611, Val637, Tyr657, Gln644, Thr640, Glu638, and Trp623, which participate in direct or indirect binding to phosphotyrosine motifs [4]. The binding pocket can be divided into three subsites:
- pY+X: Binds hydrophobic side chains
- pY+0: Engages phosphotyrosine705
- pY+1: Accommodates leucine706
Computational Screening for STAT3 SH2 Inhibitors
Recent advances in computational methods have enabled high-throughput screening of natural compound libraries against the STAT3 SH2 domain [4]. A typical workflow involves:
- Retrieving 182,455 natural compounds from ZINC15 database
- Sequential docking using HTVS, SP, and XP modes
- Binding free energy calculations with MM-GBSA
- Pharmacokinetic property assessment with QikProp
- Molecular dynamics simulations (100-200 ns) for stability evaluation
- WaterMap analysis to characterize binding thermodynamics
This approach identified ZINC67910988 as a promising STAT3 inhibitor with favorable binding affinity, stability in molecular dynamics simulations, and desirable pharmacokinetic properties [4]. Network pharmacology analysis further revealed the multi-target potential of such compounds, helping to map their interactions within biological networks and minimize off-target effects.
The EF and BG loops serve as critical structural determinants that govern SH2 domain specificity by controlling access to key binding pockets. This loop-mediated gating mechanism explains how a highly conserved protein fold can recognize diverse phosphotyrosine motifs and regulate specific signaling pathways. The experimental protocols outlined in this application note provide comprehensive methodologies for investigating loop function, engineering novel specificities, and developing therapeutic compounds that target disease-relevant SH2 domains such as STAT3. As structural and computational methods continue to advance, the ability to precisely modulate SH2 domain function through loop-targeted interventions will open new avenues for basic research and therapeutic development.
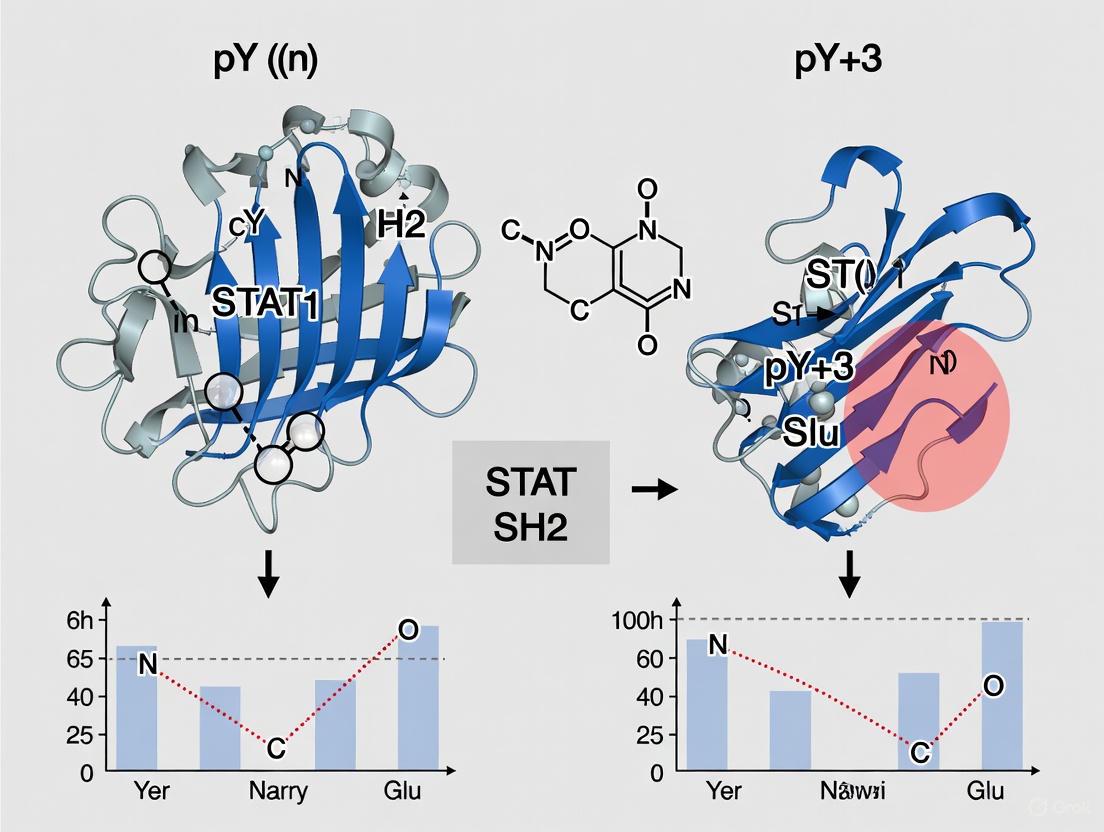
The Src Homology 2 (SH2) domain represents a critical modular unit within signal transducer and activator of transcription (STAT) proteins, serving as the primary mediator of phosphotyrosine-based signaling events that govern cellular processes ranging from proliferation to immune response [10] [1]. These approximately 100-amino-acid domains emerged approximately 600 million years ago, coinciding with the evolution of multicellular life and the consequent need for sophisticated intercellular communication networks [10]. Among the diverse family of SH2 domain-containing proteins, STAT-type SH2 domains exhibit distinctive structural adaptations that specifically facilitate their unique role in transcriptional regulation through reciprocal phosphotyrosine-SH2 domain interactions during dimerization [10] [2]. This application note delineates the unique structural features of STAT-SH2 domains, with particular emphasis on their influence over dimerization mechanisms and the consequent implications for targeted therapeutic development.
The fundamental structure of SH2 domains consists of a central anti-parallel β-sheet (βB-βD strands) flanked by two α-helices (αA and αB), forming a conserved αβββα motif [10] [1]. This architecture creates two functionally specialized subpockets: the phosphate-binding pocket (pY) that engages phosphorylated tyrosine residues, and the specificity pocket (pY+3) that determines peptide ligand selectivity through interactions with residues C-terminal to the phosphotyrosine [10]. STAT-type SH2 domains diverge from canonical Src-type SH2 domains through distinctive C-terminal structural elements—specifically, the presence of a C-terminal α-helix (αB') in STAT-type versus β-sheets (βE and βF) in Src-type domains [10] [2]. This structural distinction, coupled with unique loop configurations, enables STAT proteins to form stable dimers essential for nuclear translocation and DNA binding [2].
Table 1: Key Structural Motifs in STAT-SH2 Domains
| Structural Element | Description | Functional Role |
|---|---|---|
| Central β-sheet | Three anti-parallel strands (βB-βD) | Forms backbone of domain; partitions pY and pY+3 pockets |
| αA helix | Flanks one side of β-sheet | Contributes to pY pocket formation |
| αB helix | Flanks opposite side of β-sheet; split in STAT-type | Participates in pY+3 pocket and dimerization interface |
| pY pocket | Formed by αA helix, BC loop, and β-sheet | Binds phosphotyrosine moiety; contains conserved arginine (βB5) |
| pY+3 pocket | Formed by opposite face of β-sheet, αB helix, CD and BC* loops | Determines binding specificity; contains hydrophobic system |
| EAR region | C-terminal to pY+3 pocket; contains αB' helix in STAT-type | STAT-specific feature involved in dimer stabilization |
Unique Structural Determinants of STAT Dimerization
Molecular Architecture of the STAT Dimer Interface
STAT activation culminates in the formation of stable dimers through reciprocal phosphotyrosine-SH2 domain interactions between two STAT monomers [10] [19]. This dimerization event represents a critical control point in STAT signaling and is mediated by three distinct interfaces within the SH2 domain and its associated phosphotyrosine motif (PTM). The primary interface involves classical phosphotyrosine-SH2 domain engagement, where the phosphorylated tyrosine (Y705 in STAT3, Y694 in STAT5) of one monomer inserts into the pY pocket of the opposing monomer's SH2 domain [19]. This interaction is stabilized by a conserved salt bridge between the phosphate moiety and an invariant arginine residue (R618 in STAT5, R609 in STAT3) within the FLVRES motif of the βB strand [10] [19]. Additional hydrogen bonds with surrounding residues (K600, S620, S622, T628 in STAT5) further secure this interaction, with molecular dynamics simulations demonstrating >97% occupancy for these bonds during dimer stability [19].
The secondary interface consists of intermolecular PTM-PTM interactions between the C-terminal regions of the phosphotyrosine motifs from both monomers. In STAT5, this interface exhibits structural disorder but establishes a distinct network of hydrogen bonds (Q698, K700, and Q701) and hydrophobic contacts (P697, V702, I699) that contribute to dimer stability [19]. Notably, this PTM-PTM interface differs significantly from those observed in STAT1 and STAT3 dimers, reflecting STAT isoform-specific dimerization mechanisms [19]. The tertiary interface involves intramolecular interactions between the PTM and its own SH2 domain, a feature particularly pronounced in STAT5 where phenylalanine F706 (adjacent to the phosphotyrosine motif) engages a unique hydrophobic pocket on the SH2 domain surface [19]. This intramolecular interaction is dispensable for receptor-mediated phosphorylation but essential for subsequent dimer formation and nuclear accumulation, highlighting its allosteric regulatory function [19].
STAT-Specific Structural Adaptations
STAT-type SH2 domains possess several distinctive features that differentiate them from Src-type SH2 domains and optimize them for their role in transcription factor activation. The most notable distinction lies in the C-terminal evolutionary active region (EAR), where STAT-type domains contain an additional α-helix (αB') rather than the β-sheets (βE and βF) found in Src-type domains [10]. This structural variation creates differential surface topographies that influence both dimerization interfaces and potential drug-binding sites. Additionally, STAT SH2 domains exhibit unique loop configurations surrounding the pY+3 pocket, with the BC* loop participating directly in SH2-mediated STAT dimerization through cross-domain interactions [10]. These STAT-specific loops are less conserved than the central β-sheet region but contribute significantly to the precise geometric arrangement required for stable dimer formation.
Another critical STAT-specific feature is the hydrophobic system—a cluster of non-polar residues at the base of the pY+3 pocket that stabilizes the β-sheet conformation and maintains overall SH2 domain integrity [10]. This hydrophobic network assumes particular importance in STAT5, where it facilitates the intramolecular PTM-SH2 interaction through engagement with F706 [19]. Mutational studies confirm that disruption of this hydrophobic interface ablates dimerization capacity despite normal phosphorylation, validating its essential role in STAT activation [19]. Furthermore, STAT SH2 domains demonstrate inherent structural flexibility even on sub-microsecond timescales, with the accessible volume of the pY pocket varying dramatically [10]. This dynamic behavior complicates drug discovery efforts but presents opportunities for allosteric modulation through stabilization of specific conformational states.
Figure 1: STAT Activation Pathway - The canonical STAT activation pathway culminates in dimerization via reciprocal phosphotyrosine-SH2 domain interactions, a critical step targeted for therapeutic intervention.
Pathogenic Mutations and Functional Implications
Mutation Hotspots in STAT SH2 Domains
Comprehensive sequencing analyses of patient samples have identified the SH2 domain as a mutational hotspot in the STAT protein landscape, with both gain-of-function (GOF) and loss-of-function (LOF) mutations clustered in specific regions that dictate dimerization efficiency [10]. These mutations frequently alter the delicate equilibrium of SH2 domain dynamics, resulting in either pathological activation or functional impairment. In STAT3, germline LOF mutations typically manifest as autosomal-dominant hyper IgE syndrome (AD-HIES), characterized by recurrent staphylococcal infections, eczema, and eosinophilia due to diminished Th17 T-cell responses [10]. These mutations (e.g., K591E/M, R609G, S611G/N/I, S614G/R) predominantly localize to the pY pocket and surrounding regions, disrupting phosphotyrosine binding capacity and consequently impairing dimerization and nuclear accumulation [10].
Conversely, somatic GOF mutations in STAT3 and STAT5B drive oncogenic transformation through constitutive STAT activation independent of upstream signaling. In STAT5B, mutations such as N642H directly enhance dimer stability through mechanisms elucidated by molecular dynamics simulations [19]. The N642 residue (located at βD5 position) normally participates in hydrophobic stabilization of the phosphotyrosine aromatic ring; its mutation to histidine alters pocket geometry to favor strengthened SH2-phosphotyrosine interaction [19]. Similarly, STAT3 mutations including S614R and E616K demonstrate oncogenic potential across various hematologic malignancies, including T-cell large granular lymphocytic leukemia (T-LGLL) and natural killer T-cell lymphoma (NKTL) [10]. Strikingly, certain residues can harbor either activating or deactivating mutations depending on the specific amino acid substitution, underscoring the precise evolutionary optimization of STAT structural motifs [10].
Table 2: Disease-Associated Mutations in STAT SH2 Domains
| Mutation | Location | Pathology | Functional Effect | |
|---|---|---|---|---|
| STAT3 K591E/M | αA2 | pY | AD-HIES | Loss-of-function; impaired pY binding |
| STAT3 S611N | βB7 | pY | AD-HIES | Loss-of-function; disrupted phosphopeptide interaction |
| STAT3 S614R | BC3 | pY | T-LGLL, NK-LGLL | Gain-of-function; enhanced dimer stability |
| STAT3 E616K | BC5 | pY | NKTL | Gain-of-function; constitutive activation |
| STAT5B N642H | βD5 | pY | Leukemia | Gain-of-function; strengthened pY interaction |
| STAT5 S710F | CTS | - | Leukemia | Gain-of-function; enhanced dimerization |
Allosteric Networks and Dynamic Perturbations
Beyond direct binding pocket alterations, disease-associated mutations frequently exert allosteric effects that propagate through the STAT protein to influence functional outcomes. Hydrogen-deuterium exchange mass spectrometry studies demonstrate that ligand binding to the STAT3 SH2 domain induces decreased local dynamics at the binding site consistent with solvent exclusion, while simultaneously triggering increased deuterium uptake at distal regions important for DNA binding and nuclear localization [20]. This allosteric network explains how SH2 domain perturbations can influence STAT transcriptional activity without directly affecting DNA-binding domain function. Similarly, molecular dynamics simulations of STAT5 reveal that the intramolecular interaction between F706 and the hydrophobic pocket on the SH2 domain surface allosterically stabilizes the dimer interface, providing a mechanistic basis for the oncogenic potential of mutations in this region [19].
The flexible nature of STAT SH2 domains further complicates mutation effect prediction, as crystal structures may not capture the full conformational landscape accessible under physiological conditions [10]. This inherent dynamism means that mutations may exert their effects by altering the energy landscape of SH2 domain conformations rather than simply disrupting static interactions. For instance, the STAT5 F706L mutation identified in leukemic cells enhances dimer stability not through direct contact formation but by reducing steric hindrance and facilitating deeper engagement with the hydrophobic pocket [19]. These nuanced effects highlight the importance of integrating molecular dynamics simulations with structural analyses to fully comprehend mutation consequences.
Experimental Approaches for STAT-SH2 Domain Analysis
Computational Screening and Molecular Dynamics Protocols
Molecular docking protocols provide powerful tools for identifying potential STAT-SH2 domain inhibitors and characterizing mutation effects. The following protocol outlines a comprehensive computational approach for screening compound libraries against STAT SH2 domains:
Protein Structure Preparation: Retrieve STAT-SH2 domain structures from the Protein Data Bank (preferring higher resolution structures without mutations in the SH2 domain, such as 6NJS for STAT3 at 2.70 Å resolution). Process structures using protein preparation workflows to add hydrogen atoms, fill missing side chains, assign bond orders, and perform energy minimization using force fields such as OPLS3e [21].
Compound Library Preparation: Curate natural compound libraries from databases such as ZINC15 (182,455 compounds in a representative study). Prepare three-dimensional structures with LigPrep tools, generating possible stereoisomers and ionization states at physiological pH (7.4 ± 0.5) [21].
Receptor Grid Generation: Define the binding site using the coordinates of native ligands or known functional pockets. For STAT3, the grid box may be centered at coordinates X:13.22, Y:56.39, Z:0.27 with dimensions accommodating ligands of ~20 Å length. Validate grid accuracy by redocking native ligands and calculating root-mean-square deviation (RMSD) values [21].
Hierarchical Docking Pipeline: Implement multi-stage docking using high-throughput virtual screening (HTVS) mode for initial screening, followed by standard precision (SP) docking of top compounds, and finally extra precision (XP) docking for the most promising candidates (e.g., those with docking scores < -6.5 kcal/mol) [21].
Binding Affinity Assessment: Perform molecular mechanics generalized Born surface area (MM-GBSA) calculations to estimate binding free energies (ΔG Binding) using the equation: ΔGBinding = ΔGComplex - (ΔGReceptor + ΔGLigand). More negative values indicate stronger binding potential [21].
Molecular Dynamics Validation: Conduct MD simulations (≥2000 ns) using Desmond or similar software to assess compound-protein complex stability. Analyze backbone RMSD, root-mean-square fluctuation (RMSF), and ligand-protein interaction occupancy throughout the simulation trajectory [21] [19].
Pharmacokinetic Prediction: Evaluate drug-likeness properties using QikProp or similar tools, assessing parameters such as molecular weight, hydrogen bond donors/acceptors, polar surface area, and predicted oral absorption [21].
Figure 2: Computational Screening Workflow - Comprehensive in silico pipeline for identifying and validating STAT-SH2 domain inhibitors, incorporating hierarchical docking and molecular dynamics validation.
Biophysical and Functional Validation Methods
Direct binding assays are essential for confirming computational predictions and characterizing compound mechanisms. The following protocols outline key experimental approaches:
Fluorescence Polarization (FP) Competitive Binding Assay:
- Recombinant Protein Expression: Clone and express STAT3 SH2 domain (residues ~580-688) or full-length STAT3 in E. coli BL21(DE3) with N-terminal His-tags using pET-44 or pET-SUMO vectors. Purify proteins using nickel affinity chromatography [11] [22].
Fluorescent Probe Preparation: Utilize a fluorophore-conjugated phosphopeptide corresponding to the native STAT3 binding sequence (e.g., GpYLPQTV) with FITC or TAMRA labeling at the N-terminus [11].
Competition Assay: Incubate fixed concentrations of STAT3 SH2 domain (e.g., 50-100 nM) and fluorescent probe (e.g., 10 nM) with varying concentrations of test compounds (typically 0.1-100 μM) in binding buffer (e.g., 20 mM HEPES pH 7.4, 150 mM NaCl, 1 mM DTT, 0.1% NP-40) for 1-2 hours at room temperature [11].
Measurement and Analysis: Measure fluorescence polarization values using a plate reader. Calculate IC50 values by fitting data to a sigmoidal dose-response curve. Determine inhibition constant (Ki) using the Cheng-Prusoff equation: Ki = IC50/(1 + [L]/Kd), where [L] is probe concentration and Kd is dissociation constant for the probe [11].
Drug Affinity Responsive Target Stability (DARTS) Assay:
- Cell Lysate Preparation: Lyse STAT3-dependent cells (e.g., DU145, MDA-MB-231) in M-PER or RIPA buffer supplemented with protease inhibitors. Clarify by centrifugation at 14,000 × g for 15 minutes [11].
Compound Treatment: Incubate lysates (1-2 mg/mL total protein) with test compounds or DMSO control for 1 hour at room temperature [11].
Proteolytic Digestion: Add pronase or thermolysin at varying dilutions (typically 1:1000 to 1:10,000) and incubate for 30 minutes at room temperature. Stop reaction with EDTA or protease inhibitors [11].
Detection and Analysis: Separate proteins by SDS-PAGE, transfer to PVDF membranes, and immunoblot for STAT3. Compounds that directly bind STAT3 will confer protection from proteolytic degradation, manifesting as increased STAT3 band intensity compared to DMSO controls [11].
Cellular Thermal Shift Assay (CETSA):
- Compound Treatment: Treat intact cells (e.g., 1×10^6 cells/mL) with test compounds or vehicle for 3-4 hours at 37°C [11].
Heat Denaturation: Aliquot cell suspensions, heat at different temperatures (e.g., 45-65°C) for 3 minutes, then cool at room temperature for 3 minutes [11].
Cell Lysis and Fractionation: Freeze-thaw cycles in liquid nitrogen or use detergent-based lysis. Centrifuge at 20,000 × g for 20 minutes to separate soluble (native) from insoluble (denatured) protein [11].
Analysis: Detect STAT3 in soluble fractions by immunoblotting. Compound binding increases STAT3 thermal stability, shifting the melting curve to higher temperatures [11].
Targeted Therapeutic Intervention Strategies
Small Molecule Inhibitors of STAT-SH2 Domains
The strategic importance of STAT-SH2 domains in dimerization has made them promising therapeutic targets for cancer and autoimmune disorders characterized by aberrant STAT signaling. Multiple inhibitor classes have been developed that exploit the unique structural features of STAT-type SH2 domains. Salicylic acid-based compounds such as SF-1-066 and BP-1-102 represent early leads that demonstrated binding to the STAT3 SH2 domain through hydrogen-deuterium exchange mass spectrometry, with complexation resulting in significant local decreases in dynamics consistent with solvent exclusion at the binding site [20]. Similarly, S3I-201 and its optimized analog S3I-201.1066 directly bind the STAT3 SH2 domain with high affinity (KD = 2.74 nM) and disrupt STAT3 phosphorylation, dimerization, and nuclear translocation [22]. These compounds selectively inhibit viability and transformation of cancer cells harboring constitutively active STAT3 while demonstrating minimal effects on normal cells or STAT3-independent pathways [22].
Natural products have emerged as particularly promising STAT-SH2 inhibitors due to their inherent structural complexity and biological compatibility. Delavatine A stereoisomers (323-1 and 323-2) directly target the STAT3 SH2 domain and inhibit both phosphorylated and non-phosphorylated STAT3 dimerization with potency exceeding S3I-201 [11]. Computational docking predicts these compounds bind three subpockets of the STAT3 SH2 domain, competitively abrogating interaction with the SH2-binding peptide GpYLPQTV [11]. Recent computational screening of natural compound libraries has identified additional candidates such as ZINC67910988 that demonstrate superior stability in molecular dynamics simulations and favorable pharmacokinetic profiles [21]. These compounds typically engage critical residues including Arg609, Glu594, Lys591, Ser636, Ser611, and Trp623 within the SH2 domain binding pocket [21].
Table 3: Representative STAT-SH2 Domain Inhibitors
| Compound | Chemical Class | Binding Mode | Cellular IC50 | Therapeutic Evidence |
|---|---|---|---|---|
| S3I-201.1066 | Synthetic optimized from S3I-201 | pY pocket competition | 23 μM (FP assay) | Antitumor effects in breast cancer xenografts |
| BP-1-102 | Salicylic acid-based | SH2 domain binder | ~10 μM | Oral bioavailability; antitumor activity |
| 323-1/323-2 | Delavatine A stereoisomers | Multi-subpocket binding | <10 μM | Superior to S3I-201; inhibits IL-6 signaling |
| ZINC67910988 | Natural compound | pY+0/pY+1 pockets | ~5-10 μM (predicted) | Computational screening; MD stability |
| Stattic | Small molecule inhibitor | SH2 domain binder | ~5-10 μM | Widely used research tool |
Emerging Targeting Strategies and Challenges
Beyond conventional orthosteric inhibition, several innovative strategies are emerging for targeting STAT-SH2 domains. Allosteric modulation represents a promising approach that exploits the dynamic nature of STAT SH2 domains rather than directly competing with phosphotyrosine binding. Allosteric inhibitors may stabilize inactive conformations or disrupt the communication networks between the SH2 domain and other STAT functional domains [20]. Additionally, targeting lipid interactions offers an alternative strategy, as nearly 75% of SH2 domains interact with membrane lipids such as phosphatidylinositol-4,5-bisphosphate (PIP2) or phosphatidylinositol-3,4,5-trisphosphate (PIP3) [1] [2]. These lipid-SH2 domain interactions modulate cellular signaling by regulating membrane association and spatial organization of SH2 domain-containing proteins [1]. Non-lipidic small molecules that disrupt these interactions have been successfully developed for Syk kinase and could be adapted for STAT proteins [1].
The liquid-liquid phase separation (LLPS) paradigm reveals another potential intervention strategy. Multivalent interactions involving SH2 domains drive the formation of intracellular condensates that enhance signaling efficiency, as demonstrated in T-cell receptor complexes where GRB2, Gads, and LAT receptor interactions promote phase separation [1] [2]. Small molecules that modulate condensate formation without directly inhibiting catalytic activity could offer enhanced selectivity for pathological STAT signaling. Despite these promising approaches, STAT-targeted therapeutics face significant challenges including structural flexibility of the SH2 domain, which complicates drug design; conserved binding mechanisms across STAT family members that hinder selectivity; and the intracellular location of the target, which demands favorable pharmacokinetic properties for effective engagement [10] [21]. Overcoming these hurdles will require integrated structural, computational, and chemical biology approaches that leverage the unique features of STAT-type SH2 domains.
The Scientist's Toolkit: Research Reagent Solutions
Table 4: Essential Research Reagents for STAT-SH2 Domain Studies
| Reagent/Category | Specific Examples | Function/Application | Experimental Notes |
|---|---|---|---|
| Recombinant STAT-SH2 Proteins | His-tagged STAT3 SH2 domain (residues 580-688); STAT5 SH2 domain (residues 589-687) | Biophysical assays; crystallography; screening | Express in E. coli BL21(DE3); purify via nickel affinity chromatography [22] |
| Competitive Peptide Probes | GpYLPQTV-NH2 (STAT3); pY694/pY705 phosphopeptides | Fluorescence polarization; affinity measurements | FITC or TAMRA labeling for FP; biotinylation for pull-down assays [11] [22] |
| Reference Inhibitors | S3I-201; Stattic; BP-1-102; Cryptotanshinone | Assay controls; mechanism studies | Varying selectivity profiles; use for validation and comparator studies [11] [22] |
| Cell Lines with Constitutive STAT Activation | MDA-MB-231 (breast); DU145 (prostate); Panc-1 (pancreatic) | Cellular validation; functional assays | Monitor pY705-STAT3 levels; use STAT3-negative lines as controls [22] |
| STAT-Dependent Reporter Systems | pLucTKS3 (STAT3-dependent); pLucSRE (STAT3-independent) | Transcriptional activity screening | Transfert into STAT-hyperactive cells; normalize with Renilla luciferase [11] [22] |
| Phospho-Specific Antibodies | Anti-pY705-STAT3; anti-pY694-STAT5 | Western blot; immunofluorescence; flow cytometry | Critical for monitoring activation status; validate specificity [11] [23] |
| Molecular Dynamics Software | Desmond; GROMACS; NAMD | Conformational analysis; binding mechanism studies | Run simulations ≥2000 ns for convergence; analyze RMSD/RMSF [21] [19] |
The unique structural features of STAT-SH2 domains—including their distinctive C-terminal αB' helix, specialized loop configurations, and dynamic hydrophobic systems—create both challenges and opportunities for therapeutic intervention. These evolutionary adaptations optimize STAT proteins for their essential role in phosphotyrosine-mediated dimerization and transcriptional regulation, while simultaneously providing structural vulnerabilities that can be exploited for targeted drug development. The integrated experimental approaches outlined in this application note, spanning computational modeling, biophysical validation, and functional cellular assays, provide a robust framework for advancing STAT-SH2 targeted therapeutics. As structural characterization techniques continue to evolve and our understanding of STAT dynamics deepens, the prospect of clinically effective STAT-SH2 domain inhibitors grows increasingly tangible, offering new avenues for intervention in cancer, autoimmune disorders, and inflammatory diseases driven by aberrant STAT signaling.
The Src Homology 2 (SH2) domain is a critical protein-protein interaction module that specifically recognizes phosphotyrosine (pY) motifs, thereby facilitating signal transduction in eukaryotic cells [24] [2]. Within the conserved structural framework of SH2 domains, two primary binding pockets dictate ligand specificity: the phosphotyrosine-binding pocket (pY pocket) and the specificity pocket (pY+3 pocket) [24] [16]. This application note details the key residues governing these interactions, with particular focus on the invariant FLVR arginine within the pY pocket and the hydrophobic contacts in the pY+3 pocket, framed within molecular docking research targeting STAT SH2 domains.
The structural basis of SH2 domain binding provides fundamental insights for rational drug design. SH2 domains assume a conserved αββα fold with a central antiparallel β-sheet flanked by two α-helices [2]. This architecture creates a binding surface where the pY pocket anchors the phosphorylated tyrosine, while the pY+3 pocket confers specificity by accommodating residues C-terminal to the pY [24] [16]. Understanding these molecular determinants is essential for developing inhibitors that disrupt pathogenic SH2-mediated interactions, particularly in oncology where STAT SH2 domains represent promising therapeutic targets.
Structural Architecture and Key Functional Residues
The Conserved FLVR Arginine in the pY Pocket
The pY pocket is characterized by several positively charged residues that coordinate the phosphate moiety of phosphotyrosine. Among these, an invariant arginine residue located at position βB5 within the FLVR (or FLXRXS) signature motif is absolutely critical for phosphotyrosine binding [24] [2]. This arginine sits at the bottom of the pY pocket and forms a crucial salt bridge with the phosphate group of the phosphotyrosine residue [2]. Mutation of this arginine typically abolishes SH2 domain function, underscoring its essential role [24].
Interestingly, while this arginine is nearly universal, three human SH2 domains (RIN2, TYK2, and SH2D5) feature an aromatic residue substitution at this position, enabling them to recognize acidic residues other than phosphotyrosine through atypical binding modes [24]. This exception highlights the functional significance of the typical arginine-phosphate interaction in conventional SH2 domains.
Hydrophobic Contacts and Loop Control in the pY+3 Pocket
The pY+3 pocket determines ligand specificity by recognizing the amino acid residue at the third position C-terminal to the phosphotyrosine. This pocket is predominantly hydrophobic and is structurally defined by the EF and BG loops, which control accessibility to binding subsites [16]. These loops function as "gates" that can either permit or restrict access to the hydrophobic pocket through conformational variations and residue substitutions [16].
A landmark study demonstrated the critical role of these loops by engineering a specificity switch in the Src SH2 domain. Mutation of a single threonine residue in the EF loop to tryptophan (ThrEF1→Trp) physically occluded the pY+3 pocket and created a new binding surface that preferentially recognized asparagine at the pY+2 position, effectively converting Src SH2 specificity to resemble that of Grb2 SH2 [25]. This illustrates how natural sequence variation in SH2 loops generates distinct specificities within a conserved structural framework.
Table 1: Key Residues Defining SH2 Domain Binding Pockets
| Binding Pocket | Key Residue(s) | Structural Location | Function | Conservation |
|---|---|---|---|---|
| pY Pocket | Invariant Arginine | βB strand (βB5), FLVR motif | Salt bridge with phosphate moiety | Nearly invariant (exceptions: RIN2, TYK2, SH2D5) |
| pY+3 Pocket | Hydrophobic residues | EF and BG loops | Shape complementary to hydrophobic ligand residues | Variable; determines specificity |
| Sheinerman Residues | 8 residues including critical arginine | pY pocket region | Phosphotyrosine anchoring | Highly conserved |
Quantitative Binding Specificity Across SH2 Domain Classes
SH2 domains exhibit distinct preferences for residues C-terminal to the phosphotyrosine, which can be systematically categorized. Research has identified that SH2 domains generally recognize three principal types of peptide ligands, with specificity for hydrophobic residues at either the pY+2, pY+3, or pY+4 positions [16].
Table 2: SH2 Domain Classification by Peptide Specificity
| Specificity Group | Representative SH2 Domains | Primary Specificity Residue | Characteristic Motif | Key Structural Features |
|---|---|---|---|---|
| Group IA/IB | SRC, FYN, ABL1, ABL2, CRK, CRKL | Hydrophobic at pY+3 | pY-x-x-ψ* | Open pY+3 pocket; hydrophobic EF/BG loops |
| Group IC | GRB2, GADS, GRB7, GRB10, GRB14 | Asparagine at pY+2 | pY-x-N | Tryptophan in EF loop blocks pY+3 pocket |
| Group IIA/IIB | VAV, PI3K-p85α, PLC-γ1, SHP-1 | Hydrophobic at pY+3 | pY-ψ-x-ψ | Variant pY+3 pocket composition |
| Group IIC | BRDG1 (STAP-1), BKS (STAP-2), CBL | Hydrophobic at pY+4 | pY-x-x-x-ψ | Open pY+4 pocket; accessible binding site |
| STAT Family | STAT1, STAT3, STAT5 | Glutamine at pY+1 (STAT3) | pY-x-x-Q | Lacks EF loop; open BG loop; unconventional pockets |
*ψ denotes hydrophobic residues
The structural basis for these specificity differences lies in the composition and conformation of the loops surrounding the binding pocket. For Group IC SH2 domains like Grb2, a bulky tryptophan residue in the EF loop occupies the pY+3 pocket, forcing the bound peptide to adopt a β-turn conformation and enabling specific recognition of asparagine at pY+2 [16] [25]. In contrast, Group IIC SH2 domains such as BRDG1 feature an accessible hydrophobic pocket suited for accommodating leucine or isoleucine at pY+4, formed by five conserved hydrophobic residues arranged in a "pentagon basket" [16].
Experimental Protocols for Investigating SH2 Interactions
Structural Characterization of SH2 Domain-Ligand Complexes
Objective: Determine high-resolution structure of SH2 domain in complex with phosphopeptide or small-molecule inhibitor to characterize binding interactions.
Workflow:
- Protein Expression and Purification: Express recombinant SH2 domain (or full-length protein) in appropriate system (e.g., insect cells for PI3Kα complex [26]). Purify using affinity (e.g., His-tag), ion exchange, and size exclusion chromatography.
- Complex Formation: Incubate purified protein with ligand (e.g., 1:5 molar ratio for PI3Kα with cpd17 [26]) at 4°C for 30 minutes.
- Structure Determination:
- X-ray Crystallography: Grow crystals, collect diffraction data, solve structure by molecular replacement.
- Cryo-EM (for large complexes): Apply 3-4 μL sample to glow-discharged grids, vitrify, image with Titan Krios (or similar) with Gatan K3 detector, process data (motion correction, CTF estimation) [26].
- Structure Analysis: Model building in Coot, refinement in Phenix, analysis of binding interactions in PyMol or Chimera.
Key Parameters: Maintain protein integrity during purification; optimize protein:ligand ratio for complex formation; achieve resolution sufficient to resolve key residues (e.g., FLVR arginine, EF/BG loop residues).
Specificity Switching by Site-Directed Mutagenesis
Objective: Engineer altered specificity in SH2 domain by rational mutation of key residues controlling pocket accessibility.
Workflow:
- Target Identification: Based on structural alignment, identify residues controlling pocket accessibility (e.g., ThrEF1 in Src SH2 [25]).
- Mutagenesis Design: Design mutation to alter pocket character (e.g., Thr→Trp to occlude pY+3 pocket [25]).
- Mutant Generation: Use site-directed mutagenesis (e.g., QuikChange) to introduce mutation, sequence verify.
- Functional Characterization:
- Binding Assays: Measure affinity for wild-type vs. mutant peptides using ITC, SPR, or FP.
- Specificity Profiling: Use oriented peptide array library (OPAL) to determine sequence preferences [16].
- Structural Validation: Determine mutant structure to confirm engineered binding mode.
Applications: Molecular mechanism studies; engineering biosensors; proof-of-concept for targeting specific pockets.
Molecular Docking to STAT SH2 Domains
Objective: Identify and optimize small-molecule inhibitors targeting STAT SH2 domain pY and pY+3 pockets.
Workflow:
- Structure Preparation:
- Obtain STAT SH2 coordinates (PDB or AlphaFold2 models from SH2db [24]).
- Prepare protein: add hydrogens, assign partial charges, define binding pocket (pY+pY+3).
- Ligand Preparation:
- Generate 3D structures of candidate inhibitors.
- Assign appropriate torsion angles and ionization states.
- Docking Simulation:
- Use program (rDock, SMINA) with defined search space encompassing both pY and pY+3 pockets [27].
- Generate multiple poses, score interactions.
- Interaction Analysis:
- Evaluate key contacts: salt bridges with FLVR arginine; hydrophobic contacts in pY+3 pocket.
- Calculate binding energies.
- Hit Prioritization: Rank compounds by score and interaction quality; select for experimental testing.
Validation: Compare docking poses with known crystal structures; test predictive accuracy through retrospective screening.
Visualization of SH2 Domain Binding Architecture
SH2 Domain Binding Pocket Architecture
Table 3: Key Research Reagents and Resources for SH2 Domain Studies
| Resource | Type | Key Features/Applications | Access |
|---|---|---|---|
| SH2db [24] | Structural Database | Comprehensive SH2 domain structures; generic residue numbering; PDB and AlphaFold models; structure download | http://sh2db.ttk.hu |
| PocketVec [27] | Pocket Descriptor Tool | Identifies druggable pockets; similarity search across proteome; vector-based pocket characterization | Custom implementation |
| OPAL [16] | Specificity Profiling | Oriented Peptide Array Library defines binding motifs for SH2 domains | Specialized setup required |
| rDock & SMINA [27] | Docking Software | Molecular docking to identified pockets; rDock for rigid, SMINA for flexible docking | Open source |
| SH2 Mutant Collection [25] | Reagent | Site-directed mutants for specificity switching studies (e.g., Src T→W EF1) | Available through academic collaborations |
The precise molecular characterization of the FLVR arginine in the pY pocket and hydrophobic contacts in the pY+3 pocket provides a robust foundation for targeted inhibition of SH2 domain interactions. The experimental protocols and research resources detailed herein enable systematic investigation of these key residues, particularly in the context of STAT SH2 domains. As structural databases expand and computational methods advance, the integration of biophysical data with molecular docking will accelerate the development of selective inhibitors that disrupt pathogenic signaling pathways through competitive binding to these essential interaction pockets.
Practical Docking Protocols: From Setup to Virtual Screening for STAT SH2 Inhibitors
Signal Transducer and Activator of Transcription (STAT) proteins, particularly STAT3, are crucial transcription factors that regulate cell growth, survival, and differentiation. Their dysregulated activation is directly linked to various cancers, including breast, prostate, lung, and hematological malignancies [4]. The Src Homology 2 (SH2) domain contained within STAT proteins plays a pivotal role in their activation by mediating phosphotyrosine-dependent protein-protein interactions [2]. This domain specifically facilitates the dimerization of STAT molecules, which is essential for their activation and subsequent nuclear translocation [4] [12]. Inhibition of the STAT SH2 domain disrupts this binding, reduces STAT phosphorylation, and impairs dimerization, making it a promising therapeutic strategy for cancer treatment [4].
The STAT SH2 domain recognizes phosphotyrosine (pY) motifs through distinct binding pockets. Structural studies reveal that the pY binding pocket is divided into three sub-pockets: the pY+0 (binds to pY705), pY+1 (binds to L706), and a hydrophobic side pocket (pY-X) [4]. These structural features, particularly the pY and pY+3 pockets, present ideal targets for therapeutic intervention using structure-based drug design approaches. Targeting these pockets requires high-quality, well-prepared protein structures, making proper protein preparation an essential first step in any molecular docking campaign aimed at STAT SH2 domain research [4].
Protein Preparation Workflow: Principles and Significance
The Protein Preparation Workflow is a critical first step in structure-based drug design that ensures the reliability of subsequent computational analyses. Successful modeling projects demand not only accurate software but also accurate starting structures [28]. Experimentally-derived structures from sources like the Protein Data Bank (PDB) often contain common problems including missing hydrogen atoms, incomplete side chains and loops, ambiguous protonation states, and flipped residues [28] [29]. Left untreated, these issues can lead to wasted time and resources in virtual screening campaigns.
A well-prepared and validated structure avoids technical artifacts and boosts the accuracy of downstream protein-modeling tasks including molecular docking, dynamics simulations, and binding-energy calculations [30]. For STAT SH2 domain research specifically, proper preparation ensures that the critical pY and pY+3 binding pockets are correctly modeled, increasing the likelihood of identifying true bioactive inhibitors [4]. The preparation process typically involves structure selection, preprocessing, refinement, and validation, creating a reliable, all-atom protein model suitable for computational studies [28].
Table 1: Key Problems in Raw Protein Structures and Their Solutions in Preparation
| Structural Problem | Impact on Modeling | Solution in Preparation Workflow |
|---|---|---|
| Missing hydrogen atoms | Affects H-bonding networks and electrostatic interactions | Add hydrogens appropriate for physiological pH |
| Incomplete side chains | Creates artificial cavities in binding sites | Fill in missing side chains using Prime |
| Missing loop regions | Disrupts protein topology and dynamics | Fill in missing loops using Prime |
| Alternate atom locations | Introduces structural ambiguity | Remove alternate locations (keep highest occupancy) |
| Incorrect protonation states | Misrepresents charge distribution and H-bonding | Determine optimal protonation states using Epik/PROPKA |
| Crystallographic waters | May obstruct binding site or mediate important interactions | Remove waters or selectively retain those forming H-bonds |
STAT-Specific Protocol: Application to SH2 Domain Structures
PDB Structure Selection for STAT SH2 Domains
Selecting an appropriate starting structure is crucial for successful docking studies targeting STAT SH2 domains. When exploring the PDB for STAT structures, prioritize those with: high resolution (preferably <2.8 Å), co-crystallized ligands that indicate the binding site location, no mutations in the SH2 domain, and minimal gaps in the sequence [4]. For STAT3 specifically, the 6NJS structure has been successfully used in recent studies as it has a resolution of 2.70 Å, lacks mutations in the SH2 domain, and has fewer gaps in its sequence compared to alternatives like 6NUQ [4].
Structural analysis reveals that STAT-type SH2 domains are distinct from SRC-type domains as they lack the βE and βF strands as well as the C-terminal adjoining loop. Additionally, the αB helix is split into two helices [2]. This unique architecture is an adaptation that facilitates STAT dimerization, reflecting the ancestral function of SH2 domain-containing proteins that predate animal multicellularity [2]. When preparing STAT structures, researchers should be aware that the loops connecting secondary structural elements play a pivotal role in defining access to the binding pockets that are integral to all SH2 domains, contributing significantly to ligand specificity [16].
Comprehensive Preparation Protocol
The following protocol outlines the steps for preparing STAT SH2 domain structures using Schrödinger's Protein Preparation Workflow, though the principles apply to other software platforms as well.
Step 1: Import and Initial Processing
Begin by importing your STAT structure into the preparation environment. The raw PDB file should undergo initial processing with the following operations:
- Assign bond orders using the Chemical Components Dictionary (CCD) database to ensure proper bond characterization [31]
- Add hydrogens to the structure while removing any original hydrogens to fix potential issues with nonstandard PDB atom names [31]
- Create disulfide bonds between cysteine residues within reacting distance
- Convert selenomethionines to methionines if present (these sometimes appear in structures determined using selenomethionine substitution) [31]
- Fill in missing side chains and loops using Prime, with particular attention to regions near the SH2 domain binding pockets [31]
- Cap termini with ACE (N-acetyl) and NMA (N-methyl amide) groups at uncapped N and C termini, including any chain breaks where residues are missing [31]
Step 2: Review and Modify
Carefully review the structure for potential issues:
- Examine ligands, metals, and waters - retain crystallographic waters that may mediate important interactions but remove those that don't form H-bonds with non-waters [29]
- For STAT SH2 domains, pay special attention to the pY705 binding site and adjacent pockets
- Check for alternate locations and retain only the highest-occupancy atoms, particularly for residues in the binding pocket [30]
- Use the Diagnostics tab to identify valences, missing atoms, and overlapping atoms that need correction [31]
Step 3: Refine and Minimize
Optimize the structure for docking:
- Assign protonation states using PROPKA at pH 7.0 to match physiological conditions [29]
- Optimize the hydrogen bond network using a systematic, cluster-based approach [28]
- Perform a restrained minimization using the OPLS3e or OPLS4 force field with a heavy atom convergence threshold of 0.30 Å RMSD to relax the structure while maintaining the overall fold [4] [29]
Key Parameters for STAT SH2 Domain Preparation
Table 2: Critical Preparation Parameters for STAT SH2 Domain Structures
| Parameter Category | Recommended Setting | Rationale |
|---|---|---|
| pH for protonation states | 7.0 (physiological) | Represents biological environment; use PROPKA for accurate pKa predictions |
| Force field for minimization | OPLS3e or OPLS4 | Accurate energy calculations and parameterization for proteins and ligands |
| Heavy atom convergence | 0.30 Å RMSD | Sufficiently relaxes the structure while maintaining crystallographic pose |
| Water treatment | Remove waters with <2 H-bonds to non-waters | Retains only functionally important crystallographic waters |
| Missing loops | Fill loops up to 20 residues using Prime | Maintains structural integrity, particularly important for flexible binding sites |
| Termini treatment | Cap with ACE and NMA groups | Prevents artificial charge interactions at truncated termini |
The Scientist's Toolkit: Essential Research Reagents and Tools
Table 3: Essential Research Reagents and Computational Tools for STAT SH2 Domain Studies
| Tool/Reagent | Function/Purpose | Application Notes |
|---|---|---|
| Schrödinger Maestro | Molecular visualization and workflow platform | Provides integrated environment for protein preparation, docking, and analysis |
| Protein Preparation Wizard | Automated structure preparation | Corrects common PDB issues; available in multiple modeling suites |
| OPLS3e/OPLS4 Force Fields | Molecular mechanics energy functions | Accurate energy calculations for proteins and organic molecules |
| Prime | Protein structure prediction | Fills missing side chains and loops; models mutations |
| PROPKA | pKa prediction | Determines residue protonation states at specific pH values |
| STAT3 SH2 domain structures | Experimental structural data | 6NJS recommended for STAT3 studies (2.70Å, no SH2 mutations) |
| ZINC Database | Natural compound library | Source of phytochemicals for virtual screening against STAT SH2 domain |
Validation and Troubleshooting in STAT SH2 Domain Preparation
Validation Techniques
After preparing your STAT SH2 domain structure, thorough validation is essential before proceeding to docking experiments. Several diagnostic tools can assess preparation quality:
- Examine the Ramachandran plot to verify proper backbone torsion angles and identify any outliers that may need correction [29]
- Check for steric clashes between atoms that could indicate problematic regions requiring additional minimization [30]
- Validate hydrogen bonding networks, particularly around the phosphotyrosine binding pocket where specific interactions are critical for function [4]
- For STAT structures, pay special attention to the SH2 domain loops (EF and BG loops) as these regions control access to binding pockets and significantly influence ligand specificity [16]
Common Issues and Solutions
Several issues commonly arise when preparing STAT SH2 domain structures with recommended solutions:
- Problem: Poor electron density in flexible loop regions near the binding site. Solution: Use Prime to model missing loops, restricting to regions <20 residues for best results [31]
- Problem: Ambiguous protonation states for histidine residues coordinating key interactions. Solution: Carefully examine the H-bonding network around each histidine and test different protonation states if necessary [28]
- Problem: Crystallographic ligands with unclear binding modes in the pY pocket. Solution: Verify ligand placement against electron density maps when available and ensure proper orientation for key interactions with conserved arginine residues [4]
- Problem: Structural distortions from minimization. Solution: Use restrained minimization with heavier constraints on backbone atoms while allowing side chains flexibility, particularly in the binding site [29]
A meticulously prepared protein structure forms the foundation for successful molecular docking campaigns targeting STAT SH2 domains. The protocol outlined here—emphasizing careful structure selection, comprehensive preprocessing, systematic review, and restrained refinement—generates reliable all-atom models that accurately represent the STAT SH2 domain's binding landscape. This approach directly supports the identification of novel inhibitors targeting the phosphotyrosine binding pocket, such as the natural compounds ZINC67910988 and ZINC255200449 which were recently identified through similar methodologies [4].
The prepared structures enable researchers to leverage advanced computational techniques including molecular dynamics simulations, MM-GBSA binding free energy calculations, and WaterMap analysis to further characterize ligand interactions with the STAT SH2 domain [4]. By ensuring structural correctness from the outset, the Protein Preparation Workflow significantly enhances the efficiency and reliability of structure-based drug design efforts aimed at developing novel therapeutics targeting STAT-driven cancers.
The SRC Homology 2 (SH2) domain of Signal Transducer and Activator of Transcription 3 (STAT3) presents a critical therapeutic target for cancer treatment due to its essential role in STAT3 dimerization and activation. Constitutive activation of STAT3 is observed in numerous cancer types, including breast, prostate, lung, and hematological malignancies, promoting tumor progression and immune evasion [4]. The STAT3 SH2 domain facilitates reciprocal binding between two STAT3 monomers through interaction with phosphorylated tyrosine 705 (pY705), forming transcriptionally active dimers that translocate to the nucleus [32] [33]. Strategic targeting of this interaction interface represents a viable approach for inhibiting oncogenic STAT3 signaling.
Molecular docking campaigns against the STAT3 SH2 domain require precise definition of the docking grid to encompass key binding subsites. The binding surface is structurally organized into specialized sub-pockets designated as pY+0 (binds pY705), pY+1 (binds L706), and pY+3/X (hydrophobic side) [4] [16]. The pY+0 pocket interacts with the phosphotyrosine residue to stabilize dimerization, while the pY+3 pocket confers binding specificity through interactions with residues C-terminal to the phosphotyrosine [4] [34]. This application note details protocols for defining the docking grid around these critical regions to optimize virtual screening outcomes for STAT3 inhibitors.
Structural Characterization of STAT3 SH2 Binding Pockets
Key Binding Subsites and Functional Residues
The STAT3 SH2 domain features a conserved architecture comprising a central anti-parallel β-sheet flanked by two α-helices (αA and αB), forming an αβββα motif [4]. Within this structure, three principal binding subsites recognize specific elements of the phosphopeptide ligand:
pY+0 Pocket: This primary pocket binds the phosphotyrosine 705 residue and contains several positively charged residues that facilitate electrostatic interactions with the phosphate moiety. Key residues include Arg609, which sits at the bottom of the pocket and serves as the principal binding partner, along with Lys591, Ser611, and Ser636, which directly interact with pY705 [4] [34]. Disruption of this interaction interface prevents STAT3 dimerization and activation.
pY+3/X Pocket: This hydrophobic pocket determines binding specificity by accommodating residues C-terminal to the phosphotyrosine. Critical residues include Val637, which controls accessibility to this pocket, while Tyr657, Gln644, Thr640, and Glu638 facilitate hydrogen bond interactions with the target peptide [4] [34]. Additionally, Ile659, Trp623, and Phe621 create a hydrophobic environment that stabilizes ligand binding [34].
pY+1 Pocket: This subsite interacts with Leu706 and represents a secondary specificity determinant, though it has been less extensively characterized in inhibitor design campaigns [4].
Table 1: Key Residues in STAT3 SH2 Domain Binding Pockets
| Binding Pocket | Key Residues | Functional Role |
|---|---|---|
| pY+0 | Arg609, Lys591, Ser611, Ser636 | Principal phosphotyrosine binding; electrostatic interactions with pY705 phosphate moiety |
| pY+3/X | Val637, Tyr657, Gln644, Thr640, Glu638, Ile659, Trp623, Phe621 | Specificity determination; hydrophobic environment and hydrogen bonding with C-terminal residues |
| pY+1 | (Less characterized) | Recognition of Leu706 |
Structural Variations and Allosteric Regulation
Beyond the direct binding interface, researchers should note that loop regions controlling access to binding pockets significantly influence SH2 domain specificity [16]. Unlike many SH2 domains that feature a conventional P+3 binding pocket, STAT3 lacks an EF loop and has an open BG loop, resulting in a distinctive binding architecture without a conventional P+3 or P+4 binding pocket [16]. Furthermore, allosteric regulation of the SH2 domain via the coiled-coil domain (CCD) presents an alternative targeting strategy, with perturbations in CCD transmitted through a rigid core that orchestrates conformational changes in the SH2 domain [34].
Docking Grid Definition Protocols
Grid Placement Strategy Based on Crystallographic Data
Optimal docking grid placement requires alignment with the native binding site geometry observed in crystallographic structures. The recommended protocol utilizes the STAT3 crystal structure (PDB: 6NJS) due to its superior resolution (2.70 Å), absence of mutations in the SH2 domain, and fewer sequence gaps compared to alternative structures [4].
Grid Center Coordinates: The docking grid should be centered at coordinates X: 13.22, Y: 56.39, Z: 0.27 to encompass the critical pY705 binding region and flanking residues [4]. These coordinates position the grid box to optimally sample interactions across both pY+0 and pY+3/X pockets.
Grid Box Dimensions: A grid box with side lengths of 20 Å provides sufficient space to accommodate ligand flexibility while maintaining focus on the key binding residues [4]. This size ensures comprehensive sampling of the binding cavity without introducing excessive computational overhead.
Validation through Redocking: Always validate the receptor grid by redocking the native co-crystallized ligand and calculating the root-mean-square deviation (RMSD) between the docked and crystallographic poses. An RMSD value ≤ 2.0 Å indicates appropriate grid placement and reliable docking parameters [4].
Table 2: Recommended Docking Grid Parameters for STAT3 SH2 Domain
| Parameter | Specification | Rationale |
|---|---|---|
| PDB Structure | 6NJS | Better resolution (2.70 Å), no SH2 domain mutations, fewer sequence gaps |
| Grid Center | X: 13.22, Y: 56.39, Z: 0.27 | Optimally covers pY705 binding region and flanking specificity pockets |
| Box Size | 20 Å | Accommodates ligand flexibility while focusing on key binding residues |
| Validation Metric | Redocking RMSD ≤ 2.0 Å | Confirms grid placement accuracy and docking protocol reliability |
Advanced Considerations for Enhanced Sampling
For challenging docking campaigns requiring enhanced sampling, consider these advanced approaches:
Multiple Receptor Conformations: Incorporate protein flexibility by using ensemble docking across multiple STAT3 conformations derived from molecular dynamics (MD) simulations [33]. This approach accounts for binding pocket plasticity and can identify poses missed by rigid receptor docking.
Induced-Fit Docking: For compounds exhibiting unconventional binding modes, employ induced-fit docking protocols that allow side-chain flexibility in key binding residues such as Arg609, Glu638, and Trp623 [33].
Allosteric Pocket Targeting: When targeting allosteric regulation, expand grid placement to include the interface between the SH2 domain and the coiled-coil domain, particularly focusing on communication pathways mediated by the linker domain [34].
Integrated Workflow for STAT3 Inhibitor Screening
The following diagram illustrates the comprehensive workflow for defining the docking grid and performing virtual screening for STAT3 SH2 domain inhibitors:
Research Reagent Solutions
Table 3: Essential Research Reagents for STAT3 SH2 Domain Docking Studies
| Reagent / Resource | Specifications | Application in Research |
|---|---|---|
| STAT3 Crystal Structure | PDB ID: 6NJS (Resolution: 2.70 Å) | High-quality structural template for docking grid definition |
| Compound Libraries | ZINC15 Natural Products (182,455 compounds) | Source of diverse chemical entities for virtual screening |
| Docking Software | Schrödinger Suite (Maestro) | Integrated platform for protein prep, grid generation, and GLIDE docking |
| Molecular Dynamics | Desmond MD System | Simulation of protein-ligand complexes for binding stability assessment |
| Binding Assay | Fluorescence Polarization (FP) | In vitro validation of SH2 domain binding (IC50 determination) |
| Cell-Based Validation | MDA-MB-231, HepG2 cells | Cellular assessment of STAT3 phosphorylation inhibition |
Strategic placement of the docking grid around the pY705 binding site and flanking residues represents a critical determinant of success in virtual screening campaigns targeting the STAT3 SH2 domain. The precise coordinates (X: 13.22, Y: 56.39, Z: 0.27) with a 20 Å box size, centered on the pY+0 pocket while encompassing key specificity determinants in the pY+3/X region, provide optimal coverage of the pharmacologically relevant binding interface. Implementation of the integrated workflow encompassing multi-stage docking, binding free energy calculations, and molecular dynamics validation significantly enhances the probability of identifying potent STAT3 inhibitors with favorable drug-like properties. These protocol specifications establish a standardized approach for defining the docking grid in STAT3-targeted drug discovery programs.
Src Homology 2 (SH2) domains are modular protein domains that facilitate critical protein-protein interactions in cellular signaling pathways by recognizing phosphotyrosine (pTyr) motifs. In Signal Transducer and Activator of Transcription (STAT) proteins, the SH2 domain is particularly crucial for molecular activation, mediating the dimerization of two STAT monomers through reciprocal pTyr-SH2 domain interactions, which enables nuclear translocation and drives transcription of target genes [10]. The STAT SH2 domain binding interface consists of two primary pockets: the pY pocket, which binds the phosphorylated tyrosine residue, and the pY+3 pocket, which provides specificity by accommodating residues C-terminal to the pTyr [16]. These domains have emerged as promising drug targets, particularly in oncology, as constitutive STAT activation is directly linked to cancer progression and immune evasion [4].
Targeting the STAT SH2 domain presents unique challenges for conventional compound libraries. The binding interface is typically shallow and flexible, characteristics that have historically placed PPIs in the "undruggable" category [35] [10]. Furthermore, STAT SH2 domains exhibit significant flexibility even on sub-microsecond timescales, with the accessible volume of the pY pocket varying dramatically [10]. This necessitates ligand libraries with special structural properties—compounds with sufficient complexity and rigidity to effectively disrupt these challenging interactions. This application note details protocols for curating high-quality natural and synthetic compound libraries specifically tailored for discovering inhibitors of the STAT SH2 domain pY and pY+3 pockets.
Strategic Library Design for Challenging Targets
Key Considerations for STAT SH2 Domain Screening
Conventional commercial libraries often fail against difficult targets like the STAT SH2 domain because they sample a limited chemical space with well-studied scaffolds. Research indicates that commercial libraries from vendors like ChemBridge, TargetMol, and SPECS show high similarity to each other, limiting their effectiveness for novel target discovery [35]. A comparative analysis revealed that synthetic methodology-based libraries (SMBL) demonstrated significantly lower Tanimoto coefficients (Tc) when compared to these commercial libraries, indicating greater structural uniqueness [35].
Successful library design for STAT SH2 domains should prioritize:
- Structural Complexity: Including bridged, spiro, and other three-dimensional ring systems that mimic natural product complexity [35]
- Stereochemical Diversity: Incorporation of chiral centers through asymmetric synthesis [35]
- Target-Focused Filtering: Removing compounds with structural liabilities while maintaining diversity for broad coverage [36]
- Synthetic Accessibility: Ensuring virtual compounds can be efficiently synthesized for follow-up medicinal chemistry [35]
Comparative Analysis of Commercial Screening Libraries
Table 1: Characteristics of Commercial Compound Libraries for Screening
| Library Name | Compound Count | Key Features | Similarity to SMBL (Tc max) | Best Application |
|---|---|---|---|---|
| ChemBridge | 1,000,000+ | Diverse small molecules, drug-like compounds | Low | General target screening |
| TargetMol | 500,000+ | Bioactive compounds, natural products | Low | Targeted pathway screening |
| SPECS | 400,000+ | Structurally diverse compounds | Low | Hit identification |
| SMBL (Entity) | ~1,600 | Unique scaffolds, stereochemical complexity | N/A | Challenging PPI targets |
| SMBL (Virtual) | 14,000,000+ | Theoretically accessible, natural product-like | N/A | Ultra-large virtual screening |
Protocol 1: Sourcing and Curating Natural Product Libraries
Database Preparation and Compound Acquisition
Natural products offer privileged scaffolds evolved to interact with biological systems, making them particularly valuable for targeting challenging interfaces like the STAT SH2 domain. Approximately 40% of FDA-approved drugs are derived from natural sources, highlighting their therapeutic relevance [4].
Procedure:
- Database Retrieval: Download natural compound structures from specialized databases such as ZINC 15 (182,455 compounds as used in recent STAT3 studies) [4]. Other valuable resources include:
- Natural Products Atlas
- SuperNatural 3.0
- COCONUT (COlleCtion of Open Natural prodUcTs)
Format Standardization: Convert all structures to consistent 3D representations using tools like Open Babel or the LigPrep module (Schrödinger Suite). This ensures uniform protonation states and molecular representations for subsequent processing [4].
Ionization State Generation: Generate possible ionization states at physiological pH (7.4 ± 0.5) using Epik or similar tools to account for relevant protonation states under biological conditions [4].
Structural Desalting: Remove counterions and salt forms to isolate the core bioactive structure while recording original salt information for future experimental reference.
Natural Product Library Profiling and Filtering
Procedure:
- Drug-Likeness Assessment: Apply multi-parameter optimization (MPO) including:
- Lipinski's Rule of Five (molecular weight ≤ 500, LogP ≤ 5, H-bond donors ≤ 5, H-bond acceptors ≤ 10)
- Veber's criteria (rotatable bonds ≤ 10, polar surface area ≤ 140 Ų)
- PAINS (Pan-Assay Interference Compounds) filtering to remove promiscuous binders
Property Calculation: Compute key physicochemical properties using Canvas (Schrödinger) or RDKit:
- Molecular weight and heavy atom count
- Partition coefficient (LogP) and aqueous solubility (LogS)
- Topological polar surface area (TPSA)
- Number of rotatable bonds and hydrogen bond donors/acceptors
Structural Clustering: Perform cluster analysis using fingerprint-based methods (Tanimoto similarity, MACCS keys) to ensure structural diversity and avoid over-representation of similar scaffolds.
Table 2: Sourcing Strategies for Natural Product Libraries
| Sourcing Method | Protocol Details | Advantages | Considerations for STAT SH2 |
|---|---|---|---|
| Database Mining | Retrieve from ZINC15, NP Atlas; standardize via LigPrep [4] | High structural diversity, evolutionary validation | May require lead optimization for potency |
| Ethnobotanical Collection | Field collection based on traditional use; solvent extraction | Novel scaffolds, bioactivity pre-selection | Supply limitations, identification challenges |
| Marine Source Extraction | Deep-sea sampling; chromatography-based separation | Extremophile adaptations, unique halogens | Sustainability, compound stability |
| Microbial Fermentation | Strain culture; metabolite extraction | Scalable production, engineered strains | Complex mixtures requiring purification |
Protocol 2: Constructing Synthetic Methodology-Based Libraries
Entity Library Construction from Published Methodologies
Synthetic methodology-based libraries (SMBL) leverage recent advances in organic synthesis to access chemical space distinct from commercial sources and natural products [35].
Procedure:
- Compound Collection: Compile compounds synthesized using published methodologies over multi-year periods (e.g., 1600+ compounds over 10 years) [35]. Focus on reactions generating structural complexity:
- Asymmetric catalysis creating chiral centers
- Multicomponent reactions generating molecular complexity
- Ring-forming reactions creating spiro and bridged systems
Quality Control:
- Purify all compounds to >90% purity (HPLC/LCMS validation)
- Verify structural identity (NMR, HRMS)
- Store at -80°C in DMSO under inert atmosphere to prevent degradation
Structural Coding: Implement uniform coding and numbering systems tracking:
- Core scaffold type (e.g., spiro[bicyclo[2.2.1]heptane-2,3'-indolin]-2'-one) [35]
- Stereochemical configuration
- Synthetic route and yield
Virtual Library Expansion and Enumeration
Procedure:
- Scaffold Identification: Extract core structural motifs from entity library compounds using tools such as the Matched Molecular Pair analysis or scaffold network analysis.
Derivable Site Analysis: Identify sites amenable to combinatorial derivatization based on published methodology scope. For example:
- Aromatic substitution (R₁: aryl, heteroaryl)
- Alkyl/heterocyclic substitution (R₂: heterocycles, alkyls) [35]
Virtual Enumeration: Use combinatorial chemistry modules (e.g., Legion in Sybyl-X 2.0) to generate virtual compounds while respecting synthetic feasibility constraints demonstrated in original methodologies [35].
Library Profiling: Analyze the virtual library for:
- Structural uniqueness via Tanimoto similarity comparisons to commercial libraries [35]
- Shape diversity using principal moment of inertia (PMI) analysis
- Physicochemical property distribution
Protocol 3: Library Preparation for Molecular Docking
Ligand Preparation Workflow
Proper ligand preparation is critical for accurate molecular docking results, particularly for challenging targets like the STAT SH2 domain where subtle interactions determine binding affinity.
Procedure:
- Structure Optimization:
- Generate possible tautomers and protomers at pH 7.4 ± 0.5 using LigPrep (Schrödinger) or MOE
- Assign appropriate bond orders and formal charges
- Remove salts and counterions while preserving the core structure
Conformational Sampling: Generate multiple low-energy conformers using:
- Mixed torsional/low-mode sampling (MacroModel)
- Rule-based conformer generation (ConfGen)
- Energy window: 10 kcal/mol above global minimum
- Maximum conformers: 100 per ligand
Structural Minimization: Optimize geometries using appropriate force fields (OPLS3e, MMFF94) with gradient convergence threshold of 0.05 kcal/mol/Å
Target-Specific Library Tailoring for STAT SH2 Domain
Procedure:
- pY Pocket Focused Filtering:
pY+3 Pocket Tailoring:
- Identify compounds with hydrophobic extensions (aryl, alkyl groups) to occupy the hydrophobic pY+3 pocket [16]
- Select scaffolds capable of forming hydrogen bonds with residues in the specificity-determining region
Diversity Selection: From the filtered subset, select structurally diverse compounds using:
- Fingerprint-based clustering (ECFP6 fingerprints)
- MaxMin diversity selection to ensure broad coverage
- Final library size: 50,000-100,000 compounds for virtual screening
Experimental Validation and Screening Workflow
Integrated Screening Protocol
A hybrid screening approach combining ligand- and structure-based methods increases confidence in hit identification for STAT SH2 domain inhibitors [37].
Procedure:
- Virtual Screening Cascade:
- Step 1 (HTVS): High-throughput virtual screening of entire library using Glide HTVS or AutoDock Vina with relaxed precision [4]
- Step 2 (SP): Standard precision docking of top 10-20% compounds from HTVS
- Step 3 (XP): Extra precision docking of top 5-10% compounds from SP for detailed binding evaluation
Consensus Scoring: Rank compounds using multiple scoring functions (GlideScore, AutoDock Vina, ChemScore) to reduce false positives [37]
Interaction Analysis: Manually inspect top-ranking compounds for specific interactions with STAT SH2 domain key residues:
Experimental Validation of Screening Hits
Procedure:
- Compound Procurement/ Synthesis: Prioritize commercially available hits or synthesize key compounds from virtual library using established methodologies [35]
Biophysical Assays:
- Surface Plasmon Resonance (SPR) to measure binding affinity to STAT SH2 domain
- Fluorescence Polarization (FP) to assess disruption of STAT3 dimerization
Cellular Assays:
- Western blotting to detect inhibition of STAT3 phosphorylation at Y705
- Immunofluorescence to monitor disruption of STAT3 nuclear translocation
- MTT assays to evaluate effects on cancer cell viability
Diagram 1: Integrated workflow for STAT SH2 domain ligand library curation and screening
Research Reagent Solutions
Table 3: Essential Research Reagents for STAT SH2 Domain Screening
| Reagent/Category | Specific Examples | Function in Research | Protocol Application |
|---|---|---|---|
| Molecular Docking Software | Glide (Schrödinger), AutoDock Vina, GOLD | Predict ligand binding poses and affinity | Virtual screening cascade (HTVS→SP→XP) [4] [38] |
| Structure-Based Design Tools | Prime MM-GBSA, WaterMap, Desmond | Calculate binding free energy, solvation effects | Post-docking analysis and hit prioritization [4] |
| Compound Library Resources | ZINC15, SMBL (Synthetic Methodology-Based Library) | Source diverse chemical structures | Natural product and synthetic compound sourcing [35] [4] |
| STAT SH2 Domain Constructs | Human STAT3 SH2 (residues 500-670), STAT5B SH2 | Target protein for experimental validation | Biophysical binding assays, co-crystallization |
| Ligand Preparation Tools | LigPrep (Schrödinger), Open Babel, MOE | Generate 3D structures, ionization states | Library preparation for docking [36] [4] |
The strategic curation of ligand libraries specifically designed for the STAT SH2 domain's pY and pY+3 pockets significantly enhances the probability of identifying effective inhibitors against this challenging therapeutic target. By integrating structurally unique synthetic compounds with diverse natural products, researchers can access chemical space beyond conventional commercial libraries. The detailed protocols provided for sourcing, preparation, and screening enable a targeted approach to address the molecular recognition challenges posed by the STAT SH2 domain. Implementation of these methods, coupled with experimental validation, provides a systematic framework for advancing drug discovery efforts against STAT-dependent signaling pathways in cancer and other diseases.
The identification of novel therapeutic compounds targeting protein domains such as the STAT SH2 domain requires efficient computational methods to navigate vast chemical spaces. The STAT (Signal Transducers and Activators of Transcription) SH2 domain is a critical therapeutic target due to its essential role in mediating protein-protein interactions through recognition of phosphotyrosine (pTyr)-containing sequences [10]. This domain facilitates STAT dimerization and nuclear translocation, driving transcription of genes involved in proliferation and cellular survival, making it a prominent target in oncology and immunology [10]. Structure-based virtual screening represents a powerful approach for identifying potential ligands, but the computational cost of screening ultra-large libraries against dynamic targets necessitates strategic methodologies [39].
Multi-stage docking protocols address this challenge by implementing a hierarchical funnel approach that balances computational efficiency with accuracy. These protocols sequentially apply docking methods of increasing rigor and computational expense to gradually filter large compound libraries into manageable sets of high-probability hits [40] [41]. The High Throughput Virtual Screening (HTVS), Standard Precision (SP), and Extra Precision (XP) modes implemented in docking platforms like Glide (Schrödinger) exemplify this strategy, enabling researchers to prioritize compounds based on predicted binding affinities and complementarity to the target's binding pockets [41]. For STAT SH2 domains, which feature distinct pY (phosphate-binding) and pY+3 (specificity) pockets with unique flexibility characteristics, such tailored protocols are particularly valuable [10] [16].
STAT SH2 Domain: Structural Context and Therapeutic Significance
Structural Features of STAT SH2 Domains
STAT SH2 domains belong to a larger family of SH2 domains but possess distinctive structural characteristics that influence ligand binding and drug discovery approaches. The canonical SH2 domain fold consists of a central anti-parallel β-sheet flanked by two α-helices, forming an αβββα motif [10]. This structure creates two primary binding subsites: the pY pocket that engages the phosphorylated tyrosine residue, and the pY+3 pocket that provides specificity for residues C-terminal to the pTyr [10] [16].
Unlike many SH2 domains, STAT-type SH2 domains contain a C-terminal α-helix rather than a β-sheet and exhibit a particularly flexible binding interface [10]. This flexibility is evident in the pY pocket, where accessible volume varies dramatically even on sub-microsecond timescales, presenting both challenges and opportunities for drug discovery [10]. Additionally, STAT SH2 domains lack an EF loop and feature an open BG loop, resulting in a non-conventional P+3 binding pocket architecture compared to other SH2 domain classes [16].
Disease Relevance and Targeting Strategy
STAT SH2 domains, particularly in STAT3 and STAT5, have emerged as compelling therapeutic targets due to their central role in oncogenic signaling and immune regulation. Sequencing analyses of patient samples have identified the SH2 domain as a mutational hotspot in STAT proteins, with these mutations profoundly affecting STAT transcriptional activity [10]. Both gain-of-function and loss-of-function mutations occur at the same sites within the SH2 domain, underscoring the delicate structural balance required for proper STAT function [10].
Targeting the STAT SH2 domain requires consideration of several structural and functional aspects:
- The domain mediates critical protein-protein interactions in multiple pleiotropic cascades
- SH2 domain interactions are essential for molecular activation and nuclear accumulation of phosphorylated STAT dimers
- The relatively shallow binding surfaces elsewhere on STAT proteins make the SH2 domain a primary therapeutic interest
- Protein dynamics play a crucial role in ligand binding, necessitating docking approaches that account for flexibility [10]
Multi-Stage Docking Protocol: HTVS → SP → XP
The hierarchical docking protocol sequentially applies filters of increasing complexity to efficiently identify high-affinity ligands for the STAT SH2 domain while conserving computational resources.
The diagram below illustrates the complete multi-stage docking workflow:
Stage 1: High Throughput Virtual Screening (HTVS)
The HTVS stage serves as the initial filter to rapidly reduce library size by prioritizing compounds with favorable shape complementarity to the STAT SH2 domain binding pocket.
Preparation: Protein structures are prepared using the Protein Preparation Wizard, which adds hydrogens, optimizes protonation states, and performs restrained minimization [40]. The STAT SH2 domain structure should be optimized around a known agonist or antagonist if possible, as receptor conformation significantly impacts screening performance [40]. Ligands are prepared using LigPrep, generating all possible protonation and tautomeric states at physiological pH (7.0 ± 2.0) [40].
Grid Generation: A docking grid is centered on key residues in the pY and pY+3 pockets of the STAT SH2 domain. For STAT SH2 domains, this typically involves residues forming the phosphate-binding pocket and the hydrophobic specificity pocket [10]. The grid box should have sufficient dimensions (≥26Å) to accommodate ligand exploration within both pockets.
HTVS Parameters: The HTVS mode in Glide uses a series of hierarchical filters to search for possible ligand locations, trading sampling breadth for speed [41]. A scaling factor of 0.8 is applied to the van der Waals radius of non-polar ligand atoms (partial charge < 0.15e) to accommodate minor steric clashes [40]. Post-docking minimization is performed with full ligand flexibility.
Output: Typically, the top 5-10% of compounds ranked by GlideScore progress to the SP stage. For a library of 1 million compounds, this reduces the pool to 50,000-100,000 compounds.
Stage 2: Standard Precision (SP) Docking
The SP stage provides more rigorous sampling and scoring of the HTVS hits, eliminating false positives with poorer complementarity to the STAT SH2 domain.
Sampling Enhancement: SP performs exhaustive sampling of ligand conformational space within the binding pocket, using a more rigorous algorithm than HTVS [41]. The OPLS3 or OPLS2005 force fields are employed for energy evaluation during the docking process [41].
Scoring Refinement: The SP scoring function incorporates more detailed physical chemistry terms than HTVS, including lipophilic interactions, hydrogen bonding, and rotatable bond penalties [41]. For STAT SH2 domains, which utilize both polar interactions in the pY pocket and hydrophobic interactions in the pY+3 pocket, this balanced scoring is particularly important [10].
Output: The top 10-20% of SP-docked compounds (approximately 5,000-20,000 from an initial library of 1 million) advance to the XP stage. Visual inspection of a subset of top-ranking compounds at this stage can help verify reasonable binding modes.
Stage 3: Extra Precision (XP) Docking
The XP stage applies the most computationally intensive but accurate docking methodology to identify high-affinity ligands with optimal interactions in the STAT SH2 domain binding pockets.
Enhanced Sampling: XP uses an anchor-and-grow sampling approach that more rigorously explores ligand binding modes [41]. This method systematically builds up the ligand in the binding site, exploring alternative conformations that might be missed by less rigorous sampling.
Detailed Scoring: The XP scoring function includes additional terms such as hydrophobic enclosure and enhanced penalties for desolvation and strain [41]. For STAT SH2 domains, the scoring accounts for:
- Penalties for buried polar groups that lack hydrogen bonding partners
- Rewards for hydrophobic contacts in the pY+3 pocket
- Enhanced electrostatic interactions in the pY pocket
- Detailed desolvation effects for both ligand and protein
Output: The top 1-2% of XP-docked compounds (approximately 50-100 from an initial 1 million) are selected for further analysis. These compounds should be carefully examined for binding pose quality and interaction patterns with key STAT SH2 domain residues.
Performance Characteristics
Table 1: Performance Metrics for Glide Docking Modes in Virtual Screening
| Docking Mode | Speed (seconds/compound)* | Typical Yield | Pose Prediction Accuracy (RMSD < 2.5Å) | Primary Application |
|---|---|---|---|---|
| HTVS | ~2 | Top 5-10% | ~70% | Initial library filtering |
| SP | ~10 | Top 10-20% | ~85% | Balanced screening |
| XP | ~120 | Top 1-2% | >90% | High-confidence hit identification |
Based on performance using a single processor of a Quad Core Xeon X5482 system (3.20GHz) [40].
Advanced Considerations for STAT SH2 Domain Docking
Accounting for SH2 Domain Flexibility
STAT SH2 domains exhibit significant flexibility, particularly in the loops defining access to binding pockets [10] [16]. Several methods can address this flexibility in docking campaigns:
Ensemble Docking: Generate multiple receptor conformations through molecular dynamics or optimization with different known ligands [40]. Dock libraries against each conformation and combine results.
Induced Fit Docking (IFD): For top-ranking XP hits, apply Schrödinger's IFD protocol that allows side-chain and backbone flexibility in the binding site [41]. The IFD protocol has been shown to significantly improve pose prediction for targets requiring conformational adaptation [41].
Loop Modeling: For STAT SH2 domains, specific attention should be paid to the BG and EF loops (where present) that control access to binding pockets [16]. These loops can be explicitly modeled in multiple conformations.
Focused Screening for pY and pY+3 Pockets
The distinct nature of the pY and pY+3 pockets in STAT SH2 domains enables targeted screening strategies:
pY Pocket Focus: The pY pocket is highly conserved and positively charged, suitable for compounds with phosphate or phosphate-mimicking groups [10]. Pharmacophore constraints can enforce these interactions during docking.
pY+3 Pocket Focus: The pY+3 pocket varies among STAT family members, offering opportunities for selectivity [10] [16]. For STAT SH2 domains, which may lack conventional P+3 pockets, analysis of clinical mutations can reveal key specificity determinants [10].
Experimental Validation and Controls
Control Docking Calculations
Prior to large-scale screening, establish controls to evaluate docking parameters [39]:
- Known Active Compounds: Dock known STAT SH2 domain binders to verify accurate pose reproduction
- Decoy Sets: Include presumed inactive compounds (e.g., from ZINC database) to assess enrichment capability [40] [39]
- Mutation Validation: Test docking against SH2 domains with clinically relevant mutations that alter function [10]
Biochemical Assays for Validation
Experimentally validate computational predictions using:
- Surface Plasmon Resonance (SPR) to measure binding kinetics and affinity
- Cellular assays monitoring STAT phosphorylation, dimerization, and nuclear translocation
- Gene reporter assays for STAT transcriptional activity
Research Reagent Solutions
Table 2: Essential Research Tools for STAT SH2 Domain Docking Studies
| Resource | Description | Application in STAT SH2 Research |
|---|---|---|
| Glide (Schrödinger) | Comprehensive docking suite with HTVS, SP, and XP modes | Hierarchical screening against STAT SH2 domains [41] |
| ZINC Database | Publicly available database of commercially available compounds | Source of screening compounds and decoys [40] [39] |
| Protein Data Bank | Repository of 3D protein structures | Source of STAT SH2 domain structures (limited availability) [10] |
| DOCK3.7 | Academic docking software (free for nonprofit research) | Alternative docking platform for large-scale screens [39] |
| Prime (Schrödinger) | Protein structure prediction and refinement tool | Modeling STAT SH2 domain homology models and loop conformations [41] |
| LigPrep (Schrödinger) | Ligand preparation and minimization tool | Generation of proper protonation states and tautomers for screening [40] |
The multi-stage docking protocol utilizing HTVS, SP, and XP modes provides an efficient strategy for identifying high-affinity ligands targeting the STAT SH2 domain. This approach balances computational efficiency with accuracy, enabling thorough exploration of chemical space while focusing resources on the most promising candidates. For STAT SH2 domains—dynamic interaction domains with therapeutic significance in cancer and immune disorders—this protocol offers a structured path to discovering novel inhibitors that disrupt pathogenic signaling. As structural information for STAT proteins continues to grow and computational methods advance, such hierarchical docking strategies will become increasingly valuable in drug discovery efforts targeting these challenging proteins.
Molecular docking has become an indispensable tool in modern drug discovery, particularly in the development of inhibitors targeting oncogenic transcription factors like STAT3. The Src Homology 2 (SH2) domain of STAT3 plays a pivotal role in cancer progression and immune evasion by facilitating the phosphotyrosine-mediated dimerization essential for STAT3 activation and subsequent nuclear translocation [4]. Inhibition of the STAT3 SH2 domain disrupts this binding, reduces STAT3 phosphorylation, and impairs dimerization, making it a promising therapeutic strategy for various cancers, including triple-negative breast cancer [42]. However, docking experiments merely generate potential ligand-receptor complexes; the true value emerges from rigorous post-docking analysis that evaluates pose quality, binding affinity, and interaction fingerprints to identify genuine hits. This application note provides detailed protocols and analytical frameworks for post-docking analysis specifically tailored to STAT SH2 domain research, enabling researchers to distinguish true inhibitors from false positives efficiently.
The STAT3 SH2 domain structure features a central anti-parallel β-sheet flanked by two α-helices (αA and αB), commonly known as the αβββα motif [4]. Its phosphotyrosine (pY) binding pocket is divided into three sub-pockets: the pY+0 pocket that binds to phosphotyrosine705 (pTyr705), the pY+1 pocket that engages leucine706 (L706), and a hydrophobic side pocket (pY-X) [4] [12]. This structural arrangement creates specific challenges and opportunities for inhibitor design that must be addressed through comprehensive post-docking analysis.
Quantitative Evaluation of Docking Poses
Binding Pose Metadynamics (BPMD) for Pose Stability Assessment
Binding Pose Metadynamics (BPMD) is an enhanced sampling method that provides an efficient assessment of ligand stability in solution, effectively discriminating between correctly and incorrectly docked poses [42]. Unstable poses under the bias of metadynamics simulation contribute minimally to binding affinity, making BPMD an invaluable tool for post-docking filtration.
Protocol: BPMD Analysis for STAT SH2 Domain Complexes
- System Preparation: Use Desmond software with an NVIDIA RTX 4090 GPU or comparable system. Prepare the protein-ligand complex using the protein preparation wizard in Maestro Schrödinger suite.
- Simulation Parameters: Run 10 independent metadynamics simulations of 10 ns each for every protein-ligand complex. Apply a bias potential to the root-mean-square-deviation (RMSD) of the ligand heavy atoms relative to the starting docking pose.
- Scoring Evaluation: Calculate three critical scores for each complex:
- PoseScore: Average RMSD from the starting pose throughout the simulation. A PoseScore <2.0 Å indicates stability.
- Persistence Score (PersScore): Fraction of simulation frames in the last 2 ns maintaining the same hydrogen bonds as the input structure. A PersScore >0.6 indicates good hydrogen bond persistence.
- Composite Score (CompScore): Combined metric calculated as CompScore = PoseScore - 5 × PersScore. Lower CompScore values signify more robust complexes [42].
Table 1: BPMD Scoring Criteria for STAT SH2 Domain Inhibitors
| Score | Excellent | Acceptable | Poor | Interpretation |
|---|---|---|---|---|
| PoseScore | <2.0 Å | 2.0-3.0 Å | >3.0 Å | Measures geometric stability |
| PersScore | >0.6 | 0.4-0.6 | <0.4 | Measures H-bond persistence |
| CompScore | < -2.0 | -2.0 to 0.0 | >0.0 | Combined stability metric |
For STAT SH2 domain inhibitors, the control compound SI-109 demonstrates excellent BPMD metrics with a PoseScore of 1.896 Å, PersScore of 0.827, and CompScore of -2.237, serving as a benchmark for candidate evaluation [42].
Binding Free Energy Calculations using MM-GBSA
The Molecular Mechanics/Generalized Born Surface Area (MM-GBSA) method provides more reliable binding free energy estimates than standard docking scores by incorporating solvation effects and molecular mechanics energy components.
Protocol: MM-GBSA Analysis for STAT SH2 Domain Complexes
- System Setup: Use the Prime MM-GBSA module within the Schrödinger suite. Employ the OPLS3e force field and VSGB solvation model.
- Trajectory Extraction: Extract snapshots from molecular dynamics simulations of the protein-ligand complexes at regular intervals (typically 100 ps).
- Energy Calculation: Calculate binding free energy using the equation: ΔGBinding = ΔGComplex - (ΔGReceptor + ΔGLigand) where ΔGBinding, ΔGReceptor, and ΔGLigand denote the total binding energy of the complex, free receptor, and unbound ligand, respectively [4].
- Result Interpretation: More negative ΔGBinding values indicate stronger binding. For STAT SH2 domain inhibitors, candidates with ΔGbind ≤ -50 kcal/mol demonstrate promising binding affinity [42].
Table 2: MM-GBSA Binding Energies of Potential STAT3 SH2 Domain Inhibitors
| Compound ID | Docking Score (kcal/mol) | MM-GBSA ΔG (kcal/mol) | Stability Assessment |
|---|---|---|---|
| ZINC255200449 | -8.2 | -58.3 | Stable in MD simulation |
| ZINC299817570 | -7.9 | -55.7 | Favorable binding |
| ZINC31167114 | -8.5 | -61.2 | Stable in MD simulation |
| ZINC67910988 | -9.1 | -65.4 | Superior stability |
| SI-109 (Control) | -10.2 | -68.9 | Experimental reference |
Structural Analysis of SH2 Domain Binding Pockets
SH2 Domain Architecture and Binding Pocket Specificity
The human genome encodes approximately 120 SH2 domains across 110 proteins, all sharing a conserved fold but exhibiting remarkable specificity in phosphotyrosine recognition [2] [16]. Understanding STAT SH2 domain architecture is crucial for accurate post-docking analysis.
STAT-type SH2 domains are structurally distinct from SRC-type domains. They lack the βE and βF strands as well as the C-terminal adjoining loop, with the αB helix split into two helices [2]. This unique architecture is an adaptation that facilitates STAT dimerization, a critical step in STAT-mediated transcriptional regulation.
The binding specificity of SH2 domains is governed by surface loops that control access to binding subsites. The EF loop (joining β-strands E and F) and BG loop (joining α-helix B and β-strand G) play crucial roles in determining binding selectivity by controlling access to ligand specificity pockets [2] [16]. For STAT SH2 domains, the absence of a conventional P+3 or P+4 binding pocket due to their unique loop architecture significantly influences inhibitor binding modes [16].
Diagram 1: SH2 domain binding determinants. The BG and EF loops control access to sub-pockets, determining binding specificity.
Critical Residues for Inhibitor Binding in STAT SH2 Domain
Systematic analysis of STAT3 SH2 domain interactions has identified key residues involved in inhibitor binding. These include Arg609, Glu594, Lys591, Ser636, Ser611, Val637, Tyr657, Gln644, Thr640, Glu638, and Trp623, which show direct or indirect binding involvement with the phosphoserine motif of STAT3 [4]. Mutations and disruptions in these amino acids attenuate STAT3 signaling and activation, confirming their functional importance.
Post-docking analysis should specifically evaluate interactions with these residues, as they represent critical determinants of binding efficacy and specificity. The high conservation of binding sites across STAT family members (particularly between STAT1 and STAT3) presents challenges for achieving selective inhibition and must be carefully considered during analysis [12].
Advanced Analytical Techniques
Ligand-Receptor Contact Fingerprints (LRCF) Analysis
Ligand-Receptor Contact Fingerprints provide a binary vector representation of interactions between a docked ligand and specific atoms in the protein binding site, enabling systematic analysis of interaction patterns [43].
Protocol: LRCF Analysis for STAT SH2 Domain Inhibitors
- Fingerprint Generation: Use specialized software (e.g., in-house Fortran package or comparable tools) to generate LRCFs. The fingerprint consists of "1"s or "0"s corresponding to binding site atoms that either engage or avoid contact with a docked ligand pose.
- Data Integration: Combine LRCFs with scoring function values as descriptors in machine learning models to classify STAT3 ligands into "active" or "inactive" categories.
- Machine Learning Application: Implement orthogonal machine learners (Random Forest, XGBoost) coupled with genetic algorithms to identify critical descriptors that determine anti-STAT3 bioactivity.
- SHAP Analysis: Use Shapley Additive Explanations (SHAP) to determine the relative contribution of each descriptor in bioactivity class predictions and translate these into pharmacophore models [43].
This approach has successfully identified novel STAT3 inhibitors with nanomolar-range cytotoxic IC50 values (35 nM to 6.7 μM), demonstrating the power of LRCF-based analysis in hit identification [43].
WaterMap Analysis for Hydration Site Evaluation
WaterMap analysis uses molecular dynamics simulations to characterize the thermodynamic properties of hydration sites within protein binding pockets, providing insights into the role of water molecules in ligand binding.
Protocol: WaterMap Analysis for STAT SH2 Domain
- System Preparation: Run molecular dynamics simulations of the apo STAT3 SH2 domain using Desmond with OPLS3e force field.
- Hydration Site Identification: Identify hydration sites by clustering water positions from the simulation trajectory.
- Thermodynamic Analysis: Calculate the enthalpy and entropy of each hydration site to determine its free energy.
- Result Application: Identify unfavorable hydration sites that represent displacement opportunities for ligand design. For STAT3 SH2 domain inhibitors, WaterMap analysis has demonstrated superior hydration thermodynamics for promising candidates like ZINC67910988 [4].
Molecular Dynamics Simulations for Binding Stability
Molecular dynamics (MD) simulations provide dynamic information about protein-ligand interactions under physiologically relevant conditions, complementing static docking poses.
Protocol: MD Simulation for STAT SH2 Domain Complexes
- System Setup: Use Desmond within the Schrödinger suite. Solvate the protein-ligand complex in an orthorhombic water box with explicit SPC water molecules.
- Simulation Parameters: Run simulations for at least 100-250 ns at constant temperature (300 K) and pressure (1 atm) using the OPLS3e force field.
- Trajectory Analysis: Calculate RMSD of protein Cα atoms and ligand heavy atoms to assess complex stability. Analyze interaction fractions to determine persistent hydrogen bonds and hydrophobic interactions.
- Free Energy Calculations: Perform thermal MM-GBSA calculations on simulation snapshots to determine binding free energy convergence [4].
For STAT3 SH2 domain inhibitors, promising candidates like ZINC67910988 demonstrate superior stability in MD simulations with minimal structural deviation and maintained interaction networks throughout the simulation period [4].
Experimental Protocols and Workflows
Integrated Post-Docking Analysis Workflow
A comprehensive post-docking analysis workflow for STAT SH2 domain inhibitors should integrate multiple computational techniques to maximize prediction accuracy.
Diagram 2: Integrated workflow for STAT SH2 domain inhibitor screening. This multi-step approach improves hit identification rates.
Protocol: Comprehensive Post-Docking Workflow for STAT SH2 Domain Inhibitors
- Initial Pose Filtering: Cluster docking poses using RMSD-based clustering and select representative poses from each cluster for further analysis.
- Pose Stability Assessment: Perform BPMD analysis on top poses (typically 50-100) to filter out unstable binding modes.
- Binding Affinity Estimation: Calculate MM-GBSA binding free energies for BPMD-validated poses and select compounds with ΔGbind ≤ -50 kcal/mol.
- Interaction Fingerprint Analysis: Generate LRCFs for top candidates and evaluate critical interactions with STAT SH2 domain residues (Arg609, Glu594, Lys591, Ser636, Ser611).
- Dynamic Validation: Run 250 ns MD simulations to assess binding stability and interaction persistence under dynamic conditions.
- Hydation Analysis: Perform WaterMap analysis to identify opportunities for structure-based optimization.
- Selectivity Assessment: Evaluate potential cross-reactivity with STAT1 and other STAT family members through comparative docking and sequence analysis [12].
This integrated workflow has successfully identified novel STAT3 inhibitors with significant anti-TNBC activity, demonstrating its utility in drug discovery pipelines [42].
Specificity Evaluation for STAT Family Cross-Binding
The high conservation of SH2 domains across STAT family members presents significant challenges for achieving selective inhibition. Stattic, initially reported as a STAT3-specific inhibitor, subsequently demonstrated potent inhibition of STAT1 and STAT2 due to its targeting of the highly conserved pY+0 binding pocket [12].
Protocol: Specificity Assessment for STAT SH2 Domain Inhibitors
- Comparative Modeling: Generate high-quality homology models of STAT family SH2 domains if crystal structures are unavailable.
- Cross-Docking Studies: Dock candidate inhibitors against STAT1, STAT2, STAT3, and other STAT family SH2 domains.
- Conservation Analysis: Perform multiple sequence alignment to identify conserved and divergent residues in binding pockets.
- Specificity Determination: Evaluate potential cross-binding by analyzing interactions with conserved residues in the pY+0 and pY-X pockets [12].
This approach revealed that fludarabine phosphate derivatives inhibit both STAT1 and STAT3 by competing with two conserved cavities (pY+0 and pY-X), while stattic primarily targets the highly conserved pY+0 pocket, explaining its lack of specificity [12].
Research Reagent Solutions
Table 3: Essential Research Reagents for STAT SH2 Domain Post-Docking Analysis
| Reagent/Software | Specific Product/Version | Application in Analysis | Key Features |
|---|---|---|---|
| Molecular Docking Suite | Schrödinger Maestro (2024-2) | Protein-ligand docking and initial pose generation | GLIDE module with HTVS, SP, and XP precision modes |
| MD Simulation Software | Desmond | Binding pose validation and stability assessment | OPLS3e force field, GPU acceleration |
| Binding Free Energy Tool | Prime MM-GBSA | Binding affinity calculation | VSGB solvation model, OPLS3e force field |
| Pose Stability Software | Binding Pose Metadynamics (BPMD) | Pose stability assessment | Metadynamics-based pose ranking |
| Hydration Site Analysis | WaterMap | Solvation thermodynamics analysis | Identifies unfavorable hydration sites |
| Structure Database | Protein Data Bank (ID: 6NJS) | STAT3 SH2 domain structure | 2.70 Å resolution, no SH2 domain mutations |
| Compound Database | ZINC15, ChemDiv | Natural compound libraries | 182,455 natural compounds (ZINC15) |
| Machine Learning Platform | KNIME Analytics Platform (4.3.3) | LRCF analysis and model building | Integration with custom fingerprint scripts |
Comprehensive post-docking analysis is essential for identifying genuine STAT SH2 domain inhibitors from virtual screening hits. By integrating pose stability assessment through BPMD, binding affinity evaluation via MM-GBSA, interaction fingerprint analysis using LRCF, and dynamic validation through molecular dynamics simulations, researchers can significantly improve hit rates and identify promising candidates for experimental validation. The protocols and analytical frameworks presented in this application note provide a structured approach for researchers targeting the STAT SH2 domain, with particular emphasis on addressing the challenges of binding specificity and selectivity across STAT family members. As computational methods continue to advance, the integration of machine learning and advanced sampling techniques will further enhance our ability to identify novel therapeutic agents targeting this important oncogenic domain.
Overcoming Docking Challenges: Strategies for Pose Accuracy and Affinity Prediction
The Src Homology 2 (SH2) domain is a approximately 100-amino-acid modular unit that serves as a critical reader of phosphotyrosine (pY) signaling, mediating protein-protein interactions in numerous cellular processes [1] [44]. In the context of drug discovery, particularly targeting the STAT SH2 domain, researchers face a formidable challenge: the structural plasticity of the pY and pY+3 binding pockets [10]. This flexibility, manifested as loop dynamics and side-chain rearrangements, directly impacts ligand binding and represents a significant obstacle in structure-based drug design. The STAT-type SH2 domains, essential for dimerization and transcriptional activation, exhibit particularly flexible behavior even on sub-microsecond timescales, with the accessible volume of the pY pocket varying dramatically [10]. Understanding and addressing this mobility is not merely an academic exercise but a practical necessity for developing effective therapeutic inhibitors against oncogenic targets like STAT3.
The central β-sheet of the SH2 domain, a hallmark of its structure, is not a static platform but a dynamic entity. Recent studies on the N-SH2 domain of SHP2 phosphatase have revealed that phosphopeptide binding correlates with the partial unzipping of this central β-sheet, a conformational change that could not be deduced from static crystal structures alone [45]. This demonstrates that the very core of the domain undergoes significant flexibility upon ligand binding. Furthermore, the loops connecting secondary structural elements—particularly the EF loop (joining β-strands E and F) and BG loop (joining α-helix B and β-strand G)—play pivotal roles in controlling access to binding pockets and defining specificity [1] [16]. These structural elements act as molecular gatekeepers, with their dynamics directly influencing whether potential inhibitors can effectively engage their targets.
Architectural Basis of Pocket Flexibility in STAT SH2 Domains
Structural Anatomy of STAT SH2 Domains
STAT SH2 domains belong to a distinct structural subclass characterized by an αβββα motif [10]. This conserved fold consists of a central anti-parallel β-sheet (strands βB-βD) flanked by two α-helices (αA and αB). The STAT-type SH2 domains are distinguished from Src-type domains by the presence of an additional α-helix (αB') in the C-terminal region of the pY+3 pocket, known as the evolutionary active region (EAR), instead of the β-sheet (βE and βF) found in Src-type domains [10]. This architectural difference contributes to the unique flexibility profile of STAT SH2 domains.
The binding surface is partitioned into two primary subpockets: the pY pocket (phosphate-binding pocket) formed by the αA helix, BC loop, and one face of the central β-sheet; and the pY+3 pocket (specificity pocket) created by the opposite face of the β-sheet along with residues from the αB helix and CD and BC* loops [10]. A cluster of non-polar residues at the base of the pY+3 pocket forms a hydrophobic system that stabilizes the β-sheet conformation and maintains overall SH2 domain integrity. This intricate network of structural elements provides multiple points where flexibility can influence ligand binding.
Molecular Determinants of Flexibility
The loops connecting secondary structures serve as the primary molecular determinants of SH2 domain flexibility and specificity. Research has revealed that these loops control accessibility to three primary binding pockets that exhibit selectivity for the three positions C-terminal to the phosphotyrosine in peptide ligands [16]. Through variations in loop sequence and conformation, binding pockets on an SH2 domain can be either plugged (inaccessible) or open (accessible) for ligand recognition [16].
The EF and BG loops are particularly crucial in defining the hydrophobic cavity that molds the P+3 binding pocket [16]. In some SH2 domains, such as Grb2, a bulky tryptophan residue in the EF loop physically occupies the P+3 binding pocket, forcing bound peptides to adopt a β-turn conformation and fundamentally altering binding specificity [16]. The length and conformation of the CD loop also varies significantly between SH2 domain families, with enzymatic proteins tending to have longer loops compared to non-enzymatic proteins like STATs [2]. This variation directly impacts the dynamics and accessibility of the adjacent binding pockets.
Table 1: Key Flexible Elements in STAT SH2 Domain Structure
| Structural Element | Location | Role in Flexibility | Impact on Binding |
|---|---|---|---|
| Central β-sheet | Domain core | Unzipping/zipping dynamics | Alters pY pocket depth and geometry |
| BC loop (pY loop) | Between βB & βC strands | Conformational flexibility | Modulates phosphotyrosine binding |
| EF loop | Between βE & βF strands | Gating movement | Controls access to P+3 pocket |
| BG loop | Between αB & βG strands | Hinge-like motions | Defines P+4 pocket accessibility |
| CD loop | Between βC & βD strands | Variable length & conformation | Influences pocket topography |
Beyond loop dynamics, side-chain rearrangements of critical residues contribute significantly to pocket flexibility. The highly conserved Arg residue (βB5) in the FLVR motif, which forms a salt bridge with the phosphotyrosine, exhibits rotational freedom that can impact pY binding affinity [1]. Disease-associated mutations frequently localize to these dynamic regions, with many found within the lipid-binding pocket of SH2 domains [1], highlighting the functional importance of these flexible elements.
Diagram 1: Molecular determinants of SH2 domain flexibility. The architecture reveals multiple points of flexibility that collectively influence ligand binding.
Computational Strategies for Modeling Flexibility
Molecular Dynamics Simulations
Molecular dynamics (MD) simulations provide a powerful approach for capturing the temporal evolution of SH2 domain conformations, offering insights into loop motions and side-chain rearrangements that occur on physiological timescales. MD simulations have been successfully employed to study the N-SH2 domain of SHP2, revealing an allosteric interaction that restrains the domain into either an activating or stabilizing state [46]. These simulations demonstrated that phosphopeptides remain tightly bound to the N-SH2 domain throughout 1 μs simulations, maintaining a conformation very similar to experimental structures while still exhibiting functional dynamics [46].
For STAT SH2 domains, which display particularly flexible behavior, enhanced sampling techniques can be employed to overcome the timescale limitations of conventional MD. These methods allow researchers to characterize the transition between multiple conformational states of the pY and pY+3 pockets, mapping the free energy landscape of these binding sites [10]. The integration of MD simulations with free energy calculations creates a comprehensive framework for understanding how pocket flexibility influences ligand binding affinity and specificity.
Advanced Docking Protocols
Conventional rigid docking approaches often fail to account for SH2 domain flexibility, leading to inaccurate pose prediction and binding affinity estimation. Advanced protocols that incorporate flexibility include:
Ensemble Docking: This technique utilizes multiple receptor conformations taken from MD simulations or experimental structures to account for pocket flexibility [4]. By docking against an ensemble of structures, researchers can identify compounds that maintain favorable interactions across multiple conformational states.
Induced Fit Docking (IFD): IFD protocols explicitly model side-chain and backbone adjustments upon ligand binding, making them particularly suitable for SH2 domains where loop rearrangements can significantly alter pocket geometry [4]. These methods iteratively optimize both ligand pose and binding site structure.
WaterMap Analysis: This computational technique locates conserved water molecules within the SH2 binding pockets and evaluates their thermodynamic properties, providing insights into solvation effects that influence both flexibility and binding [4]. Displacing unfavorable water molecules can drive binding affinity and needs to be considered in flexible docking.
Table 2: Computational Strategies for Addressing SH2 Domain Flexibility
| Method | Application | Advantages | Limitations |
|---|---|---|---|
| Molecular Dynamics Simulations | Sampling conformational space | Atomistic detail, physiological conditions | Computationally expensive, timescale limits |
| Ensemble Docking | Virtual screening against multiple conformations | Accounts for binding site heterogeneity | Requires representative conformations |
| Induced Fit Docking | Modeling side-chain/backbone adjustments | Explicitly models receptor flexibility | Increased computational cost |
| MM-GBSA/MM-PBSA | Binding free energy estimation | More accurate than docking scores alone | Sensitive to input conformations |
| WaterMap Analysis | Solvation thermodynamics | Identifies key water molecules | Requires lengthy MD simulations |
Binding Free Energy Calculations
Molecular Mechanics Generalized Born Surface Area (MM-GBSA) and related methods provide more reliable binding affinity estimates by combining molecular mechanics energy with solvation terms [4]. For STAT SH2 domains, these post-processing techniques can be applied to snapshots from MD simulations to account for flexibility in binding free energy calculations. The formula for calculating binding free energy is:
ΔGBinding = ΔGComplex - (ΔGReceptor + ΔGLigand)
Where ΔGBinding, ΔGReceptor, and ΔGLigand denote the total binding energy of the complex, free receptor, and unbound ligand, respectively [4]. This approach, when applied to an ensemble of conformations, provides a more comprehensive picture of binding thermodynamics that incorporates flexibility.
Experimental Approaches for Characterizing Flexibility
Biophysical Techniques for Studying Dynamics
Experimental characterization of SH2 domain flexibility provides essential validation for computational models and reveals dynamics that might not be captured in simulations. Nuclear Magnetic Resonance (NMR) spectroscopy is particularly powerful for studying protein dynamics at atomic resolution across multiple timescales. NMR studies have been instrumental in revealing that the apo form of the N-SH2 domain in solution primarily adopts a conformation with a fully zipped central β-sheet, contrary to earlier crystallographic interpretations [45]. This finding highlights how experimental environment can influence observed flexibility and underscores the importance of solution-based techniques.
X-ray crystallography of multiple SH2 domain liganded states provides structural snapshots of different conformational states. To date, the structures of 70 SH2 domains have been experimentally solved with varying degrees of resolution [1] [2]. Comparing these structures reveals conserved flexibility patterns and conformation-dependent side-chain arrangements. However, researchers must be cautious as the crystallographic environment can significantly influence the structure of isolated domains, potentially leading to misleading interpretations [45].
Protocol: Integrative Approach for Mapping SH2 Domain Flexibility
This protocol combines computational and experimental methods to comprehensively characterize STAT SH2 domain flexibility:
Step 1: Multi-Temperature X-ray Crystallography
- Purify recombinant STAT SH2 domain (residues 575-670 for STAT3) using standard affinity chromatography
- Crystallize both apo and ligand-bound forms using vapor diffusion methods
- Collect diffraction data at multiple temperatures (100K, 277K, room temperature)
- Refine structures and analyze B-factors (temperature factors) to identify regions of high flexibility
Step 2: Solution-State NMR Dynamics Measurements
- Prepare uniformly (^{15})N and (^{13})C-labeled SH2 domain samples
- Collect (^{15})N-(^{1})H HSQC spectra to assess global fold and stability
- Measure (^{15})N relaxation parameters (T1, T2, heteronuclear NOE) to characterize backbone dynamics on ps-ns timescales
- Analyze chemical exchange using CPMG experiments to detect μs-ms timescale conformational dynamics
Step 3: Molecular Dynamics Simulations Setup
- Build simulation systems from experimental structures with explicit solvation
- Parameterize phosphorylation state of key tyrosine residues if applicable
- Run multiplicate 500 ns-1 μs simulations using AMBER or CHARMM force fields
- Perform principal component analysis to identify dominant collective motions
Step 4: Integrative Analysis
- Map NMR-derived order parameters onto SH2 domain structure
- Correlate crystallographic B-factors with MD-derived root mean square fluctuations
- Identify conserved hinge regions and flexible hotspots across methodologies
- Validate computational models against experimental dynamics measurements
Application to STAT SH2 Domain-Targeted Drug Discovery
Challenges in STAT SH2 Inhibitor Development
The development of specific inhibitors targeting STAT SH2 domains faces significant challenges due to several aspects of their flexibility and conservation. The high conservation of the pY binding pocket across STAT family members makes achieving selectivity particularly difficult. Studies have shown that inhibitors like stattic, which primarily target the highly conserved pY+0 SH2 binding pocket, are not specific for STAT3 but are equally effective toward STAT1 and STAT2 [12]. This cross-reactivity results from the structural similarity and dynamic behavior of the pY pocket across different STAT proteins.
The shallow, hydrophobic nature of the pY+3 pocket presents another challenge influenced by flexibility. This pocket, which is crucial for specificity, exhibits conformational heterogeneity that can complicate drug design [10]. Additionally, the allosteric coupling between pockets means that perturbations in one region can dynamically influence others. Molecular simulations of SHP2 phosphatase have revealed that N-SH2 predominantly adopts two distinct conformations (α- and β-states), where only the α-state is activating, while the β-state stabilizes the autoinhibited interface [46]. This conformational selection mechanism likely extends to STAT SH2 domains, where ligand binding may selectively stabilize specific conformational states.
Strategy: Structure-Based Design Accounting for Flexibility
Successful targeting of flexible STAT SH2 domains requires an integrated strategy that explicitly accounts for pocket dynamics:
1. Target Cryptic Pockets
- Identify transient pockets that emerge during MD simulations but are absent in crystal structures
- Design compounds that stabilize these cryptic pockets, potentially achieving greater specificity
- Use fragment-based screening to detect binders to low-population conformational states
2. Design Flexible Inhibitors
- Develop compounds with appropriate conformational flexibility to adapt to multiple SH2 domain states
- Balance rigidity for potency with flexibility to maintain binding across conformational ensembles
- Utilize linkers that accommodate loop movements while maintaining key interactions
3. Exploit Allosteric Sites
- Target less conserved allosteric sites that influence pY or pY+3 pocket dynamics
- Identify regions like the BC* loop that participate in SH2-mediated STAT dimerization
- Design allosteric inhibitors that lock the SH2 domain in inactive conformations
4. Multi-Pocket Targeting
- Develop bivalent inhibitors that simultaneously engage both pY and pY+3 pockets
- Design compounds that bridge main and secondary pockets to increase affinity and specificity
- Utilize extended chemical scaffolds that maintain interactions despite side-chain rearrangements
Diagram 2: Integrative workflow for designing inhibitors against flexible STAT SH2 domains, combining computational and experimental approaches.
The Scientist's Toolkit: Research Reagent Solutions
Table 3: Essential Reagents and Tools for Studying SH2 Domain Flexibility
| Reagent/Tool | Specifications | Application | Considerations |
|---|---|---|---|
| Recombinant SH2 Domains | STAT3 (residues 575-670), >95% purity, isotope-labeled for NMR | Biophysical studies, screening | Include phosphorylation mimics if needed |
| Phosphopeptide Libraries | Oriented peptide array libraries (OPAL) with pY motifs | Specificity profiling | Include disease-associated variants |
| Molecular Dynamics Software | AMBER, CHARMM, GROMACS with specialized force fields | Conformational sampling | Validate force fields against experimental data |
| Crystallography Reagents | Cryoprotectants (glycerol, MPD), high-grade precipitants | Structure determination | Test multiple crystal conditions |
| NMR Isotope Labels | (^{15})N-ammonium chloride, (^{13})C-glucose | Protein dynamics studies | Optimize expression conditions |
| Statistical Mechanics Tools | MM-GBSA, MMPBSA, quasi-harmonic analysis | Energetics analysis | Use multiple methodologies for validation |
| Specialized Docking Software | Schrödinger (Induced Fit), AutoDock Vina, RosettaFlex | Flexible docking | Benchmark against known binders |
Addressing pocket flexibility in STAT SH2 domain research requires a multidisciplinary approach that integrates computational modeling with experimental validation. The dynamic nature of loops and side-chains surrounding the pY and pY+3 pockets is not merely a complicating factor but an essential property that can be exploited for therapeutic advantage. Strategies that explicitly account for this flexibility—including ensemble docking, molecular dynamics simulations, and advanced biophysical characterization—provide a path forward for developing specific inhibitors against challenging targets like STAT3.
Future advances will likely come from several emerging areas. Machine learning approaches can help predict flexibility patterns from sequence alone and guide inhibitor design. Time-resolved structural techniques may capture conformational transitions in real time, providing unprecedented insight into SH2 domain dynamics. Multiscale modeling that incorporates full-length STAT proteins and their cellular context will offer a more complete picture of how SH2 domain flexibility functions in physiological signaling. By embracing rather than avoiding the inherent flexibility of STAT SH2 domains, researchers can develop more effective therapeutic strategies that account for the dynamic nature of these critical signaling modules.
Molecular docking has become an indispensable tool in structure-based drug design, particularly for targeting protein-protein interactions that are historically challenging to inhibit. In the context of Signal Transducer and Activator of Transcription (STAT) protein research, the Src Homology 2 (SH2) domain represents a critical therapeutic target due to its essential role in phosphotyrosine-mediated signaling, dimerization, and subsequent nuclear translocation. The SH2 domain structure consists of a central anti-parallel β-sheet flanked by two α-helices, forming what is commonly known as the αβββα motif [4]. This domain contains three key sub-pockets designated as pY (phosphotyrosine binding), pY+1, and pY+3, which recognize specific peptide sequences and facilitate protein-protein interactions [4]. Disrupting these interactions through small molecule inhibitors has emerged as a promising strategy for cancer therapy, particularly given the documented role of constitutive STAT3 activation in various malignancies including breast, prostate, lung, and hematological cancers [4].
The selection of appropriate docking algorithms and scoring functions is paramount for successful virtual screening campaigns targeting the STAT-SH2 domain. This application note provides a comprehensive framework for researchers to navigate the complex landscape of available docking tools, with specific emphasis on their application to the distinct structural features of the SH2 domain's pY and pY+3 pockets. We present systematically evaluated quantitative data, detailed protocols, and practical recommendations to enhance the efficiency and accuracy of docking studies in this specific research domain.
Molecular Docking Fundamentals and Methodologies
Basic Principles of Molecular Docking
Molecular docking computationally predicts the preferred orientation of a small molecule (ligand) when bound to a target receptor protein, enabling researchers to characterize ligand-receptor interactions and estimate binding affinity. The theoretical foundation rests on two complementary models: the Lock-and-Key model, which treats both ligand and receptor as rigid structures, and the more sophisticated Induced Fit theory, which accounts for conformational changes in both binding partners during the association process [47]. The docking process typically involves two sequential components: a search algorithm that explores possible binding orientations and conformations, and a scoring function that evaluates and ranks these poses based on estimated binding affinity [38].
The binding between proteins and ligands represents a complex dynamic interaction process that seeks the lowest energy conformations [47]. Current conformational search methods for protein-ligand docking generally fall into three categories: systematic searching, stochastic searching, and deterministic searching algorithms. Each approach offers distinct advantages and limitations that must be considered in the context of the specific research target and available computational resources.
Docking Method Classifications
Molecular docking methodologies can be classified based on their treatment of molecular flexibility during the docking process. The three primary approaches include:
Rigid Docking: This method treats both ligand and receptor as fixed structures, altering only their relative spatial orientation. While computationally efficient, this approach overlooks conformational changes upon binding and is generally suitable only for systems with minimal flexibility [47].
Semi-Flexible Docking: The most widely used approach for small molecule-protein docking, semi-flexible docking allows ligand flexibility while maintaining a rigid receptor structure. This method offers a practical balance between computational efficiency and biological relevance, making it particularly suitable for high-throughput virtual screening [47].
Flexible Docking: This advanced methodology permits flexibility in both ligand and receptor, providing the most accurate representation of the binding process but at significantly higher computational cost. Flexible docking is typically reserved for final refinement stages or when studying systems with substantial conformational changes [47].
Docking Algorithms and Scoring Functions: A Comparative Analysis
The continuous evolution of molecular docking has yielded numerous software solutions with varying algorithms, scoring functions, and performance characteristics. The table below summarizes key docking programs relevant to STAT-SH2 domain research:
Table 1: Molecular Docking Software Overview
| Software | Search Algorithm | Scoring Function | Flexibility Handling | Key Features |
|---|---|---|---|---|
| AutoDock Vina | Gradient Optimization | Empirical | Semi-Flexible | Fast execution, good accuracy, open-source [48] [49] |
| Glide | Systematic search | Force field-based | Semi-Flexible to Flexible | High accuracy, multiple precision modes (HTVS, SP, XP) [4] [49] |
| DOCK 3.5 | Shape-based matching | Force field-based | Semi-Flexible | Historic significance, transition state docking [38] |
| FlexX | Incremental construction | Empirical | Semi-Flexible | Efficient fragment-based approach [47] |
| GOLD | Genetic Algorithm | Empirical, Knowledge-based | Semi-Flexible | Thorough conformational sampling [38] |
| Surflex | Molecular similarity | Empirical | Semi-Flexible | High scoring accuracy [38] |
| DockingPie | Multiple (Vina, Smina, RxDock, ADFR) | Varies by engine | Semi-Flexible | PyMOL integration, consensus docking [50] |
Recent advances have introduced deep learning (DL) approaches to molecular docking, which can be categorized into generative diffusion models (SurfDock, DiffBindFR), regression-based models (KarmaDock, GAABind), and hybrid methods (Interformer) that integrate traditional conformational searches with AI-driven scoring functions [49]. These methods leverage robust learning capabilities to predict protein-ligand binding conformations and associated binding free energies, potentially overcoming limitations of traditional physics-based approaches [49].
Performance Evaluation of Docking Methods
Comprehensive benchmarking studies provide critical insights into the relative performance of different docking methods. A recent multidimensional evaluation assessed traditional and DL-based docking methods across several benchmark datasets, with results particularly relevant for STAT-SH2 domain research:
Table 2: Docking Method Performance Comparison Across Benchmark Datasets [49]
| Method Category | Representative Software | Pose Accuracy (RMSD ≤ 2 Å) | Physical Validity (PB-valid) | Combined Success Rate |
|---|---|---|---|---|
| Traditional | Glide SP | 75.29% (Astex) | 97.65% (Astex) | 74.12% (Astex) |
| Traditional | AutoDock Vina | 78.24% (Astex) | 92.35% (Astex) | 73.53% (Astex) |
| Generative Diffusion | SurfDock | 91.76% (Astex) | 63.53% (Astex) | 61.18% (Astex) |
| Regression-based | KarmaDock | 47.65% (Astex) | 40.00% (Astex) | 21.76% (Astex) |
| Hybrid Methods | Interformer | 72.35% (Astex) | 89.41% (Astex) | 67.06% (Astex) |
The evaluation revealed a distinct performance hierarchy across different docking methodologies. Traditional methods like Glide SP and AutoDock Vina demonstrated superior physical validity rates exceeding 90%, with Glide maintaining remarkable consistency (≥94% PB-valid rates) across diverse datasets including Astex, PoseBusters, and DockGen [49]. Generative diffusion models, particularly SurfDock, excelled in pose prediction accuracy, achieving RMSD ≤ 2 Å success rates of 91.76% (Astex), 77.34% (PoseBusters), and 75.66% (DockGen) [49]. However, their suboptimal physical validity scores (63.53%, 45.79%, 40.21% across the same datasets) reveal significant deficiencies in modeling critical physicochemical interactions, resulting in moderate combined success rates [49]. Regression-based methods generally underperformed, struggling with both pose accuracy and physical validity, while hybrid approaches offered a balanced compromise between traditional and DL-based methods [49].
Scoring Functions: Principles and Applications
Scoring functions are mathematical models used to predict the binding affinity of protein-ligand complexes. They can be broadly categorized into four main classes:
Force Field-Based: These functions calculate binding energy by summing contributions from non-bonded interactions including van der Waals forces, hydrogen bonding, and electrostatic interactions, often incorporating bond angle and torsional deviation terms [38] [47]. Examples include the scoring functions implemented in AutoDock and DOCK [38].
Empirical: These scoring functions employ linear regression analysis of protein-ligand complexes with known binding affinities, parameterizing energy terms based on different interaction types such as hydrogen bonds, ionic interactions, and hydrophobic contacts [38].
Knowledge-Based: These functions utilize statistical analyses of structural databases to derive atom-pair potentials, leveraging the increasing availability of high-quality protein-ligand complex structures [38].
Consensus Scoring: This approach combines evaluations from multiple scoring functions in various configurations to improve reliability and reduce method-specific biases [38].
The scoring function remains one of the most critical components in structure-based drug design, and recent advances have focused on improving their accuracy and reliability [51]. For STAT-SH2 domain targeting, empirical and force field-based scoring functions have demonstrated particular utility, especially when complemented by molecular mechanics generalized born surface area (MM-GBSA) calculations for binding free energy estimation [4].
Application to STAT-SH2 Domain Targeting: Protocols and Workflows
STAT-SH2 Domain Structure and Characteristics
The STAT-SH2 domain presents distinctive structural features that must be considered during docking studies. The domain contains three crucial sub-pockets: the pY+X (hydrophobic side), pY+0 (binds to pY705), and pY+1 (binds to L706) pockets [4]. Key amino acid residues involved in binding include Arg 609, Glu 594, Lys 591, Ser 636, Ser 611, Val 637, Tyr 657, Gln 644, Thr 640, Glu 638, and Trp 623, which show direct or indirect binding involvement with the phosphoserine motif of STAT3 [4]. Mutations and disruptions in these residues can attenuate STAT3 signaling and activation, making them prime targets for therapeutic intervention.
The pY+0 pocket specifically interacts with phosphotyrosine705 on STAT3 to stabilize dimerization and facilitate nuclear translocation of phosphorylated STAT3 [4]. Following nuclear translocation, STAT3 functions as a transcription factor, stimulating genes required for cell proliferation and survival [4]. This makes the pY and adjacent pockets particularly attractive for small molecule inhibition strategies aimed at disrupting STAT3 dimerization and activation.
Integrated Workflow for STAT-SH2 Domain-Targeted Docking
The following diagram illustrates a comprehensive workflow for molecular docking studies targeting the STAT-SH2 domain, integrating multiple steps from protein preparation through experimental validation:
Diagram Title: STAT-SH2 Domain Docking Workflow
Detailed Experimental Protocol for STAT-SH2 Domain Targeting
Based on successful implementations in STAT-SH2 domain research, the following protocol provides a step-by-step methodology for docking studies targeting this specific domain:
Protein Preparation and Binding Site Definition
Protein Structure Selection: Retrieve the STAT3 crystal structure (PDB ID: 6NJS) from the Protein Data Bank. This structure is recommended due to its superior resolution (2.70 Å), absence of mutations in the SH2 domain, and minimal sequence gaps compared to alternatives like 6NUQ (3.15 Å resolution) [4].
Protein Preprocessing: Utilize the Protein Preparation Wizard in Schrödinger Suite to:
- Add hydrogen atoms and missing side chains using the Prime tool
- Assign proper bond orders
- Review and modify the structure as needed, ensuring the crucial binding pocket remains unaltered [4]
Energy Minimization: Employ the OPLS3e (Optimized Potential for Liquid Simulation) force field to minimize protein energy, achieving a stable low-energy state protein structure [4].
Binding Site Definition: Create a receptor grid file centered on the SH2 domain with coordinates X:13.22, Y:56.39, Z:0.27, using a grid box size of 20 Å to encompass the pY, pY+1, and pY+3 pockets [4]. Validate the grid by redocking the co-crystallized ligand and calculating the root-mean-square deviation (RMSD) between pre- and post-docking conformations.
Compound Library Preparation
Database Curation: Retrieve natural compounds from databases such as ZINC15, applying appropriate availability criteria. In published STAT3 studies, 182,455 natural compounds were successfully screened [4].
Ligand Preparation: Process compounds using LigPrep tool in Maestro Schrödinger Suite to:
- Generate suitable three-dimensional structures
- Optimize ionization states at physiological pH (7.4 ± 0.5)
- Examine molecular chirality
- Perform further optimization using the OPLS3e force field [4]
Molecular Docking Execution
Hierarchical Docking Approach: Implement a multi-stage docking protocol using GLIDE:
- Initial Screening: Perform High-Throughput Virtual Screening (HTVS) of the entire compound library (e.g., 182,455 prepared ligands)
- Intermediate Screening: Subject top-ranking molecules from HTVS (e.g., 55,872 compounds) to Standard Precision (SP) docking
- Final Screening: Execute Extra Precision (XP) docking on the top-scoring compounds (cut-off at -6.5 kcal/mol) from SP mode for the most accurate assessment [4]
Consensus Docking: For critical hits, consider implementing consensus docking using tools like DockingPie, which provides interfaces to multiple docking programs (Smina, Autodock Vina, RxDock, ADFR) and facilitates comparative analysis [50].
Post-Docking Analysis and Validation
Binding Energy Calculation: Perform MM-GBSA (Molecular Mechanics Generalized Born Surface Area) analysis using the Prime MM-GBSA module to determine binding free energy (ΔG Binding) of protein-ligand complexes. Utilize the OPLS3e force field and VSGB solvent model with the equation: ΔG Binding = ΔG Complex - (ΔG receptor + ΔG ligand) [4]
WaterMap Analysis: Execute WaterMap analysis to evaluate the role of water molecules in binding pockets and their contribution to binding affinity [4].
Molecular Dynamics Simulations: Conduct molecular dynamics simulations (e.g., using Desmond) to assess compound stability over time, complement with thermal MM-GBSA for binding energy validation under dynamic conditions [4].
Visualization and Interaction Analysis: Utilize PyMOL for visualization of docking poses and interaction analysis. Specific commands for analyzing protein-protein docking results can be adapted for small molecule interactions:
- Remove solvent molecules:
remove solvent - Display binding site residues:
show sticks, byres [receptor] within 5 of [ligand] - Identify polar contacts: Select ligand → Find → Polar contacts → Any atoms [52]
- Remove solvent molecules:
Table 3: Essential Research Reagents and Computational Tools for STAT-SH2 Domain Docking Studies
| Category | Item/Software | Specification/Version | Application/Purpose |
|---|---|---|---|
| Protein Structures | STAT3 SH2 domain (PDB: 6NJS) | Resolution: 2.70 Å | Primary target structure for docking studies [4] |
| Compound Libraries | ZINC15 Natural Compounds | 182,455 compounds | Source of potential inhibitors [4] |
| Software Suites | Schrödinger Suite | 2024-2 | Comprehensive drug discovery platform [4] |
| Docking Software | GLIDE | HTVS, SP, XP modes | Hierarchical virtual screening [4] |
| Docking Software | AutoDock Vina | Open-source | Rapid docking calculations [48] [49] |
| Docking Software | DockingPie | PyMOL plugin | Consensus docking platform [50] |
| Visualization Tools | PyMOL | Version ≥2.3.0 | Molecular graphics and visualization [50] [52] |
| Simulation Tools | Desmond | - | Molecular dynamics simulations [4] |
| Analysis Tools | Prime MM-GBSA | - | Binding free energy calculations [4] |
| Analysis Tools | WaterMap | - | Hydration site analysis [4] |
Algorithm Selection Guidelines for STAT-SH2 Domain Research
Based on comprehensive performance evaluations and specific application requirements for STAT-SH2 domain targeting, the following algorithm selection guidelines are recommended:
Method Selection Based on Research Objectives
High-Throughput Virtual Screening: For initial screening of large compound libraries (>100,000 compounds), employ a hierarchical approach combining HTVS mode in GLIDE followed by SP and XP docking for top hits [4]. This strategy balances computational efficiency with accuracy, successfully identifying potential STAT3 inhibitors like ZINC255200449, ZINC299817570, ZINC31167114, and ZINC67910988 in published studies [4].
Accurate Pose Prediction for Lead Optimization: When precise binding mode identification is prioritized, particularly during lead optimization phases, utilize generative diffusion models like SurfDock, which demonstrated superior pose accuracy (91.76% RMSD ≤ 2 Å on Astex diverse set) [49]. Complement with traditional methods to ensure physical validity.
Structure-Activity Relationship Studies: For SAR applications requiring reliable affinity predictions, implement hybrid approaches that combine traditional search algorithms with machine learning scoring functions, such as Interformer, which balanced pose accuracy (72.35%) with physical validity (89.41%) in benchmark studies [49].
Consensus Docking for Critical Validation: When evaluating high-priority candidates, employ consensus docking strategies using platforms like DockingPie, which integrates multiple docking engines (Smina, Autodock Vina, RxDock, ADFR) and facilitates comparative analysis to increase confidence in predictions [50].
Addressing Specific STAT-SH2 Domain Challenges
The unique characteristics of the STAT-SH2 domain present particular challenges that influence algorithm selection:
Phosphotyrosine Mimicry: Since the pY pocket specifically recognizes phosphotyrosine, docking programs must effectively handle the charged phosphate groups or phosphate-mimicking moieties in small molecule inhibitors. Empirical scoring functions with appropriate parameterization for charged interactions are recommended.
Adaptive Binding Pockets: The pY+1 and pY+3 pockets exhibit adaptability to different peptide sequences, suggesting potential flexibility. Consider flexible docking approaches or ensemble docking for these regions if rigid receptor docking yields inconsistent results.
Solvent-Mediated Interactions: SH2 domains frequently employ water-mediated hydrogen bonding networks. Implement docking protocols that incorporate explicit water molecules or utilize post-docking WaterMap analysis to account for these contributions [4].
Specificity Considerations: To minimize off-target effects against other SH2 domain-containing proteins, employ stringent scoring thresholds and complement docking with molecular dynamics simulations to assess binding stability and interaction patterns unique to STAT-SH2 domains.
The landscape of molecular docking continues to evolve with emerging methodologies, particularly deep learning approaches that show significant promise for enhancing pose prediction accuracy. However, current evaluations indicate that traditional methods like Glide and AutoDock Vina maintain advantages in physical validity and overall reliability for STAT-SH2 domain targeting [49]. The integration of hierarchical docking protocols with advanced molecular dynamics simulations and binding free energy calculations represents the most robust strategy for identifying and validating potential STAT-SH2 domain inhibitors.
Future developments in docking methodologies will likely address current limitations in modeling protein flexibility and solvation effects, further improving accuracy for challenging targets like the STAT-SH2 domain. Additionally, the growing integration of network pharmacology approaches will enhance our ability to map compound interactions within biological systems, highlighting multitarget potential and helping minimize off-target effects [4]. As these computational methods continue to advance, they will increasingly accelerate the discovery and optimization of novel therapeutics targeting STAT signaling pathways in cancer and other diseases.
Molecular docking serves as a cornerstone in structure-based drug design, providing initial predictions of ligand binding modes and affinities. However, its reliance on empirical scoring functions often limits the accuracy of binding affinity predictions, a critical shortcoming when targeting challenging domains such as the STAT SH2 domain with its shallow, flexible binding pockets [10] [38]. To address this, advanced computational methods have emerged that provide more rigorous and physically grounded estimates of binding free energy. This application note details the integration of two such techniques—MM/GBSA (Molecular Mechanics with Generalized Born and Surface Area solvation) and WaterMap—within the specific context of STAT SH2 domain research. These methods move beyond docking scores to yield deeper insights into the energetic drivers of ligand binding, facilitating the rational design of more potent and selective inhibitors.
The STAT SH2 domain is a high-value therapeutic target in oncology and immunology, mediating critical protein-protein interactions in signal transduction pathways. Its binding interface consists of two primary pockets: the phosphotyrosine (pY) pocket, which engages the phosphorylated tyrosine residue, and the pY+3 pocket, which confers binding specificity [10] [16]. The unique flexibility and shallow nature of the STAT-type SH2 domain, characterized by an α-helix at the C-terminus and a particularly flexible pY pocket, present a significant challenge for accurate affinity prediction using docking alone [10]. MM/GBSA and WaterMap provide complementary strategies to overcome these challenges by accounting for solvation effects and the thermodynamic behavior of water molecules within the binding site, respectively.
Theoretical Background and Comparative Analysis
MM/GBSA for Binding Free Energy Estimation
The MM/GBSA method estimates the binding free energy (ΔG_bind) of a ligand (L) to a receptor (R) according to the following thermodynamic cycle:
Formula: MM/GBSA Binding Free Energy
ΔG_bind = G_complex - (G_receptor + G_ligand)
Where the free energy of each species (G) is calculated as:
G = E_MM + G_solv - TS
E_MM represents the molecular mechanics energy in vacuum, comprising bonded (bond, angle, dihedral) and non-bonded (electrostatic and van der Waals) interactions. G_solv is the solvation free energy, further decomposed into polar (G_polar) and non-polar (G_nonpolar) contributions. The polar term is typically computed using the Generalized Born (GB) model, while the non-polar term is often estimated from the solvent accessible surface area (SASA). The entropy contribution (-TS) is often the most computationally demanding term to calculate and is sometimes omitted in high-throughput studies, leading to the reported value being an estimate of the binding enthalpy [53] [54].
A critical operational choice is the selection of the structural ensemble. The "1-average" (1A) approach uses snapshots from a single molecular dynamics (MD) simulation of the complex, from which the unbound receptor and ligand are derived by atom removal. This approach benefits from cancellation of intramolecular strain energy and is computationally efficient. In contrast, the "3-average" (3A) approach employs separate simulations for the complex, receptor, and ligand, which can capture conformational changes upon binding but introduces more noise and is significantly more computationally expensive [53].
WaterMap for Hydration Site Analysis
WaterMap is an advanced analytical tool based on molecular dynamics simulations and statistical mechanics that identifies the locations and estimates the free energy of hydration sites within a protein's binding pocket [55] [56]. It operates on the principle that the displacement of structured water molecules from the binding site to the bulk solvent is a major driver of ligand binding affinity.
The method performs an explicit-solvent MD simulation of the protein. The positions of water molecules are then clustered to identify hydration sites. For each site, a thermodynamic breakdown is provided, including the enthalpy (ΔH), entropy (-TΔS), and total free energy (ΔG) of the water molecule residing there relative to the bulk solvent [56]. Hydration sites are categorized as:
- Unfavorable (Displaceable):
ΔΔG >> 0andΔH >> 0. Displacing these high-energy waters provides a significant thermodynamic gain for binding. - Favorable (Stable):
ΔΔG << 0. Displacing these low-energy waters is thermodynamically costly. - Replaceable:
ΔH << 0butΔΔG ≈ 0 or > 0. These waters can be displaced if the ligand can form similarly favorable interactions.
Designing ligands with functional groups that specifically displace unfavorable waters while preserving or mimicking favorable ones can lead to substantial gains in binding affinity and selectivity [55] [57].
Comparative Analysis of Docking, MM/GBSA, and WaterMap
Table 1: Comparison of Computational Methods for Binding Affinity Assessment.
| Method | Theoretical Basis | Output | Computational Cost | Key Advantages | Key Limitations |
|---|---|---|---|---|---|
| Molecular Docking | Empirical or knowledge-based scoring functions. | Docking Score, Binding Pose. | Low | High-throughput, fast screening of large libraries [38]. | Limited accuracy; neglects full flexibility and explicit solvation [49]. |
| MM/GBSA | Molecular mechanics and implicit solvation models. | Estimated ΔG_bind (enthalpy). | Medium | More rigorous than docking; accounts for solvent and entropy (if calculated); provides energy decomposition [53] [54]. | Sensitive to input structures and parameters; crude entropy treatment; high uncertainty with 3A approach [53]. |
| WaterMap | MD simulation and statistical mechanics of explicit water. | Hydration site locations and free energies. | High | Provides atomic-level insight into solvation thermodynamics; guides rational design [55] [56]. | Does not directly compute ligand affinity; requires expert interpretation. |
Application to STAT SH2 Domain Research
Protocol 1: MM/GBSA Calculation Workflow
This protocol describes the steps to perform an MM/GBSA calculation to estimate the binding free energy of a ligand bound to the STAT SH2 domain.
Diagram: MM/GBSA Calculation Workflow
Step-by-Step Procedure:
- System Preparation:
- Obtain a high-resolution structure of the STAT SH2 domain (e.g., from PDB). Critical residues for the pY and pY+3 pockets should be correctly protonated.
- Prepare the ligand structure, ensuring proper bond orders and charges. Energy minimization is recommended.
- Generate the protein-ligand complex using a molecular modeling suite like Maestro (Schrödinger) or similar.
Molecular Dynamics Simulation:
- Solvate the complex in an explicit water box (e.g., TIP3P) and add ions to neutralize the system.
- Energy minimize the system to remove bad contacts.
- Gradually heat the system to the target temperature (e.g., 310 K) under constant volume (NVT) conditions.
- Equilibrate the system under constant pressure (NPT) conditions until density and energy stabilize.
- Run a production MD simulation (typically 10-100 ns). The length should be sufficient for the system to stabilize, as judged by root-mean-square deviation (RMSD).
Snapshot Sampling and Energy Calculation:
- Extract a series of snapshots (e.g., 100-1000) from the equilibrated portion of the trajectory at regular intervals.
- For each snapshot, remove all water molecules and ions. The MM/GBSA calculation is then performed using an implicit solvation model on these "dry" snapshots.
- Use a software tool like Schrodinger's Prime, Amber, or GROMACS with g_mmpbsa to calculate the energy terms for the complex, receptor, and ligand using the 1A approach [54] [58].
- The free energy is computed for each snapshot using the formula in Section 2.1.
Analysis:
- Average the individual energy terms and the total ΔG_bind over all snapshots.
- Report the mean and standard error of the estimate.
- Perform energy decomposition per-residue to identify "hot spots" in the pY and pY+3 pockets that contribute most significantly to binding [58].
Protocol 2: WaterMap Analysis Workflow
This protocol outlines the steps to conduct a WaterMap analysis for the apo STAT SH2 domain to guide inhibitor design.
Diagram: WaterMap Analysis Workflow
Step-by-Step Procedure:
- System Preparation:
- Use the same prepared structure of the STAT SH2 domain as in Protocol 1, but in its apo (unliganded) form.
Molecular Dynamics Simulation:
- Solvate, minimize, and equilibrate the apo protein system as described in Protocol 1.
- Run a production MD simulation. A well-converged simulation is critical for obtaining a meaningful water structure. Convergence can be assessed by monitoring the stability of the water clusters over time.
Hydration Site Analysis:
- The WaterMap software (Schrödinger) analyzes the MD trajectory to cluster water molecule positions into discrete hydration sites within the defined binding pocket region encompassing the pY and pY+3 pockets [55] [57].
- For each hydration site, it calculates the free energy (ΔG), enthalpy (ΔH), and entropy (-TΔS) of the water molecule occupying it, relative to bulk solvent.
Interpretation and Design:
- Visually inspect the results. Hydration sites are typically color-coded by their ΔG value (e.g., red for unfavorable/high-energy sites, blue for favorable/low-energy sites).
- Identify high-energy hydration sites in the pY+3 pocket and other sub-pockets. These are prime targets for displacement by introducing complementary hydrophobic or H-bonding groups on the ligand [56] [57].
- Note stable, low-energy waters that mediate protein-ligand interactions. These should be preserved or replaced by isosteric ligand functional groups.
The Scientist's Toolkit: Research Reagent Solutions
Table 2: Essential Software and Tools for MM/GBSA and WaterMap Analysis.
| Tool Name | Type | Primary Function | Application in This Context |
|---|---|---|---|
| Schrödinger Suite [55] | Commercial Software Platform | Integrated drug discovery platform. | Contains Maestro for setup, Glide for docking, Desmond for MD, Prime for MM/GBSA, and WaterMap. Provides a seamless workflow. |
| Flare MM/GBSA [54] | Commercial Software Module | MM/GBSA calculations. | User-friendly implementation of MM/GBSA, suitable for both single conformations and MD trajectories. |
| AMBER | Commercial/Academic Software | Molecular dynamics simulation and analysis. | A widely used package for running MD simulations and performing end-state free energy calculations like MM/PBSA and MM/GBSA. |
| GROMACS | Open-Source Software | Molecular dynamics simulation. | A high-performance MD package that can be used with tools like g_mmpbsa for MM/GBSA calculations. |
| AutoDock Vina [49] [38] | Open-Source Software | Molecular docking. | Provides initial poses and scoring for complexes prior to more refined MM/GBSA analysis. |
| PDB | Public Database | Repository of 3D protein structures. | Source of initial experimental structures of the STAT SH2 domain for simulation setup [58]. |
The integration of MM/GBSA and WaterMap into the drug discovery pipeline for STAT SH2 domain inhibitors represents a powerful strategy to transcend the limitations of molecular docking. While docking provides a crucial initial screen, MM/GBSA delivers a more rigorous, physics-based estimate of binding affinity, and WaterMap offers unparalleled insight into the solvation thermodynamics that govern molecular recognition. By applying these protocols, researchers can deconstruct the energetic contributions of key residues in the pY and pY+3 pockets and rationally design ligands that optimally displace unfavorable waters. This synergistic approach enables a shift from mere binding pose prediction to intelligent, structure-guided lead optimization, accelerating the development of novel therapeutics targeting STAT-driven diseases.
In the context of molecular docking research targeting the STAT SH2 domain, particularly its pY and pY+3 pockets, the validation of predicted binding poses is a critical step in ensuring the reliability of computational findings. The Root-Mean-Square Deviation (RMSD) calculation serves as a fundamental quantitative metric for this validation process, providing a measure of similarity between computationally predicted ligand poses and experimentally determined reference structures [49] [59]. Within the specific architectural framework of SH2 domains—characterized by a central β-sheet flanked by two α-helices that form specialized binding pockets for phosphotyrosine-containing sequences—accurate pose prediction becomes essential for developing effective inhibitors [16] [21]. The validation process employing RMSD provides researchers with a standardized approach to assess docking performance, compare different computational methodologies, and establish confidence in predicted binding modes before proceeding to more resource-intensive experimental validation.
Experimental Protocols for RMSD Validation
Reference Structure Preparation
The first critical step involves obtaining and preparing a reliable reference structure. For STAT SH2 domain research, this typically begins with retrieving a crystal structure from the Protein Data Bank (PDB), such as 6NJS (STAT3-SH2) at 2.70 Å resolution [21]. The protein preparation process includes adding hydrogen atoms, correcting missing side chains, and energy minimization using force fields such as OPLS3e [21]. The co-crystallized ligand within the SH2 domain's binding pocket, particularly one engaging the pY and pY+3 pockets, serves as the reference ligand conformation for subsequent RMSD calculations.
Self-Docking and Cross-Docking Validation
To establish the accuracy of the docking protocol, self-docking validation is performed where the native co-crystallized ligand is re-docked into its original binding site [59]. The RMSD is then calculated between the docked pose and the original crystal structure pose. Successful validation typically requires an RMSD value ≤ 2.0 Å, indicating the docking method can reproduce the experimental binding mode [49]. For more rigorous testing, cross-docking validation using multiple protein structures complexed with different ligands assesses the protocol's robustness across similar but non-identical systems.
RMSD Calculation Methodology
The actual RMSD calculation involves a specific mathematical approach. After docking, the predicted ligand pose is structurally aligned with the reference crystal structure pose based on the protein's alpha-carbon atoms or binding site residues. The RMSD is then calculated using the formula:
RMSD = √[Σ(xi - xref)^2 + (yi - yref)^2 + (zi - zref)^2) / N]
Where (xi, yi, zi) represent the atomic coordinates of the docked ligand, (xref, yref, zref) represent the reference ligand coordinates, and N is the number of atoms compared. Specialized tools such as fcon and various molecular visualization packages implement this calculation, typically using heavy atoms for meaningful comparison [59].
Comprehensive Workflow for Docking Validation
The complete experimental workflow for docking validation integrates multiple steps from initial preparation to final analysis, with RMSD calculation serving as the critical validation checkpoint as shown in the diagram below.
Quantitative Benchmarks and Interpretation
RMSD Thresholds and Performance Metrics
The establishment of clear RMSD thresholds is essential for objective assessment of docking accuracy as detailed in the table below.
Table 1: RMSD Thresholds for Docking Validation and Performance Benchmarks
| RMSD Range | Validation Outcome | Typical Success Rates | Implications for SH2 Domain Research |
|---|---|---|---|
| ≤ 2.0 Å | Successful validation | 70-91% (top traditional methods) [49] | High confidence in pY+3 pocket binding mode prediction |
| 2.0 - 3.0 Å | Moderate accuracy | Varies by method and target | Binding pocket generally correct but side-chain orientations uncertain |
| ≥ 3.0 Å | Unsuccessful docking | <30% for poor performers [49] | Incorrect binding mode; protocol optimization required |
Advanced Considerations for SH2 Domain Applications
When targeting the STAT SH2 domain, several specialized considerations enhance the meaningful application of RMSD validation. First, residue-specific alignment focusing on the pY binding pocket (containing critical residues like Arg609 and Lys591 in STAT3) rather than global protein alignment provides more relevant RMSD values for binding pose assessment [21] [11]. Second, given that SH2 domains recognize diverse peptide sequences through combinatorial use of pY, pY+1, and pY+3 pockets controlled by surface loops [16], ligands making unique contacts may require tailored validation approaches. Third, while RMSD evaluates geometric accuracy, it should be complemented with interaction fingerprint analysis to verify that key hydrogen bonds and hydrophobic contacts with the SH2 domain are maintained [59].
Research Reagent Solutions
Table 2: Essential Research Tools for Docking Validation and SH2 Domain Research
| Research Tool | Specific Function | Application in STAT SH2 Studies |
|---|---|---|
| AutoDock Vina [60] | Molecular docking with empirical scoring function | Initial screening of compounds targeting pY pocket |
| Schrödinger Glide (XP mode) [21] [59] | High-accuracy docking with extra precision | Refined docking for lead compounds targeting SH2 domain |
| RMSD Calculation Tools (fcon, PyMOL) [59] | Quantifying pose deviation from reference | Validation of predicted binding poses against crystal structures |
| Protein Data Bank (PDB) | Repository of 3D protein structures | Source of STAT SH2 domain structures (e.g., 6NJS) [21] |
| Prime MM-GBSA [21] | Binding free energy calculation | Energetic validation of SH2 domain inhibitors |
| ZINC Database [21] | Library of commercially available compounds | Source of natural product libraries for virtual screening |
| PDB Structures 6NJS, 6NUQ [21] | STAT3-SH2 domain crystal structures | Reference structures for docking validation |
Application in SH2 Domain Research
The application of RMSD-guided docking validation has proven particularly valuable in STAT SH2 domain inhibitor development. Successful examples include the identification of natural compounds like delavatine A stereoisomers (323-1 and 323-2) that bind to three subpockets of the STAT3 SH2 domain [11]. In these studies, RMSD-validated docking predictions were corroborated by experimental methods including drug affinity responsive target stability (DARTS) and fluorescence polarization assays, confirming direct targeting of the STAT3 SH2 domain and inhibition of both phosphorylated and non-phosphorylated STAT3 dimerization [11]. Similarly, virtual screening of natural product libraries against the STAT3 SH2 domain has identified compounds such as ZINC67910988, which demonstrated stable binding in molecular dynamics simulations following initial RMSD validation of docking poses [21]. These applications underscore how RMSD validation serves as a crucial gatekeeper in computational workflows, ensuring that only poses with geometrically plausible binding modes advance to further computational and experimental validation stages.
Within drug discovery programs focused on inhibiting the STAT-SH2 domain, the optimization of a compound's pharmacokinetic profile is as crucial as enhancing its binding affinity. The Src Homology 2 (SH2) domain is a key mediator in phosphotyrosine-based signaling, and targeting its pY and pY+3 pockets is a prominent strategy for disrupting aberrant signaling in diseases such as cancer [1] [24]. However, a potent inhibitor in a biochemical assay is ineffective in vivo without favorable absorption, distribution, metabolism, excretion, and toxicity (ADMET) properties. It is reported that approximately 40% of drug candidates fail in clinical trials due to poor ADME properties [61]. Computational tools like QikProp enable the early assessment of these critical properties, allowing researchers to prioritize lead compounds with a higher probability of clinical success. This application note details the integration of ADMET prediction tools, specifically within the context of a research thesis aimed at discovering novel STAT-SH2 domain inhibitors.
The STAT-SH2 Domain as a Therapeutic Target
Structural and Functional Context
The SH2 domain is a protein module of approximately 100 amino acids that specifically recognizes and binds to phosphotyrosine (pY)-containing peptide motifs [1]. Its highly conserved structure consists of a central anti-parallel beta-sheet flanked by two alpha helices, forming an αβββα motif [4] [24]. This architecture creates two primary binding pockets:
- The pY Pocket (Phosphate-Binding Pocket): This pocket anchors the phosphotyrosine residue of the ligand. It contains a nearly invariant arginine residue (from the FLVR motif) that forms a critical salt bridge with the phosphate group [1] [24] [62].
- The pY+3 Pocket (Specificity Pocket): Located adjacent to the pY pocket, this region interacts with amino acid residues C-terminal to the phosphotyrosine (typically at the +3 position), conferring specificity to different SH2 domains [4] [62].
In STAT3 (Signal Transducer and Activator of Transcription 3), the SH2 domain facilitates the protein's activation through reciprocal phosphotyrosine-mediated dimerization. Disrupting this dimerization by blocking the SH2 domain is a validated therapeutic strategy for inhibiting oncogenic signaling [4].
Targeting Strategy and Challenges
The therapeutic strategy involves designing small molecules that compete with the native phosphopeptide for binding to the pY and pY+3 pockets. The key challenge is to identify compounds that are not only potent but also "drug-like," meaning they can be administered orally, reach systemic circulation, and have an acceptable safety profile [4] [63]. This requires careful balancing of molecular properties during the lead optimization phase.
Diagram 1: STAT3 Signaling and SH2 Domain Inhibition. This diagram illustrates the role of the SH2 domain in STAT3 dimerization and activation, and the mechanism by which small-molecule inhibitors block this process by targeting the pY and pY+3 pockets.
Computational Tools for ADMET Prediction
QikProp is an industry-standard tool for predicting the pharmacokinetic and physicochemical properties of small organic molecules. It uses the molecule's 3D structure to compute a wide range of properties critical for drug-likeness, making it invaluable for filtering compound libraries and refining lead optimization efforts [61].
Key Predicted Properties for SH2 Domain Inhibitors
For inhibitors targeting the largely polar and charged surface of the SH2 domain, certain ADMET properties are particularly important to monitor. The table below summarizes key properties predicted by QikProp and their relevance to an SH2 inhibitor development program.
Table 1: Key ADMET Properties Predicted by QikProp and Their Significance in SH2 Inhibitor Development
| Property | Description | Target Range | Relevance to SH2 Inhibitors |
|---|---|---|---|
| logP | Octanol/water partition coefficient. | <5 [64] | Impacts passive absorption; polar SH2-binding groups can lower logP. |
| logS | Aqueous solubility. | > -6 log mol/L [64] | Crucial for oral bioavailability; poor solubility is a common failure point. |
| Caco-2 Permeability | Model of human intestinal absorption. | > 22 nm/s (good) | Predicts likelihood of oral absorption. |
| MDCK Permeability | Model for passive blood-brain barrier penetration. | Variable based on target | Important for central nervous system (CNS) drug design. |
| logBB | Blood-brain barrier partition coefficient. | -3.0 to 1.2 [61] | Critical for determining CNS exposure. |
| HERG IC50 | Prediction of hERG potassium channel blockage. | > -5 log IC50 [61] | Indicator of potential cardiotoxicity risk. |
| % Human Oral Absorption | Estimated human oral absorption. | >80% is high, <25% is poor [61] | A key high-level metric for dosing feasibility. |
Benchmarking and Alternative Tools
While QikProp is a leading tool, benchmarking studies are essential for selecting the best predictive model. A 2024 comprehensive review of computational tools for physicochemical and toxicokinetic properties confirmed that several software tools demonstrate adequate predictive performance [64]. Furthermore, large-scale benchmarking datasets like PharmaBench are emerging to provide more robust platforms for developing and validating ADMET prediction models, addressing previous limitations of small dataset sizes and lack of drug discovery project relevance [65].
Experimental Protocol: Integrating ADMET Prediction into a STAT-SH2 Drug Discovery Workflow
This protocol outlines a typical virtual screening and lead optimization workflow, integrating QikProp for ADMET profiling, as applied in recent research on STAT3-SH2 domain inhibitors [4].
Diagram 2: Integrated Virtual Screening Workflow. This workflow shows the key stages in identifying and optimizing SH2 domain inhibitors, highlighting the critical point where ADMET prediction is incorporated.
Step-by-Step Procedure
Step 1: Protein and Compound Library Preparation
- Protein Preparation: Obtain the 3D structure of the STAT-SH2 domain (e.g., PDB ID: 6NJS) [4]. Using Maestro's Protein Preparation Wizard, add hydrogen atoms, assign bond orders, fill in missing side chains, and minimize the structure using the OPLS3e or OPLS4 force field.
- Compound Library Preparation: Retrieve a database of natural compounds or synthetic small molecules (e.g., ZINC15). Prepare the ligands using LigPrep to generate 3D structures, correct geometries, and generate possible ionization states at a physiological pH of 7.4 ± 0.5 [4].
Step 2: Molecular Docking
- Receptor Grid Generation: Define the binding site on the STAT-SH2 domain using the coordinates of the co-crystallized ligand. Center the grid box on the pY and pY+3 pockets.
- Hierarchical Docking:
- High-Throughput Virtual Screening (HTVS): Dock the entire prepared library to rapidly filter out compounds with poor complementarity.
- Standard Precision (SP): Re-dock the top-ranking HTVS hits for more reliable scoring.
- Extra Precision (XP): Dock the best SP compounds to identify those with highly specific interactions and to minimize false positives. A docking score cut-off (e.g., -6.5 kcal/mol) is typically applied at this stage [4].
Step 3: Binding Affinity Refinement with MM-GBSA
- Perform Molecular Mechanics/Generalized Born Surface Area (MM-GBSA) calculations on the top protein-ligand complexes from XP docking. This provides a more rigorous estimate of the binding free energy (ΔG Binding) by implicitly accounting for solvation effects [4].
Step 4: ADMET Prediction with QikProp
- Input: Prepare the 3D structures of the top-ranked compounds (typically up to 100-500) from the MM-GBSA analysis.
- Run QikProp: Execute the program using default settings to predict a wide range of ADMET properties.
- Analysis: Filter compounds based on key drug-likeness criteria. For example:
- Prioritize compounds with % Human Oral Absorption > 80%.
- Ensure logP is within an acceptable range (e.g., 1-5).
- Flag compounds with high predicted affinity for the hERG channel (potential cardiotoxicity).
- For non-CNS targets, ensure logBB is low (< -1).
Step 5: Molecular Dynamics Simulation
- Subject the top 3-5 candidates that pass the ADMET filter to molecular dynamics (MD) simulations (e.g., 100 ns using Desmond). This assesses the stability of the protein-ligand complex, the persistence of key hydrogen bonds, and the flexibility of the binding pocket over time [4] [66].
Step 6: Selection of Lead Candidates
- Integrate all data—docking score, MM-GBSA ΔG, ADMET profile, and MD simulation stability—to select 2-3 lead candidates for in vitro and in vivo validation.
Table 2: Essential Research Reagents and Computational Tools for STAT-SH2 Inhibitor Development
| Item | Function/Description | Example Sources/Software |
|---|---|---|
| STAT-SH2 Domain Structure | Provides the 3D atomic coordinates for structure-based drug design. | Protein Data Bank (PDB): e.g., 6NJS, 6NUQ [4] |
| Compound Libraries | Collections of small molecules for virtual screening. | ZINC15, ChEMBL [4] [65] |
| Molecular Docking Software | Predicts the binding pose and affinity of ligands to the protein target. | GLIDE (Schrödinger), AutoDock Vina [4] |
| ADMET Prediction Tool | Computes pharmacokinetic and toxicity properties from molecular structure. | QikProp (Schrödinger) [61] [63] |
| Molecular Dynamics Software | Simulates the dynamic behavior of the protein-ligand complex in a solvated environment. | Desmond (Schrödinger), GROMACS [4] [66] |
| SH2 Domain Database | Specialized resource for sequences, structures, and generic numbering of SH2 domains. | SH2db [24] |
From In Silico to In Vitro: Validating Docking Predictions and Assessing Inhibitor Specificity
Molecular docking is a cornerstone of structure-based drug design, enabling the prediction of how small molecules interact with protein targets. For the Src Homology 2 (SH2) domains of Signal Transducers and Activators of Transcription (STAT) proteins, docking is critical for developing inhibitors that can disrupt aberrant signaling in cancer and inflammatory diseases. SH2 domains are ~100 amino acid modules that recognize phosphotyrosine (pTyr) motifs, and their inhibition blocks STAT activation and subsequent dimerization [12]. A key challenge is achieving specificity, given the high conservation of the pTyr-binding pocket among STAT family members [12]. This application note provides a detailed protocol for benchmarking docking performance against STAT SH2 domains, focusing on the pY and pY+3 binding pockets, to guide the development of selective inhibitors.
Scientific Background and Significance
STAT SH2 Domain Structure and Function
The SH2 domain fold is characterized by a central β-sheet flanked by two α-helices [16]. Its function is to bind peptides containing phosphorylated tyrosine residues. Specificity for different peptide sequences is largely determined by residues in the loops connecting secondary structures, which control access to three key binding pockets that select for the pTyr (pY+0) and the residues at the +1 to +4 positions C-terminal to it [16]. The pTyr-binding pocket (pY+0) is highly conserved and features a critical arginine residue that forms bidentate hydrogen bonds with the phosphate moiety [16] [67]. The pY+3 pocket is a key specificity-determining region; however, studies on the v-Src SH2 domain suggest this region can be a large, dynamic binding surface that allows significant promiscuity, presenting a challenge for designing selective inhibitors [68].
The Challenge of Specificity in STAT Inhibition
The high conservation of SH2 domain structures, especially in the pY+0 pocket, makes designing specific inhibitors difficult. Research has shown that the STAT3 inhibitor Stattic is not specific but also effectively inhibits STAT1 and STAT2 because it primarily targets the conserved pY+0 pocket [12]. Similarly, fludarabine, known as a STAT1 inhibitor, can also inhibit STAT3 phosphorylation by competing with the pY+0 and a hydrophobic side pocket (pY-X) [12]. These findings underscore the necessity of rigorous docking benchmarks that evaluate predictions for multiple STAT family members to assess cross-binding potential.
Benchmarking Protocol
This protocol outlines the steps for evaluating docking performance using known inhibitors and experimental structures of STAT SH2 domains.
System Preparation
Protein Structure Preparation
- Source: Obtain high-resolution crystal structures of STAT SH2 domains (e.g., STAT1, STAT3) from the RCSB Protein Data Bank (PDB). If a structure for a specific STAT is unavailable, generate a high-quality homology model [12].
- Preparation: Use a tool like
PDBFixerto add missing hydrogen atoms and residues. Remove all water molecules and non-essential cofactors. - Binding Site Definition: The binding site encompasses the pY+0 pocket and the key specificity pockets (pY+1, pY+3, pY-X). Visually inspect the domain using PyMol to confirm the pocket, which is formed by loops and a central β-sheet [16] [67]. The conserved arginine in the FLVR motif is essential for pTyr binding [67].
Ligand Preparation
- Known Inhibitors: Collect a set of known STAT SH2 binders, including both specific and cross-reactive inhibitors (e.g., Stattic, fludarabine derivatives) [12].
- Preparation: Generate 3D structures for each ligand. Assign correct protonation states at physiological pH (e.g., using RDKit). Perform energy minimization to ensure proper geometry.
Decoy Preparation (for Enrichment Studies)
- Source: Use a database like the Directory of Useful Decoys (DUD) to obtain decoy molecules. Decoys are physically similar to active ligands but are chemically distinct to minimize the chance of actual binding, providing a more rigorous benchmark [69].
Docking Execution
- Software Selection: Choose a docking program such as AutoDock Vina, Smina, or MOE, which offers multiple scoring functions (London dG, Alpha HB, etc.) [70] [67].
- Grid Box Definition: Define a search space that encompasses the entire SH2 domain binding cleft. The grid center and size should be consistent across all docking runs to ensure comparability.
- Parameters: Set an appropriate exhaustiveness value (e.g., 16 or higher) to ensure a comprehensive search of the conformational space [67]. For each ligand, generate multiple poses (e.g., 20-50) for post-docking analysis.
Performance Evaluation
A robust evaluation uses multiple metrics to assess both geometric accuracy and binding affinity ranking.
- Geometric Accuracy: Measure the Root Mean Square Deviation (RMSD) between the heavy atoms of the docked pose and the co-crystallized ligand conformation. A pose with an RMSD ≤ 2.0 Å is typically considered successfully docked [71].
- Pose Plausibility: Use a toolkit like PoseBusters to perform a series of chemical and physical checks on the top-ranked poses. A "PB-valid" pose must pass all checks, including:
- Correct bond lengths and angles.
- Proper stereochemistry and planarity.
- No severe intramolecular clashes.
- An acceptable energy ratio (pose energy vs. ensemble energy) [71].
- Scoring Power: Evaluate the correlation between the docking scores and experimental binding affinities (e.g., pKd or pKi values) for a set of known inhibitors. The Pearson correlation coefficient is a common metric for this [70].
- Virtual Screening Power (Enrichment): Assess the ability to prioritize true binders over decoys. A key metric is the logAUC, which quantifies the fraction of top true binders found early in the screening process, providing a more stringent test than overall correlation [72].
Workflow for docking performance benchmark
Quantitative Evaluation Metrics
The following tables summarize the key metrics and criteria for a comprehensive docking benchmark.
Table 1: Key Metrics for Docking Performance Evaluation
| Metric Category | Specific Metric | Calculation/Description | Success Threshold |
|---|---|---|---|
| Geometric Accuracy | Root Mean Square Deviation (RMSD) | (\sqrt{(1/N) \sum{i=1}^N |ri^{true} - r_i^{pred}|^2}) | ≤ 2.0 Å (High Accuracy) |
| ≤ 5.0 Å (Acceptable) | |||
| Physical Plausibility | PoseBusters (PB-valid) Rate [71] | Percentage of poses passing all stereochemical, bonding, and energy checks. | Higher percentage is better. |
| Scoring Power | Pearson Correlation (R) [72] | Linear correlation between docking scores and experimental binding affinities. | R > 0.7 (Strong) |
| Virtual Screening Power | logAUC [72] | Area Under the Curve for the fraction of true binders found in the top ranks on a log-scaled fraction of the screened library. | Closer to 1.0 is better. |
| Enrichment Factor (EF) | Concentration of true binders in top-ranked subset vs. random. | EF > 10 is good. |
Table 2: Advanced Interface Comparison Metrics for Protein-Protein Docking
| Metric | Formula | Interpretation |
|---|---|---|
| Interface TM-score (iTM-score) [73] | (\frac{1}{L{max}}\sum{i=1}^{Na}\frac{1}{1+(di/d_0)^2}) | Measures geometric similarity of interfaces. Closer to 1.0 is better. |
| Interface Similarity Score (IS-score) [73] | (\frac{S + s0}{1 + s0}, \quad S=\frac{1}{L{max}}\sum{i=1}^{Na}\frac{fi}{1+(di/d0)^2}) | Measures geometric and side-chain contact similarity. > 0.4 indicates significant match. |
The Scientist's Toolkit
Table 3: Essential Research Reagents and Computational Tools
| Tool/Reagent | Type | Function in Benchmarking | Example/Reference |
|---|---|---|---|
| STAT SH2 Domain Structures | Protein Structure | Provides the target for docking. Essential for understanding pocket architecture. | PDB IDs: (e.g., STAT1, STAT3) [12] |
| Known SH2 Inhibitors | Small Molecules | Serve as positive controls for docking and enrichment studies. | Stattic, Fludarabine [12] |
| Directory of Useful Decoys (DUD) | Database | Provides physically matched but topologically distinct decoy molecules to prevent scoring bias [69]. | https://blaster.docking.org/dud/ |
| AutoDock Vina/Smina | Software | Widely used, open-source molecular docking engine. | [70] [67] |
| PoseBusters | Validation Toolkit | Evaluates chemical and physical plausibility of docking poses beyond just RMSD [71]. | https://posebusters.readthedocs.io/ |
| Molecular Operating Environment (MOE) | Software Platform | Commercial software with multiple empirical and force-field based scoring functions for comparison [70]. | London dG, Alpha HB, Affinity dG |
| Large-Scale Docking (LSD) Database | Benchmarking Data | Community resource with docking scores and experimental results for billions of molecules to train and test ML models [72]. | https://lsd.docking.org/ |
Robust benchmarking is indispensable for developing reliable docking protocols aimed at discovering specific STAT SH2 domain inhibitors. By integrating rigorous geometric checks with physical plausibility tests and enrichment analyses, researchers can critically evaluate and improve their computational strategies. The framework outlined here, which emphasizes the challenges of pocket conservation and cross-reactivity, provides a solid foundation for advancing the development of therapeutic agents targeting STAT signaling pathways.
The signal transducer and activator of transcription 3 (STAT3) is a transcription factor that plays a pivotal role in tumor initiation, progression, and maintenance, making it a compelling therapeutic target for cancer treatment [74] [32]. Conventional STAT3 activation is initiated by cytokine or growth-factor interactions with extracellular receptors, stimulating Src Homology 2 (SH2) domain-mediated recruitment and phosphorylation at tyrosine 705 (Y705) [74] [10]. The phosphorylated STAT3 (pSTAT3) monomers then form transcriptionally active homodimers via reciprocal phosphotyrosine-SH2 domain interactions, which translocate to the nucleus to regulate target genes [74] [75]. As the function of STAT3 relies significantly on its SH2 domain for dimerization, this domain has become a dominant therapeutic target for small molecule modulator discovery [74] [10]. This application note details the integrated use of Fluorescence Polarization (FP) and Co-Immunoprecipitation (Co-IP) to validate the binding and functional inhibition of novel small-molecule compounds targeting the STAT3 SH2 domain, providing critical experimental correlates for molecular docking predictions focused on the pY and pY+3 pockets.
The following tables summarize key quantitative data from validation experiments for representative STAT3 SH2 domain inhibitors, demonstrating the correlation between FP binding affinity and functional biological activity.
Table 1: Binding Affinity and Functional Activity of STAT3 SH2 Domain Inhibitors
| Compound | FP IC₅₀ (µM) | Co-IP Dimerization Inhibition | Cellular IC₅₀ (µM) | STAT3 Y705 Phosphorylation Inhibition | Citation |
|---|---|---|---|---|---|
| 323-1 (Delavatine A) | Not Reported | More potent than S3I-201 | ~5.0 - 10.0 (LNCaP) | Yes (IL-6 stimulated) | [74] |
| 323-2 (Chiral Isomer) | Not Reported | More potent than S3I-201 | ~5.0 - 10.0 (LNCaP) | Yes (IL-6 stimulated) | [74] |
| A11 (BBI608 derivative) | 5.18 ± NA | Not Reported | 0.67 ± 0.02 (MDA-MB-231) | Yes | [32] |
| S3I-201 (Commercial) | Not Reported | Benchmark for Co-IP | >100 (LNCaP) | Weak | [74] |
Table 2: Downstream Effects of Validated STAT3 Inhibitors on Target Genes and Cell Fate
| Compound | MCL1 Expression | Cyclin D1 Expression | C-Myc Expression | Apoptosis Induction | Citation |
|---|---|---|---|---|---|
| 323-1 / 323-2 | Downregulated | Downregulated | Not Reported | Not Reported | [74] |
| A11 | Not Reported | Downregulated | Downregulated | Yes (concentration-dependent) | [32] |
| S3I-201 | Not Reported | Not Reported | Not Reported | Not Reported | [74] |
Experimental Protocols
Fluorescence Polarization (FP) Binding Assay
The FP assay is a homogeneous, solution-based technique that measures the change in the rotational mobility of a small, fluorophore-labelled peptide upon binding to a larger protein domain. A decrease in FP signal upon addition of a test compound indicates competitive displacement of the peptide, confirming direct binding to the SH2 domain [75] [76].
Detailed Protocol:
Reagent Preparation:
- Protein: Purify the recombinant human STAT3 SH2 domain (e.g., amino acids 127-722) or a truncated STAT3 protein containing the SH2 domain. Dialyze into FP assay buffer (e.g., 10 mM Tris/HCl, 50 mM NaCl, 1 mM EDTA, 0.1% NP-40 substitute, 1 mM DTT, pH 8.0) and snap-freeze in aliquots [75] [32].
- Tracer Peptide: Synthesize a phosphotyrosine-containing peptide based on the canonical STAT3 binding sequence (e.g., GpYLPQTV). Label the N-terminus with a fluorophore such as 5-carboxyfluorescein (CF). Purify the peptide to >90% homogeneity and confirm its identity via mass spectrometry [74] [75].
- Buffer: Prepare FP assay buffer with 2% DMSO to maintain compound solubility [75].
Assay Establishment and Optimization:
- Determine Kd: Conduct a saturation binding experiment. In a black 384-well plate, incubate a fixed, low concentration of the tracer peptide (e.g., 10 nM) with a serial dilution of the STAT3 SH2 domain protein. Plot the FP (mP) values against the protein concentration to determine the apparent dissociation constant (Kd) [77] [76].
- Optimize Concentrations: For the competitive binding assay, use a tracer concentration below its Kd (e.g., 10 nM) and a protein concentration near its Kd or EC80 to maximize the assay window (difference between bound and free tracer mP) [77]. The Z'-factor for such assays is typically >0.5, indicating a robust HTS-ready assay [75].
Competitive Binding Experiment:
- In a 384-well plate, pre-incubate the STAT3 SH2 domain protein (e.g., 33-50 nM) with a serial dilution of the test compound (e.g., 0.1 nM to 100 µM) in FP assay buffer for 60 minutes at room temperature [75] [32].
- Add the CF-labelled tracer peptide (e.g., 10 nM) to each well and incubate for an additional 60 minutes in the dark.
- Measure fluorescence polarization (mP values) using a plate reader (e.g., Tecan Infinite F500) with appropriate filters (excitation: 485 nm, emission: 535 nm).
Data Analysis:
- Normalize the mP values:
(mP_sample - mP_free) / (mP_bound - mP_free) * 100, where mPfree is the mP of the tracer alone, and mPbound is the mP of the tracer with protein but no inhibitor. - Plot normalized mP versus the logarithm of the inhibitor concentration and fit the data to a four-parameter logistic model to determine the IC₅₀ value.
- Convert the IC₅₀ to the inhibition constant (Ki) using the Cheng-Prusoff equation:
Ki = IC₅₀ / (1 + [Tracer] / Kd_Tracer)[75] [76].
- Normalize the mP values:
Diagram 1: Fluorescence Polarization (FP) Assay Workflow for STAT3 SH2 Domain Binding Validation.
Co-Immunoprecipitation (Co-IP) Dimerization Assay
Co-IP is a cell-based method used to probe protein-protein interactions and is the gold standard for validating the functional consequence of SH2 domain inhibitors: the disruption of STAT3 dimerization [74].
Detailed Protocol:
Cell Culture and Treatment:
- Culture STAT3-dependent cell lines (e.g., LNCaP, DU145) in appropriate media [74].
- Seed cells in 6-well or 10 cm dishes and allow them to adhere overnight.
- Pre-treat cells with the test compound for a predetermined time (e.g., 2-4 hours).
- Stimulate cells with IL-6 (e.g., 20 ng/mL) for 30 minutes to activate STAT3 phosphorylation and dimerization [74]. Include a control group stimulated with IL-6 but treated with compound vehicle (e.g., DMSO).
Cell Lysis:
- Place the culture dishes on ice and rinse cells with cold phosphate-buffered saline (PBS).
- Lyse cells using a non-denaturing, cold lysis buffer (e.g., M-PER buffer supplemented with protease and phosphatase inhibitors) for 10-15 minutes on ice [74].
- Scrape the cells and transfer the lysate to a microcentrifuge tube. Clarify the lysate by centrifugation at 14,000 x g for 15 minutes at 4°C. Collect the supernatant.
Immunoprecipitation:
- Determine the protein concentration of the supernatant.
- Pre-clear the lysate by incubating with Protein A/G agarose beads for 30-60 minutes at 4°C. Centrifuge to remove the beads.
- Incubate the pre-cleared lysate with an anti-STAT3 antibody (e.g., 1-2 µg) overnight at 4°C with gentle rotation.
- Add Protein A/G agarose beads and incubate for an additional 2-4 hours to capture the antibody-protein complex.
- Pellet the beads by gentle centrifugation and wash thoroughly 3-4 times with ice-cold lysis buffer to remove non-specifically bound proteins.
Elution and Immunoblotting:
- Elute the bound proteins from the beads by boiling in 2X Laemmli sample buffer for 5-10 minutes.
- Separate the eluted proteins by SDS-PAGE and transfer to a PVDF membrane.
- Probe the membrane with an anti-pSTAT3 (Y705) antibody to detect the phosphorylated STAT3 dimer. Subsequently, re-probe the membrane with an anti-STAT3 antibody to confirm equal loading of total STAT3.
- Visualize the bands using a chemiluminescence detection system. A reduction in the pSTAT3 band intensity in the compound-treated group, without a change in total STAT3, indicates successful inhibition of STAT3 dimerization [74].
Diagram 2: Co-Immunoprecipitation (Co-IP) Workflow for Assessing STAT3 Dimerization Inhibition.
The Scientist's Toolkit: Research Reagent Solutions
Table 3: Essential Reagents for STAT3 SH2 Domain Binding and Inhibition Studies
| Reagent / Solution | Function / Application | Example Specifications / Notes |
|---|---|---|
| Recombinant STAT3 SH2 Domain Protein | Direct binding studies (FP, SPR, DARTS); required for biochemical assays. | Purified fragment (e.g., aa 127-722) with C-terminal His-tag for affinity purification [74] [75]. |
| Fluorophore-labelled Phosphopeptide | Tracer molecule for FP assays to monitor competitive binding to the SH2 domain. | N-terminal CF-labeled, e.g., 5-CF-GpYLPQTV; >90% purity; confirm identity by MS [74] [75]. |
| STAT3-Dependent Cell Lines | Cellular models for Co-IP, viability, and mechanism-of-action studies. | LNCaP (prostate), DU145 (prostate), MDA-MB-231 (breast) [74] [32]. |
| Phospho-STAT3 (Y705) Antibody | Critical for detecting activated STAT3 in Co-IP and Western Blot experiments. | Validate for immunoprecipitation and/or Western Blot applications [74]. |
| Non-Denaturing Lysis Buffer | Extract native proteins while preserving protein-protein interactions for Co-IP. | Commercially available M-PER buffer, supplemented with fresh protease/phosphatase inhibitors [74]. |
| Protein A/G Agarose Beads | Solid support for immobilizing and capturing antibody-protein complexes in Co-IP. | Ensure compatibility with the host species of the immunoprecipitating antibody. |
Correlating Molecular Docking with Experimental Validation
Molecular docking predicts the binding pose and affinity of small molecules within the STAT3 SH2 domain, often targeting the pY705 binding pocket and the adjacent pY+3 hydrophobic pocket [74] [32]. The experimental protocols described herein provide the essential functional validation for these computational predictions. For instance, docking of compound A11 into the STAT3 SH2 domain (PDB: 1BG1) predicted key interactions, such as a hydrogen bond with Arg609 in the pY pocket; this binding mode was subsequently confirmed via FP assay, which demonstrated direct competition with the native phosphopeptide [32]. Similarly, the 323 compounds (delavatine A stereoisomers) were computationally docked to three subpockets of the SH2 domain. The Co-IP assay confirmed the functional outcome of this binding—potent inhibition of STAT3 dimerization—which was more effective than the commercial inhibitor S3I-201 [74]. This synergistic use of FP (for direct binding confirmation) and Co-IP (for functional disruption of dimerization) creates a robust framework for translating in silico hits into biologically active lead compounds, ultimately advancing STAT3-targeted cancer therapeutics.
The Signal Transducer and Activator of Transcription 3 (STAT3) is a cytoplasmic transcription factor that is constitutively activated in numerous human cancers, driving tumorigenesis through the regulation of genes controlling cell proliferation, survival, and angiogenesis [78]. The critical role of its Src Homology 2 (SH2) domain in mediating STAT3 activation makes it a prime target for therapeutic intervention [74]. This domain facilitates the reciprocal phosphotyrosine–SH2 interaction between two STAT3 monomers, leading to their dimerization, nuclear translocation, and subsequent DNA binding [11] [2]. Inhibiting this key protein-protein interaction offers a compelling strategy to disrupt oncogenic STAT3 signaling. This application note analyzes two successful case studies of small-molecule STAT3 SH2 domain inhibitors—Delavatine A and S3I-201—framed within the context of molecular docking research targeting the pY and pY+3 pockets. We provide detailed protocols for key experiments validating their mechanism of action.
Table 1: Key Characteristics of Featured STAT3 SH2 Inhibitors
| Inhibitor | Chemical Class | Primary Molecular Target | Reported IC₅₀ / Kᵢ | Cellular Models |
|---|---|---|---|---|
| Delavatine A (323-1/323-2) | Natural product (cyclopenta[de]isoquinoline) | STAT3 SH2 domain [74] | Inhibition of STAT3 dimerization more potent than S3I-201 [74] | Prostate cancer (LNCaP, 22Rv1, DU145) [74] |
| S3I-201 | Salicylic acid-based | STAT3 SH2 domain [78] | IC₅₀ = 86 μM (FP Assay) [78] | Breast cancer, hepatocellular carcinoma [78] |
| S3I-201.1066 | Optimized sulphoneamide analog | STAT3 SH2 domain (Kᴅ = 2.74 nM) [22] | IC₅₀ = 23 μM (Disruption of pTyr-peptide binding) [22] | Breast cancer (MDA-MB-231), pancreatic cancer (Panc-1) [22] |
| Stattic | Small-molecule inhibitor | STAT3 SH2 domain [78] | IC₅₀ = 5.1 μM (FP Assay) [78] | Breast cancer, hepatic cancer [78] |
STAT3 Signaling Pathway and Inhibitor Mechanism
The canonical activation of STAT3 begins with extracellular cytokines or growth factors binding to their receptors, initiating intracellular phosphorylation events. The STAT3 SH2 domain is indispensable for the subsequent activation cascade, as illustrated below.
Case Study I: Delavatine A Stereoisomers
Compound Origin and Docking Analysis
The delavatine A stereoisomers, compound 323-1 ((15R,2R)-delavatine A) and 323-2 ((15S,2R)-delavatine A), were identified from the medicinal plant Incarvillea delavayi and subsequently synthesized [74]. In silico computational docking predicted that these compounds bind to three subpockets of the STAT3 SH2 domain, forming critical interactions within the binding cavity [74]. This binding mode directly competes with the native phosphotyrosine peptide, preventing the STAT3 dimerization necessary for its transcriptional activity.
Key Experimental Validation and Protocols
Table 2: Key Experimental Findings for Delavatine A
| Assay Type | Key Finding | Biological Significance |
|---|---|---|
| Co-immunoprecipitation | Disrupted STAT3 dimerization more potently than S3I-201 [74] | Direct evidence of target engagement and functional inhibition. |
| Fluorescence Polarization (FP) | Competitively abrogated STAT3 interaction with GpYLPQTV peptide [74] | Confirmed direct binding to the SH2 domain and quantified disruption. |
| Western Blot | Reduced IL-6-stimulated STAT3 phosphorylation (Tyr705) [74] | Demonstrated inhibition of pathway activation in a cellular context. |
| Luciferase Reporter Assay | Inhibited STAT3 transcriptional activity [74] | Confirmed functional consequence at the level of gene regulation. |
| qPCR / Western Blot | Downregulated MCL1 and cyclin D1 [74] | Suppressed expression of key STAT3 target genes controlling survival/proliferation. |
Protocol: Fluorescence Polarization (FP) Competitive Binding Assay
This protocol is used to confirm and quantify the direct disruption of STAT3-SH2 domain interaction with its phosphotyrosine peptide [74].
Reagent Preparation:
- Purify the STAT3 SH2 domain protein.
- Prepare a fluorescently-labeled phosphopeptide based on the gp130-derived sequence (e.g., FITC-GpYLPQTV).
- Prepare serial dilutions of the test inhibitor (e.g., 323-1, 323-2) in a suitable buffer (e.g., PBS with 0.01% Tween-20).
Assay Procedure:
- In a 96-well plate, mix a fixed concentration of the fluorescent peptide (e.g., 10 nM) with the purified SH2 domain protein at its approximate Kd concentration, determined via prior titration.
- Add increasing concentrations of the test inhibitor to the wells. Include control wells with no inhibitor (maximal polarization) and a well with a large excess of unlabeled peptide (minimal polarization).
- Incubate the reaction mixture for 1-2 hours at room temperature in the dark.
Data Acquisition and Analysis:
- Measure fluorescence polarization (mP units) using a plate reader.
- Plot the mP values against the logarithm of the inhibitor concentration.
- Fit the data to a sigmoidal dose-response curve to calculate the IC₅₀ value, which represents the concentration of inhibitor that displaces 50% of the fluorescent peptide.
Protocol: Co-immunoprecipitation for STAT3 Dimerization
This protocol assesses the inhibitor's ability to disrupt STAT3-STAT3 dimer formation in a cellular context [74].
Cell Treatment and Lysis:
- Culture relevant cancer cell lines (e.g., LNCaP, DU145). Treat with inhibitor or vehicle control (DMSO) for a predetermined time (e.g., 6-12 hours). Optionally, stimulate with IL-6 (e.g., 20 ng/ml) for 15-30 minutes prior to lysis to enhance STAT3 activation.
- Lyse cells using a mild, non-denaturing lysis buffer (e.g., RIPA buffer) supplemented with protease and phosphatase inhibitors.
Immunoprecipitation:
- Pre-clear the cell lysates with Protein A/G beads for 30 minutes at 4°C.
- Incubate the pre-cleared lysate with an anti-STAT3 antibody overnight at 4°C with gentle rotation.
- Add Protein A/G beads and incubate for an additional 2-4 hours to capture the antibody-protein complex.
Detection:
- Wash the beads thoroughly with lysis buffer to remove non-specifically bound proteins.
- Elute the bound proteins by boiling in SDS-PAGE loading buffer.
- Analyze the eluates by Western blotting, using an anti-STAT3 antibody for detection. The presence of STAT3 in the immunoprecipitate indicates dimer formation, which should decrease upon successful inhibitor treatment.
Case Study II: The S3I-201 Series
Lead Identification and Optimization
S3I-201 was identified through structure-based virtual screening of the NCI chemical libraries [78]. Its salicylic acid moiety was found to dock into the pTyr-binding site (pY pocket) of the STAT3 SH2 domain [78]. Rational optimization of S3I-201 led to the development of more potent analogs, including SF-1066 and the well-characterized S3I-201.1066, which exhibits a significantly higher affinity for STAT3 (Kᴅ = 2.74 nM) [22].
Key Experimental Validation and Protocols
Protocol: Electrophoretic Mobility Shift Assay (EMSA)
EMSA is used to evaluate the inhibitor's effect on the DNA-binding capability of activated STAT3 dimers [22].
Preparation of Components:
- Nuclear Extracts: Prepare nuclear extracts from untreated or cytokine-stimulated cancer cells (e.g., MDA-MB-231) using a standard kit.
- Probe: Design a double-stranded DNA oligonucleotide containing a STAT3 consensus binding site (e.g., the high-affinity sis-inducible element (hSIE), 5'-AGCTTCATTTCCCGTAAATCCCTA-3'). Label it with [γ-³²P]ATP.
Binding Reaction:
- Pre-incubate nuclear extracts with the test inhibitor for 30 minutes at room temperature.
- Add the radiolabeled probe to the mixture and incubate for another 30 minutes at 30°C.
Electrophoresis and Detection:
- Resolve the protein-DNA complexes on a native polyacrylamide gel.
- Dry the gel and visualize the shifted protein-DNA complex bands using autoradiography or a phosphorimager. A reduction in band intensity in inhibitor-treated samples indicates successful disruption of STAT3's DNA-binding activity.
Protocol: In Vivo Tumor Xenograft Efficacy Study
This protocol assesses the antitumor efficacy of inhibitors in a live animal model [22].
Tumor Implantation:
- Subcutaneously inject human cancer cells harboring constitutive STAT3 activity (e.g., MDA-MB-231 breast cancer cells) into the flanks of immunodeficient mice.
Dosing and Monitoring:
- Once tumors reach a palpable size (e.g., ~100 mm³), randomize mice into treatment and control groups.
- Administer the inhibitor (e.g., S3I-201.1066) via a predetermined route (e.g., intraperitoneal injection) at a selected dose and schedule (e.g., 5 mg/kg daily). The control group receives vehicle alone.
- Monitor tumor volume and body weight regularly throughout the study period.
Terminal Analysis:
- At the end of the experiment, harvest tumors and weigh them.
- Process tumor tissues for Western blot analysis to confirm downregulation of pY705-STAT3 and its downstream targets (e.g., Bcl-xL, Survivin, c-Myc). Statistical comparison of tumor volumes and weights between groups demonstrates in vivo efficacy.
The Scientist's Toolkit: Research Reagent Solutions
Table 3: Essential Research Reagents for STAT3 SH2 Inhibition Studies
| Reagent / Assay Kit | Function & Application | Example Use-Case |
|---|---|---|
| Recombinant STAT3 SH2 Domain Protein | Target protein for in vitro binding assays (FP, DARTS, SPR). | Purified protein for Fluorescence Polarization assays [74]. |
| Phosphotyrosine Peptides (e.g., GpYLPQTV) | SH2 domain binding probes; can be unlabeled or fluorescently tagged. | Competitive binding in FP assays [74] [22]. |
| Drug Affinity Responsive Target Stability (DARTS) Kit | Identifies direct target engagement by measuring ligand-induced protease resistance. | Validated direct binding of Delavatine A to STAT3 [74]. |
| Cignal STAT3 Reporter (Luciferase) Kit | Measures STAT3-dependent transcriptional activity in live cells. | Demonstrated inhibition of STAT3-driven transcription by Delavatine A [74]. |
| pY705-STAT3 & Total STAT3 Antibodies | Key reagents for Western blot, immunofluorescence, and co-IP to monitor activation and expression. | Detected reduced STAT3 phosphorylation in inhibitor-treated cells and tumors [74] [22]. |
| STAT3 Consensus Binding Site Oligos | For EMSA to study the disruption of STAT3-DNA binding. | Showed inhibition of STAT3 DNA-binding activity by S3I-201.1066 [22]. |
The successful application of structure-based virtual screening, rational design, and rigorous biochemical and cellular validation in the development of Delavatine A and the S3I-201 series provides a robust roadmap for discovering STAT3 SH2 inhibitors. The detailed protocols outlined herein for key experiments—from in vitro binding (FP) to in vivo efficacy models—serve as a valuable resource for researchers aiming to design and characterize novel inhibitors targeting the critical pY and pY+3 pockets of the STAT3 SH2 domain.
The Src Homology 2 (SH2) domain is a protein interaction module found in over 100 human proteins, including all members of the Signal Transducer and Activator of Transcription (STAT) family. These domains specifically recognize and bind to phosphorylated tyrosine (pY) motifs, playing a crucial role in cellular signaling networks. A significant challenge in targeting the STAT3 SH2 domain for therapeutic intervention lies in achieving high selectivity over other STAT family members and structurally similar SH2 domains. The high degree of structural conservation among SH2 domains, particularly within the pY-binding pocket, makes the development of selective inhibitors exceptionally difficult. This application note details integrated computational and experimental strategies to design assays that effectively minimize off-target effects when developing compounds targeting STAT SH2 domains, with particular emphasis on the pY and pY+3 binding pockets.
Structural Basis of SH2 Domain Specificity
Conserved Architecture and Selectivity Determinants
All SH2 domains share a highly conserved fold consisting of a three-stranded antiparallel beta-sheet flanked by two alpha helices, forming an αβββα structure [4] [2]. Despite this conserved core architecture, key structural variations enable targeted drug design:
- pY-Binding Pocket: A deep pocket containing an invariant arginine residue (βB5) within the FLVR motif that forms a salt bridge with the phosphotyrosine moiety [2]. This region exhibits high conservation across SH2 domains.
- Specificity Pockets: Adjacent pockets that bind residues C-terminal to the phosphotyrosine (designated pY+1, pY+2, pY+3, etc.) show greater structural diversity and provide opportunities for achieving selectivity [4] [2].
- Domain Subgroups: STAT-type SH2 domains lack the βE and βF strands found in SRC-type domains and feature a split αB helix, reflecting adaptations for STAT dimerization [2].
Table 1: Key Structural Features of STAT-Type SH2 Domains
| Structural Element | Characteristics | Role in Specificity |
|---|---|---|
| pY+0 Pocket | Binds pY705; contains conserved Arg609, Ser611, Ser613 | High conservation limits selectivity; essential for binding affinity |
| pY+1 Pocket | Binds L706; hydrophobic character | Moderate selectivity potential |
| pY+3 Pocket | Variable loops (BG, EF loops) control access | High selectivity potential due to sequence/structure variation |
| BG Loop | Joins α-helix B and β-strand G | Determines accessibility to specificity pockets |
| EF Loop | Joins β-strands E and F | Structural diversity enables selective compound design |
STAT3 SH2 Domain Binding Characteristics
The STAT3 SH2 domain facilitates STAT3 dimerization through reciprocal interactions where the phosphotyrosine (pY705) of one STAT3 monomer binds to the SH2 domain of another monomer [4]. Key residues involved in this interaction include Arg609, Glu594, Lys591, Ser636, Ser611, Val637, Tyr657, Gln644, Thr640, Glu638, and Trp623 [4]. These residues participate in direct or indirect binding with the phosphopeptide motif and represent critical anchor points for inhibitor design.
Computational Approaches for Specificity Screening
Molecular Docking and Virtual Screening
Structure-based virtual screening employs molecular docking to prioritize compounds with high predicted affinity and selectivity for the target SH2 domain before experimental testing.
Protocol: Tiered Docking Screen for STAT3 Specificity
- Protein Preparation: Retrieve STAT3 crystal structure (e.g., PDB: 6NJS). Prepare using Protein Preparation Wizard (Schrödinger) to add hydrogens, fill missing side chains, and minimize energy using the OPLS3e force field [4].
- Grid Generation: Generate a receptor grid centered on the SH2 domain binding site using coordinates from the co-crystallized ligand (e.g., X:13.22, Y:56.39, Z:0.27) with a box size of 20Å [4].
- Compound Library Preparation: Retrieve natural compounds from databases like ZINC15 (182,455 compounds in exemplified study). Prepare ligands using LigPrep to generate 3D structures with optimized ionization states at pH 7.4±0.5 [4].
- High-Throughput Virtual Screening (HTVS): Perform initial rapid screening of entire library to eliminate poor binders [4].
- Standard Precision (SP) Docking: Subject top compounds from HTVS (~30% of library) to more rigorous SP docking [4].
- Extra Precision (XP) Docking: Apply the most accurate XP docking to top-scoring SP compounds (e.g., cutoff at -6.5 kcal/mol) to select candidates with optimal binding poses and interactions [4].
- Cross-Screening Against Off-Target SH2 Domains: Dock top hits against SH2 domains of other STAT family members (STAT1, STAT5) and non-STAT SH2 domains (e.g., SRC, ABL) to predict selectivity. Prioritize compounds showing preferential binding to STAT3.
The following workflow illustrates this multi-stage screening process:
Binding Free Energy Calculations
After docking, apply more computationally intensive methods to refine predictions:
Protocol: MM-GBSA Binding Free Energy Calculation
- Use the Prime MM-GBSA module (Schrödinger) to calculate binding free energies for protein-ligand complexes [4].
- Employ the OPLS3e force field and VSGB solvation model.
- Calculate binding free energy using the equation: ΔGBinding = ΔGComplex - (ΔGReceptor + ΔGLigand)
- Compare ΔGBinding values across different STAT family SH2 domains to quantify predicted selectivity [4].
Specificity Assessment Using Molecular Dynamics
Protocol: Molecular Dynamics Simulation for Specificity Profiling
- Solvate the protein-ligand complex in an explicit solvent model using Desmond or similar software [4].
- Equilibrate the system using a standard relaxation protocol.
- Run production simulations for at least 100 ns while tracking:
- Root mean square deviation (RMSD) of protein and ligand
- Root mean square fluctuation (RMSF) of binding site residues
- Protein-ligand hydrogen bonding patterns
- Ligand interaction frequencies with key residues [4]
- Perform similar simulations with other STAT family SH2 domains and compare interaction stability.
Table 2: Computational Methods for Specificity Assessment
| Method | Application | Role in Specificity Assessment |
|---|---|---|
| XP Molecular Docking | Pose prediction and scoring | Identifies compounds with optimal interactions with unique STAT3 residues |
| MM-GBSA | Binding free energy calculation | Quantifies theoretical binding affinity differences between SH2 domains |
| Molecular Dynamics | Simulation of binding stability | Assesses persistence of interactions in unique subpockets over time |
| WaterMap Analysis | Location and energetics of water molecules | Identifies displacement of unfavorable waters in STAT3 specificity pockets |
| Density Functional Theory (DFT) | Electronic structure calculation | Determines frontier orbitals (HOMO-LUMO) for reactivity prediction |
Experimental Validation of Specificity
Binding Assays for Selectivity Profiling
Protocol: Fluorescence Polarization (FP) Competitive Binding Assay
- Labeled Probe Preparation: Use a fluorescein-labeled phosphopeptide corresponding to the STAT3 recruitment sequence (e.g., GpYLPQTV) [11].
- Protein Incubation: Incubate purified SH2 domains from various STAT proteins (STAT1, STAT3, STAT5) with the fluorescent probe.
- Competition Measurement: Add increasing concentrations of test compound and monitor decrease in fluorescence polarization as compound displaces the probe.
- Data Analysis: Calculate IC50 values for each STAT SH2 domain and determine selectivity ratios (e.g., STAT1 IC50/STAT3 IC50) [11].
- Validation: Confirm true competitive inhibition by analyzing the binding mode.
Recent studies have successfully employed parallel assays for STAT family SH2 domains to measure binding affinity (KD) and selectivity of small molecules, providing direct thermodynamic profiling across multiple targets [79].
Cellular Target Engagement and Functional Assays
Protocol: Co-Immunoprecipitation for Dimerization Inhibition
- Cell Treatment: Treat cells (e.g., LNCaP prostate cancer cells) with test compounds for optimal duration [11].
- Cell Lysis: Lyse cells using non-denaturing lysis buffer supplemented with phosphatase and protease inhibitors.
- Immunoprecipitation: Incubate lysates with STAT3 antibody and protein A/G beads overnight at 4°C.
- Western Blot Analysis: Detect co-precipitated STAT3 using anti-STAT3 antibody to assess dimer disruption.
- Selectivity Assessment: Compare effects on STAT1 and STAT5 dimerization in parallel assays [11].
Protocol: Phosphorylation Inhibition Profiling
- Cell Stimulation: Stimulate different cell lines with appropriate cytokines:
- Compound Treatment: Pre-treat cells with test compounds before cytokine stimulation.
- Western Blot Analysis: Detect phosphorylated and total STAT proteins using specific antibodies.
- Selectivity Calculation: Determine IC50 values for phosphorylation inhibition of each STAT protein and calculate selectivity indices.
The following diagram illustrates the key experimental methods for assessing compound selectivity:
The Scientist's Toolkit: Research Reagent Solutions
Table 3: Essential Reagents for STAT Specificity Screening
| Reagent / Assay | Specific Function | Application in Specificity Testing |
|---|---|---|
| Recombinant SH2 Domains (STAT1, STAT3, STAT5) | Direct binding studies | FP assays to measure binding affinity and selectivity ratios |
| Cellular Models with specific STAT activation | Cellular pathway engagement | Phosphorylation inhibition profiling across STAT family |
| STAT-Selective Reporter Cell Lines | Transcriptional activity measurement | Assessment of functional selectivity in live cells |
| pY-Selective Probes (e.g., GpYLPQTV) | Competitive binding measurements | Displacement assays to determine binding mode and affinity |
| Phospho-Specific Antibodies (pSTAT1, pSTAT3, pSTAT5) | Detection of activated STATs | Western blot analysis of pathway inhibition selectivity |
| PROTAC Derivatives (e.g., from SD-36) | Targeted protein degradation | Validation of target engagement specificity through degradation |
Case Studies and Applications
Successful Examples of Selective Inhibitors
- SD-36: A PROTAC degrader that demonstrates high selectivity for STAT3 over other STAT family members. SD-36 potently induces degradation of STAT3 protein while sparing STAT1 and STAT5, achieving complete tumor regression in xenograft models at well-tolerated doses [80].
- Compounds 323-1 and 323-2: Natural product-derived STAT3 inhibitors that show superior selectivity compared to commercial inhibitor S3I-201. These compounds more potently inhibit STAT3 dimerization than STAT1, as validated through FP assays and computational docking [11].
- WR-S-462: A optimized STAT3 inhibitor with high binding affinity (Kd = 58 nM) to the STAT3 SH2 domain that effectively suppresses triple-negative breast cancer growth and metastasis with minimal off-target effects [81].
Emerging Technologies for Enhanced Specificity
Recent advances in screening methodologies offer new approaches for achieving STAT specificity:
- Parallel SH2 Domain Panels: Novel assay platforms enable simultaneous screening of compound libraries against multiple STAT family SH2 domains, allowing direct comparison of binding affinities and early identification of selective hits [79].
- Network Pharmacology: Mapping compound interactions within biological networks highlights multi-target potential and helps minimize off-target effects by elucidating relationships between compounds and multiple targets [4].
- PROTAC Technology: Heterobifunctional degraders like SD-36 can achieve enhanced selectivity through cooperative binding requirements, where both the SH2 domain binder and E3 ligase recruiter contribute to specificity [79] [80].
Achieving STAT specificity when targeting SH2 domains requires a multifaceted approach that integrates computational prediction with experimental validation. The strategies outlined in this application note—combining tiered virtual screening, free energy calculations, direct binding assays, and cellular functional assessments—provide a comprehensive framework for identifying compounds with minimal off-target effects on other SH2 domain-containing proteins. As structural understanding of SH2 domain diversity improves and screening technologies advance, the rational design of highly selective STAT inhibitors continues to become more feasible, offering promising avenues for targeted cancer therapies with improved safety profiles.
The paradigm of drug discovery is shifting from the traditional "one gene, one target, one disease" model toward a network-based "multi-target, multi-effect" approach. This transition is particularly relevant for complex diseases like cancer, where transcription factors such as STAT3 (Signal Transducer and Activator of Transcription 3) drive pathogenesis through intricate signaling networks. The Src Homology 2 (SH2) domain of STAT3 facilitates its dimerization and nuclear translocation, representing a promising therapeutic target. This application note details protocols for integrating network pharmacology with machine learning to predict multi-target compounds against the STAT3 SH2 domain, providing researchers with a structured framework for accelerating lead identification in cancer drug discovery.
Network pharmacology (NP) establishes a system-level approach to drug discovery by modeling the complex interactions between drugs, targets, and diseases. This methodology effectively replaces the concept of "magic bullets" with "magic shotguns" – therapeutic agents that modulate multiple targets simultaneously [82]. When applied to molecular docking against the STAT3 SH2 domain, NP helps elucidate the multi-target mechanisms underlying the efficacy of potential inhibitors, such as natural compounds, by mapping their interactions within biological networks [21] [83].
Concurrently, machine learning (ML) and artificial intelligence (AI) are revolutionizing structural bioinformatics. Deep generative models like PocketGen enable efficient design and analysis of protein pockets, while AI-driven tools enhance the detection of functional binding sites and cryptic pockets [84] [85]. The integration of these computational approaches provides a powerful toolkit for predicting and validating compounds that target the critical pY and pY+3 pockets of the STAT3 SH2 domain, offering new avenues for therapeutic intervention in STAT3-driven cancers.
Application Notes: Integrated Workflow
The following integrated workflow leverages both network pharmacology and machine learning for comprehensive multi-target prediction. The diagram below illustrates the synergistic relationship between these methodologies.
Key Advantages of Integration
Systems-Level Understanding: Network pharmacology elucidates the complex relationships between compounds and multiple targets, helping to minimize off-target effects while maximizing therapeutic efficacy [21] [82]. For STAT3 inhibition, this means understanding not only direct SH2 domain binding but also downstream effects on associated pathways like JAK-STAT signaling.
Enhanced Pocket Characterization: Machine learning models, particularly deep generative approaches like PocketGen, can efficiently generate and analyze protein pockets with high fidelity, achieving amino acid recovery rates exceeding 63% and operating ten times faster than physics-based methods [84]. This enables rapid characterization of the STAT3 SH2 domain's pY and pY+3 sub-pockets.
Multi-Target Prediction Accuracy: Integration of ML with network pharmacology enables the identification of "master regulator" targets within disease networks. Studies demonstrate that network-based approaches can predict drug-activated targets with >40% accuracy through meta-analysis of disease gene networks [82].
Protocol 1: Network Pharmacology Construction for STAT3 Signaling
Objectives
- Construct a compound-target-pathway network for STAT3 SH2 domain inhibitors
- Identify key signaling pathways and potential off-target effects
- Prioritize multi-target compounds for experimental validation
Materials and Reagent Solutions
Table 1: Key Research Reagents for Network Pharmacology and Molecular Docking
| Category | Tool/Resource | Function | Access |
|---|---|---|---|
| Database | DrugBank | Curated drug & target information | https://go.drugbank.com |
| Database | TCMSP | Traditional Chinese Medicine systems pharmacology | http://tcmspw.com/tcmsp.php |
| Database | ZINC15 | Natural compound library for virtual screening | https://zinc15.docking.org |
| Software | Cytoscape | Network visualization and analysis | https://cytoscape.org |
| Software | STRING | Protein-protein interaction network | https://string-db.org |
| Software | SwissTargetPrediction | Compound target prediction | http://www.swisstargetprediction.ch |
Step-by-Step Procedure
Target Gene Collection
- Collect STAT3-associated target genes from GeneCards and DisGeNET databases using "STAT3," "SH2 domain," and "cancer" as keywords
- Include proteins directly interacting with STAT3 from STRING database with confidence score >0.9
Compound Target Identification
- Retrieve potential STAT3 SH2 domain inhibitors from ZINC15 database (filter for natural compounds, drug-like properties)
- Predict compound targets using SwissTargetPrediction and STITCH databases
- Apply Lipinski's Rule of Five and ADMET filters for compound prioritization
Network Construction and Analysis
- Import compound-target data into Cytoscape (version 3.7.1 or higher)
- Construct compound-target-disease network with:
- Nodes: compounds, proteins, pathways
- Edges: compound-target interactions, protein-protein interactions
- Calculate network topology parameters (degree, betweenness centrality)
- Identify hub nodes with high degree centrality as potential master regulators
Pathway Enrichment Analysis
- Perform KEGG pathway enrichment analysis using ShinyGo platform
- Focus on pathways including neuroactive ligand-receptor interaction, dopaminergic synapses, and serotonergic synapses [86]
- Identify significantly enriched pathways (p-value < 0.05, FDR < 0.1)
Protocol 2: Multi-Scale Molecular Docking to STAT3 SH2 Domain
Objectives
- Perform hierarchical virtual screening against STAT3 SH2 domain
- Evaluate binding free energies of top candidates
- Assess binding stability through molecular dynamics
Materials and Reagent Solutions
Table 2: Computational Tools for Molecular Docking and Dynamics
| Software Tool | Specific Function | Application Context |
|---|---|---|
| Schrödinger Suite | Protein Preparation Wizard, Glide | Molecular docking & visualization |
| AutoDock Vina | Protein-ligand docking | Binding affinity prediction |
| Desmond | Molecular dynamics simulation | Binding stability assessment |
| PyMOL | Molecular visualization | Structure analysis & figure generation |
| QikProp | ADMET prediction | Pharmacokinetic profiling |
Step-by-Step Procedure
Protein Structure Preparation
- Retrieve STAT3 crystal structure (PDB: 6NJS) from Protein Data Bank
- Preprocess protein using Protein Preparation Wizard (Schrödinger Suite)
- Add hydrogen atoms, assign bond orders, fill missing side chains using Prime
- Optimize hydrogen bonding network and minimize energy using OPLS3e force field
Grid Generation
- Define binding pocket around SH2 domain with coordinates: X=13.22, Y=56.39, Z=0.27
- Set grid box size to 20Å to encompass pY705 and L706 binding pockets
- Validate grid by redocking native ligand (RMSD < 2.0Å)
Hierarchical Virtual Screening
- Conduct High-Throughput Virtual Screening (HTVS) of ZINC15 natural compound library
- Advance top 10% compounds to Standard Precision (SP) docking
- Submit best SP compounds (cut-off: -6.5 kcal/mol) to Extra Precision (XP) docking
Binding Affinity Assessment
- Calculate binding free energies using MM-GBSA
- Perform WaterMap analysis to estimate hydrophobic enclosure
- Conduct molecular dynamics simulations (100ns) to assess complex stability
SH2 Domain Binding Pocket Analysis
The STAT3 SH2 domain contains critical sub-pockets that facilitate interactions with phosphorylated tyrosine residues. The diagram below illustrates this architecture.
Protocol 3: Machine Learning-Enhanced Pocket Analysis & Generation
Objectives
- Implement deep learning models for enhanced pocket detection
- Generate novel pocket designs with improved binding affinity
- Predict compound interactions using ML-based scoring functions
Materials and Reagent Solutions
Table 3: AI/ML Tools for Protein Pocket Analysis
| Tool | Type | Specific Application |
|---|---|---|
| PocketGen | Deep generative model | Protein pocket sequence/structure generation |
| Deep Q-Network (DQN) | Reinforcement learning | Cryptic pocket detection |
| RFdiffusion All-Atom | Diffusion model | De novo binding protein design |
| ProteinMPNN | Protein language model | Sequence design for generated structures |
Step-by-Step Procedure
Data Preparation and Feature Extraction
- Curate protein-ligand complexes from PDB with resolution <2.5Å
- Extract molecular features: spatial coordinates, SASA, hydrophobicity, electrostatic charge
- Apply variance threshold filtering and dimensionality reduction using autoencoders
Pocket Detection and Characterization
- Implement Deep Q-Network (DQN) agent to navigate protein surfaces
- Train model with reward signal optimized for pocket detection accuracy
- Identify functional binding sites incorporating geometric and biochemical features
Pocket Generation and Optimization
- Initialize PocketGen with target ligand and protein scaffold
- Generate residue sequence and atomic structure of pocket regions
- Use graph transformer for structural encoding and sequence refinement
- Validate generated pockets with scRMSD (<2.0Å) and scTM score
Binding Affinity Prediction
- Train ML models on curated protein-ligand complexes with known binding affinities
- Integrate structural features with chemical descriptors for improved prediction
- Validate models using cross-validation on benchmark datasets
Expected Results and Interpretation
Network Pharmacology Outcomes
Successful implementation of Protocol 1 should yield a compound-target network with approximately 300-500 nodes and 500-1000 edges, with an average node degree of 1.5-2.5 [86]. Hub nodes with high betweenness centrality represent potential master regulators of STAT3 signaling. KEGG pathway analysis typically identifies neuroactive ligand-receptor interactions, cancer pathways, and JAK-STAT signaling as significantly enriched.
Docking and Binding Validation
Table 4: Expected Results from Multi-Scale Docking and Dynamics
| Parameter | Expected Range | Interpretation |
|---|---|---|
| Docking Score (XP) | <-6.5 kcal/mol | High binding affinity |
| MM-GBSA ΔG | <-50 kcal/mol | Favorable binding energy |
| Molecular Dynamics RMSD | <2.0Å | Stable protein-ligand complex |
| Hydrogen Bonds | ≥3 | Specific binding interactions |
| Ligand Efficiency | >0.3 | Optimal binding per atom |
Exemplary compounds like ZINC67910988 demonstrate superior stability in molecular dynamics simulation and WaterMap analysis, making them promising candidates for further development [21] [87].
ML-Based Pocket Generation Metrics
PocketGen typically achieves an amino acid recovery rate exceeding 63% and success rates of 97% for generating pockets with higher binding affinity than reference pockets [84]. The model operates ten times faster than physics-based methods, enabling rapid iteration in pocket design.
Troubleshooting and Optimization
- Low Enrichment in Network Analysis: Expand target database sources and adjust interaction confidence thresholds (>0.7)
- Poor Docking Scores: Verify protein preparation steps, particularly hydrogen bonding network and protonation states
- Unstable Molecular Dynamics: Extend simulation time to 100-200ns and check solvent box size
- Low ML Model Accuracy: Increase training dataset size and incorporate additional features like electrostatic potential
The integration of network pharmacology and machine learning provides a powerful framework for multi-target prediction against the STAT3 SH2 domain. This approach enables researchers to navigate the complexity of signaling networks while leveraging advanced computational methods for precise molecular targeting. The protocols outlined herein offer a comprehensive roadmap for identifying and validating multi-target compounds, with the ultimate goal of developing more effective therapeutic strategies for STAT3-driven cancers. Future directions include incorporating multi-omics data and developing specialized ML models for SH2 domain-specific interactions.
Conclusion
Molecular docking against the STAT SH2 domain's pY and pY+3 pockets is a powerful, yet complex, component of modern drug discovery. A successful strategy requires a deep understanding of the domain's unique structure, rigorous application and optimization of computational methods, and, crucially, a clear pathway for experimental validation. The integration of advanced computational analyses like MM-GBSA and WaterMap with high-throughput experimental profiling is closing the gap between prediction and reality. Future efforts should focus on modeling full complex dynamics, exploiting non-canonical binding sites, and applying machine learning to multi-omics data, ultimately paving the way for the development of highly specific, clinically effective STAT inhibitors for oncology and immunology.
References
- 1. Update on Structure and Function of SH2 Domains [https://pmc.ncbi.nlm.nih.gov/articles/PMC12470777/]
- 2. Update on Structure and Function of SH2 Domains [https://www.mdpi.com/1422-0067/26/18/9060]
- 3. Defining the Specificity Space of the Human Src Homology ... [https://www.sciencedirect.com/science/article/pii/S1535947620312007]
- 4. Computational screening and molecular dynamics of natural ... [https://pmc.ncbi.nlm.nih.gov/articles/PMC12638358/]
- 5. SH2 Domain Binding: Diverse FLVRs of Partnership [https://www.frontiersin.org/journals/endocrinology/articles/10.3389/fendo.2020.575220/full]
- 6. Physical and functional interactions between SH2 and SH3 ... [https://pmc.ncbi.nlm.nih.gov/articles/PMC359163/]
- 7. Analysis of the Fyn SH2 domain structure - PubMed Central [https://pmc.ncbi.nlm.nih.gov/articles/PMC2585567/]
- 8. Mutational Analysis of the STAT6 SH2 Domain [https://www.sciencedirect.com/science/article/pii/S002192581880535X]
- 9. Novel STAT3 small-molecule inhibitors identified by ... [https://www.sciencedirect.com/science/article/abs/pii/S1043661821002218]
- 10. Structural Implications of STAT3 and STAT5 SH2 Domain ... [https://pmc.ncbi.nlm.nih.gov/articles/PMC6895964/]
- 11. Novel STAT3 Inhibitors Targeting STAT3 Dimerization by ... [https://www.frontiersin.org/journals/pharmacology/articles/10.3389/fphar.2022.836724/full]
- 12. In silico simulations of STAT1 and STAT3 inhibitors predict ... [https://www.sciencedirect.com/science/article/abs/pii/S0014299913008224]
- 13. Discovery of the novel Benzo[b]thiophene 1,1-dioxide ... [https://www.sciencedirect.com/science/article/abs/pii/S0223523422008558]
- 14. Identification of New Shikonin Derivatives as Antitumor ... [https://www.nature.com/articles/s41598-017-02671-7]
- 15. mdciao: Accessible Analysis and Visualization of Molecular ... [https://journals.plos.org/ploscompbiol/article?id=10.1371/journal.pcbi.1012837]
- 16. Loops Govern SH2 Domain Specificity by Controlling Access ... [https://pmc.ncbi.nlm.nih.gov/articles/PMC6590088/]
- 17. Specificity and regulation of phosphotyrosine signaling ... [https://pmc.ncbi.nlm.nih.gov/articles/PMC7337045/]
- 18. Structural insights into substrate recognition by the SOCS2 ... [https://www.nature.com/articles/s41467-019-10190-4]
- 19. Intramolecular hydrophobic interactions are critical ... [https://www.nature.com/articles/srep35454]
- 20. Changes in Signal Transducer and Activator of ... [https://www.sciencedirect.com/science/article/pii/S0021925820474599]
- 21. Computational screening and molecular dynamics of ... [https://link.springer.com/article/10.1007/s11030-024-11075-5]
- 22. A novel small-molecule disrupts Stat3 SH2 domain ... [https://pmc.ncbi.nlm.nih.gov/articles/PMC3188443/]
- 23. The Coiled-Coil Domain of Stat3 Is Essential for Its SH2 ... [https://pmc.ncbi.nlm.nih.gov/articles/PMC86266/]
- 24. SH2db, an information system for the SH2 domain - PMC [https://pmc.ncbi.nlm.nih.gov/articles/PMC10320075/]
- 25. Structural Basis for Specificity Switching of the Src SH2 ... [https://www.sciencedirect.com/science/article/pii/S1097276500802695]
- 26. Structural insights into the interaction of three Y-shaped ... [https://pmc.ncbi.nlm.nih.gov/articles/PMC10450665/]
- 27. Comprehensive detection and characterization of human ... [https://www.nature.com/articles/s41467-024-52146-3]
- 28. Protein Preparation Workflow - Schrödinger [https://www.schrodinger.com/life-science/learn/white-papers/protein-preparation-workflow/]
- 29. Preparing Your System for Molecular Dynamics (MD) [https://ctlee.github.io/BioChemCoRe-2018/system-prep/]
- 30. Protein Preparation & Validation [https://documentation.samson-connect.net/tutorials/prepare-protein/prepare-protein/]
- 31. Schrödinger Notes—Molecular Docking - J's Blog [https://blog.jiangshen.org/2024/schrodinger-notes-molecular-docking/]
- 32. Design, synthesis and biological evaluation of novel potent ... [https://www.sciencedirect.com/science/article/abs/pii/S0223523420303998]
- 33. Novel STAT3 Small-Molecule Inhibitors Identified by Structure ... [https://pmc.ncbi.nlm.nih.gov/articles/PMC8217378/]
- 34. SH2 domain regulation by CCD in D170A variant [https://journals.plos.org/ploscompbiol/article?id=10.1371/journal.pcbi.1010794]
- 35. Construction of a synthetic methodology-based library and ... [https://www.nature.com/articles/s41467-022-34598-7]
- 36. Designing quality ligand libraries - Schrödinger [https://www.schrodinger.com/life-science/learn/education/courses/library/]
- 37. Combining Ligand- and Structure-Based Methods for More ... [https://www.genengnews.com/topics/drug-discovery/combining-ligand-and-structure-based-methods-for-more-effective-virtual-screening/]
- 38. Molecular docking as a tool for the discovery ... [https://www.nature.com/articles/s41598-023-40160-2]
- 39. A practical guide to large-scale docking [https://www.nature.com/articles/s41596-021-00597-z]
- 40. Docking-based virtual screening for ligands of G protein ... [https://pmc.ncbi.nlm.nih.gov/articles/PMC3035735/]
- 41. Docking and scoring - Schrödinger [https://www.schrodinger.com/life-science/learn/white-papers/docking-and-scoring/]
- 42. Discovery of novel STAT 3 inhibitors with anti-breast cancer activity... [https://pmc.ncbi.nlm.nih.gov/articles/PMC12013508/]
- 43. Discovery of new STAT 3 inhibitors as anticancer agents using... [https://pubs.rsc.org/en/content/articlehtml/2023/ra/d2ra07007c]
- 44. SH2 Domains: Folding, Binding and Therapeutical ... [https://www.mdpi.com/1422-0067/23/24/15944]
- 45. Phosphopeptide binding to the N-SH2 domain of tyrosine ... [https://www.sciencedirect.com/science/article/pii/S2001037024000473]
- 46. An allosteric interaction controls the activation mechanism ... [https://www.nature.com/articles/s41598-020-75409-7]
- 47. Recent Advances in Molecular Docking for the Research ... [https://pmc.ncbi.nlm.nih.gov/articles/PMC7692358/]
- 48. Ligand docking and binding site analysis with PyMOL ... [https://pmc.ncbi.nlm.nih.gov/articles/PMC2881210/]
- 49. Decoding the limits of deep learning in molecular docking for ... [https://pubs.rsc.org/en/content/articlehtml/2025/sc/d5sc05395a]
- 50. Dockingpie [https://pymolwiki.org/index.php/Dockingpie]
- 51. Scoring functions and their evaluation methods for protein– ... [https://pubs.rsc.org/en/content/articlelanding/2010/cp/c0cp00151a]
- 52. Visualizing protein-protein docking using PyMOL [https://medium.com/@snippetsbio/visualizing-protein-protein-docking-using-pymol-cc49494e54bb]
- 53. The MM/PBSA and MM/GBSA methods to estimate ligand- ... [https://pmc.ncbi.nlm.nih.gov/articles/PMC4487606/]
- 54. Flare MM/GBSA - Cresset Group [https://cresset-group.com/software/flare-mmgbsa/]
- 55. WaterMap | Schrödinger [https://www.schrodinger.com/platform/products/watermap/]
- 56. WaterMap and Molecular Dynamic Simulation-Guided ... [https://pmc.ncbi.nlm.nih.gov/articles/PMC8529594/]
- 57. Virtual structure-based docking, WaterMap, and molecular ... [https://www.sciencedirect.com/science/article/abs/pii/S0022286020317130]
- 58. In-silico molecular modelling, MM/GBSA binding free ... [https://www.frontiersin.org/journals/chemistry/articles/10.3389/fchem.2022.991369/full]
- 59. 4.4. Molecular Docking (Validation, Parameters, and ... [https://bio-protocol.org/exchange/minidetail?id=10749406&type=30]
- 60. Structure-based virtual screening, molecular docking, and MD ... [https://pmc.ncbi.nlm.nih.gov/articles/PMC12312920/]
- 61. QikProp | Schrödinger [https://www.schrodinger.com/platform/products/qikprop/]
- 62. Interactive Protein Tutorial [https://www.ucl.ac.uk/~ucgbw3e/sh2.html]
- 63. A Molecular Docking, QSBAR, and ADMET Prediction Approach [https://pmc.ncbi.nlm.nih.gov/articles/PMC9568345/]
- 64. Comprehensive benchmarking of computational tools for ... [https://pmc.ncbi.nlm.nih.gov/articles/PMC11674477/]
- 65. PharmaBench: Enhancing ADMET benchmarks with large ... [https://www.nature.com/articles/s41597-024-03793-0]
- 66. Pharmacophore modeling, molecular docking, MMGBSA ... [https://www.sciencedirect.com/science/article/pii/S2468227625001048]
- 67. Determination of promising inhibitors for N-SH2 domain of ... [https://link.springer.com/article/10.1007/s11030-024-10880-2]
- 68. Structure, dynamics, and binding thermodynamics of the v- ... [https://pubmed.ncbi.nlm.nih.gov/18536014/]
- 69. Benchmarking Sets for Molecular Docking - PMC [https://pmc.ncbi.nlm.nih.gov/articles/PMC3383317/]
- 70. Pairwise Performance Comparison of Docking Scoring ... [https://www.mdpi.com/1420-3049/30/13/2777]
- 71. PoseBusters: Protein–Ligand Docking Evaluation [https://www.emergentmind.com/topics/posebusters-dataset]
- 72. A database for large-scale docking and experimental results [https://pmc.ncbi.nlm.nih.gov/articles/PMC11888352/]
- 73. New benchmark metrics for protein-protein docking methods [https://pmc.ncbi.nlm.nih.gov/articles/PMC3076516/]
- 74. Novel STAT3 Inhibitors Targeting STAT3 Dimerization by ... [https://pmc.ncbi.nlm.nih.gov/articles/PMC9196127/]
- 75. A High-Throughput Fluorescence Polarization-Based ... [https://pmc.ncbi.nlm.nih.gov/articles/PMC9781101/]
- 76. Fluorescence Polarization Assays in Small Molecule ... [https://pmc.ncbi.nlm.nih.gov/articles/PMC3277431/]
- 77. Establishing and optimizing a fluorescence polarization ... [https://www.moleculardevices.com/en/assets/app-note/br/establishing-and-optimizing-fluorescence-polarization-assay]
- 78. STAT inhibitors for cancer therapy | Journal of Hematology & Oncology [https://jhoonline.biomedcentral.com/articles/10.1186/1756-8722-6-90]
- 79. identifying selective inhibitors of SH2 domains [https://www.drugtargetreview.com/webinar/104692/decoding-cancer-and-inflammation-identifying-selective-inhibitors-of-sh2-domains/]
- 80. A Potent and Selective Small-molecule Degrader of STAT3 ... [https://pmc.ncbi.nlm.nih.gov/articles/PMC6880868/]
- 81. Structural optimization and characterization of highly potent ... [https://www.sciencedirect.com/science/article/abs/pii/S0223523425000972]
- 82. Network Pharmacology: A New Approach for Chinese Herbal ... [https://pmc.ncbi.nlm.nih.gov/articles/PMC3671675/]
- 83. Leveraging network pharmacology for drug discovery [https://www.sciencedirect.com/science/article/pii/S259009862500017X]
- 84. Efficient generation of protein pockets with PocketGen [https://www.nature.com/articles/s42256-024-00920-9]
- 85. AI-driven protein pocket detection through integrating deep ... [https://pubmed.ncbi.nlm.nih.gov/41051642/]
- 86. Network pharmacology combined with molecular docking ... [https://www.nature.com/articles/s41598-024-58877-z]
- 87. a multitarget approach using network pharmacology [https://pubmed.ncbi.nlm.nih.gov/39786519/]