Solving Poor Protein Band Resolution: A Scientist's Complete Guide to Troubleshooting SDS-PAGE
This comprehensive guide addresses the pervasive challenge of incomplete protein separation and poor band resolution in SDS-PAGE, crucial for accurate protein analysis in research and drug development.
Solving Poor Protein Band Resolution: A Scientist's Complete Guide to Troubleshooting SDS-PAGE
Abstract
This comprehensive guide addresses the pervasive challenge of incomplete protein separation and poor band resolution in SDS-PAGE, crucial for accurate protein analysis in research and drug development. Covering foundational principles through advanced optimization, we explore the root causes of resolution issues—from sample preparation artifacts to electrophoretic parameters—and provide systematic methodological protocols for both prevention and correction. The article details practical troubleshooting workflows for common problems like smearing, distortion, and faint bands, while establishing validation frameworks to confirm separation efficacy and compare methodological approaches. Designed for researchers seeking reproducible, publication-quality results, this resource synthesizes current best practices with empirical troubleshooting strategies to enhance experimental reliability in biomedical research.
Understanding the Root Causes of Poor Protein Separation in Electrophoresis
The Fundamental Principles of SDS-PAGE and Molecular Sieving
Core Principles and Workflow
The Principle of SDS-PAGE
Sodium dodecyl sulfate-polyacrylamide gel electrophoresis (SDS-PAGE) is an analytical technique used to separate proteins based on their molecular weight [1] [2]. The key to this process is the treatment of proteins with SDS, an anionic detergent that performs two critical functions [2]:
- It denatures proteins by breaking non-covalent bonds and unfolding them into linear chains, disrupting their secondary and tertiary structures [1] [2].
- It binds to the protein backbone at a constant ratio, imparting a uniform negative charge that masks the proteins' inherent electrical charges [1] [2].
When an electric field is applied, these negatively charged protein-SDS complexes migrate through a polyacrylamide gel matrix. Since all proteins now have a similar charge-to-mass ratio, their migration depends primarily on molecular size, enabling separation based on polypeptide chain length [1].
The Molecular Sieving Effect
The polyacrylamide gel acts as a molecular sieve [3]. Polymerized acrylamide forms a mesh-like matrix with pores of specific sizes [1] [3]. The sieving process works as follows [3]:
- Smaller proteins migrate faster through the gel matrix as they experience less resistance and can navigate the pores more easily.
- Larger proteins migrate more slowly as they encounter greater frictional resistance and are hindered by the mesh network.
The pore size of this molecular sieve is determined by the concentration of polyacrylamide [3]. Using a higher acrylamide concentration produces a gel with a smaller mesh size, which is more suitable for separating small proteins. In general, an acrylamide concentration between 6% and 15% is used [1].
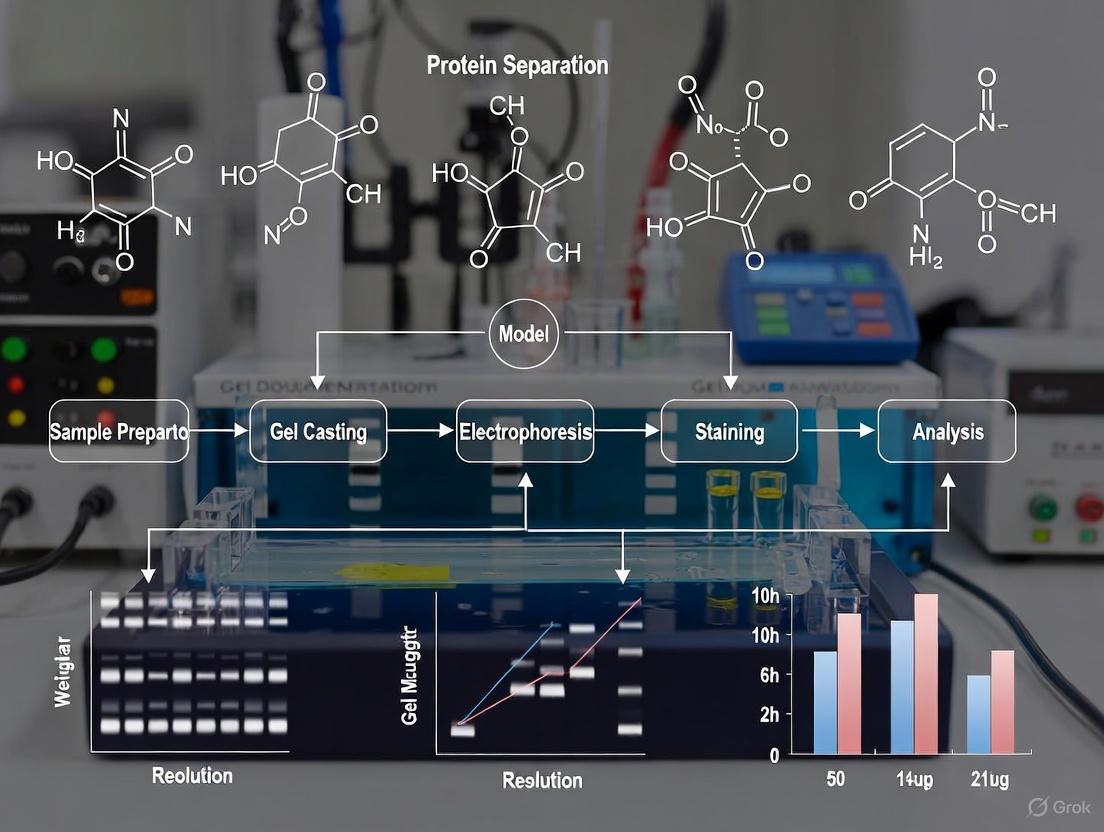
SDS-PAGE Experimental Workflow
The diagram below illustrates the key stages of a standard SDS-PAGE experiment:
Troubleshooting Guide: FAQs and Solutions
Poor Band Resolution and Separation
Problem: Protein bands are not properly separated or resolved, appearing blurry, overlapping, or as a single broad band [4].
Solutions:
- Increase run time: Ensure sufficient electrophoresis time; a standard practice is running the gel until the dye front nears the bottom [4] [2].
- Optimize gel concentration: Use an appropriate acrylamide percentage for your target protein size [4] [3].
- Verify buffer preparation: Improper ion concentration in running buffer disrupts current flow and pH maintenance [4].
- Adjust voltage: Running at too high voltage can cause smearing; reduce voltage by 25-50% for better resolution [5].
- Ensure complete denaturation: Increase boiling time slightly (typically 5 minutes at 98°C) and place samples immediately on ice after boiling to prevent renaturation [3].
Smeared Bands
Problem: Protein bands appear as diffuse smears rather than sharp, discrete bands [4].
Solutions:
- Reduce voltage: Run gel at lower voltage (10-15 volts/cm) for longer time [4].
- Decrease protein load: Reduce amount of protein loaded on gel [5].
- Check salt concentration: High salt can cause smearing; dialyze sample or use desalting column [5].
- Verify sample preparation: Ensure sufficient SDS is present; dilute sample with more SDS solution if needed [5].
Irregular Band Shapes (Smiling/Frowning)
Problem: Bands exhibit curved "smiling" or "frowning" patterns instead of straight lines [4] [2].
Solutions:
- Control temperature: "Smiling" is often due to excessive heat; run gel in cold room or with ice packs [4].
- Ensure even current distribution: Check buffer levels and composition across the apparatus [2].
- Avoid overloading: Load consistent sample volumes across wells [2].
- Minimize aggregation: Use optimized sample preparation with reducing agents [2].
Edge Effect and Distorted Peripheral Bands
Problem: Bands in the outermost lanes (left and right edges) appear distorted compared to central lanes [4].
Solutions:
- Avoid empty wells: Do not leave peripheral wells empty; load ladder or control samples in all wells [4].
- Load consistently: Ensure all wells contain samples with similar buffer composition [4].
Protein Migration Issues
Problem: Proteins migrate too fast, too slow, or diffuse out of wells before running [4] [5].
Solutions:
- Check running buffer concentration: Too diluted buffer causes fast migration [4].
- Optimize voltage: Very high voltage causes excessively fast migration [4].
- Minimize loading-to-run delay: Start electrophoresis immediately after loading samples to prevent diffusion [4].
- Verify gel polymerization: Ensure stacking gel has polymerized completely (wait 30 minutes) before removing comb [5].
Experimental Protocols
Materials Needed:
- Glass plates, spacers, comb, and electrophoresis apparatus
- Acrylamide solutions for stacking and separating gels
- SDS-PAGE running buffer
- Protein samples and molecular weight markers
- Sample buffer with SDS and reducing agent
Procedure:
- Assemble gel casting mold using clean glass plates and spacers.
- Prepare separating gel according to required acrylamide percentage (see Table 1).
- Pour separating gel and overlay with water or isopropanol to prevent oxygen inhibition of polymerization.
- Allow polymerization for 20-30 minutes, then remove overlay liquid.
- Prepare stacking gel and pour over polymerized separating gel.
- Insert comb and allow stacking gel to polymerize for 20-30 minutes.
- Prepare samples by mixing with sample buffer containing SDS and reducing agent.
- Denature samples by heating at 95-100°C for 3-5 minutes, then briefly centrifuge.
- Assemble electrophoresis apparatus and fill with running buffer.
- Load samples and molecular weight markers into wells.
- Run electrophoresis at appropriate voltage (typically 100-150V) until dye front reaches bottom of gel.
- Disassemble apparatus, remove gel, and proceed with staining or transfer.
Gel Percentage Selection Guide
Table 1: Optimal Acrylamide Gel Concentrations for Different Protein Sizes
| Protein Size Range | Recommended Gel Percentage | Separation Characteristics |
|---|---|---|
| <15 kDa | 12-20% | Tight matrix for small proteins |
| 15-100 kDa | 10-12% | Standard separation range |
| 25-200 kDa | 8-10% | Suitable for larger proteins |
| >200 kDa | 4-8% | Open matrix for very large proteins |
For applications requiring retention of protein function or metal cofactors, a modified NSDS-PAGE protocol can be used:
Modified Conditions:
- Sample Buffer: Omit SDS and EDTA; include Coomassie G-250 and glycerol
- Running Buffer: Reduce SDS concentration to 0.0375%; omit EDTA
- Sample Preparation: Eliminate heating step to preserve native structure
- Electrophoresis: Run at 200V for standard mini-gels
Applications: This method preserves enzymatic activity and metal cofactors in many proteins while maintaining good resolution [6].
The Scientist's Toolkit: Essential Research Reagents
Table 2: Key Reagents for SDS-PAGE Experiments and Their Functions
| Reagent/Material | Function | Key Considerations |
|---|---|---|
| SDS (Sodium Dodecyl Sulfate) | Denatures proteins and provides uniform negative charge | Critical for linearizing proteins and masking inherent charge [2] |
| Acrylamide/Bis-acrylamide | Forms cross-linked gel matrix for molecular sieving | Concentration determines pore size; higher % for smaller proteins [1] [3] |
| TEMED & Ammonium Persulfate | Catalyzes acrylamide polymerization | Fresh solutions required for complete gel polymerization [3] |
| Tris-based Buffers | Maintains pH during electrophoresis | MOPS or Tris-glycine systems commonly used [1] |
| Reducing Agents (DTT, β-mercaptoethanol) | Breaks disulfide bonds for complete unfolding | Essential for proper denaturation of structured proteins [1] |
| Glycerol | Increases sample density for well loading | Ensures samples settle properly in wells [1] |
| Tracking Dye (Bromophenol Blue) | Visualizes migration progress | Monitors run time; should reach bottom but not run off [4] |
| Molecular Weight Markers | Reference standards for size estimation | Pre-stained or unstained options available [1] |
Advanced Techniques and Optimization
Gradient Gels
Gels with an acrylamide concentration gradient provide a pore size gradient that can simultaneously resolve proteins across a broad molecular weight range [1] [2]. This is particularly useful for complex samples containing both high and low molecular weight proteins.
Two-Dimensional Electrophoresis
Two-dimensional electrophoresis separates proteins first by isoelectric point and then by molecular weight using SDS-PAGE, enabling resolution of thousands of proteins in a single analysis [2]. This powerful technique is essential for comprehensive proteomic studies.
Buffer System Variations
Different buffer systems (e.g., Tris-glycine, Tris-tricine, Bis-Tris) offer specific advantages for particular applications. Tris-tricine systems, for instance, provide better resolution for small peptides (<10 kDa), while Bis-Tris gels offer improved stability and reduced protein modification [6] [2].
FAQs: Keratin Contamination
Q1: What is keratin contamination and how does it appear on my gel or blot? Keratin contamination originates from human skin, hair, or dander and is a common foreign protein introduced during sample handling. On a gel or blot, it typically appears as a heterogeneous cluster of bands at approximately 55-65 kDa on reducing SDS-PAGE gels. In western blots, it can be detected if the antigen used to prepare the antibody was contaminated with keratin [7].
Q2: How can I prevent keratin contamination in my protein samples?
- Wear Gloves: Always wear gloves and change them if contamination is suspected [8] [9].
- Use Filter Tips: Use aerosol barrier (filter) pipette tips to prevent cross-contamination via pipettors [9].
- Maintain a Clean Workspace: Ensure a dust-free work bench. Do not leave tubes, tips, or buffers open to the environment [9].
- Use Dedicated Reagents: Aliquot buffers and store them to avoid repeated use of a stock solution that may become contaminated. Run a sample buffer-only control lane to check for contamination in your reagents [7].
Q3: My western blot shows keratin bands. What should I do? First, confirm that the signal is keratin by running a sample buffer-only control. If the control is clean, the contamination is in your sample. Re-prepare your sample using the preventive measures listed above. If the control shows bands, you must remake your lysis buffer and all other solutions using fresh aliquots [7].
FAQs: Protease Activity
Q4: What are the signs of protease activity in my samples? Protease activity typically results in smearing, multiple unexpected bands, or a complete loss of bands on your gel or blot. The protein degradation pattern may vary between samples if they are left at room temperature for different durations before heating [7].
Q5: How can I inhibit protease activity during sample preparation?
- Work on Ice: Perform all pre-heating steps on ice to slow enzymatic activity [10].
- Use Protease Inhibitors: Add a fresh protease inhibitor cocktail to your cell lysis buffer [10].
- Heat Immediately: After adding your sample to the SDS lysis buffer, heat the mixture immediately at 95-100°C for 5 minutes to denature and inactivate proteases. Do not let the sample sit in the buffer at room temperature [7].
Q6: I suspect my protein is being degraded, but I use protease inhibitors. What else could be wrong? Some proteins are sensitive to cleavage at aspartic acid-proline (Asp-Pro) bonds when heated to 100°C. If your protein contains such bonds, try heating at a lower temperature, such as 75°C for 5 minutes, which is often sufficient to inactivate proteases while preserving the protein [7].
FAQs: Carbamylation
Q7: What is protein carbamylation and what causes it in vitro? Carbamylation is a non-enzymatic post-translational modification where isocyanic acid reacts with the amino groups of proteins, primarily at the N-terminus and the side chains of lysine and arginine residues [11]. In laboratory settings, it is primarily caused by cyanate ions that form spontaneously in urea solutions commonly used as denaturants [7] [12]. This modification can alter a protein's charge, mass, and functional properties [11].
Q8: How does carbamylation affect my electrophoresis and western blot results? Carbamylation can cause:
- Charge Heterogeneity: A single protein may appear as multiple, closely spaced bands (charge trains) on a gel [11].
- Mass Shift: Each carbamylation event adds 43 Da to the protein's mass, which may be detectable by mass spectrometry [7].
- Masked Epitopes: Modification of lysine residues can block antibody binding sites, leading to weak or no signal in western blots [11].
Q9: What is the most effective way to prevent carbamylation from urea? The most effective method is to use ammonium-containing buffers, such as ammonium bicarbonate (NH₄HCO₃), with your urea solutions. The ammonium ions inhibit the carbamylation reaction through a common ion effect, pushing the equilibrium away from cyanate formation [11] [7]. A high concentration (e.g., 1M) of NH₄HCO₃ can inhibit almost all carbamylation [11].
Q10: Are there other strategies to minimize carbamylation? Yes, several complementary strategies exist:
- Use Fresh Urea: Always prepare urea solutions fresh or deionize them immediately before use [11].
- Avoid Excessive Heat: Do not heat urea solutions above room temperature, as higher temperatures accelerate cyanate formation [11].
- Use Scavengers: Add cyanate scavengers like glycinamide or ethylenediamine to the urea solution [7].
- Limit Exposure: Restrict the time your protein is exposed to urea to the shortest duration possible [7].
The table below summarizes the key artifacts and their quantitative impacts on protein analysis.
Table 1: Summary of Common Artifacts and Their Characteristics
| Artifact | Primary Cause | Observed Effect on Gel/Blot | Key Preventive Measure |
|---|---|---|---|
| Keratin Contamination [7] | Human skin, hair, or dander | Bands at 55-65 kDa | Use gloves and filter tips; maintain a clean workspace |
| Protease Activity [7] | Endogenous proteases in sample | Smearing, multiple bands, or loss of main band | Add inhibitors; heat samples immediately after lysing |
| Carbamylation [11] [7] | Cyanate ions in urea solutions | Multiple bands, charge trains, +43 Da mass shift | Use ammonium-containing buffers with urea |
Experimental Protocols
Protocol 1: Diagnosing and Preventing Protease Degradation
Purpose: To confirm whether protease activity is degrading your protein sample. Materials: SDS-PAGE sample buffer, heating block, ice. Procedure:
- Split your protein sample into two equal aliquots after adding SDS-PAGE sample buffer.
- Immediately heat one aliquot at 95-100°C for 5 minutes.
- Leave the second aliquot at room temperature for 2-4 hours, then heat it at the same temperature and duration.
- Analyze both samples on the same SDS-PAGE gel and compare the banding patterns. Expected Outcome: The sample left at room temperature will show significant degradation (smearing, extra bands, or a fainter main band) compared to the immediately heated sample if proteases are active [7].
Protocol 2: Preventing Carbamylation in Urea-Based Procedures
Purpose: To protect proteins from carbamylation during denaturation and digestion in urea. Materials: High-purity urea, ammonium bicarbonate (NH₄HCO₃), mixed-bed resin (optional). Procedure:
- Prepare your urea solution fresh. For critical applications, deionize it using a mixed-bed resin like Bio-Rad AG 501-X8 [7].
- Prepare your digestion or denaturation buffer using a high concentration (e.g., 0.5M to 1M) of ammonium bicarbonate instead of Tris-HCl or phosphate buffer [11].
- Keep the urea solution at 4°C or on ice and minimize the total time your protein is exposed to it [11] [7]. Expected Outcome: This protocol results in a significant reduction or elimination of carbamylation artifacts, leading to a single, sharp band on IEF gels or a single correct mass in MS analysis [11].
Visualization of Artifact Mechanisms and Prevention
The following diagram illustrates the sources and effects of the three major artifacts, along with the critical steps for their prevention.
The Scientist's Toolkit
Table 2: Essential Research Reagent Solutions
| Reagent | Function | Application Note |
|---|---|---|
| Protease Inhibitor Cocktail | A mixture of inhibitors that target various classes of proteases (serine, cysteine, aspartic, metallo-). | Add fresh to lysis buffer immediately before use. Essential for maintaining sample integrity, especially in crude lysates [10]. |
| Ammonium Bicarbonate (NH₄HCO₃) | A volatile buffer used in enzymatic digestions and urea-containing solutions. | Using at 0.5-1M concentration effectively inhibits protein carbamylation by urea-derived cyanate [11]. |
| Filter Pipette Tips | Aerosol barrier tips that prevent sample carryover and contamination from pipettors. | Critical for preventing cross-contamination between samples and introduction of keratins or other contaminants [9]. |
| Dithiothreitol (DTT) | A strong reducing agent that breaks disulfide bonds in proteins. | Used in sample buffer for complete denaturation. Final concentration should be less than 50 mM to prevent gel artifacts like shadowed lane edges [13]. |
| Trichloroacetic Acid (TCA) | A precipitating agent used to concentrate and purify proteins from dilute samples. | Helps remove contaminants like salts and detergents prior to electrophoresis. Must be thoroughly rinsed off with water to prevent stain aggregation [8] [7]. |
Core Principles: How Protein Properties Affect Electrophoretic Migration
The migration of proteins during Polyacrylamide Gel Electrophoresis (PAGE) is primarily governed by three intrinsic characteristics: molecular size, net charge, and structural properties. Understanding their interplay is crucial for interpreting experimental results and troubleshooting anomalies [14] [15].
In Denaturing SDS-PAGE, the anionic detergent Sodium Dodecyl Sulfate (SDS) binds to proteins, masking their intrinsic charge. Proteins are denatured and linearized, creating a uniform charge-to-mass ratio. Separation occurs primarily by molecular size as proteins sieve through the polyacrylamide matrix [14] [16]. However, this relationship is not absolute. Hydrophobic proteins may bind more SDS, while post-translationally modified proteins (e.g., glycosylated or phosphorylated) may bind less, leading to minor deviations in expected mobility [16]. Furthermore, membrane proteins frequently show anomalous migration ("gel shifting") because their hydrophobic domains bind variable amounts of SDS, altering the mass and shape of the protein-detergent complex [17].
In Native-PAGE, proteins are separated based on the combined influence of their net charge, size, and native three-dimensional shape. The higher the negative charge density, the faster the migration. Simultaneously, the gel matrix exerts a sieving effect, retarding larger or more structurally complex proteins more than smaller, compact ones [14].
The following diagram illustrates how these fundamental properties dictate a protein's path and final position in different electrophoretic methods.
Quantitative Data on Anomalous Migration
The table below summarizes documented examples of anomalous migration, particularly in membrane proteins, highlighting the significant discrepancies that can occur between apparent and formula molecular weights [17].
Table 1: Documented Gel Shifts in Helical Membrane Proteins
| Protein | Oligomeric State | Formula MW (kDa) | Apparent MW (kDa) | Gel Shift (%) |
|---|---|---|---|---|
| I. tartaricus F-type ATPase c subunit | Undecamer | 97 | 53 | -46% |
| Phospholamban | Monomer | 6.1 | 9 | +48% |
| E. coli lactose permease | Monomer | 47 | 33 | -30% |
| β2-adrenergic receptor | Monomer | 47 | 62 | +30% |
| Potassium channel KcsA | Tetramer | 76 | 60 | -21% |
| M. tuberculosis MscL channel | Monomer | 16 | 20 | +26% |
These migration anomalies are strongly correlated with the protein's SDS-binding capacity. A study on helix-loop-helix membrane proteins found that the amount of SDS bound ranged from 3.4 to 10 grams of SDS per gram of protein, far exceeding the typical 1.4 g/g for soluble proteins. The gel shift behavior showed a strong correlation with this SDS loading capacity (R² = 0.8) [17].
Troubleshooting FAQs and Guides
Poor Band Resolution
Problem: Protein bands are blurry, poorly defined, or overlap excessively, making interpretation difficult.
Table 2: Troubleshooting Poor Band Resolution
| Possible Cause | Detailed Explanation & Solution |
|---|---|
| Incorrect Gel Percentage | The pore size of the gel matrix is unsuitable for your target protein's size [3]. Solution: Use a lower % acrylamide gel for high molecular weight proteins (>100 kDa) and a higher % gel for low molecular weight proteins (<20 kDa). Gradient gels (e.g., 4-20%) provide a broad separation range [18]. |
| Incomplete Denaturation | Proteins with residual secondary or tertiary structure will not migrate strictly by size [3]. Solution: Ensure sample buffer contains sufficient SDS and reducing agent (DTT or β-mercaptoethanol). Boil samples at 95-100°C for 5 minutes and then place immediately on ice to prevent re-folding [3]. |
| Protein Overload | Loading too much protein can cause aggregation and over-saturation of the lane, leading to poor resolution and smearing [5]. Solution: Serial dilute your sample to determine the optimal, non-saturating loading amount [3]. |
| Incorrect Electrical Parameters | Running the gel at too high a voltage generates heat, which can cause band smiling and diffusion, reducing resolution [18]. Solution: Run the gel at a lower constant voltage (e.g., 100-120V instead of 150V) for a longer time to minimize heat-related artifacts [18]. |
Atypical Migration (Gel Shifting)
Problem: A protein migrates to a position that does not correspond with its known or predicted molecular weight.
Table 3: Investigating and Confirming Atypical Migration
| Possible Cause | Experimental Verification & Solution |
|---|---|
| Altered SDS Binding | Hydrophobic proteins (e.g., membrane proteins) or proteins with extreme pI values may bind SDS differently, altering mobility [17] [16]. Verification: Compare migration in a Native SDS-PAGE (NSDS-PAGE) system, which uses minimal SDS and no heating, to standard SDS-PAGE. Altered migration patterns confirm an SDS-binding effect [6]. |
| Post-Translational Modifications (PTMs) | Modifications like glycosylation or phosphorylation add mass but may not be coated proportionally with SDS, leading to aberrant migration [16]. Verification: Treat samples with specific enzymes (e.g., PNGase F for N-linked glycans, phosphatases) and re-run on SDS-PAGE. A shift in mobility confirms the presence of the PTM. |
| Residual Protein Structure | Disulfide bonds or exceptionally stable protein domains may not fully denature, creating a more compact shape that migrates faster [17]. Verification: Increase the concentration of reducing agent in the sample buffer and extend boiling time. A shift to a higher apparent MW indicates incomplete reduction. |
| High Charge Density | In SDS-PAGE, a protein's intrinsic charge is mostly masked, but proteins with very high positive or negative charge can still exhibit minor mobility shifts. Verification: Measure the protein's effective valence (Zeff) using techniques like REM-MCE [19]. Compare the measured charge with the theoretical net charge at the running buffer pH. |
Band Smiling and Distortion
Problem: Bands curve upwards at the edges ("smiling") or show wavy, non-horizontal patterns.
Table 4: Addressing Band Smiling and Distortion
| Problem | Cause & Solution |
|---|---|
| Smiling Effect | Cause: The center of the gel runs hotter than the edges, causing proteins to migrate faster in the middle [18]. Solution: Use a lower running voltage to reduce heat generation. Run the gel in a cold room or use a gel apparatus with a cooling core [18]. |
| Vertical Streaking | Cause: The protein is precipitating in the well, often due to overloading or incompatibility with the buffer [5]. Solution: Centrifuge samples before loading. Reduce the amount of protein loaded. Add a chaotrope like 4-8 M urea to the sample buffer to solubilize hydrophobic proteins [5]. |
| Edge Effect | Cause: Distorted bands in the outermost lanes due to uneven electrical field distribution, especially when peripheral wells are empty [18]. Solution: Load sample or a dummy protein (e.g., BSA) into all wells, including those at the edges. Ensure the gel cassette is properly assembled and the buffer level is even [18]. |
The Scientist's Toolkit: Key Reagent Solutions
The following table lists essential reagents used in protein electrophoresis, detailing their critical functions in ensuring successful and interpretable separations.
Table 5: Key Reagents in Protein Electrophoresis
| Reagent | Function in the Experiment |
|---|---|
| Sodium Dodecyl Sulfate (SDS) | Anionic detergent that denatures proteins and binds to the polypeptide backbone, conferring a uniform negative charge and allowing separation primarily by mass [14] [16]. |
| Polyacrylamide | Forms a cross-linked, porous matrix when polymerized. Acts as a molecular sieve; the pore size is controlled by the total acrylamide percentage, determining the effective separation size range [14]. |
| Bis-Acrylamide | Cross-linking agent used with acrylamide to form the rigid polyacrylamide gel network. The ratio of bisacrylamide to acrylamide affects the gel's pore size and mechanical properties [14]. |
| TEMED & Ammonium Persulfate (APS) | TEMED catalyzes the production of free radicals from APS, which initiate the polymerization reaction of acrylamide and bis-acrylamide to form the gel [14]. |
| Tris Buffer | A common buffer (pKa ~8.1) used in running buffers, gel matrices, and sample buffers. It maintains a stable alkaline pH, which is critical for the SDS-protein complex charge and the function of the discontinuous buffer system [16]. |
| Glycine | An amino acid used in the running buffer. Its charge state is pH-dependent and is crucial for the "stacking" effect in discontinuous SDS-PAGE, creating a sharp interface that concentrates proteins before they enter the resolving gel [16]. |
| DTT or β-Mercaptoethanol | Reducing agents that break disulfide bonds between cysteine residues, ensuring proteins are fully denatured into their individual subunits [16]. |
| Coomassie Blue | A dye used for staining proteins after electrophoresis. It binds non-specifically to proteins through ionic and van der Waals interactions, allowing visualization of separated bands [6]. |
Experimental Protocol: Native SDS-PAGE for Detecting Metal-Binding Proteins
This protocol is adapted from a study investigating Zn²⁺ retention in proteins and is useful for analyzing proteins where preserving non-covalent interactions or cofactors is desirable [6].
Objective: To separate proteins with high resolution while retaining bound metal ions and/or enzymatic activity.
Methodology Summary:
Sample Preparation:
- Mix 7.5 µL of protein sample with 2.5 µL of 4X NSDS-PAGE sample buffer.
- Critical Note: Do not boil the sample. The sample buffer contains 100 mM Tris HCl, 150 mM Tris base, 10% glycerol, 0.0185% Coomassie G-250, and 0.00625% Phenol Red, pH 8.5 [6].
Gel Preparation:
- Use standard precast Bis-Tris polyacrylamide gels (e.g., Invitrogen NuPAGE Novex 12% Bis-Tris).
- Pre-run the gel at 200V for 30 minutes in double-distilled H₂O to remove storage buffer and unpolymerized acrylamide [6].
Electrophoresis:
- Load the prepared samples.
- Run the gel at a constant voltage (e.g., 200V) using a running buffer containing 50 mM MOPS, 50 mM Tris Base, and 0.0375% SDS (note the reduced SDS concentration compared to standard protocols), pH 7.7 [6].
- Stop the run when the dye front reaches the bottom of the gel.
Expected Outcomes: This method results in high-resolution protein separation similar to standard SDS-PAGE but with significantly retained biological properties. The cited study showed Zn²⁺ retention increased from 26% (standard SDS-PAGE) to 98% (NSDS-PAGE), and 7 out of 9 model enzymes retained their activity post-electrophoresis [6].
Critical Buffer Components and Their Roles in Maintaining Separation Integrity
FAQ: Core Principles of Buffer Components
What is the primary function of Laemmli buffer in SDS-PAGE? Laemmli buffer is essential for preparing protein samples for SDS-PAGE. It creates the physicochemical conditions necessary for proteins to be separated based almost exclusively on their molecular weight [20]. It does this by denaturing proteins and imparting a uniform charge, ensuring separation integrity.
Why are multiple components needed in the sample buffer? Each component in Laemmli buffer has a distinct and critical role. No single component can achieve the required denaturation, charge uniformity, and sample handling needed for clear separation. The synergistic action of all five components is what ensures high-resolution band separation [20].
How does buffer pH affect protein separation? Buffer pH is critical for achieving maximum resolution. In SDS-PAGE, the Laemmli buffer is prepared at pH 6.8 to match the stacking gel pH. This pH is close to the pI of glycine in the running buffer, which creates a stacking effect that concentrates protein samples into sharp bands before they enter the resolving gel, leading to better separation [20].
Troubleshooting Guide: Poor Band Separation
Poor band separation or resolution is a common issue in SDS-PAGE. The table below summarizes the potential causes and solutions.
Table 1: Troubleshooting Poor Band Separation/Resolution
| Observed Problem | Potential Cause | Recommended Solution | Supporting Experimental Protocol |
|---|---|---|---|
| Smeared bands [3] [21] | Voltage too high, generating excessive heat. | Run the gel at a lower voltage for a longer duration (e.g., 10-15 V/cm). Use a cooling pack or run in a cold room [3] [21]. | Use the Azure Aqua Transfer Cell with a compatible ice pack or place the entire gel apparatus in a cold room during the run [3]. |
| Poor separation, blurry or overlapping bands [3] [21] | Incomplete protein denaturation. | Ensure samples are boiled for an appropriate time (commonly 5 minutes at 98°C) and placed immediately on ice to prevent renaturation. Verify the concentration of SDS and reducing agent (DTT/BME) [3]. | After boiling, immediately place samples on ice. Do not allow them to cool gradually at room temperature [3]. |
| Poor separation across all samples [3] [21] | Overused or improperly formulated running buffer. | Prepare fresh running buffer before each run. Confirm the correct salt concentrations and pH [3] [21]. | Formulate running buffer with the proper ionic strength to ensure current flows correctly and proteins remain denatured [21]. |
| Bands too close together [3] | Inappropriate polyacrylamide percentage. | Use a lower % gel for high molecular weight proteins and a higher % gel for low molecular weight proteins. | For high MW proteins: Use a gel with ≤8% acrylamide. For low MW proteins: Use a gel with ≥12% acrylamide [3]. |
| Poor resolution, even with fresh buffer [21] | Incomplete gel polymerization. | Ensure all gel components are fresh and added in correct concentrations, especially TEMED and APS. Allow sufficient time for complete polymerization. | Verify that TEMED and APS are added to the gel solution. Consider using pre-cast gels to eliminate polymerization variables [3]. |
| "Smiling" bands (curved upwards) [21] | Excessive heat generation during electrophoresis. | Run the gel at a lower voltage or implement cooling methods (cold room, ice packs). | Distorted bands on the gel's periphery ("edge effect") can be minimized by loading unused wells with a dummy sample like protein ladder or buffer [21]. |
| Protein samples diffuse out of wells before running [21] | Lag between sample loading and starting electrophoresis. | Start the electrophoresis run immediately after loading the final sample. | Minimize the time delay between loading the first sample and applying the electric current to prevent haphazard sample diffusion [21]. |
The following diagram illustrates a logical workflow for diagnosing and resolving poor band separation issues.
The Scientist's Toolkit: Essential Research Reagent Solutions
Table 2: Key Reagents for SDS-PAGE Protein Separation
| Reagent | Critical Function | Technical Notes & Optimization |
|---|---|---|
| SDS (Sodium Dodecyl Sulfate) | Denatures proteins by disrupting non-covalent bonds and confers a uniform negative charge, masking proteins' intrinsic charge [20] [22]. | An estimated 1.4g SDS binds to 1g of protein. Ensure sufficient SDS is present in your sample buffer [20]. |
| Reducing Agent (DTT or BME) | Breaks disulfide bonds (covalent linkages) within and between protein subunits, which SDS alone cannot disrupt [20] [22]. | DTT is less stable than BME over long-term storage. If using DTT in buffer, it may need to be re-added periodically [20]. |
| Tris Buffer | Maintains a stable pH (6.8) in the sample buffer, which is critical for the stacking gel process that sharpens bands [20]. | The specific pH of the Tris buffer in Laemmli buffer is critical for proper glycine ion mobility and sample stacking [20]. |
| Glycerol | Increases the density of the sample mixture, ensuring it sinks to the bottom of the well during loading [20]. | Glycerol is dense (1.26 g/cm³). For accuracy, measure by mass (multiply desired volume by 1.26) instead of pipetting [20]. |
| Tracking Dye (Bromophenol Blue) | Visualizes the sample during loading and allows monitoring of electrophoresis progress via the migrating "dye front" [20]. | As long as the dye front remains on the gel, you can be confident that your proteins have not migrated off the gel [20]. |
| Polyacrylamide Gel | Forms a cross-linked, sieve-like matrix through which proteins are separated based on size [3] [22]. | Pore size is inversely related to acrylamide %. Optimize gel percentage for your target protein's size for best resolution [3]. |
Visualization of the SDS-PAGE Separation Mechanism
The following diagram illustrates how the key buffer components interact with proteins and facilitate separation based on molecular weight.
How Cross-Linking Density and Gel Polymerization Affect Pore Size and Resolution
Polyacrylamide gel electrophoresis (PAGE) separates proteins based on their molecular weight using a crosslinked polymer matrix that functions as a molecular sieve. The polyacrylamide gel forms a mesh-like structure through which proteins migrate when electrical current is applied. Smaller proteins navigate this mesh quickly, while larger ones migrate more slowly. The separation matrix is created by polymerizing acrylamide monomers with a crosslinking agent, typically N,N'-methylenebisacrylamide (BIS). The pore size of the resulting gel is not fixed but is dynamically determined by two critical factors: the total concentration of acrylamide (%T) and the proportion of crosslinker relative to the total monomer content (%C). Understanding and controlling these parameters is fundamental to achieving optimal protein separation, as they directly govern the gel's sieving properties and directly impact band resolution in experimental results [3] [23].
Key Concepts: Cross-Linking Density and Polymerization
Defining Cross-Linking Density and Gel Composition
Cross-linking density refers to the frequency of connections between polymer chains within the gel matrix. A higher cross-linking density creates a tighter, more rigid mesh with smaller pores, while a lower density results in a looser network with larger pores. This density is quantitatively controlled by the concentrations of two components during gel preparation [23]:
- Acrylamide: The primary monomer that forms the linear backbone of the polymer chains.
- N,N'-methylenebisacrylamide (BIS): The crosslinking agent that connects multiple acrylamide chains, forming the three-dimensional network.
The relationship between gel composition and its physical structure is described by two key formulas [23] [24]:
Total Monomer Concentration (%T): (\%T = \frac{\text{(grams of acrylamide + grams of crosslinker)}}{100 \text{ mL}} \times 100\%)
- Function: Primarily determines the average pore size. Higher %T values create gels with smaller average pores.
Cross-linker Percentage (%C): (\%C = \frac{\text{grams of crosslinker}}{\text{(grams of acrylamide + grams of crosslinker)}} \times 100\%)
- Function: Determines the tightness of the mesh and the number of pores. It directly defines the cross-linking density.
Table 1: Effect of Gel Composition Parameters on Pore Structure
| Parameter | Definition | Primary Effect on Gel | Impact on Protein Migration |
|---|---|---|---|
| %T (Total Monomer) | Total concentration of acrylamide and bisacrylamide | Determines the average pore size | Higher %T → smaller pores → slower migration for all proteins |
| %C (Cross-linker) | Proportion of crosslinker in total monomer | Controls the cross-linking density and number of pores | Optimal %C → sharp bands; Too high/low %C → poor resolution and smearing |
The Gel Polymerization Process
The polymerization process is a critical step that transforms liquid monomer solutions into a solid, porous gel. This reaction is initiated by ammonium persulfate (APS), which generates free radicals, and catalyzed by Tetramethylethylenediamine (TEMED). These components work together to trigger the formation of polyacrylamide chains linked by bisacrylamide bridges [3].
Critical Factors for Successful Polymerization:
- Complete Polymerization: The gel must be given adequate time to polymerize completely before use. Incomplete polymerization, often caused by expired or improperly stored reagents (especially TEMED and APS), will result in a gel with inconsistent pore structure and poor separation capabilities [3].
- Inhibitors to Avoid: Oxygen can inhibit the free-radical polymerization process. Furthermore, contaminants from disposable plasticware, such as oleamide or cationic biocides, can leach into solutions and disrupt polymerization. Washing plasticware with methanol or DMSO before use can mitigate this risk [7].
FAQs and Troubleshooting Guides
Frequently Asked Questions (FAQs)
Q1: What happens if my gel has a cross-linking density that is too high or too low?
- Too High Cross-linking Density: Creates an extremely tight, brittle gel matrix with very small pores. This can prevent larger proteins from entering the gel entirely and cause excessive resistance for all proteins, leading to poor band separation and "smiling" or distorted bands due to excessive heat buildup [23].
- Too Low Cross-linking Density: Results in a loose, fragile, and overly large-pore matrix. While large proteins may migrate, the gel will fail to adequately resolve smaller proteins of similar sizes, causing them to co-migrate as a single, poorly defined band [23].
Q2: How does gel percentage affect the resolution of proteins of different sizes?
- High-Percentage Gels (e.g., 12-20%): Feature small pores ideal for resolving low molecular weight proteins (<30 kDa). In a low-percentage gel, these small proteins migrate too quickly and fail to separate from one another [3].
- Low-Percentage Gels (e.g., 6-10%): Feature large pores necessary for the efficient migration and separation of high molecular weight proteins (>100 kDa). A high-percentage gel would restrict their movement, causing them to cluster near the top [3].
Q3: Why did my protein bands appear smeared instead of sharp? Smeared bands are one of the most common issues and can have several causes related to gel polymerization and density [25]:
- Improper Gel Polymerization: Incomplete polymerization creates an inconsistent matrix.
- Incorrect Voltage: Running the gel at too high a voltage generates excessive heat, which can warp the gel and distort bands.
- Protein Overload: Loading too much protein causes over-saturation in the lane, leading to aggregation and smearing as the proteins cannot be resolved.
Troubleshooting Common Problems
Table 2: Troubleshooting Poor Band Resolution and Separation Issues
| Problem Observed | Potential Causes Related to Gel/Cross-linking | Recommended Solutions |
|---|---|---|
| Poor band separation | Incorrect gel percentage for target protein size; Incomplete polymerization; Overused running buffer [3] [25]. | Choose gel % based on protein MW; Ensure fresh APS/TEMED; Make fresh running buffer. |
| Smeared bands | Gel polymerization incomplete; Voltage too high; Protein overload; Gel percentage too low for small proteins [3] [25]. | Check reagent freshness; Run gel at lower voltage; Load less protein; Use higher % gel for small proteins. |
| 'Smiling' bands (curved upwards) | Gel became too hot during electrophoresis due to high voltage and resistive heating [25]. | Run gel at a lower voltage for a longer time; Use a cooling apparatus or run in a cold room. |
| Protein bands not resolving - all run together | Gel run time too short; Acrylamide concentration in resolving gel is too high for your proteins [25]. | Run gel until dye front nears bottom; Lower the acrylamide percentage of the resolving gel. |
| Unexpected bands or streaks in lanes | Protease degradation (sample not heated immediately); Keratin contamination from skin/dust; Leached chemicals from plasticware [7]. | Heat samples immediately after adding buffer; Wear gloves; use filtered tips; Wash plasticware with methanol. |
Experimental Protocols and Methodologies
Protocol: Optimizing Gel Percentage for Target Protein Size
This protocol guides the selection of the appropriate gel percentage to resolve proteins within a specific molecular weight range [3].
Materials Needed:
- Acrylamide/bis-acrylamide stock solution (e.g., 30%T, 2.7%C)
- Tris-HCl buffer (for resolving gel, typically 1.5 M, pH 8.8)
- Ammonium persulfate (APS), 10% solution
- Tetramethylethylenediamine (TEMED)
- Protein molecular weight standard
Methodology:
- Calculate Gel Formulation: Based on the molecular weight of your target protein, choose a gel percentage.
- >100 kDa: Use 6-8% gel.
- 50-100 kDa: Use 8-10% gel.
- 25-50 kDa: Use 10-12% gel.
- <25 kDa: Use 12-20% gel.
- Cast the Gel: Mix acrylamide/bis-acrylamide, Tris buffer, and water in proportions to achieve the desired %T. Add APS and TEMED to initiate polymerization immediately after mixing. Swirl gently and pour between glass plates.
- Load and Run: Once polymerized, load protein samples and molecular weight standards. Run the gel at a constant voltage (e.g., 100-150V for mini-gels) until the dye front approaches the bottom.
- Analyze: Stain the gel or process for western blotting. Assess the resolution of your target band and the sharpness of the standard bands.
Protocol: Systematic Study of Cross-linking Density Effects
This advanced protocol, inspired by material science approaches, allows for a systematic investigation of how cross-linker percentage (%C) affects gel properties [26] [24].
Objective: To fabricate and characterize a series of polyacrylamide gels with constant %T but varying %C, and to evaluate their separation performance.
Materials Needed:
- Acrylamide powder
- N,N'-methylenebisacrylamide (BIS) powder
- Tris-HCl buffers
- APS and TEMED
- Standard protein mixture (covering a broad MW range)
Methodology:
- Design Formulations: Prepare a series of gel solutions with a fixed %T (e.g., 10%). Systematically vary the %C across a range (e.g., 1%, 2.6% (standard), 5%, 10%).
- Polymerize Gels: For each %C formulation, cast a separate gel. Ensure consistent polymerization times and temperatures across all gels to minimize variables.
- Electrophoresis: Run the same standard protein mixture and complex protein samples (e.g., cell lysate) on all gels under identical running conditions.
- Performance Analysis:
- Resolution Calculation: Measure the resolution (Rs) between adjacent protein bands in the standard. Rs ≥ 0.5 is generally considered acceptable [24].
- Band Sharpness: Qualitatively and quantitatively assess the sharpness and definition of bands in the complex sample.
- Gel Strength: Note the mechanical properties (e.g., brittleness, elasticity) of each gel during handling.
Expected Outcome: You will identify an optimal %C for your specific %T that provides the best balance of resolution, band sharpness, and mechanical stability. Extremes of %C will likely show degraded performance.
Quantitative Data and Relationships
Protein Mobility and Gel Density
The Ferguson analysis is a fundamental method for quantifying the relationship between protein mobility and gel density, providing insight into the sieving properties of the gel [24].
Table 3: Protein Mobility as a Function of Gel Density (Ferguson Analysis)
| Protein Target | Molecular Weight (kDa) | Electrophoretic Mobility (μ) in 4%T Gel | Electrophoretic Mobility (μ) in 8%T Gel | Electrophoretic Mobility (μ) in 10%T Gel |
|---|---|---|---|---|
| eIF4E | 25 | High | Medium | Low |
| ERK | 44 | High | Medium | Low |
| HER2 | 185 | Medium | Low | Very Low / No Migration |
| mTOR | 289 | Low | Very Low / No Migration | No Migration |
Data derived from single-cell western blotting studies [24]. Mobility is relative and intended to illustrate the trend of decreasing mobility with increasing gel density.
Optimized Gel Conditions for Protein Separation
Based on empirical data, the following table provides guidelines for selecting gel conditions to achieve optimal resolution for specific protein targets.
Table 4: Optimized Gel Formulations for Key Protein Targets
| Protein Target | Molecular Weight | Recommended Gel %T | Effective Separation Range | Key Consideration |
|---|---|---|---|---|
| eIF4E / ERK | 25 / 44 kDa | 10% - 12% | Low MW Proteins | Higher %T gels are required to resolve the rapid migration of small proteins. |
| HER2 / mTOR | 185 / 289 kDa | 6% - 8% | High MW Proteins | Low %T gels with large pores are needed for large proteins to enter and migrate. |
| Broad Range (e.g., GFP, various standards) | 25 - 289 kDa | Pore-gradient Gel | All sizes | A gel with a spatial pore-size gradient (low to high %T) can resolve a broad mass range over a short distance [24]. |
Visualization of Concepts and Workflows
Relationship Between Cross-Linking and Pore Size
This diagram illustrates the core concept of how the concentration of the cross-linker bisacrylamide determines the density of the gel matrix and its effective pore size.
Experimental Workflow for Gel Optimization
This workflow outlines the systematic process for troubleshooting and optimizing polyacrylamide gel formulations to improve protein separation.
The Scientist's Toolkit: Research Reagent Solutions
Table 5: Essential Reagents for Polyacrylamide Gel Preparation
| Reagent / Material | Function / Role | Critical Consideration for Resolution |
|---|---|---|
| Acrylamide / Bis-acrylamide | Primary monomer and crosslinker forming the gel matrix. | Use high-purity grades. Pre-mixed stock solutions (e.g., 30%T, 2.7%C) ensure consistency and improve safety [3]. |
| Ammonium Persulfate (APS) | Initiator that generates free radicals to start polymerization. | Prepare fresh 10% solution frequently or use frozen aliquots. Degraded APS leads to incomplete polymerization and smeared bands [3] [7]. |
| TEMED | Catalyst that accelerates the polymerization reaction by decomposing APS. | Store tightly sealed at 4°C. Its volatile nature means old or improperly stored TEMED will slow or prevent complete gel formation [3]. |
| Tris-HCl Buffers | Provides the correct pH environment for polymerization and electrophoresis. | Incorrect ion concentration or pH in running buffer disrupts current flow and protein stability, causing poor resolution [3] [25]. |
| Pre-stained Protein Ladder | A set of proteins of known molecular weight used to monitor run progress and approximate protein size. | Do not boil pre-stained ladders, as this can degrade the proteins and distort bands. Use unstained standards for accurate molecular weight determination [27]. |
| Dithiothreitol (DTT) or β-Mercaptoethanol | Reducing agents that break disulfide bonds in proteins for complete denaturation. | Use fresh aliquots. Oxidized DTT will not fully denature proteins, leading to aberrant migration and multiple bands [27] [7]. |
Optimized Protocols for Flawless Protein Separation and Analysis
Proper sample preparation is the foundational step for successful protein analysis, whether for Western blotting, mass spectrometry, or other analytical techniques. The quality of your sample preparation directly determines the reliability of your final results, especially when investigating complex biological questions such as incomplete protein separation. This guide provides detailed troubleshooting and FAQs to address specific issues encountered during the critical stages of protein sample preparation, from initial lysis to final denaturation [28] [29].
Sample Preparation Workflow: A Visual Guide
The following diagram illustrates the core workflow for preparing protein samples, highlighting key stages where problems frequently occur.
Troubleshooting Common Problems
This section addresses the most frequent issues researchers face during sample preparation, which can lead to poor band resolution and incomplete protein separation.
Troubleshooting Guide: Common Issues and Solutions
| Problem Category | Specific Symptom | Potential Root Cause | Recommended Solution |
|---|---|---|---|
| Sample Lysis & Homogenization | Low protein yield [29] | Inefficient tissue disruption; insufficient mechanical homogenization | Follow mechanical homogenization (e.g., Polytron) with sonication for complete membrane disruption [29]. |
| Protein degradation [28] [29] | Active endogenous proteases/phosphatases; multiple freeze-thaw cycles | Add protease/phosphatase inhibitors to lysis buffer; snap-freeze samples in liquid N₂; limit freeze-thaw cycles [28] [29]. | |
| Sample Complexity & Interference | High background, masking low-abundance proteins [28] | Complex sample with high dynamic range of protein concentrations | Use depletion strategies (e.g., immunoaffinity) to remove highly abundant proteins; employ enrichment for target proteins or PTMs [28]. |
| Signal suppression in MS [28] | Presence of salts and detergents | Desalt and concentrate samples using dialysis or desalting columns prior to analysis [28]. | |
| Denaturation, Reduction & Alkylation | Incomplete denaturation [28] | Inefficient or incorrect use of denaturing agents | Use strong chaotropic agents like urea or thiourea. For gel-based methods, ensure proper SDS-PAGE conditions [28] [29]. |
| Vertical streaking on gels, smearing [28] | Incomplete disulfide bond reduction or improper cysteine alkylation | Irreversibly break disulfide bonds with reducing agents (DTT or TCEP), then alkylate with iodoacetamide to prevent reformation [28]. | |
| General Sample Quality | Poor band resolution, wide peaks [30] | Sample contamination or matrix component buildup | Perform column/sample cleaning procedures; replace mobile phases frequently to prevent microbial growth in aqueous buffers [30]. |
| Inconsistent results between replicates [29] | Inaccurate protein quantification; improper sample storage | Use a consistent, reliable protein assay; ensure samples are stored at -80°C with minimal manipulation [29]. |
Advanced Troubleshooting: Poor Resolution
The diagram below outlines a systematic, top-down approach to diagnosing and resolving the common yet critical issue of poor resolution in downstream analyses like chromatography or gel electrophoresis.
Frequently Asked Questions (FAQs)
Q1: My protein yield is low after lysis. What are the main causes? Low yield is often due to inefficient tissue disruption. For solid tissues like skeletal muscle, mechanical homogenization (e.g., with a Polytron) is necessary first. If yields remain low, follow this with sonication to fully disrupt cellular membranes. Also, ensure your lysis buffer contains appropriate detergents to solubilize your target proteins, especially if they are membrane-bound [29].
Q2: How can I protect my protein sample from degradation during preparation? Immediately after collection, wash tissue samples in an ice-cold, neutral-pH buffer, snap-freeze in liquid nitrogen, and store at -80°C. Most critically, you must add protease and phosphatase inhibitors to your lysis buffer to inactivate endogenous enzymes released during cell disruption. Avoid multiple freeze-thaw cycles [28] [29].
Q3: What is the purpose of reduction and alkylation, and when should I perform these steps? Reduction uses agents like DTT or TCEP to break disulfide bonds, fully unfolding the protein. Alkylation (e.g., with iodoacetamide) then permanently blocks the free cysteine sulfhydryl groups, preventing disulfide bonds from re-forming. This is a critical step after denaturation and before enzymatic digestion (for MS) or gel electrophoresis to ensure complete protein unfolding and accurate molecular weight analysis [28].
Q4: Why is my sample too complex, and how can I simplify it? Biological samples like serum or cell lysates contain a vast dynamic range of protein abundances, where high-abundance proteins can mask the detection of low-abundance ones. To simplify, use depletion strategies (e.g., immunoaffinity columns) to remove common highly abundant proteins. Alternatively, employ enrichment techniques to isolate your proteins of interest based on subcellular location or specific post-translational modifications like phosphorylation [28].
Q5: I see vertical streaking or smearing on my Western blot. What went wrong? This is frequently a sign of incomplete sample preparation. The most common causes are inefficient denaturation, incomplete reduction of disulfide bonds, or failure to properly alkylate cysteine residues. Ensure you are using fresh, effective reducing agents and that the alkylation step is performed correctly and completely [28].
The Scientist's Toolkit: Essential Reagents and Materials
The following table lists key reagents used in protein sample preparation, along with their specific functions.
| Reagent/Material | Primary Function | Key Considerations & Examples |
|---|---|---|
| Protease/Phosphatase Inhibitors | Protect proteins from degradation and artifactual modification by endogenous enzymes released during lysis [28] [29]. | Essential for all preparations. Added directly to the lysis buffer. |
| Detergents (e.g., Triton X-100, SDS) | Solubilize proteins by disrupting lipid-lipid and lipid-protein interactions. SDS coats proteins with negative charge [29]. | Ionic (SDS) for full denaturation; non-ionic (Triton) for native proteins. Choice depends on downstream application. |
| Chaotropic Agents (e.g., Urea) | Denature proteins by disrupting hydrogen bonds and hydrophobic interactions [28]. | Commonly used in in-solution digestion for mass spectrometry (e.g., 8M urea). |
| Reducing Agents (e.g., DTT, TCEP) | Break disulfide bonds between cysteine residues to fully unfold proteins [28] [29]. | TCEP is often more stable and effective than DTT. A critical step before alkylation. |
| Alkylating Agents (e.g., Iodoacetamide) | Irreversibly modify free cysteine sulfhydryl groups to prevent reformation of disulfide bonds [28]. | Must be performed after reduction, typically in the dark. |
| Buffering Agents | Maintain a stable pH (typically 7-9) to ensure protein solubility and prevent precipitation [29]. | pH should be proximate to the protein's isoelectric point. |
| Enzymes (e.g., Trypsin) | Digest proteins into peptides for mass spectrometric analysis by hydrolytically cleaving peptide bonds [28]. | Used after denaturation, reduction, and alkylation in "Bottom-Up" proteomics workflows. |
Selecting the Ideal Gel Percentage Based on Target Protein Size
For researchers in drug development and molecular biology, achieving complete protein separation is a fundamental step in experiments ranging from purity checks to western blotting. A primary cause of poor band resolution and incomplete separation is the selection of an inappropriate gel concentration. The polyacrylamide gel acts as a molecular sieve; its concentration must be meticulously matched to the molecular weight of the target proteins to obtain sharp, well-resolved bands. This guide provides a detailed framework for selecting gel percentages, accompanied by proven protocols and troubleshooting advice, to overcome the challenge of poor band resolution in protein research.
Gel Percentage Selection Guide
The following table provides recommended polyacrylamide gel percentages for optimal separation of proteins based on their molecular weight.
| Protein Size Range | Recommended Gel Percentage |
|---|---|
| >200 kDa | 4-6% [31] |
| 50 - 200 kDa | 8% [31] |
| 15 - 100 kDa | 10% [31] |
| 10 - 70 kDa | 12.5% [31] |
| 12 - 45 kDa | 15% [31] |
| 4 - 40 kDa | Up to 20% [31] |
For a broader separation range, especially when analyzing multiple unknown proteins or proteins with widely varying sizes, gradient gels are highly recommended. A gradient gel, such as one with 4-20% acrylamide, can resolve proteins from 10-200 kDa on a single gel, preventing the need to run multiple gels [31] [32].
Standard SDS-PAGE Protocol
This protocol details the steps for running a denaturing SDS-Polyacrylamide Gel Electrophoresis (SDS-PAGE) to separate proteins by molecular weight [32].
Reagents Required
- Protein samples
- Acrylamide gel (pre-cast or freshly prepared)
- SDS-PAGE Running Buffer (e.g., 10X Tris-Glycine-SDS)
- Laemmli-style 2X Sample Buffer
- Reducing agent (e.g., β-mercaptoethanol (BME) or Dithiothreitol (DTT))
- Protein Molecular Weight (MW) Standards
Procedure
- Gel Preparation: Place your chosen percentage gel or gradient gel into the electrophoresis chamber [32].
- Running Buffer: Prepare 1X SDS-PAGE Running Buffer from a 10X stock solution [32].
- Sample Preparation:
- Mix protein sample with an equal volume of 2X Sample Buffer [32].
- For reduced samples, add a reducing agent like BME to a final concentration of 0.55M [32].
- Heat denature the samples at 85-95°C for 2-5 minutes to fully unfold the proteins [33] [32].
- Centrifuge samples for 3 minutes to pellet any debris [32].
- Loading and Running:
- Post-Run Analysis: Turn off the power, remove the gel, and proceed with staining (e.g., Coomassie Brilliant Blue) or western blotting [34] [32].
Troubleshooting Common Issues
Why are my protein bands smeared?
- Cause: Running the gel at too high a voltage can generate excessive heat, leading to band smearing [35] [5].
- Solution: Run the gel at a lower voltage (e.g., 10-15 V/cm) for a longer duration to reduce heat production and improve band sharpness [35].
Why is the separation of my protein bands poor?
- Cause: The gel percentage may be inappropriate for your target protein size, or the gel may not have been run long enough [5].
- Solution:
Why do I see a "smiling" effect (curved bands)?
- Cause: Uneven heating across the gel causes the center to run warmer and faster than the edges, creating curved bands [35] [5].
- Solution: Run the gel at a lower voltage to minimize heat generation. Performing the run in a cold room or using a cooling apparatus can also help [35].
Why did my samples run off the gel?
- Cause: The gel was run for too long, causing proteins, particularly low molecular weight ones, to migrate off the bottom [35].
- Solution: Stop the electrophoresis as soon as the dye front reaches the bottom of the gel. For high molecular weight targets, you may run slightly longer, but monitor carefully [35].
The Scientist's Toolkit: Essential Research Reagents
| Reagent | Function |
|---|---|
| Acrylamide/Bis-acrylamide | Forms the cross-linked polymer matrix that acts as a molecular sieve for separation [31]. |
| SDS (Sodium Dodecyl Sulfate) | An ionic detergent that denatures proteins and confers a uniform negative charge, allowing separation based primarily on size [32]. |
| Reducing Agents (BME, DTT) | Break disulfide bonds in proteins to ensure complete unfolding and accurate molecular weight determination [33] [32]. |
| TEMED & Ammonium Persulfate (APS) | Catalyze the polymerization reaction of acrylamide to form the gel [31] [5]. |
| Tris-Glycine-SDS Running Buffer | Maintains pH and provides ions necessary to conduct current through the gel during electrophoresis [32]. |
| Coomassie Brilliant Blue | A dye used to stain and visualize proteins on the gel after electrophoresis [34]. |
Workflow for Gel Selection and Troubleshooting
The diagram below outlines a logical workflow to guide your experimental setup and problem-solving.
Frequently Asked Questions (FAQs)
What is the key advantage of using a gradient gel?
Gradient gels provide two major advantages: they can resolve a much broader range of protein sizes on a single gel, and they produce sharper bands because the leading edge of a protein band enters a higher % gel and slows down before the trailing edge, causing the band to "stack" and become more defined [31].
My samples contain high salt concentrations. How will this affect my gel?
High salt increases the conductivity of the sample, which can lead to distorted migration patterns and gel artifacts. To resolve this, dialyze your samples, precipitate and resuspend them in a low-salt buffer, or use a desalting column before loading the gel [33] [5].
I see a band at ~67 kDa in my reduced samples. Is this real?
A band at approximately 67 kDa in reduced samples is often an artifact from an excess of the reducing agent β-mercaptoethanol. This can be eliminated by adding iodoacetamide to the equilibration buffer [5].
This technical support guide provides a systematic framework for optimizing electrophoresis parameters to resolve incomplete protein separation and poor band resolution. For researchers in drug development, achieving precise and reproducible results is critical for accurate data interpretation in downstream applications. The following troubleshooting guides and FAQs address specific, high-impact experimental challenges related to voltage, temperature, and time, providing detailed methodologies and quantitative data to enhance experimental precision.
Troubleshooting Guides
Guide 1: Optimizing Band Resolution
Problem Statement: Poorly separated bands, characterized by closely stacked bands that are difficult to differentiate [36].
Optimization Parameters:
- Primary Factor: Gel concentration is the single most important factor for resolution [37]. An incorrect pore size will prevent optimal separation.
- Secondary Factors: Sample volume and applied voltage significantly influence band sharpness and separation efficiency [38].
Step-by-Step Optimization Protocol:
- Select Gel Concentration: Choose a gel percentage optimized for your target protein size range. Higher percentage gels (e.g., 15% acrylamide) are better for lower molecular weight proteins, while lower percentages (e.g., 8-10%) are better for high molecular weight proteins [39].
- Optimize Sample Load: Do not overload wells. A general recommendation is to load 0.1–0.2 μg of sample per millimeter of a gel well's width [36]. Overloading causes thick, fused bands and smearing.
- Program Voltage Correctly: Start with a low voltage (e.g., 80V for SDS-PAGE) to allow samples to concentrate into sharp bands as they enter the separating gel. Once entered, increase the voltage to 120V to complete the separation [38].
- Determine Optimal Run Time: Use the migration of the dye front as an indicator. For standard 10-12% gels, 80-90 minutes is typically adequate. For higher percentage gels like 15%, extend the run time slightly [38].
Data Presentation: Agarose Gel Percentage Selection This table provides guidance for DNA separation; analogous principles apply for protein gels with different percentages.
| Agarose Gel Percentage | Effective Separation Range (for DNA) |
|---|---|
| 0.5% | 2,000 – 50,000 bp |
| 1.0% | 400 – 8,000 bp |
| 1.5% | 200 – 3,000 bp |
| 2.0% | 100 – 2,000 bp |
Guide 2: Resolving Band Distortion and "Smiling"
Problem Statement: Distorted, non-linear bands where samples in center lanes migrate faster ("smiling") or slower than those on the edges [37].
Root Cause: Uneven heat distribution (Joule heating) across the gel during electrophoresis [41] [37].
Step-by-Step Resolution Protocol:
- Reduce Voltage: Running the gel at a lower voltage is the most direct way to minimize Joule heating. A general guideline is 5-10 V per cm of distance between electrodes [42]. For large DNA fragments (>1.5 kb), lower voltages provide better resolution [42].
- Use Constant Current Mode: If available, use a power supply with a constant current mode, which helps maintain a more uniform temperature [37].
- Ensure Proper Buffer Levels: Confirm the gel is fully submerged in running buffer with 3–5 mm of buffer covering its surface. Insufficient buffer can cause overheating and band distortion [41].
- Check Setup: Verify the gel is properly aligned, electrodes are straight and secure, and that the buffer is fresh [37].
Frequently Asked Questions (FAQs)
FAQ 1: What is the single most important factor for improving band resolution in gel electrophoresis?
The gel concentration is the most critical factor [37]. Selecting a gel with a pore size optimized for the size range of the molecules being separated is fundamental for achieving sharp, well-resolved bands. Using an incorrect gel percentage will lead to poor separation regardless of other optimized parameters.
FAQ 2: My gel shows smeared bands. What are the primary causes and solutions?
Smeared bands indicate molecules of varying sizes and can be caused by several factors [36] [37]:
- Sample Degradation: Handle samples gently, use nuclease-free reagents, and keep samples on ice to prevent degradation.
- Excessive Voltage: Run the gel at a lower voltage for a longer duration to reduce heating-induced denaturation and smearing.
- Incorrect Gel Type: For single-stranded nucleic acids (e.g., RNA) or proteins, ensure you are using a denaturing gel system. For double-stranded DNA, avoid denaturing conditions.
- Sample Overloading: Load less sample per well, following the guideline of 0.1–0.2 μg per millimeter of well width [36].
FAQ 3: How can I rapidly determine the optimal temperature for a sensitive electrophoresis assay?
A temperature-controlled on-chip capillary electrophoresis (CE) device can be used for high-speed, repetitive optimization [43]. The process involves:
- Programming consecutive run-to-run CE operations on a single device by switching electric fields.
- Executing a series of electrophoretic separations at different running temperatures.
- Analyzing the data to identify the temperature that provides optimal separation, such as for discriminating a single-base substitution in DNA. This method can execute a single run for one temperature condition within 4 minutes [43].
FAQ 4: Why are there no bands visible on my gel after the run?
The absence of bands indicates a failure at a fundamental step [36] [37]:
- Sample Issues: The sample may have been degraded during preparation or was of insufficient concentration. Re-check sample preparation and handling.
- Staining Error: The staining agent may have been prepared incorrectly, or the staining duration was too short. Prepare fresh stain and optimize the staining time.
- Electrophoresis Setup Failure: The power supply may not have been on, electrodes were connected incorrectly, or a short circuit occurred. Always verify all connections and use a DNA or protein ladder to confirm the run was successful.
The Scientist's Toolkit: Research Reagent Solutions
| Item | Function |
|---|---|
| TAE Buffer | Running buffer ideal for longer DNA fragments (>1 kb) and is compatible with enzymatic reactions post-electrophoresis. Not suitable for very long runs. [41] |
| TBE Buffer | Running buffer with higher ionic strength, providing better separation of small DNA fragments and suitability for longer run times. Not recommended for enzymatic steps. [41] |
| Sample Loading Dye | Contains a visible dye to track migration and a high percentage of glycerol to make the sample sink into the well, preventing diffusion into the running buffer. [41] |
| DNA Ladder | A mix of DNA fragments of known sizes, essential for sizing experimental samples and confirming the electrophoresis run was successful. [41] |
| Hydroxyethyl Cellulose (HEC) | A polymer used as a sieving matrix in capillary electrophoresis for separation of biomolecules like DNA and proteins. [43] |
| SYBR Gold Nucleic Acid Gel Stain | A highly sensitive fluorescent stain for detecting nucleic acids; requires as little as 1 ng of DNA per band to be visible. [41] |
Experimental Workflow and Optimization Pathways
Diagram Title: Electrophoresis Troubleshooting Workflow
This workflow outlines a systematic approach for diagnosing and resolving common electrophoresis issues. Begin by checking the most critical parameters like gel concentration and sample volume. Based on the specific artifact observed (e.g., smiled, smeared, or faint bands), follow the targeted solutions to restore optimal separation and band clarity.
Troubleshooting Guides
Guide 1: Troubleshooting Poor Nuclear Protein Localization
Problem: Protein of interest fails to localize to the nucleus, disrupting DNA damage repair (DDR) studies.
Question: Why is my protein not localizing to the nucleus despite having a predicted nuclear localization signal?
Answer: Incomplete nuclear import can often be traced to disrupted interactions with the nuclear transport machinery. Valosin-containing protein (VCP), for instance, is synthesized in the cytoplasm and must be translocated to the nucleus to participate in DDR. This process is directly mediated by the import receptor KPNB1 (karyopherin β1). A failure in this translocation can halt DDR pathways [44].
Solution:
- Verify KPNB1 Interaction: Confirm that your protein directly interacts with KPNB1 using co-immunoprecipitation assays.
- Inhibit KPNB1 Functionally: Use the tool compound Withaferin A (WA), which covalently binds to CYS 158 on KPNB1, to disrupt its function and experimentally block nuclear import. This serves as a good positive control for your import assay [44].
- Check for Dominant-Negative Mutants: Consider using dominant-negative constructs of key nuclear transport proteins to confirm the specificity of the import pathway.
Prevention: Always include a positive control (e.g., a known nuclear protein like p53) in your localization experiments to ensure your assay conditions are functioning correctly.
Guide 2: Troubleshooting Membrane Protein Aggregation
Problem: Membrane proteins aggregate during extraction or purification, leading to loss of function and unreliable data.
Question: How can I prevent my membrane protein from aggregating in solution?
Answer: Membrane proteins are prone to aggregation because their large hydrophobic surfaces are exposed upon removal from their native lipid environment. Proteins like endophilin B1, which peripherally associate with membranes, can exhibit tremendous conformational flexibility, making them particularly susceptible to non-native interactions [45] [46].
Solution:
- Use Lipid Mimetics: Incorporate lipid bicelles or nanodiscs during purification. These mimics provide a more native membrane-like environment, stabilizing the protein's structure and preventing exposed hydrophobic patches from causing aggregation. Studies on endophilin B1 have successfully used nanodiscs to achieve high-resolution structural data [46].
- Optimize Detergent Screen: Systematically test different detergents (e.g., DDM, LMNG, OG) to identify the one that best stabilizes your specific membrane protein.
- Include Lipids: Add specific lipids to your purification buffers. For example, the presence of cardiolipin was crucial for stabilizing the membrane association of endophilin B1 [46].
- Utilize Stabilizing Additives: Include excipients like sugars (sucrose) and polyols in your formulation buffer to help stabilize the protein's native conformation [47].
Prevention: Maintain a high concentration of detergent or lipid throughout the purification process and avoid drastic changes in buffer conditions, such as rapid dilution.
Guide 3: Troubleshooting Aggregation-Prone Proteins in Formulation
Problem: Therapeutic proteins or enzymes aggregate in storage buffer, reducing efficacy and increasing immunogenicity risk.
Question: What strategies can I use to stabilize an aggregation-prone protein in formulation?
Answer: Protein aggregation is a complex process that can proceed through different mechanisms, including the reversible association of native monomers, aggregation of conformationally altered monomers, or aggregation driven by chemical modifications [48]. These aggregates can trigger deleterious immune responses in patients [49].
Solution:
- Excipient Screening: Test a standard panel of stabilizers, including sugars (e.g., sucrose), polyols (e.g., sorbitol), and surfactants (e.g., polysorbates). These can occupy the protein's hydration sphere, increasing conformational stability and preventing surface-induced unfolding [47].
- Optimize Physicochemical Conditions: Fine-tune the buffer's pH and ionic strength to find the condition where the protein is most stable and least prone to aggregation [47] [48].
- Leverage Computational Prediction: Use advanced algorithms like catGRANULE 2.0 to predict a protein's intrinsic propensity for phase separation and aggregation. This tool can analyze protein sequences and AlphaFold2-derived structural features to identify aggregation-prone regions at single-amino-acid resolution, allowing for informed mutagenesis or formulation design [50].
- Mitigate Mechanical Stress: Minimize physical stresses during manufacturing, such as agitation, shear forces from mixing and pumping, and interfacial surface tension [47].
Prevention: Conduct developability assessments as early as possible in the candidate selection process to identify potential aggregation risks before they become major roadblocks [47].
Frequently Asked Questions (FAQs)
FAQ 1: My Western blot shows poor band resolution for a low-abundance nuclear protein. How can I improve the signal without buying more antibody?
Answer: The recently developed Sheet Protector (SP) Strategy can drastically reduce antibody consumption while maintaining sensitivity. This method uses a common stationery sheet protector to create a thin, evenly distributed layer of antibody solution over the nitrocellulose membrane.
- Protocol: After blocking, briefly wash and semi-dry your membrane. Place it on a sheet protector leaflet, apply a small volume of antibody solution (20–150 µL for a mini-gel), and gently overlay with the top leaflet. The surface tension creates a uniform layer. Incubate at room temperature without agitation [51].
- Key Advantage: This method uses 100-500 times less antibody than conventional methods (which typically require 10 mL) and can reduce incubation time from hours to minutes [51].
FAQ 2: How do I experimentally confirm that a specific protein undergoes liquid-liquid phase separation (LLPS) in cells?
Answer: A combination of computational prediction and experimental validation is most effective.
- Computational Prediction: Use tools like catGRANULE 2.0 ROBOT to first assess your protein's LLPS propensity. This algorithm integrates physicochemical properties and AlphaFold-derived structural features to provide a reliable prediction and can even model the effect of specific mutations [50].
- Experimental Validation: Follow up with live-cell imaging. Transfert cells with a fluorescently tagged version of your protein and observe for the formation of dynamic, spherical droplets under conditions known to induce LLPS (e.g., osmotic stress). Key confirmatory tests include demonstrating reversibility (droplets dissolve upon removing the stress) and fusion of smaller droplets into larger ones over time [50].
FAQ 3: Are the strategies to prevent aggregation the same for new therapeutic modalities like bispecific antibodies or viral vectors?
Answer: While the goal of achieving stability is the same, the strategies often need customization. New modalities present unique challenges:
- Bispecific Antibodies & ADCs: These complex molecules have stability issues that don't always follow the rules for standard antibodies and may require specialized excipient screens [47].
- mRNA & LNPs: Stability is threatened by nucleases, requiring protective delivery systems like lipid nanoparticles (LNPs), which have their own distinct aggregation and stability concerns [47].
- Viral Vectors: These must maintain structural integrity to remain infectious, a different stability challenge compared to a monoclonal antibody [47]. The formulation strategies must be tailored to the unique structure and chemistry of each modality.
Data Presentation
Table 1: Quantitative Comparison of Western Blot Antibody Probing Methods
| Parameter | Conventional Method | Sheet Protector (SP) Strategy |
|---|---|---|
| Antibody Volume | ~10,000 µL | 20-150 µL [51] |
| Incubation Time | Overnight (18 hours) | As little as 15 minutes to 2 hours [51] |
| Incubation Temperature | 4°C | Room Temperature [51] |
| Agitation Required? | Yes (on a rocker) | No [51] |
| Reported Sensitivity & Specificity | Standard | Comparable to conventional method [51] |
Table 2: Key Research Reagent Solutions for Problematic Protein Studies
| Reagent / Tool | Function / Application | Key Detail / |
|---|---|---|
| Withaferin A (WA) | Tool compound to inhibit nuclear import via KPNB1. | Covalently binds to CYS 158 of KPNB1; useful for studying DNA damage repair [44]. |
| Lipid Nanodiscs / Bicelles | Membrane mimics for stabilizing membrane proteins during structural studies. | Provides a native-like lipid environment; used to resolve cryo-EM structure of endophilin B1 [46]. |
| catGRANULE 2.0 ROBOT | Algorithm to predict Liquid-Liquid Phase Separation (LLPS) propensity. | Uses sequence/structural features & AlphaFold2 models; predicts mutation effects [50]. |
| Sheet Protector | Common stationery for low-volume Western blot antibody incubation. | Enables drastic antibody reduction by creating a thin liquid layer over the membrane [51]. |
| MSP2N2 | Membrane scaffolding protein used to form nanodiscs. | Used to create a defined lipid bilayer platform for studying peripheral membrane proteins [46]. |
Experimental Protocols
Protocol 1: Disrupting Nuclear Import with Withaferin A
This protocol is adapted from research investigating VCP nuclear translocation [44].
- Cell Culture & Treatment: Seed your cancer cell lines (e.g., anaplastic thyroid carcinoma lines like C643) in appropriate media.
- Compound Application: Treat cells with Withaferin A (WA). The cited study found an IC50 of approximately 0.5 μM across multiple ATC cell lines.
- Incubation: Incubate for a desired period (e.g., 24 hours) to allow the compound to covalently bind KPNB1 and inhibit its function.
- Analysis:
- Immunofluorescence: Fix and stain cells for your protein of interest (e.g., VCP) and a nuclear marker (e.g., DAPI). Compare the nuclear fluorescence intensity between treated and untreated cells.
- Cell Fractionation: Perform cytoplasmic and nuclear fractionation, followed by Western blotting to quantify the distribution of your target protein.
- Validation: The specificity of WA for KPNB1 can be confirmed using cellular thermal shift assays (CETSA) or drug affinity responsive target stability (DARTS) assays [44].
Protocol 2: Sheet Protector (SP) Western Blot Method
This protocol details the antibody incubation step using the SP strategy [51].
- Standard Procedures: Perform protein extraction, SDS-PAGE, and membrane transfer using your standard protocols.
- Blocking: Block the nitrocellulose (NC) membrane with 5% skim milk in TBST for 1 hour.
- Prepare Membrane: Briefly immerse the blocked membrane in TBST to wash off excess milk. Thoroughly blot the membrane with a paper towel to absorb residual moisture. The membrane should be semi-dry.
- Apply Antibody:
- Place the membrane on a leaflet of a cropped sheet protector.
- Apply a small volume of primary antibody (diluted in blocking buffer) directly onto the membrane. The recommended volume is 20-150 µL for a mini-gel.
- Gently place the upper leaflet of the sheet protector over the membrane. The antibody solution will disperse by surface tension to form a thin layer.
- Incubate: Incubate the SP "unit" at room temperature. For incubations over 2 hours, place the unit on a wet paper towel inside a sealed zipper bag to prevent evaporation.
- Wash and Detect: After incubation, remove the membrane and perform standard wash steps. Proceed with secondary antibody incubation and detection as usual.
Pathway and Workflow Visualizations
Title: WA Blocks VCP Nuclear Import via KPNB1
Title: Protein Aggregation Pathways
Title: SP Western Blot Workflow
Frequently Asked Questions (FAQs)
FAQ 1: What are the primary challenges when working with crude lysates in protein analysis? Crude lysates present several challenges for protein analysis. They contain a complex mixture of total cellular proteins, which can lead to high background noise and mask your protein of interest [52]. Furthermore, they often include cellular components like lipids, nucleic acids, and metabolites that can inhibit or interfere with downstream reactions like PCR or enzymatic assays [53] [54]. The key is to use affinity purification tags, such as polyhistidine or GST, to selectively capture your target protein from the crude lysate mixture [55].
FAQ 2: Why do I get poor band separation (poor resolution) on my SDS-PAGE gel when analyzing complex samples? Poor band separation on SDS-PAGE gels can stem from multiple factors related to your sample or the gel itself. Common causes include:
- Overloading the Gel: Loading too much protein causes bands to smear and merge [3] [56].
- Incomplete Denaturation: If proteins are not fully denatured, they may not migrate strictly by molecular weight [3].
- Incorrect Gel Percentage: Using a gel with an inappropriate polyacrylamide percentage for your protein's size prevents optimal separation—high percentages are needed for small proteins, and low percentages for large proteins [3] [56].
- Improper Electrophoresis Conditions: Running the gel at too high a voltage can generate excessive heat, leading to smiling bands and poor resolution [56].
FAQ 3: How can I prevent smearing in my protein gel? Protein smearing is often a result of protein degradation or aggregation. To prevent it:
- Ensure Proper Sample Preparation: Use fresh protease inhibitors and keep samples on ice to minimize proteolytic activity [3] [52].
- Avoid Overloading: Do not exceed the recommended protein load per well [56].
- Use Fresh Buffers: Overused or improperly formulated running buffers can hinder separation [3].
- Control Gel Temperature: Run the gel at a lower voltage or in a cold room to prevent heat-induced artifacts [3] [56].
FAQ 4: What methods can I use to overcome PCR inhibition in complex samples like crude lysates? PCR inhibition in complex samples can be mitigated through several optimization methods:
- Dilution of the Lysate: Simply diluting the sample can reduce the concentration of inhibitors [57].
- Additive Reagents: Including reagents like 5X AmpSolution can help counteract PCR inhibitors [57].
- Sample Purification: Using magnetic beads or spin-column purification to remove interfering substances from the lysate [57].
- pH Adjustment: For some lysis buffers, adjusting the pH can make the sample compatible with downstream reactions [57].
Troubleshooting Guides
Troubleshooting Poor Band Resolution in SDS-PAGE
Poorly separated or blurry bands make analysis difficult. The table below summarizes common issues and their solutions.
| Problem | Possible Cause | Troubleshooting Solution |
|---|---|---|
| Smeared Bands | Sample degradation [3] | Use fresh protease inhibitors; keep samples cold. |
| Too much protein loaded [3] [56] | Reduce the amount of protein loaded per well. | |
| Gel run at too high voltage [56] | Lower the voltage and extend the run time. | |
| Poor Separation (Bands too close) | Incorrect gel percentage [3] [56] | Use a higher % gel for small proteins; lower % for large proteins. |
| Insufficient run time [56] | Run the gel longer, until the dye front nears the bottom. | |
| Improperly prepared running buffer [56] | Prepare fresh running buffer with correct ion concentrations. | |
| 'Smiling' Bands (curved edges) | Gel overheating [56] | Run gel in a cold room or with an ice pack; use lower voltage. |
| No Bands/Blank Gel | Samples ran off the gel [56] | Stop the run before the dye front migrates off the gel. |
| Protein diffused from wells [56] | Minimize delay between loading and starting electrophoresis. |
Troubleshooting Issues with Crude Lysates
Problems with crude lysates often involve low yield, purity, or activity.
| Problem | Possible Cause | Troubleshooting Solution |
|---|---|---|
| Low Protein Yield | Inefficient cell lysis [55] | Optimize lysis method (sonication, French press, lysozyme, detergents). |
| Target protein in insoluble inclusion bodies [55] | Use denaturing conditions (e.g., urea, guanidine-HCl) for purification. | |
| Protease degradation [52] | Add a broader cocktail of protease inhibitors; work faster and colder. | |
| High Background (impurities) | Nonspecific binding to resin [55] | Increase salt or detergent concentration in wash buffers. |
| Insufficient washing [55] | Increase number or volume of wash steps. | |
| PCR Inhibition | Presence of inhibitors from cells [57] [54] | Dilute lysate, use inhibitor-resistant polymerases, or purify nucleic acids. |
Key Experimental Protocols
Rapid Purification of Polyhistidine-Tagged Proteins from Crude Lysate
This protocol uses magnetic affinity resin for quick purification under native or denaturing conditions [55].
Materials:
- MagneHis Ni-Particles (or similar magnetic resin)
- FastBreak Cell Lysis Reagent (or preferred lysis buffer)
- Binding/Wash Buffer (e.g., 50 mM phosphate, 300 mM NaCl, 10-20 mM imidazole, pH 8.0)
- Elution Buffer (e.g., Binding/Wash Buffer with 250-500 mM imidazole)
- Magnetic Separation Stand
- Imidazole solution
Method:
- Cell Lysis: Resuspend cell pellet in FastBreak Lysis Reagent. Mix thoroughly. For insoluble proteins, include a denaturant like 6M guanidine-HCl in the lysis buffer [55].
- Clarification: Pellet cellular debris by centrifugation. Transfer the supernatant (crude lysate) to a new tube.
- Binding: Add MagneHis Ni-Particles to the crude lysate. Incubate with mixing for 15-60 minutes to allow the polyhistidine-tagged protein to bind to the resin [55].
- Capture: Place the tube on a magnetic stand until the solution clears. Carefully pipette off and discard the supernatant.
- Washing: Remove the tube from the magnet. Resuspend the particles in Binding/Wash Buffer. Return the tube to the magnetic stand, clear, and discard the supernatant. Repeat this wash 2-3 times.
- Elution: Remove the tube from the magnet. Resuspend the particles in Elution Buffer. Incubate with mixing for 5-15 minutes. Place on the magnetic stand and transfer the eluate (containing your purified protein) to a new tube.
- Analysis: Analyze the eluate and crude lysate by SDS-PAGE to assess purity and yield [55].
Workflow for Handling Complex Viscous Samples
The following diagram outlines a logical decision pathway for processing complex, viscous samples to ensure success in downstream applications.
Complex Sample Processing Workflow
Research Reagent Solutions
The table below lists key reagents and materials essential for working with complex samples like crude lysates.
| Item | Function/Benefit |
|---|---|
| Affinity Purification Tags (e.g., Polyhistidine, GST) [55] | Allows for selective capture and purification of a recombinant protein from a crude lysate, significantly enhancing purity. |
| Magnetic Resins (e.g., MagneHis Ni-Particles) [55] | Enable rapid, high-throughput purification of tagged proteins without the need for multiple centrifugation steps. |
| FastBreak Cell Lysis Reagent [55] | A detergent-based reagent that provides efficient cell lysis for protein extraction. |
| Protease Inhibitor Cocktails | Added to lysis buffers to prevent proteolytic degradation of the target protein during and after cell disruption. |
| DNase I / RNase A | Enzymes used to digest nucleic acids and reduce sample viscosity, improving gel resolution and flow-through in columns [52]. |
| Imidazole | A competitive agent used in the wash and elution buffers during IMAC purification of polyhistidine-tagged proteins [55]. |
| Solid-Phase Extraction (SPE) Cartridges [53] | Used to preconcentrate analytes, remove salts, and clean up interfering substances from complex liquid samples. |
Diagnostic Troubleshooting for Common SDS-PAGE Resolution Problems
In protein-based research, from basic molecular biology to targeted drug development, the clarity of results from techniques like SDS-PAGE and Western blotting is paramount. The phenomenon of protein smearing represents a significant technical hurdle that can compromise data interpretation, lead to erroneous conclusions, and hinder research progress. Smearing manifests as diffuse, poorly resolved protein bands instead of sharp, discrete ones, indicating incomplete separation of proteins by molecular weight. Within the broader thesis of resolving incomplete protein separation and poor band resolution, understanding smearing is foundational. This guide provides a systematic, evidence-based approach to diagnosing and resolving the primary causes of protein smearing, enabling researchers to produce publication-quality data and accelerate discovery timelines.
FAQs: Diagnosing Your Smearing Problem
Q1: My protein bands appear as broad, diffuse smears rather than sharp lines. What is the most common cause?
Several factors can cause smearing, but the most prevalent ones fall into three categories:
- Voltage Issues: Running the gel at too high a voltage generates excessive heat, causing uneven migration and smeared bands [58]. A standard practice is to run gels at around 150V, but if smearing occurs, lowering the voltage and increasing the run time is recommended [58].
- Improper Sample Denaturation: If proteins are not completely linearized and coated with SDS, they will not migrate strictly by molecular weight. This can be due to insufficient boiling time, outdated or improperly prepared sample buffer, or allowing samples to cool slowly after denaturation [3].
- Protein Degradation: Endogenous proteases in the sample can partially digest proteins before and during electrophoresis, creating a heterogeneous mixture of protein fragments that appear as a smear [7]. This is prevented by using fresh protease inhibitors and maintaining samples on ice.
Q2: I see a "smiling" effect where bands curve upward at the edges, along with some smearing. What does this indicate?
This "smiling" pattern is a classic indicator of overheating during electrophoresis [58]. The heat generated by high current causes the gel to expand slightly, leading to faster migration in the warmer center than at the cooler edges. This uneven migration distorts band shape and can contribute to smearing. To resolve this, run the gel at a lower voltage for a longer time, use a cold room, or employ a gel apparatus with a cooling unit or ice pack [58] [59].
Q3: My samples look smeared even before I start the run, with material leaking from the wells. What went wrong?
This occurs when there is a significant delay between loading the samples and applying the electric current [58]. Without the electric field to focus the proteins into the gel matrix, they will diffuse haphazardly out of the wells. The solution is to minimize this time lag; start the electrophoresis run immediately after finishing your sample loads [58].
Troubleshooting Guide: Systematic Resolution of Smearing
To effectively troubleshoot, address these areas systematically. The following workflow outlines the primary diagnostic paths and their solutions.
Optimize Electrophoresis Conditions
Excessive heat is a major contributor to poor band resolution. The electric current naturally generates heat, and when uncontrolled, it causes bands to smear and distort.
- Lower Voltage and Extend Run Time: A standard practice is to run mini-gels at around 150V. If smearing occurs, reduce the voltage to 10-15 volts per cm of gel length and extend the run time accordingly [58]. This provides better resolution and minimizes heat buildup.
- Implement Active Cooling: Perform electrophoresis in a cold room (4°C) or use a gel apparatus designed with a cooling core. Alternatively, placing ice packs in or around the gel tank can effectively dissipate heat [58] [59].
Perfect Your Sample Preparation
Improperly prepared samples are a leading cause of smearing. Ensuring complete denaturation and preventing degradation is critical.
- Ensure Complete Denaturation: After adding your sample to the Laemmli (SDS) buffer, boil it for 5 minutes at 98°C to fully denature the proteins [3]. A key, often overlooked step is to immediately place the samples on ice after boiling to prevent gradual cooling and re-folding (renaturation) of the proteins [3].
- Prevent Proteolytic Degradation: Protein degradation by endogenous proteases creates a heterogeneous mixture that appears as a smear. Always add fresh protease inhibitor cocktails to your lysis buffer and keep samples on ice throughout preparation [59] [7]. To test for protease activity, heat one sample immediately and leave another at room temperature for several hours before heating and running both on a gel; increased smearing in the delayed-heat sample confirms proteolysis [7].
- Avoid Overloading: Loading too much protein causes over-saturation in the well and gel matrix, leading to poor resolution and smearing as proteins cannot separate effectively [3]. Validate the optimal protein load for your system and use the minimum amount required for detection.
Verify Gel and Buffer Integrity
The quality of the gel matrix and running buffer is fundamental to a successful experiment.
- Confirm Complete Gel Polymerization: Incompletely polymerized gels have a soft, uneven matrix that causes distorted bands and smearing. Ensure ammonium persulfate (APS) and TEMED are fresh and added in correct concentrations. Allow adequate time for complete polymerization before use [3].
- Use Fresh Electrophoresis Buffer: Overused or improperly formulated running buffer has incorrect ion concentration and pH, hindering proper current flow and protein mobility [58] [3]. For optimal results, make fresh running buffer before each run.
The following tables consolidate key experimental parameters and reagent information for troubleshooting and experimental planning.
Table 1: Troubleshooting Metrics for SDS-PAGE Smearing
| Parameter | Problematic Value/Issue | Optimal Value/Solution | Key Reference |
|---|---|---|---|
| Running Voltage | Too high (e.g., >150V for mini-gel) | 10-15 V/cm of gel; lower voltage for longer time | [58] |
| Sample Boiling | Incomplete denaturation | 5 minutes at 98°C, then immediately on ice | [3] |
| Protein Load | Overloading (>60 µg for crude samples) | Load minimum amount for detection; 0.5-4 µg for pure protein (Coomassie) | [7] |
| Buffer State | Overused or improperly formulated | Prepare fresh running buffer before each run | [3] |
| Protease Inhibition | Samples not protected | Use fresh protease inhibitor cocktail; keep samples on ice | [7] |
Table 2: Research Reagent Solutions for Optimal SDS-PAGE
| Reagent / Material | Critical Function | Troubleshooting Tip | |
|---|---|---|---|
| SDS (Sodium Dodecyl Sulfate) | Denatures proteins and confers uniform negative charge. | Ensure it is fresh; improper denaturation causes smearing. | |
| DTT or β-Mercaptoethanol | Reduces disulfide bonds to fully linearize proteins. | Use fresh stock; old reductants lose potency. | |
| TEMED & APS | Catalyzes and initiates gel polymerization. | Must be fresh for complete gel polymerization. | [3] |
| Tris-Glycine Running Buffer | Carries current and maintains pH during electrophoresis. | Make fresh to ensure correct ion concentration/pH. | [58] |
| Protease Inhibitor Cocktail | Inactivates endogenous proteases in samples. | Add fresh to lysis buffer to prevent protein degradation. | [7] |
| Polyacrylamide Gels | Acts as a molecular sieve to separate proteins by size. | Choose correct percentage for target protein size. | [3] |
Advanced Experimental Protocol: Validating Sample Integrity
To systematically rule out protein degradation as a cause of smearing, employ this controlled experimental protocol.
Objective: To determine if proteases in the sample are causing protein degradation and smearing.
Materials:
- Protein sample(s)
- 2X SDS-PAGE sample buffer (with β-mercaptoethanol or DTT)
- Heat block (98°C)
- Ice bucket
- Pre-cast or freshly poured polyacrylamide gel
- SDS-PAGE electrophoresis system
Method:
- Split Sample: Divide your protein sample into two equal-volume aliquots in separate tubes.
- Add Buffer: Add an equal volume of 2X SDS-PAGE sample buffer to each tube and mix thoroughly by pipetting.
- Differential Heat Treatment:
- Tube A (Immediate Heat): Place this tube immediately in a heat block set to 98°C for 5 minutes. Immediately after heating, transfer it to ice.
- Tube B (Delayed Heat): Leave this tube at room temperature (approx. 22-25°C) for 2-4 hours. Then, heat it at 98°C for 5 minutes and place on ice.
- Analysis: Centrifuge both tubes briefly to bring down condensation. Load equal volumes of Tube A and Tube B on the same SDS-PAGE gel. Run the gel and stain with Coomassie Blue or perform a Western blot.
Interpretation:
- If both Tube A and Tube B show identical, sharp bands, protease activity is not significant in your sample.
- If Tube B shows significant smearing, decreased intensity of full-length bands, or new lower molecular weight bands compared to Tube A, this confirms that proteases were active during the room temperature incubation and are a likely source of smearing in your standard protocol [7]. This validates the need for more rigorous use of protease inhibitors and faster sample processing.
FAQs: Troubleshooting Band Distortions
Q1: Why are my protein bands curved ("smiling")? This is typically caused by excessive heat generation during electrophoresis. High voltage can cause the gel to expand unevenly, leading to faster migration at the edges than in the center, which produces curved bands. To resolve this, run the gel at a lower voltage for a longer duration, use a cooling ice pack in the buffer chamber, or perform the electrophoresis in a cold room [60].
Q2: What causes distorted bands at the edges of my gel? This is known as the "edge effect." It occurs when the outermost wells of the gel are left empty, leading to an uneven electric field across the gel. This causes distorted migration in the lanes adjacent to the empty wells. The solution is to load all wells with samples. If you lack experimental samples, load these wells with protein ladder or a spare protein solution [60].
Q3: Why are my protein bands smeared or poorly separated? Poor band separation can stem from several issues [3] [60]:
- Improper Sample Preparation: Incomplete denaturation of proteins can cause irregular migration. Ensure your sample buffer contains adequate SDS and DTT, and that boiling time is sufficient (commonly 5 minutes at 98°C). After boiling, immediately place samples on ice to prevent proteins from renaturing.
- Overloading the Gel: Loading too much protein causes aggregation and poor resolution. Use the minimum amount of protein required for detection.
- Incorrect Gel Percentage: The polyacrylamide percentage must be suitable for your target protein's size. Use lower percentage gels for high molecular weight proteins and higher percentage gels for low molecular weight proteins [3].
- Old or Improper Buffers: Overused or incorrectly formulated running buffers can hinder proper current flow and protein separation. Prepare fresh buffers before each run.
Q4: Why do my samples migrate out of the wells before the run starts? This happens due to diffusion if there is a significant delay between loading the samples and applying the electric current. To prevent this, start the electrophoresis run immediately after finishing sample loading [60].
Troubleshooting Guide: Band Distortion Issues and Solutions
The table below summarizes common problems, their causes, and proven corrective actions.
| Problem | Primary Cause | Corrective Action |
|---|---|---|
| Smiling Bands | Excessive heat during electrophoresis [60] | Run gel at lower voltage for longer time; use cooling ice pack or cold room [3] [60]. |
| Edge Effects (Distorted Peripheral Lanes) | Empty wells at the edges of the gel [60] | Load all wells; use ladder or spare protein in unused wells [60]. |
| Smeared Bands / Poor Separation | Incomplete protein denaturation [3] | Ensure correct SDS/DTT concentration; boil samples for ~5 min at 98°C, then cool immediately on ice [3]. |
| Too much protein loaded [3] [60] | Load the minimum amount of protein required for detection [3]. | |
| Incorrect gel percentage [3] | Use low % gel for high MW proteins; high % gel for low MW proteins [3]. | |
| Overused or improper running buffer [3] | Make fresh electrophoresis buffer [3]. | |
| Bands Migrating Too Fast | Running buffer too diluted or voltage too high [60] | Use running buffer with correct salt concentration; run gel at standard voltage (~150V) [60]. |
| Sample Diffusion from Wells | Delay between loading and running [60] | Start electrophoresis immediately after loading samples [60]. |
Experimental Protocol: Resolving Incomplete Protein Separation
This protocol provides a systematic methodology for troubleshooting and correcting poor band resolution, a critical step for accurate analysis in protein research.
1. Sample Preparation (Denaturation)
- Prepare sample with denaturing loading buffer containing SDS and a reducing agent like DTT [3].
- Heat denature samples at 98°C for 5 minutes to ensure complete linearization of proteins [3].
- Critical Step: Immediately after boiling, place samples on ice to prevent gradual cooling and protein renaturation [3].
2. Gel Preparation and Loading
- Ensure the polyacrylamide gel has polymerized completely. Incomplete polymerization, often due to old reagents or missing TEMED, will ruin separation [3].
- Choose the appropriate gel percentage based on the molecular weight of your target proteins. For example, use a 8-10% gel for standard proteins, a lower percentage (e.g., 6-8%) for high MW proteins, and a higher percentage (e.g., 12-15%) for low MW proteins [3].
- Load the optimal amount of protein. Validate the amount for each protein-antibody pair to avoid overloading, which causes smearing, or underloading, which yields faint bands [3] [60].
- Critical Step: Do not leave any wells empty to prevent the edge effect. Load ladder or buffer in unused wells [60].
3. Electrophoresis Parameters
- Use fresh running buffer formulated with the correct ion concentrations to ensure proper current flow and pH maintenance [3].
- Run the gel at an appropriate voltage. A standard is ~150V. If smiling or overheating occurs, reduce the voltage and extend the run time [60].
- Critical Step: Employ cooling methods. Place the gel apparatus in a cold room or use a gel-running apparatus with a built-in cooling unit to manage heat [3] [60].
4. Post-Run Analysis
- Stop the electrophoresis when the dye front is near the bottom of the gel. Over-running can cause proteins, especially low molecular weight ones, to migrate off the gel [60].
Workflow for Diagnosing Band Distortion
This diagram outlines a logical workflow for diagnosing and correcting common band distortion issues, guiding you from problem identification to solution.
Research Reagent Solutions for Optimal SDS-PAGE
This table details key materials and their specific functions for successful and distortion-free protein separation.
| Research Reagent / Material | Function in Experiment |
|---|---|
| SDS (Sodium Dodecyl Sulfate) | A denaturing detergent that linearizes proteins by breaking secondary/tertiary structures and coats them with a uniform negative charge, enabling separation primarily by molecular weight [3]. |
| Reducing Agent (e.g., DTT) | Disrupts disulfide bonds in proteins, further aiding in complete denaturation and unfolding, which is crucial for accurate molecular weight determination [3]. |
| Polyacrylamide Gel | Forms a crosslinked, mesh-like matrix that acts as a molecular sieve. The percentage of polyacrylamide determines pore size, controlling the migration rate of proteins based on their size [3]. |
| Fresh Electrophoresis Buffer | Provides the ions necessary to conduct electric current through the gel and maintains an optimal pH, both of which are critical for consistent and sharp band resolution [3] [60]. |
| TEMED | A catalyst that, along with ammonium persulfate (APS), initiates the radical polymerization reaction of acrylamide and bisacrylamide to form the polyacrylamide gel matrix. Its freshness is vital for complete gel polymerization [3]. |
FAQ: Why are my bands faint or absent, and how can I fix this?
A faint or absent signal on your Western blot is a common frustration, often stemming from issues at the stages of protein loading, transfer efficiency, or antibody detection. The table below summarizes the primary causes and their direct solutions.
| Primary Cause | Specific Reason | Recommended Solution |
|---|---|---|
| Insufficient Antigen | Protein not expressed at detectable levels or loaded in too small an amount [61] [62]. | Load more protein (e.g., 20–50 µg per lane); enrich for target via fractionation or immunoprecipitation [61] [63]. |
| Inefficient Transfer | Proteins, especially high MW, did not move from gel to membrane; low MW proteins passed through membrane [61] [13]. | Verify transfer by staining gel/membrane; for high MW, add 0.1% SDS to buffer; for low MW, use smaller pore size (0.22 µm) and reduce transfer time [61] [62]. |
| Suboptimal Antibody Conditions | Antibody concentration is too low, has lost activity, or is mismatched with secondary [13] [62] [63]. | Titrate antibodies for optimal concentration; test on a positive control; ensure correct host species for secondary antibody [61] [63]. |
| Epitope Masking | The blocking agent (e.g., milk) is physically blocking antibody access to the epitope [63]. | Switch blocking buffers (e.g., from milk to BSA), especially for phosphoproteins [61] [13]. |
| HRP Inhibition | Sodium azide, a common preservative, quenches Horseradish Peroxidase (HRP) activity [61] [13] [62]. | Use fresh, sodium azide-free buffers in all steps post-transfer [61]. |
| Weak Detection | The chemiluminescent substrate is expired or insufficiently sensitive for low-abundance targets [61] [13]. | Use a fresh, more sensitive ECL substrate; increase film exposure time [61] [62]. |
The Scientist's Toolkit: Essential Research Reagent Solutions
The correct preparation and selection of reagents are fundamental to preventing the issues outlined above. Below is a table of key materials and their critical functions.
| Reagent/Material | Function & Importance in Troubleshooting |
|---|---|
| Fresh Electrophoresis & Transfer Buffers | Ensures proper ion concentration for consistent current flow and protein migration. Overused or improperly formulated buffers hinder separation and transfer [3] [64]. |
| Protease Inhibitors | Added to lysis buffer to prevent protein degradation during sample preparation, which can cause band loss or smearing [61] [63]. |
| BSA Blocking Buffer | An alternative to milk; crucial for detecting phosphoproteins as milk contains phosphoprotein casein, which can cause high background [61] [13]. |
| Prestained Molecular Weight Marker | Allows visual tracking of electrophoresis and transfer progress, and helps estimate protein size [64] [13]. |
| High-Sensitivity ECL Substrate | Designed for detecting low-abundance proteins, generating a stronger and longer-lasting light signal than standard substrates [61] [13]. |
| PVDF Membrane (0.45 µm & 0.22 µm) | 0.45 µm is standard; 0.22 µm is essential for efficiently retaining low molecular weight proteins (<30 kDa) that might otherwise pass through [61] [62]. |
| Positive Control Lysate | A known sample containing your target protein. It is the most critical control for verifying that your entire protocol and antibodies are working correctly [61] [62]. |
Experimental Protocols for Diagnosis
When you encounter faint or no bands, follow these diagnostic steps to systematically identify the problem.
Verifying Protein Transfer Efficiency
Materials: Transferred membrane, Ponceau S stain or reversible protein stain kit, appropriate staining trays.
Method:
- After transfer, gently rinse the membrane with distilled water.
- Incubate the membrane in Ponceau S stain or a reversible protein stain for 5-10 minutes with gentle agitation [61] [62].
- Observe the membrane. Evenly stained lanes indicate successful transfer of total protein. The absence of stain where your samples were loaded suggests a transfer failure.
- Destain the membrane with water or the recommended buffer before proceeding to blocking. This check confirms whether your proteins are present on the membrane.
Troubleshooting Antibody Quality and Concentration
Materials: Primary antibody, secondary antibody, positive control lysate, blocking buffer, wash buffer.
Method:
- Perform a Dot Blot: Dilute your positive control lysate and dot 1-2 µL directly onto a small piece of activated membrane. Let it dry.
- Follow your standard protocol: block the membrane, then incubate with your primary antibody, wash, and incubate with your secondary antibody and detect [61].
- A strong signal confirms the antibodies are active. A weak signal suggests the antibody concentration needs optimization or the antibody has degraded.
- Titrate the Antibody: Using your Western blot system, test a range of primary antibody concentrations (e.g., 1:500, 1:1000, 1:5000). The optimal dilution provides a strong specific signal with minimal background [61] [63]. Always consult the manufacturer's datasheet as a starting point.
Systematic Troubleshooting Pathway
This workflow provides a logical sequence of steps to diagnose and resolve the issue of faint or absent bands.
Troubleshooting Guides
Troubleshooting Guide for Small Proteins (<15 kDa)
Small proteins are prone to over-transfer and poor retention in gels, leading to loss through the membrane or poor resolution.
| Problem | Possible Cause | Recommended Solution |
|---|---|---|
| Weak or no signal | Protein passed through membrane pores [59] | Use a 0.2 µm pore size membrane instead of 0.45 µm [59] [27]. |
| Protein migrated too quickly [59] | Increase alcohol (methanol) and decrease SDS in transfer buffer to slow migration and improve membrane binding [59]. | |
| Insufficient binding to membrane [13] | Add 20% methanol to the transfer buffer to enhance protein binding to the membrane [13]. | |
| Poor band separation | Proteins co-migrate in gel [3] | Use a higher percentage polyacrylamide gel (e.g., 15-20%) for better size-based separation [3]. |
| Smiling bands or smearing | Gel overheated during electrophoresis [59] | Run the gel at a lower voltage for a longer time. Perform electrophoresis in a cold room or use ice packs [59] [3]. |
Troubleshooting Guide for Large Proteins (>150 kDa)
Large proteins often face issues with incomplete transfer from the gel to the membrane and inefficient entry into gel pores.
| Problem | Possible Cause | Recommended Solution |
|---|---|---|
| Incomplete or inefficient transfer | Protein trapped in gel [59] | Use a 0.45 µm pore size membrane [59]. Opt for wet transfer over semi-dry for better efficiency [59]. |
| Insufficient transfer force [59] [27] | Increase transfer time and/or voltage [27]. Add SDS (0.01-0.1%) to the transfer buffer to help elute proteins from the gel [59] [13]. | |
| Poor band separation & aggregation | Protein aggregation during prep [59] | Avoid boiling; incubate sample at 70°C for 10-20 min or 37°C for 30-60 min [59]. |
| Inefficient migration into gel [3] | Use a lower percentage polyacrylamide gel (e.g., 6-10%) with larger pores [3]. | |
| High background | Antibody concentration too high [13] | Decrease concentration of primary and/or secondary antibody [13]. |
Frequently Asked Questions (FAQs)
Q1: My protein ladder is smearing. What should I do? A: Smearing can result from several factors. Ensure you are not heating your protein ladder before loading, as they are typically ready-to-use [27]. Check that you are not loading too much protein, and verify that your gel has fully polymerized by ensuring all ingredients, especially TEMED, were fresh and added correctly [3] [27].
Q2: I see a "smiley face" pattern in my gel. What does this mean? A: A "smiley face" pattern, where bands curve upward at the edges, typically indicates that your gel overheated during electrophoresis [59]. To fix this, run the gel at a lower voltage, and use a cold room or ice packs in and around the gel box to dissipate heat [59] [3].
Q3: My transfer efficiency is poor. How can I confirm if my protein transferred successfully? A: Always confirm your transfer immediately after the process by using a reversible protein stain like Ponceau S on the membrane [59]. Alternatively, you can stain the gel post-transfer with a protein stain to see if the protein has been removed [13].
Q4: For very large complexes, what transfer conditions are best? A: For large protein complexes or very high molecular weight proteins, a wet transfer system is more efficient [59]. Use a long transfer time (e.g., overnight at low voltage) to ensure complete movement of the large proteins out of the gel [59]. Ensure the system is kept cool to prevent overheating.
Q5: How does gel percentage affect my protein of interest? A: The gel percentage determines the pore size of the polyacrylamide matrix [3].
- Low percentage gels (e.g., 8%) have larger pores, allowing large proteins to migrate more easily.
- High percentage gels (e.g., 15%) have smaller pores, providing a tighter mesh that is better for resolving small proteins. Choose a gel percentage where your protein of interest migrates to the middle of the gel for optimal resolution.
Experimental Protocols
Optimized Semi-Dry Transfer for Small Proteins
This protocol is designed to prevent small proteins (<15 kDa) from passing through the membrane.
- Gel Preparation: After electrophoresis, equilibrate the gel in transfer buffer for 5-10 minutes.
- Membrane Preparation: Use a 0.2 µm PVDF membrane. Activate it by soaking in 100% methanol for 1 minute, followed by equilibration in transfer buffer.
- Transfer Buffer Preparation: Prepare a standard Tris-Glycine transfer buffer. To improve retention of small proteins:
- Assembly: Assemble the transfer stack in the following order (cathode to anode):
- Cathode plate
- Filter pad soaked in transfer buffer
- Gel
- 0.2 µm PVDF Membrane
- Filter pad soaked in transfer buffer
- Anode plate Carefully roll out any air bubbles with a roller after each layer is added.
- Transfer Conditions: Transfer at a constant current of 0.5-1.0 mA per cm² of gel for 30-60 minutes. Keep the transfer unit cool by placing it on an ice pack or in a cold room.
Optimized Wet Transfer for Large Proteins
This protocol enhances the elution and transfer of large proteins (>150 kDa) from the gel.
- Gel Preparation: After electrophoresis, equilibrate the gel in transfer buffer for 10-15 minutes.
- Membrane Preparation: Use a 0.45 µm nitrocellulose or PVDF membrane. For PVDF, activate with methanol and equilibrate in buffer.
- Transfer Buffer Preparation: Prepare a standard Tris-Glycine buffer with 20% methanol. To aid the transfer of large proteins:
- Assembly: Assemble the gel and membrane into a cassette, ensuring no air bubbles are trapped. Place the cassette in the transfer tank so the membrane is between the gel and the anode.
- Transfer Conditions: For a standard mini-gel system, transfer at 100V (constant voltage) for 90 minutes or at 30V (constant voltage) overnight. To manage heat, run the transfer in a cold room or use a stir bar and cooling unit if available [59].
The Scientist's Toolkit: Research Reagent Solutions
| Item | Function & Application |
|---|---|
| 0.2 µm Pore Membrane | Prevents small proteins (<15 kDa) from passing through the membrane during transfer [59] [27]. |
| 0.45 µm Pore Membrane | Standard for most proteins; suitable for large proteins where over-transfer is not a concern [59]. |
| High-Percentage Gels (e.g., 15%) | Creates a tight gel matrix for optimal resolution of small proteins [3]. |
| Low-Percentage Gels (e.g., 6-8%) | Creates large pores for efficient migration and separation of large proteins [3]. |
| Methanol | In transfer buffer, it promotes protein binding to membranes but can shrink gel pores. Use higher concentrations (20%) for small proteins and standard (10-20%) for large proteins [59] [27]. |
| SDS in Transfer Buffer | Helps elute large proteins from the gel. Use at low concentrations (0.01-0.1%) for large proteins; avoid for small proteins [59] [13]. |
| Unstained Protein Ladder | Provides accurate molecular weight estimation as it is not affected by bound dyes that alter migration [59]. |
| Protease Inhibitor Cocktail | Added to lysis buffer to prevent protein degradation during sample preparation, preserving target protein integrity [59]. |
Workflow Visualization
Protein Resolution Troubleshooting Flow
Complete WB Workflow for Extreme MWs
Systematic Problem-Solving Flowchart for Rapid Diagnosis
Troubleshooting Guide: Poor Band Resolution in SDS-PAGE
This guide addresses the common and frustrating issue of poor protein band separation during SDS-PAGE electrophoresis, a critical first step in Western blotting that separates proteins by molecular weight [3].
Diagnostic Questions and Solutions
Why are my protein bands smeared or blurry? Smeared bands often indicate incomplete protein denaturation or excessive voltage during electrophoresis [3] [65].
- Solution: Ensure proper sample preparation by verifying SDS and DTT concentrations. Increase boiling time to 5 minutes at 98°C, then immediately place samples on ice to prevent renaturation [3].
- Solution: Run the gel at a lower voltage for a longer duration to prevent overheating that causes smearing [65].
Why are my bands poorly separated or overlapping? Poor separation results from insufficient run time, incorrect gel concentration, or improper buffer preparation [65].
- Solution: Run the gel until the dye front approaches the bottom, adjusting time for your target protein size [65].
- Solution: Match polyacrylamide percentage to protein size: use low-percentage gels for high molecular weight proteins and high-percentage gels for low molecular weight proteins [3].
- Solution: Prepare fresh running buffer to ensure proper ion concentration and pH [3].
Why do my bands show a "smiling" or "frowning" curved pattern? Curved bands indicate uneven heat distribution across the gel [37].
- Solution: Run gels at lower voltage or use constant current power supply [37].
- Solution: Perform electrophoresis in a cold room or use apparatus with cooling capability [3] [65].
Why do the outermost lanes of my gel show distorted bands? This "edge effect" occurs when peripheral wells are left empty [65].
- Solution: Load all wells with samples, ladder, or buffer to ensure even current flow [65].
Key Experimental Parameters for Optimal Band Resolution
The table below summarizes critical parameters for troubleshooting poor band separation.
| Parameter | Issue | Optimal Range/Solution | Effect on Separation |
|---|---|---|---|
| Sample Preparation [3] | Incomplete denaturation | 5 min at 98°C, then immediate ice placement | Prevents smearing; ensures linearized proteins |
| Gel Percentage [3] | Mismatched to protein size | Low % (e.g., 8%) for high MW proteins; High % (e.g., 15%) for low MW proteins | Creates appropriate pore size for molecular sieving |
| Voltage [65] [37] | Too high (smearing/overheating) | 10-15 V/cm; lower voltage for longer time | Reduces Joule heating, improves band sharpness |
| Run Time [65] | Too short | Until dye front is ~0.5-1 cm from bottom | Allows sufficient migration for separation |
| Protein Load [3] | Too much protein | Validate optimal load for each protein-antibody pair | Prevents aggregation and bleeding between lanes |
| Buffer Freshness [3] | Overused or improper formulation | Make fresh before each run or as frequently as possible | Ensures proper current flow and pH maintenance |
Detailed Experimental Protocol for SDS-PAGE
Sample Preparation Protocol
- Denaturation: Mix protein sample with denaturing loading buffer containing SDS and a reducing agent (e.g., DTT) [3].
- Boiling: Heat samples at 98°C for 5 minutes to linearize proteins [3].
- Cooling: Immediately transfer samples to ice to prevent protein renaturation. Do not allow gradual cooling [3].
Gel Electrophoresis Protocol
- Gel Preparation: Ensure polyacrylamide gel is fully polymerized. Verify TEMED and APS are fresh and added in correct concentrations [3].
- Loading: Load appropriate amount of protein determined through prior validation. Do not leave wells empty to prevent edge effects [3] [65].
- Electrophoresis Conditions: Use fresh running buffer. Run gel at 150V or lower depending on gel size. For standard mini-gels, 1-1.5 hours is typical [65].
- Temperature Control: Maintain cool gel temperature by running at lower voltage, using apparatus with cooling features, or performing in cold room [3] [65].
Diagnostic Flowchart for Poor Band Resolution
The Scientist's Toolkit: Essential Research Reagents
The table below lists key reagents and materials critical for successful SDS-PAGE protein separation.
| Reagent/Material | Function | Critical Considerations |
|---|---|---|
| SDS (Sodium Dodecyl Sulfate) [3] | Denatures proteins and imparts uniform negative charge | Ensures separation by molecular weight, not native structure |
| Polyacrylamide Gel [3] | Forms molecular sieve for protein separation | Percentage must match target protein size (low % for high MW) |
| DTT (Dithiothreitol) [3] | Reducing agent breaks disulfide bonds | Essential for complete protein unfolding and denaturation |
| TEMED [3] | Catalyzes polyacrylamide gel polymerization | Must be fresh for complete gel polymerization |
| Running Buffer [3] [65] | Carries current and maintains pH | Requires specific salt concentration; make fresh frequently |
| Pre-cast Gels [3] | Alternative to hand-casted gels | Ensure consistent quality and complete polymerization |
Principles of SDS-PAGE Separation
Proper SDS-PAGE separation requires proteins to be denatured into linear chains with uniform negative charge, allowing migration through the polyacrylamide matrix based primarily on molecular weight rather than native structure or charge [3].
Validation Frameworks and Technique Comparison for Separation Quality Assurance
In Western blotting, successful electrophoretic separation and efficient transfer of proteins from the gel to a membrane are foundational to obtaining reliable, interpretable results. Incomplete or uneven transfer can lead to weak signals, absent bands, or erroneous conclusions about protein size and abundance. This guide provides targeted troubleshooting and verification protocols to confirm separation efficacy and optimize protein transfer, directly addressing common pitfalls that compromise data quality in protein analysis.
Frequently Asked Questions
What are the primary methods for confirming protein transfer efficiency?
There are several quick and reliable methods to confirm proteins have been successfully transferred from your gel to the membrane before you proceed with costly antibody incubations.
- Ponceau S Staining: This reversible stain allows you to visualize the total protein pattern on the membrane immediately after transfer. The presence of many pink/red bands confirms successful transfer, and the pattern can help you assess the quality of separation and check for equal loading. The stain is then easily washed off with water or a mild buffer so you can proceed with blocking and immunodetection [66].
- Post-Transfer Gel Staining: After transfer, stain the polyacrylamide gel with a protein stain like Coomassie Brilliant Blue. If the gel is nearly blank, your transfer was efficient. If prominent blue sample bands remain, the transfer was incomplete and needs optimization (e.g., longer transfer time, different buffer conditions) [67].
- Pre-Stained Protein Ladder: Using a pre-stained molecular weight marker is one of the simplest visual controls. After transfer, the colored ladder bands should be clearly visible on the membrane and absent from the gel, confirming that proteins of various sizes have migrated out of the gel [67].
My high molecular weight proteins won't transfer. What should I do?
Large proteins (>100 kDa) can be difficult to elute from the gel matrix. To facilitate their transfer, you can modify your protocol to include SDS in the transfer buffer.
- Protocol: Pre-equilibrate the gel in 2X transfer buffer (without methanol) containing 0.02–0.04% SDS for 10 minutes before assembling the transfer sandwich. Then, perform the transfer using 1X transfer buffer containing methanol and a lower concentration of 0.01% SDS [68].
- Additional Adjustments: Consider decreasing the methanol concentration in your transfer buffer, as methanol can cause the gel to shrink and trap large proteins. For wet transfers, running at a lower voltage (e.g., 30V) overnight at 4°C can also improve the transfer of large proteins [69].
My low molecular weight proteins are faint or missing. How can I prevent this?
Small proteins (<25 kDa) can transfer so efficiently that they pass completely through the membrane, a phenomenon known as "blow-through."
- Reduce Transfer Time/Voltage: Shorten the duration or reduce the voltage/current of your transfer to prevent small proteins from passing through the membrane [68] [70].
- Optimize Membrane Pore Size: The standard 0.45 µm pore size membrane is too large to retain many small proteins. Switch to a membrane with a smaller pore size (0.2 µm) to better capture low molecular weight targets [68] [70].
- Use a Second Membrane: For critical experiments, you can insert a second membrane behind the first to capture any proteins that have passed through. If you detect your target on the second membrane, it confirms that your primary transfer conditions are too long or forceful [67].
I see uneven or "swirling" band patterns after transfer. What went wrong?
Swirling or diffuse bands are typically caused by poor physical contact between the gel and the membrane during transfer.
- Eliminate Air Bubbles: Ensure no air bubbles are trapped between the gel and membrane when assembling your transfer stack. Roll a glass pipette or roller firmly over each layer as you build the sandwich to create uniform contact [68] [69].
- Check Sandwich Compression: Both over-compression and under-compression of the transfer stack can cause problems. The stack should be held securely without exerting excess pressure, which can flatten the gel and distort transfer. If pads have lost resiliency, replace them [68].
Troubleshooting Guide: Staining and Transfer Verification
The table below summarizes common problems, their causes, and solutions for verifying and ensuring efficient protein transfer.
| Problem | Possible Cause | Verification Method & Solution |
|---|---|---|
| Weak/No Signal | Inefficient transfer of proteins from gel to membrane. | Verify: Stain post-transfer gel with Coomassie blue. If protein remains, transfer was incomplete [67].Solve: Increase transfer time or voltage; add SDS for high MW proteins [68]. |
| High Background | Membrane dried out during processing; insufficient blocking. | Verify: Visually inspect membrane before blocking; it should be uniformly wet.Solve: Keep membrane immersed in buffer at all times; ensure adequate blocking time and reagent volume [13]. |
| Missing Low MW Bands | Proteins passed through the membrane ("blow-through"). | Verify: Use a second membrane during transfer; stain it to see if small proteins were captured [67].Solve: Reduce transfer time; use a 0.2 µm pore size membrane [68] [70]. |
| Missing High MW Bands | Proteins trapped in the gel. | Verify: Stain post-transfer gel with Coomassie blue; prominent high MW bands will remain [67].Solve: Add 0.01-0.04% SDS to transfer buffer; decrease methanol content; extend transfer time [68] [69]. |
| Uneven or Swirling Bands | Poor contact between gel and membrane due to air bubbles or improper assembly. | Verify: Use Ponceau S stain; blank spots or swirls on the membrane indicate areas of no transfer [66].Solve: Roll glass pipette vigorously over stack during assembly to remove bubbles; ensure proper compression [68] [69]. |
Experimental Protocols
Protocol 1: Verifying Transfer with Ponceau S Staining
Ponceau S is a rapid, reversible stain for visualizing total protein on nitrocellulose or PVDF membranes.
- Staining: After transfer, incubate the membrane in Ponceau S solution (0.1% Ponceau S in 5% acetic acid) for 5 minutes with gentle agitation [71].
- Destaining/Washing: Rinse the membrane briefly with distilled water or a mild wash buffer (e.g., 1% acetic acid) to destain the background. The protein bands will appear pink/red.
- Documentation: Photograph the stained membrane immediately.
- Destaining for Immunoblotting: Completely remove the stain by washing the membrane with Tris-Buffered Saline with Tween-20 (TBST) or your standard wash buffer until the red color is fully gone. Proceed with blocking.
Protocol 2: Verifying Transfer by Post-Transfer Gel Staining
This protocol confirms that proteins have left the gel.
- Staining: After transferring the proteins to the membrane, place the polyacrylamide gel in a container with Coomassie Brilliant Blue staining solution. Agitate for at least 30-60 minutes.
- Destaining: Replace the stain with a Coomassie destaining solution (e.g., 40% methanol, 10% acetic acid). Agitate until the background is clear and protein bands are visible.
- Interpretation: A gel that is nearly clear with only faint or no protein bands indicates an efficient transfer. Prominent blue bands suggest incomplete transfer, and transfer conditions need optimization [67].
Experimental Workflow for Transfer Verification
The diagram below outlines a logical workflow for systematically troubleshooting and verifying protein transfer in Western blotting.
The Scientist's Toolkit: Research Reagent Solutions
| Item | Function & Application |
|---|---|
| Ponceau S Stain | A rapid, reversible stain for visualizing total protein patterns on a membrane after transfer, allowing assessment of transfer efficiency and loading uniformity before immunodetection [66] [71]. |
| Coomassie Blue Stain | A high-sensitivity protein stain used to visualize proteins remaining in the gel after transfer, providing direct evidence of incomplete transfer [67]. |
| Pre-Stained Protein Ladder | A molecular weight marker with pre-conjugated dyes that allows visual tracking of transfer efficiency for proteins of different sizes directly on the membrane [67]. |
| Methanol | A key component of standard Towbin transfer buffer. It facilitates protein binding to the membrane but can reduce transfer efficiency for high molecular weight proteins by shrinking the gel pores. Concentration (typically 10-20%) is a key optimization parameter [68] [72]. |
| SDS (Sodium Dodecyl Sulfate) | Can be added in small amounts (0.01-0.04%) to the transfer buffer to help elute large, difficult-to-transfer proteins from the gel matrix. However, excess SDS can prevent proteins from binding to the membrane [68] [69]. |
| 0.2 µm Pore Size Membrane | Essential for retaining low molecular weight proteins (<20-25 kDa) that may pass through standard 0.45 µm membranes during transfer [68] [70]. |
In protein research, the critical challenge of incomplete protein separation and poor band resolution can significantly hinder data accuracy and reproducibility. This technical support document provides a comparative analysis of two core electrophoretic techniques: traditional fixed-concentration gels and gradient gels. Within the context of a broader thesis on resolving separation issues, this guide offers targeted troubleshooting and protocols to help researchers select the optimal gel system, overcome common experimental pitfalls, and achieve superior band resolution for their specific applications in drug development and proteomic research.
Technical Comparison: Traditional vs. Gradient Gels
Core Principles and Separation Mechanisms
Traditional Fixed-Percentage Gels utilize a uniform concentration of polyacrylamide throughout the gel matrix, creating a consistent pore size. This makes them ideal for separating proteins within a relatively narrow, predictable molecular weight (MW) range [14]. The migration speed of proteins is primarily governed by the sieving effect of this uniform matrix.
Gradient Gels are formulated with a continuous increase in acrylamide concentration, typically from a low percentage at the top to a high percentage at the bottom. This creates a pore size that narrows progressively [31]. As proteins migrate, their leading edges encounter smaller pores and slow down before their trailing edges, causing the bands to sharpen and "stack" upon themselves. This mechanism allows a single gel to resolve a very broad spectrum of protein sizes effectively [73].
Quantitative Performance Data
The following table summarizes the key characteristics and performance metrics of both gel types, based on experimental analyses.
Table 1: Comparative Analysis of Fixed vs. Gradient Gel Performance
| Feature | Fixed-Percentage Gel | Gradient Gel |
|---|---|---|
| Pore Size | Uniform across the gel [73] | Varies from top (large) to bottom (small) [73] |
| Resolution Range | Narrow, optimal for a specific MW window [73] | Wide, capable of resolving proteins from 4-250 kDa in a single run [31] [73] |
| Band Sharpness | Good for target MW | Superior; the gradient compresses bands, leading to sharper definition [31] |
| Best For | Analyzing proteins of known, similar sizes [73] | Complex mixtures, unknown MWs, and detecting degradation products [73] |
| Run Time | Slightly faster | Slightly longer |
| Cost | Lower | Slightly higher [73] |
Table 2: Recommended Gel Percentage for Target Protein Sizes
| Target Protein Size | Fixed Gel % | Gradient Gel Range |
|---|---|---|
| >200 kDa | 4-6% [31] | 4-20% [73] |
| 50-200 kDa | 8% [31] | 4-20% [73] |
| 15-100 kDa | 10% [31] | 8-15% [31] |
| 10-70 kDa | 12.5% [31] | 4-20% [73] |
| <30 kDa | 15% [73] | 4-20% [73] |
Experimental Protocols
Protocol A: Standard SDS-PAGE Using Fixed-Percentage Gels
This is a foundational method for separating proteins by mass under denaturing conditions [14].
- Gel Casting: Prepare the resolving gel solution according to your desired percentage (e.g., 10% for 50-150 kDa proteins). A standard 10% Tris-Glycine mini gel recipe includes 7.5 mL of 40% acrylamide, 3.9 mL of 1% bisacrylamide, 7.5 mL of 1.5 M Tris-HCl (pH 8.7), water to 30 mL, and polymerization initiators 0.3 mL of 10% APS and 0.03 mL TEMED [14]. Pour between glass plates and overlay with a solvent to ensure a flat surface. Once polymerized, pour a stacking gel (lower acrylamide %) to create the sample wells.
- Sample Preparation: Dilute protein samples in Laemmli buffer containing SDS and a reducing agent (e.g., DTT or β-mercaptoethanol). Heat samples at 70-100°C for 3-5 minutes to fully denature the proteins [14].
- Electrophoresis: Load samples and a molecular weight marker into the wells. Run the gel in a suitable buffer (e.g., Tris-Glycine-SDS) at a constant voltage (e.g., 150V for a mini-gel) until the dye front approaches the bottom [74].
- Detection: Following electrophoresis, proteins can be visualized using stains like Coomassie Brilliant Blue or Silver Stain, or transferred to a membrane for western blotting [14].
Protocol B: High-Resolution Separation Using Gradient Gels
Gradient gels offer a powerful alternative for complex samples, and can be made in-house or purchased as precast gels [31].
- Gel Casting (Two-Method Overview):
- Using a Gradient Maker: The most controlled method. Place the low-concentration acrylamide solution in the "output" chamber and the high-concentration solution in the "reservoir" chamber. Use a pump or gravity flow to mix the solutions gradually as the gel is poured from the top, creating a smooth gradient [31].
- Rapid Pipette Method: A quicker, manual alternative. Using a serological pipette, sequentially draw up half the total volume needed from the low-concentration tube and the other half from the high-concentration tube. Aspirate a small air bubble (approx. 0.5 mL) and tilt the pipette to allow the bubble to travel its length, mixing the solutions. Slowly dispense the mixture into the gel cassette [31].
- Sample Preparation: Identical to Protocol A. No special preparation is required.
- Electrophoresis: Load samples and run the gel. Note that run times may be slightly longer than fixed-percentage gels. The gradient inherently performs the band-sharpening function of a stacking gel [14].
- Detection and Analysis: Identical to Protocol A. The broader separation range will be evident upon visualization.
Troubleshooting Guides & FAQs
Common SDS-PAGE Issues and Solutions
Table 3: Troubleshooting Common Protein Gel Problems
| Problem | Possible Cause | Troubleshooting Solution |
|---|---|---|
| Smeared Bands | Voltage too high [74] | Run the gel at a lower voltage (e.g., 10-15 V/cm) for a longer time [74]. |
| Poor Band Resolution | Gel run time too short; incorrect acrylamide % [74] | Run the gel longer; optimize acrylamide percentage for your target protein's size or switch to a gradient gel [31] [74]. |
| 'Smiling' Bands | Excessive heat generation during run [74] | Run the gel in a cold room, use a cooling apparatus, or lower the voltage [74]. |
| Edge Effect (Distorted outer lanes) | Empty wells on the periphery of the gel [74] | Load protein samples or ladder in all wells to ensure an even electric field [74]. |
| Protein Samples Ran Off Gel | Gel run for too long [74] | Stop the run as soon as the dye front reaches the bottom of the gel [74]. |
| Vertical Streaks in 2D Gels | High salt concentration in sample [75] | Desalt samples using dialysis, ultrafiltration, or gel filtration to keep salt concentration below 10 mM [75]. |
| Horizontal Streaks in 2D Gels | Incomplete rehydration of IPG strips [75] | Ensure strips are rehydrated in sufficient buffer volume for the recommended time (e.g., overnight) [75]. |
Frequently Asked Questions (FAQs)
Q: When should I definitely choose a gradient gel? A: A gradient gel is the best choice when your protein sample is a complex mixture of unknown composition, contains proteins spanning a wide molecular weight range, or when you need to detect potential degradation products or post-translational modifications on a single gel [31] [73].
Q: Do gradient gels require special equipment to run? A: No. As long as the gel cassette is compatible with your electrophoresis tank, gradient gels run using the same standard equipment and buffers as fixed-percentage gels [73].
Q: My bands are fuzzy and poorly separated. Could the gel type be the issue? A: Yes. If you are using a fixed-percentage gel for a sample with a broad MW range, a gradient gel will likely provide much sharper bands. The gradient continuously slows proteins as they migrate, leading to a "stacking" effect that sharpens bands [31]. Also, ensure you are not running the gel at too high a voltage [74].
Q: I see high background staining in my 2D gel. What is the cause? A: This can be due to insufficient washing of ampholytes from the gel after isoelectric focusing. Thoroughly wash the gel according to the protocol before applying the stain [75].
The Scientist's Toolkit: Essential Research Reagents
Table 4: Key Reagents for Protein Gel Electrophoresis
| Reagent / Material | Function | Key Considerations |
|---|---|---|
| SDS (Sodium Dodecyl Sulfate) | Denatures proteins and confers a uniform negative charge, allowing separation primarily by mass [14]. | Use a high-purity grade for consistent results. |
| Acrylamide/Bis-acrylamide | Forms the cross-linked polyacrylamide gel matrix that acts as a molecular sieve [14]. | Handle with care; a neurotoxin in its monomeric form. |
| APS & TEMED | Polymerization initiators for the gel. APS generates free radicals, and TEMED catalyzes the reaction [14]. | Fresh APS is critical for consistent gel polymerization. |
| Tris-based Buffers | Maintains stable pH during electrophoresis, which is critical for consistent protein migration [76] [14]. | Bis-Tris gels (neutral pH) can offer better stability and resolution than Tris-Glycine (alkaline pH) for some applications [76]. |
| Molecular Weight Markers | Provide a reference for estimating the size of unknown proteins in the sample [14]. | Choose a ladder that covers the expected MW range of your target proteins. |
| IPG Strips (for 2D-PAGE) | Immobilized pH gradient strips used for the first dimension separation of proteins by their isoelectric point (pI) [14]. | The pH range of the strip must be selected based on the pI of the proteins of interest. |
Experimental Workflow and Decision Pathway
The following diagram illustrates the logical workflow for selecting the appropriate gel type and addressing common resolution issues, based on the comparative analysis.
Gel Selection and Troubleshooting Workflow
Frequently Asked Questions (FAQs)
This section addresses common challenges researchers face when using 2D-Electrophoresis and Liquid Chromatography for protein separation.
2D-Electrophoresis FAQs
- Why are my protein bands smeared or streaked in the 2D gel? Smearing or streaking is often caused by improper sample preparation. Ensure your sample is fully solubilized using reagents containing at least 8 M urea, and add reducing agents like DTT along with non-ionic detergents as described in your protocol. Also, limit the salt concentration in your samples to 10 mM or less, as high salt can cause severe streaking [75].
- What causes curved "smiling" bands or distorted bands at the edges of my SDS-PAGE gel? "Smiling" bands, where bands curve upwards at the ends, are typically caused by excessive heat generation during electrophoresis. Running the gel at a lower voltage for a longer time, in a cold room, or using an apparatus with a cooling unit can minimize this [77]. Distorted bands on the periphery of the gel, known as the "edge effect," occur when outer wells are left empty. Load ladders or dummy protein samples in unused wells to prevent this [77].
- Why is my band separation poor, with blurry or overlapping bands?
Poor resolution can result from several factors:
- Insufficient Run Time: The gel may not have been run long enough; a standard practice is to run until the dye front is near the bottom [77].
- Incorrect Gel Percentage: The polyacrylamide percentage might be unsuitable for your target protein's size. Use lower percentage gels for high molecular weight proteins and higher percentage gels for low molecular weight proteins [3].
- Improper Buffer: Overused or improperly formulated running buffer can hinder current flow and separation; prepare fresh buffer frequently [3].
- Incomplete Denaturation: Ensure samples are properly denatured by boiling with SDS and DTT, and then placed immediately on ice to prevent renaturation [3].
Liquid Chromatography FAQs
- What causes peak tailing or fronting, and how can I resolve it?
Tailing often arises from secondary interactions between analytes and active sites on the stationary phase, or from column overload (too much analyte mass). Fronting is typically caused by column overload (too high concentration or too large injection volume) or a physical change in the column [78].
- Check and reduce your sample load (injection volume or concentration) [78] [79].
- Ensure the injection solvent strength is compatible with, or weaker than, the initial mobile phase [78] [79].
- For tailing, consider using a column with less active residual sites, such as an end-capped silica or a more inert stationary phase [78].
- Why do I see ghost peaks or unexpected signals in my blank runs?
Ghost peaks can originate from several sources:
- Carryover from a previous injection due to insufficient cleaning of the autosampler or injection needle [78].
- Contaminants in the mobile phase, solvent bottles, or sample vials [78].
- Column bleed or decomposition of the stationary phase, especially at high temperature or extreme pH [78].
- Run blank injections to identify these peaks, clean the autosampler, use fresh high-purity mobile phase, and replace the column if you suspect bleed or degradation [78].
- Why have my retention times shifted unexpectedly?
Retention time shifts can be caused by:
- A change in mobile phase composition, pH, or buffer strength [78].
- A change in flow rate or column temperature [78].
- Column aging or stationary phase degradation [78].
- Verify your mobile phase preparation and check the pump flow rate for accuracy. If the shift is uniform for all peaks, the issue is likely systemic (e.g., flow rate); if it's selective to some peaks, it's likely a chemical or column issue [78].
Troubleshooting Guides
Troubleshooting Poor Band Separation in SDS-PAGE
The following table outlines common issues and solutions for poor band separation in SDS-PAGE gels, a critical first step in 2D-Electrophoresis.
| Problem | Possible Cause | Troubleshooting Solution |
|---|---|---|
| Smeared Bands | Gel run at excessively high voltage [77]. | Run gel at 10-15 V/cm; use lower voltage for longer time [77]. |
| Poor Resolution (Blurry/overlapping bands) | Insufficient gel run time [77]. | Run gel longer, at least until dye front nears bottom [77]. |
| Incorrect polyacrylamide gel percentage [3]. | Use lower % gel for high MW proteins; higher % gel for low MW proteins [3]. | |
| Improper or old running buffer [77]. | Prepare fresh running buffer with correct salt concentration [77] [3]. | |
| Incomplete protein denaturation [3]. | Ensure proper boiling time (e.g., 5 min at 98°C) in denaturing buffer; place on ice immediately after [3]. | |
| "Smiling" Bands | Excessive heat generation during run [77]. | Run gel in cold room, with cooling apparatus, or at lower voltage [77]. |
| Vertical Streaking in 2D Gels | High salt concentration in sample [75]. | Desalt sample to ≤10 mM salt using dialysis, gel filtration, or ultrafiltration [75]. |
| Horizontal Streaking in 2D Gels | Incomplete focusing or rehydration [75]. | Ensure strips are fully rehydrated; optimize focusing time; increase solubilizing agents in buffer [75]. |
Troubleshooting Common Liquid Chromatography Issues
This table provides a structured approach to diagnosing and resolving frequent problems in liquid chromatography.
| Problem | Possible Cause | Troubleshooting Solution |
|---|---|---|
| Peak Tailing/Fronting | Column overload (mass or volume) [78]. | Reduce injection volume or dilute sample concentration [78] [79]. |
| Secondary interactions or voided column [78]. | Use a more inert stationary phase; for physical issues, check/replace inlet frit or column [78] [79]. | |
| Injection solvent stronger than mobile phase [78]. | Ensure injection solvent is same or weaker strength than mobile phase [78] [79]. | |
| Pressure Spikes | Blockage in system (frit, guard column, tubing) [78]. | Disconnect column to isolate; if pressure is normal, column is culprit. Reverse-flush or replace column/guard [78]. |
| Baseline Drift/Instability | Impure mobile phase or air bubbles in system [80]. | Use high-purity solvents; degas mobile phase; purge system to remove air bubbles [80]. |
| Ghost Peaks | Carryover or contaminants [78]. | Clean autosampler/needle; run blank injections; use fresh, high-purity mobile phase and solvents [78]. |
| Variable Retention Times | Mobile phase composition change or pump malfunction [78]. | Verify mobile phase preparation; check pump for proper mixing and steady flow rate [78] [79]. |
| Temperature fluctuations [78]. | Use a thermostatically controlled column oven [78] [79]. |
Experimental Protocols for Optimal Results
Protocol for High-Resolution 2D-Electrophoresis
1. Sample Preparation:
- Solubilization: Fully denature and solubilize the protein sample using a buffer containing at least 8 M urea, a reducing agent (e.g., DTT), and non-ionic or zwitterionic detergents [75].
- Desalting: Reduce salt concentration to 10 mM or less using methods like ultrafiltration, dialysis, or gel filtration to prevent horizontal streaking during IEF [75].
- Protease Inhibition: Include protease inhibitors during preparation to prevent protein degradation, which can cause spot doubling or smearing [75].
2. Isoelectric Focusing (IEF):
- Rehydration: Ensure IPG strips are fully rehydrated with the sample rehydration buffer. Typically, rehydrate for 1 hour at minimum, or extend to overnight for improved results, ensuring the buffer covers the strip completely [75].
- Focusing: Apply the appropriate voltage gradient as per manufacturer's instructions. Disable the "Load Check" feature on the power supply to prevent automatic shutdown as the current drops during focusing [75].
3. Gel Equilibration and Second Dimension (SDS-PAGE):
- Equilibration: Equilibrate the focused IPG strip in equilibration buffer containing SDS and DTT to prepare proteins for the second dimension. Perform this step as described in the manual to ensure complete transfer [75].
- Transfer: Place the strip directly onto the SDS-PAGE gel, ensuring no air bubbles are trapped between the strip and the gel surface [75].
- Electrophoresis: Run the gel using optimized parameters. To prevent "smiling" and improve resolution, consider running the gel at a lower voltage (e.g., 150V) for a longer time, potentially in a cooled environment [77] [3].
Protocol for Optimizing Liquid Chromatography Separation
1. System and Mobile Phase Preparation:
- Solvent Quality: Use high-purity (HPLC-grade) solvents. Filter and degas mobile phases before use to prevent baseline noise and pump issues [80] [79].
- Buffer Freshness: Prepare buffered mobile phases fresh and ensure accurate pH and composition to maintain reproducible retention times [78].
2. Sample Preparation and Injection:
- Compatibility: Dissolve the sample in a solvent that is the same as, or weaker than, the starting mobile phase to avoid peak distortion (e.g., fronting or splitting) [78] [79].
- Filtration: Filter samples through a 0.22 µm or 0.45 µm membrane to remove particulates that could clog the column or frits [80].
- Load: Avoid mass and volume overload by using an appropriate injection volume (typically <40% of the expected peak width) and sample concentration to prevent tailing or fronting peaks [79].
3. Column Care and System Maintenance:
- Guard Column: Use a guard column to protect the analytical column from contaminants and extend its life. Replace the guard cartridge regularly [78] [79].
- Column Cleaning: Follow manufacturer guidelines for column cleaning and storage. If column performance degrades (e.g., increased backpressure, peak tailing), wash with appropriate strong solvents [79].
- Leak Checks: Regularly inspect the system for leaks, especially if a sudden pressure drop or retention time shift occurs [78].
Research Workflow and Reagent Solutions
Logical Workflow for Protein Separation Troubleshooting
The following diagram illustrates a systematic approach to diagnosing and resolving common protein separation issues.
Essential Research Reagent Solutions
The following table lists key reagents and materials critical for successful protein separation experiments, along with their primary functions.
| Reagent/Material | Function in Separation |
|---|---|
| Urea (8 M) | A chaotropic agent used in sample buffers for 2D-Electrophoresis to denature proteins and maintain solubility during isoelectric focusing [75]. |
| DTT (Dithiothreitol) | A reducing agent that breaks disulfide bonds in proteins, ensuring complete denaturation and linearization for accurate separation by molecular weight [75] [3]. |
| Carrier Ampholytes | Create a stable pH gradient in the gel during isoelectric focusing (IEF) for 2D-Electrophoresis. They help proteins migrate to their isoelectric point (pI) [75]. |
| Polyacrylamide Gel | Forms a crosslinked, mesh-like matrix that acts as a molecular sieve. The percentage of acrylamide determines the effective separation range for proteins by size [3]. |
| SDS (Sodium Dodecyl Sulfate) | A strong detergent that denatures proteins and confers a uniform negative charge, allowing separation primarily by molecular weight in SDS-PAGE [81] [3]. |
| HPLC-grade Solvents | High-purity mobile phases (e.g., water, acetonitrile) are essential for LC to prevent baseline drift, ghost peaks, and column contamination [78] [80]. |
| Guard Column | A short, disposable cartridge placed before the analytical LC column to trap contaminants and particulate matter, protecting the more expensive analytical column [78] [79]. |
| C18 Stationary Phase | A common reversed-phase chromatography material with hydrophobic surfaces, used for separating biomolecules like peptides based on their hydrophobicity [82]. |
Frequently Asked Questions
What are the most critical factors affecting band reproducibility in SDS-PAGE? Band reproducibility can be compromised by inconsistencies in sample preparation, gel polymerization, and electrophoresis conditions. Ensure proteins are completely denatured by boiling samples for about 5 minutes and then placing them immediately on ice to prevent renaturation. Use fresh electrophoresis buffers for each run and verify that polyacrylamide gels have completely polymerized before use [3].
Why are my protein bands fuzzy or poorly separated? Poor band sharpness and resolution are frequently caused by overloading the gel with too much protein, using an inappropriate polyacrylamide gel percentage for your target protein size, or protein diffusion during the staining process [3]. A fixation step before staining can prevent diffusion and significantly improve band sharpness [83].
How can I troubleshoot poor band resolution for high or low molecular weight proteins? The percentage of polyacrylamide in your gel is critical. For high molecular weight proteins, use a low percentage gel (e.g., 8%) with larger pores to allow efficient migration. For low molecular weight proteins, use a high percentage gel (e.g., 15%) with smaller pores to slow migration and improve separation [3].
My internal standards are varying. What could be the cause? Inconsistent internal standards can indicate an active site in your system (e.g., a dirty MS source or GC inlet liner in coupled systems) or a problem with the autosampler not consistently dosing the same amount of internal standard. For autosamplers, check for leaks in the internal standard vessel and ensure proper rinsing between samples [84].
Troubleshooting Guides
Poor Band Sharpness and Resolution
This guide addresses issues where protein bands appear smeared, fuzzy, or poorly separated from each other.
| Observed Symptom | Potential Root Cause | Recommended Solution |
|---|---|---|
| Bands are smeared or diffuse | Incomplete denaturation of proteins [3] | Boil samples for 5 minutes and immediately place on ice to prevent renaturation [3]. |
| Protein diffusion during staining [83] | Incorporate a fixation step (40% methanol, 10% acetic acid for 30 min) prior to Coomassie staining [83]. | |
| Bands are too close together; poor separation | Incorrect polyacrylamide percentage [3] | Use a lower % gel for high MW proteins; use a higher % gel for low MW proteins [3]. |
| Gel running too hot [3] | Run the gel at a lower voltage for a longer time or use a cooling apparatus [3]. | |
| All proteins are clustered near the top of the gel | Gel percentage is too high for protein size [3] | Switch to a lower percentage polyacrylamide gel [3]. |
Reproducibility Issues
This guide helps diagnose and fix problems where band patterns, intensities, or positions are inconsistent between runs.
| Observed Symptom | Potential Root Cause | Recommended Solution |
|---|---|---|
| Inconsistent band intensities or positions between runs | Overused or improperly formulated running buffer [3] | Prepare fresh electrophoresis buffers before each run [3]. |
| Inconsistent sample loading or improper rinsing of autosampler [84] | Check autosampler for leaks and ensure consistent dosing and rinsing protocols [84]. | |
| Inconsistent internal standard areas | Active site in the system (GC-MS, Purge & Trap) [84] | Perform MS source maintenance, replace GC inlet liner, or clean the analytical trap [84]. |
| Incomplete gel polymerization [3] | Ensure all gel components, especially TEMED, are fresh and added in correct concentrations [3]. | |
| High background across all lanes | Overloading protein [3] | Load the minimum amount of protein required for detection; optimize concentration [3]. |
Quantitative Metrics and Standards
The following table summarizes key quantitative measurements and targets for assessing gel quality. These metrics provide objective criteria for quality control.
| Quality Metric | Description | Target / Standard |
|---|---|---|
| Reproducibility (Run-to-Run) | Consistency of band migration (Rf) and intensity between replicate runs. | Coefficient of variation (CV) < 5% for band position of a standard. |
| Band Sharpness | Measure of band definition, inversely related to band width. | Sharp, distinct bands with no smearing or diffusion [83]. |
| Resolution (R) | Ability to distinguish two adjacent bands. | R ≥ 1.0 for complete separation of two bands. |
| Sensitivity (Detection Limit) | The lowest amount of protein detectable by staining. | Colloidal CBB-G: ~1-8.2 ng/band [83]; CBB-R: ~200 ng/band [83]. |
Experimental Protocols
Improved Colloidal Coomassie Staining for Enhanced Band Sharpness
Background: Standard colloidal Coomassie Brilliant Blue (CBB-G) staining can suffer from protein diffusion during the washing step, leading to reduced band resolution. This protocol incorporates a fixation step to prevent this diffusion [83].
Materials:
- Fixation Solution: 40% (v/v) Methanol, 10% (v/v) Acetic Acid [83]
- Staining Solution: 0.02% (w/v) CBB G-250, 5% (w/v) Aluminium Sulfate, 10% (v/v) Ethanol, 2% (v/v) Orthophosphoric Acid [83]
- Destain Solution: 10% (v/v) Ethanol, 2% (v/v) Orthophosphoric Acid [83]
Methodology:
- Electrophoresis: Complete SDS-PAGE run as per standard protocol [3].
- Fixation: Transfer the gel to a fixation solution. Shake at 80 rpm for 30 minutes. This step can be extended overnight for convenience [83].
- Rinse: Briefly rinse the fixed gel with ultrapure water.
- Stain: Incubate the gel in CBB-G staining solution for 2 hours or overnight with shaking at 80 rpm.
- Destain: Briefly rinse the gel with water. Destain in destain solution with shaking for 3-5 minutes.
- Final Wash: Rinse the gel briefly and then wash with ultrapure water for 10 minutes with shaking to remove colloidal particles [83].
Native SDS-PAGE for Functional Analysis
Background: Standard SDS-PAGE denatures proteins, destroying functional properties. Native SDS-PAGE (NSDS-PAGE) is a modified method that maintains proteins in a native state, allowing for the retention of enzymatic activity and metal cofactors while providing high resolution similar to traditional SDS-PAGE [6].
Materials:
- NSDS Sample Buffer: 100 mM Tris HCl, 150 mM Tris base, 10% (v/v) glycerol, 0.0185% (w/v) Coomassie G-250, 0.00625% (w/v) Phenol Red, pH 8.5 [6].
- NSDS Running Buffer: 50 mM MOPS, 50 mM Tris Base, 0.0375% SDS, pH 7.7 [6].
- Precast Bis-Tris gels (e.g., Invitrogen NuPAGE Novex).
Methodology:
- Sample Preparation: Mix 7.5 μL protein sample with 2.5 μL of 4X NSDS sample buffer. Do not heat the sample. [6]
- Gel Equilibration: Pre-run the precast gel at 200V for 30 minutes in ddH₂O to remove storage buffer [6].
- Electrophoresis: Load samples and run the gel at a constant voltage (e.g., 200V) using NSDS running buffer until the dye front reaches the end of the gel [6].
The Scientist's Toolkit: Research Reagent Solutions
| Reagent / Material | Function / Purpose | Key Consideration |
|---|---|---|
| SDS (Sodium Dodecyl Sulfate) | Denatures proteins and imparts a uniform negative charge [3]. | Critical for denaturing; concentration affects Native vs. Denaturing protocols [6]. |
| Polyacrylamide Gel | Forms a porous matrix that separates proteins by size [3]. | Gel percentage must be matched to target protein size for optimal resolution [3]. |
| Coomassie Brilliant Blue G-250 | Colloidal dye for staining proteins after electrophoresis [83]. | More sensitive and reproducible than CBB R-250 [83]. |
| TEMED | Catalyst for the polymerization of polyacrylamide gels [3]. | Essential for complete gel polymerization; must be fresh [3]. |
| Methanol & Acetic Acid | Key components of fixation and destaining solutions [83]. | Prevents protein diffusion, improving band sharpness [83]. |
| Tris-Glycine Buffer | Common running buffer system for SDS-PAGE. | Must be fresh; overused buffer can hinder separation [3]. |
| DTT (Dithiothreitol) | Reducing agent that breaks disulfide bonds for complete denaturation [3]. | Ensures proteins are linearized. |
Implementing Benchmarking Protocols for Method Validation and Optimization
FAQs: Troubleshooting Protein Separation and Band Resolution
This section addresses common challenges researchers face during SDS-PAGE experiments, providing targeted solutions to improve protein separation and band clarity.
FAQ 1: Why are my protein bands smeared or poorly resolved instead of sharp and distinct?
Smeared bands are most frequently caused by issues with sample preparation or gel running conditions [3] [85].
- Incomplete Denaturation: Ensure proteins are fully denatured by boiling samples in loading buffer containing SDS and a reducing agent like DTT for the appropriate time (typically ~5 minutes at 98°C). After boiling, place samples immediately on ice to prevent renaturation [3].
- Excessive Protein Load: Overloading wells with too much protein causes overcrowding and smearing. Titrate your protein amount to the minimum required for detection [3].
- Incorrect Gel Percentage: High molecular weight (HMW) proteins require low-percentage acrylamide gels (e.g., 8%) for adequate pore size, while low molecular weight (LMW) proteins need higher percentages (e.g., 12-15%) to slow migration and improve resolution [3] [27].
- Voltage Too High: Running the gel at too high a voltage generates excessive heat, leading to poor separation. Use a lower voltage for a longer duration, or run the gel in a cold room or with a cooling apparatus [85].
FAQ 2: What causes "smiling" or "frowning" bands, and how can I fix them?
"Smiling" bands (curved upward) are primarily a result of uneven heat distribution across the gel [85].
- Heat Dissipation: Excessive current generates heat, causing the center of the gel to warm up more than the edges. Proteins migrate faster in the warmer center, creating an upward curve.
- Troubleshooting: Run the gel at a lower voltage to reduce heat production. Ensure efficient cooling by using a gel apparatus with a cooling coil or by running the gel in a cold room [85].
FAQ 3: My protein ladder looks abnormal (missing, faint, or distorted bands). What is wrong?
An abnormal ladder indicates issues with the ladder itself or its handling [27].
- Overheating: Do not boil ready-to-load protein ladders, as this can degrade the proteins.
- Improper Storage: Repeated freeze-thaw cycles or storage at the wrong temperature can cause degradation. Aliquot and store as recommended.
- Incorrect Volume: Load the recommended volume for your gel size (e.g., 5-10 µL for a mini-gel) [27].
- Expired Ladder: Check the expiration date, as expired ladders may not perform optimally.
FAQ 4: Why do my proteins not separate by molecular weight as expected?
If proteins do not migrate according to their predicted size, check the fundamental principles of SDS-PAGE [3].
- Intact Protein Structure: SDS and DTT must fully denature and linearize the proteins. If tertiary structures remain, migration will be aberrant. Ensure your sample buffer is fresh and complete.
- Old or Improper Buffers: Overused or improperly formulated running buffers can hinder current flow and protein separation. Always use fresh running buffers [3].
FAQ 5: What is the "edge effect," and how can it be avoided?
The "edge effect" describes distorted bands in the outermost lanes of a gel [85].
- Cause: This occurs when wells at the periphery of the gel are left empty, altering the electric field path.
- Solution: Avoid leaving any wells empty. If you have unused wells, load them with a dummy sample like sample buffer or a control protein [85].
Troubleshooting Guide: Poor Band Separation and Resolution
This guide provides a structured approach to diagnosing and resolving the most common SDS-PAGE issues. The table below summarizes key problems and their solutions.
Table 1: Troubleshooting Guide for Poor Band Separation in SDS-PAGE
| Observed Problem | Potential Causes | Recommended Solutions |
|---|---|---|
| Smeared Bands | 1. Incomplete protein denaturation [3]2. Protein overload [3]3. Gel run at too high a voltage [85] | 1. Ensure proper boiling time; place on ice after [3].2. Load less protein; optimize concentration [3].3. Lower the voltage and extend run time [85]. |
| Poor Band Resolution (Bands too close together) | 1. Gel run time too short or too long [85]2. Incorrect acrylamide percentage [3]3. Improper running buffer [85] | 1. Optimize run time; stop when dye front is ~1 cm from bottom [85].2. Use lower % gel for HMW proteins; higher % for LMW proteins [3].3. Remake running buffer to ensure correct ion concentration/pH [85]. |
| 'Smiling' Bands (curved upwards) | Excessive heat generation during electrophoresis [85] | 1. Run gel at lower voltage.2. Use a cooling apparatus or run in a cold room [85]. |
| Protein Bands Not Visible | 1. Too little protein loaded [3]2. Protein ran off the gel [85]3. Protein degradation by proteases [86] | 1. Increase protein load; create a loading curve.2. Reduce run time; do not let dye front run off [85].3. Use fresh, broad-spectrum protease inhibitors during extraction [86]. |
| Edge Effect (distorted outer lanes) | Empty wells at the edges of the gel [85] | Load all outer wells with sample, ladder, or control buffer [85]. |
Experimental Protocol: Optimizing Protein Extraction for SDS-PAGE
A critical pre-analytical step for high-resolution SDS-PAGE is obtaining a high-quality protein extract. The following protocol, optimized for challenging plant root tissues, provides a robust methodology to minimize degradation and interference [86].
Principle: Efficient extraction requires effective tissue homogenization, inhibition of proteases, and removal of interfering compounds like phenolics and polysaccharides. A Tris-EDTA-based buffer followed by TCA/acetone precipitation is effective for this purpose [86].
Materials and Reagents:
- Lysis Buffer: 50 mM Tris-HCl (pH 8.0), 10 mM EDTA, 2% SDS. Add 1-2% β-Mercaptoethanol and 1 mM PMSF fresh before use [86].
- TCA/Acetone Solution: 10% Trichloroacetic Acid (TCA) in cold acetone [86].
- Wash Solution: Cold acetone with 0.07% β-Mercaptoethanol [86].
- Protease Inhibitor Cocktail: Commercial tablets or a solution including PMSF [86].
Procedure:
- Homogenization: Grind 1 g of frozen tissue to a fine powder in liquid nitrogen. Transfer the powder to a pre-chilled tube containing 5 mL of Lysis Buffer. Vortex vigorously [86].
- Incubation: Incubate the homogenate for 15 minutes on ice.
- Precipitation: Add 4 volumes of cold TCA/Acetone solution to the supernatant. Mix and precipitate at -20°C for 1 hour [86].
- Centrifugation: Centrifuge at 15,000 × g for 15 minutes at 4°C. Discard the supernatant.
- Washing: Wash the pellet twice with the cold acetone wash solution. Centrifuge briefly after each wash [86].
- Drying: Air-dry the pellet for 5-10 minutes to evaporate residual acetone.
- Solubilization: Solubilize the final protein pellet in a suitable buffer (e.g., urea/thiourea buffer for 2D-PAGE or SDS-loading buffer for 1D-SDS-PAGE) [86].
- Quantification: Determine protein concentration using a Bradford or BCA assay before analysis [86].
Experimental Workflow and Diagnostic Pathways
The following diagram illustrates the logical troubleshooting workflow for diagnosing poor band resolution in SDS-PAGE.
Research Reagent Solutions for Protein Electrophoresis
This table lists essential reagents and materials for successful protein separation experiments, along with their critical functions.
Table 2: Key Reagents for Protein Separation Experiments
| Reagent/Material | Function/Purpose | Key Considerations |
|---|---|---|
| SDS (Sodium Dodecyl Sulfate) | Denatures proteins and confers a uniform negative charge, enabling separation primarily by molecular weight [3]. | Ensure high purity; concentration in sample buffer is critical. |
| DTT or β-Mercaptoethanol | Reducing agent that breaks disulfide bonds to fully linearize proteins [3] [86]. | Must be added fresh to buffers as it oxidizes over time. |
| Acrylamide/Bis-acrylamide | Forms the cross-linked gel matrix that acts as a molecular sieve [3]. | Percentage determines pore size and resolution range [3]. |
| TEMED & Ammonium Persulfate (APS) | Catalyzes the polymerization of the polyacrylamide gel [3]. | Fresh APS is crucial for complete and consistent gel polymerization. |
| Proteinase Inhibitors (e.g., PMSF) | Prevents proteolytic degradation of target proteins during extraction [86]. | Use a broad-spectrum cocktail; add fresh to extraction buffer. |
| TCA/Acetone | Precipitates proteins to concentrate samples, remove contaminants, and inactivate proteases [86]. | Precipitation time is critical for yield; avoid prolonged exposure [86]. |
| Tris & Glycine Buffers | Components of running buffer that maintain pH and conduct current through the gel [85]. | Always use fresh buffer; overused buffer leads to poor resolution [85]. |
| Pre-stained Protein Ladder | Provides visible markers for tracking electrophoresis and transfer efficiency [27]. | Not for precise molecular weight determination; do not heat [27]. |
Conclusion
Achieving optimal protein separation in SDS-PAGE requires integrated mastery of both fundamental principles and practical troubleshooting strategies. Success hinges on meticulous attention to sample preparation, appropriate gel selection, and controlled electrophoretic conditions, while systematic diagnosis of artifacts like smearing or distortion enables rapid problem resolution. Implementing robust validation through proper controls and quality metrics ensures reproducible, high-quality data. As protein analysis continues to drive advancements in biomarker discovery, therapeutic development, and diagnostic applications, the rigorous methodologies outlined here provide essential frameworks for research integrity. Future directions will likely incorporate computational prediction tools, advanced material sciences for gel matrices, and automated troubleshooting systems to further enhance separation precision and efficiency in biomedical research.
References
- 1. The principle and method of polyacrylamide gel ... [https://www.mblbio.com/bio/g/support/method/sds-page.html]
- 2. SDS-PAGE guide: Sample preparation to analysis [https://www.abcam.com/en-us/knowledge-center/western-blot/sds-page-guide]
- 3. 6 Best Tips for Troubleshooting Poor Band Separation on ... [https://azurebiosystems.com/blog/6-tips-for-troubleshooting-poor-band-separation-on-sds-page-gels/]
- 4. Troubleshooting SDS-PAGE Gel Running Issues [https://www.goldbio.com/blogs/articles/troubleshooting-sds-page-gel-running-issues?srsltid=AfmBOorGnH_A672eXVgp6GsfB4a4FlyHzOI4OCMb51XaSanm0jiXcLF1]
- 5. Troubleshooting Sodium Dodecyl Sulfate- Polyacrylamide ... [https://www.hycultbiotech.com/sds-page/troubleshooting/]
- 6. Native SDS-PAGE: High Resolution Electrophoretic ... [https://pmc.ncbi.nlm.nih.gov/articles/PMC4517606/]
- 7. Common artifacts and mistakes made in electrophoresis [https://pmc.ncbi.nlm.nih.gov/articles/PMC7295095/]
- 8. Protein Stains Support—Troubleshooting [https://www.thermofisher.com/us/en/home/technical-resources/technical-reference-library/protein-electrophoresis-western-blotting-support-center/protein-stains-support/protein-stains-support-troubleshooting.html]
- 9. 12 Tips for Preparing Non-Covalent Protein Complexes ... [https://www.technologynetworks.com/analysis/how-to-guides/preparing-perfect-non-covalent-protein-complexes-for-analysis-by-mass-spectrometry-12-key-thoughts-307775]
- 10. Western Blot: Technique, Theory, and Trouble Shooting [https://pmc.ncbi.nlm.nih.gov/articles/PMC3456489/]
- 11. Inhibition of Protein Carbamylation in Urea Solution Using Ammonium... [https://pmc.ncbi.nlm.nih.gov/articles/PMC4072244/]
- 12. (PDF) Carbamylation of N-Terminal Proline [https://www.academia.edu/7456598/Carbamylation_of_N_Terminal_Proline]
- 13. Western Blot Troubleshooting [https://www.thermofisher.com/us/en/home/life-science/protein-biology/protein-biology-learning-center/protein-gel-electrophoresis-information/western-blot-troubleshooting.html]
- 14. Overview of Protein Electrophoresis [https://www.thermofisher.com/us/en/home/life-science/protein-biology/protein-biology-learning-center/protein-biology-resource-library/pierce-protein-methods/overview-electrophoresis.html]
- 15. Electrophoresis [https://pubmed.ncbi.nlm.nih.gov/36251838/]
- 16. SDS-PAGE: The science behind all those bubbles [https://www.antibodiesinc.com/pages/sds-page-demystified?srsltid=AfmBOoq0Grc0wSurTkowfC8xW8TnCCkgySZTM_voJv-TWVeN4I51iQfg]
- 17. Detergent binding explains anomalous SDS-PAGE ... [https://pmc.ncbi.nlm.nih.gov/articles/PMC2644111/]
- 18. Troubleshooting SDS-PAGE Gel Running Issues [https://www.goldbio.com/blogs/articles/troubleshooting-sds-page-gel-running-issues?srsltid=AfmBOoq0dDe_Np0dcdhuFHnY1UOoHP6yFWZHYEjbUIWy0nD9U50grQv8]
- 19. Protein charge determination and implications for ... [https://pmc.ncbi.nlm.nih.gov/articles/PMC5275725/]
- 20. Laemmli Buffer: The 5 Critical Components [https://bitesizebio.com/44540/laemmli-buffer-what-is-it-for-anyway/]
- 21. Troubleshooting SDS-PAGE Gel Running Issues [https://www.goldbio.com/blogs/articles/troubleshooting-sds-page-gel-running-issues?srsltid=AfmBOoqm5arhr78xIbxjdXKL0txzr7aFQEzP2v1JQjSPeOemcUbPcUdA]
- 22. Protein Electrophoresis Using SDS-PAGE: A Detailed ... [https://www.goldbio.com/blogs/articles/protein-electrophoresis-sds-page-overview?srsltid=AfmBOorqQckwkpH5uVAkjbr_SR0F80BlN_9s8e9CvCKwVLxWI8curnyx]
- 23. Educational series: characterizing crosslinked polymer networks [https://pubs.rsc.org/en/content/articlehtml/2024/py/d3py00914a]
- 24. Hydrogel pore-size modulation for enhanced single-cell ... [https://pmc.ncbi.nlm.nih.gov/articles/PMC4708057/]
- 25. Troubleshooting SDS-PAGE Gel Running Issues [https://www.goldbio.com/blogs/articles/troubleshooting-sds-page-gel-running-issues?srsltid=AfmBOor0DR-jNklBHI-jTQBaH8lcGW29PoeXIlKYtM-tXc5FFClSGLuG]
- 26. Effect of polymer concentration and cross-linking density ... [https://link.springer.com/article/10.1007/s10971-024-06390-0]
- 27. Protein Standards and Ladders Support — Troubleshooting [https://www.thermofisher.com/us/en/home/technical-resources/technical-reference-library/protein-electrophoresis-western-blotting-support-center/protein-standards-ladders-support/protein-standards-ladders-support-troubleshooting.html]
- 28. Protein sample preparation for mass spectrometry [https://www.thermofisher.com/br/en/home/life-science/protein-biology/protein-biology-learning-center/protein-biology-resource-library/pierce-protein-methods/sample-preparation-mass-spectrometry.html]
- 29. An overview of technical considerations for Western ... [https://pmc.ncbi.nlm.nih.gov/articles/PMC5138151/]
- 30. What are common causes of low resolution for a liquid ... [https://support.waters.com/KB_Chem/Columns/WKB244143_What_are_common_causes_of_low_resolution_for_a_Liquid_Chromatography_LC_column]
- 31. A Guide to Gradient Gels: The Why's and How's [https://bitesizebio.com/47184/gradient-gels/]
- 32. SDS-PAGE Protocol [https://www.rockland.com/resources/sds-page-protocol/?srsltid=AfmBOoo4EpdBIJVcDGh4xsdBDEy1ZKC2ilXWJW7fNsbBbgOmGXXslN5Y]
- 33. Gel Electrophoresis Sample Preparation [https://www.thermofisher.com/us/en/home/references/protein-analysis-guide/protein-separation/gel-electrophoresis-sample-preparation.html]
- 34. Mastering Gel Electrophoresis: 10 Tips and Tricks for ... [https://americanlaboratorytrading.com/mastering-gel-electrophoresis-10-tips-and-tricks-for-successful-results/?srsltid=AfmBOopY6dXTKzw3cHeX6eoOZQb7zLwMnoCggyCzPCWsP70YgoeBc7NX]
- 35. Troubleshooting SDS-PAGE Gel Running Issues [https://www.goldbio.com/blogs/articles/troubleshooting-sds-page-gel-running-issues?srsltid=AfmBOorzI_0Lk7dY2CvazjUNXy0dJUdzFwiPAY3_BYmLZRvwAvq3D00t]
- 36. Nucleic Acid Gel Electrophoresis Troubleshooting [https://www.thermofisher.com/us/en/home/life-science/cloning/cloning-learning-center/invitrogen-school-of-molecular-biology/na-electrophoresis-education/na-electrophoresis-troubleshooting.html]
- 37. Troubleshooting Common Electrophoresis Problems and ... [https://www.labx.com/resources/troubleshooting-common-electrophoresis-problems-and-artifacts/5539]
- 38. Optimizing Gel Electrophoresis: Best Practices for Sample ... [https://www.gelepchina.com/news/optimizing-gel-electrophoresis-best-practices-for-sample-volume-voltage-and-timing/]
- 39. Troubleshooting Gel Casting/ Polymerization Issues in ... [https://www.goldbio.com/blogs/articles/troubleshooting-gel-casting-polymerization-issues-in-sds-page?srsltid=AfmBOoryXqLGAmjXEtm9FyzLpDPzqmGYILSqN4oC4Qg8Zu7mDlMCKeA3]
- 40. Choosing the right agarose percentage for gel ... [https://www.minipcr.com/choosing-the-right-agarose-percentage/]
- 41. Eight Tips to Improve Gel Electrophoresis Results [https://www.thermofisher.com/us/en/home/brands/thermo-scientific/molecular-biology/molecular-biology-learning-center/molecular-biology-resource-library/spotlight-articles/8-DNA-ladder-tips.html]
- 42. Choosing the right voltage for your gel electrophoresis run [https://www.minipcr.com/choosing-the-right-voltage/]
- 43. A Rapid Method for Optimizing Running Temperature ... [https://pmc.ncbi.nlm.nih.gov/articles/PMC3155350/]
- 44. Initiated by interacting with KPNB1 to repair DNA damage [https://pmc.ncbi.nlm.nih.gov/articles/PMC12088430/]
- 45. Molecular contacts in self-assembling clusters of membrane ... [https://pmc.ncbi.nlm.nih.gov/articles/PMC12232663/]
- 46. Peripheral membrane protein endophilin B1 probes ... [https://www.nature.com/articles/s42003-025-07610-1]
- 47. Prevent Protein Aggregation in Formulations: A Guide [https://www.leukocare.com/blog/how-to-prevent-protein-aggregation-in-formulations]
- 48. Exploring Protein Aggregation in Biological Products [https://link.springer.com/article/10.1208/s12249-025-03189-2]
- 49. Exploring Protein Aggregation in Biological Products [https://pubmed.ncbi.nlm.nih.gov/40629131/]
- 50. catGRANULE 2.0: accurate predictions of liquid-liquid phase... [https://genomebiology.biomedcentral.com/articles/10.1186/s13059-025-03497-7]
- 51. Sheet Protector Strategy for Western Blot to Reduce ... [https://pmc.ncbi.nlm.nih.gov/articles/PMC12462392/]
- 52. Crude Lysate - an overview [https://www.sciencedirect.com/topics/agricultural-and-biological-sciences/crude-lysate]
- 53. Overview of Methods and Considerations for Handling ... [https://www.chromatographyonline.com/view/overview-methods-and-considerations-handling-complex-samples]
- 54. Methods and systems for amplification in complex samples [https://patents.google.com/patent/WO2017180745A1/en]
- 55. An Introduction to Protein Purification Methods [https://www.promega.com/resources/guides/protein-analysis/protein-purification-methods/]
- 56. Troubleshooting SDS-PAGE Gel Running Issues [https://www.goldbio.com/blogs/articles/troubleshooting-sds-page-gel-running-issues?srsltid=AfmBOopWVou1Bb1BQuvWHTWQ_3tOVPK5Y4_F1TlFH2K_Mq2iYmbxDdlH]
- 57. Systematic optimisation of crude buccal swab lysate ... [https://pmc.ncbi.nlm.nih.gov/articles/PMC12003550/]
- 58. Troubleshooting SDS-PAGE Gel Running Issues [https://www.goldbio.com/blogs/articles/troubleshooting-sds-page-gel-running-issues?srsltid=AfmBOoo-_JZ-Ad4lmynYyDMrylIjO6_rEYQ42tzvI25cf7osVY-O7iSS]
- 59. Troubleshooting and Optimizing a Western Blot [https://blog.addgene.org/troubleshooting-and-optimizing-a-western-blot]
- 60. Troubleshooting SDS-PAGE Gel Running Issues [https://www.goldbio.com/blogs/articles/troubleshooting-sds-page-gel-running-issues?srsltid=AfmBOorYOIg-Y5LI89Q9JLFCgmdF26F3TZ2tuFKVHI0U_QqRInK_5IEE]
- 61. The 8 Western Blot Failures and How to Prevent Them (2025 ... [https://wildtypeone.substack.com/p/the-8-western-blot-failures-and-how?utm_campaign=post&triedRedirect=true]
- 62. Western Blot Troubleshooting: Weak/No Signal & Other [https://www.ptglab.com/support/western-blot-protocol/western-blot-troubleshooting-weak-no-signal-other/?srsltid=AfmBOoqV0v6Eoo8WVqTuWVuDUyQWGXRSa49GkmeAWaNpexoFhDdgR4ty]
- 63. Western Blot Troubleshooting: 8 Protocol Issues Solved [https://www.stressmarq.com/blog/western-blot-troubleshooting-8-protocol-issues-solved/?srsltid=AfmBOopb1NzCS1SKO1aabTV-uP90r-jDHkylUZiPh-xjsYeezb21jhtt]
- 64. Troubleshooting SDS-PAGE Gel Running Issues [https://www.goldbio.com/blogs/articles/troubleshooting-sds-page-gel-running-issues?srsltid=AfmBOopxxV5iY5rcclksfHfdnYcANkC3hUoyefevBh9nb-OP9zLA0biq]
- 65. Troubleshooting SDS-PAGE Gel Running Issues [https://www.goldbio.com/blogs/articles/troubleshooting-sds-page-gel-running-issues?srsltid=AfmBOorERnnIzIi4e2EuyD-FYV63yg8P546J_43Lye7qFibuh81dbunD]
- 66. Western blot troubleshooting guide! [https://www.jacksonimmuno.com/secondary-antibody-resource/technical-tips/western-blot-trouble-shooting/]
- 67. 3 Hot Tips to Optimize Your Western Blot Transfers [https://bitesizebio.com/7356/optimize-your-western-blot/]
- 68. Western Blotting Support—Troubleshooting [https://www.thermofisher.com/us/en/home/technical-resources/technical-reference-library/protein-electrophoresis-western-blotting-support-center/western-blotting-support/western-blotting-support-troubleshooting.html]
- 69. Western Blot Troubleshooting [https://www.antibodies.com/applications/western-blotting/western-blot-troubleshooting]
- 70. Western Blotting Troubleshooting Guide [https://www.cellsignal.com/learn-and-support/troubleshooting/western-blot-troubleshooting-guide?srsltid=AfmBOopIfER9KUvPg1GkJr5fmSvb7furJSpv7jCMbCspiCFO923WCF9E]
- 71. Western Blotting: Products, Protocols, & Applications [https://www.thermofisher.com/us/en/home/life-science/protein-biology/protein-biology-learning-center/protein-biology-resource-library/pierce-protein-methods/overview-western-blotting.html]
- 72. Western Blot - StatPearls - NCBI Bookshelf - NIH [https://www.ncbi.nlm.nih.gov/books/NBK542290/]
- 73. Gradient Gels vs. Fixed % Gels: Which Should You Use? [https://nusep.us/blogs/precast-gel-education-center/4-20-gradient-gels-vs-fixed-gels-when-to-use-each?srsltid=AfmBOopO02TDN3D33pXRrjEKMHj3uksnNDFgrQLhg-vLDgbb1VD8SBUZ]
- 74. Troubleshooting SDS-PAGE Gel Running Issues [https://www.goldbio.com/blogs/articles/troubleshooting-sds-page-gel-running-issues?srsltid=AfmBOorKduf3d8vmiN4VWvxpC1nrDebh-7zPPF9mRtXykcnHL7dBwbzO]
- 75. Protein Gel 2D Electrophoresis Support—Troubleshooting [https://www.thermofisher.com/us/en/home/technical-resources/technical-reference-library/protein-electrophoresis-western-blotting-support-center/protein-gel-2d-electrophoresis-support/protein-gel-2d-electrophoresis-support-troubleshooting.html]
- 76. A Guide to Choosing the Right Gel for Protein Gel ... [https://biobasic-asia.com/choosing-guide-protein-gel/]
- 77. Troubleshooting SDS-PAGE Gel Running Issues [https://www.goldbio.com/blogs/articles/troubleshooting-sds-page-gel-running-issues?srsltid=AfmBOorZ48LZwlRMWFVzizf1ow6EbUzS-4bPG4Y-HUh7kAxqp9yc8qaj]
- 78. LC Troubleshooting Essentials: A Guide to Common ... [https://www.chromatographyonline.com/view/lc-troubleshooting-essentials-a-guide-to-common-problems-and-solutions-for-peak-tailing-ghost-peaks-and-pressure-spikes]
- 79. Chromatography Troubleshooting Guides-Liquid ... [https://www.thermofisher.com/us/en/home/industrial/chromatography/chromatography-learning-center/chromatography-consumables-resources/chromatography-troubleshooting-guides/chromatography-troubleshooting-guides-liquid-chromatography.html]
- 80. Some Common Issues With Liquid Chromatography And ... [https://www.alwsci.com/news/some-common-issues-with-liquid-chromatography-84962676.html]
- 81. Separation methods for food protein purification and analysis [https://www.explorationpub.com/Journals/eff/Article/101043]
- 82. Comparison of different separation technologies for ... [https://www.sciencedirect.com/science/article/abs/pii/S0021967306011319]
- 83. Higher resolution protein band visualisation via improvement ... [https://chembioagro.springeropen.com/articles/10.1186/s40538-022-00297-0]
- 84. Troubleshooting Part 4: Linearity and reproducibility issues [https://blog.teledynetekmar.com/troubleshooting-part-4-linearity-and-reproducibility-issues]
- 85. Troubleshooting SDS-PAGE Gel Running Issues [https://www.goldbio.com/blogs/articles/troubleshooting-sds-page-gel-running-issues?srsltid=AfmBOopL661FZRMoiywlulTYBisF6Np9dl5VjF5zDAxBq59uFgpVRD1R]
- 86. High-Efficiency Protein Extraction From Lupine Roots [https://pmc.ncbi.nlm.nih.gov/articles/PMC12514137/]