SDS-PAGE vs Native PAGE: A Comprehensive Guide to Protein Separation Techniques for Biomedical Research
This article provides researchers, scientists, and drug development professionals with a detailed comparison of SDS-PAGE and Native PAGE protein separation techniques.
SDS-PAGE vs Native PAGE: A Comprehensive Guide to Protein Separation Techniques for Biomedical Research
Abstract
This article provides researchers, scientists, and drug development professionals with a detailed comparison of SDS-PAGE and Native PAGE protein separation techniques. It covers foundational principles from protein denaturation to native state preservation, methodological protocols for diverse applications from molecular weight determination to functional studies, practical troubleshooting for common experimental challenges, and validation strategies for data interpretation. The content also explores evolving technologies like capillary electrophoresis-SDS and high-resolution clear native PAGE, offering insights to guide method selection for specific research objectives in proteomics and biopharmaceutical development.
Core Principles: How SDS-PAGE and Native PAGE Work at the Molecular Level
In protein biochemistry, the analytical separation of complex mixtures serves as a foundational step in characterizing biological systems. Polyacrylamide gel electrophoresis (PAGE) represents one of the most widely employed techniques for protein separation, with two principal methodologies dominating research applications: Sodium Dodecyl-Sulfate Polyacrylamide Gel Electrophoresis (SDS-PAGE) and Native PAGE. These techniques operate under fundamentally different separation mechanisms that directly impact the type of information researchers can extract from biological samples. SDS-PAGE separates proteins primarily by molecular weight under denaturing conditions, while Native PAGE separates proteins based on combined factors of charge, size, and shape under non-denaturing conditions [1] [2]. This technical guide examines the core separation mechanisms of these complementary techniques, framed within the context of their applications in research and drug development. Understanding these fundamental principles is crucial for selecting the appropriate methodology to address specific research questions in proteomics, structural biology, and pharmaceutical development.
Core Principles of Separation
SDS-PAGE: Molecular Weight-Dependent Separation
SDS-PAGE operates on the principle of molecular weight-based separation through a deliberate denaturation process. The technique employs sodium dodecyl sulfate (SDS), an anionic detergent that binds uniformly to protein molecules in a constant weight ratio (approximately 1.4 g SDS per 1 g of protein) [2]. This SDS binding achieves two critical functions: First, it disrupts and denatures the secondary, tertiary, and quaternary structures of proteins, unfolding them into linear polypeptide chains. Second, the negatively charged SDS molecules overwhelm any intrinsic charge characteristics of the native proteins, creating a uniform negative charge density along the entire length of the denatured polypeptides [3] [4].
During electrophoresis, these SDS-protein complexes migrate through the polyacrylamide gel matrix toward the positively charged anode. The gel acts as a molecular sieve, with its pore size determined by the concentration of acrylamide and bisacrylamide cross-linkers [2] [5]. Smaller polypeptide chains navigate through the porous matrix more readily than larger ones, resulting in separation inversely correlated with molecular mass. This relationship enables accurate molecular weight estimation when samples are run alongside standardized protein markers [6]. The denaturing conditions typically include heating samples to 70-100°C in the presence of reducing agents like β-mercaptoethanol or dithiothreitol (DTT), which cleave disulfide bonds to ensure complete unfolding [3] [2].
Native PAGE: Multifactorial Separation by Charge, Size, and Shape
In contrast to the simplified separation by mass in SDS-PAGE, Native PAGE employs a multifactorial separation mechanism that preserves proteins in their native, functional state. This technique omits denaturing agents like SDS, allowing proteins to maintain their natural conformation, enzymatic activity, and interaction capabilities [7] [2]. The separation in Native PAGE depends on three interdependent factors: the intrinsic net charge of the native protein at the running buffer pH, the hydrodynamic size (which reflects both mass and three-dimensional structure), and the molecular shape [1] [2].
In this system, proteins migrate according to their charge density (charge-to-mass ratio) while simultaneously being influenced by the sieving effect of the gel matrix. The frictional forces encountered during electrophoresis depend on both the size and shape of the native protein, with compact proteins migrating faster than elongated proteins of equivalent mass [2] [6]. Additionally, multimeric proteins maintain their quaternary structure, meaning they migrate as intact complexes rather than dissociated subunits [7]. This preservation of native state enables researchers to study biological interactions, oligomerization states, and functional characteristics that would be destroyed under denaturing conditions [7].
Table 1: Fundamental Separation Mechanisms of SDS-PAGE versus Native PAGE
| Parameter | SDS-PAGE | Native PAGE |
|---|---|---|
| Primary Separation Basis | Molecular weight/mass | Charge, size, and shape |
| Protein State | Denatured/unfolded | Native/folded |
| Detergent Usage | SDS present (0.1% in running buffer) | No SDS |
| Sample Preparation | Heating (70-100°C) with reducing agents | No heating; non-denaturing buffers |
| Charge Characteristics | Uniform negative charge from SDS | Intrinsic charge based on buffer pH |
| Quaternary Structure | Disrupted | Preserved |
| Functional Activity Post-Separation | Lost in most cases [8] | Retained |
| Molecular Weight Determination | Accurate estimation possible | Challenging due to multiple influencing factors |
| Typical Running Temperature | Room temperature | 4°C [1] |
Experimental Methodologies
Standard SDS-PAGE Protocol
The following methodology outlines a standard SDS-PAGE procedure based on commercial Invitrogen NuPAGE systems, which represents a widely adopted protocol in proteomics research [8]:
Sample Preparation:
- Combine 7.5 μL of protein sample (containing 5-25 μg total protein) with 2.5 μL of 4X LDS sample loading buffer
- Heat samples at 70°C for 10 minutes to ensure complete denaturation
- Centrifuge briefly to collect condensed samples
Gel Preparation:
- Utilize pre-cast NuPAGE Novex 12% Bis-Tris 1.0 mm mini-gels
- If casting manually, prepare resolving gel with appropriate acrylamide concentration (e.g., 10-12% for most applications) and stacking gel with lower acrylamide concentration (~4-5%)
- Insert gel cassette into electrophoresis chamber and fill with 1X MOPS SDS running buffer (50 mM MOPS, 50 mM Tris Base, 0.1% SDS, 1 mM EDTA, pH 7.7)
Electrophoresis:
- Load prepared samples and molecular weight standards (5 μL prestained standards recommended) into wells
- Apply constant voltage of 200V for approximately 45 minutes (for 60 mm gel) until dye front reaches gel bottom
- Terminate electrophoresis and process gel for staining, western blotting, or further analysis
Standard Native PAGE Protocol
The Native PAGE methodology follows substantially different conditions to preserve protein native state [8] [2]:
Sample Preparation:
- Mix 7.5 μL of protein sample with 2.5 μL of 4X Native PAGE sample buffer (50 mM BisTris, 50 mM NaCl, 10% glycerol, 0.001% Ponceau S, pH 7.2)
- Do not heat samples
- Avoid reducing agents and denaturants
Gel Preparation:
- Use pre-cast Native-PAGE Novex 4-16% Bis-Tris 1.0 mm mini-gels
- Place gel cassette in electrophoresis apparatus with specialized anode and cathode buffers
- Cathode buffer: 50 mM BisTris, 50 mM Tricine, 0.02% Coomassie G-250, pH 6.8
- Anode buffer: 50 mM BisTris, 50 mM Tricine, pH 6.8
Electrophoresis:
- Load prepared samples and native protein standards (5 μL unstained standards recommended)
- Run at constant voltage of 150V for 90-95 minutes (for 60 mm gel) at 4°C to minimize denaturation
- Continue electrophoresis until dye front reaches gel bottom
- Process gel for activity assays, staining, or further native analysis
Advanced Methodology: Native SDS-PAGE (NSDS-PAGE)
Recent methodological developments have sought to combine the high resolution of SDS-PAGE with the native state preservation of Native PAGE. The NSDS-PAGE protocol represents such a hybrid approach [8]:
Modified Sample Preparation:
- Combine 7.5 μL of protein sample with 2.5 μL of 4X NSDS sample buffer (100 mM Tris HCl, 150 mM Tris base, 10% glycerol, 0.0185% Coomassie G-250, 0.00625% Phenol Red, pH 8.5)
- Omit heating step and EDTA to preserve metal cofactors
Gel Equilibration:
- Pre-run pre-cast NuPAGE Novex 12% Bis-Tris 1.0 mm mini-gels at 200V for 30 minutes in double distilled H2O to remove storage buffer and unpolymerized acrylamide
Modified Running Conditions:
- Use NSDS-PAGE running buffer with reduced SDS concentration (50 mM MOPS, 50 mM Tris Base, 0.0375% SDS, pH 7.7)
- Perform electrophoresis at 200V for 30 minutes
- This modified approach demonstrated 98% zinc retention in metalloproteins compared to 26% with standard SDS-PAGE, with seven of nine model enzymes retaining activity [8]
Comparative Analysis and Technical Data
Buffer Composition and Separation Conditions
The fundamental differences between electrophoresis methods are exemplified in their buffer compositions, which directly dictate separation mechanisms and outcomes.
Table 2: Comparative Buffer Compositions for PAGE Methodologies
| Component | SDS-PAGE | BN-PAGE | NSDS-PAGE |
|---|---|---|---|
| Sample Buffer | 106 mM Tris HCl, 141 mM Tris Base, 0.51 mM EDTA, 0.22 mM SERVA Blue G-250, 0.175 mM Phenol Red, 2% LDS, 10% Glycerol, pH 8.5 | 50 mM BisTris, 50 mM NaCl, 16 mM HCl, 10% Glycerol, 0.001% Ponceau S, pH 7.2 | 100 mM Tris HCl, 150 mM Tris Base, 0.01875% Coomassie G-250, 0.00625% Phenol Red, 10% Glycerol, pH 8.5 |
| Running Buffer | 50 mM MOPS, 50 mM Tris Base, 1 mM EDTA, 0.1% SDS, pH 7.7 | Cathode: 50 mM BisTris, 50 mM Tricine, 0.02% Coomassie G-250, pH 6.8Anode: 50 mM BisTris, 50 mM Tricine, pH 6.8 | 50 mM MOPS, 50 mM Tris Base, 0.0375% SDS, pH 7.7 |
| Critical Additives | SDS, EDTA, reducing agents | Coomassie G-250, no denaturants | Reduced SDS, no EDTA |
| Key Functional Impact | Complete denaturation, charge masking | Native state preservation, charge shift | Partial structure preservation, metal retention |
Performance Metrics and Functional Outcomes
The selection of electrophoresis methodology significantly impacts functional outcomes, particularly regarding metalloprotein integrity and enzymatic activity retention.
Table 3: Functional Outcomes Across PAGE Methodologies
| Performance Metric | SDS-PAGE | BN-PAGE | NSDS-PAGE |
|---|---|---|---|
| Zinc Retention in Metalloproteins | 26% | >95% [8] | 98% [8] |
| Enzyme Activity Retention | 0/9 model enzymes [8] | 9/9 model enzymes [8] | 7/9 model enzymes [8] |
| Resolution of Complex Mixtures | High | Moderate | High |
| Molecular Weight Determination Accuracy | High | Challenging | Moderate to High |
| Protein Complex Preservation | None (subunits separated) | Excellent | Partial |
| Post-Separation Protein Recovery | Not functional | Functional | Functional for most enzymes |
| Detection Method Compatibility | Staining, western blot, mass spectrometry | Activity assays, native blotting, staining | Staining, activity assays, metal-specific detection |
Research Applications and Strategic Implementation
The Scientist's Toolkit: Essential Reagent Solutions
Successful implementation of PAGE methodologies requires strategic selection of reagents and materials tailored to specific research objectives.
Table 4: Essential Research Reagent Solutions for PAGE Methodologies
| Reagent/Material | Function | Specific Applications |
|---|---|---|
| SDS (Sodium Dodecyl Sulfate) | Denatures proteins, confers uniform negative charge | SDS-PAGE |
| DTT or β-Mercaptoethanol | Reduces disulfide bonds | SDS-PAGE |
| Coomassie G-250 | Imparts charge shift while maintaining native state | BN-PAGE, NSDS-PAGE |
| Protease Inhibitors (PMSF) | Prevents protein degradation during separation | All PAGE methods, especially Native PAGE |
| Benzonase Nuclease | Degrades nucleic acids to reduce sample viscosity | Complex sample preparation for all PAGE |
| TEMED & Ammonium Persulfate | Catalyzes acrylamide polymerization | Gel casting for all PAGE methods |
| Tris-Based Buffers | Maintains stable pH during electrophoresis | All PAGE methods |
| Molecular Weight Markers | Reference standards for size determination | SDS-PAGE primarily, adapted versions for Native PAGE |
| Metal Chelators (EDTA) | Prevents metal-dependent protease activity | SDS-PAGE (omitted in NSDS-PAGE for metal retention) |
| Specialized Stains (TSQ) | Detects specific metal ions in gels | Metalloprotein studies in Native PAGE and NSDS-PAGE |
Method Selection Framework for Research Applications
The strategic selection between electrophoresis methodologies depends fundamentally on research objectives and the nature of the biological questions being addressed.
SDS-PAGE is indicated for:
- Molecular weight determination of protein subunits [1] [2]
- Assessing sample purity and homogeneity
- Protein expression analysis
- Immunoblotting (western blotting) applications [6]
- Proteomic profiling by mass spectrometry
- Analysis of post-translational modifications under denaturing conditions
Native PAGE is preferred for:
- Enzymatic activity studies post-separation [7] [2]
- Protein-protein interaction analysis [7]
- Oligomeric state determination [7] [2]
- Metalloprotein analysis with metal cofactor retention [8]
- Functional screening of protein complexes
- Native protein purification for structural studies
NSDS-PAGE represents a specialized hybrid approach for:
- High-resolution separation with partial activity retention [8]
- Metalloprotein studies requiring fine resolution [8]
- Situations balancing structural integrity with separation power
- Zinc proteome analysis and other metal-binding proteins [8]
The fundamental separation mechanisms in SDS-PAGE and Native PAGE establish these techniques as complementary rather than competitive tools in protein research. SDS-PAGE provides high-resolution separation based primarily on molecular weight through deliberate denaturation, making it ideal for analytical applications requiring mass determination and component resolution. In contrast, Native PAGE employs a multifactorial separation mechanism based on intrinsic charge, hydrodynamic size, and molecular shape under non-denaturing conditions, enabling functional studies and complex analysis. The emerging NSDS-PAGE methodology demonstrates that hybrid approaches can bridge these paradigms, offering high-resolution separation while preserving critical functional characteristics like metal binding in metalloproteins. For researchers and drug development professionals, strategic selection between these methodologies must align with specific research objectives, recognizing that the choice between molecular weight-based versus charge/size/shape-based separation fundamentally dictates the biological information that can be extracted from protein samples. As proteomic research advances toward increasingly complex questions regarding protein function and interaction networks, methodologies that preserve native states while providing high-resolution separation will continue to grow in importance for basic research and pharmaceutical development.
Protein gel electrophoresis is a foundational technique in biochemistry and molecular biology for separating complex protein mixtures. The core principle relies on the fact that charged protein molecules migrate through a porous gel matrix under the influence of an electrical field. The rate of migration is influenced by factors including field strength, the protein's net charge, size, shape, and the properties of the gel matrix itself [9]. The critical choice a researcher makes is the chemical environment in which this separation occurs—denaturing or non-denaturing (native) conditions. This decision fundamentally determines the basis for separation and directly impacts the type of biological information that can be obtained, making it a cornerstone of experimental design in protein research [10] [7].
This guide provides an in-depth technical comparison of protein separation in SDS-PAGE (denaturing) and Native PAGE (non-denaturing) environments, detailing their principles, methodologies, and applications for research and drug development.
Core Concepts and Separation Mechanisms
Denaturing Conditions: SDS-PAGE
In SDS-PAGE (Sodium Dodecyl Sulfate Polyacrylamide Gel Electrophoresis), proteins are denatured and separated primarily by their molecular mass [9] [3]. The system employs the anionic detergent SDS, which binds to hydrophobic regions of the protein backbone at a constant weight ratio (approximately 1.4 g SDS per 1 g of protein) [9]. This SDS coating masks the proteins' intrinsic charges, imparting a uniform negative charge density. Simultaneously, the sample is heated (typically between 70-100°C) in the presence of a reducing agent like β-mercaptoethanol or dithiothreitol (DTT), which cleaves disulfide bonds [9] [10]. The combined action of SDS and reducing agent unfolds the proteins into linear, rod-like chains. Consequently, all SDS-polypeptide complexes have a similar shape and charge-to-mass ratio, allowing separation based almost exclusively on molecular size as they sieve through the polyacrylamide gel [9] [7].
Non-Denaturing Conditions: Native PAGE
In contrast, Native PAGE separates proteins in their folded, native state. No denaturing agents are used in the gel or sample buffer [3] [1]. Separation depends on the protein's intrinsic net charge, size, and three-dimensional shape [9] [10]. In alkaline running buffers, most proteins carry a net negative charge and migrate toward the anode. A protein with a higher negative charge density will migrate faster, while the gel matrix provides a sieving effect that retards larger or more irregularly shaped molecules more than smaller, compact ones [9]. This technique preserves protein function, enzymatic activity, and multimeric subunit interactions, allowing for the analysis of protein complexes in their functional state [9] [10].
Table 1: Fundamental Differences Between SDS-PAGE and Native PAGE
| Parameter | SDS-PAGE (Denaturing) | Native PAGE (Non-Denaturing) |
|---|---|---|
| Basis of Separation | Molecular mass (weight) of polypeptide chains [3] [1] | Native size, net charge, and 3D shape [9] [10] |
| Gel & Buffer Chemistry | Contains SDS (denaturant) and often a reducing agent (DTT/β-mercaptoethanol) [9] [1] | No denaturing or reducing agents; buffer maintains native pH [3] [10] |
| Protein State | Denatured and linearized; disulfide bonds broken [10] | Folded, native conformation; quaternary structure retained [9] [7] |
| Net Charge on Protein | Uniformly negative (from SDS coating) [9] | Intrinsic charge (can be positive or negative) [1] |
| Protein Function Post-Separation | Lost/compromised [1] | Largely retained; proteins can remain active [9] [10] |
| Protein Recovery | Typically not recoverable in functional form [3] | Can be recovered via passive diffusion or electro-elution for functional studies [9] |
| Primary Applications | Molecular weight determination, purity assessment, Western blotting [10] [7] | Analysis of protein complexes, oligomerization state, enzymatic activity assays [9] [7] |
Experimental Protocols and Methodologies
SDS-PAGE Protocol
The following protocol describes a standard discontinuous SDS-PAGE procedure using a mini-gel format [9].
1. Gel Preparation: A polyacrylamide gel is cast between two glass plates. The gel consists of two distinct layers:
- Resolving Gel (Separating Gel): This lower layer has a higher percentage of acrylamide (e.g., 10-12%) and a higher pH (~8.8). Its pore size determines the resolution of proteins by molecular weight [9].
- Stacking Gel: This upper, low-percentage acrylamide layer (~4-5%) is cast on top of the resolving gel at a lower pH (~6.8). Its function is to concentrate all protein samples into a sharp, unified band before they enter the resolving gel, significantly improving resolution [9].
Table 2: Example Recipe for a Traditional 10% SDS-PAGE Resolving Gel
| Component | Volume | Final Concentration/Function |
|---|---|---|
| 40% Acrylamide Solution | 7.5 mL | 10% resolving gel matrix |
| 1.5 M Tris-HCl, pH 8.8 | 7.5 mL | Provides pH for separation |
| 10% SDS | 0.3 mL | Denaturant for consistent charge |
| 10% Ammonium Persulfate (APS) | 0.3 mL | Polymerizing agent |
| TEMED | 0.03 mL | Catalyst for polymerization |
| Water | To 30 mL | Solvent |
2. Sample Preparation: Protein samples are diluted in a loading buffer containing SDS, a reducing agent, glycerol (to increase density), and a tracking dye. The mixture is heated at 95-100°C for 5-10 minutes to ensure complete denaturation and reduction [9] [10].
3. Electrophoresis: The gel cassette is mounted in a tank filled with a running buffer containing Tris, glycine, and SDS. Protein samples and a molecular weight marker (protein ladder) are loaded into the wells. An electrical current is applied (e.g., 100-200 V). The negatively charged proteins and tracking dye migrate toward the positive anode. Electrophoresis is stopped once the tracking dye front reaches the bottom of the gel [9].
Native PAGE Protocol
The Native PAGE protocol shares similarities with SDS-PAGE but lacks denaturing components.
1. Gel Preparation: The gel is cast similarly but without SDS in either the stacking or resolving gel. The buffer system is chosen to maintain a pH that preserves protein native structure and activity (often Tris-glycine or Tris-borate around pH 8.3-8.8) [10]. The acrylamide concentration is selected based on the size of the native proteins or complexes being separated.
2. Sample Preparation: The critical difference is that the sample buffer contains no SDS or reducing agents. The sample is not heated to prevent denaturation. Glycerol and a tracking dye are still included [1].
3. Electrophoresis: The running buffer also lacks SDS. The apparatus is often run in a cold room (4°C) to minimize denaturation and proteolysis during the run [1]. Since proteins retain their native charge, the direction and rate of migration depend on their intrinsic charge at the running buffer's pH.
The Scientist's Toolkit: Essential Research Reagents
Table 3: Key Reagent Solutions for PAGE Experiments
| Reagent/Material | Function | SDS-PAGE | Native PAGE |
|---|---|---|---|
| SDS (Sodium Dodecyl Sulfate) | Anionic detergent that denatures proteins and confers uniform negative charge [9] [3] | Essential | Not Used |
| DTT or β-Mercaptoethanol | Reducing agent that breaks disulfide bonds [3] [10] | Essential | Not Used |
| Acrylamide/Bis-acrylamide | Monomer and crosslinker that form the porous polyacrylamide gel matrix [9] | Essential | Essential |
| APS & TEMED | Ammonium persulfate (APS) and Tetramethylethylenediamine (TEMED) catalyze gel polymerization [9] | Essential | Essential |
| Tris-based Buffers | Provides the conductive and pH-controlled environment for electrophoresis [9] | Essential (pH ~8.8 & ~6.8) | Essential (pH for native structure) |
| Molecular Weight Markers | Pre-stained or unstained proteins of known size for calibrating gels and estimating molecular weight [9] | Essential (for mass determination) | Used (for rough size estimation) |
| Coomassie Blue/Silver Stain | Dyes used to visualize separated protein bands post-electrophoresis [9] | Common | Common |
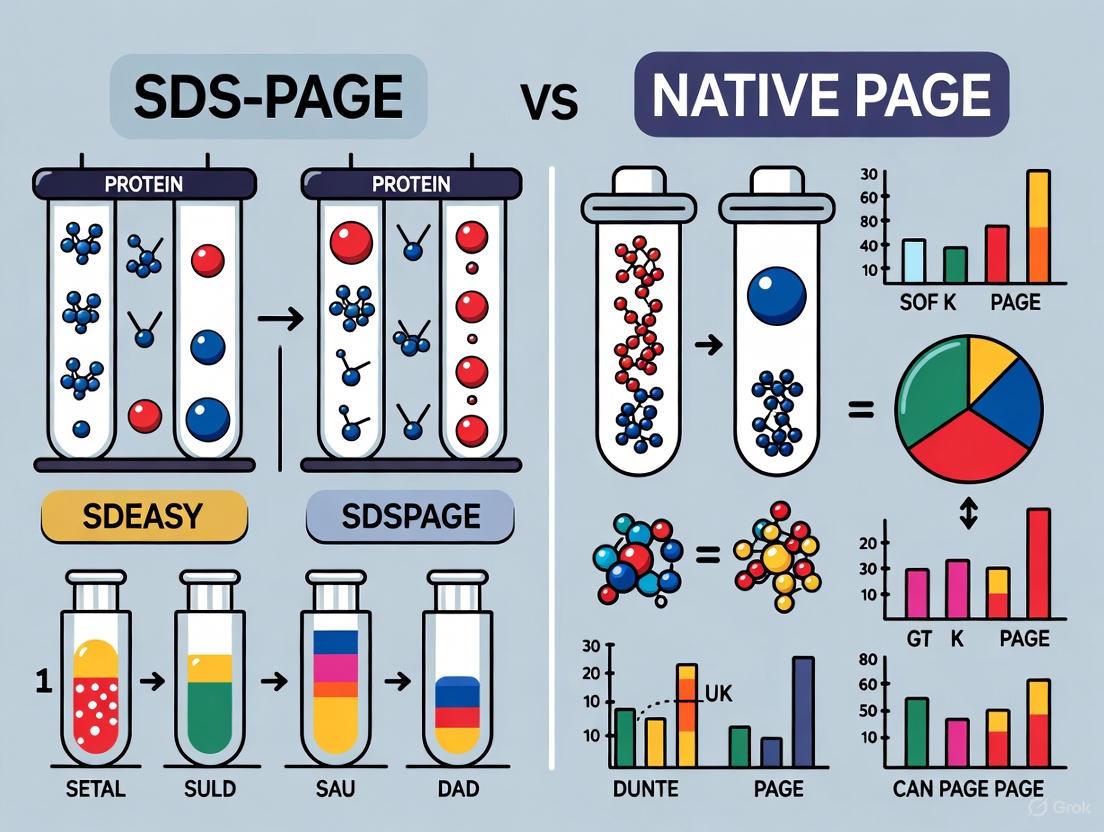
Visualization of Separation Mechanisms
The following diagrams illustrate the core principles and procedural workflows for SDS-PAGE and Native PAGE.
Applications in Research and Drug Development
The choice between these electrophoretic methods is dictated by the research question and downstream applications, particularly in the biopharmaceutical sector.
SDS-PAGE is indispensable for:
- Molecular Weight Determination: Providing a reliable estimate of polypeptide chain size against a protein ladder [10] [1].
- Assessing Purity and Integrity: Checking the homogeneity of a protein preparation or confirming protein expression [10] [7].
- Western Blotting: Serving as the first separation step before transfer to a membrane for immunodetection [9] [7].
- Peptide Mapping and Mass Spectrometry: Preparing samples for in-gel digestion and subsequent protein identification [9].
Native PAGE is the method of choice for:
- Studying Protein Complexes and Oligomeric State: Analyzing intact multi-subunit assemblies and their stoichiometry [9] [7].
- Enzymatic Activity Assays: Zymography, where the gel conditions preserve enzyme function, allowing activity to be detected after separation [9] [10].
- Protein-Protein Interactions: Investigating native interactions and isolating functional complexes directly from the gel [7].
- Purification of Active Proteins: Recovering functional proteins for downstream biochemical studies [9].
In drug development, these techniques are vital for the quality control of protein therapeutics, such as monoclonal antibodies. SDS-PAGE analyzes size heterogeneity and purity, while Native PAGE can be used to monitor aggregation states and the integrity of functional complexes [11].
SDS-PAGE and Native PAGE are complementary pillars of protein analysis. The decision to use denaturing or non-denaturing conditions dictates the fundamental nature of the separation—by mass versus by a combination of native charge, size, and shape. SDS-PAGE offers simplicity, high resolution for polypeptide chains, and is a universal tool for determining molecular weight and sample purity. In contrast, Native PAGE preserves the delicate native structure and function of proteins, enabling the study of active complexes and biomolecular interactions. A deep understanding of their underlying chemical environments allows researchers and drug developers to strategically select the optimal technique to address their specific biological questions and advance their therapeutic programs.
Sodium Dodecyl Sulfate-Polyacrylamide Gel Electrophoresis (SDS-PAGE) represents a cornerstone technique in modern biochemical analysis, enabling researchers to separate complex protein mixtures with exceptional precision. The technique's revolutionary power lies not merely in its electrophoretic separation mechanism, but specifically in the sample preparation step where Sodium Dodecyl Sulfate (SDS) fundamentally transforms protein properties. This transformation allows separation based predominantly on molecular weight, eliminating confounding variables inherent to native protein structures [12]. Within the broader context of protein separation methodologies, SDS-PAGE stands in direct contrast to Native PAGE, which preserves protein structure and function during separation [7]. The critical differentiator between these techniques is the deliberate denaturation and charge normalization accomplished by SDS, which this article examines in comprehensive technical detail. For researchers and drug development professionals, understanding these mechanistic principles is essential for proper experimental design and accurate interpretation of protein separation data across diverse applications from diagnostic development to therapeutic protein characterization.
Molecular Mechanisms of SDS Action
Protein Denaturation and Linearization
SDS operates as a powerful anionic detergent that systematically dismantles protein higher-order structure through a multi-stage process. Initially, SDS disrupts the hydrophobic interactions that stabilize tertiary and quaternary structures by interacting with nonpolar regions of the protein [13]. This detergent action effectively "unfolds" the polypeptide chain, eliminating most of the secondary and tertiary structure that defines a protein's native conformation [12]. The resulting structure is largely a random coil polypeptide chain, with the hydrophobic tails of SDS molecules embedded along the protein backbone and the negatively charged sulfate groups projecting outward into the aqueous environment [14].
Despite SDS's effectiveness at disrupting non-covalent bonds, it cannot break covalent disulfide bridges that may stabilize protein structure. This limitation is addressed through reducing agents like β-mercaptoethanol or dithiothreitol (DTT), which are typically added to SDS sample buffer [12]. These compounds reduce disulfide bonds between cysteine residues, ensuring complete dissociation of protein subunits and full linearization of polypeptide chains [14]. The combined action of SDS and reducing agents produces fully denatured, linear polypeptides whose physical properties now primarily reflect their amino acid chain length rather than their native structural complexity.
Uniform Negative Charge Conferment
The second critical function of SDS is its ability to confer a uniform negative charge density to denatured polypeptides. SDS molecules bind to the protein backbone through hydrophobic interactions at a remarkably consistent ratio of approximately 1.4 grams of SDS per 1 gram of protein [13]. This binding occurs relatively uniformly along the polypeptide chain, with one SDS molecule associating per two amino acid residues on average [12].
This saturation binding results in a cloud of negative charges along the entire length of the denatured polypeptide. The intrinsic charge of individual amino acids, which varies considerably between acidic (negatively charged), basic (positively charged), and neutral residues, becomes effectively masked by this overwhelming surplus of SDS-derived negative charges [15]. Consequently, all proteins migrating in an SDS-PAGE gel carry a strong net negative charge with a consistent charge-to-mass ratio [13]. This charge normalization ensures that when an electric field is applied, all proteins migrate toward the anode (positive electrode) at rates determined primarily by molecular size rather than their inherent electrostatic properties [1].
Table 1: Molecular Mechanisms of SDS Action on Protein Structure
| Mechanism | Molecular Process | Effect on Protein Structure |
|---|---|---|
| Hydrophobic Disruption | SDS intercalates into hydrophobic protein core | Dissolves tertiary and quaternary structure |
| Charge Masking | Negative sulfate groups overwhelm intrinsic protein charge | Neutralizes inherent charge differences between proteins |
| Disulfide Reduction | Reducing agents (DTT, β-mercaptoethanol) break S-S bonds | Separates polypeptide subunits; enables full linearization |
| Linearization | Combination of above processes produces random coil | Eliminates shape-based migration differences |
Comparative Framework: SDS-PAGE versus Native PAGE
The transformative actions of SDS create fundamental distinctions between SDS-PAGE and Native PAGE separation methodologies. These techniques serve complementary but distinct purposes in protein analysis, with the presence or absence of denaturing agents determining their analytical applications [7].
In Native PAGE, proteins remain in their folded, native conformation throughout the separation process. Without SDS to denature and charge-normalize, proteins migrate based on a combination of their intrinsic charge, size, and shape [1]. The net charge—which can be positive, negative, or neutral depending on the protein's isoelectric point and the buffer pH—directly influences migration direction and velocity [7]. This preservation of native structure maintains biological activity, allowing researchers to recover functional proteins from the gel for subsequent enzymatic assays or interaction studies [7]. Native PAGE is particularly valuable for studying protein complexes, oligomerization states, and conformational changes [1].
In contrast, SDS-PAGE intentionally sacrifices native structure and function to achieve separation by molecular weight alone [12]. The denaturing conditions unfold proteins into linear chains, while SDS coating eliminates charge and shape as migration factors [15]. This specialized separation comes at the cost of biological activity, as proteins cannot be recovered in functional form [1]. However, this method provides exceptional resolution for molecular weight determination, purity assessment, and subunit composition analysis [13].
Table 2: Comparative Analysis of SDS-PAGE versus Native PAGE
| Parameter | SDS-PAGE | Native PAGE |
|---|---|---|
| Separation Basis | Molecular weight only | Size, charge, and shape |
| Protein State | Denatured and linearized | Native, folded conformation |
| SDS Presence | Present (1-2% in buffer) | Absent |
| Reducing Agents | DTT or β-mercaptoethanol present | No reducing agents |
| Sample Preparation | Heating (60-100°C) | No heating |
| Net Protein Charge | Uniformly negative | Intrinsic charge (positive or negative) |
| Protein Function | Lost during denaturation | Preserved |
| Post-Separation Recovery | Non-functional polypeptides | Functional proteins |
| Primary Applications | MW determination, purity checks, subunit analysis | Protein complexes, oligomerization, activity studies |
| Typical Running Temperature | Room temperature | 4°C |
Experimental Protocols for SDS-Mediated Sample Preparation
Reagent Composition and Sample Buffer Formulation
Proper sample preparation is critical for successful SDS-PAGE separation, with specific buffer components each serving essential functions in the denaturation and charge-conferment process. A standard 2× concentrated sample buffer typically includes the following components in final working concentrations [14]:
- SDS (1-2%): Primary denaturant that unfolds proteins and confers negative charge.
- Reducing Agent (DTT 160 mM or β-mercaptoethanol 5%): Breaks disulfide bonds for complete linearization.
- Glycerol (10%): Increases sample density for well loading.
- Tris-Cl Buffer (10-20 mM, pH 6.8): Maintains appropriate pH for electrophoresis.
- EDTA (1-2 mM): Chelates divalent cations to inhibit proteolytic enzymes.
- Tracking Dye (Bromophenol Blue, ~0.05 mg/ml): Visualizes migration progress.
The sample preparation protocol involves mixing protein samples with an equal volume of 2× sample buffer, followed by heating at 60-100°C for 5-10 minutes to complete the denaturation process [12]. Heating enhances SDS penetration into hydrophobic regions and ensures complete unfolding, though excessive boiling can cause protein aggregation in some cases [14]. After heating, samples are typically centrifuged briefly to remove any insoluble material before loading onto the gel.
Critical Optimization Parameters
Several factors require optimization to achieve complete denaturation and reliable results:
- Protein Concentration: Ideal loading concentrations range from 0.5-2 mg/ml total protein, with adjustment based on target abundance [14].
- Heating Conditions: Most samples require 5-10 minutes at 95-100°C, though membrane proteins may need lower temperatures to prevent aggregation [14].
- Reducing Agent Stability: DTT and β-mercaptoethanol solutions should be prepared fresh or stored frozen to maintain efficacy.
- SDS Availability: Ensure SDS is fully dissolved in buffer and not precipitated, especially when working at room temperature.
Incomplete denaturation, evidenced by smeared or distorted bands, can often be traced to insufficient reducing agent, outdated reagents, or inadequate heating [16]. Verification of denaturation completeness can be assessed by comparing migration patterns with and without reducing agents, or against a well-characterized protein standard.
Research Reagent Solutions for SDS-PAGE
Table 3: Essential Reagents for SDS-Mediated Protein Denaturation and Separation
| Reagent/Category | Function in SDS-PAGE | Technical Specifications |
|---|---|---|
| SDS (Sodium Dodecyl Sulfate) | Primary denaturant and charge conferment | 1-2% in sample buffer; binds 1.4g SDS/1g protein |
| DTT (Dithiothreitol) | Reducing agent for disulfide bond cleavage | 160 mM in stock buffer; preferred over β-mercaptoethanol |
| β-mercaptoethanol | Alternative reducing agent | 5% in buffer; stronger odor than DTT |
| Tris-Cl Buffer | pH maintenance during denaturation | 10-20 mM, pH 6.8 for sample buffer |
| EDTA (Ethylenediaminetetraacetic acid) | Protease inhibition via cation chelation | 1-2 mM in sample buffer |
| Glycerol | Sample density increase for well loading | 10% in final buffer |
| Bromophenol Blue | Migration tracking dye | ~0.05 mg/ml in buffer |
| Acrylamide/Bis-acrylamide | Gel matrix formation for molecular sieving | 8-15% total concentration; crosslinked matrix |
| TEMED/Ammonium Persulfate | Gel polymerization catalysts | Free radical initiation of acrylamide polymerization |
| Tris-Glycine-SDS Buffer | Running buffer for electrophoresis | Maintains pH and conductivity during separation |
Workflow Integration and Visualization
The denaturation and charge-conferment process represents the critical first stage in the complete SDS-PAGE workflow. The following diagram illustrates the sequential transformation of native proteins into denatured, charge-uniform species ready for electrophoretic separation:
SDS-PAGE Workflow from Denaturation to Separation
The deliberate denaturation and charge normalization imparted by SDS represent a foundational principle that enables precise molecular weight-based protein separation. This transformative process distinguishes SDS-PAGE from Native PAGE and determines their respective applications in biochemical research and drug development. Through its dual mechanisms of structural unfolding and charge masking, SDS effectively eliminates the influence of native protein characteristics that would otherwise complicate electrophoretic separation. The resulting capacity to resolve complex protein mixtures by molecular weight with high reproducibility has established SDS-PAGE as an indispensable tool in modern biology. For researchers designing protein separation strategies, understanding these core principles ensures appropriate technique selection and accurate data interpretation across diverse experimental contexts from basic protein characterization to diagnostic applications.
Polyacrylamide Gel Electrophoresis (PAGE) serves as a fundamental technique in biochemistry and molecular biology laboratories for separating protein mixtures based on their physicochemical properties [7]. The choice between its two primary forms—Sodium Dodecyl Sulfate-PAGE (SDS-PAGE) and Native PAGE—represents a critical methodological crossroads that directly determines whether proteins will be analyzed in their denatured state or with their native conformations preserved. This distinction is not merely technical but fundamentally shapes the type of biological information researchers can extract from their experiments [7] [2].
Within drug development and basic research, understanding protein behavior under different conditions is paramount. SDS-PAGE and Native PAGE offer complementary yet distinct windows into protein characteristics, enabling researchers to address different biological questions [7] [1]. The core divergence lies in their treatment of protein structure: SDS-PAGE intentionally denatures proteins into linear polypeptides for molecular weight determination, while Native PAGE maintains the intricate three-dimensional architecture of proteins, preserving their biological activity and complex interactions [2] [1]. This technical guide explores the mechanistic foundations, methodological considerations, and research applications of these two indispensable techniques, providing scientists with a comprehensive framework for selecting the appropriate approach based on their specific analytical needs.
Fundamental Mechanisms: How SDS-PAGE and Native PAGE Work
SDS-PAGE: Separation by Molecular Weight
SDS-PAGE operates on the principle of complete protein denaturation and uniform charge conferment to achieve separation strictly by molecular mass [13] [17]. The anionic detergent sodium dodecyl sulfate (SDS) plays the pivotal role in this process, binding to hydrophobic regions of proteins at a consistent ratio of approximately 1.4 grams of SDS per 1 gram of protein [13] [17]. This binding mechanism accomplishes two critical functions: first, it disrupts nearly all non-covalent interactions including hydrogen bonds, hydrophobic interactions, and ionic bonds, effectively unfolding proteins into linear polypeptides; second, it masks the proteins' intrinsic charges by imparting a uniform negative charge density along the entire polypeptide backbone [7] [17].
The denaturation process is typically enhanced by heating protein samples to 70-100°C in the presence of excess SDS and reducing agents such as dithiothreitol (DTT) or β-mercaptoethanol, which cleave disulfide bonds to ensure complete unfolding [2] [1]. The resulting SDS-polypeptide complexes share similar charge-to-mass ratios and geometric shapes, ensuring that their migration through the polyacrylamide gel matrix depends solely on molecular size rather than native charge or conformation [2] [17]. The gel itself acts as a molecular sieve, with smaller polypeptides navigating the porous network more efficiently than larger ones, thus achieving separation based strictly on molecular weight [2] [6].
Native PAGE: Separation by Charge, Size, and Shape
In stark contrast to the denaturing approach of SDS-PAGE, Native PAGE maintains proteins in their native, folded conformations throughout the separation process [7] [1]. This technique relies on the intrinsic electrical charges of proteins at the running buffer pH, without the masking effect of SDS [2]. Consequently, separation occurs based on a combination of factors including the protein's net charge, hydrodynamic size (influenced by both mass and three-dimensional shape), and conformational structure [2] [6].
The absence of denaturing agents means that multimeric proteins retain their subunit interactions and quaternary structures [2]. This preservation of native state extends to functional properties, with many proteins maintaining enzymatic activity following separation and recovery from native gels [2] [1]. The migration behavior in Native PAGE is more complex than in SDS-PAGE, as proteins with higher negative charge density migrate faster toward the anode, while the gel matrix exerts a sieving effect that retards larger complexes more than smaller ones [2]. This multi-parameter separation provides information about native protein complexes that is unattainable through denaturing methods, though it may sacrifice the clear molecular weight determination offered by SDS-PAGE [7].
Table 1: Fundamental Separation Mechanisms of SDS-PAGE versus Native PAGE
| Parameter | SDS-PAGE | Native PAGE |
|---|---|---|
| Separation Basis | Primarily molecular mass [2] | Combined charge, size, and shape [2] |
| Protein State | Denatured, linearized polypeptides [7] | Native, folded conformation [7] |
| Charge Characteristics | Uniform negative charge from SDS [17] | Intrinsic charge at running buffer pH [2] |
| Quaternary Structure | Disrupted into subunits [7] | Preserved intact [2] |
| Biological Activity | Typically lost [7] | Often retained [2] |
Comparative Workflow Visualization
The experimental workflows for SDS-PAGE and Native PAGE share similar electrophoretic principles but differ significantly in sample preparation and buffer composition. The following diagram illustrates the key procedural differences:
Methodological Comparison: Detailed Experimental Protocols
Gel Composition and Buffer Systems
Both SDS-PAGE and Native PAGE utilize polyacrylamide gel matrices formed through the polymerization of acrylamide and bisacrylamide cross-linkers, typically initiated by ammonium persulfate (APS) and catalyzed by TEMED [2] [13]. However, the specific gel formulations and buffer systems differ significantly between the two techniques. SDS-PAGE employs a discontinuous buffer system with a stacking gel (pH ~6.8, lower acrylamide concentration) layered above a resolving gel (pH ~8.8, higher acrylamide concentration) [13] [17]. This configuration creates a stacking effect that concentrates protein samples into sharp bands before they enter the resolving region, enhancing separation resolution [13]. The running buffer typically contains Tris-glycine with 0.1% SDS at neutral to basic pH [17].
Native PAGE utilizes milder buffer conditions without SDS, often employing Tris-glycine or Bis-Tris systems at physiological pH ranges to maintain protein stability [2] [8]. The absence of stacking effects in some native systems can result in broader bands but preserves protein interactions. Specialty variants like Blue Native (BN)-PAGE incorporate Coomassie dye to impart charge for migration, while Clear Native (CN)-PAGE relies solely on intrinsic protein charges [1].
Table 2: Detailed Buffer and Gel Composition Comparison
| Component | SDS-PAGE | Native PAGE |
|---|---|---|
| Gel Structure | Discontinuous: stacking & resolving gels [13] | Single concentration or gradient gels [2] |
| Acrylamide Concentration | 4-6% stacking, 10-20% resolving [6] | Variable, typically 4-16% gradients [2] |
| Critical Additives | SDS (0.1-0.5%), reducing agents [17] | No SDS, sometimes Coomassie (BN-PAGE) [1] |
| Sample Buffer | Tris-HCl, SDS, glycerol, bromophenol blue [17] | Tris-based, glycerol, no denaturants [2] |
| Running Buffer | Tris-glycine-SDS or MOPS-SDS [17] | Tris-glycine or Bis-Tris, no SDS [2] |
| Typical pH Range | 6.8 (stacking) to 8.8 (resolving) [13] | 6.0-8.5 (near physiological) [2] |
Sample Preparation Protocols
Sample preparation represents the most distinctive difference between the two techniques, directly determining whether native structures will be preserved or denatured. For SDS-PAGE, protein samples are typically mixed with loading buffer containing SDS (1-2%), reducing agents (50-100 mM DTT or 5% β-mercaptoethanol), glycerol for density, and tracking dyes [17]. This mixture is heated to 70-100°C for 5-10 minutes to ensure complete denaturation and reduction of disulfide bonds [1] [17]. The heating step is crucial for linearizing proteins and facilitating uniform SDS binding.
In contrast, Native PAGE sample preparation deliberately avoids denaturing conditions. Samples are mixed with non-denaturing loading buffer containing only glycerol for density and tracking dyes, without SDS or reducing agents [1]. The mixture is kept at low temperatures (often 4°C) to prevent aggregation or denaturation, and no heating is applied [1]. For temperature-sensitive proteins, all procedures including electrophoresis may be performed in cold rooms or with cooling apparatus to maintain stability [2].
Research Reagent Solutions Toolkit
Table 3: Essential Research Reagents for Protein Electrophoresis
| Reagent | Function | Specific Applications |
|---|---|---|
| SDS (Sodium Dodecyl Sulfate) | Denaturing detergent that binds proteins and confers uniform negative charge [17] | Essential for SDS-PAGE; typically used at 0.1-0.5% in buffers [13] |
| DTT (Dithiothreitol) or β-Mercaptoethanol | Reducing agents that cleave disulfide bonds [13] | SDS-PAGE: ensures complete unfolding; concentrations: 10-100 mM DTT or 1-5% BME [17] |
| TEMED (N,N,N',N'-Tetramethylethylenediamine) | Catalyst for acrylamide polymerization [2] | Universal for both techniques; promotes free radical formation with APS [2] |
| APS (Ammonium Persulfate) | Free radical initiator for acrylamide polymerization [2] | Standard for both SDS-PAGE and Native PAGE gel formation [2] |
| Coomassie G-250 | Charge-conferring dye for protein migration in native conditions [1] | Blue Native PAGE (BN-PAGE); provides minimal denaturation while enabling electrophoretic mobility [1] |
| Protease Inhibitors (PMSF, etc.) | Prevent protein degradation during sample handling [8] | Critical for Native PAGE to maintain protein integrity; often used in cocktail formulations [8] |
Applications in Research and Drug Development
Specific Use Cases for Each Technique
The choice between SDS-PAGE and Native PAGE is fundamentally guided by the research question, as each technique illuminates different aspects of protein characterization. SDS-PAGE excels in applications requiring molecular weight determination, purity assessment, and expression analysis [13]. Its denaturing nature makes it ideal for quantifying protein expression levels across different conditions, such as comparing healthy versus diseased tissues or evaluating recombinant protein production [13]. In pharmaceutical development, SDS-PAGE serves as a critical quality control tool for monitoring antibody purity, detecting degradation products, and verifying subunit composition of biotherapeutic proteins [18].
Native PAGE finds its strength in functional and structural studies where maintaining protein integrity is paramount [7]. It enables researchers to investigate protein-protein interactions, oligomerization states, and enzymatic activities in near-physiological conditions [7] [2]. Native PAGE is particularly valuable for studying membrane protein complexes that often dissociate under denaturing conditions [19]. In drug discovery, this technique helps characterize therapeutic proteins in their active forms and assess compound effects on native protein complexes [19]. Following separation by Native PAGE, proteins can often be recovered in functional form for downstream activity assays or further purification [2] [1].
Advancements and Hybrid Approaches
Recent methodological innovations have expanded the applications of both techniques while addressing their limitations. The development of NSDS-PAGE (Native SDS-PAGE) represents a significant hybrid approach that modifies standard SDS-PAGE conditions by reducing SDS concentration (0.0375% in running buffer) and eliminating heating steps and EDTA from sample preparation [8]. This method preserves enzymatic activity and metal cofactors in many proteins while maintaining high-resolution separation comparable to traditional SDS-PAGE [8]. Studies demonstrate that Zn²⁺ retention in metalloproteins increases from 26% in standard SDS-PAGE to 98% using NSDS-PAGE conditions, with seven of nine model enzymes maintaining activity post-electrophoresis [8].
Capillary electrophoresis SDS (CE-SDS) has emerged as an automated, quantitative alternative to traditional slab gel SDS-PAGE, offering superior resolution and precision for biopharmaceutical applications [18]. This technology enables sensitive detection of antibody fragments and post-translational modifications like glycosylation variants that are difficult to resolve by conventional SDS-PAGE [18]. For membrane proteins, detergent-free reconstitution methods using engineered scaffold peptides allow researchers to extract proteins directly from native membranes into nanodiscs while preserving functional states that are typically disrupted by detergents [19].
Technical Considerations and Decision Framework
Method Selection Guidelines
Choosing between SDS-PAGE and Native PAGE requires careful consideration of experimental goals and protein characteristics. SDS-PAGE is generally preferred when the primary objective involves determining molecular weight, assessing sample purity, analyzing subunit composition, or processing multiple samples efficiently [7] [13]. Its straightforward protocol, high reproducibility, and extensive literature support make it ideal for routine analyses. However, SDS-PAGE is unsuitable for studying functional properties, protein complexes, or metal-binding characteristics due to its denaturing nature [7].
Native PAGE should be selected when investigating protein-protein interactions, oligomeric states, enzymatic activity, or native conformation [7] [2]. It is particularly valuable for analyzing proteins where biological function must be preserved for downstream applications. The main limitations of Native PAGE include more complex interpretation of banding patterns, potential for protein aggregation, and lower resolution for complex mixtures compared to SDS-PAGE [7]. Researchers should also consider that molecular weight standards for Native PAGE provide size estimates rather than precise determinations due to the influence of protein shape and charge on migration [2].
Troubleshooting Common Challenges
Both techniques present distinctive technical challenges that researchers must address for successful implementation. In SDS-PAGE, common issues include smeared bands resulting from incomplete denaturation (addressed by fresh reducing agents and adequate heating), "smiling" bands caused by uneven heating (resolved by reducing voltage or implementing cooling), and unusual banding patterns from protease degradation (mitigated by protease inhibitors) [6]. For Native PAGE, maintaining protein stability throughout the process is critical, requiring careful temperature control (often 4°C), avoidance of pH extremes, and use of protease inhibitors [2]. Protein aggregation may occur in native systems, which can be addressed by optimizing detergent concentrations or using mild non-denaturing detergents [2].
The evolving landscape of protein electrophoresis continues to address these challenges through methodological refinements. The emergence of precast gradient gels, improved staining protocols, and hybrid approaches like NSDS-PAGE [8] expands the technical toolbox available to researchers. By understanding the fundamental principles and practical considerations of both SDS-PAGE and Native PAGE, scientists can make informed decisions about protein separation strategies that align with their specific research objectives in basic science or drug development contexts.
The field of protein biochemistry was transformed in 1970 with Ulrich K. Laemmli's development of high-resolution sodium dodecyl sulfate polyacrylamide gel electrophoresis (SDS-PAGE). Working as a postdoctoral fellow with Aaron Klug at the British Medical Research Council's Laboratory of Molecular Biology in Cambridge, Laemmli sought to analyze the structural proteins of the capsid of phage T4, a problem that had been stymied by the inability to resolve the dozens of proteins involved in particle assembly [20]. His key insight was recognizing that the stacking phenomena described by Ornstein and Davis in discontinuous gel electrophoresis could be made to work for SDS-polypeptide complexes, theoretically enabling high resolution under denaturing conditions [20]. This breakthrough, detailed in his seminal 1970 Nature paper, provided an indispensable tool that has since been cited nearly 300,000 times, fundamentally reshaping protein analysis in molecular biology and biochemistry [21] [17].
The subsequent evolution of electrophoretic techniques has expanded our protein separation capabilities, particularly with the development of native PAGE variants that preserve protein structure and function. This technical guide examines the historical development from Laemmli's SDS-PAGE to modern native PAGE variants, framing this evolution within the broader context of how protein separation principles differ between denaturing and native conditions. For researchers, scientists, and drug development professionals, understanding these complementary techniques is essential for designing experiments that yield the most informative results for specific research objectives, whether focused on protein size, purity, interactions, or functional activity [7].
Fundamental Principles: SDS-PAGE vs. Native PAGE
The Mechanism of SDS-PAGE
SDS-PAGE operates on the principle of complete protein denaturation and uniform charge masking to achieve separation primarily by molecular weight. The technique employs sodium dodecyl sulfate (SDS), an anionic detergent that binds to hydrophobic regions of proteins in a constant ratio of approximately 1.4 grams of SDS per gram of protein – equivalent to one SDS molecule per two amino acids [17]. This binding unfolds proteins into linear chains, masking their intrinsic charge and conferring a uniform negative charge-to-mass ratio [7] [22]. When subjected to an electric field, these SDS-protein complexes migrate through a polyacrylamide gel matrix that acts as a molecular sieve, with smaller proteins moving faster and larger proteins migrating more slowly due to greater resistance [23]. The discontinuous gel system with stacking and separating gels at different pH values creates a stacking effect that concentrates proteins into sharp bands before they enter the separating gel, enhancing resolution [17].
The Mechanism of Native PAGE
In contrast, native PAGE (polyacrylamide gel electrophoresis) maintains proteins in their natural, folded state throughout the separation process. Without denaturing agents like SDS, proteins retain their biological activity, complex structures, and interactive capabilities [7]. Separation occurs based on a combination of the protein's intrinsic charge, size, and shape as they migrate through the gel matrix [1]. The native charge of the protein determines its migration direction and speed, with positively charged proteins moving toward the cathode and negatively charged proteins toward the anode [1]. This preservation of native structure makes the technique particularly valuable for studying functional properties, protein-protein interactions, oligomerization states, and enzymatic activities under conditions that mimic the cellular environment [7].
Table 1: Fundamental Separation Principles of SDS-PAGE and Native PAGE
| Parameter | SDS-PAGE | Native PAGE |
|---|---|---|
| Separation Basis | Molecular weight primarily | Size, charge, and shape |
| Protein State | Denatured and linearized | Native, folded conformation |
| Charge Characteristics | Uniform negative charge from SDS | Intrinsic charge maintained |
| Structural Preservation | Disrupts secondary, tertiary, and quaternary structures | Preserves higher-order structures |
| Functional Activity | Proteins typically inactive | Proteins often retain function |
| Buffer Conditions | Contains SDS and reducing agents | No denaturing or reducing agents |
| Sample Preparation | Heating required (95°C, 5 minutes) | No heating, maintained at 4°C |
Historical Development and Technical Evolution
Pre-Laemmli Foundations
The foundations for Laemmli's breakthrough were established in the 1960s through key innovations in electrophoretic theory and methodology. Baruch Davis and Leonard Ornstein at New York's Mt. Sinai Hospital developed discontinuous polyacrylamide gel electrophoresis to resolve proteins in blood and related samples [20]. Their work established the use of polyacrylamide as an ideal matrix due to its transparency, biological unreactivity, chemical inertness, neutral charge, controllable pore size, and mechanical strength [20]. Ornstein's description of the stacking phenomenon and compression of protein species between different buffer systems provided the theoretical framework that Laemmli would later adapt for denaturing conditions [20]. Concurrently, Jacob V. Maizel Jr. had demonstrated that poliovirus particles could be dissociated and solubilized using SDS, with polypeptide chains migrating through acrylamide gels proportionally to their molecular weight [20]. However, these early SDS gels produced broad bands adequate for simple viral proteomes but insufficient for complex mixtures like T4 phage with dozens of protein components [20].
Laemmli's Breakthrough Innovation
Laemmli's critical contribution was finding a buffer system in which SDS-polypeptide chains would concentrate and stack at a buffer interface, enabling high-resolution separation under denaturing conditions [20]. His systematic approach involved testing numerous buffer and gel solutions, casting gels in glass tubes, running samples, then cracking open the tubes, slicing, drying and staining the gel slices – a laborious process often involving exposure to SDS aerosols and neurotoxic acrylamide before their health risks were fully understood [20]. The successful implementation allowed him to demonstrate that T4 heads assembled from more than six different proteins and to identify them as products of specific T4 genes [20]. The method immediately proved invaluable for mapping viral self-assembly pathways, identifying proteolytic processing events, and revealing scaffolding functions in morphogenesis [20] [21].
Post-Laemmli Technical Advancements
Following Laemmli's initial development, several key advancements enhanced the practicality and applications of electrophoretic separation. The transition from tube gels to slab gels, particularly through the work of William Studier and Pat O'Farrell, enabled simultaneous analysis of multiple samples, dramatically improving efficiency and comparative analysis [20]. The introduction of two-dimensional electrophoresis combining isoelectric focusing with SDS-PAGE significantly expanded separation power for complex protein mixtures [20] [22]. Subsequent innovations included western blotting for specific protein detection, northern blotting for nucleic acids, and specialized variants like blue native PAGE (BN-PAGE) and clear native PAGE (CN-PAGE) for analyzing membrane protein complexes and oligomeric states under non-denaturing conditions [20] [1].
Modern Methodologies: Experimental Protocols
Standard SDS-PAGE Protocol
The contemporary SDS-PAGE procedure follows a well-established workflow with specific reagents and conditions optimized for reproducible protein separation by molecular weight [22] [17].
Gel Preparation: Polyacrylamide gels are typically cast between two glass plates with spacers (0.75-1.5 mm thickness) determining loading capacity. The separating gel (typically 10-12% acrylamide for most applications) is prepared first with acrylamide, bisacrylamide cross-linker, Tris-HCl buffer (pH 8.8), SDS, and polymerized with ammonium persulfate (APS) and TEMED catalyst. After polymerization, a stacking gel (4-6% acrylamide with Tris-HCl buffer, pH 6.8) is poured on top with a sample comb inserted to create wells [17]. Gradient gels with increasing acrylamide concentration (e.g., 4-12%) can be cast using a gradient mixer for expanded separation range [17].
Sample Preparation: Protein samples are diluted in sample buffer (typically containing Tris-HCl, glycerol, SDS, bromophenol blue, and reducing agents like DTT or β-mercaptoethanol) [24] [17]. Samples are heated to 95°C for 5 minutes (or 70°C for 10 minutes) to denature proteins and ensure complete SDS binding [17]. For molecular weight estimation, a protein ladder with known molecular weights is prepared alongside experimental samples [23].
Electrophoresis: Denatured samples are loaded into wells and electrophoresis is performed in SDS-containing running buffer (typically Tris-glycine with 0.1% SDS) at constant voltage (100-150V for mini-gels) until the dye front approaches the gel bottom [22] [17]. The process typically takes 40-60 minutes depending on gel concentration and voltage [22].
Protein Detection: Following separation, proteins are visualized using staining methods with varying sensitivity: Coomassie Blue for general detection (compatible with mass spectrometry), silver staining for enhanced sensitivity, or fluorescent stains for broad dynamic range [22]. For western blotting, proteins are transferred to a membrane for antibody-based detection [22] [23].
Standard Native PAGE Protocol
Native PAGE maintains proteins in their functional state through modifications to the standard SDS-PAGE protocol [1] [8].
Gel Preparation: Polyacrylamide gels are cast without SDS or other denaturing agents. The gel percentage is selected based on the target protein size, similar to SDS-PAGE, but without the discontinuous buffer system [1]. For specific applications, specialized variants like Blue Native PAGE (BN-PAGE) include Coomassie dye in the cathode buffer, while Clear Native PAGE (CN-PAGE) maintains native protein charge without dyes [1] [8].
Sample Preparation: Protein samples are mixed with non-denaturing sample buffer (typically containing Tris-HCl, glycerol, and a tracking dye like bromophenol blue) without SDS or reducing agents [1] [8]. Critically, samples are not heated to preserve native structure [1]. The native charge of proteins determines their migration direction, with some proteins moving toward the anode and others toward the cathode [1].
Electrophoresis: Electrophoresis is performed using non-denaturing running buffers (typically Tris-glycine without SDS) at lower temperatures (4°C) to maintain protein stability and prevent denaturation during separation [1]. Running times may be longer than SDS-PAGE due to more complex migration behavior [1].
Detection and Recovery: Following electrophoresis, proteins can be detected through gentle staining methods or activity assays. Importantly, proteins can often be recovered from native gels in functional form for downstream applications [1].
Advanced Modern Variants
Blue Native PAGE (BN-PAGE): This technique uses Coomassie Brilliant Blue dye to impart charge to proteins while maintaining native structure, enabling analysis of protein complexes and oligomeric states [1] [8]. The dye binds non-covalently to proteins, providing the necessary charge for electrophoresis without significant denaturation [8]. BN-PAGE is particularly valuable for studying membrane protein complexes and mitochondrial respiratory chains [8].
Clear Native PAGE (CN-PAGE): This approach relies solely on the intrinsic charge of proteins under native conditions without added dyes [1]. While preserving maximal biological activity, the resolution may be lower than BN-PAGE due to variable charge-to-mass ratios among different proteins [1].
Native SDS-PAGE (NSDS-PAGE): A hybrid approach developed to balance resolution with functional preservation reduces SDS concentration in running buffers (0.0375% instead of 0.1%) and eliminates heating steps [8]. This method retains zinc in metalloproteins (98% metal retention versus 26% in standard SDS-PAGE) and preserves enzymatic activity in 7 of 9 model enzymes tested [8].
Table 2: Performance Comparison of Electrophoretic Techniques in Proteomic Analysis
| Technique | Proteins Identified | Key Advantages | Limitations | Best Applications |
|---|---|---|---|---|
| 1D SDS-PAGE | 2552 proteins (supernatant fraction) [25] | Excellent for comparative quantitation; simple protocol [25] | Destroys functional properties; poor for membrane proteins [8] | Molecular weight determination; purity assessment |
| Preparative SDS-PAGE | ~2600 proteins (precipitate fraction) [25] | Effective for insoluble fractions; good recovery | Sample loss during processing; manual intensive [24] | Analysis of membrane and insoluble proteins |
| 2D-PAGE (Native) | 4323 proteins [25] | Highest sensitivity; reveals protein interactions [25] | Limited to soluble fractions; poor reproducibility [24] | Protein interaction mapping; complex samples |
| IEF-IPG | Highest peptides per protein [24] | Superior for quantitative and structural characterization [24] | Limited dynamic range; challenging automation [24] | PTM analysis; quantitative profiling |
| BN-PAGE/CN-PAGE | Varies by complex size | Preserves native complexes and function [8] | Lower resolution than SDS-PAGE; molecular weight ambiguity [8] | Oligomeric states; functional studies |
The Scientist's Toolkit: Essential Research Reagents
Table 3: Essential Reagents for Protein Electrophoresis
| Reagent | Function | Application Notes |
|---|---|---|
| SDS (Sodium Dodecyl Sulfate) | Denatures proteins and confers uniform negative charge; binds 1.4g per gram protein [17] | Critical for SDS-PAGE; concentration above CMC (7-10 mM) required for denaturation [17] |
| Polyacrylamide/Bis-acrylamide | Forms porous gel matrix for molecular sieving [20] | Concentration determines pore size (4-20%); cross-linking ratio affects gel properties [22] |
| TEMED/Ammonium Persulfate | Catalyzes acrylamide polymerization [17] | TEMED concentration affects polymerization rate; fresh APS solution recommended |
| DTT/β-Mercaptoethanol | Reducing agents that break disulfide bonds [17] | Essential for complete denaturation; DTT preferred over β-ME for less odor [17] |
| Tris-based Buffers | Maintain pH during electrophoresis [17] | Discontinuous system uses different pH in stacking (pH 6.8) and separating (pH 8.8) gels [17] |
| Coomassie Brilliant Blue | Protein stain for visualization [22] | Standard for general detection; compatible with mass spectrometry; sensitivity ~100 ng [22] |
| Glycine/Other trailing ions | Create discontinuous buffer system [17] | Essential for stacking effect; mobility changes with pH create sharp protein bands [17] |
Applications and Research Implications
Complementary Information from Denaturing and Native Approaches
Contemporary research demonstrates that SDS-PAGE and native PAGE variants provide complementary information valuable for comprehensive protein characterization. In comparative studies analyzing human bronchial smooth muscle cells, SDS-PAGE-MS identified 2552 proteins with advantages in comparative quantitation between samples, while nondenaturing 2DE-MS identified 4323 proteins with enhanced sensitivity and the ability to visualize protein interactions [25]. This orthogonal approach reveals different aspects of protein behavior, with SDS-PAGE excelling at quantitative analysis of individual subunits and native techniques preserving functional complexes [25].
Implications for Drug Development and Biotechnology
The historical development from Laemmli's SDS-PAGE to modern native variants has profound implications for pharmaceutical research and development. SDS-PAGE remains indispensable for quality control, purity assessment, and molecular weight determination of therapeutic proteins [22]. Meanwhile, native techniques enable critical functional assessments of protein-drug interactions, complex formation, and conformational stability under near-physiological conditions [7] [8]. The biotechnology industry initially struggled with protein aggregation and misfolding issues that SDS-PAGE helped diagnose but couldn't resolve functionally – a limitation addressed by native approaches [21]. Understanding both denatured and native states of therapeutic proteins provides comprehensive characterization essential for regulatory approval and clinical efficacy [8].
The evolution from Laemmli's foundational SDS-PAGE method to modern native PAGE variants represents a continuous refinement of protein separation technology driven by diverse research needs. While SDS-PAGE remains the workhorse for determining molecular weight, assessing purity, and analyzing subunit composition under denaturing conditions, native techniques preserve functional properties essential for understanding biological activity. The historical development of these complementary approaches demonstrates how methodological innovations respond to scientific questions – from Laemmli's original goal of resolving phage structural proteins to contemporary needs for analyzing protein complexes and interactions in drug development. For today's researchers, selecting the appropriate electrophoretic technique requires careful consideration of the specific information needed, recognizing that SDS-PAGE and native PAGE answer fundamentally different questions about protein structure and function. As electrophoretic methods continue to evolve, particularly with hybrid approaches like NSDS-PAGE that balance resolution with functional preservation, the core principles established by Laemmli remain foundational to protein biochemistry and biotechnology.
In the fields of biochemistry, molecular biology, and drug development, polyacrylamide gel electrophoresis (PAGE) stands as a foundational analytical technique for protein characterization. While the differences between its two primary variants—SDS-PAGE (sodium dodecyl sulfate-polyacrylamide gel electrophoresis) and Native PAGE—are often emphasized for their distinct applications, their shared operational framework is equally critical. These methodologies are unified by a common set of core principles that govern the electrophoretic separation of proteins [7] [2]. Primarily, both techniques utilize a polyacrylamide gel matrix as a molecular sieve and rely on the driving force of an electric field to separate protein molecules based on their physicochemical properties [26] [27] [2]. This shared foundation allows researchers to extract complementary information from a single protein sample, enabling a more comprehensive analysis that can inform everything from basic research to targeted therapeutic drug development. This guide delves into the core similarities in their principles and matrix usage, providing a detailed technical reference for scientists leveraging these indispensable tools.
Core Electrophoresis Principles
The separation of proteins in both SDS-PAGE and Native PAGE is governed by a common set of physical principles that dictate how molecules migrate through a gel under an electric field.
The Driving Force: Electric Field and Charge
At its most fundamental level, both techniques rely on the fact that charged protein molecules will migrate through a conducting solvent when subjected to an electrical field [26] [27]. The direction of migration is determined by the net charge of the protein at the buffer's pH. In the alkaline running buffers commonly used, most proteins carry a net negative charge and will migrate towards the positively charged anode [28] [2]. The mobility of a molecule through this electric field is influenced by several interrelated factors: the field strength, the net charge on the molecule, and the ionic strength of the buffer [26] [2].
The Regulating Force: Molecular Sieving
The polyacrylamide gel is not a passive support medium but an active participant in the separation. It forms a three-dimensional mesh-like network with defined pore sizes [26]. As proteins migrate, this matrix creates a frictional, sieving effect that regulates their movement based on size and three-dimensional shape [28] [2]. Smaller proteins and polypeptides encounter less resistance and can navigate the pores more easily, leading to faster migration. Conversely, larger proteins face greater frictional forces and migrate more slowly [29] [2]. This sieving effect is a cornerstone of both techniques, though the specific protein properties being sieved (mass alone vs. native size and shape) differ.
The Polyacrylamide Gel Matrix
The polyacrylamide gel is the central component shared by both SDS-PAGE and Native PAGE, serving as the medium through which separation occurs.
Composition and Polymerization
The gel is formed through the chemical polymerization of acrylamide (Acr) and a cross-linking agent, most commonly N,N'-methylenebisacrylamide (Bis) [26]. This reaction is catalyzed by ammonium persulfate (APS) as the free radical provider and TEMED (N,N,N',N'-tetramethylethylenediamine) as the catalyst [26] [2]. The polymerization process creates a covalent network whose properties can be precisely controlled by the researcher. The resulting gel is characterized by its strength, elasticity, and transparency, and is suitable for easy handling and subsequent analysis [26].
Control of Pore Size and Sieving Properties
The sieving properties of the gel are not fixed; they can be finely tuned by adjusting the chemical composition during casting. Two key parameters define this:
- T (%): The total concentration of acrylamide and bisacrylamide, which primarily controls the average pore size. A higher T% yields a gel with a smaller pore size, better for resolving smaller proteins [2].
- C (%): The mass fraction of the cross-linker (Bis) relative to the total acrylamide, which affects the rigidity of the polymer network [26].
Researchers select a gel concentration based on the molecular weight of their target proteins. Low-percentage gels (e.g., 6-8%) are used to resolve high molecular weight proteins, while high-percentage gels (e.g., 12-15%) are used for low molecular weight proteins [2]. For a broader separation range, gradient gels are employed, which have a low acrylamide concentration at the top and a high concentration at the bottom [2].
Table 1: Standard Gel Compositions for Different Protein Size Ranges
| Target Protein Size | Recommended Gel Concentration (T%) | Primary Separation Mechanism |
|---|---|---|
| Large Proteins (>100 kDa) | 6% - 8% | Molecular sieving through larger pores |
| Medium Proteins (30-100 kDa) | 10% - 12% | Balanced sieving and resolution |
| Small Proteins (<30 kDa) | 12% - 15% | Molecular sieving through smaller pores |
| Broad Range (10-300 kDa) | 4%-20% Gradient | Progressive sieving across the gel length |
Common Methodological Framework
The experimental workflow for SDS-PAGE and Native PAGE shares multiple key steps, from gel casting to final detection.
Standardized Equipment and Setup
Both techniques use an nearly identical setup, which includes [29] [27] [2]:
- A power supply to provide a constant current or voltage.
- An electrophoresis chamber or tank to hold the buffer and gel.
- Glass plates and spacers to form a cassette for casting the gel.
- A comb to create wells for sample loading.
The gel cassette is mounted vertically in the apparatus, which is then filled with a running buffer that conducts current. Protein samples are loaded into the wells, and a current is applied.
The Discontinuous Gel and Buffer System
A critical similarity in modern implementations is the use of a discontinuous (or disc) buffer system with a stacked gel structure [17]. This system employs two distinct gel layers cast in a single cassette [29] [26]:
- Stacking Gel: A large-pore gel with a lower percentage of acrylamide (typically 4-5%) and a different pH (e.g., pH 6.8). This gel acts to concentrate all protein samples into a sharp, unified band before they enter the separating gel, vastly improving resolution [2].
- Separating (Resolving) Gel: A small-pore gel with a higher percentage of acrylamide (ranging from 6% to 20%) and a different pH (e.g., pH 8.8). This is where the actual size-based separation of proteins occurs [29] [2].
Shared Detection and Analysis Techniques
After electrophoresis, the procedures for visualizing and analyzing the separated proteins are largely identical. The most common method is protein staining with dyes like Coomassie Brilliant Blue or fluorescent stains [26] [17]. Following staining, the resulting banding patterns can be analyzed using densitometry to determine relative abundance or, with the use of standards, molecular weight [2]. Furthermore, proteins separated by either method can be transferred to a membrane (e.g., PVDF or nitrocellulose) for western blotting analysis with specific antibodies [7] [28].
Diagram 1: Shared PAGE Workflow.
The Scientist's Toolkit: Essential Reagents and Materials
Successful execution of both SDS-PAGE and Native PAGE relies on a core set of high-quality reagents and materials.
Table 2: Essential Research Reagent Solutions for PAGE
| Reagent/Material | Core Function | Key Considerations |
|---|---|---|
| Acrylamide-Bis Solution | Forms the cross-linked polyacrylamide gel matrix. | Toxic in monomeric form; stable for ~1 month at 4°C; pre-mixed solutions ensure consistency [26]. |
| Tris-Based Buffers | Provides the ionic environment and pH for electrophoresis and polymerization. | Different pH for stacking (pH 6.8) and separating (pH 8.8) gels is critical for discontinuous systems [26] [17]. |
| APS & TEMED | Catalyzes the free-radical polymerization of acrylamide. | TEMED should be added last to initiate gel casting; polymerization rate is temperature-dependent [26] [2]. |
| Protein Ladder (MW Standards) | Allows estimation of protein molecular weight and monitors run progress. | Contains pre-defined proteins of known mass; essential for analytical comparisons [27] [2]. |
| Coomassie Staining Solution | Visualizes separated protein bands post-electrophoresis. | Standard method for total protein detection; requires destaining for optimal contrast [26] [17]. |
| Power Supply & Electrophoresis Chamber | Generates the electric field and holds the gel/buffer system. | Must provide constant voltage/current; safety features are essential [27] [2]. |
SDS-PAGE and Native PAGE, while designed for different analytical endpoints, are built upon a shared technological foundation. Their reliance on the core principles of electrophoresis, the molecular sieving properties of a tunable polyacrylamide matrix, and a common methodological workflow makes them complementary tools in the scientist's arsenal. For researchers in drug development and biotechnology, a deep understanding of these similarities is not merely academic. It enables the informed selection of the appropriate technique for a given question, facilitates the intelligent troubleshooting of experimental protocols, and allows for the integration of data from both methods to build a more holistic understanding of protein identity, structure, and function. By mastering the unified principles outlined in this guide, scientists can more effectively leverage these powerful techniques to drive innovation from the bench to the clinic.
Practical Protocols: When and How to Apply Each Technique in Research Workflows
The core thesis governing protein separation in polyacrylamide gel electrophoresis (PAGE) is that the choice of sample preparation protocol directly dictates the level of structural information obtained. SDS-PAGE and Native PAGE represent two philosophically distinct approaches: one dismantles protein structure to determine molecular weight, while the preserves it to analyze function and quaternary structure [1] [3]. This divergence is established almost entirely during sample preparation, where the use of reducing agents, heat, and specific buffer compositions dictates whether proteins are denatured to their primary structure or maintain their native, folded conformation.
In SDS-PAGE, the anionic detergent sodium dodecyl sulfate (SDS) unfolds proteins and binds to the polypeptide backbone at a constant ratio, masking intrinsic charges and imparting a uniform negative charge density [17]. This allows separation based almost exclusively on molecular mass [6]. Conversely, Native PAGE employs non-denaturing conditions without SDS, meaning a protein's migration depends on its combined intrinsic charge, size, and shape [1] [3]. This fundamental difference in separation criteria, governed by sample treatment, dictates the applications for which each method is suited, from simple purity checks to functional enzyme assays.
SDS-PAGE Sample Preparation: Denaturation for Mass-Based Separation
Core Reagents and Their Biochemical Roles
The SDS-PAGE sample preparation protocol is a deliberate process of protein denaturation designed to eliminate structural variables. The key components work in concert to reduce the protein to a linear polymer. A detailed breakdown of these reagents and their functions is provided in the table below.
Table 1: Essential Research Reagent Solutions for SDS-PAGE Sample Preparation
| Reagent | Function | Typical Concentration |
|---|---|---|
| SDS (Sodium Dodecyl Sulfate) | Denatures proteins by disrupting hydrogen bonds; binds uniformly to coat proteins with negative charges [17] [3]. | 1-2% (w/v) in sample buffer [17]. |
| Reducing Agents (DTT, β-Mercaptoethanol) | Cleaves disulfide bonds between cysteine residues to fully unfold proteins [30] [6]. | DTT: 10-100 mM; β-Mercaptoethanol: 5% (v/v) [17]. |
| Glycerol | Increases sample density for facile loading into gel wells [3]. | 10-20% (v/v) [8]. |
| Tracking Dye (Bromophenol Blue) | Visualizes sample migration during electrophoresis [17]. | 0.001-0.01% (w/v) |
| Tris-HCl Buffer | Provides a stable pH for the sample solution [8] [17]. | 50-100 mM, pH ~6.8 [8]. |
Detailed Experimental Protocol
The following workflow and detailed steps outline a standard SDS-PAGE sample preparation protocol, commonly used for analytical resolution of complex protein mixtures such as cell lysates or serum proteins [31].
Diagram 1: SDS-PAGE Sample Prep Workflow
- Sample Mixing: Combine the protein sample with an appropriate volume of 2X or 4X Laemmli sample buffer [17]. The buffer typically contains Tris-HCl (pH 6.8), SDS, glycerol, bromophenol blue, and a reducing agent.
- Heat Denaturation: Cap the tubes and heat the samples at 95°C for 5 minutes in a heat block or boiling water bath [17]. This critical step disrupts secondary and tertiary protein structures by breaking hydrogen bonds, allowing SDS to bind uniformly to the hydrophobic regions of the polypeptide chain.
- Cooling and Centrifugation: Briefly centrifuge the heated samples to bring down condensation and collect the entire volume at the bottom of the tube.
- Loading: The samples are now ready to be loaded into the wells of a polyacrylamide gel. The glycerol in the buffer ensures the sample sinks evenly to the bottom of the well [3].
Native PAGE Sample Preparation: Preservation of Native Structure
Core Reagents and Strategic Omissions
Native PAGE sample preparation is defined by the deliberate omission of certain reagents used in SDS-PAGE. The objective is to maintain the protein's higher-order structure, enzymatic activity, and post-translational modifications [1] [3].
Table 2: Essential Research Reagent Solutions for Native PAGE Sample Preparation
| Reagent | Function | Key Consideration |
|---|---|---|
| Non-denaturing Detergent | Mild detergents (e.g., Digitonin) may be used for membrane proteins without denaturing [32]. | Replaces SDS; used at low concentrations to prevent aggregation. |
| Glycerol | Increases sample density for loading [8]. | Same function as in SDS-PAGE. |
| Coomassie Dye (BN-PAGE) | Imparts negative charge to proteins in Blue Native PAGE [8]. | Not used in Clear Native PAGE (CN-PAGE) [32]. |
| Native Buffer (e.g., BisTris) | Provides a stable, non-denaturing pH environment [8]. | Lacks denaturants and reducing agents. |
Detailed Experimental Protocol
The protocol for Native PAGE is designed to be gentle, avoiding any steps that would disrupt the native conformation of the protein.
Diagram 2: Native PAGE Sample Prep Workflow
- Sample Mixing: Gently mix the protein sample with a native sample buffer. This buffer is characteristically free of SDS, reducing agents, and other denaturants [1]. It typically contains a non-denaturing buffer like Bis-Tris, glycerol, and sometimes a mild dye like phenol red [8].
- Omission of Heating: Do not heat the samples [1]. Heating is a major denaturing step and is incompatible with the goal of Native PAGE.
- Temperature Control: Keep the samples on ice or at 4°C throughout preparation to maintain stability [1].
- Loading and Electrophoresis: Load the samples onto the native gel. To prevent denaturation during the run, electrophoresis is often performed in a cold room or using a cooling apparatus [1].
Comparative Analysis: Experimental Outcomes and Method Selection
Quantitative Comparison of Separation Outcomes
The different sample preparation protocols lead to dramatically different experimental outcomes, as quantifiable through protein recovery, metal ion retention, and functional activity.
Table 3: Quantitative Comparison of Experimental Outcomes Based on Sample Prep
| Parameter | SDS-PAGE | Native PAGE | NSDS-PAGE (Hybrid) |
|---|---|---|---|
| Metal Ion Retention | ~26% (Zn²⁺) [8] | High (Not quantified) [8] | ~98% (Zn²⁺) [8] |
| Enzymatic Activity Post-Electrophoresis | 0/9 model enzymes active [8] | 9/9 model enzymes active [8] | 7/9 model enzymes active [8] |
| Basis of Separation | Molecular mass only [1] [3] | Size, charge, and shape [1] [3] | Primarily size, with native properties retained [8] |
| Protein Recovery for Further Use | Not functional [1] [3] | Functional proteins can be recovered [1] [3] | Functional proteins can be recovered [8] |
A Hybrid Approach: Native SDS-PAGE (NSDS-PAGE)
Recent methodological advances demonstrate that the dichotomy between denaturing and non-denaturing electrophoresis is not absolute. A technique termed Native SDS-PAGE (NSDS-PAGE) has been developed, which modifies standard SDS-PAGE conditions by drastically reducing the SDS concentration in the running buffer (e.g., to 0.0375%) and omitting SDS, EDTA, and the heating step from the sample preparation [8]. This hybrid approach aims to balance the high resolution of SDS-PAGE with the functional retention of Native PAGE. As shown in Table 3, this method results in markedly improved retention of bound metal ions and enzymatic activity compared to fully denaturing SDS-PAGE [8].
The selection between SDS-PAGE and Native PAGE sample preparation is a critical strategic decision that directly determines the success of downstream analysis. The protocols are fundamentally incompatible, with one requiring rigorous denaturation and the other demanding its careful avoidance.
For researchers and drug development professionals, the choice is guided by the core research question:
- Choose SDS-PAGE when the goal is to determine subunit molecular weight, assess purity, or analyze expression levels. Its strength lies in its simplicity and high resolution based on a single property: mass.
- Choose Native PAGE when the goal is to study native conformation, oligomeric state, protein-protein interactions, or enzymatic activity. Its power is in providing data on the functional, folded protein.
Emerging techniques like NSDS-PAGE and advanced capillary electrophoresis methods (e.g., CE-SDS) offer new avenues to overcome traditional limitations, providing improved quantitative precision, automation, and the ability to retain certain native properties without sacrificing resolution [8] [33]. By understanding the profound impact of reducing agents, heating, and buffer composition, scientists can strategically select and optimize the sample preparation protocol that most effectively aligns with their analytical objectives.
In the realm of protein separation, polyacrylamide gel electrophoresis (PAGE) serves as a foundational technique, with its two principal variants—SDS-PAGE and native PAGE—offering complementary insights for research and drug development. The core principle of electrophoresis involves the movement of charged protein molecules through a solvent under the influence of an electrical field, with separation achieved as molecules migrate at rates proportional to their charge density and size [34]. The specific configuration of the gel matrix, particularly the use of stacking and resolving layers or gradient formulations, is a critical determinant in the efficacy and resolution of this separation. This guide delves into the intricate chemistry and configuration of these gels, framing their functions within the broader thesis of how protein separation fundamentally differs under denaturing (SDS-PAGE) and non-denaturing (native PAGE) conditions.
SDS-PAGE employs a discontinuous buffer system and the anionic detergent sodium dodecyl sulfate (SDS) to denature proteins, mask their intrinsic charge, and facilitate separation based predominantly on molecular mass [34] [35] [17]. In contrast, native PAGE maintains proteins in their folded, biologically active state, enabling separation based on a combination of the protein's native charge, size, and three-dimensional shape [34] [7]. This fundamental distinction in objective dictates the subsequent choices in gel chemistry and configuration, which are engineered to optimize for either a single dominant parameter (mass) or a complex interplay of native properties.
Core Principles of Gel Electrophoresis
The Polyacrylamide Gel Matrix
The polyacrylamide gel serves as a porous medium, functioning as a molecular sieve that regulates the movement of proteins [34]. It is formed through the polymerization of acrylamide monomers cross-linked by N,N'-methylenebisacrylamide (bis-acrylamide) [34] [36]. The polymerization reaction is catalyzed by tetramethylethylenediamine (TEMED), which promotes the formation of free radicals from ammonium persulfate (APS), thereby initiating the chain reaction that solidifies the gel [34] [36] [17].
The pore size of the resulting matrix is inversely related to the total percentage of acrylamide; a higher percentage creates a tighter mesh with smaller pores, which is more effective at resolving smaller proteins, while a lower percentage with larger pores is better suited for separating larger proteins [34] [35]. This relationship allows researchers to tailor the gel composition to the specific molecular weight range of their target proteins.
The Discontinuous Buffer System
A key innovation in SDS-PAGE is the use of a discontinuous buffer system [35] [17]. This system employs different buffers in the gel (stacking vs. resolving) and the running buffer tank, creating a discontinuity in both pH and ionic composition. This setup is engineered to concentrate the protein sample into a sharp band before it enters the resolving gel, which is essential for achieving high-resolution separation [34] [35]. The mechanism hinges on the manipulation of the mobility of ions, particularly glycine, in the running buffer as they encounter different pH environments [35].
Gel Configuration: Stacking vs. Resolving Gels
The Resolving Gel
The resolving gel, also known as the separating gel, is where the actual separation of proteins based on molecular weight occurs. Its composition is optimized for its sieving function.
- Function: The primary function of the resolving gel is to separate proteins based on their size [34] [36]. In SDS-PAGE, this translates to separation by molecular mass, whereas in native PAGE, separation is by size, charge, and shape [7].
- Typical Composition: It has a higher percentage of acrylamide (e.g., 10-12%), creating a smaller pore size for molecular sieving, and a higher pH (typically pH 8.8) [35] [36] [17].
The Stacking Gel
The stacking gel is layered on top of the resolving gel and is designed to concentrate all protein samples into a single, sharp band before they enter the resolving phase.
- Function: To "stack" or concentrate the protein samples from the relatively large volume of the loading well into a very narrow band, ensuring they all enter the resolving gel at the same time. This process is critical for producing sharp, well-defined bands [34] [35].
- Typical Composition: It has a lower percentage of acrylamide (e.g., 4-5%), which offers less resistance and allows for freer protein movement. It is also buffered at a lower pH (typically pH 6.8) [35] [36] [17].
The following workflow illustrates how proteins migrate through these gel layers and how the key buffer, glycine, functions in the stacking mechanism.
Quantitative Comparison of Gel Layers
The distinct roles of the stacking and resolving gels are achieved through deliberate differences in their chemical composition, as summarized in the table below.
Table 1: Quantitative Comparison of Stacking and Resolving Gel Compositions in a Typical Tris-Glycine SDS-PAGE System
| Parameter | Stacking Gel | Resolving Gel |
|---|---|---|
| Primary Function | Concentrates protein samples into a sharp band [35] | Separates proteins based on molecular weight [34] |
| Typical Acrylamide Percentage | 4% - 5% [35] [17] | 8% - 12% (can be higher for small proteins) [34] [17] |
| Typical pH | 6.8 [35] [36] [17] | 8.8 [35] [36] [17] |
| Pore Size | Larger [35] | Smaller [34] |
| Key Ionic Mechanism | Glycine exists as a zwitterion, moving slowly [35] | Glycine is negatively charged, moving quickly [35] |
Gradient Gel Formulations
Concept and Configuration
Gradient gels represent an advanced configuration where the acrylamide concentration is not constant but varies linearly or non-linearly from the top to the bottom of the gel. For instance, a gradient might run from 4% acrylamide at the top to 12% or even 20% at the bottom [34] [17]. This creates a continuum of pore sizes, with larger pores at the top and progressively smaller pores towards the bottom. Gradient gels are typically cast using a specialized gradient mixer [17].
Advantages and Applications
The primary advantage of a gradient gel is its ability to resolve a much broader range of protein molecular weights on a single gel compared to a fixed-percentage gel [34]. A low-percentage gel is optimal for large proteins but allows small proteins to migrate off the gel quickly, while a high-percentage gel resolves small proteins well but may impede the entry and migration of large proteins. A gradient gel combines these properties: large proteins separate well in the lower-concentration region at the top, while small proteins continue to be resolved as they travel through the increasingly tighter matrix, leading to sharper bands across a wide size range [34]. Furthermore, the gradient itself can perform the concentrating function of a stacking gel, making a separate stacking layer unnecessary in some protocols [34].
Table 2: Comparison of Gel Configurations for Protein Separation
| Gel Configuration | Separation Principle | Optimal Use Case | Key Advantages |
|---|---|---|---|
| Fixed-Percentage Gel | Molecular sieving through a uniform pore size [34] | Analysis of proteins within a known, narrow molecular weight range | Simplicity in preparation and optimization [34] |
| Gradient Gel | Molecular sieving through a continuously decreasing pore size [34] [17] | Analysis of complex samples with a wide molecular weight range or unknown size | Broad separation range; sharper bands; can eliminate need for stacking gel [34] |
| Native Gel (No Stacking) | Combined effect of native charge, size, and shape [34] [7] | Study of native protein complexes, oligomeric states, and functional activity | Preserves protein function and complex integrity [7] [37] |
The Scientist's Toolkit: Essential Reagents for Gel Electrophoresis
Successful protein separation relies on a suite of critical reagents, each serving a specific function in sample preparation, gel polymerization, and electrophoresis.
Table 3: Essential Reagents for Protein Gel Electrophoresis
| Reagent | Function | Technical Note |
|---|---|---|
| SDS (Sodium Dodecyl Sulfate) | Denatures proteins; binds to polypeptide backbone to confer uniform negative charge [35] [36] [17] | Typically used at a concentration above 1 mM for full denaturation [17] |
| Acrylamide/Bis-acrylamide | Forms the cross-linked polymer matrix that acts as a molecular sieve [34] [36] | Pore size is determined by the total acrylamide percentage and the bis-acrylamide crosslink ratio [34] |
| APS & TEMED | Catalyze the free-radical polymerization of the polyacrylamide gel [34] [36] [17] | TEMED stabilizes free radicals generated by APS to initiate polymerization [36] |
| Tris-HCl Buffer | Provides the required pH environment in the stacking and resolving gels [35] | Discontinuous system uses different pH values (6.8 and 8.8) in different gel layers [35] |
| Glycine | Key ion in the running buffer for the discontinuous system; charge state changes with pH to enable stacking [35] | At pH 8.3, it is anionic; at pH 6.8, it becomes a zwitterion, slowing its mobility [35] |
| DTT or β-Mercaptoethanol | Reducing agents that break disulfide bonds in proteins, aiding complete denaturation [36] [17] | Essential for "reducing SDS-PAGE" to analyze protein subunits [30] |
| Ammonium Persulfate (APS) | A radical initiator that generates free radicals for acrylamide polymerization when combined with TEMED [34] [17] | A 10% solution is commonly used in gel recipes [34] |
Experimental Protocols
Detailed Protocol: Casting a Discontinuous SDS-PAGE Gel
This protocol outlines the steps for preparing a traditional Tris-glycine mini gel for SDS-PAGE [34] [36].
- Assemble Gel Cassette: Clean and dry two glass plates separated by spacers and clamped together to form a leak-proof cassette.
- Prepare and Cast Resolving Gel:
- Mix the following components in a beaker: 7.5 mL of 40% acrylamide solution, 3.9 mL of 1% bisacrylamide solution, 7.5 mL of 1.5 M Tris-HCl (pH 8.7), and water to a final volume of 30 mL [34].
- Add 0.3 mL of 10% SDS and swirl to mix [34].
- To initiate polymerization, add 0.3 mL of 10% ammonium persulfate (APS) and 0.03 mL of TEMED. Mix swiftly and avoid introducing bubbles [34].
- Immediately pipette the solution into the gel cassette to the desired height. Carefully layer a small amount of isopropanol or water-saturated butanol over the gel to exclude oxygen and create a flat meniscus [36] [17].
- Allow the gel to polymerize completely (approximately 15-30 minutes). A distinct schlieren line will appear between the gel and the alcohol layer.
- Prepare and Cast Stacking Gel:
- Pour off the isopropanol and rinse the top of the resolving gel with water. Blot away residual liquid with filter paper.
- In a new beaker, mix components for a stacking gel: e.g., a lower percentage acrylamide solution (e.g., 4%) buffered with Tris-HCl at pH 6.8 [35] [17].
- Add APS and TEMED as before to initiate polymerization.
- Pour the stacking gel solution directly onto the resolving gel. Immediately insert a clean sample comb without trapping bubbles.
- Allow the stacking gel to polymerize fully.
- Sample Preparation: Dilute protein samples in Laemmli buffer (containing Tris-HCl, SDS, glycerol, bromophenol blue, and a reducing agent like β-mercaptoethanol) [35]. Heat the samples at 95°C for 5 minutes (or 70°C for 10 minutes) to fully denature the proteins [17].
- Electrophoresis: Mount the gel cassette in the electrophoresis tank filled with running buffer (e.g., Tris-glycine-SDS, pH 8.3) [35]. Load prepared samples and molecular weight markers into the wells. Apply a constant voltage (e.g., 80-120 V for a mini-gel) until the dye front reaches the bottom of the gel [17].
This protocol is designed to separate proteins in their native, functional state [7] [37].
- Gel Preparation: Cast a polyacrylamide gel without SDS or reducing agents in the recipe. A single-concentage resolving gel or a gradient gel can be used, typically without a stacking gel, though discontinuous native systems also exist [37]. The buffer system is chosen to maintain a pH that preserves protein activity (often neutral to basic).
- Sample Preparation: The key distinction is that the sample is not heated or treated with SDS or reducing agents. The sample is mixed with a native sample buffer, which may contain glycerol and a tracking dye, but no denaturants [7].
- Electrophoresis and Analysis: The gel is run in a running buffer lacking SDS. Since proteins retain their native charge, they can migrate towards the anode or cathode depending on their isoelectric point and the buffer pH. It is crucial to run the apparatus cool to prevent denaturation [34]. Following electrophoresis, proteins can be detected with stains compatible with activity assays, or recovered from the gel for functional studies [34] [7].
The configuration of the gel matrix—whether employing a discontinuous stack-resolve system or a gradient formulation—is a sophisticated exercise in protein physical chemistry, directly engineered to achieve a specific separation objective. The choice between SDS-PAGE and native PAGE dictates the entire experimental design, from sample treatment to gel chemistry. SDS-PAGE, with its deterministic separation by mass, is an unparalleled tool for analytical and proteomic applications requiring determination of molecular weight, purity, and subunit composition. Native PAGE, by preserving the delicate ecosystem of native protein structure, opens a window into the functional world of protein complexes, interactions, and enzymatic activity. For the researcher, a deep understanding of how stacking gels concentrate, how resolving gels sieve, and how gradients expand the dynamic range is fundamental to designing robust, reproducible, and informative electrophoretic experiments, ultimately accelerating discovery in basic research and therapeutic development.
In protein analysis, the choice between SDS-PAGE and Native PAGE represents a fundamental methodological crossroads that dictates whether proteins will be separated in a denatured or native state. This decision directly impacts the preservation of protein function, complex integrity, and biological activity. Running conditions—specifically temperature requirements and buffer system composition—serve as critical determinants in optimizing either approach. While SDS-PAGE employs denaturing conditions that destroy native protein structure but provide superior resolution based primarily on molecular weight, Native PAGE maintains protein complexes and functional properties but with reduced resolving power. Understanding these technical parameters is essential for researchers and drug development professionals seeking to align their electrophoretic methodology with specific research objectives, whether for protein characterization, complex analysis, or functional studies.
Fundamental Principles: SDS-PAGE vs. Native PAGE
SDS-PAGE: Denaturing Separation
Sodium dodecyl sulfate polyacrylamide gel electrophoresis (SDS-PAGE) is the most widely used technique for high-resolution separation of complex protein mixtures. The method relies on initial denaturation of proteins with the anionic detergent SDS, which binds to proteins and imparts a uniform negative charge proportional to their molecular mass. This process unfolds proteins and destroys functional properties including non-covalently bound metal ions and enzymatic activity. Proteins subsequently migrate through a porous acrylamide gel matrix under an electric field, separating almost exclusively based on molecular mass with excellent resolution [8] [30].
The standard SDS-PAGE protocol involves heating protein samples in a buffer containing SDS and often reducing agents like β-mercaptoethanol or dithiothreitol (DTT) to further break down quaternary structures and disulfide linkages. This denaturing approach makes SDS-PAGE ideal for applications assessing protein purity, evaluating expression levels, determining molecular weights, and immunochemical identification via western blotting, but unsuitable for studying native protein function [8] [30].
Native PAGE: Preservation of Native Structure
Native PAGE (or BN-PAGE for Blue Native PAGE) employs non-denaturing conditions that preserve protein structure and maintain functional properties. Unlike SDS-PAGE, Native PAGE does not use denaturing detergents in the sample preparation or running buffers. Proteins are prepared in non-reducing, non-denaturing sample buffers that maintain secondary structure and native charge density. Consequently, proteins separate based on a combination of factors including their native charge, size, and shape rather than molecular mass alone [8] [38].
This preservation of native state allows Native PAGE to maintain enzymatic activity, protein-protein interactions, and cofactors including bound metal ions. However, this comes at the cost of reduced protein resolving power compared to SDS-PAGE. Native PAGE is particularly valuable for studying oligomeric states, protein complexes, and functional properties, making it indispensable for structural biology and enzymology research [8] [39].
Buffer System Composition: A Comparative Analysis
Buffer systems represent one of the most significant technical differences between denaturing and native electrophoretic methods, directly impacting protein behavior during separation.
SDS-PAGE Buffer Systems
Standard SDS-PAGE employs buffer systems containing SDS in both sample and running buffers to maintain protein denaturation and consistent charge-to-mass ratios [8] [30].
Table 1: SDS-PAGE Buffer Compositions
| Buffer Component | Sample Buffer | Running Buffer |
|---|---|---|
| SDS Concentration | 2% LDS [8] | 0.1% SDS [8] |
| Reducing Agents | Optional: DTT or β-mercaptoethanol [30] [40] | None |
| Buffer Base | Tris HCl/Tris Base [8] | MOPS/Tris Base [8] |
| Chelating Agents | 0.51 mM EDTA [8] | 1 mM EDTA [8] |
| Tracking Dye | Phenol Red [8] | Not applicable |
| Glycerol | 10% [8] | Not applicable |
Native PAGE Buffer Systems
Native PAGE buffers deliberately exclude denaturing agents and instead use mild detergents or Coomassie dye to facilitate protein migration while maintaining native structure [8] [38].
Table 2: Native PAGE Buffer Compositions
| Buffer Component | BN-PAGE Sample Buffer | NSDS-PAGE Sample Buffer | Standard Native PAGE Running Buffer |
|---|---|---|---|
| Detergent/Dye | 0.001% Ponceau S [8] | 0.01875% Coomassie G-250 [8] | None |
| SDS Concentration | None | 0.0375% (reduced) [8] | None |
| Buffer Base | BisTris [8] | Tris HCl/Tris Base [8] | Tris/Glycine [38] |
| Chelating Agents | None | None | None |
| Glycerol | 10% [8] | 10% [8] | 25% (sample buffer) [38] |
| Salt | 50 mM NaCl [8] | None | None |
Specialized Buffer Systems: NSDS-PAGE
Native SDS-PAGE (NSDS-PAGE) represents a hybrid approach that modifies standard SDS-PAGE conditions to retain some native properties while maintaining high resolution. This method removes SDS and EDTA from the sample buffer, omits the heating step, and reduces SDS in the running buffer from 0.1% to 0.0375%. Research demonstrates that these modifications increase Zn²⁺ retention in proteomic samples from 26% to 98%, with seven of nine model enzymes retaining activity after electrophoresis [8].
Temperature Requirements and Optimization
Temperature control during electrophoresis significantly impacts separation efficiency and protein integrity, with distinct considerations for denaturing versus native approaches.
SDS-PAGE Temperature Protocols
Standard SDS-PAGE is typically performed at room temperature with electrophoresis conducted at constant voltage (200V) for approximately 45 minutes [8]. A critical step in SDS-PAGE is the heating of protein samples prior to loading, usually at 70°C for 10 minutes [8]. This heating step ensures complete protein denaturation and SDS binding, which is essential for uniform charge distribution and accurate molecular weight-based separation.
Native PAGE Temperature Requirements
Native PAGE requires strict temperature control to maintain protein stability and function. The method specifically recommends omitting heating during sample preparation [38]. For electrophoresis running conditions, Native PAGE should ideally be performed with cooling systems, with one protocol specifically recommending placing "the system on ice" to prevent protein degradation during separation [38]. This temperature-sensitive approach preserves the delicate tertiary and quaternary structures necessary for maintaining enzymatic activity and complex integrity.
BN-PAGE protocols run at similar room temperature conditions (constant 150V for 90-95 minutes) [8], but the absence of denaturants reduces the risk of heat-induced aggregation or denaturation during separation.
Experimental Protocols and Methodologies
Standard SDS-PAGE Protocol
- Sample Preparation: Mix 7.5 μL protein sample (5-25 μg protein) with 2.5 μL 4X LDS sample loading buffer [8]
- Denaturation: Heat sample at 70°C for 10 minutes [8]
- Gel Loading: Load samples into precast NuPAGE Novex 12% Bis-Tris 1.0 mm minigels alongside pre-stained molecular weight standards [8]
- Electrophoresis: Run at constant voltage (200V) for approximately 45 minutes at room temperature using 1X MOPS SDS running buffer until dye front reaches gel end [8]
- Analysis: Proceed to staining, western blotting, or other downstream applications
Standard Native PAGE Protocol
- Sample Preparation: Mix protein sample with non-reducing, non-denaturing sample buffer (62.5 mM Tris-HCl, pH 6.8, 25% glycerol, 1% bromophenol blue) - DO NOT HEAT [38]
- Gel Preparation: Cast separating gel (6-15% acrylamide concentration) in 0.375 M Tris-HCl (pH 8.8) with ammonium persulfate (AP) and TEMED, allow to polymerize 20-30 minutes [38]
- Stacking Gel: Prepare stacking gel (0.375 M Tris-HCl pH 8.8) with AP and TEMED, insert comb, polymerize 20-30 minutes [38]
- Electrophoresis: Load samples, run at appropriate voltage (recommended to place system on ice to prevent protein degradation) using Tris/glycine running buffer (25 mM Tris, 192 mM glycine, pH ~8.3) [38]
- Analysis: Stain with Coomassie-blue or proceed to immuno-blotting while maintaining native conditions [38]
BN/SDS-PAGE Two-Dimensional Protocol
For comprehensive analysis of protein complexes, BN-PAGE can be coupled with SDS-PAGE in a two-dimensional approach:
- First Dimension: Separate native protein complexes using BN-PAGE with Cathode Buffer (50 mM BisTris, 50 mM Tricine, 0.02% Coomassie G-250, pH 6.8) and Anode Buffer (50 mM BisTris, 50 mM Tricine, pH 6.8) [8] [39]
- Lane Excision: After electrophoresis, cut lanes from BN-PAGE gel [39]
- Second Dimension: Place BN-PAGE lanes on SDS-PAGE gel, separate under denaturing conditions [39]
- Analysis: Identify complex subunits while correlating with native molecular weights
This approach has been successfully applied to snake venoms, demonstrating maintained enzymatic activity of metalloproteinases and serine proteinases after separation [39].
Technical Workflow: SDS-PAGE vs. Native PAGE
The diagram below illustrates the key procedural differences between SDS-PAGE and Native PAGE methodologies, highlighting how buffer and temperature requirements create divergent pathways for protein separation.
The Scientist's Toolkit: Essential Research Reagents
Table 3: Essential Reagents for Protein Electrophoresis
| Reagent | Function | Specific Applications |
|---|---|---|
| SDS (Sodium Dodecyl Sulfate) | Denaturing detergent that binds proteins, imparting uniform negative charge | SDS-PAGE: Essential for denaturation and molecular weight-based separation [8] [30] |
| DTT or β-mercaptoethanol | Reducing agents that break disulfide bonds | Reducing SDS-PAGE: Disrupts quaternary structure, analyzes protein subunits [30] [40] |
| Coomassie G-250 | Anionic dye that binds proteins, causing charge shift | BN-PAGE: Facilitates protein migration while maintaining native state [8] [39] |
| Bromophenol Blue | Tracking dye that monitors electrophoresis progress | Both SDS-PAGE and Native PAGE: Visualizes migration front [40] [38] |
| Tris/Glycine Buffer | Discontinuous buffer system for stacking and separating proteins | Native PAGE: Running buffer that maintains native protein structure [38] |
| MOPS/Tris Buffer | Running buffer system for electrophoretic separation | SDS-PAGE: Maintains denaturing conditions during electrophoresis [8] |
| Glycerol | Increases sample density for gel loading | Both methods: Ensbles samples to sink properly into gel wells [8] [38] |
| TEMED & Ammonium Persulfate | Catalyzes acrylamide polymerization | Gel preparation: Essential for creating polyacrylamide gel matrix [38] |
Implications for Research and Drug Development
The strategic selection between SDS-PAGE and Native PAGE running conditions has profound implications for experimental outcomes and therapeutic development.
Protein Characterization and Purity Assessment
SDS-PAGE remains the gold standard for determining protein purity, molecular weight estimation, and expression analysis due to its superior resolution and denaturing characteristics. The standardized running conditions allow for consistent, reproducible results across laboratories. For drug development, this approach is invaluable for quality control of recombinant protein therapeutics, vaccine development, and biosimilar characterization [30].
Functional Protein Analysis and Complex Characterization
Native PAGE enables researchers to study proteins in their functional states, preserving enzymatic activity, protein-protein interactions, and metal ion binding. The modified NSDS-PAGE conditions demonstrate that retention of functional properties is achievable while maintaining reasonable resolution [8]. In venom research, BN/SDS-PAGE has revealed functional protein complexes in Bothrops snake venoms, with maintained enzymatic activity of metalloproteinases and serine proteinases after separation [39]. This preservation of biological activity is crucial for understanding mechanism of action in both toxins and therapeutic proteins.
Structural Biology and Therapeutic Development
The growing understanding of protein complex structures in physiological and pathological processes makes Native PAGE increasingly valuable for structural biology. With 60-90% of snake venoms consisting of proteins that form covalent and/or non-covalent complexes [39], and similar complex formation occurring in human biological systems, Native PAGE provides insights that denaturing methods cannot. For drug development professionals, understanding these native interactions informs targeted therapeutic approaches, particularly for complex-based diseases and enzyme-targeting drugs.
Temperature requirements and buffer systems fundamentally differentiate SDS-PAGE and Native PAGE, creating complementary tools for protein analysis. SDS-PAGE employs denaturing buffers with heating steps and room temperature electrophoresis to achieve high-resolution separation based primarily on molecular weight. In contrast, Native PAGE utilizes non-denaturing buffers without heating, often with cooling systems, to preserve native structure and function at the cost of some resolution. The recent development of NSDS-PAGE demonstrates that hybrid approaches can balance resolution preservation with functional retention. For researchers and drug development professionals, strategic selection and optimization of these running conditions remains essential for generating biologically relevant data, whether the goal is protein characterization, functional analysis, or therapeutic development. As electrophoretic techniques continue to evolve, the fundamental relationship between buffer composition, temperature control, and protein behavior will continue to guide methodological innovation in protein science.
Molecular weight determination is a fundamental technique in biochemical research, with methodologies diverging significantly based on the electrophoretic principle employed. Within the context of protein separation, Sodium Dodecyl Sulfate-Polyacrylamide Gel Electrophoresis (SDS-PAGE) and Native PAGE represent two powerful yet distinct approaches. SDS-PAGE separates proteins primarily by molecular mass under denaturing conditions, making it ideal for precise molecular weight determination [1] [7]. In contrast, Native PAGE separates proteins based on a combination of their intrinsic charge, size, and three-dimensional shape under non-denaturing conditions, preserving their native conformation and biological activity [2].
The critical difference lies in sample preparation: SDS-PAGE uses the anionic detergent SDS to denature proteins and confer a uniform negative charge, effectively negating the influence of a protein's inherent charge and structure [17]. Native PAGE omits denaturants, allowing proteins to maintain their native state, which means separation depends on both the protein's size and overall charge at the running pH [1] [2]. This fundamental distinction dictates the choice of methodology—SDS-PAGE for determining subunit molecular weight and purity, and Native PAGE for analyzing protein complexes, oligomerization states, and native function [7].
The Principle of Molecular Weight Determination in SDS-PAGE
The Role of SDS in Linearizing and Charging Proteins
In SDS-PAGE, the anionic detergent SDS plays a pivotal role by binding to hydrophobic regions of proteins in a constant weight ratio of approximately 1.4 g SDS per 1 g of protein [17]. This binding unfolds the proteins into linear polypeptide chains, masking their intrinsic charges and imparting a uniform negative charge density [2] [17]. Consequently, when an electric field is applied, all SDS-bound proteins migrate through the polyacrylamide gel matrix toward the positively charged anode at rates inversely proportional to the logarithm of their molecular mass [1] [23]. The gel matrix acts as a molecular sieve, where smaller proteins navigate the pores more easily and migrate faster, while larger proteins are retarded [2].
The Calibration Curve: Relating Migration Distance to Molecular Weight
The determination of an unknown protein's molecular weight relies on constructing a calibration curve using a protein ladder—a mixture of proteins with known molecular weights that is electrophoresed alongside the samples [41] [2]. The relationship between the migration distance and molecular weight is logarithmic. After separation, the migration distance of each standard protein band from the well is measured. A calibration curve is then generated by plotting the logarithm of the molecular weight (Log MW) of each standard against its migration distance [2]. The molecular weight of an unknown protein is determined by comparing its migration distance to this standard curve.
Experimental Protocol: Using a Protein Ladder for Calibration
Materials and Reagent Setup
The following toolkit is essential for performing molecular weight determination via SDS-PAGE.
Table 1: Research Reagent Solutions for SDS-PAGE and Molecular Weight Determination
| Item | Function | Key Considerations |
|---|---|---|
| Protein Ladder [41] | A set of proteins of known molecular weights for creating the calibration curve. | Available in prestained (for run monitoring) and unstained (for high accuracy) formats. |
| Acrylamide/Bis-acrylamide [2] | Forms the cross-linked polymer gel matrix that acts as a molecular sieve. | Gel percentage determines pore size; higher % for better separation of low MW proteins. |
| SDS (Sodium Dodecyl Sulfate) [17] | Anionic detergent that denatures proteins and confers uniform negative charge. | Critical for disrupting secondary and tertiary structures and ensuring separation by mass. |
| Reducing Agent (e.g., DTT, β-ME) [1] [17] | Cleaves disulfide bonds to fully denature protein subunits. | Ensures proteins are linearized and separation reflects polypeptide chain mass. |
| Tris-Glycine Buffer [17] | Common electrophoresis running buffer that conducts current and maintains pH. | The discontinuous system (stacking/separating gel) enhances band sharpness. |
| Protein Stain (e.g., Coomassie) [2] | Visualizes separated protein bands on the gel post-electrophoresis. | Allows measurement of migration distances for both standards and unknown samples. |
Step-by-Step Methodology
Step 1: Sample and Standard Preparation Protein samples and the protein ladder are prepared in a loading buffer containing SDS and a reducing agent like Dithiothreitol (DTT) or β-mercaptoethanol [17] [42]. A typical sample buffer consists of 62.5 mM Tris-HCl (pH 6.8), 2% SDS, 10% glycerol, 0.01% bromophenol blue, and 5% β-mercaptoethanol or 100 mM DTT [17]. The mixtures are then heated at 95°C for 5 minutes to ensure complete denaturation [17].
Step 2: Gel Electrophoresis A polyacrylamide gel is cast, typically with a stacking gel (e.g., 4-5% acrylamide) layered on top of a resolving gel (e.g., 10-12% acrylamide) [17]. The prepared samples and ladder are loaded into wells. Electrophoresis is performed at a constant voltage (e.g., 100-200 V) using a Tris-glycine-SDS running buffer until the dye front approaches the bottom of the gel [2] [17].
Step 3: Protein Staining and Visualization After electrophoresis, the gel is stained with a protein-binding dye such as Coomassie Brilliant Blue to visualize the separated protein bands [2]. The migration distance of each band in the ladder and the unknown samples is measured from the top of the resolving gel.
Step 4: Data Analysis and MW Determination
- Record Data: Note the known molecular weight (MW) and measured migration distance (Rf) for each band in the protein ladder.
- Create Calibration Curve: Plot the Log₁₀(MW) of the standard proteins against their migration distance. The resulting curve should be approximately linear in the middle range of the gel.
- Determine Unknown MW: Measure the migration distance of the unknown protein band. Locate this distance on the calibration curve and interpolate to find the corresponding Log(MW). Calculate the actual molecular weight.
Table 2: Example Data from a Hypothetical Protein Ladder for Calibration Curve Generation
| Protein Standard | Molecular Weight (kDa) | Log₁₀(MW) | Migration Distance (mm) |
|---|---|---|---|
| Myosin | 250 | 2.40 | 12 |
| Phosphorylase B | 130 | 2.11 | 18 |
| BSA | 95 | 1.98 | 22 |
| Ovalbumin | 50 | 1.70 | 30 |
| Carbonic Anhydrase | 35 | 1.54 | 36 |
| Lysozyme | 20 | 1.30 | 45 |
Critical Considerations and Troubleshooting
Limitations and Factors Affecting Accuracy
Despite its widespread use, the accuracy of molecular weight determination by SDS-PAGE has inherent limitations, with typical errors around ±10% [17]. Several protein-specific factors can lead to anomalous migration:
- Post-Translational Modifications (PTMs): Additions like glycosylation or phosphorylation increase the apparent mass of a protein but do not affect its SDS-binding capacity proportionally. A heavily glycosylated protein may run at a higher molecular weight than predicted from its amino acid sequence [43].
- Amino Acid Composition: Proteins with unusual amino acid compositions (e.g., highly charged or proline-rich regions) may bind SDS differently, leading to deviations from expected mobility [43].
- Multimeric Complexes: Incompletely reduced disulfide bonds or SDS-resistant protein interactions can result in bands corresponding to multimers rather than monomeric subunits [17].
Recent research integrating SDS-PAGE with mass spectrometry has created databases of accurate electrophoretic migration patterns to help troubleshoot these discrepancies and improve the reliability of Western blot data [43].
Troubleshooting Common Issues
- Poor Linear Fit of Calibration Curve: Ensure the protein ladder is appropriate for the gel percentage used. Consider using a gradient gel for a broader separation range [2].
- Smearing or Diffuse Bands: This can indicate protein degradation, overloaded samples, or improper gel polymerization. Use fresh samples and ensure gels are properly cast and run at the correct temperature [23].
- Inconsistent Migration Between Runs: Standardize sample preparation (especially heating time) and running conditions (voltage, buffer composition) to ensure reproducibility [42].
Molecular Weight Analysis in Native PAGE
While SDS-PAGE is the standard for polypeptide molecular weight determination, Native PAGE employs a different principle. Without SDS, a protein's migration depends on its intrinsic charge, size, and shape [2]. Specialized ladders, such as the NativeMark Unstained Protein Standard, are required [41]. These standards are composed of native protein complexes with known molecular weights and charges.
In Native PAGE, the calibration curve still plots Log(MW) against migration distance. However, because the protein's own charge significantly influences mobility, the estimated "molecular weight" is only accurate for proteins with a similar charge density to the standards. Therefore, the value obtained is an apparent molecular weight that provides information about the protein's native oligomeric state but is not as precise for mass determination as SDS-PAGE [41] [2].
The use of protein ladders and calibration curves remains a cornerstone of protein analysis, enabling reliable molecular weight estimation. The choice between SDS-PAGE and Native PAGE dictates the type of information gained: SDS-PAGE provides the mass of denatured polypeptide chains, ideal for assessing purity, expression, and subunit composition, while Native PAGE yields an apparent mass of the native, functional protein, useful for studying complexes and activity. Understanding the principles, meticulously executing the protocol, and critically interpreting the data within the context of each method's limitations are essential for accurate molecular weight determination in modern biochemical research.
Within biochemical research, polyacrylamide gel electrophoresis (PAGE) serves as a fundamental tool for protein analysis. The core distinction in PAGE methodologies lies between denaturing techniques, primarily SDS-PAGE, and non-denaturing or "native" techniques. Sodium dodecyl sulfate polyacrylamide gel electrophoresis (SDS-PAGE) employs an ionic detergent to denature proteins, masking their intrinsic charge and enabling separation almost exclusively by molecular weight [1] [3]. In contrast, Native Polyacrylamide Gel Electrophoresis (Native PAGE) separates proteins based on a combination of their size, overall charge, and shape while maintaining their native, folded conformation [1]. This preservation of higher-order structure is critical for studying biologically active proteins, their functional interactions, and complex assemblies.
This whitepaper focuses on two advanced Native PAGE variants: Blue Native PAGE (BN-PAGE) and Clear Native PAGE (CN-PAGE). These techniques are indispensable for researchers, particularly in drug development, who require analysis of intact protein complexes, such as those involved in mitochondrial respiration, signal transduction, and other multi-subunit cellular machinery [44] [45]. By framing these variants within the broader context of protein separation strategies, this guide provides an in-depth technical examination of their principles, methodologies, and applications.
Fundamental Principles and Comparative Analysis
Core Mechanism of Native PAGE Variants
Both BN-PAGE and CN-PAGE are designed to separate protein complexes under non-denaturing conditions, but they achieve this through distinct mechanisms:
BN-PAGE utilizes the anionic dye Coomassie Brilliant Blue G-250, which binds non-covalently to the surface of proteins [46] [45]. This binding imparts a uniform negative charge shift, allowing the complexes to be separated primarily based on their size and molecular mass in a similar manner to SDS-PAGE, but without causing dissociation or denaturation [45] [47]. The dye provides the charge necessary for electrophoretic mobility while also visualizing the separation in real-time.
CN-PAGE, in contrast, does not use Coomassie dye in the running buffer. Instead, separation relies on the protein complexes' intrinsic charge at the gel's pH, as well as their size and shape [47] [48]. This results in a "clear" background but introduces more complexity in predicting migration behavior, as both net charge and size influence movement through the gel matrix.
The table below summarizes the key differences between SDS-PAGE, BN-PAGE, and CN-PAGE.
Table 1: Comprehensive Comparison of SDS-PAGE, BN-PAGE, and CN-PAGE
| Criteria | SDS-PAGE | Blue Native PAGE (BN-PAGE) | Clear Native PAGE (CN-PAGE) |
|---|---|---|---|
| Separation Basis | Molecular weight only [1] | Size/Mass (with charge shift) [45] [47] | Intrinsic charge & size [47] [48] |
| Gel Condition | Denaturing [1] [3] | Non-denaturing [46] | Non-denaturing [47] |
| Key Agent | SDS & Reducing Agents [1] | Coomassie Blue G-250 Dye [46] [45] | None (Intrinsic Charge) [47] |
| Protein State | Denatured, Linearized [1] | Native, Folded [46] | Native, Folded [47] |
| Protein Function | Lost [1] | Largely Retained [46] | Retained [48] |
| Protein Recovery | Not recoverable [1] | Recoverable for assays [1] [46] | Recoverable for assays [47] |
| Resolution | High (by mass) | High for membrane complexes [45] | Lower than BN-PAGE [47] [48] |
| Primary Applications | MW determination, purity check [1] | Analysis of multi-subunit complexes, supercomplexes [44] [46] | Analysis of labile supercomplexes, active enzyme assays [47] [48] |
Workflow and Strategic Selection
The following diagram illustrates the fundamental decision-making process and experimental workflow for selecting and implementing the appropriate PAGE technique.
Experimental Protocols for BN-PAGE and CN-PAGE
Key Research Reagent Solutions
Successful execution of native PAGE requires specific reagents tailored to preserve protein complexes.
Table 2: Essential Reagents for Native PAGE Protocols
| Reagent / Solution | Composition / Example | Function in the Protocol |
|---|---|---|
| Solubilization Buffer | 50 mM Bis-Tris, 1% n-dodecyl-β-D-maltoside, 750 mM ε-amino-N-caproic acid, pH 7.0 [45] | Mildly solubilizes membrane proteins while maintaining complex integrity. |
| Protease Inhibitors | PMSF, Leupeptin, Pepstatin [46] | Prevents proteolytic degradation of protein complexes during preparation. |
| Coomassie Dye (for BN-PAGE) | 0.3% Serva Blue G-250 (w/v) in sample buffer [45] | Imparts negative charge for electrophoresis and visualizes migration. |
| Cathode Buffer (BN-PAGE) | 50 mM Tricine, 15 mM Bis-Tris, 0.02% Coomassie Blue G-250, pH 7.0 [46] [45] | Provides the anionic front for electrophoresis in BN-PAGE. |
| Cathode Buffer (CN-PAGE) | 50 mM Tricine, 15 mM Bis-Tris, pH 7.0 (no dye) [45] [48] | Used in CN-PAGE where charge is intrinsic; also used in later BN-PAGE stages. |
| Anode Buffer | 50 mM Bis-Tris, pH 7.0 [46] [45] | Standard buffer for the positive electrode in both BN-PAGE and CN-PAGE. |
| Gel Buffer | 500 mM ε-amino-N-caproic acid, 50 mM Bis-Tris, pH 7.0 [45] | Forms the matrix for native separation; aminocaproic acid improves membrane protein solubilization. |
Detailed BN-PAGE Protocol
The following workflow outlines the key stages in a standard BN-PAGE experiment, from sample preparation to downstream analysis.
Stage 1: Sample Preparation Isolate mitochondria from tissue (e.g., rat brain) or cultured cells via Percoll gradient centrifugation [45]. Resuspend the mitochondrial pellet (e.g., 0.4 mg) in 40 µL of solubilization buffer (e.g., 750 mM ε-amino-N-caproic acid, 50 mM Bis-Tris, pH 7.0) containing protease inhibitors [46]. Add a mild detergent like n-dodecyl-β-D-maltoside (e.g., 7.5 µL of 10% solution) to solubilize membrane complexes. Mix and incubate on ice for 30 minutes to 1 hour. Centrifuge at high speed (e.g., 72,000 x g for 30 min) to remove insoluble material. Collect the supernatant and add Coomassie Blue G-250 dye (e.g., 2.5 µL of 5% solution) [46].
Stage 2: Native Gel Electrophoresis (First Dimension) Cast a polyacrylamide gel, with a linear gradient (e.g., 6-13%) often providing superior resolution for high-mass complexes [46]. The gel buffer typically contains 500 mM ε-amino-N-caproic acid and 50 mM Bis-Tris (pH 7.0). Load the prepared samples (5-20 µL) into the wells. Run the gel using a cathode buffer (50 mM Tricine, 15 mM Bis-Tris, 0.02% Coomassie Blue G-250, pH 7.0) and an anode buffer (50 mM Bis-Tris, pH 7.0). Electrophoresis can be performed at 150 V for approximately 2 hours, or until the dye front approaches the bottom of the gel. To improve resolution, the cathode buffer can be replaced with a dye-free version partway through the run [45].
Stage 3: Downstream Analysis The first-dimension BN-PAGE gel can be used for several analytical techniques:
- Western Blotting: Transfer proteins to a PVDF membrane for immunodetection with specific antibodies [46].
- In-Gel Activity Assays: Directly incubate the gel with specific substrates to visualize the activity of functional complexes like those in the respiratory chain [45].
- Mass Spectrometry: Excise protein bands for proteomic analysis to identify subunits [44].
- Second Dimension SDS-PAGE: For a comprehensive analysis of complex composition, excise a lane from the BN-PAGE gel, soak it in SDS buffer, and load it onto an SDS-PAGE gel. This separates the individual protein subunits that constitute each native complex [44] [46].
CN-PAGE Protocol Notes
The protocol for CN-PAGE follows a similar structure to BN-PAGE but with critical modifications. The key difference is the absence of Coomassie dye from the sample and cathode buffers [47] [48]. Separation depends solely on the intrinsic charge of the proteins at the operating pH. This milder treatment is particularly advantageous for preserving exceptionally labile supramolecular assemblies, such as certain states of mitochondrial ATP synthase, which might dissociate in the presence of the dye [48]. The lack of dye also prevents interference with downstream applications like fluorescence resonance energy transfer (FRET) analyses or specific enzymatic assays [47].
Applications in Research and Drug Development
The unique ability of BN-PAGE and CN-PAGE to resolve native complexes makes them powerful tools in fundamental and applied research. A primary application is the analysis of the mitochondrial respiratory chain and OXPHOS system [44] [45]. These techniques can resolve individual complexes (I-V) and their higher-order assemblies, known as supercomplexes or "respirasomes," providing insights into mitochondrial function and dysfunction [44]. This is crucial for investigating mitochondrial diseases and the mechanisms of certain drugs.
In the context of drug development, BN-PAGE is used for target identification and validation by characterizing the protein complexes involved in disease pathways. Furthermore, it can be applied in biologics characterization, such as analyzing the native structure and assembly of complex therapeutic proteins or antibodies. The technique also has a role in diagnostics, as it can be used clinically to diagnose mitochondrial defects associated with human diseases by revealing alterations in the abundance or composition of respiratory complexes [45]. The preservation of enzymatic activity allows for functional screening of compounds that modulate the activity of specific protein complexes.
This technical guide details the core downstream applications of SDS-PAGE and Native PAGE, framing them within the broader context of how the choice of protein separation method dictates the scope and type of subsequent analysis. The fundamental difference lies in the preservation of protein structure: SDS-PAGE denatures proteins, making it ideal for analysis based on polypeptide size, while Native PAGE maintains proteins in their folded, functional state, enabling the study of activity, complexes, and native conformation [1] [2]. This initial choice creates a decisive fork in the experimental pathway, directing researchers toward specific and often incompatible downstream applications.
Core Separation Principles and Their Impact on Downstream Analysis
The following table summarizes the fundamental differences between the two techniques, which form the basis for their divergent downstream uses.
Table 1: Fundamental Differences Between SDS-PAGE and Native PAGE
| Criteria | SDS-PAGE | Native PAGE |
|---|---|---|
| Separation Basis | Molecular weight (size) of polypeptides [1] [2] | Size, overall charge, and 3D shape of the native protein [1] [7] |
| Protein State | Denatured and linearized [1] [2] | Native, folded conformation [1] [2] |
| Detergent | SDS (Sodium Dodecyl Sulfate) present [1] | SDS absent [1] |
| Sample Preparation | Heated with SDS and reducing agents (DTT/BME) [1] | Not heated; no denaturing or reducing agents [1] |
| Protein Function | Lost post-separation [1] | Retained post-separation [1] [2] |
| Primary Downstream Use | Western blotting, mass spectrometry, molecular weight determination [1] [6] | Protein purification, in-gel activity assays, study of protein complexes [1] [49] [50] |
The logical flow from the initial separation choice to its appropriate downstream applications is mapped in the following workflow.
Downstream Application 1: Western Blotting
Western blotting (immunoblotting) is a quintessential application of SDS-PAGE, allowing for the specific detection of a protein target within a complex mixture after separation by size [51] [6].
Detailed Protocol: Western Blotting after SDS-PAGE
The following workflow outlines the key stages of a western blot, from gel separation to detection.
- Sample Preparation: Cells or tissues are lysed using a denaturing lysis buffer (e.g., RIPA buffer) containing SDS and protease/phosphatase inhibitors to prevent degradation [51]. The protein sample is then heated (typically 70-100°C) in Laemmli buffer containing SDS and a reducing agent like DTT or β-mercaptoethanol to fully denature proteins and break disulfide bonds [51] [2].
- Electroblotting: After separation by SDS-PAGE, proteins are transferred from the gel to a solid membrane (nitrocellulose or PVDF). Electroblotting is the most efficient method, using an electric field to drive proteins out of the gel onto the membrane [52].
- Wet/Tank Transfer: The gel-membrane sandwich is submerged in buffer. It offers high efficiency and is robust for proteins of all sizes, but takes longer (30 mins to overnight) and requires more buffer [52].
- Semi-Dry Transfer: The sandwich is placed between plate electrodes. It is faster (7-60 mins) and uses less buffer but can be less efficient for high molecular weight proteins (>300 kDa) [52].
- Immunodetection: The membrane is "blocked" with a protein solution (e.g., BSA) to prevent nonspecific antibody binding. It is then sequentially incubated with a primary antibody specific to the target protein, followed by an HRP-conjugated secondary antibody that recognizes the primary. Detection is achieved by applying a chemiluminescent substrate that produces light when cleaved by HRP [51].
While western blotting after Native PAGE is less common, it is possible if the primary antibody recognizes an epitope that is accessible in the native protein structure [51].
Downstream Application 2: Protein Purification
For purifying functional, active proteins, Native PAGE is the preferred separation method, as it allows for the recovery of proteins in their native state [1] [49].
Detailed Protocol: Protein Purification via Electroelution after Native PAGE
A prominent example is the isolation of native glycoprotein B (gB) from Herpes Simplex Virus 1 for functional studies [49].
- Sample Preparation (Viral Membrane Protein Extraction): HSV-1 particles were concentrated by ultracentrifugation. Membrane proteins were then extracted using a mild, non-ionic detergent via a commercial membrane protein extraction kit to solubilize proteins while preserving their native conformation and complex structures [49].
- Native PAGE Separation: The extracted proteins were separated on a 4-8% gradient native gel. The mild pH (8.3) and absence of denaturants allowed the ~300 kDa multimeric form of gB to remain intact. The gradient gel provided optimal resolution for this high molecular weight complex [49].
- Protein Recovery (Electroelution): The band corresponding to the gB multimer was carefully excised from the gel. The native protein was then recovered from the gel slice using electroelution, a technique that applies an electric field to drive the protein out of the gel matrix into a small volume of buffer. This yielded the protein with high purity and a concentration of 0.157 mg/mL, suitable for downstream functional assays [49].
Downstream Application 3: In-Gel Activity Assays
A powerful advantage of Native PAGE is the ability to directly assess the enzymatic function of proteins after separation through in-gel activity assays [53] [50].
Detailed Protocol: In-Gel Activity Assay for Medium-Chain Acyl-CoA Dehydrogenase (MCAD)
This protocol was used to study how pathogenic variants affect the structure and function of the homotetrameric MCAD enzyme [50].
- Sample Preparation: Mitochondrial-enriched fractions from cell homogenates or purified recombinant MCAD protein were prepared. Membrane solubilization and sample preparation used mild, non-denaturing conditions to preserve the tetrameric structure and enzymatic activity of MCAD [50].
- High-Resolution Clear Native PAGE (hrCN-PAGE): Samples were separated on a 4-16% gradient polyacrylamide gel under Clear Native (CN) conditions. CN-PAGE uses mixtures of anionic and neutral detergents in the cathode buffer instead of Coomassie dye, which avoids interference with downstream activity staining [53] [50].
- Colorimetric Activity Staining: After electrophoresis, the gel was incubated in a reaction mixture containing:
- Octanoyl-CoA: The physiological substrate for MCAD.
- Nitro Blue Tetrazolium (NBT): A tetrazolium salt that acts as an electron acceptor. When MCAD oxidizes its substrate, it reduces NBT, which forms an insoluble, purple-colored diformazan precipitate at the location of the active enzyme band [50].
- Analysis: This method allowed researchers to distinguish the activity of properly assembled tetramers from inactive, misfolded, or fragmented forms of MCAD, providing insights that standard solution-based assays could not [50].
Table 2: Key Reagent Solutions for Featured Experiments
| Research Reagent | Function / Application | Technical Notes |
|---|---|---|
| SDS (Sodium Dodecyl Sulfate) | Denatures proteins and confers uniform negative charge for SDS-PAGE [1] [2]. | Critical for molecular weight-based separation; incompatible with protein function studies. |
| DTT or β-Mercaptoethanol | Reducing agent; breaks disulfide bonds in SDS-PAGE sample prep [1] [51]. | Must be added fresh to sample buffer; ensures complete denaturation. |
| Protease/Phosphatase Inhibitors | Added to lysis buffers to prevent protein degradation and post-translational modification loss [51]. | Essential for preserving sample integrity before any electrophoresis. |
| Nitrocellulose/PVDF Membrane | Solid support matrix for protein immobilization during western blotting [52]. | PVDF requires pre-wetting in methanol. Pore size (e.g., 0.45 µm) affects binding capacity. |
| Coomassie Blue G-250 | Anionic dye used in BN-PAGE to impose charge shift on proteins [53]. | Binds hydrophobic surfaces; can interfere with some downstream activity assays. |
| n-Dodecyl-β-D-Maltoside | Mild, non-ionic detergent for solubilizing membrane proteins in Native PAGE [53]. | Preserves protein-protein interactions in complexes like OXPHOS. |
| Nitro Blue Tetrazolium (NBT) | Electron acceptor in in-gel activity assays; produces colored precipitate upon reduction [50]. | Enables visualization of oxidoreductase enzyme activity directly in the gel. |
The choice between SDS-PAGE and Native PAGE is the foundational decision that dictates a researcher's entire experimental trajectory. SDS-PAGE, by simplifying proteins to their polypeptide chains, is the unmatched technique for analytical procedures like western blotting and mass spectrometry. Conversely, Native PAGE, by preserving the intricate architecture of proteins, unlocks the potential for functional analysis, including activity assays and the purification of native complexes. Understanding the capabilities and limitations of each method enables researchers to strategically select the appropriate path to answer their specific biological questions, from determining "what and how much is there" to investigating "what does it do and with whom does it interact."
The separation of proteins based on their molecular weight has been a cornerstone of molecular biology and biopharmaceutical development for decades. For years, sodium dodecyl sulfate-polyacrylamide gel electrophoresis (SDS-PAGE) has served as the gold standard technique, enabling researchers to denature proteins with SDS to impart a uniform charge and separate them through a porous polyacrylamide gel matrix via molecular sieving [33] [18]. Pioneered in the 1960s and 1970s, this method provided a critical breakthrough for understanding protein-protein interactions, yet it carries significant limitations including labor-intensive manual procedures, lengthy analysis times, and semi-quantitative results [33] [54].
The fundamental difference between SDS-PAGE and native PAGE lies in the state of the protein during separation. While SDS-PAGE denatures proteins into linear chains with a consistent charge-to-mass ratio, allowing separation strictly by molecular size, native PAGE maintains proteins in their folded, functional state, separating them based on a combination of size, charge, and shape. This context frames the advancement of Capillary Electrophoresis with SDS (CE-SDS), a modern technological evolution that addresses the limitations of traditional gel-based methods while building upon the same foundational principles of size-based separation [33] [55].
CE-SDS represents a paradigm shift, transferring the separation process from a slab gel to a narrow-bore capillary filled with a replaceable polymer sieving matrix [55]. This transition, developed commercially in the 1980s and refined over subsequent decades, has transformed protein analysis by offering automated, quantitative, and high-resolution characterization essential for today's demanding biopharmaceutical applications [33] [56]. This technical guide explores the principles, advantages, methodologies, and applications of CE-SDS as a powerful modern alternative to traditional SDS-PAGE.
Technical Foundations: Principles of CE-SDS
Core Separation Mechanism
CE-SDS operates on the same fundamental principle as SDS-PAGE: proteins are denatured and coated with SDS detergent, creating negatively charged complexes with uniform charge-to-mass ratios. When subjected to an electric field within a separation matrix, these complexes migrate toward the anode, with smaller molecules moving faster than larger ones due to reduced hydrodynamic resistance [18] [55]. However, CE-SDS enhances this process through miniaturization and automation.
The separation occurs within a fused-silica capillary typically 25-75 µm in inner diameter and up to 100 cm in length, filled with an entangled polymer sieving matrix rather than a cross-linked polyacrylamide gel [54] [55]. This replaceable polymer solution forms an effective molecular sieve that can be automatically refreshed between analyses, eliminating the gel-to-gel variability inherent in SDS-PAGE. The application of high electric fields (300-600 V/cm) is possible due to efficient heat dissipation through the capillary walls, resulting in significantly faster separations—often completed in minutes rather than hours [54] [56].
Detection and Data Output
A fundamental distinction between CE-SDS and SDS-PAGE lies in detection methodology. While SDS-PAGE relies on post-separation staining with dyes like Coomassie Blue or silver stain followed by visual band interpretation, CE-SDS utilizes on-capillary detection systems [56] [55]. As separated protein components pass through a detection window near the capillary outlet, they are measured in real-time by UV absorbance (typically at 220 nm) or laser-induced fluorescence (LIF) [18] [55].
This automated detection generates electropherograms—digital plots of migration time versus signal intensity—where each protein component appears as a distinct peak [56]. The data is inherently quantitative, with peak areas proportional to protein concentration, eliminating the subjective band intensity assessment and non-linear staining artifacts that limit SDS-PAGE quantification [33] [18]. Software integration automatically calculates molecular weights based on migration time relative to standards, providing precise quantitative data suitable for regulatory submissions and quality control [18].
Key Technological Advantages
The capillary format coupled with modern detection systems provides CE-SDS with several compelling advantages over traditional SDS-PAGE:
- Superior Resolution and Efficiency: Narrow-bore capillaries minimize band broadening, achieving efficiencies exceeding 10^6 theoretical plates and enabling resolution of single-amino acid differences and subtle protein isoforms that co-migrate in slab gels [54].
- Excellent Reproducibility: Automated separation conditions and replaceable polymer matrices ensure consistent performance across runs, free from gel-to-gel variability common in SDS-PAGE [33].
- Minimal Sample Consumption: Nanoliter injection volumes conserve precious samples, making the technique ideal for limited-quantity biological specimens or high-value biotherapeutics [54] [56].
- Reduced Environmental Impact: Elimination of neurotoxic acrylamide monomers and significant reduction in chemical waste align with green chemistry initiatives in the biopharmaceutical industry [33].
The following workflow diagram illustrates the key steps and decision points in a CE-SDS analysis:
Comparative Analysis: CE-SDS vs. SDS-PAGE
Performance Metrics and Quantitative Data
Direct comparisons between CE-SDS and SDS-PAGE reveal significant differences in analytical performance, particularly regarding resolution, sensitivity, and quantitative capabilities. A systematic study comparing the two techniques for antibody purity analysis demonstrated CE-SDS's superior ability to detect and quantify minor impurities in heat-stressed IgG samples [18]. While both methods identified major degradation products, CE-SDS provided significantly higher signal-to-noise ratios for impurity peaks and successfully resolved nonglycosylated IgG, a species that SDS-PAGE failed to detect [18].
The quantitative superiority of CE-SDS is further evidenced by reproducibility data. In analyses of degraded IgG, CE-SDS demonstrated excellent reproducibility across four consecutive runs, with consistent peak patterns and areas essential for quality control applications [18]. This level of precision is difficult to achieve with SDS-PAGE due to variables in staining efficiency, destaining time, and image capture conditions.
The table below summarizes key performance characteristics based on published comparative data:
Table 1: Quantitative Performance Comparison: CE-SDS vs. SDS-PAGE
| Performance Parameter | CE-SDS | SDS-PAGE |
|---|---|---|
| Analysis Time | 5-35 minutes [33] [18] | Several hours to a day [33] [55] |
| Sample Volume | Nanoliters [54] [56] | Microliters [54] [56] |
| Reproducibility (Peak Area RSD) | <5% [18] | 10-20% (staining-dependent) [55] |
| Detection Sensitivity | Comparable to Coomassie; picogram with LIF [55] | Varies with stain: Coomassie (ng), Silver (pg) [55] |
| Resolution Capability | Single nucleotide/amino acid differences [54] | Limited for small mass differences [54] |
| Quantitative Linear Range | >2 orders of magnitude [55] | Limited, staining-dependent [55] |
Operational Considerations and Limitations
While CE-SDS offers compelling advantages, practical implementation requires consideration of several factors. The substantially higher initial investment for capillary instrumentation compared to basic gel electrophoresis equipment may present a barrier for some laboratories [54] [56]. Additionally, CE-SDS requires specialized training for operation and troubleshooting, particularly regarding capillary maintenance and matrix compatibility.
Methodologically, CE-SDS faces challenges with certain sample types. Particulates in samples can clog the narrow-bore capillaries, necessitating careful sample preparation including filtration or centrifugation [56]. Some traditional SDS-PAGE applications, such as two-dimensional gel electrophoresis and preparative separation for protein identification, remain challenging with current CE-SDS technology [57]. Additionally, baseline disturbances or "humps" have been reported with certain polymer matrices, particularly when analyzing high molecular weight proteins, though recent advances in agarose-based matrices show promise in addressing this limitation [58].
The table below outlines the practical operational differences between the two techniques:
Table 2: Operational Comparison: CE-SDS vs. SDS-PAGE
| Operational Aspect | CE-SDS | SDS-PAGE |
|---|---|---|
| Automation Level | Fully automated: injection, separation, detection, data analysis [33] [56] | Largely manual: gel casting, sample loading, staining, destaining [33] [54] |
| Hands-on Time | Minimal after sample preparation [33] | Significant throughout process [33] |
| Throughput | Sequential analysis (minutes per sample); multi-capillary arrays available [54] | Parallel analysis of multiple samples on one gel [54] |
| Toxic Waste Generation | Minimal: reduced reagent consumption [33] | Significant: acrylamide, staining chemicals [33] |
| Data Output Format | Digital electropherograms with quantitative peaks [56] [18] | Band patterns on gel requiring imaging and analysis [56] |
| Preparative Capability | Primarily analytical; fraction collection uncommon [54] | Bands can be excised for downstream analysis [54] |
Methodological Implementation: Protocols and Reagents
Standard Operating Procedure
A robust CE-SDS method for protein analysis follows a systematic procedure to ensure reproducible results:
Sample Preparation:
- Dilute protein samples to 0.5-1.0 mg/mL with SDS sample buffer [18].
- For reduced conditions, add 0.1M reducing agent such as β-mercaptoethanol or dithiothreitol [18].
- Heat denature at 70°C for 3-10 minutes to ensure complete unfolding and SDS binding [18].
- Centrifuge at high speed (≥10,000 × g) to remove particulates that could clog the capillary.
Instrument Setup and Separation:
- Install bare fused-silica capillary with appropriate dimensions (typically 30-50 µm ID × 20-40 cm effective length) [59] [18].
- Condition new capillaries with sequential washes: 1M sodium hydroxide (10-20 min), 0.1M hydrochloric acid (5-10 min), deionized water (5 min), and separation polymer (10 min) [55].
- Inject sample using pressure (0.5-5 psi for 5-20 seconds) or electrokinetic injection (5 kV for 5-20 seconds) [18] [55].
- Apply separation voltage of 10-30 kV (reverse polarity with cathode at outlet for SDS-protein complexes) [18] [55].
- Maintain capillary temperature at 20-25°C throughout separation [55].
Detection and Data Analysis:
- Monitor separation using UV absorbance at 220 nm (peptide bond) or 280 nm (aromatic amino acids) [18] [55].
- For enhanced sensitivity, employ laser-induced fluorescence detection with pre-column derivatization using fluorophores like 5-TAMRA.SE [55].
- Identify peaks based on migration time relative to protein standards of known molecular weight [18].
- Quantify species using peak area percentages, applying appropriate integration parameters to resolve closely migrating species [18].
Essential Research Reagent Solutions
Successful implementation of CE-SDS requires specific reagents and materials optimized for capillary-based separations:
Table 3: Essential Research Reagents for CE-SDS Analysis
| Reagent/Material | Function/Purpose | Typical Composition/Properties |
|---|---|---|
| SDS Sample Buffer | Denatures proteins and confers uniform negative charge | 1-2% SDS, 50-100 mM Tris or phosphate buffer, pH 8.0-9.0 [18] |
| Reducing Agents | Breaks disulfide bonds for reduced separations | β-mercaptoethanol (0.1-1M) or dithiothreitol (10-100 mM) [18] |
| Sieving Polymer Matrix | Size-based separation medium | Replaceable polymers: linear polyacrylamide, dextran, polyethylene oxide (1-10% w/v) [57] [55] |
| Capillary Conditioning Solutions | Maintains consistent capillary surface properties | 0.1-1M NaOH, 0.1-0.5M HCl, deionized water [55] |
| Molecular Weight Standards | Migration time calibration for size determination | Protein mixtures with known molecular weights (10-225 kDa) [18] [55] |
Recent Methodological Advances
Recent innovations continue to enhance CE-SDS capabilities. The development of SDS-capillary agarose gel electrophoresis (SDS-CAGE) using tetrahydroxyborate cross-linked agarose matrices has demonstrated baseline hump-free separation of therapeutic proteins across a wide molecular weight range [58]. This novel matrix composition enables rapid analysis (approximately 5 minutes) while eliminating the baseline disturbances common with dextran-based polymer formulations, particularly beneficial for high molecular weight species like the 660 kDa thyroglobulin [58].
Microchip-based CE-SDS platforms represent another significant advancement, reducing separation times to approximately 60 seconds per sample through ultra-miniaturization [55]. These integrated systems incorporate preloaded reagents and simplified fluidic handling, making the technology accessible to a broader range of laboratory settings while maintaining the quantitative advantages of traditional CE-SDS.
Applications in Biopharmaceutical Development
CE-SDS has established itself as an indispensable analytical tool throughout the biopharmaceutical development lifecycle, from early research to quality control and lot release:
Upstream Process Development:
- Monitoring monoclonal antibody expression levels in cell culture media during clone selection and media optimization [55].
- Tracking product quality attributes throughout fed-batch fermentation processes, with daily analysis of cell culture tanks providing critical process control data [55].
Downstream Process Monitoring:
- Assessing purification process efficiency by analyzing column fractions for product-related impurities and process-related contaminants [55].
- Demonstrating clearance of host cell proteins, protein aggregates, and fragments during purification step development [18] [55].
Formulation and Stability Studies:
- Quantifying degradation products under stressed conditions (e.g., heat stress) with superior resolution and quantitative precision compared to SDS-PAGE [18].
- Monitoring chemical modifications such as deamidation, oxidation, and clipping throughout shelf-life studies [33].
Product Characterization and Quality Control:
- Determining purity and identity for batch release testing of biopharmaceutical products [55].
- Characterizing post-translational modifications including glycosylation patterns and their impact on product quality [18] [55].
- Performing comparability studies following manufacturing process changes [55].
The application of CE-SDS extends across diverse biotherapeutic modalities, including monoclonal antibodies, bispecific antibodies, antibody-drug conjugates, fusion proteins, vaccines, cytokines, and viral vectors for gene therapy [33]. This versatility, coupled with regulatory acceptance in fillings, solidifies its position as a core analytical technology in modern biopharmaceutical development.
Capillary Electrophoresis with SDS represents a significant evolutionary step in protein separation technology, addressing the fundamental limitations of traditional SDS-PAGE while building upon its established principles. The transition from slab gel to capillary format delivers substantial improvements in resolution, reproducibility, quantification, and efficiency, making it particularly suited to the demanding requirements of contemporary biopharmaceutical research and quality control.
While SDS-PAGE retains utility for certain applications requiring visual confirmation, preparative capability, or minimal infrastructure investment, CE-SDS offers a clearly superior pathway for laboratories requiring high-quality quantitative data, regulatory compliance, and sustainable analytical practices. The technique's ability to provide automated, precise characterization of therapeutic proteins throughout development and manufacturing aligns perfectly with the quality-by-design principles underpinning modern biopharmaceutical production.
As methodological innovations continue to emerge—from novel separation matrices to integrated microchip platforms—the capabilities of CE-SDS will further expand, solidifying its role as the modern alternative for protein separation and analysis. For researchers and drug development professionals seeking to enhance their analytical toolbox, adoption of CE-SDS technology represents a strategic investment in quality, efficiency, and scientific advancement.
Solving Common Problems: Optimization Strategies for Enhanced Results
Protein separation by polyacrylamide gel electrophoresis (PAGE) is a foundational technique in biochemistry and molecular biology. The migration of proteins through the gel matrix can, however, be compromised by various artifacts such as smearing, smiling, and irregular banding patterns. Effective troubleshooting of these issues requires a fundamental understanding of how proteins are separated in the two primary forms of this technique: SDS-PAGE and Native PAGE.
In SDS-PAGE, the anionic detergent sodium dodecyl sulfate (SDS) denatures proteins and confers a uniform negative charge, meaning separation occurs almost exclusively on the basis of molecular mass [3] [2]. In contrast, Native PAGE is performed without denaturants, preserving the protein's native conformation, biological activity, and multi-subunit complexes; consequently, separation depends on the protein's intrinsic charge, size, and three-dimensional shape [7] [6]. This fundamental difference dictates that the root causes of, and solutions for, migration issues can be technique-specific.
This guide provides an in-depth analysis of common electrophoretic artifacts, framed within the context of SDS-PAGE and Native PAGE separation principles, to enable researchers to accurately diagnose and resolve these problems.
Core Differences Between SDS-PAGE and Native PAGE
A clear grasp of the mechanistic differences between these two techniques is a prerequisite for effective troubleshooting. The table below summarizes the key distinguishing factors.
Table 1: Fundamental Differences Between SDS-PAGE and Native PAGE
| Criterion | SDS-PAGE | Native PAGE |
|---|---|---|
| Separation Principle | Molecular mass (weight) only [3] [60] | Size, intrinsic charge, and 3D shape [1] [2] |
| Gel Condition | Denaturing [3] | Non-denaturing [3] |
| Key Reagents | SDS (denaturant/detergent), reducing agents (e.g., DTT, β-mercaptoethanol) [3] [1] | No SDS or reducing agents; may use coomassie dye (BN-PAGE) [1] |
| Sample Preparation | Heated (typically 70-100°C) in SDS and reducing agent [1] [2] | Not heated; maintained in native buffer [1] |
| Protein State | Denatured, linearized polypeptides [2] | Native, folded, and functional [7] |
| Protein Charge | Uniform negative charge from bound SDS [60] | Intrinsic net charge (can be positive or negative) [1] |
| Protein Recovery/Function | Proteins are denatured and cannot be recovered functionally [3] | Proteins are stable and can be recovered with function intact [3] [7] |
| Primary Applications | Molecular weight determination, purity assessment, western blotting [1] [7] | Studying oligomeric state, protein-protein interactions, enzymatic activity [3] [7] |
Troubleshooting Common Migration Issues
The following section details the most frequently encountered migration problems, their causes, and specific corrective actions.
Smearing or Diffuse Bands
Smearing appears as blurry, poorly resolved bands that can trail vertically [61]. The causes differ significantly between SDS-PAGE and Native PAGE.
Table 2: Troubleshooting Smearing or Diffuse Bands
| Cause | Manifestation in SDS-PAGE | Manifestation in Native PAGE | Corrective Action |
|---|---|---|---|
| Improper Sample Prep | Incomplete denaturation (insufficient heating) or reduction; high salt concentration [61] [6]. | Protein aggregation or degradation due to harsh conditions [2]. | SDS-PAGE: Boil samples 5-10 min with fresh reducing agent; dilute high-salt samples [6].Native PAGE: Use protease inhibitors; avoid pH extremes and maintain cool temperature [2]. |
| Overloading | Overloaded wells lead to over-saturation and trailing smears [62]. | Similar to SDS-PAGE; excess protein overwhelms separation capacity. | Load an appropriate amount of protein (e.g., 20-50 µg total protein per lane for SDS-PAGE) [63]. |
| Gel Run Issues | Voltage too high, causing overheating and buffer pH changes [61]. | Generation of heat can denature native proteins during the run. | Run gel at lower voltage (e.g., 10-15 V/cm) for a longer time; run in a cold room or with a cooling apparatus [61]. |
| Poorly Formed Wells | Wells torn during comb removal cause sample to leak and smear between lanes [62]. | Same as SDS-PAGE. | Remove comb carefully and steadily; flush wells with buffer before loading [62]. |
"Smiling" or "Frowning" Bands
This phenomenon describes bands that curve upward ("smiling") or downward at the edges of the gel. It is primarily caused by uneven heat distribution across the gel.
Table 3: Troubleshooting "Smiling" or "Frowning" Bands
| Cause | Explanation | Corrective Action |
|---|---|---|
| Excessive Heat | The center of the gel becomes warmer than the edges. Warmer buffer has lower resistance, so current and migration are faster in the center, causing an upward curve [61]. | • Reduce the running voltage [61].• Ensure efficient heat dissipation by running the gel in a cold room, using an integrated cooler, or placing ice packs in the apparatus [61]. |
| Incorrect Buffer | A running buffer with incorrect ion concentration or pH can exacerbate heating effects and conductivity issues [6]. | Check the composition and pH of the running buffer; prepare fresh buffer as needed [6]. |
Irregular or Distorted Band Patterns
This category includes a range of issues from bands migrating off the gel to poor resolution and edge distortion.
Table 4: Troubleshooting Other Irregular Band Patterns
| Issue | Cause | Corrective Action |
|---|---|---|
| Bands Ran Off Gel | Gel was run for too long, and proteins (especially low molecular weight) have migrated into the running buffer [61]. | Stop the electrophoresis as soon as the dye front (e.g., bromophenol blue) approaches the bottom of the gel [61]. |
| Poor Resolution (Bands too close) | • Gel run time too short [61].• Acrylamide concentration inappropriate for target protein size [61] [62].• Improper running buffer ions/pH [61]. | • Run the gel longer for better separation [61].• Use a higher % gel for low MW proteins and a lower % (or gradient) gel for high MW proteins [2] [6].• Remake the gel running buffer to ensure correct ion concentration and pH [61]. |
| Edge Effect (Distorted outer lanes) | Empty wells on the left or right edges cause an uneven electric field, distorting bands in adjacent lanes [61]. | Load protein samples (e.g., ladder, control, or dummy sample) into all peripheral wells to uniformize the electric field [61]. |
| Samples Migrating Out of Wells Before Run | Significant delay between loading samples and applying current allows proteins to diffuse out of the wells [61]. | Start the electrophoresis run immediately after finishing sample loading [61]. |
Experimental Protocols for Optimal Results
Standard SDS-PAGE Protocol
- Gel Preparation: Cast a discontinuous gel system. A resolving gel (e.g., 10-12% acrylamide, pH ~8.8) is overlaid with a stacking gel (e.g., 4-5% acrylamide, pH ~6.8) into which the comb is inserted [2]. Polymerization is catalyzed by APS and TEMED [2].
- Sample Preparation: Mix protein samples with 2X Laemmli buffer (containing SDS, glycerol, bromophenol blue, and a reducing agent like β-mercaptoethanol or DTT) [3] [6]. Heat at 95-100°C for 5-10 minutes to fully denature proteins [6].
- Electrophoresis: Load samples and molecular weight markers into wells. Submerge the gel in Tris-Glycine-SDS running buffer. Apply a constant voltage (e.g., 80-150V, depending on gel size) until the dye front reaches the bottom. Monitor temperature to prevent overheating [61] [2].
Standard Native PAGE Protocol
- Gel Preparation: Cast a gel of suitable acrylamide percentage without SDS or reducing agents. The same discontinuous buffer system can be used, but without SDS [6].
- Sample Preparation: Do not heat or denature the sample. Mix with a native sample buffer (lacking SDS and reductants, but containing glycerol and a tracking dye) [1]. Maintain samples at 4°C to preserve native structure.
- Electrophoresis: Use a running buffer without SDS. Because protein charge is intrinsic, ensure the buffer pH is above the protein's isoelectric point (pI) to maintain a negative charge and migration toward the anode. Run the gel at low voltage (e.g., 4°C) to minimize heat-induced denaturation [1] [2].
The Scientist's Toolkit: Key Reagents and Materials
Table 5: Essential Research Reagents and Their Functions
| Reagent/Material | Function | Key Considerations |
|---|---|---|
| SDS (Sodium Dodecyl Sulfate) | Denatures proteins and imparts a uniform negative charge, enabling separation by mass in SDS-PAGE [3] [2]. | Use high-purity SDS; critical for accurate molecular weight determination. |
| Reducing Agents (β-mercaptoethanol, DTT) | Breaks disulfide bonds in proteins, ensuring complete unfolding and denaturation in SDS-PAGE [3]. | Prepare fresh for optimal reducing power. |
| Polyacrylamide | Forms a cross-linked polymer gel matrix that acts as a molecular sieve [2]. | Pore size is determined by the % acrylamide; choose concentration based on target protein size [6]. |
| APS & TEMED | Catalyze the polymerization reaction of acrylamide to form the gel [2]. | TEMED should be stored cool and dark; fresh APS solution is crucial for consistent gel polymerization. |
| Tris-Glycine Buffer | A common discontinuous buffer system for PAGE; provides ions to conduct current and maintains pH for protein migration [2] [6]. | Prepare fresh from high-quality reagents to ensure correct pH and ionic strength. |
| Molecular Weight Markers | A set of pre-stained or unstained proteins of known sizes run alongside samples to estimate molecular weights and monitor run progress [2]. | Choose a ladder appropriate for your target protein size range. |
Workflow and Troubleshooting Logic
The following diagram illustrates the logical process for diagnosing and resolving the migration issues discussed in this guide.
Diagnosing Protein Gel Migration Issues
Effective troubleshooting of protein gel electrophoresis requires a methodical approach grounded in the core principles of the technique being used. Whether the goal is to separate proteins by mass alone using SDS-PAGE or to analyze native complexes and functions using Native PAGE, understanding the underlying causes of artifacts like smearing, smiling, and distortion is critical. By applying the diagnostic guidelines and corrective protocols outlined in this technical guide, researchers and drug development professionals can optimize their experimental outcomes, ensuring reliable and interpretable data for their scientific inquiries.
The selection of an appropriate gel matrix is a critical first step in designing any polyacrylamide gel electrophoresis (PAGE) experiment, directly influencing the resolution, accuracy, and interpretability of results. Within the broader context of protein separation methodologies, the fundamental distinction between SDS-PAGE and Native PAGE frameworks dictates every subsequent choice in experimental design, from sample preparation to data interpretation [7]. SDS-PAGE, employing the anionic detergent sodium dodecyl sulfate, denatures proteins into linear polypeptides, masking intrinsic charges and ensuring separation occurs almost exclusively on the basis of molecular mass [30] [2]. In contrast, Native PAGE maintains proteins in their native, folded conformation, enabling separation through a complex interplay of molecular mass, intrinsic charge, and three-dimensional structure, thereby preserving biological activity [1] [2]. This technical guide provides researchers and drug development professionals with a detailed framework for optimizing gel percentage selection, supported by structured data, experimental protocols, and practical tools to ensure precise protein separation within both SDS-PAGE and Native PAGE paradigms.
Core Principles: SDS-PAGE vs. Native PAGE
Understanding the mechanistic differences between SDS-PAGE and Native PAGE is essential for selecting the correct electrophoretic approach and interpreting results accurately. These techniques serve complementary but distinct purposes in protein analysis.
SDS-PAGE relies on the denaturing action of sodium dodecyl sulfate (SDS), which binds to proteins in a constant weight ratio (approximately 1.4 g SDS per 1 g of polypeptide) and confers a uniform negative charge [2]. This process, coupled with heating and the use of reducing agents like β-mercaptoethanol or dithiothreitol (DTT) to break disulfide bonds, unfolds proteins into linear chains [30] [3]. Consequently, separation depends primarily on molecular mass, with smaller polypeptides migrating faster through the gel matrix [6] [4]. This makes SDS-PAGE indispensable for determining subunit molecular weight, assessing purity, and analyzing complex protein mixtures during western blotting [7] [6].
Native PAGE is performed without denaturing agents, preserving the protein's native conformation, multimeric structure, and biological function [3] [1]. Separation depends on both the protein's intrinsic charge (which can be positive or negative) and its hydrodynamic size—a function of its mass and shape [2] [4]. This technique is ideal for studying native protein complexes, protein-protein interactions, and enzymatic activity post-separation [7] [1].
Table 1: Fundamental Differences Between SDS-PAGE and Native PAGE
| Parameter | SDS-PAGE | Native PAGE |
|---|---|---|
| Separation Basis | Molecular mass of subunits [1] [4] | Native charge, size, and shape [1] [2] |
| Gel Conditions | Denaturing [3] | Non-denaturing [3] |
| Sample Preparation | Heated with SDS and reducing agents [1] | Not heated; no denaturants [1] |
| Protein State | Denatured and linearized [6] | Native, folded conformation [6] |
| Protein Function | Lost after separation [1] | Retained after separation [1] |
| Primary Applications | Molecular weight determination, purity check, western blotting [1] | Studying oligomeric state, protein complexes, functional assays [7] [1] |
Diagram 1: Method Selection Workflow
Optimizing Gel Percentage for Target Protein Size
The polyacrylamide gel matrix acts as a molecular sieve, with its pore size determined by the concentration of acrylamide-bisacrylamide. Selecting the appropriate gel percentage is crucial for achieving optimal resolution of your target proteins.
The Relationship Between Gel Percentage and Protein Size
The pore size of a polyacrylamide gel is inversely related to its percentage - lower percentage gels have larger pores and are better for resolving high molecular weight proteins, while higher percentage gels have smaller pores and are optimal for separating low molecular weight proteins [2]. Most standard SDS-PAGE analyses use gels between 8% and 15% acrylamide [6].
Table 2: Recommended Gel Percentages for Different Protein Sizes in SDS-PAGE
| Acrylamide Percentage | Effective Separation Range | Ideal For |
|---|---|---|
| 15% | 10 - 50 kDa [6] | Low molecular weight peptides, antibody light chains |
| 12% | 40 - 100 kDa [6] | Medium molecular weight proteins (e.g., many enzymes) |
| 10% | 70 kDa and above [6] | High molecular weight proteins |
| 7.5% | Not specified in results | Very high molecular weight complexes |
For proteins with a wide range of molecular weights, gradient gels (e.g., 4-20%) are highly effective as they provide a continuous pore size distribution, allowing both low and high molecular weight proteins to be resolved sharply on the same gel [6] [2]. For proteins smaller than 30 kDa, Tricine-SDS-PAGE is often preferred over the standard Laemmli system for better resolution [30].
Gel Optimization for Native PAGE
In Native PAGE, the relationship between gel percentage and protein size follows similar principles, but the separation is more complex due to the preservation of native structure. The "charge density" (charge per unit mass) and the hydrodynamic size of the native protein significantly influence migration [2]. Higher percentage gels provide greater resolution for similarly sized proteins, while lower percentage gels are better for large protein complexes. Blue Native PAGE (BN-PAGE) and Clear Native PAGE (CN-PAGE) are specialized variants used for separating membrane protein complexes and studying oligomeric states [1].
Experimental Protocols for Gel Preparation and Electrophoresis
Protocol: Casting a Discontinuous SDS-Polyacrylamide Gel
The discontinuous (Laemmli) gel system, comprising a stacking gel and a resolving gel, is the most widely used method for SDS-PAGE as it sharpens protein bands before they enter the resolving gel [2].
Resolving Gel Preparation (for a 12% gel):
- Assemble the gel cassette according to manufacturer instructions.
- Prepare the resolving gel solution by combining:
- Add polymerization catalysts: Just before casting, add 0.3 mL of 10% ammonium persulfate (APS) and 0.03 mL of TEMED [2]. These agents initiate the polymerization reaction to form the cross-linked polyacrylamide matrix.
- Pour the resolving gel into the cassette, leaving space for the stacking gel.
- Overlay with a solvent such as water-saturated butanol or isopropanol to create a flat, even interface. Allow the gel to polymerize completely (typically 20-30 minutes).
Stacking Gel Preparation (~5% acrylamide):
- Prepare the stacking gel solution after the resolving gel has set. A typical recipe uses a lower acrylamide concentration and a different pH (e.g., Tris-HCl, pH ~6.8) [2].
- Add catalysts (APS and TEMED) to the stacking gel solution.
- Pour off the overlay, rinse the top of the resolving gel, and pour the stacking gel solution.
- Immediately insert a well-forming comb and allow the stacking gel to polymerize.
Protocol: Sample Preparation and Electrophoresis Run
SDS-PAGE Sample Preparation:
- Dilute protein samples in Laemmli buffer, which contains SDS, a reducing agent (DTT or β-mercaptoethanol), glycerol, and a tracking dye [64] [6].
- Denature samples by heating at 70-100°C for 5-10 minutes [6] [2].
- Load samples and molecular weight markers into the wells. Prestained markers allow real-time monitoring of electrophoresis progress [6].
Electrophoresis Conditions:
- Fill the electrophoresis tank with running buffer (typically Tris-Glycine with 0.1% SDS) [64].
- Apply a constant voltage: For a mini-gel system, 100-150 V is common. Higher voltages reduce run time but may cause overheating and "smiling" bands [6].
- Run the gel until the dye front reaches the bottom of the gel.
Troubleshooting and Technical Optimization
Even well-designed experiments can encounter issues. Recognizing common problems and their solutions is key to obtaining reliable data.
Table 3: Common SDS-PAGE Issues and Solutions
| Issue & Visual Symptom | Potential Cause | Solution |
|---|---|---|
| Weak/Faint or 'Bulging' Bands | Protein concentration too high or too low [6] | Perform protein quantification assay (Bradford, BCA) before loading [6] |
| 'Smiling' Bands (curved upwards) | Buffer/gel overheated due to incorrect buffer or excessive voltage [6] | Check buffer composition; run at a lower voltage [6] |
| Smeared Bands | Sample improperly denatured or high ionic strength [6] | Add fresh reducing agent; boil samples for 5 min; reduce salt concentration [6] |
| Multiple/Unexpected Bands | Protein degradation, modification, or aggregation [6] | Use protease/phosphatase inhibitors; include fresh SDS and reducing agents [6] |
Key Factors Affecting Accuracy: Several parameters beyond gel percentage can impact the outcome of PAGE. The buffer system and pH are critical, as the pH must be above the proteins' isoelectric point to maintain a net negative charge and ensure migration toward the anode [30] [6]. The applied electric field strength must be optimized, as high field strengths can generate excessive heat, altering buffer pH and protein mobility, and potentially causing conformation changes in SDS-protein complexes [65]. Maintaining cool temperatures during Native PAGE is especially important to prevent denaturation and proteolysis, preserving the native state of the protein [2].
The Scientist's Toolkit: Essential Reagents and Materials
Successful PAGE requires precise preparation and high-quality reagents. The following table details key solutions and their functions.
Table 4: Essential Research Reagent Solutions for PAGE
| Reagent / Material | Function / Purpose |
|---|---|
| SDS (Sodium Dodecyl Sulfate) | Anionic detergent that denatures proteins and confers a uniform negative charge [3] [2] |
| DTT or β-mercaptoethanol | Reducing agents that break disulfide bonds to fully linearize polypeptides [30] [3] |
| Acrylamide / Bis-acrylamide | Monomer and cross-linker that polymerize to form the porous gel matrix [2] |
| APS and TEMED | Polymerization initiator (APS) and catalyst (TEMED) for gel formation [2] |
| Tris-based Buffers | Provides the conductive medium and maintains stable pH during electrophoresis [64] [6] |
| Coomassie Blue / SYBR Safe | Protein stain (Coomassie) and DNA stain (SYBR Safe) for visualization [64] |
| Molecular Weight Markers | Prestained or unstained proteins of known sizes for calibrating protein mass [6] [2] |
| Glycerol | Added to sample buffer to increase density, preventing diffusion from wells [3] |
Diagram 2: Reagent Roles in Workflow
Strategic optimization of gel percentage and matrix selection is a fundamental skill in protein biochemistry that directly determines the success of electrophoretic separations. The choice between a denaturing SDS-PAGE system for molecular weight determination and a Native PAGE system for functional and structural analysis represents the primary strategic decision, from which all other experimental parameters follow. By adhering to the detailed protocols, selection tables, and troubleshooting guidelines presented in this technical guide, researchers can confidently design PAGE experiments that yield high-resolution, reproducible, and biologically meaningful results. As electrophoretic techniques continue to evolve with advances in capillary-based systems and fluorescent detection methods [65], the core principles of gel-based protein separation remain essential for progress in proteomics, drug development, and basic biomedical research.
In the landscape of protein separation techniques, SDS-PAGE and Native PAGE represent two foundational methodologies with distinct philosophical approaches and experimental outcomes. The core distinction lies in their treatment of protein native structure: SDS-PAGE denatures proteins to separate based solely on molecular weight, while Native PAGE preserves higher-order structure to separate based on combined molecular size, charge, and shape [7] [2]. This fundamental difference dictates every aspect of buffer preparation and pH consideration, ultimately determining the success of electrophoretic separation and the biological relevance of the results obtained. Proper buffer design is not merely a technical prerequisite but the very factor that ensures proteins carry the appropriate charge and migrate predictably through the gel matrix.
Principles of Protein Separation in SDS-PAGE vs. Native PAGE
Mechanism of SDS-PAGE
Sodium dodecyl sulfate-polyacrylamide gel electrophoresis (SDS-PAGE) employs an anionic detergent, sodium dodecyl sulfate (SDS), which fundamentally transforms protein structure and charge characteristics. SDS binds to proteins in a constant weight ratio (approximately 1.4 g SDS per 1 g of polypeptide), unraveling secondary and tertiary structures into linear chains while imparting a uniform negative charge density [22] [2]. This process masks proteins' intrinsic charge, creating a situation where all protein-SDS complexes migrate toward the anode with mobility determined primarily by molecular size rather than native charge [1]. The smaller polypeptides navigate the gel pores more readily, traveling farther than their larger counterparts during electrophoresis [6]. This denaturing approach makes SDS-PAGE particularly valuable for determining molecular weight, assessing sample purity, and analyzing subunit composition [66].
Mechanism of Native PAGE
In stark contrast, Native PAGE (non-denaturing PAGE) preserves proteins in their folded, biologically active conformations by omitting denaturing agents like SDS [3]. Separation occurs based on the combined influence of a protein's intrinsic charge, size, and three-dimensional structure [2]. In the alkaline pH conditions typical of Native PAGE, most proteins carry a net negative charge and migrate toward the anode, but at rates proportional to their charge density (charge-to-size ratio) [2]. This technique maintains enzymatic activity, protein-protein interactions, and the presence of non-covalently bound cofactors, including metal ions [8]. Consequently, Native PAGE is indispensable for studying functional protein complexes, oligomeric states, and native characteristics lost in denaturing conditions [7].
Buffer Composition and pH Requirements
SDS-PAGE Buffer Systems
SDS-PAGE relies on discontinuous buffer systems to achieve sharp protein band resolution. The methodology typically employs different buffers for the stacking and resolving gels, with Tris-based formulations being most common [6].
Table 1: Standard SDS-PAGE Buffer Compositions
| Buffer Component | Stacking Gel | Resolving Gel | Running Buffer |
|---|---|---|---|
| Buffer Type | Tris-HCl (~pH 6.8) | Tris-HCl (~pH 8.8) | Tris-Glycine (~pH 8.3-8.8) |
| Detergent | SDS (0.1-1%) | SDS (0.1-1%) | SDS (0.1%) |
| Other Components | - | - | Glycine, possible EDTA |
The stacking gel, with lower acrylamide concentration (4-5%) and pH (~6.8), concentrates protein samples into sharp bands before they enter the resolving gel. The resolving gel, with higher acrylamide concentration (typically 8-15%) and pH (~8.8), then separates the proteins based on size [2]. The running buffer, commonly Tris-glycine containing 0.1% SDS, maintains the charge and denatured state of proteins throughout electrophoresis [6]. The entire system operates at a pH above the isoelectric point of most proteins to ensure negative charge and migration toward the anode [6].
Native PAGE Buffer Systems
Native PAGE utilizes non-denaturing buffer systems that maintain physiological pH ranges to preserve protein structure and function. These buffers avoid SDS and other denaturing agents [3].
Table 2: Native PAGE Buffer Compositions
| Buffer Type | Sample Buffer | Running Buffer | Specialized Variants |
|---|---|---|---|
| Standard Native PAGE | Mild buffer (e.g., Tris-HCl), no SDS, no reducing agents | Tris-Glycine (~pH 8.8) or Tris-Borate | Cathode and anode buffers may differ |
| Blue Native (BN)-PAGE | BisTris, NaCl, Coomassie G-250 dye | Cathode: BisTris, Tricine, CoomassieAnode: BisTris, Tricine | Coomassie dye imparts charge |
| Clear Native (CN)-PAGE | Mild buffer without dye | Gradient gel without dye | Relies on intrinsic protein charge |
For Blue Native PAGE (BN-PAGE), the Coomassie G-250 dye binds to proteins, conferring a negative charge that facilitates migration toward the anode while maintaining native structure [8]. The running buffers in BN-PAGE are often divided into cathode and anode chambers with different compositions [8]. The pH of Native PAGE systems must be carefully controlled to avoid protein denaturation or aggregation while maintaining conditions where proteins remain soluble and carry adequate net charge for migration [2].
Experimental Protocols for Buffer Preparation
SDS-PAGE Buffer Preparation Protocol
1. Resolving Gel Buffer (1.5 M Tris-HCl, pH 8.8):
- Dissolve 181.7 g of Tris base in approximately 800 mL of deionized water.
- Adjust to pH 8.8 using concentrated HCl.
- Add deionized water to bring the final volume to 1 L.
- Filter through a 0.45 μm filter and store at 4°C.
2. Stacking Gel Buffer (0.5 M Tris-HCl, pH 6.8):
- Dissolve 60.6 g of Tris base in approximately 800 mL of deionized water.
- Adjust to pH 6.8 using concentrated HCl.
- Add deionized water to bring the final volume to 1 L.
- Filter and store at 4°C.
3. 10X Running Buffer (Tris-Glycine-SDS, pH 8.3):
- Dissolve 30.3 g Tris base, 144.0 g glycine, and 10.0 g SDS in approximately 800 mL deionized water.
- Adjust pH to 8.3 if necessary.
- Add deionized water to bring final volume to 1 L.
- Dilute to 1X concentration before use.
4. Sample Preparation Buffer (2X Laemmli Buffer):
- Combine 2.5 mL of 0.5 M Tris-HCl (pH 6.8), 2.0 mL of glycerol, 4.0 mL of 10% SDS, 1.0 mL of β-mercaptoethanol (for reducing conditions), and 0.5 mL of 1% bromophenol blue.
- Bring to 10 mL with deionized water.
- Aliquot and store at -20°C [22] [6].
Native PAGE Buffer Preparation Protocol
1. Native PAGE Running Buffer (10X Tris-Glycine, pH 8.8):
- Dissolve 30.0 g Tris base and 142.5 g glycine in approximately 800 mL deionized water.
- Adjust pH to 8.8 if necessary.
- Add deionized water to bring final volume to 1 L.
- Dilute to 1X concentration before use; do not add SDS [2].
2. BN-PAGE Sample Buffer (4X):
- Combine 200 μL of 1 M BisTris (pH 7.0), 200 μL of 1 M NaCl, 300 μL of glycerol, and 7.5 μL of 4% Coomassie G-250.
- Bring to 1 mL with deionized water [8].
3. BN-PAGE Cathode Buffer (1X):
- Dissolve 50 mM BisTris and 50 mM Tricine in deionized water.
- Adjust to pH 6.8 with HCl.
- Add 0.02% Coomassie G-250 before use [8].
4. BN-PAGE Anode Buffer (1X):
- Dissolve 50 mM BisTris in deionized water.
- Adjust to pH 6.8 with HCl [8].
Critical pH Considerations and Optimization
pH Effects on Protein Charge and Migration
The pH of electrophoretic buffers fundamentally controls protein migration by determining their net charge. In SDS-PAGE, the buffer pH must be sufficiently basic (typically pH 8.3-8.8) to maintain the negative charge on SDS-bound proteins and ensure migration toward the anode [6]. The Tris-glycine system creates a moving boundary that stacks proteins at the interface between stacking and resolving gels, with glycine serving as a trailing ion in the stacking gel and a leading ion in the resolving gel [2].
For Native PAGE, the buffer pH must be carefully selected based on the isoelectric points (pI) of target proteins. The pH must be above the pI for acidic proteins to maintain negative charge, or below the pI for basic proteins to maintain positive charge (requiring reversed electrode polarity) [2]. Most Native PAGE procedures use alkaline pH (8.0-9.0) where the majority of proteins carry a net negative charge [2]. Extreme pH conditions must be avoided as they can cause irreversible protein denaturation or aggregation [2].
Troubleshooting Buffer-Related Issues
1. Smiling or Frowning Bands:
- Cause: Uneven buffer composition, excessive current generating heat, or improper buffer ionic strength [6].
- Solution: Ensure consistent buffer preparation, monitor voltage to prevent overheating, and verify buffer composition matches protocol specifications [22].
2. Poor Protein Separation:
- Cause: Incorrect buffer pH, degraded buffer components, or incorrect ionic strength [22].
- Solution: Freshly prepare buffers, verify pH before use, and ensure proper storage conditions [6].
3. Irregular Migration Patterns:
- Cause: Buffer contamination or incorrect dilution [6].
- Solution: Prepare fresh running buffer from stock solutions and ensure accurate dilution factors [22].
Advanced Techniques and Modifications
NSDS-PAGE: A Hybrid Approach
Native SDS-PAGE (NSDS-PAGE) represents an innovative modification that reduces SDS concentration (to 0.0375% in running buffer) and eliminates heating and reducing agents from sample preparation [8]. This approach preserves metalloprotein metal ions (98% zinc retention versus 26% in standard SDS-PAGE) and maintains enzymatic activity in seven of nine model enzymes, while providing resolution comparable to traditional SDS-PAGE [8]. The method demonstrates that careful modulation of buffer conditions can bridge the gap between high resolution and native state preservation.
Two-Dimensional Electrophoresis
Two-dimensional PAGE combines the principles of isoelectric focusing (IEF) with SDS-PAGE, providing superior resolution of complex protein mixtures [2]. In the first dimension, proteins separate based on native isoelectric point using immobilized pH gradient (IPG) strips [2]. For the second dimension, these strips are equilibrated with SDS-containing buffer before standard SDS-PAGE separation [2]. This technique requires specialized buffer systems for both dimensions but enables resolution of thousands of proteins in a single analysis [2].
The Scientist's Toolkit: Research Reagent Solutions
Table 3: Essential Reagents for PAGE Experiments
| Reagent | Function | Key Considerations |
|---|---|---|
| Tris (Tris(hydroxymethyl)aminomethane) | Primary buffering agent for gel and running buffers | Maintains stable pH in 7.0-9.0 range; concentration varies (0.1-1.5 M) |
| Glycine | Leading ion in discontinuous buffer systems | Mobility changes with pH enable stacking in SDS-PAGE |
| SDS (Sodium Dodecyl Sulfate) | Denaturing agent and charge provider | Critical for uniform charge-to-mass ratio; typical concentration 0.1-1% |
| Acrylamide/Bis-acrylamide | Gel matrix formation | Cross-linked polymer creates molecular sieve; concentration determines pore size |
| Ammonium Persulfate (APS) | Polymerization initiator | Free radical source for acrylamide polymerization |
| TEMED | Polymerization catalyst | Accelerates APS decomposition to initiate polymerization |
| Coomassie G-250 | Charge conferring dye (BN-PAGE) | Binds proteins without significant denaturation in BN-PAGE |
| DTT (Dithiothreitol) or β-mercaptoethanol | Reducing agents | Break disulfide bonds in reducing SDS-PAGE; omitted in Native PAGE |
| Glycerol | Density agent | Increases sample density for well loading; typically 5-10% |
| Tracking Dyes (Bromophenol Blue) | Migration monitor | Visualizes electrophoresis progress |
Workflow Visualization
Buffer preparation and pH considerations form the foundation of successful protein separation in both SDS-PAGE and Native PAGE. The deliberate choice between denaturing and non-denaturing buffer systems directs the entire experimental trajectory, determining whether proteins will be separated as denatured polypeptides or as native complexes with preserved biological activity. SDS-PAGE buffers, characterized by SDS, reducing agents, and alkaline pH, facilitate separation by molecular weight alone. Native PAGE buffers, devoid of denaturants and carefully maintained in physiological pH ranges, enable separation based on the complex interplay of intrinsic charge, size, and shape. Mastery of these buffer systems empowers researchers to select the technique appropriate for their specific research questions, whether investigating protein subunit composition or studying functional protein complexes in their native states. As electrophoretic techniques continue to evolve, particularly through hybrid approaches like NSDS-PAGE, the precise control of buffer composition and pH remains paramount to ensuring proper protein charge and migration, ultimately guaranteeing the reliability and biological relevance of separation outcomes.
The core objective of any polyacrylamide gel electrophoresis (PAGE) experiment is to separate proteins in a manner that provides meaningful biological information. Whether the goal is to determine molecular weight via SDS-PAGE or to investigate native structure and function through Native PAGE, the integrity of the protein sample at the point of loading is paramount [1] [7]. Protein degradation, caused by endogenous proteases and improper handling, can generate artifactual bands, smear patterns, and lead to an overall loss of resolution, fundamentally compromising experimental results [6]. This technical guide details the critical strategies of protease inhibition and temperature control, framing them within the distinct sample preparation requirements of denaturing and native electrophoretic techniques. The principles outlined here are foundational for researchers in basic research and drug development who rely on accurate protein analysis.
SDS-PAGE vs. Native PAGE: Core Principles and Sample Integrity
SDS-PAGE and Native PAGE serve divergent purposes, which dictates their respective sample preparation protocols and the specific vulnerabilities of the protein sample during processing.
SDS-PAGE: This method separates proteins primarily by molecular weight [2]. The anionic detergent Sodium Dodecyl Sulfate (SDS) denatures proteins, binds to the polypeptide backbone in a constant ratio, and imparts a uniform negative charge, masking the protein's intrinsic charge [3] [17]. A reducing agent, such as Dithiothreitol (DTT) or β-mercaptoethanol, is typically added to break disulfide bonds [6] [17]. A key step is heating the sample to 95°C for 5 minutes to ensure complete denaturation [17]. While this heating step is destructive to higher-order structure, it also inactivates many proteases, offering a inherent level of protection against degradation.
Native PAGE: This technique separates proteins based on their native size, charge, and shape [1] [2]. Crucially, it omits denaturing agents like SDS and heating steps to preserve the protein's native conformation, biological activity, and multi-subunit interactions [7] [6]. Consequently, proteins remain fully folded and functional, but are also more susceptible to proteolysis because endogenous proteases retain their activity in the absence of denaturation [2]. This makes robust and proactive anti-degradation strategies absolutely critical for Native PAGE.
The table below summarizes the fundamental differences between these two techniques, with an emphasis on factors affecting sample integrity.
Table 1: Key Differences Between SDS-PAGE and Native PAGE with Implications for Sample Integrity
| Criteria | SDS-PAGE | Native PAGE |
|---|---|---|
| Separation Basis | Molecular Weight [1] | Native Size, Overall Charge, and Shape [1] [2] |
| Gel Condition | Denaturing [3] | Non-denaturing [3] |
| Sample Treatment | Heated (e.g., 95°C for 5 min) with SDS & Reducing Agents [1] [17] | Not Heated; No Denaturing Agents [1] |
| Protein State | Denatured and Linearized [7] | Native, Folded Conformation [3] [7] |
| Functional Recovery | Not possible; function destroyed [1] | Possible; function retained [3] [7] |
| Primary Degradation Risk | Primarily during sample preparation prior to heating | Throughout the entire procedure, from cell lysis to electrophoresis |
Strategic Pillars for Preventing Protein Degradation
Protease Inhibitors: Biochemical Defense
Protease inhibitors are molecules that specifically target and inactivate proteolytic enzymes. Given the diversity of proteases (e.g., serine, cysteine, metallo-, aspartic), a broad-spectrum cocktail is often necessary for full protection [67].
Table 2: Common Protease Inhibitors and Their Applications
| Inhibitor | Target Protease(s) | Mechanism of Action | Considerations for PAGE |
|---|---|---|---|
| PMSF (Phenylmethylsulfonyl fluoride) | Serine proteases | Irreversible sulfonation of serine residue [8] | Unstable in water; add fresh. Critical for native PAGE lysis [8]. |
| EDTA / EGTA | Metalloproteases | Chelates metal ions (e.g., Zn²⁺, Ca²⁺) required for activity [8] | Standard in SDS-PAGE buffers [8]. Omitted from native PAGE if metal cofactors are essential [8]. |
| Commercial Cocktails (e.g., cOmplete) | Broad-spectrum (Serine, Cysteine, Metallo-) | Mixture of inhibitors for synergistic action [67] | Convenient and reliable. Used pre-formulated in RIPA buffer for cell lysis [67]. |
| Benzonase | Nucleases | Degrades DNA and RNA [8] | Reduces sample viscosity. Added during sonication to aid clarification [8]. |
Temperature Control: Physical Defense
Temperature is a powerful physical tool to modulate protease activity. The foundational rule is to maintain samples at 0–4°C during all steps where protein denaturation is undesirable, particularly for Native PAGE [2]. This includes cell lysis, centrifugation, and sample storage. The choice of temperature is a direct consequence of the chosen PAGE method, as illustrated in the workflow below.
Experimental Protocols for Integrity-Preserving Protein Preparation
Protocol 1: Cell Lysis for SDS-PAGE with Protease Protection
This protocol is designed for the initial preparation of a denatured protein sample, suitable for SDS-PAGE, with an emphasis on preventing degradation before the heating step inactivates proteases.
Key Materials & Reagents:
- RIPA Lysis Buffer: A harsh detergent-based buffer for efficient cell disruption.
- Protease Inhibitor Cocktail: A commercial, broad-spectrum formulation (e.g., cOmplete, Mini) [67].
- DTT or β-mercaptoethanol: Reducing agents to break disulfide bonds.
- 4X LDS Sample Buffer: Contains SDS and other ions for denaturation [67].
- Pre-chilled equipment: Microcentrifuge tubes, cell scrapers, and centrifuges.
Step-by-Step Procedure:
- Pre-cool Equipment: Ensure the microcentrifuge, centrifuge tubes, and PBS are pre-cooled to 4°C.
- Wash Cells: Aspirate culture media from adherent cells (e.g., LLC-PK1) and wash gently with ice-cold Dulbecco's Phosphate Buffered Saline (DPBS) [8].
- Lysate Preparation: Add RIPA buffer supplemented with protease inhibitor cocktail directly to the cell monolayer (e.g., 400 μL per well of a 12-well plate) [67]. Scrape cells swiftly and transfer the lysate to a pre-chilled microcentrifuge tube.
- Incubate and Clarify: Incubate the lysate on ice for 15 minutes to ensure complete lysis. Clarify the lysate by centrifugation at 12,000 × g for 15 minutes at 4°C [67].
- Denature Sample: Transfer the supernatant to a new tube. Perform a protein quantification assay (e.g., BCA). Mix ~10 μg of protein with 4X LDS sample buffer and a reducing agent like DTT (final concentration can be 200 mM) [67]. Heat the mixture at 95°C for 5 minutes in a dry bath [67] [17].
- Storage or Load: The denatured sample can be stored at -20°C or loaded directly onto an SDS-PAGE gel.
Protocol 2: Preparing a Native Protein Lysate for Native PAGE
This protocol is tailored for maintaining proteins in their native, functional state and is therefore more stringent in its temperature and inhibition requirements.
Key Materials & Reagents:
- Mild Lysis Buffer: A non-denaturing buffer (e.g., 20 mM Tris-Cl, pH 7.4) to preserve protein interactions [8].
- Specific Protease Inhibitors: PMSF and a cocktail tailored to the sample's known proteases [8] [67].
- Benzonase Nuclease: Reduces sample viscosity by digesting nucleic acids, which is especially useful for sonicated samples [8].
- 4X Native Sample Buffer: A buffer containing Tris, glycerol, and a dye like Coomassie G-250, but no SDS or reducing agents [8].
Step-by-Step Procedure:
- Work in the Cold: Perform all steps in a 4°C cold room or on ice.
- Harvest Cells: Wash and scrape cells as in Protocol 1, but use a mild, degassed buffer like 20 mM Tris-Cl, pH 7.4 [8].
- Sonicate and Digest Nucleic Acids: Sonicate the cell suspension on ice. Add 500 μM PMSF and 1000 U of Benzonase nuclease to inhibit proteolysis and reduce viscosity [8].
- Clarify Lysate: Centrifuge the lysate at high speed (e.g., 47,000 × g for 30 minutes at 4°C) to remove cellular debris [8].
- Prepare Native Sample: Keep the supernatant on ice. Mix 7.5 μL of the supernatant with 2.5 μL of 4X native sample buffer. Do not heat the sample [8].
- Immediate Analysis: Load the sample onto a pre-run Native PAGE gel immediately. The electrophoresis apparatus should be kept at 4°C during the run to maintain protein stability [1] [2].
The Scientist's Toolkit: Essential Research Reagents
Table 3: Key Reagents for Preventing Protein Degradation in PAGE
| Reagent / Solution | Function | Key Consideration |
|---|---|---|
| cOmplete, Mini Protease Inhibitor Cocktail | Broad-spectrum inhibition of serine, cysteine, and metalloproteases [67]. | Tablets are convenient; dissolve in lysis buffer immediately before use. Essential for native procedures. |
| PMSF (Phenylmethylsulfonyl fluoride) | Targets serine proteases specifically [8]. | Short half-life in aqueous solution; must be added fresh from a stock solution. |
| DTT (Dithiothreitol) | Reducing agent that cleaves disulfide bonds [67]. | Used in SDS-PAGE. Adds an extra layer of denaturation. Keep stock solutions frozen. |
| RIPA Buffer | Radio-Immunoprecipitation Assay buffer; a denaturing lysis buffer. | Ideal for SDS-PAGE as it efficiently disrupts membranes and denatures proteins. |
| Tris-Based Buffer (pH 7.4) | A mild, non-denaturing lysis buffer. | Used for Native PAGE to preserve protein complexes and function [8]. |
| Benzonase Nuclease | Degrades DNA/RNA to reduce sample viscosity and prevent clogging. | Improves gel resolution and protein transfer efficiency in western blotting [8]. |
Preventing protein degradation is not a single step but an integrated strategy that spans the entire experimental workflow. The choice between SDS-PAGE and Native PAGE dictates a cascade of subsequent decisions regarding lysis buffer composition, protease inhibitor selection, and, most critically, temperature management. SDS-PAGE offers a built-in defense through its terminal heating step, whereas Native PAGE demands unwavering diligence in maintaining cold temperatures and potent protease inhibition from the moment of cell lysis until the completion of the gel run. By meticulously applying the principles and protocols detailed in this guide, researchers can ensure that the banding patterns they observe are a true reflection of the protein sample, thereby guaranteeing the reliability and interpretability of their data in both basic research and drug development contexts.
Handling High Molecular Weight Proteins and Membrane Protein Complexes
The choice between SDS-PAGE and Native PAGE represents a fundamental strategic decision in protein analysis, with profound implications for studying high molecular weight proteins and membrane protein complexes. These two electrophoretic techniques serve complementary yet distinct purposes, each with unique advantages and limitations for specific research applications. SDS-PAGE (sodium dodecyl sulfate-polyacrylamide gel electrophoresis) separates proteins based primarily on molecular weight under denaturing conditions, making it ideal for determining protein size and purity [7] [2]. In contrast, Native PAGE separates proteins in their folded, native state based on a combination of charge, size, and shape, preserving protein function and complex interactions [7] [1]. Understanding these core differences is essential for researchers investigating large protein assemblies and membrane-bound complexes, which present unique challenges including solubility issues, molecular size constraints, and the need to maintain non-covalent interactions for functional analysis.
For high molecular weight proteins and intricate membrane complexes, the preservation of native structure often provides critical biological insights that would be lost under denaturing conditions. This technical guide examines the specialized methodologies required for successful electrophoretic analysis of these challenging protein samples, focusing on practical applications within drug development and basic research contexts where maintaining biological activity is paramount for functional characterization.
Core Principles: SDS-PAGE versus Native PAGE
Fundamental Separation Mechanisms
The operational distinctions between SDS-PAGE and Native PAGE stem from their differential treatment of protein structure during the separation process. In SDS-PAGE, the anionic detergent sodium dodecyl sulfate (SDS) denatures proteins by binding to the polypeptide backbone in a constant weight ratio (approximately 1.4g SDS per 1g of protein) [2]. This binding masks the proteins' intrinsic charge and confers a uniform negative charge density, resulting in separation based almost exclusively on molecular mass as the SDS-coated polypeptides migrate through the polyacrylamide gel matrix [23] [68]. The denaturation process typically involves heating protein samples to 70-100°C in the presence of SDS and reducing agents like DTT or β-mercaptoethanol to break disulfide bonds, ensuring complete unfolding into linear chains [2] [1].
In Native PAGE, no denaturing agents are used, allowing proteins to maintain their native conformation, quaternary structure, and biological activity throughout the electrophoretic process [7] [1]. Separation occurs based on the intrinsic charge of the proteins at the gel pH combined with their hydrodynamic size and shape as they migrate through the gel matrix [2] [69]. This preservation of native structure enables the analysis of protein-protein interactions, multimeric complexes, and enzymatic activities directly within the gel, though molecular weight determination is less straightforward than in SDS-PAGE due to the influence of charge and conformation on migration distance [7].
Comparative Analysis: Technical Specifications
Table 1: Key technical differences between SDS-PAGE and Native PAGE
| Parameter | SDS-PAGE | Native PAGE |
|---|---|---|
| Separation Basis | Molecular weight primarily [2] [68] | Size, charge, and shape [7] [2] |
| Protein State | Denatured, linearized polypeptides [7] [68] | Native, folded conformation [7] [1] |
| Detergent Usage | SDS present in sample and running buffers [2] [1] | No SDS or other denaturing detergents [1] |
| Sample Preparation | Heating (70-100°C) with reducing agents [2] [1] | No heating; maintained at 4°C [1] |
| Protein Function Post-Separation | Lost due to denaturation [7] [1] | Retained, including enzymatic activity [7] [2] |
| Molecular Weight Determination | Accurate via comparison to standards [23] [2] | Approximate due to charge/shape influence [7] |
| Typical Applications | Molecular weight estimation, purity assessment, western blotting [7] [2] | Protein complex analysis, enzyme activity assays, oligomerization studies [7] [70] |
| Protein Recovery | Generally non-functional [1] | Functional proteins can be recovered [1] |
Specialized Techniques for Complex Protein Analysis
Blue Native PAGE (BN-PAGE) for Membrane Protein Complexes
Blue Native PAGE represents a specialized variant of native electrophoresis particularly suited for analyzing membrane protein complexes and high molecular weight assemblies. Developed by Schägger and von Jagow, this technique employs the mild non-ionic detergent n-dodecyl-β-D-maltoside (DDM) for membrane solubilization while preserving protein-protein interactions within complexes [70] [53]. The anionic dye Coomassie Blue G-250 binds to hydrophobic protein surfaces, imparting a negative charge shift that facilitates migration toward the anode while preventing protein aggregation during electrophoresis [53]. This charge-shift method enables the separation of intact protein complexes according to their molecular mass under native conditions.
The exceptional utility of BN-PAGE lies in its ability to resolve functional oxidative phosphorylation (OXPHOS) complexes, respiratory chain supercomplexes, and other membrane-embedded assemblies that would dissociate under standard electrophoretic conditions [70] [53]. When the even milder detergent digitonin is used for membrane solubilization, BN-PAGE can preserve and resolve supramolecular structures such as respirasomes (Complex I-III-IV associations) [53]. Following separation, complexes can be excised and subjected to second-dimension SDS-PAGE to identify constituent subunits, or analyzed for in-gel enzymatic activity using specific histochemical staining methods [70] [53]. This technique has proven invaluable for investigating assembly defects in mitochondrial disorders and characterizing novel protein complexes in native tissues.
Modified Electrophoretic Conditions for High Molecular Weight Proteins
The analysis of high molecular weight proteins (>200 kDa) demands specific electrophoretic conditions to achieve adequate resolution while maintaining protein integrity. For SDS-PAGE, low-percentage acrylamide gels (typically 4-8%) with extended run times facilitate improved separation of large polypeptides by providing larger pore sizes that reduce sieving effects [2] [6]. Gradient gels (e.g., 4-16% acrylamide) are particularly effective as they allow proteins to encounter progressively smaller pores, sharpening bands across a broad molecular weight range [2] [6]. The inclusion of glycerol (5-10%) in running buffers can enhance resolution of high molecular weight proteins by modifying viscosity and migration dynamics [6].
For native analyses, modifications to standard BN-PAGE have been developed to address specific research needs. Clear Native PAGE (CN-PAGE) replaces Coomassie dye with mixtures of anionic and neutral detergents in the cathode buffer, eliminating potential dye-induced dissociation of labile complexes and avoiding interference with downstream fluorescence analyses or enzyme activity assays [53] [69]. Research by PMC has demonstrated that Native SDS-PAGE (NSDS-PAGE)—using significantly reduced SDS concentrations (0.0375% versus standard 0.1%) in running buffers while eliminating EDTA and heating steps—enables high-resolution separation with remarkable retention of enzymatic activity and bound metal ions in many metalloproteins [8]. This modified approach retained 98% of Zn²⁺ in proteomic samples compared to only 26% with standard SDS-PAGE, with seven of nine model enzymes maintaining activity post-electrophoresis [8].
Table 2: Buffer compositions for different electrophoretic methods
| Component | SDS-PAGE | BN-PAGE | NSDS-PAGE |
|---|---|---|---|
| Sample Buffer | 106 mM Tris HCl, 141 mM Tris Base, 0.51 mM EDTA, 2% LDS, 10% Glycerol, pH 8.5 [8] | 50 mM BisTris, 50 mM NaCl, 10% Glycerol, pH 7.2 [8] | 100 mM Tris HCl, 150 mM Tris Base, 10% Glycerol, 0.01875% Coomassie G-250, pH 8.5 [8] |
| Running Buffer | 50 mM MOPS, 50 mM Tris Base, 1 mM EDTA, 0.1% SDS, pH 7.7 [8] | Cathode: 50 mM BisTris, 50 mM Tricine, 0.02% Coomassie G-250, pH 6.8; Anode: 50 mM BisTris, 50 mM Tricine, pH 6.8 [8] | 50 mM MOPS, 50 mM Tris Base, 0.0375% SDS, pH 7.7 [8] |
| Key Additives | SDS, reducing agents [2] [1] | Coomassie G-250, mild detergents (DDM/digitonin) [53] | Reduced SDS, Coomassie G-250 [8] |
Experimental Protocols for Challenging Protein Samples
BN-PAGE Protocol for Membrane Protein Complexes
The following protocol outlines the step-by-step procedure for analyzing membrane protein complexes using BN-PAGE, adapted from established methodologies with proven efficacy for respiratory complexes and membrane assemblies [70] [53]:
Sample Preparation:
- Membrane Isolation: Harvest cells or tissues and disrupt using hypotonic buffer or mechanical homogenization. For cultured cells, dislodge by trypsinization, wash with PBS, and pellet by centrifugation at 600 × g for 5 minutes at 4°C [53].
- Membrane Solubilization: Resuspend membrane pellets in solubilization buffer (20 mM Bis-Tris, 500 mM 6-aminocaproic acid, pH 7.0) containing 1-2% n-dodecyl-β-D-maltoside (DDM) or digitonin for supercomplex preservation [53]. Use a detergent-to-protein ratio of 2-4 g/g for optimal results.
- Clarification: Incubate samples on ice for 30 minutes with gentle agitation, then centrifuge at 100,000 × g for 30 minutes at 4°C to remove insoluble material [70].
- Sample Buffer Addition: Mix the supernatant with BN-PAGE sample buffer (50 mM BisTris, 50 mM NaCl, 10% glycerol, 0.001% Ponceau S, pH 7.2) and Coomassie Blue G-250 to a final concentration of 0.25-0.5% [8] [53].
Gel Electrophoresis:
- Gel Selection: Use 3-12% or 4-16% linear gradient polyacrylamide gels for optimal resolution of complexes ranging from 100 kDa to several MDa [53]. Precast gels are commercially available, or manually cast using gradient makers.
- Electrophoresis Conditions: Load 10-50 μg of protein per lane and run at 4°C for optimal complex stability. Begin electrophoresis at 100V for 30 minutes, then increase to 150-200V for 2-3 hours using cathode buffer (50 mM BisTris, 50 mM Tricine, 0.02% Coomassie G-250, pH 6.8) and anode buffer (50 mM BisTris, 50 mM Tricine, pH 6.8) [8] [53]. Continue until the dye front reaches the gel bottom.
Downstream Applications:
- In-Gel Activity Staining: Following electrophoresis, incubate gels in appropriate substrate solutions to detect enzymatic activities: Complex I (NADH-nitroblue tetrazolium), Complex II (succinate-PMS-MTT), Complex IV (diaminobenzidine-cytochrome c), or Complex V (ATPase calcium phosphate precipitation) [53].
- Two-Dimensional Analysis: Excise BN-PAGE lanes and incubate in 1% SDS/1% β-mercaptoethanol for 30 minutes, then embed on SDS-PAGE gels for second-dimension separation to resolve complex subunits [70] [53].
- Western Blotting: Transfer proteins to PVDF membranes using semi-dry blotting systems for immunodetection with specific antibodies [53].
BN-PAGE Experimental Workflow: This diagram illustrates the key steps in Blue Native PAGE analysis of membrane protein complexes, from sample preparation through downstream applications.
NSDS-PAGE Protocol for High Molecular Weight Proteins with Functional Preservation
The Native SDS-PAGE (NSDS-PAGE) protocol offers a hybrid approach that maintains some native protein characteristics while providing high-resolution separation similar to traditional SDS-PAGE [8]:
Sample and Buffer Preparation:
- Sample Treatment: Mix 7.5 μL of protein sample (5-25 μg) with 2.5 μL of 4X NSDS sample buffer (100 mM Tris HCl, 150 mM Tris base, 10% v/v glycerol, 0.0185% w/v Coomassie G-250, 0.00625% w/v Phenol Red, pH 8.5) [8]. Importantly, omit heating steps to preserve native structure.
- Gel Pre-equilibration: Pre-run precast NuPAGE Novex 12% Bis-Tris mini-gels in double-distilled H₂O at 200V for 30 minutes to remove storage buffer and unpolymerized acrylamide [8].
- Running Buffer Preparation: Prepare NSDS-PAGE running buffer (50 mM MOPS, 50 mM Tris Base, 0.0375% SDS, pH 7.7) without EDTA [8].
Electrophoresis and Analysis:
- Sample Loading and Separation: Load prepared samples alongside native protein standards. Run electrophoresis at constant voltage (200V) for approximately 45 minutes at room temperature until the dye front reaches the gel bottom [8].
- Functional Analysis: Following electrophoresis, proteins can be tested for retained enzymatic activity by incubating gels in appropriate substrate buffers or assessed for metal content using techniques like laser ablation-inductively coupled plasma-mass spectrometry (LA-ICP-MS) [8].
- Visualization: Stain gels with Coomassie Brilliant Blue or compatible fluorescent stains for protein detection. Avoid fixation with acetic acid if planning activity assays.
The Scientist's Toolkit: Essential Research Reagents
Table 3: Key reagents for electrophoretic analysis of high molecular weight proteins and membrane complexes
| Reagent | Function | Application Examples |
|---|---|---|
| n-Dodecyl-β-D-maltoside (DDM) | Mild non-ionic detergent for membrane protein solubilization while preserving native complexes [70] [53] | Solubilization of respiratory chain complexes for BN-PAGE [70] |
| Digitonin | Very mild detergent for preserving supramolecular protein assemblies [53] | Analysis of respiratory supercomplexes in BN-PAGE [53] |
| Coomassie Blue G-250 | Anionic dye that binds hydrophobic protein surfaces, imparting negative charge for electrophoresis [53] | Charge shift agent in BN-PAGE for membrane protein separation [53] |
| 6-Aminocaproic Acid | Zwitterionic salt that enhances extraction of membrane proteins without disrupting complexes [53] | Additive in solubilization buffers for BN-PAGE sample preparation [53] |
| Bis-Tris Buffers | Buffering system for stable pH conditions in native electrophoresis [8] [53] | Primary buffer component in BN-PAGE and NSDS-PAGE systems [8] |
| NativeMark Unstained Standards | High molecular weight protein standards for native electrophoresis calibration [8] | Molecular weight estimation in BN-PAGE and Native PAGE [8] |
| DDM | Mild non-ionic detergent for membrane solubilization with complex preservation [70] | Extraction of intact ATP synthase complexes from bacterial membranes [70] |
Technical Considerations and Troubleshooting
Optimization Strategies for Challenging Samples
Successful electrophoretic analysis of high molecular weight proteins and membrane complexes requires careful optimization of multiple parameters. For membrane proteins, the critical choice of detergent significantly impacts complex stability and resolution [70]. N-dodecyl-β-D-maltoside (DDM) typically provides a balance between efficient solubilization and complex preservation, while digitonin offers milder conditions for maintaining supercomplexes but may yield lower total protein extraction [53]. Systematic detergent screening at various concentrations (0.5-4%) is recommended for novel membrane protein targets.
The acrylamide gradient profoundly influences resolution across different molecular weight ranges. For complexes exceeding 500 kDa, shallow gradients (e.g., 3-10% acrylamide) provide superior separation, while steeper gradients (e.g., 4-16%) offer broader size range coverage [53]. Electrophoresis temperature represents another crucial variable, with 4°C generally recommended for maintaining complex integrity during extended runs, though some complexes may remain stable at room temperature [1] [53].
Troubleshooting Common Experimental Challenges
Several technical challenges commonly arise when working with high molecular weight proteins and membrane complexes:
Poor Resolution or Smearing: This may result from insufficient detergent during solubilization, protein overloading, or inappropriate gel percentage. Potential solutions include increasing detergent concentration (while monitoring complex stability), reducing sample load to 10-20 μg per lane, or optimizing acrylamide gradient parameters [70] [6].
Loss of Enzymatic Activity: In native approaches, activity loss can stem from oxidative damage, proteolytic degradation, or complex dissociation. Incorporating protease inhibitors (PMSF, complete protease inhibitor cocktails), antioxidant systems (e.g., ascorbate), and maintaining cool temperatures throughout sample processing can preserve function [8] [53].
Incomplete Solubilization: Membrane protein aggregates may persist with mild detergents. Sequential extraction strategies using progressively stronger detergents can resolve this issue, though with potential loss of native interactions. Sonication or brief freeze-thaw cycles may enhance extraction efficiency for challenging samples [70].
Vertical Streaking in 2D Analyses: In second-dimension SDS-PAGE following BN-PAGE, vertical streaking often indicates incomplete complex dissociation. Increasing SDS concentration to 2-4% and extending incubation time with reducing agents before second-dimension separation typically improves results [70] [53].
Technique Selection Guide: This decision diagram illustrates the strategic selection process for electrophoretic methods based on research objectives and sample characteristics.
The strategic selection and proper implementation of electrophoretic techniques is fundamental to successful research on high molecular weight proteins and membrane protein complexes. While SDS-PAGE remains the gold standard for molecular weight determination and purity assessment, Native PAGE approaches—particularly BN-PAGE and its variants—provide indispensable tools for investigating native protein interactions, oligomeric states, and functional characteristics. The development of modified techniques like NSDS-PAGE demonstrates continued methodological innovation, bridging the gap between high-resolution separation and functional preservation.
For researchers in drug development and basic science, understanding these complementary approaches enables appropriate experimental design for specific protein challenges. The preservation of membrane protein complexes and high molecular weight assemblies in their native states offers unique insights into biological mechanisms that would remain obscured by denaturing techniques. As electrophoretic methodologies continue to evolve with enhanced detection systems and refined separation matrices, their utility in characterizing complex protein systems will undoubtedly expand, providing increasingly powerful tools for proteomic research and therapeutic development.
The fundamental principles governing protein separation differ significantly between sodium dodecyl sulfate polyacrylamide gel electrophoresis (SDS-PAGE) and native PAGE, defining their respective applications in protein analysis. SDS-PAGE employs an ionic detergent to denature proteins and impart a uniform negative charge, separating polypeptides almost exclusively by molecular mass [2]. While this provides excellent resolution for analytical purposes, it destroys higher-order structure, quaternary interactions, and functional properties such as enzymatic activity [8] [2].
In contrast, native PAGE separates proteins according to the net charge, size, and shape of their native structure without denaturing agents [2]. This technique preserves protein complexes, enzymatic activity, and non-covalently bound cofactors—including metal ions essential for metalloprotein function [8] [2]. Consequently, native PAGE is indispensable for functional proteomics, interaction studies, and any downstream application requiring biologically active proteins. The recovery of these functional proteins from native gels, particularly via electro-elution, is therefore a critical methodological bridge between separation and subsequent biochemical analysis.
The Principle of Electro-elution
Electro-elution is a method used to extract nucleic acids or proteins from an electrophoresis gel by applying an electric field, drawing the macromolecules out of the gel matrix for subsequent collection and analysis [71]. The process essentially reverses the migration that occurred during electrophoresis.
During electro-elution from native gels, proteins are moved out of the gel slice and into a small volume of buffer trapped against the direction of protein migration by a semi-permeable membrane. This membrane allows the passage of ions and small molecules but retains the target protein, which is typically larger. The result is the concentration of the protein in a recoverable liquid fraction. This technique is particularly valuable for native PAGE separations because it can be performed under non-denaturing conditions, preserving the protein's native state and function. Preparative native PAGE can yield more than 95% recovery of functional proteins, including metalloproteins [71].
Table 1: Key Differences Between SDS-PAGE and Native PAGE with Functional Recovery Considerations
| Parameter | SDS-PAGE | Native PAGE |
|---|---|---|
| Separation Basis | Polypeptide molecular mass [2] | Native charge, size, and shape [2] |
| Protein State | Denatured and unfolded [2] | Native and folded [2] |
| Functional Activity | Destroyed [8] | Often retained [8] [2] |
| Metal Cofactors | Lost during denaturation [8] | Often retained (e.g., Zn²⁺) [8] |
| Typical Elution Goal | Identification, sequencing | Functional studies, activity assays |
| Suitability for Electro-elution | Moderate (for mass spectrometry) [72] | High (for functional recovery) [71] |
Experimental Protocols for Electro-elution
Standard Electro-elution Methodology
A common and effective electro-elution protocol utilizes a horizontal setup constructed with simple laboratory materials [73]. The following provides a detailed methodology.
Research Reagent Solutions & Essential Materials
Table 2: Essential Materials for Electro-elution
| Item | Function/Description |
|---|---|
| Dialysis Membrane | Acts as a trap or barrier to retain eluted proteins while allowing small ions and contaminants to pass through [73]. |
| Horizontal Flat-Bed Electroelution Cuvette | Can be constructed with glass plates and a dialysis membrane [73]. |
| Electroelution Buffer | A non-denaturing buffer compatible with native electrophoresis (e.g., 25 mM Tris base, 0.192 M glycine) [73]. |
| Microcentrifuge Tubes | For collecting the eluted protein sample (1.5 mL capacity) [73]. |
| Power Supply | Provides controlled electrical current for the elution process. |
Step-by-Step Protocol:
- Post-Electrophoresis Processing: Following native PAGE, carefully excise the gel slice containing the protein band of interest. Use a clean razor blade and minimize the gel volume to improve efficiency.
- Equipment Assembly: Construct a horizontal electro-elution cuvette. A typical setup involves creating a well or chamber using glass plates and a piece of dialysis membrane that has been pre-soaked in elution buffer to remove preservatives [73].
- Loading: Place the excised gel piece into the assembled chamber. Fill the chamber with an appropriate native electro-elution buffer (e.g., 25 mM Tris-glycine), ensuring the gel piece is completely submerged [73].
- Electro-elution: Immerse the entire assembly in an electrophoresis tank filled with the same buffer. Apply a constant current (e.g., 24 mA) for a defined period (e.g., 2 hours) at 4°C to prevent overheating and denaturation [73]. The electric field will drive the protein out of the gel and into the buffer confined by the dialysis membrane.
- Sample Recovery: After elution, turn off the power and carefully retrieve the protein solution from the chamber. The solution can then be concentrated and desalted if necessary, using ultrafiltration membranes with an appropriate molecular weight cutoff [73].
Performance and Quantitative Data
Electro-elution is recognized for its efficiency. As noted, preparative native PAGE can yield more than 95% recovery of metalloproteins [71]. This high recovery rate is crucial when working with precious samples or low-abundance proteins. The method is effective for a wide range of protein sizes, though very large protein complexes (>70 kDa) can sometimes be challenging to extract efficiently with some commercial electro-elution devices [74].
Table 3: Comparison of Protein Extraction Methods from Polyacrylamide Gels
| Method | Principle | Typical Duration | Key Advantages | Key Limitations |
|---|---|---|---|---|
| Passive Diffusion | Diffusion of proteins from crushed gel into buffer [75] | 4 hours to overnight [75] | Simple, no special equipment required [75] | Slow, inefficient for large proteins (>60-70 kDa), diluted sample [74] [75] |
| Electro-elution | Application of electric field to drive proteins from gel [71] | 30 minutes to 2 hours [73] [74] | Faster than passive elution, higher recovery for many proteins [71] | Requires special device, buffer components may interfere [74] |
| Gel Dissolution | Chemical dissolution of the polyacrylamide matrix [75] | Varies | Potentially complete protein recovery | Harsh conditions (e.g., H₂O₂, NaOH) denature and damage proteins [75] |
| PEPPI-MS (Passive Elution) | Enhanced passive extraction using CBB as an extraction enhancer [72] | ~10 minutes shaking [72] | Rapid, high recovery (e.g., ~68% <100 kDa), no special equipment [72] | Involves organic solvent precipitation; recovery lower for proteins >100 kDa [72] |
Downstream Applications of Eluted Functional Proteins
Proteins recovered from native gels via electro-elution are suitable for a wide array of downstream biochemical and analytical applications, precisely because their native structure and function are preserved. These applications include:
- Functional and Enzymatic Assays: A key application is the direct assessment of protein function. For instance, in a modified native SDS-PAGE (NSDS-PAGE) study, seven out of nine model enzymes, including four zinc-binding proteins, retained their activity after electrophoresis and could be assayed post-elution [8].
- Structural Biology and Mass Spectrometry (MS): Eluted proteins can be used for structural proteomics. While SDS-PAGE is often combined with bottom-up MS, native eluates are ideal for native MS and cross-linking MS (XL-MS), which provide information on higher-order structure and protein-protein interactions [72].
- Antibody Production and Immunological Assays: Electro-eluted native proteins, which maintain their conformational epitopes, serve as excellent antigens for generating high-quality antibodies [75].
- Protein-Protein Interaction Studies: Since native PAGE preserves oligomeric states and protein complexes, proteins eluted from these gels can be used to study multiprotein assemblies and interaction networks without the need for reconstitution [76].
Electro-elution stands as a powerful and efficient technique for the recovery of functional proteins from native polyacrylamide gels. Its superiority lies in the ability to retrieve proteins in their active, native state, enabling a direct path from electrophoretic separation to functional characterization. While the method requires specific equipment and optimization, its high recovery yields and compatibility with sensitive downstream applications make it an indispensable tool in the functional proteomics workflow. For researchers investigating protein complexes, enzyme mechanisms, or protein-drug interactions, mastering electro-elution from native gels is a critical step toward generating robust and biologically relevant data.
Addressing Aggregation and Poor Resolution in Native PAGE with Novel Nanodisc Approaches
The study of membrane proteins and native protein complexes is fundamental to understanding cellular functions and developing new therapeutics. For such analyses, Native Polyacrylamide Gel Electrophoresis (Native PAGE) serves as a crucial technique that preserves proteins in their native, functional state by omitting denaturing agents. This allows for the separation of proteins based on their intrinsic charge, size, and three-dimensional shape, maintaining enzymatic activity, protein-protein interactions, and cofactor binding [2]. However, despite these advantages, researchers consistently face significant challenges with protein aggregation and poor resolution when using conventional Native PAGE methods, particularly for hydrophobic membrane proteins [77]. These limitations stem from the inherent properties of membrane proteins, which, when removed from their lipid bilayer environment, tend to aggregate and precipitate, leading to smeared bands, loss of sample, and unreliable results [78].
The most prevalent solution for studying membrane proteins involves extraction with micellar detergents. While effective for solubilization, detergents create an artificial environment that can distort protein structure, disrupt functionally important interactions, and strip away essential lipid cofactors [78] [79]. Consequently, there is a pressing need for innovative methodologies that can bridge the gap between maintaining protein native states and achieving high-resolution separation. This technical guide explores the integration of nanodisc technology with advanced Native PAGE techniques as a transformative approach to overcome these long-standing limitations. By providing a more native-like membrane environment, nanodiscs stabilize membrane proteins in solution, reduce aggregation, and enable clearer, more informative electrophoretic separations, thereby opening new avenues for structural and functional characterization of these critical biomolecules.
Fundamental Separation Principles: SDS-PAGE vs. Native PAGE
To fully appreciate the challenges of native protein analysis and the solutions offered by nanodisc technology, it is essential to understand the core principles governing the two primary electrophoretic methods.
SDS-PAGE is a denaturing technique that separates proteins primarily by molecular mass. The anionic detergent Sodium Dodecyl Sulfate (SDS) denatures proteins and binds to the polypeptide backbone in a constant weight ratio, imparting a uniform negative charge that overwhelms the protein's intrinsic charge. When subjected to an electric field within a polyacrylamide gel matrix, SDS-coated proteins migrate toward the anode, with smaller proteins moving faster through the pores than larger ones [2] [23]. Sample preparation involves heating the protein in the presence of SDS and a reducing agent (like DTT) to break disulfide bonds, fully unraveling the protein into its primary subunit structure [2] [6]. While this provides excellent resolution based on size, it destroys higher-order structure, quaternary interactions, and enzymatic activity [8].
In stark contrast, Native PAGE is performed without denaturing agents. Separation depends on a combination of the protein's native net charge, size, and three-dimensional shape [2]. The protein's intrinsic charge dictates its direction and initial speed of migration in the electric field, while the gel matrix exerts a sieving effect that is influenced by the protein's hydrodynamic size and shape [2]. A key advantage is the preservation of multimeric complexes and biological activity, allowing for functional assays after separation [2]. The table below summarizes the critical differences between these two techniques.
Table 1: Core Principles and Applications of SDS-PAGE versus Native PAGE
| Parameter | SDS-PAGE (Denaturing) | Native PAGE (Non-Denaturing) |
|---|---|---|
| Separation Basis | Primarily molecular mass of polypeptide chains [2] | Net charge, size, and shape of native structure [2] |
| Sample Preparation | Heating with SDS and reducing agents (e.g., DTT) [67] | No heating or denaturants; samples kept cold [2] |
| Protein State | Denatured into monomeric subunits [6] | Native conformation and oligomeric state preserved [2] |
| Functional Activity | Destroyed [8] | Often retained [2] |
| Key Applications | Molecular weight determination, purity assessment [2] | Analysis of protein complexes, oligomeric states, active enzymes [77] [2] |
Limitations of Conventional Methods and the Role of Nanodiscs
The fundamental challenge with conventional Native PAGE, especially for membrane proteins, lies in the conflicting requirements of protein solubilization and native state preservation. Detergent-based extraction, while practical, often fails to replicate the native membrane environment. This can lead to partial denaturation of extramembranous domains, loss of essential lipid cofactors, and disruption of weak but functionally critical protein-protein interactions [80]. Furthermore, the dynamic nature of detergent micelles can induce conformational exchange and instability, broadening protein bands and reducing resolution in electrophoretic analyses [80].
Blue Native PAGE (BN-PAGE) was developed to improve the handling of membrane protein complexes. This method uses Coomassie dye or similar compounds to confer a negative charge on native proteins, allowing them to migrate in an electric field. While BN-PAGE is powerful for analyzing oligomeric complexes, it still often relies on detergents for initial solubilization and can fall short of the high resolution achieved by SDS-PAGE for complex protein mixtures [8] [77]. A study highlighted that the monodispersity of a membrane protein sample in BN-PAGE strongly correlates with its propensity to form crystals, underscoring the technique's utility in assessing sample quality for structural studies [77].
Nanodisc technology presents a paradigm shift by replacing detergent micelles with a more physiologically relevant system. Nanodiscs are nanoscale, discoidal phospholipid bilayers whose edges are stabilized by encircling membrane scaffold proteins (MSPs) or other amphipathic polymers like Styrene Maleic Acid (SMA) copolymers [78] [81]. This architecture encapsulates membrane proteins in a native-like lipid environment while maintaining water solubility. The key advantages of this system for Native PAGE include:
- Prevention of Aggregation: The lipid bilayer shield protects the hydrophobic surfaces of membrane proteins, preventing their uncontrolled aggregation in aqueous solution [78].
- Enhanced Stability: Proteins in nanodiscs often exhibit superior stability compared to their detergent-solubilized counterparts, which is critical for obtaining sharp bands during electrophoresis [80].
- Preserved Native Structure and Function: By maintaining a local lipid environment, nanodiscs help preserve the correct folding, cofactor binding, and functional activity of integral and peripheral membrane proteins [81] [80].
- Control over Oligomeric State: The size of nanodiscs can be tuned by choosing different MSP variants, allowing researchers to control and study specific oligomeric states of their target membrane protein [78].
Table 2: Comparison of Membrane Protein Solubilization and Analysis Methods
| Method | Mechanism | Advantages | Limitations |
|---|---|---|---|
| Detergent Micelles | Disrupts lipid bilayer, forms protein-detergent complex [77] | Well-established, widely used protocols [79] | Can denature proteins, strip native lipids, poor stability [78] [80] |
| BN-PAGE | Coomassie dye charges protein complexes; mild detergents often used [77] | Analyzes oligomeric states, good for protein complexes [77] | Lower resolution than SDS-PAGE, detergent interference possible [8] |
| MSP Nanodiscs | MSP proteins encircle a lipid bilayer patch [78] [81] | Tunable size, native-like environment, high stability [78] | Requires optimization of lipid/protein/MSP ratios [78] |
| Polymer Nanodiscs (e.g., SMA) | Polymers directly extract lipid/protein patches from membranes [79] | Direct extraction from native membranes, no detergent needed [79] | Variable extraction efficiency depending on polymer and protein [79] |
A Technical Guide to Nanodisc-Assisted Native PAGE
Implementing nanodisc technology for Native PAGE involves two main stages: the reconstitution of the target protein into nanodiscs, followed by electrophoretic separation under native conditions.
Reconstitution of Membrane Proteins into Nanodiscs
The process begins with the selection of an appropriate scaffold. Membrane Scaffold Proteins (MSPs), derived from Apolipoprotein A-1, are a common choice. Available in various lengths (e.g., MSP1, MSP1E3D1, MSP2N2), they allow for the creation of nanodiscs with defined diameters, typically ranging from 9 nm to 17 nm [81]. The reconstitution protocol involves several key steps [78] [81]:
- Solubilization: The target membrane protein is first solubilized from the cellular membrane using a suitable detergent.
- Formation of the Reconstitution Mixture: The solubilized protein is mixed with purified MSP and phospholipids (e.g., DOPC, POPC) at optimized ratios.
- Self-Assembly and Detergent Removal: Upon the removal of detergents using adsorbents like bio-beads, the components self-assemble into a homogeneous population of nanodiscs, with the membrane protein embedded in the phospholipid bilayer.
- Purification: The assembled nanodiscs are typically purified using Size Exclusion Chromatography (SEC) to isolate monodisperse complexes suitable for downstream analysis [81].
An alternative and increasingly popular approach uses membrane-active polymers (MAPs) like SMA copolymers. These polymers can directly extract membrane proteins along with their surrounding native lipids from cellular membranes, forming so-called "native nanodiscs" or "SMA lipid particles (SMALPs)" in a single step, without prior detergent solubilization [79]. This method is particularly powerful for preserving the most native local membrane environment.
Native PAGE with Nanodiscs: Modified Protocols
Once reconstituted, nanodisc-containing samples can be analyzed using Native PAGE. A notable advancement is the Native SDS-PAGE (NSDS-PAGE) protocol, which demonstrates how subtle modifications can significantly enhance the retention of native properties. As detailed in [8], this method involves:
- Sample Buffer: Omitting SDS and EDTA from the standard sample buffer and forgoing the heating step.
- Running Buffer: Reducing the SDS concentration to 0.0375% (from the standard 0.1%) and removing EDTA [8].
This modified approach was shown to dramatically increase the retention of bound metal ions in Zn²⁺-proteomes from 26% (standard SDS-PAGE) to 98%, with most model enzymes retaining their activity post-electrophoresis [8]. For standard BN-PAGE or Native PAGE, the sample is mixed with a mild, non-denaturing sample buffer containing Coomassie G-250 and loaded onto the gel. Electrophoresis is then performed using specialized anode and cathode buffers to maintain native conditions [8].
Diagram 1: This workflow illustrates the two primary pathways for incorporating membrane proteins into nanodiscs (polymer-based or MSP-based) prior to separation and analysis via Native PAGE.
Research Reagent Solutions: A Toolkit for Nanodisc Native PAGE
Successful implementation of these advanced techniques relies on a specific set of reagents and materials. The following table details the key components of the "Researcher's Toolkit" for nanodisc-assisted Native PAGE.
Table 3: Essential Reagents and Materials for Nanodisc-Assisted Native PAGE
| Category / Item | Specific Examples | Function & Importance |
|---|---|---|
| Nanodisc Scaffolds | MSP1E3D1 (13 nm), MSP2N2 (17 nm) [81] | Membrane Scaffold Proteins that define nanodisc diameter; larger discs accommodate bigger complexes [81]. |
| Styrene Maleic Acid (SMA) copolymers [79] | Membrane-Active Polymers that directly extract proteins and native lipids into native nanodiscs [79]. | |
| Lipids | DOPC, POPC, PIP2 [81] | Phospholipids used to form the nanodisc bilayer; specific lipids (e.g., PIP2) can be included for functional studies [81]. |
| Electrophoresis Buffers | NSDS-PAGE Running Buffer (50 mM MOPS, 50 mM Tris Base, 0.0375% SDS, pH 7.7) [8] | Modified running buffer for native-like separation with minimal denaturation, crucial for metal retention and activity [8]. |
| BN-PAGE Cathode Buffer (50 mM BisTris, 50 mM Tricine, 0.02% Coomassie G-250, pH 6.8) [8] | Imparts charge to native proteins for electrophoresis without SDS [8]. | |
| Assessment Tools | Laser Ablation-ICP-MS, TSQ Staining [8] | Techniques to confirm retention of metal cofactors (e.g., Zn²⁺) in proteins after separation [8]. |
| In-Gel Activity Assays | Used to verify the retention of enzymatic function post-electrophoresis [8]. |
Advanced Applications and Quantitative Platform
The combination of nanodiscs and Native PAGE extends beyond basic separation, enabling high-resolution structural and functional studies. A prominent application is in single-particle cryo-Electron Microscopy (cryo-EM), where nanodiscs provide a ideal platform for structural determination. As demonstrated in a study of the AP2 clathrin adaptor complex, using a 17-nm nanodisc (MSP2N2) enabled the determination of a 3.3 Å resolution structure of the peripheral membrane protein bound to the lipid bilayer, allowing researchers to visualize a bound lipid headgroup [81]. The study further emphasized that the size of the nanodisc is critical, as smaller discs (9-13 nm) led to non-native conformations or lower resolution [81].
To address the challenge of variable extraction efficiency across different polymers and target proteins, a recent breakthrough came with the development of a proteome-wide quantitative platform [79]. This high-throughput approach quantitatively evaluated the extraction efficiency of 2,065 unique mammalian membrane proteins across 11 different polymer conditions. The resulting open-access database provides researchers with the most optimized extraction condition for any target MP or multi-MP complex, moving the field away from low-throughput trial-and-error and enabling efficient capture of low-abundance MPs directly from their native organellar membranes [79]. This resource is invaluable for planning Native PAGE experiments on challenging targets.
Diagram 2: This workflow outlines the high-throughput platform used to create a public database that guides researchers to the optimal polymer for extracting their specific membrane protein into native nanodiscs [79].
The integration of nanodisc technology with refined Native PAGE protocols represents a significant leap forward in the separation and analysis of membrane proteins and native complexes. By directly addressing the core issues of aggregation and poor resolution, these methods provide a path to study these proteins in a more physiologically relevant context. The development of modified electrophoretic techniques like NSDS-PAGE and the creation of proteome-wide databases for polymer screening empower researchers to approach membrane protein biochemistry with greater precision and confidence. As these tools continue to evolve and become more accessible, they will undoubtedly accelerate drug discovery and deepen our fundamental understanding of cellular machinery, firmly establishing nanodisc-assisted Native PAGE as an indispensable technique in the modern molecular biology toolkit.
Data Interpretation and Technique Selection: Ensuring Accurate Experimental Outcomes
Polyacrylamide Gel Electrophoresis (PAGE) is a foundational technique in biochemistry for separating protein mixtures. The separation mechanism differs fundamentally between its two primary forms: SDS-PAGE (Sodium Dodecyl Sulfate-Polyacrylamide Gel Electrophoresis) and Native PAGE. The core distinction lies in whether proteins are denatured into linear polypeptides or remain in their native, folded state during separation [1] [7]. In SDS-PAGE, the anionic detergent SDS denatures proteins and imparts a uniform negative charge, meaning separation occurs almost exclusively by molecular weight [2]. In contrast, Native PAGE separates proteins based on a combination of their intrinsic charge, size, and three-dimensional shape, preserving their native conformation and, crucially, their biological function [1] [2]. This fundamental difference dictates the choice of technique, from determining protein subunit weight to analyzing functional protein complexes and enzymatic activity.
Core Separation Mechanisms & Data Tables
Comparative Analysis of Separation Principles
The following diagram illustrates the fundamental procedural and mechanistic differences between SDS-PAGE and Native PAGE.
Direct Technique Comparison Table
The table below provides a comprehensive, side-by-side comparison of the critical parameters for SDS-PAGE and Native PAGE.
Table 1: Direct Side-by-Side Comparison of SDS-PAGE and Native PAGE Techniques
| Parameter | SDS-PAGE | Native PAGE |
|---|---|---|
| Separation Principle | Molecular weight [1] [2] | Size, intrinsic charge, and 3D shape [1] [2] |
| Protein State | Denatured and linearized [1] [2] | Native, folded conformation [1] [2] |
| Functional Activity | Lost [7] | Retained [7] |
| Key Reagents | SDS (denaturant), reducing agents (DTT/β-mercaptoethanol) [1] [30] | Coomassie dye (BN-PAGE) or mixed detergents (CN-PAGE) [53] [1] |
| Sample Preparation | Heated (70-100°C) in SDS/DTT buffer [1] [2] | Not heated; mixed with non-denaturing buffer [1] |
| Net Protein Charge | Uniformly negative (from SDS) [2] | Intrinsic charge (positive, negative, or neutral) [1] |
| Typical Applications | Molecular weight determination, purity analysis, western blotting [1] [30] | Analysis of oligomeric state, protein-protein interactions, in-gel enzyme activity assays [53] [7] |
| Post-Separation Recovery | Proteins cannot be recovered in a functional form [1] | Functional proteins can often be recovered [1] [7] |
| Typical Run Temperature | Room Temperature [1] | 4°C (to maintain protein stability) [1] |
Advanced Buffer Composition Table
The specific composition of electrophoresis buffers is a critical experimental variable. The table below quantifies the key differences based on established methodologies.
Table 2: Comparative Buffer Compositions for PAGE Techniques
| Component | SDS-PAGE (Standard) | Native SDS-PAGE (NSDS-PAGE) | Blue Native (BN)-PAGE |
|---|---|---|---|
| Sample Buffer Additives | 2% LDS, 0.51 mM EDTA, reducing agent [8] | No SDS/EDTA, 0.01875% Coomassie G-250 [8] | 50 mM NaCl, 0.001% Ponceau S [8] |
| Running Buffer Additives | 0.1% SDS, 1 mM EDTA [8] | 0.0375% SDS [8] | Cathode: 0.02% Coomassie G-250 [8] |
| Key Function | Denaturation, uniform charge, and reduction of disulfide bonds [30] [2] | Partial denaturation, improved metal retention (e.g., 98% Zn²⁺ retained) [8] | Induces charge shift on native proteins, maintains protein complexes [53] |
| Sample Heated? | Yes [1] | No [8] | No [8] |
Experimental Protocols & Methodologies
Detailed Protocol: Standard SDS-PAGE
The following is a standard protocol for denaturing SDS-PAGE, widely used for determining protein molecular weight [30] [2].
- Sample Preparation:
- Mix protein sample with 4X SDS-PAGE sample loading buffer (e.g., containing Tris-HCl, SDS, glycerol, and a tracking dye like bromophenol blue) [24].
- Add a reducing agent, typically 50 mM Dithiothreitol (DTT) or 2-Mercaptoethanol (2-ME), to break disulfide bonds [24] [30].
- Heat the mixture at 70-100°C for 5-10 minutes to ensure complete denaturation [6] [2].
- Gel Preparation:
- Electrophoresis:
Detailed Protocol: Blue Native (BN)-PAGE
BN-PAGE is a prevalent Native PAGE technique for analyzing membrane protein complexes and supercomplexes, such as those in the oxidative phosphorylation system [53].
- Sample Preparation (Protein Extraction):
- Solubilize membrane proteins using a mild, non-ionic detergent like n-Dodecyl-β-D-maltoside to preserve protein-protein interactions [53].
- Supplement the extraction buffer with 6-aminocaproic acid to enhance protein solubility and complex stability.
- Do not boil or use denaturing agents. The sample is typically kept at 0-4°C.
- Gel Preparation & Loading:
- Electrophoresis:
Advanced Methodology: Native SDS-PAGE (NSDS-PAGE)
NSDS-PAGE is a modified technique designed to bridge the gap between standard SDS-PAGE and BN-PAGE, offering high resolution with partial function retention [8].
- Principle: This method uses drastically reduced SDS concentrations and omits heating and chelating agents like EDTA [8].
- Key Modifications:
- Outcome: This protocol results in high-resolution separation while retaining a high percentage of non-covalently bound metal ions (e.g., 98% Zn²⁺ retention) and enzymatic activity in many model proteins [8].
The Scientist's Toolkit: Essential Research Reagents
Table 3: Key Reagent Solutions for PAGE Experiments
| Reagent / Material | Function / Purpose |
|---|---|
| SDS (Sodium Dodecyl Sulfate) | Anionic detergent that denatures proteins and confers a uniform negative charge, enabling separation by mass in SDS-PAGE [1] [2]. |
| DTT or β-Mercaptoethanol | Reducing agents that break disulfide bonds between cysteine residues, ensuring complete protein unfolding in reducing SDS-PAGE [30]. |
| Coomassie Blue G-250 | A key component in BN-PAGE; binds to hydrophobic protein patches, inducing a negative charge shift and improving solubility of native complexes [53]. |
| n-Dodecyl-β-D-maltoside | Mild, non-ionic detergent used to solubilize membrane proteins for BN-PAGE without disrupting protein-protein interactions [53]. |
| Molecular Weight Markers | A mixture of proteins of known sizes run alongside samples to calibrate the gel and estimate the molecular weight of unknown proteins [2]. |
| Acrylamide/Bis-acrylamide | Monomer and cross-linker that polymerize to form the porous gel matrix, which acts as a molecular sieve [2]. |
| APS and TEMED | Ammonium persulfate (APS) and Tetramethylethylenediamine (TEMED) are catalysts used to initiate and accelerate the polymerization of acrylamide gels [2]. |
In biomedical research and drug development, the reliability of protein analysis hinges on the initial separation technique employed. Polyacrylamide Gel Electrophoresis (PAGE) serves as a foundational step, with the choice between SDS-PAGE and Native PAGE dictating the type and scope of subsequent validation methods [7] [2]. This technical guide details how Western blotting, mass spectrometry, and activity assays are applied after these separation methods, framing their utility within the context of a protein's structural state. SDS-PAGE, a denaturing technique, unravels proteins into their primary polypeptide subunits, enabling separation strictly by molecular mass [82] [17]. In contrast, Native PAGE preserves the protein's intricate three-dimensional structure, allowing separation based on a combination of intrinsic charge, size, and shape [1] [82]. This fundamental distinction directly determines which validation methods are applicable and what biological information can be gleaned, guiding researchers in selecting the optimal workflow for characterizing protein identity, quantity, structure, and function.
Foundational Principles of PAGE Separation
The choice of electrophoresis method sets the stage for all downstream analysis by determining the level of structural information preserved.
SDS-PAGE: Denaturing Separation by Mass
Sodium Dodecyl Sulfate-Polyacrylamide Gel Electrophoresis (SDS-PAGE) is a discontinuous electrophoretic system that separates proteins based primarily on their molecular mass [17]. The anionic detergent SDS denatures proteins by binding to hydrophobic regions, unfolding them into linear chains and masking their intrinsic charge [7] [2]. This results in SDS-polypeptide complexes that carry a uniform negative charge, ensuring migration through the polyacrylamide gel matrix is inversely proportional to the logarithm of their molecular mass [2] [17]. Samples are typically heated at 95°C for 5 minutes in the presence of SDS and a reducing agent like Dithiothreitol (DTT) or β-mercaptoethanol to break disulfide bonds [83] [17]. This technique is ideal for determining molecular weight, assessing purity, and analyzing subunit composition [7] [1].
Native PAGE: Non-Denaturing Separation by Charge and Size
Native PAGE separates proteins in their folded, functional state without denaturing agents [1] [2]. Separation depends on the protein's intrinsic net charge, size, and three-dimensional shape [82] [2]. Because the native charge is retained, proteins migrate towards the anode at alkaline pH only if they carry a net negative charge; those with a net positive charge will migrate in the opposite direction [2]. This method preserves protein-protein interactions, enzymatic activity, and quaternary structure, making it suitable for studying functional complexes, oligomerization, and conformational changes [7] [82]. The technique is typically performed at 4°C to maintain protein stability [1].
Table 1: Core Characteristics of SDS-PAGE versus Native PAGE
| Characteristic | SDS-PAGE | Native PAGE |
|---|---|---|
| Separation Basis | Molecular mass [1] [2] | Native charge, size, and shape [1] [82] |
| Protein State | Denatured and linearized [7] | Native, folded conformation [7] |
| Detergent | SDS present [1] | SDS absent [1] |
| Sample Preparation | Heating with SDS and reducing agents [1] [17] | No heating; no denaturing agents [1] |
| Protein Function | Lost post-separation [7] [1] | Retained post-separation [7] [1] |
| Primary Applications | Molecular weight determination, purity check, subunit analysis [1] [30] | Study of protein complexes, enzymatic activity, oligomerization [7] [1] |
Validation Method 1: Western Blotting
Western blotting (immunoblotting) is a highly specific technique for detecting a target protein within a complex mixture using antibody-mediated detection.
Principle and Workflow
Following SDS-PAGE separation, proteins are transferred from the gel onto a stable membrane, typically polyvinylidene fluoride (PVDF) or nitrocellulose, creating a replica of the separation pattern [6]. The membrane is then probed with a primary antibody specific to the protein of interest, followed by a labeled secondary antibody that enables detection [6]. This method provides information about the presence, relative abundance, and molecular weight of the target protein.
Protocol for Western Blotting After SDS-PAGE
The following workflow is adapted from automated Western blotting systems but reflects general principles [83]:
- Sample Preparation and Separation: Protein extracts are mixed with a sample buffer containing SDS and a reducing agent (e.g., DTT) and heated at 95°C for 5 minutes [83]. Samples are then separated by SDS-PAGE. For a standard mini-gel, electrophoresis is run at 100-150 V for approximately 1-1.5 hours, or until the dye front reaches the bottom of the gel [2] [17].
- Protein Transfer: The resolved proteins are electrophoretically transferred from the gel to a membrane. This is typically done using a tank or semi-dry transfer system.
- Immunodetection: The membrane is blocked with a blocking solution (e.g., 5% non-fat milk or BSA in TBST) to prevent non-specific antibody binding. It is then incubated with a primary antibody diluted in antibody diluent, followed by multiple washes. Next, it is incubated with an HRP-conjugated secondary antibody specific to the host species of the primary antibody [6].
- Visualization and Analysis: A chemiluminescent substrate is added, and the signal is captured using a CCD camera. The relative amount of protein can be calculated based on the peak area of the signal, often normalized to a housekeeping protein or a spiked control [83].
Compatibility with PAGE Methods
- SDS-PAGE is the standard precursor to Western blotting [7] [6]. The denaturation and linearization of proteins expose epitopes for antibody binding, leading to consistent and reliable detection. The ability to estimate molecular weight provides an additional layer of validation for protein identity.
- Native PAGE is rarely used with Western blotting [6]. Preserving the native conformation can mask antibody epitopes, leading to weak or false-negative results. Furthermore, the migration of proteins based on charge and size complicates molecular weight estimation and can make interpretation difficult.
Validation Method 2: Mass Spectrometry
Mass spectrometry (MS) has become a cornerstone for protein identification and characterization, offering unparalleled specificity by providing amino acid sequence information.
Principle and Workflow
MS identifies proteins by measuring the mass-to-charge ratio of ionized peptides derived from enzymatic digestion (e.g., with trypsin) of protein samples [84]. The resulting mass spectra are matched against in-silico digested protein sequence databases for identification. Modern MS platforms can reliably detect and quantify low-abundance proteins, making them particularly valuable for applications like monitoring host cell protein (HCP) impurities in biopharmaceuticals [84]. Quantification strategies include label-free methods, chemical labeling (e.g., TMT, iTRAQ), and targeted detection [84].
Protocol for Mass Spectrometry Analysis
A generalized bottom-up proteomics workflow is as follows:
- In-Gel Digestion: A protein band of interest is excised from the polyacrylamide gel. The gel piece is destained, reduced with DTT, alkylated with iodoacetamide, and digested overnight with a sequence-grade protease like trypsin [2].
- Peptide Extraction: The resulting peptides are extracted from the gel matrix using an organic solvent like acetonitrile, concentrated, and desalted.
- LC-MS/MS Analysis: The peptide mixture is separated by nano-flow liquid chromatography (LC) and directly introduced into a high-resolution mass spectrometer. The instrument operates in a data-dependent acquisition mode, cycling between full-scan MS spectra and subsequent fragmentation (MS/MS) of the most intense ions.
- Data Processing: The fragmentation spectra are searched against a protein database using bioinformatics software (e.g., MaxQuant, Proteome Discoverer). Artificial intelligence is increasingly used to improve spectral interpretation and reduce false results [84].
Compatibility with PAGE Methods
- SDS-PAGE is highly compatible with MS. It is a standard sample preparation step for bottom-up proteomics [7] [2]. The separation reduces sample complexity, and proteins can be excised from the gel for individual analysis, which is crucial for identifying components of a complex mixture. However, the denaturing conditions destroy non-covalent interactions and functional information.
- Native PAGE can be coupled with MS (Native MS) to study intact protein complexes. This advanced application allows for the determination of stoichiometry, subunit arrangement, and non-covalent interactions. After separation, complexes must be gently transferred to the mass spectrometer under conditions that maintain the native state, often requiring specialized buffer exchange and soft ionization techniques.
Validation Method 3: Activity Assays
Activity assays measure the biological function of a protein, such as enzymatic kinetics, ligand binding, or other functional interactions.
Principle and Workflow
These assays are tailored to the specific protein's function. For an enzyme, this typically involves incubating the protein with its substrate under optimal conditions (pH, temperature, cofactors) and measuring the formation of a product or the disappearance of the substrate over time using spectroscopic or chromatographic methods.
Protocol for Post-Electrophoresis Activity Assay
A standard protocol for detecting activity after Native PAGE is the in-gel zymography assay for hydrolytic enzymes like proteases:
- Copolymerization of Substrate: The protein substrate (e.g., gelatin for metalloproteases) is copolymerized within the polyacrylamide gel matrix.
- Electrophoresis: Protein samples are run under non-denaturing, non-reducing conditions (Native PAGE) to preserve enzymatic activity.
- Renaturation and Development: After electrophoresis, the gel is incubated in a renaturing buffer to allow proteins to refold into their active conformation. It is then transferred to a developing buffer at the optimal pH and temperature for the enzyme to act, for several hours.
- Staining and Visualization: The gel is stained with Coomassie Brilliant Blue. Where the enzyme has digested its substrate, a clear band will appear against a dark blue background, indicating the location and relative level of active enzyme.
Compatibility with PAGE Methods
- Native PAGE is the definitive method for coupling separation with activity assays. Because proteins remain folded and functional, they can be recovered from the gel for downstream functional studies [7] [2]. This allows researchers to directly link a separated band to a specific biological activity, confirming the protein is not only present but also functional.
- SDS-PAGE is incompatible with most activity assays. The denaturing action of SDS and heat irreversibly destroys the protein's three-dimensional structure, rendering it non-functional [7] [82]. While specialized renaturation techniques exist, they are often unreliable and not commonly used for functional validation.
Table 2: Suitability of Validation Methods for SDS-PAGE and Native PAGE
| Validation Method | SDS-PAGE | Native PAGE |
|---|---|---|
| Western Blotting | Ideal. Standard method; enables identification and molecular weight estimation [7] [6]. | Limited. Native structure can block epitopes; interpretation is complex [6]. |
| Mass Spectrometry | Excellent. Standard workflow for protein identification; reduces sample complexity [7] [2]. | Specialized. Possible for intact complexes (Native MS), but technically challenging. |
| Activity Assays | Incompatible. Denaturation destroys biological function [7] [82]. | Ideal. Preserves native structure and function; functional protein can be recovered [7] [2]. |
The Scientist's Toolkit: Essential Research Reagents
Successful protein separation and validation rely on a core set of reagents and materials.
Table 3: Essential Reagents for PAGE and Downstream Validation
| Reagent/Material | Function | Key Considerations |
|---|---|---|
| Acrylamide/Bis-acrylamide | Forms the cross-linked polymer gel matrix for separation [2] [17]. | Concentration determines pore size; higher % for smaller proteins. |
| SDS (Sodium Dodecyl Sulfate) | Denatures proteins and confers uniform negative charge (for SDS-PAGE) [17]. | Must be in excess (e.g., 1-2% in buffer) for complete denaturation and charge masking. |
| DTT or β-Mercaptoethanol | Reducing agents that break disulfide bonds (for reducing SDS-PAGE) [17]. | Essential for analyzing subunit structure; must be fresh. |
| TEMED & Ammonium Persulfate (APS) | Catalyzer and initiator for acrylamide polymerization [2] [17]. | TEMED is toxic; APS solution should be prepared fresh weekly. |
| Molecular Weight Markers | Proteins of known size for calibrating gels and estimating target protein mass [2] [6]. | Pre-stained markers allow tracking of electrophoresis progress. |
| Primary Antibody | Binds specifically to the target protein (for Western blotting) [6]. | Specificity and titer must be optimized for each application. |
| HRP-Conjugated Secondary Antibody | Binds to the primary antibody and enables chemiluminescent detection [83] [6]. | Must be raised against the host species of the primary antibody. |
| PVDF/Nitrocellulose Membrane | Binds proteins after transfer for Western blotting [6]. | PVDF is more durable and has higher protein binding capacity. |
| Trypsin | Protease for digesting proteins into peptides for mass spectrometry [84]. | Sequencing-grade purity ensures specific and efficient cleavage. |
The strategic selection of a protein separation method is the first critical decision in a validation pipeline, dictating the analytical tools that can be effectively deployed. SDS-PAGE, which provides denatured proteins separated by mass, is the established and optimal partner for Western blotting and standard mass spectrometry-based identification. Conversely, Native PAGE, which preserves the native conformation, is the exclusive route to in-gel activity assays and the study of functional protein complexes. By understanding the distinct advantages and limitations of each PAGE method, researchers can design robust experimental workflows. For comprehensive protein characterization, SDS-PAGE and Native PAGE are not competing techniques but rather complementary ones that, when applied judiciously, provide a complete picture of a protein's identity, structure, and function, thereby de-risking experiments and strengthening conclusions in research and drug development.
Protein electrophoresis is a standard laboratory technique by which charged protein molecules are transported through a solvent by an electrical field, serving as a simple, rapid, and sensitive analytical tool for separating proteins and nucleic acids [2]. The mobility of a molecule through an electric field depends on several factors: field strength, net charge, size and shape, ionic strength, and the properties of the matrix through which the molecule migrates [2]. Polyacrylamide gel electrophoresis (PAGE) represents the most common matrix for protein separation, with SDS-PAGE and native PAGE constituting the two primary techniques that differ fundamentally in their mechanism of separation and the type of information they provide about the protein sample.
This technical guide provides a decision framework for researchers selecting between SDS-PAGE and native PAGE methodologies based on specific research objectives in drug development and basic research. The selection between these techniques fundamentally hinges on whether the research question requires analysis of denatured polypeptide chains (SDS-PAGE) or native protein structures with preserved biological activity (native PAGE). Understanding these core differences enables researchers to align methodological choices with experimental goals, thereby optimizing resource allocation and data quality in protein characterization workflows.
Fundamental Separation Mechanisms: A Comparative Analysis
SDS-PAGE: Separation by Molecular Weight
Sodium dodecyl sulfate-polyacrylamide gel electrophoresis (SDS-PAGE) operates on the principle of complete protein denaturation to achieve separation strictly by molecular weight. The ionic detergent SDS denatures proteins by wrapping around the polypeptide backbone and conferring a uniform negative charge [2]. When protein samples are heated between 70-100°C in buffer containing excess SDS and a reducing agent such as β-mercaptoethanol or dithiothreitol (DTT), disulfide bonds are cleaved and the protein is fully dissociated into its subunits [2] [22]. Under these conditions, most polypeptides bind SDS in a constant weight ratio of approximately 1.4 grams of SDS per 1 gram of polypeptide [2]. This SDS-binding masks the intrinsic charges of the polypeptide, creating SDS-polypeptide complexes that have essentially identical negative charge densities and similar shapes [2]. Consequently, proteins migrate through the gel matrix strictly according to polypeptide size, with smaller proteins migrating faster through the porous gel matrix than larger molecules [22].
The SDS-PAGE process employs a discontinuous gel system with two distinct regions: a stacking gel and a resolving gel. The stacking gel has a lower concentration of acrylamide (typically 4-5%), lower pH (approximately 6.8), and different ionic content that allows proteins in a loaded sample to be concentrated into one tight band during the initial minutes of electrophoresis before entering the resolving portion of the gel [2]. The resolving gel contains a higher acrylamide concentration (typically 8-16%) with a basic pH (approximately 8.8) where the actual size-based separation occurs [85]. This discontinuous system, first described by Laemmli, significantly improves the resolution of protein bands compared to continuous systems [22].
Native PAGE: Separation by Charge, Size, and Conformation
Native PAGE (non-denaturing PAGE) separates proteins according to the net charge, size, and shape of their native structure without denaturation [2]. In this technique, electrophoretic migration occurs because most proteins carry a net negative charge in alkaline running buffers, causing them to migrate toward the positive anode [2] [6]. The separation mechanism depends on both charge density and the sieving effect of the gel matrix. Proteins with higher negative charge density migrate faster, while simultaneously experiencing frictional forces that regulate movement according to their size and three-dimensional shape [2]. Small, compact proteins face minimal frictional resistance and migrate rapidly, while larger proteins or those with extended conformations face greater frictional forces and migrate more slowly [86].
Because no denaturants are used in native PAGE, subunit interactions within multimeric proteins are generally retained, providing information about quaternary structure [2]. This preservation of native structure enables some proteins to retain enzymatic activity following separation, making this technique valuable for preparatory purification of active proteins and functional studies [2]. The migration pattern in native PAGE reflects a combination of the protein's intrinsic charge at the running buffer pH and its hydrodynamic size, which is influenced by both molecular mass and three-dimensional conformation [6]. A small protein with an extended conformation might migrate more slowly than a larger, more compact protein due to differences in hydrodynamic size, creating a separation profile that differs significantly from SDS-PAGE.
Table 1: Fundamental Separation Mechanisms of SDS-PAGE vs. Native PAGE
| Parameter | SDS-PAGE | Native PAGE |
|---|---|---|
| Separation Basis | Molecular weight primarily | Net charge, size, and shape |
| Protein State | Denatured and linearized | Native conformation preserved |
| Detergent Treatment | SDS present (denaturing) | No SDS (non-denaturing) |
| Disulfide Bonds | Reduced with DTT/β-mercaptoethanol | Maintained intact |
| Quaternary Structure | Disrupted into subunits | Preserved multimeric complexes |
| Electrical Charge | Uniform negative charge from SDS | Intrinsic charge based on pH |
| Typical Applications | Molecular weight determination, purity assessment | Activity assays, complex analysis, functional studies |
| Compatibility with Downstream Analysis | Western blotting, mass spectrometry | Enzymatic assays, protein activity studies |
Technical Implementation: Methodologies and Protocols
SDS-PAGE Experimental Protocol
The SDS-PAGE method consists of gel preparation, sample preparation, electrophoresis, and protein detection stages. For gel production, polyacrylamide gels are formed through free radical polymerization of acrylamide and cross-linker N,N'-methylenebisacrylamide in a mold consisting of two sealed glass plates with spacers [17]. The polymerization is catalyzed by ammonium persulfate (APS) as the radical initiator and N,N,N',N'-tetramethylethylenediamine (TEMED) as the catalyst [2] [85]. The separating gel (typically 8-16% acrylamide) is poured first and covered with a water-soluble alcohol to exclude oxygen and create a flat meniscus, followed after polymerization by the stacking gel (typically 4-5% acrylamide) into which a sample comb is inserted to create wells [17] [85].
Sample preparation represents a critical step for successful SDS-PAGE analysis. Proteins are mixed with SDS-containing sample buffer (typically Laemmli buffer) and reducing agents such as β-mercaptoethanol or dithiothreitol (DTT) to break disulfide bonds [17]. The sample is then heated to 95°C for 5 minutes (or 70°C for 10 minutes) to ensure complete denaturation and linearization of proteins [17]. The heating step disrupts secondary and tertiary structures by breaking hydrogen bonds, allowing SDS to bind uniformly along the polypeptide backbone [22]. For electrophoresis, the denatured samples are loaded into wells alongside molecular weight markers and subjected to a constant voltage (typically 100-150V) for 30-90 minutes depending on gel size and desired separation [22] [85]. The process uses a Tris-glycine-SDS running buffer (pH 8.3) to facilitate migration toward the anode [85].
Table 2: SDS-PAGE Gel Formulations for Different Protein Size Ranges
| Acrylamide Percentage | Optimal Protein Separation Range | Gel Characteristics |
|---|---|---|
| 8% | 25-200 kDa | Large pore size for high molecular weight proteins |
| 10% | 15-100 kDa | Standard all-purpose separation range |
| 12% | 10-60 kDa | Medium pore size for intermediate proteins |
| 15% | 5-45 kDa | Small pore size for low molecular weight proteins |
| 4-20% Gradient | 10-300 kDa | Broad range separation in a single gel |
Native PAGE Experimental Protocol
Native PAGE follows a similar overall workflow to SDS-PAGE but with critical differences in sample and buffer composition. The gel casting process is essentially identical, utilizing the same acrylamide polymerization chemistry, though typically with a single homogeneous gel concentration rather than a stacking/resolving gel system [2] [6]. The most significant difference lies in the complete absence of SDS or other denaturing agents from both the gel matrix and running buffers [6]. Sample preparation for native PAGE is considerably gentler, with no heating or reducing agents applied to maintain native protein structure [2]. Proteins are typically suspended in a non-denaturing buffer that preserves their biological activity and quaternary structure.
The electrophoresis buffer for native PAGE lacks SDS and often employs Tris-glycine at alkaline pH (typically 8.8) to ensure most proteins carry a net negative charge and migrate toward the anode [6]. Some protocols may utilize specialized zwitterionic buffers such as tricine with a buffering range of pH 7.4 to 8.8 when charge preservation at specific pH values is required [6]. To maintain protein integrity during native PAGE, it is crucial to keep the apparatus cool and minimize denaturation and proteolysis throughout the process [2]. pH extremes should generally be avoided as they may lead to irreversible protein damage, such as denaturation or aggregation [2].
Following electrophoresis, proteins separated by native PAGE can be detected using standard staining methods, but additionally offer the possibility of functional detection through activity staining or electroelution for recovery of active proteins [2]. The preservation of native structure enables applications such as in-gel enzymatic activity assays, where the gel is incubated with appropriate substrates to detect specific enzymes based on their function rather than mere presence [2].
Protein Visualization and Detection Methods
Following electrophoresis, separated proteins must be visualized for analysis. Multiple staining techniques are available with varying sensitivity levels and compatibility with downstream applications. Coomassie Brilliant Blue staining represents the most widely used method for in-gel protein detection due to its simplicity, affordability, and effectiveness [87]. Coomassie staining can detect protein quantities as low as 8-10 ng per band for some proteins, with a typical detection limit around 25 ng per band [87]. The protocol involves fixing proteins in an acidic methanol solution, staining with Coomassie dye, and destaining to remove background dye [87]. A significant advantage of Coomassie staining is its reversibility, as the non-covalent dye binding allows for complete destaining of excised protein bands, making them recoverable for downstream applications such as mass spectrometry or sequencing [87].
Silver staining provides substantially higher sensitivity, capable of detecting proteins in the nanogram range (0.25-0.5 ng per band) [87]. This method relies on the deposition of metallic silver onto the gel surface at protein locations, creating brown-black bands [87]. The silver staining process involves multiple steps: sensitization with agents like thiourea or formaldehyde to enhance silver ion binding, staining with silver nitrate, development to reduce silver ions to metallic silver, and stopping the reaction to stabilize the stained image [87]. While highly sensitive, silver staining has limitations including potential interference with mass spectrometry due to protein cross-linking by reagents such as glutaraldehyde or formaldehyde [87].
Fluorescent dye staining has emerged as a prominent technique offering high sensitivity and broad dynamic range for protein quantification [87]. Fluorescent dyes such as SYPRO Ruby bind to proteins through non-covalent interactions and emit light upon excitation at specific wavelengths, enabling detection of proteins at very low concentrations (0.25-0.5 ng per band) [87]. The staining process is typically quick (often completed within 60 minutes) and involves incubation with dye solution followed by washing to reduce background fluorescence [87]. The key advantage of fluorescent staining is its broad linear dynamic range, allowing for accurate quantification of proteins over wide concentration ranges while maintaining compatibility with downstream mass spectrometry analysis [87].
Research Applications and Decision Framework
Application-Specific Method Selection
The choice between SDS-PAGE and native PAGE should be driven by specific research questions and analytical requirements. SDS-PAGE is particularly well-suited for applications requiring molecular weight determination, assessment of protein purity, analysis of subunit composition, and sample preparation for western blotting [22]. The denaturing conditions provide consistent, predictable migration based primarily on polypeptide chain length, enabling accurate molecular weight estimation when compared with appropriate standards [2] [22]. The ability to assess sample purity by visualizing contaminating proteins makes SDS-PAGE invaluable for quality control in protein purification workflows [22]. Additionally, the comprehensive denaturation of proteins creates ideal conditions for subsequent immunoblotting, as epitopes are uniformly exposed in their linearized form [6].
Native PAGE finds its strongest applications when protein function, activity, or native structure must be preserved. This includes studies of multimeric protein complexes, enzymatic activity assays, and preparation of proteins for functional studies [2] [6]. By maintaining quaternary structure, native PAGE enables analysis of protein-protein interactions and stoichiometry within complexes [2]. The preservation of enzymatic activity allows for direct functional assessment after separation, either through in-gel activity assays or after electroelution [2]. For proteins where biological activity is the primary interest, native PAGE provides distinct advantages over denaturing methods.
Table 3: Method Selection Guide Based on Research Objectives
| Research Goal | Recommended Method | Rationale | Key Technical Considerations |
|---|---|---|---|
| Molecular Weight Determination | SDS-PAGE | Provides reliable size estimation under denaturing conditions | Include appropriate molecular weight markers; optimize gel percentage for target size range |
| Sample Purity Assessment | SDS-PAGE | Reveals contaminating proteins through distinct banding pattern | Use high-percentage gels for better resolution; consider silver staining for high sensitivity |
| Western Blotting Preparation | SDS-PAGE | Denatured proteins transfer efficiently and provide uniform epitope exposure | Ensure complete reduction; verify transfer efficiency with prestained markers |
| Enzymatic Activity Studies | Native PAGE | Preserves protein function and catalytic capability | Maintain cool temperatures; avoid denaturing conditions throughout process |
| Protein Complex Analysis | Native PAGE | Maintains quaternary structure and subunit interactions | Optimize pH to preserve complex stability; use gentle staining methods |
| Post-Translational Modification Analysis | Either (with modifications) | SDS-PAGE shows size shifts; Native PAGE may preserve modification-dependent interactions | 2D-PAGE may be preferable for complex PTM analysis |
| Antibody Production | SDS-PAGE (preparative) | Effective for antigen purification from contaminating proteins | Excise bands of interest after mild staining; electroelute for antigen recovery |
Advanced Techniques and Integrated Approaches
Two-dimensional polyacrylamide gel electrophoresis (2D-PAGE) combines the separation principles of both isoelectric focusing and SDS-PAGE to provide exceptionally high resolution for complex protein mixtures [2]. In this technique, proteins are first separated according to their native isoelectric point (pI) using isoelectric focusing (IEF) in the first dimension, followed by separation by mass using standard SDS-PAGE in the second dimension [2]. This orthogonal separation approach can resolve thousands of proteins on a single gel, making it particularly valuable for proteomic research where comprehensive protein profiling is necessary [2]. The development of immobilized pH gradient strips (IPG strips) has significantly improved the reproducibility and ease of 2D-PAGE, establishing it as a powerful tool for analyzing post-translational modifications and protein isoforms [2] [22].
For specialized applications, modified electrophoretic approaches may provide superior results. For example, the separation of very low molecular weight proteins and peptides may benefit from Tris-tricine buffer systems instead of the standard Tris-glycine system, as they offer better resolution in the 1-30 kDa range [17]. Similarly, the analysis of disulfide-linked complexes requires non-reducing SDS-PAGE conditions, where SDS is present but reducing agents are omitted, allowing visualization of covalent protein complexes [67]. As demonstrated in proinsulin misfolding studies, modifications to standard SDS-PAGE and electrotransfer protocols can enable more accurate quantification of different folded forms, including native monomers, misfolded monomers, and disulfide-linked oligomers [67].
Research Reagent Solutions
Table 4: Essential Reagents for Protein Electrophoresis Workflows
| Reagent Category | Specific Examples | Function | Application Notes |
|---|---|---|---|
| Gel Matrix Components | Acrylamide, Bis-acrylamide | Forms porous polyacrylamide gel matrix | Neurotoxic; handle with gloves; concentration determines pore size |
| Polymerization Agents | Ammonium persulfate (APS), TEMED | Catalyzes acrylamide polymerization | Fresh preparation critical for consistent gel formation |
| Denaturing Agents | Sodium dodecyl sulfate (SDS) | Denatures proteins and confers uniform charge | Critical for SDS-PAGE; typically used at 0.1-1% concentrations |
| Reducing Agents | β-mercaptoethanol, DTT, DTE | Breaks disulfide bonds between cysteine residues | Essential for complete denaturation in reducing SDS-PAGE |
| Running Buffers | Tris-glycine, Tris-tricine, Bis-tris | Conducts current and maintains pH during electrophoresis | Tris-glycine-SDS standard for SDS-PAGE; specialized buffers for specific applications |
| Tracking Dyes | Bromophenol blue | Visualizes migration front during electrophoresis | Migrates at approximately 5 kDa front in SDS-PAGE |
| Molecular Weight Standards | Prestained, unstained, fluorescent markers | Provides size reference for unknown proteins | Prestained markers allow tracking during run and transfer |
| Staining Reagents | Coomassie R-250/G-250, silver nitrate, SYPRO Ruby | Visualizes separated protein bands | Choice depends on sensitivity requirements and downstream applications |
The selection between SDS-PAGE and native PAGE represents a fundamental methodological decision that directly influences experimental outcomes in protein research. SDS-PAGE provides unparalleled resolution for molecular weight determination, purity assessment, and subunit analysis under denaturing conditions, while native PAGE preserves protein structure and function for activity studies and complex analysis. The decision framework presented in this guide enables researchers to align methodological choices with specific research objectives, optimizing experimental design for drug development and basic research applications.
As proteomic technologies continue to advance, both techniques maintain their relevance as core tools in the researcher's arsenal. SDS-PAGE remains the cornerstone technique for routine protein analysis, while native PAGE offers unique capabilities for functional proteomics. In many cases, these methods provide complementary information when used in concert, particularly in comprehensive protein characterization workflows. By understanding the fundamental principles, technical requirements, and application-specific advantages of each method, researchers can implement an informed electrophoretic strategy that maximizes data quality and biological relevance for their specific research goals.
The choice between Sodium Dodecyl Sulfate-Polyacrylamide Gel Electrophoresis (SDS-PAGE) and Native PAGE is fundamental in protein science, with each method offering distinct advantages and inherent constraints. This divergence stems from their core principles: SDS-PAGE separates denatured proteins based almost exclusively on molecular mass, while Native PAGE separates proteins in their native state based on a combination of charge, size, and shape [2] [7]. This in-depth guide examines the technical limitations of each approach, providing researchers and drug development professionals with a framework for selecting the appropriate technique and interpreting results within the context of a broader protein separation strategy.
SDS-PAGE: Limitations of a Denaturing Workhorse
SDS-PAGE is a foundational analytical technique valued for its ability to provide high-resolution separation of complex protein mixtures by molecular weight [30] [88]. However, its reliance on denaturing conditions introduces several significant constraints.
Loss of Native Structure and Function
The most profound limitation of SDS-PAGE is its deliberate destruction of native protein structure. The anionic detergent SDS denatures proteins by disrupting non-covalent bonds and linearizing the polypeptide chain, while reducing agents like DTT or β-mercaptoethanol break disulfide linkages [2] [88]. This process:
- Eliminates Biological Activity: Enzymatic function, receptor-binding capability, and other biological activities are irreversibly lost [8] [7].
- Destroys Quaternary Structure: Multi-subunit protein complexes dissociate into their individual components, preventing analysis of native oligomeric states and protein-protein interactions [7].
- Removes Non-Covalently Bound Cofactors: Essential metal ions and other prosthetic groups are stripped away, which is a critical shortcoming for metalloprotein analysis [8].
Limitations in Molecular Weight Interpretation
While SDS-PAGE is renowned for molecular weight estimation, several factors can compromise accuracy:
- Abnormal Migration Patterns: Proteins with unusual amino acid compositions, such as heavily glycosylated or membrane proteins, may bind SDS irregularly, leading to aberrant migration and inaccurate molecular weight determinations [88].
- Limited Resolution Range: The effective separation range is constrained by the chosen polyacrylamide concentration. Low-percentage gels resolve high molecular weight proteins but provide poor separation of smaller proteins, and vice versa [2]. Although gradient gels can mitigate this issue, they do not eliminate it.
Additional Technical Constraints
- Ineffectiveness for Basic Proteins: Extremely basic proteins may not acquire sufficient negative charge for optimal separation [30].
- Detection Challenges for Low-Abundance Proteins: While standard stains like Coomassie Brilliant Blue are useful, they lack the sensitivity for detecting low nanogram levels of protein without more advanced detection methods [88].
Table 1: Key Technical Limitations of SDS-PAGE
| Limitation Category | Specific Constraint | Impact on Protein Analysis |
|---|---|---|
| Structural Integrity | Complete denaturation and linearization | Loss of native conformation, quaternary structure, and all biological activity |
| Cofactor Retention | Removal of non-covalently bound metal ions | Inability to study functional metalloproteins directly from the gel |
| Molecular Weight Accuracy | Abnormal migration of glycoproteins, lipoproteins, and membrane proteins | Inaccurate mass estimation for specific protein classes |
| Functional Analysis | Destruction of active sites and binding interfaces | Impossible to perform activity assays or study interactions directly from the gel |
Native PAGE: Limitations of a Non-Denaturing Technique
Native PAGE preserves proteins in their biologically active state, enabling the study of function and complex formation. However, this preservation comes at the cost of resolution and introduces interpretive complexities.
Complex Migration Dependence
In Native PAGE, a protein's migration depends on its intrinsic charge, size, and shape [2] [7]. This multi-parameter dependence creates fundamental limitations:
- Molecular Weight Cannot Be Directly Determined: Unlike SDS-PAGE, migration distance does not directly correlate with molecular mass due to the variable charge contribution [7].
- Predicting Mobility is Challenging: A protein's net charge at the running buffer pH significantly influences its mobility, making it difficult to predict migration behavior without prior knowledge of the protein's isoelectric point and quaternary structure.
Reduced Resolution and Analytical Reproducibility
- Lower Resolution Power: The preservation of native conformations, including variations in shape and hydrodynamic radius, results in broader bands and lower overall resolution compared to SDS-PAGE [8].
- Buffer System Sensitivity: Results are highly sensitive to buffer composition, pH, and ionic strength, requiring careful optimization and potentially limiting reproducibility across laboratories [2].
Solubility and Stability Issues
- Aggregation and Precipitation: The absence of denaturants increases the risk of protein aggregation or precipitation during electrophoresis, particularly for hydrophobic or multi-domain proteins [2].
- pH Sensitivity: Proteins may be exposed to non-physiological pH conditions during separation, potentially leading to denaturation or loss of activity [2].
Table 2: Key Technical Limitations of Native PAGE
| Limitation Category | Specific Constraint | Impact on Protein Analysis |
|---|---|---|
| Separation Basis | Dependence on charge, size, and shape | Prevents direct determination of molecular weight; complicates prediction of migration |
| Resolution | Broader bands and lower resolving power | Reduced ability to separate proteins of similar size and charge |
| Reproducibility | High sensitivity to buffer conditions and pH | Requires stringent optimization; challenging to reproduce identical conditions |
| Protein Stability | Risk of aggregation and precipitation during run | Limited applicability to hydrophobic or less stable proteins |
Comparative Analysis and Advanced Methodologies
Direct Technique Comparison
The choice between SDS-PAGE and Native PAGE represents a fundamental trade-off between structural resolution and functional preservation. SDS-PAGE provides superior size-based resolution but destroys functional attributes, while Native PAGE preserves activity but offers lower resolution and more complex interpretation [7]. This dichotomy makes them largely complementary rather than interchangeable.
Emerging Techniques and Protocol Modifications
Researchers have developed innovative approaches to overcome the limitations of conventional methods.
Native SDS-PAGE (NSDS-PAGE) is a hybrid approach that modifies standard SDS-PAGE conditions by eliminating reducing agents and the heating step, and significantly reducing SDS concentration in the running buffer (e.g., from 0.1% to 0.0375%) [8]. This method represents a compromise, offering higher resolution than BN-PAGE (a type of native electrophoresis) while retaining functional properties lost in fully denaturing SDS-PAGE. Studies demonstrate that this modification enables retention of Zn²⁺ in metalloproteins and preservation of enzymatic activity in seven of nine model enzymes tested [8].
Two-Dimensional (2D) PAGE systems that combine both techniques provide powerful solutions for complex analyses. For example, a Native/SDS–2D-PAGE system uses native PAGE in the first dimension to preserve interactions, followed by SDS-PAGE in the second dimension to maximize separation of denatured subunits [89]. This approach is particularly valuable for detecting protein-protein interactions in complex mixtures, as mobility changes on the 2D map can indicate complex formation [89].
Specialized Immunoblotting Protocols have been refined to address quantification inaccuracies. For challenging targets like proinsulin misfolding, modifications to standard SDS-PAGE and electrotransfer protocols enable clearer separation and more accurate quantification of native monomers, misfolded monomers, and disulfide-linked oligomers that were previously overestimated due to antibody affinity variations [67].
Experimental Design Considerations
The selection of an appropriate electrophoretic method must align with the specific research question:
- For subunit composition and purity assessment: SDS-PAGE remains the gold standard [7] [88].
- For functional studies and interaction analyses: Native PAGE is indispensable despite its limitations [7] [89].
- For metalloprotein analysis or when partial structure preservation is needed: NSDS-PAGE offers a valuable intermediate approach [8].
- For comprehensive analysis of complex mixtures: 2D systems combining multiple separation principles provide the highest resolution [89].
Essential Research Reagent Solutions
Successful protein electrophoresis requires specific reagents tailored to each method. The table below details key materials and their functions.
Table 3: Essential Reagents for SDS-PAGE and Native PAGE
| Reagent | Function | Application |
|---|---|---|
| SDS (Sodium Dodecyl Sulfate) | Denatures proteins; imparts uniform negative charge | SDS-PAGE |
| DTT or β-Mercaptoethanol | Reduces disulfide bonds | Reducing SDS-PAGE |
| Acrylamide/Bis-acrylamide | Forms porous gel matrix for molecular sieving | Both techniques |
| TEMED & Ammonium Persulfate | Catalyzes acrylamide polymerization | Both techniques |
| Coomassie Blue/SYPRO Ruby | Visualizes separated proteins | Both techniques (post-electrophoresis) |
| Molecular Weight Standards | Provides size references for calibration | Primarily SDS-PAGE |
| Coomassie G-250 | Imparts charge for electrophoresis without full denaturation | BN-PAGE/NSDS-PAGE |
Workflow and Decision Pathway
The following diagram illustrates the logical decision process for selecting the appropriate electrophoretic method based on research objectives, highlighting how each technique's limitations guide experimental design.
The technical limitations of SDS-PAGE and Native PAGE are direct consequences of their underlying separation principles. SDS-PAGE sacrifices native structure and function for high-resolution size-based separation, while Native PAGE preserves biological activity at the cost of resolution and introduces interpretive complexity. Understanding these constraints enables researchers to make informed decisions, implement appropriate controls, and draw valid conclusions from their electrophoretic analyses. The continued development of hybrid techniques like NSDS-PAGE and sophisticated 2D systems demonstrates the field's ongoing efforts to overcome these limitations, providing increasingly powerful tools for protein characterization in basic research and drug development.
In the realm of protein analysis, polyacrylamide gel electrophoresis (PAGE) serves as a foundational technique, with SDS-PAGE and Native PAGE representing two fundamentally different approaches to separation. These methods provide unique insights into protein characteristics, but their reliability hinges on the implementation of robust quality control measures. The integration of appropriate loading controls and reference standards is not merely an optional step but a critical component that validates experimental integrity, ensures accurate interpretation, and enables meaningful comparisons across samples and research studies.
The choice between SDS-PAGE and Native PAGE dictates the specific quality control strategies required. SDS-PAGE, which separates denatured proteins based primarily on molecular weight, employs controls that verify complete denaturation and equal loading. In contrast, Native PAGE, which separates proteins in their native conformation based on size, charge, and shape, requires controls that monitor the preservation of protein structure and activity. Understanding these distinctions is essential for researchers, scientists, and drug development professionals who rely on these techniques for protein characterization, purity assessment, and functional studies. This guide examines the specific quality control measures—loading controls and reference standards—required for each method, framed within the broader context of how protein separation differs in SDS-PAGE versus Native PAGE research.
Fundamental Differences Between SDS-PAGE and Native PAGE
SDS-PAGE and Native PAGE employ different separation mechanisms that directly influence quality control requirements. The table below summarizes the core differences between these techniques:
Table 1: Key Differences Between SDS-PAGE and Native PAGE
| Criteria | SDS-PAGE | Native PAGE |
|---|---|---|
| Separation Principle | Molecular weight [7] [1] | Size, charge, and shape [7] [1] |
| Gel Type | Denaturing [1] | Non-denaturing [1] |
| SDS Presence | Present [1] | Absent [1] |
| Protein State | Denatured and linearized [7] [88] | Native, folded conformation [7] [1] |
| Protein Function | Lost after separation [1] | Retained after separation [1] |
| Buffer Composition | Contains reducing agents (DTT, BME) [1] | No reducing agents [1] |
| Primary Applications | Molecular weight determination, purity check [1] [88] | Protein complexes, oligomerization, activity studies [7] [1] |
In SDS-PAGE, the anionic detergent sodium dodecyl sulfate (SDS) denatures proteins and binds to the polypeptide backbone in a constant weight ratio, imparting a uniform negative charge that masks proteins' intrinsic charge [2] [88] [17]. This results in separation based almost exclusively on molecular mass rather than charge or structural features [2]. The samples are typically heated in the presence of reducing agents to ensure complete denaturation and reduction of disulfide bonds [17].
In contrast, Native PAGE separates proteins based on their intrinsic charge, size, and three-dimensional structure under non-denaturing conditions [2]. Without SDS, proteins retain their native conformation, biological activity, and complex quaternary structures [7] [2]. This makes Native PAGE ideal for studying functional protein complexes, enzyme activity, and protein-protein interactions, but introduces more variables that must be controlled experimentally [7].
Loading Controls: Ensuring Experimental Reliability
Purpose and Function of Loading Controls
Loading controls are antibodies against ubiquitously expressed proteins used as internal standards to normalize protein levels across different samples on a gel [90]. They serve several critical functions in quantitative Western blotting and gel electrophoresis:
- Normalization: Account for variations in total protein loading across wells [90] [91]
- Transfer Verification: Confirm even protein transfer from the gel to the membrane during blotting [91]
- Edge Effect Mitigation: Identify and correct for uneven transfer in outer lanes [90] [91]
- Data Reliability: Ensure observed variations reflect true biological differences rather than technical artifacts [90]
Without proper loading controls, it is impossible to distinguish whether differences in band intensity result from actual biological variation or technical inconsistencies in sample preparation, loading, or transfer [90].
Selection Criteria for Loading Controls
Choosing an appropriate loading control requires careful consideration of multiple factors:
- Stable Expression: The protein should be constitutively expressed at constant levels regardless of experimental conditions [90] [91]
- Abundance: The protein should be sufficiently abundant for easy detection [90]
- Molecular Weight: The control should differ in size from the target protein to prevent overlapping bands [90] [91]
- Tissue/Cell Specificity: Expression should be consistent in the biological system under study [90]
- Experimental Conditions: The control should be unaffected by treatments or disease states [90] [91]
Commonly Used Loading Controls
Table 2: Common Loading Controls and Their Applications
| Protein | Molecular Weight | Recommended Applications | Limitations |
|---|---|---|---|
| β-Actin [90] | 42 kDa [91] | Whole cell, cytoplasmic extracts [91] | Expression varies in muscle, certain pathologies [90] [91] |
| GAPDH [91] | 35-37 kDa [91] | Cytoplasmic fractions [91] | Expression affected by hypoxia, diabetes [91] |
| α-/β-Tubulin [90] [91] | 55/50 kDa [91] | Whole cell, cytoskeletal fractions [91] | Expression affected by anti-microbial drugs [91] |
| Vinculin [91] | 125 kDa [91] | Whole cell extracts [91] | Higher molecular weight |
| Lamin B1 [91] | 66 kDa [91] | Nuclear fractions [91] | Not suitable when nuclear envelope is removed [91] |
| COX IV [91] | 16-20 kDa [91] | Mitochondrial fractions [91] | Multiple proteins run at same size [91] |
Loading Control Validation and Troubleshooting
Proper validation of loading controls is essential for generating reliable data. The following approaches are recommended:
- Empirical Testing: Verify loading control stability under specific experimental conditions before main experiments [90]
- Multiple Controls: Use two different loading controls to confirm results, particularly with novel samples [90]
- Antibody Titration: Optimize antibody concentration to ensure signals fall within the linear detection range [90]
- Total Protein Normalization: As an alternative method, use total protein analysis with stains like Ponceau S when housekeeping protein expression varies [90]
Common issues include signal saturation, which obscures true sample-to-sample variation, and choosing controls with molecular weights too close to the target protein, making band distinction difficult [90].
Reference Standards and Molecular Weight Markers
Types of Protein Ladders and Their Applications
Protein standards, also known as molecular weight markers or protein ladders, are mixtures of proteins with known molecular weights that serve as reference points for estimating the size of unknown proteins [41] [88]. These standards are categorized based on their detection methods and specific applications:
Table 3: Types of Protein Standards and Their Characteristics
| Standard Type | Key Features | Primary Applications | Examples |
|---|---|---|---|
| Prestained [41] | Pre-labeled with colored dyes; allow visual monitoring during electrophoresis and transfer [41] | Tracking electrophoresis progress; estimating transfer efficiency [41] | PageRuler Plus, Spectra Multicolor [41] |
| Unstained [41] | No dye labels; provide accurate molecular weight estimation without dye interference [41] | Precise molecular weight determination [41] | PageRuler Unstained [41] |
| Western Blotting [41] | Contain IgG-binding sites; visualized directly during antibody detection [41] | Protein size estimation on blots; positive control for detection [41] | iBright, MagicMark XP [41] |
| Specialty [41] | Designed for specific applications like IEF, native PAGE, or detecting modifications [41] | Native PAGE, IEF, detecting His-tagged, phosphorylated, or glycosylated proteins [41] | NativeMark, IEF Marker, CandyCane [41] |
Selection Criteria for Appropriate Standards
Choosing the correct protein standard requires consideration of multiple factors:
- Separation Range: Ensure the standard covers the expected molecular weights of target proteins [41]
- Gel Compatibility: Match the standard to the specific gel system (e.g., Tris-acetate gels for high molecular weight proteins) [41]
- Detection Method: Select standards compatible with visualization methods (colorimetric, fluorescent, etc.) [41]
- Band Pattern: Choose standards with sufficient reference points across the size range of interest [41]
- Application-Specific Features: Consider specialized standards for techniques like native PAGE or isoelectric focusing [41]
Molecular Weight Determination
Protein size is calibrated by comparing the migration distance of unknown proteins to molecular weight standards run in parallel lanes [6]. The relative distance of migration (Rf) is calculated for each standard protein, and a standard curve is generated by plotting the log of molecular weight against migration distance [88]. Unknown protein sizes are then estimated based on this curve [88].
Experimental Protocols for Quality Control
Sample Preparation with Quality Controls
Proper sample preparation is fundamental for reliable protein separation:
- Protein Quantification: Determine protein concentration using colorimetric assays (BCA, Bradford, or Lowry) before loading [51] [6]
- Inhibition of Degradation: Include protease and phosphatase inhibitors in lysis buffers to prevent protein degradation or modification [51]
- Denaturation Conditions: For SDS-PAGE, heat samples to 95°C for 5 minutes in Laemmli buffer containing SDS and reducing agents (DTT or β-mercaptoethanol) [17]
- Native Conditions: For Native PAGE, avoid detergents and reducing agents, and maintain samples at 4°C to preserve protein structure [1] [2]
- Loading Consistency: Load equal amounts of total protein across wells, typically 20-50 μg depending on gel thickness and detection sensitivity [91] [6]
Gel Electrophoresis and Transfer
The electrophoresis process requires additional quality control considerations:
- Gel Selection: Choose appropriate acrylamide concentrations based on target protein size (e.g., 12% for 40-100 kDa proteins) [6] or gradient gels for broader separation ranges [2]
- Buffer Systems: Use Tris-glycine buffers for most SDS-PAGE applications [17] and specialized buffers like Tris-tricine for low molecular weight proteins [17]
- Electrophoresis Conditions: Run SDS-PAGE at room temperature [1] and Native PAGE at 4°C to maintain protein stability [1]
- Transfer Verification: Use prestained markers to confirm complete and even transfer to membranes [41]
Detection and Analysis
Quality control during detection ensures accurate data interpretation:
- Control Lysates: Include positive control lysates from cell lines known to express the target protein [91] and negative control lysates from knockout cell lines [91]
- No-Primary Antibody Control: Omit primary antibody to identify non-specific secondary antibody binding [91]
- Linear Range Detection: Optimize antibody concentrations and exposure times to prevent signal saturation, particularly for abundant loading controls [90]
- Normalization: Use loading control band intensities to normalize target protein signals for quantitative comparisons [90] [91]
The Scientist's Toolkit: Essential Research Reagents
Successful implementation of quality control measures requires specific reagents and materials:
Table 4: Essential Research Reagents for Quality Control in PAGE
| Reagent Category | Specific Examples | Function | Quality Control Role |
|---|---|---|---|
| Loading Control Antibodies [90] [91] | Anti-β-actin, anti-GAPDH, anti-tubulin [90] [91] | Detect constitutively expressed housekeeping proteins | Normalize for loading variations [90] [91] |
| Protein Ladders [41] | PageRuler, Spectra, MagicMark [41] | Provide molecular weight references | Size estimation; transfer verification [41] |
| Protease Inhibitors [51] | PMSF, aprotonin, leupeptin [51] | Prevent protein degradation | Maintain sample integrity [51] |
| Detergents & Denaturants [51] [88] | SDS, CHAPS, urea [51] | Solubilize and denature proteins | Ensure consistent separation [88] |
| Positive Control Lysates [91] | Cell lysates known to express target protein [91] | Verify antibody specificity and procedure | Confirm protocol validity [91] |
| Negative Control Lysates [91] | Knockout cell lysates [91] | Identify non-specific antibody binding | Confirm signal specificity [91] |
Quality control through appropriate loading controls and reference standards is fundamental to obtaining reliable, reproducible data in both SDS-PAGE and Native PAGE experiments. The distinct separation principles of these techniques—molecular weight versus native charge and structure—demand different quality control strategies tailored to each method. SDS-PAGE relies heavily on controls that verify complete denaturation and equal loading, while Native PAGE requires controls that monitor the preservation of native protein structure and complex integrity.
Implementing the quality measures outlined in this guide—selecting appropriate loading controls based on biological system and experimental conditions, using correct reference standards for each application, following validated protocols, and including necessary positive and negative controls—ensures that research findings reflect true biological phenomena rather than technical artifacts. For researchers in drug development and basic science, these rigorous quality control practices form the foundation for generating trustworthy data that advances scientific knowledge and therapeutic innovation.
Protein gel electrophoresis is a cornerstone technique in biochemistry and molecular biology, enabling the separation and analysis of complex protein mixtures. Within this field, two principal methodologies—Sodium Dodecyl Sulfate-Polyacrylamide Gel Electrophoresis (SDS-PAGE) and Native PAGE—offer fundamentally different approaches to protein separation, each with distinct advantages and limitations. SDS-PAGE employs denaturing conditions to separate proteins primarily based on molecular weight, while Native PAGE utilizes non-denaturing conditions to separate proteins according to their combined size, charge, and three-dimensional structure [1] [2]. This dichotomy presents a significant challenge for researchers studying multi-protein complexes: SDS-PAGE reveals subunit composition but destroys native structure and interactions, whereas Native PAGE preserves functionality but offers limited resolution for complex mixtures [7].
This technical guide explores emerging hybrid methodologies, collectively termed "Semi-native PAGE," which bridge the gap between these conventional techniques. By integrating elements from both denaturing and non-denaturing electrophoresis, these innovative approaches enable more effective analysis of protein-protein interactions, complex stoichiometry, and native conformation under conditions that preserve biological activity while enhancing analytical resolution. As drug development increasingly targets protein-protein interactions, these advanced electrophoretic techniques provide crucial tools for characterizing therapeutic targets and understanding the structural basis of complex biological processes.
Technical Foundation: SDS-PAGE versus Native PAGE
Fundamental Principles and Separation Mechanisms
The core distinction between SDS-PAGE and Native PAGE lies in their treatment of protein structure during separation. In SDS-PAGE, the anionic detergent SDS binds extensively to proteins in a constant ratio (approximately 1.4 g SDS per 1 g of polypeptide), masking intrinsic charges and unfolding the proteins into linear chains [2]. This process, typically enhanced by reducing agents like β-mercaptoethanol or DTT to break disulfide bonds, results in separation based almost exclusively on molecular weight [1] [3]. In contrast, Native PAGE avoids denaturing agents, allowing proteins to maintain their native conformation, quaternary structure, and biological activity throughout the separation process [7] [2]. Migration depends on the protein's intrinsic charge, size, and three-dimensional shape [4].
Table 1: Core Technical Differences Between SDS-PAGE and Native PAGE
| Parameter | SDS-PAGE | Native PAGE |
|---|---|---|
| Separation Basis | Molecular weight | Size, charge, and shape |
| Protein State | Denatured (unfolded) | Native (folded) |
| Detergent Usage | SDS present | No SDS |
| Sample Preparation | Heating with reducing agents | No heating, no reducing agents |
| Protein Function Post-Separation | Lost | Preserved |
| Protein Recovery | Not typically recoverable | Recoverable for functional studies |
| Primary Applications | Molecular weight determination, purity assessment, expression analysis | Protein-protein interactions, oligomeric state analysis, enzymatic activity studies |
| Typical Running Temperature | Room temperature | 4°C |
Limitations of Conventional Approaches in Complex Analysis
While both techniques are invaluable for protein analysis, each presents significant limitations for studying protein complexes. SDS-PAGE's denaturing nature dissociates multi-subunit complexes into their constituent polypeptides, destroying information about quaternary structure and interactions [1] [2]. Although it provides excellent resolution based on size, it cannot distinguish between different oligomeric states of the same protein or reveal interacting partners. Conversely, while Native PAGE preserves complexes, its resolution is often inferior due to the multiple factors influencing migration [7]. Proteins with similar mass but different charges may migrate anomalously, making precise characterization challenging without additional analytical techniques.
Semi-native PAGE: Bridging the methodological Divide
Conceptual Framework and Design Principles
Semi-native PAGE encompasses modified electrophoretic approaches designed to balance structural preservation with enhanced resolution. These techniques incorporate specific denaturing agents or modifiers at concentrations that partially disrupt protein structure without completely unfolding complexes, or they combine elements of denaturing and native electrophoresis in sequential or parallel analyses. The conceptual framework aims to:
- Preserve sufficient native structure to maintain specific protein-protein interactions
- Introduce moderate denaturing conditions to improve separation resolution
- Enable subsequent functional analysis or partner identification
- Provide information about interaction stability under mild stress conditions
Implementation Strategies and Technical Variations
Several implementation strategies have emerged for semi-native approaches:
3.2.1 Limited Denaturant PAGE incorporates mild concentrations of chaotropic agents (e.g., urea) or gentle detergents (e.g., digitonin) that partially disrupt protein structure without dissociating specific complexes. This approach can help remove weakly associated non-specific binding partners while preserving specific, higher-affinity interactions.
3.2.2 Two-Dimensional Semi-native/SDS-PAGE combines separation under native conditions in the first dimension with fully denaturing separation in the second dimension. This powerful approach identifies protein components within complexes while maintaining information about their association state.
3.2.3 Charge-Based Semi-native Methods utilize anionic detergents like SDS at concentrations below the critical micelle concentration or at lower temperatures, which allow limited detergent binding without complete unfolding. This can normalize charge differences while preserving some aspects of quaternary structure.
Table 2: Emerging Hybrid Techniques for Protein Complex Analysis
| Technique | Core Principle | Resolves | Compatible Downstream Analysis |
|---|---|---|---|
| Blue Native PAGE (BN-PAGE) | Coomassie dye confers negative charge | Native protein complexes, molecular weight | In-gel activity assays, western blotting, mass spectrometry |
| Clear Native PAGE (CN-PAGE) | Intrinsic protein charge in gradient gel | Protein complexes based on charge | Protein recovery for functional studies |
| Chemical Crosslinking + PAGE | Stabilizes interactions before analysis | Transient or weak interactions | Mass spectrometry, western blotting |
| Limited Proteolysis + PAGE | Partial digestion reveals domains | Protein domains and interaction interfaces | Mass spectrometry, N-terminal sequencing |
Integrated Workflows: Combining Semi-native PAGE with Orthogonal Methods
Crosslinking-Assisted Semi-native Electrophoresis
Chemical crosslinking stabilizes protein-protein interactions before electrophoretic analysis, enabling the study of transient or weak complexes that would otherwise dissociate during Native PAGE. As recognized in [92] and [93], this approach "freezes" interaction complexes, making them amenable to various downstream analyses.
Workflow for Crosslinking-Assisted Semi-native PAGE Analysis
Mass Photometry Coupled with Semi-native Analysis
Mass photometry is a rapidly emerging label-free technique that measures the mass of individual proteins and complexes in solution by detecting the light they scatter when landing on a glass surface [94]. When combined with semi-native PAGE, it provides orthogonal validation of complex stoichiometry and reveals the distribution of oligomeric states within samples.
Mass Photometry Complements Semi-native PAGE for Complex Characterization
Experimental Protocols for Key Semi-native Approaches
Protocol 1: Blue Native PAGE for Membrane Protein Complexes
Blue Native PAGE (BN-PAGE), first described by Schägger and von Jagow, uses the anionic dye Coomassie Brilliant Blue G-250 to confer charge on protein complexes while maintaining them in their native state [1]. This technique is particularly valuable for analyzing membrane protein complexes that require gentle detergents for solubilization.
Sample Preparation:
- Solubilize membrane proteins using mild non-ionic detergents (dodecyl-β-D-maltoside, digitonin) at concentrations just above critical micelle concentrations
- Add Coomassie dye (0.5-1% w/v) to the cathode buffer and samples
- Prepare a 4-16% polyacrylamide gradient gel for optimal resolution of different complex sizes
- Run electrophoresis at 4°C with voltage limits of 50-100V to prevent heat denaturation
Downstream Processing:
- For functional assays: electro-elute proteins from excised gel slices or transfer to PVDF membranes under native conditions
- For mass spectrometry: destain gel pieces, reduce with DTT, alkylate with iodoacetamide, and digest with trypsin overnight at 37°C
Protocol 2: Chemical Crosslinking with Tandem Enzyme Digestion
Based on methodology from [93], this protocol enhances the identification of interaction interfaces through complementary digestion patterns.
Crosslinking Procedure:
- Prepare protein complex in 20 mM HEPES, pH 7.5
- Add bis(sulfosuccinimidyl)suberate (BS3) to 1 mM final concentration
- Incubate 15 minutes at room temperature
- Quench reaction with 50 mM ammonium bicarbonate (15 minutes, room temperature)
- Precipitate proteins with 8 volumes of cold acetone (-20°C, overnight)
Orthogonal Digestion for Enhanced Coverage:
- Split crosslinked sample into two aliquots
- Aliquot 1: Digest with trypsin (50:1 protein:enzyme) in 0.8 M urea, 50 mM NH₄HCO₃, 37°C overnight
- Aliquot 2: Digest with LysargiNase (20:1 protein:enzyme) in 20 mM CaCl₂, 50 mM NH₄HCO₃, 37°C overnight
- Combine peptide digests for LC-MS/MS analysis
- Search data using specialized crosslinking software (pLink, xQuest) with appropriate settings for BS3 crosslinks
Research Reagent Solutions for Semi-native PAGE
Table 3: Essential Reagents for Semi-native PAGE Applications
| Reagent Category | Specific Examples | Function & Application |
|---|---|---|
| Crosslinkers | BS3 (bis(sulfosuccinimidyl)suberate), DSS (disuccinimidyl suberate) | Stabilize protein-protein interactions before analysis; BS3 for water-soluble applications |
| Specialized Enzymes | Trypsin, LysargiNase | Proteolytic digestion for MS analysis; complementary cleavage patterns enhance coverage |
| Detergents | Dodecyl-β-D-maltoside, Digitonin | Solubilize membrane protein complexes while maintaining native state |
| Mass Photometry Components | TwoMP mass photometer, MassFluidix HC | Measure mass distributions of complexes; HC module enables analysis at physiologically relevant concentrations |
| Affinity Purification Reagents | Glutathione resin, Cobalt resin, Antibody-conjugated beads | Isolate specific complexes from biological mixtures before electrophoretic analysis |
Applications in Drug Discovery and Development
Semi-native PAGE techniques provide critical insights for pharmaceutical research, particularly in targeting protein-protein interactions (PPIs), which represent an expanding class of therapeutic targets. As noted in [95], "uncovering protein-protein interaction information helps in the identification of drug targets." These methods enable:
Target Validation: Confirming the existence and stoichiometry of specific PPIs in physiological conditions Mechanism of Action Studies: Determining how small molecules modulate complex formation or dissociation Biologics Characterization: Analyzing the assembly and stability of engineered protein therapeutics Off-Target Profiling: Identifying unintended interactions of drug candidates with non-target proteins
The quantitative aspects of semi-native approaches, particularly when combined with mass photometry, enable determination of dissociation constants (K~D~) for complex formation under various conditions, providing crucial data for structure-activity relationship studies [94].
Current Limitations and Future Directions
While semi-native PAGE methodologies address significant gaps in protein complex analysis, several challenges remain. The techniques still require optimization for different protein systems, and the reproducibility across laboratories needs improvement. Quantitative interpretation can be complicated by variable dye binding, crosslinking efficiencies, and recovery differences.
Future developments will likely focus on:
- Standardized commercial kits for specific applications
- Improved computational tools for data interpretation
- Integration with structural techniques like cryo-EM
- Microfluidic implementations for high-throughput screening
- Enhanced crosslinkers with higher specificity and MS-detectable features
As these hybrid methodologies mature, they will increasingly become standard tools in the biochemical toolkit, enabling deeper understanding of the interactome and facilitating development of novel therapeutics targeting protein complexes.
In the highly regulated biopharmaceutical industry, the validation of analytical techniques is not merely a procedural formality but a fundamental requirement for ensuring drug safety, identity, purity, and potency. Among these techniques, polyacrylamide gel electrophoresis (PAGE) serves as a critical tool for characterizing protein-based therapeutics, with SDS-PAGE and Native PAGE representing two fundamentally different approaches with distinct applications. The choice between these methods carries significant regulatory implications, as it directly impacts the quality and type of data submitted to agencies like the FDA and EMA [30] [7]. Technique validation provides documented evidence that an analytical method is fit for its intended purpose, delivering reliable and reproducible results throughout the product lifecycle [96].
Within the context of a broader thesis on protein separation methodologies, understanding the differential capabilities of SDS-PAGE and Native PAGE becomes paramount. These techniques provide complementary insights: while SDS-PAGE reveals information about protein subunit molecular weight and purity, Native PAGE illuminates the functional state, quaternary structure, and biological activity of proteins [1] [3]. This technical guide examines the regulatory considerations for validating these electrophoretic techniques, providing a framework for their application in biopharmaceutical development while highlighting their distinct separation mechanisms through detailed methodologies, comparative analysis, and practical implementation strategies.
Fundamental Principles: SDS-PAGE versus Native PAGE
Core Separation Mechanisms
The fundamental difference between SDS-PAGE and Native PAGE lies in their treatment of protein structure and, consequently, their separation mechanisms. SDS-PAGE (Sodium Dodecyl Sulfate-Polyacrylamide Gel Electrophoresis) employs an anionic detergent that denatures proteins, masks their intrinsic charge, and imposes a uniform negative charge-to-mass ratio [1] [3]. This process effectively linearizes the proteins, ensuring separation occurs almost exclusively based on molecular weight rather than charge or shape [7]. Smaller proteins migrate faster through the gel matrix, while larger ones lag behind, allowing for molecular weight estimation when compared to standardized markers [6].
In contrast, Native PAGE maintains proteins in their native, folded conformation by omitting denaturing agents like SDS [1] [3]. Separation in Native PAGE depends on a combination of the protein's inherent charge, size, and three-dimensional shape [7] [6]. This preservation of structure allows the technique to retain biological activity, making it suitable for studying functional protein complexes, oligomerization states, and enzyme activity post-separation [97] [7].
Comparative Analysis: A Side-by-Side Technical Examination
Table 1: Comprehensive Comparison of SDS-PAGE and Native PAGE Characteristics
| Characteristic | SDS-PAGE | Native PAGE |
|---|---|---|
| Separation Basis | Molecular weight/size of subunits [1] [3] | Size, charge, and shape of native protein [1] [3] |
| Gel Condition | Denaturing [1] [3] | Non-denaturing [1] [3] |
| Use of SDS | Present (denaturing agent) [1] [3] | Absent [1] [3] |
| Sample Preparation | Heated with reducing agents (e.g., DTT, BME) [1] | Not heated; no reducing agents [1] |
| Protein State | Denatured and linearized [1] [3] | Native, folded conformation [1] [3] |
| Protein Function Post-Separation | Lost [1] | Retained [1] |
| Protein Recovery | Typically not recoverable in functional form [1] [3] | Recoverable for functional studies [1] [3] |
| Primary Applications | Molecular weight determination, purity assessment, expression analysis [30] [1] | Study of protein complexes, oligomerization, functional activity [1] [7] |
| Typical Running Temperature | Room Temperature [1] | 4°C [1] |
Visualizing the Technique Selection Pathway
The following workflow diagram outlines the decision-making process for selecting and applying the appropriate electrophoretic technique based on research objectives, leading to technique-specific validation requirements.
Regulatory Framework for Analytical Technique Validation
The Product Lifecycle Approach to Validation
Modern regulatory guidance, including the FDA's Process Validation Guidance (2011) and EU Annex 15 (2015), mandates a lifecycle approach to validation activities [96]. This framework links process and analytical development through three integrated stages: Process Design, Process Qualification, and Continued Process Verification [96]. For analytical techniques like SDS-PAGE and Native PAGE, this means validation is not a one-time event but an ongoing activity that begins during early R&D, continues through technology transfer and clinical trial manufacturing (Phases 1-3), and extends into routine commercial production [96]. This approach aligns with ICH guidelines Q8 (Pharmaceutical Development), Q9 (Quality Risk Management), and Q10 (Pharmaceutical Quality System), emphasizing sound science and risk management throughout the product lifecycle [96].
Core Validation Parameters for Electrophoretic Methods
Regardless of the specific technique, regulatory validation for electrophoretic methods must demonstrate several key parameters. While the search results do not provide explicit numerical criteria for PAGE validation, the established regulatory principles for analytical methods apply [98] [96]. These typically include:
- Specificity: The ability to unequivocally assess the analyte (e.g., a specific protein or subunit) in the presence of expected impurities.
- Accuracy: The closeness of test results obtained by the method to the true value.
- Precision: The degree of agreement among individual test results when the procedure is applied repeatedly to multiple samplings (including repeatability and intermediate precision).
- Detection Limit & Quantitation Limit: The lowest amount of analyte that can be detected or quantified with acceptable accuracy and precision.
- Linearity and Range: The ability to obtain results directly proportional to analyte concentration within a given range.
- Robustness: The capacity of the method to remain unaffected by small, deliberate variations in method parameters.
Technique-Specific Validation Considerations
Validation for SDS-PAGE Applications
For SDS-PAGE, which is predominantly used for determining protein purity, subunit molecular weight, and identity [30] [6], validation must focus on parameters relevant to these applications. Key considerations include:
- Molecular Weight Accuracy: Establishing that the method accurately determines the molecular weight of protein subunits through validation using standard proteins with known molecular weights across the intended separation range [6].
- Resolution and Sensitivity: Demonstrating that the method can resolve and detect the specific proteins or impurities of interest at required levels, which is critical for detecting product-related impurities or degradation fragments [30].
- Sample Preparation Controls: Validating the sample preparation process, including denaturation and reduction steps, to ensure complete and reproducible unfolding of proteins. The use of reducing agents like dithiothreitol (DTT) or 2-mercaptoethanol (2-ME) breaks down disulfide bonds, which is critical for accurate subunit analysis [30] [6].
The reliability of SDS-PAGE is influenced by several factors that must be controlled during method development and validation. These include gel composition (%T and %C), which determines pore size and resolution; buffer system and pH; and sample preparation techniques [30]. Proper validation must demonstrate that the method remains robust despite normal variations in these parameters.
Validation for Native PAGE Applications
Validating Native PAGE methods presents unique challenges because the objective is often to preserve and evaluate the native state, quaternary structure, and biological function of proteins [1] [7]. Key validation considerations include:
- Functional Recovery: Demonstrating that proteins separated and recovered from the gel retain their biological activity, which is essential for applications like enzyme activity assays or functional studies of protein complexes [1] [7].
- Complex Integrity: Establishing that the method preserves non-covalent protein-protein interactions and accurately reflects the oligomeric state of the protein therapeutic [97].
- Charge-Based Separation Characterization: For Native PAGE, separation depends on both size and intrinsic charge [1] [3]. Validation must account for this dual dependency, potentially requiring assessment under different buffer conditions to confirm separation characteristics.
A practical example highlighting the differential outcomes between these techniques involves the analysis of a protein dimer. When a protein sample isolated from a natural source was electrophoresed on non-reducing SDS-PAGE, it migrated as a 60 kDa band. However, when the same protein was analyzed using Native PAGE, it migrated corresponding to a 120 kDa marker. This result reasonably infers that "the protein is a dimer of 60 kDa subunits that are not linked with disulfides" [97], as the non-reducing conditions would have maintained disulfide bonds if they were present. This case study exemplifies how the complementary use of both techniques provides insights into protein quaternary structure that neither method could deliver alone.
Implementation and Documentation Requirements
Essential Research Reagent Solutions
Successful implementation and validation of electrophoretic methods require carefully controlled reagents and materials. The following table catalogues essential components and their functions in SDS-PAGE and Native PAGE workflows.
Table 2: Essential Research Reagents for Electrophoresis Validation
| Reagent/Material | Function/Purpose | Technique |
|---|---|---|
| SDS (Sodium Dodecyl Sulfate) | Denatures proteins and imparts uniform negative charge [1] [3] | SDS-PAGE |
| DTT or β-mercaptoethanol | Reducing agent that breaks disulfide bonds [30] [3] | SDS-PAGE (Reducing) |
| Acrylamide/Bis-acrylamide | Forms the cross-linked gel matrix for separation [5] [6] | Both |
| Molecular Weight Markers | Proteins of known size for calibration and estimation [6] | Both |
| Tris-glycine Buffer | Common electrophoretic buffer system [6] | Both |
| Coomassie Brilliant Blue | Protein stain for visualization [6] | Both |
| TEMED & Ammonium Persulfate | Catalyzes acrylamide polymerization [6] | Both |
| Protease/Phosphatase Inhibitors | Prevents protein degradation/modification [6] | Native PAGE |
Strategic Implementation and Contemporary Challenges
Implementing a robust validation strategy for electrophoretic techniques requires a cross-functional team approach, involving quality assurance specialists, process engineers, and regulatory compliance professionals [98]. A comprehensive Validation Master Plan (VMP) should define the procedures and equipment requiring validation, describe the process flow, and integrate risk management principles [98]. This plan must be treated as a dynamic document, with regular reviews and updates in response to method changes, regulatory updates, or feedback from quality monitoring [98].
Contemporary challenges in method validation include addressing emerging technologies such as lab-on-chip systems that are transforming traditional SDS-PAGE approaches by addressing efficiency and precision challenges [30]. Furthermore, the increasing regulatory scrutiny of chemicals of concern (CoCs), such as certain fluorescent dyes or cross-linking agents, may necessitate the development and validation of alternative reagents [99]. The emergence of Artificial Intelligence (AI) in analytical data processing also introduces new validation considerations, requiring documented algorithms, data privacy protocols, and model transparency to meet regulatory expectations [99].
The validation of SDS-PAGE and Native PAGE techniques represents a critical component of the overall quality system for biopharmaceutical development. While these methods share a common electrophoretic foundation, their distinct separation principles—with SDS-PAGE determining molecular weight under denaturing conditions and Native PAGE assessing size, charge, and structure under native conditions—demand specialized validation approaches. Regulatory compliance requires a lifecycle perspective that aligns technique validation with product development phases from R&D through commercial manufacturing. By implementing a science-based, thoroughly documented validation strategy that acknowledges both the complementary nature of these techniques and their unique applications, biopharmaceutical developers can ensure reliable characterization of therapeutic proteins while meeting the rigorous standards of global regulatory authorities.
Conclusion
SDS-PAGE and Native PAGE serve as complementary pillars in protein analysis, each offering distinct advantages for specific research objectives. SDS-PAGE remains the gold standard for molecular weight determination and protein purity assessment under denaturing conditions, while Native PAGE is indispensable for studying native protein structures, complexes, and functional activities. The evolution toward advanced techniques like CE-SDS and high-resolution clear native PAGE addresses limitations in reproducibility, throughput, and membrane protein analysis. For researchers in drug development and biomedical fields, understanding these techniques' comparative strengths enables informed method selection that aligns with experimental goals, whether for basic research, diagnostic applications, or therapeutic protein characterization. Future directions will likely focus on further automation, integration with multi-omics platforms, and enhanced capabilities for analyzing challenging membrane proteins and large macromolecular complexes.
References
- 1. Differences between SDS PAGE and Native PAGE [https://www.geeksforgeeks.org/biology/differences-between-sds-page-and-native-page/]
- 2. Overview of Protein Electrophoresis [https://www.thermofisher.com/us/en/home/life-science/protein-biology/protein-biology-learning-center/protein-biology-resource-library/pierce-protein-methods/overview-electrophoresis.html]
- 3. SDS PAGE vs Native PAGE [https://byjus.com/biology/difference-between-sds-page-and-native-page/]
- 4. What is the difference between PAGE and SDS-PAGE? [https://www.aatbio.com/resources/faq-frequently-asked-questions/What-is-the-difference-between-PAGE-and-SDS-PAGE]
- 5. SDS-PAGE Analysis of proteins: Principles, methodology, ... [https://deepscienceresearch.com/dsr/catalog/book/107/chapter/407]
- 6. Western blotting guide: Part 2, Protein separation by SDS- ... [https://www.jacksonimmuno.com/secondary-antibody-resource/technical-tips/western-blotting-guide-part-2/]
- 7. How Is Native PAGE Different from SDS-PAGE? [https://synapse.patsnap.com/article/how-is-native-page-different-from-sds-page]
- 8. Native SDS-PAGE: High Resolution Electrophoretic ... [https://pmc.ncbi.nlm.nih.gov/articles/PMC4517606/]
- 9. Overview of Protein Electrophoresis [https://www.thermofisher.com/tr/en/home/life-science/protein-biology/protein-biology-learning-center/protein-biology-resource-library/pierce-protein-methods/overview-electrophoresis.html]
- 10. Should I Use A Native Or Denaturing Gel? [https://info.gbiosciences.com/blog/should-i-use-a-native-or-denaturing-gel]
- 11. Separation and analysis of proteins by capillary ... [https://www.sciencedirect.com/science/article/abs/pii/S0003267025007172]
- 12. : Principle, Protocol & Key Applications Explained SDS PAGE [https://www.vedantu.com/biology/sds-page]
- 13. SDS-PAGE: A Cornerstone of Protein Analysis in Modern ... [https://www.metwarebio.com/sds-page-protein-analysis/]
- 14. Preparing protein samples for sds - page [https://www.ruf.rice.edu/~bioslabs/studies/sds-page/denature.html]
- 15. SDS-PAGE & Protein Separation Role of SDS Explained [https://www.letstalkacademy.com/sds-page-protein-separation-role-of-sds-explained/]
- 16. - SDS : PAGE Analysis Made Easy Protein [https://www.numberanalytics.com/blog/sds-page-protein-analysis-made-easy]
- 17. SDS-PAGE [https://en.wikipedia.org/wiki/SDS-PAGE]
- 18. Comparing SDS-PAGE and CE-SDS for Antibody Purity ... [https://www.bioprocessintl.com/qa-qc/comparing-sds-page-and-ce-sds-for-antibody-purity-analysis]
- 19. DeFrND: detergent-free reconstitution into native ... [https://www.nature.com/articles/s41467-025-63275-8]
- 20. Ulrich Laemmli's Development of SDS Polyacrylamide Gel ... [https://fnl.mit.edu/ulrich-laemmlis-development-of-sds-polyacrylamide-gel-electrophoresis/]
- 21. Using T4 genetics and Laemmli's development of high- ... [https://www.sciencedirect.com/science/article/pii/S0021925822009061]
- 22. SDS-PAGE guide: Sample preparation to analysis [https://www.abcam.com/en-us/knowledge-center/western-blot/sds-page-guide]
- 23. How SDS-PAGE Separates Proteins [https://azurebiosystems.com/blog/how-sds-page-separates-proteins/]
- 24. Comparison of in-gel protein separation techniques ... [https://pmc.ncbi.nlm.nih.gov/articles/PMC4234072/]
- 25. Comparison of the performance of 1D SDS-PAGE with ... [https://www.sciencedirect.com/science/article/abs/pii/S1570023218312546]
- 26. Principle and Protocol of Native-PAGE [https://www.creativebiomart.net/resource/principle-protocol-principle-and-protocol-of-native-page-435.htm]
- 27. Principle of SDS PAGE [https://byjus.com/biology/sds-page/]
- 28. Native PAGE Gels | Thermo Fisher Scientific - US [https://www.thermofisher.com/us/en/home/life-science/protein-biology/protein-gel-electrophoresis/protein-gels/specialized-protein-gels/nativepage-bis-tris-gels.html]
- 29. The principle and method of polyacrylamide gel ... [https://www.mblbio.com/bio/g/support/method/sds-page.html]
- 30. Deciphering food proteins: The applications of SDS-PAGE ... [https://www.sciencedirect.com/science/article/abs/pii/S2212429225003025]
- 31. Experiment-3 : Densitometric analysis of proteins on SDS-PAGE gels (Theory) : Clinical Proteomics Remote Triggering Virtual Laboratory : Biotechnology and Biomedical Engineering : Amrita Vishwa Vidyapeetham Virtual Lab [https://vlab.amrita.edu/?sub=3&brch=237&sim=1249&cnt=1]
- 32. Clear Native Gel Electrophoresis for the Purification of ... [https://pubmed.ncbi.nlm.nih.gov/40748368/]
- 33. Beyond Gels: The Evolution of SDS-Based Protein Separation | Bio-Techne [https://www.bio-techne.com/resources/blogs/advantages-of-ce-sds]
- 34. Overview of Protein Electrophoresis [https://www.thermofisher.com/ru/en/home/life-science/protein-biology/protein-biology-learning-center/protein-biology-resource-library/pierce-protein-methods/overview-electrophoresis.html]
- 35. SDS-PAGE: The science behind all those bubbles [https://www.antibodiesinc.com/pages/sds-page-demystified?srsltid=AfmBOorm23rYlm22_hrrquLxfTJoowc0sZQ4wixbKRxx2UhtXnDhouQL]
- 36. Protein Electrophoresis Using SDS-PAGE: A Detailed ... [https://www.goldbio.com/blogs/articles/protein-electrophoresis-sds-page-overview?srsltid=AfmBOoriAyTUoL3o62xs3KLc_zgBr9jG1rvvV5ZhMnKokXZMOS5orbX-]
- 37. Native Polyacrylamide Gels [https://link.springer.com/protocol/10.1007/978-1-4939-8793-1_8]
- 38. Native-PAGE [http://www.assay-protocol.com/molecular-biology/electrophoresis/native-page.html]
- 39. Two-Dimensional Blue Native/SDS Polyacrylamide Gel ... [https://www.mdpi.com/2072-6651/14/10/661]
- 40. SDS-PAGE Sample Loading Buffers [https://www.gbiosciences.com/Buffers-Reagents-Chemicals/Electrophoresis-Related-Buffers-Chemicals/SDS-PAGE-Sample-Loading-Buffer]
- 41. Protein Standards & Ladders [https://www.thermofisher.com/us/en/home/life-science/protein-biology/protein-gel-electrophoresis/protein-standards-ladders.html]
- 42. Evaluation of protein extraction methodologies on bacterial ... [https://pmc.ncbi.nlm.nih.gov/articles/PMC12312612/]
- 43. A Database of Accurate Electrophoretic Migration Patterns ... [https://www.sciencedirect.com/science/article/pii/S0022283622005605]
- 44. Protocol for the Analysis of Yeast and Human ... [https://www.sciencedirect.com/science/article/pii/S2666166720300769]
- 45. Resolving mitochondrial protein complexes using non ... - PMC [https://pmc.ncbi.nlm.nih.gov/articles/PMC2795571/]
- 46. Blue native electrophoresis protocol [https://www.abcam.com/en-us/technical-resources/protocols/blue-native-electrophoresis]
- 47. Diverse native-PAGE [http://www.assay-protocol.com/molecular-biology/electrophoresis/diverse-native-PAGE.html]
- 48. Advantages and limitations of clear-native PAGE [https://pubmed.ncbi.nlm.nih.gov/16220535/]
- 49. Optimized isolation and purification of native glycoprotein B ... [https://pubmed.ncbi.nlm.nih.gov/40612731/]
- 50. High-resolution native electrophoresis in-gel activity assay ... [https://www.nature.com/articles/s41598-025-24684-3]
- 51. Western Blot: The Complete Guide [https://www.antibodies.com/applications/western-blotting]
- 52. Western Blot Transfer Methods [https://www.thermofisher.com/us/en/home/life-science/protein-biology/protein-biology-learning-center/protein-biology-resource-library/pierce-protein-methods/western-blot-transfer-methods.html]
- 53. Validation of blue- and clear-native polyacrylamide gel ... [https://pmc.ncbi.nlm.nih.gov/articles/PMC12445495/]
- 54. Capillary vs. Gel Electrophoresis: Differences, Advantages, ... [https://www.bostonind.com/blog/capillary-vs-gel-electrophoresis-differences-advantages-and-applications?srsltid=AfmBOoqm3tDDtiEhqm-Ed5J6pgkmxQQGeSXzq4th69zEYtiLixfcd9ax]
- 55. Capillary Electrophoresis in the Biopharmaceutical Industry [https://www.chromatographyonline.com/view/capillary-electrophoresis-biopharmaceutical-industry-part-i]
- 56. Capillary Electrophoresis vs. Gel Electrophoresis [https://www.labx.com/resources/capillary-electrophoresis-vs-gel-electrophoresis-a-comprehensive-guide/5548]
- 57. Capillary Gel Electrophoresis: An Alternative to SDS-PAGE? [https://bitesizebio.com/24080/capillary-gel-electrophoresis-an-alternative-to-sds-page/]
- 58. Rapid baseline hump-free analysis of therapeutic proteins ... [https://www.sciencedirect.com/science/article/pii/S0003267025005410]
- 59. A Comprehensive Review on Capillary Electrophoresis ... [https://pmc.ncbi.nlm.nih.gov/articles/PMC12461452/]
- 60. Gel Electrophoresis, PAGE, SDS - Biochemistry [https://www.medschoolcoach.com/gel-electrophoresis-page-sds-page-mcat-biochemistry/]
- 61. Troubleshooting SDS-PAGE Gel Running Issues [https://www.goldbio.com/blogs/articles/troubleshooting-sds-page-gel-running-issues?srsltid=AfmBOopdzbgUVL5Pvbt9w5qHIIPhhiFGzJ611OXYILY8Fdmpne_4GaxP]
- 62. Nucleic Acid Gel Electrophoresis Troubleshooting [https://www.thermofisher.com/us/en/home/life-science/cloning/cloning-learning-center/invitrogen-school-of-molecular-biology/na-electrophoresis-education/na-electrophoresis-troubleshooting.html]
- 63. The 8 Western Blot Failures and How to Prevent Them (2025 ... [https://wildtypeone.substack.com/p/the-8-western-blot-failures-and-how?utm_campaign=post&triedRedirect=true]
- 64. DNA Electrophoresis vs Protein Electrophoresis [https://blog.edvotek.com/2025/07/24/dna-electrophoresis-vs-protein-electrophoresis/]
- 65. Effect of the operational parameters on the electromigration ... [https://www.sciencedirect.com/science/article/pii/S0039914025000876]
- 66. Application of SDS-PAGE in Protein Characterization [https://www.mtoz-biolabs.com/application-of-sds-page-in-protein-characterization.html]
- 67. Quantification of Folded and Misfolded Proinsulin Forms ... [https://pmc.ncbi.nlm.nih.gov/articles/PMC12152102/]
- 68. What Is SDS-PAGE and How Does It Separate Proteins? [https://synapse.patsnap.com/article/what-is-sds-page-and-how-does-it-separate-proteins]
- 69. Gel electrophoresis of proteins - Wikipedia [https://en.wikipedia.org/wiki/Gel_electrophoresis_of_proteins]
- 70. A Blue Native - PAGE analysis of membrane in... protein complexes [https://bmcmicrobiol.biomedcentral.com/articles/10.1186/1471-2180-11-22]
- 71. Electroelution [https://en.wikipedia.org/wiki/Electroelution]
- 72. In-depth structural proteomics integrating mass ... [https://www.frontiersin.org/journals/analytical-science/articles/10.3389/frans.2022.1107183/full]
- 73. A paper-based electroelution system for protein recovery ... [https://www.sciencedirect.com/science/article/abs/pii/S000326970800170X]
- 74. Minute™ Protein/Nucleic Acid Extraction Kit from Gels (20 ... [https://inventbiotech.com/products/minute-protein-nucleic-acid-extraction-kit-from-gels?srsltid=AfmBOoqUNQDYd0S9RRu8e8OVlr-NHdxequmCFeL-FB2W0rUW_We5OQ23]
- 75. Extraction of proteins from gels-A brief review - PMC [https://pmc.ncbi.nlm.nih.gov/articles/PMC7295094/]
- 76. Qualitative and quantitative evaluation of thylakoid complexes ... [https://plantmethods.biomedcentral.com/articles/10.1186/s13007-022-00858-2]
- 77. The use of blue native PAGE in the evaluation ... [https://pmc.ncbi.nlm.nih.gov/articles/PMC2648668/]
- 78. The application of nanodiscs in membrane protein drug ... [https://pmc.ncbi.nlm.nih.gov/articles/PMC11445163/]
- 79. A proteome-wide quantitative platform for nanoscale ... [https://www.nature.com/articles/s41592-024-02517-x]
- 80. Detergent/Nanodisc Screening for High-Resolution NMR ... [https://journals.plos.org/plosone/article?id=10.1371/journal.pone.0054378]
- 81. Lipid nanodiscs as a template for high-resolution cryo-EM ... [https://www.sciencedirect.com/science/article/abs/pii/S1047847723000527]
- 82. What's the Difference Between SDS-PAGE and Native ... [https://synapse.patsnap.com/article/whatE28099s-the-difference-between-sds-page-and-native-page]
- 83. Western blotting validation of mass spectrometry data [https://bio-protocol.org/exchange/minidetail?id=203675&type=30]
- 84. Advanced mass spectrometry techniques for monitoring ... [https://www.sciencedirect.com/science/article/pii/S0167779925003117]
- 85. How Does SDS-PAGE Work? A Comprehensive Guide [https://www.metwarebio.com/how-sds-page-works-guide/]
- 86. Separation And Purification Of Peptides And Proteins [https://jackwestin.com/resources/mcat-content/separations-and-purifications/separation-and-purification-of-peptides-and-proteins]
- 87. Protein Gel Staining: Coomassie, Silver, Fluorescent & More [https://www.creative-proteomics.com/resource/protein-gel-staining-methods.htm]
- 88. Overview of SDS-PAGE [https://www.creative-proteomics.com/resource/overview-of-sds-page.htm]
- 89. Using native gel in two-dimensional PAGE for the detection ... [https://www.sciencedirect.com/science/article/abs/pii/S0165022X99000093]
- 90. Loading Controls for Western Blotting [https://www.sigmaaldrich.com/US/en/technical-documents/technical-article/protein-biology/western-blotting/loading-controls-western-blotting?srsltid=AfmBOoo0RNELeeYG9-z3h98CKxhxolrhxTgXj-nBqJJ7qScI2N4cbSzh]
- 91. Recommended controls for western blot [https://www.abcam.com/en-us/technical-resources/guides/western-blot-guide/recommended-controls-for-western-blot]
- 92. Overview of Protein–Protein Interaction Analysis [https://www.thermofisher.com/us/en/home/life-science/protein-biology/protein-biology-learning-center/protein-biology-resource-library/pierce-protein-methods/overview-protein-protein-interaction-analysis.html]
- 93. Mirror cutting-assisted orthogonal digestion enabling large- ... [https://pmc.ncbi.nlm.nih.gov/articles/PMC9404107/]
- 94. Analyzing protein-protein interactions with mass photometry [https://refeyn.com/mass-photometry-protein-interactions]
- 95. Protein-Protein Interaction Detection: Methods and Analysis [https://pmc.ncbi.nlm.nih.gov/articles/PMC3947875/]
- 96. Biopharmaceutical Manufacturing Process Validation: [https://www.globenewswire.com/news-release/2025/10/28/3175149/0/en/Biopharmaceutical-Manufacturing-Process-Validation-Understand-FDA-Guidance-and-EU-Guidelines-Nov-17th-Nov-18th-2025.html]
- 97. Interpret SDS-PAGE vs Native-PAGE Results [https://www.letstalkacademy.com/sds-page-vs-native-page-protein-dimer/]
- 98. Six Key Principles for Successful Implementation in 2025 [https://zenovel.com/pharmaceutical-validation-six-key-principles-for-successful-implementation-in-2025/]
- 99. 2025 Life Sciences Regulatory Outlook [https://www.deloitte.com/us/en/services/consulting/articles/life-sciences-regulatory-outlook.html]