SDS-PAGE vs Native PAGE: A Comprehensive Guide to Choosing the Right Protein Separation Method
This article provides researchers, scientists, and drug development professionals with a definitive comparison of SDS-PAGE and Native PAGE, two foundational protein electrophoresis techniques.
SDS-PAGE vs Native PAGE: A Comprehensive Guide to Choosing the Right Protein Separation Method
Abstract
This article provides researchers, scientists, and drug development professionals with a definitive comparison of SDS-PAGE and Native PAGE, two foundational protein electrophoresis techniques. We explore the core principles governing each method, from the denaturing action of SDS to the native state preservation in non-denaturing gels. The scope extends to detailed methodological protocols, diverse applications in protein characterization and functional studies, troubleshooting for common experimental challenges, and strategic guidance for method selection and validation. By synthesizing foundational knowledge with practical optimization strategies, this guide empowers professionals to make informed decisions that enhance the accuracy and efficiency of their protein analysis workflows in biomedical and clinical research.
Core Principles of Protein Electrophoresis: Understanding SDS-PAGE and Native PAGE Fundamentals
Electrophoresis is a fundamental laboratory technique in which charged molecules, such as proteins, are transported through a solvent by an electrical field [1]. It is a simple, rapid, and sensitive analytical tool that leverages the fact that most biological molecules carry a net charge at any pH other than their isoelectric point (pI), the pH at which a molecule has no net charge [2] [1]. The mobility of a molecule through an electric field depends on several factors: the field strength, the net charge on the molecule, its size and shape, the ionic strength of the buffer, and the properties of the support matrix through which the molecule migrates [1].
This guide focuses on the application of this core principle in two dominant protein separation methods: SDS-PAGE (Sodium Dodecyl Sulfate Polyacrylamide Gel Electrophoresis) and Native PAGE. While both techniques use an electric field to drive separation, their methodologies and outcomes differ profoundly, making each suitable for distinct research objectives in biochemistry and drug development.
Core Principles of Electrophoretic Separation
At its heart, electrophoresis relies on the movement of charged particles in an electric field. Molecules with a net positive charge (cations) migrate toward the cathode (negative electrode), while molecules with a net negative charge (anions) migrate toward the anode (positive electrode) [1]. The support matrix, typically a polyacrylamide gel, acts as a molecular sieve, regulating the movement of molecules based on their size and three-dimensional structure [1].
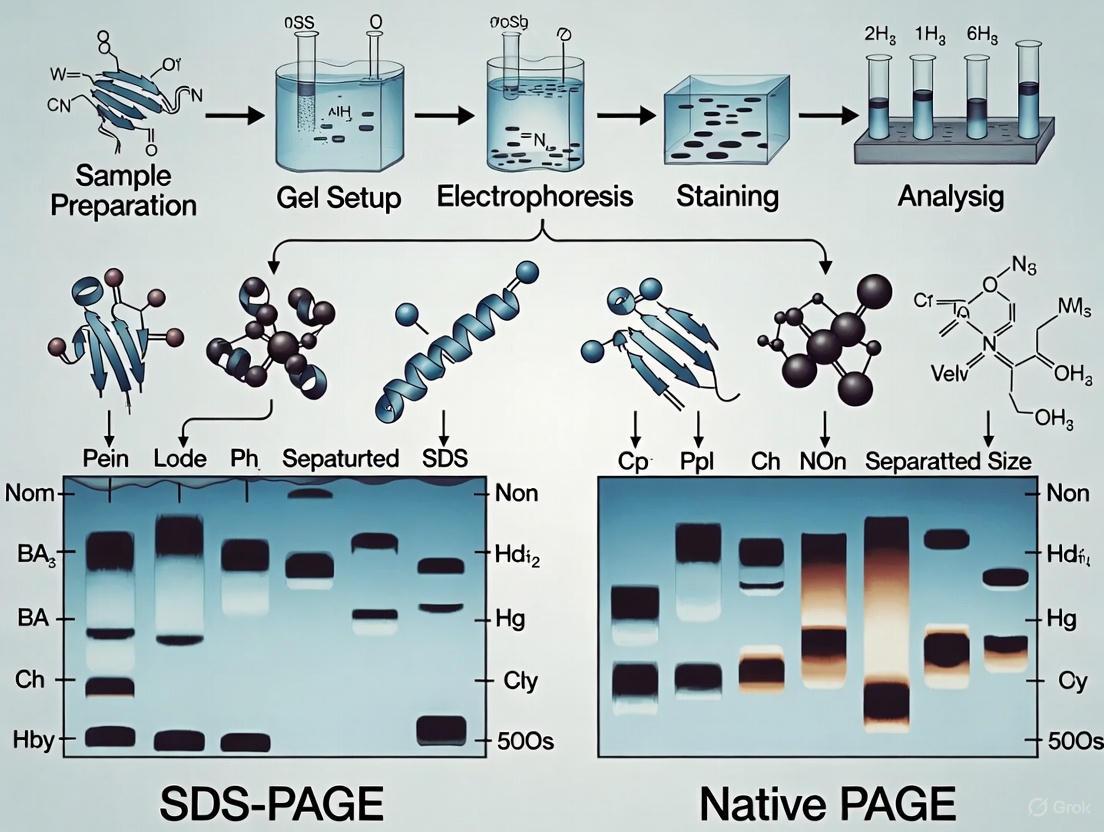
The following diagram illustrates the foundational workflow of a protein electrophoresis experiment, from sample preparation to analysis.
SDS-PAGE vs. Native PAGE: A Direct Comparison
The choice between SDS-PAGE and Native PAGE dictates the type of information gleaned from an experiment. The key distinction lies in whether proteins are denatured and uniformly charged, or kept in their native, functional state.
Table 1: Core Characteristics of SDS-PAGE and Native PAGE
| Feature | SDS-PAGE | Native PAGE |
|---|---|---|
| Principle of Separation | Primarily by molecular mass (size) [3] [1]. | By net charge, size, and 3D shape of the native protein [3] [1]. |
| Protein State | Denatured; secondary and higher structures are disrupted [4]. | Native; folded, functional structure is preserved [4]. |
| Key Reagents | SDS (denaturant/detergent), reducing agents (e.g., β-mercaptoethanol) [5]. | Native buffers, often without detergents or reducing agents [6]. |
| Molecular Weight Determination | Excellent; provides accurate estimates [1]. | Poor; migration is influenced by charge and shape, not just size [7]. |
| Preservation of Activity | No; enzymatic and functional activity is destroyed [3] [6]. | Yes; proteins often retain enzymatic and binding activity [3] [1]. |
| Ideal Applications | Assessing protein purity, subunit composition, and molecular weight [3] [5]. | Studying protein-protein interactions, oligomeric state, and enzymatic function [3] [8]. |
The fundamental difference in how proteins are prepared and separated in these two techniques is summarized in the workflow below.
Supporting Experimental Data and Protocols
The theoretical differences between these techniques are demonstrated by concrete experimental data. The following table summarizes quantitative findings from a study that modified standard SDS-PAGE to create "Native SDS-PAGE" (NSDS-PAGE), which aims to balance high resolution with the retention of functional properties [6].
Table 2: Experimental Comparison of PAGE Method Performance
| Method | Key Buffer Modifications | Impact on Protein Function | Metal Retention (Zn²⁺) |
|---|---|---|---|
| SDS-PAGE [6] | Sample buffer: Contains SDS and EDTA. Sample heated. Running buffer: 0.1% SDS, 1mM EDTA. | All nine model enzymes denatured and inactivated. | 26% |
| BN-PAGE [6] | Sample buffer: No SDS, contains Coomassie G-250. Running buffer: Cathode and anode buffers without SDS. | All nine model enzymes retained activity. | Not Specified |
| NSDS-PAGE [6] | Sample buffer: No SDS or EDTA, no heating step. Running buffer: Reduced SDS (0.0375%), no EDTA. | Seven of nine model enzymes retained activity, including four Zn²⁺ proteins. | 98% |
Detailed Experimental Protocol: NSDS-PAGE
The following methodology, adapted from a metallomics study, outlines the steps for performing NSDS-PAGE to separate proteins while preserving metal ions and enzymatic activity [6].
- Gel Pre-run: Precast NuPAGE Novex 12% Bis-Tris 1.0 mm mini-gels are run at 200V for 30 minutes in double-distilled H₂O to remove the storage buffer and any unpolymerized acrylamide.
- Sample Preparation: 7.5 μL of protein sample (e.g., partially purified proteome fractions) is added to 2.5 μL of 4X NSDS sample buffer (100 mM Tris HCl, 150 mM Tris base, 10% v/v glycerol, 0.0185% w/v Coomassie G-250, 0.00625% w/v Phenol Red, pH 8.5). Crucially, the sample is not heated.
- Electrophoresis: The prepared samples are loaded onto the pre-run gel. Electrophoresis is carried out at a constant voltage (200V) for approximately 45 minutes using the modified NSDS-PAGE running buffer (50 mM MOPS, 50 mM Tris Base, 0.0375% SDS, pH 7.7).
- Post-Electrophoresis Analysis:
- Activity Staining: The gel can be incubated in a specific substrate solution to detect enzymatic activity.
- Metal Detection: Retained metal ions (e.g., Zn²⁺) can be confirmed using techniques like laser ablation-inductively coupled plasma-mass spectrometry (LA-ICP-MS) or in-gel staining with a metal-binding fluorophore like TSQ [6].
Advanced Two-Dimensional (2D) Electrophoresis Applications
To gain deeper insights into complex protein systems, researchers often combine the strengths of native and denaturing electrophoresis in two-dimensional (2D) separations. A powerful combination is Blue Native (BN)-PAGE in the first dimension, followed by SDS-PAGE in the second dimension [9].
In this technique, protein complexes are first separated intact based on their native charge and size in a BN-PAGE gel. A single lane is then excised from the first-dimension gel, placed horizontally on a second gel, and subjected to SDS-PAGE. This second dimension denatures the complexes and separates their individual protein subunits by molecular weight [9]. This method is exceptionally valuable for characterizing multiprotein complexes, studying host-virus interactions, and identifying changes in protein complex composition in disease states [9].
Essential Research Reagent Solutions
The following table details key materials and reagents required for performing SDS-PAGE and Native PAGE, based on protocols from the cited literature.
Table 3: Essential Reagents for Protein Gel Electrophoresis
| Reagent / Material | Function / Purpose | Example from Protocol |
|---|---|---|
| Acrylamide / Bis-acrylamide | Forms the cross-linked polyacrylamide gel matrix that acts as a molecular sieve [1]. | Precast NuPAGE Novex 12% Bis-Tris gels [6]. |
| SDS (Sodium Dodecyl Sulfate) | Ionic detergent that denatures proteins and imparts a uniform negative charge [3] [5]. | Component of SDS-PAGE sample and running buffers [6]. |
| Reducing Agent (e.g., β-mercaptoethanol) | Breaks disulfide bonds between cysteine residues to fully denature protein subunits [5]. | Used in denaturing SDS-PAGE sample prep [5]. |
| Coomassie Blue G-250 | Negatively charged dye used in BN-PAGE and NSDS-PAGE to confer charge on protein complexes without significant denaturation [6]. | 0.02% in BN-PAGE cathode buffer; 0.01875% in NSDS-PAGE sample buffer [6]. |
| Tris-based Buffers (Bis-Tris, MOPS, Tricine) | Maintain stable pH during electrophoresis to ensure consistent protein charge and migration [6] [1]. | MOPS/SDS running buffer; BisTris ACA native anode buffer [6]. |
| Molecular Weight Markers | A set of proteins of known mass that provide a reference for estimating sample protein molecular weights [1]. | Prestained SDS-PAGE Standards; NativeMark unstained standards [6]. |
The basic principle of electrophoresis—the movement of charged molecules in an electric field—is powerfully applied in both SDS-PAGE and Native PAGE. The choice between them is not a matter of which is superior, but which is appropriate for the specific research question. SDS-PAGE is the unrivaled method for determining molecular weight and analyzing subunit composition under denaturing conditions. In contrast, Native PAGE is the definitive technique for probing the functional intricacies of proteins in their native state, including their interactions, oligomeric structures, and enzymatic activities. Advanced techniques like 2D BN/SDS-PAGE further combine these strengths, enabling researchers to deconstruct complex protein assemblies and gain a more holistic understanding of cellular machinery, which is paramount in fundamental research and drug development.
In the realm of protein analysis, polyacrylamide gel electrophoresis (PAGE) serves as a foundational technique for separating and characterizing proteins. Two primary methodologies dominate this field: SDS-PAGE (Sodium Dodecyl Sulfate–Polyacrylamide Gel Electrophoresis) and Native PAGE. While both techniques separate proteins using an electric field through a polyacrylamide gel matrix, their philosophical approaches and outcomes are fundamentally different. The core distinction lies in the role of the denaturing detergent Sodium Dodecyl Sulfate (SDS), which transforms proteins into uniformly charged, linear molecules, enabling separation strictly by molecular weight. This guide objectively compares SDS-PAGE against Native PAGE, detailing their mechanisms, experimental protocols, and applications to inform researchers and drug development professionals in selecting the appropriate method for their analytical needs.
The Fundamental Role of SDS in Protein Denaturation
Sodium Dodecyl Sulfate (SDS) is a powerful anionic detergent that performs two critical, simultaneous functions on protein structure, fundamentally enabling the SDS-PAGE technique.
Protein Denaturation and Linearization: SDS molecules possess a hydrophobic hydrocarbon tail and a hydrophilic sulfate head group. The hydrophobic tails interact strongly with the non-polar regions of a protein, disrupting hydrogen bonds and van der Waals forces that maintain secondary and tertiary structures. This interaction unfolds the protein, destroying its native conformation and converting it into a random, linear coil [10]. The biological activity of the protein is lost in this process.
Charge Masking and Uniform Negative Charge Impartation: As SDS binds to the unfolded polypeptide chain, it coats the protein in a uniform layer of negative charge. SDS binds to proteins in high concentrations—approximately 1.4 grams of SDS per gram of protein—which translates to roughly one SDS molecule for every two amino acids [11]. This massive, uniform negative charge overwhelms the protein's intrinsic charge, meaning a protein's own positively or negatively charged amino acids no longer influence its movement. Consequently, all proteins in the mixture attain a similar charge-to-mass ratio [11] [10].
The combined effect of these actions is that the factors of native charge and three-dimensional shape are eliminated. The sole determinant of a protein's migration speed through the gel sieve becomes its molecular weight (size). Smaller proteins migrate faster, while larger ones migrate more slowly, allowing for precise size-based separation [12] [3].
SDS-PAGE Experimental Protocol: A Detailed Methodology
The following section provides a standardized, step-by-step protocol for conducting a reducing SDS-PAGE analysis, as developed by Laemmli [11].
Research Reagent Solutions
The following reagents are essential for performing SDS-PAGE.
| Reagent Category | Specific Examples | Function in the Protocol |
|---|---|---|
| Denaturing Detergent | Sodium Dodecyl Sulfate (SDS) | Unfolds proteins and imparts uniform negative charge [10]. |
| Reducing Agents | β-mercaptoethanol (BME), Dithiothreitol (DTT) | Breaks disulfide bonds to fully dissociate protein subunits [12] [11]. |
| Gel Matrix Components | Acrylamide, Bis-acrylamide | Forms cross-linked polyacrylamide gel matrix that acts as a molecular sieve [11]. |
| Polymerization Initiators | Ammonium Persulfate (APS), TEMED | Catalyzes the free-radical polymerization of acrylamide [10]. |
| Buffers | Tris-HCl | Maintains stable pH in stacking gel (pH 6.8) and resolving gel (pH 8.8) [10]. |
| Tracking Dye | Bromophenol Blue | Visualizes sample migration during electrophoresis [10]. |
| Running Buffer | Tris-Glycine, SDS | Provides ions to carry current and maintains denaturing conditions during run [11] [10]. |
| Staining Solutions | Coomassie Brilliant Blue | Visualizes separated protein bands post-electrophoresis [12] [11]. |
Step-by-Step Workflow
Gel Preparation: A discontinuous gel system is used, comprising two distinct layers:
- Separating (Resolving) Gel: This lower layer has a higher percentage of acrylamide (e.g., 10-12%) and a pH of 8.8. Its pore size is designed to separate proteins by size [11] [10].
- Stacking Gel: This upper layer has a lower percentage of acrylamide (4-6%) and a pH of 6.8. It serves to concentrate all protein samples into a sharp, unified band before they enter the separating gel, vastly improving resolution [10]. The gel is cast between two glass plates, and a comb is inserted to create sample wells.
Sample Preparation: Protein samples are mixed with Laemmli sample buffer, which contains SDS, a reducing agent (like DTT or BME), glycerol, and tracking dye [10]. This mixture is then heated to 95 °C for 5 minutes. Heating provides the energy required to fully denature the proteins and ensure complete binding of SDS [12] [11].
Electrophoresis: The prepared samples and a molecular weight size marker are loaded into the wells. The gel apparatus is filled with a Tris-glycine-SDS running buffer, and an electric current (∼100-200V) is applied. The negatively charged proteins migrate toward the positive anode. The stacking gel mechanism, driven by the unique charge states of glycine in the different pH environments, focuses the proteins into thin lines. Once they enter the resolving gel, proteins are separated based on their molecular weight [11] [10].
Post-Run Analysis: After electrophoresis, the gel is stained (e.g., with Coomassie Blue) to visualize the protein bands. The distance migrated by unknown proteins is compared to the standard curve generated by the molecular weight marker to estimate their size [11].
Figure 1: SDS-PAGE Experimental Workflow. The process involves parallel sample and gel preparation steps, followed by loading, electrophoresis, and analysis.
SDS-PAGE vs. Native PAGE: A Direct Comparison
The addition of SDS creates a fundamental divergence from Native PAGE. The table below provides a direct, objective comparison of the two techniques based on key experimental and analytical parameters [12].
| Criterion | SDS-PAGE | Native PAGE |
|---|---|---|
| Separation Basis | Molecular weight only [12] [3] | Size, intrinsic charge, and 3D shape [12] [3] |
| Protein State | Denatured and linearized [12] | Native, folded conformation [12] |
| SDS Presence | Present (critical for function) [12] | Absent [12] |
| Reducing Agents | Often used (e.g., DTT, BME) [12] | Not used [12] |
| Sample Preparation | Heated to 95°C in SDS buffer [12] | Not heated; mixed in non-denaturing buffer [12] |
| Protein Function Post-Run | Lost [12] | Retained [12] |
| Protein Recovery | Not recoverable in functional form [12] | Can be recovered for activity assays [12] |
| Information Obtained | Subunit molecular weight, purity [12] | Oligomeric state, protein-protein interactions [12] |
| Primary Applications | Molecular weight determination, purity checks, Western blotting [12] [3] | Studying native function, enzyme activity, protein complexes [12] [3] |
Figure 2: Separation Logic Comparison. SDS-PAGE simplifies separation to molecular weight, while Native PAGE separates based on multiple native properties.
Applications in Research and Biopharmaceutical Development
The distinct principles of SDS-PAGE and Native PAGE make them suitable for different applications in life sciences and drug development.
Applications of SDS-PAGE
Molecular Weight Determination and Purity Analysis: SDS-PAGE is the standard method for estimating protein molecular weight and assessing sample purity. By comparing the migration distance of an unknown protein to a standard curve of proteins with known molecular weights, researchers can determine the approximate size of the protein subunit with an error of about ±10% [11]. It is routinely used to check the purity of protein samples after purification steps [3].
Food Science and Quality Control: In the food industry, SDS-PAGE is used extensively for protein profiling to assess the integrity and quality of proteins in raw materials and finished products. It can detect adulteration, monitor changes induced by processing (e.g., heat or enzymatic hydrolysis), and identify specific proteins in complex matrices like cereals, pulses, dairy, and meat products [13] [5].
Therapeutic Protein Characterization: In biopharmaceutical development, SDS-PAGE is critical for analyzing therapeutic proteins like monoclonal antibodies. It is used to monitor subunit integrity, check for the presence of aggregates or fragments, and ensure batch-to-batch consistency. Recent advancements, such as capillary SDS gel electrophoresis, aim to improve the efficiency and precision of these analyses for next-generation biologic drugs [14].
Applications of Native PAGE
Analysis of Protein Complexes and Oligomeric State: Native PAGE is indispensable for studying proteins in their functional, multi-subunit forms. It allows researchers to determine the stoichiometry and quaternary structure of complexes without dissociation into subunits. For example, a protein that runs as a 120 kDa complex on Native PAGE but as a 60 kDa band on non-reducing SDS-PAGE can be inferred to be a non-covalent dimer of 60 kDa subunits [7].
Functional and Enzymatic Studies: Because native PAGE preserves protein activity, it can be coupled with in-gel activity assays (zymography) to detect enzymes like proteases or dehydrogenases based on their biological function. Proteins separated by Native PAGE can also be eluted from the gel for further functional studies [12] [3].
Advanced Techniques and Future Directions
The core principles of SDS-PAGE continue to be refined and integrated with advanced analytical platforms.
Alternative Gel and Buffer Systems: For specific needs, variations of the standard SDS-PAGE exist. Tricine-SDS-PAGE is preferred for the separation of lower molecular weight proteins (< 30 kDa) and peptides, offering better resolution in this range than the traditional glycine-based system [13] [11]. Furthermore, the use of pre-cast gels with Bis-tris buffers at a near-neutral pH enhances gel stability and reduces protein modifications, such as cysteine adduct formation with unpolymerized acrylamide [11].
Integration with Mass Spectrometry: SDS-PAGE is a key front-end separation technique for mass spectrometric analysis. After separation, protein bands can be excised, digested with trypsin, and the resulting peptides analyzed by MS for protein identification and characterization of post-translational modifications. This powerful combination is a cornerstone of modern proteomics [3].
Innovations in Capillary Electrophoresis: Recent research focuses on translating slab gel SDS-PAGE to capillary formats (CE-SDS) for automated, quantitative analysis. A 2025 study highlighted a novel baseline hump-free SDS capillary agarose gel electrophoresis (SDS-CAGE) method. This advancement enables rapid (~5 minutes), high-resolution purity testing and subunit integrity analysis of therapeutic proteins, such as antibodies and highly glycosylated fusion proteins, addressing long-standing challenges with baseline disturbances in traditional CE-SDS methods [14].
SDS-PAGE and Native PAGE are powerful, complementary techniques in the protein scientist's toolkit. The inclusion of the denaturing detergent Sodium Dodecyl Sulfate is the defining feature of SDS-PAGE, enabling robust and reproducible separation of proteins based solely on subunit molecular weight. This makes it ideal for determining molecular weight, assessing purity, and analyzing protein composition in complex mixtures. In contrast, Native PAGE preserves the native structure and function of proteins, making it the method of choice for studying oligomerization, protein-protein interactions, and enzymatic activity. The choice between these techniques is not a matter of superiority but of strategic alignment with research goals. For characterizing the intrinsic properties of polypeptide chains, SDS-PAGE is unparalleled. For probing the functional architecture of native protein complexes, Native PAGE is indispensable. A comprehensive protein analysis strategy often leverages the strengths of both methodologies to build a complete picture of protein identity, structure, and function.
Native Polyacrylamide Gel Electrophoresis (PAGE) is a powerful protein separation technique that resolves proteins in their folded, native conformation. Unlike its denaturing counterpart, SDS-PAGE, Native PAGE operates under non-denaturing conditions that preserve protein structure, biological activity, and complex interactions [12] [3]. This makes it an indispensable tool for researchers studying functional protein characteristics, including enzymatic activity, protein-protein interactions, and oligomerization states [3] [15]. The technique was developed by Ornstein and Davis and separates proteins based on their combined size, charge, and shape as they migrate through a porous polyacrylamide gel matrix under the influence of an electric field [12] [16]. By maintaining the native state of proteins, this method allows scientists to extract proteins post-separation for further functional assays, providing insights that are often lost in denaturing methods [3].
Native PAGE vs. SDS-PAGE: A Fundamental Comparison
The core distinction between Native PAGE and SDS-PAGE lies in their treatment of protein structure. The table below summarizes the key differences:
Table 1: Key Differences Between Native PAGE and SDS-PAGE
| Criteria | Native PAGE | SDS-PAGE |
|---|---|---|
| Gel State | Non-denaturing [12] [15] | Denaturing [12] [15] |
| SDS Presence | Absent [12] | Present [12] |
| Sample Preparation | Not heated [12] | Heated [12] |
| Separation Basis | Size, charge, and shape [12] [3] | Molecular weight only [12] [16] |
| Protein State | Native, folded conformation [3] | Denatured, linearized [3] |
| Biological Activity | Retained [3] | Lost [3] |
| Protein Recovery | Possible post-separation [12] [15] | Not possible in functional form [12] |
| Primary Application | Studying structure, composition, and function [12] [3] | Determining molecular weight, checking purity/expression [12] [3] |
In SDS-PAGE, the anionic detergent sodium dodecyl sulfate (SDS) denatures proteins and coats them with a uniform negative charge, ensuring separation is based almost exclusively on molecular weight [3] [16]. Conversely, Native PAGE uses no denaturing agents, allowing proteins to retain their intrinsic charge and complex three-dimensional structure [3]. Consequently, a protein's migration in Native PAGE depends on its native charge-to-mass ratio and the physical obstruction of its folded shape as it moves through the gel [3] [16]. This fundamental difference dictates their application: use SDS-PAGE for analyzing protein purity and subunit molecular weight, and Native PAGE for investigating protein function, interactions, and native architecture [3].
Experimental Data and Performance Comparison
Comparative studies highlight how the choice of electrophoresis method impacts experimental outcomes, particularly in protein identification and the retention of functional properties.
Table 2: Comparative Experimental Data from Proteomic Studies
| Analysis Method | Proteins Identified (HBSMC Supernatant) | Key Functional Findings |
|---|---|---|
| 1D SDS-PAGE-MS | 2,552 proteins [17] | Advantageous for comparative quantitation of individual proteins [17]. |
| Native 2DE-MS | 4,323 proteins [17] | Advantageous for visualizing protein interactions in cells; higher sensitivity for certain membrane proteins [17]. |
| BN-PAGE | N/A | All nine model enzymes retained activity [6]. |
| Standard SDS-PAGE | N/A | All nine model enzymes underwent denaturation and lost activity [6]. |
| NSDS-PAGE | N/A | Seven of nine model enzymes, including four Zn²⁺ proteins, retained activity; 98% Zn²⁺ retention in proteomic samples [6]. |
A study analyzing human bronchial smooth muscle cells (HBSMC) found that SDS-PAGE and native 2DE provide complementary information [17]. While SDS-PAGE was superior for comparative quantification, native 2DE enabled the analysis of a larger number of proteins and was particularly effective for revealing protein interactions [17]. Furthermore, research into metalloproteins demonstrated the critical importance of native conditions. A modified method called Native SDS-PAGE (NSDS-PAGE), which uses reduced SDS and omits EDTA and a heating step, showed a dramatic increase in the retention of bound metal ions—from 26% in standard SDS-PAGE to 98% in NSDS-PAGE [6]. This protocol also allowed most model enzymes to remain active post-electrophoresis, whereas they were completely inactivated by standard SDS-PAGE [6].
Detailed Experimental Protocols
Standard Native PAGE Protocol
The following workflow outlines a typical Native PAGE experiment, from sample preparation to analysis:
1. Sample Preparation: Protein samples are prepared in a non-denaturing loading buffer that typically contains glycerol to increase density for gel loading, and a tracking dye like phenol red or Coomassie G-250 [6]. Crucially, this buffer contains no SDS, urea, or reducing agents like β-mercaptoethanol [12]. The sample is not heated prior to loading to prevent denaturation [12].
2. Gel Composition and Running Buffer: A standard polyacrylamide gel is used, but it is cast and run without SDS or other denaturing agents [12] [15]. The running buffer is also free of SDS. Common buffers include Tris-Glycine or Tris-BisTris systems at a neutral pH to help maintain protein stability [6].
3. Electrophoresis Conditions: The gel run is typically performed at 4°C to dissipate heat and protect proteins from thermal denaturation during the run, which can take 90-95 minutes [12] [6].
4. Post-Electrophoresis Analysis: After separation, proteins can be visualized using stains like Coomassie Blue or Silver Stain [18]. Because proteins are native, they can be electroeluted from gel slices or diffused out into an appropriate buffer for downstream functional assays, such as activity tests for enzymes or interaction studies [3] [15].
To experimentally verify the retention of biological activity after Native PAGE, the following methodology can be employed:
- Select Model Enzymes: Choose a set of diverse enzymes, such as alcohol dehydrogenase (Zn-ADH), alkaline phosphatase (Zn-AP), and carbonic anhydrase (Zn-CA).
- Run Parallel Gels: Subject identical aliquots of each enzyme to three parallel electrophoresis methods: Standard Denaturing SDS-PAGE, BN-PAGE, and Native SDS-PAGE (NSDS-PAGE).
- In-Gel Activity Assay: Following electrophoresis, incubate the gel in a substrate solution specific to each enzyme. For example, for alkaline phosphatase, use a solution containing a chromogenic substrate like BCIP/NBT.
- Quantify Activity: The development of a colored precipitate band on the gel indicates the location of the active enzyme. Compare the intensity and clarity of the activity bands between the different PAGE methods. As demonstrated in research, all nine model enzymes were active after BN-PAGE, seven were active after NSDS-PAGE, and none were active after standard SDS-PAGE [6].
The Scientist's Toolkit: Essential Research Reagent Solutions
Successful Native PAGE experiments require specific reagents tailored to preserve protein native state. The following table lists key solutions and their functions.
Table 3: Essential Reagents for Native PAGE Research
| Research Reagent | Function & Importance |
|---|---|
| Non-Denaturing Lysis Buffers | Extracts proteins from cells or tissues without disrupting non-covalent interactions, maintaining protein complexes. |
| Tris-Based Running Buffers | Provides the necessary ionic environment and pH control (typically near pH 7-8) for protein migration without denaturation. |
| Native-Compatible Stains (Coomassie G-250) | Visualizes protein bands without the use of harsh denaturing fixatives. Coomassie G-250 is used in techniques like BN-PAGE [6]. |
| Coomassie-Based Sample Buffer | Used in methods like NSDS-PAGE, it provides density for loading and a faint dye front without significant denaturation [6]. |
| Native Molecular Weight Standards | A mixture of intact, native proteins of known mass and charge used for calibration; essential for accurate analysis under non-denaturing conditions. |
| 4°C Electrophoresis Unit | A cooling system or dedicated cold room is crucial to run the gel at 4°C, preventing heat-induced denaturation during the run [12]. |
Advanced Techniques: Blue Native PAGE (BN-PAGE) and NSDS-PAGE
Beyond standard Native PAGE, advanced variants have been developed for specific applications:
Blue Native PAGE (BN-PAGE): This technique uses Coomassie Brilliant Blue G-250 dye, which binds to proteins and confers a negative charge, improving solubility and resolution during electrophoresis [12] [6]. BN-PAGE is particularly powerful for studying native membrane protein complexes and determining the oligomeric state of proteins [12]. It retains functional properties but may have lower resolution for complex proteomic mixtures compared to SDS-PAGE [6].
Native SDS-PAGE (NSDS-PAGE): This is a hybrid approach designed to bridge the gap between high resolution and function retention. It involves removing SDS and EDTA from the sample buffer, omitting the heating step, and significantly reducing the SDS concentration in the running buffer (e.g., to 0.0375%) [6]. This method results in high-resolution separation while retaining metal cofactors and enzymatic activity in most proteins, making it excellent for metalloprotein analysis [6].
Native PAGE is a cornerstone technique for functional proteomics, offering the unique advantage of preserving the native structure and biological activity of proteins. While SDS-PAGE remains the go-to method for determining molecular weight and analyzing purity, Native PAGE and its advanced derivatives like BN-PAGE and NSDS-PAGE are indispensable for interrogating protein function, characterizing complexes, and studying interactions in a state that closely mirrors their physiological environment. The choice between these techniques should be guided by the research question—whether the goal is to dissect protein composition or to understand its biological activity.
In polyacrylamide gel electrophoresis (PAGE), the gel matrix serves as a sophisticated molecular sieve that physically separates protein molecules based on their ability to navigate through its porous network. The polyacrylamide gel is formed by polymerizing acrylamide and bisacrylamide, creating a crosslinked polymer network whose pore size is precisely determined by the ratio and total concentration of these components [1]. This fundamental principle underpins both SDS-PAGE and Native PAGE techniques, though how proteins interact with the matrix differs significantly between these methods. Understanding and controlling polyacrylamide pore size is essential for optimizing protein separation efficiency, whether determining molecular weight under denaturing conditions or studying native protein complexes in their functional state.
Fundamentals of Polyacrylamide Gel Matrix
Gel Composition and Pore Formation
The polyacrylamide gel matrix is created through the copolymerization of acrylamide monomers and bisacrylamide (N,N'-methylenediacrylamide) crosslinkers. When ammonium persulfate (APS) is added as a polymerizing agent along with the catalyst TEMED (N,N,N',N'-tetramethylenediamine), a three-dimensional network forms with pores of defined sizes [1]. The pore size characteristics are determined by two key factors: the total acrylamide concentration (%T) and the degree of crosslinking (%C), which represents the proportion of bisacrylamide relative to the total acrylamide. This precise control over the gel's physical structure enables researchers to tailor separation conditions for different protein size ranges.
The Inverse Relationship Between Gel Percentage and Pore Size
The porosity of polyacrylamide gels exhibits an inverse relationship with the total acrylamide percentage. Lower-percentage gels (e.g., 7-8%) feature larger pores and are optimal for separating high molecular weight proteins, while higher-percentage gels (e.g., 12-15%) with smaller pores provide better resolution for lower molecular weight proteins [1]. This principle is exploited in gradient gels, which contain a low percentage of polyacrylamide at the top and a high percentage at the bottom, enabling a broader range of protein sizes to be separated effectively within a single gel [1]. The gradient design allows proteins to encounter progressively smaller pores during migration, sharpening bands and improving resolution across diverse molecular weight ranges.
Comparative Separation Mechanisms: SDS-PAGE vs. Native PAGE
Separation by Molecular Weight in SDS-PAGE
In SDS-PAGE, the anionic detergent sodium dodecyl sulfate (SDS) denatures proteins and binds to polypeptide chains in a constant weight ratio (approximately 1.4 g SDS per 1 g of protein) [1]. This SDS coating masks the proteins' intrinsic charge and confers a uniform negative charge density, transforming them into unstructured linear chains whose migration through the gel matrix depends primarily on molecular weight [12] [1]. Smaller proteins navigate the porous network more easily and migrate faster, while larger proteins encounter greater frictional resistance and migrate more slowly. This predictable relationship enables accurate molecular weight estimation when protein standards of known sizes are run in parallel.
Multidimensional Separation in Native PAGE
Native PAGE employs a non-denaturing approach that preserves proteins in their folded, functional state. Without SDS to normalize charge and disrupt structure, separation depends on a combination of size, intrinsic charge, and three-dimensional shape [12] [1] [3]. The gel pore size governs the sieving effect based on the hydrodynamic volume of native proteins, while charge dictates their electrophoretic mobility. This multidimensional separation mechanism allows Native PAGE to resolve protein complexes, study oligomerization states, and investigate protein-protein interactions under conditions that maintain biological activity [12] [3].
Table 1: Comparative Analysis of SDS-PAGE vs. Native PAGE Separation Characteristics
| Parameter | SDS-PAGE | Native PAGE |
|---|---|---|
| Separation Basis | Molecular weight only [12] | Size, charge, and shape [12] [1] |
| Protein State | Denatured, linearized polypeptides [12] [1] | Native, folded conformation [12] [3] |
| Gel Pore Size Role | Molecular sieving based on polypeptide chain length | Molecular sieving based on hydrodynamic volume |
| Charge Characteristics | Uniform negative charge from SDS [1] | Intrinsic charge determined by protein sequence and buffer pH |
| Functional Preservation | Enzymatic activity destroyed [12] [6] | Biological activity typically retained [12] [3] |
| Optimal Applications | Molecular weight determination, purity assessment [12] [1] | Protein complexes, oligomeric states, functional studies [12] [3] |
Experimental Data and Methodologies
Gel Percentage Selection for Target Protein Separation
The appropriate polyacrylamide percentage must be carefully matched to the molecular weight range of target proteins to achieve optimal separation. Experimental data demonstrate that different gel percentages provide resolution across distinct molecular weight windows, with lower percentages (8-10%) optimal for high molecular weight proteins and higher percentages (12-15%) providing superior resolution for smaller proteins [1]. Gradient gels (e.g., 4-20% or 8-16%) effectively separate broad molecular weight ranges by continuously varying pore sizes, allowing all proteins to encounter their optimal sieving environment during electrophoresis [1] [19].
Table 2: Optimal Gel Percentages for Protein Separation by Molecular Weight Range
| Gel Percentage | Effective Separation Range (kDa) | Optimal Resolution (kDa) | Pore Size Characteristics |
|---|---|---|---|
| 6-8% | 50-500 | 100-300 | Large pores, minimal sieving of high MW proteins |
| 10% | 20-300 | 40-150 | Moderate pores, standard analytical range |
| 12% | 15-200 | 30-100 | Moderately small pores, common for proteomics |
| 15% | 5-100 | 10-50 | Small pores, optimal for low MW proteins |
| 4-20% Gradient | 10-500 | 15-200 | Continuously variable pores, broadest range |
Experimental Protocol: Standard SDS-PAGE Setup
The following methodology outlines a standard SDS-PAGE procedure for protein separation based on molecular weight, with particular attention to gel matrix preparation [1]:
Gel Solution Preparation: Combine 7.5 mL of 40% acrylamide solution, 3.9 mL of 1% bisacrylamide solution, 7.5 mL of 1.5 M Tris-HCl (pH 8.7 for resolving gel), and water to 30 mL total volume for a 10% Tris-glycine mini gel.
Polymerization Initiation: Add 0.3 mL of 10% ammonium persulfate (APS), 0.3 mL of 10% SDS, and 0.03 mL TEMED to catalyze the polymerization reaction. Pour immediately between glass plates and overlay with water or isopropanol to ensure even formation.
Stacking Gel Addition: Once polymerized, prepare stacking gel with lower acrylamide concentration (typically 4-5%) at pH 6.8 and pour over the resolving gel, inserting well combs immediately.
Sample Preparation: Mix protein samples with SDS-containing sample buffer, often including reducing agents like DTT or β-mercaptoethanol, and heat at 70-100°C for 5-10 minutes to ensure complete denaturation [12] [1].
Electrophoresis Conditions: Load samples into wells and run at constant voltage (typically 150-200V) using MOPS or Tris-glycine-SDS running buffer until the dye front approaches the gel bottom [6] [1].
Modified Electrophoresis Conditions: NSDS-PAGE Protocol
Recent methodological advances have led to the development of Native SDS-PAGE (NSDS-PAGE), which modifies traditional SDS-PAGE conditions to retain protein function while maintaining high resolution [6]. The experimental protocol involves:
Sample Buffer Modification: Omit SDS and EDTA from the sample buffer and eliminate the heating step to preserve native protein structure and metal cofactors [6].
Running Buffer Adjustment: Reduce SDS concentration in the running buffer from the standard 0.1% to 0.0375% and remove EDTA to maintain protein-metal interactions [6].
Electrophoresis Conditions: Perform electrophoresis using standard equipment but maintain lower temperatures (4°C) to further preserve protein native state during separation [6].
Functional Analysis: Recover proteins from gels for activity assays, with experimental data showing seven of nine model enzymes, including four Zn²⁺ proteins, retained activity after NSDS-PAGE compared to complete denaturation in standard SDS-PAGE [6].
Visualization of Separation Mechanisms
The following workflow diagrams illustrate how polyacrylamide pore size governs protein separation in SDS-PAGE versus Native PAGE systems.
Diagram 1: Workflow comparison of SDS-PAGE versus Native PAGE separation mechanisms.
Diagram 2: Impact of gel percentage and pore size on protein separation efficiency.
Research Reagent Solutions for Gel-Based Protein Separation
Successful protein separation using polyacrylamide gels requires specific reagents and materials optimized for electrophoretic applications. The following table details essential components and their functions in gel-based protein separation protocols.
Table 3: Essential Research Reagents for Polyacrylamide Gel Electrophoresis
| Reagent/Material | Function | Application Notes |
|---|---|---|
| Acrylamide-Bis Solution | Forms the crosslinked polymer network that creates the sieving matrix [1] | Typically used at 30-40% stock solutions; concentration determines pore size |
| Ammonium Persulfate (APS) | Free radical initiator for acrylamide polymerization [1] | Fresh preparation recommended; concentration affects polymerization rate |
| TEMED | Catalyst that promotes free radical formation from APS to accelerate polymerization [1] | Added last; quantity controls gel setting time |
| SDS (Sodium Dodecyl Sulfate) | Anionic detergent that denatures proteins and confers uniform charge [12] [1] | Critical for SDS-PAGE; omitted in Native PAGE |
| Tris Buffers | Provides appropriate pH environment for electrophoresis and protein stability [6] [1] | Different pH for stacking (pH 6.8) and resolving (pH 8.8) gels in discontinuous systems |
| DTT or β-Mercaptoethanol | Reducing agents that break disulfide bonds for complete denaturation [12] | Used in SDS-PAGE; typically omitted in Native PAGE to preserve structure |
| Coomassie Blue/SERVAL Blue | Anionic dyes for visualizing protein bands post-electrophoresis [12] [6] | Can be incorporated in Native PAGE buffer systems (BN-PAGE) |
| Molecular Weight Standards | Reference proteins of known size for molecular weight calibration [1] | Essential for accurate MW determination in SDS-PAGE |
Discussion and Technical Considerations
Strategic Selection of Electrophoresis Conditions
The choice between SDS-PAGE and Native PAGE hinges on experimental objectives, with each technique offering distinct advantages and limitations. SDS-PAGE provides superior resolution for molecular weight determination and protein purity assessment but destroys native structure and function [12] [1]. Native PAGE preserves biological activity and protein complexes but offers more complex separation patterns influenced by multiple protein properties [12] [3]. Recent methodological developments like NSDS-PAGE attempt to bridge this gap by maintaining high resolution while preserving some functional characteristics, demonstrating that 98% of Zn²⁺ remained bound to metalloproteins compared to only 26% in standard SDS-PAGE [6].
Gel Matrix Optimization Strategies
Effective protein separation requires careful optimization of gel matrix parameters. For routine analytical applications, 10-12% gels provide satisfactory resolution for most protein mixtures, while gradient gels (e.g., 4-20% or 8-16%) offer superior performance for complex samples with broad molecular weight distributions [1] [19]. The incorporation of specialized buffer systems, such as the use of Coomassie G-250 in Native PAGE, can enhance resolution while maintaining protein function [6]. For specialized applications like metalloprotein analysis, modified protocols that reduce denaturant concentrations while maintaining adequate separation efficiency present promising alternatives to traditional methods [6].
The polyacrylamide gel matrix, with its precisely controllable pore size, remains the cornerstone of protein separation technologies. The critical role of this molecular sieve in governing protein migration cannot be overstated, as it directly determines the resolution and efficacy of both SDS-PAGE and Native PAGE methodologies. By understanding the fundamental relationship between gel composition, pore size, and protein separation mechanisms, researchers can strategically select and optimize electrophoretic conditions to address specific experimental questions. The continuing evolution of gel-based separation techniques, including hybrid approaches that balance resolution with native structure preservation, ensures that polyacrylamide gel electrophoresis will maintain its essential role in protein analysis and biopharmaceutical development.
In the field of protein analysis, polyacrylamide gel electrophoresis (PAGE) serves as a fundamental technique for separating and characterizing complex protein mixtures. Among the various PAGE methodologies, SDS-PAGE (Sodium Dodecyl Sulfate-PAGE) and Native PAGE represent two fundamentally different approaches distinguished primarily by their chemical components. These techniques offer complementary insights—SDS-PAGE denatures proteins to separate them by molecular weight, while Native PAGE preserves native protein structure and function. The distinction between these methods lies substantially in their use of specific buffers, reducing agents, and additives, which directly dictate the type of information that can be obtained from an experiment. This comparison guide provides an objective analysis of the key chemical components in both methods, supported by experimental data, to assist researchers in selecting the appropriate technique for their specific protein analysis requirements within drug development and basic research contexts.
Core Principles and Separation Mechanisms
The fundamental difference between SDS-PAGE and Native PAGE lies in their treatment of protein structure during separation. SDS-PAGE employs the anionic detergent sodium dodecyl sulfate (SDS) to denature proteins and impart a uniform negative charge, resulting in separation based primarily on molecular weight [12] [3] [1]. In contrast, Native PAGE avoids denaturing agents, preserving proteins in their native, folded state, which enables separation based on the protein's intrinsic charge, size, and three-dimensional shape [12] [1]. This critical distinction in approach directly impacts the choice of buffers, additives, and experimental procedures for each method.
The preservation of protein structure in Native PAGE allows for the analysis of functional properties, including enzymatic activity, protein-protein interactions, and quaternary structure [12] [1]. Meanwhile, SDS-PAGE provides superior resolution for molecular weight determination and analysis of protein subunit composition [6] [1]. A hybrid approach, termed NSDS-PAGE (Native SDS-PAGE), has been developed to balance the high resolution of traditional SDS-PAGE with the functional preservation of Native PAGE by significantly modifying standard SDS-PAGE conditions [6].
Table 1: Fundamental Characteristics of SDS-PAGE and Native PAGE
| Characteristic | SDS-PAGE | Native PAGE |
|---|---|---|
| Separation Basis | Molecular weight | Size, charge, and shape |
| Protein State | Denatured | Native/folded |
| Functional Preservation | No | Yes |
| Post-Separation Recovery | Not functional | Functional proteins can be recovered |
| Primary Applications | Molecular weight determination, protein detection, purity assessment | Protein-protein interactions, enzymatic activity studies, oligomeric state analysis |
Comparative Analysis of Chemical Components
The chemical environment defining each electrophoretic method is created through specific combinations of buffers, detergents, and additives. These components work in concert to either denature and uniformly charge proteins (SDS-PAGE) or maintain their native conformation and intrinsic charge (Native PAGE).
Buffer Systems and Composition
Buffer systems in electrophoresis serve to maintain stable pH conditions and provide the ionic environment necessary for protein migration under an electric field. SDS-PAGE typically utilizes Tris-based running buffers, often with MOPS or MES, containing SDS to maintain protein denaturation and charging during separation [6] [1]. For example, a standard SDS-PAGE running buffer contains 50 mM MOPS, 50 mM Tris Base, 1 mM EDTA, and 0.1% SDS at pH 7.7 [6]. Native PAGE employs different buffer systems, such as Bis-Tris and Tricine, without SDS, to preserve protein structure and function [6].
The modified NSDS-PAGE method utilizes a running buffer with significantly reduced SDS content (0.0375% instead of 0.1%) and omits EDTA, creating conditions that maintain protein function while still providing high-resolution separation [6]. Sample buffer composition also differs substantially, with SDS-PAGE sample buffers containing denaturing agents like LDS (lithium dodecyl sulfate) and EDTA, while Native PAGE sample buffers lack these components [6].
Table 2: Buffer Composition Comparison Between Electrophoresis Methods
| Component | SDS-PAGE | Native PAGE | NSDS-PAGE |
|---|---|---|---|
| Running Buffer | 50 mM MOPS, 50 mM Tris Base, 1 mM EDTA, 0.1% SDS, pH 7.7 [6] | Cathode: 50 mM BisTris, 50 mM Tricine, 0.02% Coomassie G-250, pH 6.8; Anode: 50 mM BisTris, 50 mM Tricine, pH 6.8 [6] | 50 mM MOPS, 50 mM Tris Base, 0.0375% SDS, pH 7.7 [6] |
| Sample Buffer | 106 mM Tris HCl, 141 mM Tris Base, 0.51 mM EDTA, 0.22 mM SERVA Blue G-250, 0.175 mM Phenol Red, 2% LDS, 10% Glycerol, pH 8.5 [6] | 50 mM BisTris, 50 mM NaCl, 16 mM HCl, 10% Glycerol, 0.001% Ponceau S, pH 7.2 [6] | 100 mM Tris HCl, 150 mM Tris Base, 10% Glycerol, 0.01875% Coomassie G-250, 0.00625% Phenol Red, pH 8.5 [6] |
| Detergent Content | High (SDS or LDS) | None | Low (SDS omitted from sample buffer, reduced in running buffer) |
Detergents and Denaturing Agents
Detergents represent the most distinctive differentiating component between these methods. SDS-PAGE utilizes the anionic detergent sodium dodecyl sulfate (SDS), which binds to proteins in a constant weight ratio (approximately 1.4 g SDS per 1 g of protein) [1]. This SDS coating denatures proteins by disrupting non-covalent bonds and confers a uniform negative charge that overwhelms the protein's intrinsic charge [12] [1]. The result is that all proteins migrate toward the anode with mobility determined primarily by molecular weight rather than native charge.
Native PAGE intentionally omits denaturing detergents like SDS to preserve protein structure and function [12]. Some Native PAGE variants, particularly Blue Native PAGE (BN-PAGE), use Coomassie Brilliant Blue G-250, which confers a slight negative charge to proteins without causing significant denaturation [12] [6]. Clear Native PAGE (CN-PAGE) avoids dyes altogether, separating proteins based solely on their intrinsic charge in a gradient gel [12].
Reducing Agents and Additives
Reducing agents play a critical role in SDS-PAGE by breaking disulfide bonds to fully denature proteins into their constituent polypeptides. Common reducing agents include β-mercaptoethanol or dithiothreitol (DTT), which are typically added to the sample buffer [12] [5]. The sample preparation process for SDS-PAGE usually involves heating samples to 70-100°C in the presence of these reducing agents to ensure complete denaturation [12] [1].
In contrast, Native PAGE buffers specifically exclude reducing agents to maintain the native protein structure, including disulfide bonds that may be essential for structural integrity [12]. The non-reducing environment preserves non-covalent interactions that maintain protein quaternary structure and complexes [7]. Additives in Native PAGE are limited to those that stabilize native conformations, such as glycerol in sample buffers, which helps maintain protein stability and improve sample loading [6].
Experimental Protocols and Methodologies
Standard SDS-PAGE Protocol
Sample Preparation: Mix protein samples with SDS-PAGE sample buffer containing reducing agents (DTT or β-mercaptoethanol) and denaturing agents (SDS or LDS) [6]. Heat samples at 70-100°C for 10 minutes to ensure complete denaturation [12] [1].
Gel Preparation: Cast polyacrylamide gels with appropriate acrylamide concentration for target protein size range. Lower percentage gels (e.g., 7-10%) separate higher molecular weight proteins better, while higher percentages (e.g., 12-15%) provide better resolution for smaller proteins [1]. Include a stacking gel with lower acrylamide concentration and pH to concentrate proteins before entering the resolving gel.
Electrophoresis: Load prepared samples into wells alongside molecular weight markers. Run gels at constant voltage (typically 150-200V) for 30-60 minutes using MOPS/Tris/SDS running buffer until dye front reaches gel bottom [6].
Post-Electrophoresis Analysis: Visualize proteins using stains (Coomassie, silver stain) or transfer to membranes for western blotting [1]. Proteins can be excised for mass spectrometry analysis but are not functionally active [12].
Standard Native PAGE Protocol
Sample Preparation: Mix protein samples with Native PAGE sample buffer containing no denaturing or reducing agents [6]. Do not heat samples to preserve native structure [12].
Gel Preparation: Cast polyacrylamide gels without SDS or other denaturants. Gradient gels (e.g., 4-16%) are often used to separate protein complexes of varying sizes [6].
Electrophoresis: Load prepared samples into wells. Run gels at constant voltage (typically 150V) for 90-95 minutes using appropriate anode and cathode buffers [6]. Maintain cool temperatures (often 4°C) during separation to prevent denaturation [12].
Post-Electrophoresis Analysis: Visualize proteins using non-denaturing stains. Proteins can be recovered from gels through passive diffusion or electro-elution while retaining function [1]. Activity assays can be performed directly on gel sections [12].
NSDS-PAGE Modified Protocol
Sample Preparation: Mix protein samples with NSDS sample buffer (100 mM Tris HCl, 150 mM Tris base, 10% glycerol, 0.01875% Coomassie G-250, 0.00625% Phenol Red, pH 8.5) without heating [6].
Gel Preparation: Use standard precast Bis-Tris gels but pre-run in double distilled H₂O for 30 minutes to remove storage buffer and unpolymerized acrylamide [6].
Electrophoresis: Run gels at 200V for approximately 45 minutes using NSDS running buffer (50 mM MOPS, 50 mM Tris Base, 0.0375% SDS, pH 7.7) [6].
Post-Electrophoresis Analysis: Proteins can be analyzed for metal content using techniques like laser ablation-inductively coupled plasma-mass spectrometry or for function using activity assays [6].
Research Reagent Solutions
The following table details essential reagents and materials required for implementing each electrophoretic method, along with their specific functions in the experimental process.
Table 3: Essential Research Reagents for Protein Electrophoresis Methods
| Reagent/Material | Function/Purpose | Method Application |
|---|---|---|
| SDS (Sodium Dodecyl Sulfate) | Denatures proteins and imparts uniform negative charge | SDS-PAGE |
| DTT (Dithiothreitol) or β-mercaptoethanol | Reduces disulfide bonds | SDS-PAGE |
| Coomassie Brilliant Blue G-250 | Imparts slight negative charge without complete denaturation | BN-PAGE (Native PAGE variant) |
| Polyacrylamide | Forms porous gel matrix for molecular sieving | All PAGE methods |
| Bis-acrylamide | Cross-linking agent for polyacrylamide gel formation | All PAGE methods |
| TEMED | Catalyzes acrylamide polymerization | All PAGE methods |
| Ammonium Persulfate (APS) | Initiates acrylamide polymerization | All PAGE methods |
| Tris-based Buffers | Maintain stable pH during electrophoresis | All PAGE methods |
| Molecular Weight Markers | Reference standards for size determination | Primarily SDS-PAGE |
| Glycerol | Increases sample density for well loading; stabilizes proteins | All PAGE methods (sample buffer) |
Experimental Data and Performance Comparison
Comparative studies provide quantitative data on the performance characteristics of different electrophoretic methods. Research comparing 1D SDS-PAGE with nondenaturing 2DE for analyzing proteins from human bronchial smooth muscle cells revealed that SDS-PAGE of the supernatant fraction enabled identification of 2552 proteins with percent abundance ranging from 3.5% to 2×10⁻⁴% [20]. Under similar conditions, nondenaturing 2DE identified 4323 proteins with percent abundance ranging from 3.6% to 1×10⁻⁵%, suggesting enhanced sensitivity with the native isoelectric focusing step [20].
The functional preservation achieved through Native PAGE and modified SDS-PAGE methods is substantiated by experimental data. In studies comparing standard SDS-PAGE with NSDS-PAGE, retention of Zn²⁺ bound in proteomic samples increased from 26% to 98% when shifting from standard to modified conditions [6]. Furthermore, seven of nine model enzymes, including four Zn²⁺ proteins subjected to NSDS-PAGE, retained activity, while all nine enzymes were inactive following standard SDS-PAGE [6].
Analysis of protein migration patterns has revealed systematic discrepancies between theoretical molecular weights and observed migration in SDS-PAGE. Large-scale studies creating databases of electrophoretic migration patterns for approximately 10,000 human proteins have highlighted how post-translational modifications and structural features affect protein migration, providing crucial reference data for troubleshooting western blot experiments and characterizing proteoforms [21].
Application Workflows and Decision Pathways
The selection between SDS-PAGE, Native PAGE, or hybrid approaches depends on research objectives, protein characteristics, and desired analytical outcomes. The following diagram illustrates the decision pathway for selecting the appropriate electrophoretic method based on experimental goals:
The comparative analysis of key chemical components in SDS-PAGE and Native PAGE reveals how specific buffers, detergents, and additives fundamentally direct experimental outcomes in protein separation. SDS-PAGE, with its denaturing conditions created by SDS and reducing agents, provides high-resolution separation based primarily on molecular weight, making it ideal for analytical applications requiring precise size determination. Native PAGE, through the omission of denaturants, preserves protein structure and function, enabling the study of protein complexes, interactions, and enzymatic activities. The development of modified methods like NSDS-PAGE demonstrates that the boundary between these approaches is not rigid but can be strategically manipulated to balance resolution with functional preservation. Understanding these chemical foundations allows researchers to make informed decisions about method selection based on their specific protein analysis requirements, ultimately enhancing the reliability and relevance of experimental results in both basic research and drug development applications.
Protocols and Applications: Step-by-Step Methods and Real-World Use Cases
In protein analysis, the choice of electrophoresis method dictates the type of information obtained, with sample preparation being the most critical determinant of success. SDS-PAGE (Sodium Dodecyl Sulfate Polyacrylamide Gel Electrophoresis) and Native PAGE represent two fundamental approaches: one denatures proteins to separate them purely by molecular weight, while the preserves their native structure to study function and complexes [3] [22]. This guide provides a detailed, objective comparison of their sample preparation protocols, enabling researchers to select and optimize the correct method for their specific application, whether it involves determining molecular weight, analyzing purity, or investigating active protein complexes and interactions.
Core Principles and Objectives
The underlying principles of SDS-PAGE and Native PAGE are diametrically opposed, leading to their distinct applications in research and drug development.
SDS-PAGE: Separation by Molecular Weight
In SDS-PAGE, the anionic detergent sodium dodecyl sulfate (SDS) plays a pivotal role. It denatures proteins by binding to the polypeptide backbone and confers a uniform negative charge, effectively masking the protein's intrinsic charge [23] [22]. The addition of reducing agents like β-mercaptoethanol or DTT breaks disulfide bonds, fully dissociating protein subunits [23] [24]. This process ensures that the charge-to-mass ratio is nearly identical for all proteins, resulting in separation based almost exclusively on polypeptide chain length and molecular weight [23] [22]. Consequently, SDS-PAGE is the method of choice for determining protein purity, estimating molecular weight, and analyzing subunit composition in a denatured state.
Native PAGE: Preservation of Native Structure
Native PAGE is a non-denaturing technique. Proteins are prepared in buffers without SDS or reducing agents, allowing them to maintain their secondary, tertiary, and quaternary structures, as well as their intrinsic biological activity [25] [12] [22]. Separation depends on the protein's native charge, size, and three-dimensional shape as it migrates through the gel matrix [22] [26]. This preservation enables the study of functional properties, making Native PAGE ideal for investigating protein-protein interactions, oligomerization states, enzymatic activity, and the composition of native protein complexes [3] [27].
Detailed Sample Preparation Protocols
The following section outlines the specific, step-by-step protocols for preparing protein samples for each method. Adherence to these protocols is essential for generating reliable and reproducible results.
SDS-PAGE Sample Preparation Protocol
The goal of SDS-PAGE sample prep is complete denaturation and linearization of proteins.
Step 1: Prepare Sample Buffer. The loading buffer is typically a 2X or 5X concentrated solution. A common 5X formulation contains: 10% (w/v) SDS for denaturation and charge masking, 10 mM Dithiothreitol (DTT) or β-mercaptoethanol (e.g., 1 µL per 25 µL lysate) to reduce disulfide bonds, 20% (v/v) Glycerol to add density for gel loading, 0.2 M Tris-HCl, pH 6.8 to maintain pH, and 0.05% (w/v) Bromophenol Blue as a tracking dye [23] [24] [28].
Step 2: Mix Sample with Buffer. The protein sample should be mixed with an equal volume of 2X sample buffer [23]. The final protein concentration should be sufficiently high for detection, typically resulting in a load of 0.5 µg to 20 µg per lane, depending on gel size and detection method [23] [28].
Step 3: Denature by Heating. A critical denaturation step involves heating the samples at 95-100°C for 5-10 minutes in a heating block or boiling water bath [23] [24] [28]. This heat treatment ensures complete unfolding and SDS binding.
Step 4: Clarify by Centrifugation. After heating, samples should be briefly centrifuged (e.g., 3 minutes in a microcentrifuge) to pellet any insoluble debris, and the supernatant is loaded into the gel [23].
Native PAGE Sample Preparation Protocol
The goal of Native PAGE sample prep is to maintain the protein's native conformation.
Step 1: Prepare Non-Denaturing Sample Buffer. A typical 2X native sample buffer contains: 62.5 mM Tris-HCl, pH 6.8, 25% Glycerol for density, and 1% Bromophenol Blue as a tracking dye [25]. Crucially, it lacks SDS, DTT, and other reducing agents [25] [12].
Step 2: Mix Sample with Buffer Gently. The protein sample is mixed with an equal volume of the native sample buffer. This step should be performed gently to minimize shear forces and avoid foaming, which could denature the protein [25].
Step 3: Omit Heating. Do not heat the samples [25]. Heating is a denaturing step and would defeat the purpose of Native PAGE. Samples are kept on ice or at 4°C to preserve activity.
Step 4: Load and Run at Cool Temperatures. To further prevent denaturation during electrophoresis, the gel apparatus is often run at 4°C and at lower voltages to minimize heat generation [12] [26].
Comparative Analysis: Key Differences at a Glance
The table below provides a consolidated, direct comparison of the critical parameters differentiating SDS-PAGE and Native PAGE sample preparation.
Table 1: Direct Comparison of SDS-PAGE and Native PAGE Sample Preparation
| Parameter | SDS-PAGE | Native PAGE |
|---|---|---|
| Detergent | SDS present (0.1-2%) [24] [22] | No SDS [12] |
| Reducing Agent | DTT or β-mercaptoethanol present [23] [24] | No reducing agent [12] |
| Heating Step | Required (95-100°C for 5-10 min) [23] [28] | Not performed [25] [12] |
| Separation Basis | Molecular weight [23] [22] | Size, charge, and shape [12] [22] |
| Protein State | Denatured and linearized [22] | Native, folded conformation [22] |
| Protein Function | Lost [3] [12] | Retained [3] [22] |
| Typical Running Temperature | Room Temperature [12] | 4°C [12] [26] |
| Post-Electrophoresis Protein Recovery | Not feasible in functional form [12] | Possible, proteins can be electro-eluted for activity assays [22] |
Supporting Experimental Data and Hybrid Approaches
Experimental data underscores the functional consequences of these preparation methods. A study comparing standard SDS-PAGE with a modified "Native SDS-PAGE" (NSDS-PAGE) demonstrated that by removing SDS and EDTA from the sample buffer and omitting the heating step, retention of bound metal ions in zinc proteins increased dramatically from 26% to 98% [6]. Furthermore, enzymatic activity assays showed that seven out of nine model enzymes remained active after NSDS-PAGE, whereas all nine were denatured and inactivated by standard SDS-PAGE conditions [6]. This highlights the direct impact of sample preparation on functional preservation.
Table 2: Quantitative Impact of Sample Preparation on Protein Functionality
| Electrophoresis Method | Sample Preparation Key Features | Zinc Retention in Proteome | Enzymatic Activity Retention |
|---|---|---|---|
| SDS-PAGE | SDS, EDTA, Heating | ~26% | 0/9 Model Enzymes |
| BN-PAGE | No SDS, Coomassie Dye, No Heat | Not Specified | 9/9 Model Enzymes |
| NSDS-PAGE | No SDS/EDTA in Sample, No Heat | ~98% | 7/9 Model Enzymes |
The Scientist's Toolkit: Essential Reagents and Materials
Successful execution of these protocols requires specific reagents. The following table lists key solutions and their functions.
Table 3: Essential Research Reagent Solutions for PAGE Sample Preparation
| Reagent Solution | Core Function | Key Components |
|---|---|---|
| SDS-PAGE Sample Buffer (2X/5X) | Denatures proteins, imparts uniform charge, allows visualization [23] [24] | SDS, Reducing Agent (DTT/BME), Glycerol, Tris-HCl, Bromophenol Blue |
| Native PAGE Sample Buffer (2X) | Maintains native state, provides density for loading [25] | Tris-HCl, Glycerol, Bromophenol Blue |
| SDS-PAGE Running Buffer | Conducts current, maintains SDS saturation [23] [24] | Tris, Glycine, SDS (0.1%) |
| Native PAGE Running Buffer | Conducts current in non-denaturing conditions [25] | Tris, Glycine |
| Blue Native (BN) PAGE Sample Buffer | Solubilizes protein complexes, imparts negative charge with dye [6] [27] | Aminocaproic Acid, Bis-Tris, Detergent (e.g., Lauryl Maltoside), Coomassie Blue G-250 |
Workflow and Decision Pathway
The following diagram summarizes the critical decision points in sample preparation, leading to the appropriate protocol for either SDS-PAGE or Native PAGE.
The choice between denaturation for SDS-PAGE and native state preservation is fundamental and dictated by the scientific question. SDS-PAGE, with its stringent denaturation and reduction, is an unparalleled tool for determining molecular weight and assessing sample homogeneity. In contrast, Native PAGE provides a unique window into the functional proteome, enabling the study of proteins in their biologically active state. By understanding and meticulously applying the distinct sample preparation protocols outlined in this guide, researchers can effectively harness the power of each technique to advance their research in biochemistry, molecular biology, and drug development.
In protein analysis, the resolution and reliability of results are fundamentally rooted in the initial gel casting process. The meticulous formulation of resolving and stacking gels within polyacrylamide gel electrophoresis (PAGE) is not merely a preparatory step but a critical determinant of experimental success. Within the broader context of comparing SDS-PAGE and native PAGE, the design of the gel matrix dictates the physical principle upon which separation occurs—either purely by molecular weight or by a complex interplay of charge, size, and shape. This guide provides a detailed, objective comparison of gel casting procedures, delivering the protocols and data necessary for researchers and drug development professionals to optimize protein separation for their specific analytical needs.
Core Principles: SDS-PAGE vs. Native PAGE
The choice between SDS-PAGE and native PAGE dictates every subsequent decision in gel formulation, as each technique operates on a different separation principle.
SDS-PAGE (Denaturing Conditions): This method separates proteins based almost exclusively on molecular weight. The anionic detergent sodium dodecyl sulfate (SDS) denatures proteins and binds to the polypeptide backbone in a constant weight ratio, imparting a uniform negative charge density. A reducing agent, such as dithiothreitol (DTT) or β-mercaptoethanol, is added to break disulfide bonds, ensuring complete denaturation into individual subunits. Consequently, the intrinsic charge of the polypeptide becomes insignificant, and all SDS-bound proteins migrate through the gel toward the anode, with smaller proteins moving faster than larger ones [1] [29] [30].
Native-PAGE (Non-Denaturing Conditions): This technique separates proteins according to the net charge, size, and shape of their native structure. Without denaturants, proteins retain their higher-order structure (quaternary and tertiary). In alkaline running buffers, most proteins carry a net negative charge and migrate toward the anode. The gel matrix creates a sieving effect, where the frictional force regulates movement based on the protein's size and three-dimensional shape [1]. This method is ideal for studying functional protein complexes, enzymatic activity, and protein-protein interactions, as native structure is preserved [1].
The following workflow outlines the key decision points and procedures for casting gels for both techniques:
Gel Formulation and Experimental Protocols
The physical structure of the gel, defined by the concentrations of acrylamide and bisacrylamide, is the primary factor controlling pore size and thus resolving power.
SDS-PAGE Gel Recipe and Casting Protocol
A standard protocol for casting a discontinuous SDS-PAGE gel for four 0.75-mm thick gels is detailed below [31].
Table 1: SDS-PAGE Gel Recipe for Four 0.75-mm Gels
| Component | Amount for X % Resolving Gel | Amount for Stacking Gel |
|---|---|---|
| Acrylamide, 30% | (0.5 x X) mL | 1.98 mL |
| Tris, 1.5 M, pH 8.8 | 3.75 mL | 0 mL |
| Tris, 0.5 M, pH 6.8 | 0 mL | 3.78 mL |
| SDS, 10% w/v | 150 µL | 150 µL |
| H₂O | (11.02 – (0.5 x X)) mL | 9 mL |
| TEMED | 7.5 µL | 15 µL |
| APS, 10% w/v | 75 µL | 75 µL |
| Total Volume | 15 mL | 15 mL |
10-Step Gel Casting Protocol [31]:
- Assemble Equipment: Clean glass plates and assemble the casting cassette.
- Prepare Gel Solutions: Mix resolving and stacking gel components in separate beakers, omitting APS and TEMED initially.
- Initiate Resolving Gel Polymerization: Add APS and TEMED to the resolving gel mixture and mix gently.
- Pour Resolving Gel: Immediately pour the mixture into the cassette, leaving space for the stacking gel.
- Overlay with Isopropanol: Gently add isopropanol on top to create a flat, smooth interface. Polymerize for 30-45 minutes.
- Remove Overlay: Pour off isopropanol and wipe residual liquid with a lint-free tissue.
- Initiate Stacking Gel Polymerization: Add APS and TEMED to the stacking gel mixture and mix.
- Pour Stacking Gel: Pour the stacking gel on top of the polymerized resolving gel.
- Insert Comb: Place the comb into the stacking gel, avoiding bubbles. Allow to polymerize fully.
- Remove Comb: Carefully remove the comb vertically to prevent well distortion.
The percentage of the resolving gel must be matched to the molecular weight of the target proteins for optimal resolution.
Table 2: Resolving Gel Percentage for Target Protein Sizes [31]
| Size of Protein (kDa) | % Acrylamide in Resolving Gel |
|---|---|
| 4 - 40 | 20% |
| 12 - 45 | 15% |
| 10 - 70 | 12.5% |
| 15 - 100 | 10% |
| 25 - 200 | 8% |
Native PAGE Gel Formulation
For native PAGE, the gel formulation is typically simpler, often consisting of a single resolving gel without a stacking gel, though discontinuous systems can be used [1]. The key difference is the absence of SDS in both the gel matrix and the running buffer. The gel percentage is chosen based on the size of the native protein or complex, as shown below. It is crucial to avoid pH extremes and keep the apparatus cool to maintain protein integrity and activity [1].
Table 3: Recommended Polyacrylamide Percentages for Non-Denaturing Gels (for double-stranded nucleic acids or native proteins) [32]
| Polyacrylamide Gel % (bis, 19:1) | Range of Efficient Separation (bp for DNA) |
|---|---|
| 3.5 | 100 - 1,000 |
| 5.0 | 80 - 500 |
| 8.0 | 60 - 400 |
| 12.0 | 50 - 200 |
| 15.0 | 25 - 150 |
| 20.0 | 5 - 100 |
The Scientist's Toolkit: Essential Research Reagents
Successful gel casting and electrophoresis rely on a specific set of high-quality reagents and equipment.
Table 4: Essential Materials for Gel Casting and Electrophoresis
| Item | Function |
|---|---|
| Acrylamide/Bis-acrylamide | Forms the cross-linked polymer network (gel matrix) that acts as a molecular sieve. The ratio and total concentration determine pore size [1] [32]. |
| Ammonium Persulfate (APS) | Initiator that provides free radicals to catalyze the polymerization of acrylamide and bis-acrylamide [1] [31]. |
| TEMED | Catalyst that accelerates the polymerization reaction by promoting free radical production from APS [1] [31]. |
| Tris-HCl Buffer | Maintains a stable pH during electrophoresis. Different pH levels (8.8 for resolving, 6.8 for stacking) are critical for the discontinuous buffer system [31]. |
| Sodium Dodecyl Sulfate (SDS) | Ionic detergent that denatures proteins and confers a uniform negative charge, allowing separation by mass alone in SDS-PAGE [1] [30]. |
| Vertical Gel Electrophoresis System | Apparatus that holds the gel cassette vertically in buffer tanks and allows application of an electrical current [33] [30]. |
| Power Supply | Provides the controlled electrical current (constant voltage/current/power) required to drive protein migration through the gel [33]. |
Troubleshooting Common Gel Casting and Running Issues
Even with precise protocols, issues can arise. The table below outlines common problems and their solutions.
Table 5: Troubleshooting Common SDS-PAGE Issues [34]
| Issue | Possible Explanation | Troubleshooting Suggestion |
|---|---|---|
| Smeared Bands | Voltage too high. | Run gel at 10-15 V/cm; use lower voltage for a longer time. |
| "Smiling" Bands | Excessive heat generation during run. | Run gel in a cold room, use ice packs, or lower the voltage. |
| Poor Resolution | Gel run time too short; uneven gel concentration; improper buffer. | Run until dye front nears bottom; ensure proper gel mixing and buffer preparation. |
| Edge Effect | Empty wells at the periphery of the gel. | Load ladders or dummy samples in empty edge wells. |
| Diffused Samples | Lag between loading and running. | Start electrophoresis immediately after loading the last sample. |
Advances in Gel Casting Technology
Innovation in gel casting technology focuses on improving efficiency, safety, and consistency. Traditional hand-casting, while cost-effective, is time-consuming (up to 90 minutes) and involves handling neurotoxic monomers [31] [35].
Newer systems, such as the mPAGE Lux Casting System, offer a streamlined alternative. This system uses a one-step process with UV irradiation and Bis-Tris chemistry, reducing total casting time from 90 minutes to 90 seconds—a 97% reduction. It also minimizes the use of hazardous chemicals like TEMED and APS and reduces plastic waste by approximately 26% per gel, supporting more sustainable lab practices while maintaining high-resolution results [35].
In the comparative analysis of protein samples, the choice between sodium dodecyl sulfate-polyacrylamide gel electrophoresis (SDS-PAGE) and native PAGE represents a fundamental methodological crossroads. Each technique provides distinct insights into protein characteristics, but their successful application hinges on the precise optimization of running conditions [3]. Voltage, temperature, and buffer systems collectively determine the resolution, integrity, and biological relevance of the separated proteins. This guide provides a systematic comparison of these critical parameters, enabling researchers to select and fine-tune conditions appropriate for their specific analytical goals, whether determining molecular weight with SDS-PAGE or investigating native structure and function with native PAGE.
Fundamental Principles: SDS-PAGE vs. Native PAGE
The foundational difference between these electrophoretic methods dictates their respective applications and optimization requirements.
SDS-PAGE employs the ionic detergent sodium dodecyl sulfate (SDS) to denature proteins, bind to them in a constant weight ratio, and impart a uniform negative charge [3] [1]. This process masks proteins' intrinsic charge and eliminates the influence of shape, resulting in separation based almost exclusively on molecular mass [36]. Consequently, SDS-PAGE is ideal for determining protein purity, subunit composition, and molecular weight, but it destroys native functional properties, including enzymatic activity and protein-protein interactions [3] [6].
Native PAGE maintains proteins in their natural, folded state by omitting denaturing agents [3]. Separation occurs based on a combination of the protein's intrinsic charge, size, and three-dimensional shape [1]. This preservation of native structure allows researchers to study functional properties such as enzymatic activity, oligomeric state, and protein-complex interactions [3] [6]. A key limitation is that a protein's migration distance is not solely dependent on its mass, complicating simple molecular weight estimation [36].
Optimizing Voltage and Temperature Regimens
The application of electrical current generates heat, which must be carefully managed as it is a double-edged sword in both techniques [37].
The Interplay of Electrical Parameters and Heat
Ohm's Law (V = I × R) defines the relationship between voltage (V), current (I), and resistance (R) during electrophoresis [37] [38]. Power (P, in watts), a direct measure of heat production, is calculated as P = I × V [37]. Excessive Joule heating causes gel deformation, uneven running bands ("smiling" bands), and in severe cases, can render the gel useless for downstream analysis [37] [38] [36]. While some heat can aid in denaturing incompletely unfolded proteins in SDS-PAGE, it is generally detrimental to both techniques [37].
Practical Settings and Modalities
Most modern power supplies allow separation to be run under constant voltage, constant current, or constant power. The choice involves a trade-off between run time, band sharpness, and heat production [38].
- Constant Voltage: As resistance increases during the run, the current and power decrease, leading to reduced heat generation and greater safety [37] [38]. The downside is that protein migration slows over time, potentially resulting in longer run times and more diffuse bands [38]. This modality allows multiple electrophoresis chambers to be run simultaneously from a single power pack [38].
- Constant Current: This setting maintains a constant protein migration rate, enabling precise run-time prediction and often producing sharper bands due to shorter run times [38]. The significant disadvantage is that voltage and power must increase to compensate for rising resistance, creating a risk of excessive heat buildup that can boil the buffer and damage the gel [37] [38]. Running the apparatus in a cold room or with an ice bath is often necessary to mitigate this [37] [38].
- General Guidelines: A common strategy, particularly for SDS-PAGE, is to start with a low voltage (e.g., 50-60 V) for the first 30 minutes to allow proteins to stack at the interface between the stacking and resolving gels, then increase the voltage (e.g., 100-150 V for mini-gels) for the remainder of the separation [37] [39]. A rule of thumb is to apply 5-15 V per centimeter of gel length [37].
Table 1: Comparison of Electrical Running Conditions
| Parameter | Constant Current | Constant Voltage | Constant Power |
|---|---|---|---|
| Primary Effect | Maintains migration rate | Maintains electrical "pressure" | Maintains heat production |
| Pros | Predictable run time; sharper bands [38] | Safer; less heat; multiple units can be run [38] | Heat production remains stable [37] |
| Cons | High risk of overheating; may need cooling [37] [38] | Slowing migration; longer runs; diffuse bands [38] | Unpredictable migration; hard to define "constant" conditions [37] |
| Recommended Use | When run time consistency is critical, with cooling | For routine, safe operation, especially with multiple gels | When minimizing heat variation is the highest priority |
Buffer System Design and Optimization
The buffer system is the chemical environment that governs protein mobility and separation quality.
The Discontinuous Buffer System
Both SDS-PAGE and native PAGE typically use a discontinuous (or disc) buffer system, which employs different ions and pH in the stacking and resolving gels to dramatically enhance resolution [40] [1]. This system concentrates protein samples into extremely sharp bands before they enter the resolving gel, creating a fine starting line for separation [40] [1]. The primary advantage of this system is its ability to enhance the resolution of separation [40].
In a standard Tris-Glycine system for SDS-PAGE:
- Chloride ions (from the gel buffer) act as highly mobile leading ions.
- Glycine ions (from the running buffer) function as trailing ions in the stacking gel (pH ~6.8) but become more mobile in the resolving gel (pH ~8.8).
- Tris base provides a common cation throughout the system [39]. This arrangement creates a voltage gradient that stacks proteins into a thin zone, which is then unstacked and separated by size in the resolving gel.
Buffer Composition Across Techniques
Buffer composition is a major differentiator between the two techniques, primarily due to the presence or absence of SDS.
Table 2: Key Buffer and Sample Preparation Components
| Component | Role in SDS-PAGE | Role in Native PAGE |
|---|---|---|
| SDS (Detergent) | Denatures proteins and confers uniform negative charge [1]. | Omitted to preserve native structure [3]. |
| Reducing Agents (e.g., DTT) | Breaks disulfide bonds for full denaturation [39]. | Typically omitted to preserve quaternary structure [36]. |
| Sample Heating | Required (e.g., 85°C for 2 minutes) to denature proteins [39]. | Not performed, as it would cause denaturation [39]. |
| Coomassie Dye (G-250) | Not a standard component in running buffer. | Added to running buffer (e.g., in BN-PAGE) to confer charge on native proteins [6] [9]. |
Advanced variations exist, such as Native SDS-PAGE (NSDS-PAGE), which seeks a middle ground. This method uses drastically reduced SDS concentrations (e.g., 0.0375% in the running buffer) and omits the heating step and EDTA from the sample buffer. This protocol can allow for high-resolution separation while retaining enzymatic activity and bound metal ions for many proteins [6].
Experimental Protocols for Reproducible Results
Protocol: Standard SDS-PAGE (Denaturing)
This protocol is adapted for a standard mini-gel format [39].
- Sample Preparation: Mix protein sample with 2X Tris-Glycine SDS Sample Buffer. For reduced conditions, add a reducing agent like DTT to a final 1X concentration. Heat the sample at 85°C for 2 minutes [39].
- Gel Setup: Rinse the wells of a pre-cast gel with running buffer. Place the gel cassette into the chamber.
- Buffer Loading: Fill the inner and outer chambers with 1X Tris-Glycine SDS Running Buffer.
- Loading: Load the prepared samples and protein molecular weight markers into the wells.
- Electrophoresis: Run the gel at a constant voltage of 125 V. Expect an initial current of 30-40 mA per gel, decreasing to 8-12 mA by the end. Run until the dye front reaches the bottom of the gel (approximately 90 minutes) [39].
- Downstream Analysis: Proceed to stain the gel for total protein visualization or transfer the proteins to a membrane for western blotting.
Protocol: Blue Native PAGE (BN-PAGE)
BN-PAGE is a common type of native PAGE used for analyzing protein complexes [9].
- Sample Preparation (Cell Lysis): Lyse cells in a native-compatible buffer (e.g., 25 mM BisTris-HCl, 20% glycerol, pH 7.0) containing a mild detergent like dodecyl maltoside to solubilize membrane complexes. Centrifuge to remove insoluble debris [9].
- Sample Buffer: Mix the protein supernatant with a BN sample buffer (e.g., containing 5% Coomassie G-250 dye) [9].
- Gel Setup: Use a native gradient gel (e.g., 4-16% acrylamide).
- Buffer System: Use a specialized anode buffer (50 mM BisTris-HCl, pH 7.0) and cathode buffer (50 mM Tricine, 15 mM BisTris, 0.01% Coomassie G-250). Keep buffers chilled [9].
- Electrophoresis: Run at a constant voltage of 150V (or lower, e.g., 100V for the first 30% of the run, then 250V for the remainder) for 1-2 hours at 4°C to manage heat [6] [9].
- Detection: After electrophoresis, proteins can be visualized or subjected to in-gel activity assays to confirm functionality [6].
The Scientist's Toolkit: Essential Reagent Solutions
Successful electrophoresis relies on a set of core reagents, each with a specific function.
Table 3: Essential Research Reagent Solutions
| Reagent / Material | Function | Key Consideration |
|---|---|---|
| Acrylamide/Bis-acrylamide | Forms the porous gel matrix that sieves proteins during separation [1]. | Pore size is inversely related to percentage; gradient gels broaden separation range [1] [36]. |
| Ammonium Persulfate (APS) & TEMED | Catalyzes the polymerization of acrylamide to form a cross-linked gel [1]. | Must be fresh; TEMED is toxic and should be handled in a fume hood. |
| SDS (Sodium Dodecyl Sulfate) | Ionic detergent that denatures proteins and confers a uniform negative charge [1]. | Critical for SDS-PAGE; omitted in native PAGE. |
| Tris-based Buffers | Provides the pH environment necessary for electrophoresis and the discontinuous ion system [39]. | pH is critical for the stacking effect in discontinuous systems [40]. |
| DTT or β-Mercaptoethanol | Reducing agents that break disulfide bonds to ensure complete protein denaturation [39]. | Added fresh just before heating the sample. |
| Coomassie G-250 Dye | In BN-PAGE, binds to proteins to confer a negative charge without significant denaturation [6] [9]. | Different from Coomassie R-250 used for staining. |
| Glycerol | Adds density to the sample buffer to help it sink into the well [6] [39]. | Included in both SDS and native sample buffers. |
| Protein Molecular Weight Markers | A set of proteins of known size run alongside samples to calibrate and estimate molecular weights [1]. | Pre-stained markers allow real-time tracking of migration. |
Decision Workflow and Comparative Analysis
The following diagram illustrates the logical decision-making process for selecting and optimizing an electrophoretic method based on research objectives.
SDS-PAGE and native PAGE are complementary pillars of protein analysis, whose efficacy is entirely dependent on appropriate running conditions. SDS-PAGE, optimized with denaturing buffers and careful heat management, provides unmatched precision for molecular weight determination and purity assessment. In contrast, native PAGE, utilizing non-denaturing buffers and cooler running temperatures, opens a window into the functional proteome, preserving complexes and activities. The emerging methodology of NSDS-PAGE demonstrates that the boundary between these techniques is not rigid, offering a promising hybrid approach [6]. By systematically applying the voltage, temperature, and buffer optimizations outlined in this guide, researchers can confidently select and refine the electrophoretic conditions that will yield the most biologically relevant and high-quality data for their specific investigative needs.
Within the broader framework of comparing SDS-PAGE and native PAGE for protein analysis, the critical step following electrophoresis is the visualization of the separated proteins. The choice of staining technique directly impacts the sensitivity, dynamic range, and compatibility with downstream analyses, all of which are pivotal for researchers and drug development professionals. This guide provides an objective comparison of the most common protein gel staining methods—Coomassie, silver, and fluorescent staining—summarizing their performance characteristics and providing foundational experimental protocols to inform your analytical strategy.
Staining Technique Performance Comparison
The selection of a staining method is a trade-off between sensitivity, ease of use, and compatibility with subsequent protein characterization. The table below summarizes the key performance metrics of the three primary techniques.
| Staining Method | Sensitivity (ng per band) | Typical Protocol Time | Dynamic Range | Compatibility with Downstream Applications | Key Advantages | Main Limitations |
|---|---|---|---|---|---|---|
| Coomassie Staining [41] [42] | 5 - 25 ng [41] | 10 - 135 min [41] | Medium [43] | Mass spectrometry, sequencing, western blotting (non-fixative methods) [41] | Simple, affordable, reversible staining [41] [42] | Lower sensitivity; bias towards basic/hydrophobic proteins [43] |
| Silver Staining [41] [44] [45] | 0.1 - 0.5 ng [41] [44] [45] | 30 - 120 min [41] | Narrow [45] | Mass spectrometry (only specific, aldehyde-free protocols) [41] [45] | Highest sensitivity of colorimetric methods [41] [45] | Complex protocol; high background risk; protein cross-linking with aldehydes [45] |
| Fluorescent Staining [41] | 0.25 - 0.5 ng [41] | ~60 min [41] | Broad linear dynamic range [41] | Mass spectrometry, western blotting [41] | High sensitivity; broad dynamic range; minimal background [41] [43] | Requires specialized imaging equipment; dyes can be expensive [41] [42] |
Detailed Staining Methodologies
Coomassie Blue Staining
Coomassie staining is the most widely used method due to its simplicity and robustness. It relies on the binding of Coomassie Brilliant Blue dye to proteins primarily through ionic interactions with positive amine groups and Van der Waals forces [42]. The dye shifts from a dull reddish-brown to an intense blue upon protein binding in acidic conditions [41].
Key Protocol Steps (for R-250) * [46] [47]:*
- Water Wash: Rinse the gel with deionized water to remove SDS and electrophoresis buffers that interfere with dye binding [41] [46].
- Staining: Incubate the gel in staining solution (e.g., 0.1% Coomassie R-250 in 40% ethanol, 10% acetic acid) for at least 1 hour at room temperature with gentle agitation [46] [47].
- Destaining: Remove excess dye by washing the gel in a destaining solution (e.g., 10% ethanol, 7.5% acetic acid) until the background is clear and protein bands are sharply visible [46] [47].
Variants of Coomassie Dye: The choice between R-250 and G-250 is important [42]:
- Coomassie R-250: The traditional variant requiring both staining and destaining steps.
- Colloidal Coomassie G-250: Often formulated for faster staining and can eliminate the need for destaining, as the dye colloid does not penetrate the gel background [41] [42].
Silver Staining
Silver staining is a colorimetric technique where metallic silver is deposited onto proteins in the gel. The principle involves silver ions (Ag⁺) binding to functional groups on proteins (e.g., carboxylic acids from Asp/Glu, imidazoles from His, sulfhydryls from Cys, and amines from Lys), followed by reduction to metallic silver (Ag) using a developer [41] [45]. This process provides extremely high sensitivity.
Key Protocol Steps * [45]:*
- Fixation: Incubate the gel in a solution (e.g., 50% methanol, 10% acetic acid) to immobilize proteins and remove interfering substances [45].
- Sensitization: Treat the gel with a sensitizer like sodium thiosulfate to enhance subsequent silver binding and sensitivity [45].
- Silver Impregnation: Soak the gel in a silver nitrate solution (typically 0.1%) to allow silver ions to bind to proteins [45].
- Development: Rinse the gel briefly and then place it in a developing solution (containing formaldehyde and sodium carbonate). Reduce silver ions to metallic silver until protein bands reach desired intensity [45].
- Stop: Halt the development by transferring the gel to a stopping solution (e.g., 5% acetic acid) [45].
Critical Consideration for Mass Spectrometry: Traditional silver staining protocols using glutaraldehyde or formaldehyde for sensitization cause protein cross-linking, making them incompatible with mass spectrometry (MS). For MS compatibility, specialized kits or protocols that omit these aldehydes and use alternatives like tetrathionate and thiosulfate must be employed [45].
The Scientist's Toolkit: Essential Reagents and Solutions
The following table lists key reagents required for executing the staining protocols discussed.
| Reagent / Solution | Function / Purpose | Example Formulation / Note |
|---|---|---|
| Coomassie Stain (R-250) [46] [47] | Binds proteins for visualization. | 0.1% Coomassie R-250, 40% ethanol, 10% acetic acid [46] [47]. |
| Destaining Solution [46] [47] | Removes unbound dye to clear background. | 10% ethanol, 7.5% acetic acid, or water for colloidal Coomassie [46]. |
| Fixation Solution (Silver Stain) [45] | Immobilizes proteins; removes interferents. | 50% methanol, 10% acetic acid [45]. |
| Sensitizer (Silver Stain) [45] | Enhances silver binding and staining sensitivity. | Sodium thiosulfate solution [45]. |
| Silver Nitrate Solution [45] | Source of silver ions (Ag⁺) for protein binding. | Typically 0.1% concentration [45]. |
| Developing Solution (Silver Stain) [45] | Reduces bound Ag⁺ to metallic silver (Ag). | Contains formaldehyde and sodium carbonate [45]. |
| SYPRO Ruby / Orange [41] [43] | Fluorescent dyes for high-sensitivity protein detection. | Requires fluorescence scanner or imager for visualization [41] [43]. |
Selecting the optimal staining technique for post-electrophoresis analysis requires balancing analytical needs with practical constraints. Coomassie staining offers simplicity and cost-effectiveness for abundant proteins. Silver staining provides ultra-high sensitivity for detecting trace amounts but demands meticulous technique. Fluorescent staining delivers an excellent combination of sensitivity and a wide dynamic range, though it requires specialized instrumentation. By aligning the performance characteristics of each method with your experimental goals within the SDS-PAGE vs. native PAGE framework, you can ensure efficient and reliable protein analysis.
Sodium Dodecyl Sulfate-Polyacrylamide Gel Electrophoresis (SDS-PAGE) stands as a cornerstone technique in modern biochemistry and molecular biology laboratories for analyzing complex protein mixtures. This method provides researchers with a powerful tool for separating proteins based on their molecular weight, enabling critical insights into protein composition, purity, and expression levels. The fundamental principle of SDS-PAGE relies on the uniform binding of the anionic detergent SDS to protein molecules, which masks their intrinsic charges and denatures them into linear chains. This process ensures that separation during electrophoresis occurs primarily according to molecular size rather than charge or structural conformation [3] [48].
The significance of SDS-PAGE extends across numerous research domains, from basic protein characterization to quality control in biopharmaceutical development. Its universal adoption stems from its high resolution, reproducibility, and relative simplicity compared to alternative techniques. When positioned within the broader context of protein electrophoresis methods, SDS-PAGE serves as a denaturing counterpart to Native PAGE, which preserves protein structure and function during separation. Understanding the distinct applications and limitations of these complementary techniques enables researchers to select the optimal approach for their specific experimental goals, whether investigating protein size and purity or studying native conformation and functional interactions [3] [12].
Fundamental Principles of SDS-PAGE
Core Mechanism of Protein Separation
The analytical power of SDS-PAGE stems from two interconnected mechanisms: charge uniformity and molecular sieving. SDS, an anionic detergent, binds to hydrophobic regions of proteins at a consistent ratio of approximately 1.4g SDS per 1g of protein. This extensive binding accomplishes two critical functions: it disrupts nearly all non-covalent bonds (including hydrogen, hydrophobic, and ionic bonds) that maintain protein structure, effectively denaturing proteins into random coils; and it confers a uniform negative charge density along the polypeptide backbone. This charge standardization negates the influence of intrinsic protein charge, ensuring that migration through the gel matrix depends almost exclusively on molecular size [49] [48].
The polyacrylamide gel matrix serves as a molecular sieve that physically separates proteins based on their hydrodynamic size. The gel forms through the polymerization of acrylamide monomers cross-linked by N,N'-methylenebisacrylamide (Bis), creating a porous network with pore sizes determined by the concentrations of these components. Under an applied electric field, smaller protein-SDS complexes navigate through the gel pores more readily than larger complexes, resulting in differential migration rates that correlate with molecular weight. This relationship enables molecular weight estimation by comparing protein migration distances to those of standard proteins with known masses [50] [48].
The Discontinuous Buffer System
SDS-PAGE employs a discontinuous (or disc) buffer system that significantly enhances separation resolution compared to continuous systems. This approach utilizes two distinct gel layers with different pore sizes and pH values: a stacking gel and a separating gel. The stacking gel, typically with low acrylamide concentration (4-5%) and pH 6.8, serves to concentrate protein samples into sharp bands before they enter the separating gel. This concentration occurs due to differential mobility of ions in the Tris-glycine buffer system, creating a voltage gradient that focuses disparate protein molecules into narrow zones [48].
The separating gel, with higher acrylamide concentration (typically 8-15%) and pH 8.8, performs the actual molecular weight-based separation. As protein bands transition from the stacking gel to the separating gel, they encounter both a higher pH environment and smaller pore sizes. The pH change alters the electrophoretic mobility of glycine ions, which overtake the protein-SDS complexes and establish a uniform electric field. Proteins then migrate through the separating gel at rates inversely proportional to the logarithm of their molecular weights, with smaller proteins advancing faster than larger ones [50] [48].
Comparative Analysis: SDS-PAGE vs. Native PAGE
Fundamental Distinctions in Methodology and Application
SDS-PAGE and Native PAGE represent complementary electrophoretic techniques with distinct methodological approaches and application domains. The core distinction lies in their treatment of protein structure: SDS-PAGE deliberately denatures proteins using detergents and reducing agents, while Native PAGE maintains proteins in their native, folded state. This fundamental difference dictates their respective advantages, limitations, and optimal use cases in protein analysis [3] [12].
Table 1: Key Differences Between SDS-PAGE and Native PAGE
| Criteria | SDS-PAGE | Native PAGE |
|---|---|---|
| Separation Basis | Molecular weight only [12] | Size, charge, and shape [12] |
| Protein State | Denatured and linearized [49] [12] | Native, folded conformation [3] [12] |
| Detergent Usage | SDS present [12] | No SDS [12] |
| Sample Preparation | Heating with reducing agents [50] [12] | No heating, no reducing agents [12] |
| Protein Function | Lost during separation [12] | Retained after separation [3] [12] |
| Temperature | Room temperature [12] | Typically 4°C [12] |
| Primary Applications | Molecular weight determination, purity assessment, expression analysis [12] [48] | Protein-protein interactions, oligomeric state, enzymatic activity [3] [12] |
| Downstream Analysis | Western blotting, mass spectrometry [3] | Activity assays, interaction studies [3] |
Comparative Experimental Data: Resolution and Functional Preservation
Recent investigations have quantified the performance differences between these techniques in specific applications. A modified approach called Native SDS-PAGE (NSDS-PAGE) has emerged as a hybrid technique that reduces SDS concentration in running buffers from 0.1% to 0.0375% while eliminating EDTA and sample heating steps. This modification demonstrated remarkable retention of functional properties while maintaining high resolution separation. In comparative studies, retention of Zn²⁺ bound in proteomic samples increased from 26% with standard SDS-PAGE to 98% with NSDS-PAGE conditions. Furthermore, seven of nine model enzymes, including four Zn²⁺ proteins, retained activity after NSDS-PAGE separation, whereas all were denatured during conventional SDS-PAGE [6].
Table 2: Performance Comparison of Electrophoresis Methods in Metalloprotein Analysis
| Parameter | SDS-PAGE | BN-PAGE | NSDS-PAGE |
|---|---|---|---|
| Metal Retention | 26% [6] | High (specific data not provided) [6] | 98% [6] |
| Enzyme Activity Retention | 0/9 model enzymes [6] | 9/9 model enzymes [6] | 7/9 model enzymes [6] |
| Resolution | High [6] [48] | Moderate [6] | High [6] |
| Molecular Weight Determination | Accurate for non-glycosylated proteins [51] [52] | Less accurate due to native structure [6] | Accurate with functional retention [6] |
Primary Application 1: Molecular Weight Determination
Methodology and Experimental Protocol
Molecular weight determination represents one of the most fundamental applications of SDS-PAGE in protein characterization. The standard protocol begins with sample preparation, where protein samples are mixed with SDS-PAGE sample buffer containing SDS, a reducing agent (such as DTT or β-mercaptoethanol), glycerol, and a tracking dye (typically bromophenol blue). This mixture is heated at 95°C for 5-10 minutes to ensure complete denaturation and reduction of disulfide bonds [50]. The denatured samples are then loaded onto a polyacrylamide gel alongside molecular weight standards containing proteins of known masses.
Electrophoresis is performed at constant voltage (typically 150-200V) using Tris-glycine-SDS running buffer until the dye front approaches the bottom of the gel [50]. Proteins are subsequently visualized using staining methods such as Coomassie Brilliant Blue (detecting ~50-100 ng protein/band) or silver staining (detecting 2-5 ng protein/band) [50]. Molecular weight estimation involves plotting the migration distances of standard proteins versus the logarithm of their molecular weights to generate a calibration curve, against which the migration distance of the unknown protein is compared [48] [51].
Accuracy, Limitations, and Comparative Performance
The accuracy of molecular weight determination by SDS-PAGE varies significantly with protein characteristics. For well-behaved, non-glycosylated proteins, estimates typically fall within a few percent of the actual molecular weight determined by more precise methods like mass spectrometry [51]. However, accuracy decreases substantially for heavily glycosylated proteins, with deviations reaching 20-30% due to atypical SDS binding and migration behavior [51] [52]. Other factors affecting accuracy include protein composition (e.g., high proline content), residual structure, and post-translational modifications [51].
Comparative studies between SDS-PAGE and capillary electrophoresis SDS (CE-SDS) reveal similar performance in molecular weight determination for standard proteins. Research examining both techniques found that trueness values (ratio of apparent to reference molecular weight) ranged between 0.93 and 1.03 for SDS-PAGE depending on experimental conditions, comparable to CE-SDS values of 1.00-1.11 [53]. The selection of appropriate molecular weight markers proves critical for accurate determination, as different standards can produce deviations exceeding 10% in calculated molecular weights [53].
Primary Application 2: Purity Assessment
Technical Approaches and Methodologies
SDS-PAGE serves as an indispensable tool for assessing protein purity and homogeneity throughout purification processes and during quality control of biopharmaceutical products. The fundamental approach involves electrophoresing a protein sample under denaturing conditions and evaluating the resulting band pattern after staining. A pure protein preparation manifests as a single, sharp band at the expected molecular weight, while impurities appear as additional bands at different molecular weights [48]. The high resolution of SDS-PAGE enables detection of common impurities including protein fragments, aggregation products, and co-purifying contaminants.
The sensitivity of purity assessment depends heavily on the detection method employed. Coomassie staining typically detects bands containing 50-100 ng of protein, while silver staining increases sensitivity to 2-5 ng per band [50]. For quantitative purity assessment, digital imaging followed by densitometric analysis of gel bands allows calculation of percentage purity based on the relative intensities of target protein bands versus contaminant bands [49]. This approach provides objective purity measurements essential for optimizing purification protocols and ensuring batch-to-batch consistency in protein production.
Comparative Analysis with CE-SDS
Recent technological advances have introduced CE-SDS as an automated, quantitative alternative to traditional SDS-PAGE for purity analysis, particularly in biopharmaceutical applications. Comparative studies demonstrate that CE-SDS offers superior resolution and signal-to-noise ratio for detecting impurities in antibody samples. In one investigation analyzing normal and heat-stressed IgG, CE-SDS readily resolved and quantitated degradation species including light chains, heavy chains, and nonglycosylated IgG, while these impurities proved difficult to quantify by SDS-PAGE due to lower resolution and signal-to-noise ratios [49].
A significant advantage of CE-SDS emerges in detecting nonglycosylated IgG variants, which SDS-PAGE often fails to resolve from their glycosylated counterparts [49]. This capability proves particularly valuable for antibody characterization since glycosylation status significantly impacts biological function. Additionally, CE-SDS demonstrates excellent reproducibility across consecutive analyses, making it particularly suitable for quality control environments where precise quantitation and documentation are required [49].
Primary Application 3: Expression Analysis
Experimental Workflows and Detection Methods
SDS-PAGE provides a foundational methodology for analyzing protein expression levels across different biological conditions, including developmental stages, disease states, or experimental treatments. The standard workflow involves preparing protein extracts from compared samples, determining protein concentrations, loading equal protein amounts onto SDS-PAGE gels, and visualizing separated proteins using appropriate staining methods. Relative expression levels are assessed by comparing band intensities, with darker, thicker bands indicating more abundant proteins [48].
For specific protein detection, SDS-PAGE typically couples with western blotting (immunoblotting) techniques. Following electrophoresis, proteins are transferred from the gel to a membrane support, which is then probed with antibodies specific to the protein of interest. This approach combines the superior separation capability of SDS-PAGE with the specificity of antibody detection, enabling accurate quantification of specific proteins within complex mixtures [3] [48]. Quantitative analysis typically employs chemiluminescent or fluorescent detection methods with appropriate standards and controls to ensure accurate comparison across samples.
Advanced Applications and Integration with Other Technologies
Expression analysis via SDS-PAGE extends beyond simple quantification to investigate post-translational modifications (PTMs) that alter protein migration patterns. Phosphorylation, glycosylation, and other modifications can cause mobility shifts detectable by SDS-PAGE, providing initial evidence of regulatory modifications [48]. For comprehensive PTM characterization, SDS-PAGE routinely integrates with mass spectrometric analysis, where gel bands are excised, digested with proteases, and identified by MS sequencing [3].
The enduring utility of SDS-PAGE in expression analysis persists despite advances in proteomic technologies. Two-dimensional gel electrophoresis (2DE), which combines isoelectric focusing with SDS-PAGE, remains a powerful approach for simultaneously analyzing hundreds of proteins in complex mixtures. Additionally, SDS-PAGE maintains relevance in validating findings from high-throughput methods like RNA sequencing and CRISPR screening, providing orthogonal confirmation of protein-level expression changes suggested by genomic or transcriptomic data [48].
The Scientist's Toolkit: Essential Reagents and Materials
Successful SDS-PAGE analysis requires precise formulation of numerous specialized reagents and materials. The following table details key components essential for implementing SDS-PAGE methodology in research settings, compiled from established protocols and commercial systems [6] [50].
Table 3: Essential Research Reagent Solutions for SDS-PAGE
| Reagent/Material | Composition/Properties | Function in SDS-PAGE |
|---|---|---|
| Acrylamide/Bis Solution | 30% acrylamide, 0.8% bis-acrylamide [50] | Forms the polyacrylamide gel matrix; concentration determines pore size and separation range |
| Separating Gel Buffer | 1.875 M Tris-Cl, 0.25% SDS, pH 8.8 [50] | Establishes high pH environment for effective separation in the resolving gel |
| Stacking Gel Buffer | 0.3 M Tris-phosphate, 0.5% SDS, pH 6.8 [50] | Creates lower pH environment for sample stacking before separation |
| Electrophoresis Buffer | 0.5 M Tris base, 1.92 M glycine, 0.5% SDS [50] | Provides conducting medium and buffer capacity during electrophoresis |
| SDS-PAGE Sample Buffer | Tris buffer, SDS, reducing agent (DTT/BME), glycerol, tracking dye [50] | Denatures proteins, reduces disulfide bonds, adds density for loading, visualizes migration |
| Molecular Weight Standards | Pre-stained or unstained proteins of known molecular weights [49] [50] | Enables molecular weight estimation by providing calibration reference |
| Staining Solutions | Coomassie Brilliant Blue, silver stain, or fluorescent stains [50] | Visualizes separated protein bands after electrophoresis |
| Catalysts | Ammonium persulfate (APS) and TEMED [50] [48] | Initiates and accelerates acrylamide polymerization reaction |
SDS-PAGE remains an indispensable analytical technique in modern protein science, providing robust, reproducible methodology for molecular weight determination, purity assessment, and expression analysis. Its enduring utility stems from its straightforward implementation, high resolution separation, and compatibility with numerous downstream applications including western blotting and mass spectrometry. While emerging technologies like CE-SDS offer advantages in automation and quantitation for specific applications, SDS-PAGE maintains distinct benefits in accessibility, flexibility, and direct visualization of separation results.
The comparative analysis with Native PAGE highlights the complementary nature of denaturing versus native electrophoretic approaches. SDS-PAGE excels in analytical applications requiring molecular weight information and purity assessment, while Native PAGE proves superior for functional studies investigating protein-protein interactions, oligomeric states, and enzymatic activities. The recent development of NSDS-PAGE and related hybrid methodologies demonstrates ongoing innovation in electrophoretic techniques, bridging the historical divide between high-resolution denaturing separations and native functional preservation. As protein science continues to advance, SDS-PAGE will undoubtedly maintain its foundational role in biochemical discovery, adapting to integrated workflows that address increasingly complex research questions in proteomics and biopharmaceutical development.
For researchers investigating the dynamic world of proteins, maintaining native conformation and biological activity is not merely a preference but a necessity. While SDS-PAGE (Sodium Dodecyl Sulfate-Polyacrylamide Gel Electrophoresis) is a powerhouse for determining molecular weight and assessing purity, its denaturing nature renders it incompatible for functional protein analysis [54] [3]. Native PAGE, a non-denaturing electrophoretic technique, serves as an indispensable alternative, enabling the separation of proteins based on their intrinsic charge, size, and shape while preserving their higher-order structure and function [12] [1]. This guide provides a detailed comparison of these techniques, focusing on the application of Native PAGE for enzyme activity assays, protein-protein interaction studies, and complex characterization, supported by experimental data and protocols.
Core Principle: A Tale of Two Separation Mechanisms
The fundamental distinction between these methods lies in their treatment of the protein sample, which directly dictates their application.
- SDS-PAGE employs the anionic detergent SDS and heat to denature proteins, linearizing them and masking their intrinsic charge. This results in separation based almost exclusively on molecular mass, as all proteins attain a uniform negative charge-to-mass ratio [3] [1] [55].
- Native PAGE avoids denaturing agents. Proteins remain in their folded, native state, and their migration through the gel depends on a combination of their inherent net charge (determined by the buffer pH) and their molecular size, with the gel matrix providing a sieving effect [1] [55]. This preservation of structure is the cornerstone of its utility in functional studies.
The table below summarizes the critical differences between the two techniques.
| Criteria | SDS-PAGE | Native PAGE |
|---|---|---|
| Separation Basis | Molecular weight only [12] [3] | Size, overall charge, and shape [12] [56] |
| Gel Condition | Denaturing [12] [15] | Non-denaturing [12] [15] |
| Sample Preparation | Includes SDS and reducing agent (e.g., DTT, BME); sample is heated [12] [55] | No SDS or reducing agent; sample is not heated [12] [55] |
| Protein State | Denatured and linearized [12] [1] | Native, folded conformation [12] [1] |
| Protein Function | Destroyed [12] [54] | Retained [12] [3] |
| Protein Recovery | Not recoverable in functional form [12] | Recoverable post-separation for downstream assays [12] [3] |
| Primary Applications | Molecular weight determination, purity check, protein expression analysis [12] [1] | Enzyme activity assays, protein-protein interactions, oligomerization state studies [12] [56] |
Advantages of Native PAGE for Functional Analysis
The primary advantage of Native PAGE is its ability to keep proteins functional, enabling a range of analyses that are impossible with SDS-PAGE [12] [3].
- Preservation of Enzymatic Activity: Since enzymes remain folded and cofactors stay bound, their activity is retained post-electrophoresis. This allows for in-gel activity assays (zymography) where the gel is incubated with specific substrates to produce a detectable signal (e.g., a colored precipitate) precisely at the band containing the active enzyme [1].
- Analysis of Protein Complexes and Interactions: Native PAGE can separate and identify stable protein-protein interactions, such as oligomers and multi-subunit complexes, under conditions that maintain non-covalent bonds [56] [1]. This is crucial for understanding quaternary structure and functional interactomes.
- Study of Charge and Conformational Heterogeneity: The technique can resolve different isoforms or post-translationally modified forms of a protein that have identical molecular weights but differ in charge [56].
Experimental Data: Quantitative Evidence of Functionality
Research has demonstrated the efficacy of Native PAGE in preserving function. In a modified approach termed NSDS-PAGE (Native SDS-PAGE), scientists reduced SDS concentration and omitted EDTA and heating. The results were striking:
- Metal Retention: Retention of bound Zn²⁺ in proteomic samples increased from 26% with standard SDS-PAGE to 98% with NSDS-PAGE [6].
- Enzymatic Activity: Seven out of nine model enzymes, including four zinc-dependent proteins, retained their activity after separation via NSDS-PAGE. In contrast, all nine were denatured and inactivated during standard SDS-PAGE [6].
This data underscores that with optimized, mild conditions, electrophoretic separation can be compatible with functional preservation.
Experimental Protocols for Key Functional Assays
Protocol 1: In-Gel Enzyme Activity Assay (Zymography)
This protocol is used to detect and characterize active enzymes, such as dehydrogenases or phosphatases, directly within the Native PAGE gel [1].
- Sample Preparation: Prepare protein samples in a non-denaturing buffer (e.g., 50 mM Tris-HCl, pH 7.4) without SDS, reducing agents, or heat [6] [55]. Centrifuge to remove insoluble debris.
- Gel Electrophoresis:
- Activity Staining:
- Gently remove the gel from the cassette and rinse with an appropriate assay buffer.
- Incubate the gel in a reaction solution containing the enzyme-specific substrate, cofactors, and any necessary coupling reagents. For example:
- Dehydrogenases: Incubate with NAD+/NADP+, a substrate, and a tetrazolium salt (e.g., MTT or NBT) which forms an insoluble, colored formazan precipitate upon reduction.
- Phosphatases: Incubate with a naphthyl phosphate substrate and a diazonium salt (e.g., Fast Blue or Fast Red) to form a colored azo dye.
- Detection: Bands of enzymatic activity will appear colored at the respective positions of the active enzymes. Stop the reaction by washing with a destaining solution or fixing the gel.
Protocol 2: Analysis of Protein Oligomerization State
This protocol is designed to characterize the native molecular weight and oligomeric status of a protein complex [56].
- Sample Preparation and Electrophoresis: Follow steps 1 and 2 from the previous protocol.
- Comparison with Markers: Run native protein molecular weight standards alongside the sample. Note that migration in Native PAGE is not linearly related to mass as in SDS-PAGE, so standards should be a mix of known native proteins.
- Post-Electrophoresis Analysis:
- Western Blotting (Native Transfer): After electrophoresis, proteins can be transferred to a membrane under native conditions (no SDS in the transfer buffer) for immunodetection with a specific antibody.
- Protein Elution: Functional proteins can be recovered from the gel by passive diffusion or electro-elution into a native buffer for further downstream analyses, such as kinetic studies or a second dimension by SDS-PAGE [1].
The following diagram illustrates the core workflow and decision-making process for a functional study using Native PAGE:
The Scientist's Toolkit: Essential Reagents and Materials
Successful Native PAGE experiments rely on specific reagents that preserve protein native state.
| Reagent/Material | Function in Native PAGE | Key Considerations |
|---|---|---|
| Acrylamide/Bis-acrylamide | Forms the porous gel matrix for separation [1] [55]. | Concentration determines pore size; adjust to target protein size range. |
| Tris-based Buffers | Provides the ionic environment and pH for electrophoresis [55]. | Common running buffers include Tris-Glycine or Tris-Borate (without SDS). |
| Coomassie Blue G-250 | A mild anionic dye used in sample buffer (e.g., in BN-PAGE) to impart slight negative charge and visualize migration [6]. | Less denaturing than SDS; helps maintain protein function. |
| Glycerol | Added to sample buffer to increase density for easy well loading [6] [15]. | Ensures sample settles evenly at the bottom of the well. |
| Native Protein Ladders | A set of proteins of known native mass and charge for comparison [55]. | Migration is not solely size-based; requires native standards for accurate interpretation. |
| 4°C Cold Room/Chamber | Environment for running the gel [12]. | Minimizes protein denaturation and proteolysis during electrophoresis. |
The choice between SDS-PAGE and Native PAGE is dictated by the experimental objective. For researchers focused on functional studies—enzymatic activity, protein-protein interactions, and complex characterization—Native PAGE is the unequivocal technique of choice. Its power lies in its ability to probe the active state of proteins, providing insights that are fundamental to biochemistry, molecular biology, and drug development. While SDS-PAGE remains the standard for routine analytical tasks, integrating Native PAGE into the research workflow opens the door to a deeper, more functional understanding of the proteome.
Troubleshooting Common Issues and Advanced Optimization Strategies
Within the broader comparison of SDS-PAGE and Native PAGE for protein analysis, SDS-PAGE remains the cornerstone technique for determining protein molecular weight and purity. Its utility, however, depends entirely on the quality of the results, which can be compromised by artifacts like smiling bands, poor resolution, and atypical migration. This guide objectively compares optimal performance against suboptimal outcomes, providing supporting experimental data and methodologies to systematically troubleshoot and resolve these common issues, ensuring researchers can generate reliable, publication-quality data.
Problem 1: Smiling Bands
Analysis & Comparative Data
"Smiling" or "frowning" bands, where migration is curved rather than straight, are primarily a heat-related phenomenon. The table below compares problematic conditions against optimal running parameters.
| Parameter | Suboptimal Condition (Problem) | Optimal Condition (Solution) | Experimental Impact |
|---|---|---|---|
| Voltage/Current | High voltage/current (>150V for mini-gels) [57] [58] | Lower voltage (e.g., 100-120V); Constant current [57] [58] | Reduced joule heating; straighter bands [57] |
| Temperature Control | No active cooling; room temperature [57] | Cold room (4°C) or apparatus with cooling/ice packs [57] [59] | Prevents gel expansion from uneven heating [57] |
| Buffer Integrity | Overused or improperly formulated buffer [58] | Fresh running buffer at correct concentration [59] [58] | Ensures consistent conductivity and heat dissipation [58] |
| Sample Salt | High salt concentration in samples [58] | Desalted samples (via dialysis, TCA precipitation, or desalting columns) [60] [58] | Prevents local heating and electric field distortion in wells [58] |
Experimental Protocol for Mitigation
Title: Protocol for Resolving and Preventing Smiling Bands Objective: To achieve straight protein band migration by optimizing electrophoretic conditions. Methodology:
- Gel Setup: Cast or use a standard Tris-Glycine SDS-PAGE gel (e.g., 12% resolving gel) [22].
- Sample Preparation: Ensure samples are prepared in a standard Laemmli buffer with minimal salt content. For high-salt samples, perform a desalting step [60].
- Apparatus Assembly: Place the gel apparatus in a cold room (4°C) or, if unavailable, use a gel tank compatible with an ice pack in the buffer chamber [59].
- Electrophoresis: Fill the tank with fresh Tris-Glycine-SDS running buffer. Apply a constant current instead of constant voltage, or if using constant voltage, do not exceed 120V for a mini-gel format [57] [58].
- Monitoring: Run the gel until the dye front is approximately 0.5-1 cm from the bottom. Stopping the run prematurely can cause other resolution issues [57].
This systematic approach directly targets the root cause of smiling bands—uneven heat distribution—by controlling current and temperature. The workflow for troubleshooting this issue is outlined in the diagram below.
Problem 2: Poor Band Resolution
Analysis & Comparative Data
Poor resolution, where bands are blurry, too close together, or poorly defined, can stem from multiple factors in gel composition, sample preparation, and running conditions. The following table compares the causes and solutions.
| Parameter | Suboptimal Condition (Problem) | Optimal Condition (Solution) | Experimental Impact |
|---|---|---|---|
| Gel Percentage | Incorrect % acrylamide for target protein size [59] | Lower % for high MW proteins; Higher % for low MW proteins; Gradient gels for broad MW range [60] [59] | Optimizes pore size for effective sieving of target proteins [59] |
| Sample Load | Too much protein (>20-30 µg per well for a mini-gel) [59] [61] | Optimal protein load (e.g., 10-20 µg per well) [59] [61] | Prevents over-saturation, aggregation, and bleeding into adjacent lanes [59] |
| Denaturation | Incomplete heating (e.g., < 95°C for 5 min) or insufficient reducing agent [59] [62] | Heat at 95-100°C for 5 min with adequate SDS and DTT/β-mercaptoethanol [59] [62] | Ensures linearization and uniform SDS coating for separation by size only [59] [22] |
| Run Time | Gel run too short or too long [57] [58] | Stop when dye front reaches bottom (optimize for high MW proteins) [57] | Allows sufficient separation without excessive band diffusion [57] [58] |
| Buffer pH/Concentration | Old, overused, or incorrect running buffer [57] [59] | Fresh running buffer at correct pH and ion concentration [57] [59] | Maintains proper current flow and pH for sharp band resolution [57] |
Experimental Protocol for Mitigation
Title: Protocol for Optimizing Band Resolution Objective: To achieve sharp, well-separated protein bands. Methodology:
- Gel Selection: Based on the molecular weight of your target protein, select an appropriate gel percentage. For example, use an 8% gel for proteins >100 kDa, a 12% gel for proteins 10-100 kDa, and a 15% gel for proteins <10 kDa. Alternatively, use a 4%-20% gradient gel for a broad separation range [60] [59].
- Sample Preparation: Mix protein sample with 2X Laemmli buffer containing 2% SDS and 5% β-mercaptoethanol (or 100mM DTT). Heat at 98°C for 5 minutes, then immediately place on ice to prevent renaturation [59] [62].
- Protein Quantification: Accurately measure protein concentration and load an optimal amount. For a standard mini-gel, begin with 10-20 µg of total protein per well and adjust based on abundance and detection method [59] [61].
- Electrophoresis: Use fresh Tris-Glycine-SDS running buffer. Run the gel at a lower voltage (e.g., 100-120V) for a longer duration to improve separation and minimize heat-induced diffusion [57] [58].
- Staining: After electrophoresis, stain the gel with Coomassie Blue or a more sensitive stain like SimplyBlue SafeStain to visualize the results [22].
The diagram below provides a logical workflow for diagnosing and correcting the various causes of poor resolution.
Problem 3: Atypical Migration
Analysis & Comparative Data
Atypical migration encompasses samples running off the gel, diffusing out of wells, or showing vertical streaking. These issues are often linked to run duration, sample handling, and gel polymerization.
| Migration Issue | Suboptimal Condition (Problem) | Optimal Condition (Solution) | Experimental Impact |
|---|---|---|---|
| Samples Run Off Gel | Gel run for too long [57] | Stop when dye front is ~0.5-1 cm from gel bottom [57] | Preserves proteins of interest, especially low molecular weight species [57] |
| Sample Diffusion from Wells | Long lag between loading and starting run; insufficient glycerol in buffer [57] [61] | Start run immediately after loading; ensure >10% glycerol in loading buffer [57] [61] | Concentrates samples in wells for clean, sharp entry into gel [57] |
| Vertical Streaking | Protein precipitation/aggregation; overloading; high salt [60] [61] | Centrifuge samples before loading; reduce load; desalt samples; add urea for hydrophobic proteins [60] [61] [58] | Eliminates particulate matter that causes uneven migration and streaking [60] |
| Poor Polymerization | Old APS/TEMED; incorrect ratios; low temperature [60] [59] | Use fresh APS/TEMED; ensure proper ratios; polymerize at room temp [60] [59] | Creates a uniform gel matrix with consistent pore sizes for even migration [60] |
Experimental Protocol for Mitigation
Title: Protocol for Correcting Atypical Sample Migration Objective: To ensure samples remain in wells until current is applied and migrate evenly without streaking. Methodology:
- Loading Buffer Preparation: Prepare 2X Laemmli sample buffer containing 20% glycerol to ensure samples sink properly into the wells [61].
- Well Preparation: Before loading samples, use a pipette tip to flush out wells with running buffer to remove air bubbles that can disrupt loading [61].
- Sample Clarification: After denaturation, centrifuge samples at >12,000 x g for 2-5 minutes to pellet any insoluble or precipitated material. Load only the supernatant [60] [58].
- Immediate Electrophoresis: Load samples quickly and consistently, not exceeding 3/4 of the well's capacity. Start the electrophoresis run immediately after the last sample is loaded to prevent diffusion [57] [61].
- Run Monitoring: Carefully monitor the run and stop the power supply as soon as the dye front approaches the bottom of the gel to prevent proteins from running off [57].
The Scientist's Toolkit: Key Research Reagent Solutions
The following table details essential materials and reagents critical for successful SDS-PAGE experimentation, based on the troubleshooting analysis.
| Reagent/Material | Function | Troubleshooting Note |
|---|---|---|
| SDS (Sodium Dodecyl Sulfate) | Denatures proteins and confers uniform negative charge, enabling separation by mass [22]. | Insufficient SDS causes improper unfolding, smearing, and atypical migration [59] [62]. |
| DTT or β-Mercaptoethanol | Reducing agents that break disulfide bonds, ensuring complete protein denaturation [59]. | Inadequate amounts lead to protein aggregation, vertical streaking, and artifact bands [60] [61]. |
| Acrylamide/Bis-Acrylamide | Forms the cross-linked porous matrix of the gel, which sieves proteins by size [22]. | Incorrect percentage or poor polymerization causes poor resolution and distorted bands [60] [59]. |
| APS & TEMED | Catalyzes the polymerization reaction of the polyacrylamide gel [22]. | Old or imprecise amounts lead to soft, uneven, or non-polymerized gels [60] [59]. |
| Tris-Glycine-SDS Buffer | Running buffer that conducts current and maintains pH for protein migration [22]. | Overused or improperly formulated buffer alters conductivity and pH, causing smearing and poor resolution [57] [59]. |
| Glycerol | Added to sample buffer to increase density, ensuring samples sink to the bottom of wells [61]. | Insufficient glycerol causes samples to leak or diffuse out of wells before running [61]. |
In the context of selecting the appropriate protein analysis method, SDS-PAGE is unmatched for determining molecular weight and assessing sample purity when it functions correctly. The experimental data and protocols provided here demonstrate that systematic troubleshooting of common problems—by controlling heat, optimizing gel and sample parameters, and ensuring proper technique—can reliably restore performance. Mastering these corrections is fundamental for researchers who require robust, reproducible protein analysis to drive their scientific discoveries and development workflows forward.
In the realm of protein analysis, the choice of electrophoretic method is a critical determinant of the integrity and functionality of the samples under investigation. While SDS-PAGE (sodium dodecyl sulfate-polyacrylamide gel electrophoresis) serves as a cornerstone for determining molecular weight, it achieves this at the cost of protein denaturation. Native PAGE emerges as a vital alternative when the preservation of a protein's native conformation, biological activity, and multi-subunit complexes is paramount [3] [1]. This guide provides a detailed, objective comparison of these techniques, with a focused exploration of Native PAGE optimization to maintain protein stability and activity, supported by experimental data and protocols.
Core Principles: SDS-PAGE vs. Native PAGE
The fundamental difference between these two techniques lies in their treatment of the protein structure. The following table outlines their core distinguishing characteristics.
Table 1: Fundamental Differences Between SDS-PAGE and Native PAGE
| Feature | SDS-PAGE | Native PAGE |
|---|---|---|
| Gel Condition | Denaturing [15] | Nondenaturing [15] |
| Sample Treatment | Heated with SDS and reducing agents [1] | No denaturants; samples kept cool [1] |
| Basis of Separation | Molecular mass [3] [15] | Net charge, size, and shape [1] |
| Impact on Protein Structure | Disrupts tertiary/quaternary structures; proteins are linearized [3] | Retains native folding, quaternary structure, and protein complexes [3] [1] |
| Protein Recovery & Activity | Proteins are denatured and inactive; recovery for functional studies is not feasible [3] [15] | Proteins often remain active and can be recovered from the gel for activity assays [3] [1] |
| Primary Applications | Molecular weight determination, analysis of purity, western blotting [3] [6] | Study of protein-protein interactions, enzymatic activity, and oligomerization states [3] [17] |
The decision-making process for selecting the appropriate electrophoretic method based on research goals is summarized in the workflow below.
The Native SDS-PAGE Hybrid: An Optimized Approach
A significant innovation in native electrophoresis addresses the trade-off between resolution and protein activity. Researchers developed Native SDS-PAGE (NSDS-PAGE), a modified method that delivers high-resolution separation while exceptionally retaining native properties like bound metal ions and enzymatic activity [6] [63].
Experimental Evidence for NSDS-PAGE Efficacy
Key modifications to standard SDS-PAGE protocols yielded dramatically improved outcomes for protein stability.
Table 2: Key Buffer Modifications in NSDS-PAGE vs. Standard SDS-PAGE
| Component | Standard SDS-PAGE | Native SDS-PAGE (NSDS-PAGE) |
|---|---|---|
| Sample Buffer | Contains SDS and EDTA; sample is heated [6] | No SDS or EDTA; no heating step [6] |
| Running Buffer | 0.1% SDS, 1 mM EDTA [6] | 0.0375% SDS, no EDTA [6] |
| Critical Additives | SDS, reducing agents [1] | Coomassie G-250 [6] |
The impact of these optimized conditions is clear from quantitative experimental data.
Table 3: Quantitative Comparison of Protein and Metal Ion Retention Across PAGE Methods
| Parameter | SDS-PAGE | BN-PAGE | Native SDS-PAGE (NSDS-PAGE) |
|---|---|---|---|
| Zn²⁺ Retention in Proteomic Samples | 26% [6] | Data Not Provided | 98% [6] |
| Enzymatic Activity Retention | 0 out of 9 model enzymes [6] | 9 out of 9 model enzymes [6] | 7 out of 9 model enzymes [6] |
| Protein Resolving Power | High resolution [6] | Lower resolution [6] | High resolution, comparable to SDS-PAGE [6] |
Detailed Experimental Protocol for Native SDS-PAGE
The following workflow and detailed steps are adapted from the research by [6], which developed and validated the NSDS-PAGE method.
- Gel Pre-electrophoresis: Pre-cast Bis-Tris gels (e.g., Invitrogen Novex 12%) are pre-run at 200V for 30 minutes in double-distilled H₂O. This step removes the gel storage buffer and any unpolymerized acrylamide [6].
- Sample Preparation: Mix the protein sample (e.g., 7.5 µL) with 4X NSDS sample buffer (2.5 µL). The final sample buffer consists of 100 mM Tris HCl, 150 mM Tris base, 10% (v/v) glycerol, 0.0185% (w/v) Coomassie G-250, and 0.00625% (w/v) Phenol Red, pH 8.5 [6]. Crucially, do not heat the sample.
- Load Sample and Standards: Load the prepared samples into the wells. Include native protein standards if activity or complex size is being assessed.
- Electrophoresis: Perform electrophoresis at a constant voltage (e.g., 200V) for the required time (approximately 45 minutes for a 60 mm gel) using the NSDS-PAGE running buffer (50 mM MOPS, 50 mM Tris Base, 0.0375% SDS, pH 7.7) [6].
- Post-separation Analysis: Proteins can be visualized using standard stains. For functional studies, proteins can be electro-eluted or subjected to in-gel activity assays [1]. Metal ion retention can be confirmed with techniques like laser ablation-inductively coupled plasma-mass spectrometry [6].
The Scientist's Toolkit: Essential Reagents for Native PAGE
Table 4: Key Research Reagent Solutions for Native PAGE Experiments
| Reagent / Material | Function in the Protocol |
|---|---|
| Bis-Tris or Tris-Glycine Gels | A common matrix for native electrophoresis; provides a stable pH environment that minimizes protein denaturation [6]. |
| Coomassie G-250 | Added to the sample buffer in NSDS-PAGE; provides a charge shift mechanism for proteins, aiding migration without significant denaturation [6]. |
| Glycerol | Added to sample buffers to increase the density of the sample, ensuring it sinks properly to the bottom of the well when loaded [15]. |
| Protease Inhibitors (e.g., PMSF) | Critical for maintaining protein integrity during sample preparation by inhibiting proteolytic degradation [6]. |
| NativeMark Unstained Standards | A set of native proteins used to estimate the molecular weight and separation efficiency of native protein complexes under non-denaturing conditions [6]. |
Within the comparative framework of protein analysis, Native PAGE is an indispensable technique for research questions where biological function, protein-protein interactions, and the integrity of non-covalently bound cofactors are the subjects of study. While SDS-PAGE remains the gold standard for molecular weight determination, its denaturing nature destroys these functional properties. The optimized Native SDS-PAGE protocol offers a powerful hybrid approach, bridging the gap by providing high-resolution separation comparable to SDS-PAGE while retaining a high degree of protein native state, as evidenced by the 98% retention of bound metal ions and preserved activity in most tested enzymes. For scientists in drug development and basic research, mastering these techniques and their optimized applications is crucial for obtaining meaningful, biologically relevant data from electrophoretic separations.
In the realm of protein analysis, the choice between SDS-PAGE and native PAGE fundamentally shapes the experimental outcome, determining whether proteins are separated by molecular mass alone or by a combination of mass, charge, and native structure. Within this framework, selecting the correct polyacrylamide gel percentage is a critical step that directly impacts the resolution and success of the electrophoresis. An appropriately chosen gel concentration acts as a molecular sieve, optimizing the separation of proteins within a specific size range. This guide provides a detailed, data-driven comparison to help researchers methodically select the ideal acrylamide concentration for their target proteins, ensuring high-quality, reproducible results in both denaturing and native contexts.
The Core Principle: Gel Percentage and Protein Size Resolution
The polyacrylamide gel matrix serves as a sieve through which proteins migrate under an electric field. The pore size of this matrix is inversely related to the percentage of acrylamide: higher percentages create smaller pores, which are better at resolving smaller proteins, while lower percentages with larger pores are suited for separating larger proteins [1]. The following table provides a definitive guide for matching your protein's size with the appropriate gel percentage, a cornerstone of effective experimental design.
Table 1: Recommended Gel Percentage for Target Protein Size
| Target Protein Size Range (kDa) | Recommended Acrylamide Percentage (%) |
|---|---|
| 4 - 40 | 20 |
| 12 - 45 | 15 |
| 10 - 70 | 12.5 |
| 15 - 100 | 10 |
| 25 - 200 | 8 |
| > 200 | Agarose gels are recommended [36] [64] |
For samples containing a very broad mix of protein sizes, gradient gels (e.g., 4-20%) are highly recommended. These gels provide a continuous increase in acrylamide concentration, offering a wider separation range and sharper bands than fixed-percentage gels, effectively performing the function of both a stacking and resolving gel [36] [1].
SDS-PAGE vs. Native PAGE: A Methodological Comparison
While gel percentage selection is vital for both techniques, the underlying separation principles and applications of SDS-PAGE and Native PAGE are distinct. Understanding these differences is essential for choosing the right initial approach for your research question.
Table 2: Key Characteristics of SDS-PAGE vs. Native PAGE
| Characteristic | SDS-PAGE | Native PAGE |
|---|---|---|
| Protein State | Denatured and linearized [36] [1] | Native, folded structure [1] [3] |
| Separation Basis | Primarily by molecular mass [11] [1] | By net charge, size, and shape of the native protein [1] |
| Sample Treatment | Heated with SDS and a reducing agent (e.g., DTT, β-mercaptoethanol) [11] | Mixed with non-denaturing sample buffer; no heating [36] |
| SDS in Buffer? | Yes [11] [1] | No [36] |
| Functional Activity | Destroyed [6] [3] | Often retained [1] [3] |
| Primary Application | Molecular weight determination, purity assessment, western blotting [6] [1] | Analysis of native complexes, oligomeric state, and enzymatic activity [1] [3] |
Experimental Protocols for Gel-Based Separation
Protocol 1: Standard Denaturing SDS-PAGE
This is the most widely used protocol for separating proteins by subunit molecular weight [11] [1].
- Sample Preparation: Mix protein sample with an SDS-based sample buffer (e.g., Laemmli buffer) containing a reducing agent like dithiothreitol (DTT) or β-mercaptoethanol. Heat the mixture at 95°C for 5 minutes (or 70°C for 10 minutes) to fully denature the proteins [11].
- Gel Selection: Based on your protein of interest's molecular weight, select a suitable fixed-percentage or gradient gel (refer to Table 1).
- Electrophoresis Setup: Load the denatured samples and a molecular weight marker into the wells of the precast or hand-cast gel. Submerge the gel in an SDS-containing running buffer (e.g., Tris-Glycine-SDS) [11] [64].
- Run: Apply a constant voltage (e.g., 100-200V) until the dye front (e.g., bromophenol blue) reaches the bottom of the gel [11].
- Downstream Analysis: Proceed to protein staining (e.g., Coomassie), western blotting, or other analysis [1].
Protocol 2: Non-Denaturing Native PAGE
This protocol is used when preserving the native state, activity, or complex formation of proteins is required [1] [3].
- Sample Preparation: Mix protein sample with a non-denaturing sample buffer that lacks SDS and reducing agents. Do not heat the sample [36].
- Gel Selection: Choose a gel percentage based on the hydrodynamic size of the native protein or complex, which may be larger than its denatured subunit mass.
- Electrophoresis Setup: Load the samples alongside native protein standards. Use a running buffer that does not contain SDS or other denaturants [36].
- Run: Apply a constant voltage. Note that migration will be towards the anode for most proteins at alkaline pH, but the rate depends on the protein's intrinsic charge and size [1].
- Downstream Analysis: Proteins can be detected by activity assays, native-compatible stains, or recovered for functional studies [1].
Protocol 3: Hybrid Native SDS-PAGE (NSDS-PAGE)
A modified SDS-PAGE method has been developed to balance high resolution with the retention of some native functional properties, such as bound metal ions or enzymatic activity [6].
- Sample Preparation: The sample is mixed with a modified sample buffer that omits SDS and EDTA. Critically, the heating step is omitted [6].
- Gel Selection: Standard Bis-Tris gels can be used.
- Electrophoresis Setup: The running buffer is modified to contain a significantly reduced concentration of SDS (e.g., 0.0375% instead of 0.1%) and no EDTA [6].
- Run: Electrophoresis is performed as standard. This method has been shown to increase zinc retention in proteomic samples from 26% to 98% compared to standard SDS-PAGE, with seven out of nine model enzymes retaining activity post-electrophoresis [6].
The Scientist's Toolkit: Essential Research Reagents
The following table details key reagents and materials required for successful protein gel electrophoresis.
Table 3: Essential Reagents for Protein Gel Electrophoresis
| Reagent/Material | Function |
|---|---|
| Acrylamide/Bis-acrylamide | Monomer and cross-linker that polymerize to form the porous gel matrix. The ratio and total concentration determine pore size [36] [1]. |
| SDS (Sodium Dodecyl Sulfate) | Anionic detergent that denatures proteins and confers a uniform negative charge, allowing separation by size alone in SDS-PAGE [11] [1]. |
| TEMED & Ammonium Persulfate | Catalyst and initiator, respectively, for the free-radical polymerization of acrylamide [11] [1]. |
| Tris-based Buffers | Provide the appropriate pH environment for electrophoresis (e.g., Tris-Glycine, Bis-Tris) [11] [1]. |
| Reducing Agents (DTT, β-ME) | Cleave disulfide bonds in proteins to ensure complete denaturation and dissociation of subunits in SDS-PAGE [11]. |
| Molecular Weight Markers | A cocktail of proteins of known sizes run in parallel to unknown samples to allow estimation of molecular weights [36] [1]. |
| Coomassie Brilliant Blue | A common protein stain that binds nonspecifically to proteins, allowing visualization after electrophoresis [6] [36]. |
Experimental Workflow and Decision Pathway
The diagram below outlines the logical decision-making process for selecting the appropriate electrophoresis method and gel conditions based on your research objectives.
Selecting the optimal acrylamide gel percentage is a fundamental skill that bridges the methodological divide between SDS-PAGE and native PAGE. By aligning the gel's pore size with the target protein's dimensions—whether denatured or native—researchers can achieve superior resolution. The experimental protocols and decision framework provided here empower scientists to make informed choices, leveraging the high-resolution mass-based separation of SDS-PAGE, the functional preservation of native PAGE, or the innovative hybrid approach of NSDS-PAGE. Mastering this selection process ensures that your electrophoresis results form a solid, reliable foundation for all subsequent protein analysis.
Protein gel electrophoresis stands as a fundamental technique in biochemistry, molecular biology, and drug development for separating and analyzing complex protein mixtures. The core principle relies on moving charged protein molecules through a porous polyacrylamide gel matrix under the influence of an electric field, enabling separation based on molecular properties. Two primary methodologies dominate this field: SDS-PAGE (Sodium Dodecyl Sulfate-Polyacrylamide Gel Electrophoresis) and native PAGE (Polyacrylamide Gel Electrophoresis), each with distinct mechanisms and applications. SDS-PAGE employs the anionic detergent SDS to denature proteins, linearize them, and impart a uniform negative charge, resulting in separation based almost exclusively on molecular mass [65] [66]. In contrast, native PAGE preserves proteins in their native, folded state, allowing separation based on a combination of size, charge, and three-dimensional structure, which is crucial for studying functional protein complexes and enzymatic activity [65] [67].
The resolution, sensitivity, and accuracy of these separations are profoundly influenced by two critical technical choices: the gel pore structure and the buffer system. Gradient gels, with their continuously varying acrylamide concentration, offer a versatile solution for separating proteins across a broad molecular weight range. Meanwhile, alternative buffer systems beyond the traditional Tris-Glycine can optimize pH conditions for specific analytical needs. This guide provides a detailed comparison of these advanced techniques, presenting experimental data and methodologies to inform researchers' strategies for enhancing protein separation resolution.
Fundamental Principles of Gradient Gels and Buffer Systems
The Mechanism and Advantages of Gradient Gels
Unlike fixed-concentration gels, gradient gels are formulated with a continuous range of polyacrylamide concentrations, typically increasing from the top to the bottom of the gel. This creates a corresponding pore size gradient, with larger pores at the top and progressively smaller pores at the bottom [68]. As proteins migrate through this gradient, they encounter steadily decreasing pore sizes. High molecular weight proteins migrate freely until they reach a pore size that restricts their movement, while low molecular weight proteins continue to migrate further until they too encounter their resolving pore size [65] [68]. This mechanism provides three key advantages:
- Superior Resolution of Broad Molecular Weight Ranges: A single gradient gel can effectively separate proteins across an extremely wide mass spectrum, eliminating the need to run multiple fixed-percentage gels [65] [68]. For instance, a 4-20% gradient gel can resolve proteins from 4-250 kDa, covering the range typically requiring several fixed-percentage gels [68].
- Sharper Protein Bands: The decreasing pore size causes the leading edge of a protein band to slow down before the trailing edge. This results in a "stacking" effect, where the band compacts on itself, producing tighter, sharper bands that are ideal for publication and quantitative analysis [68].
- Enhanced Separation of Similar-Sized Proteins: The extended path length through varying pore sizes improves the distinction between proteins with minor size differences, resolving fuzzy doublets into discrete bands [68].
The Role of Buffer Systems in Electrophoresis
The buffer system establishes the pH environment critical for controlling the charge states of proteins and buffer ions during electrophoresis. The most common system, Tris-Glycine, operates under alkaline conditions and utilizes a discontinuous pH system to concentrate proteins into sharp bands before they enter the resolving gel [65] [66]. The key to this stacking effect is the mobility of glycine, which changes with pH. In the stacking gel (pH ~6.8), glycine exists mainly as a zwitterion with low mobility, creating a narrow voltage gradient that herds proteins into a tight zone [66].
Alternative buffer systems like Bis-Tris maintain a neutral pH (~6.5-7.0) during separation. This offers significant advantages for certain applications, particularly by minimizing protein modifications such as deamidation or aggregation that can occur at the higher pH of Tris-Glycine systems. Bis-Tris gels are therefore preferred for high-resolution applications and when preserving the native state of protein complexes is important [65]. The choice of buffer (e.g., MOPS vs. MES) within a system can also affect migration speed and resolution, allowing for further fine-tuning [68].
Comparative Analysis of Electrophoretic Methods
Table 1: Comparative Analysis of Electrophoretic Methods for Protein Separation
| Feature | SDS-PAGE | Native PAGE | Native SDS-PAGE (NSDS-PAGE) |
|---|---|---|---|
| Separation Principle | Molecular mass | Size, charge, and native structure | Molecular mass with retained activity |
| Protein State | Denatured and linearized [66] | Native and folded [67] | Native, but SDS-accessible [6] |
| Typical Buffer Systems | Tris-Glycine, Bis-Tris [65] | Bis-Tris, Tris-Acetate [65] | Modified Tris-Glycine/Glycine [6] |
| Key Advantages | Simple, high resolution by mass, standard for molecular weight estimation | Retains function (e.g., enzyme activity), studies protein complexes [65] [6] | High resolution with retention of some functional properties and bound metal ions [6] |
| Key Limitations | Destroys native structure and function [6] | Lower resolution for complex mixtures, difficult mass estimation [6] | Limited by SDS sensitivity of protein function |
| Ideal Applications | Purity checks, Western blotting, molecular weight determination [65] | Enzyme activity assays, protein-protein interactions [65] [69] | Metalloprotein analysis, functional proteomics where SDS does not denature [6] |
Table 2: Performance Comparison of Gradient vs. Fixed-Percentage Gels
| Characteristic | Gradient Gels | Fixed-Percentage Gels |
|---|---|---|
| Separation Range | Broad (e.g., 4-250 kDa on a 4-20% gel) [68] | Narrow (optimized for a specific range) [68] |
| Band Sharpness | Superior due to band sharpening effect [68] | Good, but bands can diffuse over long runs |
| Resolution of Similar Sizes | Excellent, increases with run time [68] | Moderate, best at optimal % for target size |
| Ease of Preparation | More complex; requires gradient mixer or technique [68] | Simpler and more straightforward |
| Cost | Higher cost for pre-cast; cheaper homemade materials [68] | Lower cost for pre-cast; cheapest homemade |
| Best Use Cases | Discovery work, limited samples, broad/unknown protein targets [68] | Routine analysis of proteins within a known, narrow size range [67] |
Experimental Data and Methodologies
Experimental Protocol: SDS-PAGE on Gradient Gels for Proteinuria Typing
A 2023 study provides a robust semiquantitative protocol for evaluating proteinuria using SDS-PAGE with commercially available 4-20% gradient gels [70].
Methodology:
- Sample Preparation: Urine samples were centrifuged (400× g; 5 min) to remove debris. The supernatant was aliquoted and stored at -20°C until use [70].
- Gel Electrophoresis: Samples were mixed with SDS-containing sample buffer. Separation was performed on 4-20% gradient polyacrylamide gels. The protocol likely used a standard Laemmli system with a Tris-Glycine running buffer [70].
- Visualization & Analysis: After electrophoresis, proteins were stained (likely with Coomassie Brilliant Blue or similar). Protein patterns were differentiated based on the molecular weights of the detected bands, identifying distinct pathological patterns: glomerular (albumin and higher molecular weights), and two types of tubular proteinuria ("upper" ≥20 kDa and "lower" with lower molecular weights) [70].
Results and Data: The study demonstrated that this method could detect albumin at concentrations as low as 3 mg/L. In 93 clinical samples with normal albumin/creatinine ratios, the assay detected an albumin fraction in 87% of samples, with a minimum detectable albumin concentration of 2.11 mg/L. Analysis of 300 proteinuria patient samples revealed distinct patterns that were significantly associated with different glomerular filtration rates (median 66, 71, and 31 mL/min/1.73 m² for the different patterns, p=0.004) and different underlying disease diagnoses, confirming the clinical utility of the method [70].
Experimental Protocol: Native SDS-PAGE for Metalloprotein Analysis
A study on metalloproteins introduced Native SDS-PAGE (NSDS-PAGE) as a hybrid technique aiming to combine the high resolution of SDS-PAGE with the functional retention of native PAGE [6].
Methodology:
- Modified Buffers: The key modification lies in the buffer composition. The standard sample buffer was replaced with a native sample buffer (100 mM Tris HCl, 150 mM Tris base, 10% glycerol, 0.0185% Coomassie G-250, 0.00625% Phenol Red, pH 8.5), and the running buffer SDS concentration was reduced to 0.0375% without EDTA [6].
- Electrophoresis: Pre-cast NuPAGE Novex 12% Bis-Tris gels were used. The protocol omitted the heating step typically used in SDS-PAGE to denature samples [6].
- Activity & Metal Detection: Enzyme activity was assessed post-electrophoresis using specific activity stains. Retained zinc in proteins was confirmed using laser ablation-inductively coupled plasma-mass spectrometry (LA-ICP-MS) and in-gel staining with the fluorophore TSQ [6].
Results and Data: The data showed a dramatic increase in zinc retention from 26% with standard SDS-PAGE to 98% with NSDS-PAGE. Furthermore, functional assays revealed that seven out of nine model enzymes, including four zinc-dependent proteins, retained their activity after NSDS-PAGE separation. In contrast, all nine enzymes were denatured and lost activity during standard SDS-PAGE. This demonstrates that NSDS-PAGE is a viable method for high-resolution separation of proteins while preserving bound metal ions and enzymatic function for a majority of tested proteins [6].
The Scientist's Toolkit: Essential Reagent Solutions
Table 3: Key Research Reagents for Advanced Electrophoresis
| Reagent / Material | Function in the Protocol |
|---|---|
| Glycine | An amino acid in running buffer; its charge-state change with pH is critical for the discontinuous buffer system and protein stacking [66]. |
| Acrylamide/Bis-Acrylamide | Forms the cross-linked polyacrylamide gel matrix; the concentration determines pore size and resolving range [66] [68]. |
| SDS (Sodium Dodecyl Sulfate) | Anionic detergent that denatures proteins, unfolds them into linear chains, and confers a uniform negative charge [66]. |
| Tris (Tris(hydroxymethyl)aminomethane) | A buffering agent used in gel, sample, and running buffers to maintain a stable pH during electrophoresis [66]. |
| Ammonium Persulfate (APS) & TEMED | Catalysts for the free-radical polymerization of acrylamide and bis-acrylamide to form a gel [66]. |
| 2-Mercaptoethanol (BME) or DTT | Reducing agents added to sample buffer to break disulfide bonds in proteins, ensuring complete denaturation [13]. |
| Coomassie Brilliant Blue G-250 | A dye used in BN-PAGE to impart negative charge to proteins and in staining for visualization; used at low concentrations in NSDS-PAGE sample buffer [6]. |
Decision Workflow and Technical Diagram
The following workflow outlines the decision process for selecting the optimal electrophoretic strategy based on research objectives and sample properties:
Diagram 1: Decision workflow for electrophoresis method selection
The strategic incorporation of gradient gels and alternative buffer systems provides powerful levers to enhance the resolution and analytical capability of protein electrophoresis. Gradient gels offer unparalleled versatility for separating complex protein mixtures across a wide molecular weight spectrum, producing sharper bands and better resolution of similar-sized proteins. Meanwhile, the choice between buffer systems like Tris-Glycine and Bis-Tris allows researchers to tailor the electrophoretic environment to their specific needs, whether for routine analysis or for preserving labile protein functions and complexes.
Emerging techniques like NSDS-PAGE demonstrate that the boundaries between denaturing and native electrophoresis are porous, enabling new applications in metalloproteinomics and functional analysis. By understanding the principles and experimental data behind these advanced techniques, researchers and drug development professionals can make informed decisions to optimize their protein separation protocols, ultimately driving forward discovery and characterization in the life sciences.
In protein analysis, researchers often face a critical trade-off: high resolution versus native property retention. Standard SDS-PAGE provides excellent separation based on molecular weight but denatures proteins, destroying functional properties including enzymatic activity and non-covalently bound metal ions [6] [63]. Conversely, Blue-Native PAGE (BN-PAGE) preserves native structure and function but offers lower resolution and can interfere with downstream analytical techniques [6] [71]. This comparison guide explores Native SDS-PAGE (NSDS-PAGE) as a hybrid approach that strategically balances these competing demands, enabling high-resolution separation while maintaining critical native protein properties.
Understanding the Electrophoresis Landscape
Fundamental Techniques and Their Limitations
SDS-PAGE employs the anionic detergent sodium dodecyl sulfate (SDS) to denature proteins, imparting a uniform negative charge that enables separation primarily by molecular mass. While excellent for determining protein size and purity, this denaturation destroys higher-order structure, enzymatic activity, and metal-cofactor interactions [6] [48] [1].
Native PAGE techniques, including BN-PAGE and Clear-Native PAGE (CN-PAGE), separate proteins in their native state. BN-PAGE uses Coomassie G-250 dye to impose a negative charge shift on proteins, while CN-PAGE employs mixtures of anionic and neutral detergents [72]. These methods preserve function but lack the resolution of SDS-PAGE and can complicate molecular weight determination due to separation based on both charge and size [6] [71] [1].
The NSDS-PAGE Hybrid Approach
NSDS-PAGE represents a methodological compromise, modifying traditional SDS-PAGE conditions to maintain resolution while preserving native characteristics. By strategically reducing SDS concentration and eliminating denaturing steps, it enables high-resolution separation with remarkable retention of metal ions and enzymatic activity [6] [63].
Comparative Experimental Performance Data
Quantitative Analysis of Metal Retention and Enzymatic Activity
Critical evaluation of experimental data reveals fundamental differences in how these techniques preserve native protein properties. NSDS-PAGE demonstrates remarkable capability to maintain metalloprotein integrity compared to conventional methods.
Table 1: Comparative Performance of Electrophoresis Techniques in Preserving Native Properties
| Technique | Metal Ion Retention | Enzymatic Activity Retention | Resolution | Key Limitations |
|---|---|---|---|---|
| SDS-PAGE | 26% (Zn²⁺) | 0/9 model enzymes active [6] | High | Complete denaturation of proteins |
| BN-PAGE | High | 9/9 model enzymes active [6] | Moderate | Lower resolution; dye interference with downstream techniques [71] |
| CN-PAGE | High | High (e.g., ATP synthase activity) [71] | Moderate | Lower resolution; complex migration depends on intrinsic charge [71] |
| NSDS-PAGE | 98% (Zn²⁺) [6] | 7/9 model enzymes active [6] | High | Not all enzymes retain activity |
Buffer System Composition Comparison
The fundamental differences between these techniques originate from their specific buffer formulations, which dictate their denaturing versus native properties.
Table 2: Buffer Composition Comparison Across Electrophoresis Techniques
| Component | SDS-PAGE | BN-PAGE | NSDS-PAGE |
|---|---|---|---|
| Sample Buffer | 2% LDS, 0.51 mM EDTA [6] | 50 mM BisTris, 50 mM NaCl, 0.001% Ponceau S [6] | No SDS/EDTA, 0.01875% Coomassie G-250 [6] |
| Running Buffer | 0.1% SDS, 1 mM EDTA [6] | Cathode: 50 mM BisTris, 0.02% Coomassie; Anode: 50 mM BisTris [6] | 0.0375% SDS, no EDTA [6] |
| Sample Preparation | Heating at 70°C for 10 min [6] | No heating [6] | No heating [6] |
| Key Additives | Reducing agents (DTT, β-mercaptoethanol) [13] | Coomassie dye, digitonin for supercomplexes [72] | Reduced SDS, Coomassie dye [6] |
NSDS-PAGE Experimental Protocol and Methodology
Step-by-Step NSDS-PAGE Procedure
Gel Preparation: Use standard precast NuPAGE Novex 12% Bis-Tris 1.0 mm minigels or equivalent. Prior to running, precondition gels by electrophoresis at 200V for 30 minutes in double distilled H₂O to remove storage buffer and unpolymerized acrylamide [6].
Sample Buffer Preparation: Prepare 4X NSDS sample buffer containing:
- 100 mM Tris HCl
- 150 mM Tris Base
- 10% glycerol (v/v)
- 0.01875% Coomassie G-250 (w/v)
- 0.00625% Phenol Red (w/v)
- pH 8.5 [6]
Sample Preparation: Mix 7.5 μL of protein sample (5-25 μg protein) with 2.5 μL of 4X NSDS sample buffer. Crucially omit heating step to preserve native structure [6].
Running Buffer Preparation: Prepare NSDS-PAGE running buffer containing:
- 50 mM MOPS
- 50 mM Tris Base
- 0.0375% SDS (reduced from standard 0.1%)
- pH 7.7 [6]
Electrophoresis Conditions:
- Load prepared samples into preconditioned gels
- Run at constant voltage (200V) for approximately 45 minutes at room temperature
- Continue until dye front reaches the end of the gel [6]
Downstream Analysis Capabilities
NSDS-PAGE maintains compatibility with various detection methods:
- In-gel activity staining for functional assays [6]
- Laser ablation-inductively coupled plasma-mass spectrometry for metal detection [6]
- Fluorophore staining (e.g., TSQ for zinc proteins) [6]
- Western blotting for specific protein detection
Essential Research Reagent Solutions
Successful implementation of NSDS-PAGE requires specific reagents optimized for native protein separation.
Table 3: Essential Research Reagents for Native Electrophoresis Techniques
| Reagent/Category | Function/Application | Examples/Specific Notes |
|---|---|---|
| Mild Detergents | Solubilize membrane proteins while preserving complexes | n-dodecyl-β-d-maltoside (BN-PAGE), digitonin (supercomplex preservation) [72] |
| Charge-Shift Agents | Impose uniform charge without denaturation | Coomassie G-250 (BN-PAGE), mixed anionic/neutral detergents (CN-PAGE) [72] |
| Stabilizing Additives | Maintain protein structure and activity | Glycerol (sample buffer), 6-aminocaproic acid (extraction buffer) [72] |
| Specialized Buffers | Create optimal pH environment | Bis-tris systems (native PAGE), MOPS/Tris systems (NSDS-PAGE) [6] |
| Activity Stain Components | Detect functional enzymes post-electrophoresis | ATPase staining components, Complex IV activity stains [72] |
Application Scenarios and Technical Considerations
Ideal Use Cases for NSDS-PAGE
Metalloprotein Analysis: NSDS-PAGE dramatically increases zinc retention from 26% to 98% compared to SDS-PAGE, making it ideal for metalloprotein studies [6].
Enzyme Activity Screening: With 7 of 9 model enzymes retaining activity after separation, NSDS-PAGE enables functional screening of complex protein mixtures [6].
Membrane Protein Complexes: The technique preserves labile interactions in membrane protein assemblies that may be disrupted by full denaturation [73].
Diagnostic Applications: BN-PAGE and CN-PAGE have proven valuable for investigating assembly defects in oxidative phosphorylation complexes in metabolic diseases [72].
Technical Limitations and Considerations
- Not Universal: Not all enzymes retain activity after NSDS-PAGE; optimization may be required for specific proteins [6]
- Complex Migration: In CN-PAGE, migration depends on protein intrinsic charge and gel pore size, complicating mass determination [71]
- Detergent Interference: Coomassie dye in BN-PAGE can interfere with downstream catalytic activity assays and FRET analyses [71]
- Specificity: CN-PAGE best separates acidic water-soluble and membrane proteins (pI < 7) [71]
The choice between electrophoresis techniques should be guided by specific research objectives:
Choose SDS-PAGE for maximum resolution and molecular weight determination when native properties are irrelevant.
Select BN-PAGE for complete preservation of enzymatic activity and analysis of protein complexes, particularly when resolution requirements are moderate.
Opt for CN-PAGE when studying labile supramolecular assemblies or when dye interference would compromise downstream functional assays.
Implement NSDS-PAGE when both high resolution and preservation of metal binding capacity or partial enzymatic activity are required.
NSDS-PAGE represents a sophisticated hybrid approach that successfully balances the competing demands of resolution and native property retention. By understanding the specific buffer formulations, experimental protocols, and performance characteristics outlined in this guide, researchers can strategically select and implement the optimal electrophoresis technique for their specific protein analysis requirements.
Method Selection, Validation, and Complementary Analytical Techniques
Polyacrylamide Gel Electrophoresis (PAGE) is a foundational technique in biochemistry and molecular biology laboratories for separating protein molecules based on their physical characteristics. Within this domain, SDS-PAGE (Sodium Dodecyl Sulfate Polyacrylamide Gel Electrophoresis) and Native PAGE represent two principal approaches with fundamentally different operating principles and applications [3]. SDS-PAGE separates proteins that have been denatured into their primary polypeptide components, primarily by molecular mass [1]. In contrast, Native PAGE separates proteins in their natural, folded state, maintaining complex structures and biological activities [3]. The selection between these methods is critical and depends on the specific research objectives—whether determining molecular weight and purity or investigating native structure, function, and protein-protein interactions [12] [8]. This guide provides a detailed, side-by-side comparison of these techniques to inform researchers and drug development professionals in selecting the appropriate method for their protein analysis needs.
Principles of Separation and Theoretical Foundations
SDS-PAGE: Separation by Molecular Weight
SDS-PAGE operates on the principle of denaturing proteins to separate them solely based on their molecular weight [15]. The anionic detergent Sodium Dodecyl Sulfate (SDS) plays a pivotal role by binding to hydrophobic regions of proteins in a constant weight ratio (approximately 1.4 g SDS per 1 g of polypeptide) [1]. This SDS coating masks the proteins' intrinsic charges and imparts a uniform negative charge to all polypeptides [16]. Consequently, all SDS-bound proteins in a sample migrate through the gel toward the positively charged anode when an electric current is applied, with smaller proteins moving faster through the polyacrylamide matrix than larger ones due to the sieving effect [5] [1]. A reducing agent, such as β-mercaptoethanol or DTT, is typically added to the sample buffer to break disulfide bonds, ensuring complete denaturation into individual subunits [12] [15].
Native PAGE: Separation by Charge, Size, and Shape
Native PAGE separates proteins based on their inherent charge, size, and three-dimensional shape under non-denaturing conditions [12] [1]. Without SDS or reducing agents, proteins retain their native conformation, quaternary structure, and bound cofactors [3]. In this technique, the gel and running buffers lack denaturing agents, allowing proteins to migrate according to their intrinsic charge-to-mass ratio and the frictional forces they encounter within the gel matrix [1] [16]. The result is that a protein's migration rate depends on a combination of factors: its net charge at the running buffer pH, its size (mass), and its shape (globular vs. elongated) [12]. This preserves biological activity and subunit interactions within multimeric proteins, providing information about their quaternary structure [1].
Figure 1: Comparative workflow of protein separation mechanisms in SDS-PAGE versus Native PAGE.
Comparative Analysis of Key Parameters
The fundamental differences between SDS-PAGE and Native PAGE can be systematically compared across multiple technical parameters, as summarized in the table below.
Table 1: Comprehensive comparison of SDS-PAGE and Native PAGE characteristics and parameters
| Parameter | SDS-PAGE | Native PAGE |
|---|---|---|
| Separation Basis | Molecular weight only [12] [15] | Size, overall charge, and shape [12] [3] |
| Gel Nature | Denaturing [12] | Non-denaturing [12] |
| SDS Presence | Present in gel and sample buffer [12] | Absent [12] [15] |
| Reducing Agents | Typically present (DTT, β-mercaptoethanol) [12] | Absent [12] |
| Sample Preparation | Heating required (70-100°C) [12] [1] | No heating [12] |
| Protein State | Denatured, linearized polypeptides [12] [1] | Native, folded conformation [12] [3] |
| Protein Function Post-Separation | Lost [12] | Retained [12] [3] |
| Protein Recovery | Not recoverable in functional form [12] | Recoverable with preserved function [12] [15] |
| Net Charge on Proteins | Always negative (from SDS) [12] | Positive or negative (intrinsic charge) [12] |
| Typical Run Temperature | Room temperature [12] | 4°C [12] |
| Primary Applications | Molecular weight determination, purity assessment, protein expression analysis [12] [5] | Studying protein structure, subunit composition, protein-protein interactions, functional assays [12] [8] |
Experimental Data and Performance Comparison
Quantitative Analysis of Functional Preservation
Experimental data demonstrates the significant difference in functional preservation between these techniques. A modified approach called Native SDS-PAGE (NSDS-PAGE)—which reduces SDS concentration in the running buffer from 0.1% to 0.0375% and eliminates EDTA and heating steps—shows remarkable improvement in maintaining protein function compared to standard SDS-PAGE [6].
Table 2: Comparative experimental data on functional preservation between electrophoresis methods
| Method | Zinc Retention in Proteomic Samples | Enzyme Activity Retention | Resolution Quality |
|---|---|---|---|
| Standard SDS-PAGE | 26% | 0/9 model enzymes active [6] | High resolution [6] |
| Native SDS-PAGE (NSDS-PAGE) | 98% | 7/9 model enzymes active [6] | Comparable to standard SDS-PAGE [6] |
| Blue Native PAGE (BN-PAGE) | High (specific data not provided) | 9/9 model enzymes active [6] | Lower resolution than SDS-PAGE [6] |
Practical Interpretation of Results
The different separation principles can lead to distinctly different interpretations of the same protein sample. For instance, a protein sample isolated from a natural source migrated as a band corresponding to 60 kDa on non-reducing SDS-PAGE but migrated corresponding to a 120 kDa marker protein on Native-PAGE [7]. This observation strongly suggests that the protein exists as a dimer of 60 kDa subunits that are not linked with disulfide bonds in its native form [7]. The dimeric structure is maintained by non-covalent interactions (e.g., hydrophobic or electrostatic interactions) that are disrupted by SDS treatment but would remain intact under non-reducing conditions [7].
Methodological Protocols
SDS-PAGE Standard Protocol
Sample Preparation:
- Mix protein sample with SDS-containing sample buffer (typically with reducing agents like DTT or β-mercaptoethanol) [12] [5].
- Heat samples at 70-100°C for 5-10 minutes to denature proteins [12] [1].
Gel Composition:
- Use polyacrylamide gels cast in buffer containing SDS [12] [1].
- Employ a discontinuous buffer system with stacking gel (lower acrylamide concentration, pH ~6.8) and resolving gel (higher acrylamide concentration, pH ~8.8) [1].
Electrophoresis Conditions:
- Running buffer: Typically Tris-glycine or MOPS with 0.1% SDS [12] [6].
- Apply constant voltage (e.g., 200V for mini-gels) at room temperature until dye front reaches bottom [12] [6].
Native PAGE Standard Protocol
Sample Preparation:
- Mix protein sample with non-denaturing sample buffer (no SDS or reducing agents) [12].
- Do not heat samples [12].
Gel Composition:
- Use polyacrylamide gels without SDS or other denaturants [12].
- May employ specialized variants like Blue Native PAGE (BN-PAGE) with Coomassie dye or Clear Native PAGE (CN-PAGE) [12].
Electrophoresis Conditions:
- Running buffer: Tris-glycine or similar without SDS [12].
- Run at 4°C to minimize denaturation and proteolysis [12] [1].
- Apply constant voltage (e.g., 150V for mini-gels) until completion [6].
Figure 2: Comparative experimental workflows for SDS-PAGE and Native PAGE protocols.
Research Reagent Solutions and Essential Materials
Successful implementation of both electrophoresis methods requires specific reagents and materials optimized for each technique.
Table 3: Essential research reagents and materials for SDS-PAGE and Native PAGE
| Reagent/Material | Function/Purpose | SDS-PAGE | Native PAGE |
|---|---|---|---|
| Acrylamide/Bis-acrylamide | Forms porous gel matrix for separation [1] | Required | Required |
| SDS (Sodium Dodecyl Sulfate) | Denatures proteins and imparts uniform charge [15] | Required [12] | Not used [12] |
| Reducing Agents (DTT, β-mercaptoethanol) | Breaks disulfide bonds [15] | Typically used [12] | Not used [12] |
| Ammonium Persulfate (APS) & TEMED | Catalyzes acrylamide polymerization [1] | Required | Required |
| Coomassie Brilliant Blue | Protein staining for visualization [12] | Used post-electrophoresis | Used in BN-PAGE variant [12] |
| Glycerol | Increases sample density for well loading [15] | Used in sample buffer | Used in sample buffer [6] |
| Tracking Dye (Phenol Red) | Visualizes migration front during run [6] | Optional | Optional |
| Molecular Weight Markers | Reference for size determination [1] | Essential for MW determination | Useful but not absolute for MW [7] |
Applications in Research and Drug Development
SDS-PAGE Applications
SDS-PAGE serves as a workhorse technique for numerous applications in research and quality control:
- Molecular Weight Determination: Precisely estimates protein molecular weight by comparing migration distance to standard markers [12] [1].
- Purity Assessment and Quality Control: Evaluates protein sample purity and identifies contaminants [3] [5], widely used in food science to assess protein ingredients and detect adulteration [5].
- Expression Analysis: Checks protein expression levels in biological samples [12].
- Process Monitoring: Assesses the impact of processing (enzymatic hydrolysis, heat treatment) on protein molecular weight distribution [5].
- Western Blotting Pre-step: Serves as the first dimension for protein transfer to membranes for immunodetection [3] [1].
Native PAGE Applications
Native PAGE enables unique applications that leverage preserved protein structure and function:
- Protein-Protein Interaction Studies: Identifies and characterizes protein complexes and quaternary structures [3] [8], including detection of ligand-receptor interactions like interleukin-2 and its receptor [8].
- Functional and Enzymatic Assays: Allows recovery of active proteins for activity studies [12] [1]; seven of nine model enzymes retained activity after Native SDS-PAGE separation [6].
- Metalloprotein Analysis: Preserves non-covalently bound metal ions; Zn²⁺ retention increased from 26% (SDS-PAGE) to 98% (Native SDS-PAGE) [6].
- Complex Isolation: Purifies protein complexes from biological membranes in their native state [15].
- Conformational Studies: Analyzes protein folding and structural changes under different conditions [3].
SDS-PAGE and Native PAGE offer complementary approaches to protein separation, each with distinct advantages and limitations. SDS-PAGE provides high-resolution separation based primarily on molecular weight, making it ideal for determining protein size, assessing purity, and analyzing expression levels. Conversely, Native PAGE preserves the native conformation and biological activity of proteins, enabling studies of protein-protein interactions, enzymatic function, and complex stoichiometry. The choice between these techniques should be guided by specific research goals: SDS-PAGE for analytical separation of denatured proteins, and Native PAGE for functional studies of proteins in their native state. Recent methodological advances, such as Native SDS-PAGE, demonstrate that hybrid approaches can offer improved functional preservation while maintaining high resolution, providing researchers with enhanced tools for proteomic analysis in basic research and drug development.
In the realm of protein biochemistry, polyacrylamide gel electrophoresis (PAGE) serves as a fundamental analytical tool, with SDS-PAGE and Native PAGE representing two fundamentally different approaches to protein separation. These techniques support critical decisions in research and development, particularly in pharmaceutical and diagnostic applications where understanding protein structure and function is paramount. SDS-PAGE (sodium dodecyl sulfate polyacrylamide gel electrophoresis) employs a denaturing detergent that unravels proteins and imparts a uniform negative charge, enabling separation primarily by molecular weight [3] [5]. In contrast, Native PAGE maintains proteins in their natural, folded state without denaturants, preserving biological activity and complex structures while separating molecules based on their intrinsic charge, size, and three-dimensional conformation [3] [36].
The strategic selection between these methodologies significantly impacts downstream analyses and interpretations. While SDS-PAGE offers high-resolution separation ideal for determining molecular weight and assessing purity, Native PAGE provides unique insights into functional protein complexes, oligomerization states, and enzymatic activities [3]. This guide examines the technical specifications, applications, and experimental considerations for both techniques to inform method selection aligned with specific research objectives in drug development and basic research.
Technical Comparison: Mechanism and Separation Characteristics
The fundamental distinction between these techniques lies in their treatment of protein structure. In SDS-PAGE, the anionic detergent SDS binds to proteins at a constant ratio of approximately 1.4g SDS per 1g protein, masking intrinsic charge differences and unfolding tertiary structures through reduction of disulfide bonds when combined with agents like β-mercaptoethanol [3] [5]. This denaturation creates linear polypeptides whose migration through the polyacrylamide gel matrix depends almost exclusively on molecular weight [36]. The table below summarizes the core differentiating characteristics:
Table 1: Fundamental Characteristics of SDS-PAGE versus Native PAGE
| Parameter | SDS-PAGE | Native PAGE |
|---|---|---|
| Protein State | Denatured (unfolded) | Native (folded) |
| Separation Basis | Molecular weight | Size, charge, and shape |
| Detergent Use | SDS present | No SDS |
| Reducing Agents | Often used (β-mercaptoethanol, DTT) | Typically omitted |
| Biological Activity | Lost after separation | Preserved after separation |
| Migration Direction | Always toward anode | Charge-dependent |
| Molecular Weight Determination | Excellent | Approximate |
| Typical Gel Types | Discontinuous or gradient | Discontinuous or gradient |
| Optimal Protein Size Range | 5-200 kDa [36] | Varies with complex size |
Native PAGE maintains proteins in their physiological conformation by omitting denaturing agents, thus preserving multiprotein complexes, enzyme activity, and non-covalently bound cofactors including metal ions [6]. This comes at the cost of resolution, as migration depends on both the protein's hydrodynamic size (influenced by folding) and intrinsic charge, making molecular weight estimations less straightforward compared to SDS-PAGE [36]. The preservation of quaternary structure enables analysis of protein-protein interactions and oligomeric states that would be disrupted under denaturing conditions [3].
Applications and Research Contexts: Aligning Methods with Goals
Optimal Applications for SDS-PAGE
SDS-PAGE excels in analytical contexts requiring precise molecular weight determination and assessment of protein purity. Its denaturing nature makes it particularly valuable for estimating subunit molecular weights, analyzing post-translational modifications that alter migration, and assessing sample homogeneity [3]. In pharmaceutical quality control, SDS-PAGE routinely verifies recombinant protein identity and monitors degradation products. Food scientists employ this technique to authenticate protein ingredients, detect adulteration, and monitor proteolysis during processes like cheese aging [5]. When combined with western blotting, SDS-PAGE enables specific protein detection using antibodies, though the denatured epitopes may require careful antibody selection [36]. Proteomic research frequently incorporates SDS-PAGE as a first-dimension separation step before mass spectrometry analysis, particularly for membrane proteins and insoluble fractions [17].
Ideal Use Cases for Native PAGE
Native PAGE proves indispensable for functional studies requiring preserved protein activity and structure. Researchers investigating protein-protein interactions, oligomerization states, or complex stoichiometries benefit from this technique's ability to maintain quaternary structure [3]. Enzymologists frequently employ Native PAGE to detect activity through in-gel assays, where enzymes remain functional after separation [6]. Metalloprotein researchers particularly value Native PAGE for retaining metal cofactors that would be chelated in SDS-PAGE buffers containing EDTA [6]. Recent methodological advances like NSDS-PAGE (native SDS-PAGE) demonstrate modified approaches that maintain some functional properties while offering improved resolution compared to traditional Native PAGE [6]. This hybrid approach reduces SDS concentration (0.0375% in running buffer) and eliminates heating and EDTA to preserve Zn²⁺ binding in metalloproteins while maintaining high-resolution separation [6].
Experimental Design and Performance Data
Quantitative Comparison of Technical Performance
Direct comparison of these techniques reveals significant differences in their operational characteristics and outcomes. The table below summarizes experimental data comparing key performance metrics:
Table 2: Experimental Performance Metrics for PAGE Techniques
| Performance Metric | SDS-PAGE | Native PAGE | NSDS-PAGE |
|---|---|---|---|
| Metal Retention (Zn²⁺) | 26% | >95% | 98% |
| Enzyme Activity Retention | 0/9 model enzymes | 9/9 model enzymes | 7/9 model enzymes |
| Proteome Resolution | High | Moderate | High |
| Typical Run Time | ~45 minutes | ~90 minutes | ~45 minutes |
| Sample Pretreatment | Heating with SDS buffer | Minimal manipulation | No heating, modified buffer |
| Typical Voltage | 200V | 150V | 200V |
| Compatible with Western Blot | Excellent | Limited | Moderate |
The data demonstrates that Native PAGE and its modified version NSDS-PAGE significantly outperform traditional SDS-PAGE in preserving metalloprotein metal binding and enzymatic activity [6]. Specifically, Zn²⁺ retention increases from 26% in SDS-PAGE to 98% in NSDS-PAGE, while seven of nine model enzymes retained activity after NSDS-PAGE compared to complete inactivation in standard SDS-PAGE [6]. This positions NSDS-PAGE as a valuable compromise when both high resolution and functional preservation are desired.
Methodological Protocols
Standard SDS-PAGE Protocol: Protein samples (5-25μg) are mixed with loading buffer containing SDS and reducing agent (e.g., 2% LDS), then heated at 70°C for 10 minutes [6]. Denatured samples are loaded onto polyacrylamide gels (typically 10-12% acrylamide) and electrophoresed at 200V for approximately 45 minutes using MOPS or Tris-glycine running buffer containing 0.1% SDS [6] [36]. The gel is subsequently stained with Coomassie Blue, silver stain, or processed for western blotting.
Native PAGE Protocol: Protein samples are mixed with non-denaturing loading buffer (e.g., 50mM BisTris, 50mM NaCl, 10% glycerol, pH 7.2) without heating [6]. Samples are loaded onto polyacrylamide gels and electrophoresed at 150V for 90-95 minutes using cathode and anode buffers without SDS [6]. The native conditions maintain protein activity for functional assays post-separation.
NSDS-PAGE Hybrid Protocol: Samples are prepared in modified buffer (100mM Tris HCl, 150mM Tris base, 10% glycerol, 0.0185% Coomassie G-250, pH 8.5) without heating or EDTA [6]. Electrophoresis uses running buffer with reduced SDS concentration (0.0375%) and operates at 200V for approximately 45 minutes, balancing resolution with functional preservation [6].
Decision Framework and Technical Considerations
The selection between SDS-PAGE and Native PAGE hinges primarily on the research question's fundamental requirements: whether protein denaturation serves or hinders the experimental goals. The following decision pathway provides a systematic approach to technique selection:
Diagram 1: Technique Selection Decision Pathway
Essential Research Reagents and Materials
Successful implementation of either technique requires specific reagent systems optimized for each method:
Table 3: Essential Reagent Solutions for PAGE Techniques
| Reagent | Function | SDS-PAGE | Native PAGE |
|---|---|---|---|
| Detergent | Denatures proteins, imparts charge | SDS (0.1-0.5%) | None or mild non-ionic |
| Reducing Agent | Breaks disulfide bonds | β-mercaptoethanol or DTT | Omitted |
| Sample Buffer | Prepares proteins for loading | Contains SDS, reducing agents | No denaturants, mild pH |
| Running Buffer | Conducts current, maintains pH | Tris-glycine or MOPS with SDS | Tris-borate or HEPES |
| Gel Matrix | Separates proteins by size | Polyacrylamide (5-15%) | Polyacrylamide (4-16%) |
| Staining Method | Visualizes separated proteins | Coomassie, silver, fluorescent | Coomassie, activity stains |
| Molecular Weight Markers | Calibrates size separation | Denatured proteins | Native protein complexes |
Advanced Applications and Complementary Approaches
For complex analytical challenges, researchers often combine both techniques in two-dimensional approaches or supplement them with complementary methods. Blue Native (BN)-PAGE represents a specialized Native PAGE variant that uses Coomassie dye for charge shifting during separation of membrane protein complexes [6]. This technique particularly benefits mitochondrial and respiratory chain studies but offers lower resolution than SDS-PAGE for complex proteomic mixtures [6].
Comparative proteomic studies demonstrate that SDS-PAGE and Native PAGE provide complementary information on cellular protein systems. SDS-PAGE-MS analysis of human bronchial smooth muscle cells assigned 2552 proteins with excellent quantitative comparability, while nondenaturing 2DE-MS identified 4323 proteins and revealed protein interaction networks [17]. This suggests that SDS-PAGE excels in comparative quantification, while Native PAGE methods better preserve protein interactions [17].
Two-dimensional separation combining Native PAGE in the first dimension with SDS-PAGE in the second dimension powerfully analyzes protein complexes, identifying subunit composition within intact oligomers [6]. This approach leverages the strengths of both techniques: Native PAGE preserves complexes while SDS-PAGE resolves individual components by molecular weight.
The strategic selection between SDS-PAGE and Native PAGE fundamentally shapes experimental outcomes and interpretative possibilities in protein research. SDS-PAGE remains the gold standard for molecular weight determination, purity assessment, and proteomic profiling of denatured proteins, particularly when paired with western blotting or mass spectrometry. Conversely, Native PAGE offers unique capabilities for functional studies, interaction analyses, and metalloprotein characterization where preserving native structure is paramount. The emerging NSDS-PAGE hybrid approach demonstrates that methodological innovations continue to expand the technique spectrum, offering intermediate solutions that balance resolution with functional preservation. By aligning technical capabilities with research objectives through the decision framework presented, researchers can optimize their electrophoretic strategy to yield the most biologically relevant and analytically robust results for their specific applications.
In the context of comparing SDS-PAGE and native PAGE for protein separation, the confirmation of results through orthogonal validation techniques becomes paramount. While SDS-PAGE denatures proteins to separate them by molecular weight, and native PAGE preserves protein structure and interactions, both techniques often require downstream validation to confirm protein identity and quantity. The integration of Western blotting and mass spectrometry (MS) has emerged as a powerful approach for result confirmation, though the scientific community increasingly recognizes that the traditional practice of using Western blotting to validate MS findings may be outdated. As highlighted in a seminal editorial in Molecular & Cellular Proteomics, "the request to validate quantitative MS data by Western blotting is no longer justified" given the advanced capabilities of modern MS techniques [74].
This guide objectively compares the performance characteristics of Western blotting and mass spectrometry for protein validation, providing researchers with experimental data and methodologies to design robust validation strategies within their protein analysis workflows. The complementary information provided by SDS-PAGE and native PAGE separation techniques further enriches this validation paradigm, as each offers unique advantages for different analytical goals [20] [3].
Technical Comparison: Western Blotting vs. Mass Spectrometry
Fundamental Principles and Workflow Differences
Western Blotting: This technique relies on antibody-based detection following protein separation by gel electrophoresis (typically SDS-PAGE) and transfer to a membrane. The specificity depends primarily on antibody-antigen recognition, revealing information about protein size and approximate quantity through chemiluminescent or fluorescent detection [74] [75].
Mass Spectrometry: MS-based proteomics identifies and quantifies proteins by measuring the mass-to-charge ratio of peptide ions after enzymatic digestion (typically with trypsin). Advanced targeted methods like Selected Reaction Monitoring (SRM) use predetermined precursor and fragment ions for highly specific detection and quantification [74].
Performance Characteristics and Capabilities
Table 1: Direct comparison of key performance characteristics between Western blotting and mass spectrometry
| Performance Characteristic | Western Blotting | Mass Spectrometry |
|---|---|---|
| Detection Specificity | Single antibody-epitope interaction [74] | Multiple dimensions: retention time, precursor m/z, fragment ions, intensity ratios [74] |
| Quantification Approach | Single band intensity [74] | Multiple transitions per peptide, multiple peptides per protein [74] |
| Linear Dynamic Range | Limited | Superior [74] |
| Multiplexing Capacity | Low to moderate | High (100s of proteins simultaneously) [74] |
| Throughput | Moderate | High to very high |
| Information Obtained | Size approximation, presence/absence | Sequence confirmation, post-translational modifications, absolute quantification [74] |
| Assay Development | Antibody production and validation | Method development with synthetic peptides |
The superiority of MS for quantification stems from its multi-parameter confirmation system. As described in the comparative analysis, "SRM-based quantification, in contrast, uses multiple signals (multiple transitions per peptide, multiple peptides per protein, and multiple measurements of each signal) that are integrated into a composite score indicating the protein quantity" [74]. This multidimensional verification provides greater confidence in results compared to the single parameter (band intensity) measured in Western blotting.
Experimental Design and Methodologies
Mass Spectrometry-Centric Validation Workflows
Protocol 1: Targeted Proteomics Using Selected Reaction Monitoring (SRM)
Protein Extraction and Digestion: Extract proteins using appropriate lysis buffers. Reduce disulfide bonds with DTT (5 mM, 30 min at 50°C) and alkylate with iodoacetamide (15 mM, 30 min in darkness). Digest with trypsin (1:20-50 enzyme-to-protein ratio) overnight at 37°C [76] [77].
LC-MS/MS Analysis: Desalt peptides using C18 columns. Separate peptides using nanoflow HPLC with a 120-minute gradient from 3-35% acetonitrile in 0.1% formic acid. Analyze eluted peptides using a Q-Exactive mass spectrometer or similar instrument operating in targeted MS/MS mode [77].
Data Analysis: Process raw data using software such as FragPipe or Proteome Discoverer. For SRM, quantify target proteins using 3-5 unique peptides per protein and 3-5 transitions per peptide. Use isotopically labeled reference peptides for absolute quantification [74] [76].
Protocol 2: Mitochondrial RNA-Interacting Proteome Analysis
This specialized protocol demonstrates how MS can be adapted for specific organellar studies:
Crosslinking: Label cells with 100 μM 4-thiouridine for 18 hours, then expose to 302 nm UV light for 1 minute for whole-cell crosslinking or 6 minutes for isolated mitochondria [77].
Mitochondrial Isolation: Homogenize cells in hypotonic buffer, separate mitochondria by differential centrifugation (1,200 × g to remove debris, then 13,000 × g for mitochondrial pellet). Further purify using sucrose density gradients [77].
RNA-Protein Complex Isolation: Incubate mitochondrial lysates with oligo(dT) beads for 45 minutes to bind poly(A) RNA-protein complexes. Wash stringently under denaturing conditions, elute complexes, and treat with RNase to remove RNA [77].
MS Analysis: Process proteins, digest with trypsin, and analyze by LC-MS/MS as described in Protocol 1 [77].
Diagram 1: MS-centric validation workflow with optional Western blot confirmation
Western Blot Validation Protocols
Protocol 3: Antibody Validation for Western Blotting
Lysate Preparation: Prepare lysates from cells or tissues expressing the target protein. Include controls such as knockout/knockdown cells when possible [75] [78].
Gel Electrophoresis and Transfer: Separate proteins by SDS-PAGE using appropriate percentage gels based on target protein size. Transfer to nitrocellulose or PVDF membranes using standard protocols [78].
Antibody Optimization: Titrate primary antibody concentrations to determine optimal signal-to-noise ratio. Perform calibration curves to ensure linear response [78].
Detection and Analysis: Detect bands using chemiluminescent or fluorescent substrates. Image with a CCD camera or similar detection system. Analyze band intensity using densitometry software [78].
Protocol 4: Automated Western Blotting (Wes System)
Sample Preparation: Mix protein extracts with master mix to final concentration of 0.004-0.2 mg/ml total protein, 1× sample buffer, 1× fluorescent molecular weight markers, and 40 mM dithiothreitol. Heat at 95°C for 5 minutes [79].
Plate Loading: Load samples, blocking solution, primary antibodies, HRP-conjugated secondary antibodies, chemiluminescent substrate, and separation matrices into designated wells in a microplate [79].
Automated Analysis: Run fully automated electrophoresis and immunodetection with capillary system. Separate proteins at 375 V for 25 minutes. Incubate with primary and secondary antibodies for 30 minutes each [79].
Data Analysis: Capture chemiluminescence with CCD camera. Calculate relative protein amount based on peak area relative to total protein content. Use system control antibody for within-capillary normalization [79].
Advanced Validation Strategies
Integrated Approach: Combining MS and Western Blotting
While MS often provides superior quantification, Western blotting remains valuable for specific applications. The integrated approach leverages the strengths of both techniques:
MS-Driven Discovery Followed by Western Validation: Use MS for initial protein identification and quantification, then employ Western blotting for rapid assessment of additional samples or conditions [79].
Antibody Validation Using MS: Confirm Western blot antibody specificity by comparing band patterns with MS results. "Migration capture MS validation" compares staining pattern and protein size detected by the antibody with results obtained by capture Mass Spectrometry [78].
Complementary Information: SDS-PAGE-MS provides superior protein assignment numbers (2552 proteins in HBSMC supernatant), while native PAGE better preserves protein interactions [20].
Antibody Validation Techniques
Table 2: Antibody validation methods for Western blotting
| Validation Method | Description | Key Procedures |
|---|---|---|
| Genetic Strategies | Confirm specificity using cells with target protein knocked out/down | CRISPR-Cas9, RNAi; compare signal in control vs. knockout cells [75] |
| Orthogonal Strategies | Compare with antibody-independent quantification methods | MS-based quantification, correlation with RNA-seq data [75] |
| Independent Antibody | Use multiple antibodies against different epitopes of same target | Compare staining patterns of 2+ independent antibodies [75] [78] |
| Recombinant Expression | Express tagged target protein | FLAG, GFP tags; detect overexpression with antibody [75] |
| Migration Capture MS | Compare electrophoretic mobility with MS results | Align Western blot bands with MS-detected protein sizes [78] |
Diagram 2: Antibody validation strategies for Western blotting
Essential Research Reagents and Solutions
Table 3: Key research reagents for integrated validation workflows
| Reagent/Solution | Function | Application Notes |
|---|---|---|
| SDS-PAGE Gels | Protein separation by molecular weight | Essential for both Western blot and sample prep for MS [20] |
| Nondenaturing Gels | Protein separation maintaining native structure | Preserves protein interactions for functional studies [20] [3] |
| Primary Antibodies | Target protein detection | Require rigorous validation; monoclonal preferred for specificity [78] |
| Trypsin | Protein digestion for MS analysis | Sequencing-grade for reproducible digestion [76] [77] |
| C18 Desalting Columns | Peptide cleanup prior to MS | Remove salts and contaminants for improved MS signal [77] |
| Nitrocellulose/PVDF Membranes | Protein immobilization for Western blot | Nitrocellulose offers higher binding capacity [74] |
| Isotopically Labeled Peptides | Absolute quantification in MS | Internal standards for precise measurement [74] |
| 4-Thiouridine | RNA crosslinking for RNA-protein studies | Enables UV crosslinking for interaction studies [77] |
| Dithiothreitol (DTT) | Protein reduction | Breaks disulfide bonds for denaturation [79] [77] |
| Iodoacetamide | Protein alkylation | Prevents reformation of disulfide bonds [76] [77] |
The integration of Western blotting and mass spectrometry for result confirmation represents an evolving paradigm in protein analysis. While the scientific literature now clearly establishes that "the quality of MS data is vastly superior" for protein quantification [74], Western blotting remains a valuable tool for specific applications, particularly when antibodies are thoroughly validated. The comparison between SDS-PAGE and native PAGE further enriches this validation framework, as each separation method provides complementary information—with SDS-PAGE offering superior protein assignment numbers and native PAGE preserving protein interactions and complexes [20].
Future directions in validation techniques will likely see increased reliance on targeted MS methods like SRM as the gold standard for protein quantification, while Western blotting evolves to serve more specialized roles in rapid screening and educational applications. As the field progresses, the implementation of rigorous antibody validation protocols and the appropriate use of orthogonal confirmation methods will remain essential for producing reliable, reproducible protein research across basic science and drug development contexts.
For researchers, scientists, and drug development professionals, selecting the appropriate protein analysis method is crucial for obtaining accurate and relevant data. Sodium dodecyl sulfate–polyacrylamide gel electrophoresis (SDS-PAGE) and native polyacrylamide gel electrophoresis (native PAGE) are two foundational techniques in protein research, yet they serve distinctly different purposes. This guide provides an objective comparison of their performance, detailing what each method can and cannot reveal about your protein samples. Understanding their inherent limitations and capabilities ensures the selection of the most appropriate method for your research objectives, whether for qualitative analysis, functional studies, or structural characterization.
Core Principles and Separation Mechanisms
The fundamental difference between these techniques lies in their treatment of the protein's native structure, which directly dictates the type of information they can provide.
Table 1: Fundamental Principles of SDS-PAGE and Native PAGE
| Aspect | SDS-PAGE | Native PAGE |
|---|---|---|
| Core Principle | Separation based solely on molecular mass [54] [12]. | Separation based on size, overall charge, and shape [12]. |
| Protein State | Denatured and linearized [54] [55]. | Native, folded conformation [12]. |
| Key Reagent | SDS (anionic detergent) and reducing agents [12] [55]. | No denaturing agents; may use Coomassie dye (BN-PAGE) [71] [6]. |
| Charge Uniformity | SDS imposes a uniform negative charge [54]. | Protein retains its intrinsic charge [12]. |
| Sample Preparation | Includes heating and denaturing agents [12]. | No heating or denaturing agents [12]. |
The Denaturing Nature of SDS-PAGE
SDS-PAGE relies on the powerful anionic detergent SDS to denature proteins. SDS binds uniformly to the protein backbone, masking the protein's intrinsic charge and imparting a constant negative charge-to-mass ratio [54] [55]. This process, combined with heat and reducing agents like β-mercaptoethanol to break disulfide bonds, linearizes the proteins. Consequently, the migration distance through the polyacrylamide gel matrix depends almost entirely on the protein's molecular weight, allowing for mass estimation [12].
The Non-Denaturing Nature of Native PAGE
In contrast, native PAGE omits denaturing agents like SDS and heating steps. Proteins remain in their folded, native conformation, retaining their biological activity and complexed with cofactors [12]. Separation occurs based on a combination of the protein's intrinsic charge (determined by the amino acid sequence and buffer pH), its size, and its three-dimensional shape [55]. Variants of this technique include Blue-Native PAGE (BN-PAGE), which uses Coomassie dye to impose a charge shift for better separation of membrane protein complexes, and Clear-Native PAGE (CN-PAGE), which relies on the protein's intrinsic charge [71] [6].
Experimental Protocols and Methodologies
A direct comparison of standard laboratory protocols highlights the practical differences in executing these techniques.
Standard SDS-PAGE Protocol
This protocol is based on established, widely used methods [6] [55].
- Sample Preparation: Mix protein sample with a loading buffer containing SDS, a reducing agent (e.g., DTT or β-mercaptoethanol), glycerol, and a tracking dye (e.g., bromophenol blue). Heat the mixture at 95–100°C for 3–10 minutes to ensure complete denaturation [55].
- Gel Preparation: Cast a discontinuous gel system.
- Resolving Gel: Typically 7–12% polyacrylamide (choice depends on target protein size) in Tris-HCl buffer, pH ~8.8, containing 0.1% SDS.
- Stacking Gel: A low-percentage gel (e.g., 4%) at pH ~6.8, which serves to concentrate all protein samples into a sharp band before they enter the resolving gel [55].
- Electrophoresis: Load samples and molecular weight markers. Submerge the gel in a running buffer (e.g., Tris-Glycine) containing 0.1% SDS. Apply a constant voltage (e.g., 150-200V) until the dye front reaches the bottom of the gel [6].
- Post-Processing: Proteins are visualized using stains like Coomassie Brilliant Blue or silver stain [54].
Standard Native PAGE (BN-PAGE) Protocol
This protocol is adapted from methodologies used to study native complexes [71] [6].
- Sample Preparation: Mix protein sample with a loading buffer containing no SDS or reducing agents. The buffer typically includes glycerol and a dye, but the sample is not heated [12]. For BN-PAGE, the buffer and cathode buffer contain Coomassie G-250 dye [6].
- Gel Preparation: Cast a gradient gel (e.g., 4–16% polyacrylamide) to separate a wide range of protein sizes and complexes. The gel buffer, such as Bis-Tris, lacks SDS [6].
- Electrophoresis: Use a specialized cathode (light blue, containing Coomassie) and anode (clear) running buffer system without SDS. Run the gel at a constant voltage (e.g., 150V) at 4°C to maintain protein stability, as the process generates heat that could denature proteins [6] [12].
- Post-Processing: Gels are often processed for in-gel activity assays or further western blotting to identify specific proteins.
Performance Comparison: Advantages and Limitations
The choice between SDS-PAGE and native PAGE involves a trade-off between resolution and the preservation of native protein properties. The following table and diagram summarize these key performance differentiators.
Table 2: Quantitative and Qualitative Performance Comparison
| Performance Metric | SDS-PAGE | Native PAGE |
|---|---|---|
| Resolution | High resolution for denatured proteins by mass [54] [80]. | Lower resolution for complex mixtures [6]. |
| Functional Data | Cannot assess activity; proteins are denatured [6] [12]. | Can assess activity; proteins remain functional [6] [12]. |
| Structural Data | Reveals subunit molecular weight and purity. | Reveals native oligomeric state and protein-protein interactions [12] [81]. |
| Cofactor Retention | Non-covalently bound metal ions and cofactors are lost [6]. | Bound metal ions and cofactors are largely retained [6]. |
| Quantitative Capability | Primarily qualitative; semi-quantitative with staining [54] [80]. | Primarily qualitative. |
| Protein Recovery | Proteins are denatured and cannot be recovered functionally [12]. | Native proteins can be recovered for downstream functional studies [12]. |
| Typical Run Time | ~45-60 minutes [6]. | ~90-95 minutes [6]. |
Diagram 1: Method Selection Workflow. This flowchart guides researchers in choosing the appropriate electrophoretic method based on their primary analytical goal, highlighting the mutually exclusive nature of obtaining high-resolution molecular weight data versus native functional data.
Limitations in Detail
- SDS-PAGE Limitations: The most significant limitation is the complete loss of native protein conformation and function [54] [6]. This makes it impossible to study enzymatic activity, protein-protein interactions, or the role of non-covalently bound cofactors like metal ions [6]. Furthermore, it cannot distinguish between proteins with identical molecular weights but different sequences or functions [80]. While useful for estimating relative abundance, its quantitative accuracy is limited due to variations in staining efficiency between different proteins [54].
- Native PAGE Limitations: The primary limitation is its lower resolving power compared to SDS-PAGE, especially for complex protein mixtures [6]. The migration distance depends on multiple factors (size, charge, shape), complicating the estimation of native molecular mass [71]. The technique can be more complex to optimize, requires careful temperature control (often at 4°C), and may not dissociate strong protein interactions [12] [81].
Advanced and Emerging Alternatives
To address the limitations of classic one-dimensional electrophoresis, researchers have developed advanced and complementary techniques.
Two-Dimensional (2D) Electrophoresis
A powerful approach combines the strengths of both native and denaturing electrophoresis. In 2D BN/SDS-PAGE, protein complexes are first separated by BN-PAGE. The entire lane is then excised, laid on a second gel, and subjected to SDS-PAGE. This separates the individual subunits of the complexes, providing information on both the intact complex composition and the molecular weights of its constituents [81]. However, this method is time-consuming, requires significant technical skill, and can be challenging for membrane protein complexes, which may dissociate [81].
Capillary Electrophoresis-SDS (CE-SDS)
CE-SDS is a modern, automated evolution of SDS-PAGE that addresses many of its manual limitations. It replaces the gel matrix with a polymer-filled capillary and uses UV detection for quantification. Key advantages over traditional SDS-PAGE include automation, high reproducibility, quantitative data output, and faster run times (as little as 5 minutes per sample) [82]. It is recognized by regulatory authorities and is widely used in the biopharmaceutical industry for applications like monoclonal antibody purity characterization [82].
Native SDS-PAGE (NSDS-PAGE)
A hybrid method, NSDS-PAGE, modifies standard SDS-PAGE conditions by removing SDS and EDTA from the sample buffer, omitting the heating step, and drastically reducing the SDS concentration in the running buffer. This protocol was shown to retain the activity of 7 out of 9 model enzymes and increase Zn²⁺ retention from 26% to 98% compared to standard SDS-PAGE, while maintaining high-resolution separation [6] [83]. This offers a potential middle ground for certain applications.
The Scientist's Toolkit: Essential Reagent Solutions
Table 3: Key Reagents for PAGE Experiments
| Reagent | Function | SDS-PAGE | Native PAGE |
|---|---|---|---|
| SDS (Sodium Dodecyl Sulfate) | Denatures proteins and imparts uniform charge [54]. | Essential | Not Used |
| Reducing Agents (DTT, BME) | Breaks disulfide bonds for full denaturation [55]. | Essential | Not Used |
| Coomassie Dye G-250 | Binds proteins for visualization (BN-PAGE) and charge shift [71] [6]. | Not Used | Essential (BN-PAGE) |
| Polyacrylamide Gel | Sieving matrix for size-based separation [55]. | Essential | Essential |
| Tris-based Buffers | Maintains pH for electrophoresis and protein stability [55]. | Essential | Essential |
| Activity Assay Reagents | To detect enzymatic function directly in the gel (e.g., substrates). | Not Applicable | Used for Validation |
SDS-PAGE and native PAGE are complementary, not competing, techniques in the protein scientist's arsenal. SDS-PAGE is the undisputed choice for high-resolution separation and molecular weight determination of denatured proteins, offering simplicity and reproducibility. In contrast, native PAGE is indispensable for functional analyses, enabling the study of proteins in their active, native state with retained cofactors and complex interactions. The emergence of techniques like CE-SDS and 2D-PAGE addresses specific limitations, providing pathways to automation and more comprehensive analysis. The optimal choice is dictated entirely by the research question: what do you need to reveal about your proteins—their mass or their function?
In protein analysis, the choice of separation technique fundamentally shapes the experimental outcome. While one-dimensional sodium dodecyl sulfate-polyacrylamide gel electrophoresis (SDS-PAGE) is a cornerstone method for estimating protein molecular weight, its simplicity also constitutes its primary limitation. It cannot resolve complex protein mixtures with sufficient detail for advanced proteomic studies. This guide objectively compares the performance of two-dimensional polyacrylamide gel electrophoresis (2D-PAGE) with other advanced methodologies, framing the discussion within the broader context of SDS-PAGE versus native PAGE. For researchers and drug development professionals, understanding these nuances is critical for selecting the optimal tool for applications ranging from biomarker discovery to quality control of biopharmaceuticals.
Core Separation Principles: A Comparative Foundation
The journey beyond one-dimensional separation begins with a clear understanding of the foundational techniques. The table below contrasts the core principles of SDS-PAGE and Native PAGE, upon which more advanced methods are built.
Table 1: Core Principles of One-Dimensional Gel Electrophoresis Techniques
| Feature | SDS-PAGE | Native PAGE |
|---|---|---|
| Primary Separation Basis | Molecular mass [36] | Combined charge, size, and hydrodynamic shape [36] |
| Sample Condition | Denatured and reduced (primary structure) [36] | Native state (higher-order structures preserved) [36] |
| Key Reagent | Sodium dodecyl sulfate (SDS) [36] | Non-denaturing detergents or buffers [8] |
| Protein Charge | Uniform negative charge from SDS coating [36] | Intrinsic charge of the native protein [36] |
| Multimeric Structure | Disrupted [36] | Often preserved [36] |
| Ideal Application | Molecular weight estimation, western blotting [84] [36] | Studying native conformation, protein-protein interactions, and biological activity [8] [36] |
Advanced Separation Techniques: Performance and Data
Building upon the core principles, advanced separation methods offer vastly improved resolution for complex samples. The following section provides a detailed performance comparison of these sophisticated techniques.
Two-Dimensional PAGE (2D-PAGE)
2D-PAGE combines two orthogonal separation principles to achieve high resolution. A common implementation uses native PAGE in the first dimension to preserve protein interactions, followed by SDS-PAGE in the second dimension to denature and separate the components by mass [8].
- Experimental Protocol (Native/SDS 2D-PAGE): A detailed protocol for detecting protein interactions, such as between interleukin-2 (IL-2) and its receptor (IL-2Rα), involves separating the protein extract from E. coli cells using native PAGE in the first dimension. The gel strip is then incubated in SDS-containing buffer, placed atop an SDS-polyacrylamide gel, and electrophoresed in the second dimension [8]. Proteins involved in an interaction migrate as spots with abnormal mobility on the resulting 2-D map compared to controls [8].
- Performance Data: This method demonstrates "reasonably good resolution and excellent reproducibility" when separating soluble protein extract from E. coli, enabling the detection of specific protein complexes amidst hundreds of other protein spots [8].
Automated Western Blotting Systems
To address the time-consuming and variable nature of traditional Western blotting, automated systems have been developed with different degrees of automation [85].
- Experimental Protocol (Traditional vs. Automated): In a direct comparison study, traditional Western blotting involved manual SDS-PAGE, transfer to a membrane, and overnight incubation with primary antibodies [85]. This was compared to two automated systems: the semi-automated iBind Flex, which performs immunodetection using sequential lateral flow, and the fully automated JESS Simple Western, which uses capillary-based size separation and immunoblotting without a gel or membrane [85].
- Performance Data: The comparative study found that the fully automated JESS Simple Western system saved significant time and offered valuable sensitivity, which is particularly beneficial when sample amounts are limited. A downside is the higher cost of devices and reagents. The semi-automated iBind Flex system also reduces hands-on time but requires higher antibody concentrations [85].
Table 2: Performance Comparison of Advanced Protein Separation and Analysis Methods
| Method | Key Advantage | Key Limitation | Reproducibility | Hands-On Time | Ideal for Complex Mixtures? |
|---|---|---|---|---|---|
| 2D-PAGE (Native/SDS) | Detects protein-protein interactions in complex mixtures [8] | Can exhibit streaking, especially for lower molecular weight proteins [8] | Excellent reproducibility reported [8] | High (manual method) | Yes [8] |
| Traditional Western Blot | Ability to identify specific proteins; wide accessibility [85] | Time-consuming (1-3 days); potential for poor reproducibility [85] | Can suffer from lack of reproducibility [85] | High | No (typically follows 1D separation) |
| Semi-Automated WB (e.g., iBind Flex) | Reduced hands-on time for immunodetection [85] | Higher concentration of antibodies required [85] | Increased through automation of key steps [85] | Medium | No (typically follows 1D separation) |
| Fully Automated WB (e.g., JESS Simple Western) | High sensitivity; minimal sample requirement; full automation [85] | High cost of devices and reagents [85] | Greater reproducibility through full automation [85] | Low | Yes (capillary-based) |
Visualizing Method Workflows
The following diagram illustrates the logical workflow and key decision points for selecting an advanced protein separation method, based on research goals and sample constraints.
Essential Research Reagent Solutions
The execution of these advanced protocols relies on a suite of critical reagents and materials. The following table details key items and their functions in protein separation experiments.
Table 3: Key Research Reagent Solutions for Protein Separation Workflows
| Reagent/Material | Function | Example Use Case |
|---|---|---|
| SDS (Sodium Dodecyl Sulfate) | Denatures proteins and imparts a uniform negative charge, allowing separation by mass alone [36]. | SDS-PAGE; second dimension of 2D-PAGE [8] [36]. |
| Polyacrylamide Gel Matrix | A porous matrix that acts as a molecular sieve, impeding protein migration based on size [36]. | Size separation in SDS-PAGE and the second dimension of most 2D-PAGE systems [8] [36]. |
| Molecular Weight Markers | Proteins of known size used to calibrate the gel and estimate the molecular weight of unknown proteins [36]. | Included in a parallel lane during SDS-PAGE for calibration [36]. |
| Reducing Agent (e.g., β-mercaptoethanol) | Breaks disulfide bonds within and between protein subunits, ensuring complete denaturation [36]. | Added to sample buffer for SDS-PAGE to analyze primary structure [36]. |
| Primary Antibody | A specific antibody that binds to the target protein of interest [85]. | Used in Western blotting for specific detection after separation [85]. |
| Secondary Antibody (HRP-conjugated) | An antibody that binds the primary antibody and is conjugated to an enzyme (e.g., HRP) for detection [85]. | Applied after the primary antibody in Western blotting to generate a chemiluminescent or colorimetric signal [85]. |
| Tris-Glycine Buffer | A common discontinuous buffering system that stacks and then resolves proteins for sharp bands [36]. | Running buffer for standard SDS-PAGE [36]. |
| Protease Inhibitors | Prevents the degradation of sample proteins by proteases released during cell lysis [36]. | Added to lysis buffers during sample preparation to maintain protein integrity [36]. |
Conclusion
SDS-PAGE and Native PAGE are not competing but complementary techniques that serve distinct purposes in the protein analysis workflow. SDS-PAGE excels in providing high-resolution separation based primarily on molecular weight, making it indispensable for determining protein size, assessing purity, and analyzing expression levels. In contrast, Native PAGE preserves protein structure and function, enabling the study of protein complexes, oligomerization states, and enzymatic activity. The choice between these methods should be guided by specific research objectives—whether the goal is structural characterization or functional analysis. Future directions in protein electrophoresis include the refinement of hybrid techniques like NSDS-PAGE, which aims to balance high resolution with native property retention, particularly for metalloprotein analysis. As proteomics continues to advance, both techniques will remain foundational, often serving as critical first steps in comprehensive analytical pipelines that incorporate western blotting, mass spectrometry, and other advanced methodologies to provide a complete picture of protein structure and function in biomedical research and therapeutic development.
References
- 1. Overview of Protein Electrophoresis [https://www.thermofisher.com/us/en/home/life-science/protein-biology/protein-biology-learning-center/protein-biology-resource-library/pierce-protein-methods/overview-electrophoresis.html]
- 2. SDS-PAGE Analysis of proteins: Principles, methodology ... [https://deepscienceresearch.com/dsr/catalog/book/107/chapter/407]
- 3. How Is Native PAGE Different from SDS-PAGE? [https://synapse.patsnap.com/article/how-is-native-page-different-from-sds-page]
- 4. What's the Difference Between SDS-PAGE and Native ... [https://synapse.patsnap.com/article/whatE28099s-the-difference-between-sds-page-and-native-page]
- 5. SDS-PAGE in Food Science: Elevating Protein Insight and ... [https://www.eurofinsus.com/food-testing/resources/sds-page-in-food-science-elevating-protein-insight-and-product-integrity/]
- 6. Native SDS-PAGE: High Resolution Electrophoretic ... [https://pmc.ncbi.nlm.nih.gov/articles/PMC4517606/]
- 7. Interpret SDS-PAGE vs Native-PAGE Results [https://www.letstalkacademy.com/sds-page-vs-native-page-protein-dimer/]
- 8. Using native gel in two-dimensional PAGE for the detection ... [https://www.sciencedirect.com/science/article/abs/pii/S0165022X99000093]
- 9. Two-dimensional Blue Native/SDS-PAGE Analysis ... [https://pmc.ncbi.nlm.nih.gov/articles/PMC2649812/]
- 10. SDS-PAGE: The science behind all those bubbles [https://www.antibodiesinc.com/pages/sds-page-demystified?srsltid=AfmBOoq4qtwioSqLfQbQgA0Ihp9VVUGWGEByafmJxYLEzrIUijaljkGH]
- 11. SDS-PAGE [https://en.wikipedia.org/wiki/SDS-PAGE]
- 12. Differences between SDS PAGE and Native PAGE [https://www.geeksforgeeks.org/biology/differences-between-sds-page-and-native-page/]
- 13. Deciphering food proteins: The applications of SDS-PAGE ... [https://www.sciencedirect.com/science/article/abs/pii/S2212429225003025]
- 14. Rapid baseline hump-free analysis of therapeutic proteins ... [https://www.sciencedirect.com/science/article/pii/S0003267025005410]
- 15. SDS PAGE vs Native PAGE [https://byjus.com/biology/difference-between-sds-page-and-native-page/]
- 16. What is the difference between PAGE and SDS-PAGE? [https://www.aatbio.com/resources/faq-frequently-asked-questions/What-is-the-difference-between-PAGE-and-SDS-PAGE]
- 17. Comparison of the performance of 1D SDS-PAGE with ... [https://www.sciencedirect.com/science/article/abs/pii/S1570023218312546]
- 18. Protein Analysis Techniques Explained [https://www.atascientific.com.au/3-protein-analysis-techniques/]
- 19. Comparison of in-gel protein separation techniques ... [https://pmc.ncbi.nlm.nih.gov/articles/PMC4234072/]
- 20. Comparison of the performance of 1D SDS-PAGE with ... [https://pubmed.ncbi.nlm.nih.gov/30599360/]
- 21. A Database of Accurate Electrophoretic Migration Patterns ... [https://www.sciencedirect.com/science/article/pii/S0022283622005605]
- 22. Overview of Protein Electrophoresis [https://www.thermofisher.com/ru/en/home/life-science/protein-biology/protein-biology-learning-center/protein-biology-resource-library/pierce-protein-methods/overview-electrophoresis.html]
- 23. SDS-PAGE Protocol [https://www.rockland.com/resources/sds-page-protocol/?srsltid=AfmBOop_vZaO6hyWHiFX1Rs_yA4bM5MUVwxmuIEfTrrrLhymTUkblIVT]
- 24. SDS-PAGE [http://www.assay-protocol.com/molecular-biology/electrophoresis/denaturing-page.html]
- 25. Native-PAGE [http://www.assay-protocol.com/molecular-biology/electrophoresis/native-page.html]
- 26. Principle and Protocol of Native-PAGE [https://www.creativebiomart.net/resource/principle-protocol-principle-and-protocol-of-native-page-435.htm]
- 27. Blue native electrophoresis protocol [https://www.abcam.com/en-us/technical-resources/protocols/blue-native-electrophoresis]
- 28. SDS-PAGE Gel Electrophoresis [https://www.protocols.io/view/sds-page-gel-electrophoresis-7hnhj5e.html]
- 29. How SDS-PAGE Separates Proteins [https://azurebiosystems.com/blog/how-sds-page-separates-proteins/]
- 30. Mastering Electrophoresis: Techniques, Equipment, and ... [https://www.labx.com/resources/mastering-electrophoresis-techniques-equipment-and-applications-in-dna-rna-and-protei/5535]
- 31. An Easy SDS-PAGE Gel Recipe & 10-Step Protocol [https://bitesizebio.com/59429/sds-page-gel-recipe/]
- 32. Steps in Nucleic Acid Gel Electrophoresis [https://www.thermofisher.com/us/en/home/life-science/cloning/cloning-learning-center/invitrogen-school-of-molecular-biology/na-electrophoresis-education/na-electrophoresis-workflow.html]
- 33. Gel Electrophoresis Steps [https://azurebiosystems.com/blog/gel-electrophoresis-steps/]
- 34. Troubleshooting SDS-PAGE Gel Running Issues [https://www.goldbio.com/blogs/articles/troubleshooting-sds-page-gel-running-issues?srsltid=AfmBOoquTGuoFKecP6pQyX8ZTL0fA2SW31x6RVla4Eg9VWZDpqWM9NnP]
- 35. mPAGE® Lux Gel Casting System: Bridging Efficacy and ... [https://www.labroots.com/trending/immunology/26588/mpage-lux-gel-casting-system-bridging-efficacy-convenience-innovation?srsltid=AfmBOop7tG-IgP7w6sEJYVXw7uEMsbOzWo0T4-p7iVVk2sizQUIUtM7B]
- 36. Western blotting guide: Part 2, Protein separation by SDS- ... [https://www.jacksonimmuno.com/secondary-antibody-resource/technical-tips/western-blotting-guide-part-2/]
- 37. How current, voltage, and power settings affect SDS-PAGE [https://www.biossusa.com/blogs/news/how-current-voltage-and-power-settings-affect-sds-page?srsltid=AfmBOopq6QN6z8A1BaYURy-d3rJ6wQjxFdG8uaoLt7ukO2J8jNNtXf-Q]
- 38. Constant Current or Voltage in SDS-PAGE [https://bitesizebio.com/51744/constant-current-or-voltage-in-sds-page/]
- 39. One-Dimensional SDS and Non-Denaturing Gel ... [https://www.thermofisher.com/us/en/home/references/protocols/proteins-expression-isolation-and-analysis/sds-page-protocol/one-dimensional-sds-and-non-denaturing-gel-electrophoresis.html]
- 40. Advantage of discontinuous buffer system in SDS and native ... [https://www.letstalkacademy.com/advantage-of-discontinuous-buffer-system-in-sds-and-native-page/]
- 41. Protein Gel Staining Methods [https://www.thermofisher.com/us/en/home/life-science/protein-biology/protein-biology-learning-center/protein-biology-resource-library/pierce-protein-methods/protein-gel-stains.html]
- 42. How to Choose between G250 or R250 Coomassie Dyes [https://info.gbiosciences.com/blog/how-to-choose-between-g250-or-r250-coomassie-dyes]
- 43. Protein Gel Staining: Coomassie, Silver, Fluorescent & More [https://www.creative-proteomics.com/resource/protein-gel-staining-methods.htm]
- 44. Silver Staining - an overview [https://www.sciencedirect.com/topics/immunology-and-microbiology/silver-staining]
- 45. Mastering Silver Staining for Protein Gel Analysis [https://www.abcam.com/en-us/knowledge-center/western-blot/silver-staining-protein-gel-detection-guide]
- 46. Coomassi Blue Staining [https://www.thermofisher.com/us/en/home/references/protocols/proteins-expression-isolation-and-analysis/staining-protein-gels/coomassie-staining.html]
- 47. Coomassie Staining and Destaining - Oslo [https://www.ous-research.no/no/enserink/Protocols/14535]
- 48. SDS-PAGE: A Cornerstone of Protein Analysis in Modern ... [https://www.metwarebio.com/sds-page-protein-analysis/]
- 49. Comparing SDS-PAGE and CE-SDS for Antibody Purity ... [https://www.bioprocessintl.com/qa-qc/comparing-sds-page-and-ce-sds-for-antibody-purity-analysis]
- 50. Protein analysis SDS PAGE [https://www.qiagen.com/us/knowledge-and-support/knowledge-hub/bench-guide/protein/protein-analysis/protein-analysis-sds-page]
- 51. [24] Molecular weight analysis of proteins [https://www.sciencedirect.com/science/article/abs/pii/007668799093432K]
- 52. A comparative study of CE-SDS, SDS-PAGE, and Simple ... [https://pubmed.ncbi.nlm.nih.gov/33956358/]
- 53. A comparative study of CE-SDS, SDS-PAGE, and Simple ... [https://pubmed.ncbi.nlm.nih.gov/33185281/]
- 54. Advantages and Disadvantages of SDS-PAGE for Protein ... [https://www.mtoz-biolabs.com/advantages-and-disadvantages-of-sds-page-for-protein-separation.html]
- 55. Polyacrylamide Gel Electrophoresis, How It... | Technology Networks [https://www.technologynetworks.com/analysis/articles/polyacrylamide-gel-electrophoresis-how-it-works-technique-variants-and-its-applications-359100]
- 56. . Native - What's the Difference? | This Page . That vs SDS vs [https://thisvsthat.io/native-page-vs-sds]
- 57. Troubleshooting SDS-PAGE Gel Running Issues [https://www.goldbio.com/blogs/articles/troubleshooting-sds-page-gel-running-issues?srsltid=AfmBOophOL5wEJ7QkCljh6D_yJYngelYT_BdsxJEMZcZc1c4Vs9ioD_I]
- 58. Troubleshooting Common Electrophoresis Problems and ... [https://www.labx.com/resources/troubleshooting-common-electrophoresis-problems-and-artifacts/5539]
- 59. 6 Best Tips for Troubleshooting Poor Band Separation on ... [https://azurebiosystems.com/blog/6-tips-for-troubleshooting-poor-band-separation-on-sds-page-gels/]
- 60. Troubleshooting Sodium Dodecyl Sulfate- Polyacrylamide ... [https://www.hycultbiotech.com/sds-page/troubleshooting/]
- 61. Troubleshooting SDS-PAGE Sample Preparation Issues [https://www.goldbio.com/blogs/articles/troubleshooting-sds-page-sample-preparation-issues?srsltid=AfmBOorbZxAKtGwv73zBtYLlpAUBtRuXRQ8vu8_KIxVaZHoyzg8e-lQw]
- 62. SDS-PAGE Troubleshooting: Why Are My Protein Bands ... [https://synapse.patsnap.com/article/sds-page-troubleshooting-why-are-my-protein-bands-fuzzy]
- 63. Native SDS-PAGE: high resolution electrophoretic ... [https://pubs.rsc.org/en/content/articlelanding/2014/mt/c4mt00033a]
- 64. Electrophoresis in western blot [https://www.abcam.com/en-us/technical-resources/guides/western-blot-guide/electrophoresis]
- 65. A Guide to Choosing the Right Gel for Protein Gel ... [https://biobasic-asia.com/choosing-guide-protein-gel/]
- 66. SDS-PAGE: The science behind all those bubbles [https://www.antibodiesinc.com/pages/sds-page-demystified?srsltid=AfmBOoo0o0CxjixjZBtfdoVXzNwJ-R3oI_a100avv57W8c1qhPKYBonP]
- 67. What Are the Different Types of Western Blot Gels? [https://www.licorbio.com/blog/types-of-western-blot-gels]
- 68. A Guide to Gradient Gels: The Why's and How's [https://bitesizebio.com/47184/gradient-gels/]
- 69. High-resolution native electrophoresis in-gel activity assay ... [https://www.nature.com/articles/s41598-025-24684-3]
- 70. SDS Electrophoresis on Gradient Polyacrylamide Gels as a ... [https://www.mdpi.com/2075-4418/13/9/1513]
- 71. Advantages and limitations of clear-native PAGE [https://pubmed.ncbi.nlm.nih.gov/16220535/]
- 72. Validation of blue- and clear-native polyacrylamide gel ... [https://pmc.ncbi.nlm.nih.gov/articles/PMC12445495/]
- 73. DeFrND: detergent-free reconstitution into native ... [https://www.nature.com/articles/s41467-025-63275-8]
- 74. Western Blots versus Selected Reaction Monitoring Assays [https://pmc.ncbi.nlm.nih.gov/articles/PMC3769317/]
- 75. How and why you should validate your antibodies [https://azurebiosystems.com/blog/quantitative-western-blotting-how-and-why-you-should-validate-your-antibodies/]
- 76. Comparative analysis and optimization of proteomic ... [https://www.nature.com/articles/s40494-025-02002-4]
- 77. A Combined Mass Spectrometry and Data Integration ... [https://www.frontiersin.org/journals/cell-and-developmental-biology/articles/10.3389/fcell.2019.00283/full]
- 78. How to Validate Antibodies with Western Blot on a Budget [https://www.neobiotechnologies.com/resources/antibody-validation-western-blot/?srsltid=AfmBOoqudN2QYbXtCraTbBg312jfQbrMbPi_wFJIKfjILba6HB22Wxvh]
- 79. Western blotting validation of mass spectrometry data [https://bio-protocol.org/exchange/minidetail?id=203675&type=30]
- 80. Advantages and Disadvantages of SDS-PAGE Based ... [https://www.mtoz-biolabs.com/advantages-and-disadvantages-of-sds-page-based-protein-separation.html]
- 81. Advantages and Disadvantages of 2D Blue Native/SDS- ... [https://www.mtoz-biolabs.com/advantages-and-sisadvantages-of-2d-blue-native-sds-page-protein-complex-analysis.html]
- 82. Resolve SDS-PAGE Disadvantages with CE-SDS [https://www.bio-techne.com/instruments/ice/advantages-ce-sds-over-sds-page]
- 83. - Native : high resolution electrophoretic separation of... SDS PAGE [https://pubmed.ncbi.nlm.nih.gov/24686569/]
- 84. What is the difference between SDS-PAGE and western blot? [https://www.aatbio.com/resources/faq-frequently-asked-questions/What-is-the-difference-between-SDS-PAGE-and-western-blot]
- 85. Comparison of Automated and Traditional Western Blotting ... [https://pmc.ncbi.nlm.nih.gov/articles/PMC10142486/]