SDS-PAGE vs. IEF-IPG: A Comprehensive Comparison for Advanced Proteomic Profiling
This article provides a detailed analytical comparison of SDS-PAGE and IEF-IPG techniques for proteomic profiling, addressing the critical needs of researchers and drug development professionals.
SDS-PAGE vs. IEF-IPG: A Comprehensive Comparison for Advanced Proteomic Profiling
Abstract
This article provides a detailed analytical comparison of SDS-PAGE and IEF-IPG techniques for proteomic profiling, addressing the critical needs of researchers and drug development professionals. We explore foundational principles, methodological applications, and practical optimization strategies for both separation techniques. Drawing from recent scientific evidence, we demonstrate that while 1-D SDS-PAGE and IEF-IPG provide complementary protein identification results, IEF-IPG offers superior peptides per protein detection, making these techniques orthogonal rather than competitive. The content includes troubleshooting guidance for common experimental challenges and validates performance through comparative studies of resolution, dynamic range, and proteoform detection capabilities, ultimately providing a strategic framework for technique selection in biomedical research.
Core Principles: Understanding the Separation Mechanisms of SDS-PAGE and IEF-IPG
In proteomic profiling research, the ability to separate complex protein mixtures is a fundamental prerequisite for detailed analysis. Two electrophoresis techniques form the cornerstone of protein separation: Sodium Dodecyl Sulfate-Polyacrylamide Gel Electrophoresis (SDS-PAGE) and Isoelectric Focusing with Immobilized pH Gradients (IEF-IPG). These methods operate on distinct biochemical principles—molecular weight and isoelectric point, respectively—making them complementary yet competitive tools in the researcher's arsenal [1]. The selection between these techniques significantly influences the type and quality of data obtained in drug development and basic research applications.
SDS-PAGE, first described by Laemmli in 1970, revolutionized protein analysis by providing a simple, reproducible method for separating polypeptides by molecular mass [2]. Meanwhile, IEF-IPG represents a more recent refinement of isoelectric focusing technology, offering enhanced reproducibility and resolution through stabilized pH gradients [2] [3]. Both techniques have evolved to address the growing demands of proteomics, where researchers routinely analyze thousands of proteins simultaneously.
This guide provides an objective comparison of these foundational separation methods, examining their technical principles, performance characteristics, and applicability in modern proteomic research. We present experimental data and methodological details to assist researchers and drug development professionals in selecting the optimal approach for their specific applications.
Fundamental Separation Principles
SDS-PAGE: Separation by Molecular Weight
SDS-PAGE separates proteins primarily according to their molecular mass through a sophisticated biochemical process. The technique employs the anionic detergent sodium dodecyl sulfate (SDS), which denatures proteins by disrupting non-covalent bonds and binds to the polypeptide backbone at a constant ratio of approximately 1.4 g SDS per 1 g of protein [4]. This SDS coating imparts a uniform negative charge to all proteins, effectively masking their intrinsic charge properties [1] [5]. Consequently, when an electric field is applied, all proteins migrate toward the anode at rates determined principally by their size rather than their native charge [1].
The polyacrylamide gel matrix serves as a molecular sieve that regulates protein migration. The cross-linked polymer network creates pores whose size depends on the acrylamide concentration—higher percentages create smaller pores that retard movement of larger molecules [1] [4]. Proteins of smaller mass navigate these pores more readily and thus migrate faster through the gel, while larger proteins encounter greater resistance and migrate more slowly [5]. This relationship between migration distance and molecular size enables accurate mass determination when compared with standardized protein markers.
The discontinuous buffer system in SDS-PAGE significantly enhances resolution. The technique employs a stacking gel (pH ~6.8) with low acrylamide concentration and a resolving gel (pH ~8.8) with higher acrylamide concentration [4]. Glycine ions in the running buffer undergo charge state changes as they move between these different pH environments, creating a sharp voltage gradient that concentrates proteins into thin bands before they enter the resolving gel, thereby improving separation clarity [4].
IEF-IPG: Separation by Isoelectric Point
IEF-IPG separates proteins based on their isoelectric point (pI)—the specific pH at which a protein carries no net electrical charge [1] [5]. This technique employs a stable, immobilized pH gradient created by covalently attached ampholytes within a gel strip [3]. When an electric field is applied, charged protein molecules migrate through this gradient until they reach the pH region matching their pI, at which point they become neutral and cease movement [3] [6]. This focusing effect concentrates proteins into sharp, stationary bands at their respective pI positions.
The immobilized pH gradient technology represents a significant advancement over earlier liquid ampholyte systems, offering superior reproducibility, resolution, and stability [2] [3]. Unlike mobile carrier ampholytes, the covalently fixed gradient cannot drift during extended running times, ensuring consistent focusing patterns across multiple experiments [3]. Modern IPG strips are available in various pH ranges (broad-range 3-10 or narrow-range for enhanced resolution) to accommodate different experimental needs.
The fundamental separation mechanism relies on the amphoteric nature of proteins, which contain both acidic and basic functional groups. In pH regions below their pI, proteins carry a positive charge and migrate toward the cathode; in regions above their pI, they acquire a negative charge and move toward the anode [1]. This bidirectional migration concentrates proteins at their pI positions with exceptional resolution, capable of distinguishing isoforms differing by as little as 0.01 pH units under optimal conditions [2].
Comparative Performance Analysis
Quantitative Technical Comparison
The following table summarizes key performance metrics for SDS-PAGE and IEF-IPG based on experimental data from proteomic studies:
Table 1: Performance comparison between SDS-PAGE and IEF-IPG for proteomic analysis
| Parameter | SDS-PAGE | IEF-IPG | Experimental Basis |
|---|---|---|---|
| Primary Separation Principle | Molecular weight | Isoelectric point (pI) | [1] [5] |
| Theoretical Resolution | 2-10 kDa difference | 0.01 pH units | [2] |
| Typical Run Time | 45-60 minutes | 24-36 hours | [7] [6] |
| Sample Loading Capacity | ~200 μg (mini-gel) | 200-500 μg (IPG strip) | [6] |
| Protein Identification Yield | 1D: ModerateGeLC-MS: High | Higher unique peptide identifications | [8] [3] |
| Reproducibility | High with standardized protocols | High with IPG technology | [2] [3] |
| Retention of Native Structure | No (denaturing conditions) | Variable (native or denaturing) | [7] [1] |
| Compatibility with MS Analysis | High (after destaining) | High | [8] [3] |
Separation Efficiency and Protein Identification
Comparative studies directly evaluating these techniques for proteomic profiling reveal distinct advantages for each method. Research by Jafari et al. demonstrated that both 1D SDS-PAGE and IEF-IPG provided complementary protein identification results, with IEF-IPG yielding the highest average number of detected peptides per protein [8]. This enhanced peptide detection contributes to more confident protein identifications in mass spectrometry-based analyses.
When used as fractionation techniques prior to LC-MS/MS analysis, IEF-IPG demonstrates particular strength in reducing sample complexity and improving detection sensitivity for low-abundance proteins [3]. The orthogonal separation principle based on pI effectively distributes peptides across multiple fractions, decreasing dynamic range limitations that often hinder detection of less abundant species in complex mixtures [3]. However, SDS-PAGE-based GeLC-MS approaches (where entire lanes are excised and digested) remain highly effective for comprehensive proteome coverage [8].
Practical Considerations for Research Applications
Several practical factors influence technique selection for specific applications:
Throughput Requirements: SDS-PAGE offers significantly faster separation, making it preferable for high-throughput screening applications where rapid results are essential [7]. IEF-IPG requires substantially longer run times (often overnight focusing) but provides higher resolution for complex samples [6].
Sample Compatibility: SDS-PAGE effectively handles a wide range of protein types, including membrane proteins that require detergent solubilization [4]. IEF-IPG may encounter challenges with very alkaline proteins or those with extreme hydrophobicity [2].
Downstream Applications: For western blotting, SDS-PAGE is the established standard due to the compatibility of denatured proteins with antibody detection [5]. For mass spectrometry, both techniques are widely employed, though IEF-IPG may offer advantages for detecting post-translational modifications that alter pI [3].
Detailed Experimental Protocols
Standard SDS-PAGE Methodology
Sample Preparation:
- Dilute protein samples in Laemmli buffer (62.5 mM Tris-HCl, pH 6.8, 2% SDS, 10% glycerol, 5% β-mercaptoethanol, 0.01% bromophenol blue) [4].
- Heat samples at 70-100°C for 5-10 minutes to ensure complete denaturation and reduction [5] [4].
- Centrifuge briefly to collect condensed sample at tube bottom.
Gel Preparation and Electrophoresis:
- Prepare resolving gel with appropriate acrylamide concentration (8-15% depending on target protein size range) in Tris-HCl buffer, pH 8.8 [1]. Add ammonium persulfate (APS) and TEMED last to initiate polymerization.
- Once resolving gel has polymerized, prepare stacking gel (4-5% acrylamide in Tris-HCl buffer, pH 6.8) and pour over resolving gel [4].
- Assemble electrophoresis chamber and fill with running buffer (25 mM Tris, 192 mM glycine, 0.1% SDS, pH 8.3) [4].
- Load samples (10-50 μg total protein per lane) alongside molecular weight markers.
- Apply constant voltage (100-200V) until dye front reaches gel bottom (approximately 45-60 minutes for mini-gels) [7].
Post-Electrophoresis Processing:
- For western blotting, transfer proteins to PVDF or nitrocellulose membrane.
- For mass spectrometry, stain with Coomassie Blue or compatible fluorescent stains, excise bands of interest, and proceed with in-gel digestion [8].
IEF-IPG Methodology for Proteomic Profiling
Sample Preparation for IEF:
- Prepare protein extract in IEF-compatible buffer (typically containing 8 M urea, 2-4% CHAPS, carrier ampholytes) [3].
- Reduce disulfide bonds with dithiothreitol (DTT) or tris(2-carboxyethyl)phosphine (TCEP) and alkylate with iodoacetamide.
- Clarify by centrifugation to remove insoluble material.
Immobilized pH Gradient Strip Handling:
- Select IPG strip with appropriate pH range based on experimental needs.
- Rehydrate strips with sample solution for 10-12 hours [3].
- Place rehydrated strips in IEF focusing tray with electrode contacts properly aligned.
Isoelectric Focusing Protocol:
- Apply focusing program with gradual voltage increase (e.g., 500 V for 1 hour, 1000 V for 1 hour, 8000 V gradient to 32,000 Vh total) [3].
- Maintain temperature at 20°C throughout focusing to ensure reproducibility.
- After focusing, strips can be stored at -80°C or processed immediately.
Post-IEF Processing for MS Analysis:
- Equilibrate strips in SDS-containing buffer for second-dimension electrophoresis if performing 2D-PAGE.
- For shotgun proteomics, cut IPG strip into 20-50 equal segments [3].
- Extract peptides from each segment using series of washes with acidic solvents of increasing organic content [3].
- Pool extracts by fraction, concentrate via vacuum centrifugation, and clean up using C18 solid-phase extraction before LC-MS/MS analysis [3].
Research Applications and Limitations
Optimal Applications for Each Technique
SDS-PAGE is particularly well-suited for:
- Molecular weight estimation: Provides reliable mass determination with appropriate standards [1].
- Western blot analysis: Denatured proteins are ideal for antibody detection [5].
- Quality control applications: Rapid assessment of protein purity, integrity, and expression levels [7].
- GeLC-MS workflows: Simple integration with mass spectrometry via in-gel digestion [8].
- High-throughput screening: Rapid separation enables processing of multiple samples in parallel [2].
IEF-IPG excels in these applications:
- Detection of isoforms and post-translational modifications: Capable of separating protein variants with minimal mass differences but distinct pI values [3].
- Shotgun proteomics fractionation: Effectively reduces sample complexity prior to LC-MS/MS [8] [3].
- Two-dimensional electrophoresis: Serves as superior first-dimension separation for 2D-PAGE [2] [6].
- Analysis of charge variants: Essential for characterizing charge heterogeneity in biopharmaceuticals [2].
- Low-abundance protein detection: Enhanced sensitivity through sample concentration at pI [3].
Technical Limitations and Challenges
SDS-PAGE Limitations:
- Loss of native structure and function: Denaturing conditions destroy enzymatic activity and protein-protein interactions [7] [1].
- Limited resolution for similar molecular weights: Proteins with mass differences less than 2 kDa may not resolve adequately [2].
- Aberrant migration: Post-translational modifications (e.g., glycosylation, phosphorylation) can alter mobility independent of mass [4].
- Poor separation of membrane proteins: Extremely hydrophobic proteins may not focus sharply [2].
IEF-IPG Limitations:
- Extended processing time: Typical focusing requires 24-36 hours, limiting throughput [6].
- Sample precipitation risks: Proteins may precipitate at their pI, particularly at high concentrations [2].
- Limited dynamic range: High-abundance proteins can obscure detection of less abundant species [3].
- Technical complexity: Requires specialized equipment and optimization [3].
- Handling of extreme pI proteins: Very acidic or basic proteins may not focus effectively in standard pH gradients [2].
The Scientist's Toolkit: Essential Research Reagents
Table 2: Key reagents and materials for SDS-PAGE and IEF-IPG experiments
| Reagent/Material | Function/Purpose | Technical Notes |
|---|---|---|
| SDS (Sodium Dodecyl Sulfate) | Denatures proteins and confers uniform charge | Critical for mass-based separation; typically used at 0.1-1% concentrations [4] |
| Acrylamide/Bis-acrylamide | Forms porous gel matrix for molecular sieving | Ratio determines pore size; typically 29:1 or 37.5:1 acrylamide:bis [1] |
| TEMED/Ammonium Persulfate | Catalyzes acrylamide polymerization | TEMED stabilizes free radicals generated by APS [1] |
| Tris-Glycine Buffer | Most common electrophoresis buffer system | Discontinuous system with different pH in stacking (6.8) and resolving (8.8) regions [4] |
| β-Mercaptoethanol/DTT | Reducing agents that break disulfide bonds | Essential for complete denaturation; DTT preferred for MS applications [4] |
| Immobilized pH Gradient (IPG) Strips | Stable pH gradient for IEF separation | Available in various pH ranges (broad 3-10, narrow for higher resolution) [3] |
| Urea/Thiourea | Chaotropic agents for protein solubilization | Maintain solubility during IEF; typically 8M urea/2M thiourea for difficult proteins [3] |
| CHAPS | Zwitterionic detergent for protein solubilization | IEF-compatible; helps maintain solubility without interfering with focusing [3] |
| Carrier Ampholytes | Generate and stabilize pH gradient in solution | Used in addition to IPG strips to improve separation [3] |
| Coomassie/Silver Stains | Protein detection after separation | Coomassie for general use; silver for higher sensitivity but MS compatibility varies [8] |
Emerging Innovations and Future Perspectives
Technological advancements continue to address limitations in both separation platforms. For SDS-PAGE, the development of native SDS-PAGE (NSDS-PAGE) demonstrates promise for retaining metal cofactors and enzymatic activity while maintaining high resolution [7]. This modified approach reduces SDS concentration (0.0375% vs standard 0.1%) and eliminates heating and reducing agents, enabling seven of nine model enzymes to retain activity after separation compared to complete denaturation in conventional SDS-PAGE [7].
Microfluidic implementations represent another significant innovation. Microfluidic free-flow IEF (FF-IEF) devices enable continuous protein separation into 24 fractions with residence times of approximately 12 minutes, dramatically reducing processing time compared to traditional IEF [6]. These systems operate at high electric fields (up to 370V/cm) while maintaining controlled temperature, offering improved separation of protein complexes and higher yield across broader pI ranges [6].
The integration of these separation techniques with advanced mass spectrometry continues to evolve. Research indicates that combining orthogonal separation methods (SDS-PAGE and IEF-IPG) provides superior proteome coverage compared to either method alone [8]. Furthermore, the use of peptide pI information from IEF-IPG separations as a filtering parameter for large shotgun proteomics datasets shows promise for reducing false positives and enhancing identification confidence [3].
As proteomics advances toward single-cell analysis and increasingly complex sample types, both SDS-PAGE and IEF-IPG will continue to play vital roles in proteomic workflow. Understanding their fundamental separation principles, performance characteristics, and appropriate applications remains essential for researchers designing effective protein separation strategies in drug development and basic research.
Historical Development and Technological Evolution of Both Techniques
The analysis of complex protein mixtures is a cornerstone of modern molecular biology and proteomics. For decades, two powerful electrophoretic techniques have served as fundamental tools for this purpose: Sodium Dodecyl Sulfate-Polyacrylamide Gel Electrophoresis (SDS-PAGE) and Isoelectric Focusing using Immobilized pH Gradients (IEF-IPG). SDS-PAGE, introduced by Ulrich K. Laemmli in 1970, revolutionized protein science by enabling high-resolution separation based on molecular weight [9] [10]. Its publication has become one of the most cited papers in history, with over 300,000 citations to date [11]. Isoelectric focusing, with its roots in the work of Svensson (1961) and later refined with immobilized pH gradients, separates proteins based on their isoelectric point (pI), the pH at which a protein carries no net charge [2] [12]. Together, these techniques provide complementary windows into the proteome, forming the foundation of countless diagnostic and research applications in the global proteomics market, which is projected to grow at a CAGR of 12-15% [2].
This guide provides a comprehensive comparison of SDS-PAGE and IEF-IPG, tracing their historical development, detailing their experimental protocols, and objectively evaluating their performance in proteomic profiling. Designed for researchers, scientists, and drug development professionals, it synthesizes current methodological standards and performance data to inform experimental design in both academic and industrial settings.
Historical Development and Technological Trajectories
The Evolution of SDS-PAGE
The development of SDS-PAGE was intimately connected to investigations of viral assembly in phage-infected cells [9]. Laemmli's key innovation was the discontinuous system utilizing a stacking gel with neutral pH and a separating gel with basic pH, which concentrated proteins before separation, thereby dramatically improving resolution [10]. The technique's core principle involves the binding of SDS detergent to proteins at a constant ratio (approximately 1.4g SDS per 1g protein), masking intrinsic charges and imparting a uniform negative charge density [10]. This allows separation through a polyacrylamide gel matrix primarily based on molecular size rather than charge or shape.
Early methodologies were laborious, involving tube gels that required being cracked open with a hammer for analysis [11]. The subsequent shift to slab gels represented a major advancement, enabling simultaneous analysis of multiple samples and direct comparison of protein bands [11] [10]. Recent innovations include the development of pre-cast gels with proprietary buffers (e.g., Bis-tris) for enhanced stability and reproducibility, and the emergence of capillary electrophoresis SDS (CE-SDS) as a automated, quantitative alternative that reduces hands-on time and improves reproducibility [11].
The Evolution of IEF and IPG Technology
Isoelectric focusing originated from the pioneering work of Svensson in 1961 on the theoretical foundations of focusing ions according to their pI [2]. Early IEF was performed in liquid pH gradients stabilized by sucrose density gradients and utilized synthetic carrier ampholytes to generate the pH gradient [12]. A transformative advancement came with the development of Immobilized pH Gradients (IPGs) in the 1980s, where the pH gradient is covalently fixed into the polyacrylamide gel matrix during manufacture [3]. This innovation eliminated the problem of gradient drift, significantly improved reproducibility, and enabled the creation of ultra-narrow and highly stable pH gradients for exceptional resolution [3] [12].
The commercialization of IPG strips of various lengths and pH ranges made the technology accessible to non-specialist laboratories and cemented IPG-IEF's role as the first dimension in two-dimensional polyacrylamide gel electrophoresis (2D-PAGE) [12]. More recent developments include solution-phase IEF systems like the Agilent OFFGEL fractionator, which separates proteins or peptides in liquid phases while maintaining the high resolution of IPG, thereby simplifying recovery for downstream analysis [13] [12]. The application of IEF has also been successfully miniaturized into capillary formats (cIEF) for high-throughput analytical applications, particularly in biopharmaceutical quality control [12].
Table 1: Key Historical Milestones in SDS-PAGE and IEF-IPG Development
| Year | SDS-PAGE Milestone | IEF-IPG Milestone |
|---|---|---|
| 1960s | Development of early discontinuous electrophoresis systems (Ornstein, Davis) [11]. | Svensson (1961) establishes theoretical principles of IEF [2]. |
| 1970 | Laemmli publishes the definitive discontinuous SDS-PAGE method [10]. | Vesterberg and Svensson refine IEF methodology [2]. |
| 1975 | Slab gels become standard, replacing tube gels [11]. | O'Farrell and Klose independently pioneer 2D-PAGE combining IEF and SDS-PAGE [12]. |
| 1980s | — | Development and commercialization of Immobilized pH Gradient (IPG) strips [3]. |
| 1990s | Pre-cast commercial gels become widely available [10]. | IPG-IEF becomes gold standard for first dimension of 2D-PAGE [3]. |
| 2000s-Present | Capillary electrophoresis SDS (CE-SDS) gains traction for biopharmaceutical analysis [11]. | Solution-phase IEF (OFFGEL) and capillary IEF (cIEF) emerge as advanced alternatives [13] [12]. |
Fundamental Separation Principles and Mechanisms
SDS-PAGE: Separation by Molecular Size
The principle of SDS-PAGE is to negate the inherent charge differences between proteins and enforce separation based primarily on molecular weight. This is achieved through a multi-step process. First, proteins are denatured and linearized by heating in a sample buffer containing the anionic detergent SDS and a reducing agent (e.g., DTT or β-mercaptoethanol) to break disulfide bonds [10]. The SDS molecules bind to the hydrophobic regions of the polypeptide chain in a constant ratio, approximately one SDS molecule per two amino acids, conferring a uniform negative charge per unit mass [10]. When an electric field is applied, these SDS-coated proteins migrate through the porous polyacrylamide gel toward the anode. The gel acts as a molecular sieve: smaller proteins navigate the pores more easily and migrate faster, while larger proteins are retarded [10]. The discontinuous buffer system (differing pH and composition between stacking and separating gels) creates an ion front that concentrates all protein samples into a very sharp band before they enter the separating gel, which is crucial for achieving high resolution [10].
IEF-IPG: Separation by Isoelectric Point
IEF-IPG separates molecules based on their intrinsic chemical property, the isoelectric point (pI), which is the specific pH at which a protein or peptide has no net electrical charge. The separation occurs within a stable, covalently immobilized pH gradient [12]. When an electric field is applied, charged proteins migrate through this gradient. A protein in a region where the pH is below its pI will be positively charged (protonated) and will migrate toward the cathode (negative electrode). As it moves, it enters zones of progressively higher pH. Eventually, it reaches a pH zone equal to its pI, where its net charge becomes zero and migration ceases [12]. Conversely, a protein in a region where the pH is above its pI will be negatively charged and migrate toward the anode (positive electrode) until it similarly reaches its pI. This process "focuses" each protein into a sharp, stationary band at its respective pI, resulting in extremely high resolution, capable of distinguishing proteins differing by as little as 0.01 pH units [2].
Experimental Protocols and Workflows
SDS-PAGE Methodology
A standard SDS-PAGE protocol involves several key stages [10]:
- Gel Preparation: Discontinuous gels are cast in two layers. The separating gel (typically 8-16% acrylamide, pH ~8.8) determines the resolution range, while the stacking gel (4-6% acrylamide, pH ~6.8) is poured on top to concentrate the samples. Gradient gels with increasing acrylamide concentration can be used to separate a wider range of molecular weights simultaneously [10].
- Sample Preparation: Proteins are solubilized in a sample buffer containing SDS (for denaturation and charge), a reducing agent (DTT or β-mercaptoethanol to break disulfide bonds), glycerol (for density), and a tracking dye (bromophenol blue). The mixture is heated at 95°C for 5 minutes to ensure complete denaturation [10].
- Electrophoresis: Prepared samples and a molecular weight marker are loaded into wells. The gel is run in an electrophoresis buffer (e.g., Tris-Glycine-SDS) at a constant voltage (e.g., 100-200V) until the dye front reaches the bottom [10].
- Post-Electrophoresis Analysis: Proteins in the gel are visualized by staining (e.g., Coomassie Blue, silver stain) or transferred to a membrane for Western blotting [10].
IEF-IPG Methodology
A typical IEF-IPG workflow for proteomic analysis consists of [3] [12]:
- Strip Rehydration: Commercial IPG strips of a chosen pH range (e.g., broad 3-10, narrow 5-8) are rehydrated in a denaturing buffer containing urea, thiourea, a non-ionic or zwitterionic detergent (e.g., CHAPS), and carrier ampholytes. The sample can be incorporated at this stage ("rehydration loading") or loaded later via a cup [3] [12].
- Isoelectric Focusing: The rehydrated strip is placed in an IEF apparatus with electrode wicks at each end. Focusing is performed at high voltages (up to 8000V) using a stepped or gradient voltage program tailored to the strip length and pH range. This step can take several hours to overnight [3] [12].
- Post-IEF Processing: For 2D-PAGE, the focused strip is equilibrated in a SDS-containing buffer to prepare proteins for the second dimension. For shotgun proteomics, the entire strip is cut into fractions, and peptides are extracted from the gel pieces using a series of solvents (e.g., aqueous to organic) for subsequent LC-MS/MS analysis [13] [3].
Table 2: Core Components of Standard SDS-PAGE and IEF-IPG Experimental Protocols
| Protocol Step | SDS-PAGE | IEF-IPG |
|---|---|---|
| Separation Matrix | Discontinuous polyacrylamide gel (stacking & separating layers) [10]. | Rehydrated IPG strip with immobilized pH gradient [12]. |
| Key Reagents | SDS, reducing agent (DTT/β-ME), Tris-glycine running buffer [10]. | Urea/thiourea, non-ionic detergent (CHAPS), carrier ampholytes, DTT [13] [3]. |
| Sample Load | Typically 10-50 µg protein per mini-gel lane [7]. | Typically 50-500 µg protein per strip for preparative work [13]. |
| Separation Time | ~1-1.5 hours (mini-gel) [10]. | Several hours to overnight [12]. |
| Post-Run Processing | Staining or Western blotting [10]. | Equilibration for 2D-PAGE or in-gel digestion/peptide extraction for MS [13] [3]. |
Performance Comparison in Proteomic Profiling
Resolution, Reproducibility, and Sensitivity
A direct comparison of gel-based fractionation techniques for nanoLC-ESI-MS/MS analysis revealed that while 1-D SDS-PAGE (GeLC-MS/MS) and IEF-IPG yielded the highest absolute numbers of protein identifications from mitochondrial extracts, all techniques provided complementary results [13]. This suggests that combining orthogonal separation principles can enhance proteome coverage.
IEF-IPG demonstrated a distinct advantage in the average number of detected peptides per protein, a factor that can improve confidence in protein identification and facilitate quantitative and structural characterization [13]. However, the recovery of proteins and peptides from the gel matrix is highly dependent on the total volume of the gel, posing a challenge for both techniques, albeit more pronounced for proteins separated by SDS-PAGE prior to in-gel digestion [13].
SDS-PAGE offers robust and predictable separation based on molecular weight, which is highly useful for assessing sample quality, complexity, and approximate molecular weight. However, it has limited resolution for proteins of similar size and cannot distinguish different protein forms with identical molecular weights, such as many post-translationally modified variants [13] [12].
IEF-IPG provides superior resolution for separating protein isoforms and charge variants arising from post-translational modifications (phosphorylation, glycosylation, deamidation) that alter the pI but not necessarily the mass [12]. The reproducibility of IPG strips is generally high, though the technique can be sensitive to sample contaminants like salts, which must be removed prior to focusing [3].
Applications and Limitations in Proteomics
The choice between SDS-PAGE and IEF-IPG is often dictated by the specific research goal.
- SDS-PAGE is the workhorse for routine protein analysis, including purity assessment, expression level checking, and immunoblotting. The GeLC-MS/MS approach, where a whole-lane SDS-PAGE gel is sliced into multiple fractions, digested, and analyzed by MS, is a powerful and widely adopted shotgun proteomics strategy that simplifies complex mixtures effectively [13].
- IEF-IPG is indispensable for 2D-PAGE, enabling the highest resolution separation of complex protein mixtures for differential expression analysis [12]. It is also increasingly used as a first-dimension peptide fractionation step in shotgun proteomics (peptide IEF), providing an alternative or complement to strong cation exchange (SCX) chromatography [14] [3]. Furthermore, it is the preferred method for directly analyzing charge-based protein heterogeneity, such as in the quality control of therapeutic antibodies [12].
Table 3: Direct Performance Comparison of SDS-PAGE and IEF-IPG in Proteomic Analysis
| Performance Metric | SDS-PAGE | IEF-IPG |
|---|---|---|
| Basis of Separation | Molecular weight (size) [10]. | Isoelectric point (charge) [12]. |
| Typical Proteomic Identifications | High (e.g., via GeLC-MS/MS) [13]. | High, often complementary to SDS-PAGE [13]. |
| Peptides per Protein (Avg.) | Lower than IEF-IPG [13]. | Higher [13]. |
| Strength for PTM Analysis | Limited for mass-conserving PTMs [12]. | Excellent for charge-altering PTMs (e.g., phosphorylation) [12]. |
| Sample Throughput | High (fast run times) [10]. | Lower (longer focusing times) [12]. |
| Ease of Automation | Moderate; CE-SDS offers full automation [11]. | Moderate; OFFGEL systems offer automation for solution-phase IEF [13]. |
| Key Limitation | Poor separation of similar MW proteins; denaturing [13] [7]. | Sensitive to salts/detergents; challenging for very acidic/basic proteins [13] [3]. |
The Scientist's Toolkit: Essential Research Reagents
Successful execution of both SDS-PAGE and IEF-IPG relies on a set of core reagents, each serving a specific function to ensure optimal separation and recovery.
Table 4: Essential Reagents for SDS-PAGE and IEF-IPG Protocols
| Reagent Category | Specific Example | Function in Protocol |
|---|---|---|
| Denaturants | Sodium Dodecyl Sulfate (SDS) [10] | Denatures proteins and confers uniform negative charge for SDS-PAGE. |
| Urea, Thiourea [13] [3] | Disrupts hydrogen bonds to solubilize and denature proteins for IEF-IPG. | |
| Reducing Agents | Dithiothreitol (DTT), β-Mercaptoethanol [10] | Breaks disulfide bonds to fully denature proteins for both techniques. |
| Buffers & Ampholytes | Tris-based buffers [10] | Maintains pH for electrophoresis in SDS-PAGE gel and running buffer. |
| Carrier Ampholytes [12] | Small, charged molecules that help conduct current and sharpen bands in IEF-IPG. | |
| Detergents | CHAPS [13] | Zwitterionic detergent used in IEF-IPG to solubilize membrane proteins without interfering with charge. |
| Staining Agents | Coomassie Brilliant Blue, Silver Nitrate [10] | Binds to proteins for visualization after separation in gel-based methods. |
| Enzymes | Trypsin [13] [14] | Proteolytic enzyme used for in-gel digestion of separated protein bands/spots to generate peptides for MS analysis. |
SDS-PAGE and IEF-IPG have evolved significantly from their origins to become indispensable, complementary tools in the proteomics toolkit. SDS-PAGE remains the gold standard for rapid, size-based separation, robustness, and accessibility, particularly for routine analysis and MW estimation. Its modern incarnation, CE-SDS, offers superior quantitation and reproducibility for biopharmaceutical development [11]. IEF-IPG provides unparalleled resolution for charge-based separation, making it critical for the detailed analysis of protein isoforms, PTMs, and comprehensive proteome mapping via 2D-PAGE or peptide fractionation [13] [12].
The most powerful proteomic strategies often leverage the orthogonal separation principles of both techniques, either sequentially in 2D-PAGE or in parallel fractionation schemes. As proteomic inquiries delve deeper into dynamic post-translational regulation and the analysis of scarce biological samples, the continued evolution and synergistic application of these foundational techniques will remain vital to driving discovery in basic research and therapeutic development.
Key Physicochemical Parameters Governing Separation Efficiency
In mass spectrometry-based proteomic profiling, the fractionation of complex protein samples is an indispensable strategy for enhancing detection sensitivity [13]. The high complexity of biological samples, coupled with the limited peak capacity of conventional nanoflow reversed-phase liquid chromatography, makes the development of effective fractionation strategies a critical area of analytical research [13]. Among the most common gel-based protein separation techniques, SDS-PAGE (separation by molecular weight) and IEF-IPG (separation by isoelectric point) represent two fundamental approaches with orthogonal separation mechanisms [13] [15]. This guide provides an objective comparison of these techniques, focusing on the key physicochemical parameters that govern their separation efficiency for proteomic profiling applications.
Fundamental Principles of Separation
SDS-PAGE: Molecular Weight-Based Separation
Sodium Dodecyl Sulfate Polyacrylamide Gel Electrophoresis (SDS-PAGE) separates proteins primarily by their molecular weight [15]. The technique employs the anionic detergent SDS, which binds to proteins in a ratio of approximately one SDS molecule per two amino acids, causing protein denaturation and linearization [15]. This SDS coating imparts a uniform negative charge density to all proteins, effectively neutralizing their intrinsic charge differences [15]. When an electric current is applied, proteins migrate through the polyacrylamide gel matrix toward the positive electrode at rates inversely proportional to their molecular size [15]. The polyacrylamide concentration can be adjusted to create different pore sizes, with higher percentages providing better resolution for lower molecular weight proteins [15].
IEF-IPG: Charge-Based Separation
Isoelectric Focusing with Immobilized pH Gradient (IEF-IPG) separates proteins based on their isoelectric point (pI) - the specific pH at which a protein carries no net electrical charge [16] [17]. In this technique, proteins are applied to a pH gradient gel and an electric field is applied [16]. Proteins initially migrate toward the electrode of opposite charge until they reach the pH region matching their pI, where they become focused into sharp bands [16]. The major advancement of IPG technology involves covalently incorporating buffering groups into the polyacrylamide matrix to create stable, reproducible pH gradients [16] [18]. This approach overcomes limitations of carrier ampholyte-based systems, particularly gradient drift and cathodal drift issues that plagued earlier IEF methodologies [16] [19].
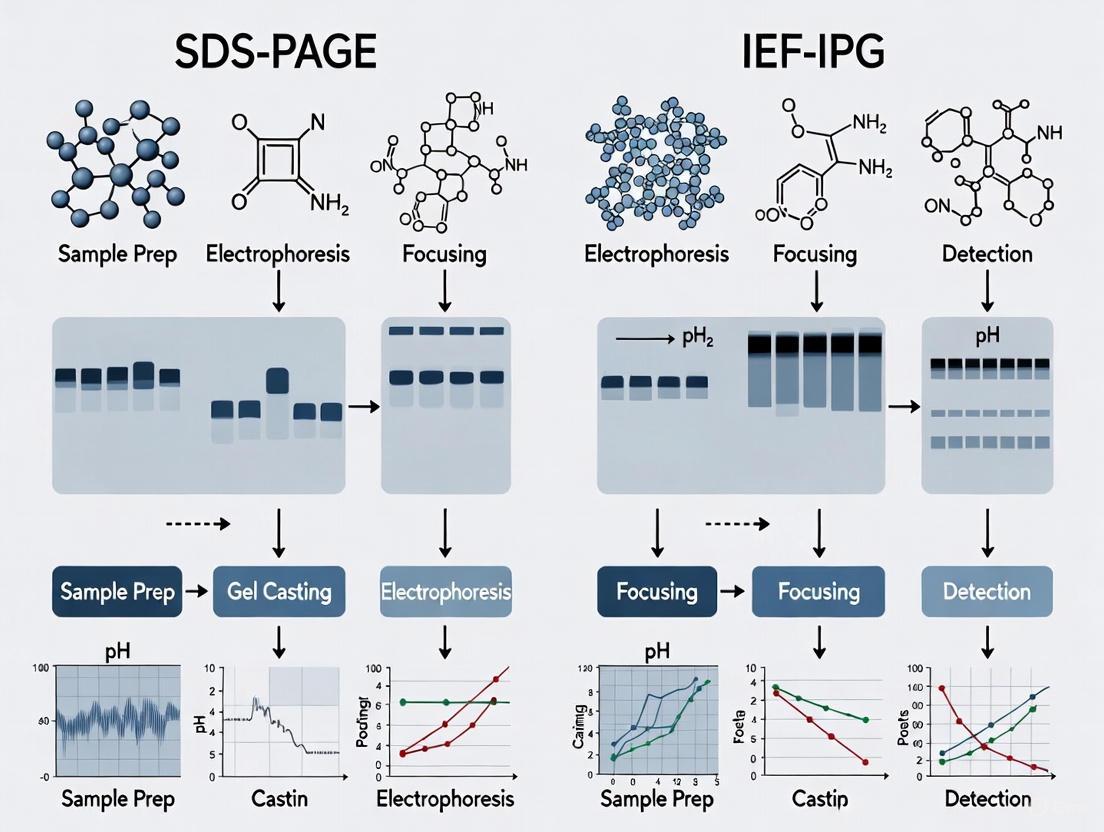
Figure 1: Fundamental separation mechanisms of SDS-PAGE and IEF-IPG techniques. SDS-PAGE relies on molecular weight separation after protein denaturation and linearization, while IEF-IPG separates proteins based on their intrinsic isoelectric points within a stable pH gradient.
Comparative Performance Analysis
Experimental Design for Technique Evaluation
A comprehensive comparison study evaluated common gel-based protein separation techniques using both standardized protein mixtures and mitochondrial extracts isolated from rat liver [13] [8]. The experimental design included:
Sample Preparation: Protein standards representing 42 different proteins were mixed in ratios covering approximately two orders of magnitude (1:5:25:100), with total protein loads of 8, 16, 33, and 131 µg [13]. Mitochondrial protein extracts were isolated from rat livers according to established protocols, with a protein concentration of 7.2 mg/mL [13]. All samples were reduced and alkylated with 5 mM TBP and 10 mM acrylamide in 25 mM ammonium bicarbonate, followed by cleanup and concentration using 10 kDa MWCO filters [13].
Separation Techniques Compared: The study evaluated 1-D SDS-PAGE, preparative 1-D SDS-PAGE, IEF-IPG, and 2-D PAGE as fractionation approaches prior to nanoLC-ESI-MS/MS analysis [13]. For 1-D SDS-PAGE and preparative 1-D SDS-PAGE, samples were diluted in sample buffer containing 50 mM DTT and loaded onto Criterion 8-16% gels [13]. IEF-IPG was performed using appropriate pH gradient strips following standard protocols [13].
Analysis Method: All fractionated samples were analyzed by nanoLC-ESI-MS/MS, and protein identification results were compared across techniques to determine separation efficiency, dynamic range, and complementarity [13].
Quantitative Performance Metrics
Table 1: Comparative performance of SDS-PAGE and IEF-IPG for proteomic profiling
| Performance Metric | SDS-PAGE | IEF-IPG | Experimental Context |
|---|---|---|---|
| Protein Identifications | Highest number of identifications [13] | Highest number of identifications [13] | Mitochondrial extracts from rat liver [13] |
| Peptides per Protein | Lower average peptides per protein [13] | Highest average peptides per protein [13] | Standardized protein mixtures [13] |
| pI-Based Resolution | Limited [15] | Excellent (can distinguish 0.001 pH unit differences) [17] | Broad range (pH 3-10) separations [19] |
| MW-Based Resolution | Excellent (size-based separation) [15] | Limited [16] | Standard protein markers [13] |
| Reproducibility | Good [13] | High with IPG technology [16] | Inter-laboratory comparisons [20] |
| Basic Protein Recovery | Good across all MW ranges [13] | Problematic (cathodal drift issues) [19] | pH 3-10 gradient evaluations [19] |
| Hydrophobic Protein Recovery | Moderate [13] | Challenging (precipitation at pI) [20] | Complex biological samples [13] |
Technique Complementarity
The comparative analysis demonstrated that all gel-based separation techniques provide complementary protein identification results [13]. While 1-D SDS-PAGE and IEF-IPG individually yielded the highest number of protein identifications, they identified different subsets of proteins due to their orthogonal separation mechanisms [13]. This complementarity suggests that a combination of 1-D SDS-PAGE and IEF-IPG fractionation can significantly improve profiling sensitivity without substantial decrease in throughput [13] [8].
The IEF-IPG technique resulted in the highest average number of detected peptides per protein, which can be particularly beneficial for quantitative and structural characterization of proteins in large-scale biomedical applications [13]. However, each technique showed specific strengths and limitations for different protein classes, highlighting the importance of selective application based on experimental goals [13].
Parameter-Specific Separation Efficiency
Molecular Weight Considerations
SDS-PAGE provides excellent molecular weight-based separation across a broad range, typically from approximately 5 to 250 kDa [15]. The separation resolution can be optimized by adjusting the polyacrylamide concentration, with lower percentages (e.g., 8%) better for high molecular weight proteins and higher percentages (e.g., 15%) more suitable for lower molecular weight proteins [15]. Gradient gels can extend the effective separation range by providing a continuum of pore sizes [15].
IEF-IPG has minimal native molecular weight discrimination since it employs low-concentration polyacrylamide gels (typically 4-5% total acrylamide) that are non-restrictive to high-molecular-weight proteins [16]. However, this lack of molecular weight-based separation represents both a limitation and advantage, as it allows pure charge-based separation without molecular sieving effects [16].
Isoelectric Point Resolution
IEF-IPG provides exceptional resolution based on isoelectric points, with the capability to differentiate biomolecules with minimal pI differences of only 0.001 pH units [17]. The resolution can be further enhanced by using narrow-range pH gradients (e.g., pH 4-5 or pH 5.5-6.5) and longer separation distances [16] [18]. This high resolution makes IEF-IPG particularly valuable for detecting post-translational modifications that alter protein charge, such as phosphorylation, acetylation, and deamidation [16] [20].
SDS-PAGE has no inherent pI-based separation capability since the SDS coating masks proteins' intrinsic charge characteristics [15]. The uniform charge imparted by SDS means separation is determined almost exclusively by molecular size through the molecular sieving effect of the polyacrylamide matrix [15].
Dynamic Range and Detection Sensitivity
Both techniques face challenges with dynamic range, particularly when analyzing complex biological samples with wide abundance ranges [20]. Highly abundant proteins can mask low-abundance species in both SDS-PAGE and IEF-IPG separations [20]. Detection sensitivity is ultimately determined by the visualization method, with silver staining detecting as little as 0.1 ng protein, while Coomassie staining typically requires 50-100 ng per band [17]. Fluorescent dyes such as SYPRO-Ruby can provide intermediate sensitivity with detection limits of approximately 1-10 ng [20].
IEF-IPG has an inherent concentrating effect as proteins focus into narrow bands at their pI positions, potentially enhancing detection sensitivity for low-abundance proteins [16]. However, sample loss during the focusing process can offset this theoretical advantage [13].
Technical Protocols and Methodologies
SDS-PAGE Experimental Protocol
Sample Preparation:
- Dilute protein samples in SDS-PAGE sample buffer (typically containing 63 mM Tris HCl, 10% glycerol, 2% SDS, 0.0025% bromophenol blue, pH 6.8) [13]
- Add reducing agent (50 mM DTT or β-mercaptoethanol) to disrupt disulfide bonds [13] [15]
- Denature samples by heating at 95-100°C for 5-10 minutes [15]
Gel Electrophoresis:
- Select appropriate gel percentage based on target protein size range (8-16% gradient gels often optimal for broad separation) [13] [15]
- Apply constant voltage (typically 100-200 V) using Tris-glycine or Tris-tricine buffer system [15]
- Monitor migration using pre-stained molecular weight markers [13]
- Terminate electrophoresis when dye front approaches gel bottom [15]
Post-Electrophoresis Processing:
- Fix proteins in gel using 40% ethanol/10% acetic acid [17]
- Visualize proteins using Coomassie, silver, or fluorescent staining [17] [20]
- Destain as needed and excise bands for in-gel digestion [13]
IEF-IPG Experimental Protocol
Sample Preparation:
- Solubilize proteins in IEF buffer (7M urea, 2M thiourea, 4% CHAPS) [13]
- Add reducing agent (50 mM DTT) and carrier ampholytes [16]
- Adjust sample conductivity to ≤300 µS/cm using centrifugal ultrafiltration if necessary [13]
Isoelectric Focusing:
- Rehydrate IPG strips with sample solution (typically overnight) [16] [19]
- Perform IEF using programmed voltage steps (gradually increasing to 8000-10,000 V) [16]
- Focus until total volt-hours reach optimal level for specific IPG strip length and pH range [16]
Post-Focusing Processing:
- Equilibrate IPG strips in SDS-containing buffer for second dimension separation [16]
- For direct analysis, extract proteins from IPG strips or process for MS analysis [13]
Figure 2: Comparative workflows for SDS-PAGE and IEF-IPG separation techniques. Both methods require specific sample preparation optimized for their separation mechanisms, followed by distinct electrophoretic conditions and processing steps prior to mass spectrometric analysis.
Application-Specific Recommendations
Molecular Weight Characterization Studies
For experiments focused on molecular weight determination, purity assessment, or disulfide bond analysis, SDS-PAGE is the unequivocal method of choice [15] [17]. Its straightforward protocol, excellent reproducibility, and wide availability make it ideal for routine protein characterization [15]. The ability to estimate molecular weight against standardized markers provides valuable information for initial protein identification and quality control [17].
Charge-Based Separations and PTM Detection
IEF-IPG excels in applications requiring charge-based separation, including detection of post-translational modifications that alter isoelectric point [16] [20]. Phosphorylation, acetylation, and other common PTMs produce characteristic pI shifts that can be detected through IEF-IPG separation [16]. The technique is also superior for analyzing protein isoforms and microheterogeneity that results from charge differences [17].
Complex Proteomic Profiling
For comprehensive proteomic analysis, the orthogonal combination of both techniques (as in 2D-PAGE) or sequential fractionation provides the most powerful approach [13] [20]. The complementary nature of protein identifications obtained with each method significantly enhances proteome coverage [13]. Research demonstrates that combining orthogonal 1-D SDS-PAGE and IEF-IPG fractionation improves profiling sensitivity without substantial decrease in throughput [13] [8].
Essential Research Reagent Solutions
Table 2: Key reagents and materials for SDS-PAGE and IEF-IPG separations
| Reagent/Material | Function/Purpose | Technical Considerations |
|---|---|---|
| SDS (Sodium Dodecyl Sulfate) | Denatures proteins and confers uniform charge [15] | Critical for linearizing proteins and eliminating shape/charge effects [15] |
| DTT or β-Mercaptoethanol | Reduces disulfide bonds [15] | Essential for complete denaturation; fresh preparation recommended [15] |
| Polyacrylamide Gels | Molecular sieving matrix [15] | Concentration determines pore size and separation range [15] |
| IPG Strips | Provide immobilized pH gradient [16] | Available in various lengths (7-24 cm) and pH ranges [16] [19] |
| Chaotropic Agents (Urea, Thiourea) | Disrupt hydrogen bonding, improve solubility [13] | Essential for IEF sample buffer; prevent aggregation [13] [16] |
| Zwitterionic Detergents (CHAPS) | Solubilize proteins without interfering with charge [13] [20] | Critical for IEF to maintain solubility without affecting pI [13] |
| Carrier Ampholytes | Assist in forming pH gradient [16] | Added to samples and rehydration solutions even with IPG strips [16] |
| Coomassie/Silver Stains | Visualize separated proteins [17] | Sensitivity ranges from 100 ng (Coomassie) to 0.1 ng (silver) [17] |
The comparative analysis of SDS-PAGE and IEF-IPG reveals that separation efficiency is governed by fundamentally different physicochemical parameters for each technique. SDS-PAGE excels in molecular weight-based separation through the molecular sieving effect of polyacrylamide gels after protein denaturation and charge normalization [15]. In contrast, IEF-IPG provides exceptional resolution based on isoelectric points through the focusing effect in stable pH gradients [16] [17].
Experimental data demonstrates that both techniques provide complementary protein identification results, with IEF-IPG yielding higher average peptides per protein—a valuable feature for protein characterization [13]. The orthogonal separation principles suggest that combined application of both techniques offers the most comprehensive approach for proteomic profiling of complex samples [13] [8].
Technique selection should be guided by specific research objectives: SDS-PAGE for molecular weight characterization and purity assessment, IEF-IPG for charge-based separations and PTM detection, and combined approaches for comprehensive proteome analysis. Understanding these fundamental separation parameters enables researchers to optimize experimental design for specific proteomic profiling applications.
The Orthogonal Nature of Separation Mechanisms and Their Complementary Value
In the field of proteomic profiling, the ability to effectively separate complex protein mixtures is a fundamental prerequisite for successful characterization and quantification. Two-dimensional gel electrophoresis (2-DE) has long served as a cornerstone technique, built upon two orthogonal separation mechanisms: sodium dodecyl sulfate polyacrylamide gel electrophoresis (SDS-PAGE) and isoelectric focusing with immobilized pH gradients (IEF-IPG) [1]. The term "orthogonal" in separation science refers to techniques that separate molecules based on entirely different physicochemical properties, thereby providing complementary information when combined. SDS-PAGE primarily separates proteins by molecular mass, while IEF-IPG separates them according to isoelectric point (pI) [1]. This fundamental difference in separation principles makes their combination particularly powerful for comprehensive proteomic analysis, enabling researchers to achieve resolution that would be impossible with either method alone.
The significance of this orthogonal relationship extends across various applications, from basic research characterizing protein complexes to clinical applications such as biomarker discovery and drug development. For pharmaceutical researchers and proteomics specialists, understanding the strengths, limitations, and optimal integration of these techniques is crucial for designing robust experimental workflows that maximize proteome coverage and detection of biologically relevant proteoforms, including those with post-translational modifications (PTMs) [21]. This guide provides an objective comparison of SDS-PAGE and IEF-IPG, supported by experimental data, to inform strategic decisions in proteomic profiling research.
Fundamental Principles of SDS-PAGE and IEF-IPG
SDS-PAGE: Separation by Molecular Weight
SDS-PAGE operates on the principle of separating proteins primarily according to their molecular weight [1]. The technique employs the anionic detergent sodium dodecyl sulfate (SDS), which denatures proteins and binds to the polypeptide backbone in a constant weight ratio (approximately 1.4 g SDS per 1 g of protein) [15]. This SDS coating confers a uniform negative charge density to all proteins, effectively masking their intrinsic charges [1]. When an electric field is applied, these SDS-protein complexes migrate through the polyacrylamide gel matrix toward the anode, with separation determined principally by molecular size through the sieving effect of the gel pores [1] [15]. Smaller proteins navigate the porous network more readily and migrate faster, while larger proteins encounter greater resistance and migrate more slowly [1]. The polyacrylamide gel concentration can be optimized for specific molecular weight ranges, with lower percentages (e.g., 8-10%) better for high molecular weight proteins and higher percentages (e.g., 12-15%) providing superior resolution for lower molecular weight proteins [1].
IEF-IPG: Separation by Isoelectric Point
IEF-IPG separates proteins based on their intrinsic isoelectric point (pI)—the specific pH at which a protein carries no net electrical charge [1]. In this technique, proteins are applied to a gel strip containing an immobilized pH gradient (IPG) formed by covalently attached buffering groups [19] [18]. When an electric field is applied, charged protein molecules migrate through the pH gradient until they reach the region where the pH matches their pI [1] [15]. At this position, the protein loses its net charge and ceases to migrate [15]. This focusing effect results in sharp, concentrated bands of proteins at their respective pI values, providing extremely high resolution for separating proteins with minute pI differences [22]. The development of IPG technology represented a significant advancement over carrier ampholyte-based systems by providing superior stability, reproducibility, and higher protein loading capacity while preventing gradient drift during extended focusing times [18].
Figure 1: Orthogonal Separation Principles of SDS-PAGE and IEF-IPG. These techniques separate proteins based on fundamentally different physicochemical properties, making their combination particularly powerful for comprehensive proteomic analysis.
Technical Comparison and Performance Data
Resolution and Dynamic Range
When evaluated as fractionation approaches prior to LC-ESI-MS/MS analysis, both SDS-PAGE and IEF-IPG demonstrate complementary protein identification capabilities [13]. In a systematic comparison using mitochondrial extracts from rat liver, 1-D SDS-PAGE and IEF-IPG yielded the highest number of protein identifications among gel-based techniques [13]. However, the IEF-IPG technique specifically resulted in the highest average number of detected peptides per protein, which can significantly benefit both quantitative analysis and structural characterization of proteins in biomedical applications [13].
The resolution capabilities of these techniques vary substantially across different pH and molecular weight ranges. IPG-based methods show limitations in the analysis of basic proteins (pI > 7), with approximately half of detected basic protein spots showing poor reproducibility in one comparative study [19]. In contrast, non-equilibrium pH gradient electrophoresis (NEPHGE)-based methods, an alternative IEF approach, demonstrated excellent reproducibility in the basic gel zone while failing to detect some highly acidic proteins [19]. This highlights the technique-specific resolution biases that researchers must consider when designing experiments.
Reproducibility and Technical Variation
Method reproducibility is a critical consideration for proteomic profiling, particularly in drug development where experimental consistency is paramount. A recent comparative study found that gel-based top-down proteomics (primarily using 2DE) demonstrated approximately three times lower technical variation compared to label-free shotgun proteomics [21]. The coefficient of variation (CV) for quantitative analysis was significantly better in 2D-DIGE (a variant of 2DE), enhancing its reliability for detecting subtle protein expression changes [21].
IPG technology has generally improved the reproducibility of IEF by providing stable, covalently immobilized pH gradients that minimize gradient drift [18]. However, batch-to-batch variations in IPG strips and environmental factors such as temperature fluctuations can still affect reproducibility [18]. SDS-PAGE typically offers good reproducibility for molecular weight-based separation, though band broadening effects due to diffusion and non-specific trapping in the gel matrix can impact resolution, particularly for longer separation times [23].
Table 1: Performance Comparison of SDS-PAGE and IEF-IPG Separation Techniques
| Parameter | SDS-PAGE | IEF-IPG | Experimental Context |
|---|---|---|---|
| Primary Separation Principle | Molecular weight | Isoelectric point (pI) | Fundamental mechanism [1] |
| Number of Protein Identifications | High | High | Mitochondrial extracts from rat liver [13] |
| Peptides per Protein | Standard | Highest | LC-ESI-MS/MS analysis [13] |
| Reproducibility (Basic Proteins, pI>7) | Not applicable | ~50% spots not reproducible | Broad-range pH 3-10 gradient [19] |
| Reproducibility (Acidic Proteins) | Not applicable | Good | Narrow-range pH 4-7 IPG [19] |
| Technical Variation (CV) | Lower (in 2DE context) | Lower (in 2DE context) | 2D-DIGE vs shotgun proteomics [21] |
| Protein Capacity | Moderate | Higher with NEPHGE | High protein load conditions [19] |
| Detection of Hydrophobic Proteins | Limited | Limited, precipitation at pI | General limitation [18] |
Specialized Applications and Detection Capabilities
The complementary nature of SDS-PAGE and IEF-IPG becomes particularly evident in specialized applications such as proteoform analysis. A recent comparative study demonstrated that 2D-GE top-down analysis provided direct qualitative and quantitative information about proteoforms, including those with unexpected post-translational modifications such as proteolytic cleavage and phosphorylation [21]. In contrast, shotgun proteomics approaches that bypass gel separation lose this essential information about proteoforms, despite faster analysis times [21].
For low-abundance proteins, both techniques face sensitivity challenges. However, implementation of field-inversion gel electrophoresis (FIGE) as a variant of SDS-PAGE has shown promise in enhancing detection sensitivity. FIGE increased band intensities two-fold for proteins with molecular masses lower than 66 kDa and improved protein separation efficiency by reducing band diffusion and matrix trapping [23]. When applied to rat liver lysates in 2D PAGE, FIGE demonstrated a 20% increase in discernible protein spots compared to constant field electrophoresis [23].
Experimental Methodologies and Protocols
Standard SDS-PAGE Protocol
The most widely used implementation of SDS-PAGE employs a discontinuous buffer system with stacking and resolving gels [1]. The stacking gel (typically lower acrylamide concentration, e.g., 4-5%) at pH 6.8 serves to concentrate proteins into a tight band before they enter the resolving gel (higher acrylamide concentration, e.g., 8-16%) at pH 8.8, where separation primarily occurs [1]. Sample preparation is critical and involves denaturation in a buffer containing SDS and a reducing agent (e.g., beta-mercaptoethanol or DTT) at 70-100°C to break disulfide bonds and ensure complete linearization [1] [15].
A standard protocol for a 10% Tris-glycine mini gel includes:
- 7.5 mL of 40% acrylamide solution
- 3.9 mL of 1% bisacrylamide solution
- 7.5 mL of 1.5 M Tris-HCl, pH 8.7
- Water to 30 mL total volume
- 0.3 mL of 10% ammonium persulfate (APS)
- 0.3 mL of 10% SDS
- 0.03 mL TEMED catalyst [1]
Electrophoresis is typically performed at constant voltage (150-200 V) for 30-60 minutes, depending on gel size and protein separation requirements [1]. For enhanced separation, FIGE can be implemented with minimal additional instrumentation by applying alternating forward and backward electric fields, which reduces protein diffusion and increases local protein concentration within the gel matrix [23].
Optimized IEF-IPG Protocol for Complex Samples
An optimized 2-D gel electrophoresis protocol for mosquito proteomic profiling demonstrates improvements for complex biological samples, with updates that enhance protein solubility, resolution, and visualization [24]. The key aspects of this protocol include:
Sample preparation for IEF-IPG requires careful attention to buffer composition. A typical rehydration buffer contains 7M urea, 2M thiourea, 4% CHAPS, and appropriate ampholytes [13]. For tissue samples, homogenization and lysis in ion-exchanged IEF buffer followed by reduction and alkylation with 5 mM TBP and 10 mM acrylamide in 25 mM ammonium bicarbonate (pH 8.0) at 37°C for 90 minutes has been successfully employed [13].
The IEF process itself involves multiple steps:
- IPG strip rehydration with sample (typically 10-12 hours)
- Initial low-voltage focusing (150-300 V for 30-60 minutes)
- Gradient or stepwise voltage increase to final high-voltage focusing (3500-8000 V)
- Total focusing time ranging from 15,000 to 30,000 Vh depending on pH range and strip length [24]
Following IEF, IPG strips are equilibrated in SDS-containing buffer before transfer to the second dimension SDS-PAGE [19]. For basic protein analysis, NEPHGE-based methods, where proteins are applied to the anodic end of the IEF gel, have shown superior performance compared to standard IPG techniques [19].
Figure 2: Integrated Workflow Combining IEF-IPG and SDS-PAGE in 2D Gel Electrophoresis. The sequential application of these orthogonal separation techniques significantly enhances resolution of complex protein mixtures compared to either method alone.
Practical Applications in Proteomic Research
Proteoform Characterization and Post-Translational Modifications
The orthogonal combination of IEF-IPG and SDS-PAGE in 2DE provides unique advantages for characterizing proteoforms and post-translational modifications (PTMs). In a comparative study, 2D-DIGE top-down analysis successfully provided direct stoichiometric qualitative and quantitative information about proteoforms, including unexpected PTMs such as proteolytic cleavage and phosphorylation [21]. This capability is particularly valuable because proteoforms—defined as all the different molecular forms in which a protein product can be found—often have critical biological functions but are frequently missed in shotgun proteomics approaches [21].
The Blood Proteoform Atlas has identified approximately 17.5 proteoforms per human gene using highly complex technical MS-based top-down proteomics, with lysine acetylation (32.9%) and C- and N-terminal cleavage (30.6%) representing the two most common modifications [21]. For detecting such modifications, 2DE remains a powerful tool because each proteoform typically has a specific pI and MW, allowing ready separation and detection [21]. This separation power enables researchers to detect condition-dependent changes in specific proteoforms that might be obscured in bulk protein measurements.
Biomarker Discovery and Differential Expression Analysis
In differential expression proteomics experiments, the combination of IEF-IPG and SDS-PAGE has proven valuable for identifying biologically relevant protein changes. For example, in a study of cytosolic unfolded protein response (UPR-Cyto) in Saccharomyces cerevisiae, NEPHGE-based 2DE successfully identified the highly basic protein Sis1p as being overexpressed during UPR-Cyto stress, while IPG-based methods showed unreliable results in the basic pI range [19]. This demonstrates how method selection can directly impact biological conclusions.
For pharmaceutical researchers investigating disease mechanisms or drug effects, the quantitative precision of 2D-DIGE (a variant using fluorescent dyes) offers advantages for detecting subtle protein abundance changes. The technology's design, which includes an internal standard comprising a pool of all samples, enables perfect qualitative and quantitative comparability between different 2D-GE runs [21]. This feature, combined with approximately three times lower technical variation compared to shotgun proteomics, makes it particularly suitable for studies with limited sample sizes or small effect sizes [21].
Table 2: Research Reagent Solutions for Protein Separation Experiments
| Reagent/Category | Specific Examples | Function/Purpose | Technical Notes |
|---|---|---|---|
| Denaturing Agents | SDS, Urea, Thiourea | Protein denaturation/disruption of higher-order structure | Urea/thiourea for IEF; SDS for SDS-PAGE [13] [1] |
| Reducing Agents | DTT, β-mercaptoethanol, TBP | Cleavage of disulfide bonds | Essential for complete denaturation [13] [15] |
| Detergents/ Surfactants | CHAPS, Triton X-100 | Solubilization of hydrophobic proteins | Critical for membrane proteins [13] |
| Alkylating Agents | Acrylamide, Iodoacetamide | Cysteine alkylation to prevent reformation of disulfide bonds | Used after reduction [13] |
| IPG Strips | Various pH ranges (3-10, 4-7, 5-8) | First dimension separation by pI | Narrow ranges provide higher resolution [19] [18] |
| Buffer Systems | Tris-glycine, Tris-tricine | Conduct current and maintain stable pH | Tris-glycine most common for SDS-PAGE [1] [15] |
| Staining Solutions | Coomassie, Silver stain, Fluorescent dyes | Protein detection after separation | Varying sensitivity and MS compatibility [19] [21] |
| Polymerization Agents | APS, TEMED | Polyacrylamide gel formation | Catalyze acrylamide cross-linking [1] |
The orthogonal separation mechanisms of SDS-PAGE and IEF-IPG provide complementary value that continues to make their combination powerful for proteomic profiling. SDS-PAGE excels at separating proteins by molecular weight with good reproducibility, while IEF-IPG offers high-resolution separation by isoelectric point, particularly in the acidic range. The technical comparison reveals that neither method is universally superior; rather, their strategic integration in 2DE workflows leverages their respective strengths to achieve comprehensive proteome coverage unattainable with either method alone.
For researchers in pharmaceutical development and proteomics, the choice between these techniques should be guided by specific experimental goals. When analyzing basic proteins (pI > 7), NEPHGE-based IEF methods may be preferable to standard IPG [19]. For studies prioritizing proteoform resolution and detection of post-translational modifications, the top-down approach enabled by 2D-GE offers unique advantages over bottom-up shotgun proteomics [21]. Conversely, when throughput and automation are primary concerns, gel-free approaches may be more suitable, albeit with compromised information about intact proteoforms.
The continuing evolution of both technologies—including developments such as field-inversion gel electrophoresis for improved SDS-PAGE resolution [23] and enhanced IPG formulations for greater reproducibility [18]—ensures that their orthogonal combination will remain relevant for addressing complex proteomic challenges in drug discovery and biomedical research. By understanding their complementary strengths and limitations, researchers can make informed decisions about method selection and integration to optimize experimental outcomes.
Current Market Landscape and Adoption Trends in Proteomics Research
Proteomics, the large-scale study of proteins, is an indispensable analytical technique for understanding the dynamic functioning of biological systems through the investigation of different proteins and their proteoforms [21]. The completion of the human genome sequencing project revealed a surprisingly limited number of genes, making it clear that much of biological complexity arises at the protein level through various modifications and proteoforms [21]. In this context, protein fractionation and separation techniques represent fundamental pillars of proteomic research, enabling researchers to deconstruct complex biological samples for detailed analysis. The global market for protein separation technologies continues to expand, valued at approximately $11.2 billion in 2022 and projected to reach $16.5 billion by 2027, representing a compound annual growth rate of 8.1% [18].
Among the diverse methodologies available, gel-based separation techniques remain cornerstone technologies in both academic and industrial settings. This comparison guide focuses on two principal gel-based approaches: SDS-PAGE (Sodium Dodecyl Sulfate-Polyacrylamide Gel Electrophoresis) and IEF-IPG (Isoelectric Focusing using Immobilized pH Gradients). These techniques offer complementary strengths for proteomic profiling, with SDS-PAGE separating proteins primarily by molecular weight and IEF-IPG separating proteins based on their isoelectric point (pI) [1] [25]. The following sections provide a detailed comparative analysis of these technologies, supported by experimental data, methodological protocols, and market trends relevant to researchers, scientists, and drug development professionals.
Principles of Separation Technologies
SDS-PAGE: Separation by Molecular Weight
SDS-PAGE is a standard laboratory technique by which charged protein molecules are transported through a solvent by an electrical field [1]. In this denaturing and reducing electrophoresis method, the ionic detergent sodium dodecyl sulfate (SDS) binds to proteins in a constant weight ratio (approximately 1.4 g SDS per 1 g of polypeptide), rendering them uniformly negatively charged [1]. This process neutralizes the intrinsic charges of polypeptides, ensuring that proteins migrate through the polyacrylamide gel matrix strictly according to their molecular weight, with smaller proteins traveling more rapidly than larger ones due to the sieving effect of the gel [1].
The polyacrylamide gel matrix is created by polymerizing acrylamide with bisacrylamide, forming a crosslinked network whose pore size is determined by the concentration of acrylamide [1]. Lower percentage gels (e.g., 7%) have larger pores and resolve high molecular weight proteins more effectively, while higher percentage gels (e.g., 12%) have smaller pores ideal for separating lower molecular weight proteins [1]. Gradient gels that transition from low to high acrylamide concentration provide broader separation ranges across protein sizes [1].
IEF-IPG: Separation by Isoelectric Point
Isoelectric focusing (IEF) separates proteins based on their native isoelectric point (pI) - the specific pH at which a protein carries no net electrical charge [25] [18]. When subjected to an electric field within a stable pH gradient, proteins migrate until they reach the point in the gradient corresponding to their pI, where their net charge becomes zero and migration ceases [25]. The immobilized pH gradient (IPG) technology represents a significant advancement over traditional carrier ampholyte-based methods, featuring pH gradients covalently incorporated into the polyacrylamide gel matrix through acrylamido buffers [25] [18]. This innovation prevents gradient drift during extended focusing times, allows for higher protein loading capacity, and enables more stable and reproducible separations [18].
Two-Dimensional Electrophoresis: Combining Both Principles
Two-dimensional gel electrophoresis (2-DE or 2D-PAGE) combines these two orthogonal separation techniques, first separating proteins by their pI using IEF-IPG in the first dimension, followed by SDS-PAGE separation based on molecular weight in the second dimension [25] [26]. This powerful analytical approach enables the simultaneous resolution of hundreds to thousands of proteins in a single gel, providing a visual map of the proteome essential for studying protein expression, modifications, and interactions [25]. The technique was independently developed in 1975 by Patrick H. O'Farrell and Joachim Klose, building on earlier one-dimensional electrophoresis methods to achieve unprecedented resolution for complex samples [25].
Figure 1: Workflow of Two-Dimensional Gel Electrophoresis (2D-PAGE) Combining IEF-IPG and SDS-PAGE
Experimental Comparison and Performance Data
Technical Performance Metrics
A comprehensive comparative study evaluated the most common gel-based protein separation techniques, including 1-D SDS-PAGE, preparative 1-D SDS-PAGE, IEF-IPG, and 2-D PAGE, for their performance in nanoLC-ESI-MS/MS analysis of protein standards and mitochondrial extracts from rat liver [13]. The findings demonstrated that while all techniques provided complementary protein identification results, 1-D SDS-PAGE and IEF-IPG yielded the highest number of protein identifications [13]. Specifically, the IEF-IPG technique resulted in the highest average number of detected peptides per protein, which can be particularly beneficial for quantitative and structural characterization of proteins in large-scale biomedical applications [13].
Table 1: Comparative Performance of Gel-Based Separation Techniques in Proteomic Profiling
| Separation Technique | Protein Identifications | Peptides per Protein | Key Strengths | Primary Limitations |
|---|---|---|---|---|
| 1-D SDS-PAGE | High | Moderate | Excellent for MW separation, simple protocol | Limited resolution for complex mixtures |
| IEF-IPG | High | Highest | Superior pI-based separation, high resolution | Challenges with hydrophobic proteins |
| 2-D PAGE | Moderate | Variable | Highest resolution, visual proteome mapping | Labor-intensive, low throughput |
| Preparative 1-D SDS-PAGE | Moderate | Moderate | High protein loading capacity | Lower resolution than analytical methods |
The analytical strengths and limitations of these fundamentally different methodologies were further explored in a practical comparative study examining qualitative and quantitative performance through parallel measurements of human prostate carcinoma cell lines using both label-free shotgun (bottom-up) and two-dimensional differential gel electrophoresis (2D-DIGE, top-down) approaches [21]. The study revealed that label-free shotgun proteomics exhibited three times higher technical variation compared to 2D-DIGE, despite its faster analysis time [21]. Only the 2D-DIGE top-down analysis provided valuable, direct stoichiometric qualitative and quantitative information about proteins and their proteoforms, including unexpected post-translational modifications such as proteolytic cleavage and phosphorylation [21].
Sample Preparation and Experimental Protocols
SDS-PAGE Methodology
For SDS-PAGE analysis, protein samples are typically diluted in a sample buffer containing Tris-HCl, glycerol, SDS, bromophenol blue, and a reducing agent such as DTT [13]. The prepared samples are then loaded onto polyacrylamide gels of appropriate concentration based on the target protein sizes [1]. Electrophoresis is performed using a discontinuous buffer system, with Tris-glycine-SDS commonly employed as the running buffer [1] [27]. The process typically requires 20-45 minutes at constant voltage (e.g., 200 V) [28]. Following separation, proteins can be visualized using various staining techniques including Coomassie Brilliant Blue, silver staining, or fluorescent dyes like Sypro Ruby [26].
IEF-IPG Methodology
For IEF-IPG separation, protein samples must first be prepared in appropriate IEF buffers, typically containing urea, thiourea, and CHAPS to maintain solubility [13]. Critical sample preparation steps include reduction and alkylation, often using tris-(2-carboxyethyl)-phosphine and iodoacetamide, respectively [28]. The prepared samples are loaded onto IPG strips with pH ranges selected based on the target proteins' isoelectric points [18]. Narrow pH ranges (e.g., 4-7 or 5-8) provide higher resolution for specific protein groups, while wider ranges (e.g., 3-10) offer broader separation capabilities [18]. Isoelectric focusing is then performed using programmed voltage gradients, typically accumulating thousands of volt-hours for optimal focusing [25].
Table 2: Key Research Reagent Solutions for Gel-Based Proteomics
| Reagent Category | Specific Products/Formulations | Function in Experimental Workflow |
|---|---|---|
| Detergents & Solubilization Agents | SDS, CHAPS, Triton X-100 | Protein denaturation, solubilization, and charge uniformity |
| Reducing Agents | DTT, DTE, TCEP | Cleavage of disulfide bonds for complete denaturation |
| Alkylating Agents | Iodoacetamide, Acrylamide | Cysteine modification to prevent reformation of disulfide bonds |
| IPG Strips & Buffers | Immobilized pH Gradient strips, Ampholytes | Establishing stable pH gradients for IEF separation |
| Gel Matrices | Polyacrylamide, Bis-acrylamide | Creating porous sieving matrix for size-based separation |
| Staining Solutions | Coomassie Blue, Sypro Ruby, Silver nitrate | Protein detection and visualization after separation |
Market Landscape and Adoption Trends
Current Market Size and Growth Projections
The market for protein electrophoresis technologies demonstrates robust growth driven by increasing applications in pharmaceutical research, clinical diagnostics, and biotechnology. The SDS-PAGE electrophoresis market specifically was valued at $378 million in 2025 and exhibits strong growth potential, projected to expand at a compound annual growth rate (CAGR) of 6.2% through 2033 [29]. Another market analysis reports a slightly more conservative but still steady growth trajectory, with the SDS-PAGE electrophoresis buffer market size at $75.9 million in 2025 and a projected CAGR of 3.3% from 2025 to 2033 [27].
The pharmaceutical and biotechnology sectors constitute the largest market segments, accounting for over 60% of the total demand for protein separation technologies [18]. These industries rely heavily on both SDS-PAGE and IEF-IPG techniques for protein characterization, purification of biopharmaceuticals, and quality control processes [18]. The increasing development of biologics and biosimilars has further accelerated demand for high-resolution separation technologies that can effectively analyze protein charge heterogeneity and other critical quality attributes [18].
Regional Adoption Patterns
Regional analysis reveals that North America holds the largest market share at 38%, followed by Europe at 30% and Asia-Pacific at 25% [18]. However, the Asia-Pacific region is expected to gain significant market share over the next five years due to expanding biopharmaceutical manufacturing capabilities and increasing adoption of advanced analytical technologies [18]. The growth in Asia-Pacific markets, particularly China and India, is exceeding 10% annually, outpacing other regions and reflecting the globalization of sophisticated proteomics research capabilities [18].
Innovation Trends and Technological Advancements
The protein separation technology landscape is experiencing several transformative innovation trends:
Automation and Miniaturization: Laboratories worldwide are increasingly investing in platforms that streamline the electrophoresis process, with a notable push toward automation, miniaturization, and data standardization [30]. Microfluidic platforms now offer chip-based electrophoresis, drastically reducing sample volume requirements while accelerating run times [30].
Enhanced Detection and Imaging: Advances in detection methods include refined staining protocols with improved sensitivity and dynamic range, along with sophisticated imaging systems that enable more accurate quantification [26]. Fluorescent-based dyes, such as Sypro Ruby, have gained prominence due to their greater dynamic range compared to traditional Coomassie Brilliant Blue or silver nitrate staining [26].
Integrated Workflow Solutions: Suppliers are expanding accessory portfolios with precision buffer solutions and calibrated protein ladders to support streamlined workflows [30]. The introduction of precast gradient gels has enhanced research flexibility, enabling scientists to adapt gel density gradients on demand without the time and variability associated with manual casting [30].
Digital Integration and Data Analysis: Software innovations are empowering researchers with enhanced image analysis algorithms that automatically detect bands, quantify intensity, and normalize against internal standards, reducing user bias and ensuring reproducibility [30]. These digital tools facilitate inter-laboratory data comparison, a critical factor for multi-center studies and global collaborations [30].
The comparative analysis of SDS-PAGE and IEF-IPG technologies reveals a complementary relationship rather than a competitive one in proteomic profiling research. While SDS-PAGE excels in molecular weight-based separation with straightforward protocols and broad accessibility, IEF-IPG provides superior resolution based on isoelectric points, enabling detection of subtle protein charge variations. The integration of these techniques in two-dimensional electrophoresis represents one of the most powerful approaches for comprehensive proteome analysis, particularly for studying post-translational modifications and proteoforms.
The market landscape reflects the enduring importance of both technologies, with steady growth driven by expanding applications in pharmaceutical development, clinical diagnostics, and basic research. The ongoing innovation in automation, detection sensitivity, and data integration ensures that these foundational techniques will remain relevant in the evolving proteomics landscape. For researchers and drug development professionals, the selection between SDS-PAGE and IEF-IPG should be guided by specific experimental objectives, with SDS-PAGE ideal for routine molecular weight analysis and IEF-IPG preferred for detailed characterization of protein charge heterogeneity and complex proteoforms.
Practical Implementation: Workflows, Protocols, and Specialized Applications
Standardized Protocols for SDS-PAGE (GeLC-MS/MS) and IEF-IPG Workflows
In mass spectrometry-based proteomic profiling, fractionating complex protein samples is an indispensable strategy to enhance detection sensitivity. Gel-based separation techniques, primarily Sodium Dodecyl Sulfate-Polyacrylamide Gel Electrophoresis (SDS-PAGE) and Isoelectric Focusing in Immobilized pH Gradients (IEF-IPG), serve as foundational first-dimension methods. These techniques leverage orthogonal separation principles: SDS-PAGE separates proteins by molecular mass, while IEF-IPG separates them based on isoelectric point (pI). When combined with liquid chromatography-tandem mass spectrometry (LC-MS/MS), they form the GeLC-MS/MS and IEF-IPG-MS workflows, which are critical for comprehensive protein analysis in biomedical research and drug development [13] [31].
The evolution of these techniques has been marked by significant milestones. IEF, first practically implemented with synthetic carrier ampholytes in the 1960s, was revolutionized by the introduction of immobilized pH gradients (IPG) in the 1980s, which enhanced reproducibility and eliminated cathodic drift [32]. SDS-PAGE, standardized by Laemmli in 1970, has evolved from a labor-intensive manual process to a streamlined workflow incorporating precast gels and automated systems [2] [33]. This guide provides a detailed, objective comparison of their performance, supported by experimental data and standardized protocols.
Separation Mechanisms and Theoretical Foundations
SDS-PAGE (GeLC-MS/MS)
The GeLC-MS/MS workflow involves separating a complex protein lysate by SDS-PAGE, slicing the entire gel lane into multiple fractions, followed by in-gel digestion and LC-MS/MS analysis of each fraction [34]. The core principle is molecular weight-based separation. Proteins are denatured and linearized with SDS and reducing agents, imparting a uniform negative charge-to-mass ratio. As they migrate through a polyacrylamide gel matrix under an electric field, smaller proteins move faster, while larger ones are retarded [33]. The resulting banding pattern provides an intermediate quality control step before MS analysis.
IEF-IPG
IEF-IPG separates proteins based on their isoelectric point (pI), the specific pH at which a protein carries no net electrical charge [32]. This technique exploits the amphoteric nature of proteins, which causes their net charge to vary with environmental pH. In IEF-IPG, proteins are applied to a gel strip containing a covalently immobilized pH gradient and subjected to a high voltage. Each protein migrates until it reaches the pH region corresponding to its pI, where its net charge becomes zero and migration ceases [32] [35]. This results in proteins concentrating into sharp, focused bands. The key advantage of IPG strips over older carrier ampholyte methods is superior stability, reproducibility, and higher protein loading capacity, enabling more consistent results, especially in complex proteomic workflows like two-dimensional electrophoresis (2-DE) [32].
Table 1: Core Principles of SDS-PAGE and IEF-IPG
| Feature | SDS-PAGE (GeLC-MS/MS) | IEF-IPG |
|---|---|---|
| Separation Principle | Molecular weight (MW) | Isoelectric point (pI) |
| Physicochemical Basis | Size-based migration through porous gel | Charge-based migration in a pH gradient |
| Key Reagents | SDS, DTT, acrylamide, bis-acrylamide | Carrier ampholytes, IPG strips, urea, CHAPS |
| Typical Format | Vertical slab gel | Individual gel strips |
| Primary Output | Bands of proteins grouped by MW | Focused zones of proteins grouped by pI |
| Compatibility | High tolerance to salts, detergents [34] | Requires low ionic strength for effective focusing [13] |
Diagram 1: Comparative workflows for GeLC-MS/MS and IEF-IPG. Both methods begin with orthogonal separation principles before converging on a common path for mass spectrometry analysis.
Experimental Protocols and Workflow Optimization
Standardized GeLC-MS/MS Protocol
The GeLC-MS/MS workflow can be significantly streamlined using a "Whole Gel" (WG) processing method, which reduces manual handling compared to the conventional "In-Gel Digestion" (IGD) procedure [34].
Diagram 2: Detailed GeLC-MS/MS workflow comparing the streamlined Whole-Gel (WG) and traditional In-Gel Digestion (IGD) processing paths.
Key Steps for GeLC-MS/MS (Whole-Gel Protocol):
- Sample Preparation: Homogenize and lyse samples in an appropriate buffer. For cells or tissues, use bead homogenization in a monophasic solvent like Water:Methanol (1:2) or Methanol:Acetone (9:1) for concurrent metabolomics, lipidomics, and proteomics analysis [36]. Reduce and alkylate proteins (e.g., with 5 mM TBP and 10 mM acrylamide) [13].
- SDS-PAGE Separation: Load samples onto a 1D SDS-PAGE gel (e.g., 4-12% gradient or uniform concentration). Run electrophoresis until the dye front reaches the bottom. A broad-range pre-stained protein marker should be included for molecular weight estimation.
- Whole-Gel Processing: This step differentiates the WG protocol. Fix and stain the entire gel (e.g., with Coomassie). Perform all subsequent washing, reduction, and alkylation steps on the intact gel in a single container, drastically reducing hands-on time compared to processing individual slices [34].
- Gel Slicing: After processing, slice the entire gel lane into 5-20 fractions based on the pre-stained markers and staining pattern. Slicing guides can be created from a scanned image of the gel.
- In-Gel Digestion & Peptide Extraction: Dice each gel slice, destain, and digest with trypsin overnight at 37°C. Extract peptides from the gel matrix using a series of solvents (e.g., acetonitrile and formic acid) and concentrate them for LC-MS/MS analysis [34].
Standardized IEF-IPG Protocol
Key Steps for IEF-IPG:
- Sample Preparation: Protein extracts must be in a low-conductivity IEF-compatible buffer, typically containing 7 M urea, 2 M thiourea, and 4% CHAPS. Sample conductivity often needs adjustment via centrifugal ultrafiltration (e.g., using 10 kDa MWCO filters) to ≤ 300 µS/cm for effective focusing [13]. Reduce and alkylate proteins before loading.
- IEF Run: Apply the sample to an IPG strip (e.g., pH 3-10) via passive rehydration or cup loading. Perform isoelectric focusing under a high voltage (e.g., up to 8000 V) using a stepwise or gradient program. Total focusing time can vary from a few hours to over 24 hours to reach volt-hour equilibrium [32] [6].
- Post-Focusing Processing: After IEF, IPG strips can be equilibrated in SDS-containing buffer for a second-dimension SDS-PAGE run (in 2-DE workflows) [32]. For direct MS analysis (IEF-IPG-MS), proteins must be recovered from the IPG strip. This can be done by cutting the strip into segments based on their pH range and eluting proteins, or by using solution-based recovery systems like the Agilent OFFGEL fractionator [13].
- Digestion and MS Analysis: Recovered proteins are then subjected to in-solution or in-gel tryptic digestion, followed by LC-MS/MS analysis.
Performance Comparison and Experimental Data
A direct comparative study evaluated several gel-based fractionation techniques—1-D SDS-PAGE, preparative 1-D SDS-PAGE, IEF-IPG, and 2-D PAGE—using a mixture of protein standards and mitochondrial extracts from rat liver, followed by nanoLC-ESI-MS/MS analysis [13].
Table 2: Quantitative Performance Comparison of Gel-Based Fractionation Techniques (based on [13])
| Technique | Relative Protein Identification Yield | Average Peptides per Protein | Key Strengths | Noted Limitations |
|---|---|---|---|---|
| 1-D SDS-PAGE (GeLC-MS/MS) | Highest number of identifications (tied with IEF-IPG) | High | High sensitivity and dynamic range; removes interfering contaminants [13] [34] | Poor recovery of proteins from gel matrix; manual processing [13] |
| IEF-IPG | Highest number of identifications (tied with SDS-PAGE) | Highest | Superior for detecting charge variants (proteoforms) [31]; excellent for quantitative and structural characterization [13] | Sensitive to salts; requires specific buffer conditions; potential protein precipitation at pI [13] [32] |
| 2-D PAGE | Lower than 1-D SDS-PAGE and IEF-IPG | N/A | High resolution for specific protein subsets | Evaluated as less effective as a fractionation approach for global profiling in this study [13] |
The study concluded that while all techniques provided complementary protein identification results, 1-D SDS-PAGE and IEF-IPG individually yielded the highest number of protein identifications [13]. A critical finding was that the IEF-IPG technique resulted in the highest average number of detected peptides per protein, which is beneficial for achieving more comprehensive protein sequence coverage, improving confidence in identification, and enabling more reliable quantitative and structural characterization [13].
Furthermore, the Whole-Gel (WG) GeLC-MS/MS procedure demonstrates performance equivalent to the conventional In-Gel Digestion (IGD) method. A back-to-back comparison showed an overlap of >80% in protein identification between the two processing methods, and label-free quantitation by spectral counting revealed a strong positive correlation (R² = 0.94) [34]. This confirms that the streamlined WG protocol achieves similar performance while significantly reducing manual processing time, especially in large-scale experiments involving many samples [34].
The Scientist's Toolkit: Essential Research Reagents
Table 3: Key Reagents and Materials for SDS-PAGE and IEF-IPG Workflows
| Item | Function/Purpose | Example Use Cases |
|---|---|---|
| IPG Strips | Immobilized pH gradients for stable, reproducible IEF separation. | First dimension separation in 2DE; standalone IEF-IPG fractionation [32] [13]. |
| Carrier Ampholytes | Small, soluble amphoteric molecules that create a stable pH gradient in solution for IEF. | Establishing pH gradients in capillary IEF or free-flow IEF devices [6]. |
| IEF-Compatible Detergents (e.g., CHAPS) | Solubilizes proteins without interfering with the IEF process or pH gradient. | Sample lysis and solubilization for IEF-IPG [13]. |
| Urea & Thiourea | Protein denaturants that help unfold and solubilize proteins in IEF samples. | Key components of IEF sample buffer (e.g., 7 M Urea, 2 M Thiourea) [13]. |
| Precast SDS-PAGE Gels | Ready-to-use gels with consistent polyacrylamide matrix for reproducible MW-based separation. | GeLC-MS/MS workflows; quality control of protein samples [33] [34]. |
| Mass Spectrometry-Compatible Stains | Allow visualization of proteins in gels without cross-linking or modifying peptides, ensuring compatibility with downstream MS. | Detecting protein bands/fractions after SDS-PAGE or IEF for gel slicing [34]. |
| Sequencing-Grade Trypsin | High-purity proteolytic enzyme for specific cleavage at lysine and arginine residues, generating peptides for MS identification. | In-gel digestion of proteins in GeLC-MS/MS; in-solution digestion of IEF fractions [34]. |
The choice between GeLC-MS/MS and IEF-IPG is not a matter of one being universally superior, but rather depends on the specific research goals, sample type, and desired outcomes.
- Choose GeLC-MS/MS when your primary goal is to achieve the deepest possible proteome coverage from a complex mixture for identification and label-free quantification. Its robustness, high tolerance to various sample contaminants, and the efficiency of the Whole-Gel protocol make it ideal for large-scale differential profiling and clinical proteomics where sample numbers are high [13] [34].
- Choose IEF-IPG when the analysis of proteoforms—specific molecular forms of a protein arising from post-translational modifications (PTMs) like phosphorylation or glycosylation that alter charge—is a priority. Its high resolution for separating charge variants and its ability to provide higher peptide coverage per protein make it exceptionally powerful for characterizing protein heterogeneity and for top-down or middle-down proteomics [31] [13].
For the most comprehensive analysis, these techniques are not mutually exclusive. They can be used orthogonally, either in a combined 2-DE workflow or by applying them to aliquots of the same sample, to maximize the depth and breadth of proteomic profiling [13]. The ongoing development of miniaturized and automated systems, such as microfluidic free-flow IEF and capillary electrophoresis, promises to further enhance the throughput, resolution, and accessibility of both methods in the future [2] [6] [33].
In proteomic profiling research, the selection of a separation technique is fundamentally intertwined with the initial sample preparation strategy. The comparative analysis between SDS-PAGE (Sodium Dodecyl Sulfate-Polyacrylamide Gel Electrophoresis) and IEF-IPG (Isoelectric Focusing using Immobilized pH Gradients) extends beyond their separation principles to encompass distinct requirements for sample lysis, reduction, and alkylation. SDS-PAGE separates proteins primarily by molecular weight, necessitating complete denaturation and uniform charge masking. In contrast, IEF-IPG separates proteins based on their intrinsic isoelectric point (pI), requiring preservation of the protein's native charge while maintaining solubility throughout the focusing process. This guide objectively compares the specific sample preparation protocols for both techniques, supported by experimental data, to inform researchers and drug development professionals in designing robust proteomic workflows.
Core Principles and Sample Preparation Objectives
Technique-Specific Separation Mechanisms
The underlying separation mechanism dictates every aspect of sample preparation. In SDS-PAGE, the anionic detergent SDS binds to proteins at a relatively constant ratio (~1.4 g SDS per 1.0 g protein), conferring a uniform negative charge density that overwhelms the protein's inherent charge. This allows separation based almost exclusively on molecular size as proteins migrate through a polyacrylamide gel matrix under an electric field. The sample preparation must therefore ensure complete denaturation and thorough SDS-binding.
Conversely, IEF-IPG relies on the protein's native charge. Proteins are applied to a gel strip containing a pre-formed pH gradient and migrate under an electric field until they reach the pH position where their net charge is zero (their pI). This technique requires that the protein's native charge remains unaltered, ruling out the use of charged denaturants like SDS during the first dimension. The preparation must maintain solubility and prevent aggregation while the protein focuses at its pI, a point where solubility is often minimized.
Key Preparation Challenges for Each Method
The primary challenges for SDS-PAGE sample preparation include:
- Complete Disruption of Secondary and Tertiary Structure: Ensuring proteins are linearized for accurate molecular weight determination.
- Elimination of Post-Translational Modification Artifacts: Reduction and alkylation must be thorough to prevent smearing from disulfide bridge heterogeneity.
- Compatibility with Gel Loading: Samples must contain a minimal salt concentration to avoid distorted band patterns.
For IEF-IPG, the major challenges are:
- Solubilization at the pI: Proteins are least soluble at their isoelectric point, creating a high risk of precipitation during the run.
- Charge Integrity: The use of charged detergents or buffers that could alter the protein's pI must be avoided.
- Conductive Interference: High salt concentrations disrupt the pH gradient and must be removed prior to IEF.
Detailed Methodologies and Experimental Protocols
Lysis Buffer Composition for SDS-PAGE vs. IEF-IPG
The choice of lysis buffer is critical for successful protein separation and must be tailored to the specific technique. Below is a detailed comparison of standard lysis buffer compositions.
Table 1: Lysis Buffer Compositions for SDS-PAGE and IEF-IPG
| Component | SDS-PAGE Lysis Buffer | IEF-IPG Lysis Buffer | Function | Technique Rationale |
|---|---|---|---|---|
| Detergent | 1-2% SDS (Ionic) | 2-4% CHAPS (Zwitterionic) | Solubilizes hydrophobic proteins | SDS denatures and confers uniform charge; CHAPS solubilizes without interfering with pI |
| Denaturant | - | 7-9 M Urea, 2 M Thiourea | Disrupts hydrogen bonding | Urea/thiourea denature without adding charge, preserving native pI for IEF |
| Reducing Agent | 50-100 mM DTT | 50-100 mM DTT or 5 mM TBP | Breaks disulfide bonds | Essential for both techniques to unfold proteins and prevent artifacts |
| Alkylating Agent | 50-100 mM IAA | 10-50 mM IAA or 10 mM Acrylamide | Alkylates free thiol groups | Prevents reformation of disulfide bonds; concentration is often lower for IEF |
| Buffering Agent | 50-100 mM Tris-HCl, pH 6.8-8.8 | 20-40 mM Tris or similar | Maintains pH | Tris is common; concentration is lower in IEF buffers to minimize conductivity |
| Additives | Glycerol, Bromophenol Blue | Carrier Ampholytes, Glycerol | Aids loading and focusing | Glycerol adds density; ampholytes help maintain solubility during IEF |
Protocol 1: Standard SDS-PAGE Sample Preparation [13]
- Lysis: Homogenize cell or tissue samples in SDS-PAGE lysis buffer (e.g., 2% SDS, 50 mM Tris-HCl pH 6.8, 10% glycerol).
- Reduction: Add DTT to a final concentration of 50-100 mM. Incubate at 95°C for 5-10 minutes.
- Alkylation: Add Iodoacetamide (IAA) to a final concentration of 50-100 mM. Incubate at room temperature in the dark for 20-30 minutes.
- Buffer Exchange (if needed): For complex samples, clean-up and concentration using centrifugal ultrafiltration (e.g., 10 kDa MWCO filters) may be performed to remove interfering contaminants.
Protocol 2: Standard IEF-IPG Sample Preparation [13]
- Lysis: Homogenize samples in IEF-IPG lysis buffer (e.g., 7 M Urea, 2 M Thiourea, 4% CHAPS, 50 mM DTT, 0.5-2% carrier ampholytes).
- Reduction & Alkylation (In-Solution): Reduce with 5 mM Tributylphosphine (TBP) and alkylate with 10 mM Acrylamide in 25 mM ammonium bicarbonate, pH 8.0, at 37°C for 90 minutes. Quench the reaction with excess DTT.
- Desalting/Clean-up: Critically, the sample must be desalted to a conductivity of ≤ 300 µS/cm using centrifugal ultrafiltration with IEF buffer to prevent disruption of the pH gradient during focusing.
Experimental Workflow Comparison
The following diagram visualizes the parallel but distinct sample preparation workflows for SDS-PAGE and IEF-IPG, highlighting the key decision points and procedural differences.
Performance Comparison and Supporting Data
Quantitative Comparison of Technical Performance
A comparative study evaluating common gel-based separation techniques for proteomic profiling provides objective performance data. The study used a mixture of protein standards and mitochondrial extracts from rat liver, followed by nanoLC-ESI-MS/MS analysis [13].
Table 2: Performance Comparison of SDS-PAGE and IEF-IPG in Proteomic Profiling [13]
| Performance Metric | 1-D SDS-PAGE (GeLC-MS/MS) | IEF-IPG | Experimental Context |
|---|---|---|---|
| Number of Protein Identifications | High | High (Highest, with 1-D SDS-PAGE) | Both techniques provided complementary results, with the highest total IDs from these two. |
| Peptides per Protein | Lower | Highest | IEF-IPG yielded the highest average number of detected peptides per protein, aiding protein validation. |
| Handling of Hydrophobic Proteins | Limited | Limited | Both techniques share this limitation, though microfluidic FF-IEF shows improvement [6]. |
| Sample Load Capacity | ~200-500 µg (Typical gel) | Similar or higher with preparative setups | Standard analytical IEF-IPG strips have capacities comparable to SDS-PAGE gels [6]. |
| Key Advantage | Effective complexity reduction; removes contaminants. | Superior resolution for charge variants (isoforms). | IEF-IPG is highly beneficial for characterizing post-translational modifications that alter pI. |
Impact on Downstream Analysis
The choice of sample preparation and separation technique directly influences downstream mass spectrometry results:
- SDS-PAGE (GeLC-MS/MS): In-gel digestion after separation effectively removes interfering contaminants and SDS, leading to clean MS samples. However, protein recovery from the gel matrix can be variable, potentially affecting yield and reproducibility [13].
- IEF-IPG: When combined with in-gel digestion, it faces similar recovery challenges. However, solution-phase recovery systems like the Agilent OFFGEL Fractionator allow proteins or peptides to be focused in a liquid phase above an IPG strip, significantly improving recovery for downstream LC-MS/MS [37]. This has made IEF a powerful prefractionation method for complex samples.
The Scientist's Toolkit: Essential Research Reagent Solutions
Successful implementation of these protocols relies on specific, high-quality reagents. The following table details essential materials and their functions.
Table 3: Essential Reagents for Sample Preparation
| Reagent / Kit | Function | Key Consideration |
|---|---|---|
| SDS (Sodium Dodecyl Sulfate) | Ionic detergent for denaturation and charge masking in SDS-PAGE. | Use high-purity grade to prevent impurities that affect migration. |
| CHAPS | Zwitterionic detergent for protein solubilization in IEF-IPG. | Does not interfere with the pH gradient, unlike SDS. |
| Urea & Thiourea | Powerful chaotropes for denaturation in IEF-IPG buffers. | Solutions must not be heated above 37°C to prevent protein carbamylation. |
| DTT (Dithiothreitol) | Reducing agent for breaking disulfide bonds. | Freshly prepared stock solutions are critical for efficacy. |
| IAA (Iodoacetamide) | Alkylating agent for cysteine residues. | Must be used in the dark and excess must be quenched. |
| Tributylphosphine (TBP) | Alternative reducing agent; often used with acrylamide for alkylation. | More efficient than DTT at reducing disulfide bonds in some protocols [13]. |
| Centrifugal Ultrafilters (10 kDa MWCO) | Desalting and buffer exchange, crucial for IEF-IPG. | Reduces sample conductivity to ≤ 300 µS/cm for effective focusing [13]. |
| OFFGEL Fractionator (Agilent) | Apparatus for solution-phase IEF fractionation. | Enables high-recovery fractionation of proteins or peptides based on pI for MS analysis [37]. |
| Rotofor System (Bio-Rad) | Preparative liquid-phase IEF fractionation. | Divides a sample into 20 fractions across a pH gradient for in-depth proteome coverage [37]. |
The selection of sample preparation protocols for SDS-PAGE versus IEF-IPG is a foundational decision in proteomic profiling. SDS-PAGE requires harsh, ionic denaturation for molecular weight-based separation, while IEF-IPG demands charge-preserving solubilization for pI-based separation.
For researchers and drug development professionals, the choice should be guided by the primary analytical goal:
- Use SDS-PAGE when the objective is to assess protein molecular weight, purity, or quantity in a robust and straightforward workflow. Its compatibility with western blotting also makes it ideal for immunodetection.
- Use IEF-IPG when resolving protein isoforms, characterizing charge heterogeneity due to post-translational modifications, or achieving the highest depth of proteomic coverage in a 2D-PAGE workflow is required.
The experimental data shows that these techniques are not mutually exclusive but are highly complementary [13]. Combining orthogonal separation principles—such as using IEF-IPG for initial fractionation followed by SDS-PAGE (as in 2D-PAGE) or LC-MS/MS—represents a powerful strategy to significantly enhance profiling sensitivity and dynamic range in the most challenging proteomic studies.
Two-dimensional gel electrophoresis (2-DE) remains a cornerstone technique in proteomics for the high-resolution separation of complex protein mixtures. This method synergistically combines two orthogonal separation principles: isoelectric focusing with immobilized pH gradients (IEF-IPG) to resolve proteins by their isoelectric point (pI), followed by SDS-PAGE to separate them by molecular weight. This guide provides a detailed comparison of these core technologies, presenting experimental data on their performance, optimized protocols for implementation, and an analysis of their complementary strengths in proteomic profiling. The integration of IEF-IPG with SDS-PAGE enables the simultaneous separation of thousands of protein spots from a single sample, forming a powerful foundation for differential expression studies, post-translational modification analysis, and biomarker discovery [13] [1].
The resolving power of two-dimensional electrophoresis stems from its ability to separate proteins across two distinct physical dimensions. The first dimension (IEF-IPG) exploits the inherent charge characteristics of proteins. Every protein has an isoelectric point (pI)—the specific pH at which it carries no net electrical charge. When placed in a pH gradient under an electric field, proteins migrate until they reach the position in the gradient corresponding to their pI, where they become focused into sharp bands [18] [1]. Modern IEF predominantly uses immobilized pH gradients (IPG), where the pH gradient is covalently fixed into the gel matrix, offering superior stability, reproducibility, and higher protein loading capacity compared to carrier ampholyte-based systems [18] [17].
The second dimension (SDS-PAGE) then separates these focused proteins based on their molecular mass. Proteins are denatured and uniformly coated with the anionic detergent sodium dodecyl sulfate (SDS), which masks their native charge and confers a consistent charge-to-mass ratio. As they migrate through the polyacrylamide gel matrix, they are sieved according to size, with smaller proteins moving faster than larger ones [1]. The sequential application of these two independent separation parameters—pI and molecular weight—results in proteins being distributed across a two-dimensional plane rather than a single line, dramatically increasing the resolving power for complex samples [13] [1].
Technical Comparison and Performance Data
Quantitative Comparison of Separation Techniques
The complementary nature of IEF and SDS-PAGE is best leveraged when they are combined. However, as standalone fractionation techniques prior to LC-MS/MS analysis, they present distinct performance characteristics, as evidenced by a comparative study of gel-based separation techniques [13].
Table 1: Performance Comparison of Gel-Based Protein Fractionation Techniques for Proteomic Profiling
| Fractionation Technique | Key Separation Principle | Performance Highlights | Key Advantages |
|---|---|---|---|
| IEF-IPG | Isoelectric point (pI) | Highest average number of detected peptides per protein; high number of protein identifications [13]. | Excellent resolution based on charge; high dynamic range; ideal for separating protein isoforms and variants [13] [17]. |
| 1-D SDS-PAGE | Molecular weight (MW) | High number of protein identifications, complementary to IEF-IPG [13]. | Effective complexity reduction; visual assessment of sample quality and MW distribution; simple and robust [13] [1]. |
| 2-D PAGE (IEF-IPG + SDS-PAGE) | Orthogonal: pI then MW | Provides complementary identifications to single-dimension techniques; enables visualization of thousands of protein spots from a single sample [13] [1]. | Maximum resolution for complex mixtures; ability to detect post-translational modifications that shift pI or MW [38] [24]. |
Comparative Analysis of IEF-IPG and Alternative Techniques
A critical comparison of first-dimension techniques highlights specific performance trade-offs, particularly concerning protein pI. A study comparing IPG with the carrier ampholyte-based NEPHGE (Non-Equilibrium pH Gradient Electrophoresis) technique revealed notable differences [19].
Table 2: IEF-IPG vs. NEPHGE for First-Dimension Separation in 2-DE
| Parameter | IEF-IPG (e.g., Invitrogen ZOOM) | NEPHGE (e.g., WITAvision) |
|---|---|---|
| Optimal pI Range | Excellent for acidic proteins (pI < 7) [19]. | Superior for basic proteins (pI > 7); can resolve highly basic proteins missed by IPG [19]. |
| Reproducibility | High reproducibility for acidic proteins; spot reproducibility for basic proteins can be lower [19]. | Excellent overall reproducibility, particularly strong in the basic gel zone [19]. |
| Protein Loss | Higher protein loss during the procedure, especially for basic proteins [19]. | Lower protein loss, maintaining better recovery of basic proteins [19]. |
| Ease of Use | Simple, standardized protocol with commercial, ready-to-use strips; easy handling [19]. | Labor-intensive; requires in-house gel casting; technique is more "stressful" and requires significant skill [19]. |
| Protein Capacity | Standard load (e.g., 50 µg); limited capacity for preparative purposes [19]. | Higher protein capacity with good spot quality and reproducibility at high loads (e.g., 100 µg) [19]. |
This data suggests that while IPG is the default and most convenient choice for most applications, NEPHGE remains a valuable, albeit more demanding, technique for laboratories focused on the analysis of basic proteomes.
Experimental Protocols for Maximum Resolution
Optimized Workflow for 2-DE with IEF-IPG
The following workflow, synthesized from multiple methodological sources, outlines a robust protocol for high-resolution 2-DE [13] [24] [39].
Sample Preparation (Critical Step):
- Extraction: Lyse cells or tissue in a suitable buffer, typically containing chaotropes (7M Urea, 2M Thiourea), non-ionic or zwitterionic detergents (e.g., 4% CHAPS), and reducing agents (e.g., DTT) to solubilize and denature proteins [13] [39].
- Clean-up: Remove interfering compounds (salts, lipids, nucleic acids, phenolics) via TCA/acetone precipitation or commercial cleanup kits. This is crucial for plant and tissue samples [39].
- Quantification: Accurately determine protein concentration using a compatible assay (e.g., Bradford assay) [39].
First Dimension: IEF-IPG
- Rehydration: Apply the protein sample (typically 50-150 µg for analytical gels) to the IPG strip, either by passive rehydration or active rehydration under low voltage. The rehydration buffer contains urea, thiourea, CHAPS, a reducing agent, and carrier ampholytes [13] [19].
- Isoelectric Focusing: Perform IEF using a programmed voltage gradient on an IEF device. A typical step-gradient protocol for a 7 cm IPG strip (pH 3-10) might include steps like 200 V for 20 min, 450 V for 15 min, 750 V for 15 min, and a final ramp to 2000 V for 30-60 min. The total volt-hours (Vhr) must be optimized for the sample and strip length [19].
Strip Equilibration:
- After IEF, equilibrate the IPG strip to prepare proteins for the second dimension. This involves two steps:
- Reduction: Incubate the strip in an equilibration buffer containing urea, glycerol, SDS, and DTT to reduce disulfide bonds.
- Alkylation: Incubate the strip in the same buffer with iodoacetamide instead of DTT to alkylate cysteine residues and prevent reformation of disulfides [19].
- After IEF, equilibrate the IPG strip to prepare proteins for the second dimension. This involves two steps:
Second Dimension: SDS-PAGE
- Gel Casting: Use a polyacrylamide gel, either uniform concentration or gradient (e.g., 4-20%), to resolve a broad range of molecular weights. A stacking gel is often used to sharpen bands [1].
- Transfer and Run: Place the equilibrated IPG strip onto the SDS-PAGE gel. Seal it with agarose to ensure good contact. Run the gel in an electrophoresis tank with Tris-Glycine-SDS running buffer until the dye front reaches the bottom [1].
Protein Detection and Analysis:
- Staining: Visualize separated proteins using stains like Coomassie Brilliant Blue (sensitivity ~50-100 ng), silver staining (sensitivity ~1 ng), or fluorescent dyes (e.g., Sypro Ruby) [17] [1].
- Image Acquisition and Analysis: Scan the gel and use specialized software (e.g., DeCyder, ImageQuant) for spot detection, quantification, and comparative analysis across multiple gels [38].
The following diagram illustrates this multi-step workflow:
Advanced Technique: Microfluidic Free-Flow IEF (FF-IEF)
To address limitations of gel-based IEF (e.g., sample loss, long run times), microfluidic preparative FF-IEF has been developed. This liquid-phase technique continuously separates proteins in a free-flowing stream, offering several advantages [6]:
- Higher Protein Yield: Improved recovery of proteins, particularly high molecular weight species.
- Broader Dynamic Range: Can handle samples from µg/mL to mg/mL concentrations.
- Faster Separation: Reduced experimental time compared to traditional IPG strip IEF.
- Continuous Operation: Amenable to automation and direct coupling with downstream analysis.
This technique demonstrates the ongoing innovation in IEF technology to enhance the sensitivity and throughput of proteomic workflows [6].
The Scientist's Toolkit: Essential Reagents and Materials
Successful 2-DE relies on a suite of specialized reagents and equipment. The following table details key solutions and their critical functions in the protocol.
Table 3: Essential Research Reagent Solutions for 2-DE
| Reagent / Solution | Function / Purpose | Key Components |
|---|---|---|
| Lysis / Rehydration Buffer | Solubilizes, denatures, and stabilizes proteins for IEF; provides the medium for IPG strip rehydration. | 7-8 M Urea, 2 M Thiourea, 4% CHAPS, reducing agent (DTT or TBP), 0.5-2% carrier ampholytes [13] [39]. |
| IPG Strips | First-dimension medium containing a covalently immobilized, stable pH gradient for high-resolution IEF. | Polyacrylamide gel with covalently linked Immobiline buffers; available in various pH ranges and lengths [18] [1]. |
| Equilibration Buffer | Denatures proteins with SDS and sets up the environment for second-dimension separation. | Urea, Glycerol, SDS, Tris-HCl; first step with DTT (reduction), second step with Iodoacetamide (alkylation) [19]. |
| SDS-PAGE Gel | Second-dimension matrix that separates proteins based on molecular weight via a sieving effect. | Polyacrylamide, Bis-acrylamide, Tris-HCl (pH 8.8), SDS, APS, TEMED; gradient gels provide wider MW resolution [1]. |
| Running Buffer | Conducts current and provides the ionic environment for protein migration during SDS-PAGE. | Tris base, Glycine, SDS [1]. |
| Staining Solutions | Visualizes separated protein spots on the 2D gel with varying levels of sensitivity. | Coomassie Blue R-250/G-250, Silver Nitrate, Sypro Ruby, Fluorescent dyes [38] [17]. |
The combination of IEF-IPG and SDS-PAGE in two-dimensional electrophoresis represents a powerful, synergistic partnership for proteomic analysis. While IEF-IPG alone excels in separating proteins by charge and provides high peptide detection rates for downstream MS, and SDS-PAGE is a robust workhorse for mass-based separation, their integration in 2-DE is unparalleled for the direct visualization of complex protein mixtures. The choice of technique and specific protocol must be guided by the research question—opting for narrow-range IPG strips for deep coverage of specific pI regions, considering alternative IEF methods like NEPHGE for basic proteomes, or embracing emerging liquid-phase fractionation technologies like FF-IEF to overcome traditional limitations. Despite the rise of gel-free shotgun proteomics, 2-DE remains an indispensable tool for many laboratories, offering a unique combination of high resolution, the ability to detect post-translational modifications, and direct visual validation of protein separation.
In proteomic profiling research, the choice of separation technique is pivotal to the success of downstream analysis. Sodium dodecyl sulfate–polyacrylamide gel electrophoresis (SDS-PAGE) and isoelectric focusing using immobilized pH gradients (IEF-IPG) represent two fundamental, yet orthogonal, approaches for resolving complex protein mixtures [13] [16]. SDS-PAGE separates proteins primarily by molecular weight, while IEF-IPG separates them based on isoelectric point (pI). This guide provides an objective comparison of their performance across three challenging application scenarios: membrane proteins, basic proteins, and proteoform detection, delivering supporting experimental data to inform researchers, scientists, and drug development professionals. A comprehensive understanding of the complementary strengths and limitations of these techniques enables more effective experimental design in proteomic studies.
Core Principles of SDS-PAGE and IEF-IPG
SDS-PAGE is a denaturing electrophoresis technique where the anionic detergent SDS binds to proteins in a constant weight ratio, imparting a uniform negative charge density. This masks the proteins' intrinsic charge, resulting in separation primarily by molecular size as they migrate through a polyacrylamide gel matrix [1]. It is a cornerstone technique for determining protein molecular weight and assessing sample complexity.
IEF-IPG separates proteins based on their inherent pI, the pH at which a protein carries no net charge. Proteins are applied to a pH gradient immobilized within a polyacrylamide gel strip. Under an electric field, they migrate until they reach the point in the gradient corresponding to their pI, where they become focused into sharp bands [16] [40]. The development of IPGs, where buffering groups are covalently fixed to the gel matrix, was a major advancement that improved reproducibility and reduced gradient drift compared to carrier ampholyte-based systems [19] [16].
Comparative Separation Characteristics
Table 1: Fundamental Characteristics of SDS-PAGE and IEF-IPG
| Parameter | SDS-PAGE | IEF-IPG |
|---|---|---|
| Separation Principle | Molecular weight (MW) | Isoelectric point (pI) |
| Typical Separation Range | 5-250 kDa | pI 3-11 (broad range); narrower intervals available |
| Sample State | Denatured and reduced | Denatured |
| Key Reagents | SDS, reducing agents (DTT, TBP), polyacrylamide | Urea, thiourea, CHAPS, carrier ampholytes, IPG strips |
| Information Obtained | Apparent molecular mass | Estimated pI, charge heterogeneity |
| Resolution | High for proteins of different sizes; lower for similar MW | Extremely high for charge differences (e.g., 0.01 pH units) |
Comparative Analysis in Key Application Scenarios
Scenario 1: Separation of Basic Proteins
Basic proteins (pI > 7.0) present a particular challenge in proteomic separations. A direct comparison of 2DE methods revealed that IEF-IPG techniques struggle with protein loss and poor reproducibility for basic proteins [19]. The study reported that "about half of detected basic protein spots were not reproducible by IPG-based 2DE," whereas a non-equilibrium pH gradient electrophoresis (NEPHGE)-based method showed excellent reproducibility in the basic gel zone [19]. This limitation of IPG strips for basic proteins is a significant consideration for researchers studying histones or other basic proteoforms.
In contrast, SDS-PAGE provides consistent performance across the pI spectrum for proteins of different sizes. Since separation is based on molecular weight and not charge, the pI of a protein does not inherently affect its migration in SDS-PAGE. This makes it a more reliable tool for initial analysis of samples rich in basic proteins, though it cannot distinguish between different basic proteins of similar molecular weight.
Scenario 2: Analysis of Membrane Proteins
Membrane proteins, characterized by hydrophobic domains, are notoriously difficult to solubilize and separate. The solubilization buffers critical for IEF-IPG are a key differentiator. Effective IEF-IPG of membrane proteins requires solubilization in strong chaotropes (e.g., 7 M urea, 2 M thiourea) and zwitterionic detergents like CHAPS to maintain solubility during the focusing step [13] [16] [41]. Even with optimized protocols, hydrophobic proteins may precipitate at their pI, leading to poor resolution and horizontal streaking on 2D gels.
SDS-PAGE has a distinct advantage for membrane proteins due to the superior solubilizing power of SDS. SDS effectively binds to and solubilizes hydrophobic regions, allowing membrane proteins to be separated based on size [1]. However, for 2D-PAGE, the SDS must be replaced with a non-ionic or zwitterionic detergent before IEF, which can lead to re-precipitation of hydrophobic proteins. This fundamental incompatibility is a primary reason why membrane proteins are under-represented in standard 2D-PAGE analyses.
Scenario 3: Detection of Proteoforms
Proteoforms, the different molecular forms of a protein derived from a single gene, often arise from post-translational modifications (PTMs) that alter charge and/or mass. IEF-IPG excels at resolving charge-based proteoforms [16] [41]. Modifications such as phosphorylation, deamidation, and acetylation alter the pI of a protein, creating distinct spots on a 2D gel. A study analyzing bovine serum albumin (BSA) demonstrated the power of 2DE (IEF-IPG + SDS-PAGE) to resolve numerous proteoforms across a range of pIs and molecular weights, revealing complexity even in "purified" protein samples [41].
SDS-PAGE is more effective for detecting size-altering proteoforms. Proteolytic processing, alternative splicing, or ubiquitination that significantly change molecular weight are readily detected by SDS-PAGE as band shifts [1]. However, it is largely blind to PTMs that only alter charge. The combination of both techniques in 2D-PAGE provides the most comprehensive platform for proteoform analysis, as it separates based on two independent physicochemical parameters [41].
Table 2: Performance Summary in Key Application Scenarios
| Application Scenario | SDS-PAGE Performance | IEF-IPG Performance | Supporting Experimental Evidence |
|---|---|---|---|
| Basic Proteins (pI > 7) | Consistent separation, independent of pI. | Poor reproducibility and protein loss for pI > 7. | ~50% of basic spots unreproducible by IPG [19]. |
| Membrane Proteins | Excellent due to SDS solubilization. | Challenging; requires specific solubilization cocktails. | Under-representation in 2DE gels; require urea/thiourea/CHAPS [13] [16]. |
| Proteoform Detection | Detects mass-altering proteoforms (e.g., cleavage). | Superior for charge-altering proteoforms (e.g., phosphorylation). | 2DE resolved numerous BSA proteoforms undetected by other methods [41]. |
| Overall Proteome Coverage | Lower number of identifications as a standalone method. | Higher peptides per protein; complementary identifications. | IEF-IPG yielded highest avg. peptides/protein in a comparison [13]. |
Integrated Workflows and Complementary Data
The most powerful proteomic strategies often combine multiple separation techniques. A three-dimensional workflow (PAGE-pIEF-LC-MS/MS) that sequentially uses 1D PAGE, in-gel trypsin digestion, peptide IEF, and finally LC-MS/MS, demonstrated a significant increase in proteome coverage compared to either separation technique alone [42]. This highlights the orthogonal and complementary nature of separations by molecular weight and isoelectric point.
Furthermore, a systematic evaluation demonstrated that while 1D SDS-PAGE and IEF-IPG individually yielded the highest number of protein identifications, all gel-based techniques provided complementary protein identification results [13]. This suggests that employing multiple fractionation strategies can expand the dynamic range and depth of proteomic analysis for complex samples.
Essential Research Reagent Solutions
The effectiveness of both SDS-PAGE and IEF-IPG is dependent on the use of specific, high-quality reagents.
Table 3: Key Research Reagents and Their Functions
| Reagent / Tool | Function | Application in SDS-PAGE | Application in IEF-IPG |
|---|---|---|---|
| SDS (Sodium Dodecyl Sulfate) | Denatures proteins and confers uniform negative charge. | Critical for separation principle. | Incompatible; must be absent during IEF. |
| IPG Strips | Provide a stable, immobilized pH gradient for the first dimension. | Not used. | Essential component. Available in various pH ranges and lengths. |
| Chaotropic Agents (Urea, Thiourea) | Disrupt hydrogen bonds to denature proteins and maintain solubility. | Optional, for sample solubilization. | Essential (e.g., 7 M Urea, 2 M Thiourea). |
| CHAPS | Zwitterionic detergent for solubilizing proteins without interfering with charge. | Less critical due to SDS. | Essential for protein solubility during IEF. |
| Reducing Agents (DTT, TBP) | Breaks disulfide bonds for complete denaturation. | Critical (often used with heat). | Critical (e.g., 100 mM DTT, 5 mM TBP) [41]. |
| Carrier Ampholytes | Soluble ampholytes that help form and stabilize the pH gradient. | Not used. | Added to sample and rehydration solution for improved IEF [16]. |
SDS-PAGE and IEF-IPG are not simply competing techniques but are powerfully complementary. SDS-PAGE offers robustness, simplicity, and superior performance for membrane proteins and molecular weight analysis. IEF-IPG provides unparalleled resolution for charge-based proteoforms and is the foundation of high-resolution 2D electrophoresis. Its limitations with basic proteins and very hydrophobic proteins must be factored into experimental design. For the most comprehensive proteomic analysis, particularly in the critical pursuit of proteoform-level understanding required for biomarker discovery and biologic drug development, integrating these orthogonal methods provides a depth of coverage unattainable by either method alone [13] [41]. The choice between them, or the decision to use them in concert, should be guided by the specific protein properties of interest and the overarching goals of the research.
Integration with Downstream Mass Spectrometry Analysis
In mass spectrometry (MS)-based proteomic profiling, the high complexity of biological samples makes fractionation an indispensable step to improve analytical sensitivity and depth [13]. Among the most common gel-based fractionation techniques are sodium dodecyl sulfate-polyacrylamide gel electrophoresis (SDS-PAGE) and isoelectric focusing using immobilized pH gradients (IEF-IPG) [13]. These techniques reduce sample complexity by separating proteins based on distinct physicochemical properties prior to LC-MS/MS analysis, thereby increasing proteome coverage and improving the detection of low-abundance proteins [13] [43]. This guide provides an objective comparison of SDS-PAGE and IEF-IPG, focusing on their performance, integration with downstream mass spectrometry, and practical application in proteomic workflows.
Fundamental Principles of Separation
SDS-PAGE and IEF-IPG separate proteins based on different physicochemical properties, which directly influences their application and effectiveness in proteomic workflows.
SDS-PAGE (Separation by Molecular Weight): This denaturing technique separates proteins primarily by their molecular weight. The ionic detergent SDS binds to proteins, conferring a uniform negative charge density. When an electric field is applied, SDS-bound proteins migrate through the polyacrylamide gel matrix toward the anode, with smaller proteins migrating faster than larger ones due to the sieving effect of the gel [1]. The resulting separation allows for mass estimation using standard protein ladders.
IEF-IPG (Separation by Isoelectric Point): This technique separates proteins based on their intrinsic isoelectric point (pI), the pH at which a protein carries no net charge. Proteins are focused within a stable, immobilized pH gradient until they reach the position where the ambient pH equals their pI [13] [19]. This method provides high resolution, capable of separating proteins differing by as little as 0.01 pH units [2].
Two-Dimensional Electrophoresis (2DE) The orthogonal separation principles of IEF and SDS-PAGE are combined in two-dimensional gel electrophoresis (2DE), where IEF (first dimension) separates proteins by pI, followed by SDS-PAGE (second dimension) which separates them by molecular weight [19] [1]. This combination provides one of the highest resolution methods for separating complex protein mixtures, allowing visualization of thousands of individual protein spots, including different proteoforms, on a single gel [21].
Experimental Comparison and Performance Data
Direct comparative studies reveal distinct performance characteristics for SDS-PAGE (GeLC-MS/MS) and IEF-IPG when used as fractionation techniques prior to LC-MS/MS analysis.
The table below summarizes key findings from a controlled study comparing common gel-based protein separation techniques for the analysis of a mixture of protein standards and mitochondrial extracts from rat liver.
Table 1: Comparative performance of gel-based fractionation techniques in proteomic profiling
| Technique | Key Performance Characteristics | Number of Protein Identifications | Advantages | Limitations |
|---|---|---|---|---|
| 1-D SDS-PAGE | Separates proteins by molecular weight. | High | Inexpensive, simple, effective complexity reduction, assesses sample quality [13]. | Poor recovery for extreme MW/pI proteins, significant manual steps, gel-to-gel variability [13]. |
| IEF-IPG | Separates proteins by isoelectric point (pI). | High (comparable to SDS-PAGE) | Highest average number of peptides detected per protein, beneficial for protein characterization [13]. | Protein loss during procedure, especially for basic proteins (pI>7) [19]. Challenging for extreme pI proteins [13]. |
| 2-D PAGE | Combines IEF-IPG and SDS-PAGE. | Provides complementary identifications | Highest resolution for intact proteins and proteoforms, detects PTMs [21]. | Lower throughput, high manual workload, 20x more time per analysis than shotgun methods [21]. |
A separate, targeted 3D workflow study combining 1D PAGE of proteins with subsequent peptide IEF (pIEF) demonstrated that applying peptide IEF after gel fractionation significantly increased the number of identified proteins compared to GeLC-MS/MS alone. This combined PAGE-pIEF-LC-MS/MS method provided deeper proteome coverage and improved the identification of low-abundance proteins [42].
Detailed Experimental Protocols
To ensure reproducibility and facilitate method adoption, detailed protocols for the key comparative experiments are provided below.
GeLC-MS/MS Workflow (SDS-PAGE Fractionation)
This protocol is adapted from the comparison study of gel-based techniques [13] and a plasma proteome fractionation study [43].
Table 2: Key reagents for GeLC-MS/MS protocol
| Research Reagent Solution | Function in the Protocol |
|---|---|
| SDS Sample Buffer (e.g., with Tris-HCl, glycerol, SDS, Bromophenol Blue) | Denatures proteins and provides density for gel loading. |
| Dithiothreitol (DTT) or Tris(2-carboxyethyl)phosphine (TBP) | Reduces disulfide bonds in proteins. |
| Acrylamide | Alkylates cysteine residues to prevent reformation of disulfide bonds. |
| Polyacrylamide Gel (e.g., 4-12% or 8-16% gradient Criterion gel) | Sieving matrix for protein separation by molecular weight. |
| Coomassie Staining Solution | Visualizes protein bands in the gel after electrophoresis. |
| Trypsin (Sequencing Grade) | Proteolytic enzyme that digests proteins into peptides for MS analysis. |
| Trifluoroacetic Acid (TFA)/Acetonitrile (ACN) | Extraction and desalting of peptides from gel slices. |
- Sample Preparation: Dilute the protein sample (e.g., 8-131 µg total protein) in a sample buffer such as 63 mM Tris HCl, 10% glycerol, 2% SDS, and 0.0025% bromophenol blue, pH 6.8. Supplement the buffer with a reducing agent (e.g., 50 mM DTT or 5 mM TBP) and incubate to reduce disulfide bonds. Alkylate the reduced cysteine residues with an agent like 10 mM acrylamide [13].
- Gel Electrophoresis: Load the prepared sample onto a suitable polyacrylamide gel (e.g., a Criterion 8-16% Tris-HCl gel). Run the electrophoresis at constant voltage until the dye front has migrated an appropriate distance (e.g., 1.0, 2.0, or 4.0 cm) [43].
- Gel Staining and Fractionation: Stain the gel with a compatible stain like Colloidal Blue to visualize protein bands. Using a clean blade, excise the entire lane and slice it into uniform fractions (e.g., 10, 20, or 40 slices of 1-mm thickness) [43]. Corresponding slices from replicate lanes can be pooled to increase protein amount.
- In-Gel Digestion: Destain the gel slices. Add a solution of trypsin (e.g., 0.02 µg/µL) to each gel piece and incubate overnight at 37°C to digest proteins into peptides [43].
- Peptide Extraction and Cleanup: Extract peptides from the gel matrix using a series of washes with solutions such as 1% formic acid, 50% acetonitrile with 1% formic acid, and finally 99% acetonitrile with 1% formic acid [42]. Pool the extracts, dry down, and desalt the peptides using StageTips or C18 spin columns before LC-MS/MS analysis [42].
IEF-IPG Fractionation Workflow
This protocol for in-gel IEF of intact proteins is derived from methodologies used in comparative studies [13] [19].
- Sample Preparation: Solubilize and lysate the protein sample (e.g., 144 µg of mitochondrial extract) in an IEF-compatible buffer, typically containing 7 M urea, 2 M thiourea, and 4% CHAPS [13]. Reduce and alkylate proteins as described in the GeLC-MS/MS protocol. It is critical to adjust the sample conductivity to ≤ 300 µS/cm using centrifugal ultrafiltration with IEF buffer to ensure effective focusing [13].
- IEF Gel Rehydration and Sample Loading: Apply the prepared sample to ceramic strip holders. For in-gel IEF, rehydrate commercial IPG strips (e.g., 7 cm or 18 cm, pH 3-10) directly in the sample solution overnight [13] [42].
- Isoelectric Focusing: Perform IEF using a dedicated IEF apparatus (e.g., IPGphor). A typical protocol involves a stepwise voltage increase: starting with 500 V for 500 Vh, a gradient from 500 V to 3000 V for 1750 Vh, and finally focusing at 8000 V for a total of 27,750 Vh (for an 18 cm strip) at 20°C. The total Vh should be optimized for the strip length [42].
- Post-IEF Processing: After focusing, the IPG strip can be equilibrated in a buffer containing SDS and urea to prepare proteins for the second dimension (if performing 2DE) [19]. For direct analysis, the strip can be fractionated. Manually cut the gel strip into pieces (e.g., 36 pieces of 0.5 cm each for an 18 cm strip) [42].
- Protein/Peptide Extraction: Extract proteins or peptides from the IPG gel pieces by sequential incubation with extraction solutions (e.g., 1% formic acid; 50% ACN, 1% FA; and 99% ACN, 1% FA) [42]. Desalt the extracted peptides prior to LC-MS/MS analysis.
Diagram 1: Comparative workflows for SDS-PAGE/GeLC-MS/MS and IEF-IPG fractionation.
Technical Considerations for MS Integration
The choice between SDS-PAGE and IEF-IPG has significant implications for downstream mass spectrometry analysis and the overall proteomic study design.
Orthogonality and Proteome Coverage: SDS-PAGE and IEF-IPG are highly orthogonal techniques. Combining them, either in a 2DE workflow or in a sequential 3D approach (e.g., PAGE-pIEF-LC-MS/MS), significantly increases proteome coverage and the number of protein identifications compared to either method alone because they separate based on independent properties [13] [42].
Detection of Proteoforms and PTMs: 2DE (IEF-IPG combined with SDS-PAGE) is a top-down technique that provides direct, qualitative, and quantitative information on intact proteins and their proteoforms. It is particularly valuable for detecting and characterizing proteoforms with unexpected post-translational modifications, such as proteolytic cleavage and phosphorylation, which are often lost in bottom-up shotgun proteomics [21].
Quantitative Reproducibility: 2D-DIGE, a variant of 2DE, demonstrates superior quantitative precision with approximately three times lower technical variation compared to label-free shotgun proteomics, making it highly robust for quantitative studies [21].
Throughput and Automation: A major limitation of gel-based methods, particularly 2DE, is throughput. The 2D-DIGE technology requires almost 20 times as much hands-on time per protein/proteoform characterization compared to shotgun methods [21]. While IEF-IPG protocols are generally simple and reproducible, SDS-PAGE is susceptible to gel-to-gel variability, and the in-gel digestion step in both methods is prone to sample loss, which can affect quantitative accuracy [13].
Both SDS-PAGE (GeLC-MS/MS) and IEF-IPG are powerful fractionation techniques that significantly enhance the depth of proteomic analysis by mass spectrometry. The choice between them is not a matter of which is universally superior, but which is more appropriate for the specific research goals.
- SDS-PAGE (GeLC-MS/MS) offers a robust, inexpensive, and straightforward approach for effective complexity reduction based on molecular weight. It is an excellent choice for routine fractionation and when analyzing samples where molecular weight information is critical.
- IEF-IPG provides high-resolution separation based on isoelectric point, can yield more peptides per protein for better coverage, and is the foundational first step for 2DE. It is the preferred method when the goal is deep characterization of protein charges states, isoelectric points, and particularly when combined with SDS-PAGE in 2DE for the unparalleled resolution of intact proteoforms.
For the most comprehensive proteomic profiling, the orthogonal combination of these techniques often yields the deepest coverage. Researchers should select their fractionation strategy by weighing the need for proteoform resolution and quantitative precision (favoring IEF-IPG, especially in 2DE) against the requirements for throughput and simplicity (favoring SDS-PAGE or gel-free peptide-level fractionation).
Solving Technical Challenges: Optimization Strategies for Enhanced Performance
In proteomic profiling research, the selection of an appropriate separation technique fundamentally shapes experimental outcomes. While SDS-PAGE separates proteins exclusively by molecular weight, Isoelectric Focusing with Immobilized pH Gradients (IEF-IPG) provides orthogonal separation based on protein isoelectric point (pI), offering unique advantages and challenges [18]. This technique is particularly critical for analyzing protein isoforms and post-translational modifications that may not alter molecular weight but produce distinct pI values [44]. However, researchers frequently encounter three persistent issues that compromise data quality: protein streaking, poor focusing, and in-gel precipitation [45]. This guide objectively compares IEF-IPG performance against alternative methods and provides experimentally-validated solutions to these common problems, enabling researchers to optimize their proteomic profiling workflows.
Technical Comparison: IEF-IPG Versus SDS-PAGE and Alternatives
The fundamental distinction between IEF-IPG and SDS-PAGE lies in their separation principles. SDS-PAGE employs sodium dodecyl sulfate to denature proteins and impart a uniform negative charge, enabling separation by molecular size as proteins migrate through a polyacrylamide gel matrix [46]. In contrast, IEF-IPG separates native proteins based on their intrinsic charge characteristics, focusing them at their respective pI values within a stable, covalently-immobilized pH gradient [18] [44]. This makes IEF-IPG exceptionally valuable for detecting charge variants resulting from post-translational modifications like deamidation, phosphorylation, or glycosylation [44].
Table 1: Performance Comparison of Protein Separation Techniques
| Parameter | IEF-IPG | Traditional SDS-PAGE | Capillary Agarose Gel Electrophoresis |
|---|---|---|---|
| Separation Principle | Isoelectric point (pI) | Molecular weight | Molecular weight |
| Resolution Capability | High (can distinguish pI differences of 0.01 pH units) [45] | Moderate | High for large proteins [47] |
| Sample Loading Capacity | 200-500 μg (standard 2D gels) [6] | Typically <100 μg | Compatible with µg/mL to mg/mL concentration range [6] |
| Typical Run Time | 2.5-3 hours (including stepwise voltage increase) [44] | 1-2 hours | ~5 minutes [47] |
| Key Limitations | Cathodic drift (pH gradient instability at basic end) [44], sample precipitation at pI [45] | Poor resolution of similar-sized proteins, charge effects may persist | Newer technology with less established protocols [47] |
| Best Applications | Detection of isoforms, PTMs, charge variants; first dimension in 2D-PAGE [44] | Molecular weight determination, purity assessment, western blotting | Rapid analysis of therapeutic proteins, highly glycosylated proteins [47] |
Recent technological innovations have introduced alternatives addressing limitations of both traditional methods. Microfluidic free-flow IEF (FF-IEF) systems enable continuous separation with higher protein loading capacity (samples from µg/mL to mg/mL) and reduce separation time to approximately 12 minutes while retaining high molecular weight proteins that may be lost in gel-based systems [6]. Similarly, SDS-capillary agarose gel electrophoresis (SDS-CAGE) has emerged as a solution providing "baseline hump-free" analysis of therapeutic proteins across a wide molecular weight range, achieving separations in approximately 5 minutes with excellent reproducibility (RSD <0.3% for migration time) [47].
Addressing Common IEF-IPG Issues: Experimental Protocols and Solutions
Problem 1: Protein Streaking
Root Causes and Identification Protein streaking manifests as horizontal smearing across the IPG strip and typically results from incomplete focusing or protein-protein interactions [45]. The primary causes include insufficient focusing time, inappropriate voltage gradients, high salt concentrations in samples (>10 mM), or the presence of interfering substances such as lipids or nucleic acids [48]. Streaking can often be identified by comparing results to well-focused standards that appear as tight, distinct bands [48].
Experimental Solutions and Protocols
- Optimized Focusing Protocol: Implement a stepwise voltage increase rather than constant voltage. An effective protocol applies: 100 V for 1 hour, 200 V for 1 hour, and 500 V for 30 minutes [44]. This gradual increase allows proper pH gradient formation before final focusing.
- Sample Desalting: For samples with high salt content, employ desalting methods such as ultrafiltration, dialysis, or gel filtration to reduce salt concentration below 10 mM [48].
- Additive Optimization: Incorporate solubilizing agents including 8 M urea, 2 M thiourea, and 2-4% CHAPS in the rehydration buffer [48]. For problematic membrane proteins, use proprietary solubilizer cocktails containing specific detergent blends [44].
- Extended Rehydration: Ensure complete strip rehydration by extending the rehydration time to overnight using 155 μL of rehydration buffer rather than the standard 1 hour with 140 μL [48].
Problem 2: Poor Focusing
Root Causes and Identification Poor focusing results in diffuse, smeary bands rather than sharp, well-defined protein spots. This anomaly frequently stems from improper sample preparation, insufficient focusing time, or incorrect IPG strip selection for the target protein pI range [45] [48]. Cathodic drift, a phenomenon where the pH gradient becomes unstable at the basic end (above pH 8.5) due to acrylamide hydrolysis, represents another common cause of poor focusing in basic proteins [44].
Experimental Solutions and Protocols
- Voltage Optimization: Ensure adequate focusing time at appropriate voltages. Research indicates that a high finishing voltage (up to 500V) applied for 30 minutes is crucial for "fine focusing" or sharpening protein bands [44].
- Sample Preparation Refinement: Add reducing agents (DTT or beta-mercaptoethanol) to disrupt disulfide bonds, and include carrier ampholytes in the sample to improve solubility and focusing [44] [48].
- IPG Strip Selection: Choose narrow-range IPG strips (e.g., pH 4-7 instead of pH 3-10) for improved resolution of specific protein populations. The immobilized pH gradient technology provides superior stability compared to carrier ampholyte-based systems [18].
- Equipment Calibration: Verify proper electrode contact and disable the "Load Check" feature on power supplies that may automatically shut off when current drops below 1 mA during normal IEF operation [48].
Problem 3: In-Gel Precipitation
Root Causes and Identification In-gel precipitation occurs when proteins reach their isoelectric point and lose solubility, forming visible aggregates or smears within the gel matrix [45]. This issue particularly affects hydrophobic proteins, membrane proteins, and proteins with extreme pI values [18]. Precipitation can be identified by unexpected protein smearing, loss of expected protein spots, or high background staining.
Experimental Solutions and Protocols
- Enhanced Solubilization Cocktails: Utilize specialized solubilizer formulations containing multiple detergents. Different proprietary solubilizer blends are available for optimizing specific sample types [44].
- Additive Incorporation: Include non-ionic detergents (such as Triton X-100, NP-40, or Tween-20 at 0.1-0.5%) in sample buffers to maintain protein solubility without interfering with focusing [44] [48].
- Chaotrope Application: Implement high concentrations of chaotropes (8 M urea, 2 M thiourea) in both sample and rehydration buffers to disrupt hydrophobic interactions and maintain protein solubility [48].
- Prevention of Oxidation: Add DTT to rehydration buffers and perform alkylation steps to prevent protein oxidation and disulfide bond formation that contribute to precipitation [48].
Table 2: Troubleshooting Guide for Common IEF-IPG Anomalies
| Problem | Primary Causes | Solution Protocols | Expected Outcome |
|---|---|---|---|
| Streaking | High salt concentration (>10 mM) [48]; Incomplete focusing [45] | Desalt samples; Implement stepwise voltage protocol (100V/1h, 200V/1h, 500V/30min) [44] [48] | Sharp, well-defined bands; Reduced background smearing |
| Poor Focusing | Incorrect IPG strip pH range [48]; Insufficient focusing time [45]; Cathodic drift [44] | Use narrow-range IPG strips; Extend focusing time at high voltage (500V); Add DTT & ampholytes [44] [48] | Distinct, crisp protein spots; Improved resolution |
| In-Gel Precipitation | Protein aggregation at pI [45]; Hydrophobic protein interactions [18] | Add solubilizing agents (urea, thiourea, CHAPS); Incorporate non-ionic detergents [44] [48] | Increased protein recovery; Reduced aggregation artifacts |
The Researcher's Toolkit: Essential Reagents and Materials
Successful IEF-IPG experimentation requires specific reagents optimized for the technique. The following essential materials represent both standard and innovative solutions for overcoming common issues:
Table 3: Essential Research Reagents for IEF-IPG Experiments
| Reagent/Material | Function | Application Notes |
|---|---|---|
| ZOOM Carrier Ampholytes [44] | Establish stable pH gradient | Small, soluble molecules with positive/negative charge groups; help stabilize pH gradient and aid protein solubility |
| ZOOM 2D Protein Solubilizers [44] | Enhance solubilization of complex proteins | Proprietary detergent blends in chaotrope solution (urea, thiourea); particularly useful for hydrophobic/membrane proteins |
| IPG Strips [18] [44] | Provide immobilized pH gradient | Available in various pH ranges (wide: 3-10; narrow: 4-7, 5-8); prevent gradient drift during extended focusing |
| DTT or Beta-Mercaptoethanol [44] [48] | Reduce disulfide bonds | Prevents unwanted protein modifications by alkylating cysteines; enables crisper focusing |
| Non-ionic Detergents (Triton X-100, NP-40, Tween-20) [44] | Maintain protein solubility | Used at 0.1-0.5% concentration; solubilize proteins without interfering with charge-based separation |
| Protease Inhibitor Cocktails [48] | Prevent protein degradation | Added during sample preparation; essential for maintaining protein integrity |
Experimental Workflow for Optimal IEF-IPG Analysis
The following workflow diagram illustrates a comprehensive protocol for addressing common IEF-IPG issues throughout the experimental process:
Effective troubleshooting of IEF-IPG methodology requires systematic addressing of sample preparation, focusing conditions, and detection parameters. The solutions presented—including optimized voltage ramping, strategic additive use, and appropriate IPG strip selection—directly target the root causes of streaking, poor focusing, and precipitation. When selecting a separation technique for proteomic profiling, researchers must consider the critical trade-offs: IEF-IPG offers unparalleled resolution for charge-based separations essential for PTM analysis and biomarker discovery, while emerging alternatives like capillary agarose gel electrophoresis and microfluidic FF-IEF provide complementary benefits in speed, automation, and compatibility with specific protein classes. By implementing these validated protocols and understanding the comparative landscape of separation technologies, researchers can significantly enhance the reliability and reproducibility of their proteomic analyses.
In the context of comparing SDS-PAGE with IEF-IPG for proteomic profiling research, the selection between broad-range and narrow-range immobilized pH gradient (IPG) strips represents a fundamental methodological decision that directly impacts data quality and biological insights. Two-dimensional gel electrophoresis (2DE) remains a powerful tool for separating complex protein mixtures, combining isoelectric focusing (IEF) with SDS-PAGE to resolve thousands of proteins simultaneously [16]. The introduction of IPG technology marked a significant advancement over carrier ampholyte-based systems by providing superior reproducibility, mechanical stability, and reduced cathodic drift [49] [16]. IPG strips are now commercially available in various lengths and pH gradients, from very wide ranges (pH 3-11) to highly narrow intervals (e.g., pH 4-5) [16].
This guide objectively compares the performance characteristics of broad-range versus narrow-range IPG strips, providing experimental data to inform selection criteria based on specific research goals. The optimal choice between these formats involves balancing comprehensive proteome coverage against resolution power for specific protein subgroups, a decision particularly relevant for researchers investigating protein expression patterns, post-translational modifications, and disease biomarkers [50].
IPG Strip Technology Fundamentals
IPG strips contain immobilized pH gradients formed by acidic and alkaline buffering groups copolymerized with the polyacrylamide matrix [16]. This fixed gradient eliminates the cathodal drift problems associated with carrier ampholyte systems and enables highly reproducible separations [49]. Before IEF, IPG strips are rehydrated with a sample solution containing chaotropes (urea, thiourea), detergents (CHAPS, ASB-14), reducing agents (DTT), and carrier ampholytes to maintain protein solubility and prevent aggregation [49] [51].
During IEF, proteins migrate through the pH gradient until they reach their isoelectric point (pI), where they carry no net charge and become focused into sharp bands [16]. The focused IPG strip is then equilibrated with SDS buffer and applied to an SDS-PAGE gel for separation in the second dimension by molecular weight [1] [16]. This orthogonal separation approach provides the high resolution necessary for complex proteomic analyses.
Comparative Separation Characteristics
Table 1: Fundamental Characteristics of Broad-Range vs. Narrow-Range IPG Strips
| Parameter | Broad-Range IPG Strips | Narrow-Range IPG Strips |
|---|---|---|
| Typical pH Range | pH 3-10 or 3-11 | pH 4-7, 5-6, or other intervals <2 pH units |
| Primary Advantage | Comprehensive overview of proteome | Enhanced resolution for specific protein subgroups |
| Optimal Application | Initial screening studies | Targeted analysis of specific protein classes |
| Protein Loading Capacity | Standard | Can be significantly higher due to expanded separation space |
| Resolution Power | Limited across full range | Superior within focused pH interval |
| Detection of Low-Abundance Proteins | Challenging due to spot crowding | Improved through spatial separation |
| Compatibility with Alkaline Proteins | Variable performance, especially above pH 10 | Specialized strips available (e.g., pH 6-11) |
Performance Comparison: Experimental Data
Resolution and Detection Sensitivity
Direct comparisons of IPG-based 2DE methods demonstrate that narrow-range pH gradients significantly improve detection sensitivity and spot resolution compared to broad-range strips. In optimization studies, the use of narrow-range IPG strips with optimized rehydration buffers increased the number of detectable polypeptides by approximately four-fold on small-format 2D gels [51]. This enhancement results from the expanded separation distance available for proteins within the focused pH interval, reducing spot overlap and improving the detection of low-abundance proteins.
The resolution advantage of narrow-range strips is particularly evident in the analysis of complex protein mixtures. While broad-range pH 3-10 strips provide a comprehensive overview, they often fail to adequately resolve proteins with similar pI values due to spatial constraints [16]. In contrast, narrow-interval IPG strips distribute the same number of proteins across a larger gel surface, decreasing spot density and improving quantification accuracy [52] [51].
Reproducibility and Quantitative Analysis
Table 2: Performance Metrics of Broad-Range vs. Narrow-Range IPG Strips Based on Experimental Data
| Performance Metric | Broad-Range (pH 3-10) IPG | Narrow-Range (pH 4-7) IPG |
|---|---|---|
| Spot Reproducibility (Overall) | 75 ± 4% | Not specifically quantified but reported as "method of choice" for acidic proteins |
| Acidic Protein Reproducibility (pI <7) | 82 ± 1% | Excellent [52] |
| Basic Protein Reproducibility (pI >7) | 44 ± 18% | Not applicable |
| Total Proteins Detected (Representative Study) | 102 spots | Approximately 4-fold increase compared to broad-range [51] |
| Protein Loss During 2DE | Higher, especially for basic proteins | Reduced for proteins within the targeted pH range |
| Ability to Detect Differential Expression | Reliable mainly in acidic range | Reliable across the entire narrow range |
The reproducibility of protein separations varies significantly between pH regions in broad-range IPG strips. Studies using Coomassie staining demonstrated that approximately half of detected basic protein spots (pI >7) were not reproducible using broad-range IPG-based 2DE, whereas the method showed good reproducibility for acidic proteins (pI <7) [52]. This limitation has profound implications for quantitative proteomic studies focusing on basic proteins such as ribosomal proteins, histones, and many DNA-binding proteins.
Methodological Protocols and Optimization Strategies
Sample Preparation and Rehydration Buffer Formulation
Proper sample preparation is critical for successful IEF separations regardless of IPG strip selection. The sample rehydration buffer must maintain proteins in solution during IEF while not affecting their pI values [49]. Based on systematic optimization using the Taguchi method, an optimized rehydration buffer formulation has been developed to enhance protein solubility and resolution [51]:
- Chaotropes: 7 M urea and 2 M thiourea
- Detergents: 1.2% CHAPS and 0.4% ASB-14
- Reducing agent: 43 mM DTT
- Carrier ampholytes: 0.25%
- Alkylating agent: 60 mM acrylamide (added after protein solubilization)
This optimized formulation has demonstrated improved performance across various sample types, resulting in increased protein solubility, reduced horizontal streaking, and enhanced spot resolution [51].
Isoelectric Focusing Protocols
The IEF conditions must be adjusted based on the specific IPG strip format and pH range. General protocols for 7 cm IPG strips include an initial step of 30 minutes at 250 V followed by a fast ramping gradient between 250-5500 V, with total focusing time exceeding 33,000 volt-hours [51]. For longer strips (18-24 cm) commonly used in high-resolution separations, extended focusing times with controlled current and voltage ramping are necessary to achieve optimal protein separation without overheating [16].
Carrier ampholyte concentration in the rehydration solution affects the required focusing time, with higher concentrations necessitating extended focusing durations. Monitoring the current during IEF provides a useful indicator of focusing completion, as it should approach zero when proteins have reached their isoelectric points [16] [51].
Application-Based Selection Guidelines
Decision Framework for IPG Strip Selection
The following workflow diagram illustrates the strategic decision process for selecting between broad-range and narrow-range IPG strips based on research objectives and sample characteristics:
Field-Specific Applications
Table 3: Application-Specific Recommendations for IPG Strip Selection
| Research Application | Recommended IPG Format | Rationale | Technical Considerations |
|---|---|---|---|
| Initial Proteome Mapping | Broad-range (pH 3-10) | Provides comprehensive overview of protein constituency | May miss low-abundance proteins; follow with narrow-range analysis |
| Post-Translational Modification Detection | Narrow-range (appropriate to protein pI) | Enhanced resolution of charge variants | Particularly effective for phosphorylation, acetylation, deamidation |
| Biomarker Discovery | Combination of multiple narrow-range strips | Maximizes resolution across proteome | Requires more sample and analysis time but improves sensitivity |
| Membrane Protein Analysis | Narrow-range with optimized solubilization | Focuses on specific protein subgroups | Enhanced by specialized detergents in rehydration buffer |
| Quantitative Differential Analysis | Narrow-range in target pI region | Improved reproducibility and quantification | Especially important for basic proteins (pI >7) |
Research Reagent Solutions
Table 4: Essential Reagents for IPG-Based 2DE Experiments
| Reagent Category | Specific Components | Function | Optimization Notes |
|---|---|---|---|
| Chaotropic Agents | Urea, Thiourea | Denature proteins and increase solubility | 7 M urea + 2 M thiourea recommended over 8 M urea alone [51] |
| Detergents | CHAPS, ASB-14, NP-40 | Solubilize proteins and prevent aggregation | Combination of 1.2% CHAPS + 0.4% ASB-14 optimal; avoid ionic detergents [49] [51] |
| Reducing Agents | DTT, TBP, TCEP | Cleave disulfide bonds | 43 mM DTT superior to TBP or TCEP for IEF [51] |
| Carrier Ampholytes | Various commercial blends | Enhance protein solubility and maintain pH gradient | Lower concentrations (0.25%) provide optimal performance [51] |
| Alkylating Agents | Iodoacetamide, Acrylamide | Prevent reformation of disulfide bonds | Acrylamide (60 mM) more effective than IAA in urea/thiourea buffers [51] |
| IPG Strips | Various pH ranges and lengths | First dimension separation matrix | Selection depends on research goals; 7-24 cm lengths available [16] |
The selection between broad-range and narrow-range IPG strips represents a critical methodological consideration in proteomic research using 2DE separation. Evidence from direct comparison studies indicates that narrow-range IPG strips provide superior resolution, detection sensitivity, and reproducibility for proteins within their targeted pH interval [52] [51]. This makes them particularly valuable for quantitative differential expression analyses and detection of post-translational modifications.
Broad-range IPG strips remain useful for initial proteomic surveys and applications where a comprehensive overview of the proteome is required. However, their limitations in resolving basic proteins and detecting low-abundance species must be acknowledged [52]. For the most demanding applications, a combined approach using multiple overlapping narrow-range IPG strips may provide the optimal balance of comprehensive coverage and high resolution.
Within the broader context of comparing SDS-PAGE with IEF-IPG for proteomic profiling, these findings highlight how strategic selection of IPG strip characteristics directly influences data quality and biological insights. By matching IPG strip selection to specific research objectives and leveraging optimized protocols, researchers can maximize the information recovered from their proteomic studies.
Improving Protein Solubility and Recovery from Gel Matrices
In mass spectrometry-based proteomic profiling, the effectiveness of upstream protein separation techniques is paramount. Fractionation of complex biological samples at the protein level is an indispensable strategy for improving analytical sensitivity and dynamic range [13]. However, the dilemma remains that fractionation can be deleterious for analyzing samples of limited availability due to sample loss at each processing stage [13]. The recovery of proteins and resulting proteolytic digests is highly dependent on the total volume of the gel matrix and the specific separation methodology employed [13]. This comparison guide objectively evaluates two fundamental gel-based separation techniques—Sodium Dodecyl Sulfate-Polyacrylamide Gel Electrophoresis (SDS-PAGE) and Isoelectric Focusing with Immobilized pH Gradients (IEF-IPG)—focusing specifically on their performance in protein solubility management and recovery efficiency. Understanding these parameters is crucial for researchers selecting the optimal technique for specific proteomic applications, particularly when working with precious or limited samples where maximum recovery is essential.
Fundamental Separation Principles and Their Impact on Protein Behavior
The fundamental principles governing SDS-PAGE and IEF-IPG dictate their distinct behaviors in protein solubility and recovery. SDS-PAGE separates proteins primarily by molecular weight using the anionic detergent SDS, which denatures proteins and imparts a uniform negative charge [1]. This denaturing environment generally enhances solubility for most proteins but permanently disrupts native structure and function. In contrast, IEF-IPG separates proteins based on their isoelectric point (pI) in a pH gradient immobilized within a polyacrylamide matrix [16]. Proteins migrate until they reach the pH region corresponding to their pI, where they become neutral and stop migrating [16]. This focusing effect concentrates proteins at their pI, potentially increasing precipitation risk for proteins with low solubility at their isoelectric point.
The following diagram illustrates the fundamental workflow differences between these two techniques and their implications for protein solubility and recovery:
Comparative Experimental Performance Data
Direct Technique Comparison in Proteomic Profiling
A comprehensive comparative study evaluated common gel-based protein separation techniques for nanoLC-ESI-MS/MS analysis of mitochondrial extracts from rat liver. The research demonstrated that while all techniques provided complementary protein identification results, 1-D SDS-PAGE and IEF-IPG yielded the highest number of identifications [13]. Notably, the IEF-IPG technique resulted in the highest average number of detected peptides per protein, which can be beneficial for quantitative and structural characterization of proteins in various large-scale biomedical applications [13].
Table 1: Comparative Performance of Gel-Based Separation Techniques in Proteomic Profiling
| Separation Technique | Protein Identifications | Peptides per Protein | Recovery Efficiency | Key Advantages |
|---|---|---|---|---|
| 1-D SDS-PAGE | Highest | Moderate | Moderate | Broad molecular weight separation, familiar protocol |
| IEF-IPG | Highest | Highest | Higher | Superior peptide detection, high resolution for charge variants |
| Preparative 1-D SDS-PAGE | Lower than 1-D SDS-PAGE | Lower than IEF-IPG | Lower than IEF-IPG | Higher protein loading capacity |
| 2-D PAGE | Lower than other techniques | Lower than IEF-IPG | Lowest | Maximum resolution, visualization of proteoforms |
Impact on Basic Protein Recovery
The recovery of specific protein classes varies significantly between techniques. A comparative study of IPG versus non-equilibrium pH gradient electrophoresis (NEPHGE) techniques revealed that protein loss during 2DE procedure was higher in IPG-based methods, especially for basic (pI > 7) proteins [19]. When evaluating basic protein spots with Coomassie staining, approximately half of detected basic protein spots were not reproducible by IPG-based 2DE, whereas the NEPHGE-based method showed excellent reproducibility in the basic gel zone [19]. This highlights a significant limitation of standard IEF-IPG for basic proteome analysis.
Table 2: Protein Recovery Challenges and Mitigation Strategies
| Challenge | Impact on SDS-PAGE | Impact on IEF-IPG | Mitigation Approaches |
|---|---|---|---|
| Basic Proteins (pI > 7) | Minimal effect - separation by MW not pI | Significant - up to 50% loss of basic proteins [19] | Use NEPHGE instead of IPG for basic proteins; narrow range basic IPG strips |
| Hydrophobic Proteins | Moderate - improved solubility with SDS | High - poor focusing and precipitation | Incorporate compatible detergents (CHAPS); use thiourea in extraction buffers [53] |
| High-MW Proteins | Limited penetration in gel matrix | Limited penetration in IPG strip | Optimize acrylamide concentration; extend run times; use specialized buffers |
| Oxidation Effects | Minimal impact in denatured state | Significant - causes horizontal streaking [54] | Pre-reduction and alkylation prior to IEF [54] |
Optimized Experimental Protocols for Enhanced Recovery
Sample Preparation for Improved Solubility
Effective protein extraction is critical for maximizing recovery in both SDS-PAGE and IEF-IPG. For IEF-IPG applications, an optimized extraction buffer containing 7 M urea, 2 M thiourea, 2% (w/v) CHAPS, 50 mM DTT, 0.2% Bio-Lyte 3/10, 1 mM PMSF, 20 U/ml DNase I, and 0.25 mg/ml RNase A, combined with sonication and vortex, yielded the best 2-DE data [53]. When working with solid tissues, bead mill-based protein extraction using a TissueLyser resulted in higher protein yield in minimal processing time compared to homogenization, sonication, or grinding-assisted methods [54].
For tumor tissue proteomes, reduction and alkylation of protein samples prior to IEF reduced horizontal streaking caused by oxidation and improved resolution at the cathode [54]. This pre-IEF treatment significantly enhances protein solubility and subsequent recovery, particularly for sensitive or easily oxidized proteins.
IEF-IPG Optimization Protocol
The following optimized protocol for IEF-IPG maximizes protein solubility and recovery:
Sample Preparation: Extract proteins using optimized extraction buffer (7 M urea, 2 M thiourea, 2% CHAPS, 50 mM DTT, protease inhibitors) with bead mill homogenization (2 min at 50 Hz) [54].
Pre-reduction and Alkylation: Pre-reduce with DTT and alkylate with iodoacetamide prior to IEF to prevent oxidation-induced artifacts [54].
Rehydration: Apply protein sample to IPG strips via in-gel rehydration for 16 hours at room temperature with rehydration buffer containing 8 M urea, 2% CHAPS, and appropriate IPG buffer.
Isoelectric Focusing: Perform IEF using a stepwise voltage protocol: 200 V for 1 hour, 500 V for 1 hour, 1,000 V for 1 hour, then gradually raise to 10,000 V for optimal focusing (approximately 70,000 Vhr total for 24 cm strips) [54].
Strip Equilibration: Equilibrate focused IPG strips in SDS equilibration buffer (6 M urea, 75 mM Tris-HCl pH 8.8, 30% glycerol, 2% SDS) with DTT for reduction, followed by iodoacetamide for alkylation.
SDS-PAGE Optimization Protocol
For optimal recovery in SDS-PAGE applications:
Sample Preparation: Dilute protein samples in sample buffer (63 mM Tris HCl, 10% glycerol, 2% SDS, 0.0025% bromophenol blue, pH 6.8) supplemented with 50 mM DTT [13].
Gel Electrophoresis: Load onto appropriate percentage Criterion gels (8-16% for broad separation) and run at constant voltage until adequate separation is achieved.
Band Excision: For GeLC-MS/MS applications, immediately excise protein bands of interest with clean scalpel to minimize keratin contamination.
In-gel Digestion: Dice gel pieces into small fragments (∼1 mm³), destain, reduce with DTT, alkylate with iodoacetamide, and digest with trypsin overnight at 37°C.
Peptide Extraction: Extract peptides from gel matrix using 50% acetonitrile/5% formic acid with sonication, followed by concentration in vacuum concentrator.
The Scientist's Toolkit: Essential Research Reagents
Table 3: Essential Reagents for Optimizing Protein Solubility and Recovery
| Reagent Category | Specific Examples | Function | Optimal Concentration |
|---|---|---|---|
| Chaotropes | Urea, Thiourea | Disrupt hydrogen bonds, improve solubility | 7 M Urea, 2 M Thiourea [53] |
| Detergents | CHAPS, SDS, Triton X-114 | Solubilize hydrophobic proteins | 2-4% CHAPS for IEF; 2% SDS for SDS-PAGE [53] |
| Reducing Agents | DTT, DTE, TBP | Break disulfide bonds | 50 mM DTT for IEF; 5 mM TBP for alkylation [13] [53] |
| Alkylating Agents | Iodoacetamide, Acrylamide | Prevent reformation of disulfide bonds | 10 mM acrylamide or 40 mM iodoacetamide [13] |
| Carrier Ampholytes | Bio-Lyte, Pharmalyte | Improve conductivity during IEF | 0.2-0.5% in IEF sample buffer [53] |
| Protease Inhibitors | PMSF, Complete Mini | Prevent protein degradation | 1 mM PMSF or commercial mixtures [53] |
| Nucleases | DNase I, RNase A | Reduce nucleic acid contamination | 20 U/ml DNase I, 0.25 mg/ml RNase A [53] |
Strategic Application Recommendations
The choice between SDS-PAGE and IEF-IPG should be guided by specific research goals and sample characteristics. For comprehensive proteome coverage with limited sample, IEF-IPG provides superior peptide detection and recovery when optimized with appropriate solubilization cocktails [13]. However, for analysis focusing on basic proteins (pI > 7), SDS-PAGE or NEPHGE-based methods are preferable due to significant protein loss of basic proteins in standard IEF-IPG protocols [19].
For researchers requiring intact protein information, including proteoform characterization, 2D-PAGE remains invaluable despite its lower overall recovery [21]. The orthogonal separation provided by combining IEF-IPG and SDS-PAGE in two-dimensional electrophoresis offers the highest resolution for detecting post-translational modifications and protein species [16] [21].
When maximum protein recovery is critical for downstream applications such as biomarker discovery or analysis of limited clinical samples, a combination of orthogonal 1-D SDS-PAGE and IEF-IPG provides improved profiling sensitivity without significant decrease in throughput [13]. This combined approach leverages the complementary strengths of both separation mechanisms while mitigating their individual limitations in protein solubility and recovery.
In proteomic profiling research, the choice of separation technique is critical for obtaining reliable and reproducible results. Two of the most fundamental methods for protein separation are Sodium Dodecyl Sulfate-Polyacrylamide Gel Electrophoresis (SDS-PAGE) and Isoelectric Focusing with Immobilized pH Gradients (IEF-IPG). Each technique offers distinct advantages and limitations when dealing with complex biological samples that often contain interfering substances such as salts, lipids, and nucleic acids. These contaminants can significantly impact separation efficiency, protein recovery, and downstream analysis, making it essential for researchers to understand how different methodologies perform under challenging sample conditions. This guide provides an objective comparison of SDS-PAGE and IEF-IPG, with particular focus on their handling of common sample interferences, supported by experimental data and detailed protocols to inform method selection for proteomic research and drug development applications.
Technical Foundations of Separation Techniques
Principle of SDS-PAGE
SDS-PAGE separates proteins primarily based on their molecular weight under denaturing conditions. The anionic detergent SDS binds to proteins at a relatively constant ratio of approximately 1.4 g SDS per gram of protein, unfolding them into linear chains and imparting a uniform negative charge density. This charge uniformity means proteins migrate through the polyacrylamide gel matrix primarily according to size, with smaller proteins moving faster than larger ones. The discontinuous buffer system, typically utilizing Tris-glycine buffers at pH 8.3-8.8, creates a stacking effect that concentrates protein samples into sharp bands before they enter the resolving gel, enhancing separation resolution. The process relies on the formation of a polyacrylamide mesh with pore sizes determined by the acrylamide concentration, which acts as a molecular sieve [55].
Principle of IEF-IPG
Isoelectric Focusing with Immobilized pH Gradients separates proteins based on their isoelectric point (pI), the specific pH at which a protein carries no net electrical charge. In IEF-IPG, proteins migrate through a stable pH gradient formed by immobilizing buffering groups covalently within the polyacrylamide matrix until they reach the region where the pH matches their pI, at which point they become stationary and focus into sharp bands. This technique provides extremely high resolution, capable of separating proteins differing by as little as 0.01 pH units under optimal conditions. Unlike carrier ampholyte-based IEF, IPG technology offers superior reproducibility and stability against gradient drift, particularly during extended focusing times, making it especially valuable for the first dimension in two-dimensional electrophoresis (2-DE) [25] [18].
Impact of Sample Contaminants on Separation Performance
Salt Interferences
Salt contaminants represent a significant challenge for electrophoretic separations, though the specific impact varies considerably between techniques.
IEF-IPG Sensitivity: IEF-IPG demonstrates high sensitivity to salt interference, particularly ionic salts that can disrupt the formation of stable pH gradients and cause local heating effects. High salt concentrations increase sample conductivity, leading to current-driven water splitting and pH gradient instability. This manifests as distorted protein bands, extended focusing times, and in severe cases, complete failure of the separation. Sample preparation for IEF-IPG typically requires extensive desalting steps, such as dialysis, centrifugal ultrafiltration with 10 kDa molecular weight cut-off filters, or protein precipitation followed by resuspension in appropriate IEF-compatible buffers containing urea and thiourea [13].
SDS-PAGE Tolerance: SDS-PAGE exhibits considerably greater tolerance to salt contaminants due to its different separation mechanism. The presence of SDS and the discontinuous buffer system helps mitigate the effects of moderate salt concentrations. However, high salt can still affect protein stacking at the gel interface, leading to band broadening and reduced resolution. The Laemmli buffer system used in SDS-PAGE is generally robust to salt concentrations that would completely disrupt IEF-IPG separations, though extreme concentrations may necessitate sample dilution or buffer exchange [13] [55].
Lipid Contaminants
Lipid-rich samples present unique challenges for both separation techniques, though the nature of these challenges differs.
SDS-PAGE Performance: SDS-PAGE handles lipid-rich samples relatively well due to the powerful solubilizing properties of SDS, which effectively disrupts lipid-protein interactions and maintains proteins in a denatured, soluble state. The presence of SDS prevents lipid-induced protein aggregation that might otherwise impede electrophoretic migration. However, excessive lipid content can still cause smearing or distorted bands, particularly in the high molecular weight region of the gel [39].
IEF-IPG Limitations: IEF-IPG demonstrates significantly greater susceptibility to lipid interference. Lipids can interact with hydrophobic protein regions, preventing proper unfolding and charge modification necessary for effective isoelectric focusing. This often results in horizontal streaking, poor resolution, and protein precipitation at the pI. Effective lipid removal requires additional sample preparation steps, such as organic solvent extraction (e.g., acetone or methanol-chloroform), detergent-based solubilization with CHAPS or Triton X-100, or use of commercial lipid removal kits prior to IEF [39].
Nucleic Acid Contamination
Nucleic acids represent a particularly challenging contaminant in protein samples due to their polyanionic nature and ability to form complexes with proteins.
IEF-IPG Vulnerability: Nucleic acid contamination severely compromises IEF-IPG separations through multiple mechanisms. The strong negative charge of nucleic acids creates high background conductivity that disrupts pH gradient formation. Additionally, nucleic acids can form complexes with basic proteins, altering their effective charge and isoelectric points, resulting in smearing and spurious bands. The high viscosity of nucleic acid-containing samples further impedes protein migration during focusing [56].
SDS-PAGE Resilience: SDS-PAGE demonstrates better performance with nucleic acid-contaminated samples, as the SDS-dominated denaturing conditions disrupt most protein-nucleic acid interactions. However, nucleic acids can still cause issues including masking of low molecular weight proteins, increased background staining, and altered migration patterns. Effective solutions include enzymatic digestion with nucleases (DNase and RNase), precipitation methods, or ion-exchange chromatography prior to electrophoresis [56].
Table 1: Comparative Impact of Sample Contaminants on Separation Techniques
| Contaminant Type | SDS-PAGE Impact | IEF-IPG Impact | Effective Mitigation Strategies |
|---|---|---|---|
| Salt Interferences | Moderate tolerance; may affect stacking | High sensitivity; disrupts pH gradient | Ultrafiltration, dialysis, dilution |
| Lipid Contaminants | Good tolerance with SDS solubilization | Significant interference; causes streaking | Organic solvent extraction, detergent addition |
| Nucleic Acids | Moderate impact; may mask protein bands | Severe disruption; alters protein pI | Nuclease treatment, precipitation, chromatography |
| Overall Robustness | High - tolerates various contaminants | Low - requires extensive sample cleanup | Sample-specific optimization needed |
Experimental Comparison and Performance Data
Methodology for Comparative Studies
A systematic comparison of SDS-PAGE and IEF-IPG for proteomic profiling was conducted using both standardized protein mixtures and complex biological samples. Protein standards were prepared as mixtures covering approximately two orders of magnitude in concentration, with sample conductivity adjusted to ≤300 µS/cm through centrifugal ultrafiltration using 10 kDa molecular weight cut-off filters for IEF-IPG compatibility. Mitochondrial extracts isolated from rat liver were used as complex biological samples, with protein concentration determined at 7.2 mg/mL. All samples were reduced and alkylated with 5 mM tributylphosphine and 10 mM acrylamide before cleanup and concentration. For contamination challenge experiments, controlled amounts of salts (NaCl), lipids (from purified cellular membranes), and nucleic acids (salmon sperm DNA) were added to samples prior to analysis [13].
Quantitative Performance Metrics
Evaluation of separation performance incorporated multiple parameters including number of protein identifications, peptide-to-protein ratio, dynamic range, and technical reproducibility. When analyzing mitochondrial extracts, 1-D SDS-PAGE and IEF-IPG demonstrated complementary protein identification results, with both techniques yielding the highest number of identifications. The IEF-IPG technique specifically resulted in the highest average number of detected peptides per protein, potentially enhancing confidence in protein identification and characterization of post-translational modifications. Recovery of proteins and resulting proteolytic digests was found to be highly dependent on the total volume of the gel matrix, with significant sample loss occurring during extraction from gel pieces [13].
Table 2: Performance Comparison of SDS-PAGE and IEF-IPG in Proteomic Profiling
| Performance Metric | SDS-PAGE | IEF-IPG | Experimental Context |
|---|---|---|---|
| Protein Identifications | High (~equivalent to IEF-IPG) | High (~equivalent to SDS-PAGE) | Mitochondrial extracts, nanoLC-ESI-MS/MS |
| Peptides per Protein | Moderate | Highest | Mitochondrial extracts, nanoLC-ESI-MS/MS |
| Dynamic Range | ~2 orders of magnitude | ~2 orders of magnitude | Mixed protein standards |
| Reproducibility | High | Moderate to High | Technical replicates |
| Handling of Contaminated Samples | Robust | Sensitive | Salt, lipid, nucleic acid spikes |
| Sample Throughput | High | Moderate | Preparation and processing time |
Experimental Protocols for Contamination Management
Sample Preparation Protocol for IEF-IPG
Effective sample preparation is crucial for successful IEF-IPG separations, particularly with challenging samples:
Protein Extraction: Homogenize samples in IEF-compatible buffer (7M urea, 2M thiourea, 4% CHAPS) to maintain solubility while minimizing interfering substances [13].
Contaminant Removal:
- For salt removal: Perform centrifugal ultrafiltration using 10 kDa MWCO filters at 9,000 RCF with multiple washes of IEF buffer until conductivity measures ≤300 µS/cm [13].
- For lipid removal: Implement phenol-based extraction or TCA/acetone precipitation, optimizing precipitation duration to minimize protein degradation [39].
- For nucleic acid removal: Add nucleases (DNase/RNase) during homogenization or employ specialized nucleic acid removal kits.
Reduction and Alkylation: Treat samples with 5 mM tributylphosphine and 10 mM acrylamide in 25 mM ammonium bicarbonate (pH 8.0) at 37°C for 90 minutes. Quench the reaction with 50 mM DTT [13].
Cleanup and Concentration: Perform final cleanup using 10 kDa MWCO filters, concentrating samples to appropriate protein concentration for IEF-IPG loading [13].
Sample Preparation Protocol for SDS-PAGE
SDS-PAGE sample preparation is generally more straightforward:
Protein Denaturation: Dilute samples in SDS-PAGE sample buffer (63 mM Tris HCl, 10% glycerol, 2% SDS, 0.0025% bromophenol blue, pH 6.8) supplemented with 50 mM DTT [13].
Heat Denaturation: Heat samples at 95°C for 5-10 minutes to ensure complete denaturation and SDS binding.
Limited Cleanup: For heavily contaminated samples, brief dialysis or protein precipitation may be necessary, though often samples can be loaded directly with minimal processing.
Centrifugation: Remove insoluble material by centrifugation at 10,000-15,000 × g for 10 minutes before loading onto the gel.
Technical Workflows and Decision Pathways
The following workflow diagrams illustrate the optimal pathways for managing sample interferences when using either SDS-PAGE or IEF-IPG separation techniques.
SDS-PAGE Interference Management Workflow
IEF-IPG Interference Management Workflow
Research Reagent Solutions Toolkit
Table 3: Essential Reagents for Managing Sample Interferences
| Reagent/Category | Primary Function | Application Notes | Compatibility |
|---|---|---|---|
| SDS (Sodium Dodecyl Sulfate) | Protein denaturation and charge uniformity | Essential for SDS-PAGE; interferes with IEF | SDS-PAGE only |
| CHAPS Detergent | Protein solubilization without charge interference | Preferred for IEF-IPG; maintains protein charge | IEF-IPG primarily |
| Urea/Thiourea | Protein denaturation and solubilization | IEF-compatible denaturants; avoid heating above 37°C | IEF-IPG primarily |
| Tributylphosphine (TBP) | Protein reduction | Alternative to DTT; more stable in urea solutions | Both techniques |
| Acrylamide | Gel matrix formation | Varying concentrations control pore size | Both techniques |
| Carrier Ampholytes | pH Gradient formation (traditional IEF) | Being replaced by IPG technology | Traditional IEF |
| IPG Strips | Immobilized pH gradients | Superior reproducibility and stability | IEF-IPG only |
| Protease Inhibitors | Prevent protein degradation | Essential for complex biological samples | Both techniques |
| Nucleases (DNase/RNase) | Nucleic acid degradation | Critical for nucleic acid-rich samples | Both techniques |
| Ultrafiltration Devices | Desalting and concentration | 10 kDa MWCO recommended for protein retention | Both techniques |
The comparative analysis of SDS-PAGE and IEF-IPG reveals a clear trade-off between separation power and robustness to sample contaminants. IEF-IPG offers superior resolution for proteoform separation and higher peptides-per-protein ratios for mass spectrometry identification, making it invaluable for detailed protein characterization. However, this comes at the cost of significantly greater susceptibility to interference from salts, lipids, and nucleic acids, necessitating extensive sample preparation. SDS-PAGE provides robust performance with contaminated samples while offering excellent molecular weight-based separation, though with lower resolution for complex protein mixtures.
For researchers working with challenging samples, the following recommendations emerge: SDS-PAGE represents the preferable option when sample purity cannot be guaranteed or when high-throughput analysis is prioritized. IEF-IPG becomes the method of choice when maximum resolution is required and sufficient sample is available for comprehensive cleanup. For comprehensive proteomic profiling, the orthogonal combination of both techniques in two-dimensional electrophoresis provides the most powerful approach, leveraging the complementary strengths of each method while mitigating their respective limitations through appropriate sample preparation strategies.
In proteomic profiling, the sample preparation steps of reduction and alkylation are critical for successful protein separation and identification, yet their optimal timing and execution remain subjects of methodological refinement. These processes serve to break disulfide bonds (reduction) and permanently block free cysteine residues (alkylation), thereby preventing protein aggregation and artefact formation during electrophoresis. Within the context of comparing SDS-PAGE and IEF-IPG separation techniques, the implementation of these steps significantly influences protein solubility, resolution, and subsequent mass spectrometry analysis. The standard protocol in traditional two-dimensional gel electrophoresis (2-DE) has involved reduction prior to isoelectric focusing (IEF) followed by a second reduction and alkylation step between the first and second dimensions [57]. However, emerging evidence demonstrates that this approach is suboptimal for achieving maximum protein recovery and separation fidelity, particularly in the critical alkaline pH region [58] [59].
The fundamental challenge arises from the dynamic nature of thiol chemistry during electrophoretic separations. During IEF, traditional reducing agents like dithiothreitol (DTT) become negatively charged and migrate away from the basic end of the IPG strip toward the anode, allowing disulfide bonds to reform through "scrambling" between like and unlike chains [57]. This phenomenon generates a series of artefactual spots in two-dimensional maps, comprising not only dimers but impressive series of oligomers—up to nonamers observed even in simple polypeptides such as human α- and β-globin chains, which possess only one or two thiol groups respectively [59]. For complex biological samples, failure to properly alkylate proteins results in substantial spot loss in the alkaline gel region, likely because these proteins regenerate disulfide bridges at their pI with concomitant formation of macroaggregates that become entrapped within polyacrylamide gel fibers [58].
Comparative Separation Principles: SDS-PAGE versus IEF-IPG
The orthogonal separation principles of SDS-PAGE and IEF-IPG form the foundation of high-resolution proteomic analysis, each with distinct advantages and limitations for specific applications. SDS-PAGE separates proteins primarily by molecular weight through the sieving effect of the polyacrylamide matrix, with SDS conferring a uniform negative charge-to-mass ratio that masks the proteins' intrinsic charge [13]. In contrast, IEF-IPG separates proteins based on their isoelectric point (pI) within a stable, immobilized pH gradient, allowing proteins to migrate until they reach a pH region where their net charge becomes zero [16]. This fundamental difference in separation mechanisms dictates their complementary application in proteomic workflows, with the combination of both techniques in two-dimensional electrophoresis providing the highest resolution for intact protein separation [21].
When evaluated as individual fractionation techniques for proteomic profiling, both 1-D SDS-PAGE and IEF-IPG demonstrate complementary protein identification results, with IEF-IPG yielding the highest average number of detected peptides per protein—a significant advantage for quantitative and structural characterization of proteins in large-scale biomedical applications [13]. The resolving power of gel-based techniques, while potentially insufficient to separate individual proteins of similar molecular weights or pIs in highly complex samples, remains highly effective for isolation of substantially simplified protein mixtures with similar physical properties [13]. For basic proteins (pI > 7), however, NEPHGE-based methods may outperform standard IPG techniques, which exhibit higher protein loss and poorer reproducibility in this critical range [19].
Table 1: Performance Comparison of SDS-PAGE and IEF-IPG Separation Techniques
| Parameter | SDS-PAGE | IEF-IPG | Combined 2-DE |
|---|---|---|---|
| Separation Principle | Molecular weight | Isoelectric point | Orthogonal (pI then MW) |
| Optimal Resolution Range | 10-250 kDa | pI 3-10 (broad) or narrower ranges | Thousands of proteoforms |
| Key Advantages | Simple, robust, molecular weight estimation | High resolution for charge variants, proteoform separation | Highest resolution for intact proteins |
| Limitations | Limited charge variant separation | Challenges with basic proteins, hydrophobic proteins | Technical complexity, low throughput |
| Protein Identification Yield | High number of identifications [13] | Highest peptides per protein [13] | Complementary coverage |
| Reproducibility | High | Moderate to high (dependent on IPG quality) | High with standardized IPG strips [16] |
Methodological Comparison: Reduction and Alkylation Workflows
The timing and implementation of reduction and alkylation procedures significantly impact the performance of both SDS-PAGE and IEF-IPG separations, with distinct protocols optimized for each technique. Traditional workflows for two-dimensional electrophoresis have typically employed an initial reduction step before IEF, followed by reduction and alkylation after IEF but before the second dimension SDS-PAGE [57]. This approach aims to prevent point streaking and other silver-staining artifacts associated with excess DTT in the protein sample [57]. However, this protocol has been demonstrated to be far from optimal, as it fails to prevent disulfide bond reformation during the IEF separation, leading to artefactual spot formation and protein loss [58] [59].
Advanced methodologies now recommend complete reduction and alkylation before any electrophoretic step, including the first dimension IEF [57] [58]. This protocol modification prevents the "scrambling" of disulfide bridges during IEF, which generates numerous spurious spots in the resulting 2D maps, particularly in the alkaline region [59]. For samples prepared for IEF-IPG, alkylation before IEF presents technical challenges because thiourea—a common component of IEF solubilization buffers—interferes with iodoacetamide-based alkylation [51]. Alternative alkylating agents such as acrylamide have been successfully employed at concentrations of 60 mM in rehydration buffer after protein solubilization in the presence of DTT, with repeated acrylamide treatment after IEF during the equilibration procedure [51].
Table 2: Comparative Reduction and Alkylation Protocols
| Protocol Step | Traditional 2-DE Protocol | Optimized Pre-IEF Protocol | Key Improvements |
|---|---|---|---|
| Initial Reduction | Before IEF with DTT or TBP | Before IEF with optimized DTT concentration (34-43 mM) [51] | Prevents disulfide reformation |
| Alkylation Timing | After IEF, before SDS-PAGE | Before any electrophoretic step [57] [58] | Eliminates artefactual spots |
| Alkylating Agent | Iodoacetamide (IAA) | Acrylamide (60 mM) [51] or IAA with thiourea-free buffers | Avoids thiourea interference |
| Second Reduction | DTT in equilibration buffer | Optional: Acrylamide treatment repeated after IEF [51] | Ensures complete alkylation |
| Resulting Artefacts | Spurious spots in alkaline region, horizontal streaking | Minimal artefacts, improved spot resolution | Enhanced protein recovery |
Buffer Composition and Optimization Strategies
Systematic optimization of rehydration buffer components for IEF-IPG separations has demonstrated significant improvements in protein solubility, resolution, and overall proteome coverage. The Taguchi method—a robust optimization approach for multi-component systems—has been successfully applied to determine optimal concentrations of detergents, carrier ampholytes, and reducing agents in rehydration buffers for 2DE using commercially supplied IPG strips [51]. This method enables efficient testing of multiple variables simultaneously, substantially reducing the number of experiments required compared to conventional one-variable-at-a-time approaches.
Critical components of IEF rehydration buffers include chaotropes (urea and thiourea), detergents (CHAPS and ASB-14), reducing agents (DTT, TBP, or TCEP), and carrier ampholytes, each playing distinct roles in protein solubilization and stabilization during IEF. Optimization experiments have demonstrated that the combination of 7 M urea and 2 M thiourea produces superior 2D images compared to 8 M urea alone [51]. When comparing reducing agents, DTT provides superior focusing compared to TBP (tributylphosphine) and TCEP (tris(2-carboxyethyl)phosphine) under identical conditions [51]. For detergents, optimal concentrations were determined to be approximately 1.20% ± 0.18% for CHAPS and 0.4% for ASB-14, with the lowest concentrations of ampholytes (0.25%) yielding the best results [51].
For protein extraction and precipitation prior to IEF-IPG, method optimization significantly impacts final 2DE gel quality. In challenging samples such as liverworts—which contain interfering secondary metabolites—extraction with 50 mM Tris-HCl (pH 7.5) followed by precipitation with 20% TCA-acetone has proven most effective, producing higher protein yields and significantly reducing streaking and smearing in resulting 2D gels [60]. Modified protocols including concentration gradient acetone washing of protein samples, increased incubation time of protein pellets in rehydration buffer, and adjustments to IEF programs and SDS concentration further enhance results [60].
Figure 1: Optimized Protein Separation Workflow with Pre-IEF Reduction and Alkylation
Experimental Data and Performance Metrics
Comparative studies of protein separation techniques provide quantitative metrics for evaluating the performance of SDS-PAGE and IEF-IPG in proteomic profiling applications. In systematic comparisons of gel-based protein separation techniques, 1-D SDS-PAGE and IEF-IPG both yielded high numbers of protein identifications, with all techniques providing complementary results [13]. The IEF-IPG technique demonstrated particular advantage in the average number of detected peptides per protein, enhancing sequence coverage and confidence in protein identification [13]. When evaluating protein loss during 2DE procedures, IPG-based methods showed higher protein loss, especially for basic proteins (pI > 7), while NEPHGE-based techniques exhibited superior performance for basic protein separation [19].
The implementation of optimized reduction and alkylation protocols before IEF has demonstrated dramatic improvements in 2DE map quality. Studies using matrix-assisted laser desorption/ionization-time of flight (MALDI-TOF) mass spectrometry have confirmed that failure to reduce and alkylate proteins prior to any electrophoretic step results in numerous spurious spots in the alkaline pH region due to scrambled disulfide bridges [58] [59]. In the analysis of human plasma proteins, proper alkylation before IEF prevented substantial spot loss in the alkaline gel region, where proteins would otherwise regenerate disulfide bridges and form macroaggregates that become trapped within polyacrylamide gel fibers [58].
Technical variability differs significantly between separation methods, with label-free shotgun proteomics demonstrating approximately three times higher technical variation compared to 2D-DIGE top-down analysis [21]. However, throughput considerations strongly favor gel-free methods, with 2D-DIGE technology requiring almost 20 times more time per protein/proteoform characterization with substantially more manual intervention [21].
Table 3: Quantitative Performance Metrics of Separation Techniques
| Performance Metric | 1-D SDS-PAGE | IEF-IPG | 2-DE (IPG) | 2D-DIGE |
|---|---|---|---|---|
| Protein Identification Count | High [13] | High [13] | Complementary | Limited by spot picking |
| Peptides per Protein | Moderate | Highest [13] | Variable | Confirmed per spot |
| Technical Variability | Moderate | Moderate | Low | Lowest (3x better than shotgun) [21] |
| Basic Protein (pI>7) Recovery | Good | Problematic [19] | Poor with IPG | Better with NEPHGE [19] |
| Throughput | High | Moderate | Low | Very low (20x more time/protein) [21] |
| Proteoform Resolution | Limited | Excellent for charge variants | Excellent | Highest resolution [21] |
Technical Considerations and Research Reagent Solutions
Successful implementation of advanced reduction and alkylation protocols requires careful selection of specialized reagents and consideration of technical factors specific to each separation method. The following research reagent solutions represent critical components for optimized protein separation workflows:
- Chaotropic Agents: 7 M urea and 2 M thiourea combination superior to 8 M urea alone for protein solubilization in IEF [51]
- Reducing Agents: DTT (34-43 mM optimal) provides superior focusing compared to TBP or TCEP [51]
- Zwitterionic Detergents: CHAPS (optimal ~1.2%) and ASB-14 (optimal ~0.4%) for enhanced protein solubility [51]
- Alkylating Agents: Acrylamide (60 mM) as effective alternative to iodoacetamide, especially in thiourea-containing buffers [51]
- Carrier Ampholytes: Low concentrations (0.25%) sufficient for effective IEF with reduced background [51]
- Protein Precipitation: TCA-acetone (20%) most effective for problematic samples with interfering compounds [60]
Technical considerations for method selection include sample complexity, target protein properties (molecular weight, pI, hydrophobicity), and downstream analysis requirements. For comprehensive proteoform analysis, 2D-GE techniques provide unparalleled resolution of intact protein species, detecting charge and size variants that would be obscured in gel-free bottom-up approaches [21]. The orthogonal separation principles of IEF-IPG and SDS-PAGE make their combination particularly powerful for resolving post-translational modifications that alter both charge and molecular weight, such as phosphorylation and proteolytic processing [16] [21].
Figure 2: Optimal IEF Rehydration Buffer Composition
The strategic implementation of reduction and alkylation protocols, coupled with buffer optimization, significantly enhances the performance of both SDS-PAGE and IEF-IPG separation techniques for proteomic profiling. While traditional methods perform reduction and alkylation between the first and second dimensions, advanced protocols demonstrating superior results implement complete reduction and alkylation before any electrophoretic separation, preventing disulfide bond scrambling and artefact formation [57] [58] [59]. The systematic optimization of rehydration buffer components using approaches such as the Taguchi method further refines separation efficiency, with defined optimal concentrations for detergents, reducing agents, and carrier ampholytes [51].
The complementary nature of SDS-PAGE and IEF-IPG separation principles makes their combination in two-dimensional electrophoresis particularly powerful for comprehensive proteome analysis, especially for detecting proteoforms with modifications that alter both molecular weight and charge [21]. While gel-free shotgun proteomics approaches offer higher throughput, gel-based top-down methods provide unparalleled resolution of intact protein species, with 2D-DIGE demonstrating threefold lower technical variability compared to label-free shotgun methods [21]. Method selection should be guided by research objectives, with IEF-IPG excelling in charge-based separations, SDS-PAGE providing robust size-based separation, and their combination in 2DE offering the highest resolution for complex proteoform analysis.
Performance Assessment: Direct Comparison of Resolution, Sensitivity, and Applications
This guide provides an objective comparison of two common gel-based protein separation techniques—1-D SDS-PAGE and Isoelectric Focusing in Immobilized pH Gradients (IEF-IPG)—for proteomic profiling. Based on experimental data, both methods provide complementary protein identification results, with 1-D SDS-PAGE yielding a marginally higher number of protein identifications, while IEF-IPG demonstrates superior performance in generating a higher average number of peptides per protein, which is crucial for confident protein validation and characterization [13] [8]. The selection between these techniques should be guided by the specific research objectives, whether maximizing proteome coverage or obtaining deeper protein sequence data.
Quantitative Performance Comparison
The following table summarizes the key performance metrics for both fractionation techniques based on nanoLC-ESI-MS/MS analysis of mitochondrial extracts from rat liver.
Table 1: Comparative Performance of Gel-Based Fractionation Techniques
| Performance Metric | 1-D SDS-PAGE | IEF-IPG |
|---|---|---|
| Total Protein Identifications | Highest number | Slightly lower than 1-D SDS-PAGE |
| Average Peptides Per Protein | Lower than IEF-IPG | Highest ratio |
| Primary Separation Principle | Molecular weight (MW) | Native isoelectric point (pI) |
| Key Advantage | Maximizing proteome coverage in biomarker discovery | Enhanced confidence for protein validation and characterization |
Experimental Protocols
The comparative data presented herein were derived from a controlled study that evaluated common gel-based separation techniques for proteomic profiling [13]. The detailed methodology is as follows:
Sample Preparation
- Biological Sample: Mitochondrial protein extracts were isolated from rat liver. The total protein concentration was adjusted to 7.2 mg/mL [13].
- Protein Load: Approximately 144 µg of total mitochondrial protein was used per each fractionation technique to ensure a fair comparison [13].
- Sample Pre-treatment: Proteins were reduced and alkylated with 5 mM Tributylphosphine (TBP) and 10 mM acrylamide. The alkylation reaction was quenched with 50 mM DTT. Subsequently, the protein extracts were cleaned and concentrated using 10 kDa molecular weight cut-off (MWCO) filters [13].
Fractionation Techniques
Protocol for 1-D SDS-PAGE
- Sample Preparation: The protein sample was diluted in a sample buffer containing 63 mM Tris HCl, 10% glycerol, 2% SDS, 0.0025% bromophenol blue, and 50 mM DTT [13].
- Gel Electrophoresis: The prepared sample was loaded onto a Criterion 8–16% Tris-HCl gel and separated using a standard SDS-PAGE protocol [13].
- Gel Processing Post-separation, the entire gel lane was excised and systematically sliced into multiple uniform bands [13].
- In-Gel Digestion: Each gel band was subjected to in-gel tryptic digestion to extract peptides for subsequent mass spectrometry analysis [13].
Protocol for IEF-IPG
- Isoelectric Focusing: The protein sample was focused according to its isoelectric point (pI) using immobilized pH gradient (IPG) gel strips [13].
- Gel Processing: After IEF, the entire IPG strip was cut into multiple sequential segments [13].
- In-Gel Digestion: Each segment of the IPG strip was subjected to in-gel tryptic digestion to extract peptides for LC-MS/MS analysis [13].
Mass Spectrometry Analysis
- The complex peptide mixtures resulting from the digested gel bands or IPG strips were analyzed by nanoLC-ESI-MS/MS (nano liquid chromatography electrospray ionization tandem mass spectrometry) [13].
- The resulting MS/MS spectra were used to identify peptides and proteins by matching against a protein sequence database.
Figure 1: Experimental workflow for comparing 1-D SDS-PAGE and IEF-IPG.
Performance Analysis and Discussion
Protein Identification Count
The experimental data indicated that 1-D SDS-PAGE yielded the highest number of protein identifications among the gel-based techniques compared [13] [8]. This suggests that fractionation by molecular weight is exceptionally effective for maximizing proteome coverage from complex biological samples, a critical factor in discovery-phase projects like biomarker identification.
Peptides Per Protein Ratio
The IEF-IPG technique resulted in the highest average number of detected peptides per protein [13] [8]. A higher peptides-per-protein ratio provides several significant advantages in proteomic analysis:
- Increased Confidence in Protein Identification: Multiple unique peptides matching to a single protein provide stronger evidence for its presence, reducing the chance of false-positive identifications.
- Deeper Protein Characterization: Extensive peptide coverage enables more comprehensive analysis of protein features, including post-translational modifications (PTMs), sequence variants, and splice isoforms [61].
- Improved Quantitative Accuracy: More peptides per protein can lead to more precise and robust label-free quantification.
Technical Considerations
- Orthogonality: The study demonstrated that 1-D SDS-PAGE and IEF-IPG provide complementary protein identification results [13]. Combining these orthogonal separation principles (MW and pI) can significantly improve profiling sensitivity and dynamic range without a substantial decrease in throughput [13].
- Recovery Efficiency: The recovery of proteins and subsequent proteolytic digests is highly dependent on the total volume of the gel matrix, a factor that must be optimized for consistent results [13].
The Scientist's Toolkit
Table 2: Essential Research Reagent Solutions for Gel-Based Proteomic Fractionation
| Reagent / Material | Function in the Protocol |
|---|---|
| Criterion Tris-HCl Precast Gels | Provides a standardized, reproducible medium for SDS-PAGE separation by molecular weight. |
| Immobilized pH Gradient (IPG) Strips | Creates a stable pH gradient for separating proteins based on their isoelectric point (pI) during IEF. |
| Tributylphosphine (TBP) | A reducing agent that cleaves disulfide bonds to fully denature proteins for SDS-PAGE. |
| Iodoacetamide / Acrylamide | Alkylating agents that covalently modify cysteine residues to prevent reformation of disulfide bonds. |
| Sequencing-Grade Trypsin | A proteolytic enzyme that digests separated proteins into peptides amenable to MS analysis. |
| 10 kDa MWCO Filters | Devices for buffer exchange, desalting, and concentration of protein samples prior to fractionation. |
The choice between 1-D SDS-PAGE and IEF-IPG is not a matter of one technique being universally superior, but rather dependent on the specific goals of the proteomic study.
- For projects where the primary objective is to maximize the number of protein identifications, such as initial proteome mapping or biomarker discovery, 1-D SDS-PAGE is the recommended technique.
- For studies requiring high confidence in protein identification and deeper characterization of specific proteins of interest, including the detection of isoforms and modifications, IEF-IPG is the preferred method due to its superior peptides-per-protein performance.
Furthermore, given the complementary nature of these techniques, a synergistic approach employing sequential or orthogonal fractionation using both 1-D SDS-PAGE and IEF-IPG can offer the most comprehensive solution for in-depth proteomic profiling of complex samples [13].
Resolution and Dynamic Range Assessment in Complex Biological Samples
In mass spectrometry-based proteomic profiling, the analysis of complex biological samples is a formidable challenge, primarily due to the vast dynamic range of protein concentrations and the inherent complexity of the mixtures. Fractionation at the protein level is an indispensable strategy to enhance the sensitivity and depth of analysis by reducing sample complexity prior to mass spectrometry. Among the most common gel-based protein separation techniques, one-dimensional sodium dodecyl sulfate-polyacrylamide gel electrophoresis (1-D SDS-PAGE) and isoelectric focusing with immobilized pH gradients (IEF-IPG) have emerged as powerful, yet fundamentally different approaches. This guide provides an objective comparison of these two techniques, evaluating their performance in resolution, dynamic range, and practical application for proteomic profiling, supported by experimental data and detailed methodologies.
Fundamental Separation Principles
The core distinction between SDS-PAGE and IEF-IPG lies in the physicochemical properties of proteins they exploit for separation.
SDS-PAGE separates proteins primarily based on their molecular weight (MW). The anionic detergent SDS binds to proteins, conferring a uniform negative charge density that masks the proteins' intrinsic charge. Consequently, when an electric field is applied, proteins migrate through the polyacrylamide gel matrix at rates inversely proportional to the logarithm of their molecular mass, with smaller proteins migrating faster than larger ones [2] [32].
IEF-IPG, in contrast, separates proteins based on their isoelectric point (pI)—the specific pH at which a protein carries no net electrical charge. Proteins are applied to a gel strip containing a covalently immobilized pH gradient. Under an electric field, proteins migrate through this gradient until they reach the region where the pH equals their pI. At this point, their net charge becomes zero, and migration ceases. This process results in the focusing of proteins into sharp, stationary bands [62] [32].
The following diagram illustrates the conceptual workflow and fundamental separation principles of each technique:
Experimental Performance Comparison
A direct comparative study evaluated common gel-based fractionation techniques, including 1-D SDS-PAGE and IEF-IPG, for nanoLC-ESI-MS/MS analysis of a mixture of protein standards and mitochondrial extracts from rat liver. The following table summarizes the key quantitative findings from this investigation [13].
Table 1: Quantitative Performance Comparison of 1-D SDS-PAGE and IEF-IPG
| Performance Metric | 1-D SDS-PAGE | IEF-IPG |
|---|---|---|
| Number of Protein Identifications | Highest (Comparable to IEF-IPG) | Highest (Comparable to 1-D SDS-PAGE) |
| Average Peptides per Protein | Lower than IEF-IPG | Highest |
| Protein Recovery from Gel | Dependent on gel matrix volume | Dependent on gel matrix volume |
| Complementarity with Other Techniques | Provides complementary identifications | Provides complementary identifications |
| Optimal Combination Strategy | Orthogonal combination with IEF-IPG | Orthogonal combination with 1-D SDS-PAGE |
The data reveals that while both techniques yielded a high and comparable number of protein identifications, IEF-IPG demonstrated a distinct advantage by generating the highest average number of detected peptides per protein [13] [8]. This is a critical metric in proteomics, as a higher sequence coverage increases confidence in protein identification and is beneficial for quantitative analyses and characterization of post-translational modifications.
Furthermore, the study concluded that all tested techniques provided complementary results, meaning they identified unique subsets of proteins. This underscores the value of employing multiple, orthogonal separation methods to maximize proteomic coverage. Specifically, the combination of 1-D SDS-PAGE and IEF-IPG was highlighted as a powerful strategy for improving profiling sensitivity without a significant decrease in throughput [13].
Technical and Practical Considerations
Beyond identification numbers, several technical factors influence the choice between SDS-PAGE and IEF-IPG.
Resolution and Dynamic Range
- IEF-IPG Resolution: IEF-IPG is a high-resolution technique capable of separating proteins differing by as little as 0.01–0.02 pH units [62] [32]. It also features an inherent sample preconcentration effect, as proteins focus into tight bands at their pI. This can improve the detection of low-abundance proteins, thereby extending the dynamic range of analysis [32].
- SDS-PAGE Resolution: The resolution of SDS-PAGE, particularly in its gradient form (where acrylamide concentration varies linearly), is effective at separating proteins across a wide molecular weight range. However, it struggles to resolve proteins with very similar molecular weights, a common limitation in complex samples [2].
Limitations and Challenges
- IEF-IPG Limitations: A significant challenge with IPG-based IEF is the potential for protein precipitation at their isoelectric point, which can lead to sample loss. The technique can also be time-consuming, with run times lasting up to 24 hours. Furthermore, the analysis of very basic proteins (pI > 10) remains challenging due to gradient instability at high pH [32] [19]. One study noted higher protein loss during the 2DE procedure with IPG, especially for basic proteins, and reported that approximately half of the detected basic protein spots were not reproducible with the IPG method [19].
- SDS-PAGE Limitations: While generally robust, SDS-PAGE has limited resolution for proteins of similar size and is less effective for very high or very low molecular weight proteins. It also provides no direct information about a protein's native charge or pI [13] [2].
Detailed Experimental Protocols
To ensure reproducibility and provide a clear framework for researchers, the following subsections detail the core methodologies as employed in the comparative study [13].
1-D SDS-PAGE Fractionation Protocol
- Sample Preparation: Protein samples were diluted in a sample buffer containing 63 mM Tris HCl, 10% glycerol, 2% SDS, and 0.0025% bromophenol blue (pH 6.8), supplemented with 50 mM DTT as a reducing agent.
- Gel Electrophoresis: The prepared samples were loaded onto a Criterion 8–16% Tris-HCl gel. Electrophoresis was performed at a constant voltage until the dye front reached the bottom of the gel.
- In-Gel Digestion: The entire gel lane was excised and systematically sliced into multiple uniform bands (e.g., 10-30 slices). Each gel band was then subjected to in-gel tryptic digestion. This process involves destaining, reduction and alkylation of cysteine residues, and overnight digestion with trypsin to release peptides.
- Peptide Extraction: The resulting peptides were extracted from the gel matrix, purified, and concentrated before analysis by nanoLC-ESI-MS/MS [13].
IEF-IPG Fractionation Protocol
- Sample Preparation: Proteins were solubilized in an IEF-compatible buffer, typically containing 7 M urea, 2 M thiourea, and 4% CHAPS. Samples were reduced and alkylated, often with reagents like TBP and acrylamide.
- Cleanup and Conductivity Adjustment: A critical step involved cleaning the protein extract and adjusting its conductivity to ≤ 300 µS/cm using centrifugal ultrafiltration (e.g., 10 kDa MWCO filters). High salt concentrations can disrupt the IEF process.
- Isoelectric Focusing: The prepared sample was loaded onto an IPG strip (e.g., pH 3–10). IEF was performed using a programmed voltage gradient, often reaching high voltages (e.g., 8000 V) to achieve a total of ~50,000 Vhr, ensuring proteins reached their isoelectric point.
- Post-Focusing Processing: After focusing, the IPG strip was equilibrated and either applied directly to a second-dimension SDS-PAGE gel or, for fractionation, cut into segments along the pH gradient. Each segment was then processed similarly to a 1-D SDS-PAGE gel band, undergoing in-gel digestion and peptide extraction for LC-MS/MS analysis [13].
The workflow for both fractionation methods leading to mass spectrometric analysis is summarized below:
The Scientist's Toolkit: Key Reagent Solutions
Successful implementation of these techniques relies on specific reagents and equipment. The following table catalogues essential solutions used in the featured experiments [13] [32] [19].
Table 2: Essential Research Reagents for Gel-Based Protein Fractionation
| Reagent / Equipment | Function / Purpose | Examples / Notes |
|---|---|---|
| IPG Strips | First-dimension separation medium for IEF; contains an immobilized linear or nonlinear pH gradient. | Commercially available in various lengths (7–24 cm) and pH ranges (e.g., broad 3–10, narrow 4–7). |
| Carrier Ampholytes | A mixture of amphoteric compounds that create a stable pH gradient in the solution for certain IEF formats. | Used in traditional IEF and NEPHGE; can suffer from gradient instability [19]. |
| IEF Sample Buffer | Solubilizes proteins while maintaining their native charge; typically contains chaotropes and non-ionic or zwitterionic detergents. | Common components: 7 M Urea, 2 M Thiourea, 4% CHAPS, DTT. |
| SDS-PAGE Sample Buffer | Denatures proteins, confers negative charge, and allows tracking of migration. | Contains SDS, glycerol, bromophenol blue, and a reducing agent (e.g., DTT or β-mercaptoethanol) in Tris buffer. |
| Reducing & Alkylating Agents | Breaks disulfide bonds (reduction) and prevents their reformation (alkylation). | DTT or TCEP for reduction; Iodoacetamide or Acrylamide for alkylation. |
| Proteolytic Enzyme | Digests separated proteins in-gel to generate peptides for MS analysis. | Trypsin is most commonly used. |
| Precast Gels & Systems | Provide standardized, reproducible platforms for running SDS-PAGE and IEF. | e.g., Criterion Tris-HCl gels, ZOOM IPGRunner, Ettan IPGphor. |
The comparative analysis of 1-D SDS-PAGE and IEF-IPG reveals that neither technique is universally superior; rather, they offer complementary strengths. The choice between them should be guided by the specific goals of the proteomic study.
- IEF-IPG excels in resolution based on the isoelectric point and provides superior peptide coverage per protein, making it ideal for detecting charge variants, post-translational modifications, and for achieving high-confidence protein identifications.
- 1-D SDS-PAGE is a robust, widely adopted workhorse for separating proteins by molecular weight. It is highly effective as a fractionation tool to simplify complex mixtures prior to LC-MS/MS analysis.
For researchers seeking to maximize proteomic coverage and sensitivity from complex biological samples, the orthogonal combination of 1-D SDS-PAGE and IEF-IPG is a powerfully synergistic strategy. This approach leverages the distinct separation principles of each method to address the profound challenges of dynamic range and complexity inherent in proteomic profiling.
In the evolving landscape of proteomic research, the comprehensive analysis of proteoforms—defined as all the different molecular forms in which a protein product of a single gene can be found—has emerged as an essential frontier for understanding biological function and dysfunction [63]. These variants arise from mechanisms including genetic variation, alternative splicing, and post-translational modifications (PTMs), creating a complexity that vastly exceeds the number of genes in an organism [21]. Current estimates suggest that the human proteome may contain several million distinct proteoforms, far surpassing the approximately 20,300 protein-coding genes [21]. This diversity is functionally critical, as specific proteoforms often drive physiological processes and disease states, explaining how a limited genome can account for the complexity of biological systems [41].
The analytical challenge lies in detecting and characterizing these proteoforms, which requires separation techniques capable of resolving protein species with subtle differences in physicochemical properties. Among the most established methods for this purpose are SDS-PAGE (separation primarily by molecular weight) and IEF-IPG (separation by isoelectric point) [13] [16]. When used individually or combined in two-dimensional approaches, these gel-based techniques provide powerful platforms for proteoform resolution, each offering distinct advantages for PTM analysis and comprehensive proteomic profiling [13] [21]. This guide objectively compares the performance of these techniques, providing researchers with experimental data and methodologies to inform their proteomic strategy.
Fundamental Principles of Separation: SDS-PAGE and IEF-IPG
SDS-PAGE: Separation by Molecular Weight
Sodium Dodecyl Sulfate Polyacrylamide Gel Electrophoresis (SDS-PAGE) separates proteins primarily by their molecular weight [1]. The technique employs the ionic detergent SDS, which denatures proteins and binds to them in a constant weight ratio, conferring a uniform negative charge [1]. This process neutralizes the proteins' intrinsic charges, causing them to migrate through the polyacrylamide gel matrix toward the anode at rates inversely proportional to the logarithm of their molecular masses [1]. The gel acts as a molecular sieve, with pore sizes determined by the polyacrylamide concentration—low-percentage gels resolve large proteins effectively, while high-percentage gels are better for smaller proteins [17]. SDS-PAGE is particularly valuable for estimating molecular weight, assessing sample purity, and identifying protein complexes under denaturing conditions [17].
IEF-IPG: Separation by Isoelectric Point
Isoelectric Focusing with Immobilized pH Gradients (IEF-IPG) separates proteins based on their intrinsic isoelectric point (pI)—the specific pH at which a protein carries no net electrical charge [16] [64]. The technique utilizes a stable, continuous pH gradient immobilized within a polyacrylamide gel strip [16]. When an electric field is applied, proteins migrate through this gradient until they reach the pH region matching their pI, at which point they become uncharged and focus into sharp, stationary bands [16]. This focusing effect concentrates the proteins, enhancing detection sensitivity and enabling resolution of proteoforms differing by as little as 0.001 pH units in their pI values [17]. The IPG technology represents a significant advancement over earlier carrier ampholyte-based systems, providing superior reproducibility, stability, and resolution by eliminating gradient drift, particularly in the cathodal region [16].
Table 1: Core Principles of SDS-PAGE and IEF-IPG Separation Techniques
| Feature | SDS-PAGE | IEF-IPG |
|---|---|---|
| Primary Separation Principle | Molecular weight (MW) | Isoelectric point (pI) |
| Key Reagents | SDS, reducing agents (DTT/β-mercaptoethanol), polyacrylamide | IPG strips, carrier ampholytes, chaotropes, zwitterionic detergents |
| Separation Basis | Molecular sieve effect of polyacrylamide gel | Immobilized pH gradient established in gel matrix |
| Protein State | Denatured and linearized | Native or denatured (depending on protocol) |
| Key Applications | MW estimation, purity assessment, disulfide bond analysis | pI determination, microheterogeneity analysis, PTM detection |
| Resolution Limit | ~2-5 kDa difference in MW | ~0.001 pH unit difference in pI |
Comparative Performance in Proteoform Detection and PTM Analysis
Detection of Post-Translational Modifications
The orthogonal separation principles of SDS-PAGE and IEF-IPG confer distinct advantages for detecting specific categories of post-translational modifications:
IEF-IPG excels at resolving PTMs that alter protein charge, including:
- Phosphorylation and sulfation (which add negative charge, decreasing pI) [16]
- Acetylation and deacetylation (which neutralize charge, increasing pI) [16]
- Glycation (which can modify charge properties) [41]
These charge-altering modifications produce readily detectable pI shifts in IEF-IPG, enabling resolution of proteoforms that might co-migrate in SDS-PAGE [16].
SDS-PAGE effectively resolves PTMs that significantly alter molecular weight, such as:
- Proteolytic cleavage (resulting in discrete fragments with different MW) [21]
- Ubiquitination and SUMOylation (adding substantial mass to proteins) [21]
- Extensive glycosylation (when it significantly increases apparent molecular weight)
For comprehensive PTM analysis, the techniques are often combined in two-dimensional electrophoresis (2D-PAGE), which separates proteins by pI in the first dimension (IEF-IPG) and by MW in the second dimension (SDS-PAGE) [16] [1]. This orthogonal approach provides the highest resolution for detecting proteoforms resulting from various PTMs [21].
Experimental Comparison Data
A systematic comparison of gel-based protein separation techniques evaluated their performance in proteomic profiling using a mixture of protein standards and mitochondrial extracts from rat liver [13]. The study revealed complementary strengths across techniques:
Table 2: Performance Comparison of Gel-Based Separation Techniques in Proteomic Profiling [13]
| Separation Technique | Key Performance Metrics | Advantages for Proteoform Detection |
|---|---|---|
| 1-D SDS-PAGE | High number of protein identifications | Effective for MW-based separation; compatible with GeLC-MS/MS |
| IEF-IPG | Highest average peptides per protein; high number of identifications | Superior for charge-based proteoform separation; enhanced PTM characterization |
| 2-D PAGE | Comprehensive proteoform resolution | Maximum proteoform separation; visual mapping of PTM patterns |
| Preparative 1-D SDS-PAGE | Increased protein load capacity | Improved detection of low-abundance proteoforms |
The IEF-IPG technique demonstrated particular strength for PTM analysis, achieving the highest average number of detected peptides per protein, which enhances sequence coverage and confidence in modification site mapping [13]. This comprehensive comparison concluded that orthogonal combination of 1-D SDS-PAGE and IEF-IPG offered optimal sensitivity for profiling without significant throughput compromise [13].
A separate comparative study between gel-based top-down and gel-free bottom-up proteomics further emphasized that 2D-GE (combining IEF and SDS-PAGE) currently provides the best demonstration of dynamic proteome complexity, enabling direct stoichiometric qualitative and quantitative information about proteins and their proteoforms, including those with unexpected PTMs [21].
Experimental Protocols for Proteoform Analysis
Standard IEF-IPG Protocol for First-Dimension Separation
The following methodology outlines the standard procedure for isoelectric focusing using immobilized pH gradient strips, adapted from multiple technical sources [13] [16] [65]:
Sample Preparation:
- Protein Extraction and Solubilization: Suspend proteins in IEF-compatible buffer (7M urea, 2M thiourea, 4% CHAPS, appropriate carrier ampholytes) [13]. For complex samples like tissue extracts, additional purification steps may be required.
- Reduction and Alkylation: Reduce proteins with 5 mM tributylphosphine (TBP) or 50-100 mM DTT at 37°C for 60-90 minutes, followed by alkylation with 10-230 mM acrylamide or iodoacetamide for 60 minutes [13] [41]. Quench excess alkylation reagent with DTT.
- Desalting and Cleanup: Remove interfering ions and contaminants using centrifugal ultrafiltration (10 kDa MWCO filters) or precipitation methods. Adjust sample conductivity to ≤300 μS/cm for optimal focusing [13].
Isoelectric Focusing:
- IPG Strip Rehydration: Apply samples to IPG strips (7-24 cm, depending on resolution needs) via passive or active rehydration. For analytical scales, load 50-100 μg total protein; for preparative scales, load up to 1 mg [13] [65].
- Focusing Parameters: Perform IEF using a stepped voltage program:
- Temperature Control: Maintain consistent temperature at 17-20°C throughout focusing [13] [42].
Strip Storage: After focusing, IPG strips can be stored at -80°C for later analysis or immediately equilibrated for second-dimension separation [64].
SDS-PAGE Protocol for Second-Dimension Separation
Following IEF, the second dimension separates proteins by molecular weight:
IPG Strip Equilibration:
- Reduction: Incubate focused IPG strips in equilibration buffer (6 M urea, 20% glycerol, 2% SDS, 375 mM Tris-HCl, pH 8.8) containing 130 mM DTT for 10-15 minutes [41] [64].
- Alkylation: Transfer strips to fresh equilibration buffer containing 350 mM acrylamide or iodoacetamide for an additional 10-15 minutes [41] [64].
SDS-PAGE Separation:
- Gel Preparation: Cast polyacrylamide gels with appropriate percentage (8-16% gradient gels recommended for broad MW range) [13] [1]. Include a stacking gel (lower percentage acrylamide) for improved resolution.
- Transfer and Embedding: Place equilibrated IPG strips onto SDS-PAGE gels, seal with agarose overlay, and insert into electrophoresis apparatus [64].
- Electrophoresis Conditions: Run gels at constant current (15-30 mA per gel) or voltage until dye front reaches bottom [1]. Maintain cooling during separation to prevent heat-induced artifacts.
Protein Detection:
- Staining Options:
- Image Acquisition: Document gels using appropriate scanning systems (laser scanners for fluorescence, white light for colorimetric stains) [21].
Integrated Workflow for Comprehensive Proteoform Analysis
The following diagram illustrates a comprehensive workflow integrating both IEF-IPG and SDS-PAGE techniques for optimal proteoform detection and PTM analysis:
This integrated approach leverages the complementary strengths of both separation principles, enabling researchers to detect proteoforms that might be missed when using either technique alone. The workflow generates a map where individual proteoforms appear as distinct spots that can be excised for identification by mass spectrometry and PTM characterization [16] [21].
Essential Research Reagent Solutions
Successful implementation of these proteoform separation techniques requires specific reagents and materials optimized for electrophoretic separations:
Table 3: Essential Research Reagents for Proteoform Analysis
| Reagent Category | Specific Examples | Function and Importance |
|---|---|---|
| IPG Strips | ReadyStrip IPG Strips (7-24 cm, various pH ranges) | Provide immobilized pH gradients for first-dimension IEF separation [16] [65] |
| Chaotropic Agents | Urea (7-9 M), Thiourea (2 M) | Denature proteins while maintaining solubility for IEF [13] [41] |
| Detergents | CHAPS (2-4%), Triton X-100, ASB-14 | Solubilize membrane proteins and prevent aggregation [13] [16] |
| Reducing Agents | DTT (50-100 mM), TBP (5 mM), β-mercaptoethanol | Break disulfide bonds for complete denaturation [13] [41] |
| Alkylating Agents | Acrylamide (100-350 mM), iodoacetamide | Modify cysteine residues to prevent reformation of disulfide bonds [13] [41] |
| Carrier Ampholytes | BioLyte Ampholytes (various pH ranges) | Enhance conductivity and improve protein solubility during IEF [16] [64] |
| Staining Reagents | Coomassie G-250/R-250, SYPRO Ruby, Silver nitrate | Visualize separated proteins/proteoforms with varying sensitivity and MS-compatibility [17] [65] |
The comparative analysis of SDS-PAGE and IEF-IPG techniques reveals complementary strengths for proteoform detection and PTM analysis. IEF-IPG offers superior resolution for charge-based separations, making it particularly valuable for detecting phosphorylation, acetylation, and other PTMs that alter isoelectric point. SDS-PAGE provides robust molecular weight-based separation effective for detecting proteolytic processing and other mass-altering modifications. When combined in two-dimensional electrophoresis, these techniques create a powerful platform for comprehensive proteoform mapping, enabling researchers to resolve thousands of protein variants from complex biological samples [16] [21].
For researchers designing proteomic studies, the choice between these techniques should be guided by specific experimental goals:
- For targeted analysis of specific PTM categories, select the technique matching the primary physicochemical property altered by the modification
- For discovery-level proteoform profiling, implement 2D-PAGE combining both separation principles
- For high-throughput analysis, consider 1-D SDS-PAGE or IEF-IPG separately, acknowledging their complementary coverage
- For maximum proteome coverage, employ orthogonal combinations of gel-based and solution-based separation techniques [13] [42]
As proteomics continues to advance toward complete proteoform characterization, these established gel-based techniques remain essential tools in the analytical arsenal, providing robust, reproducible separation power that continues to reveal the intricate complexity of biological systems. Their ongoing integration with advanced mass spectrometry approaches ensures their continued relevance in the evolving landscape of proteomic research [63] [21].
Technical Reproducibility and Gel-to-Gel Variability Metrics
Proteomic profiling research relies heavily on high-resolution protein separation techniques, with SDS-PAGE (Sodium Dodecyl Sulfate-Polyacrylamide Gel Electrophoresis) and IEF-IPG (Isoelectric Focusing using Immobilized pH Gradients) serving as foundational methods. Understanding the technical reproducibility and gel-to-gel variability of these techniques is paramount for experimental design, data interpretation, and cross-laboratory validation of results. This guide provides an objective comparison of SDS-PAGE and IEF-IPG performance metrics, drawing on experimental data to evaluate their respective strengths and limitations in proteomic applications. The assessment focuses specifically on their performance in separation efficiency, reproducibility, and suitability for different proteomic profiling scenarios.
Performance Comparison: SDS-PAGE vs. IEF-IPG
Direct comparative studies reveal distinct performance characteristics for SDS-PAGE and IEF-IPG techniques. The following data summarizes key quantitative metrics from controlled experiments.
Table 1: Comparative Performance Metrics for SDS-PAGE and IEF-IPG
| Performance Parameter | 1-D SDS-PAGE | IEF-IPG | Experimental Context |
|---|---|---|---|
| Total Protein Identifications | Highest number of identifications [13] | Highest number of identifications [13] | Analysis of mitochondrial extracts from rat liver [13] |
| Peptides per Protein | Not specified | Highest average number [13] | Analysis of mitochondrial extracts from rat liver [13] |
| Reproducibility (General) | Good | Good with commercial IPG strips [19] [16] | Broad-range (pH 3-10) analysis [19] |
| Reproducibility (Basic Proteins, pI>7) | Not applicable (separates by MW) | Lower; ~50% spot reproducibility with Coomassie [19] | Broad-range (pH 3-10) analysis [19] |
| Protein Loss | Moderate | Higher, especially for basic proteins [19] | General 2DE workflow [19] [66] |
| Technical Variation (Quantitative) | ~3x higher than 2D-DIGE (GeLC-MS/MS) [21] | Not directly specified | Label-free shotgun vs. 2D-DIGE analysis of DU145 cell line [21] |
Table 2: Suitability for Protein Analysis Based on Physicochemical Properties
| Protein Property | Recommended Technique | Performance Notes |
|---|---|---|
| Acidic Proteins | IEF-IPG (narrow range) [19] | Method of choice; excellent resolution [19] |
| Basic Proteins (pI > 7) | NEPHGE-based 2DE [19] | Preferable over IPG; IPG shows unreliable results [19] |
| High Molecular Weight | Gradient SDS-PAGE [2] | Superior separation based on molecular weight [2] |
| Proteoform/PTM Analysis | 2D-GE (IEF-IPG + SDS-PAGE) [21] | Direct qualitative and quantitative information on intact proteoforms [21] |
Experimental Protocols for Key Comparisons
The quantitative metrics presented above are derived from specific, reproducible experimental methodologies. Below are detailed protocols for the key experiments cited.
Protocol 1: Comparative GeLC-MS/MS and IEF-IPG-LC-MS/MS
This protocol is adapted from the study that directly compared protein identification numbers between SDS-PAGE and IEF-IPG [13].
- Sample Preparation: Mitochondrial extracts from rat liver are homogenized and lysed in IEF buffer (7M urea, 2M thiourea, 4% CHAPS). Proteins are reduced and alkylated with 5 mM TBP (Tributylphosphine) and 10 mM acrylamide. Samples are cleaned and concentrated using 10 kDa MWCO (Molecular Weight Cut-Off) filters, adjusting conductivity to ≤300 µS/cm [13].
- 1-D SDS-PAGE (GeLC-MS/MS): Load approximately 144 µg of protein onto a Criterion 8–16% Tris-HCl gel. After electrophoresis, the entire gel lane is excised and systematically sliced into multiple fractions (e.g., 20-30 bands). Each gel band is subjected to in-gel tryptic digestion [13] [42].
- IEF-IPG-LC-MS/MS: Load the same amount of protein onto an IPG strip (e.g., pH 3-10). Perform isoelectric focusing according to the manufacturer's protocol. After IEF, the entire strip is cut into multiple segments (e.g., 20-40 pieces). Proteins in each segment are digested in-gel with trypsin [13].
- LC-MS/MS Analysis: Tryptic peptides from each fraction of both methods are analyzed by nanoflow reversed-phase liquid chromatography coupled to tandem mass spectrometry (nanoLC-ESI-MS/MS) [13].
- Data Analysis: Protein identifications are filtered for high confidence using standard database search engines and criteria. The total number of unique protein identifications and the average number of detected peptides per protein are compared between the two techniques [13].
Protocol 2: Assessing Gel-to-Gel Reproducibility in 2DE
This protocol outlines the method for evaluating spot reproducibility, a key metric of gel-to-gel variability, as used in the comparison of IPG and NEPHGE [19].
- Sample Preparation: Prepare whole cell lysates (e.g., from Saccharomyces cerevisiae). Determine protein concentration accurately. For Coomassie staining, load 50-100 µg of total protein per gel [19].
- First Dimension - IEF:
- IPG Method: Use commercial IPG strips (e.g., 7 cm, pH 3-10). Rehydrate strips with sample overnight. Perform IEF using a stepwise voltage protocol to a total of 8,000-10,000 Vh [19] [16].
- NEPHGE Method: Cast tube gels containing carrier ampholytes. Load sample at the anodic end. Perform IEF under non-equilibrium conditions for a fixed time to prevent cathodic drift [19].
- Second Dimension - SDS-PAGE: Equilibrate IPG strips or NEPHGE gels in SDS-containing buffer. Place them onto uniform SDS-polyacrylamide gels (e.g., 12.5%). Perform electrophoresis under standardized conditions [19].
- Detection and Image Analysis: Stain gels with Coomassie Brilliant Blue. Scan gels at high resolution. Use 2D image analysis software to detect protein spots, match spots across different gels, and calculate reproducibility metrics. Reproducibility is typically reported as the percentage of protein spots consistently detected across replicate gels [19].
Workflow Visualization
The following diagrams illustrate the core workflows for the key separation techniques discussed, highlighting sources of variability.
Diagram 1: Core Separation Workflows. The 2DE workflow (red) combines IEF-IPG and SDS-PAGE, with equilibration being a potential step for variability and protein loss [19] [66].
Diagram 2: Technique Selection Logic. This decision pathway summarizes experimental data to guide the choice of separation method based on research objectives and protein properties [19] [21].
The Scientist's Toolkit: Essential Research Reagents and Materials
Successful execution of these separation techniques requires specific reagents and materials. The following table details key items and their functions in the experimental workflow.
Table 3: Essential Reagents and Materials for Protein Separation Workflows
| Item | Function / Role in Experiment |
|---|---|
| IPG Strips (various pH ranges) | Precast polyacrylamide gels with an immobilized pH gradient for the first dimension of 2DE; essential for IEF reproducibility [16]. |
| Carrier Ampholytes | Mixtures of amphoteric compounds that create a stable pH gradient in solution for NEPHGE-based IEF [19] [16]. |
| Chaotropic Agents (Urea, Thiourea) | Disrupt hydrogen bonds to denature proteins and maintain solubility during IEF sample preparation and focusing [13] [16]. |
| Zwitterionic Detergent (CHAPS) | Solubilizes proteins without interfering with their charge, crucial for IEF sample buffers [13] [16]. |
| Reducing Agent (DTT, TBP, 2-ME) | Breaks disulfide bonds to fully denature proteins. Usage before/during IEF or before SDS-PAGE is protocol-dependent [13] [66]. |
| Alkylating Agent (Iodoacetamide) | Modifies cysteine residues by alkylating free thiol groups to prevent reformation of disulfide bonds after reduction [66]. |
| Acrylamide/Bis-Acrylamide | Monomers for forming the polyacrylamide gel matrix used in both SDS-PAGE and IEF gels [2]. |
| Coomassie Staining Solution | A relatively insensitive but simple and MS-compatible protein dye for visualizing separated proteins in gels [19]. |
In the field of proteomics, the analysis of complex biological samples relies heavily on effective protein separation techniques. Due to the wide dynamic range of protein concentrations in biological systems and the limited peak capacity of conventional liquid chromatography, fractionation strategies are indispensable for improving the sensitivity of mass spectrometry-based profiling [13]. Among the most common gel-based separation methods are Sodium Dodecyl Sulfate-Polyacrylamide Gel Electrophoresis (SDS-PAGE) and Isoelectric Focusing with Immobilized pH Gradients (IEF-IPG). These techniques form the foundational first dimension of many proteomic workflows, including the powerful two-dimensional gel electrophoresis (2-DE) [67].
This guide provides an objective comparison of SDS-PAGE and IEF-IPG, outlining their complementary strengths. By examining their fundamental principles, performance metrics based on experimental data, and specific application scenarios, we aim to equip researchers with the knowledge to select the optimal technique for their specific research goals in drug development and biomedical research.
SDS-PAGE: Separation by Molecular Weight
SDS-PAGE separates proteins primarily based on their molecular weight. The technique involves denaturing proteins with sodium dodecyl sulfate (SDS), an anionic detergent that linearizes proteins and imparts a uniform negative charge. When an electric current is applied, these SDS-coated proteins migrate through a polyacrylamide gel matrix, with smaller proteins moving faster than larger ones [17]. The concentration of polyacrylamide can be adjusted to create a molecular sieve optimal for different protein size ranges; low-percentage gels are better for resolving large proteins, while high-percentage gels are superior for separating small proteins [17]. Gradient SDS-PAGE, which uses varying acrylamide concentrations throughout the gel, allows for the simultaneous analysis of a wide range of molecular weights [2].
IEF-IPG: Separation by Isoelectric Point
IEF-IPG separates proteins according to their isoelectric point (pI), the pH at which a protein carries no net charge. This technique utilizes a stable, continuous, and linear pH gradient immobilized within a polyacrylamide gel strip. When an electric field is applied, charged proteins migrate through this gradient until they reach the point where the pH equals their pI, at which point they become uncharged and stop moving [17]. The IPG (Immobilized pH Gradient) technology represents a significant advancement over older carrier ampholyte-based systems (CAPG-IEF), offering improved reproducibility, higher resolution, and avoidance of issues like cathode drift [17]. Modern IPG strips are available in various lengths and pH ranges, from broad (e.g., pH 3-10) to narrow (e.g., pH 4-7), allowing researchers to select the optimal resolution for their target proteins [19].
Visualizing the Core Principles
The following diagram illustrates the fundamental separation mechanisms of each technique, highlighting their orthogonal nature which forms the basis for two-dimensional electrophoresis.
Experimental Comparison and Performance Data
Quantitative Performance Metrics
A direct comparison of SDS-PAGE and IEF-IPG as upfront fractionation techniques for nanoLC-ESI-MS/MS analysis reveals distinct performance characteristics. The following table summarizes key metrics from a controlled study using a mixture of protein standards and mitochondrial extracts:
Table 1: Performance Comparison of Gel-Based Fractionation Techniques in Proteomic Profiling [13]
| Performance Metric | 1-D SDS-PAGE | IEF-IPG | Preparative 1-D SDS-PAGE | 2-D PAGE |
|---|---|---|---|---|
| Number of Protein Identifications | Highest | Highest | Lower than 1-D SDS-PAGE and IEF-IPG | Lower than 1-D SDS-PAGE and IEF-IPG |
| Average Peptides per Protein | Lower than IEF-IPG | Highest | Not specified | Not specified |
| Dynamic Range | High | High | Not specified | Not specified |
| Complementarity with Other Techniques | Orthogonal to IEF-IPG | Orthogonal to SDS-PAGE | Not specified | Combines both principles |
| Key Advantages | Simple, inexpensive, removes interfering contaminants | Excellent for quantitative and structural characterization | Higher protein load capacity | Visual mapping of protein spots |
The data demonstrates that while both 1-D SDS-PAGE and IEF-IPG yielded the highest number of protein identifications, the IEF-IPG technique resulted in the highest average number of detected peptides per protein, which is particularly beneficial for quantitative analyses and structural characterization of proteins [13]. The study also found these techniques to be orthogonal and complementary, with a combination of 1-D SDS-PAGE and IEF-IPG providing improved profiling sensitivity without significant decrease in throughput [13].
Protein pI and Molecular Weight Considerations
The performance of each technique varies significantly across different protein characteristics. Research specifically comparing IPG and NEPHGE (Non-Equilibrium pH Gradient Electrophoresis, an alternative IEF method) for basic protein separation reveals critical limitations of standard IPG protocols:
Table 2: Technique Performance Across Protein Properties [19]
| Protein Property | IPG-IEF Performance | NEPHGE-Based IEF Performance | SDS-PAGE Performance |
|---|---|---|---|
| Basic Proteins (pI > 7) | Poor: ~50% of basic protein spots not reproducible with Coomassie staining | Excellent: Good reproducibility in basic gel zone | Not pI-dependent |
| Acidic Proteins | Good: Similar reproducibility to NEPHGE for acidic spots | Good: Similar reproducibility to IPG for acidic spots | Not pI-dependent |
| Highly Acidic Proteins | Reliable detection | Poor: Failure to detect some highly acidic proteins | Not pI-dependent |
| High Molecular Weight | Not MW-dependent | Not MW-dependent | Resolution decreases with increasing MW |
| Low Molecular Weight | Not MW-dependent | Not MW-dependent | Excellent resolution with high-percentage gels |
The comparison highlights that NEPHGE-based IEF is preferable for the analysis of basic proteins, while narrow-range (pH 4-7) IPG technique remains the method of choice for acidic proteins [19]. SDS-PAGE performance is largely independent of pI but is significantly influenced by molecular weight, with optimal separation depending on appropriate gel percentage selection [17].
Detailed Experimental Protocols
Sample Preparation:
- Dilute protein samples in SDS-PAGE sample buffer (63 mM Tris HCl, 10% glycerol, 2% SDS, 0.0025% bromophenol blue, pH 6.8).
- Add reducing agent (50 mM DTT or 5% β-mercaptoethanol) to disrupt disulfide bonds.
- Heat samples at 95-100°C for 5-10 minutes to denature proteins.
Gel Preparation and Electrophoresis:
- Prepare polyacrylamide gel with appropriate concentration (e.g., 8-16% gradient for broad molecular weight separation).
- Load samples and molecular weight markers onto the gel.
- Run electrophoresis at constant voltage (typically 100-150V) until the dye front reaches the bottom of the gel.
Protein Visualization and Processing:
- Stain gel with Coomassie Brilliant Blue (sensitivity: 50-100 ng) or silver stain (sensitivity: 0.1 ng).
- For mass spectrometry analysis, excise protein bands, destain, and digest with trypsin.
- Extract resulting peptides for LC-MS/MS analysis.
Sample Preparation:
- Solubilize proteins in IEF buffer (7M urea, 2M thiourea, 4% CHAPS).
- Reduce and alkylate proteins with 5 mM TBP and 10 mM acrylamide in 25 mM ammonium bicarbonate, pH 8.0 at 37°C for 90 minutes.
- Quench alkylation reaction with 50 mM DTT.
- Adjust sample conductivity to ≤300 µS/cm using centrifugal ultrafiltration.
Isoelectric Focusing:
- Apply samples to IPG strips of desired pH range (e.g., broad range pH 3-10 or narrow range pH 4-7).
- Perform active rehydration and IEF using a stepped or gradient voltage program.
- Typical IEF conditions: 500 V for 30 minutes, 1000 V for 1 hour, and 8000 V until 50,000 Vhr is reached.
Strip Equilibration and Further Analysis:
- Equilibrate focused IPG strips in SDS-containing buffer.
- For 2D-PAGE, apply strips to SDS-PAGE gels for second dimension separation.
- For gel-free approaches, extract proteins directly from strips for digestion and LC-MS/MS analysis.
Integrated 2D-PAGE Workflow
The most powerful application combining both techniques is Two-Dimensional Gel Electrophoresis (2D-PAGE), where IEF-IPG serves as the first dimension and SDS-PAGE as the second. The following diagram illustrates this comprehensive workflow:
Research Reagent Solutions and Essential Materials
Table 3: Key Reagents and Materials for Gel-Based Protein Separation [13] [17] [68]
| Category | Specific Reagent/Material | Function and Importance | Technical Notes |
|---|---|---|---|
| IEF-Specific Reagents | IPG Strips (various pH ranges) | Form immobilized pH gradient for first dimension separation | Narrow range (e.g., pH 4-7) for higher resolution of specific protein groups |
| Carrier Ampholytes | Generate and stabilize pH gradient in solution-based IEF | Required for non-IPG IEF methods | |
| Urea/Thiourea Denaturants | Solubilize proteins while maintaining charge for IEF | Typical concentration: 7M urea, 2M thiourea | |
| SDS-PAGE-Specific Reagents | SDS (Sodium Dodecyl Sulfate) | Denatures proteins and confers uniform negative charge | Critical for molecular weight-based separation |
| Acrylamide/Bis-acrylamide | Forms polyacrylamide gel matrix with molecular sieving properties | Concentration determines resolution range (e.g., 8-16% gradient) | |
| TEMED/Ammonium Persulfate | Catalyzes acrylamide polymerization | Fresh preparation recommended for consistent results | |
| General Electrophoresis Reagents | DTT or β-Mercaptoethanol | Reducing agents that disrupt disulfide bonds | Essential for complete protein denaturation |
| Iodoacetamide | Alkylating agent that prevents reformation of disulfide bonds | Used after reduction for cysteine modification | |
| CHAPS Detergent | Zwitterionic detergent for protein solubilization | Commonly used at 2-4% concentration in IEF buffers | |
| Staining and Visualization | Coomassie Brilliant Blue | Protein staining with good MS compatibility | Sensitivity: 50-100 ng; Use G-250 for better sensitivity |
| Silver Nitrate | High-sensitivity protein detection | Sensitivity: 0.1 ng; may require MS-compatible protocols | |
| Fluorescent Stains (Sypro Ruby) | High sensitivity with wide linear dynamic range | Excellent for quantitative comparisons |
Application Scenarios and Selection Guidelines
When to Prefer SDS-PAGE
- Molecular Weight Estimation: SDS-PAGE remains the gold standard for determining protein molecular weight and monitoring protein purity during purification processes [17].
- Analysis of Hydrophobic Proteins: SDS-PAGE generally demonstrates better performance for membrane and hydrophobic proteins that may precipitate during IEF [13].
- Quick Quality Assessment: When rapid assessment of protein sample quality, integrity, and approximate concentration is needed, SDS-PAGE with Coomassie staining provides a simple and cost-effective solution [17].
- Western Blotting Applications: As proteins are already denatured and linearized, SDS-PAGE is ideal for subsequent transfer to membranes for immunoblotting.
- Disulfide Bond Analysis: Comparison of reduced versus non-reduced samples on SDS-PAGE allows investigation of disulfide bond formation and protein oligomerization [17].
When to Prefer IEF-IPG
- Detection of Isoforms and PTMs: IEF-IPG excels at separating protein isoforms with subtle charge differences resulting from post-translational modifications such as phosphorylation, acetylation, or deamidation [17].
- Analysis of Acidic Proteins: Narrow-range IPG strips (e.g., pH 4-7) provide superior resolution for acidic proteins compared to other methods [19].
- High-Resolution 2D-PAGE: When performing comprehensive 2D-PAGE analyses, IEF-IPG is the preferred first dimension due to its reproducibility and high resolution [67].
- Quantitative Proteomics: The high average number of detected peptides per protein makes IEF-IPG particularly beneficial for label-free quantitative proteomic studies [13].
- Microheterogeneity Assessment: IEF-IPG can reveal charge heterogeneity in purified protein preparations, important for biopharmaceutical quality control [17].
When to Combine Both Techniques
- Comprehensive Proteome Mapping: The orthogonal separation principles of IEF-IPG (by pI) and SDS-PAGE (by MW) make their combination in 2D-PAGE extremely powerful for resolving complex protein mixtures [13] [67].
- Biomarker Discovery: 2D-PAGE enables visualization of hundreds to thousands of protein spots simultaneously, facilitating comparative analysis between control and experimental samples [69].
- Analysis of Unknown Protein Complexes: The combination provides both pI and MW information that can help characterize unknown proteins or complexes before mass spectrometry analysis.
SDS-PAGE and IEF-IPG represent complementary pillars of protein separation technology, each with distinct strengths and optimal application areas. The experimental data demonstrates that SDS-PAGE provides robust, straightforward separation by molecular weight, making it ideal for routine protein analysis, quality control, and molecular weight estimation. IEF-IPG offers superior resolution based on isoelectric point, excelling in detection of protein isoforms, post-translational modifications, and acidic protein separation. For the most challenging proteomic applications, the orthogonal combination of both techniques in 2D-PAGE provides the highest resolution, while sequential use of both methods in fractionation strategies significantly enhances proteomic profiling sensitivity.
The choice between these techniques should be guided by specific research objectives: SDS-PAGE for molecular weight-based separation and simplicity, IEF-IPG for charge-based resolution and detection of fine microheterogeneity, and their combination for the most comprehensive protein analysis. Understanding these complementary strengths enables researchers to design more effective separation strategies, ultimately advancing drug development and biomedical research through improved proteomic characterization.
Conclusion
SDS-PAGE and IEF-IPG represent complementary rather than competing technologies in the proteomics toolkit, each with distinct advantages for specific applications. The evidence confirms that IEF-IPG provides superior peptides per protein detection, beneficial for quantitative and structural characterization, while SDS-PAGE remains invaluable for molecular weight-based separation and GeLC-MS/MS workflows. For comprehensive proteome coverage, particularly of proteoforms with post-translational modifications, the orthogonal combination of these techniques provides the most powerful approach. Future directions should focus on improving reproducibility for basic proteins in IEF-IPG, enhancing recovery of hydrophobic proteins, and developing more integrated automated workflows. As proteomics continues to advance toward clinical applications, understanding the strategic implementation of these foundational separation techniques will be crucial for biomarker discovery, drug development, and systems biology research.
References
- 1. Overview of Protein Electrophoresis [https://www.thermofisher.com/us/en/home/life-science/protein-biology/protein-biology-learning-center/protein-biology-resource-library/pierce-protein-methods/overview-electrophoresis.html]
- 2. Comparing Isoelectric Focusing with Gradient SDS-PAGE ... [https://eureka.patsnap.com/report-comparing-isoelectric-focusing-with-gradient-sds-page-efficiency]
- 3. Immobilized pH Gradient Isoelectric Focusing as a First- ... [https://pmc.ncbi.nlm.nih.gov/articles/PMC2291737/]
- 4. SDS-PAGE: The science behind all those bubbles [https://www.antibodiesinc.com/pages/sds-page-demystified?srsltid=AfmBOorNfpSEKVVS-YMjvTr9IPBaWOBULP-FMVnEK0Btb62L25D2HKWq]
- 5. Western blotting guide: Part 2, Protein separation by SDS- ... [https://www.jacksonimmuno.com/secondary-antibody-resource/technical-tips/western-blotting-guide-part-2/]
- 6. Microfluidic Preparative Free-Flow Isoelectric Focusing [https://pmc.ncbi.nlm.nih.gov/articles/PMC2826279/]
- 7. Native SDS-PAGE: High Resolution Electrophoretic ... [https://pmc.ncbi.nlm.nih.gov/articles/PMC4517606/]
- 8. of in-gel protein separation techniques commonly used... Comparison [https://pubmed.ncbi.nlm.nih.gov/22899259/]
- 9. Using T4 genetics and Laemmli's development of high- ... [https://www.sciencedirect.com/science/article/pii/S0021925822009061]
- 10. SDS-PAGE [https://en.wikipedia.org/wiki/SDS-PAGE]
- 11. The Evolution of SDS-Based Protein Separation [https://www.bio-techne.com/resources/blogs/advantages-of-ce-sds]
- 12. Isoelectric Focusing: Expert Tips for Protein Separation [https://bitesizebio.com/26811/isoelectric-focusing-separation-proteins-peptides/]
- 13. Comparison of in-gel protein separation techniques ... [https://pmc.ncbi.nlm.nih.gov/articles/PMC4234072/]
- 14. Evaluation on the effect of different in-gel peptide ... [https://www.sciencedirect.com/science/article/abs/pii/S0003269713003771]
- 15. Protein Separation Techniques for Accurate Sequencing [https://www.creative-proteomics.com/proteinseq/resource/protein-separation-techniques-for-precise-sequencing.htm]
- 16. Chapter 30 Isoelectric Focusing and Two-Dimensional Gel ... [https://www.sciencedirect.com/science/article/abs/pii/S0076687909630305]
- 17. 1D SDS-PAGE, IEF Service [https://www.creative-proteomics.com/services/1d-sds-page-ief.htm]
- 18. Comparing Isoelectric Focusing vs Gel Electrophoresis for ... [https://eureka.patsnap.com/report-comparing-isoelectric-focusing-vs-gel-electrophoresis-for-ph-range]
- 19. Comparison of first dimension IPG and NEPHGE techniques ... [https://proteomesci.biomedcentral.com/articles/10.1186/1477-5956-11-36]
- 20. Basics and recent advances of two dimensional [https://clinicalproteomicsjournal.biomedcentral.com/articles/10.1186/1559-0275-11-16]
- 21. A Practical and Analytical Comparative Study of Gel-Based ... [https://www.mdpi.com/2073-4409/12/5/747]
- 22. A review on preparative and semi-preparative offgel ... [https://www.sciencedirect.com/science/article/abs/pii/S0003267014005078]
- 23. Increase in local protein concentration by field-inversion gel ... [https://pmc.ncbi.nlm.nih.gov/articles/PMC2211458/]
- 24. A systematic evaluation of sample preparation and 2-D gel ... [https://www.sciencedirect.com/science/article/pii/S2215016124001316]
- 25. Two-dimensional gel electrophoresis [https://grokipedia.com/page/Two-dimensional_gel_electrophoresis]
- 26. Difference Gel Electrophoresis - an overview [https://www.sciencedirect.com/topics/neuroscience/difference-gel-electrophoresis]
- 27. SDS-PAGE Electrophoresis Buffer Insightful Analysis [https://www.archivemarketresearch.com/reports/sds-page-electrophoresis-buffer-639442]
- 28. Detergent Screening With Hybrid Detergents Increases ... [https://pmc.ncbi.nlm.nih.gov/articles/PMC12329390/]
- 29. Drivers and Barriers to Growth 2025-2033 [https://www.datainsightsmarket.com/reports/sds-page-electrophoresis-543939]
- 30. SDS-PAGE Electrophoresis Market Size & Share 2025-2032 [https://www.360iresearch.com/library/intelligence/sds-page-electrophoresis]
- 31. PEPPI-MS protocols reveal chemical structure of cellular ... [https://www.sciencedaily.com/releases/2025/01/250127124455.htm]
- 32. Isoelectric focusing [https://grokipedia.com/page/Isoelectric_focusing]
- 33. SDS-PAGE Electrophoresis Market - Global Forecast 2025- ... [https://www.researchandmarkets.com/reports/6140756/sds-page-electrophoresis-market-global?srsltid=AfmBOopoZ9UJliDH1V82h637h7aIhui0NTTIqA1Bov8ufUWAyCPodXnM]
- 34. Whole gel processing procedure for GeLC-MS/MS based ... [https://proteomesci.biomedcentral.com/articles/10.1186/1477-5956-11-17]
- 35. Redefining Proteomics Standards via Isoelectric Focusing ... [https://eureka.patsnap.com/report-redefining-proteomics-standards-via-isoelectric-focusing-improvements]
- 36. Development and thorough evaluation of a multi-omics ... [https://www.sciencedirect.com/science/article/pii/S0039914024018241]
- 37. Isoelectric Prefractionation for Proteomics [https://www.chromatographyonline.com/view/isoelectric-prefractionation-proteomics]
- 38. 2D DIGE Proteomics Service [https://www.appliedbiomics.com/2d-dige/]
- 39. High-Efficiency Protein Extraction From Lupine Roots [https://pmc.ncbi.nlm.nih.gov/articles/PMC12514137/]
- 40. UNIT 10.4 Comparing Complex Protein Samples Using Two ... [https://pmc.ncbi.nlm.nih.gov/articles/PMC6579672/]
- 41. Protein “purity,” proteoforms, and the albuminome [https://www.frontiersin.org/journals/cell-and-developmental-biology/articles/10.3389/fcell.2024.1504098/full]
- 42. Increased proteome coverage by combining PAGE and ... [https://pmc.ncbi.nlm.nih.gov/articles/PMC4285200/]
- 43. Systematic Comparison of Fractionation Methods for In- ... [https://pmc.ncbi.nlm.nih.gov/articles/PMC3430803/]
- 44. Protein Gel 2D Electrophoresis Support—Getting Started [https://www.thermofisher.com/us/en/home/technical-resources/technical-reference-library/protein-electrophoresis-western-blotting-support-center/protein-gel-2d-electrophoresis-support/protein-gel-2d-electrophoresis-support-getting-started.html]
- 45. How to Identify and Correct Isoelectric Focusing Gel ... [https://eureka.patsnap.com/report-how-to-identify-and-correct-isoelectric-focusing-gel-anomalies]
- 46. SDS-PAGE: The science behind all those bubbles [https://www.antibodiesinc.com/pages/sds-page-demystified?srsltid=AfmBOopsTsxd4CIC-xtHg_M-u3ATZ43u8yXBL-S9lvkEibxXWl_l6M6b]
- 47. Rapid baseline hump-free analysis of therapeutic proteins ... [https://www.sciencedirect.com/science/article/pii/S0003267025005410]
- 48. Protein Gel 2D Electrophoresis Support—Troubleshooting [https://www.thermofisher.com/us/en/home/technical-resources/technical-reference-library/protein-electrophoresis-western-blotting-support-center/protein-gel-2d-electrophoresis-support/protein-gel-2d-electrophoresis-support-troubleshooting.html]
- 49. 2D Gel Electrophoresis — Buffers & Reagents [https://www.thermofisher.com/us/en/home/life-science/protein-biology/protein-gel-electrophoresis/protein-electrophoresis-buffers-reagents/2d-gel-electrophoresis-buffers-reagents.html]
- 50. Application of Separation technologies to Proteomics ... [https://www.sciencedirect.com/science/article/abs/pii/S0065323303010222]
- 51. Optimisation of the two-dimensional gel electrophoresis ... [https://proteomesci.biomedcentral.com/articles/10.1186/1477-5956-2-6]
- 52. Comparison of first dimension IPG and NEPHGE techniques ... [https://pmc.ncbi.nlm.nih.gov/articles/PMC3729415/]
- 53. Optimized sample preparation for two-dimensional gel ... [https://proteomesci.biomedcentral.com/articles/10.1186/1477-5956-7-38]
- 54. Optimization of 2-dimensional gel electrophoresis ... [https://www.spandidos-publications.com/10.3892/mmr.2013.1815]
- 55. SDS-PAGE: The science behind all those bubbles [https://www.antibodiesinc.com/pages/sds-page-demystified?srsltid=AfmBOooFh_MxDIzRJyLet0f0D6gjs9XK1Tr8qHpcGilnmkOPIaROD_KY]
- 56. Nucleic acid-lipid membrane interactions studied by DSC [https://pmc.ncbi.nlm.nih.gov/articles/PMC3053523/]
- 57. Reduction and Alkylation of Proteins in 2D Gel ... [https://pmc.ncbi.nlm.nih.gov/articles/PMC5559430/]
- 58. Reduction and alkylation of proteins in preparation of two- ... [https://pubmed.ncbi.nlm.nih.gov/11465505/]
- 59. Reduction of alkylation of proteins in preparation of two- ... [https://researchers.mq.edu.au/en/publications/reduction-of-alkylation-of-proteins-in-preparation-of-two-dimensi/]
- 60. Comparison and optimization of protein extraction and two ... [https://pmc.ncbi.nlm.nih.gov/articles/PMC7006083/]
- 61. Global detection of human variants and isoforms by deep ... [https://www.nature.com/articles/s41587-023-01714-x]
- 62. Understanding Isoelectric Focusing for Mono vs Polydisperse ... [https://eureka.patsnap.com/report-understanding-isoelectric-focusing-for-mono-vs-polydisperse-samples]
- 63. Proteomics—The State of the Field - PubMed Central - NIH [https://pmc.ncbi.nlm.nih.gov/articles/PMC11036260/]
- 64. /Protein Separations- Electrophoresis/Types of Gel... Proteomics [https://en.wikibooks.org/wiki/Proteomics/Protein_Separations-_Electrophoresis/Types_of_Gel_Electrophoresis]
- 65. Evaluation of Protocols Used in 2-D Electrophoresis for ... [https://pmc.ncbi.nlm.nih.gov/articles/PMC5054159/]
- 66. Reduction and Alkylation of Proteins in 2D Gel ... [https://www.frontiersin.org/journals/chemistry/articles/10.3389/fchem.2017.00059/full]
- 67. Two-dimensional gel electrophoresis - Wikipedia [https://en.wikipedia.org/wiki/Two-dimensional_gel_electrophoresis]
- 68. Evaluation of Protocols Used in 2-D Electrophoresis for ... [https://www.sciencedirect.com/science/article/pii/S1672022911600260]
- 69. Workflow of 2D Gel Electrophoresis Image Analysis [https://www.mtoz-biolabs.com/workflow-of-2d-gel-electrophoresis-image-analysis.html]