SDS-PAGE Master Guide: Principles, Protocol, and Troubleshooting for Precise Protein Separation
This comprehensive guide details the SDS-PAGE protocol for separating proteins by molecular weight, a foundational technique in molecular biology and biopharmaceutical development.
SDS-PAGE Master Guide: Principles, Protocol, and Troubleshooting for Precise Protein Separation
Abstract
This comprehensive guide details the SDS-PAGE protocol for separating proteins by molecular weight, a foundational technique in molecular biology and biopharmaceutical development. It covers core principles of protein denaturation and electrophoretic separation, provides a step-by-step methodological protocol, addresses common troubleshooting scenarios, and explores advanced applications and comparative technologies. Designed for researchers, scientists, and drug development professionals, this article synthesizes foundational knowledge with practical optimization strategies to ensure high-resolution, reproducible results in both research and quality control contexts.
The Science of SDS-PAGE: Unraveling How Proteins Separate by Size
Sodium Dodecyl Sulphate-Polyacrylamide Gel Electrophoresis (SDS-PAGE) is a foundational technique in biochemistry and molecular biology that enables researchers to separate proteins based almost exclusively on their molecular weight [1]. This method resolves protein mixtures into discrete bands, providing critical information for analyzing protein purity, composition, and size. The technique's ability to deliver precise, reproducible results has made it indispensable in research laboratories and essential for diagnostic applications, including western blotting for disease markers such as HIV [1] [2].
The development of SDS-PAGE represents a significant advancement in protein analytics. While initial work on polyacrylamide gel electrophoresis began in the 1960s, the breakthrough came in 1970 when Ulrich Laemmli refined the method by incorporating SDS, creating a system that dramatically improved the resolution of protein bands by ensuring separation occurred primarily according to molecular weight [2].
Core Principle of Molecular Weight-Based Separation
The fundamental principle of SDS-PAGE is that proteins are separated based solely on their molecular mass, independent of their native charge or three-dimensional structure [1]. This is achieved through a two-component system that standardizes protein physical properties before separation occurs.
Role of Sodium Dodecyl Sulphate (SDS)
SDS, an anionic detergent, serves two critical functions in the denaturation process:
- Protein Denaturation: SDS disrupts and unfolds the secondary, tertiary, and quaternary structures of proteins by breaking non-covalent bonds, converting them into linear polypeptide chains [1] [3].
- Charge Standardization: SDS binds to the polypeptide backbone in a constant ratio of approximately 1.4g SDS per 1.0g protein [1]. This binding imparts a uniform negative charge to all proteins proportional to their molecular mass, effectively masking the proteins' intrinsic electrical charges [2].
Polyacrylamide Gel as a Molecular Sieve
The polyacrylamide gel matrix creates a three-dimensional network with pores of defined sizes through which proteins migrate [1]. When an electric field is applied, the negatively charged SDS-protein complexes migrate toward the positive anode, with smaller proteins moving faster through the pores while larger proteins are retarded [2]. This molecular sieving effect results in the separation of polypeptides according to their molecular weights rather than their chemical properties [3].
Table 1: Key Components and Their Functions in SDS-PAGE
| Component | Function | Mechanism of Action |
|---|---|---|
| SDS (Sodium Dodecyl Sulphate) | Denatures proteins and standardizes charge | Binds to protein backbone, disrupting non-covalent bonds and imparting negative charge |
| Reducing Agents (β-mercaptoethanol/DTT) | Breaks disulfide bonds | Reduces covalent linkages between cysteine residues, ensuring complete denaturation |
| Polyacrylamide Gel | Acts as molecular sieve | Creates pore network that separates proteins based on size |
| Tris Buffers | Maintain pH environment | Provides optimal pH for electrophoresis and protein stability |
The Scientist's Toolkit: Essential Reagents and Materials
Successful SDS-PAGE requires precise preparation and quality reagents. The following components are essential for the procedure:
Table 2: Essential Research Reagent Solutions for SDS-PAGE
| Reagent/Solution | Composition/Preparation | Function |
|---|---|---|
| Acrylamide/Bis Solution | 30% acrylamide, 0.8% bis-acrylamide in water [3] | Forms the cross-linked gel matrix for protein separation |
| Separating Gel Buffer | 1.5M Tris-HCl, pH 8.8 [3] | Creates high pH environment for optimal separation |
| Stacking Gel Buffer | 1.0M Tris-HCl, pH 6.8 [3] | Creates lower pH for sample stacking before separation |
| Electrophoresis Buffer | 25mM Tris, 250mM glycine, 0.1% SDS, pH 8.3 [3] | Conducts current and maintains buffer conditions during run |
| SDS-PAGE Sample Buffer | Tris-HCl, SDS, glycerol, β-mercaptoethanol, bromophenol blue [4] | Denatures proteins, adds density for loading, provides tracking dye |
| Ammonium Persulfate (APS) | 10% solution in water [4] | Free radical source initiates acrylamide polymerization |
| TEMED | N,N,N',N'-Tetramethylethylenediamine [4] | Catalyst that accelerates acrylamide polymerization |
Experimental Protocol
Gel Preparation
Step 1: Assembling Glass Plates Clean glass plates thoroughly with warm detergent, rinse sequentially with tap water, deionized water, and ethanol [3]. Assemble the plates with spacer strips, ensuring edges are properly sealed to prevent leakage [3].
Step 2: Preparing the Separating Gel The separating gel concentration should be selected based on the molecular weight range of the target proteins, as detailed in Table 3. Combine components in the order listed, adding TEMED and ammonium persulfate last to initiate polymerization [4]. Pour the gel mixture immediately between the glass plates, leaving appropriate space for the stacking gel, and overlay with water-saturated butanol or isopropanol to create a flat interface [4] [5]. Allow complete polymerization for approximately 30-45 minutes [5].
Table 3: Optimal Acrylamide Concentrations for Protein Separation [4] [5]
| Acrylamide Concentration (%) | Effective Separation Range (kDa) | Applications |
|---|---|---|
| 8% | 25-200 | Large proteins and protein complexes |
| 10% | 15-100 | Standard mixture of proteins |
| 12.5% | 10-70 | Intermediate size range proteins |
| 15% | 12-45 | Smaller proteins and peptides |
Step 3: Preparing the Stacking Gel After polymerization of the separating gel, pour off the overlay solution and rinse the gel surface. Prepare the stacking gel solution (typically 4-5% acrylamide) [1], add polymerization initiators, and pour immediately over the separating gel. Insert the sample comb carefully to avoid air bubbles and allow to polymerize for 20-30 minutes [4].
Sample Preparation
Protein Denaturation Mix protein samples with SDS-PAGE sample buffer containing SDS and reducing agents [1]. The typical sample buffer composition includes Tris-HCl (pH 6.8), 2% SDS, 10% glycerol, 0.1% bromophenol blue, and 5% β-mercaptoethanol or DTT [3]. Heat samples at 95-100°C for 5 minutes to ensure complete denaturation [4]. Centrifuge briefly to collect condensation before loading.
Handling Difficult Samples For dilute protein samples or samples containing high salt concentrations, precipitate proteins first using trichloroacetic acid (TCA) [4]. Add TCA to a final concentration of 10%, incubate on ice for 20 minutes, then centrifuge. Wash the pellet with ice-cold ethanol, dry, and resuspend in SDS-PAGE sample buffer [4].
Electrophoresis
Setup and Loading Mount the polymerized gel in the electrophoresis chamber and fill with running buffer [1]. Carefully rinse wells with buffer to remove unpolymerized acrylamide. Load protein samples and molecular weight markers into the wells using a micropipette [4]. Include a prestained protein ladder in at least one well for molecular weight estimation.
Running Conditions Connect the chamber to the power supply with correct polarity (proteins migrate toward the positive anode) [4]. Run the gel at constant voltage: 80-100V through the stacking gel, then 120-150V through the separating gel until the dye front reaches the bottom [2] [4]. For standard mini-gels, running time is typically 60-90 minutes; for larger formats, 4-6 hours may be required [3].
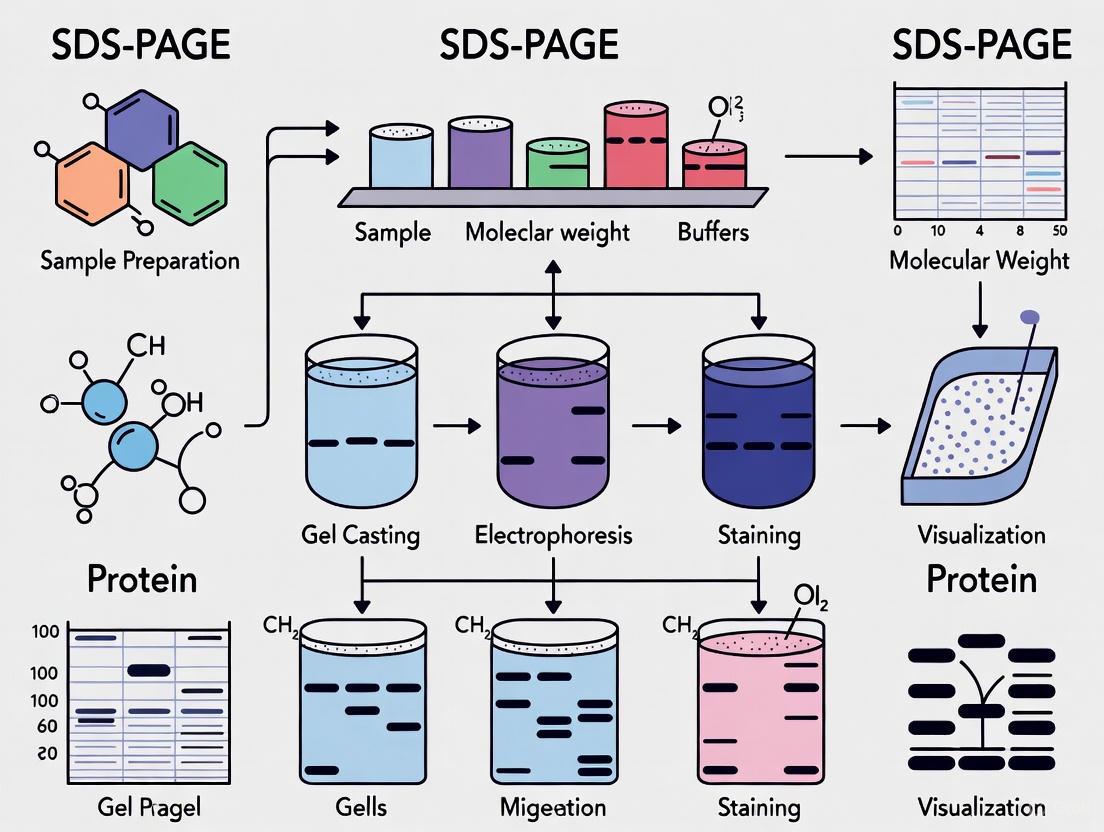
SDS-PAGE Experimental Workflow
Protein Visualization
Coomassie Staining After electrophoresis, carefully remove the gel from the plates and immerse in Coomassie Brilliant Blue staining solution (0.25% Coomassie in 40% ethanol, 10% acetic acid) [3] [4]. Stain with gentle agitation for 30 minutes to several hours. Destain with multiple changes of destaining solution (40% ethanol, 10% acetic acid) until protein bands are clear against a light background [4]. Adding a paper towel to the destaining solution can help absorb excess stain [4].
Alternative Staining Methods For increased sensitivity, silver staining can detect 2-5 ng of protein per band, approximately 50 times more sensitive than Coomassie staining [4]. Fluorescent stains offer broad dynamic range and are ideal for proteomics applications and quantification [2].
Data Analysis and Interpretation
Molecular Weight Determination
To estimate the molecular weight of unknown proteins, compare their migration distances to those of standard protein markers [1]. Create a semi-logarithmic plot of the log molecular weight versus migration distance for the standard proteins, which typically produces a linear relationship through which unknown molecular weights can be extrapolated [2].
Assessing Sample Purity
Homogeneous protein samples appear as single, sharp bands after staining, while heterogeneous samples or those containing contaminants show multiple bands [3]. The relative intensity of bands corresponds to protein abundance, with densitometric analysis enabling semi-quantitative comparisons [2].
Molecular Sieving Principle in SDS-PAGE
Advanced Applications and Modifications
Gradient Gels
Gradient gels containing a varying concentration of acrylamide (e.g., 5-20%) provide enhanced resolution for separating proteins across a wide molecular weight range in a single run [2]. The decreasing pore size creates a sieving effect that sharpens protein bands, particularly beneficial for complex samples.
Two-Dimensional Electrophoresis
Two-dimensional electrophoresis combines isoelectric focusing (separation by charge) with SDS-PAGE (separation by molecular weight), enabling the resolution of thousands of proteins in a single analysis [2]. This powerful technique is essential for proteomics research, biomarker discovery, and analysis of post-translational modifications [2].
Western Blotting
SDS-PAGE is frequently coupled with western blotting, where separated proteins are transferred to a membrane and probed with specific antibodies for targeted detection [1] [2]. This combination allows for identification of specific proteins within complex mixtures with high specificity.
Troubleshooting Common Issues
Table 4: Troubleshooting Guide for SDS-PAGE
| Problem | Potential Causes | Solutions |
|---|---|---|
| Smiling or frowning bands | Uneven heating, improper buffer composition, excessive voltage [2] | Ensure even current distribution, check buffer composition, reduce voltage |
| Poor resolution | Incorrect acrylamide percentage, insufficient run time, improper buffer pH [2] | Select appropriate gel percentage, allow complete run, verify buffer preparation |
| Diffuse bands | Incomplete denaturation, protein aggregation, sample overload [2] | Ensure proper heating with reducing agents, centrifuge samples before loading, reduce sample amount |
| Gel polymerization issues | Old reagents, oxygen inhibition, improper TEMED/APS amounts [2] | Use fresh ammonium persulfate, degas solutions, optimize catalyst concentrations |
Comparison with Alternative Techniques
SDS-PAGE vs. Native PAGE
While SDS-PAGE separates denatured proteins solely by molecular weight, Native PAGE maintains proteins in their folded, native state, with separation depending on a combination of size, shape, and intrinsic charge [1] [2]. Native PAGE preserves protein function and biological activity but provides less predictable migration behavior compared to SDS-PAGE.
Other Electrophoretic Techniques
Other protein separation methods include isoelectric focusing (IEF), which separates proteins based on their isoelectric points, and blue native PAGE (BN-PAGE), used for separating intact protein complexes under non-denaturing conditions [2]. Each technique offers unique advantages depending on the research objectives.
Sodium dodecyl sulfate-polyacrylamide gel electrophoresis (SDS-PAGE) represents a foundational methodology in biochemical research for separating proteins based on their molecular weight. The technique's resolution and reliability hinge critically on the action of sodium dodecyl sulfate (SDS), which transforms native proteins into linearized polypeptides with uniform charge characteristics [6] [7]. This application note delineates the molecular mechanisms by which SDS unfolds proteins and confers negative charge, details experimental protocols for effective implementation, and provides practical considerations for researchers employing this technique in drug development and basic research contexts. Within the broader thesis on SDS-PAGE protocol for protein separation, understanding SDS's fundamental role is paramount for proper experimental design and accurate interpretation of results.
Molecular Mechanisms of SDS-Protein Interactions
Protein Denaturation and Linearization
SDS operates as a strong anionic detergent that fundamentally disrupts the native structure of proteins. It effectively dismantles the secondary, tertiary, and quaternary structures of proteins by breaking non-covalent bonds, including hydrogen bonds and hydrophobic interactions [1] [7]. This denaturation process unfolds the compact three-dimensional structure of native proteins, converting them into linear polypeptide chains. The extent of denaturation is concentration-dependent, with unfolding beginning at SDS concentrations above 0.1 mM and most proteins becoming fully denatured above 1 mM [7]. For complete denaturation, samples are typically heated to 95°C for 5 minutes in the presence of SDS-containing buffer to ensure thorough linearization [8] [7].
Table 1: SDS Denaturation Conditions and Effects on Protein Structure
| SDS Concentration | Effect on Protein Structure | Experimental Outcome |
|---|---|---|
| >0.1 mM | Initiation of protein unfolding | Partial denaturation begins |
| >1 mM | Denaturation of most proteins | Loss of secondary/tertiary structure |
| 1-2% (w/v) | Complete denaturation and charge masking | Full linearization for accurate MW separation |
Charge Equilibration and SDS Binding
The binding of SDS to proteins represents a critical aspect of the technique's functionality. SDS molecules bind to the protein backbone via hydrophobic interactions at a relatively constant ratio of approximately 1.4 grams of SDS per 1 gram of protein [7]. This corresponds to approximately one SDS molecule per two amino acid residues in the polypeptide chain [7]. This uniform binding pattern confers a strong negative charge to the protein complex that is directly proportional to the polypeptide chain length [6] [1]. Consequently, the intrinsic charge of the native protein becomes negligible compared to the overwhelming negative charge contributed by SDS, resulting in a consistent charge-to-mass ratio across different protein species [7].
Molecular Dynamics of Unfolding
Recent molecular dynamics simulations have elucidated the microscopic mechanisms of SDS-induced protein unfolding. All-atom simulations conducted at boiling water temperature (373 K) with SDS concentrations of 110-165 mM revealed that SDS induces spontaneous protein unfolding on the microsecond timescale [9] [10]. The unfolding process occurs through two distinct mechanisms: (1) specific interactions of individual SDS molecules with protein structures that disrupt secondary elements, and (2) the formation of protein-SDS complexes in a fluid "necklace-and-beads" configuration where the protein wraps around dynamically changing SDS micelles [9]. The global conformation of the unfolded protein correlates with the number of SDS micelles bound, while the number of directly bound SDS molecules determines the relaxation time scale of the unfolded polypeptide [9] [10].
Figure 1: Molecular Mechanism of SDS-Induced Protein Unfolding. The process involves initial SDS monomer binding, protein linearization, and final complex formation with SDS micelles.
Experimental Protocols for SDS-PAGE
Sample Preparation Protocol
Proper sample preparation is critical for successful protein separation by SDS-PAGE. The following detailed protocol ensures complete protein denaturation and reduction:
Prepare Sample Buffer: Use 2X Laemmli sample buffer containing 4% SDS, 10% glycerol, 0.125 M Tris-HCl (pH 6.8), and 0.002% bromophenol blue [6] [8].
Add Reducing Agent: Incorporate β-mercaptoethanol (BME) to a final concentration of 0.55 M (1 μL stock BME per 25 μL lysate) or dithiothreitol (DTT) to 10-100 mM final concentration [8] [7]. These reducing agents cleave disulfide bonds critical for proper folding [6] [1].
Mix Samples: Combine protein sample with an equal volume of 2X sample buffer containing reducing agent [8]. Mix thoroughly by flicking the tube or pipetting [6].
Denature Proteins: Heat samples at 95°C for 5 minutes in a heat block or water bath [8] [7]. Alternative protocol: 70°C for 10 minutes [7].
Clarify Samples: Centrifuge at 15,000 rpm for 1-3 minutes at 4°C to pellet any debris [6] [8]. Use the supernatant for SDS-PAGE.
Gel Electrophoresis Procedure
The discontinuous gel electrophoresis system provides superior resolution for protein separation:
- Gel Selection: Choose appropriate acrylamide concentration based on target protein size (Table 2) [6] [8].
Table 2: Polyacrylamide Gel Concentration Guidelines for Optimal Separation
| Acrylamide Concentration | Effective Separation Range | Application Notes |
|---|---|---|
| 6-8% | 50-200 kDa | Suitable for large proteins |
| 10% | 30-100 kDa | Standard separation range |
| 12-15% | 10-60 kDa | Optimal for small proteins |
| 4-20% gradient | 10-200 kDa | Extended separation range |
Electrophoresis Setup:
Post-Electrophoresis Analysis:
Figure 2: SDS-PAGE Experimental Workflow. Key steps include sample denaturation, gel electrophoresis, and post-separation analysis.
The Scientist's Toolkit: Essential Research Reagents
Successful execution of SDS-PAGE requires specific reagents, each performing critical functions in the separation process:
Table 3: Essential Reagents for SDS-PAGE Experimentation
| Reagent | Function | Working Concentration |
|---|---|---|
| SDS (Sodium Dodecyl Sulfate) | Denatures proteins and confers uniform negative charge [6] [7] | 0.1-0.5% in buffer; 1-2% in sample buffer |
| Acrylamide/Bis-acrylamide | Forms polyacrylamide gel matrix that acts as molecular sieve [6] [7] | 5-15% depending on target protein size |
| TEMED and APS | Catalyzes acrylamide polymerization (TEMED) and initiates free radical formation (APS) [1] [7] | 0.1% TEMED; 0.1-0.5% APS |
| Tris-Glycine Buffer | Provides conducting medium and maintains pH during electrophoresis [6] [7] | 25 mM Tris, 192 mM glycine, 0.1% SDS |
| β-Mercaptoethanol or DTT | Reducing agent that breaks disulfide bonds [1] [8] | 0.55 M BME or 10-100 mM DTT |
| Molecular Weight Markers | Proteins of known size for molecular weight estimation [12] [11] | Varies by manufacturer |
Technical Considerations and Limitations
While SDS-PAGE provides robust protein separation for most applications, researchers should be aware of several technical considerations. Proteins with extensive post-translational modifications, particularly glycosylation, may exhibit anomalous migration due to altered SDS binding capacity [12]. Similarly, membrane proteins with substantial hydrophobic domains or proteins with extreme pI values may not bind SDS in the typical 1.4:1 ratio, leading to deviations in expected mobility [8] [7]. The apparent molecular weight determined by SDS-PAGE typically has an accuracy of ±10% when compared to known standards [12] [7]. For proteins with known deviations from typical SDS binding, complementary methods such as mass spectrometry should be employed for precise molecular weight determination [12].
The critical micelle concentration of SDS (7-10 mM in aqueous solutions) represents another important consideration, as only SDS monomers bind to proteins while micelles remain anionic on the outside and do not adsorb protein [7]. At typical working concentrations of 0.1-0.5% in running buffer (approximately 3.5-17 mM), SDS occurs as both monomers and micelles, ensuring a continuous supply of SDS monomers for protein binding during electrophoresis [7].
Advanced Applications in Research and Drug Development
The fundamental principles of SDS-protein interactions extend beyond basic molecular weight determination to numerous advanced applications. In western blotting, the uniform negative charge imparted by SDS enables efficient protein transfer from gels to membranes for subsequent antibody probing [1] [11]. The denaturing conditions of SDS-PAGE make it indispensable for studying post-translational modifications, where shifts in apparent molecular weight can indicate phosphorylation, glycosylation, or ubiquitination [1]. In drug development contexts, SDS-PAGE provides critical quality control for recombinant protein therapeutics by verifying molecular weight and assessing sample purity [12] [13]. Recent innovations have explored SDS-unfolded proteins for nanopore protein sequencing, where the linearized polypeptide chains translocate through nanopores for amino acid sequence determination [9] [10].
The role of SDS in unfolding proteins and imparting uniform negative charge remains the cornerstone of reliable protein separation by molecular weight. Through its dual mechanisms of protein denaturation and charge equilibration, SDS enables researchers to separate complex protein mixtures with consistent reproducibility. The detailed protocols and technical considerations outlined in this application note provide researchers with the foundational knowledge to implement SDS-PAGE effectively in diverse research settings. As protein analysis continues to evolve in pharmaceutical and academic contexts, understanding these fundamental principles ensures proper experimental design and accurate interpretation of results, forming an essential component of the broader thesis on SDS-PAGE methodology for protein separation.
In the realm of protein biochemistry, the polyacrylamide gel matrix stands as a fundamental tool for achieving high-resolution separation of complex protein mixtures. This matrix serves as the core component of Sodium Dodecyl Sulfate-Polyacrylamide Gel Electrophoresis (SDS-PAGE), a technique that has become indispensable in molecular biology and biotechnology laboratories worldwide [1]. The gel functions as a molecular sieve, enabling the separation of proteins primarily based on their molecular weight by creating a porous network through which proteins migrate under the influence of an electric field [14]. The development of SDS-PAGE in 1970 by Ulrich Laemmli, who incorporated the anionic detergent SDS into a discontinuous gel electrophoresis system, significantly improved the resolution of protein separation and revolutionized protein analysis [2]. This system remains a cornerstone technique in modern research, particularly valued for its reproducibility, versatility, and ability to provide reliable protein characterization.
The significance of the polyacrylamide gel matrix extends beyond mere separation; it provides the structural framework that permits precise discrimination between proteins of subtly different sizes. When combined with SDS, which denatures proteins and confers a uniform negative charge, the polyacrylamide gel matrix ensures that separation occurs almost exclusively based on polypeptide chain length rather than native charge or protein shape [6]. This powerful combination has established SDS-PAGE as an essential methodology for various applications, including protein purity assessment, molecular weight estimation, subunit composition analysis, and as a prerequisite technique for western blotting and mass spectrometry [2] [14] [15].
Principles of Molecular Sieving in Polyacrylamide Gels
Gel Composition and Pore Formation
The molecular sieving properties of polyacrylamide gels originate from their precise chemical composition and polymerization process. The gel matrix is formed through the copolymerization of acrylamide monomers and a cross-linking agent, most commonly N,N'-methylenebisacrylamide (Bis) [15]. This polymerization reaction, typically initiated by ammonium persulfate (APS) and catalyzed by N,N,N',N'-tetramethylethylenediamine (TEMED), creates a three-dimensional mesh-like network with pores of defined sizes [14] [7]. The relative concentrations of acrylamide and bisacrylamide determine the porosity of the resulting gel, which directly governs its sieving properties and separation capabilities [14].
The pore size within the gel matrix is inversely proportional to the total acrylamide concentration, allowing researchers to tailor the gel composition to separate proteins within specific molecular weight ranges [15]. This tunable porosity is fundamental to the gel's function as a molecular sieve, as it creates a path through which smaller proteins can navigate more easily than larger ones [1]. When an electric field is applied, SDS-coated proteins with uniform charge-to-mass ratios migrate toward the anode, with their movement impeded by the gel matrix in a size-dependent manner [2] [14]. Smaller proteins experience less resistance and migrate faster through the pores, while larger proteins encounter greater frictional forces and migrate more slowly, resulting in distinct separation based on molecular size [14].
Table 1: Relationship Between Gel Percentage and Effective Separation Range
| Acrylamide Concentration (%) | Effective Separation Range (kDa) | Optimal For Proteins |
|---|---|---|
| 6-8% | 50-250 | High molecular weight |
| 10% | 15-100 | Medium molecular weight |
| 12-15% | 5-60 | Low molecular weight |
| 5-20% (Gradient) | 5-250 | Broad molecular weight range |
The Discontinuous Buffer System
SDS-PAGE employs a sophisticated discontinuous buffer system that significantly enhances separation resolution compared to continuous systems [15]. This system utilizes two distinct gel layers with different pore sizes, pH values, and ionic compositions: the stacking gel and the separating (or resolving) gel [14]. The stacking gel, with a lower acrylamide concentration (typically 4-5%) and pH (approximately 6.8), serves to concentrate the protein samples into sharp, narrow bands before they enter the separating gel [1] [14]. This concentration occurs due to differential migration velocities of ions in the discontinuous buffer system, creating a boundary that compresses the protein into thin zones [7].
The separating gel contains a higher acrylamide concentration (typically 7.5-20%) and operates at a higher pH (approximately 8.8) [14]. When proteins transition from the stacking gel to the separating gel, they encounter both a change in pH and a decrease in pore size [15]. The increased pH alters the electrophoretic mobility of glycine ions in the running buffer, which then overtake the proteins and eliminate the stacking effect [7]. As the now-unstacked proteins enter the finer pores of the separating gel, their migration becomes governed solely by molecular sieving, where size-dependent separation occurs [14]. This two-stage process of initial concentration followed by resolution is critical for achieving the high level of separation that makes SDS-PAGE so valuable for protein analysis.
Diagram 1: SDS-PAGE Workflow - Visualization of the protein separation process in discontinuous gel electrophoresis.
Research Reagent Solutions: Essential Materials for SDS-PAGE
Successful execution of SDS-PAGE requires precise preparation and utilization of specific reagents, each serving a critical function in the separation process. The following table catalogues the essential materials and their roles in the SDS-PAGE methodology.
Table 2: Essential Research Reagents for SDS-PAGE
| Reagent/Chemical | Function/Purpose | Critical Specifications |
|---|---|---|
| Acrylamide/Bis-acrylamide | Forms the porous gel matrix; bisacrylamide acts as a crosslinker [14] | Ratio typically 37.5:1 or 29:1 (acrylamide:bis); concentration determines pore size |
| SDS (Sodium Dodecyl Sulfate) | Anionic detergent that denatures proteins and confers uniform negative charge [1] [2] | Binds at ~1.4g per 1g protein; masks intrinsic charge; ensures separation by size only |
| TEMED | Catalyst that accelerates polymerization of acrylamide gel [7] | Used with APS to initiate free radical polymerization; concentration affects gelation time |
| Ammonium Persulfate (APS) | Free radical initiator for acrylamide polymerization [14] | Fresh preparation recommended; decomposes in aqueous solution |
| Tris-HCl Buffer | Maintains pH during electrophoresis; different concentrations for stacking and separating gels [14] | Stacking gel: pH ~6.8; Separating gel: pH ~8.8 |
| Glycine | Component of running buffer; migrates behind proteins in stacking gel, then overtakes in separating gel [7] | Zwitterionic nature crucial for discontinuous buffer system |
| β-mercaptoethanol or DTT | Reducing agent that breaks disulfide bonds [1] [14] | Ensures complete protein denaturation and linearization |
| Coomassie Brilliant Blue | Protein stain for visualization post-electrophoresis [1] | Binds nonspecifically to proteins; detects ~100ng protein |
| Molecular Weight Markers | Prestained or unstained proteins of known size for molecular weight calibration [14] | Enables estimation of unknown protein sizes |
Detailed SDS-PAGE Protocol
Gel Preparation and Casting
The preparation of polyacrylamide gels requires precision and careful handling to ensure reproducible results. The process involves creating two distinct gel layers within a sealed glass plate cassette.
Separating Gel Preparation:
- Assemble Glass Plates: Clean glass plates thoroughly with ethanol and assemble the gel casting cassette using spacers to define gel thickness (typically 0.75mm or 1.5mm) [6].
- Mix Separating Gel Solution: Combine appropriate volumes of acrylamide/bis-acrylamide solution, Tris-HCl buffer (pH 8.8), SDS, and deionized water in a flask. The acrylamide concentration should be selected based on the target protein size range (refer to Table 1) [16] [14].
- Initiate Polymerization: Add ammonium persulfate (APS) and TEMED to the solution, mix gently to avoid introducing air bubbles, and immediately pour the solution between the glass plates, leaving space for the stacking gel [7].
- Overlay with Solvent: Carefully layer a small amount of water-saturated butanol or isopropanol over the gel solution to exclude oxygen and create a flat meniscus. Allow polymerization to proceed for 20-30 minutes [7].
- Remove Overlay: After polymerization is complete, pour off the overlay solution and rinse the top of the gel with deionized water to remove any unpolymerized acrylamide [6].
Stacking Gel Preparation:
- Prepare Stacking Gel Solution: Mix acrylamide/bis-acrylamide (typically 4-5%), Tris-HCl buffer (pH 6.8), SDS, and deionized water [14].
- Complete Gel Assembly: Add APS and TEMED to the stacking gel solution, pour over the polymerized separating gel, and immediately insert a clean sample comb without introducing air bubbles. Allow to polymerize for 20-30 minutes [6].
- Final Preparation: Once polymerized, carefully remove the comb and rinse wells with running buffer to remove any unpolymerized acrylamide and gel debris [6].
Table 3: Standard Gel Formulations for Different Protein Size Ranges
| Component | 15% Separating Gel (10 mL) | 10% Separating Gel (10 mL) | Stacking Gel (5 mL) |
|---|---|---|---|
| Acrylamide (30%) | 5.0 mL | 3.3 mL | 0.83 mL |
| Tris-HCl (1.5M, pH 8.8) | 2.5 mL | 2.5 mL | - |
| Tris-HCl (0.5M, pH 6.8) | - | - | 1.25 mL |
| 10% SDS | 100 µL | 100 µL | 50 µL |
| Deionized Water | 2.3 mL | 4.0 mL | 2.8 mL |
| 10% APS | 100 µL | 100 µL | 50 µL |
| TEMED | 10 µL | 10 µL | 10 µL |
| Effective Range | 5-60 kDa | 15-100 kDa | N/A |
Sample Preparation and Electrophoresis
Proper sample preparation is critical for achieving accurate separation in SDS-PAGE, as incomplete denaturation can lead to aberrant migration.
Sample Preparation Protocol:
- Combine with Sample Buffer: Mix protein sample with 2X or 5X SDS-PAGE sample buffer containing Tris-HCl, SDS, glycerol, bromophenol blue, and a reducing agent (β-mercaptoethanol or DTT) [2] [14]. Typical ratio is 1:1 for 2X buffer.
- Denature Proteins: Heat samples at 95-100°C for 5 minutes in a heat block to ensure complete denaturation [7]. For temperature-sensitive proteins, 70°C for 10 minutes may be used as an alternative [7].
- Brief Centrifugation: Centrifuge heated samples at 15,000 rpm for 1 minute to collect condensation and any insoluble material [6].
Electrophoresis Execution:
- Assemble Apparatus: Place the polymerized gel in the electrophoresis chamber and fill both upper and lower chambers with running buffer (typically Tris-glycine-SDS buffer) [1] [14].
- Load Samples: Carefully load prepared protein samples and molecular weight markers into wells using a micropipette [6]. Include appropriate positive controls and molecular weight standards.
- Apply Electric Field: Connect the chamber to a power supply and run at constant voltage. For mini-gels, 80-100 V through the stacking gel and 120-150 V through the separating gel is typical [2]. Run until the bromophenol blue tracking dye reaches the bottom of the gel (approximately 1-1.5 hours) [1].
- Terminate Electrophoresis: Turn off power supply once separation is complete. Proceed to protein visualization or transfer for western blotting.
Advanced Applications and Modifications
Gradient Gels and Two-Dimensional Electrophoresis
For complex protein mixtures or samples containing proteins with widely varying molecular weights, gradient gels provide superior resolution across a broad size range [2]. These gels contain an increasing concentration of acrylamide from top to bottom (typically 5-20% gradients), creating a pore size gradient that simultaneously resolves both high and low molecular weight proteins [15]. As proteins migrate through gradient gels, they progressively encounter smaller pores, causing each protein to migrate until it reaches a pore size that restricts further movement, resulting in sharp, well-defined bands across the entire molecular weight spectrum [2].
For even higher resolution analysis of complex protein samples, two-dimensional electrophoresis combines isoelectric focusing (IEF) with SDS-PAGE [17]. In this technique, proteins are first separated based on their isoelectric point in a pH gradient, then subsequently separated by molecular weight in the second dimension using SDS-PAGE [2]. This orthogonal separation approach can resolve thousands of protein isoforms in a single gel, making it particularly valuable for proteomic studies, analysis of post-translational modifications, and biomarker discovery [2].
Troubleshooting Common Issues
Even with careful execution, various issues can arise during SDS-PAGE that affect result quality. The following flowchart outlines common problems and their solutions.
Diagram 2: SDS-PAGE Troubleshooting Guide - Diagnostic flowchart for common electrophoresis issues.
The polyacrylamide gel matrix remains an indispensable tool in modern biological research, providing the molecular sieving properties necessary for high-resolution protein separation by size. Through its tunable porosity, customizable composition, and compatibility with denaturing agents like SDS, this matrix enables precise characterization of protein samples across diverse applications from basic research to clinical diagnostics. The well-established protocols for gel preparation, sample processing, and electrophoresis continue to make SDS-PAGE an accessible yet powerful technique for researchers studying protein structure, function, and expression.
While emerging technologies like capillary electrophoresis offer advantages in automation and quantification, the visual clarity, simplicity, and cost-effectiveness of traditional SDS-PAGE ensure its continued relevance in laboratory workflows [18]. Furthermore, the integration of SDS-PAGE with downstream applications such as western blotting, mass spectrometry, and protein sequencing underscores its foundational role in comprehensive protein analysis pipelines [1] [14]. As protein science advances, the polyacrylamide gel matrix will undoubtedly continue to serve as a critical platform for separation and analysis, adapting to new research needs while maintaining its core principle of molecular sieving for size-based separation.
Sodium Dodecyl Sulfate-Polyacrylamide Gel Electrophoresis (SDS-PAGE) is a foundational technique in biochemistry and molecular biology for separating proteins based on their molecular weight [7] [15]. The robustness and reproducibility of this method stem from three core components that work in concert: the anionic detergent SDS, reducing agents, and a discontinuous buffer system. Together, these elements denature proteins, mask their intrinsic charges, and orchestrate their migration through a polyacrylamide gel matrix under an electric field, enabling precise separation by size [19] [20]. This application note details the principles, protocols, and practical considerations for employing these key components effectively within the context of protein separation research for drug development and other scientific applications.
Core Principles and Components
The efficacy of SDS-PAGE relies on the specific functions of its core components, which together ensure that protein migration is dependent solely on polypeptide chain length.
Sodium Dodecyl Sulfate (SDS)
SDS is an anionic detergent that serves two critical functions in protein denaturation. Firstly, it disrupts nearly all non-covalent interactions—including hydrogen bonds, hydrophobic interactions, and ionic bonds—thereby unraveling the secondary and tertiary structures of proteins [15] [20]. Secondly, SDS binds uniformly to the unfolded polypeptide chains at an approximate ratio of 1.4 g of SDS per 1 g of protein [19] [7] [15]. This extensive binding confers a uniform negative charge density along the protein backbone, effectively masking the proteins' intrinsic charges [19]. The resulting SDS-protein complexes are linear molecules, all with similar charge-to-mass ratios, ensuring that their electrophoretic mobility is determined primarily by molecular size [19].
Reducing Agents
To achieve complete denaturation and linearization, reducing agents are essential for cleaving disulfide bonds, which are covalent linkages that stabilize tertiary and quaternary structures. Common reducing agents include:
- β-Mercaptoethanol (β-ME) at concentrations of 4-5% [20] or Dithiothreitol (DTT) at 10-100 mM [7]. These compounds break disulfide bridges, ensuring that multi-subunit proteins are dissociated into their individual polypeptides [15] [21]. The inclusion of a reducing agent is a critical step, as without it, proteins may not fully unfold, leading to anomalous migration and inaccurate molecular weight estimation [20].
The Discontinuous Buffer System
The discontinuous (or disc) buffer system, pioneered by Laemmli, is a key innovation that sharpens protein bands at the start of electrophoresis, greatly enhancing resolution [19] [7]. This system employs buffers of different pH and composition in the stacking gel, separating gel, and electrode chambers.
The mechanism hinges on the differential mobility of ions. In the stacking gel (pH ~6.8), the glycine ions from the Tris-glycine running buffer exist predominantly in a zwitterionic state, migrating slowly [19] [20]. Chloride ions (Cl⁻) from Tris-HCl move rapidly, while the SDS-coated proteins possess an intermediate mobility. This setup creates a narrow, high-voltage gradient zone that forces all protein species to focus into a sharp band before they enter the separating gel [19]. Upon reaching the separating gel (pH ~8.8), the glycine ions become predominantly negatively charged, overtake the proteins, and leave them to separate by molecular weight as they migrate through the sieving matrix of the polyacrylamide gel [19] [20].
Table 1: Composition of the Discontinuous Buffer System
| Component | Buffer & pH | Key Ions & Their Role | Gel Pore Size |
|---|---|---|---|
| Stacking Gel | Tris-HCl, pH ~6.8 [19] [20] | Cl⁻ (leading ion), glycine (trailing ion) [19] | Large pores, no sieving [19] |
| Separating Gel | Tris-HCl, pH ~8.8 [19] [20] | Glycine now mobile; proteins separate by size [19] | Small pores, molecular sieving [19] [15] |
| Running Buffer | Tris-glycine, pH ~8.3 [7] [20] | Provides glycine and completes circuit [19] | N/A |
The following workflow diagram illustrates the process of protein separation using SDS-PAGE, from sample preparation to final analysis:
Diagram 1: SDS-PAGE Experimental Workflow
Detailed Protocols and Methodologies
Sample Preparation Protocol
Proper sample preparation is critical for successful protein separation.
- Sample Dilution: Mix the protein sample with an equal volume of 2X SDS-PAGE sample loading buffer. A typical 2X loading buffer contains:
- SDS: 2-4% (w/v) for denaturation and charge masking [8] [20].
- Reducing Agent: 5% β-mercaptoethanol or 100 mM DTT to reduce disulfide bonds [8] [21].
- Glycerol: 10% (v/v) to add density for gel loading [20] [21].
- Bromophenol Blue: A tracking dye to monitor electrophoresis progress [20] [21].
- Tris-HCl Buffer: ~62.5 mM, pH ~6.8 [20].
- Denaturation: Heat the mixture at 95°C for 5 minutes (or 70°C for 10 minutes) to ensure complete denaturation and disruption of protein complexes [7] [8].
- Clarification: Centrifuge the heated samples briefly (e.g., 3 minutes in a microcentrifuge) to pellet any insoluble debris [8].
- Loading: Load the supernatant into the wells of the polyacrylamide gel. For a standard mini-gel, loading volumes typically range from 5–35 µL per lane [8].
Gel Preparation and Electrophoresis
Polyacrylamide gels are formed by the polymerization of acrylamide and a cross-linker, N,N'-methylenebisacrylamide (Bis), catalyzed by ammonium persulfate (APS) and TEMED [7] [15]. The gel percentage must be chosen based on the target protein's size.
Table 2: Recommended Acrylamide Concentrations for Target Protein Sizes
| Acrylamide Concentration (%) | Effective Separation Range (kDa) | Application Notes |
|---|---|---|
| 5% | 100 - 500 [8] | For very high molecular weight proteins |
| 7.5% | 50 - 250 [19] | Broad range separation |
| 10% | 20 - 300 [19] | Standard range for many proteins |
| 12% | 10 - 200 [19] | Standard range for many proteins |
| 15% | 3 - 100 [19] | For low molecular weight proteins and peptides |
Gel Casting and Running Procedure:
- Assemble the gel cassette according to the manufacturer's instructions.
- Prepare the separating gel by mixing components as detailed in the table below. Pour the solution into the cassette, leaving space for the stacking gel. Layer with isopropanol or water to create a flat interface and wait for polymerization (~30 minutes) [20].
- Prepare the stacking gel after discarding the sealing layer. Pour it on top of the polymerized separating gel and immediately insert a sample comb. Allow it to polymerize fully (~30 minutes) [20].
- Assemble the electrophoresis unit and fill the inner and outer chambers with 1X running buffer (e.g., Tris-glycine with 0.1% SDS) [8] [20].
- Load prepared samples and molecular weight standards into the wells.
- Run the gel by applying a constant voltage: 60-80V through the stacking gel, then increase to 120-200V for the separating gel. Run until the dye front reaches the bottom [8] [21].
- Post-processing: After electrophoresis, proteins can be visualized by staining (e.g., Coomassie Blue, silver stain) or transferred to a membrane for western blotting [21].
Table 3: Example Gel Formulations for Discontinuous SDS-PAGE
| Reagent | 10% Separating Gel (20 mL) | 15% Separating Gel (20 mL) | 3% Stacking Gel (10 mL) |
|---|---|---|---|
| 30% Acrylamide-Bis Solution | 6.66 mL [20] | 10 mL [20] | 1 mL [20] |
| Separating Gel Buffer (Tris-HCl, pH 8.8) | 2.5 mL [20] | 2.5 mL [20] | - |
| Stacking Gel Buffer (Tris-HCl, pH 6.8) | - | - | 1.25 mL [20] |
| 10% SDS | 0.2 mL [20] | 0.2 mL [20] | 0.1 mL [20] |
| Deionized Water | 8.54 mL [20] | 5.2 mL [20] | 5.6 mL [20] |
| 10% Ammonium Persulfate (APS) | 0.1 mL [20] | 0.1 mL [20] | 0.05 mL [20] |
| TEMED | 2 µL [20] | 2 µL [20] | 2 µL [20] |
The Scientist's Toolkit: Essential Research Reagents
The following table catalogs the essential materials required for executing a successful SDS-PAGE experiment.
Table 4: Essential Reagents for SDS-PAGE
| Reagent/Material | Function & Role in the Protocol |
|---|---|
| Sodium Dodecyl Sulfate (SDS) | Anionic detergent; denatures proteins and confers uniform negative charge [19] [15]. |
| Reducing Agents (DTT, β-ME) | Cleaves disulfide bonds to fully linearize proteins [15] [20]. |
| Acrylamide / Bis-Acrylamide | Monomer and cross-linker that polymerize to form the sieving gel matrix [7] [15]. |
| Tris Buffers | Provides the buffering environment at different pHs (6.8 and 8.8) for the discontinuous system [19] [20]. |
| Glycine | Component of the running buffer; its charge-state change is key to the stacking effect [19] [7]. |
| Ammonium Persulfate (APS) & TEMED | Catalyst and stabilizer for the free-radical polymerization of acrylamide [7] [20]. |
| Molecular Weight Markers | Pre-stained or unstained proteins of known sizes for estimating sample protein molecular weights [8] [21]. |
The precise interplay of SDS, reducing agents, and the discontinuous buffer system is what makes SDS-PAGE a uniquely powerful and enduring technique for protein analysis. Mastery of these components—understanding their specific roles, optimal concentrations, and handling protocols—is fundamental for obtaining reliable, high-resolution separation of proteins by molecular weight. This knowledge forms the bedrock for countless downstream applications in research and drug development, from western blotting and protein purification to expression profiling and purity assessment.
The Laemmli system of sodium dodecyl sulfate–polyacrylamide gel electrophoresis (SDS-PAGE) represents a foundational methodology in biochemical research, enabling precise protein separation by molecular weight. This discontinuous electrophoretic system, developed by Ulrich K. Laemmli, employs a sophisticated buffer and pH configuration to concentrate protein samples before separation, significantly enhancing resolution. Within the context of molecular weight determination for drug development and basic research, understanding the distinct yet complementary functions of the stacking and resolving gel components remains critical for experimental success. This application note delineates the theoretical principles underpinning the Laemmli system, provides detailed protocols for its implementation, and discusses key considerations for researchers employing this technique in protein characterization.
SDS-PAGE is an indispensable technique that allows protein separation by molecular mass, typically in the range of 5 to 250 kDa [7]. The method relies on the anionic detergent sodium dodecyl sulfate (SDS), which binds to proteins at approximately 1.4 grams SDS per gram of protein, effectively masking their intrinsic charge and conferring a uniform negative charge density [7]. This process, combined with protein denaturation, ensures that separation occurs primarily based on molecular size rather than charge or structural characteristics. The Laemmli system, introduced in 1970, implements a discontinuous buffer system that significantly improves resolution compared to continuous electrophoresis methods. This system's elegant exploitation of differences in pore size, ionic strength, and pH values between gel regions enables the precise analysis of complex protein mixtures, making it the standard approach for protein separation in most molecular biology and biochemistry laboratories [7] [22].
Theoretical Framework: The Discontinuous System
Principles of Operation
The hallmark of the Laemmli system is its discontinuous nature, employing different buffer compositions and pH levels in the stacking versus resolving gel regions. This configuration creates a dramatic stacking effect at the interface between the two gels, resulting in the concentration of protein samples into extremely sharp bands before they enter the separating gel. The system operates through the strategic use of three ions: chloride (Cl⁻) from the gel buffer, glycine (Gly⁻) from the running buffer, and the common Tris⁺ cation present throughout the system [22]. During electrophoresis, the highly mobile chloride ions migrate rapidly toward the anode, forming the "leading" ion front. The glycine ions, which exist in a zwitterionic form with a net charge that varies with pH, initially migrate more slowly as the "trailing" ions. The proteins, with their intermediate mobility under the stacking gel conditions, become compressed between these two ion fronts, resulting in the concentration of dilute protein samples into sharp, well-defined zones.
The Role of pH in Ion Mobility
The discontinuous pH environment is fundamental to the stacking phenomenon. The stacking gel typically maintains a neutral pH (approximately pH 6.8), while the separating gel operates at a basic pH (approximately pH 8.8) [7]. At the neutral pH of the stacking gel, glycine molecules predominantly exist as zwitterions with a net charge接近 zero, resulting in low electrophoretic mobility. In contrast, upon reaching the basic pH of the separating gel, glycine molecules lose positive charges and become predominantly anionic, significantly increasing their mobility. This transition causes the former trailing ions (glycinate) to overtake the proteins, eliminating the stacking effect and allowing molecular sieving to become the dominant separation mechanism in the resolving gel [7].
Visualization of the Stacking Mechanism
The following diagram illustrates the stepwise process of protein stacking and separation in the Laemmli system:
Materials and Reagent Solutions
Research Reagent Solutions
The following table details essential reagents required for implementing the Laemmli SDS-PAGE system, along with their specific functions in the electrophoretic process:
| Reagent | Composition/Concentration | Function in Laemmli System |
|---|---|---|
| Acrylamide/Bis-acrylamide | 30% (w/w), typically 37.5:1 or 29:1 ratio | Forms polyacrylamide gel matrix; concentration determines pore size for molecular sieving [23] [5] |
| Tris-HCl Buffers | 1.5 M pH 8.8 (resolving), 0.5 M pH 6.8 (stacking) | Establishes pH discontinuity; primary buffer component for both gel types [23] |
| SDS (Sodium Dodecyl Sulfate) | 10-20% (w/v) stock solution, 0.1% in gels | Denatures proteins and confers uniform negative charge; critical for separation by size [7] |
| Ammonium Persulfate (APS) | 10% (w/v) aqueous solution | Free radical initiator for acrylamide polymerization [23] |
| TEMED | N,N,N',N'-Tetramethylethylenediamine | Catalyzes polymerization by generating free radicals from APS [23] |
| Glycine | 0.96 M in 5X running buffer | Trailing ion in stacking gel; mobility changes with pH transition [23] [22] |
| Sample Buffer | Tris-HCl, glycerol, SDS, bromophenol blue, ß-mercaptoethanol or DTT | Denatures proteins, provides density for loading, and visual tracking [23] |
Gel Percentage Selection Guide
The appropriate acrylamide concentration in the resolving gel must be selected based on the molecular weights of the target proteins, as detailed in the following table:
| Protein Size Range (kDa) | Recommended Acrylamide Percentage | Separation Characteristics |
|---|---|---|
| 4-40 | 20% | Optimal for very low molecular weight proteins and peptides |
| 12-45 | 15% | High resolution for small to medium proteins |
| 10-70 | 12.5% | Broad range for routine applications |
| 15-100 | 10% | Standard range for most research applications |
| 25-200 | 8% | Suitable for high molecular weight proteins [5] |
For proteins falling outside these standard ranges, gradient gels (e.g., 4-20% acrylamide) provide an extended separation range and are particularly valuable for complex samples with diverse molecular weights [7].
Experimental Protocol: Laemmli SDS-PAGE
Gel Preparation Protocol
Resolving Gel Solution
The following protocol is adapted for preparing four 0.75-mm thick mini-gels, with adjustments provided for different percentages and formats [23] [5]:
- Assemble glass plates in casting apparatus, ensuring a tight seal to prevent leakage.
- Prepare resolving gel mixture according to the table below, adding TEMED and APS last to initiate polymerization:
| Component | 8% Gel | 10% Gel | 12% Gel | 15% Gel |
|---|---|---|---|---|
| 30% Acrylamide/Bis | 4.0 mL | 5.0 mL | 6.0 mL | 7.5 mL |
| 1.5 M Tris-HCl (pH 8.8) | 3.75 mL | 3.75 mL | 3.75 mL | 3.75 mL |
| 10% SDS | 150 µL | 150 µL | 150 µL | 150 µL |
| H₂O | 7.0 mL | 5.9 mL | 4.9 mL | 3.4 mL |
| 10% APS | 75 µL | 75 µL | 75 µL | 75 µL |
| TEMED | 7.5 µL | 7.5 µL | 7.5 µL | 7.5 µL |
| Total Volume | 15 mL | 15 mL | 15 mL | 15 mL |
- Pour resolving gel immediately after adding TEMED and APS, leaving approximately 2.5 cm below the top of the plates for the stacking gel.
- Overlay with isopropanol or water-saturated butanol to exclude oxygen and create a flat meniscus.
- Allow polymerization for 30-45 minutes at room temperature until a distinct interface forms.
Stacking Gel Solution
After resolving gel polymerization:
- Decant and rinse the isopropanol overlay with deionized water; remove residual liquid completely.
- Prepare stacking gel solution using the following formulation for four mini-gels:
| Component | Volume |
|---|---|
| 0.5 M Tris-HCl (pH 6.8) | 3.78 mL |
| 30% Acrylamide/Bis | 1.98 mL |
| 10% SDS | 150 µL |
| H₂O | 9 mL |
| 10% APS | 75 µL |
| TEMED | 15 µL |
| Total Volume | 15 mL |
- Pour stacking gel immediately over the resolving gel.
- Insert sample comb carefully, avoiding bubble formation beneath the teeth.
- Allow complete polymerization for 30-45 minutes before use [23] [5].
Sample Preparation and Electrophoresis
Protein Sample Denaturation
Proper sample preparation is critical for successful separation:
- Mix protein sample with an equal volume of 2X SDS sample buffer (typically containing: 0.5 M Tris-HCl pH 6.8, 10% glycerol, 2% SDS, 5% β-mercaptoethanol or 100 mM DTT, and 0.01% bromophenol blue) [23].
- Denature samples by heating at 95-100°C for 3-5 minutes, or alternatively at 70°C for 10 minutes [7] [23].
- Cool samples to room temperature and briefly centrifuge to collect condensation.
Critical Considerations:
- For membrane proteins or difficult-to-solubilize samples, include 8M urea in the sample buffer [23].
- Avoid heating samples containing certain membrane proteins that may aggregate at high temperatures; instead, incubate at 40°C for 30 minutes [23].
- Remove potassium ions from samples, as they can precipitate SDS [23].
Electrophoresis Conditions
- Assemble gel apparatus according to manufacturer's instructions, ensuring proper orientation.
- Load samples alongside appropriate molecular weight markers in adjacent lanes.
- Fill electrode chambers with Tris-glycine-SDS running buffer (25 mM Tris, 192 mM glycine, 0.1% SDS, pH 8.3) [23].
- Apply constant voltage: 125 V for mini-gels (approximately 90 minutes runtime) until the bromophenol blue tracking dye reaches the gel bottom [22].
- Terminate electrophoresis and process gel for staining or western blotting.
Technical Variations and Modifications
Alternative Buffer Systems
While the Tris-glycine buffer system remains standard for Laemmli SDS-PAGE, several modifications have been developed for specialized applications:
- Tris-Tricine System: Developed by Schägger and von Jagow for improved resolution of low molecular weight proteins (0.5-50 kDa) [7] [24]. This system substitutes glycine with tricine as the trailing ion, which does not interfere with protein sequencing and provides better separation of small peptides.
- Bis-Tris System: Used in commercial pre-cast gels with a nearly neutral pH (6.4-7.2), offering enhanced stability and reduced protein modification, particularly for cysteine residues [7].
- Continuous Systems: Simplified systems using the same buffer throughout the gel and electrode chambers, though with reduced resolution compared to discontinuous systems [25].
Gel Staining and Visualization
Following electrophoresis, multiple protein detection methods are available:
- Coomassie Brilliant Blue Staining: Standard method with detection limits of approximately 10-100 ng/protein band. Typical protocols involve fixing (50% methanol, 10% acetic acid), staining (0.25% Coomassie R-250 in 50% methanol, 10% acetic acid), and destaining (15% methanol, 10% acetic acid) [23].
- Silver Staining: 10-100 times more sensitive than Coomassie staining, capable of detecting 0.1-1.0 ng protein per band.
- Specialized Stains: Fluorescent dyes, zinc-reverse staining, and specific glycoprotein or phosphoprotein detection methods.
- Western Blotting: Transfer to membranes for immunodetection with specific antibodies.
Applications in Research and Drug Development
The Laemmli SDS-PAGE system serves as a fundamental tool across multiple research domains, providing critical protein characterization data. In drug development, the technique enables assessment of protein drug purity, stability, and integrity throughout purification and formulation processes. The method's ability to detect protein degradation, aggregation, or post-translational modifications makes it invaluable for quality control of biopharmaceuticals. In basic research, SDS-PAGE facilitates protein expression analysis, subunit composition determination, verification of homogeneity in purified samples, and preparation for downstream applications including protein sequencing, mass spectrometry, and antibody production [12] [25]. The technique's robust nature, reproducibility, and relative simplicity have maintained its position as an essential methodology in life science research for over five decades, despite the development of more sophisticated analytical technologies.
Executing the Perfect Run: A Step-by-Step SDS-PAGE Protocol
In the molecular biology laboratory, sodium dodecyl sulfate-polyacrylamide gel electrophoresis (SDS-PAGE) stands as a fundamental technique for separating protein mixtures according to their molecular weights. The success of this separation hinges on the precise casting of polyacrylamide gels with well-defined structural and electrical properties. This process relies on a sophisticated polymerization reaction catalyzed by the critical pair of tetramethylethylenediamine (TEMED) and ammonium persulfate (APS). These catalysts drive the formation of the mesh-like matrix that separates proteins based on size. This application note provides detailed protocols and formulations for the consistent preparation of stacking and resolving gels, focusing specifically on the optimal use of TEMED and APS to achieve reliable, reproducible results for research and drug development applications. Mastery of this fundamental technique ensures the generation of high-quality data in downstream analyses such as western blotting and protein characterization.
Background Principles
The Chemistry of SDS-PAGE Gel Polymerization
The formation of a polyacrylamide gel is a process of free radical-induced polymerization, creating a cross-linked matrix with predictable pore sizes. Acrylamide monomers form the linear backbone of the polymer, while bis-acrylamide crosslinks these chains, creating a three-dimensional network. The pore size of this network is determined by the ratio and total concentration of these two components; higher percentages of acrylamide create smaller pores, ideal for resolving lower molecular weight proteins.
The polymerization reaction is initiated by a pair of catalysts: Ammonium persulfate (APS) and Tetramethylethylenediamine (TEMED). APS, when dissolved in water, decomposes to produce sulfate free radicals. TEMED functions as a chemical accelerator by catalyzing the decomposition of the persulfate radical, thereby dramatically increasing the rate of radical generation. These free radicals then activate the acrylamide monomers, initiating a chain reaction that propagates until the gel is fully polymerized. The concentrations of APS and TEMED are critical parameters that must be optimized; excessive amounts can lead to rapid, inefficient polymerization and distorted gel structures, while insufficient amounts result in delayed or incomplete gel formation [5] [26].
The Function of Stacking versus Resolving Gels
SDS-PAGE employs a discontinuous gel system to achieve sharp, well-resolved protein bands. This system consists of two distinct layers:
The Resolving Gel (also called the separating gel): This lower portion of the gel contains a higher percentage of acrylamide (typically between 8% and 15%) and is buffered at Tris-HCl, pH 8.8. Its function is to separate denatured proteins based solely on their molecular weight as they migrate through the sieving matrix. The appropriate acrylamide percentage is selected based on the molecular weight range of the target proteins, as detailed in Table 1 [5] [27].
The Stacking Gel: This upper portion is composed of a low-percentage acrylamide (usually 4% or 5%) and is buffered at a lower pH (Tris-HCl, pH 6.8). Its primary purpose is not to separate, but to concentrate all protein samples into a sharp, unified band before they enter the resolving gel. This "stacking" effect, achieved through differences in ion mobility and buffer pH, ensures that all proteins enter the resolving gel at the same time, leading to sharper bands and higher resolution [5].
The following workflow diagram illustrates the complete process of hand-casting an SDS-PAGE gel, from preparation to the final polymerized product:
Reagents and Materials
Research Reagent Solutions
Successful gel casting requires precise preparation and understanding of all component solutions. The following table details the essential reagents, their standard formulations, and their critical functions within the SDS-PAGE gel system.
Table 1: Essential Reagents for SDS-PAGE Gel Casting
| Reagent | Standard Composition / Concentration | Primary Function in Gel Formulation |
|---|---|---|
| Acrylamide/Bis-acrylamide | 30% or 40% (w/v) solution; common bis ratio 37.5:1 or 29:1 [5] [27] | Forms the backbone of the polyacrylamide matrix. The total concentration (%) determines pore size and resolving range. |
| Tris-HCl Buffer | 1.5 M, pH 8.8 (Resolving Gel)0.5 M, pH 6.8 (Stacking Gel) [5] [26] | Provides the appropriate pH environment for electrophoresis and is critical for the discontinuous buffer system. |
| Sodium Dodecyl Sulfate (SDS) | 10% (w/v) solution [5] [26] | Imparts uniform negative charge to proteins, masking their intrinsic charge and allowing separation by size. |
| Ammonium Persulfate (APS) | 10% (w/v) solution in water [5] [28] | Initiator. Decomposes to provide sulfate free radicals required to begin the polymerization chain reaction. |
| TEMED | Liquid, 99% purity [5] [26] | Catalyst. Accelerates the decomposition of APS into free radicals, controlling the rate of polymerization. |
| Isopropanol | >99% purity [5] [26] | Used to overlay the resolving gel to exclude oxygen and ensure a flat, even polymerization surface. |
Key Considerations for Reagent Preparation
- Acrylamide Toxicity: Acrylamide monomer is a potent neurotoxin and suspected carcinogen. Always wear appropriate personal protective equipment (PPE) including gloves and safety goggles when handling, and dispose of waste according to institutional safety guidelines [28].
- APS Solution Stability: A 10% (w/v) APS solution must be prepared fresh daily for consistent and reliable polymerization performance. The accumulation of water in stored liquid APS causes a rapid loss of reactivity, leading to failed or inconsistent gel polymerization [26].
- TEMED Handling: TEMED is volatile and has a strong, unpleasant odor. It should be handled in a fume hood and the bottle tightly sealed after use [26]. It is highly hygroscopic, so drawing it up quickly is advised.
Detailed Protocols and Formulations
Formulating the Resolving Gel
The resolving gel is the workhorse of the separation. The appropriate acrylamide percentage must be selected based on the molecular weight of the target proteins to achieve optimal resolution. The table below provides a standardized recipe and serves as a guide for selecting the correct gel percentage.
Table 2: Resolving Gel Formulation for a 15 mL Gel (Adaptable for 4 mini-gels, ~0.75 mm thick) [5] [26] [27]
| Component | Final Acrylamide Percentage in Resolving Gel | |||
|---|---|---|---|---|
| 8% | 10% | 12% | 15% | |
| 30% or 40% Acrylamide/Bis | 4.0 mL [30%] | 5.0 mL [30%] | 6.0 mL [30%] | 7.5 mL [30%] |
| or 3.0 mL [40%] | or 3.75 mL [40%] | or 4.5 mL [40%] | or 5.63 mL [40%] | |
| 1.5 M Tris-HCl, pH 8.8 | 3.75 mL | 3.75 mL | 3.75 mL | 3.75 mL |
| 10% (w/v) SDS | 150 µL | 150 µL | 150 µL | 150 µL |
| Deionized H(_2)O | 7.0 mL | 5.95 mL | 4.95 mL | 3.45 mL |
| 10% APS (Fresh) | 75 µL | 75 µL | 75 µL | 75 µL |
| TEMED | 7.5 µL | 7.5 µL | 7.5 µL | 7.5 µL |
Table 3: Guide for Selecting Resolving Gel Percentage Based on Protein Size [5] [27]
| Target Protein Size (kDa) | Recommended Acrylamide Percentage |
|---|---|
| 4 - 40 | 20% |
| 12 - 45 | 15% |
| 10 - 70 | 12.5% |
| 15 - 100 | 10% |
| 25 - 200 | 8% |
Protocol: Casting the Resolving Gel
- Clean and Assemble: Thoroughly clean the short and spacer glass plates with a laboratory detergent, rinse with deionized water, and wipe with 70% ethanol. Assemble the glass plate sandwich securely within the casting module according to the manufacturer's instructions, ensuring a leak-proof seal [28] [26].
- Mix Base Solution: In a clean 15 mL conical tube, combine all the reagents for the chosen resolving gel percentage except for APS and TEMED. Mix the solution gently by inverting the tube to avoid introducing air bubbles, which can inhibit polymerization [5].
- Add Polymerization Catalysts: Immediately before pouring, add the freshly prepared 10% APS to the mixture, followed immediately by TEMED. Mix gently but swiftly. Critical Step: Once APS and TEMED are added, polymerization begins rapidly; work efficiently [26].
- Pour the Gel: Using a serological pipette or plastic Pasteur pipette, transfer the resolving gel solution into the gap between the glass plates. Fill to a level that leaves approximately 2.5 cm (or the height of the comb's teeth) below the top of the shorter plate [5].
- Overlay and Polymerize: Gently layer isopropanol or water-saturated butanol on top of the unpolymerized gel solution to exclude air and create a flat, even surface. Allow the gel to polymerize completely for 30-45 minutes at room temperature. Polymerization is complete when a distinct schlieren line is visible between the polymerized gel and the overlay [5] [27].
- Remove Overlay: After polymerization, pour off the isopropanol overlay. Rinse the top of the gel thoroughly with deionized water to remove any residual alcohol. Wick away the excess water completely using a lint-free tissue or filter paper [5] [28].
Formulating and Casting the Stacking Gel
The stacking gel is poured immediately after the resolving gel has been prepared. The following table provides a standard 4% or 5% stacking gel recipe.
Table 4: Stacking Gel Formulation for a 5 mL Gel (Sufficient for 2-4 mini-gels) [5] [26] [27]
| Component | 4% Stacking Gel | 5% Stacking Gel |
|---|---|---|
| 30% or 40% Acrylamide/Bis | 0.67 mL [30%] | 0.83 mL [30%] |
| or 0.5 mL [40%] | or 0.625 mL [40%] | |
| 0.5 M Tris-HCl, pH 6.8 | 1.25 mL | 1.25 mL |
| 10% (w/v) SDS | 50 µL | 50 µL |
| Deionized H(_2)O | 3.0 mL | 2.84 mL |
| 10% APS (Fresh) | 25 µL | 25 µL |
| TEMED | 5 µL | 5 µL |
Protocol: Casting the Stacking Gel
- Prepare Stacking Gel Solution: In a clean tube, combine all stacking gel reagents except APS and TEMED. This can be done while the resolving gel is polymerizing to save time [5].
- Add Catalysts and Pour: Once the resolving gel is ready and the overlay has been removed and dried, add 10% APS and TEMED to the stacking gel solution. Mix quickly and pour the solution directly onto the top of the polymerized resolving gel. Fill the cassette completely [28].
- Insert the Comb: Carefully insert a clean, dry comb into the liquid stacking gel, ensuring that no air bubbles are trapped under the teeth. The comb should be inserted at a slight angle to minimize bubbles. The stacking gel will polymerize in 20-30 minutes [5] [26].
- Final Preparation: Once polymerized, carefully remove the comb by pulling it straight up in a slow, steady motion. Immediately rinse the resulting wells with deionized water or running buffer to remove any unpolymerized acrylamide and debris [26]. The gel is now ready for immediate use or can be stored appropriately.
Critical Factors for Success and Troubleshooting
Optimization of TEMED and APS
The polymerization process is highly dependent on the correct use of APS and TEMED. An experiment testing the feasibility of creating a pre-mixed APS/TEMED aliquot demonstrated that gels only polymerized successfully when APS and TEMED were added separately to the gel solution just before casting. The pre-mixed aliquot failed to initiate polymerization, indicating that the reactive species required for initiation are short-lived [29]. This underscores the importance of the standard protocol.
- Catalyst Addition Order: Always add APS first, followed immediately by TEMED. This sequence ensures the efficient generation of free radicals.
- Freshness of APS: As emphasized, always use a freshly prepared 10% APS solution. Older solutions lose potency and are a primary cause of failed or delayed polymerization [26].
- Adjusting Polymerization Speed: The gel polymerization rate is temperature-dependent and can be controlled by the amount of TEMED and APS. To slow polymerization (e.g., for handling multiple gels or complex setups), reduce the amount of TEMED. To accelerate it (e.g., in cold rooms), slightly increase the amounts of both catalysts.
Gel Storage and Stability
Hand-cast gels can be stored for short periods. To store gels, wrap the polymerized gel (still in its cassette) in moistened tissue paper that has been soaked in deionized water and squeezed out. Then, seal the entire package in cling film to prevent dehydration. Label the package with the gel percentage, date, and thickness, and store it at 4°C. It is not recommended to store hand-cast gels for more than one week, as the gel matrix may deteriorate and affect electrophoretic performance [5] [26].
Troubleshooting Common Polymerization Issues
- Gel does not polymerize or polymerizes too slowly: The most common cause is degraded APS. Prepare a fresh 10% APS solution. Also, ensure TEMED has not been stored improperly and is not old.
- Gel polymerizes too quickly, leading to streaks or distortions: This is often due to excessive amounts of TEMED and/or APS, or a high ambient temperature. Pre-chill the gel solutions on ice before adding catalysts and/or slightly reduce the volume of TEMED added.
- Wavy or uneven gel surface: This can result from improper mixing of the gel solution after adding APS/TEMED, or from failing to overlay the resolving gel with a smoothing solvent like isopropanol [5].
- Leaking wells or collapsed wells: Leaking wells can occur if the gel cassette was not assembled tightly. Collapsed wells often result from using an old or damaged comb, or from removing the comb too forcefully or at an angle. Always remove the comb slowly and vertically [5].
In molecular biology and biochemistry, the accurate separation and analysis of proteins is a foundational technique. Sodium Dodecyl Sulphate-Polyacrylamide Gel Electrophoresis (SDS-PAGE) stands as the cornerstone method for separating proteins based primarily on their molecular weight [1] [30]. The reliability and resolution of this technique are critically dependent on the complete denaturation of protein samples into their constituent polypeptide chains prior to electrophoresis [31] [2]. Inadequate sample preparation can lead to anomalous migration, poor resolution, and incorrect molecular weight estimations, thereby compromising experimental results.
This application note details a robust and standardized protocol for the denaturation of protein samples using a combination of heat, the anionic detergent SDS, and reducing agents such as Dithiothreitol (DTT) or 2-Mercaptoethanol (BME). Proper execution of this procedure ensures that proteins are unfolded, linearized, and uniformly charged, allowing for true size-based separation during SDS-PAGE [1] [4]. The information presented herein is designed to support researchers, scientists, and drug development professionals in achieving highly reproducible and reliable protein analysis within the broader context of SDS-PAGE-based research.
Principles of Protein Denaturation for SDS-PAGE
The native structure of a protein, maintained by secondary, tertiary, and quaternary interactions, presents a complex challenge for electrophoresis. The goal of sample denaturation for SDS-PAGE is to dismantle these intricate structures to create linear polypeptide chains whose migration through a polyacrylamide gel is dependent solely on molecular weight [31] [2]. This is achieved through the synergistic action of three key components: SDS, reducing agents, and heat.
Role of SDS (Sodium Dodecyl Sulphate): SDS is a strong anionic detergent that plays a dual role. First, it disrupts nearly all non-covalent interactions—including hydrogen bonds and hydrophobic forces—that maintain the secondary and tertiary structures of a protein [1] [32]. This causes the protein to unfold. Second, SDS binds to the denatured polypeptide backbone at a relatively constant ratio of approximately 1.4 g SDS per 1.0 g of protein [32]. This binding imparts a uniform negative charge density along the entire length of the polypeptide chain, effectively masking the protein's intrinsic charge [1] [2]. Consequently, the charge-to-mass ratio becomes nearly identical for all proteins, eliminating charge as a variable during electrophoresis.
Role of Reducing Agents (DTT/BME): While SDS disrupts non-covalent bonds, it cannot break covalent disulfide (-S-S-) linkages that stabilize tertiary and quaternary structures [31] [33]. Reducing agents such as Dithiothreitol (DTT) or 2-Mercaptoethanol (BME) are essential for reducing these disulfide bonds. They work by undergoing a thiol-disulfide exchange reaction, converting cystine (the oxidized, disulfide-linked form) into two cysteine residues (the reduced, sulfhydryl form) [33]. This action ensures that multi-subunit proteins are dissociated into individual polypeptides and that the internal loops within a single polypeptide are fully linearized [1] [31]. DTT is often preferred over BME due to its lower odor and higher efficiency under some conditions [31] [34].
Role of Heat: The application of heat, typically between 70°C and 100°C, provides the kinetic energy necessary to accelerate the denaturation process [31] [34]. Heating "shakes up" the protein molecules, facilitating the penetration of SDS and reducing agents into hydrophobic core regions, thereby ensuring complete and uniform denaturation and linearization [31].
The following workflow diagram illustrates the transformative process proteins undergo during sample denaturation.
Reagent Formulations and Functions
A typical sample buffer for denaturing SDS-PAGE is a composite solution where each component serves a specific function to ensure effective denaturation, stability, and visualization during electrophoresis. The table below summarizes the common components of a 2X Laemmli sample buffer and their roles [31] [4].
Table 1: Composition and function of a standard 2X SDS-PAGE sample buffer.
| Component | Final Concentration (in 1X buffer) | Primary Function |
|---|---|---|
| SDS (Sodium Dodecyl Sulphate) | 1% - 2.5% | Denatures proteins; confers uniform negative charge [1] [31]. |
| Tris-Cl (pH ~6.8) | 62.5 - 125 mM | Provides buffering capacity at the stacking gel pH [31] [4]. |
| Glycerol | 5 - 20% | Increases sample density for easy loading into wells [31]. |
| Reducing Agent (DTT or BME) | 50 - 500 mM | Breaks disulfide bonds for complete linearization [31] [33] [34]. |
| Bromophenol Blue | 0.001 - 0.025% | Tracking dye to monitor electrophoresis progress [31]. |
| EDTA (optional) | 1-5 mM | Chelates divalent cations; inhibits metalloproteases [31]. |
The Scientist's Toolkit: Essential Reagents for Sample Denaturation
Successful sample preparation requires a set of specific, high-quality reagents. The following table lists the essential materials and their critical functions in the denaturation protocol.
Table 2: Key research reagent solutions for SDS-PAGE sample preparation.
| Reagent / Material | Function / Purpose |
|---|---|
| SDS Solution (10-20%) | Anionic detergent for protein denaturation and uniform charge masking [1] [2]. |
| Reducing Agent: DTT (e.g., 1M) or BME | Breaks covalent disulfide bonds within and between polypeptide chains [33] [34]. |
| Tris-Based Sample Buffer (e.g., 2X or 5X) | Provides denaturants, buffer, and dye in a ready-to-use mixture [4] [34]. |
| Thermal Heater Block or Water Bath | Provides controlled heating (95-100°C) for complete protein denaturation [8] [31]. |
| Microcentrifuge Tubes (PCR tubes or similar) | Withstand high temperatures during the heating step. |
| Refrigerated Microcentrifuge | Pellet insoluble debris after heating to prevent gel clogging [8] [6]. |
Step-by-Step Denaturation Protocol
Sample Preparation and Dilution
Begin by preparing your protein sample. For cell lysates or tissue homogenates, clarify the sample by centrifugation to remove insoluble debris. Determine the protein concentration using a standard assay (e.g., BCA or Bradford assay). The sample should ideally be in a low-salt, neutral pH buffer to prevent interference. For dilute samples or those containing high salt, a precipitation step (e.g., using Trichloroacetic Acid (TCA)) is recommended to concentrate the protein and remove interfering substances [4].
Denaturation Procedure
This protocol is designed for a final volume of 20 µL of 1X denatured sample.
- Prepare Working Sample Buffer: If using a concentrated sample buffer (e.g., 2X or 5X), dilute it to 1X final concentration with deionized water and your protein sample. For a 20 µL final volume, combine 10 µL of 2X sample buffer with up to 10 µL of protein sample. Ensure the sample buffer already contains SDS and Tris, but add the reducing agent fresh just before heating [34]. For example, add DTT to a final concentration of 50-100 mM or BME to a final concentration of 1-5% (v/v) [8] [31] [4].
- Mix and Heat Denature: Vortex the mixture briefly to ensure homogeneity. Centrifuge briefly to collect the solution at the bottom of the tube. Heat the samples in a pre-heated heat block or water bath at 95°C for 5-10 minutes [8] [31] [6]. The heating time may require optimization; some membrane proteins may aggregate if boiled too vigorously, in which case heating at 70-85°C for 10-15 minutes is a suitable alternative [31] [34].
- Cool and Clarify: After heating, briefly centrifuge the tubes (e.g., 3 minutes at high speed in a microcentrifuge) to pellet any precipitated or aggregated material [8] [6].
- Load Gel: Carefully load the supernatant into the well of a polyacrylamide gel. Avoid loading any pelleted material. The sample is now ready for electrophoresis.
Table 3: Troubleshooting common issues in sample denaturation.
| Problem | Potential Cause | Recommended Solution |
|---|---|---|
| Smearing bands | Incomplete denaturation; protein aggregation; overloaded well. | Ensure fresh reducing agent; optimize heating time/temperature; centrifuge sample after heating; load less protein [31] [2]. |
| Unexpected molecular weight | Incomplete reduction of disulfide bonds; post-translational modifications. | Increase concentration of DTT/BME; use a fresh aliquot of reducing agent; check for glycosylation or phosphorylation [1] [32]. |
| No bands or faint bands | Insufficient protein loaded; protein precipitation and not loaded. | Increase amount of protein loaded; ensure supernatant is loaded after centrifugation [31]. |
| Bands at top of gel | Protein aggregation; insufficient SDS. | Ensure sample was heated; include a higher concentration of SDS in the buffer [2]. |
The denaturation of protein samples using heat, SDS, and reducing agents is a critical, foundational step that dictates the success of subsequent SDS-PAGE analysis. The meticulous preparation of samples—ensuring complete unfolding, charge normalization, and disulfide bond reduction—is paramount for obtaining clear, reproducible, and interpretable results. By adhering to the standardized protocols and troubleshooting guidelines outlined in this document, researchers can reliably prepare protein samples for accurate molecular weight determination, purity assessment, and a wide array of downstream applications, including western blotting, thereby solidifying the integrity of their scientific research in protein biochemistry.
Sodium Dodecyl Sulfate-Polyacrylamide Gel Electrophoresis (SDS-PAGE) is a foundational technique in molecular biology and biochemistry, enabling the separation of proteins based primarily on their molecular weight [1]. This method relies on a discontinuous buffer system to concentrate and resolve protein complexes into individual polypeptide bands within a polyacrylamide gel matrix [35]. The reliability and resolution of this technique depend critically on two fundamental aspects: the correct assembly of the electrophoresis apparatus and the precise optimization of electrical run parameters. This application note provides detailed protocols and evidence-based guidelines for researchers to achieve consistent, high-quality results in their protein separation workflows, with particular attention to the needs of drug development professionals requiring reproducible data for analytical purposes.
Apparatus Assembly and Buffer Preparation
SDS-PAGE Running Buffer Composition
The running buffer, typically a Tris-Glycine-SDS system, provides the conductive medium essential for electrophoresis. Each component plays a specific role in the separation process [35]. Tris (tris(hydroxymethyl)aminomethane) acts as a buffering agent, maintaining a stable pH of approximately 8.3. This specific pH is critical as it ensures glycine, the "trailing ion," exists in the correct ionic state for the discontinuous buffer system to function. Glycine's dynamic change in mobility between the stacking and resolving gels is what creates the protein stacking effect. SDS (Sodium Dodecyl Sulfate) serves as a powerful anionic detergent, denaturing proteins and conferring a uniform negative charge proportional to polypeptide length, thereby ensuring separation based primarily on molecular size rather than inherent charge [6] [1].
Table 1: Standard Recipes for SDS-PAGE Running Buffer
| Component | Final Concentration (1X) | Mass for 1L (1X) | Final Concentration (10X Stock) | Mass for 1L (10X Stock) |
|---|---|---|---|---|
| Tris Base | 25 mM | 3.03 g | 250 mM | 30.3 g |
| Glycine | 192 mM | 14.4 g | 1.92 M | 144 g |
| SDS | 0.1% (w/v) | 1.0 g | Not included* | Not included* |
| Deionized Water | N/A | To 1 L final volume | N/A | To 1 L final volume |
*SDS is omitted from 10X stock solutions to prevent precipitation during storage and is added during the 1:10 dilution to make the working solution [35].
Step-by-Step Buffer Preparation Protocol
Preparing 1L of 1X Running Buffer from Scratch:
- Pour approximately 800 mL of deionized water into a clean 1L beaker or graduated cylinder.
- Add a magnetic stir bar and place on a stir plate, initiating gentle agitation.
- Weigh and add 3.03 g of Tris base and 14.4 g of glycine to the water. Allow them to dissolve completely.
- Weigh 1.0 g of SDS and slowly sprinkle it onto the surface of the stirring solution to prevent excessive foaming.
- Once all components are fully dissolved, transfer the solution to a 1L graduated cylinder and add deionized water to bring the final volume to 1 liter.
- The pH should be approximately 8.3 and typically requires no adjustment. Verify with a calibrated pH meter if troubleshooting is needed.
- Store the 1X buffer at room temperature and use within 1-2 weeks [35].
Preparing and Using a 10X Stock Solution: For laboratory efficiency, a 10X stock solution without SDS is recommended.
- Dissolve 30.3 g of Tris base and 144 g of glycine in approximately 800 mL of deionized water.
- Once dissolved, bring the final volume to 1L with water. The pH will be ~8.3.
- Store this 10X stock at room temperature for 3-6 months. Do not refrigerate, as glycine may crystallize.
- To prepare 1L of 1X working solution, mix 100 mL of the 10X stock, 890 mL of deionized water, and 10 mL of a 10% SDS stock solution (or add 1g of SDS powder) [35].
Gel Apparatus Assembly Workflow
The process of assembling the gel electrophoresis unit is a critical pre-run step. The following workflow outlines the key stages from gel casting to loading.
Diagram 1: Gel casting and apparatus setup workflow.
Optimizing Electrophoresis Run Parameters
Principles of Electrical Settings
The application of an electric field drives protein migration. Understanding the interplay between voltage (V), current (I), and power (P) is crucial for optimization. The relationship is defined by the equation: P = I × V [36]. Resistance (R) is another key factor, influenced by the gel and buffer ions, and is related by Ohm's Law: V = I × R [36].
- Constant Voltage: Provides a steady electric "pressure." As the run progresses and ions are depleted (increasing resistance), the current will decrease. This leads to a reduction in heat generation over time but may also slow protein migration in the later stages [36].
- Constant Current: Maintains a steady flow of charge. Under this setting, the voltage must increase to overcome the rising resistance, which can lead to significant heat production later in the run. This excess heat is a common cause of "smiling bands" or warped gels due to uneven expansion [36].
- Constant Power: Attempts to maintain a consistent energy input (Watts) by adjusting both voltage and current. While it can limit overall heat production, it is the most complex mode to control as two variables are in flux [36].
Heat Management and Its Impact
Heat is a critical parameter in SDS-PAGE. Moderate heat aids in protein denaturation, but excessive heat causes gel deformation, leading to smiling bands (where bands curve upward at the edges) and poor resolution [36]. In severe cases, the gel can become unusable. Heat production is directly proportional to the power consumed; therefore, higher voltage or current settings increase temperature [36]. Managing heat is particularly important when using constant current settings, where voltage—and thus heat—increases over time.
Table 2: Advantages and Disadvantages of Different Power Supply Modes
| Power Mode | Advantages | Disadvantages |
|---|---|---|
| Constant Current | Consistent run timing across multiple gels. | Voltage and heat increase during the run, risking smiling bands or gel warping. |
| Constant Voltage | Current and heat production decrease as the run progresses, improving safety. | Protein migration slows down later in the run, potentially requiring extended run times. |
| Constant Power | May limit overall heat production while maintaining more consistent migration speed. | "Constant" conditions are hard to define and monitor due to the interplay of two variables (V and I). |
Guidelines for Setting Run Parameters
A two-stage electrophoretic run is widely recommended for optimal resolution [36].
- Initial Stacking Phase: Begin the run at a low voltage, typically 50-60 V, for approximately 30 minutes. This allows proteins to migrate slowly through the stacking gel, forming sharp, concentrated bands before they enter the resolving gel.
- Resolving Phase: Once the proteins have entered the resolving gel, increase the voltage. A general rule of thumb is 5-15 V per centimeter of gel length. For standard mini-gels, this often translates to 100-150 V, while larger gels may require up to 200-300 V [36]. The run should continue until the tracking dye (e.g., Bromophenol Blue) front reaches the bottom of the gel.
To mitigate heat generation, especially when using constant current or high voltage settings, consider running the apparatus in a cold room or using a connected cooling module [36]. Always monitor the run periodically, as fluctuations can occur, and adjust settings if necessary.
Essential Research Reagent Solutions
The following reagents are fundamental for successful SDS-PAGE analysis.
Table 3: Key Reagents for SDS-PAGE Experiments
| Reagent / Material | Function / Purpose | Key Considerations |
|---|---|---|
| Tris-Glycine-SDS Running Buffer | Provides the conductive medium and ions for the discontinuous buffer system; SDS maintains protein denaturation. | pH of ~8.3 is critical for proper glycine ion function. 1X working solution is stable for 1-2 weeks [35]. |
| Polyacrylamide Gel (Gradient or Fixed %) | Acts as a molecular sieve; separates proteins by size. | Higher % acrylamide resolves smaller proteins. Choose concentration based on target protein size (e.g., 8% for 25-200 kDa, 12% for 10-70 kDa) [37]. |
| SDS Sample Buffer (with Reducing Agent) | Denatures proteins and confers uniform negative charge; reducing agents (DTT/β-mercaptoethanol) break disulfide bonds. | Boiling samples (100°C for 3-5 min) is essential for complete denaturation [6] [1]. |
| Protein Molecular Weight Marker (Ladder) | Provides reference bands of known molecular weight for estimating sample protein sizes. | Available in various size ranges (e.g., Low, High, Broad). Prestained markers allow visualization during blotting [38] [37]. |
| Ammonium Persulfate (APS) & TEMED | Catalyzes the polymerization of acrylamide and bisacrylamide to form the polyacrylamide gel. | TEMED should be added last as it initiates rapid polymerization [1]. |
Troubleshooting Common Electrophoresis Issues
- Smiling Bands (Bands Curving Upwards): This is most commonly caused by excessive heat during the run [36]. Solution: Use constant voltage mode, lower the overall voltage, or implement active cooling (ice bath, cold room).
- Poor Resolution or Diffuse Bands: Can result from incomplete gel polymerization, incorrect buffer pH, or insufficient denaturation of samples [35] [1]. Solution: Ensure fresh APS and TEMED are used for gel casting, verify buffer pH is ~8.3, and confirm that samples were heated at 95-100°C for 3-5 minutes in sample buffer.
- Abnormally Slow Migration: Often due to outdated or improperly prepared running buffer, where ions have been depleted [35]. Solution: Prepare fresh running buffer and avoid reusing buffer from previous runs.
- Uneven Band Spreading: Caused by overfilling wells, introducing bubbles into wells during loading, or an improperly mounted gel creating a non-uniform electric field [37]. Solution: Load only 80% of the well volume, use a syringe to clear wells of bubbles, and ensure the gel cassette is properly sealed in the apparatus.
Following the separation of proteins by molecular weight using SDS-PAGE, effective visualization of the resulting protein bands is a critical step in data analysis. The choice of staining technique directly impacts the sensitivity, dynamic range, and compatibility with downstream applications such as mass spectrometry or protein sequencing. This application note provides a detailed comparison of major protein staining methodologies and standardized protocols for their implementation, enabling researchers to select the optimal approach for their specific experimental needs in drug development and basic research.
Principles of Protein Visualization
Protein visualization techniques rely on the specific or non-specific binding of a chemical agent to proteins embedded within the polyacrylamide gel matrix post-electrophoresis. The fundamental principle involves the formation of a stable, detectable complex between the staining reagent and the polypeptide chains, which can be quantified based on signal intensity. The ideal stain offers high sensitivity, a broad linear dynamic range for quantification, uniformity across different protein types, and minimal interference with subsequent analytical techniques [39].
Table 1: Key Characteristics of Major Protein Staining Techniques
| Staining Technique | Mechanism of Action | Sensitivity (per band) | Linear Dynamic Range | Compatibility with Downstream Analysis |
|---|---|---|---|---|
| Coomassie Brilliant Blue | Non-specific binding via van der Waals and ionic interactions [39] | 50 ng [40] to 0.1 µg [39] | ~1 order of magnitude | Excellent (compatible with mass spectrometry) [39] |
| Colloidal Coomassie | Colloidal particles of G-250 dye bind proteins, minimizing background [39] | 1-10 ng [39] | Improved over traditional Coomassie | Excellent (compatible with mass spectrometry) [39] |
| Silver Staining | Silver ions bind to functional groups (e.g., sulfhydryl, carboxyl) and are reduced to metallic silver [39] | < 1 ng [39] to 2-5 ng [40] [4] | Limited; not uniform for all proteins [39] | Poor (proteins become oxidized); requires MS-compatible protocols [40] [4] [39] |
| Fluorescent Staining | Binding of fluorescent dyes to proteins | Equal to silver staining [39] | Broad dynamic range [39] | Excellent (compatible with mass spectrometry and microsequencing) [39] |
| "Stain-Free" TCE Detection | UV-induced covalent modification of tryptophan/tyrosine residues by TCE [41] [39] | Varies with tryptophan content | Good for quantification [41] | Data not available |
Detailed Staining Protocols
Coomassie Brilliant Blue Staining
Coomassie staining is a robust, widely used method for routine protein detection that provides a good balance between sensitivity and practicality [39].
Materials Required:
- Coomassie Staining Solution: 0.05% (w/v) Coomassie Brilliant Blue R-250, 40% (v/v) ethanol, 10% (v/v) glacial acetic acid, 50% (v/v) water [40] [4].
- Destaining Solution: 40% (v/v) ethanol, 10% (v/v) glacial acetic acid, 50% (v/v) water [40] [4].
- SDS polyacrylamide gel with separated proteins.
- Platform shaker.
Procedure:
- Staining: Following electrophoresis, carefully transfer the gel to a container with a sufficient volume of Coomassie staining solution to fully submerge it. Incubate with gentle agitation for 30 minutes to 2 hours [40] [4].
- Destaining: After staining, pour off the staining solution. Add destaining solution to the gel and agitate gently. Change the destaining solution periodically until the gel background becomes clear and protein bands are distinctly visible (typically 1-2 hours). To accelerate destaining and reuse the solution, a folded paper towel can be placed in the container to absorb excess dye [40] [4].
- Storage and Documentation: For preservation, store the destained gel in 7% acetic acid or water. Document the results by scanning or photographing the gel against a clear background [1].
Silver Staining
Silver staining offers exceptionally high sensitivity for detecting low-abundance proteins but involves a more complex, multi-step process [39].
Materials Required:
- Fixing Solution: 40% ethanol, 10% glacial acetic acid (or other compatible fixatives).
- Sensitizing Solution: Typically contains sodium thiosulfate or other sensitizing agents.
- Silver Nitrate Solution: 0.1-0.2% silver nitrate or an alternative silver-ammonia complex.
- Developing Solution: Contains a reducer like formaldehyde in an alkaline carbonate solution.
- Stop Solution: 1-5% acetic acid.
- Platform shaker.
Procedure: Note: Due to the complexity and variation in protocols, using a commercially available kit is highly recommended for reproducibility [40] [4]. The following outlines the general workflow:
- Fixation: Incubate the gel in fixing solution for 20-30 minutes to precipitate proteins and remove SDS and other interfering substances. Rinse the gel briefly with water.
- Sensitization: Treat the gel with a sensitizing solution to enhance subsequent silver deposition. This step improves sensitivity and uniformity.
- Silver Impregnation: Wash the gel with water, then incubate in the silver nitrate solution for 15-30 minutes. This allows silver ions to bind to protein functional groups.
- Image Development: Quickly rinse the gel and transfer to the developing solution. Agitate gently and monitor closely until the desired band intensity is achieved against a clear background.
- Stopping: Once development is complete, immediately transfer the gel to the stop solution (e.g., 1-5% acetic acid) for 5-15 minutes to terminate the reaction.
- Washing and Storage: Wash the gel thoroughly with water before documentation. Store in a cool place or drying solution [39].
"Stain-Free" TCE Detection
This rapid method utilizes trichloroethanol (TCE) incorporated into the gel matrix prior to electrophoresis, enabling visualization without a separate staining procedure [41] [39].
Materials Required:
- Polyacrylamide gel cast with TCE incorporated (e.g., 2,2,2-trichloroethanol added to the gel solution) [39].
- UV transilluminator or gel documentation system with UV capability.
Procedure:
- Electrophoresis: Perform SDS-PAGE as usual with a TCE-incorporated gel.
- Visualization: Immediately after electrophoresis, place the gel on a UV transilluminator. Expose the gel to UV light for approximately 5 minutes. The UV light induces a covalent modification of tryptophan (and tyrosine) residues in the proteins, generating a fluorescent signal that can be detected in the visible range [41] [39].
- Documentation: Capture the image using a compatible gel documentation system. This method is fast and avoids the use of additional stains and destaining steps [39].
The Scientist's Toolkit: Research Reagent Solutions
Table 2: Essential Reagents for Protein Visualization
| Reagent/Material | Function/Application | Key Considerations |
|---|---|---|
| Coomassie Brilliant Blue R-250 / G-250 | Dye for protein staining; binds nonspecifically to proteins [39]. | R-250 for standard protocol; G-250 for higher-sensitivity colloidal staining [39]. |
| 2,2,2-Trichloroethanol (TCE) | Compound for "stain-free" in-gel protein visualization [41] [39]. | Added to the gel matrix during casting; requires UV transilluminator for activation [39]. |
| Silver Nitrate | Source of silver ions for high-sensitivity silver staining [39]. | Requires careful handling; light-sensitive; part of a multi-step, time-sensitive protocol. |
| Prestained Protein Markers | Mixture of proteins of known molecular weight, pre-coupled to visible dyes [42]. | Allow real-time monitoring of electrophoresis and transfer efficiency in western blotting [42]. |
| Ethanol & Glacial Acetic Acid | Components of staining/destaining and fixing solutions [40] [4]. | Ethanol dehydrates and fixes proteins; acetic acid acidifies the solution to enhance dye binding and reduce background. |
| TEMED & Ammonium Persulfate | Catalyzer and initiator for polyacrylamide gel polymerization [4]. | Essential for gel casting; TEMED is a potent neurotoxin—handle with care [4]. |
Workflow for Selecting a Staining Method
The following diagram illustrates the decision-making process for selecting an appropriate protein visualization method based on key experimental parameters.
Advanced Applications and Considerations
Protein Quantification
Both Coomassie and "stain-free" methods can be adapted for protein quantification. Coomassie-stained gels can be analyzed by densitometry, where the optical density of bands is measured and compared to a standard curve of known protein concentrations [2]. The TCE-based method has also been developed into a microplate format quantification assay, demonstrating superior sensitivity compared to A₂₈₀ measurements and a wider linear range than the Bradford assay [41].
Use of Markers for Reproducible Analysis
Protein molecular weight markers (ladders) are essential for estimating the size of unknown proteins and assessing the progress of electrophoresis. Prestained markers, including multicolored variants, allow for easy visualization during and after the run, providing landmarks for gel cutting or transfer [42]. For highly reproducible gel slicing in quantitative proteomics, an innovative strategy involves mixing a DNA ladder with the protein sample. After electrophoresis, the DNA is stained, providing precise and predictable markers for gel excision that do not interfere with subsequent mass spectrometric analysis [43].
The selection of an optimal protein visualization technique is a critical determinant of success in SDS-PAGE-based research. While Coomassie staining remains the workhorse for routine analysis due to its simplicity and compatibility, advanced techniques like silver, fluorescent, and "stain-free" TCE staining offer powerful alternatives for high-sensitivity detection, rapid visualization, and specific application needs. By understanding the principles, capabilities, and limitations of each method—and by employing robust, standardized protocols—researchers and drug development professionals can ensure reliable, reproducible, and high-quality data from their protein separation experiments.
Within the framework of SDS-PAGE protocol development for protein separation, the use of molecular weight markers (also known as protein ladders or standards) is a fundamental practice that enables accurate protein sizing. SDS-PAGE separates proteins primarily by their molecular weight by negating the influence of protein charge and structure through the denaturing action of sodium dodecyl sulfate (SDS) [7] [1]. In this context, molecular weight markers serve as essential reference points that allow researchers to convert protein migration distances into molecular weight estimates, transforming the electrophoretic separation from a qualitative analysis to a semi-quantitative technique [12] [1]. This application note provides detailed protocols and analytical frameworks for the effective use of molecular weight markers in SDS-PAGE, specifically tailored for researchers, scientists, and drug development professionals requiring precise protein characterization.
Theoretical Foundations of Molecular Weight Estimation
The principle of molecular weight estimation using SDS-PAGE relies on the logarithmic relationship between protein size and its electrophoretic mobility. When proteins are denatured with SDS and reducing agents, they become linearized and carry a uniform negative charge, causing them to migrate through the polyacrylamide gel matrix toward the anode when an electric field is applied [7] [1]. The polyacrylamide gel acts as a molecular sieve, allowing smaller proteins to migrate faster while larger proteins move more slowly [1].
The use of molecular weight markers exploits this principle by providing proteins of known molecular weights that are run alongside unknown samples. By plotting the log of the molecular weights of these standard proteins against their migration distances, a standard curve is generated that enables the estimation of molecular weights for unknown proteins [12]. It is important to note that this method provides an "apparent" molecular weight with an estimated error of ±10%, as some proteins may exhibit anomalous migration due to factors such as post-translational modifications or variations in SDS binding [12].
Molecular Weight Marker Types and Selection Criteria
Classification of Protein Markers
Molecular weight markers are available in several formulations, each designed for specific applications and detection methods. The table below summarizes the primary types of markers available and their appropriate applications:
Table 1: Types of Molecular Weight Markers for SDS-PAGE
| Marker Type | Composition | Molecular Weight Range | Key Applications | Detection Method |
|---|---|---|---|---|
| Unstained Standards | Natural or recombinant proteins [44] | 5-245 kDa [44] | Accurate molecular weight determination [1] | Requires protein staining (Coomassie, silver stain) [1] |
| Prestained Standards | Proteins covalently linked to dyes [44] | Varies from unstained counterparts due to dye modification [44] | Monitoring electrophoresis progress; approximate molecular weight estimation; transfer efficiency in western blotting [44] | Visible during and after electrophoresis without additional staining [44] |
| Recombinant Standards | Precisely engineered proteins [44] | Defined ranges optimized for specific separations | High-precision applications; quantitative analyses | Compatible with various staining methods |
Selection Guidelines
Choosing the appropriate molecular weight marker is critical for experimental success. Consider the following factors when selecting markers:
- Molecular Weight Range: Select markers whose range brackets the expected sizes of your target proteins. Broad-range markers (e.g., 10-250 kDa) are suitable for initial characterization, while targeted ranges provide better resolution for specific size classes [44].
- Compatibility with Detection Methods: Unstained markers provide the most accurate molecular weight determination but require visualization through protein staining techniques such as Coomassie Brilliant Blue or silver staining [1]. Prestained markers allow real-time monitoring of electrophoresis progression but exhibit altered mobility due to the attached dye molecules [44].
- Application-Specific Requirements: For techniques following SDS-PAGE, such as western blotting, prestained markers are invaluable for monitoring transfer efficiency and orienting the membrane [1]. For quantitative purity assessments, as required in antibody development, unstained markers provide more accurate size estimation [45].
Experimental Protocol: Using Molecular Weight Markers in SDS-PAGE
Materials and Reagents
Table 2: Essential Research Reagents and Materials
| Item | Function/Description |
|---|---|
| Molecular Weight Markers | Reference proteins of known molecular weight; available as ready-to-use solutions or lyophilized powders [44] |
| SDS-PAGE Gel | Discontinuous polyacrylamide gel system typically consisting of stacking (4-6%) and separating (8-15%) gels; may be hand-cast or commercial precast gels [7] [1] |
| SDS Sample Buffer | Contains SDS (denaturant), reducing agent (DTT or β-mercaptoethanol), glycerol, tracking dye, and buffer; ensures protein denaturation and confers negative charge [1] |
| Electrophoresis Buffer | Typically Tris-glycine-SDS buffer; maintains pH and conductivity during separation [7] [1] |
| Protein Staining Solutions | Coomassie Brilliant Blue (standard sensitivity) or silver stain (high sensitivity) for visualizing protein bands post-electrophoresis [1] |
Step-by-Step Procedure
Gel Selection and Preparation:
- Choose an appropriate polyacrylamide percentage for the separating gel based on the target protein size range (e.g., 8% for large proteins >100 kDa, 12% for standard separations, 15% for small proteins <30 kDa) [7].
- For hand-cast gels, prepare separating gel solution containing acrylamide, bis-acrylamide, SDS, and Tris buffer (pH 8.8). Initiate polymerization with TEMED and ammonium persulfate (APS) [7] [1]. Once polymerized, prepare stacking gel (pH 6.8) and insert sample comb.
Sample and Marker Preparation:
- Thaw molecular weight markers according to manufacturer specifications. If using lyophilized markers, reconstitute with appropriate volume of water or sample buffer [44].
- Mix protein samples and molecular weight markers with SDS sample buffer containing reducing agents (DTT or β-mercaptoethanol) to break disulfide bonds [1].
- Heat samples at 95°C for 5 minutes (or 70°C for 10 minutes) to ensure complete denaturation [7] [1].
- Briefly centrifuge heated samples to collect condensation.
Gel Loading and Electrophoresis:
- Assemble gel cassette in electrophoresis chamber and fill with running buffer [1].
- Load prepared samples and molecular weight markers into adjacent wells. Include at least one well with molecular weight markers, preferably on both sides of unknown samples for accurate comparison [1].
- Connect power supply and run at constant voltage (typically 100-200V for mini-gels) until the tracking dye (bromophenol blue) front reaches the bottom of the gel [7].
Protein Visualization and Analysis:
Diagram 1: Molecular Weight Estimation Workflow
Data Analysis and Interpretation
Creating a Standard Curve
To estimate molecular weights of unknown proteins:
- Measure the migration distance of each protein band in the molecular weight marker from the top of the separating gel.
- Plot the logarithm of the known molecular weights of the marker proteins against their migration distances.
- Fit a regression line (typically linear or sigmoidal) to the data points to create a standard curve.
- Measure the migration distance of unknown protein bands and use the standard curve to estimate their molecular weights [12].
Troubleshooting Common Issues
- Non-linear Standard Curves: May indicate issues with gel polymerization, uneven electrophoresis, or inappropriate gel percentage for the protein size range.
- Poor Band Resolution: Can result from insufficient sample denaturation, incorrect gel percentage, or excessive voltage during electrophoresis.
- Inaccurate Size Estimation: May occur with glycoproteins, membrane proteins, or proteins with unusual amino acid compositions that bind SDS differently [12].
- Smearing: Can be caused by protein degradation, overloading, or improper sample preparation [1].
Advanced Applications in Drug Development and Research
The precise molecular weight estimation enabled by molecular weight markers finds critical applications in pharmaceutical development and biotechnology:
- Antibody Purity Analysis: In monoclonal antibody development, SDS-PAGE with molecular weight markers is used to assess purity, detect fragmentation, and identify aggregates. As shown in comparative studies, SDS-PAGE can resolve antibody fragments under reducing conditions, revealing heavy and light chains at approximately 50 kDa and 25 kDa, respectively [45].
- Detection of Post-Translational Modifications: Shifts in apparent molecular weight can indicate modifications such as glycosylation, phosphorylation, or ubiquitination [1]. For instance, glycosylated proteins appear as diffuse bands or at higher molecular weights than calculated from the amino acid sequence alone.
- Biopharmaceutical Quality Control: SDS-PAGE with molecular weight markers remains a fundamental technique for lot-to-lot consistency testing, stability studies, and impurity profiling in therapeutic protein production [45].
Methodological Considerations and Limitations
While SDS-PAGE with molecular weight markers is a powerful technique, researchers should be aware of its limitations:
- Accuracy Range: The method provides molecular weight estimates with approximately ±10% accuracy under optimal conditions [12].
- Anomalous Migration: Certain protein classes, including highly glycosylated proteins, membrane proteins, and proteins with unusual charge distributions, may migrate anomalously, leading to inaccurate size estimates [12].
- Size Limitations: Standard SDS-PAGE effectively separates proteins in the 5-250 kDa range [7]. Proteins outside this range require specialized protocols such as Tris-Tricine systems for small peptides [7] or low-percentage gels for very large proteins.
- Complementary Techniques: For higher resolution and quantification, capillary electrophoresis-SDS (CE-SDS) offers automated, quantitative analysis with superior signal-to-noise ratios for applications requiring precise purity assessments, such as antibody analysis [45].
When integrated properly into the SDS-PAGE workflow, molecular weight markers transform this fundamental laboratory technique into a robust analytical tool for protein characterization, providing critical data for research and biopharmaceutical development.
Beyond the Basics: Troubleshooting Common Issues and Optimizing Resolution
Within the framework of advanced research on protein separation by molecular weight, sodium dodecyl sulfate-polyacrylamide gel electrophoresis (SDS-PAGE) remains a foundational analytical technique. A common and significant challenge encountered during this method is poor band separation, which compromises resolution, obscures accurate molecular weight determination, and hinders downstream analysis. This application note systematically details the primary causes of inadequate band resolution and provides validated, actionable protocols to rectify these issues, ensuring the generation of publication-quality data for research and drug development.
Root Causes and Analytical Troubleshooting
Poor band separation manifests as blurred, smeared, or poorly resolved protein bands, which can stem from inconsistencies across multiple stages of the SDS-PAGE workflow. A systematic approach to diagnosis is crucial. The flowchart below outlines a logical pathway for identifying the root cause of separation issues.
The following table expands on the common issues identified in the diagnostic pathway, providing specific symptoms and their corresponding corrective measures.
Table 1: Comprehensive Troubleshooting Guide for Poor Band Separation
| Primary Cause | Specific Symptom | Recommended Corrective Action |
|---|---|---|
| Suboptimal Sample Preparation | Smeared bands across all lanes [46] [47] | • Boil samples at 95-98°C for 5 minutes with fresh SDS and reducing agent (e.g., DTT, β-mercaptoethanol) [46] [21].• Centrifuge post-heating to remove aggregates [47]. |
| Inappropriate Protein Load | Smeared, U-shaped, or fused bands; trailing into neighboring lanes [46] [48] | • Load the minimum amount of protein required for detection (validate for each protein-antibody pair) [46].• A general guideline is 0.1-0.2 μg of protein per mm of well width [49]. |
| Incorrect Gel Percentage | Poor resolution of specific size ranges; small proteins run together or large proteins remain clustered [46] | • Use low % gels (e.g., 8%) for high molecular weight proteins (>100 kDa) [46] [48].• Use high % gels (e.g., 15%) for low molecular weight proteins (<30 kDa) [46].• Use gradient gels (e.g., 4-20%) for a broad separation range [7]. |
| Improper Electrophoresis Conditions | "Smiling" bands (curved upwards); distorted or blurred bands [48] [47] | • Run gel at a lower voltage (e.g., 100-120V) for a longer time to minimize heat generation [46] [48].• Use a cooling pack or run the apparatus in a cold room [46] [48]. |
| Issues with Gel Polymerization & Buffers | Fuzzy bands, uneven migration, or distorted dye front [46] [47] | • Ensure gels are fully polymerized by using fresh APS and TEMED [46].• Prepare fresh running buffer for each run to maintain correct pH and ion concentration [46] [48]. |
Core Methodology: Optimized SDS-PAGE Protocol
This detailed protocol incorporates critical steps to prevent poor band separation, ensuring high-resolution protein analysis.
Materials and Reagent Solutions
Table 2: Essential Research Reagents and Solutions for SDS-PAGE
| Reagent/Solution | Composition / Example | Critical Function in Protocol |
|---|---|---|
| SDS Sample Buffer | 62.5 mM Tris-HCl (pH 6.8), 2% SDS, 10% glycerol, 0.01% bromophenol blue [7] [21] | Denatures proteins, provides negative charge, adds density for loading, and allows visual tracking. |
| Reducing Agent | Dithiothreitol (DTT, 10-100 mM) or β-mercaptoethanol (5%) [7] [21] | Breaks disulfide bonds to fully linearize proteins for accurate size-based separation. |
| Polyacrylamide Gel | Stacking gel: 4-5% acrylamide, pH 6.8. Resolving gel: 8-15% acrylamide, pH 8.8 [7] [47] | Stacking gel concentrates proteins; resolving gel separates by molecular weight via pore size. |
| Running Buffer | Tris-Glycine-SDS buffer: 25 mM Tris, 192 mM glycine, 0.1% SDS, pH 8.3 [7] | Maintains pH and conductivity for electrophoresis; SDS keeps proteins denatured. |
| Polymerization Agents | Ammonium Persulfate (APS) and Tetramethylethylenediamine (TEMED) [7] [47] | Catalyze the free-radical polymerization of acrylamide to form the gel matrix. |
Step-by-Step Procedural Protocol
Gel Casting
- Resolving Gel: Combine acrylamide/bis-acrylamide, Tris-HCl (pH 8.8), and SDS. Degas the solution to accelerate polymerization. Add fresh APS and TEMED, then pour the gel immediately. Overlay with water-saturated butanol or isopropanol to create a flat, even interface [47].
- Stacking Gel: After the resolving gel has polymerized (typically 20-30 minutes), pour off the overlay. Prepare the stacking gel solution with acrylamide, Tris-HCl (pH 6.8), and SDS. Add APS and TEMED, pour onto the resolving gel, and insert a comb without introducing bubbles. Allow 30 minutes to polymerize fully [47].
Sample Preparation
Electrophoresis
- Assemble the gel cassette in the electrophoresis chamber and fill the inner and outer chambers with fresh running buffer [46] [48].
- Flush wells with running buffer to remove unpolymerized acrylamide and urea [49].
- Load prepared samples and a molecular weight marker into the wells. Critical Step: Start electrophoresis immediately after loading to prevent sample diffusion from the wells [48] [47].
- Apply a constant voltage: 80-100V through the stacking gel, then increase to 120-150V for the resolving gel. Run until the dye front reaches the bottom of the gel [48] [21]. Running at a lower voltage minimizes heating and improves resolution.
Post-Electrophoresis Analysis
- Carefully disassemble the cassette and transfer the gel to a staining solution (e.g., Coomassie Brilliant Blue or a more sensitive silver stain) for protein visualization [21].
- For western blotting, transfer proteins to a PVDF or nitrocellulose membrane using an optimized transfer buffer system, such as CAPS buffer for more efficient transfer of high molecular weight proteins [50].
Advanced Applications and Modifications
For specialized research applications, the standard SDS-PAGE protocol can be modified. In metalloprotein studies, a modified Native SDS-PAGE (NSDS-PAGE) that omits SDS and reducing agents from the sample buffer and uses a lower SDS concentration (0.0375%) in the running buffer can separate proteins while retaining bound metal ions and enzymatic activity [51]. Furthermore, for resolving complex protein mixtures, Two-Dimensional Gel Electrophoresis (2D-PAGE) combines isoelectric focusing (first dimension) with SDS-PAGE (second dimension), separating proteins first by their isoelectric point and then by molecular weight, providing a powerful tool for proteomic analysis [21].
Achieving optimal band separation in SDS-PAGE is a critical prerequisite for accurate protein analysis in biomedical research. By systematically addressing common pitfalls in sample preparation, gel composition, and electrophoresis conditions as outlined in this application note, researchers can consistently obtain high-resolution results. The protocols and troubleshooting guide provided here form a robust foundation for reliable protein separation, supporting rigorous scientific inquiry and development in the field of drug discovery.
Sodium Dodecyl Sulfate-Polyacrylamide Gel Electrophoresis (SDS-PAGE) remains a fundamental technique in biochemistry and molecular biology for separating proteins based on their molecular weight [2]. The method relies on the denaturing action of SDS, which coats proteins with a uniform negative charge, and the sieving properties of a polyacrylamide gel matrix to separate polypeptides primarily by size [14]. Despite its widespread use and standardization, researchers frequently encounter technical artifacts that can compromise data interpretation, publication quality, and experimental reproducibility.
Among the most prevalent issues are band smiling (curving of bands at the edges), smearing (diffuse, non-discrete bands), and edge effects (distortions specifically at the gel perimeter) [47]. These artifacts pose significant challenges in protein characterization, particularly in critical applications such as drug development where accurate analysis of therapeutic antibodies and other biologics is essential. This application note systematically addresses the causes and solutions for these common SDS-PAGE artifacts, providing researchers with detailed protocols for identification, troubleshooting, and prevention within the broader context of optimizing molecular weight-based protein separation.
Principles of SDS-PAGE and Artifact Generation
Fundamental Separation Mechanism
SDS-PAGE separates proteins through two interconnected mechanisms: the uniform negative charge imparted by SDS binding, and the molecular sieving effect of the polyacrylamide gel matrix [2] [14]. SDS binds to denatured proteins at a relatively constant ratio of approximately 1.4 g SDS per 1 g of protein, linearizing the polypeptides and masking their intrinsic charge [14] [1]. When an electric field is applied, these negatively charged protein-SDS complexes migrate toward the anode, with smaller proteins moving faster through the porous gel matrix than larger ones [2].
The standard discontinuous gel system employs a stacking gel (pH ~6.8, lower acrylamide concentration) layered above a resolving gel (pH ~8.8, higher acrylamide concentration) [14] [1]. The stacking gel concentrates protein samples into sharp, thin bands before they enter the resolving region where actual separation occurs. This focusing effect is crucial for achieving high resolution, and any disruption to this process can generate the artifacts discussed in this document.
Artifact Classification and Impact
Band artifacts in SDS-PAGE can be broadly categorized into three main types, each with distinct visual characteristics and underlying causes:
- Band Smiling (Curvature): Characterized by upward or downward curving of protein bands at the edges of the gel, resulting from uneven heat distribution across the gel surface during electrophoresis [47].
- Band Smearing (Diffusion): Manifested as diffuse, poorly resolved bands that lack sharp definition, often caused by protein aggregation, degradation, or improper denaturation [52] [47].
- Edge Effects (Distortion): Localized distortions specifically affecting lanes at the edges of the gel, typically resulting from uneven polymerization, buffer leakage, or electrical field irregularities [47].
These artifacts not only reduce the aesthetic quality of gels but more importantly can lead to inaccurate molecular weight estimation, compromised quantification, and erroneous conclusions about protein purity or composition—critical concerns in both basic research and biopharmaceutical development.
Troubleshooting Common Artifacts
Band Smiling (Curvature Artifacts)
Band smiling, characterized by upward or downward curving of bands at the gel edges, primarily results from uneven heat distribution during electrophoresis [47]. When the center of the gel becomes hotter than the edges, migration rates increase in the warmer central region, producing the characteristic "smile" or "frown" pattern.
Table 1: Troubleshooting Band Smiling Artifacts
| Cause | Effect | Solution | Prevention Validation |
|---|---|---|---|
| Uneven heat distribution | Different migration rates across gel | Use lower constant current; Ensure proper cooling | Uniform band migration across all lanes |
| Insufficient buffer circulation | Temperature gradients form | Check buffer level; Use magnetic stirrer in tank | Consistent temperature across gel surface |
| Loose electrical connections | Irregular current flow | Secure electrodes; Clean contacts | Stable voltage/current readings during run |
| Gel composition inconsistencies | Variable resistance | Degas acrylamide solution before polymerization | Consistent polymerization across entire gel |
| Spacers acting as heat sinks | Cooler edges than center | Use thinner spacers; Adjust running conditions | Minimal temperature differential (<2°C) |
Band Smearing (Diffusion Artifacts)
Band smearing appears as diffuse, poorly resolved bands rather than sharp, discrete bands. This artifact significantly compromises resolution and can stem from various issues in sample preparation and gel composition.
Table 2: Troubleshooting Band Smearing Artifacts
| Cause | Effect | Solution | Prevention Validation |
|---|---|---|---|
| Incomplete protein denaturation | Protein aggregation; Irregular migration | Ensure adequate heating (95°C, 5 min); Fresh SDS in buffer | Single, sharp bands for purified proteins |
| Protein degradation | Multiple band fragments | Use protease inhibitors; Keep samples on ice | Intact bands without lower molecular weight fragments |
| Overloaded protein | Saturation of migration path | Dilute sample; Perform protein assay | Band intensity proportional to load |
| High salt concentration | Disrupted electrical field | Desalt samples; Use appropriate buffer | Clear bands without horizontal spreading |
| Insufficient acrylamide polymerization | Irregular pore size | Use fresh APS/TEMED; Ensure proper degassing | Consistent gel texture and elasticity |
| Inadequate reducing agents | Disulfide bond reformation | Fresh DTT/β-mercaptoethanol; Proper storage | Absence of high molecular weight aggregates |
A specialized cause of smearing observed in monoclonal antibody analysis under non-reducing conditions is method-induced artifacts from incomplete denaturation and disulfide bond scrambling [52] [53]. Research demonstrates that combining heating with alkylating agents like iodoacetamide (IAM), or using 8 M urea treatment promotes complete denaturation and minimizes these artifacts [52].
Edge Effects (Perimeter Distortions)
Edge effects manifest as distorted bands specifically in the outer lanes of a gel, often resulting from technical issues with the gel cassette assembly or polymerization.
Table 3: Troubleshooting Edge Effect Artifacts
| Cause | Effect | Solution | Prevention Validation |
|---|---|---|---|
| Uneven gel polymerization | Variable pore size at edges | Ensure uniform gel pouring and temperature | Consistent staining with Coomassie throughout gel |
| Buffer leakage | Irregular current flow at edges | Check gasket/spacer integrity; Proper assembly | No buffer droplets leaking from cassette |
| Air bubbles at bottom | Blocked current flow | Remove bubbles after cassette assembly | Unobstructed view through bottom of gel |
| Non-uniform gel interface | Distorted stacking | Overlay resolving gel evenly with butanol/water | Straight, even interface between gel layers |
| Misaligned glass plates | Variable thickness | Carefully align plates and spacers | Uniform gel thickness when measured |
Detailed Experimental Protocols
Protocol 1: Minimizing Artifacts in Non-Reducing SDS-PAGE of Antibodies
Background: Non-reducing SDS-PAGE is particularly prone to artifact bands due to incomplete denaturation and disulfide bond scrambling, especially when analyzing monoclonal antibodies [52]. This protocol implements optimized sample preparation to minimize these artifacts.
Reagents:
- SDS-PAGE sample buffer (non-reducing, without DTT/β-mercaptoethanol)
- Iodoacetamide (IAM) stock solution (500 mM in water, freshly prepared)
- Urea (ultrapure)
- Purified monoclonal antibody sample
- Appropriate gel system (Tris-glycine or Bis-Tris)
Procedure:
- Sample Preparation:
- Divide antibody sample into three aliquots (25 μL each, ~1 μg/μL)
- Aliquot 1: Mix with non-reducing SDS-PAGE sample buffer (1:1)
- Aliquot 2: Mix with non-reducing SDS-PAGE sample buffer (1:1), heat at 95°C for 5 minutes
- Aliquot 3: Add solid urea to 8 M final concentration, incubate 10 minutes at room temperature, then mix with non-reducing SDS-PAGE sample buffer (1:1)
Optional Alkylation Step:
- For additional protection against disulfide scrambling, add IAM to 50 mM final concentration to any of the above preparations after denaturation
- Incubate in dark for 30 minutes at room temperature
Gel Electrophoresis:
- Load 20 μL of each prepared sample onto appropriate non-reducing gel
- Run at constant voltage (100-150V) until dye front reaches bottom
- Stain with Coomassie Blue or appropriate staining method
Expected Results: The heated sample and urea-treated sample should show significantly reduced artifact bands compared to the untreated control, with the combination of heat and IAM providing the cleanest results [52].
Protocol 2: Optimization of Gel Polymerization to Prevent Edge Effects
Background: Inconsistent gel polymerization, particularly at the edges, contributes significantly to edge effects. This protocol ensures uniform gel formation.
Reagents:
- Acrylamide/bis-acrylamide solution (appropriate percentage)
- Ammonium persulfate (APS, 10% solution, freshly prepared)
- TEMED
- Butanol (saturated with water) or isopropanol
- Separating buffer (1.5 M Tris-HCl, pH 8.8)
- Stacking buffer (0.5 M Tris-HCl, pH 6.8)
Procedure:
- Gel Solution Preparation:
- Prepare resolving gel solution according to desired percentage, omitting APS and TEMED
- Degas solution under vacuum for 10 minutes to remove dissolved oxygen
- Add TEMED and APS, mix thoroughly but gently to avoid introducing bubbles
Gel Casting:
- Immediately pour gel solution between assembled glass plates
- Leave appropriate space for stacking gel (approximately 1 cm from top)
- Overlay carefully with saturated butanol or isopropanol using pipette
- Allow to polymerize completely (30-45 minutes)
Stacking Gel Preparation:
- Pour off overlay solution, rinse gel surface with distilled water
- Prepare stacking gel solution, degas as above
- Add TEMED and APS, pour over resolving gel
- Insert comb without trapping air bubbles
- Allow to polymerize 30 minutes
Quality Control: After polymerization, examine gel for straight, uniform interface. The gel should appear clear without streaks or swirls. Reject any gels with uneven surfaces or air bubbles.
Protocol 3: Electrophoresis Conditions to Minimize Smiling
Background: Proper electrophoresis conditions are critical for minimizing heat-related artifacts like band smiling. This protocol optimizes running conditions.
Reagents:
- Running buffer (25 mM Tris, 192 mM glycine, 0.1% SDS, pH 8.3)
- Completed polyacrylamide gel with loaded samples
- Protein molecular weight standards
Procedure:
- Apparatus Assembly:
- Place gel cassette into electrophoresis chamber
- Fill inner and outer chambers with running buffer
- Ensure no air bubbles are trapped at bottom of gel
Running Conditions:
- Connect to power supply and set to constant voltage
- For mini-gel systems: 80-100V during stacking, then 120-150V during separation
- For maxi-gel systems: 50-80V during stacking, then 100-120V during separation
- If available, use cooling apparatus or run in cold room
Monitoring:
- Observe dye front for even migration across entire gel
- If smiling begins to appear, reduce voltage by 25%
- Stop electrophoresis when dye front reaches approximately 1 cm from bottom
Troubleshooting: If smiling persists, consider pre-chilling running buffer or using a power supply with programmable temperature control to maintain constant temperature.
The Scientist's Toolkit: Essential Research Reagents
Table 4: Key Research Reagent Solutions for Artifact Prevention
| Reagent/Equipment | Function in Artifact Prevention | Optimal Usage Conditions |
|---|---|---|
| High-purity SDS | Uniform protein denaturation and charge masking | Fresh 10% solution in water; Avoid precipitation |
| DTT or β-mercaptoethanol | Reduction of disulfide bonds; Prevent aggregation | Fresh addition to sample buffer; Final concentration 50-100 mM |
| Iodoacetamide (IAM) | Alkylation of free thiols; Prevent disulfide scrambling [52] | 50 mM final concentration; Post-denaturation; Protect from light |
| Ultrapure urea | Alternative denaturant for heat-sensitive proteins [52] | 8 M final concentration; Fresh solution to avoid cyanates |
| TEMED/APS | Complete gel polymerization; Consistent pore size | Fresh APS solution; Use within 24 hours; Proper storage |
| Glycerol | Increased sample density; Prevent sample diffusion | 5-10% in sample buffer; Ensures samples settle in wells |
| Bromophenol blue | Migration tracking; Visualize run progress | 0.1% in sample buffer; Monitor for even dye front |
| Precast gradient gels | Consistent pore size; Reduced polymerization artifacts | Follow manufacturer's storage and usage instructions |
Workflow for Systematic Artifact Diagnosis
The following workflow provides a systematic approach for diagnosing and addressing band artifacts in SDS-PAGE, integrating the protocols and troubleshooting guidance presented in this document:
Systematic artifact diagnosis workflow for SDS-PAGE quality improvement.
Band artifacts in SDS-PAGE represent significant challenges in protein research and biopharmaceutical development, but they can be systematically addressed through understanding their underlying causes and implementing optimized protocols. The strategies outlined in this application note—including proper sample preparation with adequate denaturation, optimized gel polymerization, and controlled electrophoresis conditions—provide researchers with practical tools to minimize smiling, smearing, and edge effects. As the field advances with increasing demands for reproducibility and quantification in techniques like western blotting, mastery of these fundamental SDS-PAGE principles becomes increasingly critical. The protocols and troubleshooting guidelines presented here will assist researchers in obtaining publication-quality results that meet the stringent standards of modern scientific journals and regulatory requirements.
Optimizing Gel Percentage for Different Protein Size Ranges
Sodium dodecyl sulfate-polyacrylamide gel electrophoresis (SDS-PAGE) is a foundational technique in molecular biology that enables the separation of protein mixtures based on their molecular size [7]. This method has become an indispensable tool in research laboratories worldwide, with the original publication describing it becoming one of the most cited scientific papers of all time [7]. The technique's widespread adoption stems from its reliability, relative simplicity, and ability to provide critical insights into protein composition, purity, and structural characteristics [54]. In SDS-PAGE, proteins are denatured and linearized through the combined action of a reducing agent and the anionic detergent SDS, which masks the proteins' intrinsic charges and confers a relatively uniform negative charge density [20] [7]. When an electric field is applied, these protein-SDS complexes migrate through a polyacrylamide gel matrix, with smaller proteins moving more rapidly than larger ones due to less hindrance from the gel pores [55]. This process allows researchers to separate proteins strictly by molecular weight, making it possible to analyze complex protein mixtures, determine approximate molecular weights, and assess sample purity [54] [7].
The fundamental principle governing SDS-PAGE separation lies in the sieving effect of the polyacrylamide gel matrix, which acts as a molecular sieve [7]. The polyacrylamide gel is formed through the polymerization of acrylamide monomers cross-linked by N,N'-methylenebisacrylamide (Bis) [20] [56]. The porosity of the resulting gel is determined by the concentration of acrylamide, with higher percentages creating smaller pores that provide better resolution for lower molecular weight proteins, while lower percentages create larger pores suitable for separating higher molecular weight proteins [54] [20]. Typically, SDS-PAGE employs a discontinuous buffer system with two distinct gel layers: a stacking gel with lower acrylamide concentration (usually 3-5%) and neutral pH that concentrates proteins into a sharp band before they enter the separating gel, and a resolving gel with higher acrylamide concentration (ranging from 8% to 20%) and basic pH where the actual size-based separation occurs [57] [20] [7]. This discontinuous system, pioneered by Laemmli, significantly enhances resolution compared to continuous electrophoresis systems [7].
Gel Percentage Selection Guidelines
Fundamental Principles of Gel Percentage Selection
Selecting the appropriate acrylamide concentration for the resolving gel is paramount for achieving optimal separation of target proteins. The fundamental rule governing gel percentage selection is straightforward: lower acrylamide percentages (e.g., 8-10%) provide larger pore sizes that facilitate better separation of high molecular weight proteins, while higher percentages (e.g., 12-15%) create smaller pores that optimize resolution for lower molecular weight proteins [54]. This relationship exists because the polyacrylamide matrix acts as a molecular sieve; larger proteins experience greater resistance when navigating through smaller pores, thus migrating more slowly through high-percentage gels [7]. The key consideration is the size range of the proteins of interest within the sample. For instance, when analyzing very large proteins (≥200 kDa), low-percentage gels in the range of 4-8% are recommended to allow sufficient migration and separation [54]. Conversely, for small proteins and peptides (5-20 kDa), higher percentage gels (15-20%) are necessary to achieve adequate resolution [20] [7]. This strategic selection ensures that the target proteins migrate through the gel matrix at differential rates that maximize separation based on molecular size.
The linear relationship between protein mobility and molecular weight holds true within a specific separation range for each gel percentage [20]. When the molecular weight of a protein falls outside the optimal separation range for a given gel percentage, the resolution suffers significantly. Proteins that are too large for the selected gel percentage may barely enter the gel matrix or migrate with poor separation, while very small proteins may move with the dye front without adequate resolution [54] [7]. Understanding these principles allows researchers to strategically select gel percentages based on their experimental objectives and the specific characteristics of their protein samples.
Comprehensive Gel Percentage Recommendations
Table 1: Optimal Acrylamide Concentrations for Different Protein Size Ranges
| Protein Size Range | Recommended Gel Percentage | Separation Characteristics |
|---|---|---|
| ≥200 kDa | 4-8% | Provides large pore size for high molecular weight proteins to enter and migrate through the gel matrix [54] |
| 50-200 kDa | 8-12% | Standard range for most routine applications; offers good resolution for common protein sizes [20] |
| 30-100 kDa | 10-12% | Optimal for medium-sized proteins; provides sharp band resolution in this common molecular weight range [20] |
| 15-70 kDa | 12-15% | Suitable for smaller proteins; increased gel density improves separation of lower molecular weight proteins [20] |
| 5-50 kDa | 15-20% | High-density gel matrix necessary for resolving very small proteins and peptides [7] |
For researchers analyzing proteins across a broad molecular weight spectrum or when the size range of target proteins is unknown, gradient gels (e.g., 4-20%) provide an excellent alternative to single-percentage gels [54] [7]. These gels feature a continuous increase in acrylamide concentration from top to bottom, creating a pore size gradient that allows different proteins to achieve optimal resolution at different points in the gel [7]. The primary advantage of gradient gels is their extended separation range, which can resolve proteins varying widely in molecular weight on a single gel [54]. This characteristic makes them particularly valuable for preliminary experiments with unknown samples or when analyzing complex protein mixtures with components spanning a broad size range. Additionally, gradient gels typically produce sharper bands than single-percentage gels, as proteins progressively slow down as they encounter smaller pores, focusing the protein bands during migration [7].
Experimental Protocols
Gel Preparation Protocol
The preparation of polyacrylamide gels for SDS-PAGE requires precision and attention to detail to ensure reproducible and reliable results. The following protocol outlines the step-by-step procedure for creating discontinuous SDS-polyacrylamide gels with stacking and resolving layers [20] [56].
Table 2: Composition of SDS-PAGE Gels for Different Percentages
| Reagent | 7.5% Separating Gel (20 mL) | 10% Separating Gel (20 mL) | 15% Separating Gel (20 mL) | 3% Stacking Gel (10 mL) |
|---|---|---|---|---|
| 30% Acr-Bis (29:1) | 5.0 mL | 6.66 mL | 10.0 mL | 1.0 mL |
| Separating Gel Buffer (pH 8.9) | 2.5 mL | 2.5 mL | 2.5 mL | - |
| Stacking Gel Buffer (pH 6.7) | - | - | - | 1.25 mL |
| 10% SDS | 0.2 mL | 0.2 mL | 0.2 mL | 0.1 mL |
| Deionized Water | 10.2 mL | 8.54 mL | 5.2 mL | 5.6 mL |
| 10% APS | 0.1 mL | 0.1 mL | 0.1 mL | 0.05 mL |
| TEMED | 2 μL | 2 μL | 2 μL | 2 μL |
Step-by-Step Procedure:
Assemble the gel casting apparatus according to the manufacturer's instructions, ensuring that the glass plates are clean and properly sealed to prevent leakage [57] [20].
Prepare the separating gel mixture by combining all components listed in Table 2 for the desired acrylamide percentage, adding TEMED last to initiate polymerization [20] [56]. Mix gently but thoroughly to avoid introducing air bubbles.
Pour the separating gel solution into the gap between the glass plates, leaving appropriate space for the stacking gel (approximately 1-2 cm below the top of the short plate) [20].
Immediately overlay the gel solution with a small amount of water-saturated isopropanol or n-butanol to exclude oxygen and create a flat interface [20] [7]. Allow the gel to polymerize completely for approximately 30 minutes, during which a distinct schlieren line becomes visible at the gel-alcohol interface [20].
Pour off the overlay solution and rinse the gel surface with deionized water to remove any residual alcohol. Carefully remove excess water with filter paper or a narrow strip of blotting paper [20].
Prepare the stacking gel solution according to the composition in Table 2, again adding TEMED last [20] [56].
Pour the stacking gel directly onto the polymerized separating gel and immediately insert a clean sample comb without introducing air bubbles [57] [20]. Allow the stacking gel to polymerize for 20-30 minutes.
After polymerization, carefully remove the sample comb and rinse the sample wells with electrophoresis buffer or deionized water to remove any unpolymerized acrylamide [20].
The prepared gel can be used immediately for electrophoresis or stored wrapped in moist paper towels and plastic wrap at 4°C for up to 24-48 hours [7].
Gel Preparation Workflow
Sample Preparation and Electrophoresis
Sample Preparation Protocol:
Protein Extraction: Lyse cells or tissues using an appropriate extraction buffer containing detergents (e.g., SDS, Triton X-100) to solubilize membranes and release proteins, along with protease inhibitors to prevent degradation [55] [57].
Protein Quantification: Determine protein concentration using a reliable method such as the Bradford assay, BCA assay, or UV spectroscopy at 280 nm [55] [57]. Normalize samples to ensure equal protein loading across wells.
Sample Denaturation: Mix protein samples with SDS-PAGE sample buffer (typically 2× or 5× concentration) containing SDS, glycerol, bromophenol blue tracking dye, and a reducing agent (β-mercaptoethanol or DTT) [20] [56]. A typical sample buffer composition includes:
- 4.6% SDS
- 20% glycerol
- 1.23% DTT
- 0.5 M Tris-Cl, pH 6.8
- Bromophenol blue tracking dye [56]
Heat Denaturation: Denature samples at 95°C for 5 minutes or 70°C for 10 minutes to fully unfold proteins and facilitate SDS binding [57] [54] [7]. For membrane proteins or difficult-to-denature samples, extended heating may be necessary [54].
Brief Centrifugation: Centrifuge samples at maximum speed for 2-3 minutes to pellet any insoluble material or aggregates that could interfere with electrophoresis [54].
Electrophoresis Protocol:
Assemble the Electrophoresis Unit: Place the polymerized gel into the electrophoresis chamber according to the manufacturer's instructions [57].
Fill Buffer Chambers: Add SDS-PAGE running buffer (25 mM Tris, 192 mM glycine, 0.1% SDS, pH 8.3) to both the inner and outer chambers of the electrophoresis apparatus, ensuring complete coverage of the gel [57] [56].
Load Samples: Carefully load equal volumes of prepared protein samples and molecular weight markers into appropriate wells using gel loading tips for precision [57] [54]. Recommended protein loads are:
- ≤2 μg per well for purified proteins with Coomassie staining
- ≤20 μg per well for complex mixtures like whole cell lysates with Coomassie staining
- Lower amounts for more sensitive detection methods (silver staining, fluorescent staining, or western blotting) [54]
Run Electrophoresis: Connect the power supply with correct polarity (red to red, black to black) and run at constant voltage:
Maintain Temperature: To prevent "smiling" effects (curved bands caused by uneven heating), maintain a constant temperature between 10°C-20°C during separation by using a magnetic stirrer in the outer buffer chamber or by reducing running current if necessary [54].
Sample and Electrophoresis Workflow
The Scientist's Toolkit: Essential Research Reagents
Table 3: Essential Reagents for SDS-PAGE Experiments
| Reagent | Function | Key Considerations |
|---|---|---|
| Acrylamide/Bis-acrylamide | Forms the polyacrylamide gel matrix that acts as a molecular sieve [20] [56] | Typically used at 30% stock solution (29:1 or 37.5:1 acrylamide:bis ratio); neurotoxic in monomeric form [56] |
| SDS (Sodium Dodecyl Sulfate) | Anionic detergent that denatures proteins and confers negative charge [55] [7] | Binds to proteins at ~1.4g SDS/g protein; masks intrinsic charge [7] |
| Tris Buffers | Maintains pH during electrophoresis [20] [56] | Separating gel: Tris-HCl, pH 8.8; Stacking gel: Tris-HCl, pH 6.7 [20] |
| Ammonium Persulfate (APS) | Free radical initiator for gel polymerization [20] [7] | Typically used at 10% concentration; freshly prepared solutions recommended [20] |
| TEMED | Catalyst that accelerates acrylamide polymerization [20] [7] | Amount affects polymerization rate; critical for gel formation [20] |
| Glycine | Component of Tris-glycine running buffer [56] [7] | Acts as trailing ion in discontinuous buffer system [7] |
| DTT or β-Mercaptoethanol | Reducing agents that break disulfide bonds [54] [56] | Essential for complete denaturation; DTT has less odor but is less stable [54] |
| Coomassie Brilliant Blue | Protein stain for visualization after electrophoresis [58] [56] | R-250 used for gel staining; G-250 used in Bradford protein assay [58] |
| Molecular Weight Markers | Standards for size estimation and run control [54] [56] | Prestained markers allow visual tracking; broad range markers recommended for unknown samples [54] |
Troubleshooting and Optimization Strategies
Even with careful technique, researchers may encounter challenges during SDS-PAGE separation. Understanding common issues and their solutions is essential for obtaining reliable results. Band distortion and smiling effects often result from uneven heating during electrophoresis, which can be mitigated by maintaining a constant temperature between 10°C-20°C through buffer stirring or reduced current [54]. Band smearing frequently indicates protein degradation, sample contamination, or incomplete denaturation, which can be addressed by using fresh protease inhibitors, ensuring sample purity, and verifying proper heating during denaturation [54]. Inconsistent band patterns between runs typically stem from variations in sample preparation, gel quality, or electrophoresis conditions, emphasizing the need for standardized protocols and high-quality reagents [54].
Several strategic approaches can optimize gel resolution and separation accuracy. For complex samples with unknown protein sizes, gradient gels (e.g., 4-20%) provide superior resolution across broad molecular weight ranges compared to single-percentage gels [54] [7]. When precise molecular weight determination is critical, running conditions should be carefully calibrated using appropriate molecular weight markers that bracket the target size range [54] [56]. For difficult samples such as membrane proteins, ensuring complete denaturation through extended heating and using fresh reducing agents is essential to prevent aggregation and smearing [54]. Additionally, matching protein load to detection method prevents overloading (which causes smearing) or underloading (which reduces detection sensitivity), with general guidelines suggesting ≤2μg for purified proteins and ≤20μg for complex mixtures when using Coomassie staining [54].
The selection of appropriate gel percentages based on protein size ranges represents a fundamental aspect of experimental design in protein separation. By understanding the principles outlined in this protocol and applying systematic optimization strategies, researchers can achieve reliable, reproducible protein separation that forms the foundation for downstream applications including western blotting, protein quantification, and structural analysis. The guidelines presented here provide a comprehensive framework for optimizing SDS-PAGE experiments to meet specific research requirements in biochemistry, cell biology, and drug development.
Within the framework of research dedicated to optimizing SDS-PAGE for protein separation by molecular weight, sample preparation emerges as the most critical determinant of success. Incomplete denaturation and protein aggregation are two prevalent issues that can severely compromise the resolution, accuracy, and reproducibility of experimental results [14] [46]. Proper sample preparation ensures that proteins are uniformly linearized and charged, allowing their migration through the polyacrylamide gel to be dependent solely on molecular weight [14] [7]. This application note provides detailed protocols and troubleshooting strategies to identify, rectify, and prevent these common sample-related problems, enabling researchers to obtain reliable and high-quality data.
Principles of Effective Sample Preparation
The fundamental goal of sample preparation for SDS-PAGE is to convert complex, three-dimensional protein structures into linear, negatively charged polypeptides. This is achieved through the synergistic action of three key components present in the sample buffer, as detailed in [14] and [1]:
- SDS (Sodium Dodecyl Sulfate): This anionic detergent binds to proteins at a nearly constant ratio of approximately 1.4 g SDS per gram of protein [14] [7]. It disrupts hydrogen bonds and hydrophobic interactions, effectively dismantling the secondary and tertiary structures of the protein. Crucially, it confers a uniform negative charge to the polypeptides, masking their intrinsic charge and creating a consistent charge-to-mass ratio [2].
- Reducing Agents: Agents such as Dithiothreitol (DTT) or β-mercaptoethanol are added to break disulfide bonds, which are covalent linkages that stabilize tertiary and quaternary structures [14] [1]. This ensures that multi-subunit proteins dissociate into their individual polypeptide components.
- Heat: The sample is typically heated to 95°C for 5 minutes [46] [7]. This thermal energy provides the activation energy required to overcome the metastability of certain protein folds, particularly "SDS-resistant" complexes, and ensures complete unfolding in conjunction with SDS and the reducing agent [7].
Failure at any of these steps can lead to the issues of incomplete denaturation and aggregation, which manifest as poor band resolution, smearing, or incorrect molecular weight estimates on the final gel [47] [46].
Troubleshooting Incomplete Denaturation and Aggregation
Diagnostic Features and Common Causes
Issues arising from sample preparation can be identified by specific artifacts on the stained gel. The table below summarizes the key diagnostic features and their primary causes.
Table 1: Diagnostic Features and Causes of Sample Preparation Issues in SDS-PAGE
| Gel Artifact | Primary Cause | Underlying Mechanism |
|---|---|---|
| Fuzzy or poorly resolved bands [47] | Incomplete Denaturation | Proteins retain secondary or tertiary structure, leading to non-uniform migration through the gel matrix [46]. |
| Multiple bands for a purified protein [47] | Incomplete Reduction of Disulfide Bonds | Disulfide-linked aggregates or partially reduced species migrate at different apparent molecular weights. |
| High molecular weight smears or aggregates at the gel top [46] | Protein Aggregation | Insufficient SDS, incorrect heating, or high protein concentration cause proteins to form large, insoluble complexes that cannot enter the gel. |
| Streaking [47] | Sample Precipitation/Re-dissolution | Proteins precipitate in the well during loading or electrophoresis and then re-dissolve gradually during the run. |
| Incorrect apparent molecular weight [46] | Incomplete Denaturation or Unusual Sequence | A protein's native structure or hydrophobic domains are not fully unfolded, altering its mobility relative to its true mass. |
Research Reagent Solutions for Sample Preparation
The following table lists essential reagents required for effective sample preparation, along with their specific functions and troubleshooting considerations.
Table 2: Essential Reagents for SDS-PAGE Sample Preparation
| Reagent | Function | Key Considerations for Troubleshooting |
|---|---|---|
| SDS (Sodium Dodecyl Sulfate) [14] [7] | Denatures proteins and provides uniform negative charge. | Concentration is critical. Ensure a large excess is present (e.g., in 1X sample buffer). Do not exceed 1.4g SDS/g protein to avoid precipitation [47]. |
| DTT (Dithiothreitol) or β-Mercaptoethanol [14] [7] | Reduces disulfide bonds to linearize polypeptides. | Must be fresh. DTT (10-100 mM) is often preferred over β-mercaptoethanol due to its lower odor and higher efficiency [7]. "Doublet" bands can indicate insufficient reducing agent [47]. |
| Tris-Based Sample Buffer | Provides appropriate pH and ionic environment. | Check pH; acidic samples (yellow after preparation) require neutralization with NaOH to ensure proper buffer function [47]. |
| Glycerol [14] [1] | Increases sample density for easy loading into wells. | Ensure adequate concentration (typically 5-10%). Insufficient glycerol causes samples to diffuse out of wells [47]. |
| Tracking Dye (Bromophenol Blue) [14] [1] | Visualizes migration progress during electrophoresis. | Too little dye can make sample preparation issues harder to track during the run [47]. |
The logical relationship between the root causes, the mechanisms of failure, and the resulting gel artifacts is illustrated in the workflow below.
Optimized Protocols for Reliable Denaturation
Standard Protocol for Complete Denaturation
This protocol is designed to ensure full protein denaturation for most standard applications and serves as a baseline for optimization [14] [2] [7].
- Prepare Sample Buffer: Use a standard Laemmli-style 2X or 4X sample buffer containing 62.5 mM Tris-HCl (pH 6.8), 2% (w/v) SDS, 10% glycerol, and 0.01% bromophenol blue [7]. Supplement with a fresh reducing agent immediately before use.
- Mix Sample and Buffer: Combine protein sample and sample buffer at the desired ratio (e.g., 1:1 for 2X buffer) in a microcentrifuge tube. Vortex thoroughly to ensure complete mixing [47].
- Denature with Heat: Seal the tube and heat the mixture at 95°C for 5 minutes in a heating block or boiling water bath [46] [7].
- Brief Centrifugation: After heating, briefly centrifuge the samples (10-15 seconds at >10,000 x g) to collect any condensation and bring the entire volume to the bottom of the tube. This prevents the introduction of aggregates into the gel well [47].
- Load and Run: Load the supernatant onto the polyacrylamide gel immediately to minimize diffusion from the well [47]. Begin electrophoresis.
Enhanced Protocol for Problematic or Aggregate-Prone Proteins
For proteins known to be resistant to denaturation (e.g., membrane proteins, proteins with high hydrophobic content, or stable complexes), a more rigorous protocol is recommended.
- Increased Reducing Agent: Start by increasing the concentration of DTT to 50-100 mM in the sample buffer to ensure complete reduction of stubborn disulfide bonds [7].
- Alternative Denaturant Pretreatment: For severe aggregation, pre-incubate the protein sample with a higher concentration of SDS (e.g., 1-2%) without glycerol or reducing agent at room temperature for 10-15 minutes. This allows SDS better access to hydrophobic regions before the sample buffer is added.
- Extended and Higher-Temperature Denaturation: Add the complete sample buffer (with high DTT) and then heat the sample. Instead of 95°C for 5 minutes, try heating at 70°C for 10-15 minutes [7]. This longer, slightly lower temperature incubation can be more effective at denaturing metastable SDS-resistant complexes without promoting excessive aggregation that can occur at higher temperatures.
- Sonication: For visible precipitates or persistent aggregation, a brief sonication step (e.g., 2-3 pulses of 5-10 seconds each on ice) after heating can help to disrupt aggregates. Take care not to over-sonicate, as this can degrade proteins.
- Filter or Centrifuge: For critical applications, pass the final denatured sample through a 0.22 μm spin filter before loading to remove any remaining insoluble material.
Quantitative Data and Experimental Validation
To objectively validate the effectiveness of the optimized protocols, researchers should compare the outcomes of problematic samples prepared using both standard and enhanced methods. The following quantitative data provides a guide for expected results.
Table 3: Quantitative Comparison of Standard vs. Enhanced Sample Preparation Protocols
| Parameter | Standard Protocol (95°C, 5 min) | Enhanced Protocol (e.g., 70°C, 15 min, High DTT) | Measurement Method |
|---|---|---|---|
| Band Sharpness | Moderate, potential for fuzziness | High, distinct and sharp bands | Visual inspection or band width quantification via densitometry [2] |
| Aggregate/Smear at Gel Top | May be present for problematic proteins | Significantly reduced or eliminated | Visual inspection or quantification of stain intensity in the stacking gel region |
| Apparent Molecular Weight Accuracy | May be inaccurate for SDS-resistant proteins | Improved alignment with expected molecular weight | Comparison to protein ladder standard curve [12] [59] |
| Inter-lane Reproducibility | Good for simple proteins, variable for complex ones | High reproducibility across technical replicates | Coefficient of variation (%CV) in band migration distance |
Experimental Methodology for Validation: A purified protein known to be problematic (e.g., a recombinant protein with multiple cysteines) or a complex cell lysate should be aliquoted and prepared according to the standard and enhanced protocols described in Section 4. The same total protein mass should be loaded for each condition. After electrophoresis and staining (e.g., with Coomassie Blue or a fluorescent dye [2]), the gels should be imaged using a gel documentation system. Band sharpness can be quantified by measuring the full-width at half-maximum (FWHM) of bands of interest using densitometry software. The intensity of high molecular weight smears can be quantified by defining a region of interest at the top of the separating gel and comparing the integrated intensity between conditions [59].
Within the framework of SDS-PAGE protocol development for protein separation by molecular weight, the reproducibility of results is a cornerstone of scientific rigor. This reproducibility is critically dependent on two fundamental, yet often overlooked, aspects: the use of freshly prepared and properly stored buffers, and the consistent achievement of complete gel polymerization. While the principles of SDS-PAGE are well-established, day-to-day laboratory practices in buffer management and gel preparation directly influence the reliability of electrophoretic separations, impacting everything from research data to drug development validations. This application note details the precise protocols and quality control measures necessary to standardize these critical steps, ensuring that protein migration is consistent, comparable, and dependable across experiments.
The Critical Role of SDS-PAGE Running Buffer
The running buffer in SDS-PAGE is not merely a conductive medium; it is an active component of the discontinuous buffer system that enables high-resolution protein separation. Its composition and condition are paramount for the stability of the SDS-protein complexes and the maintenance of the appropriate pH throughout the electrophoresis run.
Buffer Composition and Function
The standard Tris-Glycine-SDS running buffer serves three distinct functions, each governed by a specific chemical component [35]:
- Tris (Tris(hydroxymethyl)aminomethane): Acts as the buffering agent to maintain a stable pH environment, which is crucial for the electrophoretic separation process.
- Glycine: Functions as the trailing ion in the discontinuous buffer system. Its charge state is pH-dependent, which is essential for the stacking effect that concentrates proteins into sharp bands at the beginning of the run.
- SDS (Sodium Dodecyl Sulfate): An anionic detergent that maintains the denatured state of proteins and provides a uniform negative charge-to-mass ratio, ensuring separation based primarily on molecular weight.
The following table outlines the standard recipes for both a working solution (1X) and a convenient stock solution (10X).
Table 1: Standard Recipes for SDS-PAGE Running Buffer
| Component | Mass for 1L of 1X Buffer | Final Concentration (1X) | Mass for 1L of 10X Stock | Final Concentration (10X Stock) |
|---|---|---|---|---|
| Tris Base | 3.03 g | 25 mM | 30.3 g | 250 mM |
| Glycine | 14.4 g | 192 mM | 144.0 g | 1.92 M |
| SDS | 1.0 g | 0.1% (w/v) | Not included | Not included |
Note: The 10X stock is typically prepared without SDS to prevent precipitation during storage. SDS is added during the dilution to 1X working concentration [35].
Buffer Preparation and Storage Protocols
Protocol: Preparation of 1L of 1X Running Buffer from 10X Stock
- Measure 900 mL of deionized water into a clean graduated cylinder or beaker [8] [35].
- Add 100 mL of 10X Tris-Glycine stock solution [8] [35].
- Add 10 mL of a 10% SDS stock solution (or 1.0 g of SDS powder) [35].
- Gently stir or mix the solution until the SDS is completely dissolved. Avoid vigorous stirring to prevent excessive foaming.
- Verify that the pH is between 8.2 and 8.4. No adjustment should be necessary if high-quality reagents and water are used [35].
Protocol: Preparation of 10X Tris-Glycine Stock Solution (without SDS)
- Add 800 mL of deionized water to a suitable container.
- Weigh and add 30.3 g of Tris base and 144.0 g of Glycine.
- Stir until all components are completely dissolved.
- Top up the solution to a final volume of 1 L with deionized water.
- Store the 10X stock at room temperature for up to 3-6 months. Do not refrigerate, as glycine can crystallize at low temperatures [35].
Buffer Shelf Life and Reuse
The stability of running buffer components varies significantly, directly impacting experimental reproducibility.
Table 2: Storage Conditions and Shelf Life of SDS-PAGE Buffers
| Buffer Type | Storage Temperature | Typical Shelf Life | Notes |
|---|---|---|---|
| 10X Tris-Glycine Stock (No SDS) | Room Temperature | 3-6 months | Crystallization may occur if refrigerated. Warm and stir to redissolve if needed [35]. |
| 1X Running Buffer (with SDS) | Room Temperature | 1-2 weeks | Less stable; prone to microbial growth. Best practice is to prepare fresh from stock as needed [35]. |
While buffer reuse is sometimes considered for economy, it is not recommended for reproducible results. During electrophoresis, ion depletion (particularly of glycinate) occurs, which can lead to decreased performance, slower run times, and distorted protein bands in subsequent uses [35].
Achieving Proper Gel Polymerization
The polyacrylamide gel matrix is the sieving medium that separates proteins by size. Inconsistent polymerization creates an irregular pore structure, leading to aberrant protein migration and poor resolution.
Polymerization Chemistry and Components
Gel formation relies on a free radical-induced co-polymerization reaction between acrylamide and the cross-linker, bisacrylamide [60] [32].
- Acrylamide/Bis-acrylamide: The ratio of these two determines the gel's pore size. The total concentration (%T) defines the gel's density, which should be selected based on the target protein size range [60] [32].
- Ammonium Persulfate (APS): The source of free radicals that initiate the polymerization reaction [60].
- TEMED (N,N,N',N'-Tetramethylethylenediamine): A catalyst that accelerates the decomposition of APS into free radicals, thereby controlling the rate of polymerization [60].
Table 3: Key Reagents for SDS-PAGE Gel Polymerization
| Reagent | Function | Critical Consideration for Reproducibility |
|---|---|---|
| Acrylamide/Bis-acrylamide | Forms the porous gel matrix. | Solution stability is finite; prepare fresh or use commercial stable solutions. Purity is critical [60]. |
| Ammonium Persulfate (APS) | Free radical initiator. | Freshness is critical. A 10% solution in water should be prepared fresh weekly or stored frozen in aliquots. Old APS leads to incomplete polymerization [60] [20]. |
| TEMED | Catalyst for polymerization. | Hygroscopic and oxidizes in air. Store tightly sealed and use fresh [60]. |
Optimal Gel Preparation Protocol
Protocol: Casting a Discontinuous SDS-Polyacrylamide Gel This protocol describes the preparation of a mini-gel with a resolving (separating) gel and a stacking gel [60] [20].
Part A: Preparing the Resolving Gel
- Assemble the gel cassette using clean, detergent-free glass plates and spacers to ensure no residues interfere with polymerization [60].
- Mix the resolving gel solution in a beaker. A typical 10% resolving gel formula for 10 mL is:
- 3.3 mL of 30% Acrylamide/Bis solution (29:1)
- 2.5 mL of Separating Gel Buffer (e.g., 1.5 M Tris-HCl, pH 8.8)
- 4.1 mL of Deionized Water
- 0.1 mL of 10% SDS [20]
- Initiate polymerization: Immediately before pouring, add:
- 50 µL of 10% Ammonium Persulfate (APS)
- 5 µL of TEMED Swirl gently to mix without introducing air bubbles.
- Pour the gel into the cassette, leaving space for the stacking gel.
- Overlay with a sealing agent such as water-saturated isopropanol or butanol to exclude oxygen and create a flat interface. Allow the gel to polymerize completely for 15-30 minutes, indicated by a distinct schlieren line between the gel and the overlay [60] [20].
Part B: Preparing and Casting the Stacking Gel
- Pour off the overlay from the polymerized resolving gel and rinse the top with deionized water. Remove excess water with filter paper [60].
- Mix the stacking gel solution. A typical 5% stacking gel formula for 5 mL is:
- 0.83 mL of 30% Acrylamide/Bis solution (29:1)
- 1.25 mL of Stacking Gel Buffer (e.g., 0.5 M Tris-HCl, pH 6.8)
- 2.9 mL of Deionized Water
- 0.05 mL of 10% SDS [20]
- Initiate polymerization: Add:
- 25 µL of 10% APS
- 5 µL of TEMED Mix gently.
- Pour the stacking gel directly onto the resolving gel and insert a clean comb without trapping air bubbles. Polymerize for 15-30 minutes [60].
Troubleshooting Polymerization Problems
Table 4: Common Gel Polymerization Issues and Solutions
| Problem | Potential Causes | Solutions |
|---|---|---|
| Incomplete or Slow Polymerization | Old or degraded APS/TEMED; Contaminated reagents; Oxygen inhibition. | Use fresh APS and TEMED; ensure all equipment is clean and reagents are pure; pour gels without delay after adding catalysts [60]. |
| Air Bubbles in the Gel Matrix | Vigorous stirring or pouring. | Mix solutions gently; pour slowly along an angle to minimize bubbling. Tap the cassette gently to dislodge any formed bubbles [60]. |
| Uneven Gel Surface / Smiling Bands | Uneven polymerization due to temperature gradients or improper sealing. | Ensure the gel casting apparatus is level; use a consistent, draft-free room temperature for polymerization [60]. |
The Scientist's Toolkit: Essential Reagents for SDS-PAGE
Table 5: Key Research Reagent Solutions for SDS-PAGE
| Reagent / Solution | Function | Standard Recipe / Concentration |
|---|---|---|
| 2X Laemmli Sample Buffer | Denatures proteins, provides charge and tracking dye. | 62.5 mM Tris-HCl (pH 6.8), 2% SDS, 10% Glycerol, 0.01% Bromophenol Blue. 5% β-mercaptoethanol or 100 mM DTT is added fresh for reducing conditions [8] [20]. |
| 10X SDS Running Buffer Stock | Concentrated stock for preparing the electrophoresis buffer. | 250 mM Tris, 1.92 M Glycine. Prepare without SDS. Store at room temperature [35]. |
| 30% Acrylamide/Bis Solution (29:1) | Stock solution for forming the gel matrix. | 29% acrylamide, 1% bisacrylamide in water. Filter and store at 4°C in a dark bottle [20]. |
| 10% Ammonium Persulfate (APS) | Radical initiator for gel polymerization. | 0.1 g APS in 1.0 mL deionized water. Prepare fresh weekly or store frozen in aliquots [20]. |
| Coomassie Staining Solution | Visualizes separated protein bands post-electrophoresis. | 0.25% Coomassie Brilliant Blue R-250, 40% Methanol, 10% Acetic Acid [20]. |
Workflow for Reproducible SDS-PAGE
The following workflow diagram integrates the critical checks for buffers and gel polymerization into the standard SDS-PAGE procedure, providing a visual guide for ensuring reproducibility.
In the context of protein separation research, the pursuit of reproducibility is a practical endeavor rooted in meticulous attention to foundational protocols. As detailed in this application note, the consistent use of fresh, correctly formulated buffers and the rigorous control of gel polymerization conditions are not minor preparatory details but are, in fact, decisive factors for success. By adhering to the standardized protocols for buffer preparation, storage, and gel casting outlined herein, researchers and drug development professionals can significantly minimize procedural variability. This ensures that the migration of protein standards and samples is reliable, allowing for accurate molecular weight determination and meaningful comparison of data across experiments, thereby strengthening the validity and impact of scientific findings.
Advanced Applications and Comparative Electrophoresis Technologies
Within the framework of protein separation research via SDS-PAGE, confirming the identity of a target protein and assessing the purity of a preparation are two critical and interconnected processes. Western blotting provides powerful immunodetection capabilities to validate a protein's identity, while purity assessment, often using the same SDS-PAGE separation, confirms the homogeneity of the sample. This application note details integrated methodologies for these validation techniques, providing researchers and drug development professionals with robust protocols to ensure data reliability and reproducibility. The foundational principle of SDS-PAGE, which separates proteins based on their molecular weight by masking intrinsic charges with sodium dodecyl sulfate (SDS), is a prerequisite for both applications [61] [15].
Antibody Validation for Western Blotting
Well-characterized antibody reagents are paramount for the reproducibility of research findings [62]. Antibody validation is the experimental proof and documentation that a particular antibody is suitable for the intended assay, which in this context means proof that the antibody is specific to its intended target when bound to a membrane and can selectively bind to that target within a complex heterogeneous sample [62].
Key Validation Strategies
A combination of strategies is recommended for assay-specific validation of an antibody [62]. The table below summarizes the core advanced techniques for enhanced antibody validation.
Table 1: Advanced Antibody Validation Techniques
| Technique | Core Principle | Key Outcome | Considerations |
|---|---|---|---|
| Genetic Validation [62] [63] | Use of CRISPR-Cas9 or RNAi to knock out/down the target protein gene. | Disappearance or significant reduction of the signal confirms specificity. | Considered a "gold standard" for Western blotting [62]. |
| Orthogonal Validation [63] | Comparison of protein expression data (Western blot) with RNA-Seq data. | Correlation between protein and RNA expression supports antibody validity. | Post-transcriptional regulation can affect correlation [63]. |
| Independent Antibody Validation [63] | Using other antibody-based assays (e.g., IHC, ELISA) to cross-validate results. | Matching staining patterns across platforms confirm specificity. | Assay context can influence antibody performance [62]. |
| Recombinant Expression Validation [63] | Overexpression of the tagged target protein in a sample. | Antibody detects the overexpressed protein, confirmed by the tag. | Overexpression can sometimes cause off-target binding [63]. |
| Migration Capture MS Validation [63] | Comparison of the protein size detected by antibody with results from Mass Spectrometry. | Matching sizes confirm the identity of the detected band. | Provides high-confidence identification of the band. |
Practical Experimental Protocol: Antibody Validation via Western Blot
A. Sample Preparation
- Prepare Lysates: Use cell lines or tissues known to express (positive control) and not express (negative control, e.g., KO lines from genetic validation) the target protein [62] [63].
- Lysis Buffer: Use a suitable ice-cold lysis buffer (e.g., RIPA buffer: 1% NP-40, 1% sodium deoxycholate, 0.1% SDS, 150 mM NaCl, 50 mM Tris-HCl, pH 7.8) supplemented with protease and phosphatase inhibitors to preserve protein integrity and phosphorylation states [61] [64].
- Homogenization: For tissues, snap-freeze in liquid nitrogen and homogenize using a Dounce homogenizer or sonication on ice. For cells, lyse directly with RIPA buffer [64].
- Protein Quantification: Clear the lysates by centrifugation. Measure the total protein concentration of the supernatant using a detergent-compatible assay like the Bradford assay [61] [64].
B. Determine Linear Dynamic Range
- Create a pooled sample from all lysates. Prepare a 1:2 dilution series (e.g., from 100 µg to ~0.2 µg) over at least 12 dilutions [64].
- Load and run the dilution series on an SDS-PAGE gel alongside a prestained protein ladder [65] [64].
- Transfer to a PVDF or nitrocellulose membrane and probe with the target antibody.
- Image the blot and plot the relative band density versus the protein load. Select the protein load for subsequent experiments that falls within the linear dynamic range (where density decreases consistently with dilution) [64].
C. Running the Validation Blot
- Load Samples: Load an equal amount of protein (determined from the linear range) for positive control, negative control (e.g., KO), and test samples. Include a prestained molecular weight marker [61] [64].
- SDS-PAGE & Transfer: Perform electrophoresis and electrophoretically transfer proteins to a membrane using a wet or semi-dry system [61] [66].
- Blocking: Incubate the membrane with a blocking buffer (e.g., 5% non-fat dry milk or BSA in TBST) for 1 hour to prevent non-specific binding [66].
- Primary Antibody Incubation: Incubate with the primary antibody at the optimized dilution in blocking buffer, typically for 1 hour at room temperature or overnight at 4°C [63].
- Washing: Wash the membrane at least four times for 3 minutes each with TBST [64].
- Secondary Antibody Incubation: Incubate with an enzyme-conjugated secondary antibody (e.g., HRP-conjugated) for 1 hour.
- Detection: Add a chemiluminescent substrate and capture the signal using a CCD-camera-based imager. Use software to obtain background-subtracted densitometric data [64] [63].
D. Interpretation of Results A valid antibody will produce a single, distinct band at the expected molecular weight in the positive control and test samples, with no band present in the KO negative control lane [62] [63]. Multiple bands may indicate cross-reactivity, while smeared bands can suggest protein degradation [62] [67].
Western Blot Antibody Validation Workflow
Protein Purity Assessment Using SDS-PAGE
SDS-PAGE is a cornerstone technique for the qualitative assessment of protein purity and homogeneity [68] [15] [69]. A pure protein sample is defined as one containing only a single molecular species, which, when separated by SDS-PAGE, yields a single band upon staining [69].
Principles of Purity Analysis
The interpretation of an SDS-PAGE gel for purity is typically straightforward: the investigator looks for the presence of a single, sharp band characteristic of the purified protein of interest [67]. The appearance of multiple or smeared bands suggests the presence of impurities, protein degradation, or incomplete denaturation [67] [15]. It is critical to remember that a single band is not absolute proof of purity, as a contaminant could comigrate with the target protein; it simply indicates the failure to detect contaminating species with this method [69].
Experimental Protocol: Assessing Purity by SDS-PAGE
A. Gel Electrophoresis
- Prepare Samples: Mix purified protein samples with Laemmli buffer (containing SDS and a reducing agent like β-mercaptoethanol), and heat denature at 95°C for 5 minutes [61] [15].
- Load Samples: Load equal amounts of protein (determined by a protein assay) alongside a molecular weight marker (protein ladder) [61] [67].
- Electrophoresis: Run the SDS-PAGE gel using a discontinuous buffer system until the dye front reaches the bottom.
B. Staining and Imaging
- Staining: After electrophoresis, stain the gel with Coomassie Brilliant Blue or a more sensitive silver stain to visualize protein bands [68].
- Imaging: Capture a high-quality digital image of the gel for analysis [67].
C. Data Analysis for Purity
- Identify Bands: Label all visible bands in each lane [67].
- Calculate Relative Mobility (Rf): For each band, measure the distance from the top of the separating gel to the band's center and to the dye front. Calculate Rf = (Distance to Band) / (Distance to Dye Front) [67].
- Generate Standard Curve: Plot the log of the molecular weight of the ladder standards against their Rf values on a semi-log graph [67].
- Determine Apparent Molecular Weight: Read the apparent molecular weight of the target protein and any potential contaminants from the standard curve [67].
- Assess Purity: A single, dominant band at the expected molecular weight indicates a high-purity preparation. Additional bands represent impurities or degradation products [68] [15] [69].
SDS-PAGE Purity Assessment Logic
The Scientist's Toolkit: Essential Research Reagents and Materials
The following table details key reagents and materials essential for successfully performing the protocols described in this application note.
Table 2: Essential Research Reagent Solutions for Western Blotting and Purity Assessment
| Item | Function/Purpose | Key Considerations |
|---|---|---|
| Primary Antibodies [62] [63] | Binds specifically to the target protein of interest. | Select antibodies validated for Western blotting. Recombinant monoclonals offer superior batch-to-batch consistency [62] [63]. |
| Secondary Antibodies [66] | conjugated with enzymes like HRP, binds the primary antibody for detection. | Must be raised against the host species of the primary antibody. |
| SDS-PAGE Gels [61] [15] | Polyacrylamide matrix that separates proteins by molecular weight. | Gel percentage (e.g., 8-15%) determines resolution range. Gradient gels can resolve a wider size range [15]. |
| Transfer Membrane [61] [66] | Surface to which separated proteins are blotted for probing. | PVDF membranes offer high protein binding capacity and chemical resistance. Nitrocellulose is a common alternative [61] [66]. |
| Protein Ladder [61] [65] | Prestained molecular weight standards for estimating protein size. | Prestained markers allow visual tracking of transfer and molecular weight calibration [65] [67]. |
| Lysis Buffer (e.g., RIPA) [61] [64] | Lyses cells/tissues and extracts proteins while maintaining stability. | Should include protease/phosphatase inhibitors. Detergent choice depends on protein localization and solubility [61] [64]. |
| Blocking Agent [66] | (e.g., BSA, non-fat dry milk) reduces non-specific antibody binding to the membrane. | Choice can impact background signal and antibody performance; BSA is preferred for phospho-specific antibodies [62] [66]. |
| Detection Substrate [66] [64] | (e.g., Chemiluminescent) generates light signal upon reaction with the enzyme on the secondary antibody. | Sensitivity and dynamic range vary between substrates. |
Within the broader context of thesis research on protein separation by molecular weight, Sodium Dodecyl Sulfate-Polyacrylamide Gel Electrophoresis (SDS-PAGE) stands as a fundamental methodological pillar. The standard SDS-PAGE protocol, developed by Laemmli, provides high-resolution separation of complex protein mixtures based primarily on molecular mass by denaturing proteins and masking their intrinsic charges [7]. However, this denaturation destroys functional properties, including enzymatic activity and non-covalently bound metal ions, which presents a significant limitation for researchers studying native protein function [51]. While Blue Native (BN)-PAGE preserves protein function, it does so at the cost of the superior resolving power offered by SDS-PAGE [51]. To address this methodological gap, Native SDS-PAGE (NSDS-PAGE) has been developed as a modified electrophoretic technique that maintains excellent protein resolution while preserving functional characteristics and metal cofactors essential for metalloprotein studies [51]. This application note provides detailed protocols and experimental validation for implementing NSDS-PAGE in protein research, particularly relevant for drug development professionals investigating metalloenzyme function and protein-metal interactions.
Comparative Analysis of Electrophoretic Techniques
Understanding the fundamental differences between electrophoretic methods is crucial for selecting the appropriate technique for specific research objectives. The table below summarizes the key characteristics of three common PAGE approaches:
Table 1: Comparison of Electrophoretic Techniques for Protein Separation
| Criteria | SDS-PAGE | BN-PAGE | NSDS-PAGE |
|---|---|---|---|
| Separation Basis | Molecular weight only [70] | Size, charge, and shape [70] | Molecular weight with native state preservation [51] |
| Protein State | Denatured [70] | Native/folded [70] | Native/folded [51] |
| Functional Retention | No functionality preserved [70] | Functional activity preserved [51] [70] | Functional activity and metal cofactors preserved [51] |
| SDS Presence | High SDS concentrations (0.1-1%) [51] [7] | No SDS [70] | Reduced SDS (0.0375%) [51] |
| Sample Preparation | Heating (70-95°C) with reducing agents [7] [8] | No heating [70] | No heating or EDTA [51] |
| Metal Cofactor Retention | Minimal (26%) [51] | High retention [51] | High retention (98%) [51] |
| Resolution | High [51] | Moderate [51] | High [51] |
| Typical Applications | Molecular weight determination, purity assessment [70] | Protein-protein interactions, oligomeric state analysis [51] | Metalloprotein studies, functional proteomics [51] |
The following workflow diagram illustrates the procedural differences between these three electrophoretic methods:
Native SDS-PAGE Protocol
Reagent Preparation
The successful implementation of NSDS-PAGE requires careful preparation of specialized buffers that differ significantly from traditional SDS-PAGE formulations.
Table 2: NSDS-PAGE Buffer Compositions
| Buffer Component | NSDS-PAGE Formulation | Standard SDS-PAGE Formulation | Function |
|---|---|---|---|
| Sample Buffer | 100 mM Tris HCl, 150 mM Tris Base, 10% glycerol, 0.0185% Coomassie G-250, 0.00625% Phenol Red, pH 8.5 [51] | 106 mM Tris HCl, 141 mM Tris Base, 0.51 mM EDTA, 2% LDS, 0.22 mM SERVA Blue G-250, 0.175 mM Phenol Red, 10% glycerol, pH 8.5 [51] | Protein solubilization with minimal denaturation |
| Running Buffer | 50 mM MOPS, 50 mM Tris Base, 0.0375% SDS, pH 7.7 [51] | 50 mM MOPS, 50 mM Tris Base, 1 mM EDTA, 0.1% SDS, pH 7.7 [51] | Provides electrophoretic current with reduced denaturation |
| SDS Concentration | 0.0375% [51] | 0.1% [51] | Minimal denaturation while maintaining separation |
| EDTA | Absent [51] | Present (1 mM) [51] | Preserves metal cofactors |
| Reducing Agents | Absent [51] | Often present (DTT, BME) [8] | Maintains native protein structure |
Step-by-Step Procedure
Gel Preparation: Use precast NuPAGE Novex 12% Bis-Tris 1.0 mm mini-gels or equivalent. Prior to sample loading, run the gel at 200V for 30 minutes in double distilled H₂O to remove storage buffer and any unpolymerized acrylamide [51].
Sample Preparation:
- Combine 7.5 μL of protein sample (5-25 μg protein) with 2.5 μL of 4X NSDS sample buffer [51].
- Do not heat the samples—this is a critical distinction from standard SDS-PAGE where samples are typically heated to 70-95°C for 5-10 minutes [51] [8].
- Avoid EDTA and reducing agents in sample preparation to preserve metal cofactors and native protein structure [51].
Electrophoresis:
- Load prepared samples into gel wells alongside appropriate molecular weight standards.
- Run electrophoresis at constant voltage (200V) for approximately 45 minutes using NSDS-PAGE running buffer until the dye front reaches the end of the gel [51].
- Maintain room temperature conditions throughout the procedure [51].
Post-Electrophoresis Analysis:
- Proteins can be visualized using standard staining techniques (e.g., Coomassie Brilliant Blue) [71].
- For metalloprotein detection, utilize laser ablation-inductively coupled plasma-mass spectrometry (LA-ICP-MS) or in-gel zinc staining with fluorophores such as TSQ [51].
- Enzyme activity assays can be performed directly on gel sections to confirm functional retention [51].
Experimental Validation and Applications
Functional Retention Assessment
Rigorous testing has demonstrated the superior functional preservation capabilities of NSDS-PAGE compared to traditional methods:
Table 3: Experimental Validation of NSDS-PAGE Efficacy
| Parameter Assessed | SDS-PAGE Performance | NSDS-PAGE Performance | Experimental Details |
|---|---|---|---|
| Zinc Retention | 26% retention [51] | 98% retention [51] | Measured using LA-ICP-MS in proteomic samples from LLC-PK1 cells [51] |
| Enzyme Activity | 0/9 model enzymes active [51] | 7/9 model enzymes active [51] | Tested on Zn-proteins including alcohol dehydrogenase, alkaline phosphatase, superoxide dismutase, carbonic anhydrase [51] |
| Protein Resolution | High resolution maintained [51] | High resolution maintained [51] | Comparable separation patterns in electrophoretograms of LLC-PK1 proteome fractions [51] |
| Metal Cofactor Detection | Not applicable due to denaturation | Successful visualization using TSQ staining [51] | Fluorophore TSQ enabled specific zinc-protein detection in gels [51] |
Practical Applications in Research
NSDS-PAGE provides particular utility in several research contexts:
- Metalloprotein Studies: The method enables analysis of metal-containing proteins while maintaining their metal cofactors and functional states, making it invaluable for metallomics research [51].
- Enzyme Function Analysis: Researchers can separate complex protein mixtures while retaining enzymatic activity for subsequent functional assays [51].
- Drug Development: Pharmaceutical researchers can investigate protein-metal interactions relevant to drug mechanisms while maintaining high-resolution separation [51].
- Protein Purification Tracking: The technique allows monitoring of purification processes without denaturing the target protein, particularly important for functional characterization [70].
The following diagram illustrates a typical workflow for implementing NSDS-PAGE in metalloprotein research:
Research Reagent Solutions
Successful implementation of NSDS-PAGE requires specific reagents optimized for native protein separation:
Table 4: Essential Reagents for NSDS-PAGE
| Reagent | Function | NSDS-PAGE Specific Considerations |
|---|---|---|
| Tris-Based Buffers | Maintain pH during electrophoresis | Higher Tris concentration in sample buffer (250 mM total) compared to standard formulations [51] |
| SDS | Impart negative charge to proteins | Reduced concentration (0.0375%) in running buffer to minimize denaturation [51] |
| Coomassie G-250 | Tracking dye | Lower concentration (0.0185%) compared to standard SDS-PAGE formulations [51] |
| Glycerol | Increase sample density for gel loading | Standard concentration (10%) maintained for sample loading [51] |
| Acrylamide Bis-Tris Gels | Separation matrix | Precast 12% Bis-Tris gels recommended; precondition with water rinse [51] |
| Phenol Red | Migration indicator | Reduced concentration (0.00625%) in sample buffer [51] |
Native SDS-PAGE represents a significant methodological advancement that bridges the gap between the high resolution of denaturing SDS-PAGE and the functional preservation of BN-PAGE. By modifying buffer compositions to include reduced SDS concentrations while eliminating EDTA and heating steps, researchers can achieve excellent protein separation while maintaining metal cofactors and enzymatic activity in most cases. The protocol validation demonstrating 98% zinc retention and preserved activity in 7 of 9 model enzymes confirms the technique's utility for metalloprotein research and functional proteomics. For drug development professionals and researchers investigating protein-metal interactions, NSDS-PAGE offers a powerful tool that combines the familiar principles of SDS-PAGE with the native preservation capabilities previously only available through lower-resolution methods. This modified electrophoretic approach enables new experimental possibilities for characterizing functional protein properties while maintaining the separation resolution essential for analytical protein biochemistry.
Capillary Electrophoresis with Sodium Dodecyl Sulfate (CE-SDS) has emerged as a superior, automated alternative to traditional SDS-PAGE for protein analysis in biopharmaceutical development. This application note details how CE-SDS addresses key limitations of slab gel electrophoresis by providing automated, quantitative analysis with exceptional reproducibility. The document provides a comprehensive comparison of analytical performance, detailed protocols for method implementation, and specific examples of enhanced resolution for therapeutic proteins, including monoclonal antibodies and low-molecular-weight proteins. Supported by experimental data and workflow visualizations, this note serves as an essential resource for researchers seeking to implement this robust technology for protein characterization.
Within the framework of SDS-PAGE protocol development for protein separation by molecular weight, the limitations of traditional slab gel electrophoresis are well-documented: time-consuming manual processes, semi-quantitative data, and significant inter-experiment variability [72]. Capillary Electrophoresis with Sodium Dodecyl Sulfate (CE-SDS) represents a technological evolution that directly addresses these shortcomings while operating on familiar principles of size-based separation under denaturing conditions.
In CE-SDS, proteins are denatured, complexed with SDS, and electrophoresed through a polymer-based sieving matrix filled within a fused-silica capillary [73] [74]. The fundamental advancement lies in its automation and on-capillary detection, which eliminates the need for gel staining, destaining, and manual imaging [72]. This technique has gained formal recognition from regulatory authorities, including the United States Pharmacopeia (USP) General Chapter <129>, which outlines its application for analyzing therapeutic monoclonal antibodies [72]. For researchers engaged in protein separation, CE-SDS offers a paradigm shift from qualitative gel interpretation to precise, quantitative analysis, thereby enhancing decision-making in biopharmaceutical development and quality control.
Comparative Analysis: CE-SDS vs. SDS-PAGE
A direct comparison of analytical performance highlights the distinct advantages of CE-SDS for protein purity and heterogeneity analysis.
Side-by-Side Methodology Comparison
The core procedural differences between the two techniques are summarized in Table 1.
Table 1: Methodological and Operational Comparison of SDS-PAGE and CE-SDS
| Aspect | SDS-PAGE | CE-SDS |
|---|---|---|
| Automation | Manual process | Highly automated [72] |
| Separation Medium | Polyacrylamide gel [74] | Replaceable polymer-based sieving matrix [74] [72] |
| Detection Method | Coomassie or fluorescent staining, requires imaging [72] | On-capillary UV absorbance detection at 214 or 220 nm [73] [45] |
| Data Output | Banding patterns on a gel [74] | Electropherogram (peak profile) [74] |
| Run Time | Several hours (including staining/destaining) [74] [72] | 5–35 minutes per sample [45] [72] |
| Quantification | Semi-quantitative via densitometry [72] | Fully quantitative via peak integration [72] |
| Sample Throughput | Lower; limited by gel lanes | Higher; automated multi-capillary systems available [75] |
| Reproducibility | Variable; dependent on manual steps [72] | High; %RSD for corrected peak area typically <1% [75] |
Analytical Performance Data
Comparative studies consistently demonstrate the superior resolution and quantitative capabilities of CE-SDS. In an analysis of a monoclonal antibody (IgG), CE-SDS successfully resolved and quantified nonglycosylated heavy chain, a critical quality attribute that was not detectable by SDS-PAGE under the same conditions [45]. Furthermore, the signal-to-noise ratio for impurity peaks in heat-stressed IgG samples was significantly higher in CE-SDS electropherograms compared to scanned SDS-PAGE gels, facilitating more accurate integration and quantitation [45].
Reproducibility data from multi-capillary systems underscores the robustness of CE-SDS. The relative migration time for a heavy chain fragment showed a %RSD of 1.1%, and the corrected peak area for the non-glycosylated heavy chain (a minor peak) showed a %RSD of 0.85% [75]. This level of precision is difficult to achieve with manual SDS-PAGE.
Table 2: Quantitative Performance of CE-SDS in mAb Analysis
| Performance Metric | Result | Conditions / Notes |
|---|---|---|
| Migration Time Reproducibility (Heavy Chain) | %RSD = 0.83% - 1.1% | Based on 15 consecutive runs on PA 800 Plus and BioPhase 8800 systems [75] |
| Peak Area Reproducibility (Non-glycosylated HC) | %RSD = 0.54% - 0.85% | Smallest peak in the separation trace [75] |
| Resolution (ng-HC vs. HC) | Rs = 1.39 - 1.43 | Baseline separation achieved [75] |
| Limit of Detection (LOD) | 2.4 μg/mL (UV)4 ng/mL (LIF) | For reduced NISTmAb [75] |
| Limit of Quantification (LOQ) | 4.9 μg/mL (UV)10 ng/mL (LIF) | For reduced NISTmAb [75] |
CE-SDS Experimental Protocol
The following section provides a detailed methodology for CE-SDS analysis of a reduced monoclonal antibody, based on established protocols using the SCIEX SDS-MW Analysis Assay Kit and PA 800 Plus or BioPhase 8800 systems [73] [75].
Reagents and Equipment
- CE Instrument: PA 800 Plus Pharmaceutical Analysis System (SCIEX) or equivalent capillary electrophoresis system with UV detection and temperature control [73] [75].
- Capillary: Bare fused silica, 50 μm internal diameter (ID), 20 cm effective length (30 cm total length) [73].
- SDS-MW Analysis Assay Kit (SCIEX): Contains SDS-MW Gel Buffer, Sample Buffer, 10 kDa internal standard, and SDS-MW Size Standard [73] [75].
- Chemicals: HPLC grade water, 2-mercaptoethanol (for reduced analysis) or iodoacetamide (for non-reduced analysis) [73].
- Therapeutic Protein Sample: e.g., Monoclonal antibody at 1-2 mg/mL concentration [45] [75].
Sample Preparation
- Dilution: Dilute the antibody sample to 1.0 mg/mL with the provided SDS sample buffer [45] [75].
- Reduction: Add 2-mercaptoethanol to the sample to a final concentration of 5% (v/v). Mix thoroughly [75].
- Denaturation: Heat the sample at 70°C for 10 minutes (or at 100°C for 3 minutes) to denature the proteins [73] [75].
- Cooling: Cool the denatured sample to room temperature before injection.
- Internal Standard: For precise relative migration time calculation, the 10 kDa protein internal standard can be added either directly to the sample or run in a separate well [73] [75].
Instrumental Setup and Separation
- Capillary Conditioning: Before the first run or as part of a routine sequence, rinse the capillary with:
- Sample Injection: Electrokinetically inject the sample at 5 kV for 10-20 seconds [73] [45].
- Separation: Apply an electric field of 500-670 V/cm in reversed polarity mode (anode at the detection side) for 25-35 minutes [73] [75].
- Detection: Use UV absorbance detection at 220 nm [45] [75].
- Capillary Temperature: Set the cartridge temperature between 20°C and 25°C as a starting point. Note that temperature can be optimized to improve resolution for specific protein pairs (see Section 4.1) [73].
Data Analysis
- Identification: Identify protein peaks based on their relative migration times compared to the internal standard and a molecular weight ladder.
- Quantification: Integrate the peaks and report the results as corrected peak area percentages for each species (e.g., Light Chain, Heavy Chain, Non-glycosylated Heavy Chain, and other fragments) [75]. The software automatically performs this calculation.
The following workflow diagram summarizes the key steps of the CE-SDS protocol and its advantages.
Advanced Applications and Optimization
Temperature as an Optimization Parameter
A key advantage of CE-SDS is the precise control over separation parameters, with temperature being a critical factor for resolving challenging pairs of protein species. The electromigration of protein-SDS complexes is an activated process, with each molecule having a unique activation energy requirement for moving through the sieving matrix [73] [76]. According to the underlying theory, electrophoretic mobility (μ) is influenced by the absolute temperature (T), as shown in the simplified relationship: μ ∝ exp(-E~a~/RT) / Mw^1/6^, where E~a~ is the activation energy and R is the universal gas constant [73].
Practical Implementation: Researchers can systematically vary the capillary cartridge temperature (e.g., 20°C, 30°C, 40°C, 50°C) and analyze the resolution between peaks of interest [73]. For instance, in a mixture containing a 10 kDa standard, a nanobody, and the light/heavy chains of a mAb, increasing the temperature enhanced the resolution between the 10 kDa protein and the nanobody, while it decreased the resolution between the nanobody and the light chain [73]. This indicates that temperature optimization is molecule-specific and can be used to fine-tune the separation for a given sample.
Analysis of Low-Molecular-Weight Proteins and Aggregates
CE-SDS has proven particularly valuable for characterizing low-molecular-weight (LMW) proteins and peptides, which can be challenging to analyze by size-exclusion chromatography (SE-HPLC). Using insulin glargine as a model protein, CE-SDS effectively separated and monitored the formation of covalent monomers, dimers, and trimers under stress conditions [77]. Mass spectrometry confirmed the identity of these aggregates. Notably, SE-HPLC showed only a single aggregate peak, whereas CE-SDS provided a more detailed profile, making it an excellent complementary technique for studying LMW protein aggregation [77].
The Scientist's Toolkit: Essential Research Reagents and Materials
Successful implementation of CE-SDS relies on a set of specific reagents and consumables. The following table details the key components required for analysis.
Table 3: Essential Reagents and Materials for CE-SDS Analysis
| Item | Function / Description | Example Product / Composition |
|---|---|---|
| SDS-MW Gel Buffer | Polymer-based sieving matrix for size-based separation; optimized for proteins up to 225 kDa. | SCIEX SDS-MW Gel Buffer (borate cross-linked dextran) [73] |
| SDS Sample Buffer | Denaturing buffer for sample preparation; contains SDS, Tris-HCl at pH ~9.0, and other additives. | SCIEX SDS-MW Sample Buffer [73] [75] |
| Molecular Weight Standard | A mixture of known proteins for system suitability testing and apparent molecular weight calibration. | SDS-MW Size Standard (e.g., 10-225 kDa range) [73] |
| Internal Standard | A reference compound (e.g., 10 kDa protein) added to the sample for precise relative migration time calculation. | 10 kDa Protein Internal Standard [73] [75] |
| Reducing Agent | Breaks disulfide bonds for reduced analysis, separating heavy and light chains of antibodies. | 2-Mercaptoethanol (5% v/v final conc.) [73] [75] |
| Capillaries | Bare fused silica capillaries of defined internal diameter and effective/total length. | 50 μm ID, 20/30 cm length [73] |
| Conditioning Reagents | Solutions for maintaining capillary performance and reproducibility between runs. | 0.1 M Sodium Hydroxide (NaOH), 0.1 M Hydrochloric Acid (HCl) [73] [75] |
Protein electrophoresis is a foundational laboratory technique in which charged protein molecules are transported through a solvent by an electrical field, enabling the separation of complex protein mixtures based on physical characteristics such as size, charge, or shape [78]. This analytical family of techniques represents a simple, rapid, and sensitive tool for protein analysis that has become indispensable in biochemical research and biopharmaceutical development. The core principle relies on the fact that most biological molecules carry a net charge at any pH other than their isoelectric point and will migrate through a porous matrix at a rate proportional to their charge density when subjected to an electric field [78]. The mobility of a molecule is influenced by field strength, net charge, size and shape, ionic strength, and the properties of the matrix through which it migrates.
Among the various electrophoretic methods, three techniques have emerged as particularly significant for different applications in protein science: Sodium Dodecyl Sulfate-Polyacrylamide Gel Electrophoresis (SDS-PAGE), Blue Native Polyacrylamide Gel Electrophoresis (BN-PAGE), and Capillary Electrophoresis-Sodium Dodecyl Sulfate (CE-SDS). Each method offers distinct advantages and limitations, making them suitable for different research questions and applications. SDS-PAGE provides high-resolution separation of denatured proteins by molecular weight, BN-PAGE preserves native protein complexes for functional studies, and CE-SDS offers automated, quantitative analysis of protein purity, particularly valuable in therapeutic protein development [51] [45] [79]. This article provides a comprehensive comparative analysis of these three techniques, including their fundamental principles, applications, detailed protocols, and relative advantages to guide researchers in selecting the most appropriate method for their specific protein separation needs.
Fundamental Principles and Comparative Analysis
SDS-PAGE: Denaturing Separation by Molecular Weight
Principle and Mechanism: SDS-PAGE is a discontinuous electrophoretic system that separates proteins primarily by molecular mass under denaturing conditions [7] [78]. The technique employs the anionic detergent sodium dodecyl sulfate (SDS), which denatures proteins by wrapping around the polypeptide backbone and conferring a uniform negative charge density. When a protein mixture is heated to 70-100°C in the presence of SDS and a reducing agent (e.g., β-mercaptoethanol or dithiothreitol), disulfide bonds are cleaved and the protein is fully dissociated into its subunits [7] [78]. Most polypeptides bind SDS in a constant weight ratio of approximately 1.4 g SDS per 1 g of polypeptide, rendering the intrinsic charges of the polypeptides insignificant compared to the negative charges contributed by SDS [7]. The resulting SDS-polypeptide complexes assume rod-like structures with essentially identical charge-to-mass ratios and similar shapes, allowing separation based almost exclusively on polypeptide size rather than charge or structural features [78].
The electrophoresis is typically performed using a discontinuous buffer system that significantly enhances band sharpness [80]. This system employs a stacking gel with larger pores and a different pH that concentrates proteins into a sharp band before they enter the resolving gel where separation occurs. The Laemmli system, which uses tris-glycine buffers, stacks at pH 6.8 and resolves at pH ~8.3-9.0, though more recent bis-tris systems operating at lower pH (e.g., 6.5) help prevent disulfide bond formation between cysteine residues [80]. During electrophoresis, the polyacrylamide gel acts as a molecular sieve, with smaller proteins migrating more rapidly through the gel matrix than larger proteins [78].
BN-PAGE: Native Separation of Protein Complexes
Principle and Mechanism: BN-PAGE is a native electrophoresis technique that enables the separation of protein complexes in their biologically active state, preserving functional properties including enzymatic activity and non-covalently bound cofactors such as metal ions [81] [51] [79]. Unlike SDS-PAGE, BN-PAGE uses non-denaturing conditions and the anionic dye Coomassie Blue G-250 to impart charge to protein complexes without disrupting their structure [81]. The dye binds to the surface of proteins, providing the necessary negative charges for electrophoretic separation while maintaining protein-protein interactions within multiprotein complexes [81] [80].
In BN-PAGE, proteins are separated according to their hydrodynamic size and shape in a polyacrylamide matrix, with migration dependent on both mass and charge characteristics of the native complexes [79]. The technique is particularly valuable for studying multiprotein complexes (MPCs), which play crucial roles in cell signaling and most cellular processes [79]. BN-PAGE offers higher resolution for native complexes than alternative techniques such as gel filtration or sucrose density ultracentrifugation, making it ideal for determining the size, composition, and relative abundance of protein complexes [79]. The method typically involves a first-dimension BN-PAGE separation followed by a second-dimension denaturing SDS-PAGE, which further subdivides the native complexes into their individual polypeptide constituents [81] [79]. A notable limitation is that Coomassie dye can sometimes act as a detergent causing complexes to dissociate, and it may interfere with subsequent detection methods such as chemiluminescence or fluorescence assays [80].
CE-SDS: Automated Quantitative Analysis
Principle and Mechanism: CE-SDS represents an advanced adaptation of traditional SDS-PAGE that incorporates capillary electrophoresis for automated, quantitative protein purity analysis [45] [82]. In this technique, protein samples are denatured in the presence of SDS and electrophoretically separated by molecular weight through a sieving polymer matrix within a fused-silica capillary [45]. The method provides the same fundamental separation principle as SDS-PAGE—separation based on molecular size after SDS binding—but with enhanced resolution, quantitation, and automation capabilities [45].
Detection occurs near the distal end of the capillary using UV absorbance at 220 nm, eliminating the need for gel staining or destaining procedures required in traditional SDS-PAGE [45]. The quantitative nature of CE-SDS, combined with its high resolution and excellent signal-to-noise ratio, makes it particularly valuable for therapeutic protein characterization where precise quantification of degradation products or variants is essential [45]. Recent innovations in this field include the use of alternative detergents such as sodium hexadecyl sulfate (SHS), which has been shown to improve peak resolution and symmetry for certain therapeutic proteins that do not separate optimally with traditional SDS [82]. This adaptability to different separation chemistries underscores the versatility of the capillary electrophoresis platform for protein analysis.
Table 1: Core Characteristics of SDS-PAGE, BN-PAGE, and CE-SDS
| Characteristic | SDS-PAGE | BN-PAGE | CE-SDS |
|---|---|---|---|
| Separation Principle | Molecular mass of denatured polypeptides [78] | Hydrodynamic size & shape of native complexes [79] | Molecular mass of denatured polypeptides [45] |
| Protein State | Denatured (unfolded) [7] | Native (folded) [81] | Denatured (unfolded) [45] |
| Key Reagents | SDS, reducing agents [7] | Coomassie Blue G-250, aminocaproic acid [81] | SDS, sieving polymer [45] |
| Detection Method | Staining (Coomassie, silver) or western blot [80] | Staining, western blot, activity assays [81] [51] | UV absorbance [45] |
| Throughput | Medium (multiple samples per gel) [5] | Medium (multiple samples per gel) [81] | High (automated) [45] |
| Quantitation | Semi-quantitative (densitometry) [45] | Semi-quantitative (densitometry) [81] | Fully quantitative [45] |
| Key Applications | Molecular weight determination, purity assessment [51] [78] | Protein-protein interactions, complex composition [81] [79] | Therapeutic protein purity, quality control [45] |
Table 2: Functional Retention and Resolution Comparison
| Property | SDS-PAGE | BN-PAGE | CE-SDS |
|---|---|---|---|
| Enzymatic Activity Retention | No (all denatured) [51] | Yes (7 of 9 model enzymes active) [51] | No (denatured) [45] |
| Metal Cofactor Retention | Minimal (26% Zn²⁺ retained) [51] | High [51] | Minimal (denaturing conditions) [45] |
| Resolution | High [51] | Moderate [51] | Very High [45] |
| Molecular Weight Resolution Range | 5-250 kDa [7] | Broad range for complexes [81] | Similar to SDS-PAGE with enhanced resolution [45] |
| Multiprotein Complex Analysis | No (dissociates complexes) [7] | Yes (specialty) [81] [79] | No (dissociates complexes) [45] |
Diagram 1: Methodological workflows for SDS-PAGE, BN-PAGE, and CE-SDS techniques showing key procedural differences.
Detailed Experimental Protocols
SDS-PAGE Protocol
Sample Preparation:
- Dilute protein samples to an appropriate concentration (typically 0.1-1 mg/mL) in a suitable buffer [5].
- Mix protein sample with SDS-PAGE sample buffer (e.g., 2.5 μL 4X LDS sample buffer with 7.5 μL protein sample) containing SDS and reducing agent [51].
- Heat the mixture at 70-100°C for 5-10 minutes to denature proteins [7].
- Centrifuge briefly to collect condensation.
Gel Preparation:
- Assemble glass plates with spacers (typically 0.75-1.5 mm thickness) in a casting stand [5].
- Prepare resolving gel solution according to desired acrylamide percentage (Table 3), adding APS and TEMED last to initiate polymerization [5].
- Pour resolving gel between plates, leaving space for stacking gel, and overlay with isopropanol or water to create a flat interface.
- After polymerization (30-45 minutes), remove overlay, rinse with water, and prepare stacking gel solution.
- Pour stacking gel, insert comb, and allow to polymerize for 20-30 minutes [5].
Table 3: SDS-PAGE Gel Recipes for Different Protein Size Ranges
| Component | 8% Gel | 10% Gel | 12% Gel | 15% Gel | Stacking Gel |
|---|---|---|---|---|---|
| 30% Acrylamide Mix (mL) | 4.0 | 5.0 | 6.0 | 7.5 | 1.98 |
| 1.5M Tris-HCl, pH 8.8 (mL) | 3.75 | 3.75 | 3.75 | 3.75 | - |
| 0.5M Tris-HCl, pH 6.8 (mL) | - | - | - | - | 3.78 |
| 10% SDS (μL) | 150 | 150 | 150 | 150 | 150 |
| H₂O (mL) | 7.0 | 6.0 | 5.0 | 3.5 | 9.0 |
| 10% APS (μL) | 75 | 75 | 75 | 75 | 75 |
| TEMED (μL) | 7.5 | 7.5 | 7.5 | 7.5 | 15 |
| Optimal Protein Separation Range (kDa) | 25-200 | 15-100 | 10-70 | 12-45 | - |
Electrophoresis:
- Place polymerized gel in electrophoresis chamber and fill with running buffer (e.g., 25 mM Tris, 192 mM glycine, 0.1% SDS, pH 8.3) [81] [7].
- Load prepared samples and molecular weight markers into wells (typical volumes: 10-30 μL depending on well size) [5].
- Run electrophoresis at constant voltage (100-200 V) until dye front reaches bottom of gel (approximately 45-90 minutes for mini-gels) [51].
- Proceed to protein detection by staining (Coomassie, silver stain) or western blotting [80].
BN-PAGE Protocol
Mitochondrial Sample Preparation:
- Resuspend 0.4 mg of sedimented mitochondria in 40 μL of 0.75 M aminocaproic acid, 50 mM Bis-Tris, pH 7.0 [81].
- Add 7.5 μL of 10% n-dodecyl-β-D-maltopyranoside (lauryl maltoside) [81].
- Mix and incubate for 30 minutes on ice for solubilization.
- Centrifuge at 72,000 × g for 30 minutes at 4°C to remove insoluble material [81].
- Collect supernatant and add 2.5 μL of 5% Coomassie blue G in 0.5 M aminocaproic acid [81].
- Add protease inhibitors (e.g., 1 mM PMSF, 1 μg/mL leupeptin, 1 μg/mL pepstatin) [81].
BN-Gel Preparation:
- Prepare a linear gradient gel (typically 4-15% or 6-13% acrylamide) using a gradient mixer [81] [79].
- For a 6-13% gradient, prepare low (6%) and high (13%) acrylamide solutions:
- Pour gradient gel between glass plates and overlay with isopropanol.
- After polymerization, prepare and add stacking gel (3.2% acrylamide) with comb [79].
BN-Electrophoresis:
- Load prepared samples (5-20 μL) into wells at 4°C [81].
- Fill inner chamber with cathode buffer (50 mM Tricine, 15 mM Bis-Tris, 0.02% Coomassie blue G, pH 7.0) and outer chamber with anode buffer (50 mM Bis-Tris, pH 7.0) [81].
- Run electrophoresis at 150 V for approximately 2 hours or until dye front approaches bottom of gel [81].
- For second dimension analysis, excise BN-PAGE lane, soak in SDS-PAGE denaturing buffer, and place on SDS-PAGE gel [81] [79].
CE-SDS Protocol
Sample Preparation:
- Dilute antibody or protein sample to 1.0 mg/mL with SDS sample buffer [45].
- For non-reduced analysis, heat at 70°C for 3 minutes [45].
- For reduced analysis, add reducing agent (e.g., β-mercaptoethanol) and heat at 70°C for 10 minutes [45].
Capillary Electrophoresis:
- Rinse capillary with separation gel buffer according to manufacturer specifications.
- Inject prepared samples into capillary inlet using high voltage (5 kV for 20 seconds) [45].
- Separate proteins in an electric field of 500 V/cm for 30-35 minutes using SDS-gel buffer in replaceable sieving matrix [45].
- Detect proteins by UV absorbance at 220 nm near distal end of capillary [45].
- Analyze electrophoregrams using instrument software for peak identification and quantitation [45].
Research Reagent Solutions
Table 4: Essential Reagents and Materials for Electrophoresis Techniques
| Reagent/Material | Function/Purpose | Technique |
|---|---|---|
| SDS (Sodium Dodecyl Sulfate) | Denatures proteins and confers uniform negative charge [7] | SDS-PAGE, CE-SDS |
| Coomassie Blue G-250 | Imparts charge to native protein complexes for electrophoresis [81] | BN-PAGE |
| Acrylamide/Bis-acrylamide | Forms crosslinked polymer network for molecular sieving [78] | SDS-PAGE, BN-PAGE |
| n-Dodecyl-β-D-maltopyranoside | Mild detergent for solubilizing membrane proteins without disrupting complexes [81] | BN-PAGE |
| 6-Aminocaproic Acid | Provides ionic strength and minimizes protein aggregation [81] | BN-PAGE |
| Tris-Based Buffers | Maintain pH during electrophoresis for optimal protein separation [81] [7] | All Techniques |
| TEMED/APS | Catalyzes acrylamide polymerization (free radical initiation) [78] | SDS-PAGE, BN-PAGE |
| DTT/β-Mercaptoethanol | Reducing agents for cleaving disulfide bonds [7] | SDS-PAGE, CE-SDS |
| Molecular Weight Markers | Reference standards for size determination [78] | All Techniques |
| PVDF/Nitrocellulose Membranes | Protein immobilization for immunodetection [81] | SDS-PAGE, BN-PAGE |
Applications and Method Selection
Application-Specific Method Recommendations
Therapeutic Protein Purity Analysis: CE-SDS is particularly well-suited for therapeutic protein characterization, especially for monoclonal antibodies, where precise quantification of fragments, aggregates, and variants is critical for quality control [45]. The method provides superior resolution and signal-to-noise ratio compared to traditional SDS-PAGE, enabling detection of specific variants such as nonglycosylated IgG that may not be resolved by gel-based methods [45]. The quantitative nature, automation capability, and excellent reproducibility make CE-SDS ideal for regulated environments where documentation and comparability between batches are essential [45].
Protein Complex Analysis: BN-PAGE is the method of choice for studying multiprotein complexes, protein-protein interactions, and oligomerization states [83] [79]. Its ability to preserve native protein structures and interactions makes it invaluable for investigating the composition, stoichiometry, and assembly of protein complexes such as the mitochondrial oxidative phosphorylation system, proteasomes, and other macromolecular assemblies [81] [79]. The combination of first-dimension BN-PAGE with second-dimension SDS-PAGE provides a powerful tool for comprehensive analysis of complex composition, identifying both the intact complexes and their subunit constituents [79].
Molecular Weight Determination and Routine Analysis: SDS-PAGE remains the most widely used method for determining polypeptide molecular weights, assessing sample purity, and routine protein analysis [7] [78]. Its simplicity, low cost, and adaptability to various downstream applications (western blotting, mass spectrometry) make it ideal for general laboratory use. SDS-PAGE is particularly valuable when material needs to be recovered for further analysis or when equipment for capillary electrophoresis is unavailable [5].
Advanced Technical Considerations
Detection Sensitivity and Limitations: Each method presents distinct advantages and limitations in detection sensitivity. Traditional SDS-PAGE with Coomassie staining typically detects 10-100 ng of protein per band, while silver staining increases sensitivity to 0.1-1 ng [80]. CE-SDS with UV detection generally offers sensitivity in the low nanogram range but provides superior quantitation [45]. BN-PAGE may have somewhat lower sensitivity due to the presence of Coomassie dye throughout the procedure, which can interfere with some detection methods [80].
Artifact Considerations: Researchers should be aware of potential artifacts specific to each method. In SDS-PAGE, incomplete denaturation can lead to anomalous migration, while in BN-PAGE, the Coomassie dye itself can sometimes act as a detergent and promote complex dissociation [80]. Specific lipid and detergent conditions in BN-PAGE can affect the migration of membrane proteins, potentially causing carriers to migrate as monomers rather than dimers [83]. In CE-SDS, protein adsorption to the capillary wall can sometimes cause peak broadening or recovery issues.
Emerging Variations: Recent methodological developments offer enhanced capabilities for specific applications. Clear Native PAGE (CN-PAGE) eliminates Coomassie dye to prevent potential interference with downstream assays while maintaining native conditions [80]. NSDS-PAGE (Native SDS-PAGE) modifies standard SDS-PAGE conditions by reducing SDS concentration and eliminating heating steps, resulting in improved retention of metal ions and enzymatic activity while maintaining good protein resolution [51]. Alternative detergents such as sodium hexadecyl sulfate (SHS) in CE-SDS have shown improved resolution for certain therapeutic proteins that do not separate optimally with traditional SDS [82].
Diagram 2: Method selection workflow for choosing the appropriate electrophoresis technique based on research objectives and sample requirements.
The comparative analysis of SDS-PAGE, BN-PAGE, and CE-SDS reveals a complementary landscape of protein separation techniques, each with distinct advantages for specific research applications. SDS-PAGE remains the workhorse method for routine protein separation by molecular weight, offering simplicity, versatility, and cost-effectiveness for general laboratory use. BN-PAGE provides unique capabilities for studying native protein complexes and interactions, preserving functional properties that are destroyed in denaturing methods. CE-SDS represents an advanced platform for quantitative protein purity analysis, particularly valuable in therapeutic protein development where precision, automation, and regulatory compliance are essential.
Method selection should be guided by research objectives: SDS-PAGE for molecular weight determination and routine analysis, BN-PAGE for protein complex studies, and CE-SDS for quantitative purity assessment of therapeutic proteins. As electrophoretic technologies continue to evolve, emerging variations and enhancements to these core methodologies will further expand their applications in protein science, drug development, and basic research. Understanding the fundamental principles, capabilities, and limitations of each technique enables researchers to select the most appropriate approach for their specific protein separation needs and effectively interpret the resulting data within the appropriate analytical context.
Sodium Dodecyl Sulphate-Polyacrylamide Gel Electrophoresis (SDS-PAGE) is an indispensable analytical technique in the development and quality control (QC) of biopharmaceuticals, including monoclonal antibodies (MAbs) and therapeutic proteins [1] [45]. Its primary function is to separate denatured proteins based almost exclusively on their molecular weight, providing critical data on protein purity, identity, and integrity [1] [84]. In a regulatory-driven industry, confirming the identity of a biotherapeutic and quantifying its purity level are mandatory requirements [84]. SDS-PAGE serves as a fundamental tool to meet these requirements, enabling developers to detect product-related impurities and degradation products that may arise during manufacturing, purification, and storage [45] [84]. This application note details the specific protocols and methodologies for employing SDS-PAGE in the QC analysis of antibodies and therapeutic proteins, framed within a broader research context on molecular weight-based protein separation.
Principle and Relevance of SDS-PAGE
The core principle of SDS-PAGE is the separation of polypeptide chains based on their molecular mass by electrophoretic mobility through a polyacrylamide gel matrix [1]. This is achieved through a two-step process: first, the anionic detergent SDS denatures the proteins, disrupting their non-covalent bonds and unfolding them into linear chains [45]. Second, SDS binds to the protein backbone at a relatively constant ratio (approximately 1.4 g SDS per 1 g of protein), imparting a uniform negative charge that masks the protein's intrinsic charge [1] [45]. When an electric field is applied, these SDS-coated proteins migrate towards the positive anode. The polyacrylamide gel acts as a molecular sieve, allowing smaller proteins to move faster and larger proteins to move slower, resulting in a size-dependent separation [1]. The use of a discontinuous gel system—comprising a large-pore stacking gel and a small-pore resolving gel—ensures that proteins are concentrated into sharp bands before separation, greatly enhancing resolution [1] [85].
For antibody quality control, this principle allows for the distinct separation of heavy and light chains under reducing conditions, and the visualization of intact antibody molecules, fragments, and aggregates under non-reducing conditions [45]. Shifts in the apparent molecular weight can also indicate post-translational modifications such as glycosylation or degradation processes like proteolysis [1] [12].
Experimental Protocol for Antibody Purity Analysis
Materials and Reagents
The following materials are required for SDS-PAGE analysis. Recipes for buffers can be found in Section 3.2 if preparing solutions in-house. Alternatively, pre-cast gels and buffer solutions are available from various suppliers (e.g., Invitrogen, Thermo Fisher Scientific) [45] [85].
- Protein Sample: Purified antibody or therapeutic protein.
- Pre-Cast Gels: Novex Tris-Glycine gels (e.g., 4-12% Bis-Tris) or similar [45] [85].
- Molecular Weight Markers: Pre-stained or unstained protein standards (e.g., Precision Plus Protein Standards) [86].
- Sample Buffer: Tris-Glycine SDS Sample Buffer (2X) [85].
- Reducing Agent (for reduced samples): NuPAGE Reducing Agent (10X, containing DTT) or β-mercaptoethanol [85].
- Running Buffer: Tris-Glycine SDS Running Buffer (10X) [85].
- Staining Solution: Coomassie Brilliant Blue-based stain (e.g., GelCode Blue) [45].
- Destaining Solution: Mixture of methanol, acetic acid, and water [1].
- Deionized Water.
- Electrophoresis System: Mini-gel apparatus (e.g., XCell SureLock Mini-Cell) and compatible power supply [85].
Recommended Buffer Recipes
If preparing buffers manually, use the following recipes for a standard Tris-Glycine system [85]:
- Tris-Glycine SDS Running Buffer (1X): 25 mM Tris, 192 mM Glycine, 0.1% SDS, pH ~8.3.
- Tris-Glycine SDS Sample Buffer (2X): 106 mM Tris HCl, 141 mM Tris Base, 2% LDS, 10% Glycerol, 0.51 mM EDTA, 0.22 mM Coomassie G-250, pH 8.5. (Note: LDS is often used interchangeably with SDS in commercial buffers) [51].
Step-by-Step Procedure
- Gel Preparation: Remove a pre-cast gel from its pouch and rinse the cassette with deionized water. Remove the tape from the bottom and gently pull the comb out of the cassette. Rinse the sample wells three times with 1X SDS Running Buffer [85].
- Sample Preparation:
- Dilute the protein sample to the desired concentration (e.g., 0.2-1 mg/mL) with water [45].
- Mix the protein sample with an equal volume of 2X SDS Sample Buffer. For reduced samples, add reducing agent to a final concentration of 1X (e.g., 50 mM DTT) [85].
- Heat the samples at 85°C for 2-5 minutes to denature the proteins fully. Do not heat samples for non-reducing/native analysis. Cool the samples briefly before loading [85].
- Gel Loading:
- Assemble the gel in the electrophoresis chamber according to the manufacturer's instructions.
- Fill the inner and outer chambers with 1X SDS Running Buffer.
- Load an equal volume (e.g., 10-20 µL) of prepared samples and molecular weight markers into separate wells [85].
- Electrophoresis:
- Protein Visualization:
- After electrophoresis, carefully open the cassette and remove the gel.
- Immerse the gel in Coomassie Blue staining solution for 30-60 minutes with gentle agitation.
- Transfer the gel to a destaining solution until the background is clear and protein bands are sharply visible [1] [45].
- Document the gel using a gel imaging system.
Workflow Visualization
The following diagram illustrates the complete experimental workflow for SDS-PAGE quality control analysis:
Data Analysis and Interpretation
Purity and Impurity Quantification
Following electrophoresis and staining, densitometry is used to quantify protein bands. This process involves measuring the optical density of each band to determine the relative abundance of different species in the sample [87] [86].
- Image Acquisition: Capture a digital image of the stained gel using a scanner or imaging system.
- Densitometric Analysis: Use image analysis software (e.g., ImageJ) to quantify the signal intensity of the bands [86].
- Purity Calculation: Purity is expressed as the percentage of the main product band relative to the total protein in all bands in the lane. For example:
Table 1: Example Purity Analysis of a Monoclonal Antibody Sample
| Sample Condition | Major Band (% Area) | Fragments & Impurities (% Area) | Key Impurities Identified |
|---|---|---|---|
| Normal IgG | 150 kDa ( ~95% ) | ~5% | Trace light chain (LC) [45] |
| Heat-Stressed IgG | 150 kDa ( ~85% ) | ~15% | LC, 2H, 2H1L, nonglycosylated IgG [45] |
Molecular Weight Determination
The apparent molecular weight (MW) of an unknown protein is determined by comparing its migration distance to that of proteins in a molecular weight marker ladder with known sizes [1] [12].
- Create a Standard Curve: Plot the log(_{10})(MW) of the marker proteins against their migration distance (Rf) [12].
- Interpolate Unknowns: Use the resulting standard curve to estimate the molecular weight of the sample protein bands based on their Rf values.
It is crucial to note that apparent molecular weights from SDS-PAGE may deviate from the theoretical mass for proteins with unusual amino acid compositions or significant post-translational modifications, such as glycosylation [12].
Advanced Applications and Comparative Techniques
Capillary Electrophoresis-SDS (CE-SDS)
While SDS-PAGE is a robust workhorse, Capillary Electrophoresis-SDS (CE-SDS) is increasingly adopted in biopharma for its superior quantitative capabilities and automation [45] [84]. In CE-SDS, separation occurs in a liquid polymer-filled capillary with on-line UV detection, eliminating the need for staining and destaining [45].
A direct comparison of the two technologies for analyzing a heat-stressed IgG antibody reveals distinct advantages for CE-SDS [45]:
- Higher Resolution & Signal-to-Noise: CE-SDS electropherograms show sharper peaks and a better baseline, enabling more accurate integration and quantification of minor impurities [45].
- Detection of Critical Quality Attributes: CE-SDS can readily resolve and quantify nonglycosylated heavy chain, a species that is often difficult to detect and quantify by traditional SDS-PAGE. This is critical because glycosylation can significantly impact antibody effector function [45].
- Excellent Reproducibility: CE-SDS demonstrates high run-to-run reproducibility, which is essential for quality control [45].
Table 2: Comparison of SDS-PAGE and CE-SDS for Antibody Purity Analysis
| Feature | SDS-PAGE | CE-SDS |
|---|---|---|
| Principle | Gel-based separation | Capillary-based separation |
| Detection | Post-run staining (Coomassie/Silver) | On-line UV detection |
| Quantitation | Semi-quantitative (densitometry) | Highly quantitative (peak area) |
| Resolution | Good | Superior |
| Throughput | Medium | High (automated) |
| Key Strength | Accessibility, visual result, low cost | Precision, ability to detect variants like nonglycosylated IgG [45] |
Native SDS-PAGE for Functional Analysis
A significant limitation of standard SDS-PAGE is the complete denaturation of proteins, which destroys functional properties and strips away non-covalently bound cofactors, such as metal ions [51]. To address this, Native SDS-PAGE (NSDS-PAGE) has been developed as a hybrid technique. NSDS-PAGE modifies standard conditions by removing EDTA from buffers, drastically reducing SDS concentration (e.g., to 0.0375%), and omitting the heating step from sample preparation [51]. This method preserves much of the high-resolution separation of SDS-PAGE while allowing for the retention of metal ions and enzymatic activity in many proteins, making it valuable for analyzing functional states of metalloproteins and other sensitive therapeutic proteins [51].
The Scientist's Toolkit: Essential Research Reagent Solutions
Successful and reproducible SDS-PAGE analysis relies on a set of core reagents and materials. The following table details these essential components.
Table 3: Key Research Reagent Solutions for SDS-PAGE Quality Control
| Item | Function & Importance |
|---|---|
| Pre-Cast Gels | Consistent, ready-to-use polyacrylamide gels with defined percentages (e.g., 4-12% Bis-Tris). Eliminate variability from hand-casting and ensure reproducible separation [45] [85]. |
| SDS Sample Buffer | Contains SDS to denature and charge proteins, glycerol to density-load samples, and a tracking dye. Critical for standardizing sample condition prior to loading [51] [85]. |
| Reducing Agents (DTT/β-ME) | Break disulfide bonds to fully denature proteins into individual subunits. Essential for analyzing polypeptide composition under reduced conditions [1] [85]. |
| Molecular Weight Markers | A mixture of proteins of known molecular weights. Serves as a reference standard for estimating the size of unknown proteins and confirming gel performance [1] [86]. |
| Electrophoresis Buffers | Tris-Glycine-based running buffers provide the ions necessary for the discontinuous electrophoresis system, maintaining pH and conductivity during the run [85]. |
| Staining Solutions | Coomassie-based dyes allow visualization of separated protein bands after electrophoresis, enabling qualitative assessment and densitometric quantification [87] [45]. |
SDS-PAGE remains a cornerstone technique for the quality control of antibodies and therapeutic proteins, providing vital information on purity, identity, and molecular weight. Mastery of the protocol—from meticulous sample preparation to accurate densitometric analysis—is fundamental for generating reliable data. As the biopharmaceutical industry advances, traditional SDS-PAGE is effectively complemented by more quantitative and automated techniques like CE-SDS for critical applications requiring high precision. Furthermore, modifications such as Native SDS-PAGE expand the utility of electrophoretic analysis to include functional protein attributes. Together, these techniques form a powerful analytical toolkit that ensures the safety, efficacy, and quality of modern biopharmaceuticals.
Conclusion
SDS-PAGE remains an indispensable, robust technique for protein separation by molecular weight, underpinning advancements from basic research to biopharmaceutical quality control. Mastering its foundational principles, precise protocol execution, and systematic troubleshooting is crucial for obtaining reliable data. The evolution of this method, including native SDS-PAGE for functional studies and the adoption of automated CE-SDS for high-throughput analysis, demonstrates its ongoing relevance. Future directions will likely involve greater integration with AI-driven optimization and sustainable practices, further solidifying SDS-PAGE's role as a cornerstone of protein science with direct implications for accelerating biomedical discovery and therapeutic development.
References
- 1. : Principle, SDS & Key Applications Explained PAGE Protocol [https://www.vedantu.com/biology/sds-page]
- 2. - SDS guide: Sample preparation to PAGE | Abcam analysis [https://www.abcam.com/en-us/knowledge-center/western-blot/sds-page-guide]
- 3. Sodium Dodecyl Sulfate Polyacrylamide Gel Electrophoresis... [https://www.bioscience.com.pk/en/topics/biochemistry/sodium-dodecyl-sulfate-polyacrylamide-gel-electrophoresis]
- 4. Protein analysis SDS PAGE [https://www.qiagen.com/us/knowledge-and-support/knowledge-hub/bench-guide/protein/protein-analysis/protein-analysis-sds-page]
- 5. An Easy SDS - PAGE Recipe & Gel -Step Protocol 10 [https://bitesizebio.com/59429/sds-page-gel-recipe/]
- 6. The principle and method of polyacrylamide ... gel electrophoresis [https://ruo.mbl.co.jp/bio/e/support/method/sds-page.html]
- 7. - SDS - Wikipedia PAGE [https://en.wikipedia.org/wiki/SDS-PAGE]
- 8. SDS-PAGE Protocol | Rockland [https://www.rockland.com/resources/sds-page-protocol/]
- 9. by Protein : the Microscopic Unfolding and the... SDS Mechanisms [https://pmc.ncbi.nlm.nih.gov/articles/PMC7291819/]
- 10. by Protein : the microscopic unfolding and the... SDS mechanisms [https://pubs.rsc.org/en/content/articlelanding/2020/nr/c9nr09135a]
- 11. Choosing the Right Molecular Weight Marker for SDS-PAGE [https://bitesizebio.com/8419/choosing-the-right-molecular-weight-marker-for-sds-page/]
- 12. Determination of Protein Molecular Weights on SDS-PAGE - PubMed [https://pubmed.ncbi.nlm.nih.gov/30426411/]
- 13. One-dimensional SDS - polyacrylamide ... gel electrophoresis [https://pubmed.ncbi.nlm.nih.gov/24674069/]
- 14. Overview of SDS-PAGE - Creative Proteomics [https://www.creative-proteomics.com/resource/overview-of-sds-page.htm]
- 15. SDS-PAGE: A Cornerstone of Protein Analysis in Modern... - MetwareBio [https://www.metwarebio.com/sds-page-protein-analysis/]
- 16. Protocol for Polyacrylamide Gel Electrophoresis (PAGE) - Creative Proteomics [https://www.creative-proteomics.com/resource/protocol-for-polyacrylamide-gel-electrophoresis-page.htm]
- 17. Electrophoresis [https://pubmed.ncbi.nlm.nih.gov/36251838/]
- 18. Capillary Electrophoresis vs. Gel Electrophoresis: A Comprehensive... [https://www.labx.com/resources/capillary-electrophoresis-vs-gel-electrophoresis-a-comprehensive-guide/5548]
- 19. How SDS - PAGE Works: 7 Key Points Every Scientist Should Know [https://bitesizebio.com/580/how-sds-page-works/]
- 20. Principle and Protocol of SDS - PAGE - Creative BioMart [https://www.creativebiomart.net/resource/principle-protocol-principle-and-protocol-of-sds-page-436.htm]
- 21. Video: Separating Protein with SDS-PAGE: Procedure and Applications [https://www.jove.com/v/5058/separating-protein-with-sds-page-procedure-and-applications]
- 22. One-Dimensional SDS and Non-Denaturing Gel Electrophoresis of... [https://www.thermofisher.com/ru/ru/home/references/protocols/proteins-expression-isolation-and-analysis/sds-page-protocol/one-dimensional-sds-and-non-denaturing-gel-electrophoresis.html]
- 23. - PAGE SDS Laemmli Protocol [https://wolfson.huji.ac.il/purification/Protocols/Page_SDS.html]
- 24. Specialized Protein Gels Support... | Thermo Fisher Scientific - US [https://www.thermofisher.com/us/en/home/technical-resources/technical-reference-library/protein-electrophoresis-western-blotting-support-center/specialized-protein-gels-support/specialized-protein-gels-support-getting-started.html]
- 25. One-dimensional SDS gel electrophoresis of proteins - PubMed [https://pubmed.ncbi.nlm.nih.gov/18432979/]
- 26. A Complete Guide to Handcasting SDS-PAGE Gels [https://blog.abclonal.com/blog/a-complete-guide-to-handcasting-sds-page-gels]
- 27. - SDS PAGE Protocol [http://hackert.cm.utexas.edu/courses/ch370/fall2013/Electrophor/SDS-PAGE%20Protocol.htm]
- 28. 14.2: Casting SDS-PAGE gels - Biology LibreTexts [https://bio.libretexts.org/Bookshelves/Cell_and_Molecular_Biology/Book:_Investigations_in_Molecular_Cell_Biology_(O'Connor)/14:_SDS-PAGE/14.02:_Casting_SDS-PAGE_gels]
- 29. Evaluation for an APS / TEMED Aliquot in the SDS -PA Gel Protocol [https://www.instructables.com/Evaluation-for-an-APSTEMED-aliquot-in-the-SDS-PA-g/]
- 30. - SDS - GeeksforGeeks PAGE [https://www.geeksforgeeks.org/biology/sds-page/]
- 31. Preparing protein samples for sds - page [https://www.ruf.rice.edu/~bioslabs/studies/sds-page/denature.html]
- 32. Polyacrylamide gel electrophoresis - Wikipedia [https://en.wikipedia.org/wiki/Polyacrylamide_gel_electrophoresis]
- 33. Dithiothreitol - Wikipedia [https://en.wikipedia.org/wiki/Dithiothreitol]
- 34. One-Dimensional SDS and Non- Denaturing Gel Electrophoresis of... [https://www.thermofisher.com/eg/en/home/references/protocols/proteins-expression-isolation-and-analysis/sds-page-protocol/one-dimensional-sds-and-non-denaturing-gel-electrophoresis.html]
- 35. - SDS : The Definitive PAGE Recipe Running Buffer 2025 [https://eathealthy365.com/a-scientist-s-guide-to-perfect-sds-page-running-buffer/]
- 36. How current, voltage, and power settings affect SDS-PAGE – Bioss [https://www.biossusa.com/blogs/news/how-current-voltage-and-power-settings-affect-sds-page]
- 37. in western blot | Abcam Electrophoresis [https://www.abcam.com/en-us/technical-resources/guides/western-blot-guide/electrophoresis]
- 38. Protein molecular weight markers [https://www.takarabio.com/products/protein-research/sds-page-and-western-blotting/protein-molecular-weight-markers/low-high-and-broad-range]
- 39. How to visualize proteins after electrophoresis [https://info.gbiosciences.com/blog/how-to-visualize-proteins-after-electrophoresis]
- 40. Visualization of proteins in SDS PAGE gels [https://www.qiagen.com/us/knowledge-and-support/knowledge-hub/bench-guide/protein/protein-analysis/visualization-of-proteins-in-sds-page-gels]
- 41. Protein quantification and visualization via ultraviolet-dependent labeling with 2,2,2-trichloroethanol | Scientific Reports [https://www.nature.com/articles/s41598-019-50385-9]
- 42. Multicolored Prestained Standard Protein Marker Generation Using a Variety of Remazol Dyes for Easy Visualization of Protein Bands During SDS-PAGE - PubMed [https://pubmed.ncbi.nlm.nih.gov/30097925/]
- 43. Use of DNA ladders for reproducible protein fractionation by SDS-PAGE for quantitative proteomics - PMC [https://pmc.ncbi.nlm.nih.gov/articles/PMC2667379/]
- 44. Protein Standards›SDS and Native PAGE›Electrophoresis... SDS PAGE [https://serva.de/enDE/Catalog/201_Electrophoresis_SDS_and_Native_PAGE_SDS_PAGE_Protein_Standards.html]
- 45. Comparing SDS - PAGE and CE-SDS for Antibody Purity Analysis [https://www.bioprocessintl.com/qa-qc/comparing-sds-page-and-ce-sds-for-antibody-purity-analysis]
- 46. 6 Best Tips for Troubleshooting Poor on Band - Separation ... SDS PAGE [https://azurebiosystems.com/blog/6-tips-for-troubleshooting-poor-band-separation-on-sds-page-gels/]
- 47. Trouble Shooting of SDS Analysis | PDF PAGE [https://www.slideshare.net/slideshow/trouble-shooting-of-sds-page-analysis/4778793]
- 48. Troubleshooting SDS - PAGE Gel Running Issues | GoldBio [https://goldbio.com/articles/article/troubleshooting-sds-page-gel-running-issues]
- 49. Nucleic Acid Gel Electrophoresis... | Thermo Fisher Scientific - PE [https://www.thermofisher.com/pe/en/home/life-science/cloning/cloning-learning-center/invitrogen-school-of-molecular-biology/na-electrophoresis-education/na-electrophoresis-troubleshooting.html]
- 50. An optimized SDS-PAGE protocol with a new blotting system for the initial testing procedure of ESAs in doping control - PubMed [https://pubmed.ncbi.nlm.nih.gov/33269539/]
- 51. Native SDS - PAGE : High Resolution Electrophoretic Separation of... [https://pmc.ncbi.nlm.nih.gov/articles/PMC4517606/]
- 52. Major cause of antibody artifact on non-reducing bands - SDS ... PAGE [https://pubmed.ncbi.nlm.nih.gov/31344475/]
- 53. Major cause of antibody artifact on non-reducing bands - SDS ... PAGE [https://colab.ws/articles/10.1016%2Fj.pep.2019.105459]
- 54. Tips for Optimal SDS - PAGE Separation | Rockland [https://www.rockland.com/resources/tips-for-optimal-sds-page-separation/]
- 55. - SDS : PAGE Analysis Made Easy Protein [https://www.numberanalytics.com/blog/sds-page-protein-analysis-made-easy]
- 56. Instructor's guide to experimental biosciences, Rice University - formulas [https://www.ruf.rice.edu/~bioslabs/methods/howto/formulas.html]
- 57. Experimental Protocol for Western Blotting | AAT Bioquest [https://www.aatbio.com/resources/application-notes/experimental-protocol-for-western-blotting]
- 58. Coomassie Brilliant Blue - an overview | ScienceDirect Topics [https://www.sciencedirect.com/topics/biochemistry-genetics-and-molecular-biology/coomassie-brilliant-blue]
- 59. Analysis of protein gels ( SDS - PAGE ) [https://www.ruf.rice.edu/~bioslabs/studies/sds-page/gellab3.html]
- 60. Setting the Stage for Separation: Preparing the SDS - PAGE Gel for... [https://www.greenskybio.com/plant_extract/setting-the-stage-for-separation-preparing-the-sdspage-gel-for-protein-analysis.html]
- 61. Western Blot - StatPearls - NCBI Bookshelf [https://www.ncbi.nlm.nih.gov/books/NBK542290/]
- 62. Antibody validation for Western : By the user, for the user - PMC blot [https://pmc.ncbi.nlm.nih.gov/articles/PMC6983856/]
- 63. How to Validate Antibodies with Western ... - NeoBiotechnologies Blot [https://www.neobiotechnologies.com/resources/antibody-validation-western-blot/]
- 64. The Design of a Quantitative Western Blot Experiment - PMC [https://www.ncbi.nlm.nih.gov/pmc/articles/PMC3971489/]
- 65. Calibration of prestained protein molecular weight standards for use in the "Western" or enzyme-linked immunoelectrotransfer blot techniques - PubMed [https://pubmed.ncbi.nlm.nih.gov/6085221/]
- 66. 4 Western for Accurate Results Blotting Techniques [https://www.excedr.com/resources/western-blotting-techniques]
- 67. gel_analysis [https://www.ruf.rice.edu/~bioslabs/methods/howto/gellab3.html]
- 68. How to Test for Protein Purity Using SDS-PAGE or HPLC [https://synapse.patsnap.com/article/how-to-test-for-protein-purity-using-sds-page-or-hplc]
- 69. Determination of purity and yield - PubMed [https://pubmed.ncbi.nlm.nih.gov/21431675/]
- 70. Differences between SDS and PAGE PAGE - GeeksforGeeks Native [https://www.geeksforgeeks.org/biology/differences-between-sds-page-and-native-page/]
- 71. (PDF) comparative - sds and page protein analysis of... quantitative [https://www.academia.edu/143294522/COMPARATIVE_SDS_PAGE_AND_QUANTITATIVE_PROTEIN_ANALYSIS_OF_NIGELLA_SATIVA_ALLIUM_CEPA_AND_LINUM_USITATISSIMUM_SEEDS]
- 72. Resolve SDS-PAGE Disadvantages with CE-SDS [https://www.bio-techne.com/instruments/ice/advantages-ce-sds-over-sds-page]
- 73. Better Separation Resolution of New Biopharmaceutical Modalities through Fine Tuning of the Temperature with CE-SDS [https://sciex.com/tech-notes/ce/better-separation-resolution-of-new-biopharmaceutical-modalities]
- 74. Capillary Gel Electrophoresis: An Alternative to SDS-PAGE? [https://bitesizebio.com/24080/capillary-gel-electrophoresis-an-alternative-to-sds-page/]
- 75. High throughput multi-capillary SDS gel electrophoresis of proteins [https://sciex.com/tech-notes/ce/high-throughput-multi-capillary-sds-gel-electrophoresis-of-prote]
- 76. Better Resolution for CE-SDS Analysis of New Biopharmaceutical Modalities Through Fine-Tuning the Separation Temperature [https://www.labroots.com/webinar/ce-sds-temperature-effect-purity-heterogeneity-analysis-protein-therapeutic-modalities]
- 77. Monitoring of low- molecular - weight protein aggregation by CE - SDS ... [https://pubmed.ncbi.nlm.nih.gov/37327620/]
- 78. Overview of Electrophoresis | Thermo Fisher Scientific - KZ [https://www.thermofisher.com/kz/en/home/life-science/protein-biology/protein-biology-learning-center/protein-biology-resource-library/pierce-protein-methods/overview-electrophoresis.html]
- 79. Blue Native Polyacrylamide Gel Electrophoresis (BN-PAGE) for Analysis of Multiprotein Complexes from Cellular Lysates - PMC [https://www.ncbi.nlm.nih.gov/pmc/articles/PMC3339838/]
- 80. Gel electrophoresis of proteins - Wikipedia [https://en.wikipedia.org/wiki/Gel_electrophoresis_of_proteins]
- 81. Blue native electrophoresis protocol | Abcam [https://www.abcam.com/en-us/technical-resources/protocols/blue-native-electrophoresis]
- 82. Purity Determination by Capillary Electrophoresis Sodium Hexadecyl Sulfate (CE-SHS): A Novel Application For Therapeutic Protein Characterization - PubMed [https://pubmed.ncbi.nlm.nih.gov/29357216/]
- 83. Blue Native Polyacrylamide Gel Electrophoresis (BN-PAGE) for the Analysis of Protein Oligomers in Plants - PubMed [https://pubmed.ncbi.nlm.nih.gov/32250554/]
- 84. Confirming Protein Identity and Purity | BioPharmaSpec [https://biopharmaspec.com/protein-characterization-services/identity-and-purity/]
- 85. One-Dimensional SDS and... | Thermo Fisher Scientific - US [https://www.thermofisher.com/us/en/home/references/protocols/proteins-expression-isolation-and-analysis/sds-page-protocol/one-dimensional-sds-and-non-denaturing-gel-electrophoresis.html]
- 86. A protocol for recombinant protein quantification by densitometry - PMC [https://pmc.ncbi.nlm.nih.gov/articles/PMC7294310/]
- 87. A protocol for recombinant protein quantification by densitometry - PubMed [https://pubmed.ncbi.nlm.nih.gov/32255275/]