SDS-PAGE Demystified: Principles, Protocols, and Protein Separation Mechanisms for Researchers
This article provides a comprehensive analysis of SDS-PAGE (Sodium Dodecyl Sulfate-Polyacrylamide Gel Electrophoresis), a cornerstone technique in biochemistry and molecular biology.
SDS-PAGE Demystified: Principles, Protocols, and Protein Separation Mechanisms for Researchers
Abstract
This article provides a comprehensive analysis of SDS-PAGE (Sodium Dodecyl Sulfate-Polyacrylamide Gel Electrophoresis), a cornerstone technique in biochemistry and molecular biology. Tailored for researchers, scientists, and drug development professionals, it delves into the fundamental principles enabling protein separation by molecular weight, detailed methodological protocols, advanced troubleshooting strategies, and validation through comparative analysis with other techniques. By exploring both foundational concepts and cutting-edge applications, this guide serves as an essential resource for optimizing experimental design, interpreting results accurately, and leveraging SDS-PAGE in diverse research and diagnostic contexts.
The Core Science of SDS-PAGE: How Proteins are Separated by Molecular Weight
Core Principle of Size-Based Separation
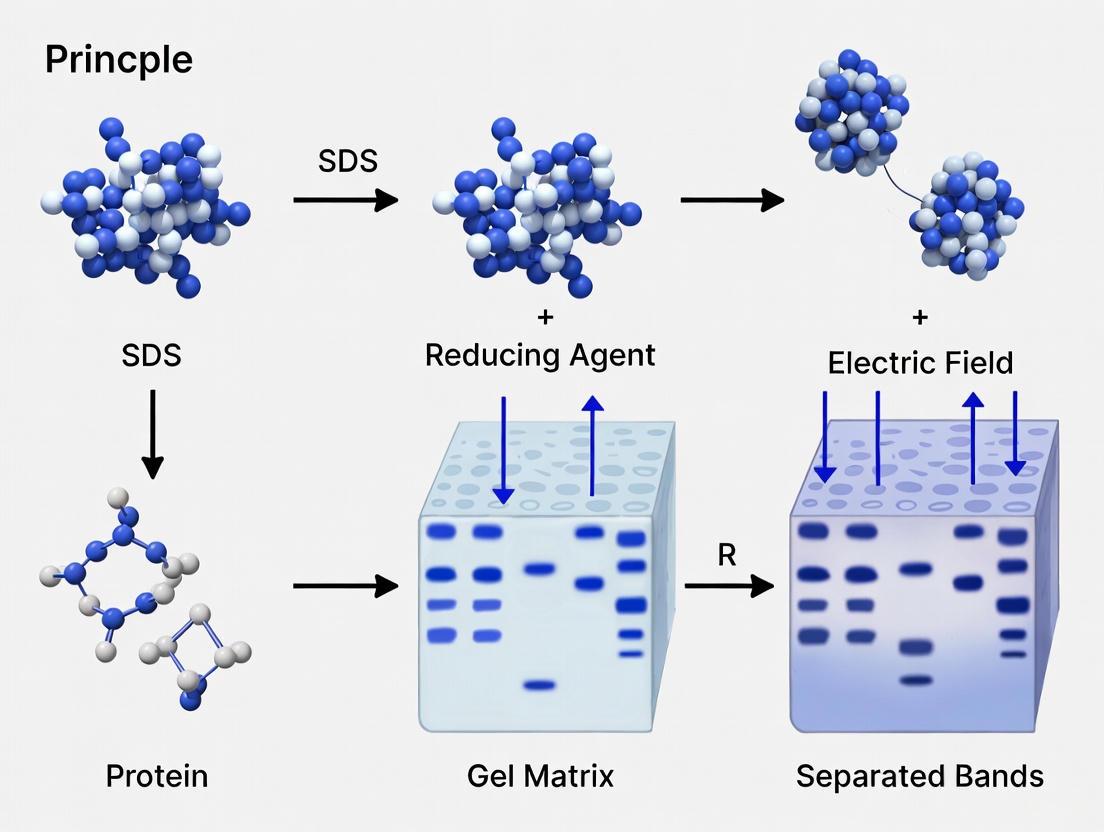
Sodium Dodecyl Sulfate-Polyacrylamide Gel Electrophoresis (SDS-PAGE) is a fundamental biochemical technique that separates proteins based almost exclusively on their molecular weight. The core principle relies on overcoming the inherent differences in protein charge and three-dimensional structure to ensure that migration through a gel matrix depends solely on polypeptide chain length [1] [2].
This is achieved through a two-part system: the detergent Sodium Dodecyl Sulfate (SDS) denatures proteins and confers a uniform negative charge, while the Polyacrylamide Gel acts as a molecular sieve, retarding larger molecules and allowing smaller ones to migrate faster [3]. Under an applied electric field, all proteins travel toward the positive anode, with smaller proteins moving farthest through the gel network [1]. This process allows for the determination of a protein's molecular mass with an accuracy of approximately ±10% [3].
Mechanism of Charge and Structure Unification
For separation by molecular weight to be possible, the natural variations in protein charge and conformation must be eliminated. SDS is critical to this process, performing two essential functions.
Charge Masking with SDS
Proteins possess intrinsic charges based on their amino acid composition, which would cause them to migrate at different speeds in an electric field. SDS binds to the protein backbone through hydrophobic interactions at a consistent ratio of about 1.4 grams of SDS per 1 gram of protein [3]. This equates to approximately one SDS molecule for every two amino acids, creating a uniform negative charge density along the entire polypeptide chain [3] [2]. This SDS coat effectively masks the protein's native charge, ensuring that all proteins have a similar charge-to-mass ratio and will migrate toward the anode at a rate determined only by their size [1].
Protein Denaturation and Linearization
SDS, aided by heat and reducing agents, unfolds proteins into linear chains. The ionic part of SDS disrupts non-covalent interactions within proteins, while its hydrophobic region interacts with and unfolds hydrophobic protein domains [1]. To achieve complete denaturation, samples are typically heated to 95°C for 5 minutes [3]. This heating step destroys hydrogen bonds that stabilize secondary structures like alpha helices and beta sheets [1].
Reducing agents such as Beta-Mercaptoethanol (BME) or Dithiothreitol (DTT) are added to break disulfide bridges, which are covalent bonds that can maintain tertiary and quaternary structure even in the presence of SDS [1] [3]. This combination of SDS, heat, and reducing agents ensures proteins are fully denatured into random coil polypeptides, allowing separation based purely on molecular weight.
Table 1: Key Reagents for Protein Denaturation and Their Functions
| Reagent | Primary Function | Typical Working Concentration |
|---|---|---|
| SDS (Sodium Dodecyl Sulfate) | Denatures proteins; confers uniform negative charge [1] | 0.1% - 1% (w/v) [3] |
| DTT (Dithiothreitol) | Breaks disulfide bonds [1] | 10 - 100 mM [3] |
| BME (Beta-Mercaptoethanol) | Breaks disulfide bonds [1] | 5% (v/v) [3] |
Polyacrylamide Gel as a Molecular Sieve
The polyacrylamide gel provides the sieving matrix that separates proteins based on size. The gel is formed through the polymerization of acrylamide monomers cross-linked by bis-acrylamide [1]. The pore size of the gel is determined by the concentration of acrylamide, with higher percentages creating smaller pores that provide better resolution for lower molecular weight proteins [4].
Polymerization is initiated by Ammonium Persulfate (APS), which forms persulfate free radicals, and catalyzed by TEMED (N,N,N',N'-Tetramethylethylenediamine) [1] [5]. This reaction creates a three-dimensional mesh with pores through which proteins migrate. The discontinuous gel system, comprising stacking and resolving gels with different pore sizes and pH, further sharpens protein bands for superior resolution [1] [3].
Table 2: Polyacrylamide Gel Compositions for Protein Separation
| Gel Type | Typical Acrylamide Concentration | pH | Primary Function |
|---|---|---|---|
| Stacking Gel | 4% - 5% [1] [5] | ~6.8 [1] | Concentrates proteins into a sharp stack before entering resolving gel |
| Resolving Gel | 6% - 15% (depending on target protein size) [2] | ~8.8 [1] | Separates proteins based on molecular weight |
SDS-PAGE Protein Denaturation Mechanism - This diagram illustrates the process of protein denaturation and linearization prior to electrophoresis, involving SDS binding, heat application, and disulfide bond reduction.
Detailed Experimental Protocol and Workflow
A standardized SDS-PAGE protocol ensures reproducible protein separation. The following procedure outlines key steps from gel preparation to analysis.
Gel Casting
The gel is typically cast between two glass plates sealed with spacers [3]. First, the resolving gel solution (e.g., 12% acrylamide for proteins in the 10-150 kDa range) is poured and overlaid with water-saturated butanol or isopropanol to prevent oxygen inhibition and create a flat surface [1] [5]. After polymerization (~20-30 minutes), the stacking gel is poured on top, and a comb is inserted to create sample wells [2].
Sample Preparation
Protein samples are mixed with SDS-PAGE sample buffer (containing SDS, reducing agents, glycerol, and a tracking dye like bromophenol blue) and denatured by heating at 95°C for 3-5 minutes [5] [2]. The samples are then centrifuged briefly to collect condensation before loading [2].
Electrophoresis
Samples and molecular weight markers are loaded into wells. The gel apparatus is filled with running buffer (typically Tris-Glycine-SDS) [3]. Electrophoresis begins at a lower voltage (e.g., 80-100 V) as samples move through the stacking gel, then increases (e.g., 120-200 V) once the dye front enters the resolving gel [5]. The run stops when the dye front nears the bottom.
Protein Visualization and Analysis
Post-electrophoresis, proteins are visualized using stains like Coomassie Brilliant Blue [5] [3]. The migration distances of unknown proteins are compared to a standard curve generated from molecular weight markers to estimate their size [5].
SDS-PAGE Experimental Workflow - This diagram outlines the key steps in the SDS-PAGE procedure, from gel casting and sample preparation to electrophoresis and analysis.
The Scientist's Toolkit: Essential Research Reagents
Successful SDS-PAGE requires specific reagents, each fulfilling a critical function in the separation process. The table below details these essential components.
Table 3: Essential Reagents for SDS-PAGE Research
| Reagent/Category | Specific Examples | Critical Function in SDS-PAGE |
|---|---|---|
| Denaturing Detergents | Sodium Dodecyl Sulfate (SDS) | Unfolds proteins; confers uniform negative charge [1] |
| Reducing Agents | Dithiothreitol (DTT), Beta-Mercaptoethanol (BME) | Breaks disulfide bonds for complete denaturation [1] [3] |
| Gel Matrix Components | Acrylamide, Bis-Acrylamide | Forms cross-linked polyacrylamide gel sieve [1] |
| Polymerization System | Ammonium Persulfate (APS), TEMED | Initiates and catalyzes acrylamide polymerization [1] [5] |
| Buffer Systems | Tris-HCl, Glycine | Creates pH discontinuity for stacking effect [3] |
| Tracking Dye | Bromophenol Blue | Visualizes migration front during electrophoresis [3] |
| Molecular Weight Markers | Pre-stained or unstained protein ladders | Provides size standards for estimating sample MW [3] |
Technological Evolution and Current Applications
Since its development by Laemmli in 1970, SDS-PAGE has remained a cornerstone technique [6] [3]. Its applications span diverse fields from basic research to pharmaceutical development.
In biopharmaceuticals, SDS-PAGE is used to monitor protein purity, stability, and integrity during drug development and quality control (QC) [6] [7]. Food science utilizes SDS-PAGE for protein profiling, detecting adulteration, assessing processing impact, and monitoring quality across products like cereals, dairy, and meats [8] [9]. It is also indispensable in clinical diagnostics for analyzing serum proteins to diagnose certain diseases [7].
While traditional slab-gel SDS-PAGE remains widespread, advanced formats like capillary electrophoresis SDS (CE-SDS) offer higher automation, reproducibility, and quantitative precision, making them particularly valuable for biopharmaceutical QC [6]. These technological improvements address limitations of manual gel-based methods while maintaining the fundamental principle of size-based separation.
Sodium dodecyl sulfate-polyacrylamide gel electrophoresis (SDS-PAGE) stands as a cornerstone analytical technique in biochemistry and molecular biology laboratories worldwide. This method provides researchers with a reliable means to separate complex protein mixtures based primarily on molecular weight. The fundamental breakthrough of SDS-PAGE lies in its ability to overcome the natural variations in protein charge and structure that would otherwise complicate electrophoretic separation. Through the strategic use of ionic detergents and reducing agents, proteins are transformed into uniformly charged linear molecules, enabling separation that closely correlates with polypeptide chain length [3] [10].
The significance of this methodology extends across numerous applications, including assessing protein purity, evaluating expression levels, determining molecular weights, and preparing samples for subsequent analysis such as western blotting or mass spectrometry [11] [10]. The technique's versatility, reproducibility, and relative simplicity have maintained its prominence since its development by Ulrich Laemmli in the 1970s, with the original methodology paper accumulating over 259,000 citations, making it one of the most cited scientific papers overall [3].
Within the broader context of protein separation research, understanding the precise role of SDS represents a fundamental prerequisite for proper experimental design and accurate interpretation of results. This technical guide examines the mechanistic basis of SDS action, providing researchers and drug development professionals with the foundational knowledge necessary to leverage this powerful technique effectively in their investigative work.
Fundamental Mechanisms of SDS Action
SDS-Protein Binding Dynamics
The sodium dodecyl sulfate (SDS) molecule possesses a distinctive chemical structure that enables its crucial function in protein denaturation and charge manipulation. This amphipathic molecule features a hydrophobic twelve-carbon alkyl chain attached to a hydrophilic sulfate group [12] [3]. This structure allows SDS to interact effectively with both hydrophobic and hydrophilic regions of proteins, facilitating the comprehensive unfolding of complex tertiary structures.
The process of protein denaturation by SDS follows a coordinated sequence of events. When SDS molecules encounter a folded protein, their hydrophobic tails associate with non-polar regions of the protein through hydrophobic interactions, while the ionic sulfate groups remain exposed to the aqueous environment. This binding disrupts hydrophobic interactions that stabilize the protein's native conformation [3]. As SDS concentration increases, the cumulative effect of numerous SDS molecules binding to the protein backbone ultimately overwhelms the structural integrity of the protein, leading to complete unfolding [12].
The binding stoichiometry between SDS and polypeptides occurs at a remarkably consistent ratio of approximately 1.4 grams of SDS per 1.0 gram of polypeptide [3]. This equates to roughly one SDS molecule for every two amino acid residues in the protein sequence [3] [13]. This uniform coating accomplishes two critical objectives: first, it masks the protein's intrinsic charge characteristics, regardless of whether the native protein was acidic or basic; second, it confers a consistent net negative charge that increases proportionally with the size of the polypeptide [10]. The resulting protein-SDS complexes assume an elongated rod-like shape with similar charge-to-mass ratios, creating the essential conditions for separation based primarily on molecular dimensions rather than inherent charge properties [14] [3].
Critical Parameters for Effective SDS Binding
Several critical parameters govern the efficacy of SDS-protein complex formation, each requiring careful control to ensure reproducible results. The concentration of SDS monomers (rather than micelles) represents the most crucial factor, as only SDS monomers participate in protein binding [14]. Research indicates that SDS concentrations greater than 0.1 mM initiate protein unfolding, while concentrations exceeding 1 mM typically achieve complete denaturation of most proteins [3].
The critical micelle concentration (CMC) of SDS—approximately 7-10 mM in aqueous solutions—defines the threshold above which SDS molecules spontaneously assemble into spherical micelles consisting of approximately 62 SDS molecules each [3]. These micelles, while anionic on their surface, do not participate directly in protein binding and can reduce the availability of SDS monomers if not properly managed [3]. Successful SDS-PAGE protocols therefore maintain SDS concentrations well above the CMC in sample buffers (typically 1-10% w/v) to ensure an adequate reservoir of SDS monomers for complete protein denaturation [14].
Additional factors influencing SDS binding efficiency include:
- Ionic strength: Low ionic strength solutions (10-100 mM) promote higher SDS monomer concentration and more effective binding [14]
- Reducing agents: Beta-mercaptoethanol (β-ME) or dithiothreitol (DTT) cleave disulfide bonds that might otherwise maintain structural elements [3] [10]
- Temperature: Heating samples to 70-100°C accelerates denaturation by disrupting hydrogen bonds and promoting SDS penetration [3] [10]
The following diagram illustrates the sequential mechanism of SDS-mediated protein denaturation and complex formation:
SDS-Mediated Protein Denaturation and Migration Mechanism
Quantitative Aspects of SDS-Protein Interactions
SDS Binding Stoichiometry and Charge Masking
The quantitative relationship between SDS and polypeptides follows predictable patterns that enable the standardized separation of proteins across a broad molecular weight spectrum. The consistent binding ratio of 1.4 grams of SDS per 1.0 gram of polypeptide translates to approximately one SDS molecule per two amino acid residues, regardless of the specific amino acid composition [3] [13]. This uniform coating provides a net negative charge that is directly proportional to the length of the polypeptide chain, effectively masking the protein's intrinsic charge properties derived from acidic and basic amino acid side chains [10].
The charge uniformity achieved through SDS binding represents a critical foundation for molecular weight-based separation. Without this charge normalization, proteins with similar molecular weights but different innate charges would migrate at different rates through the gel matrix, complicating molecular weight determination [10]. The SDS-coated proteins adopt nearly identical charge-to-mass ratios, ensuring that migration differences primarily reflect molecular dimensions rather than charge characteristics [3]. Research indicates that this approach enables molecular weight estimation with approximately ±10% accuracy when appropriate size standards are employed [3].
Experimental Conditions Influencing SDS Binding
Several technical parameters significantly impact the efficiency and consistency of SDS-protein interactions, requiring careful optimization for reliable results. The following table summarizes key quantitative relationships in SDS-PAGE methodology:
Table 1: Quantitative Parameters for Optimal SDS-Protein Interactions
| Parameter | Optimal Range | Effect on Separation | Experimental Consideration |
|---|---|---|---|
| SDS:Protein Ratio | 3:1 to 4:1 (w/w) [14] | Ensures complete denaturation & charge masking | Higher ratios prevent SDS depletion in complex mixtures |
| SDS Monomer Concentration | >1 mM [3] | Maintains denaturing power | Must exceed CMC (7-10 mM) while ensuring monomer availability |
| Reducing Agent Concentration | β-ME: 4-5% (v/v); DTT: 10-100 mM [3] | Cleaves disulfide bonds for complete unfolding | Fresh preparation essential as reducing agents oxidize over time |
| Sample Buffer Ionic Strength | 10-100 mM [14] | Promotes SDS monomer availability | High salt competes with SDS binding, causing smearing |
| Denaturation Temperature | 70-100°C for 5-10 min [3] [10] | Disrupts hydrogen bonds & secondary structure | Insufficient heating preserves structure, altering mobility |
The ionic strength of the sample buffer merits particular attention, as elevated salt concentrations can interfere with SDS binding efficiency by reducing the availability of SDS monomers [14]. This interference manifests electrophoretically as diffuse or smeared protein bands rather than the sharp, well-defined bands characteristic of optimal SDS-PAGE conditions [15]. Similarly, the presence of reducing agents must be carefully controlled, as incomplete disulfide bond reduction can maintain elements of tertiary structure, resulting in anomalous migration patterns that do not accurately reflect molecular weight [3] [10].
Experimental Protocols for SDS-PAGE
Sample Preparation Methodology
Proper sample preparation represents the most critical determinant of successful SDS-PAGE separation, as inconsistencies at this stage introduce variability that cannot be remedied during subsequent electrophoresis. The following step-by-step protocol ensures complete protein denaturation and reproducible results:
Prepare Sample Buffer: Create a 2× or 4× concentrated loading buffer containing:
Mix Sample with Buffer: Combine protein sample with an equal volume of 2× sample buffer (or appropriate ratio for other concentrations) in a microcentrifuge tube. Vortex thoroughly to ensure complete mixing [18].
Denature Proteins: Heat the sample-buffer mixture at 95°C for 5 minutes or 70°C for 10 minutes using a dry bath or water bath [3] [17]. This heating step disrupts hydrogen bonds and promotes complete protein unfolding and SDS binding.
Cool and Centrifuge: Briefly centrifuge heated samples (15,000 rpm for 1 minute) to collect condensation and any insoluble material [18]. The supernatant is loaded directly onto the gel.
Load Gel: Using gel-loading pipette tips, carefully transfer 10-40 μL of prepared sample into the wells of the pre-cast polyacrylamide gel, avoiding well-to-well contamination [18].
For optimal results, total protein loading should typically range between 0.5-20 μg per band for Coomassie staining and 0.1-1 μg for silver staining or western blotting applications [15]. Prior to electrophoresis, protein concentration should be determined using established quantification methods (Bradford, Lowry, or BCA assays) to ensure appropriate loading volumes [15].
Electrophoresis Conditions and Buffer Composition
The electrophoretic separation phase requires precise control of buffer conditions and electrical parameters to maintain protein denaturation and ensure sharp band resolution. The standard Tris-glycine discontinuous buffer system consists of:
- Running Buffer (pH 8.3-8.8): 25 mM Tris base, 192 mM glycine, 0.1% (w/v) SDS [16] [13]
- Stacking Gel (pH 6.8): 4-5% acrylamide with 125 mM Tris-HCl [13]
- Resolving Gel (pH 8.8): 8-15% acrylamide with 375 mM Tris-HCl [13]
The discontinuous nature of this buffer system creates a stacking effect at the interface between the stacking and resolving gels, concentrating proteins into sharp bands before they enter the separating region of the gel [13]. The presence of SDS in both the sample buffer and running buffer (typically 0.1%) maintains the denatured state of proteins throughout electrophoresis [3].
Electrophoresis is typically performed at constant voltage, with recommended parameters varying based on gel size:
- Mini-gel systems (8 × 8 cm): 100-200 V for 45-60 minutes [11] [18]
- Midi-gel systems (8 × 13 cm): 150-250 V for 60-90 minutes
- Large format gels (15 × 18 cm): 200-300 V for 4-6 hours
The process should be terminated when the bromophenol blue tracking dye front reaches approximately 1 cm from the bottom of the gel [18]. Throughout the run, excessive heating should be avoided as it can lead to protein degradation, diffusion artifacts, and the characteristic "smiling" band pattern where bands curve upward at the edges [15].
The Scientist's Toolkit: Essential Research Reagents
Successful execution of SDS-PAGE requires precise formulation of several key reagent systems. The following table outlines the essential components and their specific functions in the electrophoretic process:
Table 2: Essential Reagents for SDS-PAGE Methodology
| Reagent | Standard Concentration/Formula | Primary Function | Technical Considerations |
|---|---|---|---|
| SDS (Sodium Dodecyl Sulfate) | 10-20% (w/v) stock solution [16] | Protein denaturation & charge conferment | Use high-purity grade; solutions should be clear |
| Acrylamide/Bis-acrylamide | 29.2:0.8 or 30:0.8 (Acr:Bis ratio) [16] | Gel matrix formation | Neurotoxic until polymerized; handle with gloves |
| APS (Ammonium Persulfate) | 10% (w/v) in water [16] | Polymerization initiator | Prepare fresh weekly or aliquot and freeze |
| TEMED | Neat liquid [16] | Polymerization catalyst | Accelerates gel setting; amount affects porosity |
| Tris Buffers | Stacking: 0.5 M, pH 6.8; Resolving: 1.5 M, pH 8.8 [16] | pH maintenance & charge transport | High purity Tris base required for reproducibility |
| Glycine | 192 mM in running buffer [13] | Leading ion in discontinuous system | Zwitterionic properties essential for stacking |
| β-Mercaptoethanol or DTT | β-ME: 5% (v/v); DTT: 100 mM [3] | Disulfide bond reduction | DTT preferred for stronger reducing capability |
| Tracking Dye | 0.01-0.1% bromophenol blue [17] | Migration monitoring | Also increases sample density for well loading |
Alternative buffer systems have been developed to address specific research needs. The Bis-Tris system (pH 6.4-7.2) offers enhanced stability and reduced gel hydrolysis, making it particularly suitable for pre-cast gels with extended shelf life [14] [3]. For separation of low molecular weight peptides (<15 kDa), Tricine-based buffer systems provide superior resolution compared to traditional glycine systems [14] [3]. Similarly, Tris-acetate buffers extend the separation range to very high molecular weight proteins (up to 500 kDa) by using larger pore sizes and different ion mobility characteristics [14].
Methodological Variations and Advanced Applications
Comparative Electrophoretic Techniques
While standard SDS-PAGE remains the workhorse for protein analysis by molecular weight, several methodological variations address specific research requirements. Understanding these alternatives enables researchers to select the most appropriate technique for their experimental objectives:
Blue Native (BN)-PAGE preserves protein complexes in their native state by using Coomassie G-250 dye to impart charge while maintaining protein-protein interactions [11]. This technique enables analysis of oligomeric states and functional protein complexes but sacrifices the high resolution achieved with denaturing conditions [11].
Native SDS-PAGE (NSDS-PAGE) represents a hybrid approach that modifies standard SDS-PAGE conditions by reducing SDS concentration in running buffers (0.0375% vs. standard 0.1%), eliminating EDTA from sample buffers, and omitting the heating step [11]. This method retains significant enzymatic activity in resolved proteins (7 of 9 model enzymes remained active) and preserves bound metal ions (98% zinc retention in metalloproteins) while maintaining high resolution separation [11].
CTAB-PAGE and BAC-PAGE employ cationic detergents rather than anionic SDS, reversing the migration direction while maintaining denaturing conditions [3]. These techniques are particularly valuable for analyzing highly acidic proteins or membrane proteins that demonstrate atypical behavior in standard SDS-PAGE.
The following workflow diagram illustrates the decision process for selecting appropriate electrophoretic methods based on research objectives:
Electrophoresis Method Selection Workflow
Troubleshooting Common SDS-PAGE Artifacts
Even with careful technique, various artifacts can manifest in SDS-PAGE results. The following table addresses common issues and their resolutions:
Table 3: Troubleshooting Common SDS-PAGE Experimental Issues
| Observation | Potential Causes | Recommended Solutions |
|---|---|---|
| Smiling Bands (curved bands) | Uneven heating across gel [15] | Run at lower voltage; ensure adequate buffer circulation |
| Smeared Bands | Incomplete denaturation [15]; high salt concentration [15] | Fresh reducing agents; ensure proper heating; desalt samples |
| Atypical Migration | Incomplete SDS binding [14]; post-translational modifications | Verify SDS:protein ratio; consider glycosylation or phosphorylation |
| Vertical Streaking | Protein aggregation [15]; particulate matter | Centrifuge samples before loading; include urea in buffer |
| Missing Bands | Protein degradation [15]; insufficient loading | Use protease inhibitors; verify protein quantification |
| Multiple Bands for Single Protein | Proteolysis [15]; incomplete reduction | Fresh protease inhibitors; increase reducing agent concentration |
Understanding these potential artifacts and their remedies enables researchers to maintain the reliability of their electrophoretic separations. Particularly for drug development professionals, where quantitative accuracy is paramount, systematic troubleshooting ensures that experimental conclusions reflect biological reality rather than methodological artifacts.
The strategic application of SDS in polyacrylamide gel electrophoresis represents a foundational methodology that continues to enable critical advances across biological research and pharmaceutical development. Through its dual mechanism of protein denaturation and charge normalization, SDS transforms structurally diverse proteins into uniformly charged linear molecules whose electrophoretic mobility correlates reliably with molecular weight. The quantitative precision of this relationship—approximately 1.4 grams of SDS binding per gram of polypeptide—establishes the predictable charge-to-mass ratio that underpins the technique's utility and reproducibility.
While standard SDS-PAGE remains indispensable for molecular weight determination and purity assessment, methodological innovations continue to expand its applications. Techniques such as NSDS-PAGE demonstrate that modified SDS conditions can preserve metal binding and enzymatic activity while maintaining high-resolution separation, bridging the historical divide between denaturing and native electrophoresis [11]. Similarly, specialized buffer systems address the unique challenges posed by extremely high or low molecular weight proteins, ensuring the technique's continued relevance in an era of increasingly complex research questions.
For researchers and drug development professionals, mastery of SDS-PAGE principles and methodologies remains an essential competency. The comprehensive understanding of SDS mechanisms, optimal conditions, and potential artifacts provided in this technical guide establishes a foundation for experimental design, implementation, and interpretation that supports rigorous scientific discovery and therapeutic innovation.
Within the framework of SDS-PAGE (Sodium Dodecyl Sulfate-Polyacrylamide Gel Electrophoresis) principle and mechanism research, the process of protein denaturation is not merely a preliminary step but the foundational event that enables accurate protein separation based solely on molecular weight. The core objective of SDS-PAGE is to negate the influence of a protein's inherent charge and three-dimensional shape, ensuring migration through the polyacrylamide gel is dependent only on size [19] [20]. This is achieved through a deliberate and synergistic denaturation process employing three key agents: the anionic detergent SDS, heat, and reducing agents like Dithiothreitol (DTT) or Beta-Mercaptoethanol (BME). This guide details the individual and combined mechanisms of these agents, providing researchers and drug development professionals with a deep technical understanding essential for optimizing experimental outcomes and interpreting protein data with precision.
The Principle of Protein Denaturation for SDS-PAGE
Proteins in their native state possess complex secondary, tertiary, and often quaternary structures, stabilized by a combination of non-covalent interactions and covalent bonds [21]. These structures confer upon a protein its specific shape and intrinsic net charge, both of which would significantly influence its mobility in an electric field, confounding separation by molecular weight alone [19].
The core principle of sample preparation for SDS-PAGE is the complete dismantling of this native structure to produce linear, uniformly charged polypeptides. This involves:
- Disruption of Non-covalent Interactions: This includes hydrogen bonds, hydrophobic interactions, and ionic bonds that maintain secondary and tertiary folding [20].
- Cleavage of Covalent Disulfide Bridges: These bonds, formed between cysteine residues, stabilize the tertiary and quaternary structure of many proteins [19].
Successful denaturation results in proteins that are functionally identical from an electrophoretic perspective: linear chains coated with a uniform negative charge, thus fulfilling the prerequisite for molecular weight-based separation [20].
The Denaturing Agents and Their Mechanisms
The combined denaturation protocol effectively linearizes proteins by systematically targeting every type of stabilizing interaction. The following diagram illustrates this synergistic mechanism.
Sodium Dodecyl Sulfate (SDS)
SDS is an amphipathic molecule, featuring a hydrophobic 12-carbon tail and a hydrophilic anionic sulfate head group [21]. Its action is two-fold, fundamentally enabling the SDS-PAGE technique.
Mechanism 1: Protein Unfolding. The hydrophobic tail of SDS interacts strongly with the non-polar regions of a protein, which are typically buried in the hydrophobic core in the native state [21] [19]. This binding disrupts hydrophobic interactions, a major stabilizing force in the tertiary structure. Concurrently, the ionic head group can disrupt ionic and hydrogen bonds [21]. This comprehensive binding leads to the complete unfolding of the protein into a random coil structure.
Mechanism 2: Charge Conferral. SDS binds to the polypeptide backbone at a nearly constant ratio of approximately 1.4 g of SDS per 1 g of protein [20]. This abundant coating masks the protein's intrinsic charge and imparts a uniform negative charge density. As a result, the charge-to-mass ratio becomes essentially identical for all proteins, ensuring they migrate towards the anode during electrophoresis at a rate determined only by their size [19] [20].
Heat
Heating the protein sample to 95°C for 5 minutes is a standard step in SDS-PAGE preparation [22] [23].
- Primary Role: The application of heat provides thermal energy that is particularly effective at breaking the vast number of hydrogen bonds that stabilize secondary structures like alpha-helices and beta-sheets [19]. While SDS disrupts these interactions, heat ensures their complete and rapid dissolution.
- Practical Necessity: For certain protein types, such as membrane proteins with strong hydrophobic interactions, thorough heating is critical for complete denaturation and preventing aggregation [23]. Incomplete heating can result in incomplete denaturation, leading to aberrant migration on the gel.
Reducing Agents (DTT and BME)
Reducing agents are essential for disrupting the covalent disulfide bonds that SDS and heat cannot break.
- Mechanism of Action: Both DTT and BME are thiol-containing compounds ("reducing thiols") that act as reducing agents [19]. They break disulfide bonds (S-S) by reducing them into free sulfhydryl groups (-SH), effectively linearizing the polypeptide chain and ensuring complete dissociation of protein subunits [19].
- Agent Comparison:
- Application Note: A typical protocol involves adding BME to a final concentration of 0.55 M (e.g., 1 µL of stock BME per 25 µL of lysate) [22]. For non-reducing SDS-PAGE, used to analyze intact protein complexes, these agents are omitted.
Table 1: Summary of Denaturing Agents and Their Targets in SDS-PAGE
| Agent | Type | Primary Target in Protein Structure | Key Outcome |
|---|---|---|---|
| SDS (Sodium Dodecyl Sulfate) | Anionic detergent | Hydrophobic interactions, ionic bonds [21] [19] | Protein unfolding & uniform negative charge [20] |
| Heat (95°C) | Physical treatment | Hydrogen bonds (secondary structure) [19] | Complete linearization of polypeptide chain |
| DTT / BME | Reducing agent | Covalent disulfide bonds [19] | Dissociation of subunits and full linearization |
Quantitative Data and Experimental Protocol
Key Quantitative Data
The denaturation process relies on specific quantitative parameters to ensure reproducibility and effectiveness.
Table 2: Quantitative Parameters for Effective Protein Denaturation in SDS-PAGE
| Parameter | Typical Value or Ratio | Technical Notes |
|---|---|---|
| SDS-to-Protein Binding Ratio | 1.4 : 1 (g/g) [20] | Ensures full charge masking and protein coating. |
| Heating Temperature | 95 °C [22] [23] | Standard temperature for efficient denaturation. |
| Heating Duration | 5 minutes [22] [23] | Sufficient for most proteins; can be optimized. |
| Final BME Concentration | 0.55 M [22] | Example: 1 µL BME per 25 µL sample. |
| Sample Buffer Concentration | 2X, 5X, or 6X | More concentrated stocks allow loading of diluted samples [23]. |
Detailed Experimental Protocol for Sample Preparation
The following workflow outlines the standard procedure for preparing a protein sample for SDS-PAGE analysis, incorporating the denaturing agents discussed.
Step-by-Step Methodology:
Sample and Buffer Mixing: Transfer the protein sample to a microcentrifuge tube and mix it with an equal volume of 2X SDS-PAGE sample buffer. The sample buffer contains SDS for denaturation and charge conferral, glycerol to increase density for gel loading, and a tracking dye like bromophenol blue to monitor migration [22] [20]. For dilute samples, a more concentrated buffer (e.g., 5X or 6X) can be used to concentrate the sample in the well [23].
Reduction: Add a reducing agent, either DTT or BME, to the sample-buffer mixture. A common formulation is to add BME to a final concentration of 0.55 M [22].
Heat Denaturation: Cap the tubes securely and place them in a heating block or water bath set to 95°C for 5 minutes [22] [23]. This step is critical for complete linearization.
Clarification: After heating, centrifuge the samples at maximum speed in a microcentrifuge for 2–3 minutes to pellet any insoluble debris or aggregates that formed during heating [23].
Loading: Carefully load the clear supernatant into the wells of the prepared polyacrylamide gel. Avoid loading the pellet. The prepared samples are now ready for electrophoresis.
The Scientist's Toolkit: Essential Reagents for SDS-PAGE Denaturation
Table 3: Essential Research Reagents for Protein Denaturation and SDS-PAGE
| Reagent / Material | Function / Role in Denaturation and Separation |
|---|---|
| SDS (Sodium Dodecyl Sulfate) | Anionic detergent that unfolds proteins and confers uniform negative charge [19] [20]. |
| DTT (Dithiothreitol) | Reducing agent that cleaves disulfide bonds; less odor but less stable than BME [23]. |
| BME (Beta-Mercaptoethanol) | Reducing agent that cleaves disulfide bonds; strong odor but stable over freeze-thaw cycles [23]. |
| SDS-PAGE Sample Buffer | Contains SDS, reducing agent, glycerol, and tracking dye to prepare the sample for loading [20]. |
| Tris-Glycine-SDS Running Buffer | Maintains pH and ionic strength, provides ions for conductivity, and supplies SDS to maintain denaturation during the run [20]. |
| Polyacrylamide Gel | Acts as a molecular sieve; stacking gel concentrates proteins, resolving gel separates by size [20]. |
| Molecular Weight Standards | Mixture of pre-stained or unstained proteins of known sizes for estimating molecular weights of unknowns [22] [20]. |
The deliberate and synergistic denaturation of proteins using SDS, heat, and reducing agents is a cornerstone of the SDS-PAGE technique. SDS unfolds the protein and standardizes its charge, heat efficiently disrupts hydrogen-bonded structures, and reducing agents cleave stabilizing disulfide bridges. Together, they transform a heterogeneous mixture of complex proteins into linear, negatively charged polypeptides, allowing for a separation based purely on the fundamental property of molecular weight. A deep understanding of this process, including the specific roles, mechanisms, and optimal conditions for each agent, is indispensable for researchers in biochemistry and drug development to generate reliable, interpretable, and high-quality protein data.
The polyacrylamide gel matrix stands as a fundamental component in the realm of protein separation science, serving as a precisely tunable molecular sieve that enables the high-resolution separation of proteins by size. Within the technique of Sodium Dodecyl Sulfate-Polyacrylamide Gel Electrophoresis (SDS-PAGE), this matrix provides the critical sieving environment that, when combined with the protein-denaturing power of SDS, allows researchers to separate complex protein mixtures based primarily on molecular weight [9] [24]. The development of this matrix into a two-layer discontinuous system by Laemmli in 1970 revolutionized protein analysis, creating a methodology that remains the gold standard in laboratories worldwide more than five decades later [9] [6].
The essential function of the polyacrylamide gel is to create a porous network through which linearized, negatively-charged protein-SDS complexes migrate under an electric field. The pore size distribution within this network determines the separation range and resolution, and this can be systematically controlled by adjusting the concentration of acrylamide and cross-linker [10] [25]. This tunability makes the polyacrylamide gel matrix an extraordinarily versatile tool that can be optimized for specific protein size ranges, from very small peptides to large protein complexes [26] [10]. For researchers and drug development professionals, understanding the construction, tuning, and application of this molecular sieve is crucial for designing experiments, interpreting results, and developing analytical methods for biopharmaceutical characterization [24] [6].
Core Principles of the Gel Matrix as a Molecular Sieve
Composition and Polymerization Chemistry
The polyacrylamide gel is formed through a vinyl addition polymerization reaction that creates a three-dimensional network with precisely controlled porosity. The fundamental components of this system include acrylamide monomers that form the backbone of the polymer chains and bisacrylamide (N,N'-methylenebisacrylamide) that serves as a cross-linking agent, bridging multiple polyacrylamide chains to form the mesh-like structure [10] [25].
The polymerization reaction is catalyzed by a two-component system: ammonium persulfate (APS), which provides the free radicals to initiate polymerization, and N,N,N',N'-tetramethylenediamine (TEMED), which accelerates the decomposition of APS to produce these free radicals [10] [25]. The resulting gel structure possesses pores whose sizes are determined by both the total concentration of acrylamide (%T) and the degree of cross-linking (%C), typically ranging from 2-20% cross-linker relative to the total acrylamide [10].
Table: Fundamental Components of Polyacrylamide Gel Formation
| Component | Chemical Function | Role in Matrix Formation |
|---|---|---|
| Acrylamide | Monomer | Forms the linear polymer backbone chains |
| Bisacrylamide | Cross-linker | Creates bridges between polyacrylamide chains |
| Ammonium Persulfate (APS) | Free radical initiator | Generates free radicals to begin polymerization |
| TEMED | Catalyst | Accelerates free radical production from APS |
The Relationship Between Gel Concentration and Pore Size
The pore size characteristics of the polyacrylamide gel matrix are directly determined by the concentration of acrylamide used in gel formulation. Higher percentages of acrylamide create denser networks with smaller pores, while lower percentages create more open structures with larger pores [10] [25]. This relationship allows researchers to selectively tailor the gel matrix to separate proteins within specific molecular weight ranges of interest.
The pore size distribution follows an inverse relationship with acrylamide concentration, meaning that as the % acrylamide increases, the average pore diameter decreases. This directly affects the electrophoretic mobility of proteins, as larger proteins experience greater frictional resistance when navigating through smaller pores [24] [10]. For optimal separation, researchers typically choose gel percentages that position the proteins of interest in the mid-range of the gel's separation capabilities, where the relationship between migration distance and log molecular weight remains linear [26].
Table: Gel Percentage Recommendations for Protein Separation
| Acrylamide Percentage | Effective Separation Range | Primary Applications |
|---|---|---|
| 6-8% | 50-200 kDa | Large proteins and protein complexes |
| 10% | 30-100 kDa | Standard protein mixture separation |
| 12% | 20-80 kDa | Intermediate protein separation |
| 15% | 10-50 kDa | Small to medium protein separation |
| 4-20% Gradient | 10-300 kDa | Broad range separation without precise knowledge of protein sizes |
The development of gradient gels, which contain a continuously varying concentration of acrylamide from top to bottom, represents an important advancement in gel matrix technology. These gels effectively combine the benefits of multiple acrylamide percentages in a single gel, creating a pore size gradient that automatically optimizes separation across a broad molecular weight range [10] [25]. This makes them particularly valuable for initial characterization of unknown samples or complex mixtures where protein sizes vary significantly.
The Discontinuous Buffer System: Integration with the Gel Matrix
The Two-Layer Gel Architecture
The full power of the polyacrylamide gel matrix as a molecular sieve is realized through its integration with a discontinuous buffer system that employs a two-layer gel architecture [27] [24]. This system consists of two distinct regions: a stacking gel with lower acrylamide concentration (typically ~4%) and pH 6.8, positioned above a resolving gel (or separating gel) with higher acrylamide concentration and pH 8.8 [27] [25].
Each layer serves a specific function in the separation process. The stacking gel acts as an initial staging area where proteins become concentrated into extremely sharp bands before entering the resolving gel. This concentration effect is crucial for achieving high-resolution separation, as it ensures all proteins begin their molecular weight-based separation at the same starting point [27]. The resolving gel then serves as the primary molecular sieve, where proteins separate based on their size as they migrate through its precisely controlled pore structure [24] [10].
The Role of Buffer Chemistry and pH Transitions
The discontinuous nature of this system extends beyond just the gel matrix to include the buffer chemistry. The key to the stacking mechanism lies in the mobility differences between various ions in the system, particularly the chloride ions (from Tris-HCl in the gel) and glycine ions (from the running buffer) [27]. In the stacking gel at pH 6.8, glycine exists primarily as a zwitterion with minimal net charge, resulting in low electrophoretic mobility. Meanwhile, the protein-SDS complexes possess intermediate mobility, and chloride ions have high mobility [27].
This creates a steep voltage gradient that forces the protein-SDS complexes to concentrate into a very narrow zone between the leading chloride ions and trailing glycine ions. When this zone reaches the resolving gel at pH 8.8, the glycine ions become predominantly negatively charged (glycinate anions) and gain high mobility, rapidly passing through the proteins and leaving them to separate based on size as they migrate through the pores of the resolving gel [27] [25].
Experimental Protocols for Gel Preparation and Analysis
Standard Protocol for Casting Discontinuous SDS-PAGE Gels
The preparation of polyacrylamide gels for SDS-PAGE requires precision and attention to detail to ensure reproducible separation performance. The following protocol outlines the standard procedure for casting a discontinuous Tris-glycine SDS-PAGE gel, which remains the most widely used system for protein separation [10] [25].
Resolving Gel Preparation:
- Assemble glass plates in casting cassette according to manufacturer instructions, ensuring clean, dry surfaces to prevent leaks and imperfections.
- Prepare resolving gel solution by mixing appropriate volumes of acrylamide/bisacrylamide stock solution, 1.5M Tris-HCl (pH 8.8), 10% SDS, and deionized water in a clean flask. The total volume depends on gel dimensions, with mini-gels typically requiring 5-10 mL.
- Add polymerization initiators: Immediately before casting, add 10% ammonium persulfate (APS) and TEMED. Mix gently to avoid introducing air bubbles.
- Pour resolving gel into the cassette using a pipette or syringe, leaving appropriate space for the stacking gel (approximately 2-3 cm from top of plates).
- Overlay with saturated isobutanol or water to create a flat interface and exclude oxygen, which inhibits polymerization.
- Allow complete polymerization (typically 20-30 minutes) until a distinct interface forms beneath the overlay.
Stacking Gel Preparation:
- Pour off overlay liquid and rinse gel surface with deionized water to remove any unpolymerized acrylamide.
- Prepare stacking gel solution by mixing appropriate volumes of acrylamide/bisacrylamide stock solution, 0.5M Tris-HCl (pH 6.8), 10% SDS, and deionized water.
- Add polymerization initiators: Add 10% APS and TEMED, mixing gently.
- Pour stacking gel directly onto the polymerized resolving gel and immediately insert a clean comb, avoiding air bubble formation.
- Allow complete polymerization (typically 15-20 minutes) before carefully removing comb and rinsing wells with running buffer or deionized water.
Table: Example Recipe for a 10% Tris-Glycine Mini Gel for SDS-PAGE
| Component | Resolving Gel (10%) | Stacking Gel (4%) |
|---|---|---|
| Acrylamide Solution | 3.75 mL of 40% stock | 0.65 mL of 40% stock |
| 1.5M Tris-HCl (pH 8.8) | 3.75 mL | - |
| 0.5M Tris-HCl (pH 6.8) | - | 1.25 mL |
| 10% SDS | 150 µL | 50 µL |
| Deionized Water | 7.1 mL | 3.0 mL |
| 10% Ammonium Persulfate | 75 µL | 25 µL |
| TEMED | 7.5 µL | 5 µL |
| Total Volume | ~15 mL | ~5 mL |
Protein Visualization Techniques
Following electrophoretic separation, proteins within the gel matrix must be visualized to analyze results. The two most common methods are Coomassie staining and silver staining, each with different sensitivity ranges and procedural requirements [28].
Coomassie Staining Protocol:
- Prepare Coomassie staining solution (0.05% Coomassie Brilliant Blue R-250, 40% ethanol, 10% glacial acetic acid) [28].
- Incubate gel in staining solution for 30 minutes to 2 hours with gentle agitation.
- Destain gel by incubating in destaining solution (40% ethanol, 10% glacial acetic acid) with gentle agitation, changing solution periodically until background is clear and protein bands are visible.
- Enhance destaining by adding a folded paper towel to absorb excess stain during the destaining process.
Silver Staining Protocol:
- Fix proteins in the gel using 40% ethanol/10% acetic acid for at least 30 minutes.
- Sensitize gel with pretreatment solution (commercial kits recommended for reproducibility).
- Wash gel thoroughly with deionized water.
- Impregnate with silver nitrate solution (typically 0.1-0.2%) for 20-30 minutes.
- Wash briefly with deionized water.
- Develop bands using developing solution until desired intensity is reached.
- Stop development with appropriate stop solution.
Silver staining offers significantly higher sensitivity (2-5 ng protein per band) compared to Coomassie staining (typically 50 ng per band) but is less quantitative and can interfere with downstream protein analysis [28].
Advanced Applications in Research and Drug Development
Protein Characterization and Quality Control
The polyacrylamide gel matrix serves as an indispensable tool for protein characterization across diverse research and biopharmaceutical applications. Its primary uses include molecular weight determination through comparison with protein standards of known mass, purity assessment through detection of single or multiple bands, and subunit composition analysis under reducing conditions that dissociate multi-subunit proteins [24]. In drug development, these applications are critical for quality control of therapeutic proteins, including monoclonal antibodies, bispecific antibodies, and antibody-drug conjugates [6].
For monoclonal antibodies, reduced SDS-PAGE reveals the characteristic pattern of heavy and light chains, while non-reduced SDS-PAGE shows the intact antibody, allowing assessment of integrity and detection of fragmentation [6]. The high resolution of polyacrylamide gels enables detection of minor impurities or degradation products that could impact drug safety or efficacy. These applications make SDS-PAGE an essential technique from early development through lot release testing of biopharmaceutical products [6].
Food Science and Allergen Detection
In food science, SDS-PAGE with polyacrylamide gels finds extensive application for protein profiling across diverse food categories, including cereals, pulses, dairy products, meats, seafood, and plant-based alternatives [9]. The technique enables identification of specific proteins in complex food matrices, monitoring protein changes during processing, detection of adulterants, and allergen detection [9]. For example, SDS-PAGE can differentiate gluten proteins from different wheat varieties, assess quality parameters in pulses, and verify the presence of declared meat species in processed products [9].
The technique is particularly valuable for detecting potential allergen contamination in food products, as specific allergenic proteins can be identified based on their molecular weights and banding patterns. This application supports food safety protocols and regulatory compliance in food manufacturing [9].
Technological Evolution: From Traditional Gels to Capillary Systems
While traditional polyacrylamide gel electrophoresis remains widely used, technological advancements have led to the development of capillary electrophoresis SDS (CE-SDS) as a complementary approach [6]. This automated format replaces the physical gel matrix with capillaries filled with separation matrix, offering several advantages including higher resolution, superior reproducibility, quantitative precision, and reduced analysis time [6].
CE-SDS systems provide automated separation with minimal manual intervention, eliminating the need for gel casting, staining, and destaining. The technology offers excellent resolution for characterizing biopharmaceutical products, with specific cartridges available for high-throughput needs (results in 5.5 minutes per sample) or superior resolution applications (25 minutes per sample) [6]. Despite these advantages, traditional polyacrylamide gels maintain importance for their accessibility, visual clarity, and flexibility for method development, ensuring their continued relevance in modern protein analysis workflows.
The Scientist's Toolkit: Essential Reagents and Materials
Table: Key Research Reagent Solutions for SDS-PAGE
| Reagent/Material | Function | Technical Specifications |
|---|---|---|
| Acrylamide/Bis-acrylamide | Gel matrix formation | Typically 29:1 or 37.5:1 ratio of acrylamide to bis-acrylamide; neurotoxin in monomer form requiring careful handling |
| Ammonium Persulfate (APS) | Polymerization initiator | Typically prepared as 10% solution in water; free radical source for polymerization |
| TEMED | Polymerization catalyst | Accelerates free radical production from APS; critical for gel polymerization kinetics |
| Tris Buffers | pH control | 1.5M Tris-HCl, pH 8.8 for resolving gel; 0.5M Tris-HCl, pH 6.8 for stacking gel |
| SDS (Sodium Dodecyl Sulfate) | Protein denaturation & charge uniformity | 10% solution; anionic detergent that binds proteins at ~1.4g SDS per 1g protein [24] |
| Glycine | Running buffer component | Zwitterionic buffer ion; key to discontinuous buffer system; running buffer typically contains 25mM Tris, 192mM glycine, 0.1% SDS, pH 8.3 [27] |
| Protein Molecular Weight Markers | Size standards | Pre-stained or unstained proteins of known molecular weight for calibration |
| Coomassie Brilliant Blue R-250 | Protein stain | 0.05% in 40% ethanol, 10% acetic acid; detects ~50 ng protein per band [28] |
| Silver Stain | High-sensitivity protein detection | Detects 2-5 ng protein per band; more complex protocol than Coomassie [28] |
| β-mercaptoethanol or DTT | Disulfide bond reduction | Added to sample buffer (typically 5% final concentration) to reduce disulfide bonds [25] |
The polyacrylamide gel matrix represents a remarkably adaptable molecular sieve whose pore structure can be precisely tuned through systematic adjustment of acrylamide concentration and cross-linking density. This tunability, combined with the sophisticated discontinuous buffer system, enables high-resolution separation of proteins based on molecular weight, making SDS-PAGE an indispensable technique across diverse scientific disciplines. From basic research to biopharmaceutical development and food science applications, this methodology provides critical insights into protein composition, purity, and structure [9] [24] [6].
Despite the emergence of complementary technologies like capillary electrophoresis, the fundamental principles of the polyacrylamide gel matrix continue to underpin modern protein separation science. Its versatility, reproducibility, and accessibility ensure that it remains an essential tool for researchers and drug development professionals seeking to understand and characterize proteins with precision and accuracy. As protein therapeutics and analytical methodologies continue to advance, the tunable molecular sieve provided by the polyacrylamide gel matrix will undoubtedly maintain its central role in scientific discovery and biopharmaceutical quality control.
Within the realm of protein biochemistry, polyacrylamide gel electrophoresis (PAGE) serves as a fundamental tool for separating complex protein mixtures. When this technique is coupled with the denaturing detergent sodium dodecyl sulfate (SDS), it allows for separation primarily based on molecular weight [10]. The resolution and efficacy of SDS-PAGE, a cornerstone of modern proteomics and drug development research, are fundamentally dependent on the ingenious implementation of a discontinuous buffer system [3]. This system, which utilizes stacking and resolving gels with different physicochemical properties, is what transforms a simple electrophoretic migration into a high-resolution analytical method.
The discontinuous system, pioneered by Laemmli, is so named because it employs buffers of different ionic compositions and pH at various points within the electrophoretic apparatus [29] [30]. This discontinuity is critical for concentrating the protein sample into a sharp band before the main separation occurs, thereby ensuring that proteins of identical size migrate as a tight unit, which dramatically improves resolution [31]. This technical guide delves into the core principles, components, and mechanisms of the discontinuous buffer system, framing it within broader research on the principles and mechanisms of protein separation by SDS-PAGE.
Fundamental Principles of the Discontinuous System
The core objective of any electrophoresis system is to separate molecules based on their differential mobility through a gel matrix under an applied electric field. For proteins, their inherent three-dimensional structures and variable charge profiles based on amino acid composition make direct separation by mass impossible under native conditions [29]. SDS-PAGE overcomes this by using the anionic detergent SDS to linearize proteins and confer a uniform negative charge, making electrophoretic mobility primarily a function of molecular size [10] [32].
The discontinuous system enhances this basic principle by introducing a stacking mechanism. The key to this mechanism lies in manipulating the mobility of ions in the system to create a sharp, concentrated starting zone for the proteins [30]. The entire process hinges on two distinct layers of gel, each with specific properties, as outlined in Table 1: Composition and Function of Gel Layers in the Discontinuous Buffer System.
Table 1: Composition and Function of Gel Layers in the Discontinuous Buffer System
| Gel Layer | Acrylamide Concentration (%) | pH | Primary Buffer | Main Function |
|---|---|---|---|---|
| Stacking Gel | 4-5% [3] (Low) | 6.8 [29] [30] | Tris-HCl | To concentrate disparate protein samples into a sharp, unified band before they enter the resolving gel. |
| Resolving Gel | 7-20% [10] [15] (Variable) | 8.8 [29] [30] | Tris-HCl | To separate the focused protein band into individual components based primarily on their molecular weight. |
The effectiveness of this two-gel system is governed by the precise control of ion mobility. The running buffer, typically Tris-glycine at pH 8.3, contains glycine, a key player whose charge state is pH-dependent [32] [29]. At the pH of the stacking gel (6.8), glycine exists predominantly as a zwitterion with no net charge and thus low electrophoretic mobility [30]. In contrast, the chloride ions (Cl⁻) from Tris-HCl in the gel move with high mobility. This disparity creates a narrow, steep voltage gradient that sweeps the proteins into a sharp zone between the fast-moving chloride front (leading ion) and the slow-moving glycine front (trailing ion) [32] [3]. When this ion front reaches the resolving gel at pH 8.8, the glycine molecules lose a proton, become negatively charged glycinate ions, and gain high mobility, overtaking the proteins. The proteins, now released from the stacking zone and entering a gel with smaller pores, begin to separate based on their size [29] [30].
Core Components and Their Roles
A deep understanding of the discontinuous buffer system requires a detailed look at the specific chemicals involved and their precise functions.
Chemical Composition and Reagents
The entire process is driven by a carefully balanced set of reagents, each playing a critical role. The following table, The Scientist's Toolkit: Key Reagents for Discontinuous SDS-PAGE, catalogs these essential materials.
Table 2: The Scientist's Toolkit: Key Reagents for Discontinuous SDS-PAGE
| Reagent | Function | Key Characteristics |
|---|---|---|
| Acrylamide/Bis-acrylamide | Forms the porous polyacrylamide gel matrix that acts as a molecular sieve [10]. | The ratio and total concentration determine pore size; higher % acrylamide resolves smaller proteins [10]. |
| Tris-HCl | Buffering agent for both stacking and resolving gels [30]. | Different pH (6.8 vs. 8.8) for stacking and resolving gels, respectively, is crucial for the discontinuous system [29]. |
| SDS (Sodium Dodecyl Sulfate) | Anionic detergent that denatures proteins and confers a uniform negative charge [10] [32]. | Binds at ~1.4 g SDS per 1 g of protein, masking intrinsic charge and allowing separation by size [3]. |
| Ammonium Persulfate (APS) & TEMED | Catalytic system for gel polymerization. APS provides free radicals, and TEMED accelerates the reaction [10] [3]. | Typically prepared fresh for consistent and complete gel polymerization. |
| Glycine | Key ion in the running buffer whose mobility is controlled by pH [32] [30]. | At pH 6.8, it is a slow zwitterion; at pH 8.8, it is a fast-moving anion, enabling the stacking effect [29]. |
| Sample Buffer (Laemmli Buffer) | Prepares the protein sample for electrophoresis [30]. | Contains SDS, a reducing agent (e.g., BME), glycerol, tracking dye, and Tris buffer at pH 6.8 [32]. |
The Mechanism of Stacking Visualized
The dynamic interplay between the leading chloride ions, the trailing glycine, and the proteins is the engine of the stacking process. The following diagram illustrates the step-by-step mechanism as the proteins transition from the stacking gel to the resolving gel.
Experimental Protocol and Methodologies
To achieve reproducible and high-resolution results, a meticulous approach to gel preparation and electrophoresis is paramount. The following section provides a detailed methodology for casting a discontinuous SDS-PAGE gel and executing the run.
Gel Casting Protocol
Part A: Preparing the Resolving Gel
- Assemble the Gel Cassette: Secure clean glass plates with spacers in a casting stand to form a leak-proof cassette.
- Mix Resolving Gel Solution: Combine the following components in the order listed for a 10% resolving gel [10]:
- 4.0 mL of 40% Acrylamide/Bis solution
- 3.8 mL of 1.5 M Tris-HCl, pH 8.8
- 4.2 mL of Deionized Water
- 0.15 mL of 10% SDS
- Initiate Polymerization: Just before pouring, add:
- 0.15 mL of 10% Ammonium Persulfate (APS)
- 0.01 mL of TEMED
- Swirl gently to mix. Avoid introducing bubbles.
- Pour and Overlay: Immediately pipette the solution into the gel cassette. Gently overlay the gel solution with water-saturated butanol or isopropanol to exclude oxygen and create a flat meniscus [3].
- Polymerize: Allow the gel to polymerize completely (typically 20-30 minutes). A distinct schlieren line will appear between the gel and the overlay.
Part B: Preparing the Stacking Gel
- Remove Overlay: Once polymerized, pour off the overlay liquid and rinse the top of the gel with deionized water. Blot away residual liquid with filter paper.
- Mix Stacking Gel Solution: Combine the following for a 5% stacking gel [3]:
- 0.5 mL of 40% Acrylamide/Bis solution
- 1.0 mL of 0.5 M Tris-HCl, pH 6.8
- 2.4 mL of Deionized Water
- 0.05 mL of 10% SDS
- Initiate and Pour: Add:
- 0.05 mL of 10% APS
- 0.01 mL of TEMED
- Mix and pour the solution on top of the resolving gel.
- Insert Comb: Immediately insert a clean sample comb without introducing bubbles. Allow the stacking gel to polymerize for 20-30 minutes.
Electrophoresis Execution
- Sample Preparation: Dilute protein samples in Laemmli buffer [30]. Heat at 95°C for 5 minutes to ensure complete denaturation [3]. Centrifuge briefly to collect condensation.
- Assemble Apparatus: Place the polymerized gel cassette into the electrophoresis chamber. Fill the inner and outer chambers with Tris-glycine running buffer (pH 8.3) containing 0.1% SDS [29].
- Load Samples: Carefully remove the comb. Using a microsyringe, load equal amounts of protein (e.g., 10-40 µg) or a molecular weight marker into each well [30].
- Apply Current: Connect the apparatus to a power supply. Run the gel at a constant voltage of 80-100V initially. Once the samples have entered the resolving gel (tracked by the bromophenol blue dye), the voltage can be increased to 120-150V for the remainder of the run [30].
- Termination: Stop electrophoresis when the dye front reaches the bottom of the gel.
Troubleshooting and Optimization
Even with a sound protocol, issues can arise. Recognizing and correcting common problems is essential for research integrity.
- Smiling Bands (bands curve upward at edges): Caused by uneven heating across the gel. Solution: Ensure the gel apparatus is properly cooled, reduce the running voltage, or check that the buffer is circulating evenly [15].
- Smeared Bands: Often results from incomplete denaturation of proteins or overloading. Solution: Ensure the sample buffer contains fresh reducing agent (DTT or BME) and that the heating step was sufficient. Lower the total protein load per well [15].
- Vertical Streaking: Can be caused by precipitation of proteins, often due to high salt concentration in the sample. Solution: Desalt samples or dilute them in a lower salt buffer before preparation [30].
- Poor Stacking: If the tight band of dye is not formed in the stacking gel, the discontinuous pH system has failed. Solution: Check the pH of all buffers (stacking gel, resolving gel, and running buffer) and ensure they are correctly prepared [29] [30].
Mastering the SDS-PAGE Workflow: From Sample Prep to Real-World Applications
Sodium dodecyl sulfate-polyacrylamide gel electrophoresis (SDS-PAGE) is a foundational analytical technique in molecular cell biology and proteomics, enabling researchers to separate complex mixtures of proteins based on their molecular weight [18] [10]. The core principle of this method relies on the use of an anionic detergent, SDS, to denature proteins and confer upon them a uniform negative charge [33]. When an electric field is applied, these SDS-protein complexes migrate through a porous polyacrylamide gel matrix, where smaller proteins migrate faster due to less resistance, while larger proteins migrate more slowly [18]. This process effectively eliminates the influence of a protein's native charge or three-dimensional structure, ensuring separation is almost solely based on polypeptide chain length [18] [10]. The following guide provides a detailed, step-by-step protocol for casting SDS-PAGE gels, preparing protein samples, and executing electrophoresis, framed within the broader thesis of its fundamental mechanism for protein separation.
The workflow below illustrates the complete SDS-PAGE procedure, from initial setup to the final separated proteins.
Gel Casting Protocol
Polyacrylamide gels are created from a polymer network formed by mixing acrylamide and bisacrylamide, which serves as the sieving matrix for protein separation [10]. The gel casting process involves creating two distinct layers: a resolving gel (or separating gel) where size-based separation occurs, and a stacking gel that concentrates all protein samples into a sharp band before they enter the resolving gel, thereby enhancing resolution [18] [10].
Resolving Gel Preparation and Casting
The resolving gel, with its higher acrylamide concentration and specific pH, is responsible for separating proteins based on size [10]. The appropriate acrylamide percentage must be selected based on the molecular weight of the target proteins to achieve optimal resolution.
Table 1: Resolving Gel Composition for a 12% Gel (for two mini-gels)
| Component | Volume for Two 1.0 mm Gels | Final Percentage/Concentration |
|---|---|---|
| 30% Acrylamide/Bis Solution | 6.0 mL | 12% |
| 1.5 M Tris-HCl, pH 8.8 | 3.75 mL | 375 mM |
| 10% SDS | 150 µL | 0.1% |
| 10% Ammonium Persulfate (APS) | 75 µL | 0.05% |
| TEMED | 7.5 µL | 0.05% |
| Deionized Water | 5.025 mL | - |
| Total Volume | ~15 mL |
Table 2: Acrylamide Percentage and Protein Separation Range
| % Acrylamide in Resolving Gel | Effective Separation Range (kDa) |
|---|---|
| 8% | 25 - 200 |
| 10% | 15 - 100 |
| 12.5% | 10 - 70 |
| 15% | 12 - 45 |
- Assemble the Gel Casting Mold: Thoroughly clean the glass plates with ethanol or industrial methylated spirit (IMS) and assemble them with spacers into a casting frame according to the manufacturer's instructions [34] [35]. Test for leaks by pipetting deionized water between the plates; if no leakage occurs, pour out the water and dry with a lint-free wipe [35].
- Mix Resolving Gel Components: In a clean receptacle, combine the acrylamide solution, Tris-HCl (pH 8.8), SDS, and water as specified in Table 1. Do not add APS and TEMED at this stage, as they will initiate polymerization [34] [35].
- Initiate Polymerization and Pour: Add the 10% APS and TEMED to the mixture. Mix gently without introducing air bubbles. Immediately use a plastic transfer pipette to pour the solution between the glass plates to the desired height, leaving space for the stacking gel [34] [35].
- Overlay with Solvent: Gently overlay the unpolymerized gel with water-saturated isopropanol or deionized water. This layer prevents contact with air (oxygen), which inhibits polymerization and ensures a flat, uniform gel surface [18] [34].
- Polymerize: Allow the gel to polymerize completely for 20-45 minutes at room temperature. Polymerization is complete when a distinct interface is visible between the gel and the overlay liquid [18] [35].
Stacking Gel Preparation and Casting
The stacking gel, with a lower acrylamide concentration and pH, serves to concentrate the protein samples into a narrow line before they enter the resolving gel [18] [10].
Table 3: Stacking Gel Composition (for two mini-gels)
| Component | Volume for Two 1.0 mm Gels | Final Percentage/Concentration |
|---|---|---|
| 30% Acrylamide/Bis Solution | 1.98 mL | 5% |
| 0.5 M Tris-HCl, pH 6.8 | 3.78 mL | 126 mM |
| 10% SDS | 150 µL | 0.1% |
| 10% Ammonium Persulfate (APS) | 75 µL | 0.05% |
| TEMED | 15 µL | 0.1% |
| Deionized Water | 9.0 mL | - |
| Total Volume | ~15 mL |
- Remove Overlay and Prepare Stacking Gel: Once the resolving gel has polymerized, pour off the overlay liquid. Wick away any residual liquid with a lint-free tissue or filter paper [34].
- Mix Stacking Gel Components: In a separate tube, combine acrylamide, Tris-HCl (pH 6.8), SDS, and water. Just before pouring, add APS and TEMED and mix gently [35].
- Pour Stacking Gel and Insert Comb: Pour the stacking gel mixture directly onto the polymerized resolving gel. Fill the cassette completely. Immediately insert a clean comb into the liquid stacking gel, being careful to avoid trapping air bubbles under the teeth [34].
- Polymerize: Allow the stacking gel to polymerize for 20-30 minutes. Once set, carefully remove the comb in a vertical motion to prevent tearing the wells. The gel is now ready for electrophoresis or can be wrapped in moist tissue paper and cling film and stored at 4°C for several weeks [18] [34].
The following diagram details the key stages of the gel casting process.
Sample Preparation Protocol
Proper sample preparation is critical for successful SDS-PAGE, as it ensures complete denaturation of proteins into linear polypeptides with a uniform charge-to-mass ratio [36] [10].
Sample Buffer Composition and Denaturation
A standard 2X Laemmli sample buffer contains several key components, each with a specific function to facilitate denaturation and tracking.
Table 4: Components of a Standard 2X Sample Buffer
| Component | Typical Concentration | Function |
|---|---|---|
| SDS (Sodium Dodecyl Sulfate) | 2-4% | Denatures proteins and confers uniform negative charge [36] [10]. |
| Tris-HCl Buffer | 62.5 - 125 mM | Maintains stable pH [36]. |
| Glycerol | 10-20% | Increases sample density for easy loading into wells [36]. |
| Reducing Agent (DTT or β-mercaptoethanol) | 100-350 mM | Breaks disulfide bonds to fully unfold proteins [36] [37]. |
| Bromophenol Blue Tracking Dye | ~0.01% | Visualizes sample migration during electrophoresis [36]. |
- Prepare Sample-Buffer Mixture: Mix the protein sample with an equal volume of 2X sample buffer. For example, combine 25 µL of protein sample with 25 µL of 2X buffer [36] [37]. A final protein concentration of 1-2 mg/mL is often suitable, aiming to load 0.5-1 µg per expected band for pure proteins or 10-50 µg for complex mixtures like cell lysates [36] [37].
- Denature Proteins: Heat the sample-buffer mixture at 95-100°C for 3-5 minutes in a heating block or boiling water bath [18] [37]. Heating is essential as it "shakes up the molecules, allowing SDS to bind in the hydrophobic regions and complete the denaturation" [36]. Caution: Overheating (e.g., beyond 100°C) can cause protein aggregation [36].
- Centrifuge: After heating, centrifuge the samples at high speed (e.g., 15,000 rpm) for 1-3 minutes to pellet any insoluble debris [18] [37]. The supernatant is now ready to be loaded onto the gel.
Electrophoresis Protocol
The final stage involves running the gel to separate the denatured proteins.
- Assemble Electrophoresis Apparatus: Remove the polymerized gel cassette from the casting frame and mount it into the electrophoresis chamber according to the manufacturer's instructions. Ensure the gel is properly seated to prevent buffer leaks [18] [37].
- Fill with Running Buffer: Fill the inner (upper) and outer (lower) chambers of the electrophoresis apparatus with 1X SDS-PAGE running buffer (e.g., Tris-Glycine-SDS buffer). The running buffer conducts current and provides ions necessary for the discontinuous electrophoresis system [18] [37].
- Load Samples and Markers: Using a micropipette, load the prepared protein samples and molecular weight markers into the wells. Record the lane assignments. A typical loading volume for a 1.0 mm thick gel with a 10-well comb is 10-30 µL per well [18] [34] [37].
- Run Electrophoresis: Connect the electrodes (proteins will migrate toward the positive anode), place the cover on the apparatus, and turn on the power supply. Run the gel at a constant voltage of 100-150 V for a mini-gel system [18] [37]. The run should continue until the bromophenol blue tracking dye reaches the bottom of the gel (typically 45-90 minutes).
- Post-Electrophoresis Analysis: Once the run is complete, turn off the power, disconnect the apparatus, and carefully remove the gel cassette. Pry the plates apart using a spatula and proceed with the desired downstream analysis, such as protein staining (e.g., Coomassie Blue), western blotting, or other proteomic applications [18] [10].
The Scientist's Toolkit: Essential Research Reagent Solutions
Table 5: Key Reagents for SDS-PAGE
| Reagent Solution | Function in Protocol | Key Characteristics |
|---|---|---|
| Acrylamide/Bis-Acrylamide (30-40%) | Forms the porous gel matrix for protein separation. | Neurotoxic in monomeric form; typically used at a 37.5:1 or 29:1 ratio of acrylamide to bis-acrylamide [34] [10]. |
| Tris-HCl Buffer (pH 6.8 & 8.8) | Provides the appropriate pH environment for gel polymerization and electrophoresis. | Stacking gel (pH ~6.8) and resolving gel (pH ~8.8) create a discontinuous system for sample stacking [34] [10]. |
| SDS (Sodium Dodecyl Sulfate) | Anionic detergent that denatures proteins and imparts uniform negative charge. | Binds to polypeptide backbone at a constant ratio ( ~1.4 g SDS/g protein), masking intrinsic protein charge [18] [10]. |
| APS (Ammonium Persulfate) & TEMED | Polymerization catalysts for the polyacrylamide gel. | APS provides free radicals; TEMED is a catalyst that accelerates polymerization [34] [10]. |
| Reducing Agents (DTT, β-mercaptoethanol) | Cleaves disulfide bonds in proteins for complete denaturation. | Essential for removing the last bit of tertiary and quaternary structure; DTT is often preferred due to a less pungent odor [36]. |
| Protein Molecular Weight Markers | A set of proteins of known sizes for estimating sample protein weights. | Run alongside unknown samples; available in pre-stained or unstained formats [37] [10]. |
Sodium Dodecyl Sulfate-Polyacrylamide Gel Electrophoresis (SDS-PAGE) stands as a cornerstone analytical technique in biochemical research and pharmaceutical development for separating protein mixtures according to their molecular weights. This method relies on a sophisticated biochemical system where several key reagents interact to denature proteins, impose a uniform charge, and facilitate separation through a porous polyacrylamide matrix under an electrical field. The principle of SDS-PAGE hinges on the fact that all proteins, regardless of their inherent charge, can be made to migrate towards the anode based almost exclusively on their molecular size. This is achieved through a delicate interplay of denaturing agents, catalysts, and buffer ions that work in concert to create a discontinuous electrophoretic system, first stacking proteins into a sharp zone before resolving them into discrete bands in the separating gel.
The critical reagents that enable this process—TEMED, Ammonium Persulfate (APS), Tris, Glycine, and tracking dye—each perform specialized, non-redundant functions within the experimental framework. Understanding their individual chemical properties and synergistic interactions is fundamental to mastering SDS-PAGE protocol optimization, which is essential for applications ranging from quality control in biopharmaceutical development to proteomic analysis in basic research. This technical guide provides an in-depth examination of these core reagents, framing their functions within the broader mechanistic context of protein separation to empower researchers with the knowledge to troubleshoot experiments and achieve highly reproducible results.
Core Reagent Functions and Specifications
The following table summarizes the primary functions, key characteristics, and operational roles of the five essential reagents in SDS-PAGE.
Table 1: Core SDS-PAGE Reagents and Their Functions
| Reagent | Primary Function | Key Characteristics & Mechanism | Role in Separation Process |
|---|---|---|---|
| TEMED | Catalyst for gel polymerization [10] | Stabilizes free radicals from APS; initiates cross-linking of acrylamide monomers [38] [10]. | Creates the porous polyacrylamide gel matrix essential for molecular sieving. |
| APS (Ammonium Persulfate) | Polymerization initiator [38] | Spontaneously decomposes to form free radicals that initiate acrylamide polymerization [38]. | Serves as the source of free radicals to begin the formation of the gel matrix. |
| Tris (Tris(hydroxymethyl)aminomethane) | Buffer component [39] | Maintains stable pH in both stacking (pH ~6.8) and resolving (pH ~8.8) gels [10]. | Establishes the pH environment critical for proper protein charge and ion mobility. |
| Glycine | Leading ion in discontinuous buffer system [39] | At stacking gel pH, exists as a zwitterion with low mobility; at resolving gel pH, becomes fully negatively charged and highly mobile [39] [10]. | Creates the discontinuous buffer system that stacks proteins before their separation. |
| Tracking Dye (e.g., Bromophenol Blue) | Visual migration marker [40] | Anionic dye that migrates toward the anode, providing a visible front to monitor electrophoresis progress [40]. | Allows visual monitoring of the electrophoresis run and indicates when to terminate the process. |
Experimental Protocol and Workflow
A standard protocol for discontinuous SDS-PAGE, as derived from established laboratory methods, involves a sequential process of gel preparation, sample preparation, and electrophoresis [38].
Gel Preparation
The process begins with the casting of the resolving gel (also called the separating gel), followed by the stacking gel. A typical 10% resolving gel mixture includes water, 30% acrylamide/bis-acrylamide solution, 1.5 M Tris-HCl (pH 8.8), and 10% SDS. Polymerization is initiated by adding 10% Ammonium Persulfate (APS) and TEMED. The solution is poured between glass plates and often overlaid with a small layer of butanol or water to create a flat surface. Once polymerized, the stacking gel is prepared with a lower acrylamide concentration (e.g., 5%) and a different pH buffer (0.5 M Tris-HCl, pH 6.8). APS and TEMED are added to this mixture, which is then poured on top of the polymerized resolving gel, and a comb is immediately inserted to create sample wells [38] [10].
Sample Preparation and Electrophoresis
Protein samples are combined with Laemmli sample buffer, which contains SDS and a reducing agent like 2-mercaptoethanol. The mixture is heated at 95-100°C for 3-5 minutes to denature the proteins and ensure uniform SDS binding. The prepared samples and molecular weight markers are then loaded into the wells. The gel cassette is placed in an electrophoresis tank filled with Tris-Glycine SDS running buffer [39] [38]. A constant current (e.g., 30 mA for a mini-gel) is applied until the tracking dye front migrates to the bottom of the gel, typically taking about one hour. The gel is then removed for downstream applications such as staining, western blotting, or mass spectrometric analysis [38] [10].
Schematic Workflow of SDS-PAGE
The following diagram illustrates the key stages and reagent interactions in a standard SDS-PAGE experiment.
The Scientist's Toolkit: Essential Research Reagent Solutions
Successful execution of SDS-PAGE requires not only the core reagents but also a suite of complementary materials and solutions. The following table details these essential components.
Table 2: Essential Reagents and Materials for SDS-PAGE Experiments
| Item | Function / Description | Example Product / Specification |
|---|---|---|
| Tris-Glycine SDS Running Buffer | Conducts current and provides ions for the discontinuous buffer system during electrophoresis [39]. | Often purchased as a 10X concentrate (e.g., Novex Tris-Glycine SDS Running Buffer) and diluted to 1X before use [39]. |
| Acrylamide/Bis-acrylamide Solution | The monomer and cross-linker that form the porous polyacrylamide gel matrix when polymerized [10]. | Typically a 30-40% stock solution at a fixed ratio (e.g., 29:1 or 37.5:1 acrylamide:bis). Caution: Neurotoxin in monomer form. [38] |
| Laemmli Sample Buffer | Prepares protein samples by providing SDS for denaturation/charging, glycerol for density, and a tracking dye [38]. | Contains SDS, Tris-HCl, glycerol, Bromophenol Blue, and often β-mercaptoethanol as a reducing agent. |
| Molecular Weight Markers | A mixture of proteins of known sizes that allows for estimation of sample protein molecular weights. | Available in various size ranges, prestained or unstained (e.g., PageRuler Unstained Protein Ladder) [10]. |
| Precast Gels | Ready-to-use polyacrylamide gels that eliminate the need for in-lab gel casting, ensuring consistency and saving time. | Available in various percentages and formats (e.g., Novex Tris-Glycine gels) [39]. |
| Protein Stains | Used to visualize separated protein bands in the gel after electrophoresis is complete. | Includes Coomassie Brilliant Blue, silver stain, and fluorescent stains (e.g., SimplyBlue SafeStain) [10]. |
The sophisticated mechanism of protein separation in SDS-PAGE emerges from the precisely coordinated functions of its core reagents. TEMED and APS are the foundational catalysts that create the sieving matrix, while Tris buffers establish the critical pH environments at each stage. Glycine's dynamic charge behavior drives the discontinuous buffer system that is central to achieving high-resolution bands, and the anionic tracking dye provides the visual feedback necessary for experimental control. A deep, mechanistic understanding of these reagents—their individual properties, their interactions, and their roles in the broader experimental context—is indispensable for researchers aiming to optimize protocols, troubleshoot effectively, and generate robust, reproducible data. This knowledge forms the basis for the technique's extensive application in scientific discovery and biopharmaceutical development, from characterizing recombinant therapeutics to analyzing complex proteomic samples.
Sodium Dodecyl Sulfate-Polyacrylamide Gel Electrophoresis (SDS-PAGE) is a foundational technique in biochemical research that allows for the separation of proteins based on their molecular weight. The core principle of this method relies on the fact that proteins denatured by the anionic detergent SDS become uniformly negatively charged, causing charge-to-mass ratios to be similar across different proteins. This effectively eliminates charge as a separation variable, leaving molecular size as the primary determinant of electrophoretic mobility through the polyacrylamide gel matrix [41]. The polyacrylamide gel acts as a molecular sieve, with its pore size dictating the resolution capabilities for proteins of different sizes. The pore size is directly controlled by the percentage of acrylamide in the gel, making the selection of an appropriate gel concentration a critical parameter for successful protein separation in various applications, including proteomics, drug development, and food quality assessment [42] [43].
The discontinuous buffer system, pioneered by Laemmli, employs two distinct gel layers with different pH values and acrylamide concentrations to enhance separation. The stacking gel, with lower acrylamide content (typically 4-5%) and pH 6.8, serves to concentrate protein samples into a tight band before they enter the resolving gel. This concentration occurs through an ion migration phenomenon where highly mobile chloride ions and slower-moving glycine zwitterions create a steep voltage gradient that compresses protein samples into a narrow zone. When this zone reaches the resolving gel with its higher pH (8.8) and acrylamide concentration, the glycine ions become negatively charged and migrate faster, depositing the protein sample as a sharp band at the top of the resolving gel where size-based separation begins [41].
Principles of Gel Percentage Selection
The Relationship Between Acrylamide Concentration and Protein Separation
The percentage of acrylamide in a gel directly determines the size of the pores within the polyacrylamide matrix, which in turn governs the migration of linearized SDS-protein complexes. Higher percentages of acrylamide create denser cross-linking and smaller pores, making it more difficult for larger proteins to navigate through the gel. Conversely, lower acrylamide percentages create larger pores that allow bigger proteins to migrate more freely while providing less resistance to smaller proteins [41] [44]. This sieving effect means that for any given acrylamide concentration, there exists an optimal molecular weight range where separation resolution is maximized. Proteins outside this optimal range will either migrate too slowly (if too large for the gel pores) or too rapidly (if too small), resulting in poor resolution [45].
The migration of proteins through the gel is not linear with time, as smaller proteins progressively encounter more resistance when entering regions of the gel with effectively smaller pores. This phenomenon is particularly pronounced in gradient gels, where the increasing acrylamide concentration causes the leading edge of a protein band to migrate more slowly than the trailing edge, resulting in a "stacking" effect that produces sharper, more defined bands [45]. The same principle applies to fixed-percentage gels, though the effect is less dramatic. Understanding this relationship is fundamental to selecting the appropriate gel percentage for the protein sizes of interest in any given experiment.
Gel Percentage Recommendations for Protein Size Ranges
Extensive empirical research has established standard acrylamide percentages optimal for resolving proteins within specific molecular weight ranges. The following table provides a comprehensive guide for selecting gel percentages based on target protein sizes, synthesized from multiple technical sources:
Table 1: Optimal Gel Percentages for Different Protein Sizes
| Protein Size Range | Recommended Gel Percentage | Separation Characteristics |
|---|---|---|
| 4-40 kDa [45] | Up to 20% [45] | Ideal for small peptides and low molecular weight proteins; provides tight band separation |
| 12-45 kDa [46] [45] | 15% [46] [45] | Excellent resolution for smaller proteins; commonly used for cytokines and peptide fragments |
| 10-70 kDa [46] [45] | 12.5% [46] [45] | Versatile range for many cytoplasmic proteins |
| 15-100 kDa [46] [45] | 10% [46] [45] | Standard workhorse gel for many experimental proteins |
| 50-200 kDa [46] [45] | 8% [46] [45] | Suitable for medium to large proteins including many receptors |
| >200 kDa [46] [45] | 4-6% [46] [45] | Essential for very large proteins; minimal sieving effect to allow migration |
These recommendations provide a starting point for gel selection, though optimization may be required for specific applications. It is important to note that alternative classification systems exist, with some sources recommending slightly different ranges, such as 7% gels for 50-500 kDa proteins or 15% gels for 3-100 kDa proteins [44]. These variations highlight the context-dependent nature of gel selection and the potential need for empirical optimization when working with novel protein systems.
Advanced Separation Techniques: Gradient Gels
Principles and Advantages of Gradient Gels
Gradient gels provide a powerful alternative to fixed-percentage gels by incorporating a continuous gradient of acrylamide concentration, typically from low to high percentage, within a single gel. This configuration creates a progressively decreasing pore size through which proteins must migrate during electrophoresis. As proteins move through the gradient, they encounter increasingly restrictive pores, causing each protein to slow its migration at a point where the pore size approaches its hydrodynamic radius. This results in several distinct advantages over fixed-percentage gels, including the ability to resolve a broader range of protein sizes on a single gel, producing sharper bands, and achieving better separation of similarly-sized proteins [45].
The sharpening effect in gradient gels occurs because the leading edge of a protein band encounters smaller pores and migrates more slowly than the trailing edge, causing the band to compress as it moves through the gel. This self-sharpening effect produces exceptionally well-defined bands that are ideal for publication-quality images and quantitative analysis. Additionally, the extended separation range of gradient gels makes them particularly valuable when analyzing complex protein mixtures with components spanning a wide molecular weight range, or when sample quantity is limited and running multiple gels at different percentages is impractical [45].
Selecting Appropriate Gradient Ranges
The choice of gradient range should be guided by the specific proteins of interest within a sample. The following table provides guidance on selecting gradient gels based on experimental requirements:
Table 2: Gradient Gel Selection for Different Applications
| Protein Size Range | Low/High Acrylamide Percentage | Application Context |
|---|---|---|
| 4-250 kDa [45] | 4% / 20% [45] | Discovery work; analyzing complex mixtures with unknown protein sizes |
| 10-100 kDa [45] | 8% / 15% [45] | Targeted analysis of proteins within a specific range; avoids running multiple gels |
| 50-75 kDa [45] | 10% / 12.5% [45] | High-resolution separation of similarly-sized proteins |
The preparation of gradient gels requires more technical skill than fixed-percentage gels and can be accomplished using either a gradient mixer or a simplified pipette method. The gradient mixer approach uses two chambers containing low and high acrylamide concentrations, respectively, with a controlled flow combining the solutions as they enter the gel cassette. Alternatively, the pipette method involves sequentially drawing low and high concentration acrylamide solutions into a serological pipette, introducing a small air bubble to mix the solutions, and then carefully dispensing the gradient mixture into the gel casting apparatus [45]. For laboratories requiring high reproducibility or with high throughput needs, commercially available precast gradient gels provide convenience and consistency, though at a higher cost than laboratory-poured gels.
Experimental Protocols for Gel Preparation and Electrophoresis
Gel Casting Methodology
The preparation of polyacrylamide gels requires precision and attention to detail to ensure reproducible results. The following protocol outlines the standard procedure for casting discontinuous SDS-PAGE gels:
- Assemble Gel Casting Apparatus: Clean glass plates and spacers thoroughly with deionized water and ethanol before assembly to ensure proper sealing and polymerization [47].
- Prepare Separating Gel Solution: Combine acrylamide/bis-acrylamide solution at the desired percentage, Tris-HCl (pH 8.8), SDS, and water in a clean container. Add ammonium persulfate (APS) and TEMED last to initiate polymerization, then mix gently without introducing air bubbles [47].
- Pour Separating Gel: Transfer the solution into the assembled gel cassette using a pipette or pour directly, leaving space for the stacking gel. Carefully overlay with water or isopropanol to create a flat, even interface and prevent oxygen inhibition of polymerization [47].
- Polymerize Separating Gel: Allow the gel to set completely at room temperature for 20-30 minutes until polymerization is evident by a distinct refractive interface [47].
- Prepare and Pour Stacking Gel: After removing the overlay solution, prepare stacking gel solution (typically 4-5% acrylamide with Tris-HCl, pH 6.8), add APS and TEMED, and pipette onto the polymerized separating gel. Immediately insert a clean comb, avoiding air bubbles [47].
- Complete Polymerization: Allow the stacking gel to polymerize for 20-30 minutes at room temperature before carefully removing the comb and rinsing wells with running buffer or deionized water to remove unpolymerized acrylamide [47].
Electrophoresis Conditions and Optimization
Proper electrophoresis conditions are essential for optimal protein separation. The following standardized protocol ensures consistent results:
- Sample Preparation: Mix protein samples with Laemmli buffer (containing Tris-HCl, SDS, glycerol, bromophenol blue, and β-mercaptoethanol) [41]. Heat samples at 95°C for 5 minutes to ensure complete denaturation, then briefly centrifuge to collect condensation [47].
- Gel Setup: Mount the polymerized gel in the electrophoresis chamber and fill both inner and outer chambers with running buffer (25 mM Tris base, 192 mM glycine, 0.1% SDS, pH 8.3) [46].
- Sample Loading: Load equal amounts of protein (typically 10-50 µg for cell lysates or 10-100 ng for purified proteins) into wells using a microsyringe [46]. Include an appropriate molecular weight marker in at least one lane.
- Electrophoresis: Apply constant voltage (100-150 V) for 1-2 hours until the dye front approaches the bottom of the gel [46]. For large proteins (>100 kDa), extended run times may be necessary for optimal separation.
- Post-Electrophoresis Analysis: Following separation, process gels for staining (e.g., Coomassie, silver stain) or transfer for Western blotting according to standard protocols [47].
Troubleshooting Common Resolution Issues
Even with careful gel percentage selection, various issues can compromise protein resolution. The following table outlines common problems, their causes, and solutions:
Table 3: Troubleshooting Protein Resolution in SDS-PAGE
| Problem | Possible Causes | Recommended Solutions |
|---|---|---|
| Poor band resolution [48] [49] | Incorrect gel percentage; run time too short; current too high | Match gel percentage to protein size; extend run time; decrease voltage by 25-50% |
| Band smearing [48] [49] | Protein overload; voltage too high; sample precipitation | Reduce protein load; decrease voltage; centrifuge samples before loading |
| Smiling bands [48] [49] | Excessive heat generation during run | Run gel at lower voltage; use cooling apparatus; perform electrophoresis in cold room |
| Missing bands [48] | Protein ran off gel; degradation; insufficient fixation | Use higher % gel for small proteins; add protease inhibitors; optimize fixation protocol |
| Distorted bands [48] [49] | Salt concentration too high; air bubbles; uneven polymerization | Dialyze samples; remove air bubbles; ensure proper gel mixing and degassing |
| Vertical streaking [48] | Sample precipitation; overloading | Centrifuge samples before loading; reduce protein amount or dilute sample |
Understanding these common issues and their solutions enables researchers to systematically optimize their SDS-PAGE conditions for the best possible protein separation. Particular attention should be paid to protein concentration, which if too high can lead to smearing, while insufficient protein results in weak or undetectable bands [48]. Additionally, the salt concentration in samples should be minimized, as high ionic strength can cause band distortion and poor resolution [48].
The Scientist's Toolkit: Essential Reagents and Materials
Successful SDS-PAGE requires specific chemical reagents and equipment, each serving a defined function in the separation process. The following table outlines the essential components:
Table 4: Essential Research Reagents for SDS-PAGE
| Reagent/Material | Function | Application Notes |
|---|---|---|
| Acrylamide-Bis Solution [47] | Forms the porous gel matrix for molecular sieving | Neurotoxic; handle with gloves; concentration determines pore size |
| Tris-HCl Buffer [41] [47] | Maintains pH during electrophoresis and polymerization | Different pH for stacking (6.8) and resolving (8.8) gels |
| SDS (Sodium Dodecyl Sulfate) [41] | Denatures proteins and confers uniform negative charge | Critical for linearizing proteins and eliminating charge effects |
| Ammonium Persulfate (APS) [47] | Initiates free radical polymerization of acrylamide | Prepare fresh solution for optimal polymerization |
| TEMED [47] | Catalyzes acrylamide polymerization by generating free radicals | Add last to gel solutions; quantity affects polymerization rate |
| Glycine [41] | Leading ion in discontinuous buffer system | Charge state changes with pH; critical for stacking effect |
| β-Mercaptoethanol/DTT [41] | Reducing agent that breaks disulfide bonds | Essential for complete denaturation; prevents protein aggregation |
| Coomassie/Silver Stain [47] | Visualizes separated proteins after electrophoresis | Different sensitivity levels (nanogram for silver, microgram for Coomassie) |
Additional specialized equipment includes a vertical electrophoresis apparatus with buffer chambers, a power supply capable of providing constant voltage or current, and gel casting stands with glass plates and spacers of appropriate thickness. For protein visualization, gel documentation systems with appropriate lighting and filters are essential. The quality and consistency of these reagents directly impact the reproducibility and reliability of SDS-PAGE results, making source selection and proper storage critical considerations for any laboratory implementing this technique.
The selection of an appropriate gel percentage is a fundamental parameter in SDS-PAGE that directly determines the success of protein separation experiments. By understanding the relationship between acrylamide concentration, pore size, and protein mobility, researchers can make informed decisions about gel formulation tailored to their specific protein targets. Fixed-percentage gels provide a straightforward approach for proteins within a limited size range, while gradient gels offer enhanced capabilities for complex mixtures or proteins of similar size. The systematic optimization of gel percentage, combined with proper sample preparation and electrophoresis conditions, enables researchers across diverse fields—from basic proteomics to applied drug development—to achieve high-resolution protein separation. As SDS-PAGE continues to be a cornerstone technique in protein analysis, mastery of gel selection principles remains essential for generating reliable, reproducible data in biochemical research.
Visual Appendix
SDS-PAGE Separation Mechanism Diagram illustrating the four-stage process of protein separation, from sample application through the stacking and resolving phases to final band separation based on molecular size.
Sodium Dodecyl Sulfate-Polyacrylamide Gel Electrophoresis (SDS-PAGE) stands as a cornerstone technique in biochemical research and development, providing critical insights into protein characteristics through size-based separation. By combining the denaturing power of SDS with the molecular sieving properties of polyacrylamide gels, this method enables researchers to separate complex protein mixtures with exceptional precision and reproducibility [24]. The fundamental principle involves conferring a uniform negative charge to all proteins, effectively masking intrinsic charge differences and ensuring separation occurs solely based on molecular weight [50] [3]. For research scientists and drug development professionals, mastering SDS-PAGE applications remains essential for protein characterization, quality control, and functional analysis. This technical guide examines three critical applications—molecular weight determination, purity assessment, and expression analysis—within the broader context of SDS-PAGE separation mechanisms, providing detailed methodologies and practical considerations for implementation in modern laboratory settings.
Fundamental Principles of SDS-PAGE
The SDS-PAGE technique relies on a sophisticated biochemical and physical foundation that enables precise protein separation based on molecular size. Understanding these core principles is essential for proper experimental design and accurate interpretation of results.
Protein Denaturation and Charge Uniformity
The foundation of SDS-PAGE lies in the complete denaturation of proteins into their linear forms. Sodium Dodecyl Sulfate (SDS), an anionic detergent, plays two critical roles in this process. First, SDS binds to hydrophobic regions of proteins through its hydrophobic tail, effectively unfolding secondary and tertiary structures by disrupting non-covalent bonds [50] [51]. Second, the negatively charged sulfate head groups of SDS impart a uniform negative charge along the entire polypeptide backbone, with approximately 1.4 grams of SDS binding per 1 gram of protein [3]. This creates a consistent charge-to-mass ratio across all proteins in the sample, effectively neutralizing their intrinsic charges [50] [24]. Additional sample preparation steps ensure complete denaturation: heating at 95°C for several minutes disrupts hydrogen bonds, while reducing agents like β-mercaptoethanol or dithiothreitol (DTT) break disulfide bridges between cysteine residues [50] [3]. This comprehensive denaturation process ensures that during electrophoresis, separation occurs exclusively based on molecular weight rather than native structure or intrinsic charge.
Molecular Sieving in Polyacrylamide Gels
The polyacrylamide gel matrix serves as a molecular sieve that physically separates proteins based on size. This three-dimensional network forms through the polymerization of acrylamide monomers cross-linked by N,N'-methylenebisacrylamide (Bis) [24]. The polymerization reaction is initiated by ammonium persulfate (APS), which generates free radicals, and catalyzed by N,N,N',N'-tetramethylethylenediamine (TEMED) [50] [3]. The pore size within this matrix determines its sieving properties and can be precisely controlled by adjusting the concentrations of acrylamide and bisacrylamide. Lower percentage gels (e.g., 8-10%) with larger pores facilitate the separation of high molecular weight proteins, while higher percentage gels (e.g., 12-15%) with smaller pores provide better resolution for lower molecular weight proteins [24] [52]. Gradient gels, which feature an increasing acrylamide concentration from top to bottom, offer an extended separation range capable of resolving proteins with diverse molecular weights simultaneously [3].
Discontinuous Buffer System
SDS-PAGE employs a discontinuous (or disc) buffer system that significantly enhances separation resolution compared to continuous systems. This approach utilizes differences in pH and gel composition to concentrate proteins into sharp bands before they enter the main separating gel [3] [51]. The system consists of two distinct gel layers: the stacking gel (pH ~6.8) with low acrylamide concentration (typically 4-5%), and the resolving or separating gel (pH ~8.8) with higher acrylamide concentration (typically 8-15%) [50] [51]. The key to this stacking effect lies in the mobility of glycine ions from the running buffer (pH ~8.3). In the stacking gel's acidic environment, glycine exists primarily as zwitterions with minimal net charge, resulting in low electrophoretic mobility [51]. Chloride ions from the Tris-HCl buffer migrate rapidly as leading ions, while glycine zwitterions function as trailing ions. Proteins, with intermediate mobility, become concentrated into a narrow zone between these two fronts. When this protein stack reaches the resolving gel with its higher pH, glycine ions become deprotonated and gain negative charge, transforming into highly mobile glycinate ions that overtake the proteins [51]. This deposits the proteins in a sharp band at the top of the resolving gel, where actual molecular weight-based separation begins [50] [51].
Figure 1: SDS-PAGE Experimental Workflow. This diagram illustrates the key steps in SDS-PAGE analysis, from sample preparation through final analysis.
Molecular Weight Determination
Accurate molecular weight determination represents one of the most fundamental applications of SDS-PAGE, providing essential data for protein identification, characterization, and verification.
Principle and Methodology
The determination of protein molecular weight using SDS-PAGE relies on the inverse logarithmic relationship between the migration distance of a protein through the gel and the logarithm of its molecular weight [24]. As proteins subjected to SDS treatment possess uniform charge density, their electrophoretic mobility depends primarily on molecular size rather than charge or structural features [50]. The polyacrylamide gel matrix acts as a molecular sieve, retarding the migration of larger proteins while allowing smaller proteins to migrate more rapidly toward the anode [50] [3]. To estimate the molecular weight of an unknown protein, a standard curve is generated using protein markers of known molecular weights (size standards) run concurrently on the same gel [3]. The relative mobility (Rf) of each standard protein is calculated as the distance migrated by the protein divided by the distance migrated by the dye front [24]. Plotting the log10 of the molecular weights of these standard proteins against their Rf values produces a standard curve from which the molecular weight of unknown proteins can be extrapolated [3]. It is important to note that this method provides an estimate with typical accuracy of ±10%, as anomalous migration may occur due to factors such as extensive glycosylation, unusual amino acid composition, or incomplete denaturation [3] [51].
Practical Protocol
Sample Preparation:
- Dilute protein samples in Laemmli buffer (typically containing 62.5 mM Tris-HCl pH 6.8, 2% SDS, 10% glycerol, 0.01% bromophenol blue) with 5% β-mercaptoethanol or 100 mM DTT as reducing agent [3] [51].
- Heat samples at 95°C for 5 minutes to ensure complete denaturation [3].
- Centrifuge briefly to collect condensed samples at the bottom of tubes.
Gel Selection:
- For most routine applications, 10-12% polyacrylamide gels provide optimal separation for proteins in the 10-250 kDa range [24] [52].
- For better resolution of low molecular weight proteins (5-100 kDa), use higher percentage gels (12-15%) [52].
- For high molecular weight proteins (100-300 kDa), use lower percentage gels (6-10%) [24].
- Gradient gels (e.g., 4-20%) offer broad separation range for complex mixtures with diverse molecular weights [3].
Electrophoresis Conditions:
- Load molecular weight markers and samples into wells.
- Run gel at constant voltage: 80-100 V through stacking gel, 120-150 V through resolving gel [3].
- Stop electrophoresis when bromophenol blue dye front reaches bottom of gel (typically 1-1.5 hours for mini-gels).
Analysis:
- Stain gel with Coomassie Brilliant Blue or more sensitive silver stain [52] [3].
- Measure migration distances of standard and sample bands.
- Generate standard curve using molecular weight markers.
- Calculate molecular weight of unknown proteins from standard curve.
Table 1: Recommended Gel Compositions for Different Molecular Weight Ranges
| Protein Size Range (kDa) | Acrylamide Concentration (%) | Separation Characteristics |
|---|---|---|
| 5-50 | 12-15 | Optimal for small proteins and peptides |
| 10-100 | 10-12 | Standard range for most applications |
| 50-200 | 8-10 | Suitable for medium to large proteins |
| 100-300 | 6-8 | Best for high molecular weight proteins |
| 5-300 | 4-20 (gradient) | Broad range for complex mixtures |
Technical Considerations and Limitations
While SDS-PAGE provides reliable molecular weight estimates for most proteins, researchers must be aware of potential anomalies. Proteins with significant post-translational modifications, particularly glycosylation, may exhibit altered migration patterns [51]. Heavily glycosylated proteins bind less SDS per unit mass due to the carbohydrate moieties, resulting in slower migration and consequently overestimation of molecular weight [51]. Similarly, highly basic or acidic proteins may demonstrate anomalous migration despite SDS treatment. Membrane proteins with extensive hydrophobic domains may bind excess SDS, potentially leading to underestimated molecular weights [51]. To address these limitations, researchers can employ complementary techniques such as Western blotting with specific antibodies for verification, or mass spectrometry for precise molecular weight determination [24]. Additionally, the use of different gel percentages and buffer systems (e.g., Tris-Tricine for low molecular weight proteins below 10 kDa) can improve accuracy for challenging samples [3].
Purity Assessment
SDS-PAGE serves as a critical quality control tool for evaluating protein sample purity, with applications spanning recombinant protein production, biopharmaceutical development, and biochemical research.
Principles of Purity Evaluation
The fundamental principle underlying purity assessment by SDS-PAGE is straightforward: a pure protein sample should generate a single, sharply defined band when separated under denaturing conditions [52]. Contaminating proteins, protein fragments, or aggregated species will appear as additional bands or smears, providing a direct visual assessment of sample homogeneity [52]. The high resolution of SDS-PAGE enables detection of impurities that differ in molecular weight from the protein of interest, making it particularly valuable for monitoring purification procedures and ensuring sample quality for downstream applications [24] [52]. The limit of detection depends on the staining method employed, with Coomassie Brilliant Blue typically detecting 10-100 ng of protein per band, while silver staining can detect as little as 0.1-1 ng per band, offering approximately 100-fold greater sensitivity [52] [3]. This sensitivity range makes SDS-PAGE suitable for identifying both major and minor contaminants in protein preparations.
Detailed Protocol for Purity Assessment
Sample Preparation:
- Prepare protein samples at appropriate concentrations (typically 1-10 μg per lane for Coomassie staining, 10-100 times less for silver staining) [52].
- Mix with 2X Laemmli buffer (125 mM Tris-HCl pH 6.8, 4% SDS, 20% glycerol, 0.02% bromophenol blue) containing 5% β-mercaptoethanol or 100 mM DTT [3] [51].
- Denature at 95°C for 5 minutes, then centrifuge briefly.
Gel Electrophoresis:
- Use an appropriate acrylamide concentration based on the molecular weight of the target protein (refer to Table 1).
- Load pre-stained molecular weight markers alongside samples for orientation.
- Include a positive control (known pure protein) and negative control (unpurified sample) if available.
- Perform electrophoresis as described in Section 3.2.
Staining and Detection:
- Coomassie Staining:
- Silver Staining (Higher Sensitivity):
- Fix gel in 40% ethanol, 10% acetic acid for 30 minutes.
- Wash with 30% ethanol.
- Sensitize with 0.02% sodium thiosulfate.
- Impregnate with 0.2% silver nitrate for 20 minutes.
- Develop with 3% sodium carbonate, 0.05% formaldehyde.
- Stop with 5% acetic acid [52].
Analysis and Interpretation:
- Document gel image using a digital imaging system.
- For quantitative assessment, perform densitometry analysis using software such as ImageJ or commercial alternatives.
- Calculate purity percentage using the formula: (Intensity of target band / Total intensity of all bands in lane) × 100 [52].
- Identify potential contaminants by comparing their migration distances with molecular weight markers.
Table 2: Comparison of Protein Staining Methods for Purity Assessment
| Parameter | Coomassie Brilliant Blue | Silver Staining | Fluorescent Staining |
|---|---|---|---|
| Detection Limit | 10-100 ng/band | 0.1-1 ng/band | 1-10 ng/band |
| Linear Dynamic Range | ~10-fold | ~40-fold | ~1000-fold |
| Compatibility with MS | Good | Moderate (requires destaining) | Excellent |
| Procedure Complexity | Simple | Technically demanding | Moderate |
| Cost | Low | Moderate | High |
| Recommended Use | Routine purity assessment, abundant proteins | High-sensitivity detection, trace impurities | Quantitative analysis, proteomics |
Applications in Protein Purification and Quality Control
SDS-PAGE-based purity assessment plays a crucial role throughout protein isolation procedures. During method development, it enables rapid evaluation of different purification strategies by analyzing samples from each chromatography step [24]. In biopharmaceutical production, it provides essential quality control data for lot release testing of therapeutic proteins [7]. The technique is particularly valuable for detecting common impurities including proteolytic fragments, protein aggregates, and co-purifying host cell proteins [52]. When combined with specific detection methods like Western blotting, SDS-PAGE can distinguish between target protein variants and unrelated contaminants. For comprehensive purity evaluation, researchers often employ both reducing and non-reducing conditions to assess disulfide-mediated aggregation, and may combine SDS-PAGE with other analytical techniques such as size-exclusion chromatography or mass spectrometry for orthogonal verification [24] [52].
Expression Analysis
SDS-PAGE provides a powerful approach for analyzing protein expression patterns across different biological conditions, cell types, or experimental treatments, offering insights into regulatory mechanisms and cellular responses.
Fundamental Approach to Expression Analysis
Expression analysis using SDS-PAGE involves the comparative assessment of protein abundance between different samples separated on the same gel. The fundamental premise is that the intensity of a protein band correlates with its abundance in the original sample, allowing semi-quantitative comparison between experimental conditions [24]. While traditional SDS-PAGE alone provides relative abundance information, its utility expands significantly when combined with specific detection methods. Western blotting with antibodies against target proteins enables specific identification and more accurate quantification [24]. For comprehensive expression profiling, gel bands of interest can be excised and identified using mass spectrometry [24]. This approach is particularly valuable for initial screening of expression systems, monitoring induction of recombinant proteins, comparing protein levels between different cell states (e.g., healthy vs. diseased, treated vs. untreated), and verifying knockout or knockdown of specific proteins in genetic experiments [24].
Detailed Experimental Workflow
Sample Preparation from Cell Cultures or Tissues:
- Cell Lysis: Use appropriate lysis buffer (e.g., RIPA buffer: 50 mM Tris-HCl pH 8.0, 150 mM NaCl, 1% NP-40, 0.5% sodium deoxycholate, 0.1% SDS) containing protease and phosphatase inhibitors.
- Protein Quantification: Determine protein concentration for all samples using Bradford, BCA, or similar assay.
- Sample Normalization: Dilute samples to equal concentrations (typically 1-2 μg/μL) in Laemmli buffer.
- Denaturation: Heat at 95°C for 5 minutes, cool on ice, and centrifuge.
Electrophoresis and Detection:
- Load equal amounts of total protein (10-50 μg per lane) for Coomassie-based detection [24].
- Include appropriate controls (untreated, induction series, molecular weight markers).
- Perform electrophoresis under standard conditions.
- Detect proteins using Coomassie, silver staining, or transfer to membrane for Western blotting.
Data Analysis:
- Digital Imaging: Capture gel images using calibrated documentation system.
- Densitometry: Measure band intensities using image analysis software.
- Normalization: Normalize target protein intensities to loading control (e.g., housekeeping proteins like actin or GAPDH in Western blotting).
- Statistical Analysis: Perform appropriate statistical tests to determine significance of observed differences.
Figure 2: Protein Expression Analysis Workflow. This diagram outlines the key steps in comparative expression analysis using SDS-PAGE, from sample preparation through data interpretation.
Detection and Analysis of Post-Translational Modifications
Beyond measuring total protein abundance, SDS-PAGE can provide valuable information about post-translational modifications (PTMs) that alter protein migration patterns [24]. Phosphorylation, glycosylation, and other modifications can cause small but detectable shifts in apparent molecular weight [24] [51]. Glycosylation typically increases apparent molecular weight, resulting in broader, diffuse bands rather than sharp bands [51]. Phosphorylation generally causes a slight increase in apparent molecular weight (1-2 kDa), which may be more evident when comparing modified and unmodified forms side-by-side [24]. Specific enzymatic treatments can be employed before electrophoresis to detect PTMs: PNGase F to remove N-linked glycans, neuraminidase to remove sialic acids, or phosphatases to remove phosphate groups [24]. The resulting mobility shifts confirm the presence of specific modifications. For comprehensive PTM analysis, SDS-PAGE is typically combined with Western blotting using modification-specific antibodies or mass spectrometric analysis of excised gel bands [24].
The Scientist's Toolkit: Essential Reagents and Materials
Successful SDS-PAGE analysis requires precise formulation and preparation of numerous reagents and materials. The following table summarizes key components and their functions in the SDS-PAGE workflow.
Table 3: Essential Reagents and Materials for SDS-PAGE Experiments
| Reagent/Material | Composition/Type | Function | Key Considerations |
|---|---|---|---|
| SDS (Sodium Dodecyl Sulfate) | Anionic detergent | Denatures proteins, confers uniform negative charge [50] [51] | Use high-purity grade; critical micelle concentration ~7-10 mM [3] |
| Acrylamide/Bis-acrylamide | Monomer: Acrylamide, Crosslinker: Bis | Forms polyacrylamide gel matrix [50] [3] | Typically 37.5:1 or 29:1 ratio of acrylamide to bis; neurotoxin in monomer form [50] |
| TEMED | N,N,N',N'-Tetramethylethylenediamine | Catalyzes polymerization reaction [50] [3] | Used with APS to initiate free radical polymerization [50] |
| APS | Ammonium Persulfate | Free radical initiator for polymerization [50] [3] | Fresh preparation recommended for consistent polymerization [3] |
| Tris Buffers | Tris-HCl at various pH | Maintains pH in stacking (6.8) and resolving (8.8) gels [51] | Different pH values critical for discontinuous system [51] |
| Glycine | Amino acid | Mobile phase in running buffer; charge state critical for stacking [51] | Zwitterionic at stacking pH, anionic at resolving pH [51] |
| Reducing Agents | β-mercaptoethanol, DTT, DTE | Breaks disulfide bonds [50] [3] | DTT preferred over BME for lower odor and higher efficiency [3] |
| Molecular Weight Markers | Pre-stained or unstained proteins | Reference for molecular weight estimation [3] | Choose appropriate range for target proteins; pre-stained for tracking [3] |
| Staining Reagents | Coomassie, Silver, Fluorescent dyes | Visualize separated proteins [52] [3] | Coomassie for routine, silver for high sensitivity, fluorescent for quantification [52] |
Troubleshooting and Method Optimization
Even well-established techniques like SDS-PAGE can present challenges that require systematic troubleshooting and optimization to ensure reliable results.
Common Issues and Solutions
Poor Resolution or Smearing:
- Cause: Incomplete denaturation, improper gel polymerization, or excessive sample loading.
- Solutions: Ensure fresh reducing agents and complete heating at 95°C; verify gel polymerization by including control samples; optimize protein load [3] [51].
Atypical Migration (Band Compression or Spreading):
- Cause: Improper buffer pH, incomplete SDS binding, or specific protein characteristics.
- Solutions: Prepare fresh buffers and verify pH; ensure sufficient SDS in sample buffer; consider protein modifications that affect SDS binding [51].
Vertical Streaks:
- Cause: Protein precipitation, particulate matter, or bubbles in gel.
- Solutions: Centrifuge samples before loading; filter samples if necessary; ensure proper gel casting without bubbles [3].
Uneven Band Patterns:
- Cause: Irregular polymerization, buffer depletion, or temperature gradients.
- Solutions: Ensure uniform gel polymerization; use fresh running buffer; consider running at lower voltage to reduce heating [3].
Method Optimization Strategies
To enhance the quality and reliability of SDS-PAGE results, researchers should consider several optimization strategies. Gel composition should be tailored to the specific molecular weight range of target proteins, with gradient gels offering the broadest separation range for complex mixtures [3]. Electrophoresis conditions can be optimized by running gels at constant current rather than constant voltage to minimize heat-related artifacts, particularly for high-percentage gels [3]. Sample preparation can be improved by incorporating alternative denaturing conditions such as higher SDS concentrations or different reducing agents for challenging proteins [51]. For quantitative applications, fluorescent staining offers superior linear dynamic range compared to traditional colorimetric methods [52]. When analyzing proteins with known anomalies, the use of buffer systems like Tris-acetate for high molecular weight proteins or Tris-tricine for low molecular weight proteins can significantly improve resolution and accuracy [3].
SDS-PAGE remains an indispensable technique in the molecular biologist's toolkit, providing robust, reproducible methods for protein separation and analysis. Its applications in molecular weight determination, purity assessment, and expression analysis continue to support advancements across basic research, drug discovery, and biopharmaceutical development. While emerging technologies like capillary electrophoresis and microfluidics platforms offer automation and high-throughput capabilities, the simplicity, cost-effectiveness, and versatility of SDS-PAGE ensure its continued relevance in modern laboratories [7]. By understanding the fundamental principles outlined in this guide and implementing the detailed protocols provided, researchers can leverage the full potential of SDS-PAGE for comprehensive protein characterization. As protein science continues to evolve, SDS-PAGE maintains its position as a foundational technique that bridges classical biochemistry with contemporary omics technologies, enabling researchers to address increasingly complex biological questions through precise protein analysis.
Sodium Dodecyl Sulphate-Polyacrylamide Gel Electrophoresis (SDS-PAGE) remains a cornerstone analytical technique in biochemistry and molecular biology for separating proteins based on their molecular weight. The fundamental principle of SDS-PAGE relies on the detergent SDS, which denatures proteins and confers a uniform negative charge, effectively masking intrinsic charge differences and enabling separation primarily by molecular size as proteins migrate through a polyacrylamide gel matrix under an electric field [53] [24]. While routinely used for determining molecular weight and assessing sample purity, SDS-PAGE also provides powerful capabilities for analyzing protein subunit composition and investigating post-translational modifications (PTMs) when combined with specific methodological adaptations. This technical guide explores these advanced applications within the broader context of protein separation research, providing detailed methodologies and current data presentation formats tailored for researchers, scientists, and drug development professionals.
The discontinuous buffer system, pioneered by Laemmli, employs both stacking and separating gels to achieve high-resolution separation [3]. The stacking gel with lower acrylamide concentration and acidic pH compacts protein samples into sharp bands before they enter the separating gel, which has higher acrylamide concentration and basic pH where actual size-based separation occurs [53] [24]. This system, combined with reducing agents that break disulfide bonds, enables the detailed dissection of complex protein structures and modifications that are crucial for understanding biological function and developing therapeutic proteins.
Fundamental Principles of SDS-PAGE for Complex Protein Analysis
Core Mechanism of Molecular Weight-Based Separation
The resolving power of SDS-PAGE stems from two critical components working in concert: the denaturing detergent SDS and the polyacrylamide gel matrix. SDS binds to proteins at a relatively constant ratio of approximately 1.4 g SDS per 1 g of protein, linearizing polypeptide chains through disruption of non-covalent bonds and imparting a uniform negative charge density [53] [24] [3]. This SDS coating ensures that proteins migrate toward the anode with mobility determined primarily by molecular size rather than native charge or shape.
The polyacrylamide gel serves as a molecular sieve with pore sizes determined by the concentrations of acrylamide and the cross-linker N,N'-methylenebisacrylamide (Bis) [24]. Lower acrylamide concentrations (e.g., 8-10%) create larger pores suitable for separating high molecular weight proteins, while higher concentrations (e.g., 12-15%) create smaller pores optimal for resolving lower molecular weight proteins [24]. Gradient gels with increasing acrylamide concentration provide expanded separation ranges for complex mixtures containing proteins of diverse sizes.
Discontinuous Buffer System and Electrophoresis Conditions
The Laemmli discontinuous system employs different buffer compositions in the stacking and separating gels to enhance resolution. The stacking gel (pH ~6.8) utilizes the unique properties of glycine, which exists predominantly as a zwitterion at this pH, creating a scenario where chloride ions migrate rapidly as "leading ions," glycinate ions migrate slowly as "trailing ions," and proteins stack into sharp bands between these ion fronts [3]. As proteins enter the separating gel (pH ~8.8), glycine becomes more negatively charged, overtaking the proteins and allowing them to separate based on size within the uniform polyacrylamide matrix [53].
Optimal electrophoresis conditions depend on gel size and configuration. Standard mini-gels typically run at constant current of 30 mA for approximately 1 hour, while larger formats may require adjusted parameters [53] [54]. Maintaining appropriate voltage and running time prevents overheating and band distortion, with tracking dyes like bromophenol blue providing visual monitoring of migration progress [3].
Subunit Composition Analysis of Multimeric Proteins
Principles of Subunit Dissociation and Analysis
Many functionally important proteins, including antibodies, receptors, and enzyme complexes, exist as multimeric structures composed of multiple polypeptide chains. SDS-PAGE enables characterization of these subunit compositions through selective disruption of non-covalent interactions and disulfide bonds. When analyzing multimeric proteins under non-reducing conditions (without added reducing agents), subunits connected by disulfide bonds remain associated, migrating as intact complexes [9]. In contrast, under reducing conditions with agents like dithiothreitol (DTT) or β-mercaptoethanol, disulfide bonds are broken, dissociating the complex into individual subunits [53] [24].
This differential analysis under reducing versus non-reducing conditions provides critical information about protein quaternary structure. For example, antibody molecules analyzed under non-reducing conditions migrate as ~150 kDa intact immunoglobulin, while reduction yields separate heavy (~50 kDa) and light (~25 kDa) chains [24]. This application is particularly valuable in biopharmaceutical development for characterizing therapeutic antibodies and protein complexes.
Experimental Protocol for Subunit Composition Analysis
Sample Preparation:
- Prepare protein samples at 0.5-2 mg/mL concentration in appropriate buffer
- Divide samples into two aliquots for reducing and non-reducing analysis
- For reducing conditions: Add SDS-PAGE sample buffer containing 1-5% β-mercaptoethanol or 10-100 mM DTT [53] [3]
- For non-reducing conditions: Add SDS-PAGE sample buffer without reducing agents
- Denature samples by heating at 95°C for 5 minutes (or 70°C for 10 minutes) [3]
- Centrifuge briefly to collect condensate before loading
Gel Electrophoresis:
- Select appropriate gel concentration based on expected subunit sizes (e.g., 10% gel for 10-250 kDa proteins) [24]
- Load molecular weight markers in first or last well for size reference
- Load reduced and non-reduced samples in adjacent wells for direct comparison
- Run electrophoresis at constant current (30 mA for mini-gels) until dye front reaches bottom (~1 hour) [54]
- Visualize proteins with Coomassie Brilliant Blue, silver staining, or western blotting
Key Considerations:
- Incomplete reduction may occur with insufficient reducing agent or heating time
- Some non-covalent protein complexes may remain associated even in SDS without heating
- Artifactual oxidation during sample preparation can create disulfide-linked aggregates
Table 1: Expected Migration Patterns for Common Multimeric Proteins
| Protein Complex | Non-Reducing Conditions | Reducing Conditions | Applications |
|---|---|---|---|
| Antibodies (IgG) | ~150 kDa intact molecule | Heavy chain (~50 kDa) and light chain (~25 kDa) | Biotherapeutic quality control [24] |
| Hemoglobin | ~64 kDa tetramer | α-globin (~15 kDa) and β-globin (~16 kDa) | Hemoglobinopathy diagnostics [24] |
| Viral Envelope Proteins | Multimeric complexes | Individual subunit proteins | Vaccine development [55] |
Investigating Post-Translational Modifications
Detecting PTMs Through Altered Electrophoretic Mobility
Post-translational modifications covalently alter protein structure, frequently resulting in measurable changes in electrophoretic mobility that can be detected by SDS-PAGE. While SDS-PAGE alone cannot definitively identify specific PTMs, it provides an efficient initial screening method to detect modification-induced mobility shifts before employing more sophisticated techniques like mass spectrometry for precise characterization [24].
Common PTMs that alter SDS-PAGE mobility include glycosylation (addition of carbohydrate groups), phosphorylation (addition of phosphate groups), ubiquitination (addition of ubiquitin chains), and proteolytic processing. Each modification produces characteristic migration patterns: glycosylation typically decreases mobility relative to unmodified protein, producing diffuse bands or smears due to glycan heterogeneity [55], while phosphorylation generally causes slight decreases in mobility that can be enhanced using Phos-tag reagents [56].
Specialized Methodologies for Specific PTM Analysis
Glycosylation Analysis: Protein glycosylation can be preliminarily detected by comparing mobility shifts before and after enzymatic deglycosylation. Treatment with glycosidases like PNGaseF removes N-linked glycans, resulting in increased electrophoretic mobility observable by SDS-PAGE [55]. The inherent heterogeneity of glycosylation patterns often produces broad, diffuse bands rather than sharp bands, particularly for heavily glycosylated proteins like viral envelope antigens used in subunit vaccines [55].
Phosphorylation Detection Using Phos-tag SDS-PAGE: Phos-tag technology provides enhanced detection of protein phosphorylation by incorporating a phosphate-binding molecule into the polyacrylamide gel. Phos-tag reagents selectively bind phosphorylated amino acid residues, significantly retarding their migration compared to non-phosphorylated forms [56]. This technique enables semi-quantitative analysis of phosphorylation changes under different physiological conditions or in disease states without requiring phospho-specific antibodies.
Protocol for Phos-tag SDS-PAGE [56]:
- Prepare Phos-tag gel: Incorporate 25-100 μM Phos-tag reagent and 50-100 μM MnCl₂ into standard polyacrylamide gel formulation
- Prepare protein samples in standard SDS-PAGE sample buffer with reducing agents
- Run electrophoresis at lower voltage (e.g., 20 mA for mini-gels) to ensure proper Phos-tag interaction
- Soak gel in transfer buffer containing 1 mM EDTA after electrophoresis to chelate Mn²⁺ before western blotting if required
- Visualize proteins using standard staining methods or western blotting with pan-specific antibodies
Ubiquitination and SUMOylation Analysis: Ubiquitin and SUMO modifications add significant molecular weight to target proteins (~8 kDa for ubiquitin, ~12 kDa for SUMO), creating characteristic laddering patterns or discrete upward mobility shifts detectable by SDS-PAGE [53]. These modifications are often investigated using epitope-tagged ubiquitin/SUMO constructs in combination with western blotting for specific detection.
Table 2: Characteristic SDS-PAGE Mobility Shifts for Common PTMs
| PTM Type | Mobility Shift | Detection Method | Notes |
|---|---|---|---|
| N-Linked Glycosylation | Decreased mobility (broader bands) | Comparison ± PNGaseF treatment | Common in secreted proteins and vaccines [55] |
| Phosphorylation | Slight decrease in mobility | Phos-tag SDS-PAGE [56] | Best detected with Phos-tag reagents |
| Ubiquitination | Discrete bands or ladders at higher MW | Western blot with ubiquitin antibodies | Polyubiquitination creates characteristic ladder [53] |
| Proteolytic Cleavage | Appearance of lower MW bands | Standard SDS-PAGE with specific staining | Indicates processing or degradation |
Complementary and Advanced Techniques
Two-Dimensional Gel Electrophoresis (2D-PAGE)
Two-dimensional gel electrophoresis significantly enhances PTM analysis by combining isoelectric focusing (IEF) with SDS-PAGE. The first dimension (IEF) separates proteins based on isoelectric point (pI), while the second dimension (SDS-PAGE) separates by molecular weight [57]. Charge-altering modifications like phosphorylation or deamidation produce horizontal shifts in the 2D pattern, while molecular weight-altering modifications like proteolytic processing or glycosylation produce vertical shifts [57]. This technique provides superior resolution of complex protein mixtures and modified isoforms but requires specialized equipment and expertise.
Capillary Electrophoresis-SDS (CE-SDS)
CE-SDS represents an automated, quantitative evolution of traditional SDS-PAGE that offers superior resolution, reproducibility, and quantitative precision [6]. This technique separates proteins in narrow-bore capillaries filled with separation matrix under applied voltage, with detection via UV absorption or fluorescence. CE-SDS provides fully automated operation, eliminating manual gel casting, staining, and destaining steps while generating digital electropherograms for precise quantification [6]. The Maurice CE-SDS system, for example, offers both high-throughput (Turbo CE-SDS cartridge, 5.5 minutes/sample) and high-resolution (CE-SDS PLUS cartridge, 25 minutes/sample) options for different analytical needs throughout biopharmaceutical development [6].
Research Reagent Solutions for Advanced Applications
Table 3: Essential Reagents for Subunit and PTM Analysis by SDS-PAGE
| Reagent/Category | Specific Examples | Function/Application |
|---|---|---|
| Reducing Agents | Dithiothreitol (DTT), Dithioerythritol (DTE), β-Mercaptoethanol, Tris(2-carboxyethyl)phosphine (TCEP) | Break disulfide bonds for subunit analysis under reducing conditions [53] [3] |
| Detergents & Denaturants | Sodium Dodecyl Sulfate (SDS) | Denature proteins and confer uniform negative charge [53] [24] |
| PTM-Specific Reagents | Phos-tag reagents, PNGaseF, Neuraminidase | Detect specific modifications (e.g., phosphorylation, glycosylation) [55] [56] |
| Gel Formation Components | Acrylamide, Bis-acrylamide, Ammonium Persulfate (APS), TEMED | Create polyacrylamide gel matrix with defined pore sizes [53] [24] |
| Molecular Weight Standards | Precision Plus Protein Standards, Unstained Protein Ladder | Reference for molecular weight estimation and normalization [53] [24] |
| Staining Solutions | Coomassie Brilliant Blue, Silver Stain, SYPRO Ruby, Fluorescent dyes | Visualize separated protein bands with varying sensitivity [53] [57] |
Workflow Integration and Data Interpretation
Integrated Experimental Design
Effective analysis of subunit composition and PTMs requires strategic integration of multiple SDS-PAGE approaches. A typical workflow begins with standard SDS-PAGE under both reducing and non-reducing conditions to assess overall composition and identify potential modifications based on anomalous migration. Subsequent experiments employ specialized techniques like Phos-tag SDS-PAGE or deglycosylation treatments to characterize specific modifications of interest. Finally, confirmatory analysis using western blotting with modification-specific antibodies or mass spectrometry provides definitive identification of modification sites and stoichiometry.
Troubleshooting and Data Interpretation Challenges
Several technical challenges can complicate interpretation of subunit and PTM analysis by SDS-PAGE:
- Smearing or diffuse bands may indicate protein degradation, heterogeneous modifications (especially glycosylation), or improper sample handling [53]
- Unexpected bands in reduced samples may represent incomplete reduction, proteolytic fragments, or non-specific antibody binding in western blots
- Inconsistent mobility shifts between experiments can result from variations in gel composition, running conditions, or sample preparation
- Persistent multimers even under reducing conditions may indicate SDS-resistant non-covalent interactions or artifactual disulfide bond formation during sample preparation
Proper controls including molecular weight standards, modification-sensitive positive controls, and specific enzymatic treatments (e.g., phosphatases, glycosidases) are essential for valid interpretation.
SDS-PAGE remains an indispensable tool for advanced protein characterization beyond simple molecular weight determination. Through strategic application of reducing versus non-reducing conditions, integration of modification-specific reagents like Phos-tag, and complementary use of techniques such as 2D-PAGE and CE-SDS, researchers can extract detailed information about protein subunit architecture and post-translational modifications. These applications continue to evolve through technological improvements like automated CE-SDS systems and novel affinity-based detection methods, ensuring SDS-PAGE maintains its relevance in both basic research and biopharmaceutical development. The workflows and methodologies detailed in this guide provide a framework for implementing these advanced applications to address complex questions in protein science and therapeutic development.
Troubleshooting SDS-PAGE: Solving Common Problems and Optimizing Resolution
Sodium dodecyl sulfate-polyacrylamide gel electrophoresis (SDS-PAGE) operates on the fundamental principle that proteins denatured by SDS and reducing agents will migrate through a polyacrylamide gel matrix strictly according to polypeptide molecular weight [10] [58]. The anionic detergent SDS unfolds proteins, binds to the polypeptide backbone in a constant weight ratio (approximately 1.4 g SDS/g protein), and imparts a uniform negative charge, effectively negating the influence of a protein's intrinsic charge [10] [59] [58]. Under ideal conditions, this results in sharp, well-resolved bands whose migration distance inversely correlates with the logarithm of their molecular mass. However, this idealized separation is often compromised by anomalous banding patterns—smiles, smears, and aberrant migration—that confound interpretation and indicate deviations from ideal electrophoretic behavior. For researchers and drug development professionals, accurately diagnosing these anomalies is critical for validating protein analysis data in contexts ranging from basic research to biopharmaceutical quality control.
A Systematic Diagnostic Guide for Abnormal Banding
Abnormal banding patterns typically arise from issues in sample preparation, gel running conditions, or inherent protein properties. The following tables provide a systematic framework for diagnosing the most common anomalies.
Pattern 1: Smiling Bands
"Smiling" or U-shaped bands occur when bands in the outer lanes curve upward compared to those in the center lanes.
| Observation | Primary Cause | Underlying Mechanism | Corrective Action |
|---|---|---|---|
| Upward-curving bands in outer lanes ("smiling") | Excessive Heat Generation | Uneven heating across the gel face causes faster migration in warmer, less dense regions [60]. | • Run gel at a lower voltage for a longer time [60].• Perform electrophoresis in a cold room or use a built-in cooling apparatus [60].• Ensure buffer circulation if using a tank with that capability. |
Pattern 2: Smeared Bands
Smearing appears as diffuse, blurry bands lacking sharp resolution and can stem from several causes.
| Observation | Primary Cause | Underlying Mechanism | Corrective Action |
|---|---|---|---|
| Diffuse, blurry bands across all lanes | Voltage Too High | Excessive current causes overheating and protein denaturation during the run, leading to poor stacking and resolution [60]. | • Run the gel at 10-15 volts/cm of gel length [60].• Use lower voltage for a longer run time [60]. |
| Sample Overloading | Exceeding the gel's protein capacity overwhelms the sieving effect, causing trailing smears [61]. | • Load 0.1–0.2 μg of protein per mm of well width [61].• Serial dilute sample to determine optimal load. | |
| Protein Degradation | Proteolytic cleavage creates a heterogeneous mixture of polypeptide fragments of varying sizes [61]. | • Use fresh protease inhibitors during sample preparation.• Keep samples on ice whenever possible. | |
| Incomplete Denaturation | Residual secondary or tertiary structure impedes uniform SDS binding and migration [58]. | • Ensure sample buffer contains sufficient SDS and reductant (DTT/BME) [58].• Heat samples at 95°C for 5-10 minutes [58]. | |
| Poorly Formed Wells | Damaged or connected wells allow sample to leak, creating a smeared start [61]. | • Carefully flush wells with buffer before loading.• Avoid puncturing wells with pipette tips [61]. |
Pattern 3: Aberrant Migration (Gel Shifting)
Aberrant migration, or "gel shifting," occurs when proteins migrate at a rate inconsistent with their true molecular weight.
| Observation | Primary Cause | Underlying Mechanism | Corrective Action |
|---|---|---|---|
| Migration inconsistent with known mass | Altered SDS Binding | Hydrophobic proteins may bind excess SDS, increasing charge and migration speed. Glycosylated or phosphorylated proteins may bind less SDS, reducing charge and slowing migration [62] [59]. | • For membrane proteins, consider alternative methods like NSDS-PAGE [11] or BN-PAGE [11].• Use enzymatic deglycosylation or phosphatase treatment. |
| Residual Disulfide Bonds | Incomplete reduction leaves compact structures that migrate faster than fully linearized polypeptides [58]. | • Increase concentration of reducing agent (DTT/BME) [58].• Extend heating time during sample prep. | |
| Non-Protein Contaminants | High salt or protein contaminants can interfere with protein mobility and SDS binding [61]. | • Precipitate or desalt protein samples to remove contaminants [61].• Ensure sample is in a compatible, low-salt buffer. |
Figure 1: A diagnostic workflow for troubleshooting common abnormal banding patterns in SDS-PAGE, linking observations to root causes and corrective actions.
Advanced Investigation: When Standard Troubleshooting Fails
When banding anomalies persist despite optimized standard protocols, the underlying causes may involve more complex protein-detergent or protein-matrix interactions.
The Role of Detergent Binding in Aberrant Migration
A foundational assumption of SDS-PAGE is uniform SDS binding. However, this is not universal. Membrane proteins, rich in hydrophobic transmembrane domains, often exhibit stoichiometric SDS binding that can be 2-3 times greater than the 1.4 g SDS/g protein benchmark for soluble proteins [62]. This excess negative charge can cause anomalously fast migration. Conversely, proteins with extensive post-translational modifications like glycosylation may bind less SDS due to steric hindrance, leading to anomalously slow migration [59]. A strong correlation (R² = 0.8) has been demonstrated between SDS-loading capacity and gel shift behavior in helical membrane proteins, confirming that altered detergent binding is a primary explanation for anomalous migration [62].
Alternative Electrophoretic Methods
For proteins prone to anomalous migration in standard SDS-PAGE, alternative methods can provide more reliable separation.
- Native SDS-PAGE (NSDS-PAGE): This modified technique removes SDS and EDTA from the sample buffer, omits the heating step, and uses a significantly reduced SDS concentration (e.g., 0.0375%) in the running buffer [11]. This approach can shift Zn²⁺ retention in metalloproteins from 26% to 98% while maintaining high-resolution separation, offering a middle ground for analyzing metal-binding or complex proteins without full denaturation [11].
- Blue Native (BN)-PAGE: This method uses Coomassie dye or other mild detergents to confer charge for electrophoresis without denaturing proteins. It perfectly retains enzymatic activity and metal cofactors but sacrifices the high resolution of SDS-PAGE, making it ideal for studying native protein complexes and oligomeric states [11].
- Capillary Electrophoresis-SDS (CE-SDS): An automated, quantitative alternative to slab gel SDS-PAGE, CE-SDS provides superior resolution, reproducibility, and quantitative precision while eliminating gel-to-gel variability and the need for hazardous acrylamide [6]. This method is widely adopted in biopharmaceutical development for the analysis of therapeutic proteins like monoclonal antibodies [6].
Experimental Protocols for Diagnosis and Resolution
Protocol 1: Native SDS-PAGE (NSDS-PAGE) for Metalloprotein Analysis
This protocol is adapted from methods used to study the Zn²⁺ proteome with high metal retention and resolution [11].
- Sample Buffer (4X): 100 mM Tris HCl, 150 mM Tris base, 10% (v/v) glycerol, 0.0185% (w/v) Coomassie G-250, 0.00625% (w/v) Phenol Red, pH 8.5 [11].
- Running Buffer (1X): 50 mM MOPS, 50 mM Tris Base, 0.0375% SDS, pH 7.7 [11].
- Methodology:
- Sample Preparation: Mix 7.5 μL of protein sample with 2.5 μL of 4X NSDS sample buffer. Do not heat. [11].
- Gel Equilibration: Pre-run precast Bis-Tris polyacrylamide gels at 200V for 30 minutes in ddH₂O to remove storage buffers and unpolymerized acrylamide [11].
- Electrophoresis: Load samples and run at a constant voltage (e.g., 200V) using the specified running buffer until the dye front migrates to the gel bottom [11].
- Expected Outcome: Retention of over 98% of bound metal ions and preservation of enzymatic activity in many model enzymes, while maintaining high-resolution separation comparable to denaturing SDS-PAGE [11].
Protocol 2: Detergent Binding Analysis via Sedimentation Equilibrium
This methodology quantitatively links SDS binding to aberrant migration, as demonstrated in CFTR transmembrane hairpin proteins [62].
- Key Reagents: Purified protein of interest, ¹⁴C-radiolabeled SDS, size-exclusion chromatography equipment, ultracentrifuge.
- Methodology:
- Complex Formation: Incubate the purified protein with a known concentration of ¹⁴C-labeled SDS to form protein-detergent complexes [62].
- Separation: Isolate the complexes using size-exclusion chromatography to remove unbound SDS micelles [62].
- Quantification: Determine the amount of bound SDS (g SDS/g protein) in the isolated complexes by measuring the radiolabeled SDS content and the protein concentration [62].
- Correlation: Plot the measured SDS binding ratio against the protein's apparent gel shift (dMW%) to establish the relationship between detergent loading and electrophoretic mobility [62].
- Application: This method is particularly useful for confirming suspected anomalous detergent binding in hydrophobic proteins or mutants that show significant gel shifts [62].
Figure 2: A comparative workflow of two advanced experimental protocols for diagnosing complex banding anomalies, from sample preparation to final analysis.
The Scientist's Toolkit: Essential Reagents and Materials
| Research Reagent / Material | Function in SDS-PAGE and Troubleshooting |
|---|---|
| SDS (Sodium Dodecyl Sulfate) | Linearizes proteins and confers uniform negative charge. Critical for mass-based separation [10] [58]. |
| DTT (Dithiothreitol) or BME (Beta-Mercaptoethanol) | Reducing agents that break disulfide bonds to ensure complete protein unfolding [58]. |
| TEMED & APS (Ammonium Persulfate) | Catalyze the polymerization of acrylamide and bis-acrylamide to form the porous gel matrix [10] [58]. |
| Tris-based Buffers | Provide the conductive medium and maintain stable pH during electrophoresis in both gels and running buffers [59]. |
| Glycine | Key ion in the discontinuous buffer system; its charge-state change between stacking (pH 6.8) and resolving (pH 8.8) gels enables protein stacking [59]. |
| Coomassie G-250 | Used in Native SDS-PAGE and BN-PAGE to confer charge without full denaturation [11]. |
| Protease Inhibitor Cocktails | Prevent protein degradation during sample preparation, a common cause of smearing [61]. |
Diagnosing abnormal banding patterns in SDS-PAGE requires a systematic approach that moves from simple fixes—optimizing voltage, sample load, and denaturation conditions—to a deeper investigation of protein-specific behaviors. Understanding that the fundamental assumptions of uniform SDS binding and perfect denaturation are frequently violated, particularly for membrane, glycosylated, or metalloproteins, is key to effective troubleshooting. When standard SDS-PAGE fails, alternative methods like NSDS-PAGE, BN-PAGE, and CE-SDS provide powerful pathways to obtain reliable, high-quality data. For researchers in drug development, where accurate protein characterization is non-negotiable, mastering this diagnostic workflow ensures the integrity of analytical results from the research bench to commercial product release.
Sodium Dodecyl Sulfate-Polyacrylamide Gel Electrophoresis (SDS-PAGE) is a foundational technique in biochemistry and molecular biology that separates proteins based primarily on their molecular weight [24]. The method combines the denaturing power of SDS with the molecular sieving properties of a polyacrylamide gel matrix. SDS, an anionic detergent, binds to proteins at a consistent ratio of approximately 1.4g SDS per 1g of protein, masking intrinsic charge differences and conferring a uniform negative charge [24] [10]. This ensures protein migration depends solely on molecular size when an electric field is applied [24]. The polyacrylamide gel is formed through the polymerization of acrylamide monomers and a crosslinker, most commonly N,N'-methylenebisacrylamide (Bis), creating a three-dimensional network with controlled pore sizes that determine the separation range [24] [63].
The Critical Role of Acrylamide-to-Bis Ratio in Gel Optimization
The porosity and sieving properties of a polyacrylamide gel are determined by two interdependent factors: the total acrylamide concentration (%T) and the proportion of crosslinker (%C), which defines the acrylamide-to-bisacrylamide ratio [63]. This ratio profoundly impacts the mechanical stability and pore structure of the gel. The pore size is smallest at approximately 5%C, with any increase or decrease from this point resulting in larger effective pores [63]. Standard SDS-PAGE protocols often employ a crosslinking ratio of 37.5:1 (acrylamide:Bis) [34]. However, strategic manipulation of this ratio is a powerful tool for optimizing separation for specific protein size ranges.
Research has demonstrated that using a low-percentage acrylamide gel with an altered acrylamide/Bis ratio of 80:1 provides superior resolution for very high molecular weight proteins (>200 kDa) [64]. This modified ratio creates a gel matrix with larger pores, facilitating the migration and separation of giant proteins that would otherwise be trapped or poorly resolved in standard gels. For simultaneous analysis of proteins with very high and low molecular weights, an innovative system combining a low-percentage gel (with 80:1 ratio) for high-mass proteins and a conventional gradient gel (with standard 40:1 ratio) for lower mass proteins has been developed, creating a continuous separation path known as the LAG gel system [64].
Table 1: Standard Acrylamide Gel Formulations for Different Protein Size Ranges
| Protein Size (kDa) | Recommended Gel Percentage (%) | Acrylamide:Bis Ratio |
|---|---|---|
| 4 - 40 | 20 | 37.5:1 [65] |
| 12 - 45 | 15 | 37.5:1 [65] |
| 10 - 70 | 12.5 | 37.5:1 [63] |
| 15 - 100 | 10 | 37.5:1 [65] |
| 25 - 200 | 8 | 37.5:1 [63] |
| >200 | 5 | 80:1 [64] [65] |
Gradient Gels for Enhanced Separation Range and Resolution
Gradient gels provide a powerful alternative to single-percentage gels by offering a continuous increase in acrylamide concentration (and corresponding decrease in pore size) along the migration path [63]. These gels typically feature a low percentage of acrylamide at the top and a high percentage at the bottom, creating a pore gradient that automatically optimizes the separation for each protein size as it migrates [10]. This design allows for the resolution of a much broader range of protein molecular weights on a single gel compared to fixed-concentration gels [65]. Furthermore, gradient gels often yield sharper protein bands, leading to better separation of proteins with similar sizes and higher quality data [63]. Common gradient ranges like 4-20% or 6-15% are highly effective for complex protein mixtures containing both high and low molecular weight components [24] [64]. The gradient itself also performs the function of a stacking gel, concentrating the protein samples into sharp bands before they enter the higher percentage resolving region [10].
Table 2: Comparison of Single-Concentration vs. Gradient Gels
| Feature | Single-Concentration Gel | Gradient Gel |
|---|---|---|
| Optimal Protein Range | Narrow [65] | Broad (e.g., 5-200 kDa) [64] |
| Band Sharpness | Standard | Enhanced [63] |
| Resolution of Similar Sizes | Good for target size | Excellent across range [63] |
| Best Use Case | Single protein or similar-sized proteins [65] | Complex mixtures with diverse sizes [65] |
| Ease of Preparation | Simpler | More complex; often pre-cast [65] |
Experimental Protocols for Advanced Gel Formulation
Protocol for LAG Gel for Very High and Low Molecular Weight Proteins
This protocol enables simultaneous analysis of giant proteins and small proteins in the same electrophoretic gel, using a combination of low-percentage acrylamide gel and a gradient SDS-PAGE gel [64].
- Gel Cassette Preparation: Clean glass plates thoroughly and assemble the casting cassette according to manufacturer's instructions.
- Low-Percentage Gel Segment (for high MW proteins): Prepare the first segment of the resolving gel with a low acrylamide percentage (e.g., 5%) and an acrylamide/bisacrylamide ratio of 80:1. Add catalysts (APS and TEMED) last, mix gently, and pour the mixture into the cassette. Overlay with isopropanol or water to ensure a flat surface and allow to polymerize completely (30-45 minutes).
- Gradient Gel Segment (for low MW proteins): Prepare a conventional gradient gel solution (e.g., 6-15%) with a standard acrylamide/bisacrylamide ratio of 40:1. Use a gradient maker to pour the gradient solution directly on top of the polymerized low-percentage gel.
- Stacking Gel Addition: After the gradient gel has polymerized, pour off the overlay. Prepare a standard stacking gel (e.g., 5% acrylamide) and pour it on top of the resolving gel. Insert a comb carefully to avoid bubbles and allow to polymerize.
- Electrophoresis: The continuous LAG gel is now ready for standard SDS-PAGE electrophoresis, immunoblotting, or other downstream applications [64].
Standard Protocol for Casting a Single-Concentration Gel
This general protocol is adaptable for various gel percentages and ratios [34].
- Gel Casting Setup: Clean glass plates and spacers, then assemble the casting stand. Ensure a tight seal to prevent leaks.
- Resolving Gel Preparation: Combine all resolving gel ingredients in the specified order (see Table 3), adding the polymerization catalysts APS and TEMED last. Mix gently to avoid introducing bubbles.
- Pouring and Polymerization: Immediately pour the resolving gel mixture into the cassette, leaving space for the stacking gel. Carefully overlay with isopropanol or water-saturated butanol to create a flat interface. Allow 30-45 minutes for complete polymerization.
- Stacking Gel Preparation: Pour off the overlay liquid and wick away any residue. Prepare the stacking gel mixture, add APS and TEMED last, and pipette it onto the polymerized resolving gel.
- Comb Insertion: Insert a clean comb into the stacking gel, avoiding air bubbles. Allow the stacking gel to polymerize for 20-30 minutes. The gel can be used immediately or wrapped in moist tissue and plastic film and stored at 4°C for several weeks [34].
Table 3: Research Reagent Solutions for SDS-PAGE Gel Formulation
| Reagent | Function / Purpose | Handling Notes |
|---|---|---|
| Acrylamide / Bisacrylamide | Forms the porous gel matrix; %T and %C determine pore size [63]. | Potent neurotoxin; wear gloves [65]. |
| Ammonium Persulfate (APS) | Initiator of the free-radical polymerization reaction [24]. | Prepare fresh 10% solution for optimal results [65]. |
| TEMED | Catalyst that accelerates polymerization by producing free radicals from APS [24]. | |
| SDS (Sodium Dodecyl Sulfate) | Denatures proteins and confers uniform negative charge, masking intrinsic charge [10]. | |
| Tris-HCl Buffer | Provides the appropriate pH for polymerization and electrophoresis (pH 8.8 for resolving gel; pH 6.8 for stacking gel) [24] [34]. | |
| DTT or β-Mercaptoethanol | Reducing agents that break disulfide bonds for complete protein denaturation and linearization [24]. |
Technical Considerations and Optimization Strategies
Successful SDS-PAGE optimization requires attention to several technical factors beyond the acrylamide-to-bis ratio. The discontinuous buffer system, utilizing stacking and resolving gels with different pH and porosity, is critical for sharp band formation [24]. Protein load should be optimized, typically 15-40 µg total protein per mini-gel well, to prevent overloading and distortion [63]. Gel thickness influences run time, resolution, and sample capacity; 0.75-mm gels offer a good balance between speed and robustness, while thicker gels (1.0-1.5 mm) can load more sample [34]. The polymerization time can vary significantly based on reagent quality and room temperature; if polymerization is slow (>60 minutes), fresh APS and TEMED should be prepared [65]. Finally, for precise molecular weight determination, appropriate protein ladders must be run alongside samples, noting that apparent molecular weight can shift slightly with different buffer systems [63].
Strategic optimization of gel chemistry, particularly the acrylamide-to-bis ratio and the implementation of gradient systems, is fundamental to advancing protein separation research using SDS-PAGE. While standard 37.5:1 ratios suffice for routine analysis, modifying this ratio to 80:1 enables critical analysis of very high molecular weight proteins, and gradient gels provide unparalleled resolution for complex mixtures. These refined techniques ensure that SDS-PAGE remains a cornerstone of biochemical discovery, bridging classical methods with the demands of next-generation proteomic research. As protein analysis continues to evolve with more complex samples and challenging targets, these optimization strategies will remain essential tools for researchers and drug development professionals.
Resolving Issues with Gel Polymerization and Sample Loading
Sodium Dodecyl Sulfate-Polyacrylamide Gel Electrophoresis (SDS-PAGE) remains a cornerstone technique in biochemistry and molecular biology for separating proteins based on their molecular weight [24]. The principle involves denaturing proteins with the anionic detergent SDS, which confers a uniform negative charge, and then forcing them through a polyacrylamide gel matrix under an electric field [24]. The polyacrylamide gel, formed through the polymerization of acrylamide and a crosslinker such as N,N'-methylenebisacrylamide (Bis), creates a molecular sieve that separates proteins primarily by size [24]. Despite its widespread use, researchers frequently encounter technical challenges related to gel polymerization and sample loading that can compromise experimental results. This in-depth guide addresses these common issues within the broader context of SDS-PAGE principles and protein separation mechanisms, providing researchers and drug development professionals with systematic troubleshooting methodologies and practical experimental protocols.
Core Principles of SDS-PAGE and the Polymerization Process
Fundamental Mechanisms of Protein Separation
SDS-PAGE relies on two critical mechanisms to achieve separation based on molecular weight. First, the detergent SDS binds to proteins at a nearly constant ratio of approximately 1.4g SDS per 1g of protein, masking the intrinsic charge of proteins and imparting a uniform negative charge density [24] [66]. This charge uniformity ensures that all proteins migrate toward the anode when an electric field is applied. Second, the polyacrylamide gel matrix serves as a molecular sieve, with pore sizes determined by the concentrations of acrylamide and bisacrylamide [24]. Smaller proteins navigate these pores more readily than larger ones, resulting in size-dependent separation [67]. The discontinuous buffer system, comprising stacking and resolving gels with different pH levels and pore sizes, further enhances resolution by initially concentrating protein samples into sharp bands before they enter the separating gel [24].
Chemistry of Gel Polymerization
The polyacrylamide gel is formed through a vinyl addition polymerization reaction between acrylamide monomers and the crosslinking agent bisacrylamide. This process is catalyzed by ammonium persulfate (APS), which provides the free radicals to initiate polymerization, and tetramethylethylenediamine (TEMED), which accelerates the reaction rate by stabilizing the free radicals [24]. The ratio of acrylamide to bisacrylamide critically determines the gel's pore structure and mechanical properties. Consistent and complete polymerization is essential for creating a uniform matrix with predictable separation characteristics, making proper handling of these reagents fundamental to successful SDS-PAGE.
Troubleshooting Gel Polymerization Issues
Common Polymerization Problems and Solutions
Improper gel polymerization manifests in various operational defects that compromise separation quality. The table below summarizes frequent issues, their probable causes, and corrective actions.
Table 1: Troubleshooting Guide for Gel Polymerization Issues
| Problem | Possible Cause | Suggested Solution |
|---|---|---|
| Gel does not polymerize | TEMED and/or ammonium persulfate omitted; outdated reagents; temperature too low [48] | Use fresh ammonium persulfate and TEMED; polymerize at room temperature; ensure acrylamide quality [48] |
| Slow polymerization time | Insufficient ammonium persulfate or TEMED; low temperature; degraded reagents [48] | Increase ammonium persulfate or TEMED concentrations; degas acrylamide solution to remove oxygen inhibition [48] |
| Gel is too soft | Poor quality acrylamide or bisacrylamide; insufficient crosslinker [48] | Use high-purity reagents; increase the amount of bisacrylamide [48] |
| White or opaque gel | Bisacrylamide concentration too high [48] | Recheck and adjust the amount of bisacrylamide used [48] |
| Cracked gel | Excessive heat generation during polymerization [48] | Use cooled reagents or polymerize in a cooler environment [48] |
| Uneven gel interface | Improper topping of resolving gel; non-uniform polymerization [68] | Top resolving gel carefully with isopropanol or water for a uniform interface; ensure level casting apparatus [68] [48] |
Impact of Polymerization on Electrophoresis
Incomplete or non-uniform polymerization directly causes poor band resolution and aberrant migration patterns. A poorly polymerized resolving gel creates an inconsistent pore matrix, resulting in smeared bands, distorted migration, or failure of proteins to separate despite adequate run times [68]. An uneven interface between the stacking and resolving gels causes samples in different lanes to begin separation at different starting points, leading to non-parallel bands [68]. Ensuring complete, uniform polymerization is therefore critical not only for gel integrity but also for the accuracy and reproducibility of protein separation.
Addressing Sample Loading and Well-Related Problems
Preventing Sample Leakage and Well Damage
Sample leakage from wells represents a common frustration that leads to lost samples, cross-contamination, and distorted bands. This typically occurs when wells are damaged during comb removal or sample loading [68]. To prevent leakage, always remove the comb after placing the gel in the running chamber filled with buffer, which provides supportive hydraulic pressure [68]. Exercise extreme care when pulling out the comb, lifting it slowly and evenly to avoid tearing the delicate well structures. Prior to loading samples, you can fill wells with a small amount of loading dye to check for integrity [68]. During sample loading, use fine tips and avoid touching the bottom or sides of the wells to prevent accidental puncturing [68].
Optimizing Sample Preparation for Loading
Proper sample preparation ensures consistent loading and prevents well-related artifacts. Key considerations include:
- Sedimentation: After heating samples, centrifuge them briefly to pellet any insoluble debris that might clog well bottoms [69] [48].
- Density: Ensure sufficient glycerol or sucrose in the sample buffer (typically 5-10%) to increase density, preventing samples from diffusing out of wells before electrophoresis begins [48].
- Salt Concentration: High salt concentrations can cause band distortion and smearing [48]. Dialyze samples, perform protein precipitation, or use desalting columns if necessary [48].
- Reducing Agents: Fresh dithiothreitol (DTT) or β-mercaptoethanol ensure complete reduction of disulfide bonds [69]. Old or insufficient reducing agent can cause artifact bands or doublets [48].
Advanced Technical Considerations
Optimizing Gel Concentration for Target Proteins
The appropriate acrylamide concentration is critical for resolving proteins of specific molecular weights. The table below provides guidelines for gel concentration selection based on protein size.
Table 2: Gel Concentration Guidelines for Optimal Protein Separation
| Protein Molecular Weight Range | Recommended Gel Concentration |
|---|---|
| 100-600 kDa | 4% [67] |
| 50-500 kDa | 7% [67] |
| 30-300 kDa | 10% [67] |
| 10-200 kDa | 12% [67] |
| 3-100 kDa | 15% [67] |
For proteins with very large molecular weights, a lower acrylamide percentage creates larger pores that facilitate migration [68]. Conversely, high-percentage gels provide better resolution for small proteins. Gradient gels (e.g., 4-20%) offer a broad separation range and are particularly useful when analyzing proteins of diverse sizes or when molecular weights are unknown [48] [24].
Experimental Protocol: Standard SDS-PAGE Procedure
This detailed protocol ensures reproducible gel polymerization and sample separation:
Gel Preparation: Decide on an appropriate acrylamide percentage based on your target protein molecular weight [69]. For a standard mini-gel, prepare the resolving gel mixture, pour it into the cassette, and carefully top with isopropanol or water to ensure a flat interface [68]. After polymerization (typically 15-30 minutes), pour off the overlay, prepare and add the stacking gel, and immediately insert the comb without introducing bubbles [68].
Sample Preparation: Mix protein samples with an equal volume of 2X Laemmli sample buffer containing β-mercaptoethanol (final concentration 0.55M) or DTT [69]. Heat denature at 95°C for 5 minutes [69]. Centrifuge at maximum speed for 3 minutes to pellet insoluble material [69].
Electrophoresis Setup: Place the gel in the running chamber and fill both inner and outer chambers with 1X running buffer (25 mM Tris base, 192 mM glycine, 0.1% SDS, pH 8.3) [70]. Carefully load samples (5-35 µL per lane) and molecular weight markers [69].
Separation: Connect the power supply and run at constant voltage (100-150V) until the dye front reaches the bottom of the gel (typically 45-90 minutes) [69] [70]. Lower voltages (e.g., 80-100V) can improve resolution for difficult separations and minimize heating artifacts [48].
Post-Electrophoresis Processing: Turn off the power, disconnect electrodes, and carefully remove the gel from its plates for subsequent staining or western blotting [69].
The Scientist's Toolkit: Essential Reagents for SDS-PAGE
Table 3: Key Research Reagent Solutions for SDS-PAGE
| Reagent | Function | Technical Notes |
|---|---|---|
| Acrylamide-Bis Solution | Forms the porous gel matrix for molecular sieving [24] | Ratio of acrylamide to bisacrylamide typically 29:1 or 37.5:1; concentration determines pore size [67] [24] |
| Ammonium Persulfate (APS) | Free radical source to initiate polymerization [24] | Prepare fresh solutions or store frozen aliquots; concentration affects polymerization rate [48] |
| TEMED | Catalyst that stabilizes free radicals and accelerates polymerization [24] | Amount directly controls gelation time; hygroscopic - store tightly sealed [48] |
| SDS (Sodium Dodecyl Sulfate) | Anionic detergent that denatures proteins and confers negative charge [24] [71] | Critical micelle concentration ~0.23% in water; use high purity for consistent binding (~1.4g SDS/g protein) [71] [24] |
| Tris-Glycine-SDS Buffer | Running buffer for electrophoresis [70] | Standard composition: 25 mM Tris, 192 mM glycine, 0.1% SDS, pH 8.3-8.8 [70] |
| DTT or β-Mercaptoethanol | Reducing agents that break disulfide bonds [24] | Essential for linearizing proteins; use fresh for complete reduction [69] [48] |
Visualization of the SDS-PAGE Troubleshooting Workflow
The following diagram illustrates a systematic approach to diagnosing and resolving common gel polymerization and sample loading issues:
Mastering the technical nuances of gel polymerization and sample loading is fundamental to obtaining reliable, reproducible results with SDS-PAGE. By understanding the underlying principles of protein separation and methodically addressing common pitfalls through the protocols and troubleshooting strategies outlined in this guide, researchers can significantly enhance their experimental outcomes. Proper gel casting technique, careful handling of polymerization reagents, optimal gel concentration selection, and meticulous sample loading practices collectively form the foundation of successful protein separation. These foundational skills remain essential even as advanced protein analysis techniques continue to evolve, ensuring SDS-PAGE maintains its status as an indispensable tool in biochemical research and biopharmaceutical development.
Sodium Dodecyl Sulfate–Polyacrylamide Gel Electrophoresis (SDS-PAGE) remains a cornerstone technique in biochemical research and biopharmaceutical development for separating protein mixtures by molecular weight. The fundamental mechanism relies on the binding of SDS, an anionic detergent, to protein molecules. This process unfolds native protein structures and imparts a uniform negative charge density, effectively negating the influence of a protein's inherent charge and ensuring separation is based primarily on molecular size rather than charge [72]. The polyacrylamide gel matrix serves as a molecular sieve, where smaller proteins migrate more readily through the porous network than larger ones [42]. While the basic principles have remained consistent since their establishment, optimizing electrophoretic conditions—specifically voltage and run time—is critical for achieving high-resolution band separation, a prerequisite for accurate analysis in applications ranging from quality control of therapeutic proteins to fundamental proteomic research [73].
This technical guide examines the interplay between electrical parameters and separation quality, providing detailed methodologies for optimizing SDS-PAGE conditions. The objective is to equip researchers with the knowledge to systematically eliminate band smiling, smearing, and poor resolution, thereby enhancing the reproducibility and reliability of protein analysis data.
The Science of Electrical Settings: Current, Voltage, and Power
In SDS-PAGE, an electric field provides the driving force for protein migration. Most modern power supplies allow control over three interrelated parameters: voltage (V), current (I, in amps), and power (P, in watts), governed by the relationship P = I × V [74] [75]. The choice of which parameter to keep constant directly impacts the electrophoresis run's heat generation, migration rate, and final band quality.
Constant Voltage: Under this mode, the applied voltage is fixed. As the run progresses and electrolytes in the running buffer are consumed, the system's resistance increases. According to Ohm's Law (V = I × R), this increase in resistance causes the current to decrease over time. The primary advantage of this mode is that the decreasing current leads to reduced heat production as the run continues, minimizing the risk of gel deformation and protein denaturation. A potential drawback is that the migration rate of proteins will slow down in the latter part of the run, which can lead to longer run times and potentially more diffuse bands [74] [75].
Constant Current: When current is held constant, the voltage must increase to compensate for the rising resistance in the system. This ensures a constant migration rate for the proteins, allowing for predictable run times. However, the increasing voltage leads to a corresponding increase in power (P = I² × R), resulting in significant Joule heating toward the end of the run. This excess heat can cause gels to expand, leading to distorted "smiling" bands or, in severe cases, rendering the gel unusable for downstream applications like western blotting [74] [75] [76].
Constant Power: This mode attempts to maintain a fixed power output. As resistance increases, the relationship between voltage and current adjusts to keep their product constant. While this can help limit overall heat production, the constantly changing voltage and current make the sample's migration rate difficult to predict, potentially leading to inconsistent run times and band resolution [74] [75].
A critical consequence of any electrophoretic run is Joule heating, where electrical energy is converted into thermal energy within the buffer and gel. While mild heating can aid in denaturing proteins, excessive heat is detrimental, causing gel expansion, uneven migration, and distorted bands, often manifesting as the characteristic "smile" effect where bands curve upwards at the edges [74] [76]. Managing this heat is therefore paramount to achieving sharp, well-resolved bands.
Optimizing Voltage and Run Time: A Detailed Experimental Guide
Optimal separation in SDS-PAGE is achieved through a discontinuous buffer system and a two-stage electrophoretic run. The following protocols provide a systematic approach to optimizing these parameters for different gel sizes and experimental requirements.
General Two-Stage Protocol for Sharp Bands
A common strategy for achieving high-resolution separation involves starting at a lower voltage to concentrate proteins at the stacking/resolving gel interface, followed by a higher voltage for efficient separation.
- Sample Preparation: Mix protein samples with Laemmli buffer (containing Tris-HCl, SDS, glycerol, bromophenol blue, and a reducing agent like β-mercaptoethanol) and denature by heating at 70-95°C for 5-10 minutes [72] [11].
- Gel Loading: Load prepared samples and a molecular weight standard (ladder) into the wells of a polyacrylamide gel. It is critical to load protein or buffer in empty wells to prevent distortion from the "edge effect" in peripheral lanes [76].
- Initial Running Stage (Stacking): Begin electrophoresis at a low voltage of 50-60 V. This slow migration allows the stacking gel mechanism, driven by the differential mobility of chloride (leading) and glycine (trailing) ions, to focus all protein samples into a sharp, narrow band before they enter the resolving gel. This step typically takes about 30 minutes, or until the dye front has completely entered the resolving gel [74] [72].
- Main Running Stage (Resolving): Once proteins have entered the resolving gel, increase the voltage. A standard guideline is to apply 5-15 V per centimeter of gel length. The total run time depends on gel concentration and protein size, but is generally complete when the bromophenol blue dye front reaches the bottom of the gel [74] [76].
Quantitative Settings for Different Gel Formats
The table below summarizes recommended starting parameters for different gel formats, which should be optimized for specific apparatus and protein targets.
Table 1: Recommended Voltage Settings for Different SDS-PAGE Gel Formats
| Gel Format | Initial Stacking Voltage | Main Resolving Voltage | Approximate Total Run Time | Key Considerations |
|---|---|---|---|---|
| Mini-Gel (~5-10 cm length) | 50 - 80 V | 100 - 150 V | 45 - 90 minutes | High voltage enables fast runs; monitor heat generation. |
| Midi-Gel | 60 - 80 V | 120 - 180 V | 60 - 120 minutes | A balance between speed and resolution. |
| Large Gel | 80 - 100 V | Up to 200-300 V | 1.5 - 3 hours | Requires higher voltage to drive migration; increased risk of Joule heating. |
Protocol for Heat-Sensitive or High-Resolution Applications
For experiments where heat-sensitive protein integrity is paramount or when optimizing for the sharpest possible bands, the following protocol is recommended.
- Apparatus Setup: Perform electrophoresis in a cold room (4°C) or use a circulating chiller unit. Alternatively, submerge the gel tank in an ice bath. Ensure the power supply itself remains at room temperature to prevent condensation damage [75].
- Constant Voltage Run: Use the constant voltage mode to prevent the heat increase associated with constant current. Refer to Table 1 for voltage guidelines based on gel size.
- Extended Run Time: Expect run times to be 20-50% longer than standard protocols due to the inverse relationship between temperature and electrical resistance [75].
- Validation: Use a pre-stained protein ladder to monitor migration in real-time. Stop the run immediately when the desired separation is achieved, even if the dye front has not fully exited the gel.
The following workflow diagram summarizes the decision-making process for selecting and applying the appropriate electrophoretic conditions.
Troubleshooting Common Issues Related to Running Conditions
Even with a robust protocol, issues can arise. The table below links common problems to their causes and provides targeted solutions.
Table 2: Troubleshooting SDS-PAGE Band Appearance
| Problem | Possible Cause | Troubleshooting Solution |
|---|---|---|
| 'Smiling' Bands (curved bands) | Excessive Joule heating during the run [76]. | Use constant voltage mode; run gel in a cold room or with an ice bath; lower the voltage and extend run time [74] [75]. |
| Smeared Bands | Voltage too high; protein overload; improper sample preparation [76]. | Run the gel at a lower voltage for a longer duration; ensure samples are properly denatured and centrifuged; check gel for uneven polymerization [76]. |
| Poor Resolution (unclear bands) | Run time too short; incorrect acrylamide concentration; improper buffer [76]. | Run the gel until the dye front is near the bottom; optimize acrylamide % for target protein size; freshly prepare running buffer to ensure correct ion concentration and pH [76]. |
| Diffuse Bands | Constant voltage mode with overly long run time [75]. | Optimize run time to stop as soon as separation is achieved; consider switching to constant current for more predictable migration. |
| Bands Migrated Off Gel | Run time too long [76]. | Stop electrophoresis as soon as the dye front reaches the bottom of the gel (for most applications). For very low molecular weight proteins, use a higher % gel and shorter run time. |
| Edge Effect (distorted peripheral lanes) | Empty wells at the edges of the gel [76]. | Load sample buffer or a dummy protein sample into unused wells to ensure even current flow across the entire gel. |
Advanced Applications and Future Perspectives in Protein Separation
Optimized SDS-PAGE continues to be a vital tool in advanced research and industry. In drug development, it is indispensable for the quality control of protein pharmaceuticals like monoclonal antibodies, ensuring batch-to-batch consistency and purity [77] [73]. The technique is also being adapted for more specialized needs. For instance, Native SDS-PAGE (NSDS-PAGE) has been developed, which uses reduced SDS concentrations and omits heating and reducing agents to allow for the separation of proteins while retaining enzymatic activity and bound metal ions [11]. Furthermore, innovative protocols now enable the in-gel refolding of fluorescent proteins like GFP after standard denaturing SDS-PAGE, allowing for direct fluorescence detection without the need for immunoblotting [78].
The field continues to evolve with technological advancements. Capillary electrophoresis (CE), particularly CE-mass spectrometry, is gaining traction for protein analysis due to its high efficiency, automation, and minimal sample consumption [77]. Concurrently, the market for SDS-PAGE systems is shifting toward precast gels, automation, and integrated digital imaging and analysis software, all aimed at improving reproducibility, throughput, and data standardization in proteomic research [73].
The Scientist's Toolkit: Essential Reagents for SDS-PAGE
The following table details key reagents and their critical functions in a standard SDS-PAGE workflow.
Table 3: Essential Research Reagent Solutions for SDS-PAGE
| Reagent / Solution | Composition / Example | Primary Function in SDS-PAGE |
|---|---|---|
| Laemmli Sample Buffer | Tris-HCl, SDS, Glycerol, Bromophenol Blue, β-mercaptoethanol (BME) or DTT [72]. | Denatures proteins, provides negative charge, adds sample density for loading, and allows visual tracking of migration. BME/DTT reduces disulfide bonds. |
| Running Buffer | Tris, Glycine, SDS, pH ~8.3 [72]. | Carries current and maintains stable pH during electrophoresis. Glycine's charge state is crucial for the stacking gel effect. |
| Stacking Gel | Low % acrylamide, Tris-HCl, pH ~6.8 [72]. | Concentrates loaded proteins into a sharp band before they enter the resolving gel, improving final resolution. |
| Resolving Gel | Variable % acrylamide (e.g., 8-16%), Tris-HCl, pH ~8.8 [72]. | Separates proteins based on molecular weight via a sieving effect through the polyacrylamide matrix. |
| Polyacrylamide Gel Matrix | Acrylamide, Bis-acrylamide (cross-linker), Ammonium Persulfate (APS), TEMED [42] [72]. | Forms a porous gel network. Pore size is determined by the total acrylamide concentration (%T) and degree of cross-linking (%C). APS and TEMED catalyze polymerization. |
Sodium dodecyl sulfate-polyacrylamide gel electrophoresis (SDS-PAGE) is a foundational technique in biochemistry, renowned for separating proteins based on molecular weight. The method relies on SDS binding to denature proteins and impart a uniform charge-to-mass ratio. However, significant exceptions to this principle occur, particularly with hydrophobic transmembrane proteins and acidic polypeptides, where variable SDS binding leads to anomalous migration. This technical review examines the molecular basis of SDS binding variability, its impact on electrophoretic mobility, and methodological adaptations to address these limitations for accurate protein analysis. Understanding these factors is crucial for researchers relying on SDS-PAGE for protein characterization in drug development and basic research.
SDS-PAGE operates on the principle that proteins denatured by sodium dodecyl sulfate (SDS) and reducing agents migrate through a polyacrylamide gel matrix at rates inversely proportional to their molecular weight. The anionic detergent SDS binds to hydrophobic regions of proteins at an average ratio of 1.4 g SDS per gram of protein [3], unfolding secondary and tertiary structures and conferring a uniform negative charge. This charge uniformity theoretically ensures migration depends solely on polypeptide chain length rather than intrinsic charge or conformation [20].
The electrophoresis system employs a discontinuous buffer system with stacking and separating gels at different pH levels (6.8 and 8.8, respectively) to concentrate samples into sharp bands before separation [3] [79]. The polyacrylamide gel acts as a molecular sieve, with pore size determined by acrylamide concentration. Smaller proteins migrate faster through this matrix, while larger proteins experience greater resistance [80].
Despite its widespread utility, the fundamental assumption of uniform SDS binding fails for specific protein classes, including transmembrane proteins with extensive hydrophobic domains and acidic proteins with high aspartate/glutamate content. This review examines the molecular mechanisms underlying these exceptions and their implications for accurate protein analysis.
Molecular Mechanisms of SDS Binding Variability
SDS-Protein Interactions
SDS denatures proteins through a "necklace and bead" model where helical, SDS-coated polypeptide regions form micellar "beads" separated by flexible, uncoated linkers [62]. The detergent binds to protein backbones via hydrophobic interactions, with monomeric SDS (not micelles) primarily responsible for protein binding [3]. While SDS concentrations above 1 mM denature most proteins [3], the stoichiometry of binding varies significantly based on protein composition and structure.
The amphipathic nature of SDS enables it to interact with both polar and nonpolar protein regions, disrupting hydrogen bonds and unfolding secondary structures [3]. However, proteins with abundant hydrophobic domains, particularly transmembrane segments, exhibit altered binding kinetics and capacity due to their thermodynamic preference for hydrophobic environments over aqueous SDS solutions.
Structural Factors Influencing SDS Binding
Multiple structural elements impact SDS binding efficiency and uniformity:
Hydrophobic domains: Transmembrane helices rich in hydrophobic residues preferentially embed within SDS micelle interiors rather than adsorbing SDS monomers uniformly [62]. This reduces accessible binding sites and creates compact protein-detergent complexes.
Disulfide bonds: Covalent cross-links restrict complete protein unfolding, reducing SDS binding by up to 2-fold compared to reduced polypeptides [62]. This explains the anomalous migration of non-reduced versus reduced proteins.
Post-translational modifications: Glycosylation and phosphorylation can sterically hinder SDS access to polypeptide chains, resulting in lower detergent binding and altered mobility [79].
Tertiary structure stability: Proteins with metastable folds or SDS-resistant complexes maintain compact conformations despite SDS treatment, especially without heat denaturation [3].
These structural factors create a continuum of SDS-binding efficiencies across different protein types, fundamentally challenging the assumption of uniform charge distribution in SDS-PAGE.
Anomalous Electrophoretic Migration: Quantitative Evidence
Membrane Proteins and Hydrophobic Sequences
Hydrophobic transmembrane domains demonstrate the most pronounced deviations from predicted SDS-PAGE migration. Experimental evidence reveals that helical membrane proteins consistently migrate at rates disproportionate to their formula molecular weights, with apparent mass discrepancies ranging from -46% to +48% [62]. This "gel shifting" correlates strongly with increased SDS binding capacity.
Table 1: SDS Binding and Gel Migration in Membrane Proteins
| Protein | Formula MW (kDa) | Gel Shift (% ΔMW) | SDS Binding (g SDS/g protein) |
|---|---|---|---|
| Glycophorin | - | - | 3.4 [62] |
| CP-B2 | - | - | 4.5 [62] |
| Cytochrome b5 | - | - | 1.2 [62] |
| KcsA tetramer | 76 | -21% | 0.7 [62] |
| Glut1 | - | - | 1.7 [62] |
| CFTR hairpin (WT) | Model system | -10% to +30% | 3.4-10 [62] |
Research demonstrates a direct correlation between SDS loading capacity and electrophoretic mobility. In model helix-loop-helix peptides derived from CFTR transmembrane domains, gel shifts strongly correlated with SDS loading (R² = 0.8) and with peptide helicity (R² = 0.9) [62]. This relationship indicates that anomalous migration originates primarily from altered detergent binding rather than other factors.
Acidic Proteins and Charge Effects
Proteins with high acidic amino acid content (aspartate and glutamate) exhibit retarded migration on SDS-PAGE. A systematic study of zebrafish nucleolar protein Def and its fragments revealed a linear relationship between acidic residue content and mobility shift [81]. The equation y = 276.5x - 31.33 (where x = percentage of acidic residues, y = average ΔMW per amino acid) accurately predicts SDS-PAGE-displayed molecular weight for acidic proteins within 11.4% to 51.1% acidic content [81].
Table 2: Acidic Amino Acid Content and Migration Anomalies
| Acidic AA Content | Observed ΔMW per AA (Da) | Example Proteins |
|---|---|---|
| 11.4% | ~0 | Typical globular proteins |
| 20% | ~24 | Moderately acidic regions |
| 35.6% | ~67 | Def N-terminal region |
| 51.1% | ~110 | Extremely acidic peptides |
This retardation effect persists despite theoretical charge neutralization by SDS, suggesting that residual negative charges or altered conformation in acidic regions affects electrophoretic mobility through mechanisms distinct from hydrophobic domains.
Methodological Approaches and Experimental Protocols
Standard SDS-PAGE Protocol with Modifications
Standard SDS-PAGE employs a Tris-glycine buffer system with sample heating to 95°C for 5 minutes in Laemmli buffer containing SDS and reducing agents [3] [18]. For hydrophobic proteins, these conditions may require optimization:
Sample preparation: Increase SDS concentration to 2-4% in sample buffer and extend heating time to 10-15 minutes to improve hydrophobic domain denaturation [80].
Gel composition: Use gradient gels (4-12% acrylamide) to resolve proteins with unknown migration behavior [3] [80].
Alternative buffer systems: Bis-tris methane-based gels at neutral pH (6.4-7.2) improve stability and reduce modifications to cysteine residues [3].
Figure 1: Experimental Workflow for Proteins with SDS Binding Variability
Native SDS-PAGE for Functional Analysis
Native SDS-PAGE (NSDS-PAGE) represents a significant modification that preserves protein function while maintaining high resolution. This method eliminates SDS and EDTA from sample buffers, omits the heating step, and reduces SDS in running buffer to 0.0375% [11]. Compared to standard SDS-PAGE, NSDS-PAGE dramatically increases zinc retention in metalloproteins from 26% to 98% and preserves enzymatic activity in 7 of 9 model enzymes tested [11].
Research Reagent Solutions
Table 3: Essential Reagents for Studying SDS Binding Variability
| Reagent/Category | Function/Application | Examples/Specifications |
|---|---|---|
| Alternative Detergents | Study detergent-specific effects | CTAB (cationic), 16-BAC [3] |
| Reducing Agents | Break disulfide bonds | β-mercaptoethanol, DTT, TCEP [3] [20] |
| Molecular Weight Markers | Calibration for anomalous proteins | Prestained standards, unstained markers [15] |
| Modified Buffer Systems | Enhanced resolution | Tris-tricine for small proteins, Bis-tris for stability [3] [15] |
| Gel Staining Methods | Protein visualization | Coomassie, silver stain, SYPRO Ruby [20] [80] |
| Cross-linking Reagents | Stabilize protein complexes | Glutaraldehyde, DSS (for native PAGE) |
Implications for Research and Development
Molecular Weight Estimation Accuracy
The database of electrophoretic migration patterns for approximately 10,000 human proteins reveals significant discrepancies between predicted and observed molecular weights [82]. This variability negatively impacts antibody validation and western blot reliability, contributing to considerable waste of reagents and labor worldwide [82]. Researchers must recognize that single-band appearance on SDS-PAGE does not confirm protein purity or identity, particularly for hydrophobic and acidic proteins.
Structural Predictions from Migration Data
Despite its limitations, anomalous SDS-PAGE migration provides valuable structural insights when properly interpreted. Retarded migration in acidic proteins suggests high aspartate/glutamate content, while accelerated migration in transmembrane proteins indicates extensive hydrophobic domains and compact SDS-resistant folding [62] [81]. These patterns serve as initial screens for identifying structural features before undertaking more sophisticated analyses.
SDS binding variability presents significant challenges for molecular weight determination and protein characterization using SDS-PAGE. Hydrophobic proteins with transmembrane domains and acidic polypeptides with abundant aspartate/glutamate residues demonstrate particularly pronounced deviations from predicted migration. These limitations necessitate methodological adaptations, including modified buffer systems, alternative detergents, and native SDS-PAGE approaches that preserve metal binding and enzymatic function. Future developments in database resources documenting accurate electrophoretic migration patterns will enhance reliability in protein analysis. Researchers must exercise caution when interpreting SDS-PAGE results and employ complementary techniques to verify protein identity and structural features.
Validating Results and Comparative Techniques: SDS-PAGE in the Modern Lab
Validation with Molecular Weight Markers and Western Blotting
Western blotting remains a cornerstone technique in biomedical research and drug development for detecting specific proteins within complex biological mixtures. This technical guide delves into the critical role of molecular weight markers in the validation process, providing a comprehensive framework for ensuring accurate protein identification, verifying separation efficiency, and confirming transfer success. Within the broader context of SDS-PAGE principles and protein separation mechanisms, we present detailed methodologies for proper marker utilization, quantitative data analysis, and troubleshooting common issues. By establishing rigorous validation protocols using molecular weight standards, researchers can generate reliable, reproducible data essential for protein characterization, expression analysis, and diagnostic applications in pharmaceutical development.
Western blotting (also known as immunoblotting) is a powerful analytical technique that enables researchers to identify specific proteins from complex mixtures extracted from cells or tissues [83]. The technique employs three fundamental elements: separation by size through gel electrophoresis, transfer to a solid support membrane, and immunological detection of the target protein using antibody probes [84]. The specificity of the antibody-antigen interaction enables a target protein to be identified in the midst of a complex protein mixture, producing both qualitative and semi-quantitative data about the protein of interest [84].
Molecular weight markers (also referred to as protein ladders or standards) are essential components in western blotting that serve as critical reference points for interpreting results [33]. These mixtures of proteins of known molecular weights are run alongside experimental samples on the same gel, creating a standard curve against which the size of unknown proteins can be estimated [33]. The migration pattern of these pre-characterized proteins provides a reference scale that confirms proper electrophoretic separation, verifies electrotransfer efficiency, and enables accurate calculation of target protein molecular weights [85]. Without appropriate molecular weight markers, researchers cannot confidently validate that the detected band corresponds to the protein of interest rather than nonspecific binding or protein degradation products.
The importance of molecular weight markers extends beyond simple size estimation. They provide critical quality control checkpoints throughout the western blotting process [33]. Successful migration and separation of the molecular weight marker confirms that the electrophoresis conditions are appropriate, while abnormal migration patterns can indicate issues with buffer composition, gel integrity, or running conditions [33]. Furthermore, during the transfer step, the efficient movement of marker proteins from the gel to the membrane validates transfer efficiency, particularly important for proteins of extreme molecular weights [86]. For researchers in drug development, where reproducibility and accuracy are paramount, proper validation with molecular weight markers is not optional but essential for generating reliable, publishable data.
The Principle of SDS-PAGE and Protein Separation
Sodium dodecyl sulfate-polyacrylamide gel electrophoresis (SDS-PAGE) forms the foundational separation step in western blotting [18]. The technique relies on the ability of polyacrylamide gel matrices to separate protein molecules based on their molecular mass when subjected to an electric field [33]. In their native state, proteins exhibit varying charges and complex three-dimensional structures that would cause them to migrate at different rates unrelated to their size. SDS-PAGE overcomes this limitation through a denaturing approach that standardizes the charge-to-mass ratio across all proteins [18].
The key to this process is the detergent sodium dodecyl sulfate (SDS), which binds to the protein backbone at a constant molar ratio of approximately 1.4g SDS per 1g protein [18] [33]. In the presence of SDS and reducing agents that cleave disulfide bonds, proteins unfold into linear polypeptide chains with negative charges proportional to their length [18]. This treatment effectively neutralizes the intrinsic charge differences between proteins and imposes a uniform negative charge density. When an electric current is applied, these denatured protein-SDS complexes migrate through the porous polyacrylamide gel matrix toward the positive anode, with smaller proteins moving faster due to less resistance from the gel mesh [18] [33].
The polyacrylamide gel concentration significantly influences separation efficiency [18]. Polymerized acrylamide forms a mesh-like matrix with pore sizes determined by the acrylamide concentration, with higher percentages creating smaller pores better suited for separating low molecular weight proteins [18]. Typically, acrylamide concentrations between 6% and 15% are used, with gradient gels that vary in concentration from top to bottom offering enhanced resolution across a broader molecular weight range [18]. The gel system itself consists of two distinct layers: an upper stacking gel with lower acrylamide concentration and pH that concentrates proteins into sharp bands before they enter the separating gel, and a lower resolving gel with higher acrylamide concentration and pH where actual size-based separation occurs [83]. This sophisticated system enables researchers to achieve high-resolution separation of complex protein mixtures based primarily on molecular weight, creating the foundation for specific detection through western blotting.
Types and Selection of Molecular Weight Markers
Selecting appropriate molecular weight markers is crucial for successful western blot validation, as different applications require different marker characteristics. The market offers various types of standards, each with specific advantages for particular experimental needs. Understanding these options allows researchers to choose the most suitable markers for their specific applications.
Table 1: Types of Molecular Weight Markers for Western Blotting
| Marker Type | Characteristics | Optimal Applications | Limitations |
|---|---|---|---|
| Prestained | Proteins pre-labeled with visible dyes; migration can be monitored in real-time during electrophoresis | Verification of electrophoresis progress and transfer efficiency; approximate molecular weight estimation | Slight size shift compared to unstained proteins due to dye molecules; not for precise molecular weight determination |
| Unstained | Native proteins without attached dyes; require post-staining for visualization | Precise molecular weight determination; applications requiring minimal protein modification | Cannot monitor progress during electrophoresis; requires additional staining step |
| Biotinylated | Proteins labeled with biotin; detected with streptavidin-HRP conjugates | Western blots using chemiluminescent detection; visible on final blot without staining | Additional incubation step required; potential interference with some detection systems |
| Fluorescent | Proteins labeled with fluorophores; detected with appropriate imaging systems | Fluorescent western blotting; multiplex applications | Requires fluorescent imaging capability; may have different transfer characteristics |
The selection criteria for molecular weight markers should consider several factors. First, the molecular weight range must cover the expected size of the target protein with adequate standards both above and below the protein of interest [85]. For high molecular weight proteins (>150 kDa), specialized markers with extended range are essential [86]. Second, researchers must decide between prestained and unstained markers based on their need to monitor electrophoresis and transfer versus obtaining precise molecular weight measurements. Prestained markers allow direct visualization of protein migration during electrophoresis and confirm successful transfer to the membrane, but the attached dye molecules can slightly alter protein mobility, making them less ideal for precise molecular weight determination [33].
Additional considerations include the compatibility of marker proteins with specific gel systems and buffer conditions. Some specialized applications, such as native gel electrophoresis or bis-tris gel systems, may require specific marker formulations [11]. The presence of particular standard proteins can also be important when they might comigrate with or interfere with detection of the target protein. For quantitative western blotting, markers with evenly spaced protein bands across the molecular weight range facilitate more accurate standard curve generation [33]. Ultimately, researchers should validate their chosen markers in their specific experimental system to ensure appropriate performance and interpretation.
Experimental Protocols
Standard Western Blot Protocol with Molecular Weight Markers
The following protocol outlines the standard western blot procedure with integrated steps for proper molecular weight marker utilization:
Sample Preparation:
- Extract proteins from cells or tissues using appropriate lysis buffer containing protease inhibitors [83]. For adherent cells, wash with cold PBS, dislodge cells with a scraper, centrifuge at 1500 RPM for 5 minutes, and lyse the pellet with ice-cold lysis buffer [83].
- Determine protein concentration using a spectrophotometer to ensure equal loading across lanes [83]. Typically, 10-50 µg of total protein is loaded per well, depending on protein abundance and detection system sensitivity [85].
- Prepare samples by mixing with SDS sample buffer (e.g., LDS buffer) containing reducing agents (e.g., DTT) [87]. Heat samples at 70°C for 10 minutes or 95°C for 5 minutes to denature proteins [85] [87].
- Centrifuge samples at 15,000 rpm for 1 minute to pellet any insoluble material [18].
Gel Electrophoresis:
- Assemble gel electrophoresis apparatus according to manufacturer instructions [18]. Use appropriate gel percentage based on target protein size (6-15% acrylamide) [18].
- Load molecular weight marker (5-10 µL) alongside prepared samples (15-20 µL) into wells [87] [83]. Ensure at least one lane contains marker proteins for accurate molecular weight estimation.
- Run gel at constant voltage (100-150V) using appropriate running buffer until the dye front reaches the bottom of the gel [18] [85]. Monitor prestained marker migration if used.
Protein Transfer:
- Select transfer method based on protein characteristics. For most applications, especially high molecular weight proteins, wet transfer is recommended [86].
- Prepare transfer stack in the following order (from cathode to anode): sponge, 3 filter papers, gel, membrane, 3 filter papers, sponge [85] [83]. Ensure no air bubbles are trapped between gel and membrane.
- For wet transfer, run at 80V for 2-3 hours or at 25V overnight at 4°C [85]. For high molecular weight proteins (>150 kDa), consider higher current (500mA) for 1 hour at 4°C [86].
- Verify transfer efficiency by visualizing prestained markers on the membrane [33].
Immunodetection:
- Block membrane with 5% non-fat dry milk or BSA in TBST for 1 hour at room temperature to prevent nonspecific antibody binding [87] [83]. For phosphorylated targets, BSA is recommended over milk [85].
- Incubate membrane with primary antibody diluted in blocking buffer overnight at 4°C with gentle agitation [87]. Refer to antibody datasheet for recommended dilutions.
- Wash membrane three times for 5 minutes each with TBST [87].
- Incubate with species-appropriate HRP-conjugated secondary antibody (typically 1:2000 dilution) in blocking buffer for 1 hour at room temperature [87].
- Wash membrane three times for 5 minutes each with TBST [87].
- Develop blot using chemiluminescent substrate according to manufacturer instructions [87]. Acquire images using appropriate imaging system.
Specialized Protocol for High Molecular Weight Proteins
Proteins larger than 150 kDa present unique challenges in western blotting due to inefficient transfer and potential incomplete denaturation. The following protocol modifications optimize detection of high molecular weight targets:
Gel Preparation and Electrophoresis:
- Use lower percentage gels (6-8% acrylamide) or gradient gels (4-12%) to improve separation and migration of large proteins [86].
- Extend electrophoresis time (approximately 1.5 hours at 150V) to ensure adequate separation [86]. Use pre-chilled running buffer and surround apparatus with ice packs to prevent overheating [86].
- Increase sample loading to at least 20 µg total protein per lane to compensate with potential transfer inefficiencies [86].
Transfer Optimization:
- Prior to transfer, equilibrate gel in transfer buffer for 40 minutes to prevent swelling or shrinking [86].
- For PVDF membranes, activate with methanol for 15 seconds before equilibration in transfer buffer [86].
- Use high-current wet transfer (500 mA for 1 hour at 4°C) to facilitate movement of large proteins from gel to membrane [86].
- Consider adding SDS (0.1%) to the transfer buffer to enhance protein elution from the gel, though this may reduce membrane binding efficiency [84].
Detection Considerations:
- Extend blocking time to 1 hour at room temperature or overnight at 4°C to ensure complete blocking of membrane [86].
- Consider using specialized antibodies validated for high molecular weight targets, as epitope accessibility may be reduced in larger proteins [86].
- Increase primary antibody incubation time (up to 24 hours at 4°C) to improve binding to large, potentially less accessible targets.
Data Interpretation and Validation
Molecular Weight Estimation and Analysis
Accurate molecular weight estimation relies on proper analysis of the molecular weight marker migration pattern. The process involves creating a standard curve from the marker proteins and using this curve to determine the size of unknown proteins:
- Measure the migration distance of each marker protein band from the well [33]. Distance should be measured to the center of each band for consistency.
- Plot the logarithm of molecular weight (y-axis) against migration distance (x-axis) for each standard protein [33]. This typically generates a linear relationship that serves as the standard curve.
- Determine the equation of the trendline (y = mx + b) and correlation coefficient (R²). An R² value >0.95 indicates a reliable standard curve.
- For unknown proteins, measure migration distance and use the standard curve equation to calculate molecular weight.
Table 2: Troubleshooting Common Issues with Molecular Weight Validation
| Issue | Potential Causes | Solutions |
|---|---|---|
| Inaccurate molecular weight estimation | Improper standard curve, unusual protein structure, post-translational modifications | Use unstained markers for precise determination; verify with positive control; consider potential modifications |
| Non-linear standard curve | Incomplete denaturation, improper electrophoresis conditions, limited marker range | Ensure complete sample denaturation; verify buffer composition; use markers with appropriate molecular weight range |
| Poor transfer of high molecular weight proteins | Insufficient transfer time or current, gel porosity too small | Extend transfer time; increase current; use lower percentage gels; add SDS to transfer buffer |
| Signal detection problems | Inefficient transfer, poor antibody binding, insufficient substrate | Verify transfer with prestained markers; optimize antibody concentrations; use fresh detection reagents |
Several factors can affect molecular weight estimation accuracy. Post-translational modifications such as glycosylation or phosphorylation can significantly increase apparent molecular weight [83]. Unusual amino acid compositions may affect SDS binding, leading to aberrant migration [88]. Multimeric proteins not fully reduced may migrate at higher than expected molecular weights. Researchers should compare estimated molecular weights with predicted sizes based on protein sequence and consider potential modifications when interpreting results.
Validation of Experimental Results
Proper validation using molecular weight markers involves multiple checkpoints throughout the western blotting process:
Electrophoresis Validation:
- Prestained markers should show sharp, well-separated bands migrating appropriately through the gel [33]. Smeared or distorted bands indicate problems with gel quality or running conditions.
- The migration pattern should correspond to expected molecular weights without compression or unusual spacing between bands.
Transfer Efficiency Validation:
- Successful transfer is confirmed by the presence of prestained markers on the membrane [33].
- For unstained markers, reversible staining methods like Ponceau S can visualize total transferred protein [85] [84].
- Incomplete transfer may be evidenced by residual protein in the gel after transfer, particularly for high molecular weight proteins.
Specificity Validation:
- The target band should appear at the expected molecular weight based on the standard curve [83].
- Multiple bands may indicate protein isoforms, degradation products, splice variants, or nonspecific antibody binding [83].
- Negative controls (samples lacking the target protein) should not show the band of interest [83].
- Positive controls (samples known to express the target protein) should show the expected band [83].
For quantitative western blotting, additional validation steps include ensuring the detection method is within the linear range and normalizing signals to appropriate loading controls. Densitometric analysis of band intensity should be performed only when the signal response is confirmed to be linear with protein amount.
The Scientist's Toolkit: Essential Research Reagents
Table 3: Essential Research Reagents for Western Blot Validation
| Reagent Category | Specific Examples | Function and Importance |
|---|---|---|
| Molecular Weight Markers | Prestained protein standards, unstained protein ladders, biotinylated markers | Provide molecular weight references for size estimation; verify electrophoresis and transfer efficiency |
| Electrophoresis Buffers | Running buffer (e.g., Tris-glycine-SDS), sample buffer (e.g., LDS with reducing agent) | Maintain pH and conductivity during electrophoresis; denature and impart uniform charge to proteins |
| Transfer Buffers | Tris-glycine transfer buffer with methanol | Facilitate protein movement from gel to membrane; maintain protein stability during transfer |
| Blocking Agents | Non-fat dry milk, BSA, commercial blocking buffers | Prevent nonspecific antibody binding to membrane; reduce background signal |
| Detection Reagents | Chemiluminescent substrates (e.g., ECL), fluorescent dyes | Generate detectable signals from antibody-bound proteins; enable visualization and quantification |
| Membranes | Nitrocellulose, PVDF | Immobilize transferred proteins for antibody probing; provide binding surface with low background |
Molecular weight markers serve as indispensable tools in western blot validation, providing critical reference points throughout the experimental workflow. From verifying proper electrophoretic separation to confirming efficient transfer and enabling accurate molecular weight estimation, these standards are fundamental to generating reliable, interpretable data. As western blotting continues to evolve with new detection methods and applications, the fundamental role of appropriate molecular weight markers remains constant. By incorporating rigorous validation practices using well-characterized standards, researchers can ensure the accuracy and reproducibility of their protein analysis work, particularly crucial in drug development and diagnostic applications where results directly impact scientific conclusions and therapeutic decisions.
Protein electrophoresis is a foundational technique in biochemistry and molecular biology laboratories for separating complex protein mixtures based on their physicochemical properties. This analytical method relies on the movement of charged protein molecules through a porous gel matrix under the influence of an electrical field [10]. The rate of protein migration depends on multiple factors including field strength, the molecule's net charge, size, three-dimensional shape, ionic strength, and the properties of the matrix through which migration occurs [10]. Polyacrylamide gel electrophoresis (PAGE) has become the standard method for protein separation due to its tunable pore size and excellent resolving power [89] [10].
Among the various PAGE techniques, SDS-PAGE (Sodium Dodecyl Sulfate-Polyacrylamide Gel Electrophoresis) and Native-PAGE represent two fundamentally different approaches with distinct applications and outcomes [90] [91]. SDS-PAGE separates proteins primarily by molecular weight under denaturing conditions, while Native-PAGE separates proteins based on their combined size, charge, and shape while maintaining their native conformation and biological activity [10]. The choice between these methods significantly impacts the type of information obtained and determines the suitability for downstream applications, making understanding their differences essential for researchers in proteomics, drug development, and structural biology.
Core Principles and Mechanisms of Separation
SDS-PAGE: Separation by Molecular Weight
SDS-PAGE operates on the principle of eliminating the influence of protein shape and intrinsic charge, thereby enabling separation based almost exclusively on molecular weight [53] [10]. This is achieved through the use of Sodium Dodecyl Sulfate (SDS), a potent anionic detergent that binds to hydrophobic regions of proteins in a constant ratio of approximately 1.4 g SDS per 1 g of polypeptide [57] [10]. This binding process denatures proteins by disrupting non-covalent bonds, unfolding them into linear polypeptide chains [53]. The SDS coating imparts a uniform negative charge to all proteins, effectively masking their intrinsic charges [53] [10].
Protein samples for SDS-PAGE are typically heated between 70-100°C in the presence of excess SDS and a reducing agent like β-mercaptoethanol or dithiothreitol (DTT) [53] [10]. These reducing agents break disulfide bonds, ensuring complete dissociation of protein subunits and full denaturation [53]. When an electric field is applied, the negatively charged SDS-protein complexes migrate toward the positive electrode through the polyacrylamide gel matrix, which acts as a molecular sieve [57]. Smaller proteins move more rapidly through the pores, while larger proteins are retarded, resulting in separation strictly by polypeptide size [10].
Table 1: Key Components and Their Roles in SDS-PAGE
| Component | Function | Role in Separation |
|---|---|---|
| SDS (Sodium Dodecyl Sulfate) | Denatures proteins and confers uniform negative charge | Eliminates influence of native charge and shape |
| Reducing Agents (DTT, BME) | Breaks disulfide bonds | Ensures complete denaturation into subunits |
| Polyacrylamide Gel | Forms porous matrix | Sieves molecules based on size |
| Heat Treatment | Aids denaturation | Linearizes proteins for SDS binding |
Native-PAGE: Separation by Charge, Size, and Shape
In contrast to the denaturing approach of SDS-PAGE, Native-PAGE (also called non-denaturing PAGE) preserves proteins in their native, folded conformation throughout the separation process [90] [91]. Without denaturants, proteins retain their higher-order structure, including secondary, tertiary, and quaternary arrangements [10]. This preservation means that separation depends on the combined factors of the protein's intrinsic net charge, size, and three-dimensional shape [90] [10].
In Native-PAGE, proteins are separated in a polyacrylamide gel without SDS or reducing agents [90]. Under alkaline running buffer conditions, most proteins carry a net negative charge and migrate toward the positive electrode [10]. However, unlike in SDS-PAGE, this charge is not uniform but varies according to each protein's amino acid composition and structure [91]. Simultaneously, the gel matrix creates a frictional force that regulates movement according to protein size and shape [10]. The result is that a protein's mobility depends on its charge-to-mass ratio, with highly charged, compact proteins migrating fastest [91].
The preservation of native structure enables the analysis of protein complexes in their oligomeric states and the study of protein-protein interactions [91]. Perhaps most significantly, proteins separated by Native-PAGE frequently retain their biological activity, allowing for functional assays to be performed directly after separation [90] [10].
Comparative Analysis: Key Differences and Applications
Direct Comparison of Methodological Features
The fundamental differences in approach between SDS-PAGE and Native-PAGE lead to distinct experimental protocols, separation characteristics, and downstream applications. Understanding these contrasts enables researchers to select the appropriate method for their specific research objectives.
Table 2: Comprehensive Comparison of SDS-PAGE vs. Native-PAGE
| Parameter | SDS-PAGE | Native-PAGE |
|---|---|---|
| Separation Basis | Molecular weight only [90] [10] | Size, charge, and shape [90] [10] |
| Protein State | Denatured and linearized [90] [53] | Native, folded conformation [90] [91] |
| Detergent | SDS present [90] | No SDS [90] |
| Reducing Agents | Present (DTT, BME) [90] | Absent [90] |
| Sample Preparation | Heating required (70-100°C) [90] [10] | No heating [90] |
| Protein Function | Lost during denaturation [90] | Retained [90] [10] |
| Protein Recovery | Not recoverable in functional form [90] | Recoverable with activity [90] |
| Net Protein Charge | Always negative (from SDS) [90] | Positive or negative (intrinsic) [90] |
| Typical Running Temperature | Room temperature [90] | 4°C [90] |
| Primary Applications | Molecular weight determination, purity checks, protein expression analysis [90] [53] | Studying protein complexes, oligomerization, enzymatic activity, protein-protein interactions [90] [91] |
Application-Specific Considerations
The choice between SDS-PAGE and Native-PAGE fundamentally depends on the research question. SDS-PAGE is ideal for analytical applications requiring molecular weight determination, such as verifying protein identity after purification or checking expression levels in different samples [90] [53]. Its denaturing nature makes it excellent for assessing protein purity and subunit composition, as it dissociates non-covalently bound complexes [91]. SDS-PAGE is also the preferred first step for western blotting, where proteins are transferred to membranes for antibody detection [53] [10].
Native-PAGE excels when protein function or native structure must be preserved. It is particularly valuable for studying multimeric protein complexes and protein-protein interactions without disrupting non-covalent bonds [91]. Since enzymatic activity is maintained, Native-PAGE enables zymography, where enzymes remain active after separation [10]. It is also preferred for purifying functional proteins from mixtures, as recovered proteins retain their biological activity [90] [10]. Specialized forms like Blue Native-PAGE (BN-PAGE), which uses Coomassie dye to impart charge, provide enhanced resolution of membrane protein complexes and respiratory chain complexes [90] [11].
Experimental Protocols and Methodologies
SDS-PAGE Standard Protocol
The SDS-PAGE procedure involves several critical steps to ensure proper denaturation and separation of proteins [53]:
Gel Preparation: Polyacrylamide gels are typically composed of two layers: a stacking gel (lower acrylamide concentration, pH ~6.8) and a resolving gel (higher acrylamide concentration, pH ~8.8) [53] [10]. The stacking gel concentrates protein samples into sharp bands before they enter the resolving gel, improving resolution. Gel concentration should be selected based on target protein size: 8-10% for large proteins (50-200 kDa), 12% for standard separation (10-100 kDa), and 15% for small proteins (<50 kDa) [57]. Polymerization is catalyzed by ammonium persulfate (APS) and TEMED [53] [10].
Sample Preparation: Protein samples are mixed with SDS-PAGE sample buffer containing SDS (for denaturation and charge), a reducing agent (DTT or β-mercaptoethanol to break disulfide bonds), glycerol (for density), and a tracking dye [53]. Samples are heated at 70-100°C for 5-10 minutes to ensure complete denaturation [53] [10].
Electrophoresis: Prepared samples are loaded into wells alongside a molecular weight marker [53]. Gels are run in Tris-glycine or Tris-tricine buffer containing 0.1% SDS [53] [10]. Electrophoresis can be run at constant current (e.g., 30 mA for a mini-gel) or constant voltage (e.g., 200V) [53] [75]. Constant current provides consistent migration rates and sharper bands, while constant voltage generates less heat and is safer for multiple gel setups [75]. Running time is typically 45-90 minutes, depending on gel size and conditions [53].
Detection: After separation, proteins are visualized using stains like Coomassie Brilliant Blue or more sensitive silver stains [53]. For western blotting, proteins are transferred to a membrane for antibody probing [53].
Native-PAGE Standard Protocol
Native-PAGE protocols differ significantly in their preservation of protein structure [90]:
Gel Preparation: Native gels are cast without SDS or reducing agents [90]. A single continuous gel is often used, though discontinuous buffer systems can also be employed. The acrylamide concentration is selected based on the size range of native proteins or complexes to be separated.
Sample Preparation: Protein samples are mixed with native sample buffer containing glycerol (for density) and a tracking dye, but no denaturants or reducing agents [90]. Samples are not heated to preserve native structure [90].
Electrophoresis: Samples are loaded alongside native protein standards [90]. Gels are run in buffers without SDS, typically at 4°C to maintain protein stability and prevent denaturation during separation [90]. Lower voltages (1-8 V/cm) may be used to minimize heat generation [89]. Running times are generally longer than for SDS-PAGE due to the lower charges and more complex shapes of native proteins [75].
Detection and Recovery: Proteins can be visualized using standard stains [90]. For functional analysis, gentle staining methods or activity assays can be employed [11]. Active proteins can be recovered from native gels by passive diffusion or electroelution for downstream applications [10].
Advanced Technical Considerations and Emerging Methods
Optimization Strategies and Troubleshooting
Successful electrophoresis requires attention to technical details that can significantly impact results. In SDS-PAGE, Joule heating during electrophoresis can cause gels to swell, leading to uneven migration and distorted bands (the "smiling effect") [75]. This can be mitigated by running gels at constant voltage, using cooled chambers, or performing electrophoresis in a cold room [75]. In Native-PAGE, maintaining appropriate pH conditions is critical, as extremes can lead to protein denaturation or aggregation [10].
Protein smearing in SDS-PAGE may indicate incomplete denaturation, protease activity, or overloading [53]. Sharpening bands can be achieved by optimizing the stacking gel system and ensuring proper buffer compositions [53]. For Native-PAGE, the addition of cofactors or stabilizers to buffers may be necessary to maintain protein activity and structural integrity during separation [10].
Hybrid Approaches: Native SDS-PAGE
Recent methodological advances have sought to combine benefits from both techniques. Native SDS-PAGE (NSDS-PAGE) represents a hybrid approach where SDS concentration is substantially reduced (e.g., to 0.0375% in the running buffer) and sample heating is omitted [11]. This modification maintains excellent protein resolution while preserving functional properties for many proteins [11].
In comparative studies, NSDS-PAGE demonstrated remarkable retention of metalloprotein metal ions (98% zinc retention versus 26% with standard SDS-PAGE) and preserved enzymatic activity in seven of nine model enzymes tested [11]. This approach offers a valuable compromise when both high resolution and partial function retention are desired, particularly for metalloprotein analysis [11].
Two-Dimensional Electrophoresis
For the most comprehensive protein separation, two-dimensional PAGE (2D-PAGE) combines the strengths of both Native-PAGE and SDS-PAGE principles [57] [10]. In the first dimension, proteins are separated by their isoelectric point (pI) using isoelectric focusing [57]. In the second dimension, these separated proteins are then resolved by molecular weight using standard SDS-PAGE [57] [10]. This orthogonal approach provides extremely high resolution of complex protein mixtures, capable of separating thousands of proteins in a single experiment [57] [10].
Essential Research Reagent Solutions
Table 3: Key Reagents for Protein Electrophoresis
| Reagent/Chemical | Function/Purpose | Application Notes |
|---|---|---|
| Acrylamide/Bis-acrylamide | Forms cross-linked polymer gel matrix | Concentration determines pore size; neurotoxic - handle with gloves [89] |
| SDS (Sodium Dodecyl Sulfate) | Denatures proteins and confers negative charge | Critical for SDS-PAGE; omit for Native-PAGE [53] [10] |
| TEMED and APS | Catalyzes acrylamide polymerization | TEMED accelerates free radical formation from APS [53] [10] |
| DTT or β-Mercaptoethanol | Reducing agents that break disulfide bonds | Essential for complete denaturation in SDS-PAGE; omit for Native-PAGE [53] |
| Tris-based Buffers | Maintains pH and ionic strength | Different pH for stacking (pH 6.8) and resolving (pH 8.8) gels in SDS-PAGE [53] [10] |
| Coomassie Brilliant Blue | Protein stain for visualization | Standard for protein detection; available in different formulations [90] [53] |
| Molecular Weight Markers | Size standards for calibration | Essential for molecular weight determination in SDS-PAGE [53] [10] |
| Glycine | Leading ion in buffer system | Facilitates discontinuous buffer system for sharp bands [53] |
SDS-PAGE and Native-PAGE represent complementary approaches in the protein separation toolkit, each with distinct strengths and applications. SDS-PAGE remains the gold standard for molecular weight determination and analytical separation of denatured proteins, offering high resolution and reproducibility [90] [10]. Its denaturing nature makes it ideal for western blotting, purity assessment, and subunit composition analysis [91]. In contrast, Native-PAGE preserves the native structure and function of proteins, enabling the study of protein complexes, oligomeric states, and enzymatic activities [90] [91].
The choice between these methods should be driven by specific research objectives rather than technical convenience. When protein function, interactions, or native structure are paramount, Native-PAGE is unequivocally the appropriate choice [91]. When molecular weight determination, high-resolution analytical separation, or compatibility with immunodetection methods is required, SDS-PAGE remains superior [10]. Emerging hybrid techniques like NSDS-PAGE and the powerful resolution of 2D-PAGE offer additional options for challenging separation needs [57] [11].
Understanding the fundamental principles, practical protocols, and application landscapes of these core electrophoretic techniques empowers researchers to make informed methodological choices that align with their scientific questions, ultimately advancing research in proteomics, structural biology, and drug development.
The analysis of proteins based on their molecular weight represents a foundational technique in biochemical research and biopharmaceutical development. For decades, sodium dodecyl sulfate-polyacrylamide gel electrophoresis (SDS-PAGE) has served as the cornerstone method for protein separation. However, the evolving demands of modern laboratories for higher throughput, improved quantification, and greater automation have driven the development and adoption of capillary electrophoresis (CE) platforms. Within the broader thesis on SDS-PAGE principles and mechanisms of protein separation, this whitepaper provides an in-depth technical comparison of these two techniques, with a specific focus on throughput and automation—critical parameters for efficiency and reproducibility in research and drug development. SDS-PAGE separates proteins by exploiting a polyacrylamide gel matrix that acts as a molecular sieve, while capillary electrophoresis performs separations within narrow-bore capillaries, enabling automation and high-throughput analysis. Understanding the capabilities and limitations of each method is essential for scientists selecting the optimal platform for their specific application needs, from basic research to quality control in biotherapeutic characterization [80] [3].
Core Principles and Mechanisms of Separation
SDS-PAGE: Discontinuous Gel Electrophoresis
SDS-PAGE is a discontinuous electrophoretic system that separates proteins based primarily on their molecular mass. The core principle involves the binding of the anionic detergent sodium dodecyl sulfate (SDS) to proteins, which masks the proteins' intrinsic charges and confers a uniform negative charge density. Specifically, approximately 1.4 grams of SDS bind per gram of protein, corresponding to one SDS molecule per two amino acids. This complex, when heated in the presence of reducing agents like β-mercaptoethanol or dithiothreitol (DTT), linearizes the proteins by breaking disulfide bonds and disrupting non-covalent interactions. The resulting SDS-polypeptide complexes migrate through a cross-linked polyacrylamide gel matrix when an electric field is applied. The gel acts as a molecular sieve, whereby smaller proteins migrate faster through the pores, while larger proteins are retarded [80] [3] [24].
The "discontinuous" nature of the system arises from the use of two distinct gel layers and buffer systems:
- Stacking Gel (pH 6.8): A large-pore gel that concentrates the protein samples into sharp bands before they enter the separating gel.
- Separating Gel (pH 8.8): A small-pore gel of higher acrylamide concentration (typically 8-15%) where the actual size-based separation occurs.
This setup, coupled with the use of trailing glycinate ions in the Tris-glycine buffer system, creates a stacking effect that results in exceptionally sharp band definition, a hallmark of the Laemmli method [92] [3].
Capillary Electrophoresis: Microscale Separation in a Capillary
Capillary electrophoresis, and specifically capillary sodium dodecyl sulfate-gel electrophoresis (CE-SDS), translates the principles of SDS-PAGE into an automated, capillary-based format. In CE-SDS, separation occurs within a fused-silica capillary filled with a sieving matrix (e.g., a viscous polymer network). The interior of the capillary is typically coated to minimize protein adsorption onto the capillary wall. Proteins are similarly denatured with SDS and reducing agents to form negatively charged complexes. When a high voltage (typically 15-20 kV) is applied across the capillary, the SDS-protein complexes migrate towards the positive anode and are separated by their hydrodynamic volume (size) as they pass through the sieving matrix. Detection occurs in real-time near the outlet of the capillary, most commonly via UV absorbance or laser-induced fluorescence (LIF), generating an electropherogram where proteins are represented as peaks [93] [94].
The key differentiators of CE-SDS are its format and detection mechanism. The narrow diameter of the capillary (e.g., 50 μm) efficiently dissipates heat, allowing for the application of very high electric fields, which dramatically reduces separation times compared to conventional SDS-PAGE. Furthermore, the on-capillary detection eliminates the need for post-separation staining and destaining, facilitating automated, quantitative data collection [93].
Figure 1: Comparative Workflows of SDS-PAGE and Capillary Electrophoresis. SDS-PAGE involves multiple manual steps, while CE is highly automated from sample injection to data analysis.
Throughput and Automation: A Direct Comparison
Throughput and automation represent the most significant practical differentiators between SDS-PAGE and capillary electrophoresis. These factors directly impact analytical efficiency, operational costs, and data reproducibility.
Throughput and Analysis Time
SDS-PAGE throughput is inherently limited by its batch-processing format. A single gel can typically analyze 10-15 samples simultaneously (including molecular weight markers), with a total run time of approximately 1 to 1.5 hours for standard mini-gel systems. However, the overall hands-on time and total analysis time are substantially longer due to mandatory post-electrophoresis processes. Gel staining (e.g., Coomassie), destaining, and drying can add several hours to overnight to the total procedural timeline. Furthermore, the number of samples processed per day is physically constrained by the number of gel units available and the researcher's capacity to prepare and run them in parallel [80] [92].
In contrast, capillary electrophoresis offers dramatically higher throughput, primarily through automation and parallel processing. Modern multi-capillary instruments, such as the SCIEX BioPhase 8800 system, feature 8 parallel capillaries that process samples simultaneously. This multi-capillary format enables the analysis of 64 samples in approximately 8 hours, a task that would require multiple gels and significant manual intervention with SDS-PAGE. Furthermore, individual CE-SDS separations are often faster, with analysis times frequently under 30 minutes per sample. When combined with automated sample tray loading, this allows for uninterrupted, walk-away operation, including overnight runs, significantly boosting overall laboratory productivity [93].
Automation and Walk-Away Capability
Automation is a defining feature of capillary electrophoresis, whereas SDS-PAGE remains a predominantly manual technique.
SDS-PAGE requires extensive user involvement at nearly every stage: manual gel casting (or purchasing pre-cast gels), manual sample loading with a micropipette, manual setup in the electrophoresis tank, manual control of power supply parameters, and manual post-processing (staining, destaining, imaging). This high degree of manual intervention not only limits throughput but also introduces opportunities for user-induced variability [80] [3].
Capillary Electrophoresis is designed for full automation. Once the sample plate is loaded into the instrument, the entire process—including capillary conditioning, electrokinetic or pressure injection, voltage application, separation, real-time detection, and data collection—is controlled by software. This enables true walk-away operation, allowing researchers to focus on other tasks while the instrument runs. Advanced systems can also automate method transfers from single-capillary to multi-capillary formats and switch between detection modes (e.g., UV and LIF) within the same sequence, further enhancing method development efficiency [93] [95].
Table 1: Quantitative Comparison of Throughput and Automation Features
| Feature | SDS-PAGE | Capillary Electrophoresis (Single Capillary) | Multi-Capillary Electrophoresis (e.g., 8-capillary) |
|---|---|---|---|
| Samples per Run | 10-15 (per gel) [80] | 1 | 8 (simultaneously) [93] |
| Typical Separation Time | 60-90 minutes [92] | 15-30 minutes [93] | ~30 minutes (for 8 samples) [93] |
| Post-Separation Processing | Required (staining/destaining, 1 hr to overnight) [80] | Not required (real-time detection) | Not required (real-time detection) |
| Total Hands-on Time | High (gel prep, loading, staining) | Low (sample prep and tray loading only) | Low (sample prep and tray loading only) |
| Walk-Away Automation | Limited | Yes | Yes [93] |
| Data Output | Banding pattern (gel image) | Electropherogram (digital peaks) | Multiple electropherograms (digital peaks) [93] |
Quantitative Performance and Data Quality
The transition from band-based to peak-based analysis in CE-SDS brings advantages in data quantification and reproducibility.
Reproducibility and Data Quality
The automated nature of CE-SDS minimizes human error, leading to superior analytical precision. In a demonstrated analysis of a monoclonal antibody, a multi-capillary CE system showed excellent reproducibility for relative migration time (RSD = 1.1%) and corrected peak area (RSD = 0.85% for the non-glycosylated heavy chain). This performance was comparable to, and in some cases better than, single-capillary CE systems [93]. SDS-PAGE reproducibility is highly dependent on the operator's skill in gel preparation, sample loading, and staining consistency, typically resulting in higher variability. Furthermore, CE-SDS provides a wide linear dynamic range of up to 4 orders of magnitude, with low limits of detection (e.g., 2.4 μg/mL with UV detection), enabling both qualitative and robust quantitative analysis [93].
Resolution and Separation Performance
Both techniques are capable of high-resolution separations. SDS-PAGE can effectively resolve complex protein mixtures, with resolution adjustable by modifying the acrylamide concentration or using gradient gels [80] [92]. CE-SDS has been shown to provide comparable, and sometimes superior, resolution. For instance, a direct comparison demonstrated that the resolution (Rs) between the non-glycosylated and glycosylated heavy chains of a monoclonal antibody was 1.425 for the multi-capillary CE system versus 1.391 for a single-capillary system, confirming that the high-resolution separation is maintained in the multi-capillary format [93]. A foundational 1994 study comparing the separation of 65 proteins concluded that capillary SDS-gel electrophoresis was a powerful microanalytical method for protein separation by size, confirming its performance parity with traditional slab gel electrophoresis [94].
Table 2: Analytical Performance Metrics for a Monoclonal Antibody Analysis
| Performance Metric | SDS-PAGE (Typical) | Single Capillary CE-SDS | Multi-Capillary CE-SDS |
|---|---|---|---|
| Migration Time Reproducibility (RSD) | Variable, user-dependent | ~0.83% RSD [93] | ~1.1% RSD [93] |
| Peak Area Reproducibility (RSD) | Variable, user-dependent | ~0.54% RSD [93] | ~0.85% RSD [93] |
| Limit of Detection (LOD) | Microgram range | ~2.4 μg/mL (UV) [93] | Comparable to single capillary [93] |
| Resolution (Rs) between ng-HC and HC | Application-dependent | 1.391 [93] | 1.425 [93] |
| Quantitation Dynamic Range | ~1.5 orders of magnitude | 4 orders of magnitude [93] | 4 orders of magnitude [93] |
Essential Research Reagents and Materials
The execution of both SDS-PAGE and CE-SDS requires specific reagents and consumables. The following table details the key components for each technique.
Table 3: Key Research Reagent Solutions for SDS-PAGE and Capillary Electrophoresis
| Item | Function/Description | Example Components |
|---|---|---|
| SDS-PAGE Reagents | ||
| Acrylamide/Bis-Acrylamide Mix | Forms the cross-linked polyacrylamide gel matrix that acts as a molecular sieve [92]. | 30% Acrylamide/Bis solution (29:1 or 37.5:1 ratio) |
| Polymerization Catalysts | Initiate and catalyze the free-radical polymerization of the gel. | Ammonium Persulfate (APS) and TEMED [92] [3] |
| SDS-PAGE Buffers | Provide the conductive medium and control pH for electrophoresis. | Tris-HCl buffers (pH 6.8 for stacking gel, pH 8.8 for separating gel), Tris-Glycine-SDS running buffer [92] [3] |
| Sample Buffer | Denatures proteins and provides charge for loading. | Laemmli Buffer: Contains SDS, glycerol, bromophenol blue, Tris-HCl, and a reducing agent (e.g., β-mercaptoethanol or DTT) [92] [3] |
| Protein Stains | Visualize separated protein bands post-electrophoresis. | Coomassie Brilliant Blue, Silver Stain, fluorescent dyes [80] [92] |
| Capillary Electrophoresis Reagents | ||
| SDS-MW Analysis Kit | Optimized, kit-based reagents for reproducible CE-SDS analysis. | Includes SDS-MW gel buffer, sample buffer, and internal standards [93]. |
| Bare Fused Silica Capillary | The conduit for separation. Typical dimensions: 50 μm internal diameter, 30 cm total length (20 cm effective length) [93]. | Various internal coatings available to minimize protein adsorption. |
| Internal Standard | Used to normalize migration times and improve quantitative accuracy. | A low-molecular-weight protein (e.g., 10 kDa peptide) added to all samples [93]. |
| Capillary Conditioning Solutions | Maintain capillary performance and reproducibility between runs. | 0.1 M Sodium Hydroxide (NaOH), 0.1 M Hydrochloric Acid (HCl), deionized water [93]. |
Application Protocols in Research and Development
Protocol: SDS-PAGE for Protein Purity Assessment
This protocol is adapted from standard laboratory procedures for a mini-gel format [92] [3].
Gel Preparation: Assemble glass plates with spacers. For a 10% separating gel, mix 3.3 mL of 30% acrylamide/bis mix, 2.5 mL of 1.5 M Tris-HCl (pH 8.8), 100 μL of 10% SDS, and 3.9 mL deionized water. Degas briefly. Add 50 μL of 10% ammonium persulfate (APS) and 5 μL of TEMED, then pour immediately. Overlay with isopropanol and allow to polymerize for 20-30 minutes. Pour off isopropanol. For the stacking gel, mix 0.83 mL of 30% acrylamide/bis, 0.63 mL of 1.0 M Tris-HCl (pH 6.8), 50 μL of 10% SDS, and 3.4 mL water. Degas, add 25 μL of 10% APS and 5 μL of TEMED, pour on top of the separating gel, insert a comb, and polymerize for 15-20 minutes.
Sample Preparation: Dilute protein samples in Laemmli sample buffer (e.g., 1:1 ratio) containing 2% SDS and 5% β-mercaptoethanol. Heat denature at 95°C for 5 minutes, then cool on ice. Centrifuge briefly to collect condensation.
Electrophoresis: Mount the gel in the electrophoresis chamber and fill with Tris-glycine-SDS running buffer. Load 20-50 μg of protein per well alongside a pre-stained protein ladder. Run at 80 V until the dye front enters the separating gel, then increase to 120 V until the dye front reaches the bottom of the gel (~60-90 minutes total).
Post-Run Staining & Analysis: Carefully disassemble the gel and stain with Coomassie Blue (1-2 hours) or a more sensitive silver stain. Destain until background is clear and protein bands are visible. Image the gel using a documentation system and analyze band patterns and intensities using densitometry software.
Protocol: Automated CE-SDS for Biotherapeutic Analysis (Reduced Monoclonal Antibody)
This protocol is based on methods using the SCIEX BioPhase 8800 system or similar instruments [93].
Sample Preparation: Dilute the monoclonal antibody sample to ~1-2 mg/mL in SDS-MW sample buffer. Add a reducing agent (e.g., 50 μL of 2-mercaptoethanol per 950 μL of sample) and the provided 10 kDa internal standard (e.g., 20 μL). Mix thoroughly and incubate at 70°C for 10 minutes. Cool to room temperature and transfer to instrument vials.
Instrument Setup: Install the multi-capillary cartridge (e.g., 8 x 30 cm capillaries). Prime the system with SDS-MW gel buffer. Set the instrument method parameters, which typically include:
- Capillary Conditioning: Rinse with 0.1 M NaOH (3 min), 0.1 M HCl (1 min), water (1 min), and SDS-MW gel buffer (10 min).
- Injection: Electrokinetic injection at 5 kV for 20 seconds.
- Separation: 15 kV in reversed polarity mode with the anode at the detection side.
- Detection: UV absorbance at 220 nm.
Automated Execution: Load the sample plate into the autosampler and start the sequence. The instrument automatically performs all steps—conditioning, injection, separation, and detection—for each sample in the queue. Throughput is multiplied by the number of parallel capillaries.
Data Analysis: The software automatically generates electropherograms, aligns peaks using the internal standard, and calculates relative peak areas for quantitation of fragments (e.g., light chain, heavy chain, non-glycosylated heavy chain). The resolution between critical pairs is automatically calculated.
Figure 2: Universal Sample Preparation Core. Both SDS-PAGE and CE-SDS begin with the critical step of denaturing proteins with SDS and a reducing agent under heat to create uniformly charged complexes.
The choice between SDS-PAGE and capillary electrophoresis for protein separation is fundamentally dictated by the application's requirements for throughput, quantification, and automation. SDS-PAGE remains an invaluable, cost-effective tool for laboratories requiring a qualitative overview of protein composition, for educational purposes, or for applications like western blotting where gel-based transfer is necessary. Its simplicity and visual output are key strengths. However, for modern drug development and research environments where high throughput, superior quantitative precision, and full automation are paramount, capillary electrophoresis is the unequivocally superior technology. The ability of multi-capillary CE systems to provide rapid, reproducible, and quantitative analysis of dozens of samples with minimal user intervention makes it an indispensable platform for accelerating biotherapeutic characterization and streamlining development workflows. As the biopharmaceutical industry continues to advance, the role of automated capillary electrophoresis is set to expand, solidifying its position as the modern successor to traditional slab gel electrophoresis for analytical protein separation.
Sodium Dodecyl Sulfate-Polyacrylamide Gel Electrophoresis (SDS-PAGE) is a foundational technique in biochemistry for separating proteins based on their molecular weight. Its principle relies on the fact that SDS, an anionic detergent, denatures proteins and confers upon them a uniform negative charge, thereby negating the influence of their intrinsic charge or three-dimensional structure. When an electric field is applied, these SDS-coated proteins migrate through a polyacrylamide gel matrix, with smaller proteins moving faster than larger ones [9] [24] [3]. Within the context of broader research on protein separation, SDS-PAGE is seldom an end point; rather, it serves as a critical preparatory step for more detailed analyses. Two of the most powerful downstream applications are immunodetection (Western blotting) and mass spectrometry (MS). These integrations allow researchers to move beyond simple separation to the specific identification, quantification, and detailed characterization of proteins, which is indispensable for modern biological research and drug development [9] [96] [97]. This guide provides an in-depth technical overview of the methodologies for seamlessly coupling SDS-PAGE with these advanced analytical techniques.
Integration with Mass Spectrometry
The coupling of SDS-PAGE with mass spectrometry, often referred to as GeLC-MS, is a powerful workflow for in-depth proteomic analysis. It leverages the high-resolution separation capability of SDS-PAGE to fractionate complex protein mixtures before subjecting them to the sensitive identification and characterization power of MS [96].
Workflow and Experimental Protocol
The standard GeLC-MS workflow involves separating the protein sample via SDS-PAGE, followed by in-gel processing and subsequent analysis by mass spectrometry. Table 1 summarizes the key steps from separation to MS data acquisition.
Table 1: Key Steps in the GeLC-MS Workflow
| Step | Description | Key Considerations |
|---|---|---|
| 1. SDS-PAGE Separation | Proteins are separated by molecular weight on a polyacrylamide gel. | Use a wide well for a single band or multiple wells for a complex mixture. A protein ladder is essential for orientation [96]. |
| 2. Protein Visualization & Excision | The gel is stained (e.g., with Coomassie Brilliant Blue) to visualize protein bands. Bands of interest are excised with a clean scalpel. | Use reversible stains like CBB; avoid fixatives that cross-link proteins. Minimize gel volume during excision [96]. |
| 3. In-Gel Digestion | Proteins within the gel pieces are subjected to enzymatic digestion (typically with trypsin) to produce peptides. | Steps include destaining, reduction/alkylation of disulfide bonds, and overnight digestion [96]. |
| 4. Peptide Extraction | The resulting peptides are extracted from the gel matrix into a solution. | This is a critical step for yield. Extraction efficiency can be enhanced with specific buffers [96]. |
| 5. Mass Spectrometry Analysis | The extracted peptides are analyzed by LC-MS/MS (e.g., bottom-up proteomics). | Can also be coupled with top-down MS for intact protein analysis after specific extraction [96] [98]. |
A major historical challenge for MS integration has been the efficient recovery of intact proteins or peptides from the polyacrylamide gel matrix. Traditional passive extraction and electroelution methods often suffered from low recovery rates and long processing times [96]. A significant breakthrough, PEPPI-MS (Passively Eluting Proteins from Polyacrylamide Gels as Intact species for MS), has been developed to overcome this. This method uses a solution containing Coomassie Brilliant Blue as an extraction enhancer, allowing for high-efficiency protein recovery (mean of 68% for proteins <100 kDa) from a wide molecular weight range after just 10 minutes of shaking [96]. The protocol is as follows:
- After electrophoresis, stain the gel with an aqueous solution of Coomassie Brilliant Blue (CBB).
- Excise the protein band of interest and place it in a disposable plastic homogenizer.
- Thoroughly homogenize the gel piece with a pestle to increase the surface area.
- Add an extraction solution (0.05% SDS / 100 mM ammonium bicarbonate) and shake for 10 minutes.
- The proteins, along with CBB, are passively eluted into the solution for subsequent MS analysis [96].
This method has enabled the effective application of top-down proteomics, where intact proteins are analyzed, providing comprehensive information on proteoforms and post-translational modifications [96] [98].
Applications and Considerations
The SDS-PAGE/MS integration is particularly valuable for identifying unknown proteins in a complex mixture, confirming protein purity and identity, and characterizing post-translational modifications. When analyzing small proteins or microproteins (e.g., < 30 kDa), specific considerations must be taken. Tricine-SDS-PAGE is often recommended over traditional glycine-based systems for better resolution of lower molecular weight proteins [9] [3]. Furthermore, MS detection of these small proteins can be challenging due to depletion during sample preparation. Top-down proteomics and targeted MS methods like Parallel Reaction Monitoring (PRM) have shown advantages for their identification and quantitation [98].
Integration with Immunodetection (Western Blotting)
Western blotting, or immunoblotting, is the primary method for detecting a specific protein within a complex sample separated by SDS-PAGE. It combines the resolving power of SDS-PAGE with the specificity of antibody-antigen interactions [97].
Workflow and Experimental Protocol
The Western blot workflow begins after SDS-PAGE separation and involves transferring the proteins to a solid membrane, followed by a series of incubations with antibodies to visualize the protein of interest. Table 2 outlines the critical steps and their functions.
Table 2: Key Steps in the Western Blot Workflow Post-SDS-PAGE
| Step | Description | Function & Key Reagents |
|---|---|---|
| 1. Protein Transfer | Proteins are electrophoretically transferred from the gel onto a membrane (e.g., nitrocellulose or PVDF). | Creates an accessible, immobilized protein replica. Transfer buffer (Tris-glycine with methanol) is typically used [97]. |
| 2. Membrane Blocking | The membrane is incubated with a blocking solution (e.g., 5% non-fat dry milk or BSA in TBST). | Prevents non-specific binding of antibodies to the membrane [97]. |
| 3. Primary Antibody Incubation | The membrane is incubated with a primary antibody specific to the target protein. | Provides specificity. Antibody is diluted in blocking buffer or BSA and incubated for 1 hour to overnight [97]. |
| 4. Secondary Antibody Incubation | The membrane is incubated with an enzyme-conjugated secondary antibody (e.g., HRP-conjugated) that recognizes the primary antibody. | Provides signal amplification and enables detection. Also diluted in blocking buffer [97]. |
| 5. Detection | A substrate is added that produces a detectable signal (e.g., chemiluminescent) in the presence of the enzyme. | Visualizes the location and approximate amount of the target protein [97]. |
A critical pre-analysis step is sample preparation. To obtain meaningful results, particularly for low-abundance proteins or post-translational modification studies, the sample must be prepared correctly to preserve the target protein and its modifications.
- Lysis Buffer Choice: The formulation depends on the subcellular location of the target protein and the nature of the antibody's epitope. RIPA buffer is common for whole cell and nuclear extracts, while NP-40 or Triton X-100 buffers are suitable for cytoplasmic proteins [97].
- Inhibitors: Protease and phosphatase inhibitors must be added to the lysis buffer to prevent protein degradation and dephosphorylation during lysis [97].
- Protein Concentration Determination: After clearing the lysate of debris, the total protein concentration must be determined using an assay like BCA or Bradford to ensure equal loading across gel wells [97].
- Sample Buffer Preparation: The protein sample is diluted into a sample buffer (e.g., Laemmli buffer) containing SDS, glycerol, a tracking dye (bromophenol blue), and a reducing agent like DTT or β-mercaptoethanol to break disulfide bonds [97] [3].
Applications and Considerations
Western blotting is indispensable for determining the presence, relative abundance, size, and modifications (like glycosylation or phosphorylation) of a specific protein. It is widely used in diagnostics, drug development to assess target engagement, and basic research to study protein expression under different conditions [97]. For detecting low-abundance proteins, such as many G-protein coupled receptors (GPCRs), enrichment strategies prior to SDS-PAGE may be necessary. These include immunoprecipitation or using Wheat Germ Agglutinin (WGA) beads to pull down glycosylated proteins, thereby increasing the effective concentration of the target [97].
The Scientist's Toolkit: Essential Reagents and Materials
Successful integration of SDS-PAGE with downstream applications relies on a suite of reliable reagents and materials. Table 3 details key solutions and their roles in the workflow.
Table 3: Essential Research Reagent Solutions for Integrated SDS-PAGE Workflows
| Reagent Solution | Function | Key Components & Notes |
|---|---|---|
| Laemmli Sample Buffer | Denatures proteins and provides negative charge for electrophoresis. | Tris-HCl, SDS, Glycerol, Bromophenol Blue, and a reducing agent (DTT or β-mercaptoethanol) [97] [99] [3]. |
| Polyacrylamide Gel | Acts as a molecular sieve to separate proteins by size. | Acrylamide-bisacrylamide mixture, polymerized by APS and TEMED. Gradient gels (e.g., 4-12%) offer a wider separation range [24] [3]. |
| Electrophoresis Running Buffer | Conducts current and maintains pH during separation. | Tris, Glycine, SDS, pH ~8.3. Glycine's charge state is key to the discontinuous buffer system [99] [3]. |
| Transfer Buffer | Facilitates protein movement from gel to membrane. | Tris, Glycine, Methanol. Methanol helps proteins bind to the membrane [97]. |
| Blocking Buffer | Prevents non-specific antibody binding. | 5% Non-fat dry milk or BSA in TBST (Tris-Buffered Saline with Tween-20) [97]. |
| PEPPI-MS Extraction Buffer | Efficiently recovers intact proteins from gel pieces for MS. | 0.05% SDS, 100 mM Ammonium Bicarbonate, with Coomassie Brilliant Blue as an extraction enhancer [96]. |
| Protease/Phosphatase Inhibitors | Preserves protein integrity and modifications during lysis. | Cocktails including PMSF, Aprotinin, EDTA, Sodium Orthovanadate, etc. [97]. |
SDS-PAGE remains a cornerstone of protein analysis, but its true power is unlocked when integrated with sophisticated downstream techniques like mass spectrometry and immunodetection. The GeLC-MS workflow provides a robust platform for the unbiased identification and deep characterization of proteins, including their proteoforms and complex compositions. Conversely, Western blotting offers a highly specific and accessible method for confirming the identity, size, and relative abundance of a target protein. As proteomic technologies advance, the synergy between SDS-PAGE and these analytical methods continues to be a critical driver in biological discovery and the development of novel therapeutics. The choice between these integrated pathways is guided by the research objective: discovery-based profiling demands MS, while target-specific validation calls for immunodetection.
Emerging Variations and Technological Advancements in Protein Electrophoresis
Protein electrophoresis stands as a cornerstone technique in biochemistry, molecular biology, and biopharmaceutical development for analyzing complex protein mixtures. For decades, SDS-PAGE (Sodium Dodecyl Sulfate-Polyacrylamide Gel Electrophoresis) has served as the gold standard method, enabling researchers to separate proteins based primarily on their molecular weight [6] [7]. This technique's enduring relevance stems from its robustness, relative simplicity, and adaptability across diverse scientific applications from basic research to clinical diagnostics.
The core principle of SDS-PAGE involves leveraging an electric field to drive protein migration through a polyacrylamide gel matrix, which acts as a molecular sieve [100]. The critical innovation that enables separation by molecular weight lies in the use of SDS (Sodium Dodecyl Sulfate), a denaturing detergent that confers a uniform negative charge density to all proteins, effectively masking their intrinsic electrical charges [100] [3]. This ensures that separation occurs primarily based on polypeptide chain length rather than native charge or structural features [2]. Recent technological advancements have transformed this foundational technique, enhancing its precision, efficiency, and applicability while introducing innovative variations that address longstanding limitations.
Core Principles of SDS-PAGE: Mechanism of Protein Separation
The Role of SDS in Protein Denaturation and Charge Uniformity
The fundamental mechanism enabling molecular weight-based separation in SDS-PAGE centers on the action of SDS. This anionic detergent binds quantitatively to proteins at an approximate ratio of 1.4 grams of SDS per 1 gram of protein [3] [24]. This extensive binding serves two critical functions: First, SDS effectively disrupts nearly all non-covalent interactions—including hydrogen bonds, hydrophobic interactions, and ionic bonds—that maintain protein secondary and tertiary structures [100] [24]. This denaturation process unfolds proteins into linear polypeptide chains, eliminating variations in shape that could otherwise affect migration through the gel matrix.
Second, the dense, uniform coating of negatively charged SDS molecules confers upon all proteins a consistent negative charge-to-mass ratio [100] [3]. This charge uniformity ensures that when an electric field is applied, all proteins migrate exclusively toward the positive anode (cathode), with molecular size becoming the primary determinant of migration rate [100]. The successful elimination of charge and structural influences allows researchers to estimate protein molecular weights with approximately ±10% accuracy when appropriate standards are employed [3].
Polyacrylamide Gel as a Molecular Sieve
The polyacrylamide gel matrix creates a three-dimensional network with pore sizes determined by the concentrations of acrylamide monomer and the cross-linking agent N,N'-methylenebisacrylamide (Bis) [100] [24]. During electrophoresis, this network functions as a molecular sieve, selectively retarding the migration of larger proteins while permitting smaller polypeptides to navigate the pores more rapidly [2]. The gel's porosity can be precisely controlled by adjusting the acrylamide concentration, with higher percentages creating smaller pores optimal for resolving lower molecular weight proteins [24].
Table 1: Polyacrylamide Gel Concentrations for Optimal Protein Separation
| Acrylamide Concentration (%) | Effective Separation Range (kDa) | Primary Applications |
|---|---|---|
| 6-8% | 50-250 | High molecular weight proteins |
| 10-12% | 15-100 | Standard separation range |
| 12-15% | 5-60 | Low to medium molecular weight proteins |
| 4-20% Gradient | 10-300 | Broad range separation |
Discontinuous Buffer System for Enhanced Resolution
Traditional SDS-PAGE employs a discontinuous buffer system that significantly enhances separation resolution compared to continuous systems [100] [3]. This system utilizes two distinct gel regions with different pore sizes and pH environments:
Stacking Gel (pH ~6.8): The upper portion features larger pores and lower acrylamide concentration (typically ~4%) [100]. In this mildly acidic environment, glycine ions from the running buffer exist predominantly in zwitterionic form with minimal net migration mobility. This creates a stacking effect where proteins concentrate into extremely narrow zones before entering the separating gel [3] [24].
Separating/Resolving Gel (pH ~8.8): The lower portion contains higher acrylamide concentration (typically 8-15%) with smaller pores [100]. Upon reaching this alkaline environment, glycine ions become predominantly negatively charged and migrate rapidly ahead of the protein stack. Proteins then separate according to size as they migrate through the restrictive gel matrix [3] [24].
This discontinuous system enables the application of samples in relatively large volumes while maintaining high resolution, as proteins are concentrated into sharp bands before the actual separation process begins.
Critical Methodological Variations and Protocol Optimizations
Reducing versus Non-Reducing SDS-PAGE
A fundamental methodological variation in SDS-PAGE involves the inclusion or exclusion of reducing agents, which provides distinct analytical information:
Reducing SDS-PAGE: Incorporates reducing agents such as β-mercaptoethanol (BME), dithiothreitol (DTT), or dithioerythritol (DTE) at concentrations typically ranging from 10-100 mM [100] [3] [9]. These compounds break disulfide bonds that covalently link polypeptide chains, effectively dissociating protein complexes into their constituent subunits [100] [9]. This approach is essential for determining the molecular weights of individual subunits and analyzing proteins with disulfide-stabilized quaternary structures.
Non-Reducing SDS-PAGE: Omits reducing agents, thereby preserving disulfide-linked complexes [9]. This variation allows researchers to assess whether proteins form covalently linked multimers and analyze native disulfide bonding patterns. The migration patterns observed under non-reducing conditions typically differ significantly from reducing conditions, providing complementary structural information.
Buffer System Variations for Specific Applications
While the Tris-glycine buffer system remains most prevalent, alternative formulations have been developed to address specific separation challenges:
Tris-Tricine System: Specifically optimized for superior resolution of low molecular weight proteins and peptides (1-30 kDa) [3] [9]. This system overcomes the limitation of traditional Tris-glycine systems, which poorly resolve polypeptides below 15 kDa, making it invaluable for peptide analysis and small protein characterization.
Tris-Acetate System: Utilizes larger acetate ions that migrate more slowly than glycine, creating higher voltage gradients that enhance the separation of larger protein complexes (up to 400 kDa) [101]. This system is particularly valuable for analyzing membrane proteins and macromolecular assemblies.
Bis-Tris System: Employed in many commercial precast gels due to its superior chemical stability and reduced gel polymerization artifacts [3]. The near-neutral pH (6.4-7.2) minimizes polyacrylamide gel hydrolysis, extending shelf life while reducing modifications to cysteine residues in proteins [3].
Table 2: SDS-PAGE Buffer Systems and Their Applications
| Buffer System | Optimal Separation Range | Key Advantages | Common Applications |
|---|---|---|---|
| Tris-Glycine | 15-250 kDa | Well-established, versatile | General protein analysis, molecular weight estimation |
| Tris-Tricine | 1-100 kDa | Superior low MW resolution | Peptide analysis, small proteins, Western blotting |
| Tris-Acetate | 10-400 kDa | Enhanced large protein separation | Membrane proteins, protein complexes |
| Bis-Tris | 10-260 kDa | Extended shelf life, minimal artifacts | Precast gels, long-term studies |
Gradient Gels and Specialized Staining Techniques
Gradient gels represent another significant methodological advancement, featuring a continuous increase in acrylamide concentration (typically from 4-20%) across the gel length [3]. This creates progressively smaller pores that sharpen protein bands during migration, resulting in superior resolution across a broader molecular weight range compared to uniform concentration gels [3]. Gradient gels are particularly valuable when analyzing complex protein mixtures with diverse molecular sizes, as they eliminate the need to run multiple gels at different concentrations.
Following electrophoresis, detection methods vary in sensitivity and requirements:
- Coomassie Brilliant Blue: Standard staining providing detection in the microgram range [3]
- Silver Staining: 10-100 times more sensitive than Coomassie, detecting nanogram quantities [3]
- Fluorescent Stains: Offer broad linear dynamic ranges ideal for quantification
- Western Blotting: Enables specific antigen detection after electrophoretic transfer to membranes [3] [24]
Technological Advancements: Automation and Miniaturization
Capillary Electrophoresis-SDS (CE-SDS)
The most significant technological evolution in protein electrophoresis emerges from the development of capillary electrophoresis systems that automate and streamline the SDS-PAGE process [6]. In CE-SDS, separation occurs within narrow-bore capillaries (internal diameters of 3-75 μm) filled with separation matrix, eliminating the need for traditional gel casting [6]. This automated format provides substantial advantages:
- Enhanced Reproducibility: Capillary systems eliminate gel-to-gel variability associated with manual casting and staining procedures [6]
- Quantitative Precision: Integrated detection systems provide accurate peak integration superior to subjective band intensity assessments in gels [6]
- Reduced Analysis Time: Run times are significantly shorter, with high-throughput systems analyzing 96 samples in as little as 5.5 minutes per sample [6]
- Minimal Sample Consumption: Dramatically reduced sample volume requirements [6]
- Automation: Pre-filled capillaries eliminate manual steps including gel casting, staining, and destaining [6]
CE-SDS has gained substantial traction in biopharmaceutical development, where it provides the quantitative precision required for regulatory filings and quality control of therapeutic proteins including monoclonal antibodies, bispecific antibodies, antibody-drug conjugates, and fusion proteins [6].
Microfluidic and Lab-on-a-Chip Platforms
Further miniaturization has emerged through microfluidic electrophoresis platforms that perform separations on chip-based devices [73] [9]. These systems reduce sample volume requirements to microliter levels while accelerating analysis times through shortened separation distances [73]. The integration of multiple processing steps—including sample preparation, separation, and detection—onto single devices creates streamlined workflows particularly valuable for diagnostic applications and high-throughput screening environments [9]. These innovative platforms address efficiency and precision challenges while maintaining the fundamental robustness of traditional SDS-PAGE [9].
Digital Integration and Data Analysis
Modern electrophoresis systems increasingly incorporate advanced digital imaging and analysis software that automatically detect bands, quantify intensity, normalize against internal standards, and generate reports [73] [7]. These digital solutions reduce user bias while facilitating inter-laboratory data comparison, a critical requirement for multi-center studies and global collaborations [73]. The movement toward unified data management frameworks that combine horizontal systems, vertical continuous gels, and capillary electrophoresis represents a significant trend in the field [73].
Essential Reagents and Materials: The Scientist's Toolkit
Successful protein electrophoresis requires precisely formulated reagents and specialized materials. The following table details critical components of the SDS-PAGE workflow and their specific functions:
Table 3: Essential Research Reagents and Materials for SDS-PAGE
| Reagent/Material | Composition/Characteristics | Primary Function | Technical Considerations |
|---|---|---|---|
| SDS (Sodium Dodecyl Sulfate) | Anionic detergent (C12H25NaO4S) | Protein denaturation; uniform negative charge conferral | Critical micelle concentration: 7-10 mM; use above 1 mM for denaturation [3] |
| Acrylamide/Bis-acrylamide | Monomer (29:1 to 37:1 ratio with crosslinker) | Polyacrylamide gel matrix formation | Neurotoxin in monomer form; use precautions until polymerized [100] |
| APS & TEMED | Ammonium persulfate & tetramethylethylenediamine | Polymerization initiators (free radical generation) | TEMED catalyzes APS decomposition; determines gel setting time [100] [3] |
| Tris-based Buffers | Tris-HCl/Tris-glycine at specific pH | Maintain pH and conductivity during electrophoresis | Discontinuous system: stacking gel (pH 6.8), resolving gel (pH 8.8) [100] [3] |
| Reducing Agents | DTT (10-100 mM), β-mercaptoethanol (5%) | Disulfide bond reduction; protein linearization | DTT preferred over BME for lower odor and higher efficiency [3] |
| Protein Molecular Weight Markers | Pre-stained or unstained protein mixtures | Molecular size standards for calibration | Enable molecular weight estimation with ~10% accuracy [3] |
| Tracking Dye | Bromophenol blue in sample buffer | Visualize migration progress | Migrates at ~5 kDa front; stop electrophoresis when reaches bottom [3] [2] |
Application Spectrum Across Scientific Disciplines
The versatility of SDS-PAGE and its technological variations has enabled widespread adoption across diverse scientific fields:
Biopharmaceutical Development and Quality Control
In biopharmaceutical development, SDS-PAGE and CE-SDS provide critical analytical capabilities for therapeutic protein characterization [6] [7]. These techniques are routinely employed to assess protein purity, identify degradation products, monitor post-translational modifications, and verify batch-to-batch consistency [6] [24]. CE-SDS has become particularly entrenched in quality control workflows for biotherapeutics, with many leading companies specifically referencing the method in regulatory filings for commercial products [6]. The quantitative precision and reproducibility of modern capillary electrophoresis systems meet stringent regulatory requirements for product release testing [6].
Food Science and Quality Assessment
In food science, SDS-PAGE serves as a fundamental tool for protein profiling across diverse food products including cereals, pulses, dairy, meats, seafood, and plant-based alternatives [9]. Applications include species authentication, allergen detection, assessment of processing-induced protein modifications, and evaluation of functional properties related to specific protein components [9]. The technique effectively characterizes critical storage proteins including gliadins, glutenins, globulins, and caseins, providing valuable insights for product development and quality assurance [9].
Clinical Diagnostics and Biomarker Discovery
Clinical applications of SDS-PAGE include serum protein analysis for diagnosing various disease states [7]. The technique enables detection of abnormal protein patterns associated with specific pathological conditions, providing diagnostic information for conditions such as monoclonal gammopathies [7]. Combined with Western blotting, SDS-PAGE facilitates biomarker discovery and validation through comparative analysis of protein expression in healthy versus diseased tissues [24].
Academic Research and Protein Characterization
In academic settings, SDS-PAGE remains indispensable for routine protein analysis including expression verification, purity assessment, and molecular weight determination [7] [24]. The technique provides foundational data for studies of protein-protein interactions, post-translational modifications, and structural characterization [24]. Its accessibility and relatively low cost make it particularly valuable for educational purposes and preliminary investigations [7].
Market Landscape and Future Perspectives
Current Market Dynamics and Growth Trajectory
The SDS-PAGE electrophoresis market demonstrates steady growth, with projections indicating a compound annual growth rate (CAGR) of 6.2% from 2025-2032 [102]. This expansion reflects continuing demand across research, clinical, and industrial sectors despite the emergence of alternative technologies. The electrophoresis buffer segment specifically represents a substantial market, projected to reach $94.5 million by 2025 with growth anticipated to continue at 3.2% CAGR through 2033 [101].
Regional analysis reveals concentrated adoption in North America and Europe, where established research infrastructure and robust biotechnology sectors drive market dominance [102] [101]. However, the Asia-Pacific region demonstrates the most rapid growth trajectory, fueled by expanding research capabilities, increasing biotechnology investment, and government-funded proteomic initiatives in countries including China, Japan, and India [102].
Emerging Trends and Future Directions
Several convergent trends shape the future evolution of protein electrophoresis technologies:
Automation and High-Throughput Systems: Increasing demand for streamlined workflows drives development of automated electrophoresis platforms that minimize manual intervention while enhancing reproducibility [73] [7]. These systems particularly appeal to pharmaceutical companies and contract research organizations where processing efficiency and data consistency are paramount.
Miniaturization and Microfluidics: The trend toward lab-on-a-chip technologies continues, reducing reagent consumption and analysis time while maintaining analytical performance [73]. These developments align with broader movements toward greener laboratory practices and resource conservation.
Digital Integration and Artificial Intelligence: Advanced software solutions incorporating machine learning algorithms increasingly support gel image analysis, enabling automatic band detection, background subtraction, and quantitative interpretation with minimal researcher bias [73] [7].
Sustainability Initiatives: Growing environmental awareness encourages development of eco-friendly reagents and reduced waste generation systems [102]. CE-SDS platforms inherently support these initiatives through elimination of staining reagents and reduced plastic consumption compared to traditional gel-based systems [6].
Hybrid Analytical Approaches: Integration of electrophoresis with complementary techniques like mass spectrometry creates comprehensive pipelines for protein characterization [24]. These integrated approaches leverage the separation power of electrophoresis with the identification capabilities of mass analysis, providing more comprehensive protein analysis solutions.
In conclusion, while SDS-PAGE remains a foundational technique in protein science, technological innovations—particularly capillary electrophoresis and microfluidic platforms—increasingly address limitations of traditional methods. These advancements enhance precision, reproducibility, and efficiency while maintaining the fundamental principles that have established protein electrophoresis as an indispensable tool across scientific disciplines. The continuing evolution of these methodologies ensures their relevance in addressing emerging challenges in proteomics, personalized medicine, and biopharmaceutical development.
Conclusion
SDS-PAGE remains an indispensable, robust, and highly versatile technique in the protein researcher's toolkit. Its power lies in its elegant simplicity—using SDS to mask intrinsic protein properties, allowing separation based purely on molecular weight within a polyacrylamide gel matrix. From foundational purity checks and molecular weight estimation to supporting complex analyses like Western blotting and mass spectrometry, SDS-PAGE provides critical data for drug development, diagnostic research, and basic science. As proteomics advances, the principles of SDS-PAGE continue to be integrated into newer, high-throughput platforms, ensuring its relevance. Future directions will likely focus on increased automation, enhanced quantification capabilities, such as online fluorescence imaging, and further miniaturization, solidifying its role as a gold standard for protein analysis in biomedical research.
References
- 1. Protein Electrophoresis Using SDS-PAGE: A Detailed ... [https://www.goldbio.com/blogs/articles/protein-electrophoresis-sds-page-overview?srsltid=AfmBOopu6DcrhCTtM0U1nKgTOw2Qn0xgQ400LrHhLqQVM7wGytMoT1am]
- 2. The principle and method of polyacrylamide gel ... [https://ruo.mbl.co.jp/bio/e/support/method/sds-page.html]
- 3. SDS-PAGE [https://en.wikipedia.org/wiki/SDS-PAGE]
- 4. 13.11: Lab Technique - SDS-PAGE [https://bio.libretexts.org/Courses/West_Los_Angeles_College/Biotechnology/13%3A_Biotechnology_Lab_Protocols/13.11%3A_Lab_Technique_-_SDS-PAGE]
- 5. SDS-PAGE Experiment Protocol [https://microbiosci.creative-biogene.com/sds-page-experiment-protocol.html]
- 6. The Evolution of SDS-Based Protein Separation [https://www.bio-techne.com/resources/blogs/advantages-of-ce-sds]
- 7. What is SDS-PAGE? Uses, How It Works & Top Companies ... [https://www.linkedin.com/pulse/what-sds-page-uses-how-works-top-companies-2025-clearsedge-research-kztwf]
- 8. SDS-PAGE in Food Science: Elevating Protein Insight and ... [https://www.eurofinsus.com/food-testing/resources/sds-page-in-food-science-elevating-protein-insight-and-product-integrity/]
- 9. Deciphering food proteins: The applications of SDS-PAGE ... [https://www.sciencedirect.com/science/article/abs/pii/S2212429225003025]
- 10. Overview of Protein Electrophoresis [https://www.thermofisher.com/us/en/home/life-science/protein-biology/protein-biology-learning-center/protein-biology-resource-library/pierce-protein-methods/overview-electrophoresis.html]
- 11. Native SDS-PAGE: High Resolution Electrophoretic ... [https://pmc.ncbi.nlm.nih.gov/articles/PMC4517606/]
- 12. SDS-PAGE电泳技术的解析与应用 [https://blog.csdn.net/weixin_36288992/article/details/148592534]
- 13. 十二烷基硫酸钠聚丙烯酰胺凝胶电泳 [https://zh.wikipedia.org/zh-hans/%E5%8D%81%E4%BA%8C%E7%83%B7%E5%9F%BA%E7%A1%AB%E9%85%B8%E9%88%89%E8%81%9A%E4%B8%99%E7%83%AF%E9%85%B0%E8%83%BA%E5%87%9D%E8%86%A0%E9%9B%BB%E6%B3%B3]
- 14. SDS-PAGE - 蛋白质电泳 - 欣伯玉生物 [https://www.x-biotech.com/SDS-PAGE?article_id=34]
- 15. Western blotting guide: Part 2, Protein separation by SDS- ... [https://www.jacksonimmuno.com/secondary-antibody-resource/technical-tips/western-blotting-guide-part-2/]
- 16. SDS-PAGE电泳的基础原理和实验步骤 [https://www.detaibio.com/topics/sds-page-technology.html]
- 17. PAGE简介— 基于分子大小的蛋白质分离 [https://www.sigmaaldrich.com/HK/zh/technical-documents/protocol/protein-biology/gel-electrophoresis/sds-page?srsltid=AfmBOooBLlHhQkhHmAOQ-4gCmOPglBYeIxiL7BDpbwT-Ev9Wv8T93b0g]
- 18. The principle and method of polyacrylamide gel ... [https://www.mblbio.com/bio/g/support/method/sds-page.html]
- 19. Protein Electrophoresis Using SDS-PAGE: A Detailed ... [https://www.goldbio.com/blogs/articles/protein-electrophoresis-sds-page-overview?srsltid=AfmBOor5Fdh8uLhk7m44bOrmbPvJf4CdOC5Hme6Fn6mH1f-Nnq-fFkTF]
- 20. Overview of SDS-PAGE [https://www.creative-proteomics.com/resource/overview-of-sds-page.htm]
- 21. SDS & Protein Denaturation: The Ultimate Guide. Read now! [https://askpro.blog/sds-protein-denaturation-guide]
- 22. SDS-PAGE Protocol [https://www.rockland.com/resources/sds-page-protocol/?srsltid=AfmBOopwG8nNXa-3w5veX2lKJxjkE0k93Rlt8u_Ep9vmu9uabifikD28]
- 23. Tips for Optimal SDS-PAGE Separation [https://www.rockland.com/resources/tips-for-optimal-sds-page-separation/?srsltid=AfmBOorx-uVw-Yx5P06cyCvid5jHmjnofO0etcDrMEEW6TeLdqKtFYqz]
- 24. SDS-PAGE: A Cornerstone of Protein Analysis in Modern ... [https://www.metwarebio.com/sds-page-protein-analysis/]
- 25. Electrophoresis, How It... | Technology Networks Polyacrylamide Gel [https://www.technologynetworks.com/analysis/articles/polyacrylamide-gel-electrophoresis-how-it-works-technique-variants-and-its-applications-359100]
- 26. What is Polyacrylamide Gel? [https://rawsource.com/what-is-polyacrylamide-and-polyacrylamide-gel/]
- 27. SDS-PAGE: The science behind all those bubbles [https://www.antibodiesinc.com/pages/sds-page-demystified?srsltid=AfmBOop3LbyTKxuGdKlckMTOIr4IE74454tGWbGNNYliRi5_3uSe6MKS]
- 28. Visualization of proteins in SDS PAGE gels [https://www.qiagen.com/us/knowledge-and-support/knowledge-hub/bench-guide/protein/protein-analysis/visualization-of-proteins-in-sds-page-gels]
- 29. How SDS-PAGE Works: 7 Key Points Every Scientist ... [https://bitesizebio.com/580/how-sds-page-works/]
- 30. SDS-PAGE - Mullins Lab - [https://mullinslab.ucsf.edu/sds-page/]
- 31. Amplified DNA Product Separation for Forensic Analysts [https://nij.ojp.gov/nij-hosted-online-training-courses/amplified-dna-product-separation-forensic-analysts/overview/electrophoresis/buffer-system]
- 32. SDS-PAGE: The science behind all those bubbles [https://www.antibodiesinc.com/pages/sds-page-demystified?srsltid=AfmBOoo-xvKqfZNexqu-NEQN7Upa4wMDe9fO1p4lrxgp69z7FADdzIVv]
- 33. How SDS-PAGE Separates Proteins [https://azurebiosystems.com/blog/how-sds-page-separates-proteins/]
- 34. An Easy SDS-PAGE Gel Recipe & 10-Step Protocol [https://bitesizebio.com/59429/sds-page-gel-recipe/]
- 35. 14.2: Casting SDS-PAGE gels [https://bio.libretexts.org/Bookshelves/Cell_and_Molecular_Biology/Book%3A_Investigations_in_Molecular_Cell_Biology_(O'Connor)/14%3A_SDS-PAGE/14.02%3A_Casting_SDS-PAGE_gels]
- 36. Preparing protein samples for sds-page [https://www.ruf.rice.edu/~bioslabs/studies/sds-page/denature.html]
- 37. SDS-PAGE Protocol [https://www.rockland.com/resources/sds-page-protocol/?srsltid=AfmBOop8F9qUmRFRgiww1MWZveG_StDF3SzxroxAQYY-20WLLaJF2tXB]
- 38. SDS Page Gel Electrophoresis PAGE [https://williams.chemistry.gatech.edu/course_Information/4581/techniques/gel_elect/page_protein.html]
- 39. Novex™ Tris-Glycine SDS Running Buffer (10X) 500 mL [https://www.thermofisher.com/order/catalog/product/LC2675]
- 40. Tracking Dye Used in SDS PAGE - Let's Talk Academy [https://www.letstalkacademy.com/tracking-dye-used-in-sds-page/]
- 41. SDS-PAGE: The science behind all those bubbles [https://www.antibodiesinc.com/pages/sds-page-demystified?srsltid=AfmBOoo5F6K91Gwap0P5jszJUPzRt8CemvNyEEIJq-neaxW0qL-350x3]
- 42. SDS-PAGE Analysis of proteins: Principles, methodology ... [https://deepscienceresearch.com/dsr/catalog/book/107/chapter/407]
- 43. Optimizing SDS-PAGE for Accurate Protein ... [https://zenodo.org/records/14744563]
- 44. SDS-PAGE Optimization for Western Blot [https://www.bosterbio.com/protocol-and-troubleshooting/western-blotting-optimization/sds-page?srsltid=AfmBOor3Fut77iDhS2KAyoib74-IyMVeWwTdHnmBX9QeaT1wBvQQz7WB]
- 45. A Guide to Gradient Gels: The Why's and How's [https://bitesizebio.com/47184/gradient-gels/]
- 46. Western Blot SDS-PAGE [https://www.novusbio.com/support/support-by-application/western-blot-sds-page?srsltid=AfmBOopvaJ58vOLOXvc5mIh2H_EAEx36H0JMiGBYTOZmKOvXdqu1GVX2]
- 47. Introduction to SDS-PAGE - Separation of Proteins Based ... [https://www.sigmaaldrich.com/US/en/technical-documents/protocol/protein-biology/gel-electrophoresis/sds-page?srsltid=AfmBOoqpO7ZsEVtKV7ABlPE7qZVQnlJslIhffPFNIi6I1t5yHdkXKKbh]
- 48. Troubleshooting Sodium Dodecyl Sulfate- Polyacrylamide ... [https://www.hycultbiotech.com/sds-page/troubleshooting/]
- 49. Troubleshooting SDS-PAGE Gel Running Issues [https://www.goldbio.com/blogs/articles/troubleshooting-sds-page-gel-running-issues?srsltid=AfmBOopp6eIXUACShK2rSeT2LYB_40T4INOM1OAvJ6F4dhaU_F8lV4uz]
- 50. Protein Electrophoresis Using SDS-PAGE: A Detailed ... [https://www.goldbio.com/blogs/articles/protein-electrophoresis-sds-page-overview?srsltid=AfmBOoohqlH8L3JdY8ccqqIHdVu0IEkFCvuRPg2QkrY3nPi84vGdFKih]
- 51. SDS-PAGE: The science behind all those bubbles [https://www.antibodiesinc.com/pages/sds-page-demystified?srsltid=AfmBOoruh-4VHwDDICJFMH2LoDZC_1ExEKOmQZ6E8QhYPodt--92Khtm]
- 52. How to Validate Protein Purity Using SDS-PAGE [https://synapse.patsnap.com/article/how-to-validate-protein-purity-using-sds-page]
- 53. : SDS , Protocol & Key Applications Explained PAGE Principle [https://www.vedantu.com/biology/sds-page]
- 54. - SDS - GeeksforGeeks PAGE [https://www.geeksforgeeks.org/biology/sds-page/]
- 55. Multi-attribute monitoring (MAM) methodology for ... [https://www.nature.com/articles/s41598-025-24922-8]
- 56. Unveiling Phosphorylation Modification Using Phos-tag ... [https://pubmed.ncbi.nlm.nih.gov/40853831/]
- 57. Protein Separation Techniques for Accurate... - Creative Proteomics [https://www.creative-proteomics.com/proteinseq/resource/protein-separation-techniques-for-precise-sequencing.htm]
- 58. Protein Electrophoresis Using SDS-PAGE: A Detailed ... [https://www.goldbio.com/blogs/articles/protein-electrophoresis-sds-page-overview?srsltid=AfmBOoo1UtA45i3XbG87gOBTeQ-JMBnzMp5G19xaD4BaBRuhdGkjMYuA]
- 59. SDS-PAGE: The science behind all those bubbles [https://www.antibodiesinc.com/pages/sds-page-demystified?srsltid=AfmBOorcxDkjacWf7wZGCNVxo0H2DUaQ5bXv8Nmzwz12FWCQArjOx5q5]
- 60. Troubleshooting SDS-PAGE Gel Running Issues [https://www.goldbio.com/blogs/articles/troubleshooting-sds-page-gel-running-issues?srsltid=AfmBOopfDSARKSdvoG_oL2RZYAWUVKK6oO1CBc3f6w2gCMfHubq7s2zy]
- 61. Nucleic Acid Gel Electrophoresis Troubleshooting [https://www.thermofisher.com/us/en/home/life-science/cloning/cloning-learning-center/invitrogen-school-of-molecular-biology/na-electrophoresis-education/na-electrophoresis-troubleshooting.html]
- 62. Detergent binding explains anomalous SDS-PAGE ... [https://pmc.ncbi.nlm.nih.gov/articles/PMC2644111/]
- 63. Electrophoresis in western blot [https://www.abcam.com/en-us/technical-resources/guides/western-blot-guide/electrophoresis]
- 64. Simultaneous electrophoretic analysis of proteins of very ... [https://pubmed.ncbi.nlm.nih.gov/17054096/]
- 65. How to choose an acrylamide gel concentration for western ... [https://hellobio.com/how-to-choose-an-acrylamide-gel-concentration-for-western-blot/]
- 66. Comparing SDS-PAGE and CE-SDS for Antibody Purity ... [https://www.bioprocessintl.com/qa-qc/comparing-sds-page-and-ce-sds-for-antibody-purity-analysis]
- 67. SDS-PAGE Optimization for Western Blot [https://www.bosterbio.com/protocol-and-troubleshooting/western-blotting-optimization/sds-page?srsltid=AfmBOoqjg9Efcsro_EwOhbvdlircjIE7MpGAcxQf3XRIYRFvzNk2EJdw]
- 68. Troubleshooting Gel Casting/ Polymerization Issues in ... [https://www.goldbio.com/blogs/articles/troubleshooting-gel-casting-polymerization-issues-in-sds-page?srsltid=AfmBOopoUfmQ4SD-7av-2Fh2zazDVQMMzzquj7v2hY6aIOYOARCx_bOp]
- 69. SDS-PAGE Protocol [https://www.rockland.com/resources/sds-page-protocol/?srsltid=AfmBOor6f13_UxDRJ_bG-UBsjHqSH6evW5FBr_LWoSf_JdzZAAMS2br7]
- 70. SDS Page and Western Blot: Loading and Running the Gel [https://www.bio-techne.com/applications/western-blotting/western-blot-sds-page]
- 71. SDS protein interactions [https://www.sciencedirect.com/science/article/abs/pii/S0301462225001462]
- 72. SDS-PAGE: The science behind all those bubbles [https://www.antibodiesinc.com/pages/sds-page-demystified?srsltid=AfmBOoo4BzChiqGRZKEFn77eVO1dFlbuoCVTQn2snXTSTzaT5kLFVmD5]
- 73. SDS-PAGE Electrophoresis Market Size & Share 2025-2032 [https://www.360iresearch.com/library/intelligence/sds-page-electrophoresis]
- 74. How current, voltage, and power settings affect SDS-PAGE [https://www.biossusa.com/blogs/news/how-current-voltage-and-power-settings-affect-sds-page?srsltid=AfmBOor7fMRhrPyl1PoRsr8stuMiABTwd5d5FyU21YCvhuQc0Qv3VIRo]
- 75. Constant Current or Voltage in SDS-PAGE [https://bitesizebio.com/51744/constant-current-or-voltage-in-sds-page/]
- 76. Troubleshooting SDS-PAGE Gel Running Issues [https://www.goldbio.com/blogs/articles/troubleshooting-sds-page-gel-running-issues?srsltid=AfmBOoqK_YLv6pExvvyBMDUPeiZyvT-qB1w7zenzl9PT9w3IF7SB6tss]
- 77. Separation and analysis of proteins by capillary ... [https://www.sciencedirect.com/science/article/abs/pii/S0003267025007172]
- 78. In-gel refolding allows fluorescence detection of fully ... [https://www.sciencedirect.com/science/article/pii/S0003269725000995]
- 79. SDS-PAGE: The science behind all those bubbles [https://www.antibodiesinc.com/pages/sds-page-demystified?srsltid=AfmBOoq7uO3yqW15Rtv4vZlXJjXZ9jaWLnvSWwavp6b-Kw4POV8d9zlB]
- 80. SDS-PAGE guide: Sample preparation to analysis [https://www.abcam.com/en-us/knowledge-center/western-blot/sds-page-guide]
- 81. An equation to estimate the difference between ... [https://www.nature.com/articles/srep13370]
- 82. A Database of Accurate Electrophoretic Migration Patterns ... [https://www.sciencedirect.com/science/article/pii/S0022283622005605]
- 83. Western Blot: Technique, Theory, and Trouble Shooting [https://pmc.ncbi.nlm.nih.gov/articles/PMC3456489/]
- 84. Western Blotting: Products, Protocols, & Applications [https://www.thermofisher.com/us/en/home/life-science/protein-biology/protein-biology-learning-center/protein-biology-resource-library/pierce-protein-methods/overview-western-blotting.html]
- 85. Application Verification Testing for Western Blot [https://www.thermofisher.com/us/en/home/life-science/antibodies/antibodies-learning-center/antibodies-resource-library/antibody-application-testing-protocols/western-blot-protocol-application-testing.html]
- 86. Western blot protocol for high molecular weight proteins [https://www.abcam.com/en-us/technical-resources/protocols/western-blot-for-high-molecular-weights]
- 87. Western Blotting Protocol [https://www.cellsignal.com/learn-and-support/protocols/protocol-western?srsltid=AfmBOoqZMwbdyp3_0hFyAwIPOkZnDoSESkTvgDVb2GnihqTw7VCTw-K-]
- 88. Molecular weight standards for calibration of gel filtration ... [https://www.sciencedirect.com/science/article/pii/0003269787905707]
- 89. Native Polyacrylamide Gel Electrophoresis - an overview [https://www.sciencedirect.com/topics/medicine-and-dentistry/native-polyacrylamide-gel-electrophoresis]
- 90. Differences between SDS PAGE and Native PAGE [https://www.geeksforgeeks.org/biology/differences-between-sds-page-and-native-page/]
- 91. How Is Native PAGE Different from SDS-PAGE? [https://synapse.patsnap.com/article/how-is-native-page-different-from-sds-page]
- 92. How Does SDS-PAGE Work? A Comprehensive Guide [https://www.metwarebio.com/how-sds-page-works-guide/]
- 93. High throughput multi-capillary SDS gel electrophoresis of ... [https://sciex.com/tech-notes/ce/high-throughput-multi-capillary-sds-gel-electrophoresis-of-prote]
- 94. Comparison of the separation of proteins by sodium ... [https://pubmed.ncbi.nlm.nih.gov/7810868/]
- 95. Automated capillary electrophoresis analyses of dried ... [https://www.sciencedirect.com/science/article/pii/S2772582024000391]
- 96. In-depth structural proteomics integrating mass ... [https://www.frontiersin.org/journals/analytical-science/articles/10.3389/frans.2022.1107183/full]
- 97. Western Blot: The Complete Guide [https://www.antibodies.com/applications/western-blotting]
- 98. Detection and Quantitation of Small Proteins Using Mass ... [https://www.sciencedirect.com/science/article/pii/S1535947625001513]
- 99. SDS-PAGE: The science behind all those bubbles [https://www.antibodiesinc.com/pages/sds-page-demystified?srsltid=AfmBOooMdkQvpDVBVBJm9nq-3hYWd7gTgI3kjllWdhGyg8BRspwxIMqn]
- 100. Protein Electrophoresis Using SDS-PAGE: A Detailed ... [https://www.goldbio.com/blogs/articles/protein-electrophoresis-sds-page-overview?srsltid=AfmBOorAoFsN5fG0CuDIAOQ4QiEarnz8F3W9d0JT3oB7bD8wnZsps_kG]
- 101. SDS-PAGE Electrophoresis Buffer 3.2 CAGR Growth ... [https://www.archivemarketresearch.com/reports/sds-page-electrophoresis-buffer-76652]
- 102. With an anticipated CAGR of 6.2%, the SDS-PAGE ... [https://www.linkedin.com/pulse/anticipated-cagr-62-sds-page-electrophoresis-market-xpopf]