Protein Ladder Migration: A Comprehensive Guide to Denaturing vs. Native Gel Analysis
This article provides a definitive guide for researchers and drug development professionals on the critical differences in protein ladder migration between denaturing (SDS-PAGE) and native gel electrophoresis.
Protein Ladder Migration: A Comprehensive Guide to Denaturing vs. Native Gel Analysis
Abstract
This article provides a definitive guide for researchers and drug development professionals on the critical differences in protein ladder migration between denaturing (SDS-PAGE) and native gel electrophoresis. It covers the foundational principles of each method, their specific applications in experimental design, and practical troubleshooting for common issues like smearing and incorrect band sizing. By offering a direct comparative analysis, the content equips scientists with the knowledge to accurately select the appropriate gel system, interpret protein ladder migration patterns, and validate their protein analysis results, thereby enhancing the reliability of data in downstream biomedical and clinical research.
Core Principles: How Gel Chemistry Dictates Protein Ladder Migration
In the realm of protein biochemistry, polyacrylamide gel electrophoresis (PAGE) serves as a fundamental analytical technique for separating protein mixtures based on their physicochemical properties. Two principal methodologies dominate this field: denaturing SDS-PAGE and native PAGE. These systems employ distinct mechanisms to achieve separation, each offering unique advantages and limitations for specific research applications. The critical distinction lies in their treatment of protein structure—while SDS-PAGE dismantles proteins to their primary structure using the powerful denaturant sodium dodecyl sulfate (SDS), often coupled with reducing agents, native PAGE preserves the intricate three-dimensional architecture and biological activity of proteins [1] [2]. This comprehensive guide examines the molecular mechanisms, experimental parameters, and practical applications of these complementary techniques, with particular focus on the definitive roles of SDS and reducing agents in denaturing gel systems.
The selection between denaturing and native gel systems carries significant implications for protein analysis. Denaturing SDS-PAGE provides unparalleled resolution based primarily on molecular mass, making it indispensable for determining protein purity, subunit composition, and molecular weight [2]. In contrast, native PAGE separates proteins according to their combined charge, size, and shape under non-denaturing conditions, enabling researchers to study functional protein complexes, oligomerization states, and enzymatic activities [1] [3]. Understanding the fundamental principles governing each system is essential for designing appropriate experiments and accurately interpreting results in both basic research and drug development contexts.
Core Principles: Denaturing vs. Native Gel Systems
Mechanism of SDS-PAGE (Denaturing Conditions)
SDS-PAGE operates on the principle of complete protein denaturation to achieve separation primarily by molecular mass. The ionic detergent sodium dodecyl sulfate (SDS) plays the pivotal role in this process by binding uniformly to denatured polypeptides in a constant weight ratio of approximately 1.4 g SDS per 1 g of polypeptide [1]. This uniform SDS coating masks the proteins' intrinsic charges, imparting a relatively consistent negative charge density across all polypeptides. Consequently, the SDS-polypeptide complexes migrate through the polyacrylamide gel matrix strictly according to polypeptide size, with minimal influence from compositional or charge differences [1].
The denaturation process in SDS-PAGE typically involves heating protein samples to 70-100°C in sample buffer containing excess SDS and reducing agents. This heat-denaturation step ensures complete unfolding of protein structures and facilitates thorough SDS binding [1]. The resulting linearized polypeptides then experience a sieving effect as they migrate through the gel matrix under an electric field, with smaller polypeptides moving more rapidly than larger ones. This predictable relationship between migration distance and molecular size enables accurate molecular weight estimation when appropriate standards are included [1] [4].
Diagram: Protein Denaturation and Migration in SDS-PAGE
Mechanism of Native PAGE
In stark contrast to SDS-PAGE, native PAGE maintains proteins in their natural, folded state throughout the separation process. Without denaturants or reducing agents, proteins retain their secondary, tertiary, and quaternary structures, including subunit interactions in multimeric complexes [2]. This preservation of native structure allows separation based on the combined effects of intrinsic charge, hydrodynamic size, and three-dimensional conformation [1].
The migration of native proteins through the gel matrix depends on their net charge at the running buffer pH and the frictional forces they encounter. The gel matrix creates a sieving effect that regulates protein movement according to size and shape, with smaller, more compact proteins migrating faster than larger, bulkier proteins with equivalent charge [1]. This complex interplay of charge and size means that molecular weight determination is less straightforward than in SDS-PAGE, but the preservation of biological activity enables functional assays directly from gel fractions [2].
Table 1: Fundamental Characteristics of Denaturing vs. Native Gel Systems
| Parameter | SDS-PAGE (Denaturing) | Native PAGE |
|---|---|---|
| Protein State | Denatured to primary structure | Native, folded conformation |
| Separation Basis | Primarily molecular mass | Charge, size, and shape |
| Sample Treatment | Heating with SDS ± reducing agents | No denaturation; minimal disruption |
| Detergent | SDS present | No SDS |
| Reducing Agents | Often used (DTT, β-mercaptoethanol) | Not used |
| Molecular Weight Determination | Direct estimation possible | Not reliable |
| Biological Activity | Lost | Preserved |
| Protein Complexes | Dissociated | Maintained |
| Typical Applications | Purity assessment, subunit analysis, western blot | Enzyme activity assays, protein-protein interactions |
The Denaturing System: Components and Mechanisms
Role of SDS in Protein Denaturation
Sodium dodecyl sulfate (SDS) serves as the cornerstone of denaturing gel electrophoresis, performing two critical functions in protein sample preparation. First, SDS acts as a powerful denaturant by wrapping around the polypeptide backbone, disrupting hydrophobic interactions, and effectively unraveling the tertiary and secondary structures of proteins [1]. This denaturation process results in fully unfolded polypeptide chains with minimal residual structure.
Second, SDS provides a uniform negative charge to the denatured polypeptides through its sulfate head groups, which bind to proteins at a consistent ratio regardless of amino acid composition. This SDS coating confers a relatively uniform charge-to-mass ratio across different polypeptides, ensuring that separation occurs primarily according to molecular size rather than intrinsic charge differences [1] [4]. The anionic character of the SDS-protein complexes drives their electrophoretic migration toward the anode when an electric field is applied.
Role of Reducing Agents
While SDS effectively denatures most protein structures, additional agents are often required to completely reduce proteins to their monomeric subunits. Reducing agents such as dithiothreitol (DTT) or 2-mercaptoethanol (β-ME) serve this essential function by breaking disulfide bonds that covalently link cysteine residues within or between polypeptide chains [5].
The distinction between reducing and non-reducing SDS-PAGE lies in the inclusion of these agents. In reducing SDS-PAGE, disulfide-cross-linked subunits are fully dissociated, allowing analysis of individual polypeptide chains [5]. This is particularly important for proteins with complex quaternary structures or multiple subunits connected by disulfide bridges. In contrast, non-reducing SDS-PAGE omits reducing agents, preserving disulfide-linked complexes, which can provide information about protein oligomerization and covalent interactions [5].
Table 2: Key Reagents in Denaturing Gel Electrophoresis
| Reagent | Function | Mechanism of Action | Typical Concentration |
|---|---|---|---|
| SDS (Sodium Dodecyl Sulfate) | Denaturant and charge provider | Binds polypeptide backbone, masks intrinsic charge, unfolds proteins | 1-2% in sample buffer |
| DTT (Dithiothreitol) | Reducing agent | Cleaves disulfide bonds through thiol-disulfide exchange | 10-100 mM |
| 2-Mercaptoethanol | Reducing agent | Reduces disulfide bonds via thiol group | 0.1-1% |
| Tris-HCl Buffer | pH control | Maintains optimal pH for electrophoresis | 50-200 mM, pH 6.8-8.8 |
| Glycerol | Density agent | Increases sample density for gel loading | 5-20% |
| Bromophenol Blue | Tracking dye | Visualizes migration front during electrophoresis | 0.001-0.01% |
Experimental Design and Protocols
Standard SDS-PAGE Protocol
The following protocol outlines the fundamental steps for performing denaturing SDS-PAGE, adapted from established methodologies [1] [5] [4]:
Sample Preparation:
- Combine protein sample with SDS-PAGE sample buffer (typically containing 62.5 mM Tris-HCl pH 6.8, 2% SDS, 10% glycerol, 0.01% bromophenol blue)
- Add fresh reducing agent (50-100 mM DTT or 5% 2-mercaptoethanol)
- Heat denature at 70-100°C for 5-10 minutes
- Centrifuge briefly to collect condensed sample
Gel Preparation:
- Prepare resolving gel solution (e.g., 10% acrylamide for 40-100 kDa proteins)
- Add polymerization catalysts (APS and TEMED)
- Cast gel between glass plates, overlay with water-saturated butanol
- After polymerization, prepare and cast stacking gel (lower acrylamide concentration, typically 4-5%)
- Insert well-forming comb
Electrophoresis:
- Assemble gel in electrophoresis apparatus
- Fill buffer chambers with running buffer (25 mM Tris, 192 mM glycine, 0.1% SDS, pH 8.3)
- Load samples and molecular weight markers (10-50 μg total protein per lane)
- Apply constant voltage (100-150 V for mini-gels) until dye front reaches bottom
- Terminate electrophoresis
Optimal protein separation requires appropriate gel composition selection based on target protein size. Lower percentage acrylamide gels (e.g., 8-10%) provide better resolution for high molecular weight proteins, while higher percentage gels (12-15%) are optimal for smaller proteins [4]. Gradient gels with increasing acrylamide concentration (e.g., 4-20%) offer broad separation ranges for complex mixtures.
Critical Factors Affecting Separation Quality
Several technical factors significantly impact the resolution and accuracy of SDS-PAGE separation:
Gel Composition: The acrylamide-to-bisacrylamide ratio determines gel pore size, directly affecting protein mobility and resolution [1]. Inappropriate acrylamide concentration for the target protein size range can result in poor separation.
Buffer System: The discontinuous Tris-glycine buffer system (stacking gel at pH 6.8, resolving gel at pH 8.8, running buffer at pH 8.3) creates ion fronts that concentrate proteins into sharp bands before entering the resolving gel [1] [4].
Electrophoresis Conditions: Excessive voltage generates heat, causing band distortion ("smiling effect"), while insufficient voltage prolongs runs and increases diffusion-related band broadening [6]. Optimal separation typically occurs at 10-15 volts per cm of gel length.
Sample Integrity: Incomplete denaturation or reduction results in anomalous migration, while protein degradation produces multiple bands or smearing [4]. Fresh reducing agents and proper heating are essential for reproducible results.
Applications and Data Interpretation
Comparative Analysis of Separation Outcomes
The distinct separation mechanisms of denaturing and native gel systems produce characteristically different protein migration patterns with unique interpretive value:
Molecular Weight Determination: SDS-PAGE enables direct molecular weight estimation by comparing protein migration distances to those of standard markers [1]. This relationship follows a logarithmic function, with smaller proteins migrating farther than larger ones. In native PAGE, migration depends on both size and charge, preventing reliable molecular weight determination without additional experimental parameters.
Complexity Analysis: SDS-PAGE reveals the subunit composition of protein complexes, with each polypeptide chain appearing as a distinct band [2]. This enables assessment of sample purity and identification of individual protein components. Native PAGE preserves protein complexes, displaying them as single entities with migration characteristics reflecting their oligomeric state [3].
Western Blotting Compatibility: Denatured proteins from SDS-PAGE gels transfer efficiently to membranes for immunodetection, making SDS-PAGE the preferred method for western blotting [4]. The linearized polypeptides expose epitopes for antibody binding and facilitate uniform transfer. Native proteins from native PAGE may transfer less efficiently and exhibit variable antibody recognition due to conformational epitopes.
Table 3: Applications and Data Interpretation in Different Gel Systems
| Application | SDS-PAGE Approach | Native PAGE Approach | Key Considerations |
|---|---|---|---|
| Molecular Weight Estimation | Direct comparison to standards | Not reliable | SDS-PAGE provides mass of subunits; native PAGE reflects complex size |
| Purity Assessment | Bands represent polypeptide chains | Bands may represent complexes | Contaminants easily identified in SDS-PAGE; co-migrating proteins possible in native PAGE |
| Western Blotting | Standard method; efficient transfer | Possible but challenging | Denaturation in SDS-PAGE exposes linear epitopes |
| Activity Assays | Not possible (proteins denatured) | Direct in-gel activity staining possible | Enzymatic function preserved only in native PAGE |
| Complex Analysis | Identifies subunit composition | Reveals oligomeric states | Reducing vs. non-reducing SDS-PAGE shows disulfide-linked complexes |
| Post-translational Modifications | May cause mobility shifts | Affect charge and/or size | Phosphorylation, glycosylation alter migration differently in each system |
Troubleshooting Common Issues
Several common electrophoretic anomalies provide diagnostic information about experimental conditions:
Smeared Bands: Often result from incomplete denaturation, insufficient reduction, protein overloading, or inappropriate gel percentage [6] [4]. Solution: Ensure fresh reducing agents, adequate heating, and optimal protein loading.
"Smiling" Bands (curved bands): Caused by excessive heat during electrophoresis [6]. Solution: Reduce voltage, implement cooling, or run in a cold room.
Atypical Migration: Post-translational modifications (e.g., glycosylation, phosphorylation) or unusual amino acid composition can alter SDS binding and mobility [7]. Solution: Confirm results with alternative methods like mass spectrometry.
Poor Resolution: Insufficient running time, improper buffer pH, or incorrect gel composition [6]. Solution: Optimize run duration, verify buffer preparation, and select appropriate gel percentage.
Edge Effects: Distorted lanes at gel periphery caused by empty wells [6]. Solution: Load reference samples or buffer in unused wells.
The Scientist's Toolkit: Essential Reagents and Materials
Successful gel electrophoresis requires specific reagents and equipment designed to support the distinct mechanisms of denaturing and native systems. The following research reagent solutions represent essential components for protein separation experiments:
Table 4: Research Reagent Solutions for Gel Electrophoresis
| Reagent/Material | Function | Specific Examples |
|---|---|---|
| Acrylamide/Bis-acrylamide | Gel matrix formation | 30% acrylamide: 0.8% bis-acrylamide for standard gels |
| SDS (Sodium Dodecyl Sulfate) | Protein denaturation and charging | 10-20% stock solution for sample buffer and running buffer |
| Reducing Agents | Disulfide bond reduction | DTT (1M stock), 2-mercaptoethanol (14M stock) |
| Tris-based Buffers | pH maintenance | Tris-HCl for gels (pH 6.8, 8.8), Tris-glycine for running buffer |
| Polymerization Initiators | Gel polymerization | Ammonium persulfate (10% fresh solution), TEMED |
| Protein Molecular Weight Markers | Size calibration | Prestained and unstained standards covering 10-250 kDa range |
| Tracking Dye | Migration monitoring | Bromophenol blue (0.25%) in sample buffer |
| Protein Stains | Visualization | Coomassie Blue, Silver Stain, SYPRO Ruby, SimplyBlue SafeStain |
Denaturing SDS-PAGE and native PAGE represent complementary approaches to protein separation, each with distinctive advantages for specific research applications. The denaturing system, driven by the combined action of SDS and reducing agents, provides unparalleled resolution based primarily on molecular mass, making it indispensable for determining subunit composition, assessing purity, and facilitating immunoblotting techniques. In contrast, native PAGE preserves protein structure and function, enabling the study of protein complexes, oligomeric states, and biological activities under conditions that mimic the cellular environment.
The selection between these systems fundamentally depends on the research objectives: SDS-PAGE delivers precise molecular weight information and simplified banding patterns ideal for analytical applications, while native PAGE maintains structural integrity and biological function essential for physiological studies. For comprehensive protein characterization, researchers often employ both techniques in tandem to obtain complementary data regarding both structural and functional properties. As electrophoretic methodologies continue to evolve alongside advanced detection and analysis technologies, both denaturing and native gel systems remain cornerstone techniques in the molecular biologist's toolkit, providing fundamental insights into protein structure, function, and interactions in both basic research and drug development contexts.
Polyacrylamide gel electrophoresis (PAGE) is a foundational technique in molecular biology for separating protein mixtures, yet the choice between native and denaturing conditions fundamentally dictates the type of information obtained. Native PAGE operates without denaturants to preserve proteins in their biologically active state, maintaining complex quaternary structures, enzymatic activity, and protein-protein interactions [8]. In contrast, denaturing PAGE, typically SDS-PAGE, employs strong detergents and reducing agents to unfold proteins into linear polypeptides, separating them almost exclusively by molecular weight [9]. This guide provides a detailed comparison of these techniques, focusing on their mechanistic differences and practical applications in research and drug development, with special attention to the critical implications for protein ladder migration and interpretation.
Table 1: Core Principles of Native PAGE vs. Denaturing SDS-PAGE
| Feature | Native PAGE | Denaturing SDS-PAGE |
|---|---|---|
| Primary Separation Basis | Size, shape, and intrinsic charge of the native structure [9] | Molecular mass of polypeptide chains [9] |
| Protein Conformation | Native (folded, 3D structure preserved) [8] | Denatured (unfolded, linear chains) [9] |
| Key Reagents | Coomassie G-250 (in some systems), mild detergents [10] [11] | Sodium Dodecyl Sulfate (SDS), DTT or β-mercaptoethanol [9] [5] |
| Treatment of Protein Complexes | Preserves oligomeric states and quaternary structure [3] [9] | Disassembles complexes into individual subunits [3] [12] |
| Biological Activity Post-Electrophoresis | Often retained (enzymatic assays possible) [10] [8] | Destroyed [8] [11] |
Experimental Protocols: A Side-by-Side Comparison
Standard Native PAGE Protocol for Protein Complexes
The following protocol, adapted from studies on epichaperome identification, is designed to preserve high-order protein assemblies [13].
- Sample Preparation: Cells are lysed using a cold, mild non-ionic detergent (e.g., 0.01% NP-40) in a buffer containing 20 mM Tris pH 7.4, 20 mM KCl, and 5 mM MgCl2. Protease and phosphatase inhibitors are essential. Crucially, samples are not boiled and are kept on ice throughout to prevent denaturation [13].
- Gel Chemistry & Buffer Selection: The choice of native gel system depends on the experimental goal. Tris-Glycine systems (pH 8.3-9.5) are traditional and preserve the native net charge of proteins. NativePAGE Bis-Tris systems (pH ~7.5) use Coomassie G-250 dye in the cathode buffer to impart a uniform negative charge, allowing even basic proteins to migrate toward the anode and improving resolution for membrane proteins [10].
- Electrophoresis Conditions: Run pre-cast 3-12% or 4-16% Bis-Tris gradient gels at 4°C to maintain protein stability. Use a constant voltage of 150V for approximately 90 minutes using an appropriate anode and cathode buffer system [13] [10].
- Post-Electrophoresis Analysis: Proteins can be transferred to PVDF (not nitrocellulose) for western blotting [10]. Alternatively, complexes can be recovered via diffusion or electroelution for functional studies or examined via in-gel activity assays [13].
Standard Denaturing SDS-PAGE Protocol
This protocol, fundamental to proteomics, ensures complete protein denaturation for separation by mass.
- Sample Preparation: Mix protein samples with an SDS-based sample buffer (e.g., Laemmli buffer) containing a reducing agent like dithiothreitol (DTT) or β-mercaptoethanol. Heat samples at 70-100°C for 10 minutes to fully denature proteins and break disulfide bonds [9] [5].
- Gel Chemistry & Buffer Selection: Use Tris-Glycine or Bis-Tris gels with SDS incorporated into both the gel and the running buffer. A standard running buffer is 25 mM Tris, 192 mM Glycine, 0.1% SDS [9].
- Electrophoresis Conditions: Load samples onto a polyacrylamide gel (e.g., 12%) with a stacking gel. Run at a constant voltage (e.g., 200V) for 30-45 minutes at room temperature until the dye front reaches the bottom [11].
- Post-Electrophoresis Analysis: Proteins are typically stained (e.g., Coomassie, silver stain) or transferred for western blotting. The migration distance is compared to a denatured protein ladder to estimate molecular weight [9].
Performance and Data Comparison
Quantitative Analysis of Separation Characteristics
The presence or absence of denaturants creates starkly different separation profiles and functional outcomes, as quantified in various studies.
Table 2: Quantitative Performance and Outcome Comparison
| Parameter | Native PAGE | Denaturing SDS-PAGE | Experimental Context |
|---|---|---|---|
| Metal Ion Retention | 98% Zn²⁺ retained | 26% Zn²⁺ retained | Analysis of Zn-proteome after electrophoresis [11] |
| Enzymatic Activity Retention | 7 out of 9 model enzymes active | 0 out of 9 model enzymes active | In-gel activity assay post-electrophoresis [11] |
| Key Resolvable Targets | Protein complexes, oligomers, supercomplexes, active enzymes [3] [14] | Individual subunits, purity, molecular weight [3] [5] | Applicability for different analytical goals |
| Impact on Protein Ladder Migration | Migration depends on mass, charge, and shape; not reliable for mass determination alone [8] | Migration proportional to log(MW); reliable for mass determination [9] | Interpretation of protein standard bands |
Case Study: NSDS-PAGE as an Intermediate Method
Research has explored hybrid methods to balance resolution and native-state preservation. Native SDS-PAGE (NSDS-PAGE) modifies traditional SDS-PAGE by removing EDTA from buffers, drastically reducing SDS concentration (from 0.1% to 0.0375%), and eliminating the sample heating step [11]. This protocol achieves high-resolution separation similar to denaturing SDS-PAGE while allowing 98% of zinc ions to remain bound to metalloproteins and preserving the activity of most enzymes tested [11]. This demonstrates that the denaturants themselves, rather than the electrophoretic process, are primarily responsible for the loss of native structure and function.
The Scientist's Toolkit: Essential Reagent Solutions
Successful experimentation requires careful selection of reagents tailored to the chosen method.
Table 3: Key Research Reagents for Native and Denaturing Electrophoresis
| Reagent / Material | Function | Native PAGE Application | Denaturing SDS-PAGE Application |
|---|---|---|---|
| SDS (Sodium Dodecyl Sulfate) | Ionic detergent that denatures proteins and confers uniform charge. | Absent or minimal (e.g., 0.0375% in NSDS-PAGE) [11] | Present (e.g., 0.1-0.5%) in sample and running buffers [9] |
| Coomassie G-250 Dye | Imparts negative charge to proteins for migration at neutral pH. | Key component in BN-PAGE and NativePAGE Bis-Tris systems [10] [14] | Not used in standard protocols. |
| DTT / β-mercaptoethanol | Reducing agent that breaks disulfide bonds. | Typically omitted to preserve structure. | Essential component for full denaturation [5]. |
| Protease Inhibitor Cocktail | Prevents protein degradation during sample prep. | Critical, as samples are not denatured [13]. | Often used, but less critical due to denaturation. |
| Mild Detergent (e.g., NP-40, DDM) | Solubilizes membranes while preserving protein complexes. | Used in lysis buffer (e.g., 0.01% NP-40) [13]. | Not typically used; SDS is the primary detergent. |
| PVDF Membrane | Substrate for western blotting after electrophoresis. | Recommended for NativePAGE transfers [10]. | Compatible with standard western blotting. |
Application Scenarios and Decision Guide
The choice between native and denaturing gels is dictated by the biological question. The diagram below outlines the decision-making workflow for selecting the appropriate method.
Use Native PAGE when your objective is to study the architecture and function of proteins in their biologically relevant form. This includes identifying specific protein complexes like epichaperomes in disease models [13], analyzing the oligomeric state of a protein, resolving different conformational states (e.g., circular vs. linear DNA) [3], or performing in-gel enzymatic activity assays [14]. It is the preferred method for any application where the preservation of protein-protein interactions or biological function is paramount.
Use Denaturing SDS-PAGE when the goal is to determine the molecular weight of polypeptide chains, establish the purity of a protein sample, analyze complex protein mixtures like cell lysates with high resolution, or prepare samples for downstream techniques like western blotting or protein sequencing [3] [8] [9]. It is the standard workhorse for most analytical and preparative protein biochemistry tasks where functional integrity is not required.
In conclusion, the absence of denaturants in Native PAGE is not merely a technical omission but a fundamental design feature that enables the study of proteins as dynamic, functional macromolecular machines. While SDS-PAGE provides unparalleled resolution for determining molecular weight, Native PAGE and its derivatives offer a unique window into the structural and functional biology that underpins both basic research and drug development efforts.
Protein gel electrophoresis serves as a fundamental technique in molecular biology, biochemistry, and drug development for separating and analyzing proteins. The core principle of this technique involves the migration of charged protein molecules through a gel matrix under the influence of an electrical field [9] [15]. However, the specific mechanism governing this separation varies dramatically depending on whether the experimental conditions preserve or disrupt the native structure of proteins. This creates a critical dichotomy in separation principles: denaturing techniques separate proteins primarily by molecular weight, while native techniques separate proteins based on a combination of size, shape, and intrinsic charge [3] [9].
Understanding this distinction is paramount for researchers interpreting protein ladder migration patterns, as the same protein can migrate to different positions under denaturing versus native conditions. The choice between these systems directly impacts the resolution, sensitivity, and analytical outcomes of experiments, particularly in pharmaceutical development where characterizing protein complexes, enzyme activity, and protein-protein interactions is routine [16] [3]. This guide provides a detailed comparison of these separation mechanisms, supported by experimental data and protocols, to inform method selection for specific research objectives.
Fundamental Principles of Electrophoretic Separation
Core Factors Influencing Protein Mobility
The mobility of a molecule through an electric field depends on several factors: field strength, the net charge on the molecule, its size and shape, the ionic strength of the buffer, and the properties of the matrix through which the molecule migrates (e.g., viscosity, pore size) [9] [15]. The support matrix, such as polyacrylamide or agarose, acts as a porous molecular sieve. Polyacrylamide, with its smaller pore size, is ideal for separating most proteins, while agarose, with larger pores, is suitable for very large protein complexes [9] [15].
The fundamental relationship can be summarized as: mobility is inversely proportional to the size of the molecule and directly proportional to its net charge [15]. The conformation also plays a critical role; globular proteins, with their compact structures, exhibit faster mobility than fibrous proteins of similar molecular weight [15]. The separation mechanism an experimenter chooses—either denaturing or native—determines which of these factors become the primary determinant of mobility.
A Tale of Two Techniques: Denaturing vs. Native Conditions
The following workflow illustrates the fundamental procedural and mechanistic differences between denaturing (SDS-PAGE) and native PAGE, guiding researchers on the critical choice points in experimental design.
Denaturing Gel Electrophoresis: Separation by Molecular Weight
The SDS-PAGE Mechanism
In denaturing gel electrophoresis, specifically SDS-PAGE (Sodium Dodecyl Sulfate - Polyacrylamide Gel Electrophoresis), the ionic detergent SDS plays the pivotal role. When a protein sample is heated (typically between 70-100°C) in the presence of excess SDS and a reducing agent (like β-mercaptoethanol), the protein undergoes complete denaturation [9]. SDS binds to the polypeptide backbone in a constant weight ratio (approximately 1.4 g SDS per 1 g of polypeptide), which masks the protein's intrinsic charge [9]. The reducing agent cleaves disulfide bonds, ensuring the protein is fully dissociated into its subunits [9].
The result is that all SDS-polypeptide complexes adopt a similar rod-like shape and possess a uniform negative charge. This means the charge-to-mass ratio is essentially identical for all proteins. Consequently, when an electric field is applied, separation occurs strictly based on polypeptide size, as the proteins are sieved through the pores of the polyacrylamide gel [9]. Smaller polypeptides migrate more quickly through the gel matrix than larger ones, allowing for molecular weight determination when compared to a protein ladder of known molecular weights [9].
Experimental Protocol for SDS-PAGE
Detailed Methodology for Denaturing SDS-PAGE:
- Sample Preparation: Dilute protein samples in a Laemmli buffer containing SDS, a reducing agent (e.g., DTT or β-mercaptoethanol), and a tracking dye (e.g., bromophenol blue). Heat the samples at 70-100°C for 5-10 minutes to ensure complete denaturation and reduction [9].
- Gel Casting: Polyacrylamide gels are formed by polymerizing acrylamide and bisacrylamide (a cross-linker) in the presence of a catalyst such as ammonium persulfate (APS) and a stabilizer TEMED [9]. A resolving gel (e.g., 10-12% acrylamide) at an alkaline pH (e.g., Tris-HCl, pH 8.8) is poured first and is responsible for separation. A lower-concentration stacking gel (e.g., 4-5% acrylamide) at a lower pH (e.g., Tris-HCl, pH 6.8) is poured on top to concentrate all proteins into a sharp band before they enter the resolving gel, enhancing resolution [9].
- Electrophoresis: Load the denatured samples and a pre-stained protein molecular weight ladder into the wells. Submerge the gel cassette in a running buffer containing Tris, glycine, and SDS. Apply a constant voltage (e.g., 150-200 V) until the tracking dye front reaches the bottom of the gel [9].
- Visualization & Analysis: After electrophoresis, proteins are visualized using stains like Coomassie Brilliant Blue, silver stain, or fluorescent dyes. The distance migrated by sample proteins is compared to the protein ladder to estimate molecular weight [9].
Advantages, Limitations, and Key Data
Table 1: Characteristics of Denaturing SDS-PAGE
| Aspect | Description | Supporting Experimental Data |
|---|---|---|
| Separation Basis | Primarily molecular weight of polypeptide chains [9]. | Mass spectrometry coupled with SDS-PAGE has validated migration patterns for ~10,000 human proteins, confirming MW as the primary factor [7]. |
| Key Reagents | SDS (denaturant), reducing agents (DTT/β-Me), Tris-Glycine buffer [9]. | Consistent migration patterns across five different cell lines demonstrate high reproducibility of this method [7]. |
| Protein State | Denatured, linearized, and reduced; subunits dissociated [3] [9]. | SDS binding in a constant ratio (1.4:1) confirmed through quantitative analysis, ensuring uniform charge [9]. |
| Molecular Weight Resolution | Effective for a broad range, typically from small peptides to large complexes >100 kDa [16]. | Tris-Glycine gels resolve 10-250 kDa; Bis-Tris gels offer a wider range (15-1,000 kDa) with higher resolution [16]. |
| Applications | Molecular weight estimation, purity assessment, Western blotting, protein quantitation [3] [9]. | Critical for antibody validation and reliable Western blot data, as highlighted by databases of reference MWs [7]. |
Native Gel Electrophoresis: Separation by Size, Shape, and Charge
The Native-PAGE Mechanism
In contrast, Native-PAGE (or non-denaturing PAGE) is performed without denaturing agents like SDS. This technique preserves the protein's native, three-dimensional structure, its enzymatic activity, and its interactions within multimeric complexes [3] [9]. Under these conditions, a protein's migration through the gel is a complex function of its inherent net charge, size, and shape [9].
In an alkaline running buffer, most proteins carry a net negative charge and migrate toward the anode. The higher the charge density (more charges per molecular mass), the faster a protein will migrate. Simultaneously, the frictional force of the gel matrix creates a sieving effect, regulating movement according to the protein's size and three-dimensional shape [9]. A small, highly charged, globular protein will migrate rapidly, while a large, less charged, or fibrous protein will migrate slowly. This multi-parameter separation can provide superior resolution for certain applications but does not allow for direct determination of molecular weight without additional controls.
Experimental Protocol for Native-PAGE
Detailed Methodology for Native-PAGE:
- Sample Preparation: Protein samples are mixed with a non-denaturing loading buffer that lacks SDS and reducing agents. The buffer may contain glycerol to aid in well loading and a tracking dye. The sample is typically not heated to prevent denaturation [17].
- Gel Casting: Polyacrylamide gels are cast similarly to SDS-PAGE but without SDS in any of the components. Both the stacking and resolving gels use compatible non-denaturing buffer systems, such as Bis-Tris at neutral pH, which helps maintain protein stability and native state [16].
- Electrophoresis: The running buffer also lacks SDS. The apparatus is often run in a cold room or with a cooling unit to minimize denaturation and proteolysis during the run, as the native structure is more sensitive to heat. The electrical current is applied, and proteins migrate according to their native properties [9].
- Visualization & Analysis: Proteins can be detected using standard staining methods. A key advantage is that enzymatic activity can often be detected after electrophoresis using specific activity stains (zymography). Proteins can also be recovered from native gels in their active form via passive diffusion or electro-elution [9].
Advantages, Limitations, and Key Data
Table 2: Characteristics of Native PAGE
| Aspect | Description | Supporting Experimental Data |
|---|---|---|
| Separation Basis | Net charge, size, and shape of the native structure [9]. | Used to study protein complexes and ligand-binding, where changes in migration indicate altered stability or assembly [17]. |
| Key Reagents | Non-denaturing buffers (e.g., Bis-Tris, pH-neutral), no SDS/reducing agents [16]. | Bis-Tris gels maintain a neutral pH, better preserving the native state of protein complexes compared to alkaline Tris-Glycine [16]. |
| Protein State | Native, folded; multimers, complexes, and enzymatic activity retained [3] [9]. | Semi-native PAGE (with SDS but no heat) separates based on differences in protein structural stability [17]. |
| Applications | Analysis of protein complexes, enzyme activity assays, protein-protein interactions, studying binding events [16] [3]. | Essential for screening protein-transition metal complex interactions while maintaining the integrity of the complex [17]. |
| Key Consideration | pH extremes and heat must be avoided to prevent irreversible protein damage [9]. | Maintaining cool temperatures during the run is critical for preserving native structure and function [9]. |
Direct Comparative Analysis: Denaturing vs. Native PAGE
The following table provides a consolidated, direct comparison of the two techniques, highlighting their performance and suitability for different experimental goals.
Table 3: Direct Comparison of Denaturing (SDS-PAGE) and Native PAGE
| Parameter | Denaturing (SDS-PAGE) | Native PAGE |
|---|---|---|
| Primary Separation Mechanism | Molecular weight of polypeptide subunits [9]. | Net charge, size, and 3D shape of the native protein [9]. |
| Protein State | Denatured, linearized, subunits dissociated [3]. | Native, folded, complexes intact [3]. |
| Key Reagents | SDS, reducing agents, Tris-Glycine/SDS buffer [16] [9]. | Non-denaturing buffers (e.g., Bis-Tris), no SDS [16]. |
| Effect on Activity | Enzymatic activity destroyed [3]. | Enzymatic activity often retained [9]. |
| Molecular Weight Determination | Yes, straightforward via comparison to ladder [9]. | No, not directly possible due to influence of charge and shape. |
| Information on Quaternary Structure | No, complexes are disrupted [9]. | Yes, multimeric state is preserved and can be analyzed [9]. |
| Typical Applications | - MW estimation [9]- Purity assessment [3]- Western blotting [3]- Protein sequencing prep [3] | - Protein-complex analysis [16]- Enzyme activity assays [9]- Protein-protein/ligand interactions [16] [17] |
| Optimal Gel Type | Tris-Glycine (routine), Bis-Tris (high-resolution) [16]. | Bis-Tris (neutral pH), other non-denaturing buffer systems [16]. |
The Scientist's Toolkit: Essential Research Reagent Solutions
Selecting the appropriate reagents is critical for successful electrophoresis. The table below details key materials and their functions, drawing from the compared methodologies.
Table 4: Essential Reagents for Protein Gel Electrophoresis
| Reagent/Category | Function | Specific Examples & Notes |
|---|---|---|
| Gel Matrices | Forms the porous sieve for separation. | Polyacrylamide: Standard for most proteins [9]. Agarose: For very large protein complexes [9]. |
| Gel Chemistry Kits | Pre-mixed solutions for specific needs. | Bis-Tris Gels: High-resolution, neutral pH, superior for native and stable gels [16]. Tris-Glycine Gels: Cost-effective, routine SDS-PAGE, broad MW range [16]. Gradient Gels: Linear or gradient (e.g., 4-20%) for resolving proteins over a wider MW range [16] [9]. |
| Denaturing Agents | Disrupts protein structure, confers uniform charge. | SDS (Sodium Dodecyl Sulfate): Primary denaturant for SDS-PAGE [9]. Urea/DMSO/Glyoxal: Alternative denaturants for nucleic acids or specific applications [3]. |
| Reducing Agents | Cleaves disulfide bonds. | DTT (Dithiothreitol) or β-Mercaptoethanol: Added to sample buffer for complete denaturation [9]. |
| Buffers | Carries current, maintains pH. | Tris-Glycine-SDS: Standard running buffer for denaturing gels [9]. Bis-Tris, Native Buffer Systems: For native PAGE, no SDS [16]. |
| Molecular Weight Standards | Reference for size estimation. | Pre-stained Protein Ladders: Visualize migration during run. Unstained Protein Ladders: Higher accuracy for MW determination post-staining [9]. |
| Visualization Dyes | Detect separated proteins. | Coomassie Brilliant Blue: Standard, moderate sensitivity [16]. Silver Stain: High sensitivity [16]. Fluorescent Stains: High sensitivity, quantitative potential [16]. |
The choice between denaturing and native gel electrophoresis is not a matter of one technique being superior to the other, but rather of selecting the right tool for the specific biological question. SDS-PAGE is the unrivaled method for determining polypeptide molecular weight, assessing sample purity, and preparing for techniques like Western blotting, as it simplifies separation to a single parameter: size [9]. In contrast, Native-PAGE is indispensable when the goal is to understand a protein's functional state, revealing insights into its quaternary structure, complex formation, and enzymatic activity by leveraging the combined effects of size, shape, and native charge on migration [3] [9].
For researchers in drug development and basic science, this comparison underscores that data from one system cannot be directly transposed to the other. The migration of a protein ladder, and indeed any protein sample, is governed by fundamentally different rules in each environment. A comprehensive analysis of an unknown protein, particularly in the context of therapeutic antibody validation or characterizing biomolecular condensates [18], may even require the sequential application of both techniques to build a complete picture of both its composition and its native functional architecture.
Protein function is intrinsically linked to its structure, which is organized into four hierarchical levels. The primary structure is the linear sequence of amino acids, while secondary structure refers to localized folding into patterns such as alpha-helices and beta-sheets. The tertiary structure describes the overall three-dimensional conformation of a single polypeptide chain, and the quaternary structure arises when multiple folded polypeptide chains (subunits) assemble into a multi-subunit complex [19] [20]. Not all proteins possess quaternary structure; however, for those that do, this level of organization is critical for their biological activity, enabling complex functions such as cooperativity (exemplified by hemoglobin) and allosteric regulation [21] [20].
Understanding these structures, particularly the intact quaternary complexes, is essential in biomedical research and drug development. This guide objectively compares two fundamental electrophoretic techniques—denaturing and native gel electrophoresis—for analyzing proteins across these structural levels, providing researchers with data to inform their methodological choices.
Fundamental Principles: Denaturing vs. Native Gel Electrophoresis
Gel electrophoresis separates macromolecules based on their size and charge as they migrate through a gel matrix under an electric field. The choice between denaturing and native conditions profoundly impacts the level of protein structure that can be analyzed.
Denaturing gels, such as SDS-PAGE (Sodium Dodecyl Sulfate-Polyacrylamide Gel Electrophoresis), use the ionic detergent SDS to unfold proteins. SDS coats the polypeptide backbone with a uniform negative charge, overpowering the protein's intrinsic charge, and heat treatment disrupts non-covalent interactions. This process reduces the protein to a linear chain, meaning separation occurs almost exclusively based on molecular mass rather than shape or charge [3] [22]. Recent advancements in SDS capillary gel electrophoresis (SDS-CGE) further optimize this for high-throughput analysis of biopharmaceuticals, with studies highlighting the significant effects of operational parameters like temperature and electric field strength on resolution [22].
In contrast, native gels maintain the protein's higher-order structure during separation. Without denaturing agents, proteins remain in their folded state, retaining their secondary, tertiary, and quaternary structures. Consequently, separation depends on a combination of the protein's intrinsic charge, molecular mass, and overall three-dimensional shape (cross-sectional area) [3]. This technique, including variants like Blue Native (BN)-PAGE and Clear Native (CN)-PAGE, is indispensable for studying functional protein complexes, oligomeric states, and protein-protein interactions [23] [24].
Table 1: Core Principles of Denaturing vs. Native Gel Electrophoresis.
| Feature | Denaturing Gels (e.g., SDS-PAGE) | Native Gels (e.g., BN-/CN-PAGE) |
|---|---|---|
| Sample Condition | Proteins unfolded and linearized | Proteins in folded, native state |
| Key Reagents | SDS, reducing agents (e.g., DTT) | No denaturants; often Coomassie G-250 (BN-PAGE) |
| Separation Basis | Primarily molecular mass | Size, intrinsic charge, and 3D shape |
| Quaternary Structure | Disassembled into subunits | Preserved intact |
| Key Applications | Determining polypeptide molecular weight, purity checks, western blotting | Studying oligomeric state, protein complexes, in-gel enzymatic activity |
Experimental Data and Comparative Analysis
Case Study: Analyzing a Mitochondrial Enzyme Complex
A 2025 study on Medium-chain acyl-CoA dehydrogenase (MCAD) provides a compelling quantitative comparison. MCAD is a mitochondrial homotetramer with a theoretical mass of ~178 kDa for the intact complex [23]. Researchers employed a high-resolution clear native PAGE (hrCN-PAGE) in-gel activity assay to investigate pathogenic variants.
When analyzed under native conditions, the wild-type MCAD showed a major active band migrating between 240 and 480 kDa, consistent with its tetrameric form. A second, less intense active band at a lower molecular mass suggested the presence of an alternative, active oligomeric species. Crucially, the in-gel enzymatic activity demonstrated a linear correlation with the amount of protein loaded, confirming the assay's quantitative nature for the functional tetramer [23].
When the same MCAD variants were analyzed by SDS-PAGE, the monomers of all variants migrated identically, confirming identical polypeptide chain molecular weights. However, this technique was blind to the critical structural differences between the variants [23]. This case underscores that while SDS-PAGE is excellent for analyzing primary structure (sequence), native gels are required to understand the functional quaternary structure.
Comparative Migration Patterns of Protein Ladders
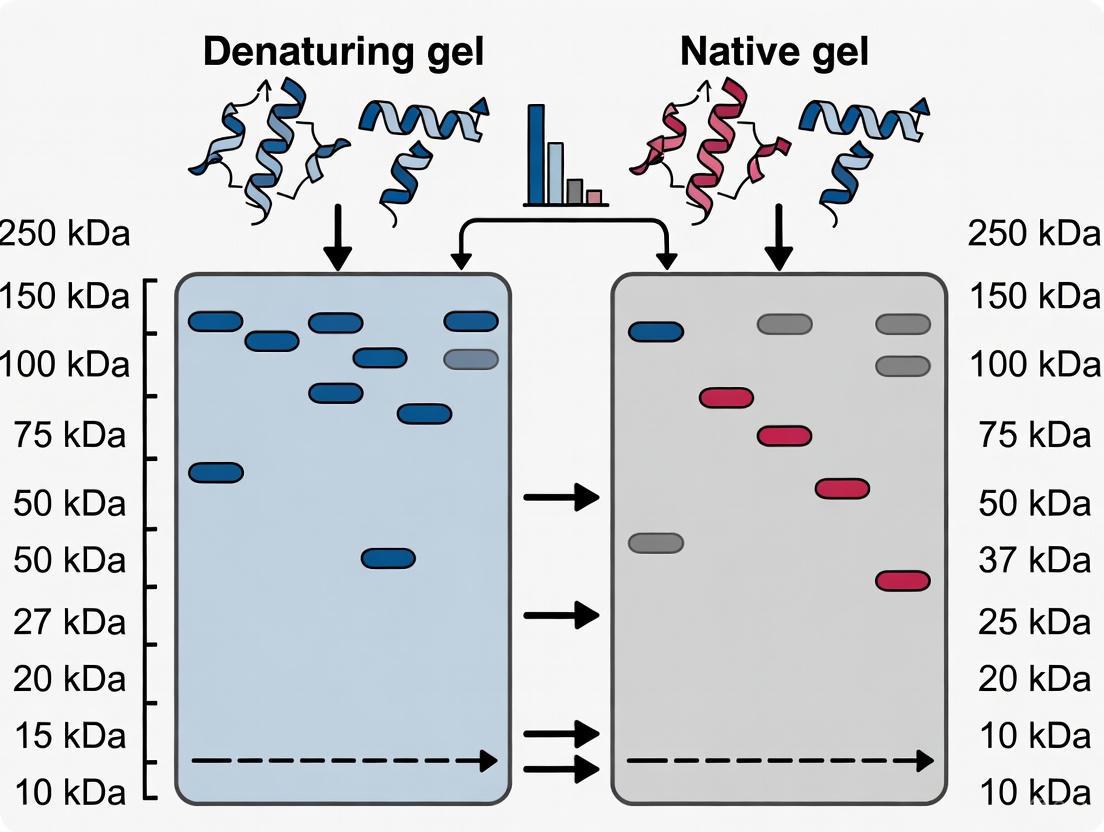
Protein ladders migrate differently under denaturing and native conditions, which must be considered for accurate size interpretation.
Table 2: Comparative Migration of Protein Ladders and Complexes.
| Protein/Complex | Structure & Theoretical Mass | Migration in Denaturing Gel (SDS-PAGE) | Migration in Native Gel | Key Insight |
|---|---|---|---|---|
| MCAD (Wild-Type) | Homotetramer (~178 kDa) | Single band at ~44 kDa (monomer mass) [23] | Major band at 240-480 kDa (intact tetramer) [23] | Native gels preserve the functional oligomeric state. |
| MCAD Variant (R206C) | Disrupted tetramer (same monomer mass) | Single band at ~44 kDa (identical to WT) [23] | Altered migration; shifted band and inactive lower-mass fragments [23] | Reveals structural instability invisible to SDS-PAGE. |
| General Oligomers | Dimers, Trimers, etc. | All dissociate to monomers. Migration reflects monomeric mass. | Migration is a function of mass, charge, and shape, not mass alone [3]. | Calibration requires native protein standards of known oligomeric state. |
Detailed Experimental Protocols
Protocol A: In-Gel Activity Assay for a Quaternary Enzyme Complex
This protocol, adapted from a 2025 study, allows simultaneous assessment of a protein's oligomeric state and enzymatic function [23].
1. Sample Preparation:
- For recombinant proteins: Purify using standard methods (e.g., affinity chromatography). Keep buffers free of denaturing agents.
- For cell lysates: Prepare mitochondrial-enriched fractions via differential centrifugation to concentrate the complex of interest.
2. High-Resolution Clear Native Electrophoresis (hrCN-PAGE):
- Cast a 4-16% gradient polyacrylamide gel to resolve a broad size range of complexes.
- Prepare the anode (lower chamber) buffer: 25 mM Imidazole/HCl, pH 7.0.
- Prepare the cathode (upper chamber) buffer: 50 mM Tricine, 7.5 mM Imidazole, pH ~7.0 (note: no SDS or other denaturants).
- Mix protein samples with a native loading dye (e.g., containing 5% Coomassie G-250). Load 1-10 µg of protein per lane.
- Run electrophoresis at 4°C to maintain complex stability. Start at 100 V, then increase to 200 V once the sample has entered the gel, until the dye front reaches the bottom.
3. In-Gel Activity Staining:
- Prepare a reaction mixture containing:
- 100 µM Octanoyl-CoA (physiological substrate)
- 200 µM Nitro Blue Tetrazolium (NBT, electron acceptor)
- 100 µM Phenazine Methosulfate (PMS, electron carrier)
- in 50 mM Tris-HCl buffer, pH 8.0.
- Incubate the gel in the staining solution in the dark at room temperature with gentle agitation.
- Active enzyme complexes will reduce NBT, producing an insoluble purple formazan precipitate. Monitor band development (typically 10-30 minutes).
- Stop the reaction by rinsing the gel with water.
4. Data Analysis:
- Capture gel images and use densitometry software to quantify band intensity. The linear correlation between protein amount and activity can be established as in [23].
Protocol B: Sequential BN-PAGE and SDS-PAGE for Complex Composition
This two-dimensional method first separates complexes natively, then denatures them to analyze subunit composition [24].
1. First Dimension: Blue Native PAGE (BN-PAGE)
- Cast a 4-12% gradient polyacrylamide gel.
- Add Coomassie Blue G-250 (0.02%) to the cathode buffer, which confers a negative charge to the protein complexes.
- Solubilize protein samples (e.g., membrane complexes) with a mild non-ionic detergent (e.g., Dodecyl-β-D-maltoside).
- Load and run the gel at 4°C. The blue dye allows visual tracking of migration.
2. Gel Strip Excission and Denaturation
- After BN-PAGE, excise a single lane from the gel.
- Equilibrate the gel strip for 15-20 minutes in a solution containing 1% SDS and 1% β-mercaptoethanol to unfold proteins and reduce disulfide bonds.
3. Second Dimension: SDS-PAGE
- Place the equilibrated gel strip horizontally on top of a standard SDS-polyacrylamide gel.
- Seal it in place with agarose.
- Perform standard SDS-PAGE. Protein complexes separated in the first dimension (by native size) are now dissociated, and their subunits are separated in the second dimension by molecular mass.
- Visualize proteins by Coomassie staining, fluorescent staining, or western blotting.
Diagram 1: 2D BN-PAGE/SDS-PAGE workflow for analyzing complex composition.
The Scientist's Toolkit: Essential Research Reagents
Table 3: Key Reagents for Protein Electrophoresis Studies.
| Reagent / Solution | Critical Function | Application Notes |
|---|---|---|
| SDS (Sodium Dodecyl Sulfate) | Denatures proteins and confers uniform negative charge. | Core component of denaturing gels; final conc. ~0.1% in gels, 1-2% in sample buffer. |
| DTT or β-Mercaptoethanol | Reduces disulfide bonds, fully linearizing polypeptides. | Essential for complete denaturation in SDS-PAGE; typically 50-100 mM in sample buffer. |
| Coomassie G-250 | Imparts negative charge to protein complexes. | Used in BN-PAGE cathode buffer; critical for native separation. |
| Nitro Blue Tetrazolium (NBT) | Electron acceptor that forms purple precipitate upon reduction. | Key component of in-gel activity assays for oxidoreductases like MCAD [23]. |
| Polyacrylamide Gel Matrix | Sieving medium for size-based separation. | Gradient gels (e.g., 4-16%) offer superior resolution for diverse complex sizes. |
| Crosslinking Reagents (e.g., DSS) | Stabilizes transient protein-protein interactions. | Used in TX-MS workflows to capture quaternary structures in complex samples [25]. |
Advanced and Emerging Techniques
While traditional gels are powerful, emerging technologies are pushing the boundaries of quaternary structure analysis. Targeted Cross-Linking Mass Spectrometry (TX-MS) combines chemical cross-linking with high-resolution MS and computational modeling to determine quaternary structures directly in complex biological samples, such as a host-pathogen complex in human plasma [25]. This method generates dense networks of distance constraints that guide high-resolution protein docking algorithms.
Furthermore, computational methods are rapidly advancing. AlphaFold-Multimer extends the revolutionary AlphaFold model to predict the structures of multimeric protein complexes [21]. Simultaneously, Protein Language Models (PLMs) fine-tuned on mutational datasets show great promise in predicting the thermodynamic stability of both tertiary and quaternary structures directly from sequence information, a significant advantage when structural data is unavailable [26].
The choice between denaturing and native gel electrophoresis is not a matter of which is superior, but which is appropriate for the biological question at hand.
Use Denaturing Gels (SDS-PAGE) when: Your goal is to verify the molecular weight of a polypeptide chain, assess sample purity, check protein expression levels, or prepare samples for western blotting or protein sequencing [3]. It is the standard for analyzing the primary structure level.
Use Native Gels (BN-/CN-PAGE) when: Your goal is to study the intact quaternary structure, identify the native oligomeric state (e.g., dimer vs. tetramer), investigate protein-protein interactions, monitor complex assembly/disassembly, or perform in-gel functional assays [23] [3] [24]. This is the definitive method for analyzing functional, higher-order structures.
For the most comprehensive structural insights, these techniques are often used in concert, as demonstrated by the 2D BN-/SDS-PAGE protocol. Furthermore, integrating these classical methods with emerging cross-linking MS and computational approaches provides a powerful, multi-faceted strategy for elucidating the architecture of protein complexes from linear chains to intact quaternary structures.
In molecular biology, the separation of proteins using gel electrophoresis is a foundational technique, and the choice between denaturing and native systems fundamentally dictates the outcome and interpretation of the experiment. Denaturing gel electrophoresis, most commonly Sodium Dodecyl Sulfate-Polyacrylamide Gel Electrophoresis (SDS-PAGE), unravels protein complexes and coats them with a negative charge, allowing separation based almost exclusively on polypeptide chain mass. In contrast, native gel electrophoresis separates proteins based on a combination of their intrinsic charge, shape, and size, preserving complex quaternary structures and enzymatic activity. For researchers, scientists, and drug development professionals, understanding the distinct band patterns produced by a protein ladder in these two systems is critical for accurate analysis. This guide provides a detailed, evidence-based comparison of the expected migration patterns, empowering you to troubleshoot your experiments and correctly interpret the resulting data.
Core Principles of Separation
The migration of a protein ladder—a set of proteins of known molecular weights used for calibration—looks dramatically different between denaturing and native systems because the underlying principles of separation are fundamentally distinct.
Denaturing SDS-PAGE Systems
In SDS-PAGE, the treatment of proteins with the anionic detergent SDS and a reducing agent like β-mercaptoethanol has two critical effects. First, it disrupts all non-covalent interactions and reduces disulfide bonds, effectively unfolding the proteins into linear polypeptide chains. Second, SDS binds to the proteins at a relatively constant ratio, imparting a uniform negative charge per unit mass. This means the charge-to-mass ratio is essentially identical for all proteins. When an electric field is applied, the proteins migrate through the polyacrylamide gel matrix, which acts as a molecular sieve. Under these conditions, separation is determined primarily by molecular size (length of the polypeptide chain), with smaller proteins migrating faster than larger ones. The polyacrylamide gel's tunable pore size (typically 5-100 nm) allows for high-resolution separation of proteins in the 10-250 kDa range [27]. The resulting protein ladder displays bands that correlate directly with the molecular weights of its constituent polypeptides, creating a reliable standard curve when migration distance is plotted against the logarithm of the molecular weight [7].
Native Gel Systems
Native gel electrophoresis is performed without denaturing agents, preserving the protein's higher-order structure—its secondary, tertiary, and quaternary conformation. Consequently, a protein's migration is influenced by three interdependent factors: its inherent net charge (determined by the pH of the running buffer), its size and shape (compact globular proteins vs. extended fibrous proteins), and its native molecular mass as a functional complex [28]. For example, a homotetrameric protein like Medium-chain acyl-CoA dehydrogenase (MCAD), with a theoretical mass of 177.7 kDa, will migrate at a position corresponding to its tetrameric mass, not the 43.6 kDa of its monomeric subunit [28]. This means a protein ladder on a native gel will produce a band pattern that reflects the native masses and shapes of the standard proteins, which may not align with the simple linear relationship seen in SDS-PAGE. Furthermore, active enzymes can be detected within the gel using specific substrates, a technique known as in-gel activity assay, which is impossible in denatured systems [28].
Comparative Analysis of Band Patterns
The following table summarizes the key differences in how a protein ladder migrates and appears in denaturing versus native gel systems.
| Feature | Denaturing (SDS-PAGE) System | Native Gel System |
|---|---|---|
| Basis of Separation | Molecular mass of polypeptide chains [29] | Combined effect of native mass, intrinsic charge, and 3D shape [28] |
| Protein State | Denatured, linearized, and uniformly negatively charged by SDS [29] | Native, folded, with intact secondary, tertiary, and quaternary structure |
| Expected Ladder Pattern | Bands form a smooth, predictable standard curve when log(MW) is plotted vs. migration distance [7] | Band pattern is less predictable; may not follow a simple log-linear relationship due to variable charge and shape |
| Key Visual Cues | Sharp, well-defined bands; relative spacing consistent with polypeptide mass | Potential for multiple active forms (e.g., tetramers, aggregates); bands may be diffuse due to charge heterogeneity |
| Impact on Mass Estimation | Provides accurate estimation of polypeptide chain mass [30] | Provides an "apparent native mass"; requires careful interpretation and specific native standards |
Table 1: Comparative analysis of protein ladder band patterns in denaturing vs. native gel electrophoresis.
The visual representation of these core separation principles and their outcomes can be summarized in the following workflow.
Experimental Protocols and Data
To illustrate these concepts with concrete examples, here are outlines of key experimental protocols from recent research that highlight the distinct outcomes in each system.
Protocol for Accurate MW Determination Using SDS-PAGE and Mass Spectrometry
This methodology, used to create a database of accurate electrophoretic migration patterns for human proteins, underscores the precision achievable in denaturing conditions [7].
- Sample Preparation: Proteins from human cell lines are solubilized in a buffer containing SDS and a reducing agent (e.g., DTT) to fully denature and linearize them. The sample is then heated to ensure complete disruption of protein structure.
- Gel Electrophoresis: Denatured samples are loaded onto a polyacrylamide gel (typically a gradient gel for a broader separation range). The gel is run under constant voltage until the dye front approaches the bottom. Internal calibration standards are run alongside to correct for gel-to-gel variability.
- In-Gel Digestion and Mass Spectrometry: Protein bands of interest are excised from the gel. Proteins within the gel pieces are subjected to enzymatic digestion (e.g., with trypsin). The resulting peptides are extracted and analyzed by tandem mass spectrometry (MS/MS) to identify the protein and confirm its theoretical molecular weight.
- Data Analysis: The migration distance of each identified protein is plotted against the logarithm of its known molecular weight to create a highly accurate standard curve. This large-scale approach allows for the identification of proteoforms and splicing events that cause minor mass shifts [7].
Protocol for In-Gel Activity Assay of a Native Tetrameric Protein
This protocol for analyzing MCAD activity directly within a native gel demonstrates the power of native systems for studying functional oligomers [28].
- Sample Preparation: Mitochondrial fractions or purified recombinant MCAD protein are prepared in a non-denaturing lysis buffer that lacks SDS or reducing agents. This preserves the homotetrameric structure of the enzyme.
- High-Resolution Clear Native PAGE (hrCN-PAGE): Samples are loaded onto a native polyacrylamide gel (e.g., 4-16% gradient). The gel is run in a cold room or with cooling to prevent heat-induced denaturation during electrophoresis.
- In-Gel Activity Staining: After electrophoresis, the gel is incubated in a reaction mixture containing the physiological substrate octanoyl-CoA, the electron acceptor nitro blue tetrazolium (NBT), and the catalyst phenazine methosulfate. Active MCAD tetramers oxidize the substrate, reducing NBT to an insoluble purple formazan precipitate at the site of the enzyme.
- Data Analysis: The formation of purple bands indicates the presence and location of active MCAD. Multiple bands can reveal different active oligomeric states (e.g., tetramers vs. higher-order aggregates), and their enzymatic activity can be quantified via densitometry, providing insights into how pathogenic variants affect structure and function [28].
The Scientist's Toolkit: Essential Research Reagents
Successful execution of these electrophoretic techniques requires specific reagents. The following table details key materials and their functions.
| Reagent / Material | Function in Denaturing (SDS-PAGE) | Function in Native Gel Electrophoresis |
|---|---|---|
| SDS (Sodium Dodecyl Sulfate) | Denatures proteins and confers uniform negative charge [29] | Typically omitted to preserve native structure |
| Reducing Agents (DTT, β-Mercaptoethanol) | Breaks disulfide bonds for complete linearization [31] | Omitted to maintain native quaternary structure |
| Polyacrylamide Gel | Acts as a molecular sieve; pore size determines resolution range [27] | Same function, but proteins migrate based on native size/shape/charge |
| Coomassie/Silver Stain | Detects denatured protein bands post-electrophoresis | Detects native protein bands; compatible with subsequent activity assays |
| Protein Ladder | Provides standards of known polypeptide mass for calibration [30] | Ideally, provides standards of known native mass and charge |
| Substrate for Activity Stain | Not applicable | Used to detect functional enzymes in-gel (e.g., NBT for dehydrogenases) [28] |
Table 2: Essential reagents for denaturing and native gel electrophoresis and their respective functions.
Choosing Your Method: A Practical Guide to Gel Selection and Ladder Usage
In the realm of protein analysis, selecting the appropriate electrophoretic method is fundamental to obtaining accurate, reproducible results. Denaturing gel electrophoresis, specifically sodium dodecyl sulfate-polyacrylamide gel electrophoresis (SDS-PAGE), serves as a cornerstone technique for molecular weight determination and western blotting. This guide provides an objective comparison between denaturing and native gel systems, focusing on their performance characteristics, supported by experimental data and detailed methodologies. Within the broader context of protein ladder migration research, understanding the distinct separation profiles generated by each system enables researchers to select the optimal approach for their specific application, thereby enhancing the reliability of protein analysis in drug development and basic research.
Denaturing vs. Native Gels: A Fundamental Comparison
Denaturing gels utilize chemical treatments to unfold proteins into linear chains, while native gels preserve the protein's higher-order structure and activity. The table below summarizes the core differences, helping you select the appropriate system for your experimental goals.
Table 1: Core Differences Between Denaturing and Native Gel Electrophoresis
| Parameter | Denaturing Gels (SDS-PAGE) | Native Gels |
|---|---|---|
| Key Components | SDS, reducing agent (DTT/β-Me), heat [32] [8] | No SDS, no reducing agent, no heat [32] [8] |
| Protein State | Linearized, denatured [3] [8] | Native conformation preserved [3] [8] |
| Separation Basis | Molecular mass (almost exclusively) [32] [8] | Size, shape, and intrinsic charge [3] [8] |
| Molecular Weight Determination | Accurate and straightforward [8] | Not suitable due to charge/shape influence [8] |
| Key Applications | - Estimating molecular weight [3] [8]- Western blotting [3] [32]- Establishing sample purity [3] [8]- Protein sequencing preparation [3] [32] | - Isolating active enzymes [3] [32]- Determining protein aggregation state [32] [8]- Analyzing protein complexes and quaternary structure [3] [8]- Studying protein-binding interactions [3] |
The Mechanism of Denaturing Gels: How SDS-PAGE Works
The power of denaturing gels for molecular weight determination lies in their ability to negate the influence of a protein's inherent charge and three-dimensional shape. This is achieved through a sample preparation process that linearizes and uniformly charges all proteins in the mixture [32] [8].
- Reduction of Disulfide Bonds: A reducing agent like dithiothreitol (DTT) breaks disulfide bonds, disrupting tertiary and quaternary structures [32] [8].
- Denaturation and Charge Uniformity: The strong anionic detergent sodium dodecyl sulfate (SDS) binds to the protein backbone at a constant ratio of approximately 1.4 g SDS per 1.0 g of protein. This coats the protein with negative charges, overwhelming any charge the protein naturally possesses [32] [8].
- Heat-Assisted Unfolding: Heating the sample (typically to 95°C) further aids in denaturation, ensuring proteins are fully unfolded into rod-like chains [32].
The result is that all proteins become linear, negatively charged chains with a nearly identical charge-to-mass ratio. During electrophoresis, separation occurs almost exclusively based on molecular size, as smaller proteins migrate more easily through the pores of the polyacrylamide gel than larger ones [8]. This allows for accurate molecular weight estimation by comparing migration distances to a standardized protein ladder.
Diagram: SDS-PAGE Workflow for Protein Separation
This workflow illustrates the process of transforming complex protein structures into linearized molecules that can be separated by size.
Denaturing Gels in Western Blotting: A Synergistic Workflow
Western blotting is a quintessential application for denaturing gels. The SDS-PAGE workflow is perfectly suited for the initial separation step in immunoblotting, as it provides a reliable method to resolve complex protein mixtures before transfer and antibody detection [33] [34].
The transfer of proteins from the gel to a solid membrane is a critical step. The efficiency of this transfer can vary significantly based on the method used and the molecular weight of the target protein. The following table compares common transfer methods and their performance, based on optimization studies.
Table 2: Comparison of Western Blot Protein Transfer Methods [33] [35]
| Transfer Method | Typical Transfer Time | Key Advantages | Key Limitations | Recommended Protein Size Range |
|---|---|---|---|---|
| Wet (Tank) Transfer | 30 min - overnight | High transfer efficiency; consistent performance for a wide size range [33] | Time-consuming; requires large buffer volumes; extensive cleanup [33] [35] | 14 - 116 kDa (80-100% efficiency) [33] |
| Semi-Dry Transfer | 7 - 60 min | Faster; uses less buffer; light cleanup [33] [35] | Can be less efficient for high MW proteins (>300 kDa) [33] | Best for small to medium proteins [36] |
| Dry (Electroblotting) Transfer | As few as 3 - 10 min | Fastest; no transfer buffers needed; minimal cleanup [33] | Requires proprietary, pre-assembled transfer stacks [33] | 10 - 300 kDa [33] |
Optimization Insight: Research shows that transfer time must be optimized for the protein of interest. For instance, while a 35-minute transfer may be suitable for a 70 kDa protein, it can lead to the complete loss ("blow-through") of a 15 kDa protein from the membrane. Recommendations suggest 15 minutes for 10-25 kDa proteins and 30-35 minutes for 70-130 kDa proteins [35].
Membrane Selection: The membrane pore size is another critical factor. A 0.45 µm pore size is standard for larger proteins, but a 0.22 µm pore size PVDF membrane is significantly more effective at retaining small-molecular-weight proteins (<30 kDa) and preventing over-transfer [35].
Experimental Protocols for Key Applications
Standard SDS-PAGE Protocol for Molecular Weight Determination
This is a foundational protocol for separating proteins by size, adapted from common laboratory practices [32] [8] [34].
Sample Preparation:
- Mix protein sample with 2X or 4X SDS-PAGE loading buffer (containing SDS and DTT or β-mercaptoethanol).
- Heat the mixture at 95°C for 5 minutes to fully denature proteins. For heat-sensitive proteins, alternatives include 70°C for 10-20 minutes or 37°C for 30-60 minutes [36].
- Centrifuge briefly to bring down condensation.
Gel Electrophoresis:
- Load denatured samples and a pre-stained protein ladder onto a polyacrylamide gel (e.g., 4-20% gradient gel for a broad separation range).
- Run the gel using a standard Tris-glycine-SDS running buffer. A modified running buffer (e.g., with added HEPES) can enable faster run times (e.g., 35 minutes at 200V) [35].
- Monitor the migration of the dye front (usually bromophenol blue) to prevent proteins from running off the gel.
Detection and Analysis:
- After electrophoresis, stain the gel with Coomassie Blue or a more sensitive fluorescent stain to visualize the protein bands.
- Plot the log(MW) of the protein ladder standards against their migration distance (Rf value) to generate a standard curve.
- Use this curve to interpolate the molecular weight of unknown protein bands based on their migration.
Denaturing Mass Photometry (dMP) Protocol for Cross-linking Analysis
A novel denaturing method, dMP, has been developed as a faster, more accurate alternative to SDS-PAGE for optimizing chemical cross-linking (XL) reactions. It showcases the evolution of denaturing techniques beyond traditional gels [37].
Denaturation:
- Incubate cross-linked protein samples in a high concentration of denaturant (5.4 M urea or 6 M guanidine hydrochloride) at room temperature for 5 minutes to achieve >95% denaturation [37].
Dilution and Measurement:
Analysis:
- The dMP method provides accurate mass identification across a broad range (30 kDa to 5 MDa) and directly quantifies all coexisting cross-linked species (sub-complexes and aggregates) at the single-molecule level [37].
Performance Data: When benchmarked against SDS-PAGE, dMP was found to be time-efficient (3 min/triplicate), required 20–100 times less material, and offered single-molecule sensitivity, making it highly suitable for rapid screening of XL conditions [37].
The Scientist's Toolkit: Essential Reagents and Materials
Table 3: Key Reagent Solutions for Denaturing Gel Electrophoresis
| Reagent/Material | Function | Key Considerations |
|---|---|---|
| SDS (Sodium Dodecyl Sulfate) | Anionic detergent that denatures proteins and confers uniform negative charge [32] [8]. | Critical for masking intrinsic protein charge. Purity is essential for consistent results. |
| DTT or β-Mercaptoethanol | Reducing agent that breaks disulfide bonds [32] [8]. | Must be added fresh to the loading buffer as it oxidizes over time. |
| Acrylamide/Bis-acrylamide | Forms the cross-linked gel matrix for size-based separation [35]. | Concentration (%T) determines pore size and resolution range. Pre-mixed reagents can save time [35]. |
| Tris-Glycine-SDS Buffer | Standard running buffer for SDS-PAGE. | Can be modified with HEPES to allow higher voltage and faster run times [35]. |
| PVDF or Nitrocellulose Membrane | Solid support for protein immobilization after transfer [33] [35]. | 0.45 µm for standard proteins; 0.22 µm for proteins <30 kDa to prevent blow-through [35] [36]. |
| Methanol or Ethanol in Transfer Buffer | Promotes protein adhesion to the membrane [33] [35]. | Ethanol is a less toxic alternative to methanol with comparable efficiency for many proteins [35]. |
Troubleshooting Common Issues in Denaturing Gels and Western Blotting
- Protein Aggregation During Prep: If proteins aggregate at 95°C, try longer incubation at 70°C or 37°C [36].
- Smiling Bands or Smearing: Caused by overheating; reduce voltage, run in a cold room, or use ice packs [36].
- Poor Transfer Efficiency: For large proteins (>100 kDa), use wet transfer with extended time. For small proteins (<20 kDa), use a 0.22 µm membrane and shorter semi-dry transfer to prevent over-transfer [35] [36].
- High Background in Western Blot: Ensure sufficient blocking time (at least 60 minutes) with milk or BSA. Check antibody specifications for recommended blocking buffers [36].
Gel electrophoresis is a fundamental tool in protein research, but the choice between native and denaturing systems is critical and application-dependent. While denaturing SDS-PAGE separates proteins based primarily on molecular mass, native PAGE preserves protein complexes in their functional state, enabling analysis of oligomeric structure and biological activity [8] [38]. This guide provides a comparative framework for researchers needing to characterize protein quaternary structure and enzymatic function within the broader context of protein ladder migration studies.
Key Differences: Native vs. Denaturing Gels
The table below summarizes the fundamental distinctions between these electrophoretic techniques:
| Parameter | Native-PAGE | Denaturing SDS-PAGE |
|---|---|---|
| Separation Basis | Net charge, size, and shape of native structure [8] [38] | Molecular mass of polypeptide subunits [8] [38] |
| Protein Structure | Maintains native conformation, quaternary structure, and subunit interactions [8] [38] | Denatures proteins into linear polypeptides; disrupts quaternary and tertiary structures [3] [8] |
| Typical Applications | Analyzing oligomeric state, isolating active enzymes, studying protein complexes [3] [8] | Determining polypeptide molecular weight, assessing sample purity, Western blotting [3] [8] |
| Enzymatic Activity | Often retained after separation, enabling in-gel activity assays [23] [8] | Destroyed due to denaturation [8] |
| Migration Direction | Can be toward either anode or cathode depending on protein's native charge [8] | Always toward the anode due to SDS coating [38] |
Experimental Applications and Protocols
Analyzing Oligomeric State
Native gels, particularly Blue Native (BN)-PAGE and Clear Native (CN)-PAGE, are indispensable for determining the oligomeric state of protein complexes, as they separate proteins based on both size and shape under non-denaturing conditions [39] [40].
Protocol: Oligomeric State Analysis via BN-PAGE/CN-PAGE
- Sample Preparation: Solubilize proteins in a non-denaturing, non-reducing buffer. For membrane proteins, use mild detergents like dodecyl maltoside to maintain solubility without disrupting complexes [41] [39]. Avoid SDS and boiling.
- Gel Electrophoresis:
- For BN-PAGE, the cathode buffer contains Coomassie G-250 dye, which binds to proteins and confers a negative charge, improving solubility and resolution [41] [39].
- For CN-PAGE, no dye is used, or it is substituted with mixtures of anionic and neutral detergents, making it preferable when Coomassie blue interferes with downstream assays [41] [23].
- Analysis: Compare the migration distance of the protein complex against native protein markers of known molecular weight and oligomeric state. The oligomeric state can be assigned based on the apparent molecular mass [40].
Supporting Data: A study on the mechanosensitive channel of large conductance (MscL) used BN-PAGE to reveal a mixture of oligomeric states (tetramers to hexamers), demonstrating diversity not always observable by other techniques like X-ray crystallography [39].
Characterizing Enzymatic Activity
A unique advantage of native gels is the ability to perform in-gel activity assays, allowing direct localization and quantification of enzymatic function within the separated protein band [41] [23].
Protocol: Continuous Monitoring In-Gel Enzymatic Assay
This protocol, adapted for studying mitochondrial oxidative phosphorylation complexes (MOPCs), allows for real-time kinetic analysis [41].
- Electrophoresis: Separate protein complexes using BN-PAGE or CN-PAGE.
- In-Gel Reaction:
- For Complex IV (Cytochrome c oxidase): Incubate the gel in a reaction medium containing cytochrome c and diaminobenzidine (DAB). Complex IV oxidizes cytochrome c, which in turn oxidizes DAB to form an insoluble, dark brown precipitate at the site of activity [41].
- For Complex V (ATP synthase): Incubate the gel in a solution containing ATP and lead nitrate. ATP hydrolysis releases phosphate, which reacts with lead to form an insoluble lead phosphate precipitate [41].
- Continuous Kinetic Analysis:
- Use a custom reaction chamber with continuous recirculation and filtering of the reaction media to prevent turbidity from interfering with imaging.
- Capture time-lapse, high-resolution digital images of the gel throughout the reaction.
- Employ processing routines to quantify the density of the precipitate formation over time, generating kinetic traces of the enzymatic activity [41].
Supporting Data: A 2025 study on medium-chain acyl-CoA dehydrogenase (MCAD) deficiency used a colorimetric in-gel assay after clear native PAGE. The gel was stained with a solution containing the substrate octanoyl-CoA and nitro blue tetrazolium (NBT), which forms a purple precipitate upon reduction. This method allowed researchers to distinguish the activity of tetrameric MCAD from inactive, fragmented forms caused by pathogenic variants, providing insights that standard solution assays could not [23].
Workflow for Native Gel Analysis
Research Reagent Solutions
The table below lists essential reagents for native gel electrophoresis and in-gel activity assays.
| Reagent/Tool | Function/Application |
|---|---|
| Coomassie G-250 | Anionic dye used in BN-PAGE to confer charge and maintain solubility of protein complexes [41] [39] |
| Dodecyl Maltoside | Mild, non-ionic detergent for solubilizing membrane proteins without disrupting complexes [41] [39] |
| NativeMark Protein Standard | Unstained, native protein ladder for estimating molecular weight and oligomeric state under native conditions [38] |
| 3,3'-Diaminobenzidine (DAB) | Chromogenic substrate for in-gel detection of cytochrome c oxidase (Complex IV) activity [41] |
| Nitro Blue Tetrazolium (NBT) | Tetrazolium salt that forms purple formazan precipitate upon reduction; used in oxidoreductase activity assays (e.g., MCAD) [23] |
| Lead Nitrate | Used in in-gel ATPase assays; phosphate released from ATP hydrolysis forms insoluble lead phosphate precipitate [41] |
The choice between native and denaturing gel electrophoresis is dictated by experimental goals. SDS-PAGE is the superior tool for routine analysis of protein purity, polypeptide molecular weight, and post-electrophoresis applications like western blotting. In contrast, native PAGE is the definitive method for investigating the structural and functional biology of proteins, providing unique insights into oligomeric assembly and enzymatic activity that are irreplaceable in advanced protein characterization.
Protein gel electrophoresis is a foundational technique in biochemistry and molecular biology, enabling the separation of complex protein mixtures based on their physical properties. The critical decision researchers face is whether to use denaturing or native conditions, a choice that fundamentally impacts protein structure, migration patterns, and downstream analysis. Under denaturing conditions, proteins are unfolded into linear chains and separated primarily by molecular weight, whereas native conditions preserve the protein's higher-order structure, enabling separation based on a combination of size, charge, and shape [3] [8] [42].
This choice is particularly crucial in the context of studying protein ladder migration, as the behavior of molecular weight standards differs significantly between these two conditions. The selection dictates not only the sample preparation protocol but also the gel chemistry, running buffers, and the type of information that can be obtained from the experiment. This guide provides a detailed, objective comparison of these two fundamental approaches to protein separation.
Comparative Analysis: Denaturing vs. Native Conditions
The following table summarizes the core differences between denaturing and native gel electrophoresis, providing a quick reference for researchers deciding on the appropriate method.
Table 1: Core Characteristics of Denaturing and Native Gel Electrophoresis
| Characteristic | Denaturing Gels (e.g., SDS-PAGE) | Native Gels (Non-Denaturing PAGE) |
|---|---|---|
| Protein State | Denatured and unfolded into linear chains [8] [32] | Native, folded structure preserved [8] [42] |
| Key Reagents | SDS (detergent) and DTT/β-mercaptoethanol (reducing agent) [8] [32] | No SDS or reducing agents; may use Coomassie G-250 dye in specific systems [10] |
| Sample Preparation | Heating samples at high temperature (e.g., 95-100°C) [8] [32] | No heating; samples kept on ice [32] |
| Separation Basis | Molecular mass almost exclusively [8] | Size, charge, and shape of the native protein [3] [10] |
| Impact on Activity | Enzymatic activity is destroyed [8] | Enzymatic activity is often preserved [10] [8] |
| Protein Complexes | Subunits are dissociated [32] | Quaternary structures and protein complexes are maintained [10] [8] |
| Molecular Weight Determination | Suitable for accurate molecular weight estimation [8] | Not suitable for accurate molecular weight determination due to charge/shape influence [8] |
Detailed Methodologies and Experimental Protocols
Sample Preparation for Denaturing Gels (SDS-PAGE)
The protocol for denaturing gel preparation is designed to completely unfold the protein and mask its inherent charge.
- Sample Buffer Composition: Prepare a Laemmli-style sample buffer containing:
- Sodium Dodecyl Sulfate (SDS): A strong anionic detergent (typically 1-2%) that binds to the protein backbone at a constant ratio, conferring a uniform negative charge and disrupting nearly all non-covalent interactions. This gives the protein a consistent charge-to-mass ratio [8] [32].
- Reducing Agent: Dithiothreitol (DTT) or Beta-mercaptoethanol (β-Me) (typically 50-100 mM) to break disulfide bonds, destroying tertiary and quaternary structures [8] [32].
- Glycerol: Adds density to the solution for easy gel loading.
- Tracking Dye: A small molecule (e.g., Bromophenol Blue) to monitor migration progress.
- Sample Denaturation: Mix the protein sample with an equal volume of the 2X sample buffer. Heat the mixture at 95-100°C for 5-10 minutes [8] [32]. This heat treatment ensures complete denaturation and efficient binding of SDS to the hydrophobic regions of the protein.
- Gel Loading: Briefly centrifuge the heated samples to collect condensation and load directly into the gel wells [32].
Sample Preparation for Native Gels
The native protocol prioritizes the maintenance of the protein's natural structure and function.
- Sample Buffer Composition: Use a non-denaturing sample buffer that lacks SDS and reducing agents. Key components include:
- Non-ionic Detergent: Optional, used for membrane proteins to prevent aggregation without denaturation (e.g., in NativePAGE Bis-Tris systems) [10].
- Glycerol and Tracking Dye: Similar to denaturing buffer.
- Native Buffer Salt: Such as Tris-Glycine or Tris-Acetate, to maintain a stable pH [10].
- Coomassie G-250 Additive: For Bis-Tris native PAGE systems, this dye binds to proteins hydrophobically, conferring a negative charge while keeping them native. It is added to the sample and is present in the cathode buffer [10].
- Sample Handling: Do not heat the samples. Mix the protein with the native sample buffer and keep it on ice until loading to preserve labile protein-protein interactions and enzymatic activity [32].
- Gel Loading: Load the samples directly into the gel wells. The running buffer will also lack SDS [32].
Gel Chemistry and Buffer Systems for Native Gels
Unlike denaturing SDS-PAGE, which has a relatively standardized protocol, native PAGE offers several gel chemistry options. The choice depends on the protein's properties and the experimental goal. There is no universal system ideal for all proteins [10].
Table 2: Common Native PAGE Gel Chemistry Systems
| Gel System | Operating pH Range | Features and Best Uses |
|---|---|---|
| Tris-Glycine | 8.3 - 9.5 | Traditional system; suitable for keeping the native net charge and studying smaller proteins (20-500 kDa) [10]. |
| Tris-Acetate | 7.2 - 8.5 | Provides better resolution for larger molecular weight proteins (>150 kDa) [10]. |
| Bis-Tris (with Coomassie G-250) | ~7.5 | Allows separation by molecular weight regardless of isoelectric point (pI); ideal for membrane proteins, hydrophobic proteins, and studying protein complexes [10]. |
Data Interpretation and Separation Characteristics
Factors Influencing Protein Migration
The migration patterns of proteins and protein ladders are governed by different principles in each system, which must be considered during data interpretation.
In Denaturing Gels: The primary factor is molecular mass. Because SDS coats proteins linearly, smaller proteins migrate faster through the gel matrix, while larger ones migrate more slowly. This allows for a relatively straightforward estimation of molecular weight by comparing to a denatured protein ladder [8]. However, it is important to note that post-translational modifications (e.g., glycosylation) can cause anomalous migration, as the added mass may not linearly correlate with increased mobility [7].
In Native Gels: Migration is a complex function of the protein's inherent charge, size (mass), and three-dimensional shape [10] [8]. A small, highly negatively charged protein will migrate very quickly, whereas a large, neutrally charged protein may migrate slowly or not at all. Proteins can even migrate toward the positive electrode (cathode) if they possess a net positive charge at the gel's pH [8]. Consequently, a native protein ladder can only be used to assess relative size or complexity, not absolute molecular weight.
Workflow Comparison
The following diagram illustrates the key procedural differences between the two methods, from sample preparation to final analysis.
Application Scenarios and Decision Framework
The choice between denaturing and native gels is dictated by the experimental objectives. The following table outlines appropriate applications for each method to guide researchers in selecting the optimal protocol.
Table 3: Guidelines for Selecting Gel Electrophoresis Conditions
| Application Goal | Recommended Method | Rationale |
|---|---|---|
| Determine Molecular Weight | Denaturing Gel [8] [32] | Separation based primarily on mass enables accurate MW estimation. |
| Establish Sample Purity | Denaturing Gel [3] [8] | Reveals all individual polypeptide contaminants. |
| Perform Western Blotting | Denaturing Gel [3] [8] | Antibody epitopes are often linear sequences exposed after denaturation. |
| Protein Sequencing | Denaturing Gel [3] [8] | Requires pure, denatured protein fragments. |
| Study Enzyme Activity | Native Gel [10] [8] | Preserves the 3D structure required for catalytic function. |
| Analyze Protein Complexes / Quaternary Structure | Native Gel [10] [8] [32] | Maintains non-covalent interactions between subunits. |
| Determine Aggregation State | Native Gel [8] [32] | Allows visualization of oligomers and multimers. |
| Study Protein-Protein Interactions | Native Gel [8] | Can resolve different stoichiometries of interacting complexes. |
Essential Reagents and Materials
Successful execution of either protocol requires specific reagents. Below is a list of key solutions and their functions.
Table 4: Essential Research Reagent Solutions for Gel Electrophoresis
| Reagent / Material | Function | Denaturing Gels | Native Gels |
|---|---|---|---|
| SDS (Sodium Dodecyl Sulfate) | Denatures proteins and confers uniform negative charge. | Mandatory [8] [32] | Not Used [32] |
| DTT or β-Mercaptoethanol | Reducing agent that breaks disulfide bonds. | Mandatory [8] [32] | Not Used [8] |
| Coomassie G-250 Dye | Binds proteins hydrophobically to confer charge for migration without denaturation. | Not Used | Used in specific systems (e.g., NativePAGE Bis-Tris) [10] |
| Heat Block (95-100°C) | For complete protein denaturation. | Mandatory [8] [32] | Not Used [32] |
| Non-Ionic Detergent | Solubilizes membrane proteins without denaturation. | Not Typically Used | Often Used (e.g., for membrane proteins) [10] |
| Polyacrylamide Gels | Sieving matrix for protein separation. | Yes (e.g., Tris-Glycine, Bis-Tris) | Yes (Tris-Glycine, Tris-Acetate, Bis-Tris) [10] [16] |
| Transfer Membrane | For protein blotting after electrophoresis. | Nitrocellulose or PVDF | PVDF recommended; Nitrocellulose binds Coomassie G-250 too tightly [10] |
The decision to use denaturing or native gel conditions is fundamental and must align with the core scientific question. Denaturing SDS-PAGE is the unrivaled method for determining molecular weight, assessing purity, and preparing for techniques like western blotting, as it simplifies separation to a function of mass. In contrast, native PAGE is indispensable for functional and structural biology, providing insights into protein complexes, oligomeric states, and enzymatic activity that are completely lost under denaturing conditions. Researchers must carefully consider their goals—whether to analyze a protein's primary structure or to probe its active, native form—to select the correct and most informative electrophoretic path.
Protein ladders, also known as molecular weight markers or standards, constitute indispensable tools in biochemical research, providing critical reference points for estimating protein size and evaluating electrophoretic separation efficiency. These standardized mixtures of highly purified proteins with known molecular weights migrate during electrophoresis at rates inversely proportional to their molecular sizes, enabling researchers to calibrate their experiments and draw meaningful conclusions about their protein samples [43]. Within the context of denaturing versus native gel electrophoresis research, the selection of an appropriate protein ladder becomes paramount, as the choice directly impacts the accuracy of molecular weight determination, the ability to monitor experimental progress, and the validity of subsequent conclusions.
The fundamental divergence in protein ladder technology originates from the methodological split between denaturing SDS-PAGE and native PAGE techniques. In SDS-PAGE, proteins are denatured, linearized, and coated with the anionic detergent SDS, giving them a uniform charge-to-mass ratio that enables separation primarily by molecular weight [44]. Conversely, native PAGE preserves proteins' higher-order structures, making separation dependent on both molecular size and intrinsic charge [44]. This methodological dichotomy necessitates different protein ladder characteristics for optimal performance in each system, driving the development of prestained, unstained, and specialized native markers with distinct properties tailored to specific research needs.
Fundamental Principles: Protein Separation Mechanics and Marker Function
The Biochemical Basis of Electrophoretic Separation
Polyacrylamide gel electrophoresis (PAGE) separates protein molecules through a molecular sieving effect as analytes migrate through a porous polyacrylamide matrix under the influence of an electric field. The gel matrix forms when acrylamide and bis-acrylamide monomers polymerize into a cross-linked network, with pore size determined by the total acrylamide concentration and the ratio of acrylamide to bis-acrylamide [44]. This controlled porosity enables precise separation of biomolecules based on their physical characteristics.
In SDS-PAGE, the sample buffer contains SDS, a reducing agent (like β-mercaptoethanol), and heat to denature proteins. SDS binds to the protein backbone at a constant ratio, conferring a uniform negative charge that overwhelms the protein's inherent charge [44]. This treatment linearizes the proteins and standardizes their charge-to-mass ratio, ensuring separation occurs almost exclusively by molecular weight rather than shape or intrinsic charge. The discontinuous buffer system further enhances resolution, with a stacking gel that concentrates all proteins into a sharp band before they enter the separating gel where size-based separation occurs [44].
Protein Ladder Evolution and Design Considerations
Protein ladders have evolved significantly from early preparations of naturally occurring proteins like lysozyme (14 kD), soybean trypsin inhibitor (21 kD), and ovalbumin (45 kD) [30]. These native protein ladders, while inexpensive (approximately $0.10 per lane), have been largely superseded by recombinant ladders with precisely engineered properties, though at increased cost (approximately $1.00 per lane) [30]. Modern ladder design incorporates multiple considerations: comprehensive molecular weight coverage, accurate migration corresponding to stated weights, high expression levels in expression systems like E. coli, efficient purification via affinity tags, and detection capabilities through engineered binding domains or conjugated dyes [30].
The Penn State Protein Ladder system exemplifies this engineered approach, utilizing plasmids that express proteins at 10, 15, 20, 30, 40, 50, 60, 80, and 100 kD in E. coli, with each protein containing a decahistidine tag for purification and a Protein A IgG binding domain for Western blot detection [30]. This rational design produces markers that migrate appropriately on SDS-PAGE gels, express at high levels (10–50 mg per liter of culture), and facilitate detection without specialized antibodies, demonstrating the sophisticated engineering underlying modern protein ladder systems [30].
Comparative Analysis: Pre-stained Versus Unstained Protein Ladders
Technical Specifications and Performance Characteristics
The choice between prestained and unstained protein ladders represents a fundamental decision point in experimental design, with each type offering distinct advantages and limitations suited to different research applications.
Table 1: Comparative Performance Characteristics of Prestained and Unstained Protein Ladders
| Property | Prestained Protein Ladder | Unstained Protein Ladder |
|---|---|---|
| Visualization during electrophoresis | Yes, colored bands visible in real-time | No, requires post-staining |
| Membrane visualization in Western blot | Yes, directly visible after transfer | No, requires membrane staining |
| Molecular weight accuracy | Reduced accuracy due to dye conjugation | High accuracy, no dye interference |
| Electrophoresis progress monitoring | Yes, enables real-time tracking | Limited to dye front monitoring |
| Transfer efficiency assessment | Yes, direct visual confirmation | Requires Ponceau or other staining |
| Compatibility with total protein stains | May interfere with some staining methods | Fully compatible with all stains |
| Typical applications | Routine SDS-PAGE, Western blot optimization | Precise MW determination, publication data |
Prestained protein ladders consist of polypeptides covalently linked to colored dyes, creating visible markers that migrate through the gel during electrophoresis [45]. This allows researchers to monitor separation progress in real-time and visually confirm successful transfer to membranes during Western blotting without additional staining steps [45] [46]. However, the attached dye molecules add extra mass (typically 2-8 kDa depending on the dye and labeling efficiency) and can alter protein conformation, leading to anomalous migration and reduced accuracy for molecular weight determination [45] [47]. Some prestained ladders also exhibit limited compatibility with certain detection methods, such as silver staining or total protein stains, where the prestaining dyes can interfere with signal development [45].
Unstained protein ladders contain native polypeptides without conjugated dyes, requiring visualization through post-electrophoresis staining with Coomassie, silver stain, or other protein detection methods [45] [43]. The absence of dye modification means these proteins migrate according to their true molecular weights, providing superior accuracy for size determination [45]. This makes unstained ladders particularly valuable for precise molecular weight estimation in publication-quality data and applications requiring exact size measurements, such as confirming recombinant protein expression or detecting cleavage products [46].
Experimental Workflows and Practical Applications
The practical implications of ladder selection extend throughout the experimental workflow, influencing procedural steps, time requirements, and data interpretation.
Table 2: Experimental Workflow Implications of Ladder Choice
| Experimental Stage | Prestained Ladder Protocol | Unstained Ladder Protocol |
|---|---|---|
| Sample Preparation | Direct loading without modification | Direct loading without modification |
| Electrophoresis Monitoring | Real-time visualization of band separation | Monitoring limited to dye front movement |
| Post-Electrophoresis Processing | Immediate imaging or transfer possible | Requires staining/destaining steps (1-2 hours) |
| Transfer Assessment | Direct visual confirmation on membrane | Requires Ponceau S or reversible staining |
| Data Analysis | Approximate molecular weight determination | Precise molecular weight calculation |
| Documentation | Direct photography of gel/membrane | Requires stained gel imaging |
The distinctive advantage of prestained ladders emerges during protein transfer in Western blotting, where the colored bands provide immediate visual feedback on transfer efficiency [45]. As the bright, clear ladder bands appear on the membrane, researchers can confirm successful electrophoretic transfer before proceeding with antibody incubations, potentially saving days of wasted effort on failed transfers [45]. This real-time monitoring capability makes prestained ladders particularly valuable for method development, educational demonstrations, and quality control in diagnostic applications.
Unstained ladders excel in applications demanding precise molecular weight determination, such as characterizing novel proteins, verifying fusion protein sizes, or detecting specific proteolytic fragments [46] [43]. Their unmodified nature ensures accurate migration relative to sample proteins, providing reliable size estimates unaffected by dye-related anomalies. Furthermore, unstained ladders maintain full compatibility with all post-electrophoresis staining methods, including Coomassie, silver stain, fluorescent total protein stains, and specialized detection techniques that might be compromised by prestaining dyes [45].
Specialized Protein Ladders: Native Markers and Advanced Formats
Native PAGE Markers and Their Applications
Native protein electrophoresis presents unique challenges for molecular weight determination, as protein migration depends on both molecular size and intrinsic charge in the absence of denaturing agents [44]. Unlike SDS-PAGE, where proteins migrate primarily according to molecular weight, native electrophoresis separates proteins based on their charge-to-mass ratio and three-dimensional structure [44]. This complexity necessitates specialized native markers designed to mimic the behavior of native proteins while providing reliable size references.
Commercial native markers, such as the NativeMark Unstained Protein Standard (Thermo Fisher), include proteins ranging from approximately 20 to 1,200 kDa [43]. These standards are optimized for migration under non-denaturing conditions, though their size estimation remains approximate compared to denaturing systems due to the additional variables influencing mobility. When using native markers, researchers must recognize that size determination is necessarily less precise than in SDS-PAGE systems, with results providing general size ranges rather than exact molecular weights.
Fluorescent and Western Blot-Compatible Markers
Advanced protein ladder formats have emerged to address specific detection challenges and specialized applications. Fluorescent protein ladders, such as the iBright Prestained Protein Ladder (Thermo Fisher), incorporate fluorophores that enable highly sensitive detection using appropriate imaging systems [48] [43]. These fluorescent markers offer broad dynamic range, minimal background interference, and compatibility with downstream applications like mass spectrometry, making them valuable for quantitative analyses and multiplexed detection schemes [43].
Western blot-specific ladders incorporate protein domains that bind antibodies used in immunodetection. For example, the MagicMark XP Western Protein Standard contains engineered IgG binding sites on all bands, enabling direct detection during the standard Western blot procedure without requiring additional antibodies specific to the ladder [48]. Similarly, the PageRuler Unstained Protein Ladder incorporates Strep-tag II sequences that allow immunodetection on blots using Strep-Tactin conjugates or anti-Strep-tag II antibodies [48]. These specialized ladders provide precise molecular weight references directly on Western blot images, eliminating alignment uncertainties between the ladder and detected bands.
Methodological Protocols: Experimental Implementation and Troubleshooting
Standard Operating Procedures for Different Ladder Types
Protocol 1: Using Prestained Protein Ladders for SDS-PAGE and Western Blotting
Gel Preparation: Prepare an appropriate SDS-polyacrylamide gel system (e.g., 4-20% gradient gel for broad separation). The stacking gel should contain 4-5% acrylamide, while the separating gel concentration should match the target protein size range [44].
Sample Preparation: Thaw the prestained ladder completely and mix gently by flicking the tube. Avoid vigorous mixing to prevent foaming and protein degradation. Centrifuge briefly to collect contents at the tube bottom.
Loading: Load 5-10 µL of prestained ladder per well for a 1.0 mm thick mini-gel, adjusting volume based on well size and desired band intensity [48]. Include appropriate controls and experimental samples in adjacent wells.
Electrophoresis: Run the gel at constant voltage (100-150V for mini-gels) until the dye front approaches the gel bottom. Monitor the separation using the colored ladder bands to determine optimal run time [45].
Transfer (Western Blot): Transfer proteins to PVDF or nitrocellulose membrane using standard protocols. Visually confirm transfer efficiency by observing the colored ladder bands on the membrane [45].
Detection: Proceed with standard immunodetection protocols. The prestained ladder provides reference points directly on the membrane for molecular weight estimation of detected bands.
Protocol 2: Using Unstained Protein Ladders for Precise Molecular Weight Determination
Gel Preparation: Cast an SDS-polyacrylamide gel with appropriate acrylamide concentration for target protein separation. Ensure clean glass plates to prevent staining artifacts.
Sample Preparation: Thaw unstained ladder and experimental samples. Add reducing agent if required (e.g., DTT or β-mercaptoethanol) and heat denature at 95-100°C for 5 minutes.
Loading and Electrophoresis: Load 5-15 µL of unstained ladder per well based on protein concentration and detection method [48]. Conduct electrophoresis as described in Protocol 1, using the bromophenol blue dye front to monitor progress.
Protein Fixation: After electrophoresis, carefully remove the gel from plates and fix proteins in the gel using 40% ethanol/10% acetic acid for 30 minutes with gentle agitation.
Staining: Choose an appropriate staining method based on sensitivity requirements:
- Coomassie Staining: Incubate with 0.1% Coomassie Brilliant Blue R-250 in 40% methanol/10% acetic acid for 1 hour with agitation [44].
- Destaining: Remove background stain with multiple changes of 40% methanol/10% acetic acid until bands are clear against a light background.
- Alternative Stains: Follow manufacturer protocols for silver staining, fluorescent stains, or other detection methods.
Imaging and Analysis: Document the stained gel using appropriate imaging systems. Calculate molecular weights of unknown proteins by comparing their migration distances to the standard curve generated from the unstained ladder bands.
Troubleshooting Common Issues with Protein Ladders
Problem: Faint or Missing Ladder Bands
- Cause: Protease contamination due to shared usage or improper storage.
- Solution: Aliquot markers into single-use portions after first use, use clean pipette tips, and store at recommended temperatures [47].
Problem: Smeared or Distorted Bands
- Causes: Old or improperly buffered electrophoresis buffers; excessive voltage causing overheating; expired gels; poor water quality.
- Solutions: Prepare fresh electrophoresis buffers, pre-chill buffers before use, use gels within their effective period, ensure ultrapure water for all solutions [47].
Problem: Discrepancies Between Expected and Observed Molecular Weights
- Causes: Different buffer systems affecting prestained marker migration; variations in gel chemistry; dye-related migration anomalies.
- Solutions: Use apparent molecular weights provided by manufacturers for specific gel systems; validate with unstained markers for critical size determinations; maintain consistent experimental conditions [46] [47].
Problem: Poor Transfer Efficiency in Western Blotting
- Causes: Incomplete transfer conditions; improper membrane selection; transfer buffer issues.
- Solutions: Optimize transfer time and current; confirm transfer using prestained ladder bands on membrane; use appropriate membrane type for target protein sizes [45].
Research Reagent Solutions: Essential Materials for Protein Electrophoresis
Table 3: Essential Reagents and Materials for Protein Electrophoresis Experiments
| Reagent Category | Specific Examples | Function and Application Notes |
|---|---|---|
| Prestained Ladders | PageRuler Plus Prestained Protein Ladder (10-250 kDa) [48], Spectra Multicolor Broad Range Protein Ladder (10-260 kDa) [48] | Real-time electrophoresis monitoring, transfer verification; multicolor options enhance band identification |
| Unstained Ladders | PageRuler Unstained Protein Ladder (10-200 kDa) [48], HiMark Unstained Protein Standard (40-500 kDa) [48] | Precise molecular weight determination; compatible with all staining methods |
| Western Blot Ladders | MagicMark XP Western Protein Standard (20-220 kDa) [48], iBright Prestained Protein Ladder (11-250 kDa) [48] | Direct detection on blots via IgG binding sites; fluorescent detection options |
| Native PAGE Markers | NativeMark Unstained Protein Standard (20-1,200 kDa) [43] | Molecular weight estimation under non-denaturing conditions |
| Gel Formulation Reagents | 30% Acrylamide/Bis-acrylamide (29:1) [44], TEMED, Ammonium Persulfate (APS) [44] | Polyacrylamide gel polymerization; determines gel porosity and separation characteristics |
| Electrophoresis Buffers | Tris-Glycine-SDS Running Buffer [44], Tris-Acetate Buffer for high molecular weight proteins [48] | Maintain pH and conductivity during electrophoresis; different systems optimize separation for specific size ranges |
| Transfer Reagents | Tris-Glycine Transfer Buffer [44], PVDF or Nitrocellulose Membranes | Protein transfer from gels to membranes for immunodetection |
| Staining Reagents | Coomassie Brilliant Blue R250 [43], Ponceau S Solution [45], Silver Stain Kits | Visualize proteins in gels or on membranes; varying sensitivity levels |
The selection of an appropriate protein ladder represents a critical decision point in experimental design, with implications for data accuracy, procedural efficiency, and experimental success. Prestained protein ladders offer unparalleled convenience for real-time monitoring and transfer verification, making them ideal for routine applications, method development, and educational contexts. Unstained ladders provide superior accuracy for molecular weight determination and full compatibility with diverse detection methods, establishing them as the gold standard for publication-quality data and precise size measurements. Specialized formats, including fluorescent, Western blot-compatible, and native markers, address specific research needs and advanced applications.
Within the broader thesis context of protein ladder migration in denaturing versus native gels, this comparison underscores the fundamental principle that marker selection must align with experimental objectives and methodological requirements. Researchers must consider their specific priorities—whether convenience, precision, or specialized detection—when selecting the most appropriate protein ladder for their experimental system. As electrophoretic techniques continue to evolve alongside recombinant protein engineering and detection technologies, protein ladders will undoubtedly advance accordingly, offering researchers increasingly sophisticated tools for biomolecular separation and analysis.
For researchers and drug development professionals, the choice of electrophoretic technique is a critical determinant of experimental success. The fundamental decision between denaturing (SDS-PAGE) and native (native-PAGE) gel electrophoresis dictates the type of information one can extract about protein samples, particularly when analyzing complexes and assessing purity. Within the broader context of comparing protein ladder migration in these different systems, understanding how separation principles diverge is essential. Denaturing gels provide unparalleled resolution based primarily on polypeptide mass, while native gels preserve higher-order structures and biological activities at the cost of less straightforward interpretation. This guide objectively compares the performance of these techniques, supported by experimental data, to inform your methodological choices.
Core Principles: A Technical Comparison
The operational distinction between these techniques stems from their treatment of protein structure. In SDS-PAGE, the anionic detergent sodium dodecyl sulfate (SDS) denatures proteins by wrapping around the polypeptide backbone, and a reducing agent cleaves disulfide bonds [8] [49]. This process dissociates protein complexes into subunits and confers a uniform negative charge, meaning separation through the gel matrix occurs almost exclusively based on molecular mass [49]. Consequently, protein ladders migrate according to their linear molecular weight, enabling accurate mass determination.
In contrast, native-PAGE is performed without denaturants, preserving the protein's secondary, tertiary, and quaternary structures [8] [42]. Separation depends on the protein's intrinsic charge, size, and three-dimensional shape [49]. A protein's migration is a function of its charge-to-mass ratio and the frictional force it experiences, which is influenced by its overall bulk and conformation [8] [3]. This means a protein ladder in a native gel will not migrate strictly by molecular weight; larger, more highly charged complexes might migrate faster than smaller, less charged proteins.
Table 1: Fundamental Characteristics of Denaturing vs. Native Gels
| Feature | Denaturing (SDS-PAGE) | Native (Native-PAGE) |
|---|---|---|
| Separation Basis | Molecular mass of polypeptides [8] [49] | Net charge, size, and shape of native structure [49] |
| Protein State | Denatured into linear chains [42] | Native, folded structure preserved [42] |
| Key Reagents | SDS, reducing agents (e.g., DTT) [8] | No denaturants; mild buffers [8] |
| Quaternary Structure | Disrupted; complexes dissociated [8] | Retained; complexes remain intact [8] [49] |
| Enzymatic Activity | Destroyed [8] | Often retained [8] [49] |
| Ladder Migration | Predictable by molecular weight | Dependent on charge and conformation |
Case Study 1: Analyzing a Multi-Subunit Protein Complex
Experimental Protocol
To illustrate the differential analysis of a protein complex, consider a hypothetical experiment with a dehydrogenase enzyme, a known multimeric Zn²⁺ metalloprotein.
Sample Preparation: A purified preparation of the enzyme is split into two aliquots.
Electrophoresis: Both samples are run simultaneously on appropriate gel systems (e.g., a Bis-Tris gel for superior resolution) alongside a suitable protein ladder [16].
Detection: Post-electrophoresis, gels are stained for total protein (e.g., Coomassie Brilliant Blue). The native gel can also be incubated in a specific substrate solution to detect enzymatic activity in-situ [8].
Results and Data Interpretation
The resulting data would be interpreted as follows, demonstrating the complementary nature of the two techniques.
Table 2: Expected Results from Analysis of a Multimeric Enzyme
| Analysis Method | Observed Banding Pattern | Interpretation |
|---|---|---|
| SDS-PAGE | A single band at ~25 kDa, consistent with the monomeric subunit mass. The prestained ladder confirms mass calibration. | The enzyme complex is composed of identical subunits. The quaternary structure is fully dissociated under denaturing conditions. Purity is confirmed by the presence of a single band. |
| Native-PAGE | A single band with high enzymatic activity. Its migration does not correlate with the 25 kDa marker from the SDS-PAGE ladder but is closer to a higher mass. | The native, active multimeric complex (e.g., a tetramer of ~100 kDa) has been separated intact. Its migration is influenced by its native charge and larger size/shape. |
Workflow for Comparative Complex Analysis
Case Study 2: Establishing Sample Purity and Identity
Experimental Protocol
A common application in drug development is confirming the purity and identity of a recombinant protein, such as a His-tagged cytokine.
Sample Preparation: Cell lysates and a purified fraction are prepared.
- For SDS-PAGE, all samples are denatured and reduced.
- For native-PAGE, samples are kept in a non-denaturing buffer.
Electrophoresis and Detection: Samples are run on both systems with appropriate ladders. Following transfer to a membrane, western blotting is performed using an anti-His antibody [48].
Results and Data Interpretation
This case study highlights how the techniques answer different questions about the same sample.
Table 3: Purity and Integrity Analysis of a Recombinant Protein
| Sample & Method | Data Output | Interpretation |
|---|---|---|
| Crude Lysate (SDS-PAGE/Western) | Multiple bands in total protein stain; a single band at expected mass in western blot. | The identity (correct mass) of the His-tagged protein is confirmed. The purity of the final product is not assessable from the crude lysate. |
| Purified Fraction (SDS-PAGE/Western) | A single, sharp band at the expected mass in both total protein stain and western blot. | Confirms high purity and correct molecular weight of the final product. The denaturing conditions ensure the assessment is based on polypeptide chain mass. |
| Purified Fraction (Native-PAGE/Western) | A single band detected by western blot, but its migration may not directly report on mass. | Confirms the protein is present in a single, homogeneous native state (e.g., not aggregated or degraded), providing information about its integrity and native conformation. |
Advanced Application: Native SDS-PAGE (NSDS-PAGE)
To bridge the gap between high resolution and native state preservation, an advanced method called Native SDS-PAGE (NSDS-PAGE) has been developed [11]. This technique modifies standard SDS-PAGE conditions by omitting EDTA and reducing the SDS concentration in the running buffer while eliminating the heating step during sample preparation [11]. The impact on performance is significant.
Table 4: Performance Comparison of Standard and Native SDS-PAGE
| Performance Metric | Standard SDS-PAGE | Native SDS-PAGE (NSDS-PAGE) |
|---|---|---|
| Protein Resolution | High [11] | High (comparable to standard SDS-PAGE) [11] |
| Zn²⁺ Retention (Model Proteome) | 26% | 98% [11] |
| Enzymatic Activity Retention | 0 out of 9 model enzymes | 7 out of 9 model enzymes [11] |
| Best For | Molecular weight determination, western blotting, assessing purity by subunit composition. | Analyzing metalloproteins, studying proteins where partial activity is desirable post-electrophoresis, high-resolution separation of native complexes with some denaturant tolerance. |
The Scientist's Toolkit: Essential Research Reagents
Selecting the correct reagents is fundamental to success. The table below details key materials for these electrophoretic techniques.
Table 5: Essential Reagents for Protein Gel Electrophoresis
| Reagent / Material | Function / Description | Denaturing (SDS-PAGE) | Native (Native-PAGE) |
|---|---|---|---|
| Protein Ladders | Molecular weight standards for calibration and monitoring run progress. | Prestained or unstained ladders (e.g., PageRuler, Spectra); migration correlates with mass [48]. | NativeMark Unstained Standard; migration depends on native mass and charge [48]. |
| Gel Matrix | Polyacrylamide gel providing a sieving matrix for separation. | Bis-Tris or Tris-Glycine gels with SDS [16]. | Bis-Tris or Tris-Glycine gels without SDS or denaturants [16]. |
| Detergent | Imparts uniform charge and denatures proteins. | Sodium Dodecyl Sulfate (SDS) is critical [49]. | Not used. |
| Reducing Agent | Breaks disulfide bonds. | Dithiothreitol (DTT) or β-mercaptoethanol. | Not used. |
| Affinity Tags | For purification and sometimes detection of recombinant proteins. | His-tag, GST-tag; often used for pull-downs before electrophoresis [50] [51]. | His-tag, GST-tag; can be used for purification while maintaining native state. |
Decision Framework for Gel Selection
The comparative analysis of denaturing and native gel electrophoresis reveals a clear trade-off: resolution versus functionality. SDS-PAGE is the unequivocal choice for determining molecular weight, establishing subunit purity, and preparing samples for downstream proteomic analysis like western blotting or sequencing. Conversely, native-PAGE is indispensable for probing the functional state of proteins, analyzing complexes, and studying interactions. The emerging technique of NSDS-PAGE offers a promising hybrid approach for specific applications. The most insightful research strategies often employ these techniques in a complementary fashion, leveraging the distinct strengths of each to build a comprehensive picture of protein identity, purity, and complex nature.
Troubleshooting Migration Anomalies and Optimizing Band Resolution
A protein ladder is the fundamental standard for interpreting gel electrophoresis results. However, its migration can be skewed by the very nature of the gel matrix and running conditions, presenting a significant challenge in both denaturing and native gel electrophoresis. Understanding these differences is not merely an academic exercise; it is essential for accurate data interpretation, ensuring that observed band shifts reflect true biological phenomena rather than methodological artifacts. This guide objectively compares protein ladder migration in these two systems, providing the experimental context to diagnose and correct anomalous results.
Gel Type and Protein Ladder Migration: A Core Comparison
The choice between denaturing (SDS-PAGE) and native gel electrophoresis fundamentally changes the physical properties of proteins being separated, directly impacting how a protein ladder migrates and how it should be used for analysis [3].
| Characteristic | Denaturing Gels (SDS-PAGE) | Native Gels |
|---|---|---|
| Protein State | Denatured into linear chains [3] | In their native, folded conformation [3] |
| Key Separation Factors | Molecular mass (length of polypeptide chain) [3] | Molecular mass, overall bulk, charge, and 3D structure [3] |
| Ladder Utility | Directly indicates polypeptide molecular weight | Serves as a rough size estimate; migration is not strictly mass-dependent |
| Impact on Ladder | Ladder separation is predictable and reliable under correct conditions [52] | Ladder separation depends on maintaining intact protein structure and correct buffer conditions |
Experimental Protocols for Comparative Analysis
To systematically investigate protein ladder migration, the following protocols outline standard procedures for denaturing and native gel systems, including a modified "native SDS-PAGE" method that bridges the two approaches.
Standard Denaturing SDS-PAGE Protocol
This classic method denatures proteins to separate based almost exclusively on molecular mass.
- Sample & Ladder Preparation: Mix protein samples and ladder with an SDS-containing sample loading buffer. A typical buffer includes SDS to denature proteins and impart a uniform negative charge, a reducing agent (like DTT or β-mercaptoethanol) to break disulfide bonds, and glycerol to allow the sample to sink into the well [52].
- Denaturation: Heat the mixture at 95°C for 2-5 minutes to ensure complete linearization of the proteins. After heating, place samples directly on ice to prevent renaturation [52].
- Gel Electrophoresis: Load the denatured samples and ladder onto a polyacrylamide gel. Run the gel using a buffer containing SDS (e.g., 0.1%) and EDTA, typically at a constant voltage of 200V for approximately 45 minutes [11].
Modified Native SDS-PAGE (NSDS-PAGE) Protocol
This protocol, adapted from scientific literature, modifies standard SDS-PAGE to preserve certain native protein features while maintaining high resolution [11].
- Sample & Ladder Preparation: The key modification lies in the sample buffer. Omit SDS and EDTA from the buffer, and do not heat the samples prior to loading [11]. A proposed NSDS sample buffer composition is 100 mM Tris HCl, 150 mM Tris base, 10% glycerol, 0.01875% Coomassie G-250, and 0.00625% Phenol Red, pH 8.5 [11].
- Gel Pre-run: Pre-run the precast polyacrylamide gel (e.g., 12% Bis-Tris) in ddH₂O at 200V for 30 minutes to remove storage buffer and unpolymerized acrylamide [11].
- Gel Electrophoresis: Load the prepared native samples and ladder. Run the gel with a modified running buffer containing a reduced concentration of SDS (e.g., 0.0375%) and no EDTA [11].
The logical relationship between these protocols and their outcomes can be visualized as a decision pathway.
Quantitative Data and Experimental Findings
Empirical data highlights the practical performance differences between these methods, particularly regarding the retention of protein function and metal cofactors.
Comparison of Enzyme Activity and Metal Retention
The table below summarizes experimental data comparing the performance of standard SDS-PAGE, Blue-Native (BN)-PAGE, and the modified NSDS-PAGE method in preserving the functionality of model enzymes [11].
| Electrophoresis Method | Proteins with Retained Activity Post-Electrophoresis | Reported Zn²⁺ Retention in Proteomic Samples |
|---|---|---|
| Standard SDS-PAGE | 0 out of 9 model enzymes [11] | 26% [11] |
| Blue-Native (BN)-PAGE | 9 out of 9 model enzymes [11] | Data not provided in source |
| Native SDS-PAGE (NSDS-PAGE) | 7 out of 9 model enzymes [11] | 98% [11] |
The Scientist's Toolkit: Essential Research Reagent Solutions
Successful electrophoresis relies on specific reagents, each with a critical function. The following table details key components used in the featured experiments.
| Reagent / Material | Function in Electrophoresis |
|---|---|
| SDS (Sodium Dodecyl Sulfate) | Denatures proteins and coats them with a negative charge, allowing separation primarily by mass in denaturing gels [3] [52]. |
| DTT or β-mercaptoethanol | Reducing agents that break disulfide bonds within and between protein subunits, ensuring complete unfolding [52]. |
| Polyacrylamide Gel | A porous matrix that acts as a molecular sieve for separating proteins based on size [3]. |
| Coomassie G-250 | A dye used in some native page protocols (like BN-PAGE and NSDS-PAGE sample buffer) [11]. |
| Tris-based Buffers | Provide a stable pH environment throughout the electrophoresis run to maintain protein stability and consistent charge [11]. |
Diagnosing Incorrect Ladder Migration: A Troubleshooting Guide
Anomalous ladder migration can stem from various preparation and runtime errors. The flowchart below outlines a logical diagnostic path for common issues.
Correctly diagnosing protein ladder migration is fundamental to deriving accurate conclusions from gel electrophoresis. Researchers must align their experimental goals—whether determining precise polypeptide mass or studying native complexes and functions—with the appropriate electrophoretic method. By understanding the core principles of denaturing versus native gels and systematically applying troubleshooting protocols, scientists can ensure their ladder serves as a reliable compass, guiding accurate analysis in drug development and basic research.
Protein gel electrophoresis is a cornerstone technique in biochemistry and molecular biology, enabling researchers to separate and analyze proteins based on their size, charge, and structural properties. However, the interpretation of results from these gels is frequently complicated by artifacts such as smearing, atypical bands, and high background. These issues not only obscure data but can also lead to incorrect conclusions about protein identity, purity, and molecular weight. Understanding the distinct migration patterns of protein ladders in denaturing versus native gel systems is fundamental to identifying, troubleshooting, and resolving these common artifacts. This guide provides a systematic comparison of protein separation in these two electrophoretic environments, supported by experimental data and detailed protocols, to equip researchers with the tools needed for accurate protein analysis.
Fundamental Principles: Denaturing vs. Native Gel Electrophoresis
The migration behavior of proteins and protein ladders differs significantly between denaturing and native gel systems due to fundamental differences in how proteins are prepared and separated.
Denaturing Gels (SDS-PAGE): In this system, proteins are denatured by heating in the presence of sodium dodecyl sulfate (SDS) and a reducing agent [8]. SDS binds uniformly to the protein backbone, imparting a strong negative charge and disrupting nearly all secondary and tertiary structure [3]. The result is that proteins unfold into linear chains, and their migration through the polyacrylamide gel is determined primarily by molecular weight [16] [8]. This makes SDS-PAGE ideal for determining molecular weight, assessing sample purity, and for techniques like western blotting [3] [8].
Native Gels: In contrast, native gels preserve the protein's higher-order structure. They are run in the absence of denaturing agents, meaning that proteins remain in their folded, native state [8]. Consequently, migration depends on a combination of the protein's intrinsic charge, size, and shape [3] [16]. This technique is indispensable for studying protein complexes, protein-protein interactions, and enzymatic activity in-gel [3] [8].
The table below summarizes the core differences between these two techniques.
Table 1: Core Differences Between Denaturing and Native Gel Electrophoresis
| Feature | Denaturing Gels (SDS-PAGE) | Native Gels |
|---|---|---|
| Principle | Separation by molecular mass | Separation by charge, size, and shape |
| Protein State | Denatured and linearized | Native, folded structure |
| Reagents | SDS, reducing agents (DTT) | Non-denaturing buffers |
| Molecular Weight Determination | Accurate | Not accurate [8] |
| Key Applications | Molecular weight estimation, western blotting, purity checks | Analysis of protein complexes, enzyme activity assays, binding studies [3] |
Protein Ladder Migration: A Comparative Analysis
Protein ladders are essential references in both denaturing and native gels, but their utility and interpretation vary with the technique.
Migration in Denaturing Gels
In SDS-PAGE, commercially available protein ladders consist of denatured proteins that migrate predictably based on their molecular weight. Researchers use them to create a standard curve of log(MW) versus migration distance, allowing for the estimation of the size of unknown proteins [54]. However, a significant and common artifact in this system is atypical band migration, where proteins do not run at their expected molecular weight. This "gel shifting" is particularly prevalent for membrane proteins [55].
The underlying cause is differential detergent binding. Unlike soluble globular proteins, hydrophobic membrane proteins can bind significantly more SDS (up to 10g SDS/g protein) [55]. This altered detergent-to-protein ratio affects the charge and hydrodynamic properties of the protein-SDS complex, leading to aberrant migration. For example, a protein with a formula mass of 50 kDa might run at an apparent mass of 40 kDa. Using specialized ladders, such as those containing membrane protein standards or unstained ladders for highest accuracy, can help mitigate misinterpretation [56] [48].
Migration in Native Gels
In native gels, the situation is more complex. Protein ladders, such as the NativeMark Unstained Protein Standard, migrate based on their native charge and structure [48]. Since the proteins in a sample retain their unique charge characteristics, they will not have a uniform charge-to-mass ratio. This means a protein's migration distance is not a simple function of its molecular weight [8]. A highly negatively charged protein will migrate faster than a larger, less charged protein. Therefore, protein ladders in native gels serve more as reference points for relative comparison rather than for precise molecular weight determination.
Table 2: Comparison of Protein Ladder Migration and Common Artifacts
| Aspect | Denaturing Gels (SDS-PAGE) | Native Gels |
|---|---|---|
| Basis of Separation | Molecular weight | Mass, charge, shape, and oligomeric state |
| Ladder Function | Direct molecular weight estimation | Reference for relative migration and complex size |
| Common Artifacts | Atypical bands (especially for membrane proteins), smearing | Smearing, band broadening, loss of basic proteins |
| Primary Causes of Artifacts | Variable SDS binding, incomplete denaturation, protein degradation [55] | Protein aggregation, unstable complexes, inappropriate buffer conditions [56] |
Troubleshooting Common Artifacts
Understanding the distinct causes of artifacts in each system is the first step toward resolving them.
Atypical Bands
Atypical bands refer to bands that appear at unexpected positions, either too high or too low for their predicted molecular weight.
- In Denaturing Gels: As established, this is frequently caused by altered detergent binding in membrane proteins or proteins with unusual amino acid compositions [55]. Other causes include post-translational modifications (e.g., glycosylation, phosphorylation) which alter mass without linearizing, or incomplete denaturation where residual structure affects mobility.
- In Native Gels: Atypical banding is often the norm rather than the artifact, as migration is influenced by multiple factors. However, unexpected bands can also indicate proteolytic degradation or the presence of different oligomeric states (e.g., monomers, dimers, tetramers) of the same protein.
Smearing
Smearing appears as a diffuse, non-discrete trail of protein behind a band or across the lane.
- In Denaturing Gels: Smearing is often a sign of protein degradation by proteases, overloading of the protein sample, or incomplete solubilization [55]. Using fresh protease inhibitors, loading less protein, and ensuring complete denaturation can resolve this.
- In Native Gels: Smearing is a major challenge due to protein aggregation during electrophoresis [56] [57]. This occurs because the lack of denaturing detergents allows hydrophobic patches on proteins to interact nonspecifically. Techniques like Blue Native PAGE (BN-PAGE) or High-Resolution Clear Native Electrophoresis (hrCNE) were developed to address this. In BN-PAGE, the dye Coomassie G-250 binds to proteins, imparting a negative charge and improving solubility, thereby reducing aggregation and smearing [56] [57]. hrCNE uses non-colored detergent mixtures to achieve a similar charge-shift and solubility enhancement without interfering with in-gel fluorescence or activity assays [57].
High Background
High background refers to a general, non-specific staining of the gel, which reduces contrast and obscures bands.
- Causes in Both Systems: This artifact is commonly linked to inefficient staining or destaining of the gel. It can also be caused by contaminants in the sample buffer (e.g., leftover culture media, lipids) that bind the stain.
- Specific to Western Blotting: In western blotting, high background is often due to non-specific antibody binding. This can be mitigated by optimizing blocking conditions, antibody concentrations, and wash stringency.
The following workflow provides a systematic approach for diagnosing and correcting these common artifacts.
Experimental Protocols for Reliable Results
Protocol: Mass Estimation of Membrane Proteins Using BN-PAGE
This protocol, adapted from Wittig et al., is designed to minimize smearing and provide accurate mass estimation for membrane proteins [56].
- Sample Preparation:
- Homogenize heart tissue (e.g., bovine or chicken) in a sucrose-based buffer (250 mM sucrose, 20 mM sodium phosphate, 1 mM EDTA, pH 7.0).
- Centrifuge the homogenate and discard the supernatant. The pellet can be stored at -80°C.
- Solubilization:
- Solubilize the membrane protein pellet in a low-salt imidazole buffer (50 mM NaCl, 50 mM imidazole/HCl, pH 7.0).
- Use an appropriate detergent for your target:
- Dodecylmaltoside or Triton X-100 for individual complexes.
- Digitonin to preserve supercomplexes.
- Centrifuge at high speed (e.g., 100,000 x g) to remove insolubles.
- Gel Preparation and Electrophoresis:
- Cast a linear acrylamide gradient gel (e.g., 3.5-12%).
- Add anionic dye Coomassie Blue G-250 to the sample (to a final concentration of 0.5% dye solution) to impose a charge shift and prevent aggregation.
- Load the sample and run the gel under cold conditions (4°C) with an anode buffer (50 mM imidazole/HCl, pH 7.0) and a cathode buffer containing 0.02% Coomassie dye.
Protocol: In-Gel Activity Assay Using High-Resolution Clear Native Electrophoresis (hrCNE)
This protocol is ideal for detecting enzymatic activity after separation, avoiding the interference of Coomassie dye [57].
- Sample Preparation:
- Prepare proteins in a native, non-denaturing buffer without SDS or reducing agents.
- Solubilization and Electrophoresis:
- Solubilize membrane proteins with a mild detergent like digitonin.
- For the cathode buffer, use a non-colored mixture of anionic and neutral detergents (e.g., mixed micelles of SDS and dodecylmaltoside) instead of Coomassie dye. This provides the necessary charge shift for migration while preserving enzyme activity.
- Run the gel in the cold.
- In-Gel Activity Staining:
- After electrophoresis, incubate the gel in an appropriate reaction buffer containing substrates for the enzyme of interest (e.g., NADH and nitrotetrazolium blue for complex I). The specific activity bands will develop color directly in the gel.
The Scientist's Toolkit: Essential Reagents and Materials
The following table lists key reagents and their specific functions in mitigating artifacts in protein electrophoresis.
Table 3: Essential Research Reagent Solutions for Troubleshooting Artifacts
| Reagent/Material | Function/Application | Considerations for Artifact Prevention |
|---|---|---|
| Coomassie Blue G-250 | Charge-shift agent in BN-PAGE [56] [57] | Reduces smearing and aggregation of membrane proteins in native gels; not suitable for in-gel activity assays. |
| Dodecylmaltoside / Digitonin | Mild detergents for solubilizing native complexes [56] | Preserves protein-protein interactions; choice between them determines whether individual complexes or supercomplexes are isolated. |
| SDS (Sodium Dodecyl Sulfate) | Strong ionic denaturant for SDS-PAGE [16] [8] | Ensures linearization of proteins for MW-based separation; incomplete removal causes artifacts in native gels. |
| DTT (Dithiothreitol) / β-Mercaptoethanol | Reducing agents [8] | Breaks disulfide bonds to ensure complete unfolding; essential for accurate MW determination in SDS-PAGE. |
| Membrane Protein Markers | Mass standards from biological sources (e.g., heart mitochondria) [56] | Crucial for accurate mass calibration of membrane proteins in BN-PAGE, as soluble markers are unreliable [56]. |
| Non-colored Detergent Mixes | Charge-shift agents in hrCNE [57] | Prevents aggregation (smearing) without inhibiting in-gel fluorescence or catalytic activity, unlike Coomassie dye. |
| Protease Inhibitor Cocktails | Added to sample preparation buffers | Prevents protein degradation, a primary cause of smearing in both denaturing and native gels. |
| Prestained Protein Ladders | Visible markers for tracking electrophoresis and transfer [48] [54] | Dyes can alter migration; use unstained ladders for precise molecular weight determination. |
Successfully navigating and troubleshooting artifacts in protein gel electrophoresis requires a deep understanding of the fundamental principles separating denaturing from native techniques. Smearing, atypical bands, and high background are not random occurrences but have specific, identifiable causes rooted in the chemistry of the chosen method. Atypical migration in SDS-PAGE often points to anomalous detergent binding, particularly in membrane proteins, while smearing in native gels frequently signals problematic protein aggregation. By selecting the appropriate gel system, leveraging specialized techniques like BN-PAGE and hrCNE, and using optimal protein ladders and reagents, researchers can effectively mitigate these issues. This systematic approach ensures the generation of clear, reliable, and interpretable data, which is paramount for driving accurate conclusions in research and drug development.
Optimizing Transfer Conditions for Western Blotting After Denaturing PAGE
In western blotting, the electrophoretic transfer of proteins from a polyacrylamide gel to a solid membrane is a pivotal step that directly impacts the sensitivity, specificity, and overall success of protein detection [33]. Following denaturing PAGE (SDS-PAGE), which separates proteins based primarily on molecular weight, efficient transfer is essential for making proteins accessible to antibody probes [4]. The migration characteristics of protein ladders during electrophoresis provide crucial information about separation efficiency, but optimal transfer conditions must be established to ensure these separation patterns are faithfully reproduced on the blotting membrane for accurate analysis [8].
This guide objectively compares the primary protein transfer methods—wet, semi-dry, and dry electroblotting—within the broader context of protein ladder migration research. By presenting comparative experimental data, detailed methodologies, and practical recommendations, we aim to provide researchers with the evidence needed to select and optimize transfer conditions for their specific applications, particularly when working across different molecular weight ranges or with limited sample quantities.
Western Blot Transfer Methods: A Comparative Analysis
Fundamental Transfer Principles
Electroblotting methods all rely on the same basic principle: using an electric field to drive negatively charged protein-SDS complexes from the gel matrix onto a membrane surface [33]. The protein transfer process involves creating a "sandwich" where the gel and membrane are placed between electrodes, with the orientation arranged so proteins migrate toward the anode [58]. Despite this common foundation, significant differences exist in implementation, efficiency, and practicality among the various methods.
The choice between transfer membranes also affects outcomes. Nitrocellulose membranes offer lower background signals, while PVDF membranes provide higher protein binding capacity but may require methanol activation and can yield higher background [58]. Membrane pore size (typically 0.2 µm or 0.45 µm) should be selected based on target protein size, with smaller pores recommended for proteins under 20 kDa to prevent pass-through [58].
Comparative Method Performance
The following table summarizes the key characteristics, advantages, and limitations of the three main electroblotting techniques:
| Parameter | Wet Transfer | Semi-Dry Transfer | Dry Transfer |
|---|---|---|---|
| Transfer Time | 1-2 hours to overnight [58] [33] | 15-60 minutes [58] [33] | 3-10 minutes [33] |
| Buffer Consumption | High (∼1000 mL) [33] | Moderate (∼200 mL) [33] | None [33] |
| Equipment Cost | Economical [58] | Moderate | High (specialized stacks) [58] |
| Handling & Cleanup | Extensive cleanup, hazardous methanol waste [33] | Light cleanup [33] | Minimal cleanup [33] |
| Cooling Requirement | Often required [58] [33] | Typically not required [33] | Not required [33] |
| Typical Transfer Efficiency | 80-100% for 14-116 kDa proteins [33] | 60-80% for most proteins [58] | Comparable to wet transfer [33] |
| Best For | Quantitative data, wide MW range, high-MW proteins (>100 kDa) [58] | Routine applications, rapid results, moderate MW proteins [58] | Speed, convenience, minimal buffer handling [58] |
| Key Limitations | Time-consuming, high buffer consumption, heating issues [58] | May struggle with very high MW proteins (>300 kDa) [33] | Costly consumables, limited optimization flexibility [58] |
Method Selection Based on Protein Characteristics
Protein size significantly influences transfer efficiency and should guide method selection. The following table outlines optimized transfer conditions for different molecular weight ranges:
| Protein Size Range | Recommended Method | Optimal Conditions | Efficiency Notes |
|---|---|---|---|
| <15 kDa | Wet transfer (overnight) [58] | 25-30V, 3-4 hours or overnight; 0.2 µm membrane; reduced methanol [58] | High risk of blow-through; requires small pore membrane [58] |
| 15-50 kDa | Semi-dry or wet transfer [58] | Semi-dry: 10-25V, 15-60 min [58]; Wet: 70-100V, 1-2 hours [58] | High efficiency with both methods [58] |
| 50-100 kDa | All methods [58] | Wet: 100V, 1.5-2 hours [58]; Semi-dry: 10-25V, 15-60 min [58] | Standard transfer conditions effective [58] |
| >100 kDa | Wet transfer (overnight) [58] | 25-30V overnight; SDS in transfer buffer; reduced methanol (10-15%) [58] | Extended transfer time and SDS improve efficiency [58] |
| >300 kDa | Wet transfer exclusively [33] | 25-30V overnight; specialized buffers | Semi-dry and dry methods show significantly reduced efficiency [33] |
Experimental Protocols for Transfer Optimization
Standard Wet Transfer Protocol
The wet transfer method remains the gold standard for quantitative transfer, particularly for proteins across a wide molecular weight range [58]. The following step-by-step protocol ensures consistent results:
- Gel Equilibration: Following SDS-PAGE, carefully equilibrate the gel in transfer buffer for 5-15 minutes to prevent gel shrinkage or swelling and ensure uniform buffer composition [58] [33].
- Membrane Preparation: For nitrocellulose membranes, pre-wet in transfer buffer. For PVDF membranes, activate in methanol for 15-30 seconds, then rinse in transfer buffer [58].
- Sandwich Assembly: On the cathode (negative electrode) core, sequentially stack: fiber pad, filter paper, equilibrated gel, prepared membrane, filter paper, and fiber pad. Roll each layer thoroughly with a 15 mL tube to remove air bubbles, which can block protein transfer [58].
- Cassette Placement: Insert the completed sandwich into the transfer cassette and place it in the tank with the membrane facing the anode (positive electrode) [58] [33].
- Transfer Conditions: Fill the tank with transfer buffer and run at constant voltage or current according to protein size requirements. For large proteins (>100 kDa), use lower voltages (25-30V) overnight; for standard proteins (15-100 kDa), 70-100V for 1-2 hours is typically effective [58].
- Cooling Management: For extended transfers or high power settings, use a cooling unit or surround the tank with ice to prevent heat-induced gel deformation or protein degradation [58].
Semi-Dry Transfer Protocol
Semi-dry transfer offers a balance between speed and efficiency for most routine applications [33]:
- Component Preparation: Cut filter papers and membrane to exact gel dimensions to prevent current short-circuiting. Pre-wet all components in appropriate transfer buffer [58] [33].
- Sandwich Assembly: On the bottom anode plate, sequentially stack: pre-wetted filter paper, equilibrated gel, prepared membrane, and pre-wetted filter paper. Roll thoroughly after each addition to eliminate air bubbles [58].
- Transfer Execution: Close the apparatus with the cathode plate and run at constant current or voltage. Typical conditions are 10-25V for 15-60 minutes, depending on protein size [58]. The limited buffer volume generates significant heat, so monitor transfer time carefully.
- Process Completion: Disassemble the apparatus immediately after transfer to prevent drying and potential cracking of the gel and membrane.
Transfer Efficiency Controls and Troubleshooting
Monitoring transfer efficiency is essential for generating reproducible western blot data. Several practical methods can assess transfer success:
- Prestained Protein Ladders: These provide visual confirmation of protein migration from gel to membrane during transfer. Different colored bands can help track transfer efficiency across various molecular weights [59].
- Post-Transfer Gel Staining: Staining the gel with Coomassie Blue after transfer reveals residual proteins, indicating incomplete transfer if significant staining remains [59].
- Dual Membrane Technique: Placing two membranes in the transfer stack helps detect over-transfer, where proteins pass completely through the first membrane onto the second [59].
Common transfer issues include incomplete transfer of high molecular weight proteins (addressed by extended transfer times and SDS addition to buffer), over-transfer of small proteins (prevented with smaller pore membranes), and uneven transfer (caused by air bubbles or improper sandwich assembly) [58].
The Researcher's Toolkit: Essential Materials for Western Blot Transfer
Successful protein transfer requires specific reagents and materials optimized for different experimental needs:
| Tool/Reagent | Function/Purpose | Selection Guidelines |
|---|---|---|
| Transfer Membranes | Immobilizes transferred proteins for antibody probing [58] | Nitrocellulose: general use, lower background; PVDF: higher binding capacity, better for low-abundance targets [58] |
| Protein Ladders | Molecular weight standards for size estimation and transfer monitoring [48] | Prestained: track transfer visually; Unstained: precise MW determination; Specialty ladders: his-tagged, fluorescent, or IgG-binding variants [48] |
| Transfer Buffers | Conducts current and maintains protein charge during transfer [58] | Standard Tris-glycine with methanol: most applications; Low-methanol or methanol-free: better for high MW proteins; Commercially optimized buffers: specific systems [58] |
| Filter Papers/Sponges | Ensures even contact between gel and membrane, wicks buffer [58] | High-quality, uniform thickness papers prevent uneven transfer; Sponges must be thoroughly saturated [58] |
| Electrophoresis Systems | Provides controlled electric field for protein separation and transfer [4] | Compatible gel formats and sandwich configurations; Cooling capability for extended runs [58] |
Experimental Workflow and Decision Pathway
The following diagram illustrates the logical decision process for selecting and optimizing western blot transfer methods based on experimental requirements:
Western Blot Transfer Method Decision Pathway
This workflow emphasizes how protein characteristics, experimental objectives, and practical constraints should guide method selection. Researchers should prioritize their primary requirement—whether it's resolution for publication, speed for screening, or cost-effectiveness for high-throughput applications—when making final decisions.
Optimizing transfer conditions following denaturing PAGE requires careful consideration of multiple interdependent factors. Protein size remains the primary determinant for method selection, with wet transfer providing superior performance for extreme molecular weights (both very small and very large proteins), while semi-dry and dry methods offer compelling advantages in speed and convenience for routine applications within the 15-100 kDa range [58] [33].
The migration patterns of protein ladders in denaturing versus native PAGE systems provide critical insights into protein behavior during separation, but these patterns must be faithfully preserved during transfer to generate meaningful western blot data [8]. By matching transfer methodology to experimental priorities—whether maximum sensitivity, quantitative accuracy, or workflow efficiency—researchers can significantly enhance the reliability and reproducibility of their protein detection results.
Future developments in transfer technology will likely focus on reducing transfer times while maintaining efficiency across broader molecular weight ranges, as well as creating more sustainable alternatives to current buffer systems. Regardless of these advancements, the fundamental principles outlined in this guide will continue to provide a foundation for effective protein transfer in western blotting applications.
The Role of Buffer Systems, pH, and Acrylamide Percentage in Resolution
Gel electrophoresis serves as a fundamental tool in molecular biology laboratories worldwide, enabling researchers to separate, analyze, and characterize proteins based on their physicochemical properties. Within this technique, three critical parameters—buffer system composition, pH conditions, and acrylamide percentage—collectively determine the resolution efficiency and reliability of results. These factors become particularly significant when comparing protein migration patterns across different electrophoretic modalities, especially in denaturing versus native gel systems.
The discontinuous buffer system pioneered by Laemmli revolutionized protein electrophoresis by creating conditions that initially stack proteins into sharp bands before resolving them by size [60]. This system exploits carefully orchestrated differences in pH and ionic composition between stacking and resolving gels to concentrate samples into thin zones, dramatically improving resolution compared to continuous systems. Understanding the nuanced interplay between these parameters provides researchers with the ability to optimize separations for specific protein classes and experimental requirements.
This guide objectively compares how buffer systems, pH, and acrylamide percentage impact resolution in denaturing versus native polyacrylamide gel electrophoresis (PAGE), providing supporting experimental data and methodologies relevant for researchers investigating protein ladder migration patterns.
Fundamental Principles of Gel Electrophoresis
Denaturing Versus Native Gel Systems
Protein electrophoresis employs two primary approaches that maintain or disrupt native protein structure, each with distinct applications and separation mechanisms.
Table 1: Comparison of Denaturing vs. Native Gel Electrophoresis
| Parameter | Denaturing Gels (SDS-PAGE) | Native Gels |
|---|---|---|
| Protein State | Denatured into linear polypeptides | Maintains native structure |
| Separation Basis | Primarily by molecular mass [3] | By mass, charge, size, and shape [9] |
| Buffer Conditions | SDS and reducing agents present | No denaturing agents |
| Charge Properties | SDS confers uniform negative charge | Intrinsic charge of native protein |
| Applications | Molecular weight determination, purity assessment [3] | Studying oligomeric states, enzyme activity, protein complexes [3] |
| Resolution Influences | Acrylamide percentage, buffer system | Acrylamide percentage, pH, buffer composition |
In denaturing SDS-PAGE, the anionic detergent sodium dodecyl sulfate (SDS) unfolds proteins and binds to polypeptide backbones at a constant ratio of approximately 1.4g SDS per 1g protein [9]. This SDS coating confers a uniform negative charge density, effectively neutralizing proteins' intrinsic charges and allowing separation based primarily on molecular mass as proteins migrate through the polyacrylamide matrix [60]. The addition of reducing agents like β-mercaptoethanol or dithiothreitol breaks disulfide bonds, ensuring complete denaturation into subunit polypeptides [5].
In contrast, native PAGE preserves protein higher-order structure—including secondary, tertiary, and quaternary arrangements—enabling separation based on the combined effects of molecular mass, intrinsic charge, and three-dimensional conformation [9]. This technique proves invaluable for studying functional protein complexes, enzyme activity, and oligomeric states while maintaining biological function post-separation [3].
Key Components Affecting Resolution
Three interconnected factors primarily govern resolution in protein electrophoresis:
Buffer Systems establish the ionic environment and pH conditions that control electrophoretic mobility. The discontinuous system utilizes different buffers in the gel and electrode chambers to create moving boundaries that stack proteins into sharp zones before entry into the resolving gel [60]. Specific ions within these systems function as leading ions (e.g., chloride) with high electrophoretic mobility or trailing ions (e.g., glycine) with lower mobility, creating a voltage gradient that concentrates protein samples [60].
pH Conditions critically influence protein charge states and migration behavior. In SDS-PAGE, different pH values in stacking (pH 6.8) versus resolving (pH 8.8) gels create conditions where glycine exists primarily as a zwitterion in the stacking gel but becomes more negatively charged in the resolving gel, facilitating the stacking and separation process [60]. In native PAGE, pH affects the intrinsic charge of proteins based on their isoelectric points relative to the buffer pH.
Acrylamide Percentage determines the gel pore size and sieving properties. Polyacrylamide gels form through copolymerization of acrylamide and bisacrylamide, creating a cross-linked matrix with pore sizes inversely related to the total acrylamide concentration [9]. Lower percentage gels (e.g., 7-10%) feature larger pores suitable for resolving high molecular weight proteins, while higher percentages (e.g., 12-20%) with smaller pores better resolve lower molecular weight proteins [9]. Gradient gels with increasing acrylamide concentration from top to bottom broaden the effective separation range for complex protein mixtures.
Buffer System Comparisons
Traditional and Novel Buffer Formulations
Various buffer systems have been developed to optimize protein separation across different molecular weight ranges and experimental requirements.
Table 2: Comparison of Electrophoresis Buffer Systems
| Buffer System | Components | Optimal Separation Range | Running Conditions | Key Advantages |
|---|---|---|---|---|
| Laemmli (Tris-Glycine) | Tris, glycine, SDS [61] | 10-200 kDa [61] | 90-120 min at 100-150V | Established standard, low cost [61] |
| Tris-Tricine | Tris, tricine, SDS [61] | <15 kDa | 3-5 hours [61] | Superior resolution of small proteins |
| Tris-Tricine-HEPES (FRB) | Tris, tricine, HEPES [61] | 15-450 kDa in single 10% gel [61] | 35 min total (150V for 15 min, then 200V for 20 min) [61] | Wide separation range, reduced running time, minimal heat generation [61] |
| Tris-Acetate | Tris, acetate, SDS | Large proteins (>100 kDa) | Varies by protocol | Enhanced resolution of high molecular weight complexes |
The traditional Laemmli Tris-Glycine-SDS system remains the most widely used buffer due to its simplicity and cost-effectiveness, though it exhibits limitations in resolving small proteins (<15 kDa) and requires relatively long running times [61]. The Tris-Tricine system, developed by Schägger and von Jagow, significantly improves resolution of low molecular weight polypeptides but cannot simultaneously resolve small (<15 kDa) and large (>100 kDa) proteins effectively [61].
Recent innovations include the Tris-Tricine-HEPES "Fast-Running Buffer" (FRB) system, which creates multiple ionic boundaries instead of the traditional two-boundary system, enhancing resolving power across an exceptionally broad molecular weight range (15-450 kDa) in a single 10% polyacrylamide gel [61]. This system also substantially reduces running time to approximately 35 minutes without excessive heat generation, addressing a significant limitation of traditional buffers for high-throughput applications [61].
pH-Mediated Stacking and Resolution Mechanisms
The discontinuous nature of SDS-PAGE relies critically on pH differences between stacking (pH 6.8) and resolving (pH 8.8) gel regions [60]. This pH differential governs the charge state of glycine molecules, which are zwitterionic (carrying both positive and negative charges) in the stacking gel but become predominantly negatively charged glycinate anions in the resolving gel [60].
This transition creates a fundamental shift in electrophoretic mobilities: in the stacking gel, chloride ions (from Tris-HCl) migrate fastest as leading ions, glycine zwitterions migrate slowest as trailing ions, and proteins concentrate between these fronts in a sharp zone [60]. Upon reaching the resolving gel at higher pH, glycinate ions gain negative charge and migrate faster than proteins, depositing the concentrated protein band at the top of the resolving gel where size-based separation occurs [60].
Diagram Title: Protein Stacking and Separation Mechanism
In native PAGE, buffer pH selectively influences protein migration based on intrinsic charge characteristics without the masking effect of SDS. Proteins carry net negative charges in alkaline running buffers, with higher charge density correlating with faster migration, while the gel matrix simultaneously exerts sieving effects based on protein size and shape [9].
Acrylamide Percentage and Gel Composition
Polyacrylamide Pore Size and Molecular Sieving
The polyacrylamide gel matrix serves as a molecular sieve, with pore sizes determined by the concentration of acrylamide and bisacrylamide cross-linker. The pore size is inversely related to the acrylamide percentage, with higher percentages creating smaller pores that more strongly retard protein migration [9].
Table 3: Acrylamide Percentage and Optimal Separation Ranges
| Acrylamide Percentage | Effective Separation Range | Gel Pore Size | Primary Applications |
|---|---|---|---|
| 6-8% | 50-300 kDa | Large | Very high molecular weight proteins |
| 10% | 20-200 kDa | Medium | Standard mixture of proteins |
| 12% | 15-100 kDa | Medium-small | Common range for many cellular proteins |
| 15% | 10-70 kDa | Small | Low to medium molecular weight proteins |
| 4-20% Gradient | 10-300 kDa | Variable (large to small) | Broad range separation, unknown samples |
Lower percentage gels (e.g., 6-8%) with larger pores facilitate migration of high molecular weight proteins, while higher percentages (e.g., 12-15%) with smaller pores provide better resolution of lower molecular weight proteins [9]. Gradient gels with increasing acrylamide concentration from top to bottom combine the advantages of both approaches, allowing proteins to migrate rapidly through low-percentage regions before encountering increasing resistance in higher-percentage regions, resulting in superior band sharpness across a broad molecular weight range [9].
Acrylamide Effects in Denaturing Versus Native Systems
The impact of acrylamide percentage differs significantly between denaturing and native electrophoresis formats. In denaturing SDS-PAGE, where proteins assume linear conformations with similar charge-to-mass ratios, migration distance shows an approximately logarithmic inverse relationship with molecular weight for a given acrylamide percentage [9]. This predictable relationship enables accurate molecular weight estimation using protein ladders.
In native PAGE, where proteins maintain their three-dimensional structures, the relationship between migration distance and molecular weight becomes more complex [3]. Compact proteins migrate faster than extended proteins of identical molecular weight, and variations in intrinsic charge further influence mobility. Consequently, acrylamide percentage optimization proves more empirical in native systems, often requiring preliminary trials to establish ideal separation conditions for specific protein complexes.
Experimental Protocols and Data Analysis
Protocol: Comparative Buffer System Evaluation
This protocol enables direct comparison of different buffer systems for resolving standard protein ladders and experimental samples.
Materials:
- 30% acrylamide/bisacrylamide solution (37.5:1)
- Tris-HCl (1.5M, pH 8.8)
- Tris-HCl (0.5M, pH 6.8)
- 10% SDS solution
- Ammonium persulfate (10%)
- TEMED
- Protein ladder (broad molecular weight range)
- Experimental protein samples
- Laemmli running buffer: 25mM Tris, 192mM glycine, 0.1% SDS, pH 8.3 [61]
- Tris-Tricine-HEPES FRB: 50mM Tris, 50mM tricine, 50mM HEPES, 0.1% SDS [61]
- Electrophoresis apparatus with power supply
Method:
- Prepare identical 10% polyacrylamide gels (8.0 × 7.3 cm) with stacking layers (5% acrylamide, pH 6.8) and resolving layers (10% acrylamide, pH 8.8) according to standard formulations [61].
- Pre-run gels for 15 minutes in respective buffer systems.
- Load protein ladder and experimental samples in parallel lanes across different buffer systems.
- Run Laemmli buffer gels at 100V for 90 minutes and FRB gels at 150V for 15 minutes followed by 200V for 20 minutes [61].
- Stain gels with Coomassie Blue or SYPRO Ruby for visualization.
- Capture images using gel documentation system and analyze band sharpness, resolution, and migration linearity using image analysis software.
Expected Results: The FRB system should provide comparable or superior resolution across a broader molecular weight range in significantly less time than the traditional Laemmli system [61]. Band sharpness can be quantified by full-width at half-maximum measurements, with lower values indicating better resolution.
Protocol: Acrylamide Percentage Optimization
This protocol determines the optimal acrylamide percentage for resolving specific protein targets in both denaturing and native conditions.
Materials:
- 30% acrylamide/bisacrylamide solution (37.5:1)
- Tris buffers (as in Protocol 5.1)
- Native running buffer: 25mM Tris, 192mM glycine, pH 8.8
- Protein standards of known molecular weight and native dimensions
Method:
- Prepare denaturing and native gels with acrylamide percentages of 8%, 10%, 12%, and 15%.
- For denaturing gels, prepare samples in Laemmli buffer with SDS and reducing agents; for native gels, prepare samples in buffer without denaturants.
- Run denaturing gels at constant current (25mA per gel) until dye front reaches bottom.
- Run native gels at constant voltage (100V) at 4°C to prevent denaturation.
- Stain and visualize proteins as in Protocol 5.1.
- Plot log(molecular weight) versus migration distance for denaturing gels to establish linearity ranges.
- For native gels, compare relative migration distances of standard proteins.
Expected Results: Denaturing gels should show linear semilogarithmic relationships between molecular weight and migration distance, with different linear ranges for each acrylamide percentage. Native gels will demonstrate more complex migration patterns influenced by protein shape and charge in addition to size.
The Scientist's Toolkit: Essential Research Reagents
Table 4: Essential Reagents for Electrophoresis Experiments
| Reagent/Category | Function | Key Considerations |
|---|---|---|
| Acrylamide/Bis-acrylamide | Forms porous gel matrix | Ratio determines pore size; 37.5:1 common |
| Tris Buffer | pH maintenance | pKa 8.1 ideal for biological pH range [60] |
| Glycine | Trailing ion in discontinuous systems | Charge state pH-dependent [60] |
| SDS (Sodium Dodecyl Sulfate) | Denatures proteins, confers negative charge | Binds ~1.4g per 1g protein [9] |
| TEMED/Ammonium Persulfate | Polymerization catalysts | Fresh APS solution recommended |
| DTT/β-Mercaptoethanol | Reducing agents | Break disulfide bonds |
| Coomassie/SYPRO Stains | Protein visualization | Different sensitivity thresholds |
| Precision Plus Marker | Molecular weight standards | Dual-color for easy orientation |
Buffer systems, pH conditions, and acrylamide percentage collectively form an integrated system that determines electrophoretic resolution. The traditional Laemmli Tris-Glycine buffer remains adequate for routine separations, while novel formulations like Tris-Tricine-HEPES FRB offer expanded separation ranges and reduced run times [61]. The discontinuous pH system is essential for effective protein stacking and sharp band formation [60]. Acrylamide percentage must be carefully matched to target protein size ranges, with gradient gels providing the broadest separation capability [9].
For researchers comparing protein ladder migration in denaturing versus native systems, methodological consistency is essential. While denaturing SDS-PAGE provides predictable size-based separation, native PAGE reveals information about protein complexes and functional states that remains inaccessible in denatured systems [3]. Understanding these fundamental principles enables researchers to strategically optimize electrophoresis conditions for specific experimental requirements in drug development and proteomic research.
For researchers characterizing complex protein mixtures, particularly native macromolecular assemblies, the choice of electrophoretic technique is paramount. While denaturing SDS-PAGE separates proteins primarily by mass after disrupting higher-order structures, native gel systems preserve protein complexes in their functional states, enabling the analysis of quaternary structure, enzymatic activity, and protein-protein interactions [8] [62]. Among native techniques, Blue Native PAGE (BN-PAGE) has emerged as a powerful tool for separating membrane protein complexes and oxidative phosphorylation (OXPHOS) systems in their native oligomeric states, typically in the mass range of 10 kDa to 10 MDa [56] [14]. A key variant, Clear Native PAGE (CN-PAGE), offers complementary advantages for specific downstream applications. The resolution of these techniques is critically enhanced by the use of polyacrylamide gradient gels, which provide a pore size gradient that separates complexes over a broad molecular weight range [56]. This guide provides a objective comparison of these advanced techniques, focusing on their performance characteristics, optimal applications, and practical implementation for research and drug development.
Fundamental Principles and Comparative Analysis
Core Separation Mechanisms
The fundamental difference between electrophoretic techniques lies in their treatment of protein structure and the resulting separation principles:
Denaturing SDS-PAGE employs the anionic detergent sodium dodecyl sulfate (SDS) and heat to fully denature proteins into linear polypeptides. SDS binds to proteins in a constant weight ratio, imparting a uniform negative charge density. Separation occurs primarily based on polypeptide chain length as proteins migrate through the polyacrylamide matrix [8] [62]. This makes molecular weight estimation straightforward but destroys all higher-order structure and function.
In contrast, Native PAGE techniques preserve protein structure and function. Separation depends on a combination of factors including the protein's intrinsic charge, size, and three-dimensional shape [8] [62]. In basic native systems without additives, proteins with pI < 7.5 migrate toward the anode, while more basic proteins may be lost [56].
BN-PAGE introduces the anionic dye Coomassie Blue G-250, which binds to hydrophobic protein surfaces and basic amino acid residues. This binding imposes a uniform negative charge shift, ensuring all proteins migrate toward the anode regardless of their intrinsic charge [56] [14]. This allows membrane proteins and basic proteins to be separated effectively while maintaining native structure.
CN-PAGE represents a milder approach that avoids Coomassie dye. In its high-resolution form (hrCN-PAGE), mixed anionic and neutral detergents in the cathode buffer provide a charge shift mechanism similar to BN-PAGE but without potential dye interference [56].
Technical Comparison of Methodologies
The table below summarizes the key characteristics and optimal applications of each major technique:
Table 1: Comparative Analysis of Protein Electrophoresis Techniques
| Parameter | SDS-PAGE | BN-PAGE | CN-PAGE/hrCN-PAGE |
|---|---|---|---|
| Separation Basis | Polypeptide molecular mass [62] | Native mass & shape (with charge normalization) [56] | Native charge, size & shape [63] [56] |
| Protein State | Denatured, reduced subunits [62] | Native complexes & oligomers [14] | Native complexes & oligomers [63] |
| Key Additives | SDS, reducing agents [62] | Coomassie Blue G-250 [14] | Mixed detergents (hrCNE) [56] |
| Mass Resolution | High for polypeptide chains [11] | Moderate for complexes (10 kDa-10 MDa) [56] | Lower than BN-PAGE for mass estimation [63] |
| Enzymatic Activity | Not preserved [11] | May be impaired by dye [14] | Preserved (no dye interference) [63] [14] |
| Membrane Proteins | Denatured subunits only [62] | Excellent resolution [56] [14] | Good, retains labile assemblies [63] |
| Typical Applications | Molecular weight determination, purity checks [62] | Analysis of protein complexes, supercomplexes [14] | In-gel activity assays, FRET analyses [63] |
Practical Workflow and Process
The following diagram illustrates the key decision points and procedural workflow for selecting and implementing these electrophoretic techniques:
Experimental Protocols and Methodologies
BN-PAGE for OXPHOS Complexes and Supercomplexes
Sample Preparation from Cultured Cells
- Harvest cells by trypsinization, wash with PBS, and pellet by centrifugation [14].
- Solubilize membrane proteins using mild non-ionic detergents. Digitonin (3.0g/g detergent/protein ratio) preserves supramolecular structures like respiratory supercomplexes, while n-dodecyl-β-D-maltoside is suitable for individual complexes [14] [64].
- Use low salt concentration (<50 mM NaCl) in extraction buffer and avoid potassium or divalent cations that may precipitate [64].
- Add Coomassie Blue G-250 dye to sample at 1:8 (gram/gram) detergent/dye ratio to impose charge shift [56] [64].
Gel Preparation and Electrophoresis
- Prepare linear acrylamide gradient gels (typically 3-12% or 4-16%) using a gradient mixer [56] [14]. Imidazole-based buffers are recommended over Bis-Tris for compatibility with downstream protein assays [56] [64].
- Cast gels at 4-7°C using solutions of decreasing density, pumping the low acrylamide solution first to create a reproducible low-percentage layer [56].
- Load samples and run with blue cathode buffer (containing 0.02% Coomassie Blue G-250) initially at constant 100V for approximately 1 hour [64].
- Replace with colorless cathode buffer to limit dye interference during transfer, continuing electrophoresis at constant 12-15mA for 1-2 hours at 4°C to preserve complex integrity [64].
CN-PAGE for In-Gel Activity Assays
Sample Preparation and Solubilization
- Follow similar solubilization procedures as BN-PAGE but omit Coomassie dye from sample buffer [63] [14].
- For mitochondrial complexes, use digitonin solubilization to preserve labile supramolecular assemblies that might dissociate under BN-PAGE conditions [63].
Electrophoresis and Activity Staining
- Use hrCN-PAGE with cathode buffer containing mixed anionic micelles of neutral and anionic detergents to provide charge shift without dye interference [56].
- Following electrophoresis, incubate gel in specific reaction mixtures to detect enzymatic activity [14] [23].
- For Medium-Chain Acyl-CoA Dehydrogenase (MCAD), stain with solution containing physiological substrate (octanoyl-CoA) and nitro blue tetrazolium chloride, which forms purple diformazan precipitate at active enzyme bands [23].
- For ATP synthase (Complex V), CN-PAGE enables detection of enzymatically active oligomeric states not observed with BN-PAGE [63].
Two-Dimensional BN/SDS-PAGE for Comprehensive Analysis
First Dimension (BN-PAGE)
Gel Lane Processing and Second Dimension
- Excise BN-PAGE lanes cleanly using a fresh razor blade [64].
- Incubate excised lane in 1% SDS and 1% mercaptoethanol solution at 60°C for 40 minutes to denature protein complexes [64].
- Wash lane thoroughly with water and place horizontally on top of a second gel plate [64].
- Pour SDS-PAGE separating gel, followed by stacking gel that embeds the BN-PAGE lane [64].
- Perform standard SDS-PAGE to separate individual subunits by molecular weight [14].
Critical Reagents and Research Solutions
Table 2: Essential Research Reagents for Native Electrophoresis
| Reagent/Category | Function & Importance | Specific Examples & Notes |
|---|---|---|
| Detergents | Solubilize membrane proteins while preserving native interactions [14] | Digitonin: Preserves supercomplexes [14].n-Dodecyl-β-D-maltoside: Solubilizes individual complexes [14].Triton X-100: Alternative for individual complexes [56]. |
| Charge Shift Agents | Ensure anodic migration of all proteins | Coomassie Blue G-250: Binds hydrophobic surfaces & basic residues (BN-PAGE) [56] [14].Mixed detergent micelles: Provide charge shift without color (hrCN-PAGE) [56]. |
| Buffer Components | Maintain pH and provide conducting ions | 6-Aminocaproic acid: Zwitterionic salt, prevents aggregation [14].Bis-Tris or Imidazole: Buffering at pH ~7.0 [56] [64]. |
| Gel Matrix Components | Create pore size gradient for separation | Acrylamide/Bis-acrylamide: Polymerizing to form porous matrix [62].Gradient gels (3-16%): Broader separation range than single-% gels [56] [14]. |
| Molecular Weight Standards | Mass calibration for native complexes | Membrane protein markers: Heart tissue extracts most reliable [56].Soluble protein standards: Limited accuracy for membrane proteins [56]. |
Performance Data and Technical Considerations
Quantitative Migration and Resolution Data
The separation behavior of proteins differs significantly between native and denaturing conditions, affecting mass estimation accuracy:
Table 3: Migration Characteristics Across Electrophoretic Techniques
| Technique | Effective Separation Range | Mass Estimation Accuracy | Key Limitations |
|---|---|---|---|
| SDS-PAGE | 5-250 kDa (polypeptides) [30] | High for polypeptide chains [62] | Destroys native structure and function [11] |
| BN-PAGE | 10 kDa - 10 MDa (native complexes) [56] | Good with membrane protein markers [56] | Coomassie dye may interfere with activity assays [63] [14] |
| CN-PAGE | Limited for basic proteins (pI >7.5) [56] | Complicated by intrinsic charge [63] | Lower resolution than BN-PAGE [63] |
| hrCN-PAGE | Broad with charge shift [56] | Better than CN-PAGE, less than BN-PAGE [56] | Requires optimization of detergent mixtures [56] |
Key Technical Considerations for Researchers
Mass Estimation Considerations:
- Considerable discrepancies exist between migration behavior of membrane and soluble protein markers [56].
- Soluble standard proteins should not be used for mass estimation of membrane proteins except with special gel types and electrophoresis conditions [56].
- Membrane protein markers from mitochondrion-rich heart tissue (bovine, chicken, rodent) provide more reliable calibration [56].
Technique Selection Guidelines:
- BN-PAGE is preferred for standard analyses of membrane protein complexes due to robust resolution and reliable mass estimation [63] [56].
- CN-PAGE/hrCN-PAGE is optimal when Coomassie dye interferes with downstream techniques, particularly in-gel catalytic activity assays or fluorescence-based analyses like FRET [63] [14].
- The combination of digitonin solubilization with CN-PAGE can retain labile supramolecular assemblies that dissociate under BN-PAGE conditions [63].
Recent Methodological Advances:
- Enhanced in-gel activity staining protocols now provide improved sensitivity for Complex V (ATP synthase) detection [14].
- High-resolution CN-PAGE methods enable functional analysis of metabolic enzymes like acyl-CoA dehydrogenases, distinguishing active tetramers from inactive aggregates in deficiency disorders [23].
- Simplified sample extraction procedures adapted for small patient samples (e.g., tissue biopsies, cultured fibroblasts) maintain robustness while requiring less material [14].
Data Validation: Directly Comparing Results Across Gel Platforms
For researchers in biochemistry and drug development, accurately determining protein molecular weight (MW) via gel electrophoresis is a fundamental technique. However, a critical and often overlooked factor is that the migration profile of a protein ladder is not absolute; it is profoundly influenced by the electrophoretic method employed. A protein's apparent MW can differ significantly between denaturing and native gel systems. This guide provides a side-by-side comparison of these migration profiles, empowering scientists to correctly interpret their results and avoid potential pitfalls in data analysis. Understanding these differences is essential for troubleshooting experiments, such as western blots, and for investigating protein complexes, post-translational modifications, and native functional properties [7] [3] [11].
Fundamental Principles: Denaturing vs. Native Gels
The core difference between denaturing and native gel electrophoresis lies in the state of the protein during separation, which directly dictates what property the migration reflects.
The following diagram illustrates the key differences in protein structure and separation principles between these two techniques:
- Denaturing Gels (SDS-PAGE): In this method, proteins are denatured with sodium dodecyl sulfate (SDS) and heat, which disrupts their secondary and tertiary structure, resulting in linear polypeptide chains. SDS binds uniformly to the protein backbone, imparting a consistent negative charge that masks the protein's intrinsic charge. Consequently, separation occurs almost exclusively based on molecular mass, with smaller proteins migrating faster [3].
- Native Gels: In contrast, native gels run proteins in their natural, folded state without denaturation. This means the protein's overall bulk, intrinsic charge (based on its amino acid composition), and three-dimensional shape all influence its migration through the gel matrix. This method is ideal for studying functional properties like enzyme activity, protein-protein interactions, and oligomeric states [3] [11].
Quantitative Comparison of Migration Profiles
The theoretical migration based on formula weight can be inconsistent with observed results. The table below summarizes how different protein characteristics affect migration in each system.
Table 1: Factors Influencing Protein Migration in Different Gel Systems
| Protein Characteristic | Impact on Denaturing (SDS-PAGE) Migration | Impact on Native Gel Migration |
|---|---|---|
| Molecular Mass | Primary determinant of migration. | A contributing factor, but not the sole determinant. |
| 3D Structure / Shape | Minimized impact due to denaturation. | Major factor; compact proteins migrate faster. |
| Intrinsic Charge | Masked by SDS binding. | Major factor; more negative charge increases migration. |
| Post-Translational Modifications (e.g., glycosylation) | Can cause anomalous migration (slower). | Significant impact based on changes to size and charge. |
| Hydrophobicity (Membrane Proteins) | Often causes anomalous migration due to atypical SDS binding [55]. | Significant impact on protein-detergent complexes. |
The discrepancy between a protein's formula weight and its apparent molecular weight on a gel is known as a "gel shift." This is particularly common for membrane proteins, which can show shifts ranging from -46% (faster migration) to +48% (slower migration) in SDS-PAGE [55]. This anomalous behavior has been conclusively linked to altered detergent binding. Hydrophobic transmembrane domains can bind significantly more SDS (up to 10 g SDS/g protein) than the canonical 1.4 g SDS/g protein for globular proteins, altering the mass and charge of the protein-detergent complex and thus its migration [55].
Experimental Protocols & Data
To illustrate the practical differences, below are generalized protocols for standard SDS-PAGE and a modified native SDS-PAGE that preserves some functional properties.
Table 2: Comparison of Standard SDS-PAGE and Native SDS-PAGE Protocols
| Component | Standard SDS-PAGE [11] | Native SDS-PAGE (NSDS-PAGE) [11] |
|---|---|---|
| Sample Buffer | Contains SDS (LDS) and a reducing agent (e.g., DTT). Sample is heated at 70°C for 10 minutes. | Contains Coomassie G-250. No SDS or EDTA. Sample is not heated. |
| Running Buffer | Contains 0.1% SDS and 1 mM EDTA. | Contains a reduced SDS concentration (0.0375%) and no EDTA. |
| Key Outcome | Denatures proteins; destroys non-covalent bonds and activity. | Retains native activity for many enzymes; dramatically increases metal cofactor retention (e.g., Zn²⁺ retention increased from 26% to 98%). |
The migration patterns of protein ladders themselves are also condition-dependent. The apparent molecular weight of each band in a prestained ladder is determined by calibration against an unstained standard under specific electrophoretic conditions, and these patterns can change if conditions are altered [65].
The Scientist's Toolkit: Essential Research Reagents
Successful electrophoresis relies on a set of key reagents. The following table details essential materials and their functions for both denaturing and native gel experiments.
Table 3: Essential Reagents for Gel Electrophoresis
| Research Reagent | Function in Denaturing Gels | Function in Native Gels |
|---|---|---|
| SDS (Sodium Dodecyl Sulfate) | Denatures proteins and confers uniform negative charge. | Typically omitted or used in very low concentrations. |
| Coomassie G-250 | Not typically used in sample buffer. | Used in the sample buffer (e.g., BN-PAGE, NSDS-PAGE) to confer charge and improve resolution [11]. |
| Protein Ladder | Prestained or unstained standards of known molecular mass for size estimation. | Critical for referencing. Note: migration will differ from denaturing gels. |
| Beta-Mercaptoethanol or DTT | Reducing agents that break disulfide bonds for complete denaturation. | Often omitted to preserve native quaternary structure. |
| Acrylamide/Bis-Acrylamide | Forms the porous gel matrix that separates proteins based on size. | Forms the gel matrix, separating based on size, charge, and shape. |
| AP/TEMED | Catalyzes the polymerization of the acrylamide gel. | Catalyzes the polymerization of the acrylamide gel. |
A Guide to Interpreting Migration Anomalies
When a protein's migration does not match expectations, consider the following steps:
- Confirm Gel Type: First, verify whether you are using a denaturing or native system. A native gel will almost always show a different migration profile than a denaturing gel for the same protein.
- Check the Ladder: Ensure you are using a ladder appropriate for your gel type. A ladder calibrated for SDS-PAGE will not provide accurate size estimates on a native gel.
- Investigate Protein Properties: If an anomaly persists in SDS-PAGE, consider the protein's biochemical characteristics:
- Consult Reference Databases: For common proteins and cell lines, resources like the publicly available database at https://pumba.dcsr.unil.ch/ can provide accurate migration patterns measured by SDS-PAGE coupled with mass spectrometry [7].
Correctly interpreting your protein ladder is the foundation for reliable data interpretation in gel electrophoresis. By understanding the distinct migration profiles in denaturing versus native conditions and recognizing the sources of anomalous migration, researchers can make informed decisions, properly troubleshoot experiments, and draw accurate conclusions about protein size, structure, and function.
Validating Molecular Weight in Denaturing Gels vs. Size Estimation in Native Gels
Gel electrophoresis is a foundational technique in molecular biology for separating proteins based on their physical properties. The choice between denaturing and native gel systems is critical, as each provides fundamentally different information about the protein sample. Denaturing gels, primarily SDS-PAGE, unravel proteins and allow separation based predominantly on polypeptide chain mass, enabling accurate molecular weight validation [9]. In contrast, native PAGE separates proteins in their intact, folded state, where migration depends on a combination of the protein's intrinsic charge, size, and three-dimensional shape, resulting in a functional size estimation of the native complex [3] [8]. This guide objectively compares the migration of protein ladders and samples in these two systems, providing the experimental data and protocols necessary for researchers to select and correctly interpret the appropriate method.
Comparative Analysis: Separation Mechanisms and Outcomes
The underlying mechanism of separation dictates every aspect of experimental outcome, from sample preparation to data interpretation.
In SDS-PAGE, the anionic detergent sodium dodecyl sulfate (SDS) binds to proteins in a constant mass ratio, conferring a uniform negative charge [9]. Combined with a reducing agent (e.g., DTT) and heat, this process denatures the protein, breaks disulfide bonds, and disrupts all tertiary and quaternary structures [32] [8]. The result is a linearized polypeptide chain whose migration through the polyacrylamide gel matrix is inversely proportional to the logarithm of its molecular mass [9]. This allows for highly accurate molecular weight determination by comparing migration distances to a standard protein ladder.
In Native PAGE, proteins are prepared in a non-denaturing, SDS-free buffer and are not heated [32] [8]. This preserves the protein's secondary, tertiary, and quaternary structures, including subunit interactions within multimeric complexes [9]. During electrophoresis, a protein's migration is determined by its net negative charge at the running buffer's pH, its size (mass), and its overall three-dimensional shape [9] [8]. Consequently, migration does not correlate directly with molecular weight alone, but provides information about the native state, including stoichiometry and conformational changes.
Table 1: Fundamental Characteristics of Denaturing and Native Gel Systems
| Feature | Denaturing Gel (SDS-PAGE) | Native Gel (Native-PAGE) |
|---|---|---|
| Key Reagents | SDS, Reducing Agent (DTT/β-Me), Heat [32] | No SDS, no reducing agent, no heat [32] |
| Protein State | Denatured and linearized [9] | Native, folded structure [3] |
| Separation Basis | Molecular mass of polypeptide chains [9] | Net charge, size, and shape of native structure [9] [8] |
| Molecular Weight Validation | Accurate determination possible [8] | Not directly possible; provides size estimation [8] |
| Effect on Activity | Enzymatic activity destroyed [32] | Enzymatic activity often preserved [9] |
Experimental Data and Migration Patterns
Empirical data reveals significant differences in how proteins migrate in the two systems.
Quantitative Migration Analysis
A database of electrophoretic migration patterns for human proteins, established using SDS-PAGE coupled with mass spectrometry, highlights the reproducibility of migration in denaturing systems when properly calibrated [7]. However, the same protein can display dramatically different migration profiles between gel types. For example, a protein complex with a native molecular weight of 480 kDa might migrate as a single band in a native gel, but dissociate into three distinct subunits (e.g., 80 kDa, 120 kDa, and 140 kDa) in a denaturing gel [8].
Table 2: Comparative Migration Outcomes for a Hypothetical Protein Complex
| Protein System | Migration in Denaturing Gel | Migration in Native Gel |
|---|---|---|
| Monomeric Protein (50 kDa) | Single band at 50 kDa position | Single band; position varies with net charge |
| Heterotrimeric Complex (Subunits: 80, 120, 140 kDa) | Three distinct bands at 80, 120, and 140 kDa | Single band corresponding to ~480 kDa native size |
| Protein with Strong Negative Charge | Band at position matching its mass | Band migrates faster than a neutral protein of similar size |
| Oligomeric Enzyme | Bands corresponding to individual subunits | Single band; often retains in-gel enzymatic activity [14] |
Visualizing the Workflows
The distinct protocols for denaturing and native gel electrophoresis can be visualized in the following experimental workflow:
Detailed Experimental Protocols
Protocol for Molecular Weight Validation via SDS-PAGE
This protocol is adapted from standard SDS-PAGE procedures for accurate molecular weight determination [9].
Sample Preparation:
Gel Preparation:
Electrophoresis:
- Load prepared samples and a pre-stained or unstained protein molecular weight ladder into the wells.
- Run the gel at a constant voltage (e.g., 120-200V) until the dye front reaches the bottom of the gel.
Analysis:
- Visualize proteins using a stain like Coomassie Blue or silver stain.
- Plot the log of the molecular weight of the ladder standards against their migration distance (Rf).
- Interpolate the molecular weight of the unknown protein samples from the standard curve.
Protocol for Size Estimation via Native PAGE
This protocol outlines the key steps for separating native proteins, preserving their structure and function [9] [14].
Sample Preparation:
Gel and Buffer Preparation:
Electrophoresis:
- Load the samples and a native protein marker or a standard of known native size and charge.
- Perform electrophoresis at constant voltage. Maintain the system at 4°C during the run to minimize denaturation and proteolysis [9].
Analysis:
- Visualize proteins. Note that migration is not based on mass alone.
- For size estimation, compare migration to a ladder of native protein standards with known hydrodynamic radii or molecular weights under non-denaturing conditions.
- Enzymatic activity can often be detected post-electrophoresis using specific in-gel activity stains [14].
The Scientist's Toolkit: Essential Research Reagents
Successful execution of these techniques relies on specific reagents, each with a defined function.
Table 3: Key Reagents for Denaturing and Native Gel Electrophoresis
| Reagent / Material | Function | Application |
|---|---|---|
| SDS (Sodium Dodecyl Sulfate) | Denatures proteins and confers uniform negative charge [9] | Denaturing Gels (SDS-PAGE) |
| DTT (Dithiothreitol) | Reducing agent that breaks disulfide bonds [32] | Denaturing Gels (SDS-PAGE) |
| Polyacrylamide | Forms a cross-linked matrix that sieves proteins based on size [9] | Both |
| Tris-Glycine Buffer | Common electrophoresis buffer system to maintain pH and conduct current [9] | Both (with/without SDS) |
| Coomassie Blue G-250 | Anionic dye used in BN-PAGE to impose charge shift on membrane proteins [14] | Native Gels (BN-PAGE) |
| n-Dodecyl-β-D-maltoside | Mild, non-ionic detergent for solubilizing membrane proteins without dissociation [14] | Native Gels (BN-PAGE) |
| Molecular Weight Markers | Pre-stained or unstained proteins of known mass for calibration [9] | Primarily Denaturing Gels |
| Native Markers | Proteins of known native size and charge for comparison | Native Gels |
The choice between denaturing and native gel electrophoresis is not a matter of superiority but of application. SDS-PAGE is the unequivocal method for determining the molecular weight of polypeptide chains, assessing sample purity, and preparing for downstream techniques like western blotting or sequencing [3] [8]. Native PAGE, however, is indispensable for investigating protein-protein interactions, quaternary structure, enzymatic activity post-separation, and the native size and charge of functional complexes [3] [14]. For a comprehensive analysis, researchers often employ both techniques orthogonally, using SDS-PAGE to deconstruct a complex into its subunits and native PAGE to understand its functional assembly. This combined approach provides a more complete picture of protein identity and function, which is crucial in both basic research and drug development.
In proteomics and drug development, accurately determining protein identity is a foundational step that underpins all subsequent research and conclusions. The complexity of protein structures, which range from simple linear sequences to intricate three-dimensional folds and multi-subunit complexes, means that no single analytical method can provide a complete picture. The migration patterns of proteins in gels, a staple technique in molecular biology, are profoundly influenced by the choice between denaturing and native conditions, leading to potentially different interpretations of a protein's identity, size, and state [3] [32]. Under denaturing conditions, agents like SDS and DTT break down the protein's higher-order structure, creating a linear polypeptide chain whose migration is primarily dependent on its molecular weight [3] [32]. In contrast, native gels preserve the protein's secondary, tertiary, and quaternary structures. Consequently, a protein's migration is influenced not just by mass, but also by its inherent charge and overall three-dimensional shape or bulk [3] [32]. This fundamental difference means that a single protein can exhibit different apparent sizes depending on the gel system used, necessitating a cross-validated approach for confirmation.
This article objectively compares the performance of modern techniques for protein identity confirmation, from traditional gel-based methods to advanced mass spectrometry and machine learning algorithms. By integrating multiple, orthogonal validation methods, researchers can achieve a higher degree of confidence in their protein identifications, which is crucial for applications ranging from basic research to the development of biotherapeutics.
Comparative Performance of Protein Identity Validation Methods
The following table summarizes the core principles, applications, and performance metrics of key techniques used for protein identity confirmation.
| Method Category | Specific Technique | Underlying Principle | Typical Application Context | Reported Performance Metrics |
|---|---|---|---|---|
| Gel Electrophoresis | Denaturing Gel (SDS-PAGE) | Separation by molecular mass after disruption of structure and charge [3] [32] | Estimating molecular weight, assessing sample purity, Western blotting [3] [32] | Separation resolution based on mass alone; accuracy for mass estimation can be +/- 10% without standards. |
| Gel Electrophoresis | Native Gel | Separation by intrinsic charge, size, and overall 3D shape of native protein [3] [32] | Determining aggregation state, isolating enzymatically active proteins, studying protein complexes [3] [32] | Reveals functional oligomeric states but does not provide precise mass without other data. |
| Mass Spectrometry | Shotgun Proteomics (DDA/DIA) | Protein inference from tandem MS data of enzymatically digested peptides [66] [67] | Large-scale, high-throughput protein identification and quantification from complex mixtures [66] [67] | Can identify thousands of proteins in a single run; protein-level FDR typically controlled at ≤1% [68] [67]. |
| Machine Learning | LightGBM Model (Sequence & Structure) | Integrates features like domain sequence identity and pocket similarity from AlphaFold2 models [69] | Predicting whether two proteins catalyze the same enzymatic reaction [69] | Outperformed models based solely on sequence similarity and state-of-the-art deep learning models [69]. |
| Machine Learning | NeXtMD (Ensemble ML/DL) | Stacks multiple ML classifiers with a deep learning refinement network using sequence-derived descriptors [70] | Identification of short anti-inflammatory peptides (AIPs) from sequence [70] | Achieved AUC of 0.8607, ACC 0.7995, MCC 0.5883, outperforming single-model approaches [70]. |
| Machine Learning | Protein Language Models (e.g., ESM-2) | Transfer learning from models pre-trained on evolutionary sequence data to predict variant effects [71] | Predicting functional impacts of mutations and protein properties from sequence alone [71] | Medium-sized models (e.g., 650M parameters) perform nearly as well as larger models (15B parameters) with limited data [71]. |
Experimental Protocols for Key Validation Techniques
Gel Electrophoresis: Denaturing vs. Native Conditions
Protocol 1: SDS-PAGE (Denaturing)
- Sample Preparation: Mix protein sample with a loading buffer containing Sodium Dodecyl Sulfate (SDS) and a reducing agent (DTT or β-mercaptoethanol). Heat the mixture at 95°C for 5-10 minutes to ensure complete denaturation [32].
- Gel Composition: Use a polyacrylamide gel with SDS incorporated into the buffer system.
- Electrophoresis: Run the gel with an electrode buffer containing SDS. The SDS-coated, linearized proteins migrate toward the anode, with distance inversely proportional to the logarithm of their molecular mass [3] [32].
- Analysis: Visualize proteins using Coomassie Blue, silver staining, or Western blotting. Compare migration to a pre-stained protein ladder run under the same denaturing conditions.
Protocol 2: Native-PAGE
- Sample Preparation: Mix protein sample with a non-denaturing loading buffer that lacks SDS and reducing agents. Do not heat the sample [32].
- Gel Composition: Use a polyacrylamide gel without SDS or other denaturants.
- Electrophoresis: Run the gel with a non-denaturing electrode buffer. The migration depends on the protein's intrinsic net charge (at the gel's pH), size, and three-dimensional shape [3] [32].
- Analysis: Visualize proteins as above. The apparent molecular size can be compared to a native protein marker, but note that migration is not based on mass alone.
Mass Spectrometry-Based Protein Inference
Protocol: Shotgun Proteomics for Protein Identification
- Sample Digestion: Extract proteins from a biological sample and digest them into peptides using a sequence-specific enzyme (e.g., trypsin). Fractionate the complex peptide mixture to reduce complexity [66].
- Mass Spectrometry Analysis:
- Database Search and Protein Inference:
- Peptide-Spectrum Matching (PSM): Compare the experimental MS2 spectra against theoretical spectra generated from a protein sequence database. Assign a score to each match (e.g., using search engines like Mascot, SEQUEST) [66].
- Statistical Validation: Control the False Discovery Rate (FDR) at the peptide and protein levels, typically using a target-decoy approach where spectra are searched against a database of real (target) and nonsense (decoy) sequences. A common threshold is 1% FDR [66] [68].
- Protein Inference: Reconstruct protein identities from the validated peptide identifications. Algorithms use parsimony principles or probabilistic models to resolve peptides that map to multiple proteins (shared peptides) and compile a minimal list of proteins explaining all observed peptides [66].
Machine Learning for Function Prediction
Protocol: Transfer Learning with Protein Language Models (pLMs)
- Feature Extraction (Embedding Generation): Input the protein amino acid sequence into a pre-trained pLM (e.g., ESM-2). Extract the resulting sequence representation (embedding) from the model's hidden layers [71].
- Embedding Compression: Compress the high-dimensional per-residue embeddings into a single vector per protein using mean pooling (averaging across all sequence positions), which has been shown to be an effective and efficient strategy [71].
- Model Training and Prediction: Use the compressed embeddings as input features to train a supervised machine learning model (e.g., LassoCV regression) for a specific downstream task, such as predicting the functional effect of a mutation or a protein's functional class [71]. For optimal performance with limited data, a medium-sized model like ESM-2 650M is recommended as it provides a good balance of performance and computational cost [71].
Integrated Workflows and Data Interpretation
Visualizing the Validation Workflow
The following diagram illustrates a logical workflow for cross-validating protein identity, integrating gel-based analysis with mass spectrometry and computational checks.
Relationships Among Validation Techniques
This diagram categorizes the primary methods discussed and shows how they complement each other in a multi-technique validation strategy.
The Scientist's Toolkit: Essential Research Reagents and Materials
| Item Name | Function/Application in Protein Identity Validation |
|---|---|
| SDS (Sodium Dodecyl Sulfate) | A strong anionic detergent used in denaturing gel electrophoresis to linearize proteins and confer a uniform negative charge [32]. |
| DTT (Dithiothreitol) or β-Mercaptoethanol | Reducing agents that break disulfide bonds within and between protein subunits, crucial for complete denaturation in SDS-PAGE [32]. |
| Polyacrylamide Gels | A cross-linked polymer matrix that acts as a molecular sieve for separating proteins during electrophoresis. Pore size can be adjusted by varying acrylamide concentration [3]. |
| Trypsin | A protease used in mass spectrometry sample preparation to digest proteins into smaller peptides, which are more amenable to MS analysis and sequencing [66]. |
| Protein Ladders (Markers) | Pre-stained or native mixtures of proteins of known molecular weight, run alongside samples on gels to estimate the size of unknown proteins [3] [32]. |
| UHPLC System | Ultra-High-Performance Liquid Chromatography system used to separate complex peptide mixtures prior to injection into the mass spectrometer, reducing sample complexity and improving identification rates [67]. |
| Target-Decoy Database | A computational database containing real (target) protein sequences and artificially generated nonsense (decoy) sequences, used to statistically validate peptide and protein identifications and estimate false discovery rates (FDR) [66] [68]. |
| Protein Language Model (e.g., ESM-2) | A pre-trained deep learning model that converts a protein sequence into a numerical representation (embedding), which can be used for various downstream prediction tasks without costly experimental data [71]. |
Identifying Post-Translational Modifications Through Migration Shifts
Post-translational modifications (PTMs) represent a crucial regulatory mechanism in cellular biology, profoundly influencing protein function, stability, and interactions. These covalent modifications, which include phosphorylation, glycosylation, and acetylation, alter the chemical and structural properties of proteins after ribosomal synthesis. For researchers investigating PTMs, gel electrophoresis serves as a fundamental tool for detecting these modifications through observable shifts in protein migration. The choice between denaturing and native gel systems fundamentally shapes experimental outcomes and interpretive capabilities, each offering distinct advantages for specific research objectives. This guide provides a comprehensive comparison of these electrophoretic approaches, supported by experimental data and detailed methodologies, to inform strategic decision-making for researchers, scientists, and drug development professionals.
Electrophoretic Fundamentals: Denaturing versus Native Systems
Understanding the core principles governing denaturing and native gel electrophoresis is essential for selecting the appropriate methodology for PTM detection. These systems differ fundamentally in their treatment of protein structure and their resulting analytical capabilities.
Denaturing gels, typically utilizing sodium dodecyl sulfate-polyacrylamide gel electrophoresis (SDS-PAGE), completely unfold proteins into uniform linear chains coated with negative charges. This process eliminates the influence of native structure and charge, making migration dependent primarily on molecular mass alone [3]. While this provides excellent size estimation for unmodified polypeptides, it can mask certain PTM-induced changes that would otherwise affect a protein's three-dimensional structure or intrinsic charge.
Conversely, native gels separate proteins in their folded, functional states without denaturing agents. This approach preserves protein complexes, higher-order structures, and intrinsic chemical properties. Consequently, migration depends on a combination of molecular mass, overall three-dimensional bulk, intrinsic charge, and shape [3] [72]. This multi-parameter sensitivity makes native electrophoresis particularly powerful for detecting PTMs that alter protein conformation or surface characteristics without significantly changing molecular weight.
The following diagram illustrates the decision pathway for selecting the appropriate electrophoretic method based on research objectives:
Comparative Analysis of Electrophoretic Approaches for PTM Detection
The selection between denaturing and native electrophoretic systems carries significant implications for detection sensitivity, interpretive accuracy, and methodological throughput in PTM research. The following table summarizes the core characteristics of each approach:
Table 1: Core Characteristics of Denaturing vs. Native Gel Electrophoresis
| Feature | Denaturing Gels (SDS-PAGE) | Native Gels |
|---|---|---|
| Separation Basis | Primarily molecular mass of polypeptide chains | Mass, charge, size, shape, and 3D structure [3] [72] |
| PTM Detection Capability | Limited to modifications causing mass shifts; may miss conformational changes | Sensitive to both mass and structural alterations from PTMs [72] |
| Structural Preservation | Disrupts all higher-order structure, dissociates complexes | Maintains native conformation and protein complexes [3] |
| Molecular Weight Accuracy | High for unmodified polypeptides [47] | Moderate; influenced by multiple factors beyond mass [47] |
| Typical Applications | Western blotting, purity assessment, protein sequencing [3] | Enzyme activity studies, complex analysis, binding studies [3] [73] |
Protein Marker Selection and Performance
The choice of protein molecular weight markers significantly influences the accuracy of PTM detection through migration shifts. Different marker types offer distinct advantages and limitations:
Table 2: Comparison of Protein Molecular Weight Marker Types
| Marker Type | Unstained Protein Marker | Pre-stained Protein Marker | WB Imaging/Exposure Marker |
|---|---|---|---|
| Molecular Weight Accuracy | Highest accuracy (no dye interference) [47] | Slightly altered migration due to dye conjugation [47] | Moderate; designed for imaging consistency [47] |
| PTM Detection Utility | Optimal for precise molecular weight determination in PTM studies [47] | Useful for monitoring electrophoresis and transfer; less accurate for size estimation [47] | Primarily for alignment and exposure reference [47] |
| Visualization Method | Requires post-staining (Coomassie, silver stain) [47] | Visible colored bands during electrophoresis [47] | Chemiluminescent or fluorescent detection [47] |
| Limitations for PTM Research | Invisible before staining, requiring additional processing steps [47] | Dye conjugation alters migration, potentially confounding PTM shift interpretation [47] | Not suitable for molecular weight estimation in gel [47] |
Advanced pre-stained markers, such as Yeasen's Tricolor Marker, are calibrated against unstained standards and provide broad molecular weight coverage (2.7-300 kDa) with color-coded bands for real-time monitoring. However, researchers should note that apparent molecular weights may vary among brands due to different calibration standards, amino acid composition affecting SDS binding, and distinct dye-labeling chemistries [47].
Experimental Protocols for PTM Detection
Agarose Native Gel Electrophoresis for PTM Analysis
Agarose native gel electrophoresis provides a robust methodology for detecting PTM-induced conformational changes in proteins. The following protocol has been successfully applied to analyze phosphorylation, metal ion binding, and aggregation states [72]:
Materials and Reagents:
- Agarose gel (specific percentage dependent on target protein size range)
- His/MES buffer at pH 6.1 [72]
- Protein samples with suspected PTMs
- Appropriate pre-stained or unstained protein markers
- Electrophoresis apparatus compatible with agarose gels
- Transfer system for Western blotting (if subsequent immunodetection required)
Methodology:
- Sample Preparation: Prepare protein samples in non-denaturing buffers without SDS or reducing agents. Maintain samples at 4°C throughout preparation to preserve native states.
- Gel Casting: Prepare agarose gel at appropriate concentration dissolved in His/MES buffer, pH 6.1. Pour gel and allow to solidify completely [72].
- Electrophoresis Conditions: Load samples in the middle of the gel. Apply constant voltage (typically 100V for mini-gels) for 60-90 minutes with cooling to prevent heat-induced denaturation. Note that basic proteins (pI > 6.1) migrate toward the cathode, while acidic proteins migrate toward the anode [72].
- Post-Electrophoresis Analysis:
- Direct Visualization: For pre-stained markers or colored proteins, document migration distances immediately.
- Total Protein Staining: Use compatible stains such as Coomassie Blue or SYPRO Ruby.
- Western Blotting: Transfer proteins to appropriate membrane using native transfer conditions [72].
- Two-Dimensional Analysis: Excise bands from agarose gel for subsequent SDS-PAGE analysis to correlate native migration with denatured subunit composition [72].
Key Applications:
- Detection of antibody aggregation/association following acid or heat treatment [72]
- Analysis of structural changes in bovine serum albumin upon limited reduction of disulfide bonds [72]
- Monitoring mobility shifts of human transferrin upon Fe³⁺ binding [72]
- Detection of phosphorylation-induced mobility shifts in Zap70 kinase [72]
Mass Spectrometry-Enhanced Migration Analysis
Coupling electrophoretic separation with mass spectrometry provides a powerful orthogonal approach for accurate PTM identification. The following protocol details the integration of these technologies:
Materials and Reagents:
- SDS-PAGE or native gel system
- Mass spectrometry-compatible staining reagents
- In-gel digestion reagents (trypsin, other proteases)
- LC-MS/MS system
- Internal calibration standards
Methodology:
- Electrophoretic Separation: Perform SDS-PAGE or native gel electrophoresis as described above.
- Band Excisation: Identify bands of interest based on migration shifts compared to unmodified controls. Excise bands with clean tools to minimize contamination.
- In-Gel Digestion: Destain, reduce, alkylate, and digest protein bands with appropriate protease (typically trypsin) using standard protocols.
- Mass Spectrometric Analysis:
- Analyze digested peptides using LC-MS/MS with appropriate fragmentation methods.
- Implement data-dependent acquisition to select precursor ions for fragmentation.
- Utilize electron-transfer dissociation (ETD) or higher-energy collisional dissociation (HCD) for PTM localization.
- Data Processing:
- Search MS/MS data against appropriate protein databases using search engines capable of PTM identification.
- Apply fragment-level open search algorithms (as implemented in tools like precisION) to discover uncharacterized modifications [74].
- Implement false discovery rate (FDR) control at protein, peptide, and modification levels.
This approach has been successfully applied to create databases of accurate electrophoretic migration patterns for approximately 10,000 human proteins, enabling researchers to distinguish PTM-induced shifts from normal migration variations [7].
Research Reagent Solutions
The following reagents and tools represent essential components for effective PTM detection through migration shift analysis:
Table 3: Essential Research Reagents for PTM Detection Studies
| Reagent/Tool | Function | Example Applications |
|---|---|---|
| Pre-stained Protein Markers | Visual monitoring of electrophoresis and transfer efficiency | Real-time tracking of separation progress; verification of transfer completeness [47] |
| Unstained Protein Markers | Accurate molecular weight determination | Precise size estimation for PTM-induced shift quantification [47] |
| PTM-Specific Antibodies | Selective detection of specific modifications | Western blot identification of phosphorylation, acetylation, or other PTMs [75] |
| Cross-linking Reagents | Stabilization of transient protein complexes | Preservation of interaction states for native gel analysis [73] |
| Cell-Free Expression Systems | Rapid production of modified proteins | High-throughput screening of PTM enzyme variants [76] |
| AlphaLISA Beads | Sensitive detection of protein interactions | Cell-free analysis of PTM enzyme-substrate engagement [76] |
| Mass Spectrometry Platforms | Comprehensive PTM identification and localization | Fragment-level open search for hidden modifications [74] |
Advanced Detection Strategies
Fragment-Level Open Search Mass Spectrometry
For comprehensive PTM discovery, recent advances in native top-down mass spectrometry (nTDMS) coupled with fragment-level open search algorithms provide unprecedented capabilities. The precisION software package implements a robust informatic framework that enables detection of "hidden" modifications within intact protein complexes without prior knowledge of modification types [74]. This approach has successfully identified undocumented phosphorylation, glycosylation, and lipidation in therapeutically relevant targets including PDE6, ACE2, osteopontin (SPP1), and GABA transporter (GAT1) [74].
The workflow involves:
- Hierarchical Spectral Analysis: Deconvolution of low signal-to-noise native mass spectra using modified Richardson-Lucy algorithm [74]
- Machine Learning-Based Filtering: Supervised voting classifier to distinguish real fragment ions from artifacts [74]
- Open Database Searching: Identification of protein isoforms without intact mass constraints [74]
- Fragment-Level Open Search: Application of variable mass offsets to protein termini to identify sets of sequence ions sharing common modifications [74]
High-Throughput PTM Screening Platforms
For drug development applications requiring rapid characterization of PTM-installing enzymes or modified protein substrates, integrated cell-free expression (CFE) and AlphaLISA screening provides exceptional throughput. This platform enables parallelized expression and testing of hundreds to thousands of variants in hours, dramatically accelerating design-build-test-learn cycles for PTM engineering [76].
The workflow encompasses:
- Cell-Free Expression: Parallel synthesis of PTM enzyme variants and protein substrates in PUREfrex system [76]
- AlphaLISA Detection: Bead-based proximity assay to quantify enzyme-substrate interactions or modification efficiency [76]
- Rapid Binding Landscape Mapping: Alanine scanning mutagenesis to identify residues critical for PTM installation [76]
This approach has been successfully applied to characterize RiPP recognition elements and engineer oligosaccharyltransferases for improved glycoprotein production [76].
The detection of post-translational modifications through electrophoretic migration shifts remains a cornerstone technique in proteomic research, with both denaturing and native systems offering complementary strengths. Denaturing SDS-PAGE provides excellent molecular weight resolution for modifications causing significant mass changes, while native electrophoresis excels in detecting conformational alterations and preserving functional complexes. The integration of these electrophoretic approaches with advanced mass spectrometric techniques and high-throughput screening platforms creates a powerful multidimensional toolkit for comprehensive PTM analysis. As research continues to unveil the complexity of the PTM landscape, these methodologies will play an increasingly vital role in elucidating disease mechanisms and developing targeted therapeutic interventions.
Pitfalls in Data Interpretation and How to Avoid Them
In the realm of molecular biology, gel electrophoresis serves as a fundamental technique for analyzing proteins and nucleic acids. Within this context, protein ladders are indispensable reference tools, providing the molecular weight standards necessary for interpreting experimental results. However, the migration patterns of these ladders and the samples they help analyze are profoundly influenced by the type of gel system employed—denaturing or native. Misinterpretation of these patterns represents a significant and common pitfall, potentially leading to incorrect conclusions about protein size, purity, oligomeric state, and identity. This guide objectively compares protein ladder migration in these two distinct environments, supported by experimental data, to equip researchers with the knowledge to avoid critical errors in data interpretation. Understanding these principles is paramount for researchers and drug development professionals who rely on these techniques for protein characterization, quality control, and functional analysis.
Theoretical Foundations: Denaturing vs. Native Gel Electrophoresis
The core difference between denaturing and native gel electrophoresis lies in the treatment of the protein's structure, which directly dictates how a protein ladder will migrate and how it should be used for analysis.
Denaturing Gels, such as SDS-PAGE (Sodium Dodecyl Sulfate Polyacrylamide Gel Electrophoresis), work by dismantling the native structure of proteins. The anionic detergent SDS binds to the protein backbone, denaturing it into a linear string of amino acids and conferring a uniform negative charge per unit mass. The reducing agent, often Dithiothreitol (DTT), breaks disulfide bonds. In this system, separation depends primarily on molecular mass, as charge and structural complexities are eliminated [3]. Protein ladders run on denaturing gels provide a reliable estimate of a protein's molecular weight.
Native Gels deliberately avoid disrupting the protein's structure. Proteins are separated based on a combination of their intrinsic charge, molecular mass, and overall three-dimensional shape (bulk or cross-sectional area) [3]. Consequently, a protein's migration is not solely dependent on its mass. A protein ladder on a native gel can serve as a rough guide, but its members will not necessarily align with their true molecular weights as they do under denaturing conditions. This system is ideal for studying functional, native proteins, their oligomeric states, and protein-protein interactions [3].
Table 1: Core Principles of Denaturing vs. Native Gel Electrophoresis
| Feature | Denaturing Gels (e.g., SDS-PAGE) | Native Gels |
|---|---|---|
| Principle | Separates proteins based primarily on molecular mass. | Separates based on charge, size, and 3D shape. |
| Sample Treatment | Heated with SDS and reducing agents (e.g., DTT). | No heating or denaturing agents. |
| Protein State | Denatured into linear chains. | In their native, folded conformation. |
| Key Applications | Estimating molecular weight, determining purity, Western blotting. | Studying oligomeric state, protein complexes, and protein-ligand interactions. |
Diagram 1: Gel selection workflow and associated pitfalls.
Comparative Experimental Data and Migration Patterns
To illustrate the practical differences, consider an experiment using a standard recombinant protein ladder, such as the Penn State Protein Ladder system, which includes proteins of 10, 15, 20, 30, 40, 50, 60, 80, and 100 kD [30]. When run on a denaturing SDS-PAGE gel, these proteins will migrate to positions that closely correlate with their known molecular weights, forming a predictable standard curve.
However, when the same ladder is run on a native gel, the migration pattern can look drastically different. A 60 kD protein that exists as a dimer in its native state (~120 kD) will migrate slower than expected, aligning closer to the 100 kD or 120 kD marker position. Similarly, a highly acidic protein (negatively charged) will migrate faster on a native gel than a basic protein (positively charged) of the same mass. This is a primary pitfall: assuming a protein's native mass based on a denaturing ladder standard.
Table 2: Comparison of a Hypothetical Protein's Migration in Different Gel Systems
| Protein Characteristic | Denaturing Gel (SDS-PAGE) | Native Gel |
|---|---|---|
| Monomer (50 kD) | Migrates at ~50 kD | Migrates at ~50 kD |
| Homodimer (2 x 50 kD = 100 kD) | Subunits denatured and separated; migrates at ~50 kD. | Migrates as a complex at ~100 kD. |
| Glycosylated Protein (50 kD core) | Migrates anomalously, often higher than 50 kD, due to uneven SDS binding. | Migration depends on the size and charge of the glycan chain. |
| Acidic Protein (pI ~4.5) | Migration determined by mass (SDS coats protein). | Migrates faster toward the anode due to high negative charge. |
Common Artifacts and Pitfalls in Data Interpretation
Misinterpreting gel data can lead to false conclusions. Below are common pitfalls associated with both the gel technique and the use of protein ladders.
Pitfall 1: Misidentifying Oligomeric State
- The Error: Assuming a band on a native gel corresponds to the monomeric mass based on a denatured protein ladder.
- The Reality: A band migrating at 100 kD on a native gel could be a 100 kD monomer, a 50 kD dimer, or a 25 kD tetramer. The denatured ladder only provides a reference for mass under denaturing conditions.
- The Avoidance: Always run a parallel denaturing gel of the same sample. If the native gel shows a band at 100 kD and the denaturing gel shows a single band at 50 kD, this is strong evidence for a homodimer.
Pitfall 2: Overlooking the Impact of Charge
- The Error: Interpreting different migration speeds on a native gel as solely being due to size differences.
- The Reality: A smaller, positively charged protein might migrate slower or even in the opposite direction than a larger, negatively charged protein in a native system with a standard pH.
- The Avoidance: Be aware of the isoelectric points (pI) of your proteins of interest. Use a ladder that is well-characterized under native conditions, though these are less common.
Pitfall 3: Confusing Artifacts with Bands
- The Error: Interpreting smears, streaks, or unexpected bands as specific protein species.
- The Reality: Smearing can be caused by protein degradation [77] [78], overloading the gel [77] [78], or incomplete denaturation (in SDS-PAGE). Keratin contamination from skin or hair is a frequent artifact that appears at ~55-65 kD [79].
- The Avoidance: Follow good laboratory practices: use fresh, purified samples; load the recommended amount of protein (typically 0.1–0.2 μg per mm of well width) [78]; wear gloves; and use clean equipment.
Detailed Experimental Protocols
Protocol 1: Denaturing SDS-PAGE for Molecular Weight Estimation
This standard protocol is used to estimate the molecular weight of a protein using a denaturing ladder.
- Sample Preparation: Mix protein sample with 1X SDS-PAGE loading dye (containing SDS and a reducing agent like DTT or β-mercaptoethanol). Heat the mixture at 95°C for 5-10 minutes to fully denature the proteins [78].
- Gel Preparation: Cast a polyacrylamide gel (e.g., 4-20% gradient gel) suitable for the expected protein size range. Thinner gels (3-4 mm) provide better resolution than thicker gels [78].
- Loading and Electrophoresis: Load the prepared samples and an appropriate volume of a pre-stained or unstained protein ladder (e.g., 3-5 μL for GoldBio ladders) [77]. Connect the power supply with the correct polarity (negative electrode at the top, near the wells) and run at a constant voltage (e.g., 1-5 V/cm of gel length) [77] [78] until the loading dye front reaches the bottom of the gel.
- Detection: Stain the gel with Coomassie Blue, Silver Stain, or a fluorescent stain to visualize the protein bands and the ladder. For fluorescent proteins (e.g., GFP, mCherry), in-gel fluorescence (IGF) can be detected directly after electrophoresis without staining, offering high sensitivity and low background [80].
Protocol 2: Native PAGE for Oligomeric State Analysis
This protocol is used to analyze the native state of a protein without denaturation.
- Sample Preparation: Mix protein sample with a native loading dye (contains no SDS or reducing agents). Do not heat the sample [78].
- Gel Preparation: Cast a polyacrylamide gel without SDS. The buffer system (e.g., Tris-Glycine, pH ~8.8) should maintain a non-denaturing environment.
- Loading and Electrophoresis: Load the samples and a native protein ladder if available. Note that a standard denatured protein ladder is not appropriate for mass calibration in this system. Run the gel in a buffer without SDS, typically at low voltages (e.g., 4°C) to prevent heat-induced denaturation.
- Detection: Visualize proteins as described in Protocol 1. Following fluorescence imaging, the gel can still be used for total protein staining or immunoblotting [80].
Diagram 2: Experimental workflows for denaturing and native gels.
The Scientist's Toolkit: Essential Research Reagents
Table 3: Key Reagents for Protein Gel Electrophoresis
| Reagent / Material | Function / Description | Critical Consideration |
|---|---|---|
| Protein Ladder | A set of pre-defined proteins used as molecular weight standards. | Choose a denaturing or native ladder based on the gel system. Do not use a denatured ladder to calibrate a native gel. |
| SDS (Sodium Dodecyl Sulfate) | Anionic detergent that denatures proteins and confers uniform charge. | Essential for denaturing gels; must be omitted for native gels. |
| Reducing Agent (DTT/BME) | Breaks disulfide bonds to fully linearize proteins. | Used in denaturing gels; omission in native gels preserves quaternary structure. |
| Polyacrylamide Gel | Matrix for separating proteins based on size. | Higher % gels better resolve smaller proteins. Thinner gels (3-4 mm) reduce band diffusion [78]. |
| Loading Dye | Provides color for tracking and density for loading samples. | Must contain SDS for denaturing gels and lack it for native gels. Dye ions can mask small fragments [77] [78]. |
| Fluorescent Stain / In-Gel Fluorescence | Enables protein detection. IGF allows direct visualization of FPs without transfer or antibodies [80]. | Offers superior sensitivity, quantification, and dynamic range compared to traditional stains [80]. |
The choice between denaturing and native gel electrophoresis is fundamental, each providing distinct and complementary information. The most significant pitfall a researcher can make is to misinterpret the data generated from one system by applying the rules of the other. A protein ladder is an essential tool, but its utility is context-dependent. A denatured ladder provides a reliable standard for molecular weight under denaturing conditions, while migration in a native gel tells a more complex story involving mass, charge, and shape. By understanding the principles outlined in this guide, employing the correct controls, and being aware of common artifacts, researchers can avoid costly misinterpretations and generate robust, reliable data critical for advancing scientific discovery and drug development.
Conclusion
The choice between denaturing and native gel electrophoresis is fundamental, directly dictating how a protein ladder migrates and how experimental results are interpreted. Denaturing gels provide a reliable measure of polypeptide molecular weight by linearizing proteins, making them indispensable for purity checks, western blotting, and initial characterization. In contrast, native gels preserve higher-order structures, offering unique insights into native mass, oligomeric state, protein-protein interactions, and functional activity that are invisible in denaturing systems. Mastering the interpretation of protein ladder migration in both contexts is not merely a technical skill but a critical analytical capability. As biomedical research increasingly focuses on complex macromolecular assemblies and functional biologics, the synergistic use of both techniques will be crucial for comprehensive protein characterization, driving advancements in drug discovery, diagnostics, and understanding disease mechanisms.
References
- 1. Overview of Protein Electrophoresis [https://www.thermofisher.com/tr/en/home/life-science/protein-biology/protein-biology-learning-center/protein-biology-resource-library/pierce-protein-methods/overview-electrophoresis.html]
- 2. How Is Native PAGE Different from SDS-PAGE? [https://synapse.patsnap.com/article/how-is-native-page-different-from-sds-page]
- 3. Native Versus Denaturing Gels [https://bitesizebio.com/27332/native-versus-denaturing-gels/]
- 4. Western blotting guide: Part 2, Protein separation by SDS- ... [https://www.jacksonimmuno.com/secondary-antibody-resource/technical-tips/western-blotting-guide-part-2/]
- 5. Deciphering food proteins: The applications of SDS-PAGE ... [https://www.sciencedirect.com/science/article/abs/pii/S2212429225003025]
- 6. Troubleshooting SDS-PAGE Gel Running Issues [https://www.goldbio.com/blogs/articles/troubleshooting-sds-page-gel-running-issues?srsltid=AfmBOor7lUrZod25V_NKQgxvKzquRtiSrJNceKHcs7XK_EiATAIPTcEU]
- 7. A Database of Accurate Electrophoretic Migration Patterns ... [https://www.sciencedirect.com/science/article/pii/S0022283622005605]
- 8. Should I Use A Native Or Denaturing Gel? [https://info.gbiosciences.com/blog/should-i-use-a-native-or-denaturing-gel]
- 9. Overview of Protein Electrophoresis [https://www.thermofisher.com/us/en/home/life-science/protein-biology/protein-biology-learning-center/protein-biology-resource-library/pierce-protein-methods/overview-electrophoresis.html]
- 10. Native PAGE Gels | Thermo Fisher Scientific - US [https://www.thermofisher.com/us/en/home/life-science/protein-biology/protein-gel-electrophoresis/protein-gels/specialized-protein-gels/nativepage-bis-tris-gels.html]
- 11. Native SDS-PAGE: High Resolution Electrophoretic ... [https://pmc.ncbi.nlm.nih.gov/articles/PMC4517606/]
- 12. Describe the differences between Native PAGE and SDS-PAGE. [https://www.truegeometry.com/api/exploreHTML?query=Describe%20the%20differences%20between%20Native%20PAGE%20and%20SDS-PAGE.]
- 13. Use of Native-PAGE for the Identification of Epichaperomes in ... [https://pmc.ncbi.nlm.nih.gov/articles/PMC10448758/]
- 14. Validation of blue- and clear-native polyacrylamide gel ... [https://pmc.ncbi.nlm.nih.gov/articles/PMC12445495/]
- 15. Electrophoresis - StatPearls - NCBI Bookshelf - NIH [https://www.ncbi.nlm.nih.gov/books/NBK585057/]
- 16. A Guide to Choosing the Right Gel for Protein Gel ... [https://biobasic-asia.com/choosing-guide-protein-gel/]
- 17. A screening method for binding synthetic metallo ... [https://www.sciencedirect.com/science/article/pii/S0003269722002445]
- 18. Comprehensive protein datasets and benchmarking for liquid ... [https://pmc.ncbi.nlm.nih.gov/articles/PMC12239342/]
- 19. Biochemistry, Primary Protein Structure - StatPearls - NCBI Bookshelf [https://www.ncbi.nlm.nih.gov/books/NBK564343/]
- 20. Protein Quaternary Structure - an overview | ScienceDirect Topics [https://www.sciencedirect.com/topics/biochemistry-genetics-and-molecular-biology/protein-quaternary-structure]
- 21. Protein quaternary structure - Wikipedia [https://en.wikipedia.org/wiki/Protein_quaternary_structure]
- 22. Effect of the operational parameters on the electromigration ... [https://www.sciencedirect.com/science/article/pii/S0039914025000876]
- 23. High-resolution native electrophoresis in-gel activity assay ... [https://www.nature.com/articles/s41598-025-24684-3]
- 24. Comparative analysis of protein aggregates by blue native ... [https://pubmed.ncbi.nlm.nih.gov/15841497/]
- 25. Rapid determination of quaternary protein structures in ... [https://www.nature.com/articles/s41467-018-07986-1]
- 26. Accurate Prediction of Protein Tertiary and Quaternary ... [https://pmc.ncbi.nlm.nih.gov/articles/PMC12345697/]
- 27. Understanding Pore Size and Gel Properties – PAM ... [https://witcarbon.com/agarose-vs-polyacrylamide-understanding-pore-size-and-gel-properties/]
- 28. High-resolution native electrophoresis in-gel activity assay ... [https://pmc.ncbi.nlm.nih.gov/articles/PMC12550018/]
- 29. Agarose vs Polyacrylamide: A Comparative Analysis [https://www.assaygenie.com/blog/agarose-vs-polyacrylamide?srsltid=AfmBOoqCvufx6OJ-zKULnU73M_aOoQHEVatnKs51G9cQq8-WeB1DjbFF]
- 30. The Penn State Protein Ladder system for inexpensive ... [https://www.nature.com/articles/s41598-021-96051-x]
- 31. Troubleshooting Sodium Dodecyl Sulfate- Polyacrylamide ... [https://www.hycultbiotech.com/sds-page/troubleshooting/]
- 32. Native or Denaturing Gel - Which Is For You? [https://advansta.com/not-all-gels-are-created-equal-native-or-denaturing-which-is-for-you/]
- 33. Western Blot Transfer Methods [https://www.thermofisher.com/us/en/home/life-science/protein-biology/protein-biology-learning-center/protein-biology-resource-library/pierce-protein-methods/western-blot-transfer-methods.html]
- 34. Western Blotting (Immunoblotting): History, Theory, Uses ... [https://pmc.ncbi.nlm.nih.gov/articles/PMC12303220/]
- 35. Comprehensive Optimization of Western Blotting - PMC [https://pmc.ncbi.nlm.nih.gov/articles/PMC10453944/]
- 36. Troubleshooting and Optimizing a Western Blot [https://blog.addgene.org/troubleshooting-and-optimizing-a-western-blot]
- 37. Denaturing mass photometry for rapid optimization of ... [https://www.nature.com/articles/s41467-024-47732-4]
- 38. Overview of Protein Electrophoresis [https://www.thermofisher.com/fr/fr/home/life-science/protein-biology/protein-biology-learning-center/protein-biology-resource-library/pierce-protein-methods/overview-electrophoresis.html]
- 39. OCAM: A new tool for studying the oligomeric diversity of ... [https://pmc.ncbi.nlm.nih.gov/articles/PMC3048416/]
- 40. A modified clear-native polyacrylamide gel electrophoresis ... [https://www.sciencedirect.com/science/article/abs/pii/S104659281830370X]
- 41. Continuous monitoring of enzymatic activity within native ... [https://pmc.ncbi.nlm.nih.gov/articles/PMC3478437/]
- 42. What is the difference between denaturing and non-denaturing (native) gels? | AAT Bioquest [https://www.aatbio.com/resources/faq-frequently-asked-questions/What-is-the-difference-between-denaturing-and-non-denaturing-native-gels]
- 43. How to Choose the Right Protein Ladders [https://www.fishersci.com/us/en/science-social-hub/buying-guides/how-choose-right-protein-ladders.html]
- 44. WB做了那么久看了这篇终于把丙烯酰胺胶的原理搞懂了! [https://www.bilibili.com/read/cv29117736]
- 45. Protein Ladders: Prestained Versus Unstained [https://www.goldbio.com/blogs/articles/protein-ladders-prestained-versus-unstained?srsltid=AfmBOop2UcBfpaeeA3L3Kcpgtws5TDxbFqQykZkVzVKoY3D_R1ijqfvU]
- 46. Protein Standards and Ladders Selection Guide [https://www.thermofisher.com/us/en/home/life-science/protein-biology/protein-gel-electrophoresis/protein-standards-ladders/protein-standards-ladders-selection-guide.html]
- 47. From Unstained to Tricolor: The Evolution of Protein Markers ... [https://www.yeasenbio.com/blogs/molecular-biology/from-unstained-to-tricolor-the-evolution-of-protein-markers-for-smarter-western-blotting]
- 48. Protein Standards & Ladders [https://www.thermofisher.com/us/en/home/life-science/protein-biology/protein-gel-electrophoresis/protein-standards-ladders.html]
- 49. Overview of Electrophoresis | Thermo Fisher Scientific - ID [https://www.thermofisher.com/id/en/home/life-science/protein-biology/protein-biology-learning-center/protein-biology-resource-library/pierce-protein-methods/overview-electrophoresis.html]
- 50. An Introduction to Protein Purification Methods [https://www.promega.com/resources/guides/protein-analysis/protein-purification-methods/]
- 51. An Overview of Current Methods to Confirm Protein-Protein ... [https://pmc.ncbi.nlm.nih.gov/articles/PMC6204658/]
- 52. Foolproof Guide to SDS-Page Ladder Migration [https://azurebiosystems.com/blog/sds-page-troubleshooting-protein-separation-but-my-ladder-is-fine/]
- 53. Troubleshooting DNA Ladders [https://www.goldbio.com/blogs/articles/troubleshooting-dna-ladders?srsltid=AfmBOopjmY5TjLdDu0GYdyvMaXpjBARgVb2JMRyB5_al0WbY1XlpYO1D]
- 54. Protein Ladders: The Bridge to Biotech Breakthroughs [https://www.unibiotech.in/news/blogs/protein-ladders-the-bridge-to-biotech-breakthroughs.html]
- 55. Detergent binding explains anomalous SDS-PAGE ... [https://pmc.ncbi.nlm.nih.gov/articles/PMC2644111/]
- 56. Mass Estimation of Native Proteins by Blue ... [https://pmc.ncbi.nlm.nih.gov/articles/PMC2953912/]
- 57. High Resolution Clear Native Electrophoresis for In-gel ... [https://www.sciencedirect.com/science/article/pii/S153594762031690X]
- 58. Western blot transfer techniques [https://www.abcam.com/en-us/knowledge-center/western-blot/western-blot-transfer-methods]
- 59. 3 Hot Tips to Optimize Your Western Blot Transfers [https://bitesizebio.com/7356/optimize-your-western-blot/]
- 60. SDS-PAGE: The science behind all those bubbles [https://www.antibodiesinc.com/pages/sds-page-demystified?srsltid=AfmBOoqF7T7VKv7ioY_cuGLPjw17O7pDesIEWGyukECjabc-83mWGhyb]
- 61. The gradient-like separation and reduced running time with ... [https://www.sciencedirect.com/science/article/abs/pii/S0003269722002457]
- 62. Overview of Protein Electrophoresis [https://www.thermofisher.com/ru/en/home/life-science/protein-biology/protein-biology-learning-center/protein-biology-resource-library/pierce-protein-methods/overview-electrophoresis.html]
- 63. Advantages and limitations of clear-native PAGE [https://pubmed.ncbi.nlm.nih.gov/16220535/]
- 64. Bench Tips: Blue Native-PAGE [https://blog.benchsci.com/bench-tips-blue-native-page]
- 65. Migration patterns of the PageRuler Prestained Protein ... [https://www.thermofisher.com/us/en/home/technical-resources/research-tools/image-gallery/image-gallery-detail.22973.html]
- 66. Inference and Validation of Protein Identifications - PMC [https://pmc.ncbi.nlm.nih.gov/articles/PMC3494198/]
- 67. Quantitative accuracy in proteomics [https://www.evosep.com/applications/quantitative-accuracy/]
- 68. 5.4 Statistical validation of protein identifications [https://fiveable.me/proteomics/unit-5/statistical-validation-protein-identifications/study-guide/9u5GtwOqSDHTHmVm]
- 69. Enhanced prediction of protein functional identity through ... [https://www.sciencedirect.com/science/article/pii/S2001037024003994]
- 70. NeXtMD: a new generation of machine learning and deep ... [https://pmc.ncbi.nlm.nih.gov/articles/PMC12261603/]
- 71. Medium-sized protein language models perform well at ... [https://www.nature.com/articles/s41598-025-05674-x]
- 72. Analysis of protein denaturation, aggregation and post ... [https://www.sciencedirect.com/science/article/abs/pii/S0141813021001057]
- 73. Validation of blue- and clear-native polyacrylamide gel ... [https://pubmed.ncbi.nlm.nih.gov/40966204/]
- 74. Uncovering hidden protein modifications with native top ... [https://www.nature.com/articles/s41592-025-02846-5]
- 75. Post-translational modification research offers new insights ... [https://www.selectscience.net/article/post-translational-modification-research-offers-new-insights-into-health-and-disease]
- 76. Characterizing and engineering post-translational ... [https://www.nature.com/articles/s41467-025-60526-6]
- 77. Troubleshooting DNA Ladders [https://www.goldbio.com/blogs/articles/troubleshooting-dna-ladders?srsltid=AfmBOoqFoTZSUw3OrWagAhm3f3k8GFv1wRBWSLDnkt2Vxy938E-VvD3B]
- 78. Nucleic Acid Gel Electrophoresis Troubleshooting [https://www.thermofisher.com/us/en/home/life-science/cloning/cloning-learning-center/invitrogen-school-of-molecular-biology/na-electrophoresis-education/na-electrophoresis-troubleshooting.html]
- 79. Common artifacts and mistakes made in electrophoresis [https://pubmed.ncbi.nlm.nih.gov/22585529/]
- 80. Direct observation of fluorescent proteins in gels [https://pmc.ncbi.nlm.nih.gov/articles/PMC11808229/]