Protein Gel Electrophoresis: Principles, Protocols, and Advanced Applications in Biomedical Research
This article provides a comprehensive guide to protein gel electrophoresis, a foundational technique in molecular biology and proteomics.
Protein Gel Electrophoresis: Principles, Protocols, and Advanced Applications in Biomedical Research
Abstract
This article provides a comprehensive guide to protein gel electrophoresis, a foundational technique in molecular biology and proteomics. Tailored for researchers, scientists, and drug development professionals, it covers the core principles of electrophoretic separation, detailed methodologies including SDS-PAGE and native-PAGE, and advanced techniques like 2D electrophoresis. It also offers practical troubleshooting for common issues and a comparative analysis of traditional gel-based versus emerging capillary electrophoresis for clinical diagnostics, particularly in monitoring conditions like multiple myeloma.
The Core Principles of Protein Electrophoresis: How an Electric Field Separates Complex Protein Mixtures
Protein gel electrophoresis serves as a fundamental analytical tool in biochemical research and clinical diagnostics, enabling the separation of complex protein mixtures based on their physicochemical properties. This technical guide examines the core principle of charged molecule migration under an electrical field, detailing how variables including molecular weight, net charge, and gel matrix properties collectively govern electrophoretic mobility. The discourse encompasses both theoretical foundations and practical methodologies, with particular emphasis on SDS-PAGE and native-PAGE systems. Within the broader context of proteomic research, this technique provides indispensable capabilities for protein characterization, purity assessment, and biomarker discovery, forming the cornerstone of experimental workflows in basic science and drug development.
Protein electrophoresis is a standard laboratory technique by which charged protein molecules are transported through a solvent by an electrical field [1]. This method leverages the fundamental physical principle that charged particles migrate toward oppositely charged electrodes when subjected to an electrical potential. The rate and direction of migration, known as electrophoretic mobility, depend on multiple factors intrinsic to both the protein molecules and the electrophoretic system [2].
At any pH other than their isoelectric point, proteins carry a net positive or negative charge due to the ionization of their amino acid side chains [1]. In an alkaline buffer environment, such as that used in most electrophoretic procedures, most proteins acquire a net negative charge and consequently migrate toward the positively charged anode [3]. The electrophoretic mobility of a protein is determined by the interplay between the electrical force driving its migration and the frictional forces resisting its movement through the matrix [2]. This relationship means that under controlled conditions, proteins with different physical properties will migrate at different rates, resulting in their physical separation within the gel matrix [1].
The support matrix, typically polyacrylamide or agarose, serves as a porous medium that functions as a molecular sieve [1]. Polyacrylamide gels, formed through the polymerization of acrylamide and bisacrylamide, create a cross-linked network with precisely controllable pore sizes [1] [4]. This matrix is particularly suitable for separating most proteins and smaller nucleic acids, while agarose gels with larger pore sizes are preferred for separating large protein complexes and nucleic acids [1]. The selection of an appropriate matrix and buffer system allows researchers to tailor separations for specific applications, from analytical procedures requiring high resolution to preparative techniques designed for protein recovery.
Core Factors Governing Electrophoretic Mobility
The migration of proteins during electrophoresis is governed by a complex interplay of factors that collectively determine the efficiency and resolution of separation. Understanding these variables is essential for both experimental design and accurate interpretation of results.
Properties of the Molecule: The size, shape, and net charge of a protein directly influence its mobility through the gel matrix [2]. Mobility is inversely proportional to molecular size and directly proportional to net charge [2]. Globular proteins typically demonstrate faster mobility than fibrous proteins of similar molecular weight due to their more compact structures [2]. In SDS-PAGE, the binding of sodium dodecyl sulfate masks the intrinsic charge of proteins, creating a uniform charge-to-mass ratio and ensuring separation occurs primarily based on molecular weight [1] [4].
Electrical Field Parameters: The strength of the electrical field, determined by the voltage applied, directly affects migration rate [2]. Higher voltage increases the speed of separation but generates more heat, which can cause diffusion of protein bands and reduce resolution [2]. Optimal voltage settings balance separation efficiency with band sharpness, with high-voltage electrophoresis (400-2000V) sometimes employed for rapid separation with minimal diffusion [2].
Buffer System Characteristics: The buffer serves dual purposes of carrying electrical current and maintaining stable pH throughout the electrophoresis run [2]. Buffer ionic strength critically affects resolution; higher ionic strength increases current sharing by buffer ions, slowing protein migration and generating excessive heat, while low ionic strength reduces overall current and resolution [2]. The pH determines the ionization state of protein functional groups, potentially altering both direction and velocity of migration if not properly controlled [2].
Support Medium Properties: The matrix through which proteins migrate creates a sieving effect that significantly influences separation [2]. The pore size of polyacrylamide gels is inversely proportional to the acrylamide concentration [1]. Low-percentage gels (e.g., 6-8%) with larger pores facilitate the separation of high molecular weight proteins, while high-percentage gels (e.g., 12-15%) with smaller pores provide better resolution for lower molecular weight proteins [1]. The phenomenon of electroendosmosis, caused by fixed charged groups on the support medium, can also affect resolution by generating counterflow of buffer ions [2].
Table 1: Key Factors Affecting Protein Electrophoretic Mobility
| Factor | Effect on Mobility | Practical Consideration |
|---|---|---|
| Molecular Weight | Inversely proportional | Smaller proteins migrate faster than larger ones [5] |
| Net Charge | Directly proportional | Higher charge density increases migration rate [1] |
| Molecular Shape | Compact shapes migrate faster | Globular proteins move more readily than fibrous proteins [2] |
| Field Strength | Proportional to voltage | Higher voltage speeds migration but generates more heat [2] |
| Buffer Ionic Strength | Complex effect | Optimal strength needed; too high causes heat, too low reduces resolution [2] |
| Gel Pore Size | Inversely related | Larger pores (low % acrylamide) for large proteins; smaller pores for small proteins [1] |
Methodological Approaches in Protein Electrophoresis
SDS-PAGE (Denaturing Electrophoresis)
Sodium dodecyl sulfate-polyacrylamide gel electrophoresis (SDS-PAGE) represents the most widely employed electrophoresis technique for separating proteins primarily by molecular mass [1]. The method relies on the ionic detergent SDS, which denatures proteins by wrapping around the polypeptide backbone and confers a uniform negative charge that masks the proteins' intrinsic charge [1] [4]. When protein samples are heated to 70-100°C in buffer containing excess SDS and a reducing agent such as beta-mercaptoethanol or dithiothreitol (DTT), disulfide bonds are cleaved and proteins fully dissociate into their subunits [1] [4]. Under these conditions, most polypeptides bind SDS in a constant weight ratio of approximately 1.4 g SDS per 1 g of polypeptide [1]. The resulting SDS-polypeptide complexes assume a rod-like shape with essentially identical charge density, ensuring migration through the gel occurs strictly according to polypeptide chain length with minimal influence from compositional differences [1].
The discontinuous buffer system employed in SDS-PAGE enhances resolution through two distinct gel phases [1] [4]. The stacking gel, with lower acrylamide concentration (typically 4-5%) and pH (~6.8), concentrates protein samples into tight bands before they enter the resolving gel [4]. The resolving gel, with higher acrylamide concentration (variable based on target protein size) and pH (~8.8), performs the actual separation based on molecular size [4]. Gradient gels with increasing acrylamide concentration from top to bottom provide an alternative approach, enabling separation of a broader range of protein sizes without a discrete stacking phase [1].
Native-PAGE
Native polyacrylamide gel electrophoresis (native-PAGE) separates proteins according to their net charge, size, and shape while maintaining their native conformation [1]. Without denaturing agents, subunit interactions within multimeric proteins are generally preserved, allowing researchers to gain information about quaternary structure and, in many cases, retain enzymatic activity following separation [1]. In this technique, proteins migrate at rates proportional to their charge density (more charges per molecule mass migrate faster) while simultaneously experiencing the sieving effect of the gel matrix, which regulates movement according to size and three-dimensional structure [1]. Several variants exist, including blue native-PAGE (using Coomassie dye to provide charge to native complexes) and clear native-PAGE (utilizing intrinsic protein charge) [6]. Maintaining cool temperatures during electrophoresis and avoiding pH extremes is crucial for preserving protein integrity in native systems [1].
Two-Dimensional Electrophoresis
Two-dimensional polyacrylamide gel electrophoresis (2D-PAGE) provides the highest resolution for protein analysis by separating compounds based on two independent properties in sequential procedures [1]. The first dimension employs isoelectric focusing (IEF), where proteins migrate through a pH gradient until they reach their isoelectric point (pI), the pH at which their net charge becomes zero [1]. The second dimension then separates the same proteins by mass using standard SDS-PAGE oriented at a 90-degree angle to the first separation [1]. This orthogonal approach can resolve thousands of proteins on a single gel, making it an invaluable technique in proteomic research where comprehensive protein profiling is required [1].
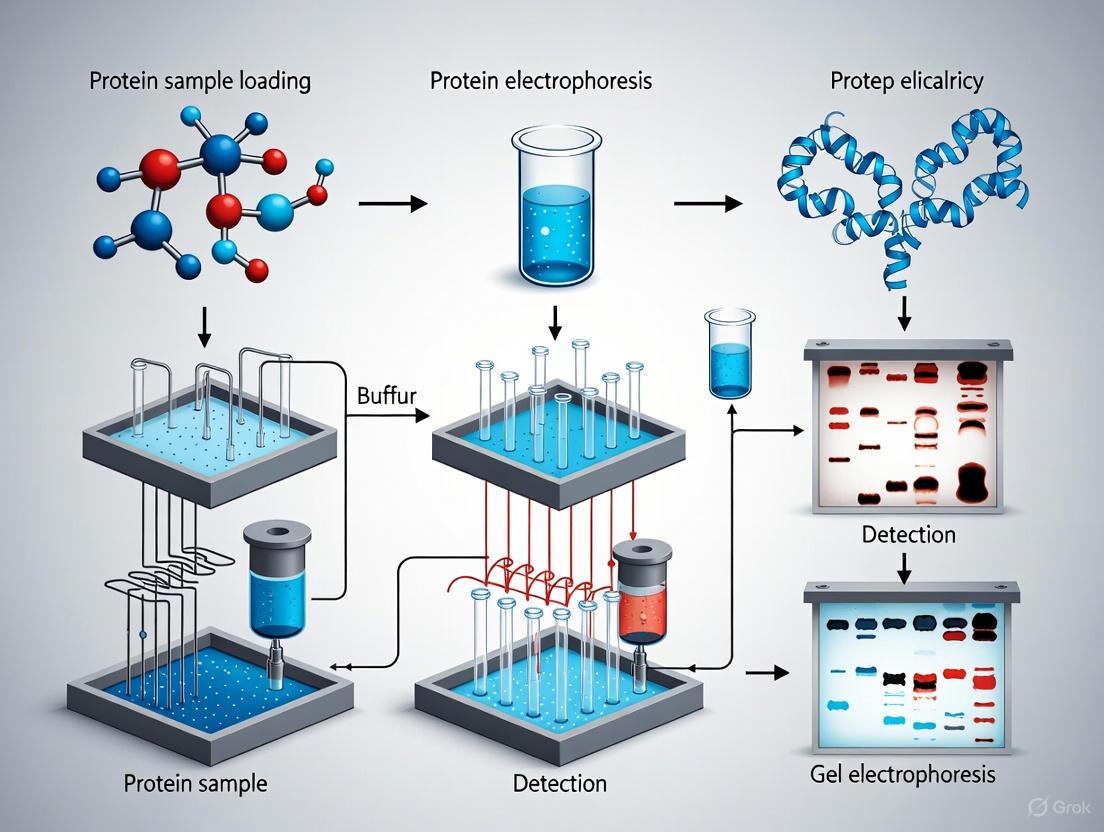
Diagram 1: Protein Electrophoresis Experimental Workflow
Experimental Protocol: SDS-PAGE Procedure
Gel Preparation and Casting
Polyacrylamide gels are formed through the polymerization of acrylamide and bis-acrylamide, a cross-linking agent, in the presence of catalytic compounds [1] [4]. The polymerization reaction is initiated by ammonium persulfate (APS), which generates free radicals, and tetramethylethylenediamine (TEMED), which catalyzes the formation of these free radicals [1] [4]. The resulting cross-linked polymer network creates a porous matrix with pore size determined by the ratio of bis-acrylamide to acrylamide and the total concentration of both components [1].
Step-by-step procedure for traditional discontinuous gel casting [5] [4]:
- Assemble casting apparatus: Thoroughly clean glass plates with ethanol and assemble with spacers to form a water-tight cassette [5].
- Prepare resolving gel: Mix acrylamide solution, bis-acrylamide, Tris-HCl buffer (pH 8.8), SDS, and water. Add TEMED and APS last to initiate polymerization and immediately pour the solution between the glass plates [1] [4].
- Overlay with solvent: Carefully layer water-saturated butanol or isopropanol over the resolving gel to exclude oxygen and create a flat interface [5] [4].
- Polymerize resolving gel: Allow the gel to polymerize completely (typically 20-30 minutes), then remove the overlay solvent and rinse the gel surface [5].
- Prepare stacking gel: Mix acrylamide solution with Tris-HCl buffer (pH 6.8), SDS, and water. Add TEMED and APS, then pour over the polymerized resolving gel [1] [4].
- Insert comb: Place a sample well comb into the stacking gel without introducing air bubbles and allow polymerization to complete [5] [4].
Table 2: Example Traditional Polyacrylamide Gel Formulation [1]
| Component | Resolving Gel (10%) | Stacking Gel (~4%) | Function |
|---|---|---|---|
| Acrylamide Solution | 7.5 mL (40%) | Variable lower concentration | Polymer matrix formation |
| Bis-acrylamide | 3.9 mL (1%) | Variable lower concentration | Cross-linking agent |
| Tris-HCl Buffer | 7.5 mL (1.5 M, pH 8.8) | Different volume (pH 6.8) | Maintains pH during run |
| SDS | 0.3 mL (10%) | Small amount | Uniform negative charge |
| APS | 0.3 mL (10%) | Small amount | Polymerization initiator |
| TEMED | 0.03 mL | Small amount | Polymerization catalyst |
| Water | To 30 mL final volume | To final volume | Solvent |
Sample Preparation and Electrophoresis
Proper sample preparation is critical for successful protein separation. The protocol involves both denaturation and reduction steps to ensure complete unfolding of protein structures [4].
Sample preparation procedure [5] [4]:
- Mix sample with buffer: Combine protein sample with SDS-PAGE sample buffer containing SDS, reducing agent (DTT or beta-mercaptoethanol), glycerol, tracking dye (bromophenol blue), and Tris-HCl buffer [5].
- Denature proteins: Heat the sample mixture at 95-100°C for 3-5 minutes in a heat block to disrupt hydrogen bonds and ensure complete denaturation [5] [4].
- Centrifuge: Briefly centrifuge at high speed (e.g., 15,000 rpm for 1 minute) to collect condensation and particulate matter [5].
- Load gel: Using a micropipette, load samples and molecular weight markers into wells of the polymerized gel [5].
- Run electrophoresis: Assemble the gel cassette in the electrophoresis apparatus, fill buffer chambers, connect to power supply, and run at constant voltage until the tracking dye approaches the gel bottom [5]. Typical conditions for a mini-gel are 150-200 V for 30-50 minutes [1].
- Post-processing: Disassemble apparatus, remove gel from plates, and proceed with staining, western blotting, or other analytical techniques [5].
Visualization, Analysis, and Data Interpretation
Protein Detection Methods
Following electrophoretic separation, proteins immobilized within the gel matrix must be visualized for analysis. Multiple staining techniques offer different levels of sensitivity and compatibility with downstream applications.
Coomassie Brilliant Blue staining provides a reliable and relatively sensitive method for protein detection, binding strongly to proteins to produce deep blue bands against a colorless background [6]. This stain is compatible with protein extraction for further analysis and is commonly used in both analytical and preparative applications. Silver staining offers significantly higher sensitivity, capable of detecting trace amounts of proteins in the nanogram range, but can be more technically challenging and may not be compatible with subsequent protein sequencing or mass spectrometry analysis [6]. Fluorescent stains including SYPRO Ruby and others provide alternative detection methods with broad linear dynamic ranges, though they require appropriate imaging equipment for visualization.
Quantitative Analysis and Uncertainty Estimation
Following staining and imaging, densitometric analysis quantifies protein abundance by measuring the optical density of separated bands, which is directly proportional to the concentration of stained protein [2]. This approach enables semi-quantitative comparison of protein levels between samples when appropriate controls and standards are included.
Advanced computational methods have been developed to improve the accuracy and efficiency of gel image analysis. Traditional approaches involve converting lane images to one-dimensional intensity profiles and applying peak-finding algorithms to identify and quantify bands [7]. More recently, artificial intelligence-based systems have demonstrated capability to automatically identify bands through segmentation, classifying pixels as 'band' or 'background' with accuracy matching or exceeding conventional methods [7]. These AI-powered frameworks can extract bands from diverse gel images in seconds without requiring expert knowledge, potentially revolutionizing this aspect of electrophoretic analysis [7].
Uncertainty in quantitative electrophoresis arises from multiple sources, including sample preparation variability, electrophoretic conditions, staining efficiency, and image analysis methodologies [8]. Studies indicate that methodological errors in band identification and integration can reach up to 10%, while baseline noise may contribute up to 5% uncertainty [8]. Proper experimental design with replication, inclusion of standards, and consistent processing protocols helps minimize these uncertainties and improve data reliability.
Essential Research Reagents and Materials
Successful protein electrophoresis requires precise formulation of reagents and appropriate selection of materials. The following table catalogizes essential components for standard procedures.
Table 3: Essential Research Reagent Solutions for Protein Electrophoresis
| Reagent/Material | Composition/Type | Function in Procedure |
|---|---|---|
| Acrylamide/Bis-acrylamide | 29:1 or 37:1 ratio mixtures | Forms cross-linked polymer matrix for molecular sieving [1] [4] |
| Tris-HCl Buffers | Tris(hydroxymethyl)aminomethane + HCl | Maintains pH in stacking (pH 6.8) and resolving (pH 8.8) gels [1] |
| SDS (Sodium Dodecyl Sulfate) | Anionic detergent | Denatures proteins and confers uniform negative charge [1] [4] |
| APS (Ammonium Persulfate) | Free radical source | Initiates acrylamide polymerization reaction [1] [4] |
| TEMED | N,N,N',N'-Tetramethylethylenediamine | Catalyzes free radical formation from APS, accelerating polymerization [1] [4] |
| DTT/BME | Dithiothreitol/Beta-mercaptoethanol | Reducing agents that break disulfide bonds [4] |
| Protein Molecular Weight Markers | Prestained or unstained protein ladders | Reference standards for molecular mass determination [1] |
| Coomassie Brilliant Blue | Triphenylmethane dye | Protein stain for visualization after separation [6] |
| Tracking Dye | Bromophenol Blue in glycerol | Visualizes migration front during electrophoresis [6] |
Applications in Research and Drug Development
Protein electrophoresis serves as a foundational analytical technique with diverse applications across biological research and pharmaceutical development. In basic research, it provides critical information about protein purity, integrity, subunit composition, and molecular weight [6] [9]. The technique is routinely employed to monitor protein purification processes, assess recombinant protein expression, and verify antibody specificity. As a preliminary step in proteomic workflows, electrophoresis enables fractionation of complex protein mixtures prior to analysis by mass spectrometry or other advanced analytical techniques [1] [9].
In clinical diagnostics and drug development, serum protein electrophoresis (SPE) represents a cornerstone technique for identifying dysproteinemias associated with various disease states [3]. Electrophoretic patterns of serum proteins facilitate diagnosis of conditions such as multiple myeloma through detection of monoclonal gammopathies, characterized by discrete, narrow bands in the gamma region [3]. Similarly, polyclonal gammopathies, appearing as broad increases in gamma globulins, indicate inflammatory or infectious processes [3]. Acute phase responses manifest as elevated alpha globulins, providing valuable diagnostic information for monitoring disease progression and therapeutic response [3].
The pharmaceutical industry relies heavily on electrophoresis for biopharmaceutical characterization, including assessment of therapeutic protein purity, detection of degradation products, and verification of monoclonal antibody integrity [9]. These applications ensure product quality and consistency throughout development and manufacturing processes. Additionally, specialized electrophoretic techniques including capillary electrophoresis and two-dimensional electrophoresis continue to expand the utility of this fundamental separation principle in increasingly sophisticated analytical contexts.
Electrophoresis is a foundational technique in biochemistry and molecular biology for separating charged molecules based on their differential migration in an electric field. The principle of protein gel electrophoresis research hinges on understanding and manipulating the factors that govern this migration, known as electrophoretic mobility. For researchers and drug development professionals, optimizing these parameters is crucial for obtaining high-resolution data in applications ranging from purity assessment of biopharmaceuticals to biomarker discovery. Electrophoretic mobility (μ) is defined by the relationship μ = v/E, where v is the velocity of the molecule and E is the electric field strength [10]. This review provides an in-depth technical examination of the key factors—molecular properties (charge, size, shape) and buffer conditions—that determine electrophoretic mobility, equipping scientists with the knowledge to design and interpret protein separation experiments effectively.
Fundamental Principles and Mathematical Relationship of Electrophoretic Mobility
The electrophoretic mobility of a molecule determines its velocity within an electric field and is the ultimate factor defining its position after separation. The overall mobility is governed by a balance between the driving force of the electric field and the retarding frictional forces of the medium.
The fundamental equation for electrophoretic mobility (μ) is [10]: μ = v/E = q/f Where:
- v is the velocity of the molecule
- E is the electric field strength (voltage/distance)
- q is the net charge of the molecule
- f is the frictional coefficient, representing the molecule's resistance to movement through the medium
The frictional coefficient f is itself influenced by the molecule's size, shape, and the viscosity of the medium. This core relationship illustrates that mobility is directly proportional to the molecule's net charge and inversely proportional to the factors that increase frictional drag [2] [10].
The following diagram illustrates the core relationship between a protein's properties and its electrophoretic mobility.
Core Factors Governing Electrophoretic Mobility
Molecular Charge
The net charge of a protein is the primary driver of its electrophoretic mobility and is influenced by the pH of the buffer relative to the protein's isoelectric point (pI).
- Charge and Migration Direction: Particles with a negative charge (anions) migrate toward the positive electrode (anode), while positively charged particles (cations) migrate toward the negative electrode (cathode) [2].
- Dependence on pH: Proteins contain ionizable groups on their amino acid side chains. The net charge of a protein is determined by the pH of the buffer relative to the protein's pI. When the buffer pH is less than the protein's pI, the protein carries a net positive charge and migrates toward the cathode. When the pH is greater than the pI, the protein carries a net negative charge and migrates toward the anode [11].
- Charge-to-Mass Ratio: In techniques like SDS-PAGE, the binding of sodium dodecyl sulfate (SDS) imparts a uniform negative charge density, masking the protein's intrinsic charge. This creates a constant charge-to-mass ratio, allowing separation to proceed primarily based on size [12] [13].
Molecular Size and Shape
The size and three-dimensional structure of a protein determine the frictional resistance it experiences when moving through the gel matrix.
- Molecular Size: Mobility is inversely proportional to the size of the molecule [2] [13]. Larger molecules experience greater frictional drag and migrate more slowly through the porous gel matrix, which acts as a molecular sieve [10] [14].
- Molecular Shape: The three-dimensional conformation of a protein significantly impacts its mobility. Globular proteins, with their compact structures, typically experience less drag and have faster mobility compared to fibrous proteins of a similar molecular weight [2]. The shape influences the effective hydrodynamic volume and thus the frictional coefficient
fin the mobility equation.
Buffer Conditions
The buffer system is not merely a conductor of current; it creates the chemical environment that dictates the behavior of the molecules being separated.
- Buffer pH: The pH is critical as it determines the ionization state of the protein and thus its net charge [2] [11]. It also affects the charge of the gel matrix itself (e.g., ionized sulfate groups in agarose), which can lead to electroendosmotic flow [2].
- Ionic Strength: The concentration of ions in the buffer has a dual effect. Higher ionic strength increases the current carried by the buffer ions, which can slow sample migration and generate excessive heat, leading to band diffusion. Conversely, low ionic strength reduces the overall current and can diminish resolution [2] [11].
- Buffer Composition: Discontinuous buffer systems (e.g., Tris-Glycine in the Laemmli method) use different pH and composition in the gel and tank buffer to create a stacking effect. This concentrates the protein samples into sharp bands before they enter the resolving gel, greatly enhancing resolution [12].
Table 1: Summary of Core Factors Affecting Electrophoretic Mobility
| Factor | Effect on Mobility | Underlying Principle |
|---|---|---|
| Net Charge (q) | Directly Proportional | Higher net charge increases the driving force in the electric field [2] [10]. |
| Molecular Size | Inversely Proportional | Larger size increases frictional drag (f) through the gel pores [2] [13]. |
| Molecular Shape | Variable (Globular > Fibrous) | Compact shapes present a smaller hydrodynamic radius, reducing friction [2]. |
| Buffer pH | Determines charge sign/magnitude | pH relative to pI controls the ionization state of protein side chains [2] [11]. |
| Buffer Ionic Strength | High: Decreases; Low: Can decrease resolution | High ionic strength shares current, generates heat; low ionic strength reduces conductivity [2]. |
Experimental Control and Optimization
Standardization via SDS-PAGE
The SDS-PAGE (Sodium Dodecyl Sulfate Polyacrylamide Gel Electrophoresis) protocol is a quintessential example of how to control for multiple factors to achieve separation based on a single variable—molecular weight.
Sample Preparation:
- Proteins are denatured by heating (typically 95-100°C) in a sample buffer containing SDS (an anionic detergent) and a reducing agent (e.g., β-mercaptoethanol or DTT) [12] [13].
- SDS binds uniformly to the polypeptide backbone, imparting a large negative charge that masks the protein's intrinsic charge.
- The reducing agent breaks disulfide bonds, ensuring complete unfolding into individual polypeptides.
- The result is a solution of linear polypeptide chains with a uniform charge-to-mass ratio and a consistent, rod-like shape [12] [13].
Gel Preparation:
- Polyacrylamide gels are formed by polymerizing acrylamide and a cross-linker (bis-acrylamide). The gel pore size is controlled by the total percentage of acrylamide (%T). Higher %T creates smaller pores, providing better resolution for lower molecular weight proteins [12] [14] [13].
- Discontinuous systems use a low-percentage stacking gel (large pores) and a higher-percentage resolving gel (smaller pores). The different pH and acrylamide concentrations work together to stack proteins into sharp bands before separation in the resolving gel [12].
Electrophoresis and Visualization:
- The denatured, SDS-coated proteins are loaded onto the gel, and an electric field is applied. Due to their negative charge, they migrate towards the anode.
- Separation occurs in the resolving gel primarily based on molecular weight, as smaller polypeptides navigate the pores more easily than larger ones [13].
- Post-electrophoresis, proteins are visualized using stains like Coomassie Brilliant Blue or more sensitive options like silver stain or fluorescent dyes [12].
Advanced Techniques for Specific Applications
- Native PAGE: This technique is performed without denaturants, preserving the protein's native charge, shape, and functional state. Separation depends on the complex interplay of the protein's intrinsic charge, size, and shape [12].
- Isoelectric Focusing (IEF): This method separates proteins based solely on their isoelectric point (pI). Proteins migrate through a stable pH gradient until they reach the pH where their net charge is zero (their pI), at which point they focus into sharp bands [2].
- Two-Dimensional Gel Electrophoresis: This powerful combination first separates proteins by their pI using IEF, followed by a second dimension where the strip is placed on an SDS-PAGE gel to separate by molecular weight. This allows for the high-resolution separation of complex protein mixtures [2].
Table 2: Optimizing Electrophoretic Conditions for Different Goals
| Analytical Goal | Recommended Technique | Key Controlled Factors | Typical Buffer/Gel System |
|---|---|---|---|
| Molecular Weight Determination | SDS-PAGE | Denatures proteins; masks intrinsic charge with SDS; reduces disulfide bonds [12] [13]. | Discontinuous Tris-Glycine or Bis-Tris systems [12]. |
| Analysis of Native Structure/Complexes | Native PAGE / BN-PAGE | No denaturants; preserves native charge, shape, and protein-protein interactions [12]. | Tris-Glycine, often with Coomassie G-250 (BN-PAGE) [12]. |
| Separation by Isoelectric Point | Isoelectric Focusing (IEF) | Uses a pH gradient; proteins migrate to their pI (net charge = 0) [2]. | Polyacrylamide or agarose gel with immobilized ampholytes. |
| High-Resolution Proteomics | Two-Dimensional (2D) PAGE | 1st Dimension: pI (IEF); 2nd Dimension: Mass (SDS-PAGE) [2]. | Combination of IEF and SDS-PAGE systems. |
The Scientist's Toolkit: Essential Reagents and Materials
Table 3: Key Research Reagent Solutions for Protein Gel Electrophoresis
| Reagent/Material | Function in the Experiment | Key Consideration |
|---|---|---|
| SDS (Sodium Dodecyl Sulfate) | Strong anionic detergent that denatures proteins and confers a uniform negative charge, enabling separation by size [12] [13]. | Purity is critical for consistent binding and migration. |
| Acrylamide/Bis-Acrylamide | Monomer and cross-linker that polymerize to form the porous polyacrylamide gel matrix, which acts as a molecular sieve [2] [13]. | Concentration determines pore size; a neurotoxin in its unpolymerized form. |
| Reducing Agent (e.g., DTT, β-mercaptoethanol) | Breaks disulfide bonds within and between polypeptide chains, ensuring complete denaturation and linearization of proteins [12] [13]. | Must be fresh; included in the sample loading buffer. |
| Tris-based Buffers | Provides the conductive medium and maintains a stable pH during electrophoresis [12]. | Discontinuous systems use different buffers (e.g., Tris-HCl for gel, Tris-Glycine for tank) [12]. |
| Ammonium Persulfate (APS) & TEMED | Catalysts for the free-radical polymerization of acrylamide to form a polyacrylamide gel [2] [13]. | Fresh APS is required for efficient and timely gel polymerization. |
| Protein Stain (Coomassie, Silver, Fluorescent Dyes) | Binds to proteins to visualize separated bands after electrophoresis [12]. | Coomassie is routine; silver is more sensitive; fluorescent dyes offer wide dynamic range. |
| Tracking Dye (Bromophenol Blue) | A low-molecular-weight colored compound mixed with the sample to visually monitor the progress of the electrophoretic run [12]. | Migrates ahead of most proteins, indicating the leading edge of separation. |
A deep understanding of the factors governing electrophoretic mobility—charge, size, shape, and buffer conditions—is fundamental to the principle of protein gel electrophoresis research. By systematically controlling these variables through techniques like SDS-PAGE, researchers can transform a complex mixture of proteins into a clear, interpretable pattern of bands. This capability is indispensable in modern life sciences, underpinning critical endeavors in drug development, such as assessing the purity and integrity of recombinant protein therapeutics, analyzing differential protein expression in disease states, and validating target engagement. As electrophoretic techniques continue to evolve, particularly in areas of microchip integration and enhanced detection sensitivity, their role in accelerating scientific discovery and biopharmaceutical innovation remains as vital as ever.
Within the framework of protein gel electrophoresis research, the fundamental principle is the separation of macromolecules based on their physical characteristics to facilitate analysis of complex biological mixtures. The core of this principle lies in the ability to resolve proteins into discrete bands, allowing researchers to determine purity, estimate molecular weight, and identify components. The support matrix is the critical component that makes this separation possible, acting as a molecular sieve to differentially retard the migration of molecules based on their size. Polyacrylamide gel has emerged as the matrix of choice for protein separation due to its highly tunable pore structure, which can be precisely engineered to separate molecules across a wide size range. This technical guide explores the fundamental mechanisms, composition, and practical implementation of polyacrylamide gels as molecular sieves in electrophoretic separations, providing researchers with both theoretical understanding and practical methodologies.
The Molecular Sieve Mechanism in Polyacrylamide Gels
Fundamental Principles of Molecular Sieving
The molecular sieve effect in polyacrylamide gel electrophoresis operates on the principle that molecules moving through a gel matrix under the influence of an electric field will encounter resistance from the gel structure. The polyacrylamide gel forms a three-dimensional mesh-like network with pores of defined sizes through which molecules must travel [15]. Smaller molecules navigate these pores with relative ease, while larger molecules are progressively more hindered, resulting in separation by size [16] [17].
This molecular sieving process is governed by the electrophoretic mobility (μ) of proteins, which is determined by the formula: μ = q/E, where q represents the charge of the molecule and E represents the frictional coefficient. In native PAGE, both charge and shape influence mobility, but in SDS-PAGE, the use of sodium dodecyl sulfate (SDS) largely eliminates the influence of structure and charge by linearizing proteins and conferring a uniform negative charge [16] [15]. This results in proteins being separated solely based on polypeptide chain length [16], as the SDS-bound proteins all have a similar mass-to-charge ratio [17].
The frictional coefficient E is directly influenced by the gel concentration, with higher acrylamide concentrations creating smaller pores that exert greater frictional forces on migrating molecules [15] [17]. The pore size distribution within the gel is not uniform but forms a statistical array that creates a sieving effect, with the average pore diameter determined by the total concentration of acrylamides (%T) and the concentration of the cross-linker bisacrylamide (%C) [17].
Gel Composition and Pore Structure
The structure of polyacrylamide gels has been examined through transmission-electron microscopy of freeze-etched specimens, revealing structural details that correlate with empirical findings concerning the molecular sieving effect [18]. The gel is created through the polymerization of acrylamide monomers cross-linked by N,N'-methylene bisacrylamide [15] [19]. This reaction is initiated by ammonium persulfate (APS) and catalyzed by tetramethylethylenediamine (TEMED) [15] [17].
The resulting gel structure possesses several electrophoretically desirable features that make it a versatile medium [17]. The pore size can be precisely controlled by adjusting the concentration of acrylamide and bisacrylamide, with the average pore diameter reduced reciprocally as the total acrylamide concentration increases [17]. The cross-linking ratio also influences pore size, with a concentration of approximately 5% bisacrylamide producing the smallest pores [17].
Table 1: Influence of Acrylamide Concentration on Separation Range
| Acrylamide Concentration (%) | Effective Separation Range (kDa) | Primary Applications |
|---|---|---|
| 4-8% | Large proteins (>100 kDa) | Separation of high molecular weight complexes |
| 8-12% | 30-100 kDa | Standard protein separation, routine analysis |
| 12-20% | <30 kDa | Small proteins, peptides, high-resolution separation |
| Gradient (e.g., 4-20%) | Broad range (10-300 kDa) | Complex mixtures with diverse protein sizes |
Practical Implementation and Methodologies
Gel Preparation and Optimization
The preparation of polyacrylamide gels with consistent molecular sieving properties requires careful attention to composition and polymerization conditions. The process begins with assembling a gel casting system consisting of glass plates, spacers, and a comb to create sample wells [16]. The gel is typically formed in two distinct sections: a stacking gel (usually around 4% acrylamide) with a pH of approximately 6.8, and a resolving gel (typically between 6-15% acrylamide) with a pH of about 8.8 [15].
The resolving gel, which performs the actual molecular sieving, is poured first. The acrylamide solution for this gel contains acrylamide monomer, bisacrylamide cross-linker, buffer (typically Tris-HCl at pH 8.8 for SDS-PAGE), and SDS for denaturing electrophoresis [16] [15]. After adding APS and TEMED to initiate polymerization, the solution is pipetted between the glass plates, and a layer of hydrated isopropyl alcohol is often added on top to create a crisp edge and prevent oxygen inhibition of polymerization [16] [15]. Once polymerized (20-30 minutes), the isopropyl alcohol is removed, and the stacking gel is added with the comb inserted to create sample wells [16].
Table 2: Essential Reagents for Polyacrylamide Gel Electrophoresis
| Reagent | Function | Typical Concentrations/Usage |
|---|---|---|
| Acrylamide | Main gel matrix component | Varies from 5% to 20% total concentration depending on target protein size |
| Bisacrylamide | Cross-linking agent | Generally 1:35 to 1:40 ratio with acrylamide |
| Ammonium Persulfate (APS) | Free radical initiator for polymerization | 0.1% final concentration |
| TEMED | Polymerization catalyst | 0.1% final concentration |
| Tris-HCl Buffer | Maintains pH during electrophoresis | Resolving gel: 1.5 M Tris, pH 8.8; Stacking gel: 0.5 M Tris, pH 6.8 |
| SDS (Sodium Dodecyl Sulfate) | Denatures proteins and confers negative charge | 0.1% in gels and running buffers |
| Running Buffer | Conducts current and maintains pH | Typically Tris-glycine with 0.1% SDS |
Electrophoresis Procedure
The electrophoresis process begins with sample preparation. For SDS-PAGE, protein samples are mixed with loading buffer containing SDS, a reducing agent (such as β-mercaptoethanol or DTT), glycerol, and a tracking dye (typically bromophenol blue) [16] [15]. The samples are then heated at 95-100°C for 3-5 minutes to ensure complete denaturation [16] [17]. For native PAGE, SDS and reducing agents are omitted, and no heating step is performed to maintain proteins in their native conformation [15].
After loading samples and molecular weight markers into the wells, an electric current is applied (typically 100-200 V for mini-gel systems) [16] [15]. The discontinuous buffer system creates a stacking effect at the interface between the stacking and resolving gels, concentrating the proteins into a tight band before they enter the resolving gel where separation based on size occurs [15]. Electrophoresis continues until the tracking dye front reaches the bottom of the gel, indicating completion.
Visualization and Analysis
Following electrophoresis, separated proteins are visualized using various staining techniques. Coomassie Brilliant Blue is the most commonly used non-covalent stain for proteins, creating blue bands that can be detected visually, though with limited sensitivity [20]. Silver staining offers higher sensitivity, where soluble silver ions permanently mark proteins and are reduced by formaldehyde to form a brown precipitate [20]. For specialized applications, fluorescent dyes may be incorporated for enhanced sensitivity [21].
Advanced analysis techniques include digital image acquisition with mathematical processing of electropherograms for protein quantification [22]. Specialized software such as Chrom & Spec can be used to convert gel images to densitograms, with peak areas corresponding to protein content [22]. For two-dimensional gels, sophisticated image analysis software (Delta2D, PDQuest, Progenesis) employs image warping and consensus spot patterns to overcome variations between gels and enable accurate quantification [23].
Advanced Applications and Current Developments
Quantitative Electrophoresis
While traditionally considered a qualitative technique, PAGE can be adapted for protein quantification through careful implementation of digital imaging and mathematical processing [22]. This approach involves acquiring high-resolution images of stained gels under uniform illumination conditions, followed by software-based analysis to generate densitograms where peak areas correlate with protein concentration [22]. This methodology has been successfully applied to both purified protein systems (e.g., bovine serum albumin) and complex protein mixtures (e.g., casein-containing sports nutrition supplements) [22].
The global protein gel market, valued at approximately $2.5 billion in 2024, reflects the continued importance of these techniques, with innovations focusing on miniaturization of gels for high-throughput analysis, development of pre-cast gels with improved resolution and reproducibility, and incorporation of fluorescent dyes for enhanced sensitivity [21].
Two-Dimensional Electrophoresis
For complex protein mixtures, two-dimensional gel electrophoresis combines isoelectric focusing (first dimension) with SDS-PAGE (second dimension) to separate proteins based on both charge and molecular weight [23]. This technique can resolve up to 10,000 protein spots on a single gel, providing a powerful tool for proteomic analysis [23]. Software-based image analysis is crucial for interpreting 2D gel experiments, with recent advances including image warping methods that correct for positional variations between gels and consensus spot patterns that enable more reliable matching and quantification [23].
Experimental Workflow and Visualization
The following diagram illustrates the complete workflow for polyacrylamide gel electrophoresis, highlighting the role of the gel as a molecular sieve:
Diagram 1: Polyacrylamide Gel Electrophoresis Workflow. This diagram illustrates the complete experimental process, highlighting the molecular sieve mechanism where smaller proteins migrate faster through the gel matrix than larger proteins.
The selection of appropriate gel concentration is critical for optimal separation. The following decision guide illustrates the relationship between gel percentage and protein separation:
Diagram 2: Gel Concentration Selection Guide. This diagram provides guidance for selecting appropriate acrylamide concentrations based on target protein size, illustrating the inverse relationship between acrylamide percentage and pore size.
Polyacrylamide gel electrophoresis remains a cornerstone technique in biochemical research and biotechnology, with its effectiveness fundamentally rooted in the molecular sieving properties of the polyacrylamide matrix. The ability to precisely control pore size by adjusting acrylamide concentration enables researchers to separate proteins across a wide size range with high resolution. While traditional PAGE is primarily qualitative, advances in digital imaging and analysis software have expanded its capabilities to include reliable protein quantification. The continued evolution of the technique, including miniaturization, improved sensitivity, and integration with downstream analysis methods, ensures that PAGE will remain an essential tool in proteomic research and biopharmaceutical development. Understanding the fundamental role of the support matrix as a molecular sieve allows researchers to optimize experimental conditions and correctly interpret separation results within the broader context of protein analysis.
Protein gel electrophoresis is a foundational technique in biochemical research and drug development, enabling the separation of complex protein mixtures based on their molecular size. The core principle hinges on applying an electric field to drive charged proteins through a porous polyacrylamide gel matrix. In the most common variant, SDS-PAGE (Sodium Dodecyl Sulfate–Polyacrylamide Gel Electrophoresis), proteins are denatured and uniformly coated with the negatively charged SDS detergent, rendering them a consistent charge-to-mass ratio [24] [25]. Consequently, separation occurs primarily by molecular weight, with smaller proteins migrating faster through the gel's molecular sieve than larger ones [26]. This methodology provides researchers with a powerful tool for analyzing protein purity, estimating molecular weight, and preparing samples for downstream applications like western blotting or mass spectrometry.
Core Components of the Electrophoresis Apparatus
A standard SDS-PAGE setup is an integrated system composed of several key components, each fulfilling a critical function for successful protein separation.
The Gel Matrix: Polyacrylamide
The polyacrylamide gel is the central separation medium, formed through the polymerization of acrylamide and a cross-linker, typically N,N'-methylenebisacrylamide [25]. This creates a three-dimensional network whose pore size is determined by the concentrations of these components; higher percentages of acrylamide create smaller pores, providing better resolution for lower molecular weight proteins [26]. The gel is structurally divided into two distinct layers:
- Stacking Gel: A large-pore gel (typically 4-5% acrylamide) at a neutral pH (~6.8) where protein samples are concentrated into a sharp starting zone before entering the resolving gel [25].
- Resolving Gel (Separating Gel): A small-pore gel (typically 8-15% acrylamide) at a basic pH (~8.8) where the actual size-based separation of proteins occurs [24]. The appropriate percentage is chosen based on the target protein's molecular weight.
The Electrophoresis Module
This module houses the gel and provides the environment for electrophoresis.
- Gel Cassette: Comprises two glass plates separated by thin spacers, which form the mold in which the gel is cast and define the gel's thickness (commonly 0.75 mm or 1.5 mm) [24].
- Buffer Chambers: The apparatus contains two buffer chambers filled with a running buffer (e.g., Tris-glycine-SDS).
- Upper Chamber (Cathode): Houses the gel cassette and interfaces with the top of the gel where the wells are located.
- Lower Chamber (Anode): Interfaces with the bottom of the gel.
- Electrodes and Power Supply: Platinum or wire electrodes are immersed in each buffer chamber and connected to a high-voltage power supply. The power supply delivers a constant voltage (typically 100-200 V) to drive the migration of proteins toward the anode (positive electrode) [24] [25].
Critical Reagents and Chemical Components
The successful execution of SDS-PAGE relies on a suite of specialized reagents [24] [25].
Table 1: Essential Reagent Solutions for SDS-PAGE
| Reagent Solution | Function |
|---|---|
| SDS (Sodium Dodecyl Sulfate) | Anionic detergent that denatures proteins and confers a uniform negative charge, negating the influence of intrinsic protein charge [25]. |
| Reducing Agents (DTT, β-Mercaptoethanol) | Break disulfide bonds in proteins by reducing them, ensuring complete unfolding into linear polypeptides [24] [25]. |
| Tris-based Buffers | Maintain a stable pH throughout the electrophoresis process. Different pH levels in the stacking (pH 6.8) and resolving (pH 8.8) gels enable the discontinuous system [24]. |
| APS & TEMED | Ammonium Persulfate (APS) and Tetramethylethylenediamine (TEMED) are catalysts that initiate and drive the free-radical polymerization of acrylamide to form the polyacrylamide gel [25]. |
| Tracking Dye (Bromophenol Blue) | A small, colored molecule added to the sample buffer to visually monitor the progress of electrophoresis [24]. |
Detailed Experimental Protocol for SDS-PAGE
The following is a standardized methodology for performing SDS-PAGE.
Gel Casting Procedure
- Assemble Gel Cassette: Clean and dry the glass plates and spacers. Assemble the cassette and clamp it securely in a casting stand to create a water-tight mold [25].
- Prepare and Pour Resolving Gel: Mix the resolving gel solution containing acrylamide/bis-acrylamide, Tris-HCl (pH 8.8), SDS, and water. Add catalysts APS and TEMED to initiate polymerization and immediately pipette the solution into the gel cassette. Layer the top with isopropanol or water-saturated butanol to create a flat, oxygen-free interface, which ensures even polymerization [24] [25].
- Prepare and Pour Stacking Gel: After the resolving gel has polymerized (∼15-30 minutes), pour off the overlay. Prepare the stacking gel solution with acrylamide, Tris-HCl (pH 6.8), SDS, APS, and TEMED. Pour it onto the resolving gel and immediately insert a sample comb without introducing air bubbles [25].
- Polymerize: Allow the stacking gel to polymerize completely (∼15-30 minutes). The gel can be used immediately or stored refrigerated for a short period.
Sample Preparation
- Mix with Sample Buffer: Combine the protein sample with a 2X or 5X SDS-PAGE sample buffer. This buffer contains SDS for denaturation and charge, a reducing agent (DTT or β-mercaptoethanol) to break disulfide bonds, Tris for pH, glycerol for density, and bromophenol blue as the tracking dye [24] [25].
- Denature: Heat the sample mixture at 95°C for 5 minutes (or 70°C for 10 minutes). This heat treatment disrupts hydrogen bonds and secondary structures, ensuring proteins are fully denatured and linearized [24] [25].
- Cool and Centrifuge: Briefly cool the sample to room temperature and centrifuge to consolidate condensation.
Electrophoresis Execution
- Assemble Apparatus: Place the polymerized gel cassette into the electrophoresis chamber. Fill the inner (upper) and outer (lower) chambers with running buffer (e.g., Tris-glycine-SDS) [24].
- Load Samples: Carefully remove the sample comb. Using a microsyringe, load equal amounts of prepared protein samples and a molecular weight size marker into individual wells [25].
- Run Gel: Connect the chamber to the power supply. Apply a constant voltage of ~100-150 V for a mini-gel system. Run the gel until the bromophenol blue tracking dye front has migrated to the bottom of the gel (∼1-1.5 hours) [24].
- Terminate and Analyze: Turn off the power supply. Disassemble the apparatus and carefully pry open the glass plates to retrieve the gel. The gel is then stained (e.g., with Coomassie Blue or silver stain) or processed for western blotting to visualize the separated protein bands [9].
Workflow and Data Analysis
The following diagram illustrates the logical workflow of a standard SDS-PAGE experiment, from setup to analysis.
Quantitative Analysis and Molecular Weight Determination
Following electrophoresis, quantitative data is derived by comparing the migration of unknown proteins to a molecular weight marker loaded on the same gel [24]. The relative mobility (Rf) of each band is calculated as the migration distance of the protein divided by the migration distance of the dye front. A semi-log plot of the molecular weights of the marker proteins versus their Rf values produces a standard curve, which is used to estimate the molecular weight of unknown proteins with an accuracy of approximately ±10% [24]. For precise quantification of band intensities—such as in purity assessment or titration experiments—advanced software like GelExplorer can be employed. These tools use curve-fitting algorithms (e.g., Lorentzian lineshapes) to deconvolute and quantify even overlapping bands, providing robust quantitative data for rigorous analysis [27].
Table 2: Recommended Polyacrylamide Concentrations for Protein Separation
| % Acrylamide (Resolving Gel) | Effective Separation Range (kDa) |
|---|---|
| 8% | 30 - 200 |
| 10% | 20 - 150 |
| 12% | 15 - 100 |
| 15% | 5 - 70 |
Note: Effective range estimates based on standard Tris-glycine SDS-PAGE systems [24] [26].
From Theory to Bench: A Practical Guide to SDS-PAGE, Native-PAGE, and 2D Electrophoresis
Sodium Dodecyl Sulfate-Polyacrylamide Gel Electrophoresis (SDS-PAGE) stands as a cornerstone methodology in protein science, providing researchers with a robust, reproducible, and relatively simple means to separate complex protein mixtures. As a form of polyacrylamide gel electrophoresis, its development represented a pivotal advancement by standardizing protein separation primarily on the basis of molecular weight, largely independent of innate protein charge or three-dimensional structure [1] [28]. This technique is indispensable in molecular biology, genetics, forensics, and biotechnology for characterizing protein samples, determining molecular weights, and assessing sample purity [29] [30]. The core achievement of SDS-PAGE lies in its use of a denaturing detergent system to unravel proteins and impose a uniform charge density, thereby transforming the unpredictable process of native protein electrophoresis into a standardized analytical tool grounded in polypeptide chain length [16] [31]. This whitepaper explores the fundamental principles, detailed methodologies, and critical applications of SDS-PAGE, framing it within the broader context of protein gel electrophoresis research essential for modern scientific inquiry and drug development.
The Fundamental Principle of SDS-PAGE
The principle of SDS-PAGE is elegantly simple: charged molecules migrate toward an oppositely charged electrode when placed in an electric field, and their separation depends on their relative mobility through a sieving matrix [29] [30]. In the case of proteins, which possess varying native charges and complex structures, this process is standardized through a denaturation step.
Protein Denaturation and Uniform Charge Conferral: The ionic detergent sodium dodecyl sulfate (SDS) plays the central role. When a protein sample is heated (typically to 95°C for several minutes) in the presence of SDS and a reducing agent like β-mercaptoethanol or dithiothreitol (DTT), several key events occur [31] [32]. The reducing agent cleaves disulfide bonds critical for tertiary and quaternary structure, while SDS disrupts hydrogen bonds and hydrophobic interactions [31]. Most critically, SDS binds to the hydrophobic regions of the denatured polypeptide backbone in a constant weight ratio of approximately 1.4 g of SDS per 1 g of protein [1] [28]. This SDS-polypeptide complex forms a rod-like structure, effectively masking the protein's intrinsic charge. Because the SDS coating is uniformly negative, all proteins in the mixture acquire a net negative charge proportional to their polypeptide chain length [16] [1] [31].
Molecular Sieving in the Gel Matrix: The polyacrylamide gel acts as a molecular sieve. Polymerized acrylamide, cross-linked by bisacrylamide, forms a porous, mesh-like matrix [16] [1]. When an electric field is applied, the negatively charged SDS-protein complexes migrate toward the positively charged anode (the positive electrode) [31]. Their rate of migration is inversely proportional to their molecular size; smaller proteins navigate the pores of the gel matrix more easily and thus migrate faster and farther, while larger proteins are impeded and migrate more slowly [16] [1]. Consequently, separation occurs almost exclusively based on polypeptide length, enabling accurate molecular weight estimation [1].
The SDS-PAGE System: Components and Setup
A successful SDS-PAGE experiment relies on a discontinuous buffer system and a layered gel structure to achieve high-resolution separation.
Key Chemical Components and Reagents
The following table details the essential reagents and their specific functions in the SDS-PAGE process.
Table 1: Key Research Reagent Solutions for SDS-PAGE
| Reagent | Function/Description |
|---|---|
| SDS (Sodium Dodecyl Sulfate) | Anionic detergent that denatures proteins and confers a uniform negative charge [31]. |
| Acrylamide/Bis-acrylamide | Monomer and cross-linker that polymerize to form the porous gel matrix [1] [32]. |
| TEMED (N,N,N',N'-Tetramethylethylenediamine) | Catalyst that promotes the production of free radicals to initiate gel polymerization [1] [32]. |
| APS (Ammonium Persulfate) | Polymerizing agent that, with TEMED, generates free radicals to catalyze acrylamide polymerization [1] [32]. |
| Tris-based Buffers | Provides the appropriate pH environment for electrophoresis (e.g., pH 6.8 for stacking gel, pH 8.8 for resolving gel) [32]. |
| Glycine | A key component of the running buffer; its charge state is manipulated in the discontinuous system to stack proteins [32]. |
| Reducing Agents (DTT/BME) | Dithiothreitol (DTT) or β-mercaptoethanol (BME) break disulfide bonds to fully denature proteins [31] [32]. |
| Tracking Dye (Bromophenol Blue) | A small, colored molecule that migrates ahead of the proteins, allowing visual tracking of the electrophoresis progress [16] [32]. |
The Discontinuous Gel System
SDS-PAGE typically employs a two-layer gel cast between two glass plates:
- Resolving Gel (Separating Gel): This is the lower, main part of the gel, usually with a higher percentage of acrylamide (e.g., 10-15%) and a pH of about 8.8 [32]. Its specific pore size is responsible for the final separation of proteins by molecular weight [1]. The appropriate acrylamide concentration depends on the size of the target proteins, with higher percentages providing better resolution for smaller proteins [16] [32].
- Stacking Gel: Poured on top of the polymerized resolving gel, this upper layer has a lower acrylamide concentration (e.g., 4-5%) and a lower pH (~6.8) [32]. Its purpose is to concentrate all the protein samples into a sharp, unified band before they enter the resolving gel. This is achieved through a phenomenon known as isotachophoresis, which creates a steep voltage gradient that forces all proteins to migrate at the same speed and stack into a tight zone, regardless of their size [1] [31]. This process ensures that proteins enter the resolving gel simultaneously, leading to sharper bands and better resolution.
Table 2: Recommended Acrylamide Concentrations for Protein Separation
| Gel Acrylamide Concentration (%) | Linear Separation Range (kDa)* |
|---|---|
| 5.0 | 57 - 212 [32] |
| 7.5 | 36 - 94 [32] |
| 10.0 | 16 - 68 [32] |
| 12.0 | Not specified in results |
| 15.0 | 12 - 43 [32] |
*Values are approximate and can vary based on specific gel formulations.
The workflow below illustrates the core process and underlying principles of SDS-PAGE.
SDS-PAGE Principle and Process Flow
Detailed Experimental Protocol
The following section provides a detailed, step-by-step methodology for performing SDS-PAGE, from gel preparation to visualization.
Gel Preparation and Casting
Materials Needed: Gel apparatus (glass plates, spacers, comb), acrylamide/bis-acrylamide stock solution (typically 30%), separating gel buffer (e.g., 1.5 M Tris-HCl, pH 8.8), stacking gel buffer (e.g., 0.5 M Tris-HCl, pH 6.8), 10% SDS, 10% Ammonium Persulfate (APS), TEMED, water-saturated butanol or isopropanol, electrophoresis running buffer (e.g., Tris-Glycine buffer with 0.1% SDS) [16] [32].
Safety Note: Acrylamide monomer is a potent neurotoxin. Wear appropriate personal protective equipment (PPE) including gloves when handling solutions and gels [32].
- Assemble the Gel Cassette: Thoroughly clean and dry the glass plates and spacers. Assemble the plates according to the manufacturer's instructions to form a water-tight cassette [16] [32].
- Prepare and Pour the Resolving Gel: In a beaker, mix the components for the resolving gel in the order listed, adding TEMED and APS last. The table below provides an example recipe for a 10% mini-gel [32].
- Pour the mixture immediately into the gap between the glass plates. Leave space for the stacking gel.
- Overlay the gel carefully with water-saturated butanol or isopropanol to exclude air (oxygen inhibits polymerization) and ensure a flat gel surface [16] [32].
- Allow polymerization to proceed for 20-30 minutes. A distinct schlieren line will appear between the gel and the overlay once polymerization is complete.
- Prepare and Pour the Stacking Gel: Pour off the overlay liquid and rinse the top of the gel with water. Dry the area with filter paper. Mix the stacking gel components, again adding TEMED and APS last.
- Pour the stacking gel solution on top of the resolving gel and immediately insert a clean comb, avoiding air bubbles [16] [32].
- Allow polymerization for about 10-15 minutes. The polymerized gel can be used immediately or stored wrapped in moist paper towel and plastic film at 4°C for a short period.
Table 3: Example Gel Formulations for a Mini-Gel
| Component | 10% Resolving Gel (for ~8x10 cm gel) | 5% Stacking Gel (for ~8x10 cm gel) |
|---|---|---|
| Water | 1.1 mL | 1.0 mL |
| 30% Acrylamide/Bis Mix | 2.2 mL | 0.28 mL |
| Separating Gel Buffer (1.5M Tris, pH8.8) | 2.2 mL | - |
| Stacking Gel Buffer (0.5M Tris, pH6.8) | - | 0.33 mL |
| 10% SDS | 0.3 mL (if not in buffer) | 15 µL (if not in buffer) |
| 10% APS | 50 µL | 15 µL |
| TEMED | 5 µL | 2 µL |
Sample Preparation
- Dilute Protein Sample: Mix the protein sample with an appropriate volume of 5X SDS-PAGE sample buffer (final concentration 1X). A typical 5X sample buffer contains: 250 mM Tris-HCl (pH 6.8), 10% SDS, 30% glycerol, 0.02% Bromophenol Blue, and 5% β-mercaptoethanol or DTT [32].
- Denature the Proteins: Heat the sample at 95°C for 3-5 minutes in a heat block or boiling water bath [16] [32]. This ensures complete denaturation and SDS binding.
- Briefly Centrifuge: Spin down the condensed sample to the bottom of the tube.
Electrophoretic Run
- Set Up the Electrophoresis Unit: Remove the comb from the polymerized gel cassette and mount the cassette in the electrophoresis chamber [16].
- Fill with Running Buffer: Fill the inner and outer chambers of the electrophoresis apparatus with running buffer (e.g., Tris-Glycine-SDS buffer) to submerge the gel. Remove any air bubbles from the bottom of the gel and flush out the wells with buffer using a syringe [16] [32].
- Load Samples: Carefully load the denatured protein samples and a molecular weight marker (protein ladder) into individual wells using a micropipette [16].
- Run the Gel: Connect the electrodes to the power supply (cathode, negative/black, at the top; anode, positive/red, at the bottom). Apply a constant voltage. For a mini-gel, 80-120 V through the stacking gel and 120-150 V through the resolving gel is common. Run the gel until the bromophenol blue tracking dye reaches the bottom of the gel [16] [32].
Protein Visualization
- Staining: After electrophoresis, carefully open the gel cassette and remove the gel. Immerse the gel in Coomassie Brilliant Blue staining solution (e.g., 0.05% Coomassie R-250, 40% methanol, 10% acetic acid) and agitate gently for at least 30 minutes to several hours [32].
- Destaining: Transfer the gel to a destaining solution (e.g., 40% methanol, 10% acetic acid) to remove excess stain from the gel background. Agitate until protein bands are clear and the background is light. A folded paper towel can be added to the destaining bath to absorb excess stain [32].
- Analysis: The stained gel can be imaged. The molecular weight of unknown proteins can be estimated by comparing their migration distance to that of the protein ladder bands of known molecular weight [32].
Applications and Variations in Research
SDS-PAGE is not merely a standalone technique but a fundamental tool that integrates into broader research workflows.
- Molecular Weight Determination: By comparing the migration distance of an unknown protein to a standard curve generated from a protein ladder, researchers can estimate its molecular weight with reasonable accuracy [32] [30].
- Purity Analysis and Quality Control: SDS-PAGE is used to assess the homogeneity of protein samples during purification processes. A pure protein will typically appear as a single band on the gel [32] [30].
- Western Blotting (Immunoblotting): Proteins separated by SDS-PAGE are transferred onto a membrane (e.g., nitrocellulose or PVDF) and probed with specific antibodies to detect and characterize a protein of interest [1] [32] [30].
- Peptide Mapping and Proteomic Analysis: Excised protein bands from SDS-PAGE gels can be subjected to proteolytic digestion (e.g., with trypsin) and subsequent analysis by mass spectrometry for protein identification [33].
- Post-Translational Modification Analysis: While SDS-PAGE separates denatured proteins, shifts in apparent molecular weight can sometimes indicate modifications like glycosylation or phosphorylation [30].
- Native SDS-PAGE (NSDS-PAGE): A variation of the standard method where the heating step is omitted, and lower concentrations of SDS are used. This allows for partial retention of protein structure and function, including enzymatic activity and non-covalently bound metal ions, while still providing separation primarily based on mass [34]. This technique bridges the gap between fully denaturing SDS-PAGE and non-denaturing Native-PAGE.
SDS-PAGE remains an indispensable and foundational technique in the life sciences. Its power lies in its ability to standardize protein separation by exploiting the simple relationship between polypeptide chain length and electrophoretic mobility in a sieving matrix, a relationship made possible by the effective denaturing action of SDS. From its role in routine quality control to its critical position in complex workflows like western blotting and proteomics, SDS-PAGE provides a reliable, relatively inexpensive, and highly informative window into the protein composition of a sample. While newer technologies continue to emerge, the principles and practice of SDS-PAGE continue to underpin a vast array of research and development activities, solidifying its status as an essential tool for researchers and drug development professionals seeking to understand and manipulate the molecular machinery of the cell.
Protein gel electrophoresis is a fundamental laboratory technique for separating complex protein mixtures based on their physicochemical properties. While denaturing methods like SDS-PAGE separate proteins primarily by molecular weight, Native Polyacrylamide Gel Electrophoresis (Native-PAGE) operates on a different principle—preserving protein structure and function throughout the separation process. This technique allows researchers to separate proteins according to their net charge, size, and shape while maintaining their native conformation, enzymatic activity, and subunit interactions [1] [35]. Within the broader thesis of protein electrophoresis research, Native-PAGE represents a crucial methodological approach for functional proteomics, enabling the study of proteins in their biologically active states, which is essential for understanding protein function in basic research and drug development.
The significance of Native-PAGE extends across multiple scientific domains. In enzymology, it facilitates the isolation of active enzymes for kinetic studies. In pharmaceutical development, it enables the analysis of protein-drug interactions under non-denaturing conditions. For structural biologists, it provides insights into quaternary protein structures and complexes [1]. This technical guide explores the principles, methodologies, and applications of Native-PAGE, providing researchers with a comprehensive resource for implementing this powerful technique in their functional protein studies.
Fundamental Principles of Native-PAGE
Separation Mechanisms in Non-Denaturing Conditions
Unlike SDS-PAGE, which uses sodium dodecyl sulfate to denature proteins and confer uniform negative charge, Native-PAGE relies on the intrinsic electrical properties of proteins under non-denaturing conditions. In this system, proteins maintain their folded conformation, and their migration through the polyacrylamide gel matrix depends on multiple factors including their net charge, hydrodynamic size, and three-dimensional structure [1]. The porous nature of the polyacrylamide gel creates a molecular sieve effect, regulating protein movement according to size and shape—smaller proteins encounter less frictional resistance and migrate faster, while larger proteins face greater resistance [35].
The electrophoretic mobility in Native-PAGE follows the principle that most proteins carry a net negative charge in alkaline running buffers and migrate toward the anode. The higher the negative charge density (more charges per molecular mass), the faster a protein will migrate [1]. This combination of charge-based separation and molecular sieving allows Native-PAGE to resolve protein complexes in their functional states, making it indispensable for studying multi-subunit proteins, protein-protein interactions, and enzymatic activities.
Buffer System Considerations and pH Optimization
The buffer system is critical in Native-PAGE as it determines the charge characteristics of the proteins being separated. For optimal results, the pH of the running buffer must be carefully selected based on the isoelectric points (pI) of the target proteins. Acidic proteins are typically separated using high pH buffer systems (e.g., pH 8.8), where they carry net negative charges and migrate toward the anode. Conversely, basic proteins require low pH buffer systems, where they maintain positive charges; in this case, the electrode polarity must be reversed during electrophoresis [35].
The discontinuous buffer system employed in Native-PAGE consists of two components: a stacking gel with lower acrylamide concentration (typically 4%) and pH ~6.8, and a resolving gel with higher acrylamide concentration (up to 17%) and pH ~8.8 [35]. This configuration creates an environment where proteins are initially concentrated into a tight band before entering the resolving region, enhancing separation resolution. The ionic strength and composition of the buffer also influence protein stability and migration, requiring optimization for different protein systems.
Table 1: Key Differences Between Native-PAGE and SDS-PAGE
| Parameter | Native-PAGE | SDS-PAGE |
|---|---|---|
| Protein State | Native, folded | Denatured, unfolded |
| Separation Basis | Charge, size, shape | Molecular weight |
| Detergent | None (non-denaturing) | SDS (denaturing) |
| Sample Treatment | No heating, no reducing agents | Heating with SDS and DTT/β-mercaptoethanol |
| Protein Activity | Preserved after separation | Destroyed after separation |
| Molecular Weight Determination | Not accurate due to native conformation | Accurate for polypeptide chains |
| Applications | Functional studies, enzyme assays, oligomerization | Purity analysis, molecular weight estimation |
Experimental Design and Protocol
Gel Composition and Formulation
The polyacrylamide gel matrix for Native-PAGE consists of acrylamide and a crosslinking agent (typically N,N'-methylenebisacrylamide) polymerized with ammonium persulfate (APS) and catalyzed by TEMED (N,N,N',N'-tetramethylethylenediamine) [1]. The pore size and sieving properties are controlled by the total acrylamide concentration (%T) and the crosslinker ratio (%C), which must be optimized based on the size range of target proteins. Lower percentage gels (e.g., 7-10%) are suitable for high molecular weight proteins and complexes, while higher percentages (12-17%) provide better resolution for smaller proteins [35].
Table 2: Basic Native-PAGE Gel Formulation for Acidic Proteins
| Reagent | Separating Gel (17%) 10 mL | Stacking Gel (4%) 5 mL |
|---|---|---|
| 40% Acr-Bis (Acr:Bis=19:1) | 4.25 mL | 0.5 mL |
| 4× Separating Gel Buffer (1.5 M Tris-HCl, pH 8.8) | 2.5 mL | - |
| 4× Stacking Gel Buffer (0.5 M Tris-HCl, pH 6.8) | - | 1.25 mL |
| Deionized Water | 3.2 mL | 3.2 mL |
| 10% APS | 35 μL | 35 μL |
| TEMED | 15 μL | 15 μL |
The gel polymerization process requires careful timing—the separating gel is first poured to approximately 3/4 of the cassette height and overlayered with isopropanol or water to create a flat interface. After polymerization (approximately 30 minutes), the stacking gel is added, and a sample comb is inserted to create wells for protein loading [35]. Proper degassing of solutions before polymerization minimizes oxygen inhibition and ensures consistent gel formation.
Sample Preparation and Electrophoresis Conditions
Sample preparation for Native-PAGE requires gentle handling to maintain protein integrity. Proteins should be dissolved in non-denaturing buffers compatible with the electrophoresis system, avoiding strong detergents, high salts, or reducing agents that might disrupt native structure. A native-compatible loading buffer containing glycerol (for density) and a tracking dye (e.g., Bromophenol Blue) is typically mixed with the protein sample before loading [35] [6].
Electrophoresis is performed under constant voltage conditions, typically starting at 100V until samples enter the resolving gel, then increasing to 150-200V for the remainder of the run [35]. To prevent heat-induced denaturation, the electrophoresis apparatus should be maintained at 4°C or placed on ice, particularly for extended run times [35]. The progress is monitored by the migration of the tracking dye, with electrophoresis stopped before the dye front reaches the bottom of the gel to prevent loss of small proteins.
Diagram 1: Native-PAGE Experimental Workflow
Advanced Applications and Methodological Variations
Quantitative Analysis and Detection Methods
While traditionally considered a qualitative technique, Native-PAGE can be adapted for quantitative analysis through digital imaging and mathematical processing of electropherograms [22]. Advanced staining and detection methods enable researchers to extract both qualitative and quantitative information about protein composition and abundance:
Activity Staining: For enzymes, specific activity stains can be applied after electrophoresis to identify functional proteins based on their catalytic capabilities, providing a direct link between protein bands and biological function [35].
Fluorescence Detection: Sensitive fluorescent dyes like SYBR Green or specialized fluorophores (e.g., TSQ for zinc-containing proteins) enable detection of low-abundance proteins while maintaining protein function for downstream analysis [34].
Digital Imaging and Densitometry: High-resolution digital photography with uniform illumination, coupled with specialized software (e.g., Chrom & Spec), allows conversion of gel images to densitograms for quantitative analysis of band intensity, enabling protein quantification similar to chromatographic techniques [22].
Methodological Variations and Hybrid Approaches
Several specialized forms of Native-PAGE have been developed to address specific research needs:
Blue Native-PAGE (BN-PAGE): Utilizes Coomassie Brilliant Blue G-250 to confer additional negative charge to native protein complexes, enabling the separation of large membrane protein complexes while maintaining protein-protein interactions [34]. The dye can sometimes act as a detergent, potentially causing partial denaturation.
Clear Native-PAGE (CN-PAGE): Relies solely on the intrinsic charge of proteins for separation, making it suitable for acidic membrane proteins and water-soluble proteins where dye-induced artifacts are a concern [6].
Native SDS-PAGE (NSDS-PAGE): A hybrid approach that reduces SDS concentration in running buffers (to 0.0375%) and eliminates heating steps, achieving high resolution while retaining enzymatic activity and metal cofactors in many proteins [34]. This method represents a promising compromise between resolution and native state preservation.
Table 3: Comparison of Native Electrophoresis Methods
| Method | Resolution | Protein State | Key Applications |
|---|---|---|---|
| Native-PAGE | Moderate | Fully native | Enzyme analysis, protein-protein interactions |
| BN-PAGE | Moderate-high | Mostly native | Membrane protein complexes, oligomeric states |
| CN-PAGE | Low-moderate | Fully native | Acidic proteins, metal-binding proteins |
| NSDS-PAGE | High | Partially native | Metalloenzymes, functional proteomics |
The Scientist's Toolkit: Essential Reagents and Materials
Successful Native-PAGE experiments require carefully selected reagents and materials that maintain protein structure and function throughout the separation process. The following toolkit outlines essential components for Native-PAGE workflows:
Table 4: Essential Research Reagent Solutions for Native-PAGE
| Reagent/Material | Function | Specifications & Considerations |
|---|---|---|
| Acrylamide-Bis Solution | Gel matrix formation | 40% stock (Acr:Bis=19:1); neurotoxin before polymerization—handle with gloves |
| Tris-HCl Buffer | pH control | Separating gel: 1.5 M, pH 8.8; Stacking gel: 0.5 M, pH 6.8 |
| APS (Ammonium Persulfate) | Polymerization initiator | 10% solution in water; freshly prepared for optimal polymerization |
| TEMED | Polymerization catalyst | Accelerates free radical formation from APS; use in fume hood |
| Tris-Glycine Running Buffer | Conducting medium | 10× stock: 30.3 g Tris base, 144 g glycine per liter; dilute to 1× before use |
| Native Sample Buffer | Sample preparation | Contains glycerol for density, tracking dye; no SDS or reducing agents |
| Coomassie Brilliant Blue R-250 | Protein staining | 0.25% in methanol:acetic acid:water (4:1:5); detects 50-100 ng protein |
| Activity Stain Reagents | Enzyme detection | Substrate-specific solutions for identifying functional enzymes in gel |
Native-PAGE represents an essential methodology within the comprehensive toolbox of protein electrophoresis techniques, fulfilling the unique requirement of maintaining protein structure and function during analysis. While SDS-PAGE remains the standard for molecular weight determination and purity assessment, Native-PAGE provides complementary information about protein function, interactions, and native state characteristics that are inaccessible through denaturing methods.
The continued evolution of Native-PAGE methodologies, including the development of quantitative applications [22] and hybrid approaches like NSDS-PAGE [34], demonstrates the technique's adaptability to emerging research needs in proteomics and drug development. For researchers investigating protein function, enzyme mechanisms, protein complex organization, or biopharmaceutical properties, Native-PAGE offers an indispensable approach for bridging the gap between protein separation and functional analysis in both basic research and applied biotechnology.
Two-dimensional polyacrylamide gel electrophoresis (2D-PAGE) remains a cornerstone technique in proteomics for the high-resolution separation of complex protein mixtures. This method sequentially resolves proteins based on their intrinsic isoelectric point (pI) through isoelectric focusing (IEF) in the first dimension, followed by separation according to molecular weight via SDS-PAGE in the second dimension. The result is a two-dimensional map where individual proteins appear as distinct spots, enabling researchers to analyze thousands of proteins simultaneously. This technical guide details the fundamental principles, standardized protocols, key reagents, and advanced applications of 2D-PAGE, framing it within the broader context of protein gel electrophoresis research essential for modern drug development and biomarker discovery.
Protein gel electrophoresis is a fundamental laboratory technique wherein charged protein molecules are transported through a solvent by an electrical field, allowing for their separation and analysis [1]. The principle of protein separation in 2D-PAGE builds upon this foundation by combining two orthogonal separation techniques to achieve unparalleled resolution. The first dimension, isoelectric focusing (IEF), separates proteins based on their isoelectric point (pI), which is the specific pH at which a protein carries no net electrical charge [36]. When an electric field is applied across a pH gradient, each protein will migrate until it reaches the position in the gradient where the pH equals its pI, effectively "focusing" the protein into a sharp band [37].
The second dimension, sodium dodecyl sulfate-polyacrylamide gel electrophoresis (SDS-PAGE), then separates these focused proteins based solely on their molecular weight [1]. The ionic detergent SDS denatures the proteins and binds to them in a constant weight ratio, imparting a uniform negative charge that overwhelms the proteins' intrinsic charges [1] [38]. When an electric field is applied, the SDS-protein complexes migrate through the polyacrylamide gel matrix, with smaller proteins moving faster than larger ones due to the sieving effect of the gel [1]. The integration of IEF and SDS-PAGE provides a powerful, high-resolution profiling tool that separates proteins based on two independent physical characteristics: native charge and mass [36].
Table 1: Key Historical Developments in 2D-PAGE
| Year | Development | Significance |
|---|---|---|
| 1930s | Introduction of Electrophoresis | Arne Tiselius first uses electrophoresis for protein separation, laying the foundation for all future techniques [37] [11]. |
| 1975 | Introduction of 2D-PAGE | O'Farrell publishes the foundational method, marking a significant leap from one-dimensional separation [36]. |
| 1980s-1990s | Refinements and Automation | Advancements in gel chemistry, immobilized pH gradients (IPG strips), and staining methods improve reproducibility and ease of use [1] [36]. |
| 1990s-2000s | Integration with Mass Spectrometry | 2D-PAGE becomes a key preparatory technique for protein identification via MS, greatly enhancing its analytical power [38]. |
Detailed Experimental Protocol
The following section provides a detailed, step-by-step methodology for performing a standard 2D-PAGE experiment. Adherence to this protocol is critical for obtaining reproducible and high-quality results.
Sample Preparation
Proper sample preparation is the most critical step for a successful 2D-PAGE run, as it directly impacts resolution and prevents artifacts.
- Protein Extraction: Proteins are extracted from cells or tissues using a lysis buffer. A typical buffer contains detergents (e.g., CHAPS), chaotropes (e.g., urea, thiourea), salts, and a cocktail of protease inhibitors to prevent protein degradation during preparation [36]. The buffer conditions must be optimized to solubilize the widest possible range of proteins, including hydrophobic membrane proteins.
- Clarification: The lysate is centrifuged at high speed (e.g., 14,000-16,000 x g) for 15-30 minutes to remove insoluble debris, lipids, and nucleic acids. The clear supernatant, containing the solubilized proteins, is then collected for further processing [36].
- Protein Quantification: The concentration of proteins in the extract is accurately determined using compatible assays such as the Bradford, BCA (bicinchoninic acid), or Lowry assay. Accurate quantification is essential for loading a consistent mass of protein across gels, which is necessary for reliable comparative analysis [36].
- Sample Preparation for IEF: The protein sample is diluted in a rehydration buffer. This buffer typically contains ampholytes (to assist in forming the pH gradient), a reducing agent (like Dithiothreitol (DTT) to break disulfide bonds), and the denaturants urea and thiourea to maintain proteins in a denatured state [36]. Optionally, proteins may be alkylated with iodoacetamide after reduction to prevent reformation of disulfide bonds.
First Dimension: Isoelectric Focusing (IEF)
IEF is performed using pre-cast Immobilized pH Gradient (IPG) strips, which are the modern standard due to their superior reproducibility compared to carrier ampholyte-generated gradients [1] [36].
- Strip Rehydration: The IPG strip is rehydrated with the prepared protein sample. This can be done passively or actively (with low voltage) for a period of several hours (often overnight) to allow proteins to enter the gel matrix [36].
- IEF Run: The rehydrated strip is placed in an IEF apparatus, and an electric field is applied. The voltage is typically ramped through a series of steps to avoid overheating and to allow proteins to migrate to their pI without precipitation. The total Volt-hours (Vhr) applied is specific to the length and pH range of the IPG strip and must be optimized. For example, a standard 7 cm strip may require up to 10,000 Vhr. The focused proteins appear as sharp bands within the strip [36].
Gel Equilibration
After IEF, the IPG strip must be equilibrated before it can be applied to the second-dimension gel.
- Equilibration Process: The strip is immersed in an equilibration buffer. This buffer contains SDS (which binds to proteins and confers a uniform negative charge), a reducing agent (like DTT), and glycerol (to add density for easier loading). This step is crucial for preparing the proteins for separation by SDS-PAGE, ensuring they are linearized and uniformly charged [36].
Second Dimension: SDS-PAGE
The equilibrated IPG strip is placed on top of a polyacrylamide gel for size-based separation.
- Gel Casting: A polyacrylamide gel is cast, often with a stacking gel on top. The concentration of acrylamide can be a single percentage (e.g., 12%) for a specific size range or a gradient (e.g., 4-20%) to resolve a broader range of protein masses simultaneously [1].
- SDS-PAGE Run: The IPG strip is sealed onto the SDS-PAGE gel using agarose. The gel cassette is then mounted in an electrophoresis tank filled with running buffer. An electric field is applied, and proteins migrate out of the IPG strip and into the polyacrylamide gel, where they are separated by molecular weight. The run is typically stopped when the dye front reaches the bottom of the gel [36].
Protein Detection, Visualization, and Image Analysis
Following electrophoresis, the separated proteins must be visualized and analyzed.
- Staining: The gel is stained to reveal the pattern of protein spots. Common methods include:
- Coomassie Brilliant Blue: A standard, cost-effective method with moderate sensitivity, suitable for abundant proteins [36].
- Silver Staining: A highly sensitive technique capable of detecting low nanogram amounts of protein, but with a narrower dynamic range and potential interference with downstream mass spectrometry [36].
- Fluorescent Stains (e.g., SYPRO Ruby): Offer excellent sensitivity, a wide dynamic range, and compatibility with mass spectrometry. In Differential Gel Electrophoresis (DIGE), different protein samples are labeled with distinct fluorescent dyes prior to IEF and then co-separated on the same gel, which minimizes gel-to-gel variability and allows for more accurate quantitative comparisons [37].
- Destaining: For Coomassie and silver stains, a destaining step is often required to wash away excess dye and improve the contrast between protein spots and the gel background [36].
- Gel Imaging and Analysis: The stained gel is digitized using a high-resolution scanner or camera. Advanced image analysis software is then used to detect spots, quantify their intensity, and match corresponding spots across multiple gels in a comparative study. This software is critical for identifying proteins that are differentially expressed between different samples or conditions [36].
Diagram 1: 2D-PAGE Experimental Workflow
The Scientist's Toolkit: Essential Reagents and Materials
Successful execution of 2D-PAGE relies on a suite of specialized reagents and equipment. The following table catalogues the key solutions required for the procedure.
Table 2: Key Research Reagent Solutions for 2D-PAGE
| Reagent/Material | Function and Role in the Experiment |
|---|---|
| IPG Strips (Immobilized pH Gradient) | Pre-cast gel strips containing an immobilized pH gradient for the first dimension (IEF). They ensure high reproducibility and are available in various pH ranges (e.g., narrow 4-7, broad 3-10) [1] [36]. |
| Ampholytes | A mixture of small, multifunctional molecules that carry the current and establish a stable pH gradient within the IPG strip during IEF [36]. |
| Urea & Thiourea | Chaotropic agents used in lysis and rehydration buffers to denature proteins, maintain solubility, and prevent aggregation during IEF [36]. |
| Detergents (e.g., CHAPS) | Used in lysis buffers to solubilize proteins, particularly hydrophobic ones, and to keep them in solution during the IEF process [36]. |
| DTT (Dithiothreitol) | A reducing agent that breaks disulfide bonds within and between protein molecules, ensuring complete denaturation and linearization [36]. |
| SDS (Sodium Dodecyl Sulfate) | An ionic detergent that denatures proteins and binds to them in a constant ratio, imparting a uniform negative charge per unit mass for separation by size in the second dimension [1] [38]. |
| Acrylamide/Bis-acrylamide | The monomer and cross-linker that polymerize to form the porous polyacrylamide gel matrix for SDS-PAGE. The ratio and concentration determine pore size and resolution range [1]. |
| APS & TEMED | Ammonium persulfate (APS) and Tetramethylethylenediamine (TEMED) are catalysts that initiate and accelerate the polymerization reaction of acrylamide to form gels [1]. |
| Protein Molecular Weight Markers | A set of pre-stained or unstained proteins of known molecular weight run alongside the sample to calibrate the gel and estimate the mass of unknown proteins [1]. |
Technical Considerations and Troubleshooting
Despite its power, 2D-PAGE can present technical challenges. Understanding these issues and their solutions is key to obtaining reliable data.
Table 3: Common Issues in 2D-PAGE and Proposed Solutions
| Problem | Potential Causes | Solutions |
|---|---|---|
| Poor Resolution / Streaking | Incomplete focusing during IEF, sample overloading, salt contamination, or protein degradation [36]. | Ensure optimal IEF running conditions (correct Volt-hours). Desalt samples, avoid overloading, and use fresh protease inhibitors during extraction [36]. |
| Horizontal Streaking | Incomplete focusing, protein-protein interactions, or presence of particulate matter [36]. | Optimize IEF protocol, improve sample clarification by centrifugation, and ensure adequate denaturation with urea/thiourea and detergents [36]. |
| Vertical Streaking | Improper equilibration, bubbles between IPG strip and SDS-PAGE gel, or uneven gel polymerization [36]. | Ensure complete equilibration with SDS buffer. Remove all bubbles when embedding the IPG strip. Check gel casting procedure for consistency [36]. |
| Low Spot Count / Missing Proteins | Insensitive staining method, protein loss during sample preparation, or failure to solubilize certain protein classes (e.g., membrane proteins) [36]. | Use more sensitive fluorescent stains. Optimize lysis buffer for difficult proteins. Ensure protein quantification is accurate [36]. |
| Gel-to-Gel Variability | Inconsistent reagent quality, polymerization, or running conditions. | Use pre-cast IPG strips and gels for maximum reproducibility. For high-precision comparative work, employ the DIGE (Differential Gel Electrophoresis) technology, where multiple samples are labeled with different fluorescent dyes and run on the same gel [37]. |
Applications in Research and Drug Development
The high-resolution capability of 2D-PAGE makes it invaluable in both basic research and applied pharmaceutical contexts.
- Biomarker Discovery: 2D-PAGE is extensively used to compare protein expression profiles between healthy and diseased tissues (e.g., cancer vs. normal) or between pre- and post-treatment samples. The differential protein spots can be excised, identified by mass spectrometry, and validated as potential diagnostic or prognostic biomarkers [38].
- Analysis of Post-Translational Modifications (PTMs): PTMs such as phosphorylation or glycosylation alter a protein's pI, causing a shift in its position on the 2D gel. This makes 2D-PAGE a powerful tool for detecting and studying PTMs, which are crucial for understanding protein function and regulation in cellular signaling and disease mechanisms [36].
- Proteomic Profiling: The technique provides a comprehensive overview of the proteome from a single sample. It has been instrumental in creating protein databases for various organisms and cell types, forming a foundational resource for systems biology [36] [38].
- Drug Mechanism of Action Studies: By analyzing the proteomic changes induced by a drug candidate, researchers can identify its cellular targets and pathways, elucidating the mechanism of action and potential side effects early in the drug development pipeline [37].
Comparative Analysis with Other Electrophoretic and Modern Techniques
While powerful, 2D-PAGE is one of several tools available for protein separation. The table below compares it to other common methods.
Table 4: Comparison of Electrophoresis Techniques
| Technique | Principle of Separation | Key Advantages | Key Limitations |
|---|---|---|---|
| 2D-PAGE | Orthogonal separation by pI (IEF) and molecular weight (SDS-PAGE) [36]. | High resolution for complex mixtures; visual map of thousands of proteins/PTMs; well-established [36]. | Technically challenging, time-consuming; limited dynamic range; poor for very acidic/basic, very large, or hydrophobic proteins [36]. |
| SDS-PAGE (1D) | Molecular weight in a denaturing gel [1]. | Simple, rapid, and robust; excellent for size estimation and purity checks [1] [37]. | Low resolution; cannot separate proteins of similar size; no information on pI or PTMs [1]. |
| Native PAGE | Size, charge, and shape of native proteins [1]. | Preserves protein function and native complexes; can study protein-protein interactions [1]. | Separation is not based on a single parameter; complex interpretation of banding patterns [1]. |
| Capillary Electrophoresis (CE) | Separation of charged species in a narrow capillary under an electric field [37] [11]. | High efficiency and resolution; fast analysis; automatable; low sample and reagent consumption [37] [11]. | Lower loading capacity than gels; can be less suitable for preparative purposes [11]. |
In the contemporary proteomics landscape, 2D-PAGE is often integrated with or complemented by liquid chromatography-mass spectrometry (LC-MS/MS) based methods. While gel-free LC-MS/MS offers higher throughput and better detection of low-abundance and hydrophobic proteins, 2D-PAGE provides a direct visual representation of the proteome that is still valued for its ability to resolve protein isoforms and PTMs effectively [38]. As noted in a 2025 review, "Far from being replaced, gel electrophoresis remains as an excellent supporting and different approach, offering a pathway to a more profound visualization and understanding of the cell proteome" [38].
Two-dimensional gel electrophoresis remains a vital and powerful technique in the protein researcher's arsenal. Its unique capacity to resolve complex protein mixtures into thousands of individual components based on two independent physical parameters provides a visual and quantitative snapshot of the proteome that is difficult to achieve with other methods. Despite challenges related to its complexity and dynamic range, its enduring relevance is secured by its direct applicability to biomarker discovery, PTM analysis, and drug development. When coupled with downstream identification technologies like mass spectrometry, 2D-PAGE continues to be a fundamental pillar supporting the principles of protein gel electrophoresis research, enabling critical discoveries in biology and medicine.
Core Principle of Protein Gel Electrophoresis
Protein gel electrophoresis is a fundamental laboratory technique for separating protein mixtures based on their physicochemical properties. The core principle involves transporting charged protein molecules through a gel matrix under the influence of an electrical field, which acts as a molecular sieve [1] [6].
In the most common form, sodium dodecyl sulfate-polyacrylamide gel electrophoresis (SDS-PAGE), proteins are denatured and coated with the anionic detergent SDS. This confers a uniform negative charge to all proteins, meaning their migration through the polyacrylamide gel depends primarily on molecular weight [1] [16]. When an electric current is applied, smaller proteins migrate more rapidly through the pores of the gel, while larger proteins are impeded [6]. This results in the separation of proteins into discrete bands within the gel [39].
Alternative methods include native-PAGE, which separates proteins in their folded state based on a combination of size, charge, and shape, and two-dimensional PAGE, which separates proteins first by their isoelectric point and then by molecular weight, providing extremely high resolution [1].
The following diagram illustrates the workflow and molecular principles of SDS-PAGE:
Detailed Gel Casting Methodology
Polyacrylamide Gel Composition
Polyacrylamide gels are created by polymerizing acrylamide and bisacrylamide (a cross-linker) to form a meshwork with controllable pore sizes [1] [6]. The pore size is inversely related to the total acrylamide concentration; higher percentages create smaller pores, which are better for resolving low molecular weight proteins [1].
Table 1: Acrylamide Gel Percentage and Recommended Protein Separation Range
| Gel Percentage (%) | Effective Separation Range (kDa) | Primary Application |
|---|---|---|
| 6-8 | 50 - 200 | High molecular weight proteins |
| 10 | 20 - 100 | Standard separation range |
| 12 | 15 - 70 | Standard separation range |
| 15 | 10 - 50 | Low molecular weight proteins |
| 4-20 (Gradient) | 10 - 200 | Broad range separation |
Most protocols use a discontinuous buffer system with two distinct gel layers [1] [6]:
- Resolving Gel (Separating Gel): This is the lower gel, typically with a higher acrylamide concentration (e.g., 10-15%) and an alkaline pH (~8.8). It is responsible for the actual size-based separation of proteins [1].
- Stacking Gel: This is the upper gel, cast on top of the polymerized resolving gel. It has a lower acrylamide concentration (~4-5%) and a lower pH (~6.8). Its function is to concentrate all protein samples into a sharp, unified band before they enter the resolving gel, which dramatically improves resolution [1] [16].
Step-by-Step Gel Casting Protocol
The following procedure is for hand-casting a standard mini gel (approx. 8 x 8 cm) [1] [16].
Research Reagent Solutions for Gel Casting
| Item | Function |
|---|---|
| Acrylamide/Bis-acrylamide Solution (e.g., 30-40%) | Monomer solution that forms the gel matrix upon polymerization. |
| Ammonium Persulfate (APS) | Polymerizing agent that initiates the cross-linking reaction. |
| TEMED (N,N,N',N'-Tetramethylethylenediamine) | Catalyst that accelerates the polymerization reaction by free radical generation. |
| Tris-HCl Buffer (e.g., 1.5 M, pH 8.8) | Buffering agent for the resolving gel, maintains alkaline pH. |
| Tris-HCl Buffer (e.g., 0.5 M, pH 6.8) | Buffering agent for the stacking gel, maintains slightly acidic pH. |
| SDS (Sodium Dodecyl Sulfate) | Anionic detergent added to the gel and buffers to ensure proteins remain denatured and uniformly charged. |
| Isobutanol or Water | Used to overlay the resolving gel solution to create a flat, even interface by preventing contact with oxygen, which inhibits polymerization. |
| Gel Casting Cassette | Comprises two glass plates and a spacer, forming the mold in which the gel is cast. |
| Comb | Inserted into the stacking gel to create wells for loading samples. |
Procedure:
- Assemble the Gel Casting Cassette: Thoroughly clean the glass plates and spacers. Assemble them into a cassette, securing the sides and bottom with a casting frame or tape to prevent leakage [16].
- Prepare and Pour the Resolving Gel:
- Mix the components for the resolving gel in a beaker. A sample recipe for a 10% resolving gel is provided in Table 2 [1].
- Add TEMED last, as it will immediately start the polymerization process. Swirl gently to mix.
- Immediately pipette the solution into the assembled cassette, leaving space for the stacking gel.
- Carefully overlay the gel solution with isobutanol or water-saturated butanol to exclude air and create a flat, level surface [16].
- Allow the gel to polymerize completely (typically 20-30 minutes). A distinct schlieren line will appear at the interface once polymerization is complete.
- Prepare and Pour the Stacking Gel:
- Pour off the overlay solution and rinse the top of the resolving gel with deionized water.
- Prepare the stacking gel solution (see Table 2 for an example).
- Add TEMED, mix, and pipette the solution onto the top of the resolved gel.
- Immediately insert a clean comb into the cassette, avoiding air bubbles.
- Allow the stacking gel to polymerize for 15-20 minutes [16].
Table 2: Example Recipes for Traditional Tris-Glycine Mini Gels [1]
| Component | 10% Resolving Gel (for ~10 mL) | 5% Stacking Gel (for ~3 mL) |
|---|---|---|
| Water | To 10 mL final volume | To 3 mL final volume |
| 40% Acrylamide Solution | 2.5 mL | 0.375 mL |
| 1.5 M Tris-HCl (pH 8.8) | 3.8 mL | - |
| 0.5 M Tris-HCl (pH 6.8) | - | 0.75 mL |
| 10% SDS | 0.1 mL | 0.03 mL |
| 10% APS | 0.1 mL | 0.03 mL |
| TEMED | 0.01 mL | 0.003 mL |
Sample Preparation Protocol
Proper sample preparation is critical for clear and reproducible results.
Reagents and Procedure
Research Reagent Solutions for Sample Preparation
| Item | Function |
|---|---|
| Laemmli Sample Buffer (2X or 4X) | Contains SDS for denaturation and charge masking, glycerol to increase density for well loading, a tracking dye (e.g., Bromophenol Blue), and often a reducing agent. |
| Reducing Agent (DTT, β-mercaptoethanol, or TCEP) | Cleaves disulfide bonds between cysteine residues to fully denature proteins into individual polypeptides. |
| Heating Block or Water Bath | Used to heat samples to further denature proteins (typically 85-100°C for 2-5 minutes). |
Step-by-Step Procedure:
- Dilute and Mix: Dilute the protein sample with an equal volume of 2X Laemmli sample buffer. If using a reducing gel, include a reducing agent in the buffer, such as 50 mM DTT or 2.5% β-mercaptoethanol [40].
- Denature by Heating: Heat the samples at 85°C for 2-5 minutes [40]. Avoid overheating (e.g., 100°C for extended periods), as this can lead to protein degradation or aggregation [40].
- Brief Centrifugation: Centrifuge the heated samples briefly (e.g., 1 minute at 15,000 rpm) to collect all condensation and liquid at the bottom of the tube [16].
- Special Considerations:
- Cell Lysates: If the sample is viscous due to genomic DNA, shear the DNA by sonication or pass it through a small-gauge needle [40].
- High Salt Concentrations: High salt can cause band distortion and uneven migration. Dialyze or precipitate and resuspend samples in a low-salt buffer before preparation [40].
- For non-denaturing (native) PAGE, do not include SDS or reducing agents, and do not heat the samples [40].
Run Conditions and Electrophoresis
Setup and Execution
Research Reagent Solutions for Electrophoresis Run
| Item | Function |
|---|---|
| Running Buffer (e.g., Tris-Glycine-SDS) | Conducts current and maintains pH during the run. The buffer ions are crucial for the discontinuous electrophoresis system. |
| Power Supply | Provides a stable electrical field (constant voltage or current) to drive protein migration. |
| Molecular Weight Marker (Protein Ladder) | A mixture of proteins of known sizes run alongside samples to estimate the molecular weight of unknown proteins. |
Procedure:
- Assemble the Gel Unit: Once the gel is polymerized, remove the comb and bottom tape. Mount the gel cassette into the electrophoresis tank according to the manufacturer's instructions [39].
- Fill with Running Buffer: Fill the inner and outer chambers of the electrophoresis apparatus with running buffer, ensuring that the wells and the bottom of the gel are submerged. Remove any air bubbles trapped under the gel [16].
- Load Samples: Using a micropipette, load equal volumes of prepared samples and protein molecular weight markers into the wells [39].
- Apply Electrical Current: Place the lid on the tank, connect it to the power supply, and apply the voltage. For a standard mini gel, a common condition is 100-150 V for 60-90 minutes, or until the tracking dye (Bromophenol Blue) front reaches the bottom of the gel [39]. The run time varies based on gel percentage, voltage, and buffer system.
Optimization and Troubleshooting
Table 3: Optimizing Run Conditions for Different Gel Types
| Goal / Gel Type | Recommended Voltage | Approximate Run Time | Key Considerations |
|---|---|---|---|
| Standard SDS-PAGE (Mini Gel) | 100 - 150 V | 60 - 90 minutes | Higher voltage speeds up the run but may cause overheating and smeared bands. |
| High-Resolution Separation | 80 - 100 V | 2 - 3 hours | Lower voltage and longer run times can improve band sharpness and resolution. |
| Gradient Gel | 100 - 150 V | 90 minutes | Does not require a stacking gel, as the gradient itself concentrates the proteins. |
| Native-PAGE | 100 - 150 V | 60 - 90 minutes | Keep the apparatus cool to prevent denaturation; no SDS in gel or buffer. |
Common issues and solutions:
- Smiling Bands (curved bands): Often caused by excessive heat. Run the gel at a lower voltage or use a cooling system [39].
- Diffuse Bands: Can result from incomplete polymerization, old reagents, or overloading of samples.
- Atypical Migration: Can be caused by high salt concentrations in the sample or reoxidation of reduced samples over long storage periods [40].
Protein gel electrophoresis is a foundational technique in molecular biology and biochemistry for separating complex protein mixtures based on their size, charge, or both [1]. The most common form, sodium dodecyl sulfate-polyacrylamide gel electrophoresis (SDS-PAGE), denatures proteins and masks their native charge, allowing separation primarily by molecular weight [1]. However, the separated proteins are invisible within the gel matrix without subsequent treatment. Staining is therefore a critical step for visualizing and analyzing the results of electrophoresis, enabling researchers to determine protein presence, quantity, and approximate size [41] [42].
The choice of staining method represents a trade-off between sensitivity, ease of use, cost, and compatibility with downstream applications such as mass spectrometry. Coomassie Blue staining, a colorimetric method, and fluorescent dye staining represent two widely used approaches with distinct characteristics and applications in proteomic research and drug development [42].
Principles of Coomassie Blue Staining
Chemical Mechanism and Dye Forms
Coomassie Brilliant Blue is an anionic dye belonging to the triphenylmethane family [41]. It binds to proteins primarily through non-covalent interactions, including hydrophobic interactions with polypeptide backbones and ionic interactions with positively charged amino acid residues such as arginine, lysine, and histidine [41]. Upon binding, the dye undergoes a visible spectral shift from a dull reddish-brown to an intense blue, creating distinct blue bands against a clear background [41].
Two primary forms of the dye are used in protein detection:
- Coomassie R-250: The "R" denotes a reddish hue; it is commonly used in traditional staining protocols for SDS-PAGE and isoelectric focusing (IEF) gels [43] [41].
- Coomassie G-250: The "G" denotes a greenish hue; it is often used in colloidal staining kits and the Bradford protein assay due to its colloidal properties [41].
The ionic state and color of Coomassie G-250 are pH-dependent: it is red as a double cation at very low pH (below 0.3), green in its neutral form at pH 1.3, and blue as an anion at higher pH levels [41].
Standard Coomassie Blue Staining Protocol
The following protocol is adapted for a standard mini-gel (approx. 8 x 8 cm) and can be completed in several hours or overnight [43] [41].
Detailed Methodology
Step 1: Water Wash. After electrophoresis, carefully remove the gel from its cassette and place it in a staining container. Rinse the gel with deionized water (approximately 100 mL for a mini-gel) three times for 5 minutes each with gentle agitation on an orbital shaker. This step removes SDS and buffer salts that can interfere with dye binding [43] [42].
Step 2: Gel Fixation. For traditional Coomassie R-250 staining, cover the gel with a fixing solution (e.g., 50% methanol and 10% acetic acid) and agitate for 30 minutes. This step precipitates proteins within the gel matrix, preventing diffusion [41]. Note: This step can be skipped when using certain ready-to-use stains like InstantBlue or SimplyBlue SafeStain [41] [43].
Step 3: Staining Incubation. Decant the fixation solution and immerse the gel in Coomassie staining solution. For SimplyBlue SafeStain, use 20-100 mL to cover the gel and incubate for 1 hour at room temperature with shaking [43]. For traditional 0.1% Coomassie R-250 (in 40% ethanol, 10% acetic acid), use 100 mL and incubate with shaking for 15 minutes to several hours [43]. To accelerate the process, microwave heating can be used cautiously: heat for 1 minute without boiling, followed by 15 minutes of shaking [43].
Step 4: Destaining. Remove the staining solution and rinse the gel briefly with deionized water. Add destaining solution (e.g., 10% ethanol with 7.5% acetic acid, or just water for some colloidal stains) and agitate. Change the solution periodically until the background is clear and protein bands are sharp [43] [41]. For faster results, heating in a microwave (1 minute without boiling) followed by shaking can be employed [43]. Activated charcoal can be used to recycle destaining solutions [41].
Step 5: Imaging and Storage. For imaging, place the gel in water for a final wash to improve background clarity [43]. Image the gel using a standard white light scanner or gel documentation system. For Coomassie-stained gels, imaging via NIR fluorescence on instruments like the Odyssey Imager is also possible, offering comparable sensitivity to SYPRO Ruby [44]. Gels can be stored in water or a 20% ammonium sulfate solution for long-term preservation [43].
The Scientist's Toolkit: Key Reagents for Coomassie Staining
Table 1: Essential Reagents and Equipment for Coomassie Blue Staining
| Item | Function | Example Formulations/Notes |
|---|---|---|
| Coomassie Stain | Binds to proteins for visualization. | 0.1% Coomassie R-250 in 40% ethanol, 10% acetic acid; or ready-to-use colloidal G-250 stains [43] [41]. |
| Destaining Solution | Removes unbound dye to clear background. | 10% ethanol, 7.5% acetic acid; or water for colloidal stains [43]. |
| Fixing Solution | Precipitates proteins in the gel. | 50% methanol, 10% acetic acid [41]. |
| Methanol & Acetic Acid | Key components of fixing and destaining solutions. | Handle with care; use in a well-ventilated area [41]. |
| Orbital Shaker | Provides gentle, consistent agitation. | Ensures even staining and destaining [43] [41]. |
| Staining Container | Holds gel and solutions during processing. | Glass, plastic, or stainless steel trays [41]. |
| Gel Documentation System | Captures images of stained protein bands. | Standard white light scanner or specialized imager [41] [44]. |
Principles of Fluorescent Dye Staining
Mechanism and Dye Characteristics
Fluorescent stains detect proteins through non-covalent binding to protein-dye complexes, resulting in light emission upon excitation at specific wavelengths [45] [42]. These dyes typically interact with the SDS coat surrounding proteins or directly with basic amino acids and the polypeptide backbone [45]. A key advantage is their broad dynamic range for quantification, often spanning 2-3 orders of magnitude, with low protein-to-protein variability [45].
These stains are highly sensitive, typically detecting 0.25 to 8 ng of protein per band, making them more sensitive than Coomassie stains and equivalent to silver staining techniques [45] [42]. Since the dyes do not covalently modify proteins, they are generally compatible with downstream applications like mass spectrometry and protein sequencing [45].
Standard Fluorescent Staining Protocol
The following protocol outlines a general workflow for fluorescent stains like SYPRO Orange and SYPRO Red, which can be completed in about an hour [45].
Detailed Methodology
Step 1: Dye Preparation. Some fluorescent stains, such as SYPRO Orange and SYPRO Red, are supplied as stock solutions and must be diluted before use. A typical dilution is 1:5000 in 7.5% (v/v) acetic acid [45]. Other stains, like SYPRO Ruby, are supplied ready-to-use [45].
Step 2: Staining Incubation. Place the gel directly into the staining solution (approximately 50 mL for a mini-gel). Incubate with gentle agitation for a period ranging from 10 minutes to overnight, depending on the specific dye and desired sensitivity. For example, SYPRO Orange and Red require 10-60 minutes, while the standard SYPRO Ruby protocol recommends an overnight incubation [45]. A microwave-accelerated protocol for SYPRO Ruby can reduce this time to 90 minutes [45].
Step 3: Washing. After staining, decant the staining solution. Rinse the gel briefly (less than 1 minute) with a wash solution, such as 7.5% acetic acid or deionized water, to reduce background [45]. Most fluorescent stains do not require extended destaining.
Step 4: Imaging. Visualize the stained gel using a fluorescence-compatible imaging system. This can include UV or blue-light transilluminators, laser-scanning instruments, or CCD-based imagers like the iBright Imaging Systems [45]. Use the appropriate excitation and emission filters for the specific dye used.
The Scientist's Toolkit: Key Reagents for Fluorescent Staining
Table 2: Essential Reagents and Equipment for Fluorescent Protein Staining
| Item | Function | Example/Notes |
|---|---|---|
| Fluorescent Stain | Binds non-covalently to proteins for detection. | SYPRO Ruby (ready-to-use), SYPRO Orange (stock solution) [45]. |
| Diluent / Wash Buffer | Used to dilute stock dyes and rinse gels. | 7.5% acetic acid is common for SYPRO dyes [45]. |
| Orbital Shaker | Provides gentle agitation during staining. | Ensures uniform dye penetration [45]. |
| Fluorescence Imager | Excites the dye and captures emitted light. | Requires specific excitation/emission filters (e.g., UV, 473 nm, 488 nm) [45]. |
Comparative Analysis of Staining Methods
Choosing between Coomassie and fluorescent staining requires a clear understanding of their performance characteristics and practical considerations.
Table 3: Quantitative Comparison of Protein Gel Staining Methods
| Parameter | Coomassie Blue Staining | Fluorescent Dye Staining |
|---|---|---|
| Typical Detection Limit | 8–10 ng per band (some proteins); ~25 ng typical [42]. | 0.25–8 ng per band, depending on the dye [45] [42]. |
| Linear Quantitation Range | Limited dynamic range [42]. | 2–3 orders of magnitude [45]. |
| Typical Staining Time | 1 hour to overnight [43] [41]. | ~1 hour to overnight [45]. |
| Key Advantages | Simple, inexpensive, reversible, MS-compatible [41] [42]. | High sensitivity, broad dynamic range, minimal protein-to-protein variation, no destaining [45]. |
| Primary Limitations | Lower sensitivity, protein composition bias [42]. | Requires specialized imaging equipment, dyes can be expensive [42]. |
| Compatibility with Mass Spectrometry | Excellent, due to non-covalent binding [41] [42]. | Excellent for most dyes (e.g., SYPRO Ruby), due to non-covalent binding [45]. |
Applications in Protein Research
Within the broader context of protein electrophoresis research, staining is not merely a visualization tool but a critical component for analytical and preparative workflows.
Protein Purity Assessment and Quantification: Both Coomassie and fluorescent stains are used to assess the purity of protein samples during purification processes. The intensity and number of stained bands provide a direct visual readout of sample homogeneity [41]. Furthermore, the intensity of stained bands can be quantified via densitometry to determine the relative abundance of proteins in a sample [44] [1].
Western Blotting Normalization: Coomassie staining of the post-transfer gel serves as an excellent loading control for western blotting. It confirms successful protein transfer and allows for normalization of immuno-signals against total protein, which is often more reliable than using a single housekeeping protein [41] [44].
Proteomics and Mass Spectrometry (MS): Compatibility with downstream MS analysis is a major advantage of both Coomassie and fluorescent stains. Because the binding is non-covalent and does not chemically modify proteins, stained protein bands can be excised, destained, and subjected to in-gel digestion and protein identification via peptide mass fingerprinting [45] [41]. This makes them indispensable tools in proteomic studies aimed at protein identification and characterization.
Functional and Post-Translational Modification Analysis: Specialized fluorescent stains can be used to detect specific protein features directly in the gel. For example, Pro-Q Emerald dye stains glycoproteins, and Pro-Q Diamond stains phosphoproteins, allowing researchers to study post-translational modifications without the need for blotting [44].
Protein gel electrophoresis is a foundational technique in molecular biology and biochemistry, enabling the separation of complex protein mixtures based on their physicochemical properties. The core principle involves transporting charged protein molecules through a gel matrix under the influence of an electrical field, acting as a molecular sieve that differentially retards proteins based on their size, charge, or shape [1]. This simple, rapid, and sensitive analytical tool forms the bedrock of numerous protein analysis workflows, from basic research to pharmaceutical development.
The significance of protein electrophoresis stems from its ability to provide critical information that is not readily obtainable through genomic analysis alone. As the functional executors of biological processes, proteins undergo extensive post-translational modifications and exist within complex interactomes; their analysis offers direct insight into cellular activities, disease mechanisms, and drug effects [46]. By separating proteins from almost any biological source, electrophoresis allows researchers to analyze protein purity, determine subunit composition, assess expression levels, identify post-translational modifications, and facilitate disease diagnosis [6]. The technique's versatility and reliability have cemented its status as an indispensable tool in the scientist's arsenal.
Core Principles of Protein Separation
Fundamental Mechanisms of Electrophoretic Separation
During electrophoresis, the mobility of a protein through an electric field depends on several factors: field strength, the net charge on the molecule, its size and shape, the ionic strength of the buffer, and the properties of the matrix through which the molecule migrates (including viscosity and pore size) [1]. Most biological molecules carry a net charge at any pH other than their isoelectric point and will migrate at a rate proportional to their charge density.
The gel matrices—typically polyacrylamide or agarose—serve as porous media that regulate protein movement. Agarose, with its large pore size, is suitable for separating nucleic acids and large protein complexes, while polyacrylamide, with its smaller pore size, is ideal for separating most proteins and smaller nucleic acids [1]. The pore size of polyacrylamide gels is inversely related to the acrylamide percentage; lower percentage gels have larger pores for resolving large proteins, and higher percentage gels have smaller pores for resolving small proteins [1] [6].
Discontinuous Gel Systems: Stacking and Resolving
Most high-resolution protein separations employ a discontinuous buffer system with two distinct gel layers: a stacking gel and a resolving gel [47]. The stacking gel has a lower concentration of acrylamide (typically 4-5%), lower pH (e.g., 6.8), and different ionic content that allows proteins in a loaded sample to be concentrated into a tight band before entering the resolving portion of the gel [1]. This concentration occurs due to the differential mobility of ions in the system, particularly glycine in its zwitterionic state at pH 6.8, which creates a steep voltage gradient that herds proteins into a narrow zone [47].
The resolving gel has a higher acrylamide concentration and pH (e.g., 8.8), creating a sieving matrix that separates proteins primarily based on molecular weight when combined with SDS [47]. When the protein-rich zone enters the resolving layer at pH 8.8, the glycine ions gain negative charges and speed past the proteins, depositing them in a tight band at the top of the resolving layer where they begin to separate based on size [47].
Primary Electrophoresis Techniques
SDS-PAGE: Separation by Molecular Weight
SDS-PAGE (sodium dodecyl sulfate-polyacrylamide gel electrophoresis) is the most widely used electrophoresis technique, separating proteins primarily by mass [1]. The ionic detergent SDS denatures proteins by wrapping around the polypeptide backbone and, when combined with heating and a reducing agent like β-mercaptoethanol, cleaves disulfide bonds to fully dissociate proteins into their subunits [1] [6]. Under these conditions, most polypeptides bind SDS in a constant weight ratio (approximately 1.4 g SDS per 1 g polypeptide), rendering the intrinsic charges of the polypeptide insignificant compared to the negative charges provided by the bound detergent [1]. The resulting SDS-polypeptide complexes have essentially identical negative charge densities and similar shapes, allowing them to migrate through the gel at rates inversely proportional to the logarithm of their molecular mass [1].
The simplicity, speed, and minimal protein requirements of SDS-PAGE (microgram quantities) have made it the method of choice for molecular mass determination and initial protein characterization [1]. Proteins from almost any source are readily solubilized by SDS, making the method generally applicable across sample types [1].
Native-PAGE: Separation of Functional Proteins
Native-PAGE (non-denaturing PAGE) separates proteins according to their net charge, size, and shape while maintaining their native structure [1]. In this technique, proteins are separated because most carry a net negative charge in alkaline running buffers, with higher negative charge density resulting in faster migration [1]. Simultaneously, the frictional force of the gel matrix creates a sieving effect that regulates protein movement according to size and three-dimensional shape [1].
Because no denaturants are used, native-PAGE preserves subunit interactions within multimeric proteins and often maintains enzymatic activity following separation [1]. This technique is particularly valuable for studying protein-protein interactions, oligomeric states, and functional properties, though it provides lower resolution for complex protein mixtures compared to SDS-PAGE [34].
Two-Dimensional Electrophoresis: Maximum Resolution
Two-dimensional (2D) PAGE provides the highest resolution for protein analysis by separating proteins according to two independent properties in sequential steps [1]. The first dimension separates proteins by their native isoelectric point using isoelectric focusing (IEF), where proteins migrate through a pH gradient until they reach the pH at which their net charge is zero (their isoelectric point or pI) [1]. The second dimension then separates these focused proteins by mass using standard SDS-PAGE [1]. This orthogonal separation approach can resolve thousands of proteins on a single gel, making it an important technique in proteomic research where comprehensive protein profiling is necessary [1].
Recent Advancements: Native SDS-PAGE
A recent methodological advancement addresses the limitation of standard SDS-PAGE, which deliberately denatures proteins and destroys functional properties. Native SDS-PAGE (NSDS-PAGE) modifies standard conditions by removing SDS and EDTA from the sample buffer, omitting the heating step, and reducing SDS in the running buffer from 0.1% to 0.0375% [34]. This approach maintains excellent protein resolution while preserving metal ions bound in proteomic samples (increasing Zn²⁺ retention from 26% to 98%) and retaining enzymatic activity in most model enzymes tested [34]. NSDS-PAGE thus represents a promising hybrid technique that combines the high resolution of traditional SDS-PAGE with the functional preservation of native approaches.
Essential Reagents and Equipment
Table 1: Key Research Reagent Solutions for Protein Electrophoresis
| Reagent | Composition | Primary Function |
|---|---|---|
| SDS (Sodium Dodecyl Sulfate) | Anionic detergent [47] | Denatures proteins and confers uniform negative charge [1] [47] |
| Polyacrylamide Gel | Acrylamide + bisacrylamide crosslinked polymer [1] | Forms porous matrix that separates proteins by size [1] |
| Reducing Agents (BME, DTT) | β-mercaptoethanol or dithiothreitol [47] | Cleaves disulfide bonds for complete denaturation [47] |
| Tris-Glycine Buffer | Tris base, glycine, SDS, pH 8.3 [47] | Conducts current and maintains pH during electrophoresis [47] |
| Ammonium Persulfate (APS) & TEMED | Polymerizing agent and catalyst [1] | Initiates and accelerates acrylamide polymerization [1] |
| Sample Loading Buffer | Tris-HCl, SDS, glycerol, Bromophenol Blue, reducing agent [47] | Denatures proteins, adds density for loading, provides tracking dye [47] |
| Molecular Weight Markers | Proteins of known molecular weight [1] | Reference for estimating sample protein sizes [1] |
The electrophoresis apparatus consists of gel cassettes formed between two glass plates, mounted vertically into a tank containing buffer chambers with electrodes (cathode and anode) [1]. When current is applied, the resulting redox reactions at the electrodes electrolyze water, producing hydrogen gas at the negatively charged cathode and oxygen gas at the positively charged anode—explaining the bubbling observed during electrophoresis [47]. Researchers can choose between hand-cast gels, prepared in the laboratory according to standardized recipes, or pre-cast gels, which offer convenience, consistency, and eliminate exposure to neurotoxic acrylamide monomers [6].
SDS-PAGE Protein Separation Workflow
Research Application 1: Protein Purity Analysis
Methodology for Purity Assessment
Protein purity analysis is essential in biotechnology and pharmaceutical development, particularly for characterizing protein-based therapeutics [48]. The standard protocol involves separating the protein sample by SDS-PAGE alongside known molecular weight markers, staining the gel, and performing densitometric analysis to quantify the relative abundance of the target protein versus contaminants [48]. Colloidal Coomassie staining is commonly employed for its balance of sensitivity and linear dynamic range, though silver staining may be used for enhanced sensitivity when detecting trace impurities [6] [48].
For quantitative purity analysis, a dilution series of the target protein is run to determine the linear range of detection, where band quantitation (volume measured in optical density units) is linear with respect to the amount of protein loaded, and the percent purity remains constant [48]. This range typically brackets the target protein load by ±20% and defines the valid quantitation range of the protocol [48]. Stressed samples containing deliberate impurities are often analyzed to validate the method's accuracy, precision, and specificity for detecting protein contaminants [48].
Pharmaceutical Quality Control Applications
In regulated pharmaceutical environments, demonstrating comparability when changing analytical methods is critical [48]. A well-designed comparability study must evaluate seven performance characteristics: accuracy, precision, specificity, limit of detection (LOD), limit of quantitation (LOQ), linearity, and range [48]. Such studies enable adoption of improved workflows while maintaining regulatory compliance.
Table 2: Performance Characteristics for Purity Analysis Validation
| Characteristic | Definition | Validation Methodology |
|---|---|---|
| Accuracy | Difference between mean and accepted true value | Nine determinations over ≥3 concentrations [48] |
| Precision | Reproducibility defined by standard deviation | Nine determinations over ≥3 concentration levels [48] |
| Specificity | Ability to detect target amid impurities | Analysis of stressed samples with known contaminants [48] |
| Linearity | Fit of method of least squares | Minimum of 5 concentrations with 3 replicates each [48] |
| LOD | Lowest amount detectable with confidence | Determined from dilution series [48] |
| LOQ | Lowest amount quantifiable within specified confidence | Determined from dilution series [48] |
| Range | Limits where linearity, accuracy, and precision are achieved | Minimum of 5 different concentrations with 3 replicates [48] |
Modern purity analysis workflows have evolved to increase efficiency through improvements such as precast gels with expanded well capacity, faster run times, and simplified staining protocols [48]. These advancements can reduce hands-on time while maintaining the rigorous standards required for biopharmaceutical characterization.
Research Application 2: Protein Expression Studies
Monitoring Expression Levels
Protein gel electrophoresis is fundamental to expression studies aimed at determining when and where proteins are synthesized, and at what levels. By comparing samples from different conditions, tissues, or developmental stages, researchers can identify differentially expressed proteins and monitor changes in expression patterns in response to experimental manipulations.
In expression analysis, samples are typically normalized by total protein content or cell number before separation by SDS-PAGE. Following electrophoresis, gel staining reveals global expression profiles, with band intensity correlating with protein abundance. Densitometric analysis of stained gels allows semi-quantitative comparison of protein levels across samples, particularly when within the linear range of detection [48]. This approach enables researchers to confirm gene expression at the protein level, evaluate the effects of genetic manipulations, and study regulatory mechanisms [46].
Post-Translational Modification Analysis
Beyond measuring abundance, electrophoresis can help detect and characterize post-translational modifications (PTMs) that significantly alter protein function, including phosphorylation, glycosylation, and proteolytic processing [49]. These modifications often cause measurable shifts in electrophoretic mobility, with phosphorylation typically increasing apparent molecular weight and glycosylation producing diffuse bands. Specific detection methods, such as phospho-specific staining or lectin blotting, can be combined with electrophoresis to identify and characterize these modifications.
Two-dimensional electrophoresis is particularly powerful for PTM analysis, as many modifications alter both isoelectric point and molecular weight. For instance, the addition of phosphate groups increases negative charge, shifting protein migration in the first dimension (IEF), while often minimally affecting migration in the second dimension (SDS-PAGE). This separation pattern creates characteristic "trains" of spots that correspond to modified forms of the same protein.
Research Application 3: Western Blotting
Principles and Procedures
Western blotting (immunoblotting) combines the separation power of SDS-PAGE with the specificity of antibody-based detection to identify specific proteins in complex mixtures [50] [49]. The technique involves transferring proteins separated by SDS-PAGE onto a hydrophobic membrane (typically nitrocellulose or PVDF), probing the membrane with a primary antibody specific for the target protein, and then detecting bound antibody with a labeled secondary antibody [50].
The transfer process can be accomplished using tank or semi-dry systems, with the tank system generally providing more consistent results, especially for high molecular weight proteins [50]. Following transfer, membranes are blocked with proteins such as bovine serum albumin (BSA) or skim milk to prevent nonspecific antibody binding [50]. Critical optimization steps include antibody concentration determination—too low and the target cannot be detected; too high and non-specific reactions occur [50].
Western Blotting Experimental Workflow
Detection Methods and Applications
Detection is typically achieved through chemiluminescence, where horseradish peroxidase (HRP) conjugated to the secondary antibody catalyzes a reaction that emits light, detected by X-ray film or cooled CCD cameras [50] [49]. Alternative detection methods include colorimetric substrates that produce insoluble colored precipitates at the antigen location [50].
Western blotting serves multiple applications in scientific research and diagnostics. It is extensively used to detect specific proteins, analyze protein modifications such as phosphorylation and glycosylation, and confirm results from genetic experiments [49]. In medical diagnostics, Western blotting provides confirmatory testing for HIV, Lyme disease, Hepatitis B, and other infectious diseases by detecting pathogen-specific antibodies in patient samples [49]. The technique's high specificity, deriving from both size-based separation and antibody recognition, makes it particularly valuable when analyzing closely related protein isoforms or modified forms.
Troubleshooting and Technical Considerations
Optimization Strategies
Successful electrophoresis requires careful attention to multiple parameters. Gel percentage should be matched to target protein size—lower percentages (8-10%) for larger proteins (>100 kDa) and higher percentages (12-15%) for smaller proteins (<30 kDa) [1] [6]. Gradient gels with increasing acrylamide concentration from top to bottom can separate a broader range of protein sizes simultaneously [1].
Sample preparation critically affects results. Protein extraction buffers must be compatible with downstream analysis, often containing protease and phosphatase inhibitors to preserve protein integrity [49]. For Western blotting, membrane selection depends on application requirements—PVDF offers higher protein binding capacity and mechanical strength, while nitrocellulose is less expensive and causes less nonspecific binding [50].
Common Artifacts and Solutions
Frequent issues in protein electrophoresis include smearing (incomplete denaturation, protease activity), uneven bands (improper gel polymerization, buffer depletion), and high background in Western blots (inadequate blocking or antibody concentration) [50]. These can be addressed through optimized sample preparation, fresh buffers, and careful antibody titration.
For purity analysis, accurate quantitation requires ensuring that the target protein band falls within the linear range of detection, which must be empirically determined for each protein-stain-imager combination [48]. Signal saturation at high loads or failure to detect impurities at low loads can lead to inaccurate purity assessments.
Future Directions and Innovations
The field of protein electrophoresis continues to evolve with technological advancements. Modern protein analysis systems increasingly integrate digital imaging, automation, and user-friendly interfaces, reducing the need for darkrooms and specialized infrastructure [46]. These systems offer built-in analysis functions, automatic quantification, and cloud-based data sharing, significantly streamlining workflows [46].
Emerging trends include the development of more sensitive detection methods, miniaturized portable devices for point-of-care applications, and integration of artificial intelligence for automated pattern recognition and data analysis [46]. The ongoing refinement of functional electrophoresis techniques, such as NSDS-PAGE that preserves protein activity while maintaining high resolution, addresses historical limitations and expands application possibilities [34]. These innovations collectively make protein analysis more intelligent, accessible, and responsive to modern scientific needs.
Protein gel electrophoresis remains a cornerstone technique in biological research and biotechnology, providing critical insights into protein composition, modification, and function. Its applications in purity analysis, expression studies, and Western blotting support advancements across basic science, drug development, and clinical diagnostics. While the fundamental principles established decades ago remain valid, ongoing methodological refinements and technological innovations continue to expand the capabilities and applications of this versatile methodology. As part of a comprehensive protein analysis strategy, electrophoresis delivers indispensable information that bridges the gap between genomic potential and functional proteomic reality.
Troubleshooting Common Protein Gel Issues: From Smearing to Poor Resolution
Protein gel electrophoresis is a fundamental pillar of biochemical and proteomic research, enabling the separation of complex protein mixtures based on their molecular properties [1] [6]. A core principle of this technique is that the mobility of a protein through a gel matrix is a function of the electrical field strength, the molecule's net charge and size, and the properties of the matrix itself [1]. While the theory is robust, the practical execution is often marred by artifacts that compromise data integrity. Among the most common of these are distorted bands—'smiling,' 'frowning,' and edge effects. Diagnosing and resolving these issues is critical for ensuring the reproducibility and accuracy essential to research and drug development.
The Core Principles of Protein Gel Electrophoresis
To effectively troubleshoot, one must first understand the foundational mechanics of the process. In polyacrylamide gel electrophoresis (PAGE), proteins are driven through a cross-linked polymer network by an electrical field [1]. The two most common forms are:
- SDS-PAGE (Denaturing): The ionic detergent sodium dodecyl sulfate (SDS) denatures proteins and confers a uniform negative charge. Under these conditions, proteins separate primarily by molecular mass, with smaller polypeptides migrating faster through the gel's molecular sieve [1] [5] [6].
- Native-PAGE: Proteins are separated in their folded state, migrating according to their combined net charge, size, and three-dimensional shape. This technique is invaluable for studying native protein complexes and enzymatic activity [1] [6].
The entire process, from gel polymerization to sample preparation and the final run, is a tightly balanced system. Deviations at any stage can introduce distortions that obscure results.
A Systematic Guide to Band Distortions
Band distortions are not random; their specific patterns reveal the underlying physical or chemical failure in the system. The following table provides a diagnostic guide to the most common artifacts.
Table 1: Diagnosis and Resolution of Common Band Distortions
| Artifact | Primary Cause | Underlying Principle Violated | Corrective Actions |
|---|---|---|---|
| 'Smiling' or 'Frowning' Bands (Curved bands) | Uneven heat distribution (Joule heating) across the gel [51] [52]. The center becomes hotter than edges, altering migration rate [51]. | Optimal separation requires a uniform electric field and temperature [51]. | - Reduce the running voltage [51] [52].- Use a power supply with constant current mode [51].- Run the gel in a cold room or use a cooling apparatus [51] [52]. |
| Edge Effects (Distorted peripheral lanes) | Empty wells at the periphery of the gel, leading to an uneven electric field [52]. | The electric field strength must be consistent across all lanes [52]. | - Load reference proteins, ladders, or dummy samples in empty edge wells [52]. |
| Smeared Bands | Sample Degradation: Proteases cleave proteins into fragments of various sizes [51].Improper Denaturation: In SDS-PAGE, incomplete denaturation leaves proteins with variable charge and shape [51]. | SDS-PAGE requires complete protein denaturation and a uniform charge-to-mass ratio [1] [51]. | - Use fresh protease inhibitors; keep samples on ice [51].- Ensure samples are heated with sufficient SDS and reducing agent [51]. |
| Poor Band Resolution (Bands too close) | Suboptimal Gel Concentration: Pore size is inappropriate for the target protein size range [51].Overloading: Too much protein in a well [51]. | Effective sieving depends on matching the gel pore size to the protein's hydrodynamic radius [1] [51]. | - Use a higher % gel for small proteins; lower % for large proteins [1] [51].- Load a smaller amount of protein per well [51]. |
Experimental Protocols for Diagnosis and Resolution
Implementing the corrective actions from Table 1 requires standardized protocols. Below is a detailed methodology for a key corrective measure: optimizing running conditions to prevent smiling bands.
Protocol: Mitigating Heat-Induced 'Smiling' Bands through Voltage and Temperature Optimization
- Gel Casting: Prepare and cast two identical SDS-polyacrylamide gels using a standard discontinuous buffer system (e.g., Tris-Glycine) [1] [5]. Ensure the total acrylamide concentration is appropriate for your protein molecular weight range.
- Sample Preparation: Prepare a single, homogeneous protein sample or lysate. A pre-stained protein ladder should be included for tracking. Denature the samples by heating at 70-100°C for 3-5 minutes in a sample buffer containing SDS and a reducing agent (e.g., β-mercaptoethanol or DTT) [1] [5].
- Experimental Run Setup:
- Gel A (Standard Conditions): Load identical volumes of the prepared sample into multiple wells. Run the gel at a constant high voltage (e.g., 200V) in an apparatus at room temperature until the dye front reaches the bottom.
- Gel B (Optimized Conditions): Load the same sample volume as in Gel A. Run the gel at a constant, lower voltage (e.g., 100-150V) for a proportionally longer time [51] [52]. Place the entire apparatus in a cold room or equip it with a stirrer and cooling unit to maintain a consistent, low temperature [51].
- Post-Electrophoresis Analysis:
- Carefully disassemble the gels and subject them to staining (e.g., Coomassie Brilliant Blue or a fluorescent stain) and destaining according to standard protocols [6].
- Image the gels and compare the band geometries between Gel A and Gel B. The bands in Gel B should demonstrate significantly straighter migration with reduced curvature, confirming that controlled heat dissipation mitigates the smiling effect.
This systematic approach isolates the variable of heat generation and provides empirical evidence for the optimal running conditions for a specific laboratory setup.
The Scientist's Toolkit: Essential Reagents and Materials
The quality and appropriateness of reagents are fundamental to successful electrophoresis. The following table outlines key solutions and their critical functions in the process.
Table 2: Key Research Reagent Solutions for Protein Gel Electrophoresis
| Reagent/Material | Function | Technical Considerations |
|---|---|---|
| Acrylamide/Bis-acrylamide | Forms the cross-linked polyacrylamide gel matrix that acts as a molecular sieve [1]. | The ratio and total concentration determine pore size. Neurotoxic until polymerized; handle with care [1] [6]. |
| Ammonium Persulfate (APS) & TEMED | Catalyzes the free-radical polymerization of acrylamide to form a gel [1]. | TEMED catalyzes the production of free radicals from APS. Fresh APS is critical for efficient and timely polymerization [1]. |
| SDS (Sodium Dodecyl Sulfate) | Ionic detergent that denatures proteins and confers a uniform negative charge, allowing separation primarily by mass [1] [5]. | Must be used in excess (typically 1.4g SDS per 1g protein) and with a reducing agent to break disulfide bonds for complete denaturation [1]. |
| Tris-based Running Buffer | Conducts current and maintains a stable pH during electrophoresis [1] [52]. | An incorrect or depleted ion concentration disrupts current flow and pH, leading to poor resolution and distorted bands [51] [52]. |
| Protein Molecular Weight Marker (Ladder) | Provides a reference for estimating the molecular weight of unknown sample proteins [1] [6]. | Essential for every run. Choose a marker that covers the expected size range of your target proteins. |
The Troubleshooting Workflow: From Problem to Solution
Success in electrophoresis hinges on a systematic approach to troubleshooting. The following diagram maps the logical pathway from observing a problem to implementing a verified solution.
Troubleshooting Workflow for Band Distortions
Within the rigorous framework of protein gel electrophoresis research, the path to reliable data is paved by a deep understanding of core principles. Artifacts like smiling bands and edge effects are not mere inconveniences; they are symptoms of deviations from these principles. A systematic approach to diagnosis—rooted in the physics of electro-migration and the chemistry of protein-denaturant interactions—enables researchers to move from symptomatic treatment to fundamental correction. As the field advances, with new computational tools like AI-powered image analysis emerging, the foundational need for high-quality, artifact-free gels remains paramount [7]. Mastering these troubleshooting skills is, therefore, not just about fixing a gel, but about ensuring the integrity of the scientific conclusions drawn from it.
Band smearing in protein gel electrophoresis represents a critical challenge that compromises data integrity and experimental outcomes in molecular biology research. This in-depth technical guide examines the principal causes of band smearing—including sample degradation, improper denaturation, and suboptimal electrophoresis conditions—within the broader context of protein separation science. We present a systematic troubleshooting framework incorporating detailed methodologies, quantitative specifications, and validated experimental protocols to diagnose and resolve smearing artifacts. Designed for researchers, scientists, and drug development professionals, this review integrates practical solutions with theoretical principles to enhance experimental reproducibility and data quality in proteomic applications.
Gel electrophoresis serves as a cornerstone methodology in protein research, enabling the separation of complex protein mixtures based on their physicochemical properties. The fundamental principle underlying this technique involves the migration of charged molecules through a gel matrix under the influence of an electric field [53] [14]. For proteins, polyacrylamide gel electrophoresis (PAGE) provides a molecular sieving effect that separates polypeptides according to their size, charge, or isoelectric point [54] [14].
The introduction of sodium dodecyl sulfate (SDS) in PAGE revolutionized protein analysis by denaturing proteins and imparting a uniform negative charge proportional to polypeptide length [5]. This treatment eliminates the influence of protein shape and native charge, allowing separation based primarily on molecular weight [5] [14]. The precision of this separation is crucial for downstream applications including proteomic analysis, biomarker discovery, and drug target validation.
Band smearing represents a significant deviation from ideal separation behavior, manifesting as diffuse, poorly resolved protein bands that compromise analytical accuracy [55] [51]. Within the broader thesis of protein electrophoresis research, understanding and addressing smearing artifacts is essential for data reliability and experimental reproducibility. This guide systematically addresses the multifactorial origins of band smearing and provides evidence-based solutions to maintain separation fidelity.
Fundamental Causes of Band Smearing
Sample Integrity Issues
Protein degradation represents a primary cause of band smearing, resulting from protease activity or physical degradation during sample handling [55] [51]. Proteases endogenous to biological samples can remain active during storage or preparation, generating partial degradation products that appear as a continuous smear below the intact protein band. Contaminated buffers or labware introduce exogenous nucleases and proteases that further exacerbate degradation [55]. Proper sample handling—including working on ice, using protease inhibitors, and employing nuclease-free reagents—is essential for maintaining sample integrity [55] [51].
Protein aggregation presents another prevalent source of smearing, particularly for hydrophobic or membrane-associated proteins [56]. Insufficiently solubilized proteins form heterogeneous complexes that migrate irregularly through the gel matrix, creating diffuse bands or high-molecular-weight smears. Sample overloading beyond the gel's separation capacity (typically 0.1–0.2 μg of protein per millimeter of well width) produces characteristic U-shaped or warped bands that fuse with adjacent lanes [55]. The presence of high salt concentrations or incompatible detergents in sample buffers creates localized conductivity variations that distort band morphology and contribute to smearing artifacts [55] [56].
Denaturation and Buffer Incompatibilities
Incomplete denaturation represents a frequent yet often overlooked cause of band smearing in SDS-PAGE. Proteins retaining secondary or tertiary structure migrate anomalously due to variations in SDS-binding efficiency [56] [51]. The denaturing process requires both the reducing agent to cleave disulfide bonds and SDS to unfold the polypeptide chain, with insufficient concentrations of either component leading to heterogeneous protein populations [56].
The use of incompatible loading buffers represents another critical factor. For SDS-PAGE, loading dyes must contain adequate reducing agents (DTT or β-mercaptoethanol) and SDS concentrations to ensure complete denaturation [56]. Conversely, for native PAGE, denaturing components must be omitted to preserve protein structure and function [55] [14]. Heating conditions during sample preparation must be optimized—typically 95-100°C for 3-5 minutes—to ensure complete denaturation without promoting protein aggregation or chemical degradation [5].
Table 1: Quantitative Guidelines for Sample Preparation to Prevent Smearing
| Parameter | Recommended Specification | Consequence of Deviation |
|---|---|---|
| Protein load | 0.1–0.2 μg per mm well width [55] | Overloading causes U-shaped bands and smearing |
| Glycerol concentration in loading buffer | Sufficient to increase density [56] | Sample leakage from wells causes distortion |
| Reducing agent concentration | 50-100 mM DTT or 5% β-mercaptoethanol [56] | Incomplete disulfide reduction causes heterogeneity |
| Heating conditions | 95-100°C for 3-5 minutes [5] | Incomplete denaturation or protein aggregation |
| Salt concentration | <50 mM recommended [55] | High salt causes localized heating and distortion |
Gel Electrophoresis Conditions
Suboptimal gel composition directly impacts separation efficiency and band morphology. Gel percentage must be appropriate for the target protein size range, with higher percentages providing better resolution for lower molecular weight proteins [55] [51]. The use of poorly formed wells—resulting from damaged combs, incomplete polymerization, or pushing combs to the gel bottom—causes sample leakage and band distortion [55]. For standard protein separations, gel thickness should be maintained at 3-4 mm to prevent diffusion-related band spreading during extended runs [55].
Electrical parameters significantly influence band sharpness through Joule heating effects. Excessive voltage generates heterogeneous heating across the gel, causing protein denaturation and differential migration rates that manifest as "smiling" or "frowning" bands [51]. Insufficient voltage prolongs run times, allowing band diffusion and loss of resolution [55]. Incompatible running buffers with inadequate buffering capacity fail to maintain stable pH during electrophoresis, altering protein charge states and migration consistency [55].
Table 2: Electrophoresis Conditions and Their Impact on Band Appearance
| Condition | Optimal Parameters | Smearing Manifestation |
|---|---|---|
| Gel concentration | 8-12% for most proteins; gradient for wide mass range [5] [14] | Poor resolution of similarly sized proteins |
| Voltage | Constant appropriate for gel size (e.g., 100-150V for mini-gels) [51] | "Smiling" or "frowning" bands from uneven heating |
| Run time | Until dye front reaches bottom (∼1-1.5 hours for mini-gels) [5] | Band diffusion with extended runs |
| Buffer composition | Fresh Tris-Glycine with SDS for SDS-PAGE [51] | pH instability causes aberrant migration |
| Gel thickness | 3-4 mm for horizontal systems [55] | Increased diffusion in thicker gels |
Diagnostic Framework and Troubleshooting
Systematic Diagnosis of Smearing Patterns
A methodical approach to diagnosing band smearing begins with characterizing the specific pattern observed. Uniform smearing across all molecular weights typically indicates generalized protein degradation or aggregate formation [55] [51]. Discrete smearing at specific molecular weights suggests incomplete denaturation or presence of protein isoforms with post-translational modifications. Smiling or frowning bands point to uneven heating during electrophoresis, often resulting from incorrect buffer conditions or voltage settings [51].
The diagnostic workflow below illustrates a systematic approach to identifying smearing causes:
Systematic Diagnosis of Band Smearing Causes
Experimental Protocols for Problem Resolution
Protocol for Assessing Sample Integrity
Objective: Determine whether protein degradation contributes to observed smearing patterns.
Materials:
- Fresh protein sample
- Protease inhibitor cocktail (e.g., PMSF, Complete Mini)
- Lysis buffer (50 mM Tris-HCl, pH 7.5, 150 mM NaCl, 1% NP-40)
- Heating block set to 95°C
- 2X SDS-PAGE loading buffer (125 mM Tris-HCl, pH 6.8, 4% SDS, 20% glycerol, 0.02% bromophenol blue)
Methodology:
- Divide protein sample into three aliquots of equal concentration
- Treat first aliquot with 1X protease inhibitor cocktail immediately after extraction
- Subject second aliquot to three freeze-thaw cycles before analysis
- Maintain third aliquot on ice throughout preparation without protease inhibitors
- Add reducing agent (100 mM DTT or 5% β-mercaptoethanol) to loading buffer immediately before use
- Denature all samples at 95°C for 5 minutes
- Centrifuge at 15,000 × g for 5 minutes to remove insoluble material
- Load equal protein amounts on identical SDS-PAGE gels
- Compare band patterns across treatments
Interpretation: Increased smearing in samples without protease inhibitors or subjected to freeze-thaw cycles indicates degradation-related smearing. Implementation of fresh inhibitors and minimized freeze-thaw cycles is recommended [55] [51].
Protocol for Optimizing Denaturation Conditions
Objective: Establish ideal denaturation parameters to minimize smearing from incomplete unfolding.
Materials:
- Protein samples at consistent concentration
- 2X SDS loading buffer with varying compositions:
- Buffer A: Standard Laemmli buffer (4% SDS, 10% glycerol, 62.5 mM Tris-HCl, pH 6.8, 0.02% bromophenol blue)
- Buffer B: Buffer A + 100 mM DTT
- Buffer C: Buffer A + 200 mM DTT
- Buffer D: Buffer A + 5% β-mercaptoethanol
- Heating blocks set to 70°C, 85°C, 95°C, and 100°C
Methodology:
- Aliquot protein samples into four equal portions
- Add each sample to the four different loading buffers
- Heat identical buffer-sample mixtures at different temperatures (70°C, 85°C, 95°C, 100°C) for 5 minutes
- Include one set without heating for comparison
- Centrifuge all samples at 15,000 × g for 5 minutes
- Load supernatants on SDS-PAGE gel with appropriate molecular weight markers
- Compare band sharpness across conditions
Interpretation: Optimal denaturation conditions yield the sharpest bands with minimal smearing. Inadequate reducing agent or heating typically shows as smearing at higher molecular weights, while excessive heat may cause protein aggregation [56] [5].
The Scientist's Toolkit: Essential Reagents and Materials
Successful prevention of band smearing requires appropriate selection and use of key laboratory reagents. The following table details essential components for optimal protein electrophoresis:
Table 3: Research Reagent Solutions for Preventing Band Smearing
| Reagent/Material | Function | Optimal Usage Specifications |
|---|---|---|
| Protease Inhibitor Cocktail | Prevents protein degradation by endogenous proteases [55] | Add fresh to extraction buffers; use manufacturer-recommended concentrations |
| DTT or β-mercaptoethanol | Reducing agent cleaves disulfide bonds [56] | 50-100 mM DTT or 5% β-mercaptoethanol in loading buffer |
| SDS (Sodium Dodecyl Sulfate) | Denaturant that unfolds proteins and imparts negative charge [5] | 2-4% in loading buffer; ensure purity and fresh preparation |
| Ultra-pure Agarose/Polyacrylamide | Gel matrix providing molecular sieving [55] [14] | Appropriate concentration for target protein size; filter if necessary |
| Glycerol | Increases sample density for well loading [56] | 5-10% in loading buffer to prevent sample diffusion |
| Tracking Dye (Bromophenol Blue) | Visualizes migration progress [5] | 0.02% in loading buffer; ensure compatibility with protein size |
| Fresh Electrophoresis Buffer | Maintains stable pH and conductivity [55] [51] | Tris-glycine with 0.1% SDS for SDS-PAGE; prepare fresh weekly |
| Pre-stained Molecular Weight Markers | Reference for protein size and transfer efficiency [5] | Include in at least one lane per gel for accurate interpretation |
Advanced Technical Considerations
Gel Composition and Buffer Systems
The selection of appropriate gel composition represents a critical factor in preventing band smearing. For standard SDS-PAGE, a discontinuous buffer system with stacking and resolving gels provides optimal band sharpness [5] [14]. The stacking gel (typically 4-5% acrylamide, pH 6.8) concentrates proteins into a sharp zone before they enter the resolving gel (typically 8-15% acrylamide, pH 8.8), which separates proteins based on molecular weight [5].
Gradient gels (e.g., 4-20% acrylamide) offer enhanced resolution for complex protein mixtures with wide molecular weight distributions [5]. The increasing acrylamide concentration creates a pore size gradient that simultaneously optimizes separation for both high and low molecular weight proteins, reducing smearing across the separation range. For membrane proteins or complexes, inclusion of urea (4-8M) in the gel system improves solubility and reduces aggregation-related smearing [56].
Electrophoresis Parameter Optimization
Precise control of electrophoretic conditions significantly minimizes band distortion. Constant current operation provides more consistent heat generation compared to constant voltage, reducing thermal gradients that cause band smiling or frowning [51]. For standard mini-gel systems (8 × 10 cm), currents of 20-30 mA per gel typically provide optimal separation without excessive heating. Cooling systems—either integrated or through ice bath placement—maintain uniform temperature distribution during extended runs.
The relationship between electrophoresis conditions and band appearance can be visualized as follows:
Relationship Between Electrophoresis Conditions and Band Appearance
Band smearing in protein gel electrophoresis represents a multifactorial challenge with origins in sample preparation, electrophoretic conditions, and detection methodologies. Within the broader context of protein research principles, addressing smearing artifacts is essential for generating reproducible, high-quality data that accurately reflects the protein composition of experimental samples.
This technical guide has established a systematic framework for diagnosing and resolving band smearing through integrated approaches addressing both prevention and troubleshooting. The implementation of optimized protocols—from sample handling through electrophoretic separation—ensures maximum resolution and band sharpness. As proteomic methodologies continue to advance with increased sensitivity and resolution demands, meticulous attention to the factors contributing to band smearing will remain fundamental to electrophoretic protein analysis.
The reagents, protocols, and troubleshooting strategies outlined herein provide researchers with a comprehensive toolkit for maintaining electrophoretic data quality. Through consistent application of these principles, scientists can minimize analytical artifacts and enhance the reliability of protein separation data in both basic research and drug development applications.
Protein gel electrophoresis is a foundational technique in molecular biology and biochemistry, enabling the separation of complex protein mixtures based on their physicochemical properties. The core principle of this research methodology centers on achieving optimal band resolution—the clear separation of individual protein species into distinct, sharp bands. This resolution is paramount for accurate protein analysis, identification, and quantification, which in turn drives progress in fields ranging from basic biological research to targeted drug development [57].
The pursuit of superior band resolution hinges on two critical, interdependent factors: the selection of an appropriate gel matrix, which creates a molecular sieve, and the precise control of electrical run parameters. The gel percentage, determined by the concentration of polyacrylamide, defines the pore size of the matrix. This pore size must be strategically matched to the molecular weights of the target proteins to achieve effective separation [58]. Simultaneously, the applied voltage, current, and run duration govern the electrophoretic mobility of proteins through this matrix. An imbalance in either factor can lead to diffuse bands, poor separation, or artifacts that compromise data integrity. This guide provides a detailed framework for researchers to systematically optimize these parameters, thereby enhancing the reliability and quality of their electrophoretic data.
Core Concepts: Gel Percentage and Run Parameters
The Strategic Selection of Gel Percentage
The polyacrylamide gel acts as a molecular sieve. Its pore size, controlled by the total acrylamide percentage (%T), determines the size range of proteins that can be effectively separated. A lower percentage gel (e.g., 8-12%) features larger pores, ideal for resolving high molecular weight proteins. Conversely, a higher percentage gel (e.g., 15-18%) has smaller pores, providing better separation for low molecular weight proteins.
Table 1: Guide to Gel Percentage Selection Based on Protein Molecular Weight
| Target Protein Size Range (kDa) | Recommended Gel Percentage | Remarks and Common Applications |
|---|---|---|
| >100 kDa | 6% - 10% | Optimal for large proteins; provides large pore size for easy migration. |
| 50 - 100 kDa | 10% - 12% | A standard range for many proteins; offers a balance of resolution and separation speed. |
| 30 - 70 kDa | 12% - 13% | A very common choice for general laboratory protein analysis. |
| 15 - 45 kDa | 13% - 15% | Provides higher resolution for mid-to-low range proteins. |
| 10 - 30 kDa | 15% - 18% | Ideal for low molecular weight proteins, peptides, and protein fragments. |
| <10 kDa | 18% - 20% (or Tricine Gels) | Essential for resolving small peptides; Tricine gels offer superior resolution in this range [59]. |
Beyond single-percentage gels, gradient gels (e.g., 4-20%) offer a powerful alternative. In these gels, the pore size decreases from the top to the bottom. Proteins stack in the larger pores and then resolve progressively as they encounter smaller pores, sharpening the bands and allowing a much broader size range of proteins to be resolved on a single gel [60].
Optimizing Electrical Run Parameters
The electrical parameters control the force and dynamics of protein migration. The key is to apply conditions that drive proteins through the gel efficiently without generating excessive heat, which can cause protein denaturation, diffusion (leading to smeared bands), or even gel damage.
- Voltage and Staging: A common strategy is to use a staged voltage protocol. A lower voltage (e.g., 80-120 V) is applied initially as proteins move through the stacking gel, promoting tight band formation. Once proteins enter the resolving gel, the voltage can be increased (e.g., 150-200 V) to complete the run in a shorter time while maintaining resolution. Recent methodologies have successfully employed a three-stage protocol (120 V for 15 min, 150 V for 15 min, 200 V for 15 min) for rapid and high-resolution separation of immunocomplexes [60].
- Current and Power: For consistent results, especially with gels of different thicknesses or multiple gels run in the same tank, it is often preferable to run at a constant current. This prevents a progressive increase in voltage and heat generation as the ionic strength of the buffer changes. Running two gels instead of one at the same voltage will double the current, increasing heat production and potentially affecting band patterns [59].
- Buffer Systems: The choice of running buffer is integral to the gel chemistry. Using the incorrect SDS-running buffer for a specific gel type can lead to poor resolution and aberrant migration.
Table 2: Compatibility of Gel Types with Running Buffers and Run Modes
| Gel Type | Compatible Native Running Buffer | Compatible Denaturing (SDS) Running Buffer | Can be run under native conditions? |
|---|---|---|---|
| Novex Tris-Glycine Gels | Novex Tris-Glycine Native Buffer | Novex Tris-Glycine SDS Running Buffer | Yes |
| NuPAGE Bis-Tris Gels | Not Recommended | NuPAGE MOPS-SDS or MES-SDS Running Buffer | No [59] |
| NuPAGE Tris-Acetate Gels | Novex Tris-Glycine Native Buffer | NuPAGE Tris-Acetate SDS Running Buffer | Yes |
| Bolt Bis-Tris Plus Gels | Not Recommended | Bolt MOPS SDS or MES SDS Running Buffer | No [59] |
| Precise Tris-HEPES Gels | Tris-HEPES SDS Running Buffer | Tris-HEPES SDS Running Buffer | No [59] |
Diagram 1: A logical workflow for optimizing band resolution, from initial sample preparation to final analysis.
Advanced Optimization: Experimental Protocols and Techniques
Detailed Protocol: Fluorescence-Based Immuno-PAGE for Protein Quantification
This advanced protocol, adapted from recent research, combines the specificity of immunodetection with the separation power of PAGE and online fluorescence imaging to achieve highly sensitive and quantitative analysis of target proteins within 1.5 hours [60].
Formation of Immunocomplexes:
- In separate microcentrifuge tubes, combine a fixed volume of fluorescently labeled antibody (e.g., 1 µL of 0.6 mg/mL anti-TRF IgG-FITC) with a series of known concentrations of the target antigen (e.g., human transferrin, TRF, ranging from 0 to 500 mg/L).
- Adjust the final volume to 100 µL with PBS.
- Incubate the tubes on a shaking mixer (e.g.,魔方程序混匀器, vibration mode 6) at room temperature for 30 minutes to allow antigen-antibody binding.
Cross-linking of Immunocomplexes:
- To stabilize the non-covalent antigen-antibody complexes during electrophoresis, add formaldehyde to a final concentration of 1%.
- Immediately after, add Tris to a final concentration of 20 mmol/L to quench any unreacted formaldehyde.
Sample Preparation for SDS-PAGE:
- Mix the cross-linked immunocomplex samples with an equal volume of SDS-PAGE loading buffer (containing Tris-HCl, SDS, glycerol, and bromophenol blue).
- Heat the samples at 95°C for 5 minutes to denature the proteins.
Electrophoresis and Online Fluorescence Imaging:
- Load the prepared samples (10 µL per well) onto a suitable precast PAGE gel (e.g., a 4%-20% gradient gel).
- Perform electrophoresis using a staged voltage protocol in TGS running buffer:
- 120 V constant voltage for 15 minutes.
- 150 V constant voltage for 15 minutes.
- 200 V constant voltage for 15 minutes.
- Use a gel documentation system with a fluorescence imaging capability. Capture images in real-time or immediately after the run using parameters such as an exposure time of 3000 ms and a gain of 15.
Image Analysis and Quantification:
- Analyze the fluorescence gel images using software like ImageJ.
- Subtract the background signal captured from a pre-run gel.
- The key principle is that the fluorescence signal intensity of the free antibody band is inversely proportional to the concentration of the target antigen. Measure the integrated density of the free antibody bands for the standard samples.
- Generate a standard curve by plotting the known antigen concentrations against the corresponding free antibody fluorescence intensities. Use this curve to quantify the target protein in unknown samples.
The Scientist's Toolkit: Essential Reagents and Materials
Table 3: Key Research Reagent Solutions for Optimized Protein Electrophoresis
| Reagent/Material | Function and Importance in Optimization |
|---|---|
| Precast Gels (e.g., Tris-Glycine, Bis-Tris) | Offer consistency, convenience, and predefined separation ranges. Different chemistries (Bis-Tris) provide superior stability and sharper bands compared to traditional Tris-Glycine gels [59]. |
| MOPS/MES SDS Running Buffers | Specialized buffers for Bis-Tris gel systems. They provide an optimal pH environment to prevent polyacrylamide gel breakdown during electrophoresis, minimizing gel artifacts and background. |
| Tris(2-carboxyethyl)phosphine (TCEP) | A potent, odorless, and stable reducing agent alternative to β-mercaptoethanol or DTT. It is highly effective at breaking disulfide bonds of 'difficult' proteins and is compatible with various gel systems. Use at a final concentration of up to 20 mM without the need for heating [59]. |
| Fluorophore-Labeled Antibodies | Enable highly sensitive, direct detection of target proteins without the need for secondary antibodies or chemiluminescence, facilitating rapid quantification as in Protocol 3.1 [60]. |
| Photoclick Hydrogel (e.g., MAP-mPyTC) | An advanced, light-activated gel matrix for novel techniques like single-cell immunoblotting. It offers high protein fixation efficiency (93.8%) and low background noise, revolutionizing the analysis of low-abundance proteins [61]. |
| Gel Documentation System with Fluorescence | Essential for capturing high-resolution images of fluorescent or stained protein bands. Modern systems with high-sensitivity CCD cameras and AI-driven software are critical for accurate quantification and analysis [62]. |
Diagram 2: The workflow for the fluorescence-based immuno-PAGE quantification protocol.
Troubleshooting Common Band Resolution Issues
Even with careful planning, issues with band shape and resolution can occur. The table below outlines common problems, their potential causes, and targeted solutions.
Table 4: Troubleshooting Guide for Poor Band Resolution
| Problem Observed | Potential Causes | Recommended Solutions |
|---|---|---|
| Smeared Bands | - Excessive heat generation during run.- Protein overload in the well.- Sample precipitated or contaminated with DNA. | - Run at a lower voltage/constant current; ensure cooling.- Load less protein; check sample concentration.- Centrifuge sample before loading; add DNase. |
| Diffuse or Fuzzy Bands | - Gel percentage inappropriate for protein size.- Acrylamide:bis-acrylamide ratio not optimal.- Running time too long or too short. | - Consult Table 1 to select a more suitable gel percentage.- Use fresh, high-quality reagents with standard ratios (e.g., 37.5:1).- Optimize run time; stop before the dye front runs off. |
| Bands Too Close Together | - Gel percentage not optimal for distinguishing similar-sized proteins.- Insufficient separation time. | - Use a higher percentage gel for smaller proteins or a gradient gel.- Increase the run time or voltage in the resolving phase. |
| Vertical Streaks | - Incomplete protein solubilization or denaturation.- Presence of non-ionic detergents (e.g., NP-40) interfering with SDS binding. | - Ensure sample is heated properly and contains sufficient SDS and reducing agent.- Keep the ratio of SDS to other detergents/lipids at 10:1 or greater [59]. |
| Abnormal Band Migration | - Incorrect running buffer for the gel type.- Poor contact between stacking and resolving gel. | - Verify buffer compatibility using Table 2.- Use fresh, properly cast or commercial precast gels. |
| No Bands or Very Weak Bands | - Insufficient protein loaded.- Protein degradation by proteases.- Inefficient transfer or detection (for WB). | - Increase loading amount; check staining/detection methods.- Include protease inhibitors during sample preparation [58].- Optimize transfer/detection protocol; use positive controls. |
The optimization of protein gel electrophoresis is a deliberate and systematic process grounded in the fundamental principles of protein chemistry and physics. Achieving publication-quality band resolution is not a matter of chance but is the direct result of strategic gel selection, precise control of electrical parameters, and meticulous attention to experimental detail. As the field advances, the integration of novel materials like photoresponsive hydrogels [61] and sophisticated detection systems [60] [62] will continue to push the boundaries of sensitivity and quantification. By adhering to the guidelines and protocols outlined in this technical review, researchers and drug development professionals can ensure their electrophoretic data is robust, reproducible, and capable of supporting the highest levels of scientific inquiry.
Protein gel electrophoresis is a foundational technique in biochemical research, enabling the separation of protein mixtures based on their physicochemical properties. The core principle involves transporting charged protein molecules through a gel matrix under the influence of an electrical field [1]. In sodium dodecyl sulfate-polyacrylamide gel electrophoresis (SDS-PAGE), the most common form, proteins are denatured and coated with a negative charge, causing them to separate primarily by molecular mass as they migrate toward the positive electrode [1] [6]. The successful visualization of these separated proteins as distinct bands is critical for analyzing protein purity, composition, and expression [6].
The absence or faint appearance of these bands represents a significant failure in the experimental process, directly impacting data interpretation and project progression in research and drug development. This guide addresses the primary causes of this issue—staining inefficiencies, insufficient sample load, and buffer integrity failures—providing a systematic troubleshooting framework to restore data quality and ensure experimental reproducibility.
Fundamental Principles of Protein Gel Electrophoresis
A proper understanding of the separation and detection process is essential for effective troubleshooting.
Separation Mechanisms and Visualization
- SDS-PAGE: The ionic detergent SDS denatures proteins and binds to them in a constant weight ratio, conferring a uniform negative charge. This causes proteins to migrate through the polyacrylamide gel based almost exclusively on polypeptide size [1] [6]. The gel acts as a molecular sieve, with smaller proteins migrating faster than larger ones [1].
- Detection Principle: Once separated, proteins must be fixed within the gel and then visualized. Stains like Coomassie Brilliant Blue or silver stain bind to proteins, creating visible bands against a clear or contrasting background [63] [6]. The intensity of the staining is generally proportional to the amount of protein present, allowing for semi-quantitative analysis.
The Critical Workflow
The following diagram illustrates the core operational workflow in protein gel electrophoresis, from sample preparation to final analysis. Failures at any stage can lead to faint or absent bands.
Systematic Troubleshooting: Faint or Absent Bands
When bands are faint or absent, the problem typically lies in one of three areas: the staining process, the sample itself, or the electrophoresis conditions. The following table provides a structured overview of the primary causes and their respective solutions.
Table 1: Comprehensive Troubleshooting Guide for Faint or Absent Bands
| Problem Category | Specific Cause | Recommended Solution | Supporting Protocol/Note |
|---|---|---|---|
| Staining Issues | Insufficient staining sensitivity or time [63] | Increase stain concentration or duration; for thick/high-% gels, allow longer staining for penetration [63]. | For colloidal Coomassie, ensure stain is well-mixed to distribute colloids [63]. |
| SDS interference [63] | Wash gel extensively with large volumes of water or destain with 25% isopropanol/10% acetic acid before staining to remove excess SDS [63]. | SDS can act as an anti-colloidal agent, causing high background and poor staining [63]. | |
| Over-destaining | Stop destaining process earlier; background can be reduced by incubating in 25% methanol, but this also destains bands [63]. | ||
| Low pH of staining solution (e.g., due to TCA) [63] | For gels fixed with TCA, rinse extensively in large water volumes (e.g., 1 hour to overnight) to raise pH before staining [63]. | Low pH causes stain aggregation and poor binding. | |
| Sample & Load Issues | Insufficient protein amount loaded [63] | Load more total protein; use a purified protein of known concentration as a positive control [63]. | For Coomassie, typical detection limit is 10-100 ng/protein band. |
| No protein present in sample [63] | Verify protein concentration of the sample before loading [63]. | A common oversight is inaccurate protein quantification. | |
| Sample leaked from well before running | Start electrophoresis immediately after loading samples to prevent diffusion [64]. | Minimize time between loading first sample and applying voltage. | |
| Protein degradation by proteases | Keep samples on ice during preparation; include protease inhibitors in lysis buffers [51]. | Degraded protein appears as a smear, not distinct bands. | |
| Gel & Buffer Issues | Gel over-run (proteins ran off gel) [64] | Stop electrophoresis when the dye front reaches the bottom of the gel; optimize run time for low molecular weight proteins [64]. | Confirm by checking if protein ladder has also run off. |
| Improper buffer preparation or depletion [64] | Remake running buffer with correct salt concentration and pH to ensure proper current flow [64]. | Ions in the buffer are essential for conducting current. | |
| Incorrect electrode connection | Ensure electrodes are correctly connected; wells (cathode, negative) should be on the same side as the black electrode [55]. | Reversed polarity will cause proteins to migrate in the wrong direction. |
Deep Dive: Staining Protocols and Optimization
The staining process is a common failure point. The protocols below should be followed meticulously.
Coomassie Brilliant Blue Staining Protocol
- Fixation: After electrophoresis, immerse the gel in a fixative solution (e.g., 40% methanol, 10% acetic acid) for 30 minutes to 1 hour. This precipitates proteins in the gel.
- Staining: Replace the fixative with Coomassie staining solution (e.g., 0.1% Coomassie Brilliant Blue R-250, 40% methanol, 10% acetic acid). Incubate with gentle agitation for at least 1 hour; for better sensitivity, stain overnight [6].
- Destaining: Replace the stain with a destaining solution (e.g., 40% methanol, 10% acetic acid, or 10% acetic acid alone). Agitate until the background is clear and protein bands are sharply visible. Using a destaining aid (e.g., a paper towel or sponge in the solution) can accelerate the process by absorbing free dye.
- Storage: Store the destained gel in 1-5% acetic acid or in water for imaging.
Troubleshooting Staining Artifacts:
- High Background: This is often due to incomplete removal of SDS [63]. Remedy by washing the gel more extensively before staining or including a destaining step with 25% isopropanol/10% acetic acid. Background is also typically higher in low-percentage acrylamide gels due to trapping of stain colloids in the larger pores [63].
- Precipitate in Stain: For colloidal Coomassie stains, the blue "chunks" are normal colloids. Shake the bottle well before use to evenly distribute them [63].
Silver Staining Protocol (High Sensitivity)
Silver staining is more complex but can detect 1-5 ng of protein, making it suitable for low-abundance samples [63].
- Fixation: Fix proteins in the gel (e.g., with 50% methanol, 5% acetic acid).
- Sensitization: Treat with a sensitizer like sodium thiosulfate to enhance staining.
- Staining: Impregnate the gel with silver nitrate solution.
- Development: Add a developer (e.g., sodium carbonate/formaldehyde) until bands reach desired intensity. This step is critical; overdevelopment leads to high background [63].
- Stopping: Halt the reaction by transferring the gel to a stop solution (e.g., 5% acetic acid) [63].
Critical Note for Silver Staining: Use only high-purity water (>18 MΩ·cm resistance) and clean, dedicated trays to prevent contamination, which manifests as specks or high background [63].
The Scientist's Toolkit: Essential Reagents and Materials
Table 2: Key Research Reagent Solutions for Protein Gel Electrophoresis
| Item | Function | Key Considerations |
|---|---|---|
| Polyacrylamide Gel | Matrix for sieving and separating proteins based on size [1]. | Pore size is inversely related to % concentration. Use lower % (e.g., 8%) for large proteins and higher % (e.g., 15%) for small proteins [1]. |
| SDS (Sodium Dodecyl Sulfate) | Denatures proteins and confers a uniform negative charge, enabling separation by mass [1] [6]. | Must be used in excess relative to protein (binding ratio is ~1.4g SDS:1g protein) [1]. |
| Molecular Weight Markers | Reference proteins of known size for estimating sample protein mass [1]. | Essential for every run to confirm gel performance and calibrate size. |
| Coomassie Stain | Reagent that binds proteins, creating visible blue bands [6]. | Detects ~10-100 ng of protein per band. Colloidal versions offer lower background [63]. |
| Silver Stain | Ultra-sensitive reagent for detecting low ng amounts of protein [63] [6]. | Prone to background and contamination; requires meticulous technique [63]. |
| Tris-Glycine Buffer | A common discontinuous buffer system for SDS-PAGE [1] [6]. | Maintains optimal pH and conducts current. Incorrect preparation is a major cause of run failure [64]. |
| APS & TEMED | Ammonium persulfate (APS) and TEMED catalyze the polymerization of acrylamide to form the gel [1]. | Degraded APS will result in gels that do not polymerize properly. |
Advanced Technical Considerations
For researchers facing persistent issues, consider these advanced factors.
Buffer Systems and Electrophoresis Conditions
The choice of buffer system can impact resolution and sensitivity. While Tris-glycine is the most common, other systems like Bis-Tris offer advantages for specific applications, such as greater stability and better performance for mass spectrometry or post-translational modification analysis [6]. The pH of the running buffer is critical; an incorrect pH can alter protein charge and migration, and compromise the staining process [64].
Optimizing the Entire Workflow
The following decision tree provides a logical pathway to diagnose and resolve the problem of faint or absent bands, integrating the concepts discussed.
Resolving the issue of faint or absent bands in protein gel electrophoresis demands a systematic approach that scrutinizes each step of the process. As detailed in this guide, the solution often lies in optimizing the staining protocol, verifying sample concentration and integrity, and ensuring the electrophoresis buffers and conditions are correct. Mastery of these troubleshooting principles is not merely about fixing a failed experiment; it is about reinforcing the foundational reliability of protein research. By applying this structured diagnostic framework, researchers and drug development professionals can efficiently identify failures, restore data quality, and uphold the rigorous standards required for impactful scientific discovery.
Protein gel electrophoresis is a fundamental cornerstone of molecular biology and proteomics, enabling the separation of complex protein mixtures based on their physicochemical properties. At its core, this technique relies on the movement of charged protein molecules through a porous gel matrix under the influence of an electrical field [1]. The mobility of a protein through this matrix is governed by several factors including field strength, net charge, size, shape, and the properties of the gel itself [1]. This principle forms the foundation for analyzing protein samples across diverse applications, from basic research to drug development and clinical diagnostics.
The global electrophoresis market, valued at an estimated USD 3.43 billion in 2025, reflects the technique's indispensable role, with protein analysis being a leading application [65] [66]. Within this framework, two advanced optimization strategies—gradient gels and antioxidant additives—have emerged as powerful tools to enhance resolution, preserve protein integrity, and yield more reliable and reproducible data. This guide details the principles and protocols for implementing these optimizations, framed within the context of advancing protein electrophoresis research.
The Principle and Optimization of Gradient Gels
Theoretical Foundation of Pore Gradient Gels
Pore gradient gel electrophoresis (PGGE) employs a polyacrylamide gel with a continuously varying concentration of acrylamide, typically from a low percentage at the top to a high percentage at the bottom [67]. This creates a corresponding pore size gradient, with larger pores at the top and progressively smaller pores toward the bottom. Unlike fixed-concentration gels, which act as a simple molecular sieve with uniform pore size, a gradient gel provides a multi-faceted sieving environment.
As proteins migrate through the gradient, they encounter progressively smaller pores. A protein's leading edge enters a region with smaller pores first and thus begins to slow down before its trailing edge. This phenomenon causes the protein band to "stack" upon itself, resulting in significantly sharper and better-resolved bands compared to fixed-concentration gels [67]. Furthermore, the gradient can separate a much broader range of protein molecular weights on a single gel, as the low-percentage region resolves high molecular weight (HMW) proteins while the high-percentage region resolves low molecular weight proteins [1] [67].
Practical Applications and Selection Guidelines
The decision to use a gradient gel is driven by specific experimental needs. Key applications and corresponding gradient selections are summarized in the table below.
Table 1: Guidelines for Selecting Polyacrylamide Gradient Gels Based on Experimental Needs
| Range of Protein Sizes | Recommended Gradient | Primary Application |
|---|---|---|
| 4 - 250 kDa | 4% to 20% | Discovery proteomics; analyzing complex, unknown samples [67]. |
| 10 - 100 kDa | 8% to 15% | Targeted analysis of a broad, but defined, weight range [67]. |
| 50 - 75 kDa | 10% to 12.5% | Resolving proteins of very similar molecular weights [67]. |
| > 200 kDa | 3% to 8% | Optimal separation and transfer of high molecular weight proteins [68]. |
Beyond acrylamide percentage, the choice of buffering system is critical for optimization. For instance, the NuPAGE Tris-Acetate system, which operates at a neutral pH (7.0-8.1), is specifically designed for HMW proteins (>100 kDa). It offers superior resolution and sharper bands compared to traditional Tris-Glycine systems by minimizing protein modification and aggregation, and it facilitates more efficient transfer to membranes for western blotting [68].
Protocol: Preparing and Running a Gradient Gel
Method 1: Using a Gradient Maker (for highest reproducibility)
- Materials: Two-chamber gradient maker, peristaltic pump, gel casting stand, acrylamide solutions of low and high concentration, ammonium persulfate (APS), TEMED.
- Procedure:
- Place the gel cassette in the casting stand.
- Connect the outlet of the gradient maker to the cassette, with a peristaltic pump tubing in line to control flow rate.
- Add the low-concentration acrylamide solution (e.g., 4%) to the chamber that is connected to the outlet.
- Add the high-concentration acrylamide solution (e.g., 20%) to the other chamber. Ensure the connecting channel between chambers is closed.
- Add APS and TEMED to both solutions immediately before pouring to initiate polymerization.
- Open the connecting channel and start the peristaltic pump. The high-concentration solution will mix progressively with the low-concentration solution as it is pumped into the cassette, creating a smooth, linear gradient from top to bottom [69].
- Carefully overlay the gel with isopropanol or water to ensure a flat surface.
- Once polymerized, the gel is ready for use.
Method 2: Sequential Pipetting with an Air Bubble (a rapid alternative)
- Materials: Serological pipette (5 or 10 mL), two separate tubes of low and high concentration acrylamide solutions with APS and TEMED added.
- Procedure:
- Using a serological pipette, aspirate half of the total gel volume needed from the low-concentration solution.
- Without expelling anything, aspirate the second half of the volume from the high-concentration solution. The two solutions will be separated in the pipette.
- Aspirate a small air bubble (~0.5 mL) and slowly move it up and down the pipette to mix the two solutions and create a gradient.
- Slowly dispense the entire contents into the gel cassette [67].
- Overlay and allow to polymerize.
The Role and Implementation of Antioxidant Additives
The Problem of Protein Oxidation during Electrophoresis
During electrophoresis, especially under denaturing conditions, proteins are vulnerable to oxidative damage. This can occur due to the generation of reactive oxygen species in the buffer system or from metal ions. Oxidation can lead to artificial band patterns, including smearing, multiple bands from a single protein species (due to modifications that alter mobility), and a general loss of resolution and signal intensity [68]. This is a critical concern for researchers studying proteins with sensitive cysteine residues or for downstream applications like mass spectrometry, where modifications complicate analysis.
Antioxidant Solutions and Mechanisms
To combat this, antioxidant additives are included in the sample preparation and/or running buffer. A prime example is the Invitrogen NuPAGE Antioxidant, which is added to the running buffer of Tris-Acetate gels. Its primary function is to scavenge free radicals and reactive oxygen species, thereby minimizing oxidative damage throughout the electrophoretic run [68]. The result is a dramatic improvement in band sharpness, particularly for reduced proteins, and a more accurate representation of the protein sample.
The benefits of antioxidants extend beyond just band clarity. Traditional Laemmli-style sample buffers can drop to a low pH (~5.2) when heated, which is known to induce cleavage at specific peptide bonds (Asp-Pro), leading to protein degradation. Modern sample buffers, like the NuPAGE LDS Sample Buffer, are formulated to maintain a pH >7.0 during heating, thereby preserving protein integrity by minimizing this acid-induced cleavage [68]. Using a system that combines a pH-buffered sample preparation with an antioxidant in the running buffer provides a comprehensive approach to maintaining sample integrity.
Protocol: Using Antioxidant Additives in SDS-PAGE
Materials:
- NuPAGE Tris-Acetate Running Buffer (or equivalent)
- NuPAGE Antioxidant
- Standard SDS-PAGE apparatus
Procedure:
- Prepare the running buffer according to the manufacturer's instructions.
- Add the antioxidant to the running buffer in the upper buffer chamber (cathode chamber) only. The typical recommended concentration is 0.5 mL of NuPAGE Antioxidant per 200 mL of running buffer [68]. Do not add antioxidant to the lower (anode) chamber.
- Proceed with standard sample loading and electrophoresis. The antioxidant will migrate into the gel with the leading ions, creating a protective, reducing environment for the proteins as they separate.
- For optimal results, ensure the protein samples are prepared in a compatible, pH-stable sample buffer like NuPAGE LDS Sample Buffer, which itself helps preserve protein integrity.
Integrated Workflow and Data Interpretation
To achieve the best results, gradient gels and antioxidant additives should be viewed as complementary components of an optimized workflow. The gradient gel provides the physical matrix for high-resolution separation across a broad size range, while the antioxidant preserves the chemical integrity of the proteins during the process.
Diagram: Integrated Workflow for Optimized Protein Electrophoresis
Expected Outcomes and Artifact Identification
The successful implementation of these optimizations yields distinct, quantifiable improvements in gel quality:
- Sharper Bands: The stacking effect of the gradient gel combined with the prevention of oxidative smearing results in crisp, tight bands [67].
- Improved Resolution of HMW Proteins: The Tris-Acetate gradient gel system demonstrates a clear advantage, as shown in comparative studies where a 3-8% gradient gel successfully transferred a large protein like BRCA2 (~384 kDa), while a traditional Tris-Glycine gel failed [68].
- Reduced Background and Smearing: The antioxidant minimizes charge heterogeneity caused by oxidation, leading to cleaner backgrounds and a more direct relationship between band intensity and protein abundance.
Table 2: Troubleshooting Common Issues with Gradient Gels and Antioxidants
| Problem | Potential Cause | Solution |
|---|---|---|
| Curved or wavy bands | Improperly formed gradient; polymerization too fast. | Ensure gradient maker is level; slightly reduce TEMED/APS to slow polymerization [69]. |
| Poor resolution of HMW proteins | Gel percentage too high; incorrect buffer system. | Switch to a lower-percentage gradient gel (e.g., 3-8%) and a Tris-Acetate buffer [68]. |
| Smearing in reduced samples | Protein oxidation during run. | Confirm antioxidant was added to the correct (upper) buffer chamber at the proper concentration [68]. |
| Vertical streaking | Protein aggregation or precipitation. | Ensure sample is properly denatured; use a fresh, pH-stable sample buffer [68]. |
The Scientist's Toolkit: Essential Reagents for Optimized Electrophoresis
Table 3: Key Research Reagent Solutions for Advanced Electrophoresis
| Reagent / Material | Function / Purpose | Example / Note |
|---|---|---|
| Gradient Gels | Provides a continuum of pore sizes to separate a wide range of protein masses and sharpen bands. | Available pre-cast (e.g., NuPAGE 3-8% Tris-Acetate) or can be poured in-lab [68] [67]. |
| Antioxidant Additive | Scavenges free radicals to minimize protein oxidation during electrophoresis, reducing smearing. | Added to the running buffer (e.g., NuPAGE Antioxidant) [68]. |
| Tris-Acetate Running Buffer | A neutral-pH buffer system optimized for the separation and transfer of high molecular weight proteins. | Superior to Tris-Glycine for proteins >100 kDa [68]. |
| LDS Sample Buffer | A pH-stable (pH >7.0) loading buffer that denatures proteins while minimizing acid-induced cleavage. | Preferable over traditional Laemmli buffer for preserving protein integrity [68]. |
| High-MW Protein Ladder | Provides accurate molecular weight standards for large proteins, essential for calibration. | Look for ladders with markers extending to 500 kDa or more [68]. |
The strategic integration of gradient gels and antioxidant additives represents a significant advancement in the core principle of protein gel electrophoresis—the high-fidelity separation of proteins based on their inherent properties. By leveraging the continuous sieving action of gradient gels and the protective chemical environment provided by antioxidants, researchers can achieve a level of resolution and reproducibility that is essential for modern proteomic research, quality control in biopharmaceutical development, and clinical diagnostics. As the electrophoresis market evolves toward greater automation and integration with AI-driven analysis [65] [70], these foundational optimization techniques will continue to be critical for generating high-quality, reliable data.
Beyond Standard Gels: Validating Results with Capillary Electrophoresis and Clinical Applications
Protein gel electrophoresis serves as a fundamental pillar in molecular biology and proteomics research, providing a robust method for separating complex protein mixtures based on their physicochemical properties. The core principle of this technique involves transporting charged protein molecules through a gel matrix under the influence of an electrical field, effectively acting as a molecular sieve [1]. Within this framework, method validation emerges as a critical component, ensuring the reliability, reproducibility, and accuracy of experimental data. Molecular weight markers and controls form the cornerstone of this validation process, transforming simple separation techniques into quantitatively analytical tools essential for drug development, diagnostic applications, and basic research.
The significance of proper method validation extends beyond simple band identification; it provides the foundational confidence for downstream analyses including western blotting, mass spectrometry, and functional protein characterization [1]. For researchers and drug development professionals, implementing rigorous controls demonstrates scientific diligence and generates data that meets regulatory standards, particularly when assessing protein purity, confirming identity, or determining expression levels in therapeutic target validation.
The Principle of Protein Separation by Gel Electrophoresis
Fundamental Mechanisms of Separation
Protein gel electrophoresis operates on the principle that charged molecules migrate through a porous matrix when subjected to an electrical field. The rate of migration depends on several factors including field strength, the molecule's net charge, size and shape, ionic strength, and the properties of the matrix such as viscosity and pore size [1]. Two primary support matrices are employed: agarose, with large pore sizes suitable for nucleic acids and large protein complexes, and polyacrylamide, with smaller pore sizes ideal for separating most proteins and smaller nucleic acids [1].
Several forms of polyacrylamide gel electrophoresis (PAGE) exist, each providing different information about proteins of interest. The most widely used variant is denaturing and reducing sodium dodecyl sulfate PAGE (SDS-PAGE) with a discontinuous buffer system, which separates proteins primarily by mass [1]. This is achieved through the ionic detergent SDS, which denatures proteins and binds to the polypeptide backbone in a constant weight ratio (approximately 1.4 g SDS per 1 g of polypeptide) [1]. This SDS binding confers a uniform negative charge to all proteins, effectively negating the influence of their intrinsic charges. Consequently, SDS-bound proteins migrate through the gel toward the positively charged anode at rates inversely proportional to their molecular mass, with smaller proteins moving faster through the gel matrix than larger ones [1].
In contrast, native-PAGE (or non-denaturing PAGE) separates proteins according to their mass/charge ratio while maintaining their native, folded structure [1]. This technique preserves protein function, including enzymatic activity, and maintains subunit interactions within multimeric proteins, providing information about quaternary structure [1]. For the most comprehensive separation, two-dimensional (2D) PAGE combines isoelectric focusing, which separates proteins by their native isoelectric point (pI) in the first dimension, with SDS-PAGE separation by mass in the second dimension [1].
The Gel Matrix: Polyacrylamide Formation and Properties
Polyacrylamide gels are created by polymerizing acrylamide monomers with bisacrylamide cross-linkers, typically using ammonium persulfate (APS) as the polymerizing agent and TEMED (N,N,N',N'-tetramethylenediamine) as a catalyst [1]. The resulting cross-linked polymer network forms a porous matrix whose properties critically determine separation efficiency.
The pore size of the gel, and thus its sieving properties, is governed by the ratio of bisacrylamide to acrylamide and the total concentration of both components [1]. The polyacrylamide percentage is inversely related to pore size; for example, a 7% gel has larger pores than a 12% gel [1]. This relationship informs gel selection: low-percentage gels resolve large proteins, while high-percentage gels resolve small proteins. Gradient gels, which feature a low percentage of polyacrylamide at the top and a high percentage at the bottom, enable separation of a broader range of protein sizes within a single gel [1].
To optimize protein resolution, a stacking gel with lower acrylamide concentration, lower pH, and different ionic content is typically cast over the main resolving gel. This configuration concentrates protein samples into tight bands before they enter the resolving portion of the gel, enhancing separation sharpness [1].
Molecular Weight Markers: Essential Tools for Method Validation
Definition and Purpose
Molecular weight markers, also referred to as protein ladders, size standards, or MW markers, consist of a set of standard proteins with pre-determined molecular masses [71]. These standards are run alongside experimental samples in adjacent gel lanes to provide a reference scale for estimating the size of unknown proteins [72]. The fundamental principle underlying their use is the inverse relationship between molecular weight and migration distance through the gel matrix [71]. When experimental conditions are properly controlled, this relationship provides a logarithmic scale by which researchers can interpolate the sizes of sample proteins [71].
The applications of molecular weight markers extend beyond simple size estimation. They serve as critical controls for monitoring electrophoresis progress, assessing transfer efficiency in western blotting, verifying protein migration, and sometimes acting as positive controls [71]. In method validation, they provide evidence that the electrophoretic separation has occurred as expected, confirming that the gel system is functioning properly and that run conditions are appropriate for the proteins of interest.
Types of Protein Molecular Weight Markers
Protein markers are available in several formulations, each with distinct characteristics and applications. Understanding these variations is essential for selecting the appropriate marker for specific experimental needs.
Table 1: Types of Protein Molecular Weight Markers and Their Applications
| Marker Type | Composition | Key Features | Primary Applications | Limitations |
|---|---|---|---|---|
| Unstained Markers | Natural or recombinant proteins | Accurate size determination; Require post-electrophoresis staining for visualization [71] | SDS-PAGE when precise molecular weight determination is critical [71] | Cannot be visualized during electrophoresis; Additional staining step required [71] |
| Prestained Markers | Proteins covalently bound to chromogenic or fluorescent dyes | Visible during electrophoresis; Monitor run progress and transfer efficiency [71] | Western blotting; Tracking electrophoresis progress [71] | Less accurate size determination due to dye effects on mobility [71] |
| Recombinant Markers | Engineered proteins with uniform properties | Uniform staining; Evenly spaced bands; May include affinity tags [71] | High-precision applications; Quantitative work | Higher cost than natural markers |
| Natural Markers | Mixture of naturally occurring proteins | Lower cost; Well-characterized mobility | Routine SDS-PAGE; Educational settings | May bind stains variably; Less uniform band intensities [71] |
| Biotinylated Markers | Proteins conjugated with biotin | Detectable with streptavidin-HRP; High sensitivity detection [71] | Specialized detection methods; Low-abundance proteins | Require specific detection system |
An important distinction exists between molecular weight markers and protein ladders. Molecular weight markers typically consist of native proteins with well-characterized but not necessarily whole-number molecular weights, providing approximate size estimates [71]. In contrast, protein ladders are composed of highly purified proteins (usually 10-12 proteins) with known molecular weights corresponding to whole numbers, enabling more precise size determination [71]. In some validation protocols, both types are run together for additional confirmation [71].
Experimental Protocol: Incorporating Markers and Controls
SDS-PAGE Procedure with Molecular Weight Markers
The following detailed protocol ensures proper integration of molecular weight markers for validated protein separation by SDS-PAGE, adapted from standard laboratory practices [5]:
Step 1: Gel Preparation
- Assemble gel casting apparatus using clean glass plates and spacers [5].
- Prepare resolving gel solution according to required percentage (e.g., 10-12% for most proteins). A typical 10% Tris-glycine mini gel recipe includes: 7.5 mL 40% acrylamide, 3.9 mL 1% bisacrylamide, 7.5 mL 1.5 M Tris-HCl (pH 8.7), water to 30 mL, 0.3 mL 10% APS, 0.3 mL 10% SDS, and 0.03 mL TEMED [1].
- Pour resolving gel between plates, overlay with water or butanol to prevent oxygen inhibition of polymerization, and allow to polymerize for 20-30 minutes [5].
- Prepare stacking gel (typically 4-5% acrylamide) with lower pH (e.g., pH 6.8) and pour over polymerized resolving gel. Insert appropriate comb (e.g., 8-lane comb for 7 samples plus marker lane) and allow to polymerize [5].
Step 2: Sample Preparation
- Mix protein samples with SDS-PAGE sample buffer (typically containing SDS, glycerol, bromophenol blue tracking dye, and reducing agent like β-mercaptoethanol or DTT) [5].
- Heat samples at 70-100°C for 3-5 minutes to denature proteins [1] [5].
- Centrifuge at 15,000 rpm for 1 minute to pellet insoluble material [5].
Step 3: Gel Electrophoresis
- Mount gel cassette in electrophoresis apparatus and fill buffer chambers with running buffer (e.g., Tris-glycine buffer with SDS) [5].
- Load molecular weight marker (5-10 µL typically) in first or last lane and experimental samples in adjacent lanes [5]. Ensure at least one lane contains marker for every gel.
- Apply constant voltage (typically 100-150V for mini-gels) until tracking dye reaches bottom of gel [5].
Step 4: Post-Electrophoresis Analysis
- Disassemble apparatus and remove gel from plates [5].
- If using unstained markers, stain gel with Coomassie Brilliant Blue, silver stain, or other appropriate protein stain [6].
- Destain and image gel for analysis.
- Calculate molecular weights of unknown proteins by comparing their migration distances to the standard curve generated from the marker lane [71].
Method Validation Controls
Beyond molecular weight markers, comprehensive method validation includes additional controls:
- Positive Controls: Samples with known expression of the target protein confirm that detection methods are working properly.
- Negative Controls: Samples lacking the target protein (e.g., knockout cell lines, empty vector transfections) verify antibody specificity in western blotting.
- Loading Controls: Housekeeping proteins (e.g., actin, tubulin, GAPDH) demonstrate equal protein loading across samples.
- Background Controls: Include samples without primary antibody in immunodetection methods to assess non-specific binding.
The Researcher's Toolkit: Essential Reagents for Gel Electrophoresis
Table 2: Essential Research Reagent Solutions for Protein Gel Electrophoresis
| Reagent/Category | Function/Description | Examples/Formats |
|---|---|---|
| Gel Matrices | Forms porous sieve for separation; Polyacrylamide for most proteins; Agarose for large complexes [1] | Handcast gels; Precast gels (consistent, convenient, avoid neurotoxic acrylamide) [6] |
| Denaturing Agents | Unfolds proteins; masks intrinsic charge; enables separation by size alone [1] | SDS (sodium dodecyl sulfate); Reducing agents (DTT, β-mercaptoethanol) cleave disulfide bonds [1] |
| Buffer Systems | Establish pH; provide ions for conductivity; affect protein mobility and SDS binding [71] | Tris-glycine (Laemmli system); Bis-Tris (greater sensitivity, lower pH stability); Tris-acetate (larger proteins) [6] |
| Molecular Weight Markers | Size reference standards for unknown proteins; quality controls [71] | Unstained (accurate size); Prestained (track migration/transfer); Recombinant (uniform); Biotinylated (sensitive detection) [71] |
| Tracking Dyes | Monitor electrophoresis progress; migrate ahead of proteins [6] | Bromophenol Blue (migrates at ~5 kDa front) [6] |
| Staining Solutions | Visualize separated proteins; varying sensitivity levels [6] | Coomassie Brilliant Blue (general use); Silver stain (high sensitivity); Fluorescent dyes [6] |
Advanced Applications and Emerging Technologies
The field of gel electrophoresis continues to evolve, with several advanced applications and emerging technologies enhancing method validation capabilities. Two-dimensional electrophoresis (2D-PAGE), which separates proteins by native isoelectric point in the first dimension and by mass in the second, provides the highest resolution for protein analysis and remains an important technique in proteomic research [1]. The development of immobilized pH gradient (IPG) strips has significantly improved the reproducibility and ease of the first-dimension separation [1].
Recent advances include AI-powered gel image analysis systems such as GelGenie, which uses machine learning to automatically identify gel bands through segmentation, classifying pixels as 'band' or 'background' [7]. This approach eliminates the traditional workflow of digitally carving out lanes and bands before signal quantification, instead directly segmenting bands from images regardless of position or shape [7]. Such systems can accurately identify bands in sub-optimal conditions including warped bands, high background levels, and diffuse bands, providing a comprehensive and consistent approach for band identification [7].
For drug development professionals, these technological advances offer improved reproducibility and quantification in critical analyses such as assessing protein drug purity, characterizing biosimilars, and validating biomarkers. The integration of robust controls and markers with these emerging technologies strengthens the entire analytical pipeline from separation to quantification.
Molecular weight markers and controls transform simple protein separation into a validated analytical method essential for rigorous scientific research and drug development. Their proper selection and implementation underpin the reliability of protein characterization data, ensuring accurate molecular weight determination, confirming separation efficiency, and verifying transfer quality in downstream applications. As electrophoresis technologies evolve with AI-powered analysis and improved reproducibility, the fundamental role of appropriate standards and controls remains constant—providing the quality assurance necessary for generating trustworthy, reproducible scientific data. For researchers pursuing diagnostic applications, therapeutic development, or basic biological discovery, integrating comprehensive method validation with molecular weight markers represents not merely a technical step, but a fundamental commitment to scientific rigor.
Electrophoresis is a cornerstone technique in molecular biology and analytical chemistry, enabling the separation of macromolecules like DNA, RNA, and proteins based on their size, charge, or conformation. Within the context of protein gel electrophoresis research, the principle revolves around moving charged protein molecules through a solvent under an electrical field, typically using a gel matrix like polyacrylamide to act as a molecular sieve [1]. For decades, traditional gel electrophoresis has been the standard method. However, the evolution of capillary electrophoresis (CE) has introduced a powerful alternative that operates on similar fundamental principles but offers distinct operational advantages and limitations [73] [74]. This technical guide provides an in-depth comparative analysis of these two techniques, focusing on throughput, sensitivity, and cost, to inform researchers, scientists, and drug development professionals in their methodological selections.
Principles and Methodologies
The Principle of Protein Gel Electrophoresis
Protein gel electrophoresis, particularly SDS-PAGE (Sodium Dodecyl Sulfate Polyacrylamide Gel Electrophoresis), separates proteins primarily based on their molecular weight [1] [5]. The key principle involves denaturing proteins with SDS and a reducing agent. SDS binds to the protein backbone in a constant weight ratio, conferring a uniform negative charge that overwhelms the protein's intrinsic charge. Consequently, when an electric field is applied, all SDS-bound proteins migrate through the polyacrylamide gel matrix toward the positive anode, with smaller polypeptides moving faster through the pores than larger ones [1]. The polyacrylamide gel's concentration determines pore size; lower percentages are suitable for separating large proteins, while higher percentages provide better resolution for smaller proteins [1]. Techniques like native-PAGE, which separates proteins based on their native charge and size without denaturation, and two-dimensional PAGE, which separates proteins by isoelectric point and then by mass, offer additional layers of analytical power [1].
The Principle of Capillary Electrophoresis
Capillary Electrophoresis (CE) performs separations within a narrow-bore (typically 25-100 µm internal diameter) fused-silica capillary filled with an electrolyte buffer [75] [74]. The primary driving force is the application of a high-voltage electric field, which can be much stronger than in gel systems due to the efficient dissipation of Joule heat by the narrow capillary [73]. Separation can be based on the molecules' size-to-charge ratio in free solution, or by molecular sieving when the capillary is filled with a gel polymer matrix, a mode known as capillary gel electrophoresis (CGE) [73] [75]. A critical phenomenon in CE is electroosmotic flow (EOF), a bulk flow of the buffer solution caused by the electric field acting on the charged inner surface of the capillary. Molecules are detected in real-time as they pass a detector (e.g., UV, fluorescence) at the end of the capillary, producing an electropherogram with peaks representing separated analytes [74].
Comparative Performance Analysis
Throughput and Speed
Throughput encompasses not only the number of samples processed per unit time but also the hands-on labor required.
- Analysis Speed: Capillary electrophoresis separations are remarkably fast, typically completing in minutes due to the high voltages (up to 30 kV) that can be applied without overheating [73] [74]. In contrast, gel electrophoresis runs are measured in hours, excluding the additional time needed for gel casting, staining, and destaining [73] [76].
- Automation and Labor: CE systems are fully automatable, handling sample loading, separation, detection, and data output with minimal user intervention. This allows for continuous, unattended operation, including overnight runs [73] [74]. Gel electrophoresis is predominantly manual, requiring labor-intensive steps for gel preparation, sample loading, and post-processing, which limits throughput and introduces variability [74] [76].
- Multiplexing: A single slab gel can run dozens of samples in parallel (e.g., 96-well format), which is a distinct advantage for side-by-side comparison [73]. A single capillary can process only one sample at a time. However, commercial CE instruments are available with multicapillary arrays (e.g., 8 or 96 capillaries) to process samples in parallel, mitigating this disadvantage in high-throughput settings [73].
Sensitivity and Resolution
Sensitivity refers to the ability to detect low-abundance analytes, while resolution is the ability to distinguish between molecules with minor differences.
- Resolution: CE generally provides higher resolution than gel electrophoresis. The efficient heat dissipation in capillaries minimizes band broadening and allows for superior separation efficiency. CE can achieve single-nucleotide resolution for nucleic acids and can resolve protein variants, such as non-glycosylated species, that are difficult to distinguish with SDS-PAGE [73]. Gel resolution can be optimized by adjusting parameters like gel percentage and thickness but typically cannot match the peak capacity of CE [73].
- Sensitivity in Clinical Detection: For detecting monoclonal immunoglobulins (M proteins) in serum, a key clinical application, CE and gel electrophoresis show comparable performance. A comparative study found CE had a sensitivity of 76% and specificity of 92%, while gel electrophoresis had a sensitivity of 74% and specificity of 95% [77]. Another study reported a 73% sensitivity for gel and 76% for CE, with specificities of 95% and 92%, respectively, indicating similar diagnostic power [78].
- Sample Volume: CE requires very small sample volumes—in the nanoliter range. This is a significant advantage when sample material is precious or limited [75] [74]. Gel electrophoresis typically requires larger volumes, in the microliter range [74].
Table 1: Quantitative Comparison of Throughput and Sensitivity
| Performance Metric | Gel Electrophoresis | Capillary Electrophoresis |
|---|---|---|
| Typical Run Time | 1 to several hours [73] [74] | Minutes to <30 minutes [73] [74] |
| Automation Level | Mostly manual [74] [76] | Fully automatable [73] [76] |
| Sample Volume | Microliters (µL) [74] | Nanoliters (nL) [75] [74] |
| Resolution | Moderate [76] | High (e.g., single-nucleotide) [73] [76] |
| Sensitivity (M-protein detection) | 74% [77] | 76% [77] |
| Specificity (M-protein detection) | 95% [77] | 92% [77] |
| Inter-operator Agreement | High (80% complete agreement) [77] | Lower (67% complete agreement) [77] |
Cost Analysis
The cost analysis must consider both initial capital investment and long-term operational expenses.
- Instrument Cost: Gel electrophoresis systems have a low upfront cost, with basic setups ranging from $500 to $3,000 [65]. Capillary electrophoresis instruments represent a significantly higher capital investment. Prices vary by type and capability: genetic analyzers can range from $75,000 to $150,000 for new systems, fragment analyzers from $40,000 to $100,000, and protein analyzers from $5,000 to $25,000 [75].
- Consumables and Reagents: Gel electrophoresis consumables (e.g., precast gels, stains, buffers) are relatively inexpensive, contributing to its status as a low-cost technique for routine use [73]. CE consumables, such as proprietary capillary cartridges, specific buffer kits, and sample plates, represent a recurring operational cost. Laboratories can spend $2,000 to $10,000 annually on electrophoresis consumables, with CE-specific reagents often being more costly than standard gel reagents [65].
- Total Cost of Ownership: While CE has a higher initial price, its automation and speed can lead to significant savings in labor and time for high-volume laboratories, improving long-term cost-effectiveness [73]. Gel electrophoresis remains the most economically viable option for low-throughput, budget-conscious, or educational environments where hands-on training is also an objective [74].
Table 2: Cost and Operational Considerations
| Cost Factor | Gel Electrophoresis | Capillary Electrophoresis |
|---|---|---|
| Upfront Instrument Cost | $500 - $3,000 [65] | $5,000 - $150,000 (varies by type) [75] |
| Typical Annual Consumable Cost | Lower | $2,000 - $10,000+ [65] |
| Labor Intensity | High (manual) [74] | Low (automated) [73] |
| Data Quantification | Semi-quantitative (band intensity) [76] | Highly quantitative (peak area/height) [74] |
| Best Suited For | Low-budget labs, routine checks, education [74] | High-throughput labs, regulated environments (GMP) [65] |
Essential Research Reagent Solutions
The following table details key reagents and materials essential for conducting protein electrophoresis experiments, drawing from standard SDS-PAGE and CE methodologies [1] [5].
Table 3: Key Research Reagent Solutions for Protein Electrophoresis
| Reagent/Material | Function | Application in Gel Electrophoresis | Application in Capillary Electrophoresis |
|---|---|---|---|
| SDS (Sodium Dodecyl Sulfate) | Ionic detergent that denatures proteins and confers uniform negative charge. | Core component of SDS-PAGE sample buffer and running buffer [1] [5]. | Used in CE-SDS (capillary electrophoresis-SDS) methods for protein sizing [73] [75]. |
| Acrylamide/Bis-acrylamide | Monomer and cross-linker that polymerize to form a porous gel matrix. | Forms the polyacrylamide gel for SDS-PAGE and native-PAGE [1]. | Used as a sieving polymer matrix in capillary gel electrophoresis (CGE) [75]. |
| APS & TEMED | Ammonium persulfate (APS) and TEMED catalyze the polymerization of acrylamide. | Essential for gel casting [1] [5]. | Used in the preparation of polymer matrices for CGE. |
| Tris Buffers | Provide the required pH and ionic strength for the running environment. | Used in gel recipes (resolving/stacking gel) and running buffers (e.g., Tris-Glycine) [1]. | Common component of electrolyte and separation buffers in CE. |
| Reducing Agents (e.g., β-Mercaptoethanol, DTT) | Cleave disulfide bonds to fully denature proteins into individual subunits. | Added to SDS-PAGE sample buffer for complete denaturation [1]. | Added to CE-SDS sample buffer for protein subunit analysis. |
| Protein Stains (e.g., Coomassie, Fluorescent dyes) | Bind to proteins for visualization. | Used for post-run staining and destaining of slab gels [1]. | Not required, as detection is via in-line UV/fluorescence [73]. |
| Molecular Weight Markers | A mixture of proteins of known sizes for calibrating and estimating molecular weight. | Run alongside samples on a gel for size comparison [1]. | Included in CE runs as an internal or external standard for precise migration time calibration. |
Application Scenarios in Research and Development
The choice between gel and capillary electrophoresis is dictated by the specific application requirements. The following diagram illustrates the decision-making workflow for selecting the appropriate method based on key experimental parameters.
- Biopharmaceutical Quality Control (QC): The biopharma industry's demand for precise protein therapeutic analysis, including purity assessment and charge variant analysis of monoclonal antibodies, is a major driver for CE adoption. CE provides the quantitative data, reproducibility, and compliance (GMP, 21 CFR Part 11) required for regulatory filings [65]. While SDS-PAGE is still used for initial screening, CE-SDS and capillary isoelectric focusing (cIEF) are becoming standard for detailed characterization [73] [75].
- Clinical Diagnostics: In clinical serum protein analysis for conditions like multiple myeloma, both methods are analytically suitable. Gel electrophoresis offers high specificity (95%) and is a well-established, visual method [77] [78]. CE offers slightly higher sensitivity (76%) and the benefits of automation, which is crucial for high-volume clinical labs [77] [78].
- Academic and Discovery Research: Gel electrophoresis remains dominant for routine, qualitative checks due to its low cost and simplicity. Verifying protein expression, checking purity during purification, or initial characterization of PCR products are typical applications [74] [76]. CE is leveraged in academic settings for more demanding applications requiring high resolution and quantification, such as proteomic studies or characterization of recombinant proteins [73].
Gel electrophoresis and capillary electrophoresis are complementary, not mutually exclusive, technologies in the scientist's toolkit. Gel electrophoresis, with its low cost, simplicity, and visual output, remains an indispensable tool for routine protein analysis, educational purposes, and initial qualitative screening. Its principles form the foundational knowledge upon which more advanced techniques are built. Conversely, capillary electrophoresis offers superior resolution, speed, automation, and quantitative capabilities, making it the technique of choice for high-throughput environments, applications demanding high precision, and regulated industries like biopharmaceuticals.
The decision between the two must be guided by a clear assessment of the experimental needs: the required throughput, the necessity for quantification, available sample volume, budget constraints, and data regulatory requirements. As the field of proteomics and drug development continues to advance, the integration of CE into analytical workflows is likely to grow. However, the enduring utility and accessibility of gel electrophoresis ensure it will continue to be a fundamental pillar of protein gel electrophoresis research for the foreseeable future.
Serum protein electrophoresis (SPEP) remains a cornerstone laboratory technique for the diagnosis and monitoring of multiple myeloma, a malignant plasma cell disorder and the second most common blood cancer. This technical guide delineates the principle of protein separation by electrophoresis and its pivotal application in detecting monoclonal immunoglobulins (M-proteins) produced by neoplastic plasma cells. We provide a comprehensive analysis of SPEP methodologies, including detailed protocols, data interpretation frameworks, and a comparative evaluation of gel versus capillary systems. The content is contextualized within the broader thesis of protein gel electrophoresis research, highlighting its indispensable role in clinical proteomics and therapeutic drug monitoring for researchers and drug development professionals. Supported by structured data visualization and reagent toolkits, this review serves as a definitive resource for implementing robust electrophoretic assays in oncological research and clinical practice.
Multiple Myeloma (MM) is a clinically significant hematologic malignancy characterized by the uncontrolled proliferation of plasma cells in the bone marrow, resulting in the overproduction of a monoclonal immunoglobulin or free light chains, known as an M-protein or paraprotein [79] [80]. With an estimated 36,110 new diagnoses anticipated in the U.S. in 2025, MM represents a substantial area of focus for clinical researchers and diagnostic developers [79]. The principle of electrophoresis, first demonstrated by Arne Tiselius in 1937, exploits the net electrical charge of proteins to separate them in an electric field within a supporting medium [2]. In the context of MM, this technique enables the detection and quantification of the pathological M-protein, which serves as a critical diagnostic and monitoring biomarker.
The clinical utility of SPEP in myeloma management is multifaceted. It provides a non-invasive, relatively inexpensive, and rapid method for both initial screening and serial monitoring of disease burden [80] [81]. International guidelines, including those from the International Myeloma Working Group (IMWG) and the National Comprehensive Cancer Network (NCCN), recommend SPEP alongside immunofixation electrophoresis (IFE) and serum free light chain (sFLC) assays as essential components of the diagnostic and monitoring workflow for plasma cell dyscrasias [79] [82]. The technique separates serum proteins into five distinct fractions—albumin, alpha-1 globulin, alpha-2 globulin, beta globulin, and gamma globulin—based on their charge, size, and shape when subjected to an electrical current [83] [84]. The presence of an M-protein is indicated by a characteristic sharp, narrow band or "peak" most frequently observed in the gamma region, although IgA proteins may migrate to the beta or alpha-2 regions [85] [84].
Fundamental Principles of Protein Gel Electrophoresis
The underlying principle of protein electrophoresis involves the differential migration of charged molecules through a stabilizing medium under the influence of an electric field. The rate of migration, or electrophoretic mobility (μ), of a protein is determined by the relationship μ = Q/kr, where Q represents the net charge of the protein, r is its molecular radius, and k is a constant related to the buffer conditions [1] [2]. Several key factors govern this mobility and are critical for method optimization in research settings.
- Net Charge and Size: The net charge of a protein is dependent on the ionizable groups on its amino acid side chains and is profoundly influenced by the pH of the running buffer relative to the protein's isoelectric point (pI). At a pH above its pI, a protein carries a net negative charge and migrates toward the anode (+), while at a pH below its pI, it carries a net positive charge and migrates toward the cathode (-). Mobility is directly proportional to the net charge and inversely proportional to the molecular size and shape [1] [2].
- Electrical Field Strength: The velocity of protein migration increases with higher voltage gradients (V/cm). However, excessive voltage generates significant Joule heat, leading to increased diffusion of separated bands and potential protein denaturation, thereby reducing resolution [2].
- Support Matrix: The choice of support medium is crucial for separation efficacy. Agarose gel, a heteropolysaccharide, forms a porous matrix with large pore sizes, making it ideal for separating large protein complexes like immunoglobulins in native conditions [1] [2]. Polyacrylamide gel, formed by polymerizing acrylamide and bis-acrylamide, creates a tighter mesh with controllable pore size, excellent for high-resolution separation of smaller proteins, typically using SDS-PAGE (Sodium Dodecyl Sulfate-Polyacrylamide Gel Electrophoresis) under denaturing conditions [1].
The following diagram illustrates the core workflow and governing principles of the SPEP process:
SPEP Methodologies: Gel vs. Capillary Systems
Two primary electrophoretic platforms are utilized in clinical laboratories for serum protein separation: traditional gel-based systems and emerging capillary-based systems. The choice between these methodologies involves trade-offs between analytical sensitivity, throughput, labor intensity, and cost.
Agarose Gel Electrophoresis
Agarose gel electrophoresis has long been regarded as the gold standard for SPEP and immunofixation electrophoresis (IFE) [79]. In this method, serum samples are applied to wells precast in an agarose gel slab, which is then subjected to an electric field in a buffered chamber. Proteins separate into distinct bands based on their electrophoretic mobility. Post-separation, the gel is stained (e.g., with Amido Black, Coomassie Blue, or acid-based stains), destained, and then quantified using densitometry, which measures the optical density of each protein band [2] [84]. The primary advantage of agarose gel is its high resolution and established role in clinical practice. However, it is notably labor-intensive, requiring significant hands-on time for gel preparation, sample application, staining, and destaining [79].
Capillary Electrophoresis
Capillary electrophoresis (CE) represents a technological advancement where separation occurs within a thin, fused-silica capillary tube filled with a buffer solution. When a high voltage is applied, proteins migrate through the capillary and past a detector (typically a UV spectrophotometer) that quantifies them in real-time, generating an electrophoretogram [79] [84]. The key advantages of CE are its automation, minimal sample volume requirements, and superior speed, as it eliminates the need for staining and destaining steps. This translates to improved laboratory efficiency and lower operational costs due to reduced full-time equivalent (FTE) hours [79]. A 2018 survey indicated that despite these benefits, capillary electrophoresis had not been widely adopted, with fewer than 32% of labs worldwide using it for plasma cell dyscrasia monitoring [79].
Comparative Analysis
A critical point of contention between these methods has been analytical sensitivity, particularly for detecting low levels of specific immunoglobulins or light chains. Published literature has suggested that capillary methods may be less sensitive than gel methods, though a close inspection reveals that when evaluated as a complete method with appropriate staff training, capillary electrophoresis demonstrates similar sensitivity and specificity to agarose gel electrophoresis [79]. The interpretation of the electrophoretogram is paramount, and the lack of proper education and training in comparison studies has often skewed results. With adequate training, both methods can produce high-quality, clinically actionable results [79].
Table 1: Comparative Analysis of SPEP Methodologies
| Parameter | Agarose Gel Electrophoresis | Capillary Electrophoresis |
|---|---|---|
| Throughput | Lower, manual processing | Higher, automated [79] |
| Hands-on Time | High | Low [79] |
| Assay Time | Several hours (including staining/destaining) | Minutes [79] |
| Sensitivity | Considered the gold standard; high | Comparable with proper training and method optimization [79] |
| Sample Volume | ~5 µL | < 1 µL |
| Labor Cost | Higher (more FTEs) | Lower (fewer FTEs) [79] |
| Data Output | Stained gel with densitometric tracing | Direct digital electrophoretogram |
Detailed Experimental Protocol for SPEP in Myeloma Research
This section provides a standardized protocol for performing SPEP using the agarose gel method, which remains a benchmark technique in clinical mycology research.
Specimen Collection and Preparation
- Specimen Type: Serum is the required sample. Blood must be collected in a red-top tube (no anticoagulant) or a serum separator tube (SST) [84].
- Collection Procedure: Perform routine venipuncture. Allow the blood to clot completely at room temperature for 30-60 minutes. Centrifuge at 1,500-2,000 x g for 10 minutes to separate the serum from the clot [84].
- Specimen Handling: Aliquot the serum into a sterile tube, avoiding lipemic, icteric, or hemolyzed samples. Specimens can be stored at 2-8°C for up to 7 days. For longer storage, freeze at -20°C or below. Avoid repeated freeze-thaw cycles, as this can cause protein degradation or aggregation, altering electrophoretic mobility [2].
Agarose Gel SPEP Procedure
- Gel Preparation: Prepare a 0.5% to 1.0% agarose gel in an appropriate barbital or Tris-barbital buffer (pH 8.6-9.0). Heat to dissolve the agarose completely, then pour the solution onto a clean glass or plastic support and allow it to solidify. Pre-cast commercial gels are commonly used for consistency [2] [84].
- Sample Application: Dilute serum samples 1:1 with the running buffer. Using a pipette or applicator, apply 3-5 µL of the diluted sample to the application wells on the gel [84].
- Electrophoretic Run: Place the gel in the electrophoresis chamber filled with the same running buffer. Ensure good contact between the gel and the buffer via wicks. Run the gel at a constant voltage of 100-150 V for approximately 30-45 minutes. The run is complete when the albumin marker (bromophenol blue) has migrated 3-4 cm from the origin [84].
- Post-Run Processing:
- Fixing: Immerse the gel in a fixative solution (e.g., 5% acetic acid or methanol-based fixative) for 3-5 minutes to precipitate proteins and prevent diffusion.
- Staining: Transfer the gel to a staining solution (e.g., 0.1% Amido Black, Coomassie Brilliant Blue, or Acid Violet) for 5-10 minutes to bind proteins.
- Destaining: Remove excess background stain by washing the gel in a destaining solution (e.g., 2% acetic acid) until the background is clear and protein bands are sharply defined [2].
- Densitometry and Quantification: Place the dried or wet gel in a scanning densitometer. The instrument measures the optical density of each stained protein fraction. The area under the curve for each peak is calculated, and the percentage of total protein is determined. This percentage is then converted to an absolute concentration (g/dL) by multiplying by the total protein concentration obtained via a separate biuret assay [85] [84].
Table 2: Key Reagent Solutions for SPEP Research
| Research Reagent / Material | Function / Explanation |
|---|---|
| Agarose Gel (0.5-1.0%) | Support matrix for protein separation; provides porous medium for molecular sieving [1] [2]. |
| Barbital/Tris-Barbital Buffer (pH 8.6) | Carries electrical current and maintains alkaline pH to ensure most serum proteins carry a net negative charge for consistent anodal migration [2] [84]. |
| Protein Stain (e.g., Coomassie Blue) | Binds non-specifically to proteins, enabling visualization of separated bands after destaining [1] [2]. |
| Acid/Methanol Destaining Solution | Removes unbound stain from the gel background, enhancing contrast and resolution of protein bands [2]. |
| Molecular Weight Markers | Commercial protein ladders of known molecular weights used as reference standards for SDS-PAGE; not typically used in native SPEP for myeloma [1]. |
| Acrylamide/Bis-Acrylamide | Monomers for forming polyacrylamide gels, used for higher resolution separation of proteins (e.g., SDS-PAGE, 2D-PAGE) in proteomic research [1]. |
| Antibodies (for IFE) | Specific anti-sera (anti-IgG, IgA, IgM, kappa, lambda) used in immunofixation to identify the isotype of the M-protein [82] [84]. |
Data Interpretation and Clinical Correlation in Myeloma
The interpretation of SPEP patterns is a critical skill for diagnosing and monitoring multiple myeloma. A normal SPEP pattern displays a large albumin peak (55-65% of total protein) followed by smaller alpha-1, alpha-2, beta, and gamma globulin fractions [83] [84]. In multiple myeloma, the key finding is the presence of a monoclonal gammopathy.
Identifying the M-Protein
The M-protein appears as a tall, narrow, homogeneous spike or "church spire" peak on the densitometric tracing, most commonly located in the gamma zone. However, it can occasionally migrate to the beta or even alpha-2 regions, particularly in the case of IgA myeloma [85] [84]. This pattern is distinct from a polyclonal gammopathy, which presents as a broad, diffuse increase in the gamma region due to the presence of many different immunoglobulins from various plasma cell clones, typically seen in reactive or inflammatory conditions [83] [84]. SPEP can typically detect an M-protein at a concentration of 0.5 g/dL, which corresponds to approximately 10^9 antibody-producing cells [84].
Diagnostic Workflow and Follow-up Testing
An abnormal SPEP result must be integrated into a broader diagnostic workflow. The following diagram outlines the logical pathway from initial suspicion to confirmed diagnosis and monitoring:
The M-spike quantified by SPEP is a major criterion for diagnosing multiple myeloma and is essential for disease staging and risk stratification using systems like the Revised International Staging System (R-ISS), which also incorporates serum albumin and beta-2 microglobulin levels [85] [82]. It is crucial to note that SPEP may miss small M-proteins or cases of light-chain-only myeloma. Therefore, a full workup for suspected myeloma must always include serum free light chain (sFLC) assay and urine protein electrophoresis (UPEP) to detect Bence Jones proteinuria, as approximately 15-20% of patients produce only light chains [85] [82] [86].
Table 3: SPEP Reference Ranges and Myeloma-Associated Patterns in Adults
| Protein Fraction | Reference Range (g/dL) | Change in Active Myeloma | Potential Clinical/Research Significance |
|---|---|---|---|
| Total Protein | 6.4 - 8.3 [80] [84] | Often Elevated | Reflects increased immunoglobulin production. |
| Albumin | 3.5 - 5.0 [80] [84] | Decreased | A low level is a negative prognostic marker in the R-ISS [85]. |
| Alpha-1 Globulin | 0.1 - 0.3 [80] [84] | Unchanged/Variable | Acute phase reactants; not typically affected in myeloma. |
| Alpha-2 Globulin | 0.6 - 1.0 [80] [84] | Unchanged/Variable | Contains haptoglobin; not typically a focus in myeloma. |
| Beta Globulin | 0.7 - 1.2 [80] [84] | May show a spike | IgA M-proteins often migrate here [85]. |
| Gamma Globulin | 0.7 - 1.6 [80] [84] | Monoclonal spike (M-protein) | Primary region of interest for IgG M-proteins; the area under the M-spike quantifies tumor burden [85] [84]. |
Serum protein electrophoresis stands as a fundamental and powerful tool within the broader field of protein gel electrophoresis research, providing an indispensable method for the diagnosis and therapeutic monitoring of multiple myeloma. Its principle, rooted in the differential migration of charged proteins in an electric field, enables the specific detection of the pathological M-protein that defines the disease. While the established agarose gel method offers high resolution and reliability, capillary electrophoresis presents a compelling automated alternative that enhances laboratory efficiency. For researchers and drug development professionals, a deep understanding of SPEP methodologies, detailed protocols, and nuanced data interpretation is critical. This knowledge not only facilitates accurate disease characterization in clinical trials but also underscores the enduring significance of foundational electrophoretic techniques in advancing modern oncological science and patient care.
Protein gel electrophoresis serves as a fundamental separation tool in structural biology and proteomics, providing a foundation for cross-platform verification with mass spectrometry (MS). The principle of protein gel electrophoresis research hinges on separating complex protein mixtures based on their physicochemical properties—primarily size in denaturing conditions or both size and charge in native states—enabling researchers to isolate individual protein components for subsequent analysis [1]. This separation is crucial for reducing sample complexity before MS analysis, particularly for detecting low-abundance proteins that would otherwise be challenging to identify in complex biological samples [87]. The integration of these techniques represents a powerful approach in modern analytical science, combining the high-resolution separation capabilities of electrophoresis with the exquisite sensitivity and identification power of mass spectrometry.
Within this framework, polyacrylamide gel electrophoresis (PAGE) has emerged as an exceptionally versatile platform. Its ability to separate proteins under both denaturing and native conditions makes it ideally suited for diverse research applications, from routine molecular weight determination to sophisticated interaction studies [1] [6]. When coupled with MS, electrophoretic separations transform from merely analytical tools into preparative platforms that feed into more comprehensive structural proteomics workflows. This integration has accelerated significantly in recent years with methodological advancements that address long-standing challenges in protein recovery from gel matrices [87].
Fundamental Principles of Protein Electrophoresis
Electrophoretic Separation Mechanisms
Protein electrophoresis operates on the principle that charged molecules migrate through a porous matrix under the influence of an electric field. The rate of migration depends on several factors: field strength, the molecule's net charge, molecular size and shape, ionic strength, and properties of the matrix such as viscosity and pore size [1]. Two primary variants of polyacrylamide gel electrophoresis dominate proteomics research:
SDS-PAGE (Denaturing Electrophoresis): In this widely used method, sodium dodecyl sulfate (SDS) denatures proteins by wrapping around the polypeptide backbone. When combined with heating and reducing agents to cleave disulfide bonds, SDS binds to proteins in a constant weight ratio (approximately 1.4 g SDS per 1 g polypeptide) [1]. This process confers a uniform negative charge density to all proteins, effectively neutralizing their intrinsic charges [5]. Consequently, separation occurs primarily according to molecular weight, with smaller polypeptides migrating faster through the gel matrix than larger ones [1] [6]. The simplicity, speed, and minimal protein requirements of SDS-PAGE have made it the most widely used method for determining polypeptide molecular mass [1].
Native-PAGE: In contrast to denaturing conditions, native-PAGE separates proteins according to the net charge, size, and shape of their native structure [1]. Without denaturants, subunit interactions within multimeric proteins are generally retained, preserving quaternary structure and often maintaining enzymatic activity following separation [1]. This technique is particularly valuable for studying functional protein complexes, protein-protein interactions, and for preparing purified, active proteins for downstream analyses [6].
Gel Matrix Properties and Selection
The polyacrylamide gel matrix serves as a molecular sieve, with its pore size determined by the concentration of acrylamide and bisacrylamide. The polymerization reaction is catalyzed by ammonium persulfate (APS) and tetramethylethylenediamine (TEMED), which promotes free radical formation [1]. Critically, pore size is inversely related to the polyacrylamide percentage—lower percentage gels (e.g., 7-8%) have larger pores suitable for separating high molecular weight proteins, while higher percentage gels (e.g., 12-15%) have smaller pores ideal for resolving lower molecular weight proteins [1] [6].
Table 1: Polyacrylamide Gel Percentage Recommendations for Protein Separation
| Gel Percentage | Effective Separation Range | Primary Applications |
|---|---|---|
| 6-8% | 50-150 kDa | Large proteins |
| 10% | 20-100 kDa | Standard proteins |
| 12-15% | 10-60 kDa | Small proteins |
| 4-20% Gradient | 10-300 kDa | Broad size range |
Gradient gels, which feature increasing acrylamide concentration from top to bottom, enable separation of a broader range of protein sizes within a single gel [1]. For optimal resolution, most SDS-PAGE protocols employ a discontinuous buffer system with both stacking and resolving gels. The stacking gel, with lower acrylamide concentration and pH, concentrates protein samples into tight bands before they enter the resolving portion of the gel, thereby enhancing resolution [1] [5].
Integrating Electrophoresis with Mass Spectrometry
Methodological Framework for Cross-Platform Verification
The correlation of electrophoresis data with mass spectrometry involves a coordinated series of experimental steps, each requiring careful optimization to ensure successful protein identification and characterization. The following workflow diagram illustrates the integrated process:
Sample Preparation and Electrophoretic Separation
Effective cross-platform analysis begins with optimized sample preparation. Proteins must be extracted and solubilized in appropriate buffers compatible with both electrophoresis and subsequent MS analysis. For standard SDS-PAGE, samples are typically heated to 70-100°C in buffer containing SDS and thiol reagents to denature proteins and cleave disulfide bonds [1] [5]. For complex samples such as cell lysates, additional steps like acetone precipitation may be employed to concentrate proteins and remove interfering substances [88].
The choice between handcast and precast gels represents an important practical consideration. While researchers traditionally prepared gels following standard recipes, commercially available precast gels now offer enhanced convenience and consistency [6]. These gels come in various buffer formulations (Tris-acetate, Tricine Tris-glycine, Bis-Tris) optimized for specific applications and also minimize researcher exposure to neurotoxic acrylamide [6].
Protein Detection and In-Gel Digestion
Following electrophoresis, separated proteins are visualized using staining techniques that balance sensitivity with MS compatibility. Colloidal Coomassie brilliant blue staining is commonly used for preparative gels destined for MS analysis, offering a favorable balance between detection sensitivity and compatibility with downstream protein identification [88]. Silver staining provides higher sensitivity for analytical gels but may introduce modifications that interfere with MS analysis [88].
For protein identification, target bands are excised from the gel and subjected to in-gel digestion. This process involves multiple steps: destaining to remove dye molecules, reduction and alkylation of disulfide bonds, and proteolytic digestion (typically with trypsin) to generate peptides suitable for MS analysis [88]. The resulting peptides are then extracted from the gel matrix, desalted, and concentrated before MS analysis.
Mass Spectrometry Analysis and Protein Identification
Two primary MS approaches are utilized for protein identification following electrophoretic separation:
MALDI-TOF MS (Peptide Mass Fingerprinting): This approach involves analyzing the peptide mixture by matrix-assisted laser desorption/ionization time-of-flight mass spectrometry to generate a peptide mass fingerprint [88]. The resulting mass list is searched against protein databases using programs such as Mascot, with identification based on the correspondence between experimentally determined peptide masses and theoretical digests of database proteins [88].
LC-ESI-MS/MS (Tandem Mass Spectrometry): For samples not successfully identified by MALDI-TOF MS, liquid chromatography electrospray ionization tandem mass spectrometry provides complementary data [88]. In this method, peptides are separated by reversed-phase chromatography prior to introduction into the mass spectrometer. As peptides elute, data-dependent acquisition is performed where the most intense peaks are selected for fragmentation, generating MS/MS spectra that provide sequence information for more confident protein identification [88].
Table 2: Mass Spectrometry Techniques for Protein Identification
| Technique | Principle | Advantages | Limitations |
|---|---|---|---|
| MALDI-TOF MS | Peptide mass fingerprinting | High throughput, relatively simple | Lower sequence coverage, database dependent |
| LC-ESI-MS/MS | Peptide sequencing via fragmentation | Higher confidence IDs, de novo sequencing possible | More complex instrumentation and analysis |
Advanced Integration Strategies
Overcoming Technical Challenges in Protein Recovery
A longstanding obstacle in correlating electrophoresis with MS has been the efficient recovery of intact proteins or peptides from polyacrylamide gels. Traditional methods including electroelution and passive extraction often suffered from low recovery rates and extended processing times [87]. This challenge has been particularly pronounced for high molecular weight proteins and membrane proteins.
The recent development of innovative extraction techniques has dramatically improved this situation. The PEPPI-MS (Passively Eluting Proteins from Polyacrylamide Gels as Intact species for MS) method, introduced in 2020, uses Coomassie Brilliant Blue as an extraction enhancer to efficiently recover proteins across a wide molecular weight range [87]. This technique achieves remarkable recovery rates—approximately 68% for proteins below 100 kDa and 57% for those above 100 kDa—after just 10 minutes of shaking [87]. This breakthrough has enabled the application of GeLC-MS (combined SDS-PAGE separation and LC-MS) workflows to top-down proteomics, where analysis of intact proteoforms is desired.
Two-Dimensional Electrophoresis and Structural Proteomics
For comprehensive analysis of complex protein samples, two-dimensional polyacrylamide gel electrophoresis (2D-PAGE) provides superior resolution by separating proteins according to two independent properties: isoelectric point (pI) in the first dimension and molecular weight in the second [1]. In the first dimension, isoelectric focusing (IEF) separates proteins according to their native isoelectric point using immobilized pH gradient (IPG) strips [1]. The second dimension then resolves proteins by mass using standard SDS-PAGE [1]. This approach can resolve thousands of proteins on a single gel, making it particularly valuable for comparative proteomics studies where differential protein expression between samples is of interest [88].
The integration of 2D-PAGE with MS enables researchers to define protein components of regulons and stimulons in biological systems, including those where genome sequencing is still in progress [88]. This powerful combination allows direct comparison of hundreds or even thousands of proteins simultaneously, with subsequent protein identification through peptide mass fingerprinting and tandem MS [88].
Native Electrophoresis for Structural Analysis
The recent emergence of native mass spectrometry techniques has created new opportunities for correlating electrophoresis data with structural information. When combined with native-PAGE separations, MS can provide insights into protein complexes and higher-order structures that are lost under denaturing conditions [87]. This approach is particularly valuable for studying protein-protein interactions, subunit stoichiometry, and conformational changes.
Several variants of native-PAGE have been developed for specific applications. Blue native-PAGE uses Coomassie brilliant blue dye to provide charge to native protein complexes, while clear native-PAGE utilizes the intrinsic charge of proteins for separation [6]. Quantitative native-PAGE separates proteins by their isoelectric points, enabling subsequent metal cofactor identification and quantification using high-resolution inductively coupled plasma mass spectrometry (ICP-MS) [6].
Essential Reagents and Materials
Successful cross-platform verification requires careful selection of reagents and materials optimized for both electrophoretic separation and mass spectrometric analysis. The following table details key research reagent solutions and their specific functions in integrated workflows:
Table 3: Essential Research Reagent Solutions for Integrated Electrophoresis-MS
| Reagent/Material | Function | Application Notes |
|---|---|---|
| Polyacrylamide/Bis-acrylamide | Forms porous gel matrix for size-based separation | Concentration determines pore size; neurotoxic in monomeric form |
| Ammonium Persulfate (APS) | Initiates polymerization reaction | Fresh preparation recommended for consistent results |
| TEMED | Catalyzes polymerization by promoting free radical production | Accelerates gel setting; amount affects polymerization rate |
| SDS (Sodium Dodecyl Sulfate) | Denatures proteins and confers uniform negative charge | Critical for mass-based separation in SDS-PAGE |
| DTT or β-Mercaptoethanol | Reduces disulfide bonds | Essential for complete protein denaturation |
| Coomassie Brilliant Blue | Protein staining for visualization and extraction enhancement in PEPPI-MS | Compatible with MS; reversible binding |
| Trypsin | Proteolytic enzyme for in-gel digestion | Specific cleavage C-terminal to arginine and lysine residues |
| CHAPS/Urea/Thiourea | Solubilization agents for protein extraction | Particularly important for membrane proteins in 2D-PAGE |
| Ampholytes | Establish pH gradient for isoelectric focusing | Essential for first dimension of 2D-PAGE |
| Molecular Weight Markers | Provide size reference for electrophoretic separation | Pre-stained or unstained varieties available |
| α-cyano-4-hydroxycinnamic acid | Matrix for MALDI-TOF MS analysis | Facilitates peptide ionization and desorption |
The correlation of electrophoresis data with mass spectrometry represents a powerful synergy in proteomics research, combining the robust separation capabilities of gel-based techniques with the exceptional identification power of modern mass spectrometry. As methodological advancements continue to address historical challenges in protein recovery and compatibility, this integrated approach offers increasingly sophisticated insights into protein structure, function, and interactions. The ongoing development of techniques such as PEPPI-MS for efficient protein extraction from gels demonstrates that even established methodologies like SDS-PAGE continue to evolve and find new applications in structural proteomics. For researchers pursuing comprehensive protein characterization, the cross-platform verification of electrophoretic separations with mass spectrometric identification remains an indispensable strategy in the analytical toolkit.
Protein gel electrophoresis, a cornerstone technique in molecular biology, operates on the fundamental principle of separating charged molecules under the influence of an electric field. The electrophoretic mobility of a protein is governed by a complex interplay between its net charge, size, and shape, as described by the equation μ = v/E = q/f, where v represents migration velocity, E is electric field strength, q is net charge, and f is the frictional coefficient [10]. This principle enables researchers to separate complex protein mixtures by size, charge, or both, providing a critical tool for protein analysis, purification, and characterization. In modern proteomics, this technique has evolved from a simple separation method to an integral component of sophisticated multi-omics workflows, maintaining its relevance through continuous adaptation to emerging technological landscapes.
The proteomics field is currently undergoing a significant transformation characterized by strategic integration across omics technologies. Major genomics and spatial biology players are increasingly incorporating high-plex proteomics into comprehensive multi-omics strategies, as evidenced by Illumina's planned acquisition of SomaLogic and 10x Genomics' integrated spatial protein launches [89]. This shift is fueled by the recognition that proteins, as the primary functional executors in biological systems, provide critical insights into cellular states that cannot be fully deduced from genomic or transcriptomic data alone. Within this integrated framework, electrophoresis maintains a crucial position, particularly for targeted protein analysis, validation studies, and clinical applications requiring high reproducibility and quantitative accuracy.
Fundamental Principles and Technical Evolution of Protein Electrophoresis
Core Separation Mechanisms
The effectiveness of protein separation via electrophoresis relies on overcoming the inherent variability of protein charge and structure. Sodium dodecyl sulfate-polyacrylamide gel electrophoresis (SDS-PAGE), the gold standard for protein separation by molecular weight, achieves this through protein denaturation and charge normalization [10]. The SDS detergent binds to hydrophobic regions of proteins in a uniform ratio (approximately 1.4g SDS per 1g protein), imparting a consistent negative charge-to-mass ratio and unfolding proteins into linear polypeptides [10]. When combined with reducing agents like dithiothreitol (DTT) or β-mercaptoethanol to break disulfide bonds, this process ensures separation occurs almost exclusively based on molecular size rather than intrinsic charge or structural features [10].
The polyacrylamide gel matrix serves as a molecular sieve with highly uniform pore sizes, providing superior resolution for proteins compared to agarose gels used for nucleic acids [10]. Smaller proteins navigate the pores more easily, migrating faster through the gel, while larger proteins experience greater frictional resistance and migrate more slowly [10]. This size-dependent separation enables accurate molecular weight estimation when compared to pre-stained protein ladders with known molecular weights.
Advanced Electrophoretic Techniques
Two-dimensional gel electrophoresis (2D-GE) represents a significant advancement for resolving complex protein mixtures with high resolution. This technique separates proteins based on two independent properties in successive steps [90]. The first dimension involves isoelectric focusing, where proteins migrate through a pH gradient until they reach their isoelectric point (pI) – the pH where their net charge is zero [90]. The second dimension then separates these focused proteins by molecular weight using SDS-PAGE [90]. This orthogonal separation approach can resolve thousands of protein isoforms from a single sample, making it invaluable for differential expression profiling and post-translational modification analysis.
Capillary electrophoresis (CE) has emerged as a high-resolution, automated alternative to traditional slab gel methods. CE performs separations in narrow fused-silica capillaries, eliminating the need for gel preparation and enabling rapid, high-throughput analysis [10]. Samples are loaded electrokinetically, and separation is driven by both electric field and electro-osmotic flow, with detection occurring via in-line detectors that provide chromatogram-like output [10]. This format is particularly advantageous for clinical applications requiring quantitative results and standardized protocols.
Electrophoresis in Integrated Multi-Omics Workflows
Strategic Integration with Mass Spectrometry
The co-evolution of separation sciences with mass spectrometry has profoundly shaped contemporary proteomics. While liquid chromatography coupled to MS (LC-MS) currently dominates high-throughput proteomics, electrophoresis maintains complementary strengths for specific applications [91]. SDS-PAGE remains a workhorse for protein complexity reduction prior to MS analysis, particularly through gel-assisted proteomic workflows where separated proteins are excised, digested, and identified by MS [10]. This approach provides valuable orthogonal separation that can mitigate ionization suppression effects and enrich low-abundance proteins.
The integration of ion mobility spectrometry (IMS) with MS presents new opportunities for electrophoresis principles applied in the gas phase. IMS separates ions based on their size, shape, and charge as they move through a buffer gas under an electric field, effectively functioning as "electrophoresis in the gas phase" [91]. This technology has demonstrated potential to eventually complement or even replace LC for certain clinical applications, particularly when combined with targeted analyses of defined biomarker panels [91]. The theoretical advantages in speed, robustness, and reproducibility position IMS as a disruptive technology that could reshape standard proteomic workflows.
Spatial Proteomics and Electrophoresis
Spatial biology represents one of the most significant trends in proteomics, with platforms increasingly moving toward multi-omic integration. Growing adoption of integrated RNA and proteomics platforms (e.g., 10x Genomics' Xenium, Bruker's CosMx) underscores the shift toward analyzing multiple molecular layers within their native spatial context [89]. While these technologies often rely on antibody or oligonucleotide-based detection, electrophoretic techniques contribute to validation workflows and quality control steps that ensure antibody specificity and sample integrity.
The clinical translation of spatial proteomics is accelerating, with diagnostic platforms like Castle Bioscience's TissueCypher test gaining clinical traction, and partnerships focused on developing spatial companion diagnostics (e.g., Roche & AstraZeneca's partnership for a TROP2 CDx) highlighting the determined push toward clinical integration [89]. In these contexts, traditional electrophoretic methods provide essential validation for novel spatial protein biomarkers, creating integrated workflows that leverage both established and emerging technologies.
Essential Methodologies: SDS-PAGE and 2D-GE Protocols
SDS-PAGE Experimental Protocol
The SDS-PAGE workflow involves several critical steps that must be optimized for reproducible protein separation [10]:
Sample Preparation: Protein samples are mixed with SDS-PAGE sample buffer (typically containing Tris-HCl, glycerol, SDS, bromophenol blue, and reducing agent) at a recommended ratio of 1:4 (sample:buffer) [10]. The mixture is heated at 95-100°C for 5-10 minutes to ensure complete protein denaturation and SDS binding. Insoluble material is removed by centrifugation at 10,000-15,000 × g for 5 minutes to prevent gel artifacts.
Gel Casting: Polyacrylamide gels are typically cast in a discontinuous system with two layers [10]. The resolving gel (typically 8-16% acrylamide depending on target protein sizes) is poured first and overlayered with water or alcohol to create a flat interface. After polymerization, the stacking gel (4-5% acrylamide) is added with a comb to create wells. The stacking gel concentrates proteins into a sharp band before they enter the resolving gel, ensuring well-defined separation.
Electrophoresis Conditions: Prepared gels are placed in vertical electrophoresis chambers filled with running buffer (25mM Tris, 192mM glycine, 0.1% SDS, pH 8.3) [10]. Samples and pre-stained protein ladders are loaded into wells. Electrophoresis is typically performed at constant voltage (100-150V for mini-gels) until the dye front reaches the bottom of the gel (approximately 60-90 minutes). Lower voltages (50-100V) may be used for improved resolution of complex mixtures.
Visualization and Analysis: Following separation, proteins are visualized using stains such as Coomassie Blue (detection limit ~10-100ng), silver stain (detection limit ~0.1-1ng), or fluorescent dyes compatible with downstream MS analysis [10] [90]. Gel imaging systems capture digital records, and band intensities are quantified using specialized software, with molecular weights determined by comparison to standardized ladders.
Two-Dimensional Gel Electrophoresis Protocol
2D-GE builds upon the SDS-PAGE foundation with additional complexity in the first dimension separation [90]:
First Dimension - Isoelectric Focusing: Protein samples are mixed with rehydration buffer containing urea, thiourea, CHAPS, DTT, and carrier ampholytes. This mixture is used to rehydrate immobilized pH gradient (IPG) strips, which provide stable pH gradients for separation. Isoelectric focusing is performed using a programmed voltage gradient, typically achieving 50-100kVh total focusing depending on strip length and pH range. The focused strips are then equilibrated in SDS-PAGE buffer to prepare for the second dimension.
Second Dimension - SDS-PAGE: Equilibrated IPG strips are sealed onto polyacrylamide gels using agarose, and standard SDS-PAGE is performed as described above. Specialized wide-format gel apparatus may be used to accommodate multiple first-dimension separations simultaneously.
Image Analysis and Spot Picking: Following electrophoresis and staining, gel images are captured using high-resolution scanners. Specialized software aligns images from multiple gels, detects protein spots, and calculates differential expression. Spots of interest are excised using automated pickers for subsequent protein identification by mass spectrometry.
Quantitative Data and Technical Specifications
Table 1: Electrophoresis Technical Parameters for Proteomic Applications
| Parameter | Agarose Gel Electrophoresis | SDS-PAGE | 2D-GE | Capillary Electrophoresis |
|---|---|---|---|---|
| Separation Basis | Size | Molecular weight | Isoelectric point & molecular weight | Size-to-charge ratio |
| Optimal Separation Range | 100 bp - 25 kb (DNA/RNA) | 5-250 kDa | 10-200 kDa | 1-100 kDa |
| Resolution Capacity | ~5 bp difference for DNA | 1-2 kDa difference | Can resolve >5,000 spots per gel | Higher than SDS-PAGE |
| Typical Run Time | 20-60 minutes | 1-2 hours | 8-24 hours (including IEF) | 10-30 minutes |
| Sample Throughput | Low to moderate | Moderate | Low | High (automated) |
| Quantitation Capability | Semi-quantitative | Semi-quantitative (±10-20%) | Semi-quantitative (±10-20%) | Highly quantitative (±1-5%) |
| Compatibility with MS | Not applicable | High (in-gel digestion) | High (spot excision/digestion) | Moderate (fraction collection) |
| Protein Loading Capacity | N/A | 0.1-20 μg per band | 100-500 μg per gel | 0.001-0.1 μg |
Table 2: Electrophoresis Applications in Integrated Proteomic Workflows
| Application Domain | Electrophoresis Method | Downstream Integration | Key Performance Metrics |
|---|---|---|---|
| Protein Expression Profiling | 2D-GE, SDS-PAGE | MS/MS identification, LC-MS validation | Resolution of >1,000 protein spots; CV < 20% for technical replicates |
| Biomarker Verification | Western blot, SDS-PAGE | Targeted MS (SRM/MRM), immunoassays | Detection of 2-fold changes with >95% confidence; >90% specificity |
| Post-Translational Modification Analysis | 2D-GE, Phos-tag SDS-PAGE | Enrichment MS, phosphoproteomics | Resolution of phosphorylation isoforms; >80% enrichment efficiency |
| Protein-Protein Interaction Validation | Native PAGE, BN-PAGE | Cross-linking MS, Y2H verification | Preservation of native complexes; <10% false-positive rate |
| Clinical Assay Development | Capillary electrophoresis, SDS-PAGE | FDA/EMA validation, IVD translation | Inter-lab CV <15%; >98% reproducibility; LOD <1 ng/mL |
| Single-Cell Proteomics | Microchip electrophoresis, CE-MS | scMS, multiplexed immunoassays | Detection of <1,000 protein copies; <5% carryover between runs |
Visualization of Integrated Workflows
Workflow Integration: This diagram illustrates how electrophoresis serves as a critical sample preparation and validation component within integrated proteomic workflows, bridging sample preparation and mass spectrometry analysis while providing orthogonal validation for discovered biomarkers.
The Scientist's Toolkit: Essential Research Reagents
Table 3: Essential Reagents for Electrophoresis in Proteomic Workflows
| Reagent Category | Specific Examples | Function & Purpose | Technical Considerations |
|---|---|---|---|
| Separation Matrices | Polyacrylamide (4-20%), Agarose (1-3%) | Molecular sieving matrix; pore size determines resolution range | Higher % acrylamide improves small protein resolution; bis-acrylamide ratio affects crosslinking |
| Denaturing Agents | SDS, Urea, Thiourea | Protein denaturation; charge uniformity; solubilization | Urea concentration typically 6-8M; avoid heating to prevent carbamylation |
| Reducing Agents | DTT, β-mercaptoethanol, TCEP | Disulfide bond reduction; protein unfolding | TCEP more stable than DTT; use fresh preparations for complete reduction |
| Buffering Systems | Tris-glycine, Tris-tricine, Bis-Tris | pH maintenance; ion conduction | Tris-glycine for standard separations; Tris-tricine for better low MW resolution |
| Staining Reagents | Coomassie Blue, SYPRO Ruby, Silver stain | Protein detection and visualization | Silver stain most sensitive (0.1ng); SYPRO Ruby MS-compatible |
| Molecular Standards | Prestained protein ladders, Unstained standards | Molecular weight calibration; transfer monitoring | Choose ladders spanning expected MW range; verify linearity of calibration curve |
| Transfer Reagents | Nitrocellulose/PVDF membranes, Transfer buffers | Protein immobilization for Western blotting | PVDF offers better protein retention; requires methanol activation |
| Detection Reagents | ECL substrates, Fluorescent antibodies | Target protein visualization | ECL offers high sensitivity; fluorescent enables multiplexing |
Future Perspectives and Concluding Remarks
The future of electrophoresis in proteomic workflows will be shaped by several converging technological trends. Miniaturization and automation continue to drive innovation, with microfluidic gel electrophoresis platforms enabling low-volume, chip-based separations ideal for precious clinical samples or single-cell proteomics [90]. These systems reduce analysis times from hours to minutes while improving reproducibility through standardized operational protocols. Enhanced detection methodologies are also evolving, with safer fluorescent dyes replacing traditional stains like ethidium bromide and SYBR Safe providing sensitivity comparable to silver staining without the associated toxicity [90].
The integration of artificial intelligence and machine learning with electrophoretic analysis represents another significant frontier. AI-powered band detection algorithms are automating interpretation and quantification, reducing subjective bias in gel analysis while improving throughput and reproducibility [90]. These computational approaches can identify subtle patterns in complex 2D-GE maps that might escape human detection, potentially revealing novel biomarkers or disease signatures.
Perhaps most significantly, electrophoresis is finding new relevance in clinical proteomics and point-of-care diagnostics. As the field shifts from discovery to translation, simplified electrophoretic methods compatible with clinical settings are gaining importance. Capillary electrophoresis systems, in particular, offer the standardization, quantitative accuracy, and throughput necessary for clinical validation studies and routine laboratory testing [10]. When combined with targeted mass spectrometry approaches, these methods provide orthogonal validation that strengthens biomarker verification pipelines.
In conclusion, while mass spectrometry dominates contemporary proteomics, electrophoresis maintains a complementary and evolving role in integrated workflows. Its strengths in fractionation, visualization, and validation ensure continued relevance, particularly as the field addresses the challenges of clinical translation and multi-omic integration. The fundamental principle of separating proteins by their physicochemical properties under an electric field continues to adapt to new technological contexts, demonstrating the enduring utility of this foundational methodology in an era of increasingly complex biological analysis.
Conclusion
Protein gel electrophoresis remains an indispensable and versatile tool in the researcher's arsenal, underpinning everything from basic protein characterization to complex clinical diagnostics. Its foundational principle—separating molecules by their mobility in an electric field—manifests in highly adaptable methodologies like SDS-PAGE and 2D-PAGE. Mastering both the protocol execution and troubleshooting is crucial for generating reproducible, high-quality data. As the field advances, traditional gel-based techniques are being complemented by high-throughput technologies like capillary electrophoresis, enhancing efficiency in clinical settings. The continued integration of electrophoresis with downstream analytical techniques ensures its enduring relevance in driving discoveries in drug development, disease biomarker identification, and fundamental biomedical research.
References
- 1. Overview of Protein Electrophoresis [https://www.thermofisher.com/us/en/home/life-science/protein-biology/protein-biology-learning-center/protein-biology-resource-library/pierce-protein-methods/overview-electrophoresis.html]
- 2. Electrophoresis - StatPearls - NCBI Bookshelf - NIH [https://www.ncbi.nlm.nih.gov/books/NBK585057/]
- 3. Protein electrophoresis [https://eclinpath.com/chemistry/proteins/electrophoretic-patterns/]
- 4. Protein Electrophoresis Using SDS-PAGE: A Detailed ... [https://www.goldbio.com/blogs/articles/protein-electrophoresis-sds-page-overview?srsltid=AfmBOopDLDvo4RZkG9VUQC3zFqsn92D5nosPEuKfG5AN47LBMIpFMLqS]
- 5. The principle and method of polyacrylamide gel ... [https://ruo.mbl.co.jp/bio/e/support/method/sds-page.html]
- 6. What Is Protein Gel Electrophoresis? Definition & Overview [https://www.excedr.com/resources/protein-gel-electrophoresis]
- 7. GelGenie: an AI-powered framework for gel ... [https://www.nature.com/articles/s41467-025-59189-0]
- 8. Uncertainty Estimation for Quantitative Agarose Gel ... [https://www.mdpi.com/1424-8220/23/4/1999]
- 9. What Is Protein Electrophoresis and How Does It Work? [https://synapse.patsnap.com/article/what-is-protein-electrophoresis-and-how-does-it-work]
- 10. Mastering Electrophoresis: Techniques, Equipment, and ... [https://www.labx.com/resources/mastering-electrophoresis-techniques-equipment-and-applications-in-dna-rna-and-protei/5535]
- 11. Trends development and applications on electrophoresis ... [https://www.sciencedirect.com/science/article/abs/pii/S0039914025005193]
- 12. of Gel - Wikipedia electrophoresis proteins [https://en.wikipedia.org/wiki/Gel_electrophoresis_of_proteins]
- 13. What is Polyacrylamide Gel (PAGE)? Electrophoresis [https://www.news-medical.net/life-sciences/What-is-Polyacrylamide-Gel-Electrophoresis-(PAGE).aspx]
- 14. Proteomics/ Protein Separations- Electrophoresis / Gel ... [https://en.wikibooks.org/wiki/Proteomics/Protein_Separations-_Electrophoresis/Gel_Electrophoresis]
- 15. Polyacrylamide Gel Electrophoresis, How It Works, ... [https://www.technologynetworks.com/analysis/articles/polyacrylamide-gel-electrophoresis-how-it-works-technique-variants-and-its-applications-359100]
- 16. The principle and method of polyacrylamide gel ... [https://www.mblbio.com/bio/g/support/method/sds-page.html]
- 17. Polyacrylamide gel electrophoresis [https://en.wikipedia.org/wiki/Polyacrylamide_gel_electrophoresis]
- 18. On the mechanism of the molecular-sieve effect in ... [https://www.sciencedirect.com/science/article/abs/pii/S0021967300821937]
- 19. What is Polyacrylamide Gel? [https://rawsource.com/what-is-polyacrylamide-and-polyacrylamide-gel/]
- 20. Electrophoretic color marker [https://en.wikipedia.org/wiki/Electrophoretic_color_marker]
- 21. Protein Gel 2025-2033 Overview: Trends, Competitor Dynamics ... [https://www.archivemarketresearch.com/reports/protein-gel-142853]
- 22. On the Applicability of Electrophoresis for Protein ... [https://pmc.ncbi.nlm.nih.gov/articles/PMC8625784/]
- 23. The state of the art in the analysis of two-dimensional gel ... [https://pmc.ncbi.nlm.nih.gov/articles/PMC2279157/]
- 24. SDS-PAGE [https://en.wikipedia.org/wiki/SDS-PAGE]
- 25. Protein Electrophoresis Using SDS-PAGE: A Detailed ... [https://www.goldbio.com/blogs/articles/protein-electrophoresis-sds-page-overview?srsltid=AfmBOor_Tmbn5zSJuPixGjrX7DequKYJ5YnQfEkxjuxG-zoknG6_dFAT]
- 26. Gel electrophoresis [https://en.wikipedia.org/wiki/Gel_electrophoresis]
- 27. Quantitative analysis of electrophoresis data: novel curve ... [https://pmc.ncbi.nlm.nih.gov/articles/PMC146501/]
- 28. Gel Electrophoresis of Proteins - an overview [https://www.sciencedirect.com/topics/biochemistry-genetics-and-molecular-biology/gel-electrophoresis-of-proteins]
- 29. Principle of SDS PAGE [https://byjus.com/biology/sds-page/]
- 30. SDS Page [https://www.geeksforgeeks.org/biology/sds-page/]
- 31. Protein Electrophoresis Using SDS-PAGE: A Detailed ... [https://www.goldbio.com/blogs/articles/protein-electrophoresis-sds-page-overview?srsltid=AfmBOop_m3-vOTRNlbD2X8uJv4CATYN8_DMsQm4NizDeKN1RMqGYSNKK]
- 32. Protein analysis SDS PAGE [https://www.qiagen.com/us/knowledge-and-support/knowledge-hub/bench-guide/protein/protein-analysis/protein-analysis-sds-page]
- 33. Extraction of proteins from gels-A brief review - PMC [https://pmc.ncbi.nlm.nih.gov/articles/PMC7295094/]
- 34. Native SDS-PAGE: High Resolution Electrophoretic ... [https://pmc.ncbi.nlm.nih.gov/articles/PMC4517606/]
- 35. Principle and Protocol of Native-PAGE [https://www.creativebiomart.net/resource/principle-protocol-principle-and-protocol-of-native-page-435.htm]
- 36. Overview of Two-Dimensional Gel Electrophoresis [https://www.creative-proteomics.com/resource/overview-of-two-dimensional-gel-electrophoresis.htm]
- 37. Understanding Electrophoresis Assays [https://www.bostonind.com/blog/understanding-electrophoresis-assays-principles-techniques-and-applications?srsltid=AfmBOooHUn2TQhlT-blar5bcvO9418jYimvxeldFc4B7YMm73QCbhGy1]
- 38. Seed protein electrophoresis in plant genetics [https://pmc.ncbi.nlm.nih.gov/articles/PMC12254572/]
- 39. Gel Electrophoresis Steps [https://azurebiosystems.com/blog/gel-electrophoresis-steps/]
- 40. Gel Electrophoresis Sample Preparation [https://www.thermofisher.com/us/en/home/references/protein-analysis-guide/protein-separation/gel-electrophoresis-sample-preparation.html]
- 41. Coomassie blue staining - Proteins and protein analysis [https://www.abcam.com/en-us/knowledge-center/proteins-and-protein-analysis/coomassie-blue-staining]
- 42. Protein Gel Staining: Coomassie, Silver, Fluorescent & More [https://www.creative-proteomics.com/resource/protein-gel-staining-methods.htm]
- 43. Coomassi Blue Staining [https://www.thermofisher.com/us/en/home/references/protocols/proteins-expression-isolation-and-analysis/staining-protein-gels/coomassie-staining.html]
- 44. Colorimetric and Fluorescent Gel Staining [https://www.licorbio.com/applications/colorimetric-and-fluorescent-gel-staining]
- 45. Fluorescent Protein Gel and Membrane Stains [https://www.thermofisher.com/us/en/home/life-science/protein-biology/protein-gel-electrophoresis/protein-gel-staining-imaging/fluorescent-protein-gel-stains.html]
- 46. Protein Analysis Techniques: A New Era of Detection and ... [https://www.uprtek.com/en/blogs/protein-analysis-techniques]
- 47. SDS-PAGE: The science behind all those bubbles [https://www.antibodiesinc.com/pages/sds-page-demystified?srsltid=AfmBOopl6I0epMBTygFlkyAw4aRvOnZez3of7J9Ddp9xcztED3yrE5So]
- 48. Performing a Protein Purity Analysis Comparability Study [https://www.biopharminternational.com/view/performing-protein-purity-analysis-comparability-study]
- 49. : Western , Blotting ... - Creative Proteomics Principles Applications [https://www.creative-proteomics.com/resource/western-blotting-principles-applications-experimental-techniques.htm]
- 50. The principle and method of Western (WB) | MBL Life... blotting [https://ruo.mbl.co.jp/bio/e/support/method/westernblotting.html]
- 51. Troubleshooting Common Electrophoresis Problems and ... [https://www.labx.com/resources/troubleshooting-common-electrophoresis-problems-and-artifacts/5539]
- 52. Troubleshooting SDS-PAGE Gel Running Issues [https://www.goldbio.com/blogs/articles/troubleshooting-sds-page-gel-running-issues?srsltid=AfmBOoqePLu7-GWsvXM2WRRVxSljwvmGUZnl5REIdkGIYKBfPGvlM3Aa]
- 53. : Gel , Types & Steps Explained Electrophoresis Principles [https://www.vedantu.com/biology/gel-electrophoresis]
- 54. (PDF) Gel of Electrophoresis Proteins [https://www.academia.edu/53976139/Gel_Electrophoresis_of_Proteins]
- 55. Nucleic Acid Gel Electrophoresis Troubleshooting [https://www.thermofisher.com/us/en/home/life-science/cloning/cloning-learning-center/invitrogen-school-of-molecular-biology/na-electrophoresis-education/na-electrophoresis-troubleshooting.html]
- 56. Troubleshooting SDS-PAGE Sample Preparation Issues [https://www.goldbio.com/blogs/articles/troubleshooting-sds-page-sample-preparation-issues?srsltid=AfmBOoo_RdeM9NPWDM5AUc3WYAWvoItG8vrdiG8mLPS6Y-zCs5gCOOKb]
- 57. 酵母蛋白质组学分析与制备技术研究进展 [https://manu61.magtech.com.cn/zgnz/article/2025/0254-5071/2025-3-8.html]
- 58. 双向 蛋 —BIO-101 白 质 电 泳 [https://bio-protocol.org/bio101/e1010131]
- 59. 一维 蛋 入门 | Thermo Fisher Scientific - CN 白 质 凝 胶 电 泳 [https://www.thermofisher.com/cn/zh/home/technical-resources/technical-reference-library/protein-electrophoresis-western-blotting-support-center/protein-gel-1d-electrophoresis-support1/protein-gel-1d-electrophoresis-support-getting-started.html]
- 60. 基于聚丙烯酰胺凝胶电泳结合在线荧光成像的蛋白质特异性 ... [https://pmc.ncbi.nlm.nih.gov/articles/PMC12412021/]
- 61. 快速响应的光敏感性单细胞免疫印迹技术 [https://hupi.fudan.edu.cn/content.jsp?urltype=news.NewsContentUrl&wbtreeid=1041&wbnewsid=1377]
- 62. 文档系统市场 展望 | 全球视角与洞察 | Emergen Research 凝 胶 [https://www.emergenresearch.com/cn/industry-report/gel-documentation-system-market]
- 63. Protein Stains Support—Troubleshooting [https://www.thermofisher.com/us/en/home/technical-resources/technical-reference-library/protein-electrophoresis-western-blotting-support-center/protein-stains-support/protein-stains-support-troubleshooting.html]
- 64. Troubleshooting SDS-PAGE Gel Running Issues [https://www.goldbio.com/blogs/articles/troubleshooting-sds-page-gel-running-issues?srsltid=AfmBOoraPJPNhEE9DKtrdWdCrTu_A_3uo0NA39d_-anXMa_wSy020JLi]
- 65. Electrophoresis Market Trends, Share and Forecast, 2025- ... [https://www.coherentmarketinsights.com/market-insight/electrophoresis-market-2666]
- 66. North America Electrophoresis Reagents Market Report ... [https://www.linkedin.com/posts/bussiness-insights-tsr-research-and-media-pvt-ltd_north-america-electrophoresis-reagents-market-activity-7392575593474592768-atSq]
- 67. A Guide to Gradient Gels: The Why's and How's [https://bitesizebio.com/47184/gradient-gels/]
- 68. NuPAGE Tris-Acetate Gels [https://www.thermofisher.com/us/en/home/life-science/protein-biology/protein-gel-electrophoresis/protein-gels/nupage-tris-acetate-gels.html]
- 69. Pore gradient gel electrophoresis: theory, practice, and ... [https://www.sciencedirect.com/science/article/abs/pii/S0003267098003432]
- 70. Electrophoresis Market Size & Industry Demand 2025-2035 [https://www.futuremarketinsights.com/reports/electrophoresis-market]
- 71. Molecular-weight size marker [https://en.wikipedia.org/wiki/Molecular-weight_size_marker]
- 72. Molecular Weight Markers | DNA Ladders [https://www.promega.com/products/cloning-and-dna-markers/dna-ladder-rna-ladder/]
- 73. Tech Compare: Capillary vs. Gel Electrophoresis [https://www.labcompare.com/10-Featured-Articles/585409-Tech-Compare-Capillary-vs-Gel-Electrophoresis/]
- 74. Capillary Electrophoresis vs. Gel Electrophoresis [https://www.labx.com/resources/capillary-electrophoresis-vs-gel-electrophoresis-a-comprehensive-guide/5548]
- 75. Capillary Electrophoresis: Instrument Price and Cost ... [https://www.labx.com/resources/capillary-electrophoresis-instrument-price-and-cost-considerations/1142]
- 76. Capillary Electrophoresis vs Gel Electrophoresis [https://www.labmanager.com/capillary-electrophoresis-vs-gel-electrophoresis-comparing-separation-techniques-33684]
- 77. Performance comparison of capillary and agarose gel ... [https://pubmed.ncbi.nlm.nih.gov/18285269/]
- 78. A Comparison of gel (Hydragel 30) and capillary ... [https://www.sciencedirect.com/science/article/pii/S2352551721000330]
- 79. Should you use gel or capillary serum protein ... [https://myadlm.org/cln/articles/2025/julyaugust/should-you-use-gel-or-capillary-serum-protein-electrophoresis-to-monitor-myeloma]
- 80. Serum Protein Electrophoresis (SPEP) for Multiple Myeloma [https://www.patientpower.info/multiple-myeloma/serum-protein-electrophoresis-spep]
- 81. Understanding Serum Protein Electrophoresis (SPEP) for ... [https://www.mymyelomateam.com/resources/understanding-serum-protein-electrophoresis-spep-for-multiple-myeloma]
- 82. Multiple Myeloma Workup [https://emedicine.medscape.com/article/204369-workup]
- 83. Understanding and Interpreting Serum Protein ... - AAFP [https://www.aafp.org/pubs/afp/issues/2005/0101/p105.html]
- 84. Serum Protein Electrophoresis [https://emedicine.medscape.com/article/2087113-overview]
- 85. Tests to assess monoclonal protein [https://www.myeloma.org/monoclonal-protein-tests]
- 86. Tests for Multiple Myeloma [https://www.cancer.org/cancer/types/multiple-myeloma/detection-diagnosis-staging/testing.html]
- 87. In-depth structural proteomics integrating mass ... [https://www.frontiersin.org/journals/analytical-science/articles/10.3389/frans.2022.1107183/full]
- 88. Comparative proteomics using 2-D gel electrophoresis and ... [https://pmc.ncbi.nlm.nih.gov/articles/PMC1190382/]
- 89. Beyond the Hype: Top 5 Life Science Tech Trends Set to ... [https://www.decibio.com/insights/beyond-the-hype-top-5-life-science-tech-trends-set-to-define-2026]
- 90. Why Gel Electrophoresis Still Matters in 2025? [https://eureka.patsnap.com/blog/what-is-gel-electrophoresis-used-for/]
- 91. The Future of Proteomics is Up in the Air: Can Ion Mobility ... [https://pmc.ncbi.nlm.nih.gov/articles/PMC11161313/]