Protein Gel Electrophoresis: Principles, Methods, and Advanced Applications for Biomedical Research
This article provides a comprehensive guide to gel electrophoresis for protein separation, tailored for researchers, scientists, and drug development professionals.
Protein Gel Electrophoresis: Principles, Methods, and Advanced Applications for Biomedical Research
Abstract
This article provides a comprehensive guide to gel electrophoresis for protein separation, tailored for researchers, scientists, and drug development professionals. It covers foundational principles, including the core mechanisms of separation based on size and charge. The article details established and emerging methodologies like SDS-PAGE and capillary gel electrophoresis, alongside their critical applications in biopharmaceutical quality control and proteomics. A dedicated troubleshooting section addresses common challenges to ensure reproducible results, and a final section validates the technique through performance comparisons with other separation technologies and explores future trends, including automation and integration with mass spectrometry.
The Core Principles of Protein Separation: Understanding Gel Electrophoresis Fundamentals
Electrophoresis is a standard laboratory technique in which charged protein molecules are transported through a solvent by an electrical field [1]. First demonstrated by Swedish biochemist Arne Tiselius in 1937, this method exploits the fundamental property that biomolecules, including proteins, peptides, and nucleic acids, possess electrical charges and will migrate toward either the anode or cathode based on their net charge when placed in an electric field [2]. This technique provides a simple, rapid, and sensitive analytical tool for separating macromolecules based on their size, charge, and shape [1] [3].
In the context of protein research, electrophoresis serves as a fundamental step in many proteomics analyses, enabling researchers to separate complex protein mixtures, determine molecular weights, analyze protein purity, and investigate post-translational modifications [1]. The technique has evolved significantly since its inception, with modern implementations offering high-resolution separation of thousands of proteins in a single run, making it indispensable for drug development professionals seeking to understand disease mechanisms and identify novel therapeutic targets [1] [4].
Core Principles of Separation
The fundamental principle of electrophoresis relies on the phenomenon that charged particles experience a force and move through a medium when subjected to an electrical field. The direction and speed of this migration depend on the molecule's net charge, with positively charged molecules (cations) migrating toward the negative electrode (cathode) and negatively charged molecules (anions) moving toward the positive electrode (anode) [2]. For protein separation, this principle is harnessed using gel-based matrices that serve as molecular sieves, adding a size-based separation dimension to the charge-based migration.
Factors Governing Electrophoretic Mobility
The mobility of a molecule through an electric field during electrophoresis depends on several key factors that researchers must optimize for effective separation [1]:
- Field Strength: Mobility is proportional to the potential gradient (voltage). Higher voltages generally increase migration rates but can generate excessive heat if not properly controlled [2].
- Net Charge on the Molecule: Mobility is directly proportional to the net charge of the molecule. Higher charge density results in faster migration [2].
- Size and Shape of the Molecule: Mobility is inversely proportional to molecular size. Smaller, more compact molecules migrate faster than larger ones through the gel matrix [2].
- Buffer Ionic Strength: The optimum ionic strength is necessary as higher ionic strength increases the share of current carried by buffer ions, slowing sample migration and generating heat. Lower ionic strength reduces resolution due to reduced overall current [2].
- Matrix Properties: The viscosity and pore size of the gel matrix significantly affect separation. Matrices with smaller pores provide better resolution for smaller molecules but restrict the movement of larger molecules [1].
Table 1: Key Factors Affecting Electrophoretic Mobility
| Factor | Effect on Mobility | Practical Consideration |
|---|---|---|
| Molecular Size | Inversely proportional | Larger molecules migrate slower |
| Net Charge | Directly proportional | Higher charge increases migration rate |
| Field Strength | Proportional | Higher voltage speeds separation but increases heat |
| Buffer Ionic Strength | Complex effect | Optimal strength needed; too high causes overheating |
| Matrix Pore Size | Inversely related | Smaller pores provide better resolution for small molecules |
Mathematical Relationship of Separation
The electrophoretic mobility (μ) of a molecule can be described by the following relationship:
μ = q / (6πηr)
Where:
- q = net charge on the molecule
- η = viscosity of the medium
- r = molecular radius
This equation illustrates that mobility is directly proportional to net charge and inversely proportional to molecular size and medium viscosity. In practical terms, this means that under constant experimental conditions, small, highly charged molecules will migrate fastest, while large molecules with low charge will migrate slowest [2].
Support Matrices and Their Properties
The support matrix serves as a critical component in gel electrophoresis, providing a porous medium that acts as a molecular sieve to separate molecules based on size as they migrate under the influence of the electric field. The choice of matrix significantly impacts resolution and separation efficiency [1] [2].
Polyacrylamide Gel Matrix
Polyacrylamide gel is formed by polymerizing acrylamide monomers in the presence of a crosslinking agent, typically N,N'-methylenebisacrylamide (bis-acrylamide) [1]. The polymerization reaction is initiated by ammonium persulfate (APS) and catalyzed by N,N,N',N'-tetramethylethylenediamine (TEMED) [1] [5]. The resulting gel forms a three-dimensional network with pore sizes that can be precisely controlled by adjusting the concentrations of acrylamide and bis-acrylamide, typically ranging between 20 and 150 nm in diameter [5].
Polyacrylamide gels are particularly favored for protein separation due to their smaller pore sizes, which provide superior resolution for most proteins and smaller nucleic acids [1]. The total concentration of acrylamide plus bis-acrylamide (expressed as %T) determines the pore size, with higher percentages creating smaller pores better suited for separating smaller molecules [5].
Table 2: Polyacrylamide Gel Concentrations for Optimal Separation
| Gel Percentage | Separation Range for Proteins | Application Focus |
|---|---|---|
| 7-8% | 50-150 kDa | Large proteins |
| 10% | 20-100 kDa | Standard separation |
| 12% | 15-70 kDa | Standard separation |
| 15% | 10-50 kDa | Small proteins |
Agarose Gel Matrix
Agarose, a polysaccharide polymer derived from red algae, forms gels with larger pore sizes suitable for separating larger molecules and protein complexes [1] [6]. When heated and cooled, agarose forms a gel matrix with pore sizes ranging from 50 to 200 nm in diameter, governed by gel concentration [5]. Agarose gels are typically used for separating nucleic acids and large protein complexes but have limited application for standard protein separation due to their larger pore size [1].
Buffer Systems
The buffer in electrophoresis serves two critical functions: carrying the electric current and maintaining stable pH to ensure molecules retain their charge throughout separation [2]. The discontinuous buffer system used in SDS-PAGE incorporates two different buffers: one for the stacking gel and another for the resolving gel, which concentrates proteins into sharp bands before separation by size [1].
Methodologies and Experimental Approaches
SDS-PAGE (Denaturing Electrophoresis)
Sodium dodecyl sulfate-polyacrylamide gel electrophoresis (SDS-PAGE) represents the most widely used electrophoresis technique for protein separation, employing a discontinuous buffer system that separates proteins primarily by mass [1]. The methodology involves several critical steps:
Sample Preparation: Protein samples are heated between 70-100°C in the presence of excess SDS and a reducing agent (β-mercaptoethanol or dithiothreitol) [1]. SDS denatures proteins by wrapping around the polypeptide backbone while the reducing agent cleaves disulfide bonds, fully dissociating proteins into their subunits [1]. Most polypeptides bind SDS in a constant weight ratio (approximately 1.4 g SDS per 1 g polypeptide), masking intrinsic charges and creating uniformly negatively charged complexes [1].
Gel Preparation: SDS-PAGE uses a discontinuous gel system consisting of:
- Stacking Gel: A lower concentration gel (typically 4-5% acrylamide) with a different pH (e.g., 6.8) that concentrates proteins into a sharp band before entering the resolving gel [1].
- Resolving Gel: A higher concentration gel (typically 7-15% acrylamide, depending on target protein sizes) with higher pH (e.g., 8.8) where actual separation occurs [1].
Example Traditional Polyacrylamide Gel Formulation [1]:
- 7.5 mL 40% acrylamide solution
- 3.9 mL 1% bisacrylamide solution
- 7.5 mL 1.5 M Tris-HCl, pH 8.7
- Water to 30 mL total volume
- 0.3 mL 10% APS
- 0.3 mL 10% SDS
- 0.03 mL TEMED
Electrophoretic Run: Prepared samples are loaded into wells, and current is applied (typically 100-200 V for 30-90 minutes, depending on gel size). Proteins migrate toward the anode, with smaller polypeptides moving faster through the gel matrix [1].
Visualization: Separated proteins are typically visualized using stains such as Coomassie Blue, silver stain, or fluorescent dyes [7]. For specific detection, proteins can be transferred to membranes for Western blotting with antibody probes [1] [7].
Diagram 1: SDS-PAGE Workflow
Native-PAGE
Native polyacrylamide gel electrophoresis (Native-PAGE) separates proteins according to their net charge, size, and shape while maintaining their native structure [1]. Unlike SDS-PAGE, no denaturants are used, allowing multimeric proteins to retain subunit interactions and enzymatic activity [1]. This technique is particularly valuable for studying protein complexes, oligomeric states, and functional analyses where maintaining native conformation is essential [1].
Two-Dimensional Electrophoresis
Two-dimensional polyacrylamide gel electrophoresis (2D-PAGE) provides the highest resolution for protein analysis by separating proteins based on two distinct properties in sequential steps [1]:
First Dimension - Isoelectric Focusing (IEF): Proteins are separated according to their native isoelectric point (pI) using immobilized pH gradient (IPG) strips that establish a pH gradient [1]. Proteins migrate until they reach their isoelectric point (pI), where their net charge becomes zero [2].
Second Dimension - SDS-PAGE: The IPG strip is then applied to an SDS-polyacrylamide gel, and proteins are separated by mass at a 90° angle to the first dimension run [1]. This orthogonal separation approach can resolve thousands of proteins in a single gel, making it invaluable for proteomic research [1].
Capillary Electrophoresis
Capillary electrophoresis (CE) represents an advanced format where separation occurs in narrow-bore capillaries filled with separation matrix [8] [2]. This format offers several advantages over traditional gel-based methods, including automation, higher resolution, superior reproducibility, quantitative precision, and reduced consumption of samples and reagents [8]. For SDS-based separations, CE-SDS (capillary electrophoresis-sodium dodecyl sulfate) provides an automated, quantitative alternative to traditional SDS-PAGE with minimal hands-on time [8].
The Scientist's Toolkit: Essential Research Reagents
Successful protein electrophoresis requires specific reagents and materials, each serving a distinct function in the separation process. The following table details key components essential for electrophoretic experiments:
Table 3: Essential Research Reagents for Protein Electrophoresis
| Reagent/Material | Function | Application Notes |
|---|---|---|
| Acrylamide/Bis-acrylamide | Forms polyacrylamide gel matrix | Neurotoxic; handle with protective equipment [5] |
| Ammonium Persulfate (APS) | Initiates polymerization | Free radical source for acrylamide polymerization [1] |
| TEMED | Catalyzes polymerization | Promotes free radical production by APS [1] |
| SDS (Sodium Dodecyl Sulfate) | Denatures proteins, confers uniform charge | Critical for SDS-PAGE; masks intrinsic protein charges [1] |
| Reducing Agents (β-mercaptoethanol, DTT) | Cleaves disulfide bonds | Ensures complete protein denaturation into subunits [1] |
| Tris Buffers | Maintains pH during electrophoresis | Different pH for stacking (6.8) and resolving (8.8) gels [1] |
| Molecular Weight Markers | Size reference for separated proteins | Pre-stained or unstained protein ladders [1] |
| Tracking Dye | Visualizes migration front | Bromophenol blue or xylene cyanol in sample buffer [7] |
| Protein Stains (Coomassie, Silver, Fluorescent) | Visualizes separated proteins | Different sensitivity levels; Coomassie most common [7] |
Factors Affecting Resolution and Performance
Several technical factors must be optimized to achieve high-resolution protein separation by electrophoresis:
Gel Percentage Selection: The appropriate acrylamide concentration must be matched to the target protein size range. Lower percentage gels (7-10%) are optimal for high molecular weight proteins, while higher percentages (12-15%) provide better resolution for smaller proteins [1]. Gradient gels, with increasing acrylamide concentration from top to bottom, can separate a broader range of protein sizes in a single run [1].
Buffer Composition and Ionic Strength: Buffer ionic strength affects both migration rate and resolution. Higher ionic strength increases current sharing with buffer ions, slowing protein migration and generating excessive heat that can cause band diffusion and distortion [2]. Lower ionic strength reduces overall current and may decrease resolution [2].
Voltage and Run Conditions: Applied voltage must be balanced against gel size and cooling capacity. Higher voltages reduce run time but can generate heat that melts gels or creates smiling bands [7]. Standard SDS-PAGE runs typically use 100-200 V constant voltage for mini-gels [1].
Electroendosmosis: This phenomenon occurs when fixed charged groups on the support matrix (such as sulfate groups in agarose) become ionized and migrate, creating a counterflow that can impede sample movement and reduce resolution [2]. Using ultrapure agarose with low sulfate content minimizes this effect [2].
Diagram 2: Separation Principle in Gel Matrix
Advanced Applications and Future Directions
Protein electrophoresis continues to evolve with technological advancements that enhance its utility in research and drug development:
Biopharmaceutical Applications: Electrophoresis techniques, particularly CE-SDS, have become critical analytical tools in biopharmaceutical development and quality control [8]. Regulatory filings for commercial biotherapeutics frequently include CE-SDS data to characterize protein therapeutics, including monoclonal antibodies, bispecific antibodies, antibody-drug conjugates, fusion proteins, and viral vectors [8].
Diagnostic Applications: Clinical diagnostics employs protein electrophoresis for detecting and monitoring various conditions. Immunoelectrophoresis and immunofixation electrophoresis are used to identify abnormal gamma-globulin fractions and free light chains in patients with monoclonal or polyclonal gammopathy [2]. High-resolution techniques like isoelectric focusing can fractionate hemoglobin variants for diagnosing hemoglobinopathies [2].
Proteomics Research: Two-dimensional electrophoresis remains a cornerstone of proteomic research, enabling comprehensive analysis of complex protein mixtures from cells, tissues, or biological fluids [1]. When combined with mass spectrometry, 2D-PAGE facilitates protein identification, quantification of expression changes, and detection of post-translational modifications [1].
Technology Advancements: The field continues to advance with trends toward miniaturization, automation, and integration of digital technologies [9]. Automated systems with integrated software for gel visualization, analysis, and data management are becoming standard, enhancing reproducibility and throughput while reducing manual errors [9]. These advancements align with the growing emphasis on precision, efficiency, and data integrity in both research and clinical applications.
This technical guide explores the fundamental physical and chemical factors governing protein migration in gel electrophoresis, a cornerstone technique in biochemical research and drug development. The separation of proteins in an electric field is a complex process dictated by an interplay of intrinsic molecular properties and extrinsic buffer conditions. A deep understanding of these factors—protein charge, size, and shape, combined with buffer pH, ionic strength, and composition—is essential for optimizing experimental design, improving resolution, and generating reproducible, high-quality data in applications ranging from proteomics to pharmaceutical quality control.
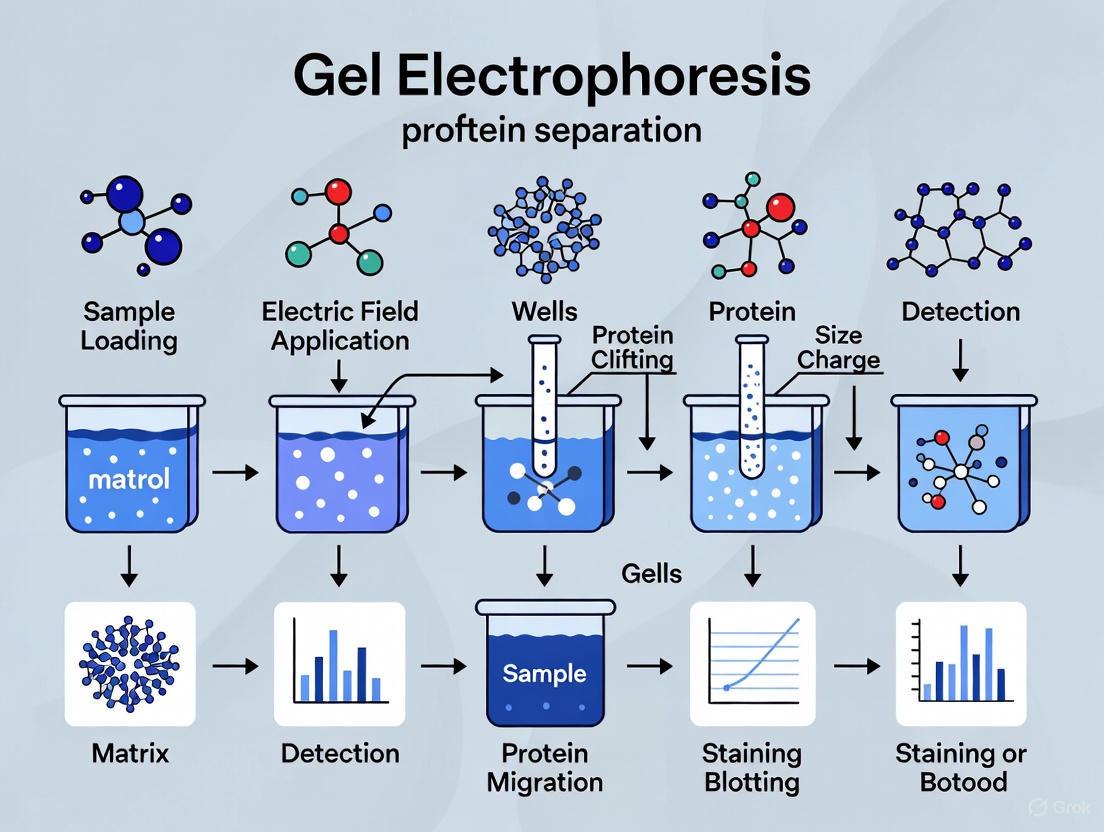
Gel electrophoresis is a foundational technique in molecular biology and biochemistry for the separation and analysis of complex protein mixtures. The general principle involves applying an electric field to drive the migration of charged protein molecules through a porous gel matrix [10]. The differential mobility of proteins through this matrix allows for their separation based on key physical characteristics.
The effectiveness of this separation, or electrophoretic mobility (μ), is described by the fundamental equation μ = v/E = q/f, where v is the velocity of the molecule, E is the electric field strength, q is the net charge of the molecule, and f is the frictional coefficient, which is influenced by the molecule's size and shape and the viscosity of the medium [11]. This review provides an in-depth examination of the core factors in this equation—charge, size, shape, and buffer conditions—framing them within the practical context of designing and interpreting protein electrophoresis experiments.
Intrinsic Factors Governing Protein Migration
Molecular Charge
The net charge of a protein is a primary determinant of its direction and speed of migration. Unlike nucleic acids, which possess a uniform negative charge, a protein's charge is determined by the ionizable groups on its constituent amino acids and is highly dependent on the pH of the surrounding buffer [10] [12].
- Isoelectric Point (pI): The pH at which a protein has a net charge of zero is its isoelectric point. When the buffer pH is less than the protein's pI, the protein carries a net positive charge and migrates toward the cathode. Conversely, when the buffer pH is greater than the pI, the protein is negatively charged and migrates toward the anode [10] [13]. At its pI, a protein's mobility ceases.
- Charge in SDS-PAGE: The use of sodium dodecyl sulfate (SDS) fundamentally alters protein charge. SDS is an anionic detergent that binds to hydrophobic regions of proteins, coating them in a uniform negative charge. This masks the protein's intrinsic charge, resulting in an approximately uniform charge-to-mass ratio for all SDS-protein complexes [11] [14]. This allows separation to proceed primarily based on molecular weight rather than native charge.
Molecular Size and Shape
The frictional coefficient (f) in the mobility equation represents the drag a molecule experiences as it moves through the gel matrix. This is profoundly affected by both the size and three-dimensional structure of the protein.
- Molecular Sieving: The gel matrix (e.g., polyacrylamide or agarose) acts as a molecular sieve. Smaller proteins can navigate the pores of the gel more easily, experiencing less friction and migrating faster, while larger proteins are more hindered and migrate more slowly [11] [12].
- Role in Native vs. Denaturing Electrophoresis: Under native conditions, without denaturants, a protein's shape and quaternary structure significantly influence its mobility. Compact, globular proteins will migrate faster than elongated, fibrous proteins of the same molecular weight [12]. In denaturing SDS-PAGE, reducing agents and heat disrupt disulfide bonds, and SDS linearizes the polypeptide chain, minimizing the influence of shape. Proteins thus migrate primarily as linear chains, with mobility being inversely proportional to the logarithm of their molecular weight [15] [14].
Table 1: Impact of Intrinsic Protein Properties on Electrophoretic Mobility
| Factor | Description | Impact on Migration | Technique for Control |
|---|---|---|---|
| Net Charge | Determined by amino acid composition and buffer pH. | Higher net charge increases mobility; direction depends on charge polarity. | Isoelectric focusing (IEF); manipulation of buffer pH. |
| Isoelectric Point (pI) | The pH where net charge is zero. | Defines the charge state and direction of migration at a given pH. | Key parameter for 2D-PAGE and native PAGE. |
| Molecular Size | Mass or number of amino acids. | Larger size increases frictional drag, decreasing mobility. | SDS-PAGE to separate by molecular weight. |
| Molecular Shape | Three-dimensional conformation (globular, fibrous). | Compact shapes migrate faster than extended shapes of similar mass. | Use of denaturants (SDS) to linearize proteins. |
| Quaternary Structure | Assembly of multiple polypeptide subunits. | Complexes have lower mobility than individual subunits. | Use of reducing agents (DTT, β-mercaptoethanol) to disrupt disulfide bonds. |
Extrinsic Buffer and Gel Conditions
The environment in which electrophoresis occurs is as critical as the properties of the proteins themselves. Buffer conditions and gel composition must be carefully controlled to ensure reproducible and accurate separations.
Buffer pH and Ionic Strength
The electrophoresis buffer provides the ions necessary for electrical conductivity and establishes the pH environment that dictates protein charge [16].
- pH Stability: The buffer must maintain a stable pH throughout the run. Changes in pH can alter the charge states of proteins mid-experiment, leading to distorted migration patterns, band broadening, and loss of resolution [10] [16].
- Ionic Strength: This measures the concentration of ions in the buffer. High ionic strength increases current and can lead to excessive Joule heating, which may denature proteins and cause gel smearing. Low ionic strength results in poor conductivity, slow migration, and band diffusion due to a weak electric field [10] [16]. An optimal ionic strength ensures efficient separation without overheating.
Table 2: Key Buffer Conditions and Their Electrophoretic Effects
| Buffer Parameter | Optimal Condition | Effect of High Value | Effect of Low Value |
|---|---|---|---|
| pH | Chosen based on protein pI or technique (e.g., Tris-HCl ~pH 8.8 for SDS-PAGE). | Alters protein charge; can cause protein deamidation or degradation. | Alters protein charge; may reduce stability. |
| Ionic Strength | Balanced to provide conductivity without excessive heat. | Excessive heat generation, gel smearing, and longer run times. | Poor separation, band diffusion, and slow migration. |
| Buffer Capacity | Sufficient to maintain stable pH for the duration of the run. | Can contribute to high ionic strength effects. | pH shifts during run, leading to unreliable migration. |
Gel Matrix Properties
The choice and composition of the gel matrix define the sieving properties that separate proteins by size.
- Gel Type: Agarose gels have larger pores and are typically used for separating large protein complexes or nucleic acids. Polyacrylamide gels offer a more uniform and smaller pore structure, providing superior resolution for most proteins [12]. The pore size in polyacrylamide is determined by the total concentration of acrylamide (%T) and the cross-linker bisacrylamide (%C) [13].
- Gel Concentration: The percentage of acrylamide dictates the effective separation range. Lower percentages (e.g., 8-10%) are optimal for high molecular weight proteins, while higher percentages (e.g., 12-15%) provide better resolution for low molecular weight proteins [15].
Experimental Protocols for Key Techniques
SDS-PAGE for Molecular Weight Determination
The Laemmli method of discontinuous SDS-PAGE is the gold standard for determining protein molecular weight and analyzing purity [15] [14].
Detailed Methodology:
- Sample Preparation: Protein samples are mixed with a sample buffer containing SDS (typically 1-2%), a reducing agent (β-mercaptoethanol or DTT), glycerol, and a tracking dye. The mixture is heated at 95-100°C for 5-10 minutes to ensure complete denaturation and linearization [15] [14].
- Gel Casting: A polyacrylamide gel is cast in two layers:
- Resolving Gel: The lower gel (e.g., 12% acrylamide, Tris-HCl pH 8.8) where size-based separation occurs.
- Stacking Gel: The upper gel (e.g., 4% acrylamide, Tris-HCl pH 6.8) that concentrates all proteins into a sharp band before they enter the resolving gel, improving resolution [14].
- Electrophoresis Run: The gel is mounted in a vertical tank, submerged in running buffer (e.g., Tris-Glycine-SDS). Samples and a pre-stained protein ladder are loaded. A constant voltage (e.g., 100-150V) is applied until the dye front reaches the bottom of the gel [15].
- Visualization and Analysis: The gel is stained with Coomassie Blue, silver stain, or fluorescent dyes. The migration distance of unknown proteins is compared to the standard curve generated from the molecular weight marker to estimate size [11] [17].
Native PAGE for Studying Protein Complexes
Native PAGE is performed without denaturants to preserve protein structure, activity, and non-covalent interactions [12].
Detailed Methodology:
- Sample and Buffer Preparation: Samples are prepared in a non-denaturing buffer without SDS or reducing agents. The pH of the gel and running buffer is carefully selected to maintain protein solubility and native charge. Common systems include Tris-Glycine at pH 8.8 or Tris-Borate at various pHs [12].
- Gel Casting and Run: A polyacrylamide or agarose gel is cast without SDS. The sample is loaded, and electrophoresis is performed, typically at 4°C to maintain stability. Since proteins retain their native charge, they can migrate toward either the anode or cathode depending on their pI and the buffer pH.
- Activity Staining: Following electrophoresis, proteins can be detected through activity assays (e.g., zymography for enzymes) or general protein stains, allowing for the analysis of functional complexes [12].
The Scientist's Toolkit: Essential Research Reagents
Table 3: Key Reagents for Protein Gel Electrophoresis
| Reagent / Material | Function / Purpose | Technical Notes |
|---|---|---|
| SDS (Sodium Dodecyl Sulfate) | Denatures proteins and confers a uniform negative charge. | Critical for SDS-PAGE; disrupts most non-covalent interactions. |
| Acrylamide/Bis-acrylamide | Monomer and cross-linker for forming the polyacrylamide gel matrix. | Polymerized gels act as a molecular sieve; concentration determines pore size. |
| Tris-based Buffers | Provides stable pH and ionic strength for gel polymerization and running. | Common formulations include Tris-HCl for gel casting and Tris-Glycine for running buffer. |
| DTT or β-Mercaptoethanol | Reducing agents that break disulfide bonds. | Ensures complete denaturation and subunit separation in reducing SDS-PAGE. |
| Coomassie Brilliant Blue | A dye that binds non-specifically to proteins for visualization. | Standard for general protein detection; sensitivity in the ~10-100 ng range. |
| SYBR-based Dyes | Fluorescent nucleic acid stains; used in EMSA protocols. | Safer alternative to ethidium bromide; high sensitivity for detecting DNA in gels [18]. |
| Agarose | Polysaccharide for making gels with larger pore sizes. | Ideal for native analysis of large protein complexes or nucleic acids [12]. |
| Molecular Weight Markers | Pre-stained or unstained protein standards of known molecular weight. | Essential for estimating the size of unknown proteins and monitoring run progress. |
Advanced Applications and Considerations
Understanding the core factors of protein migration enables more sophisticated techniques. Affinity Gel Electrophoresis (AGE) investigates specific protein-ligand interactions. In AGE, a ligand is immobilized within the gel matrix. A specific interaction between the protein and the ligand causes a decrease in electrophoretic mobility. The presence of a free, competing ligand in the buffer restores mobility, allowing for the quantification of dissociation constants (KD) [19]. This technique is powerful for studying enzyme-substrate, antibody-antigen, and protein-carbohydrate interactions.
Furthermore, two-dimensional gel electrophoresis (2D-PAGE) separates proteins based on two independent properties in sequential steps: first by their isoelectric point (pI) using isoelectric focusing, and then by molecular weight using SDS-PAGE [11]. This orthogonal separation provides extremely high resolution for analyzing complex protein mixtures, such as entire proteomes, and is capable of resolving thousands of proteins in a single experiment.
The migration of proteins in gel electrophoresis is a predictable phenomenon governed by the precise interplay of intrinsic molecular properties—charge, size, and shape—and carefully controlled extrinsic buffer conditions. Mastery of these factors is not merely academic; it is a practical necessity for researchers and drug development professionals. A deep understanding allows for the rational selection of the appropriate electrophoretic technique, optimization of protocols for maximum resolution and reproducibility, and, most importantly, the correct interpretation of experimental data. As electrophoresis continues to be a foundational tool in biochemistry and molecular biology, a firm grasp of these key influencing factors remains indispensable for advancing scientific discovery and ensuring the rigor of analytical data.
Gel electrophoresis remains a cornerstone technique in molecular biology and biochemistry laboratories worldwide, enabling the separation of charged macromolecules based on their size and charge. The technique's fundamental principle involves applying an electric field to move molecules through a porous gel matrix, which acts as a molecular sieve. Among the various matrices available, agarose and polyacrylamide represent the two primary support media, each with distinct properties that dictate their application scope and separation efficacy. The selection between these matrices is critical for researchers, particularly in protein separation research, where resolution, molecular size range, and downstream applications must be carefully considered. This technical guide provides an in-depth examination of agarose and polyacrylamide as molecular sieves, detailing their structural characteristics, separation mechanisms, and optimal applications within protein research and drug development contexts.
The sieving properties of these matrices originate from their nanoporous structures, which retard the movement of molecules in a size-dependent manner. When an electric field is applied, charged molecules migrate through this porous network, with smaller molecules navigating the pores more readily than larger counterparts, resulting in differential migration distances. This molecular sieving effect forms the basis for size-based separations critical for protein characterization, purity assessment, and functional analysis in both academic research and pharmaceutical development pipelines. Understanding the nuanced interplay between gel matrix structure and separation performance empowers researchers to select optimal conditions for their specific experimental requirements, thereby enhancing data quality and experimental throughput.
Fundamental Properties and Separation Mechanisms
Structural Composition and Pore Formation
The structural foundations of agarose and polyacrylamide gels dictate their fundamental sieving properties. Agarose, a natural polysaccharide derived from seaweed, forms a gel through hydrogen bonding and hydrophobic interactions that create a three-dimensional network with large, non-uniform pores [20] [21]. This matrix is characterized by its mechanical stability and thermal reversibility, allowing gels to be remelted if necessary. The pore size in agarose gels is primarily controlled by adjusting the agarose concentration, with lower concentrations (0.5-1%) generating larger pores suitable for big macromolecules, and higher concentrations (2-3%) creating smaller pores for improved separation of smaller species [21].
In contrast, polyacrylamide gels are synthetic polymers formed through a chemical polymerization reaction between acrylamide monomers and a cross-linking agent, typically N,N'-methylenebisacrylamide (bis-acrylamide) [22] [1]. This covalent cross-linking creates a uniform mesh with precisely controllable pore sizes. The polymerization is catalyzed by ammonium persulfate (APS) and tetramethylethylenediamine (TEMED), which generate free radicals to initiate the chain reaction [1]. The pore dimensions in polyacrylamide gels are determined by both the total acrylamide concentration (%T) and the cross-linker ratio (%C), enabling exquisite control over the sieving properties for high-resolution separations [22].
Table 1: Fundamental Structural Properties of Agarose and Polyacrylamide Gels
| Property | Agarose Gel | Polyacrylamide Gel |
|---|---|---|
| Chemical Nature | Natural polysaccharide from seaweed | Synthetic polymer of acrylamide and bis-acrylamide |
| Gel Formation Mechanism | Physical gelation via hydrogen bonding and hydrophobic interactions | Chemical polymerization via free radical reaction |
| Polymerization Trigger | Cooling of heated solution | Chemical catalysts (APS/TEMED) |
| Pore Size Distribution | Large, non-uniform pores | Small, highly uniform pores |
| Primary Pore Control | Agarose concentration | Total acrylamide concentration and cross-linker ratio |
| Mechanical Strength | High, forms robust gels | Brittle, requires glass plates for support |
| Thermal Properties | Thermoreversible (can be remelted) | Thermally stable (irreversible formation) |
Molecular Sieving Mechanisms
The molecular sieving mechanisms in both gel types operate on the principle of size-based separation, but their specific interactions with migrating molecules differ significantly. In agarose gels, the large, random pore structure functions as a obstacle course where smaller molecules navigate through the matrix more rapidly than larger molecules that experience greater frictional resistance and more frequent collisions with the gel fibers [20] [21]. This sieving mechanism is particularly effective for large DNA fragments and big protein complexes, where the resolution, while lower than polyacrylamide, remains sufficient for many applications including DNA fragment analysis and protein complex separation [23].
Polyacrylamide gels provide a more refined sieving action due to their homogeneous, well-defined pore structure that creates a more predictable migration environment [22]. For protein separations, the system is often enhanced with sodium dodecyl sulfate (SDS) in SDS-PAGE, where the detergent denatures proteins and confers a uniform negative charge, ensuring separation occurs primarily based on molecular mass rather than charge or shape [22] [1]. In native PAGE, however, proteins retain their higher-order structure, and separation depends on both intrinsic charge and molecular dimensions, enabling functional analysis of proteins in their native state [24] [1]. The discontinuous buffer system commonly used in polyacrylamide electrophoresis further enhances resolution by stacking proteins into tight bands before they enter the separating gel, sharpening the resulting bands [22].
Comparative Performance and Applications
Separation Range and Resolution Characteristics
The separation ranges of agarose and polyacrylamide gels complement each other, covering the full spectrum of biomolecule sizes encountered in research. Agarose gels excel in separating large DNA fragments from 100 base pairs to over 20 kilobases, with optimal resolution achieved by modulating agarose concentration [20] [23]. For protein applications, agarose is suitable for large protein complexes and can separate hyaluronan in the range of approximately 5-500 kDa, with excellent linear calibration obtained for molecular masses as low as 9 kDa in specific formulations [25]. The resolution offered by agarose, while sufficient for many applications, remains lower than polyacrylamide, making it ideal for analytical separations where extreme resolution is not required.
Polyacrylamide gels provide superior resolution for smaller molecules, capable of separating proteins from 5-250 kDa in standard SDS-PAGE systems [22]. Gradient polyacrylamide gels extend this range further, offering enhanced resolution for complex protein mixtures by continuously varying pore sizes throughout the gel [25] [1]. The high resolution of polyacrylamide enables discrimination of proteins differing by just a few thousand Daltons, and for nucleic acids, can resolve fragments differing by a single base pair [20] [23]. This exceptional resolving power makes polyacrylamide indispensable for proteomic research, protein purity assessment, and detailed characterization of therapeutic proteins in drug development.
Table 2: Performance Characteristics and Optimal Applications
| Parameter | Agarose Gel | Polyacrylamide Gel |
|---|---|---|
| Effective Separation Range | DNA: 100 bp - 20 kbpProteins: 5-500 kDa (specialized) | Proteins: 5-250 kDa (standard SDS-PAGE)Small nucleic acids: <1000 bp |
| Resolution Capability | Lower resolution, suitable for larger fragments | High resolution, can distinguish <1 kDa differences for proteins |
| Optimal Gel Concentrations | 0.5% (large DNA), 1.5-2% (small DNA), 2-4% (proteins) | 6-8% (large proteins), 10-12% (standard proteins), 15-20% (small proteins/peptides) |
| Primary Applications | DNA analysis, RNA integrity checking, large protein complexes | Protein analysis (SDS-PAGE, native PAGE), western blotting, protein complex studies |
| Detection Sensitivity | Moderate (typically requires 0.5-2.5 μg nucleic acid) | High (can detect <0.5 μg protein with silver staining) |
| Quantitation Capability | Good for relative quantitation of nucleic acids | Excellent for protein quantitation with appropriate standards |
Application-Specific Considerations for Protein Research
The selection between agarose and polyacrylamide for protein research depends heavily on the experimental objectives, target protein characteristics, and downstream applications. Agarose gels find specialized utility in separating very large protein complexes and specific glycoconjugates like hyaluronan, where their large pore structure permits migration of macromolecular assemblies that would be excluded from polyacrylamide matrices [25]. Recent innovations in capillary agarose gel electrophoresis have demonstrated its value for therapeutic protein analysis, offering rapid, baseline hump-free separation of monoclonal antibodies and fusion proteins across a wide molecular weight range [26].
Polyacrylamide gels remain the gold standard for most protein electrophoresis applications due to their superior resolving power and versatility. SDS-PAGE provides reliable molecular mass estimation under denaturing conditions and is fundamental for protein purity assessment, western blotting, and mass spectrometry sample preparation [22] [1]. Native PAGE preserves protein structure and function, enabling the study of protein complexes, enzyme activity after separation, and metal-binding properties [24]. Two-dimensional PAGE combining isoelectric focusing with SDS-PAGE represents the highest resolution method for complex protein mixtures, capable of resolving thousands of proteins in proteomic studies [1]. For drug development professionals, polyacrylamide gel electrophoresis provides critical quality control capabilities for biopharmaceutical characterization, including assessment of protein aggregation, degradation, and post-translational modifications.
Experimental Methodologies
Agarose Gel Electrophoresis for Macromolecular Separation
The preparation and execution of agarose gel electrophoresis for protein and large biomolecule separation follows a standardized methodology with specific modifications for different analyte classes. For separation of hyaluronan samples in the 5-500 kDa range, researchers have developed optimized protocols using both Tris-acetate-EDTA (TAE) and Tris-borate-EDTA (TBE) buffer systems [25]. The gel concentration typically ranges from 0.5% to 4.0% agarose, with higher concentrations providing better resolution for lower molecular weight species.
Detailed Protocol for Protein Separation in Agarose Gels:
- Gel Preparation: Select appropriate agarose type (standard or high-resolution) and concentration based on target protein size. For most protein applications, 1-3% gels provide optimal separation. Dissolve agarose in appropriate buffer (TAE: 40 mM Tris, 5 mM CH₃COONa, 0.9 mM EDTA, pH 7.9; or TBE: 100 mM Tris-borate, 1 mM EDTA, pH 8.3) using heating and mixing until completely dissolved [25].
- Casting: Cool agarose solution to 50-60°C, then pour into casting tray with well comb in place. Allow to solidify completely at room temperature (20-30 minutes).
- Sample Preparation: Mix protein samples with loading buffer (typically containing glycerol for density and tracking dyes). For quantitative analysis, include appropriate protein standards.
- Electrophoresis Conditions: Place gel in electrophoresis chamber filled with running buffer. Apply samples to wells. Run at constant voltage (typically 80-120 V) for 45-90 minutes, depending on gel size and separation requirements.
- Detection: Stain with appropriate protein stains (Stains-All, Coomassie Blue, or silver stain) followed by destaining in water. For hyaluronan detection, Stains-All dye (3,3'-dimethyl-9-methyl-4,5,4',5'-dibenzothiacarbocyanine) provides sensitive detection [25].
- Analysis: Document separation using densitometric scanning and calculate molecular mass averages using appropriate standards for calibration.
For high-percentage agarose gels (3.0-4.0%), a modified preparation protocol is recommended to ensure complete dissolution and proper gelling. The agarose powder is slowly sprinkled into chilled buffer while stirring, followed by controlled heating with intermittent swirling to achieve complete dissolution without excessive evaporation [25]. The final gel concentration should be verified by weight, replacing any evaporated water with hot deionized water to maintain accurate matrix density.
Polyacrylamide Gel Electrophoresis for High-Resolution Protein Separation
SDS-PAGE represents the most widely used protein electrophoresis technique, providing reliable size-based separation under denaturing conditions. The discontinuous buffer system, initially described by Laemmli, employs stacking and resolving gels with different pore sizes and pH to achieve high-resolution separation [22].
Detailed Protocol for SDS-PAGE:
- Gel Preparation: Prepare resolving gel solution appropriate for target protein size (7-12% acrylamide for most applications). The solution contains acrylamide/bis-acrylamide, Tris-HCl buffer (pH 8.8), SDS, and polymerization initiators (APS and TEMED). Pour between glass plates, overlay with isopropanol or water to create flat interface, and allow to polymerize (15-30 minutes) [1].
- Stacking Gel Preparation: After resolving gel polymerization, remove overlay liquid and add stacking gel solution (lower acrylamide concentration, typically 4-5%, with Tris-HCl buffer pH 6.8). Insert well comb and allow to polymerize.
- Sample Preparation: Mix protein samples with SDS-PAGE loading buffer (containing SDS, reducing agent such as β-mercaptoethanol, glycerol, and tracking dye). Heat at 70-100°C for 3-5 minutes to denature proteins [22] [1].
- Electrophoresis: Assemble gel in electrophoresis apparatus filled with running buffer (typically Tris-glycine with SDS). Load samples and molecular weight markers. Run at constant voltage (100-200 V) until tracking dye reaches gel bottom (typically 40-60 minutes).
- Detection: Stain with Coomassie Blue, silver stain, or fluorescent stains according to required sensitivity. For western blotting, transfer proteins to membrane after electrophoresis.
Native PAGE Protocol for Functional Protein Analysis: Native PAGE preserves protein structure and function by omitting denaturants from all buffers. The protocol follows similar steps to SDS-PAGE with key modifications:
- Sample Preparation: Mix protein samples with native loading buffer (containing glycerol and tracking dye but no SDS or reducing agents). Do not heat samples [24] [1].
- Gel and Buffer Composition: Prepare gels without SDS. Use running buffers without SDS, typically Tris-glycine or TBE at pH 8.3-8.8 [24].
- Electrophoresis Conditions: Run at constant voltage (100-150 V) at 4°C to maintain protein stability. Higher voltages may generate excessive heat that denatures proteins.
- Activity Staining: For enzyme detection, use specific activity stains instead of general protein stains.
A specialized variant called NSDS-PAGE (native SDS-PAGE) employs reduced SDS concentration (0.0375% in running buffer) and eliminates EDTA and heating steps, resulting in retention of Zn²⁺ in metalloproteins and preservation of activity for seven of nine model enzymes tested [24].
The Scientist's Toolkit: Essential Reagents and Materials
Successful execution of gel electrophoresis experiments requires specific reagents and materials optimized for each matrix type. The following research reagent solutions represent essential components for protein separation workflows using both agarose and polyacrylamide gel systems.
Table 3: Essential Research Reagents for Protein Gel Electrophoresis
| Reagent/Material | Function | Application Specifics |
|---|---|---|
| Agarose (Various Types) | Matrix formation for large pore gels | Standard agarose for routine separations; low-melting point for fragment recovery; high-resolution for improved band sharpness [21] |
| Acrylamide/Bis-acrylamide | Matrix formation for polyacrylamide gels | 29:1 or 37.5:1 acrylamide:bis ratio common; concentration determines pore size; neurotoxic monomer requires careful handling [22] [1] |
| SDS (Sodium Dodecyl Sulfate) | Protein denaturation and charge uniformity | Anionic detergent that binds proteins at ~1.4g SDS per 1g protein; masks intrinsic charge [22] [1] |
| APS (Ammonium Persulfate) and TEMED | Polyacrylamide gel polymerization | Free radical initiators catalyze acrylamide polymerization; fresh preparation required for consistent results [1] |
| Tris-Based Buffers | pH maintenance and current conduction | Discontinuous system: Tris-HCl pH 6.8 (stacking) and pH 8.8 (resolving); continuous systems also available [22] |
| Tracking Dyes | Migration monitoring | Bromophenol blue (migrates at ~4 kDa) and xylene cyanol (~20 kDa) common in SDS-PAGE [22] |
| Reducing Agents | Disulfide bond reduction | β-mercaptoethanol or DTT breaks disulfide linkages for complete denaturation [22] |
| Protein Molecular Weight Markers | Size calibration and estimation | Pre-stained or unstained standards covering specific size ranges (e.g., 10-250 kDa) [1] |
| Staining Solutions | Protein detection | Coomassie Blue (moderate sensitivity), silver stain (high sensitivity), fluorescent stains (quantitative) [25] [1] |
The selection between agarose and polyacrylamide as molecular sieves represents a critical decision point in experimental design for protein separation research. Each matrix offers distinct advantages that make it suitable for specific applications: agarose with its large pore structure accommodates massive protein complexes and specialized macromolecules, while polyacrylamide provides unparalleled resolution for standard protein analyses. Understanding the fundamental principles underlying their molecular sieving mechanisms enables researchers to make informed decisions that optimize separation efficiency and data quality.
Recent methodological advances continue to expand the applications of both matrix types. Innovations in agarose gel formulations, including tetrahydroxyborate-stabilized matrices for capillary electrophoresis, enable rapid, hump-free analysis of therapeutic proteins [26]. Modifications to traditional polyacrylamide protocols, such as NSDS-PAGE, preserve metal binding and enzymatic activity while maintaining high resolution [24]. These developments underscore the dynamic nature of electrophoretic separation technologies and their continued relevance in modern biological research and drug development. As protein therapeutics increase in complexity, with emerging modalities including multispecific antibodies, antibody-drug conjugates, and fusion proteins, the role of appropriate gel matrix selection becomes increasingly critical for accurate characterization and quality assurance in pharmaceutical development pipelines.
Electrophoresis, a cornerstone technique in analytical biochemistry, has fundamentally shaped the field of protein separation research. The principle, first proposed in the 1930s, involves the migration of charged particles through a medium under the influence of an electric field [10]. For proteins, this technique leverages their inherent charge properties, which vary based on their amino acid composition and the pH of their environment. The rate of migration is influenced by multiple factors including the protein's net charge, size and shape, the composition of the separation medium, and the buffer conditions such as pH and ionic strength [10]. This foundational principle has been implemented in increasingly sophisticated formats over the decades, driving progress in proteomics, drug development, and clinical diagnostics. The evolution from slab gels to capillary and microchip systems represents a continuous pursuit of higher resolution, faster analysis, and greater automation, enabling researchers to address increasingly complex biological questions.
The Evolution of Electrophoresis Formats
Slab Gel Electrophoresis: The Foundational Tool
The 1950s and 1960s saw the establishment of slab gel electrophoresis as a standard laboratory technique, particularly with the introduction of polyacrylamide gels which allowed for improved differentiation of proteins and nucleic acids [10]. In this format, samples are loaded into wells at one end of a gel slab, and an electric field is applied, causing charged molecules to migrate through the porous matrix. The gel acts as a molecular sieve, separating proteins primarily by size in denaturing conditions (SDS-PAGE) or by both size and charge in native conditions [1]. The polyacrylamide matrix is created by polymerizing acrylamide with bisacrylamide, forming a cross-linked network whose pore size can be precisely controlled by adjusting the concentration of acrylamide and the cross-linking ratio [1]. This allows researchers to tailor the separation for specific protein size ranges. Slab gel electrophoresis remains a fundamental tool due to its simplicity, low cost, and ability to analyze multiple samples simultaneously on a single gel [27]. Its visual, post-stain readout provides intuitive qualitative data, and separated proteins can be excised for downstream analysis, making it a versatile preparatory and analytical tool [27].
Capillary Electrophoresis: The Shift to Automation
The 1980s and 1990s marked a significant transition with the advent of capillary electrophoresis (CE), which offered higher resolution and longer analysis times due to reduced particle diffusion in narrow capillaries [10]. CE miniaturizes the separation path into a fused-silica capillary typically 25-75 µm in diameter and up to 100 cm long [27]. This format enables the application of very high electric field strengths (300-600 V/cm) because the high surface-to-volume ratio efficiently dissipates Joule heat, preventing sample degradation [27]. Separation in CE is governed by the combination of electrophoretic mobility (the movement of charged species in an electric field) and electroosmotic flow (the bulk flow of buffer solution caused by the charged capillary wall) [28]. Detection occurs in real-time through on-capillary detection systems such as UV absorbance or laser-induced fluorescence (LIF), providing quantitative digital data in the form of electropherograms [27]. The automation of sample injection, separation, and capillary rinsing makes CE highly reproducible and suitable for high-throughput applications, while its minimal sample volume requirements (nanoliters) conserve precious biological samples [27] [28].
Microchip Electrophoresis: The Dawn of Miniaturization
In 2008, a new era began with the development of microchip electrophoresis (MCE), which integrated electrophoresis with microfluidics to enable high-throughput analysis and rapid results [10]. MCE is a miniaturized form of capillary electrophoresis performed on stamp-sized chips containing networks of microchannels [29]. The working principle is based on the movement of charged analytes under an electric field, with separations often occurring in seconds to minutes due to short separation distances and the ability to apply very high field strengths [29]. These devices can integrate multiple laboratory functions onto a single chip, including sample preparation, separation, and detection, creating "lab-on-a-chip" systems [10] [29]. The dramatically reduced consumption of samples and reagents, combined with the potential for portability and point-of-care diagnostics, makes MCE a transformative technology [29]. Recent research has even demonstrated on-chip protein separation with single-molecule resolution, highlighting the advanced capabilities of this format [30].
Comparative Analysis of Electrophoresis Techniques
Table 1: Performance comparison of different electrophoresis formats for protein analysis.
| Feature | Slab Gel Electrophoresis | Capillary Electrophoresis (CE) | Microchip Electrophoresis (MCE) |
|---|---|---|---|
| Separation Medium | Polyacrylamide or agarose slab gel [27] | Fused-silica capillary filled with buffer or polymer matrix [27] | Microfabricated chip with integrated channels [29] |
| Typical Field Strength | 4–10 V/cm [27] | 300-600 V/cm [27] | Up to 1000 V/cm and higher [29] |
| Analysis Time | Tens of minutes to hours [27] | Minutes to tens of minutes [27] [28] | Seconds to a few minutes [29] |
| Sample Volume | Microliters [27] | Nanoliters [27] [28] | Picoliters to nanoliters [29] |
| Detection Method | Post-run staining (e.g., Coomassie Blue, silver stain) [31] [1] | On-capillary UV or Laser-Induced Fluorescence (LIF) [27] | On-chip detection (e.g., LIF, electrochemical) [29] |
| Resolution | Good for routine analysis; distinguishes proteins with mass differences of a few percent [27] | High; can resolve single-amino-acid differences and protein isoforms [27] | Very high; capable of single-molecule resolution under optimized conditions [30] |
| Throughput | Multiple samples per gel, but largely manual [27] | Sequential analysis, but fully automated with autosamplers [27] | High-throughput potential with parallel channels and integrated automation [10] |
| Key Advantage | Low cost, visual confirmation, preparative use [27] | High resolution, automation, quantitative data [27] [28] | Extreme speed, minimal reagent use, portability [10] [29] |
Table 2: Summary of key applications and limitations for each electrophoresis format.
| Format | Primary Applications in Protein Research | Common Limitations |
|---|---|---|
| Slab Gel | Protein purity checks, Western blotting, molecular weight determination, protein expression analysis [27] [1] | Manual, labor-intensive, semi-quantitative, lower resolution [27] [28] |
| Capillary (CE) | High-resolution profiling of complex protein mixtures, glycoform analysis, pharmacokinetic studies, quality control of biopharmaceuticals [27] | Higher instrument cost, capillary clogging, specialized training required [27] |
| Microchip (MCE) | Rapid clinical diagnostics, single-cell proteomics, point-of-care testing, environmental monitoring [10] [30] [29] | Emerging technology, can require complex chip fabrication and integration [29] |
Detailed Experimental Protocols
Protocol 1: SDS-PAGE Using Slab Gel Electrophoresis
Sodium Dodecyl Sulfate-Polyacrylamide Gel Electrophoresis (SDS-PAGE) is the most widely used electrophoresis technique for separating proteins primarily by mass [1]. The following protocol details a standard procedure for a discontinuous SDS-PAGE system.
Principle: Proteins are denatured and linearized by heating in the presence of SDS and a reducing agent (e.g., β-mercaptoethanol or DTT). SDS binds to the polypeptide backbone in a constant mass ratio, imparting a uniform negative charge that masks the protein's intrinsic charge. This allows separation to occur based almost exclusively on polypeptide size as molecules migrate through the polyacrylamide gel matrix [1].
Reagents and Solutions:
- Resolving Gel Buffer: 1.5 M Tris-HCl, pH 8.8
- Stacking Gel Buffer: 0.5 M Tris-HCl, pH 6.8
- 30% Acrylamide/Bis-acrylamide Solution (37.5:1 ratio)
- 10% Sodium Dodecyl Sulfate (SDS)
- 10% Ammonium Persulfate (APS)
- TEMED (N,N,N',N'-Tetramethylethylenediamine)
- Running Buffer: 25 mM Tris, 192 mM glycine, 0.1% SDS, pH ~8.3
- 5X Sample Loading Buffer: 250 mM Tris-HCl (pH 6.8), 10% SDS, 0.5% Bromophenol Blue, 50% Glycerol, 5% β-mercaptoethanol
- Protein Stain: Coomassie Brilliant Blue or similar
Procedure:
- Gel Casting:
- Assemble glass plates in a casting cassette.
- For a 10% resolving gel, mix 4.0 mL of 30% acrylamide solution, 3.0 mL of resolving gel buffer, 4.9 mL of water, 0.1 mL of 10% SDS, 0.1 mL of 10% APS, and 0.01 mL of TEMED. Pour between the plates, overlay with water-saturated butanol or water, and allow to polymerize for 15-30 minutes [1].
- Prepare the stacking gel (e.g., 5% acrylamide) using stacking gel buffer. Pour off the overlay, add the stacking gel mixture, and insert a well-forming comb. Allow to polymerize.
Sample Preparation:
- Mix the protein sample with an appropriate volume of 5X sample loading buffer (e.g., 4:1 sample to buffer ratio).
- Heat the samples at 70-100°C for 5-10 minutes to denature the proteins [1].
Electrophoresis:
- Place the polymerized gel into the electrophoresis chamber and fill the upper and lower chambers with running buffer.
- Load the prepared samples and molecular weight markers into the wells.
- Connect the power supply and run at a constant voltage of 80-150 V until the dye front reaches the bottom of the gel [1].
Detection:
- Carefully disassemble the gel cassette.
- Stain the gel with Coomassie Blue or a fluorescent protein stain to visualize the separated protein bands [31]. Destain if necessary.
Protocol 2: Capillary Electrophoresis-Sodium Dodecyl Sulfate (CE-SDS)
CE-SDS is an automated, capillary-based version of SDS-PAGE that provides quantitative data with high resolution.
Principle: Similar to SDS-PAGE, proteins are complexed with SDS and denatured. They are then electrokinetically injected into a capillary filled with a sieving polymer matrix. Under an applied high-voltage field, proteins are separated by size. Real-time detection via UV absorbance or laser-induced fluorescence at the end of the capillary generates an electropherogram with peaks corresponding to separated proteins [27].
Reagents and Equipment:
- CE Instrument with UV or LIF detector
- Fused-silica capillary (e.g., 50 µm inner diameter, 30-40 cm length)
- SDS-MW Gel Buffer (commercial sieving matrix with SDS)
- CE-SDS Sample Buffer (containing SDS)
- Iodoacetamide (for optional alkylation)
- Running Buffer (typically provided with the kit)
Procedure:
- Sample Preparation:
- Dilute the protein sample (0.5-2 mg/mL) in CE-SDS sample buffer containing SDS and a fluorescent dye (for LIF detection) or leave unlabeled for UV detection.
- Denature the samples by heating at 70-100°C for 5-10 minutes [27].
Instrument Setup:
- Install the capillary in the instrument according to the manufacturer's instructions.
- Prime the capillary with fresh SDS-MW gel buffer.
Separation:
- Inject the sample hydrodynamically or electrokinetically (e.g., 5-10 kV for 10-30 seconds).
- Apply the separation voltage (typically 10-15 kV) with reversed polarity (anode at the detector side) [27].
- Monitor the separation in real-time; total run time is typically less than 30 minutes.
Data Analysis:
- The software generates an electropherogram. Peak areas are used for quantification, and migration times are compared to a protein ladder (size standards) to determine molecular weights.
Protocol 3: On-Chip Protein Separation (Microchip SDS-PAGE)
This protocol is adapted from a research study demonstrating protein separation with single-molecule resolution on a microfluidic device [30].
Principle: The protocol scales down SDS-PAGE to a microchip. Proteins are driven electrokinetically through a photopolymerized polyacrylamide gel within a shallow (~0.6 µm deep) microchannel. The restricted depth keeps the proteins in focus for widefield fluorescence microscopy, allowing video-rate monitoring of single-protein migration [30].
Reagents and Specialized Equipment:
- Microchip with offset double T-junctions for sample injection and a separation channel [30].
- Acrylamide/Bis-acrylamide Solution (e.g., 5-10% concentration)
- Photoinitiator (e.g., VA-086)
- SDS and Tris-Glycine Buffer
- Fluorescently Labeled Protein Sample
- Widefield Fluorescence Microscope with high NA objective and EM-CCD camera.
- Digital Lithography System for selective gel polymerization.
Procedure:
- Chip Preparation and Gel Polymerization:
- Coat the microchannels with linear polyacrylamide to prevent protein adsorption [30].
- Fill the channels with an unpolymerized acrylamide solution containing SDS, Tris-Glycine buffer, and a photoinitiator.
- Use a digital lithography system with 365 nm light to selectively photopolymerize the gel only in the separation channel region [30].
Sample Loading and Separation:
- Load the fluorescently labeled protein sample into the sample port.
- Apply a vacuum or electric field to load the sample into the injection arm.
- Switch the electric field to the separation channel to inject a precise plug of sample into the separation gel.
- Apply a separation voltage (e.g., up to 30 V across a 5 mm channel) [30].
Detection and Imaging:
- Image the protein migration in real-time using video-rate (e.g., 19.31 frames per second) widefield fluorescence microscopy [30].
- Use single-particle image analysis software to track the mobility of individual proteins and create separation profiles.
The Scientist's Toolkit: Essential Research Reagent Solutions
Table 3: Key reagents and materials for electrophoresis-based protein separation.
| Item | Function/Description | Application Notes |
|---|---|---|
| Polyacrylamide/Bis-acrylamide | Forms the cross-linked polymer network that acts as a molecular sieve. Pore size is controlled by the total percentage and cross-linking ratio [1]. | Used for slab gels, capillary sieving matrices, and microchip gels. Lower percentages (e.g., 8%) separate larger proteins; higher percentages (e.g., 15%) separate smaller proteins. |
| SDS (Sodium Dodecyl Sulfate) | Anionic detergent that denatures proteins and confers a uniform negative charge, allowing separation primarily by molecular weight [1]. | Essential for SDS-PAGE and CE-SDS. Typically used at a concentration of 0.1-1% in buffers and samples. |
| TEMED & APS | Catalytic system for gel polymerization. APS provides free radicals, and TEMED accelerates the polymerization reaction [1]. | TEMED is hygroscopic and should be stored under nitrogen. Fresh APS solution should be prepared regularly. |
| Tris-Glycine Buffer | A common discontinuous buffer system for SDS-PAGE. The stacking gel (low pH, Tris-HCl) concentrates proteins before they enter the resolving gel (high pH, Tris-HCl) [1]. | The standard running buffer is 25 mM Tris, 192 mM Glycine, 0.1% SDS. |
| Molecular Weight Markers | A mixture of proteins of known molecular weights, run alongside samples to calibrate the gel/capillary and estimate the size of unknown proteins [1]. | Available in pre-stained, unstained, and fluorescent formats for different detection needs. |
| Coomassie Blue Stain | A colorimetric dye that binds nonspecifically to proteins through ionic and van der Waals interactions, enabling visualization of separated bands on a slab gel [31] [1]. | A workhorse stain for slab gels; sensitivity is typically in the 10-100 ng range. Requires destaining. |
| Sypro Ruby / Fluorescent Dyes | Fluorescent stains that offer higher sensitivity than Coomassie Blue and are compatible with subsequent mass spectrometry analysis [1]. | Used for both slab gels and for labeling proteins in capillary and microchip electrophoresis with LIF detection. |
| Fused-Silica Capillary | The separation conduit for CE. Its inner wall possesses silanol groups that generate electroosmotic flow (EOF) at neutral to basic pH [27] [29]. | Capillaries are often coated with polymers (e.g., linear polyacrylamide) to suppress EOF and protein adsorption for protein separations. |
| Replaceable Sieving Matrix | A polymer solution (e.g., linear polyacrylamide, dextran) used in CE-SDS and some MCE applications to mimic the sieving properties of a cross-linked gel [27] [29]. | Allows for automatic capillary rinsing and refilling between runs, enabling high-throughput automation. |
Workflow and Signaling Pathways
The following diagram illustrates the historical and technical progression of electrophoresis formats, highlighting their interrelationships and key technological drivers.
Evolution of Electrophoresis Formats
The journey of protein electrophoresis from traditional slab gels to sophisticated capillary and microchip systems illustrates a consistent trajectory toward higher performance, automation, and integration. While slab gel electrophoresis remains an indispensable tool for its simplicity and preparative capabilities, capillary electrophoresis has set a new standard for quantitative, high-resolution analysis in regulated environments. Microchip electrophoresis, now pushing the boundaries toward single-molecule resolution, promises to further transform biomedical analysis through point-of-care diagnostics and massive parallelization [30] [29]. For today's researcher, this historical context provides not just a timeline of technological advancement, but a strategic framework for selecting the appropriate separation platform. The choice hinges on the specific analytical requirements: slab gels for visual confirmation and low-cost screening, capillary systems for automated quantification and high-resolution analytics, and microchips for ultimate speed and minimal sample consumption. As these technologies continue to converge and evolve, they will undoubtedly unlock new frontiers in proteomics and personalized medicine.
Sodium Dodecyl Sulfate-Polyacrylamide Gel Electrophoresis (SDS-PAGE) is a foundational technique in biochemistry and molecular biology that allows for the separation of proteins based solely on their molecular weight. The method was developed by Ulrich K. Laemmli in 1970 and has since become one of the most cited scientific techniques, with the original paper accumulating over 259,000 citations by 2025 [32]. The power of SDS-PAGE lies in its ability to negate the influence of a protein's inherent charge and three-dimensional structure, ensuring that separation occurs exclusively by molecular size. This technique is indispensable for a wide range of applications, from initial protein characterization and purity assessment in academic research to quality control in pharmaceutical development [33] [34].
The core principle of SDS-PAGE involves the use of an anionic detergent, sodium dodecyl sulfate (SDS), which binds to and denatures proteins, conferring upon them a uniform negative charge. When these denatured proteins are subjected to an electric field within a polyacrylamide gel matrix, they migrate toward the anode at rates inversely proportional to their molecular weights. This process provides researchers with a reliable method for estimating protein size, assessing sample purity, analyzing subunit composition, and preparing samples for downstream applications such as Western blotting or mass spectrometry [33] [34].
The Fundamental Role of SDS in Charge Unification
Mechanism of Protein Denaturation and Linearization
The effectiveness of SDS-PAGE hinges on the complete denaturation of proteins into their linear form, thereby eliminating the influence of secondary, tertiary, and quaternary structures on their electrophoretic mobility. SDS plays a pivotal role in this process through its unique chemical properties as an anionic surfactant [35] [36]. The SDS molecule consists of a hydrophobic hydrocarbon tail (a 12-carbon chain) and a hydrophilic sulfate head group [35]. This amphipathic nature allows SDS to interact extensively with protein molecules.
The denaturation process involves two key mechanisms. First, the hydrophobic tails of SDS molecules interact with and disrupt the hydrophobic regions within the protein's core. Second, the ionic sulfate heads disrupt non-covalent interactions, including hydrogen bonds and ionic attractions, that stabilize secondary and tertiary structures [35]. This combined action unfolds the protein, transforming it from a compact, folded structure into an extended, linear polypeptide chain coated with SDS molecules. For complete linearization, especially for proteins with disulfide bridges, reducing agents such as β-mercaptoethanol (BME) or dithiothreitol (DTT) are added to break these covalent bonds, ensuring the protein is fully denatured to its primary structure [35] [32].
Charge Masking and Uniform Charge-to-Mass Ratio
The second critical function of SDS is to mask the protein's intrinsic charge and confer a uniform negative charge. In their native state, proteins possess variable net charges depending on their amino acid composition and the pH of their environment. This inherent charge heterogeneity would cause proteins to migrate at different speeds and even in different directions during electrophoresis, preventing separation based solely on size [35] [33].
SDS binds to proteins with high affinity and in large quantities—approximately 1.4 grams of SDS per 1 gram of protein, which corresponds to roughly one SDS molecule for every two amino acids [32]. This extensive binding creates a uniform "coat" of negative charges along the entire polypeptide backbone. Consequently, the intrinsic charges of the amino acid side chains become negligible compared to the overwhelming negative charge provided by SDS [35] [36] [33]. This results in all proteins achieving a similar charge-to-mass ratio, a fundamental prerequisite for size-based separation. Under an electric field, all SDS-bound protein complexes will now migrate toward the positive electrode (anode) at speeds determined only by their ability to navigate the pores of the polyacrylamide gel [35] [33].
Table 1: Key Steps in Protein Sample Preparation for SDS-PAGE
| Step | Reagents | Purpose | Typical Conditions |
|---|---|---|---|
| Denaturation | SDS (Sodium Dodecyl Sulfate) | Unfolds protein; confers uniform negative charge | ~1.4g SDS / 1g protein [33] [32] |
| Reduction | β-mercaptoethanol (BME) or Dithiothreitol (DTT) | Breaks disulfide bonds for complete linearization | 5% BME or 10-100 mM DTT [35] [32] |
| Heating | Heat | Disrupts hydrogen bonds, ensures complete denaturation | 95°C for 5 minutes [35] [32] |
The Polyacrylamide Gel Matrix as a Molecular Sieve
Gel Composition and Polymerization Chemistry
The polyacrylamide gel serves as a molecular sieve that separates linearized proteins based on their size. This three-dimensional network is created through the polymerization of acrylamide monomers cross-linked by N,N'-methylenebisacrylamide (Bis) [35] [33]. The pore size of the gel, which dictates its sieving properties, is determined by the concentrations of these two components. A higher total percentage of acrylamide results in a smaller pore size, which is more effective at separating lower molecular weight proteins. Conversely, a lower percentage creates larger pores, better suited for resolving higher molecular weight proteins [36] [37].
The polymerization reaction is a free-radical process catalyzed by a pair of initiators: ammonium persulfate (APS) and N,N,N',N'-Tetramethylethylenediamine (TEMED) [35] [37]. APS provides the persulfate free radicals that initiate the chain reaction, while TEMED acts as a catalyst that accelerates the formation of these free radicals. When added to a solution of acrylamide and bisacrylamide, these catalysts trigger a rapid polymerization, forming a solid gel with a consistent, mesh-like structure. The entire process of preparing and pouring the gel is known as "casting" [35].
Table 2: Polyacrylamide Gel Formulations for Different Protein Size Ranges
| Protein Size Range | Recommended Acrylamide % | Purpose and Rationale |
|---|---|---|
| Very Large Proteins (>150 kDa) | 5-8% | Larger pores allow big proteins to enter and migrate through the gel [37]. |
| Standard Range (10-250 kDa) | 10-15% (or 8-15% gradient) | Standard pore size for resolving most common proteins [33] [32]. |
| Small Proteins/Peptides (<30 kDa) | 15-20% | Smaller pores provide better resolution and prevent small proteins from running off the gel [36] [37]. |
The Discontinuous Buffer System: Stacking and Resolving Gels
A key innovation in modern SDS-PAGE is the use of a discontinuous buffer system employing two distinct gel layers with different pore sizes, pH, and ionic compositions: the stacking gel and the resolving (or separating) gel [35] [36] [32]. This system is critical for achieving sharp, well-defined protein bands.
The Resolving Gel: This is the lower portion of the gel, typically comprising a higher percentage of acrylamide (e.g., 10-15%) and buffered at a higher pH (pH ~8.8). It is here that the actual separation of proteins by molecular weight occurs. The smaller pore size presents a sieving effect that differentially retards the progress of larger proteins [35] [37].
The Stacking Gel: Positioned above the resolving gel, this layer has a lower acrylamide concentration (~4-5%) and a lower pH (pH ~6.8). Its primary function is to "stack" or concentrate all protein samples into extremely narrow, well-defined bands before they enter the resolving gel. This stacking effect ensures that proteins begin their size-based separation from an identical starting line, dramatically improving resolution [35] [36].
The mechanism behind the stacking effect relies on the differential mobility of ions in the discontinuous system. The running buffer contains glycine ions. At the pH of the stacking gel (6.8), glycine exists predominantly as a zwitterion with minimal net charge and thus low mobility. Chloride ions (from Tris-HCl in the gel) are highly mobile "leading ions," while the glycine zwitterions act as slow "trailing ions." Sandwiched between these two ion fronts, the proteins—whose mobility is intermediate—are compressed into a very narrow zone as they move through the stacking gel. When this protein zone reaches the resolving gel with its higher pH (8.8), the glycine ions lose a proton, become negatively charged glycinate ions, and overtake the proteins. The proteins are then deposited as a tight band at the top of the resolving gel, where their size-based separation begins [36] [32].
SDS-PAGE Gel Separation Process: Illustrates protein stacking and separation mechanism across gel layers.
Experimental Protocol for SDS-PAGE
Reagent Preparation and Gel Casting
A successful SDS-PAGE experiment begins with the careful preparation of reagents and the casting of the polyacrylamide gel. The following protocol outlines a standard method for preparing a mini-gel system [34] [37].
Key Research Reagent Solutions:
Table 3: Essential Reagents for SDS-PAGE
| Reagent | Function | Critical Details |
|---|---|---|
| Acrylamide/Bis Solution | Forms the gel matrix; pore size determines resolution. | Neurotoxic; handle with gloves [37]. |
| Tris-HCl Buffer (pH 6.8 & 8.8) | Maintains pH for stacking and resolving gels. | Different pH values are crucial for discontinuous system [37]. |
| SDS (Sodium Dodecyl Sulfate) | Denatures proteins and provides uniform charge. | Typically used as a 10% solution [34]. |
| APS (Ammonium Persulfate) | Free radical initiator for gel polymerization. | Prepare fresh or store at 4°C for short periods [37]. |
| TEMED | Catalyst that accelerates polymerization of acrylamide. | Final addition to gel solutions [35] [37]. |
| Laemmli Sample Buffer | Prepares protein samples for loading. | Contains SDS, glycerol, tracking dye, and reducing agent [36]. |
| Running Buffer (Tris-Glycine-SDS) | Conducts current and maintains pH during run. | 25 mM Tris, 192 mM Glycine, 0.1% SDS, pH 8.3 [37]. |
Gel Casting Procedure:
- Assemble the Gel Cassette: Secure glass plates and spacers in the casting apparatus according to the manufacturer's instructions [34].
- Prepare the Resolving Gel: Mix components for the resolving gel (e.g., for a 10% gel: 3.3 mL 30% acrylamide/bis, 2.5 mL 1.5 M Tris-HCl pH 8.8, 100 μL 10% SDS, 3.9 mL deionized water). Degas the solution if necessary. To initiate polymerization, add 50 μL of 10% APS and 5 μL of TEMED, and mix gently without introducing bubbles [37].
- Pour the Resolving Gel: Immediately pipette the resolving gel solution into the gap between the glass plates. Leave space for the stacking gel (about 2 cm below the top of the shorter plate). Carefully layer a small amount of isopropanol or water-saturated butanol over the top to flatten the meniscus and exclude oxygen, which inhibits polymerization [35] [32].
- Polymerize: Allow the resolving gel to solidify completely at room temperature for about 20-30 minutes. A distinct schlieren line will appear between the gel and the overlaying alcohol once polymerization is complete [34].
- Prepare and Pour the Stacking Gel: Pour off the overlaying alcohol and rinse the top of the gel with deionized water. Remove any residual liquid with absorbent paper. Prepare the stacking gel solution (e.g., 0.83 mL 30% acrylamide/bis, 0.63 mL 1.0 M Tris-HCl pH 6.8, 50 μL 10% SDS, 3.4 mL deionized water). Add 25 μL of 10% APS and 5 μL of TEMED, mix, and pour onto the resolving gel.
- Insert the Comb: Immediately insert a clean sample comb into the stacking gel solution without trapping air bubbles. Allow the stacking gel to polymerize for 15-20 minutes [34] [37].
Sample Preparation, Electrophoresis, and Visualization
Sample Preparation:
- Dilute and Mix: Combine the protein sample with an equal volume of 2X Laemmli sample buffer. A standard 2X buffer contains 4% SDS, 20% glycerol, 0.004% bromophenol blue, 100 mM Tris-HCl (pH 6.8), and often a reducing agent like 10% β-mercaptoethanol (added fresh) or 100 mM DTT [36] [37].
- Denature: Heat the sample mixture at 95°C for 5 minutes (or 70°C for 10 minutes) in a heat block or boiling water bath. This heat treatment is crucial for complete protein denaturation and linearization [32].
- Cool and Centrifuge: Briefly cool the samples and then centrifuge at 12,000 × g for 30 seconds to collect any condensation and ensure the entire sample is at the bottom of the tube [34].
Running the Gel:
- Assemble the Apparatus: Remove the comb carefully and place the polymerized gel cassette into the electrophoresis chamber. Fill the inner and outer chambers with freshly prepared running buffer [34].
- Load the Samples: Using a microsyringe, load 20-50 μg of protein (for Coomassie staining) per well. One well should be loaded with a molecular weight marker (protein ladder) for size estimation [37].
- Apply Current: Connect the chamber to a power supply. Run the gel initially at a constant voltage of 80 V until the dye front (bromophenol blue) has moved through the stacking gel and entered the resolving gel. Then, increase the voltage to 120 V and continue running until the dye front reaches the bottom of the gel (typically 60-90 minutes total). Cooling the apparatus with an ice bath or a built-in cooling unit is recommended to prevent overheating and "smiling" of bands [37].
Staining and Destaining:
- Disassemble and Fix: After electrophoresis, turn off the power supply. Carefully remove the gel cassette and pry the plates apart. Place the gel in a container with a fixation solution (e.g., 40% ethanol, 10% acetic acid) for 30 minutes. This step precipitates proteins within the gel [34] [37].
- Stain: Replace the fixative with Coomassie Brilliant Blue staining solution (e.g., 0.1% Coomassie R-250 in 40% ethanol, 10% acetic acid). Gently agitate for 1-2 hours to allow the dye to bind to proteins [37].
- Destain: Transfer the gel to a destaining solution (e.g., 10% ethanol, 7% acetic acid). Agitate, changing the destain solution periodically, until the gel background is clear and dark blue protein bands are visible. For higher sensitivity, silver staining protocols can be used, which are about 100 times more sensitive than Coomassie staining [37].
- Document: Illuminate and photograph the gel using a white light transilluminator or a gel documentation system for a permanent record and further analysis [34].
Critical Factors Influencing SDS-PAGE Accuracy and Reliability
Several variables can impact the resolution and accuracy of SDS-PAGE, and researchers must be aware of these to optimize their results.
Gel Composition and Pore Size: The choice of acrylamide concentration is paramount. Using a gel with pores that are too large will fail to resolve smaller proteins, while pores that are too small may exclude larger proteins entirely or cause band broadening. Gradient gels, where the acrylamide concentration increases from top to bottom, can provide a broader separation range within a single gel [14] [32].
Sample Preparation Integrity: Incomplete denaturation or reduction is a common source of poor results. Insufficient heating or outdated reducing agents can leave proteins partially folded or disulfide-linked, leading to anomalous migration, smearing, or multiple bands from a single protein. The presence of protease activity in the sample can also cause degradation and smearing if not inhibited [14] [37].
SDS-Protein Binding Variability: While SDS binding is generally uniform, hydrophobic proteins may bind more SDS, and proteins with significant post-translational modifications (such as glycosylation or phosphorylation) may bind less. This can cause slight deviations in apparent molecular weight, as the charge-to-mass ratio is no longer perfectly uniform [36]. This is an important consideration when analyzing such modified proteins.
Buffer System and pH: The precise pH of the stacking and resolving gels is critical for establishing the ionic conditions that drive the stacking effect. Deviations in pH can lead to poor stacking, resulting in diffuse bands and loss of resolution. Fresh running buffer should always be used to ensure consistent ionic strength and conductivity [14] [36].
Table 4: Troubleshooting Common SDS-PAGE Issues
| Problem | Possible Cause | Solution |
|---|---|---|
| Smearing/Streaking | Incomplete denaturation; Protease degradation | Extend boiling time; Add protease inhibitors; Use fresh DTT/BME [37]. |
| Vertical Streaks | Air bubbles in polymerized gel; Dirty glass plates | Degas gel solutions before pouring; Clean plates thoroughly [37]. |
| Atypical Band Migration | Uneven SDS binding; PTMs (Glycosylation) | Consider protein properties; Use glycosidase enzymes if needed [36]. |
| Gel Does Not Polymerize | Degraded APS or TEMED; Oxygen inhibition | Prepare fresh APS; Ensure no leaks in casting setup [37]. |
Applications in Research and Drug Development
SDS-PAGE is not merely a standalone technique but a fundamental tool integrated into a wide array of analytical and preparative workflows in life sciences and pharmaceutical industries.
Molecular Weight Determination and Purity Assessment: The most direct application of SDS-PAGE is to estimate the apparent molecular weight of an unknown protein by comparing its migration distance to that of a standard protein ladder [33] [34]. It is also the first-line method for assessing the purity of a protein sample during purification protocols (e.g., from column chromatography). A single, sharp band suggests a homogeneous sample, while multiple bands indicate impurities or degradation products [33].
Analysis of Protein Subunit Composition: Under reducing conditions, multi-subunit proteins held together by non-covalent forces and disulfide bonds will dissociate into their constituent polypeptides. SDS-PAGE allows researchers to determine the number and size of these subunits, providing insight into the quaternary structure of protein complexes [33]. For example, antibodies can be reduced to reveal their heavy and light chains.
Sample Preparation for Downstream Analyses: SDS-PAGE is often a prerequisite for more sophisticated techniques. In Western blotting (immunoblotting), proteins separated by SDS-PAGE are transferred onto a membrane for specific detection with antibodies [34]. For protein identification via mass spectrometry, specific bands can be excised from the gel, digested with trypsin, and the resulting peptides analyzed [35] [33].
Quality Control and Diagnostic Applications: In the food industry, SDS-PAGE is used for species identification, detecting adulteration, and monitoring protein changes during processing [14]. In medical diagnostics, it is employed in techniques like the HIV Western blot test, where patient antibodies are used to detect HIV proteins separated by SDS-PAGE, and in proteinuria tests to analyze proteins in urine [34].
SDS-PAGE remains an indispensable cornerstone technique in protein science decades after its development. Its enduring utility stems from the elegant simplicity of its core principle: using SDS to negate charge and structural differences, thereby reducing the complex parameter of "protein identity" to the single, separable parameter of molecular weight. The discontinuous buffer system further refines this, delivering sharp bands and high-resolution separation.
From basic research to applied drug development, SDS-PAGE provides critical information on protein size, purity, composition, and integrity. When coupled with techniques like Western blotting or mass spectrometry, it forms the backbone of modern proteomic analysis. While newer technologies continue to emerge, the robustness, reproducibility, and accessibility of SDS-PAGE ensure it will remain a fundamental tool for researchers and scientists seeking to understand and manipulate the protein machinery of life.
From Theory to Bench: A Practical Guide to Protein Electrophoresis Protocols
Gel electrophoresis is a foundational technique in biochemistry and molecular biology for separating macromolecules based on their physical properties. For protein research, several electrophoretic methods have been developed, each with distinct principles and applications. This technical guide provides an in-depth comparison of four key techniques: SDS-PAGE, Native PAGE, Blue-Native PAGE (BN-PAGE), and two-dimensional gel electrophoresis (2D-GE). The choice of method depends critically on the research objectives—specifically, whether the goal is to analyze denatured protein subunits or to preserve native protein structures and complexes. Understanding the principles, capabilities, and limitations of each technique is essential for effective experimental design in protein characterization, proteomics, and drug development.
Core Principles and Methodological Comparison
The fundamental principle of electrophoresis involves moving charged molecules through a gel matrix under the influence of an electric field. The polyacrylamide gel acts as a molecular sieve, separating proteins based on different physical properties depending on the technique used. Below is a detailed comparison of the four core methods.
Table 1: Core Characteristics of Protein Gel Electrophoresis Methods
| Method | Separation Basis | Protein State | Key Reagents | Primary Applications |
|---|---|---|---|---|
| SDS-PAGE [38] [32] | Molecular weight (size) | Denatured, linearized subunits | SDS, reducing agents (DTT/BME) [38] | Purity assessment, molecular weight estimation, subunit analysis [14] |
| Native PAGE | Size, charge, and shape | Native, folded & active | No SDS or denaturants | Analysis of native protein oligomers, enzyme activity assays [13] |
| Blue-Native PAGE (BN-PAGE) [39] [40] [41] | Size and charge shift | Native, intact complexes & supercomplexes | Coomassie G-250, mild detergents (e.g., DDM) [40] [41] | Studying OXPHOS complexes, protein-protein interactions, assembly pathways [39] [40] |
| 2D-Gel Electrophoresis [42] | 1st Dimension: pI (charge); 2nd Dimension: Molecular Weight | Typically denatured | IPG strips, SDS-PAGE reagents | Proteome profiling, biomarker discovery, post-translational modification analysis [42] |
SDS-PAGE (Sodium Dodecyl Sulfate – Polyacrylamide Gel Electrophoresis) is the most widely used method for separating proteins based solely on their molecular mass [38] [32]. The anionic detergent SDS binds extensively to proteins, masking their intrinsic charge and unfolding them into linear rods. This results in a uniform charge-to-mass ratio, ensuring migration through the polyacrylamide gel towards the anode is determined strictly by size [38] [32]. The discontinuous gel system, comprising a stacking gel (pH ~6.8) and a resolving gel (pH ~8.8), further sharpens bands for high resolution [38].
Native PAGE, in contrast, omits denaturing agents like SDS. Proteins remain in their native, folded conformation, and separation depends on a combination of the protein's intrinsic charge, size, and shape [13]. This preservation of structure allows for the detection of active enzymes and the analysis of protein oligomers, though interpreting results is more complex due to multiple influencing factors.
Blue-Native PAGE (BN-PAGE) is a specialized form of native electrophoresis designed for analyzing intact membrane protein complexes, particularly the mitochondrial oxidative phosphorylation (OXPHOS) system [39] [40] [41]. The key differentiator is the use of Coomassie Blue G-250 dye, which binds to hydrophobic protein surfaces, imparting a negative charge shift that drives electrophoretic migration and prevents aggregation [40]. Solubilization with mild detergents like n-dodecyl-β-d-maltoside or digitonin allows individual complexes or higher-order supercomplexes (respirasomes) to remain intact [40].
Two-Dimensional Gel Electrophoresis (2D-GE) separates proteins in two orthogonal steps. First, proteins are resolved based on their isoelectric point (pI) using isoelectric focusing (IEF). Subsequently, the strip from the first dimension is applied to an SDS-PAGE gel, where proteins are separated by molecular weight [42]. This powerful technique can resolve thousands of proteins from a complex mixture, making it a cornerstone of comparative proteomics.
Detailed Experimental Protocols
SDS-PAGE Protocol
Sample Preparation:
- Denaturation: Mix protein sample with SDS-PAGE sample buffer (containing SDS, Tris, glycerol, and a tracking dye like bromophenol blue) [38] [32].
- Reduction: Add a reducing agent, typically dithiothreitol (DTT) or β-mercaptoethanol (BME), to break disulfide bonds [38].
- Heating: Heat the sample at 95°C for 5 minutes (or 70°C for 10 minutes) to fully denature the proteins [32].
Gel Casting:
- Resolving Gel: Prepare and pour the lower resolving gel (typically 10-12% acrylamide, pH ~8.8). Layer with isopropanol or water-saturated butanol to create a flat surface and prevent oxygen inhibition of polymerization [38] [32].
- Stacking Gel: After the resolving gel polymerizes, pour the stacking gel (typically 4-6% acrylamide, pH ~6.8) and insert a comb to form wells [38].
Electrophoresis:
- Loading: Load prepared samples and a molecular weight marker into the wells [32].
- Running: Submerge the gel in running buffer (e.g., Tris-Glycine-SDS) and apply a constant voltage (e.g., 100-150V) until the dye front reaches the bottom of the gel [38] [32].
Downstream Analysis: Proteins can be visualized using stains (e.g., Coomassie Brilliant Blue, silver stain) or transferred to a membrane for Western blot analysis [32].
Blue-Native PAGE (BN-PAGE) Protocol
Sample Preparation (from Mitochondria):
- Solubilization: Resuspend mitochondrial pellet (e.g., 0.4 mg) in 40 µL of aminocaproic acid/Bis-Tris buffer [41].
- Detergent Extraction: Add a mild detergent (e.g., 7.5 µL of 10% n-dodecyl-β-D-maltopyranoside) and incubate on ice for 30 minutes [41].
- Clarification: Centrifuge at high speed (e.g., 72,000 x g for 30 min) to remove insoluble material [41].
- Dye Addition: Add Coomassie Blue G-250 (e.g., 2.5 µL of a 5% solution) to the supernatant [41].
Gel Casting and Electrophoresis:
- Gel Preparation: Cast a native gradient gel (e.g., 6-13% acrylamide) using a gradient maker. The gel buffer is typically 50 mM Bis-Tris, pH 7.0 [41].
- Running Conditions: Load the sample and run the gel using specific anode (50 mM Bis-Tris, pH 7.0) and cathode (50 mM Tricine, 15 mM Bis-Tris, 0.02% Coomassie G-250, pH 7.0) buffers. Run at 150 V for approximately 2 hours at 4°C [41].
Downstream Applications:
- In-gel Activity Staining: The intact, catalytically active complexes can be assayed directly in the gel for enzymes like Complex I, II, IV, and V [39] [40].
- Second Dimension SDS-PAGE: A single lane from the BN-PAGE gel can be excised, soaked in SDS buffer, and laid horizontally on a second SDS-PAGE gel to separate the individual subunits of each complex [40] [41].
- Western Blotting: Proteins can be transferred to a PVDF membrane for immunodetection with specific antibodies [41].
Visualizing Workflows and Method Selection
The following diagrams illustrate the experimental workflow for BN-PAGE and a logical guide for selecting the appropriate electrophoresis method.
BN-PAGE Experimental Workflow
Method Selection Decision Tree
Essential Research Reagent Solutions
Successful execution of electrophoretic protocols requires specific, high-quality reagents. The following table catalogs key materials and their functions.
Table 2: Essential Reagents for Gel Electrophoresis Protocols
| Reagent/Chemical | Function/Purpose | Key Protocols |
|---|---|---|
| Acrylamide/Bis-acrylamide | Forms the porous polyacrylamide gel matrix; pore size controlled by concentration and ratio [38] | All PAGE methods |
| SDS (Sodium Dodecyl Sulfate) | Anionic detergent that denatures proteins and confers uniform negative charge [38] [32] | SDS-PAGE, 2nd Dimension of 2D-GE |
| DTT (Dithiothreitol) / BME (β-Mercaptoethanol) | Reducing agents that break disulfide bonds to fully linearize proteins [38] [14] | Reducing SDS-PAGE |
| TEMED & APS (Ammonium Persulfate) | Catalyzer (TEMED) and initiator (APS) for free-radical polymerization of acrylamide gel [38] | All PAGE methods |
| Coomassie Blue G-250 | Imparts negative charge shift, prevents aggregation of membrane proteins [40] [41] | BN-PAGE |
| n-Dodecyl-β-D-Maltoside (DDM) | Mild, non-ionic detergent for solubilizing membrane proteins while preserving complex integrity [40] [41] | BN-PAGE |
| Digitonin | Very mild detergent used to preserve weak interactions in supercomplexes [40] | BN-PAGE (Supercomplex analysis) |
| 6-Aminocaproic Acid | Zwitterionic salt used in extraction buffers; supports solubilization and acts as a protease inhibitor [40] [41] | BN-PAGE |
Applications in Research and Drug Development
The choice of electrophoresis method directly enables specific research and development applications.
SDS-PAGE serves as a ubiquitous workhorse for quality control in protein purification, verifying recombinant protein expression, and determining molecular weight [14]. In food science, it is applied for species identification, allergen detection, and monitoring protein changes during processing [14].
Native PAGE and BN-PAGE are critical for structural biology and disease mechanism studies. BN-PAGE is particularly indispensable in mitochondrial research, enabling the diagnosis of OXPHOS deficiencies by revealing defective assembly pathways and altered supercomplex formation in patients with metabolic disorders [39] [40]. In drug development, these methods can assess how therapeutics affect protein-complex stability and interactions.
2D-Gel Electrophoresis remains a powerful tool in discovery proteomics. Despite advances in liquid chromatography-mass spectrometry (LC/MS), 2D-GE offers high reproducibility and the ability to resolve thousands of protein isoforms simultaneously, making it valuable for biomarker discovery and analyzing post-translational modifications [42].
Technical Considerations and Limitations
Each method has specific limitations that must be considered during experimental design. SDS-PAGE destroys native structure and cannot be used to study protein complexes or activity [32]. BN-PAGE requires optimization of detergent-to-protein ratios for effective solubilization, and the Coomassie dye can interfere with some downstream activity assays (a limitation addressed by clear-native PAGE, or CN-PAGE) [39] [40]. Furthermore, in-gel activity staining is not universally available for all complexes (e.g., it is less sensitive for Complex IV and unavailable for Complex III) [39]. 2D-GE has a limited dynamic range and struggles with very acidic, basic, hydrophobic, or very large/small proteins [42]. Image analysis, while improved by modern software, can still be challenging due to gel-to-gel variation [42].
This guide details the core protocol for sodium dodecyl sulfate-polyacrylamide gel electrophoresis (SDS-PAGE), a foundational technique for separating proteins based on their molecular weight. The principle of SDS-PAGE relies on the application of an electrical field to drive the movement of charged protein molecules through a porous polyacrylamide gel matrix [1] [43]. The ionic detergent SDS denatures proteins and confers a uniform negative charge, masking the proteins' intrinsic charge and causing them to migrate strictly according to polypeptide chain length [1] [44]. This technique is indispensable in molecular biology and biochemistry workflows for analyzing protein purity, estimating molecular weight, and preparing for downstream applications like western blotting [1].
The following workflow diagram illustrates the major stages of the SDS-PAGE protocol:
The Scientist's Toolkit: Essential Research Reagent Solutions
Successful SDS-PAGE requires precise preparation and use of specific reagents. The table below catalogues the essential materials and their functions in the protocol.
Table 1: Key Research Reagent Solutions for SDS-PAGE
| Item | Function / Purpose |
|---|---|
| Acrylamide/Bis-acrylamide | Forms the cross-linked polyacrylamide gel matrix that acts as a molecular sieve for separation [1]. |
| SDS (Sodium Dodecyl Sulfate) | An ionic detergent that denatures proteins and confers a uniform negative charge, allowing separation by size rather than native charge [1] [44]. |
| TEMED & Ammonium Persulfate (APS) | Catalyzer (TEMED) and initiator (APS) for the free-radical polymerization of acrylamide to form a gel [1]. |
| Tris-HCl Buffers | Provides the appropriate pH for gel polymerization and the electrophoretic run. The resolving and stacking gels use different pH buffers (e.g., pH 8.8 and pH 6.8) [1] [44]. |
| Tris-Glycine-SDS Running Buffer | Carries the current and maintains the pH during electrophoresis; the SDS ensures proteins remain denatured and charged [44]. |
| Sample Buffer (with DTT/β-Me) | Denatures proteins; reducing agents (DTT or β-mercaptoethanol) break disulfide bonds to fully linearize polypeptides [1]. |
| Protein Molecular Weight Marker | A set of pre-stained or unstained proteins of known sizes, run alongside samples to estimate the molecular weight of unknown proteins [1]. |
| Coomassie Stain / Fluorescent Dyes | Used to visualize separated protein bands after electrophoresis by binding to proteins [1]. |
Detailed Methodologies and Experimental Protocols
Sample Preparation
Proper sample preparation is critical for clear and accurate results.
- Combine Sample and Buffer: Mix the protein sample with an appropriate volume of 2X or 4X SDS-PAGE sample buffer to achieve a final 1X concentration. A typical sample buffer contains Tris-HCl, SDS, glycerol, bromophenol blue, and a reducing agent like DTT or β-mercaptoethanol [44].
- Denature Proteins: Heat the mixture at 70-100°C for 3-5 minutes [1] [44]. This heating step ensures complete denaturation of the proteins and binding of SDS to the polypeptide backbone.
- Brief Centrifugation: Centrifuge the denatured samples at high speed (e.g., 15,000 rpm for 1 minute) to collect any condensation and bring the entire volume to the bottom of the tube [44]. The sample is now ready for loading.
Gel Casting
The gel consists of two distinct layers: a resolving gel where separation occurs, and a stacking gel that concentrates the samples into sharp bands before they enter the resolving gel.
- Assemble Gel Cassette: Thoroughly clean the glass plates with ethanol and assemble them with spacers into a casting cassette, ensuring a tight seal [44].
- Prepare and Pour Resolving Gel: Combine all components for the resolving gel solution, typically containing a higher percentage of acrylamide (e.g., 8-15%) in a Tris buffer at pH 8.8. Add TEMED last to initiate polymerization and immediately pipette the solution into the gel cassette, leaving space for the stacking gel. The optimal acrylamide percentage depends on the target protein size, as detailed in Table 2.
- Overlay with Solvent: Carefully overlay the resolving gel with water-saturated butanol or isopropanol to create a flat, even interface and prevent contact with air, which inhibits polymerization [44]. Allow the gel to polymerize completely for 15-30 minutes.
- Prepare and Pour Stacking Gel: Once polymerized, pour off the overlay liquid and rinse the top of the gel. Prepare the stacking gel solution, which has a lower percentage of acrylamide (e.g., 4-5%) in a Tris buffer at pH 6.8. Add TEMED, pour the solution on top of the resolving gel, and immediately insert a clean comb [1] [44]. Avoid bubbles. Allow the stacking gel to polymerize for another 15-30 minutes.
Table 2: Recommended Polyacrylamide Concentrations for Separating Proteins of Different Sizes [1]
| Polyacrylamide Gel (%) | Optimal Separation Range (kDa) |
|---|---|
| 6% | 50 - 150 |
| 8% | 30 - 90 |
| 10% | 20 - 80 |
| 12% | 12 - 60 |
| 15% | 10 - 40 |
Gel Running
- Assemble Apparatus: Remove the comb and bottom tape/spacer from the polymerized gel cassette. Mount the cassette in the electrophoresis chamber and fill both the inner and outer chambers with running buffer [44].
- Load Samples: Using a micropipette, load equal volumes of the prepared protein samples and molecular weight markers into the wells [1].
- Run Gel: Connect the chamber to a power supply with the correct polarity (proteins migrate toward the positive anode). Run the gel at a constant voltage, typically between 100-150 V, until the dye front (bromophenol blue) reaches the bottom of the gel [44]. For sharper bands, some protocols recommend starting at 50V for the first few minutes before increasing to the higher voltage [45].
Visualization and Analysis
- Stain Gel: After electrophoresis, carefully open the cassette and remove the gel. Place the gel in a container with a protein-binding stain, such as Coomassie Brilliant Blue, and incubate with gentle agitation for 15-60 minutes [1].
- Destain Gel: Transfer the gel to a destaining solution (e.g., methanol/acetic acid) to remove background stain. Change the destaining solution periodically until the protein bands are clear against a low-background field [43].
- Image and Document: Capture an image of the stained gel using a gel documentation system. For accurate quantification, ensure the image is not overexposed (saturated) [46].
- Analyze Results: The molecular weight of unknown proteins can be estimated by comparing their migration distance to a standard curve generated from the molecular weight marker [1]. Band intensity can also be quantified using densitometry software to determine relative protein abundance [43] [46].
This detailed SDS-PAGE protocol provides a reliable and standardized method for separating proteins by molecular weight. Mastery of sample preparation, gel casting, electrophoretic running, and visualization is fundamental to protein research, enabling critical analyses in characterization, quality control, and diagnostic applications. Adherence to this protocol ensures high-resolution, reproducible results that form the basis for robust scientific findings in drug development and proteomic research.
Selecting the Right Gel Percentage and Buffer System for Optimal Resolution
Gel electrophoresis is a foundational technique in protein research, enabling the separation, analysis, and purification of proteins based on their physicochemical properties. For researchers and drug development professionals, achieving optimal resolution is not merely a technical step but a critical determinant for the success of downstream applications, from western blotting to mass spectrometry. The clarity of separation directly impacts the ability to detect specific isoforms, quantify protein expression, and identify post-translational modifications. Central to this goal are two interdependent choices: the selection of an appropriate gel percentage, which acts as a molecular sieve, and the implementation of a suitable buffer system, which governs the electrophoretic conditions. This guide provides an in-depth technical examination of these factors, framing them within the core principles of protein separation to enable informed experimental design and robust, reproducible results.
The Principle of Protein Separation by Gel Electrophoresis
Protein gel electrophoresis typically employs a discontinuous buffer system within a polyacrylamide gel matrix. In this system, proteins are driven by an electrical field through the porous gel. The polyacrylamide gel is formed by the polymerization of acrylamide and bis-acrylamide, where bis-acrylamide serves as a cross-linking agent [1] [47]. The pore size of the resulting matrix is inversely related to the total percentage of acrylamide; a higher percentage creates a smaller pore size, providing a tighter sieve for separating smaller proteins [1].
The most common method, SDS-PAGE (Sodium Dodecyl Sulfate Polyacrylamide Gel Electrophoresis), relies on the denaturing detergent SDS. SDS binds to proteins in a constant weight ratio, conferring a uniform negative charge and masking the proteins' intrinsic charge [1] [47]. This treatment, coupled with heating and reducing agents like Dithiothreitol (DTT) or β-mercaptoethanol (BME) to break disulfide bonds, linearizes the proteins [47] [48]. Consequently, separation occurs primarily on the basis of molecular weight, as all SDS-bound complexes migrate toward the anode, with smaller polypeptides moving faster through the gel [1]. The process can be visualized in the following workflow.
Selecting the Correct Gel Percentage
The concentration of the polyacrylamide resolving gel is the primary factor controlling the size-based separation of proteins. The fundamental rule is to use a lower percentage gel (e.g., 8%) for resolving high molecular weight proteins and a higher percentage gel (e.g., 15%) for low molecular weight proteins [48] [49]. This is because low-percentage gels have larger pores, offering less resistance to the movement of large proteins, while high-percentage gels have smaller pores that provide better sieving for smaller proteins [1].
For a mixture of proteins with a broad molecular weight range or when the size of the target protein is unknown, gradient gels are ideal. These gels have a low percentage of acrylamide at the top and a high percentage at the bottom, creating a pore gradient that can resolve a wider spectrum of protein sizes within a single gel [1] [50]. The following table provides a detailed guide for selecting gel percentage based on protein size.
Table 1: Guidelines for Selecting Polyacrylamide Gel Percentage Based on Protein Molecular Weight
| Size of Protein (kDa) | Recommended Gel Percentage | Separation Principle |
|---|---|---|
| 4 - 40 kDa | 20% | Small pore size sieves low MW proteins effectively [51] [49]. |
| 12 - 45 kDa | 15% | Optimal for resolving peptides and small proteins [51] [49]. |
| 10 - 70 kDa | 12.5% | Standard range for many cellular proteins [51] [49]. |
| 15 - 100 kDa | 10% | A versatile choice for a broad range of proteins [51] [49]. |
| 25 - 200 kDa | 8% | Larger pores allow bigger proteins to migrate [51]. |
| > 200 kDa | 4 - 6% | Very large pores for high molecular weight complexes [49]. |
| Broad/Unknown Range | 4-20% Gradient | Continuous pore gradient resolves a wide MW spectrum [50]. |
Buffer System Chemistry and Mechanisms
The buffer system is equally critical for achieving sharp, well-resolved bands. The discontinuous (or Laemmli) buffer system, typically based on Tris-Glycine, uses differences in pH and ion mobility to concentrate proteins into a sharp stack before they enter the resolving gel [1] [50].
This system relies on three key ions:
- Chloride (Cl⁻): From the gel buffer, acts as the highly mobile leading ion [50].
- Glycinate (NH₂CH₂COO⁻): From the running buffer, acts as the slower-moving trailing ion at the stacking gel pH [50].
- Tris (H⁺): The common counter-ion present in both gel and running buffers [50].
In the stacking gel (lower pH, ~6.8), glycinate has a low charge and migrates slowly. Chloride ions race ahead, followed by the protein-SDS complexes which have a intermediate mobility, and then by glycinate. This configuration creates a sharp boundary that stacks all proteins into a thin zone. Upon reaching the resolving gel (higher pH, ~8.8), the glycinate ions become highly charged, overtake the proteins, and eliminate the stacking effect. The proteins then separate based on their size as they migrate through the pores of the resolving gel [1] [50]. The relationship between these components is summarized below.
Table 2: Core Components of a Discontinuous Tris-Glycine SDS-PAGE Buffer System
| Component | Typical Composition | Function in Separation |
|---|---|---|
| Stacking Gel | Lower acrylamide (e.g., 4%), Tris-HCl, pH ~6.8 [47] | Creates a low-pH, large-pore environment for protein stacking; concentrates samples into a sharp starting band [1]. |
| Resolving Gel | Variable acrylamide (e.g., 8-20%), Tris-HCl, pH ~8.8 [47] | Creates a high-pH environment with specific pore sizes for molecular weight-based separation [1]. |
| Running Buffer | 25 mM Tris base, 192 mM Glycine, 0.1% SDS, pH ~8.3 [49] | Carries current and provides chloride (leading) and glycinate (trailing) ions for the discontinuous system [50]. |
| Sample Buffer | Tris-HCl, SDS, Glycerol, Bromophenol Blue, with/without DTT/BME [47] [48] | Denatures proteins, provides negative charge, adds density for loading, and includes a tracking dye [47]. |
A Detailed SDS-PAGE Gel Casting and Running Protocol
Gel Casting Protocol
The following 10-step protocol ensures reliable casting of polyacrylamide gels [51]:
- Assemble Equipment: Clean glass plates and spacers with ethanol and assemble the casting cassette.
- Prepare Resolving Gel Solution: Mix acrylamide/bis-acrylamide solution, Tris-HCl (pH 8.8), SDS, and water in a beaker. Do not add TEMED and APS yet.
- Initiate Resolving Gel Polymerization: Add ammonium persulfate (APS) and TEMED to the resolving gel mixture. TEMED catalyzes the formation of free radicals from APS, which initiates the polymerization of acrylamide and bis-acrylamide [1] [47]. Mix gently.
- Pour Resolving Gel: Immediately pour the solution into the cassette, leaving space for the stacking gel.
- Overlay with Isopropanol: Carefully layer isopropanol or water on top of the unpolymerized gel to create a flat, smooth interface and exclude oxygen.
- Polymerize: Allow the resolving gel to set completely (30-45 minutes).
- Prepare and Pour Stacking Gel: Pour off the isopropanol. Prepare a stacking gel solution with lower acrylamide (e.g., 4%), Tris-HCl (pH 6.8), water, and SDS. Add APS and TEMED, then pour onto the polymerized resolving gel.
- Insert Comb: Immediately place a well-forming comb into the stacking gel, avoiding bubbles.
- Polymerize Stacking Gel: Allow the stacking gel to polymerize fully.
- Store or Use: Once set, carefully remove the comb. Gels can be used immediately or wrapped in damp tissue and cling film and stored at 4°C for several weeks.
Electrophoresis Running Protocol
- Load Samples and Markers: Place the gel cassette into the electrophoresis chamber and fill with running buffer. Load protein samples and an appropriate molecular weight marker into the wells [49].
- Apply Current: Connect to a power supply and run at a constant voltage. For mini-gels, 100-150 V for 40-60 minutes is standard. Run until the dye front just reaches the bottom of the gel [48] [49].
- Control Temperature: Maintain a constant temperature (10-20°C) during the run to prevent "smiling" (curving) of bands caused by uneven heat distribution. Using a magnetic stirrer in the buffer tank can help [48].
The Scientist's Toolkit: Essential Reagents and Materials
Successful protein separation relies on a suite of high-quality reagents and materials. The following table details the essential components of the researcher's toolkit.
Table 3: Essential Research Reagent Solutions for SDS-PAGE
| Tool/Reagent | Function & Importance |
|---|---|
| Acrylamide/Bis-acrylamide | The monomer and cross-linker that form the polyacrylamide gel matrix; the ratio and total concentration determine gel pore size [1] [47]. |
| Ammonium Persulfate (APS) & TEMED | APS (a source of free radicals) and TEMED (a catalyst) are co-initiators required to trigger the polymerization of the gel [1] [47]. |
| SDS (Sodium Dodecyl Sulfate) | An ionic detergent that denatures proteins and confers a uniform negative charge, enabling separation by size rather than intrinsic charge [1] [47]. |
| DTT (Dithiothreitol) or BME (β-Mercaptoethanol) | Reducing agents that break disulfide bonds within and between protein subunits, ensuring complete denaturation to polypeptide chains [47] [48]. |
| Tris-based Buffers | Provides the appropriate pH environment for both gel polymerization and electrophoretic separation; a key component of the discontinuous buffer system [1] [50]. |
| Molecular Weight Markers | A mixture of proteins of known sizes run alongside samples; essential for estimating the molecular weight of unknown proteins and monitoring run progress [1]. |
| Pre-cast Gels | Commercially available gels (e.g., Novex Tris-Glycine Gels) offer convenience, reproducibility, and specialized formats like high-capacity WedgeWell wells [50]. |
Troubleshooting for Optimal Resolution
Even with a sound theoretical understanding, practical challenges can arise. Below are common issues and their solutions.
Problem: Smearing or Streaking Bands
Problem: Poor Separation or Bands at Wrong MW
Problem: "Smiling" Bands (Curved Bands)
Problem: Diffuse or Poorly Defined Bands
- Cause: The gel was run for too long, and low molecular weight proteins have run off the bottom, or the gel percentage was inappropriate [48].
- Solution: Stop the run before the tracking dye front exits the gel. Refer to Table 1 to select a gel percentage more suited to your protein's size.
The pursuit of optimal resolution in protein gel electrophoresis is a deliberate process grounded in the principles of molecular sieving and buffer chemistry. The critical choices of gel percentage and buffer system are not arbitrary but must be strategically aligned with the specific properties of the target protein and the overarching research goal. As detailed in this guide, leveraging a discontinuous Tris-Glycine system with a correctly chosen polyacrylamide concentration—whether a single percentage or a gradient—forms the bedrock of high-quality protein separation. By integrating this knowledge with meticulous attention to sample preparation and troubleshooting, researchers can consistently generate reliable, publication-ready data, thereby driving forward discovery in proteomics and drug development.
Protein gel electrophoresis is a fundamental technique in molecular biology and proteomics that separates proteins based on their size, charge, or other properties. Following separation by techniques such as sodium dodecyl sulfate-polyacrylamide gel electrophoresis (SDS-PAGE), visualization of the protein bands becomes critical for analysis [1]. The field of protein detection has evolved significantly from traditional colorimetric stains to advanced fluorescent and stain-free technologies, each offering distinct advantages in sensitivity, convenience, and compatibility with downstream applications [52] [53]. This evolution addresses the growing demands of proteomic research and therapeutic development, where detecting proteins across a wide dynamic range is essential for comprehensive analysis [54].
The basic principle of electrophoresis involves migrating charged protein molecules through a gel matrix under the influence of an electrical field [43]. In SDS-PAGE, proteins are denatured and coated with SDS, giving them a uniform negative charge-to-mass ratio, allowing separation primarily by molecular weight [1]. After separation, detection methods make the invisible protein bands visible through various mechanisms, including dye binding, metallic deposition, or intrinsic fluorescence [52]. The choice of detection method represents a balance between sensitivity, linear dynamic range, ease of use, quantitative capability, and compatibility with subsequent protein analysis techniques such as mass spectrometry or western blotting [55].
Fundamental Principles of Protein Gel Electrophoresis
Protein electrophoresis relies on the movement of charged molecules through a porous matrix under an electrical field. The rate of migration depends on several factors including the protein's net charge, size, shape, the strength of the electrical field, and the properties of the support medium [43]. SDS-PAGE, the most common form of protein electrophoresis, employs the anionic detergent SDS to denature proteins and impart a uniform negative charge, allowing separation based primarily on molecular weight as proteins migrate through the polyacrylamide gel matrix [1].
Polyacrylamide gels are created by polymerizing acrylamide and bis-acrylamide, forming a cross-linked network with pore sizes determined by the concentration of these components [1]. Lower percentage gels (e.g., 7-10%) have larger pores suitable for separating high molecular weight proteins, while higher percentage gels (e.g., 12-20%) have smaller pores that better resolve lower molecular weight proteins [1]. The electrophoresis process involves loading protein samples into wells at the top of the gel, then applying an electrical current that causes the proteins to migrate downward through the gel matrix, separating into discrete bands within each lane [1].
The following workflow diagram illustrates the general process of protein electrophoresis and detection:
For optimal separation, most SDS-PAGE setups utilize a discontinuous buffer system with a stacking gel that concentrates all proteins into a sharp band before they enter the resolving gel where separation occurs [1]. After electrophoresis is complete, the gel proceeds to the detection phase, which varies significantly depending on the method selected. Understanding these fundamental separation principles provides the necessary context for selecting appropriate detection methods based on the specific requirements of each experiment.
Coomassie Brilliant Blue Staining
Principles and Mechanisms
Coomassie Brilliant Blue (CBB) staining is one of the most widely used methods for detecting proteins in polyacrylamide gels due to its simplicity, reliability, and cost-effectiveness [56]. The technique utilizes triphenylmethane dyes that bind to proteins primarily through hydrophobic interactions and ionic attractions with basic amino acid residues (arginine, lysine, and histidine) [52] [56]. Under acidic conditions, the dye undergoes a color shift from reddish-brown to intense blue upon protein binding, creating visible blue bands against a clear background [52].
Two primary forms of Coomassie dye are commonly used: R-250 (reddish hue) and G-250 (greenish hue) [56]. Traditional Coomassie staining uses R-250 dissolved in a methanol-acetic acid-water mixture, which simultaneously fixes proteins in the gel and enables dye binding [57]. The methanol and acetic acid serve to fixate proteins within the gel matrix, preventing diffusion during staining, while also removing interfering substances from the electrophoresis process [57]. Colloidal Coomassie stains utilize the G-250 form, which does not penetrate the gel matrix uniformly, resulting in selective protein staining with minimal background and often eliminating the need for destaining [55].
Protocol and Methodology
The classic Coomassie Brilliant Blue R-250 staining protocol involves several key steps. After electrophoresis, the gel is placed in a fixation solution (typically containing trichloroacetic acid or methanol with acetic acid) to precipitate and immobilize proteins within the gel matrix [57]. The gel is then immersed in staining solution (0.1-0.25% CBB R-250 in 40-50% methanol and 10% acetic acid) for a minimum of 2 hours with agitation [57]. For enhanced sensitivity, staining can be performed at elevated temperatures (37°C) or extended overnight [57]. Following staining, the gel is transferred to a destaining solution (40% methanol, 10% acetic acid without dye) to remove unbound dye from the gel background until clear protein bands are visible against a transparent background [56] [57]. This destaining process can be accelerated by using heated destaining solution (50-60°C) or including additional absorptive materials such as paper towels in the destaining container [57].
Improved colloidal Coomassie G-250 protocols offer simplified procedures with better sensitivity. After electrophoresis, gels are washed in hydrochloric acid solution before transfer to the G-250 staining solution [57]. Staining requires 2-16 hours with continuous agitation, followed by destaining in hydrochloric acid solution with several solution changes until bands are clearly visible [57]. Commercial ready-to-use Coomassie formulations such as InstantBlue provide extremely simplified workflows where proteins become visible within 10-15 minutes of adding the stain without requiring destaining [55].
Applications and Limitations
Coomassie staining is particularly valuable for routine protein detection, quantification of relative protein abundance, and assessing sample purity during protein purification workflows [56]. Its major advantages include excellent reproducibility, wide linear dynamic range for quantification, compatibility with mass spectrometry and protein sequencing, and relatively low cost [52] [55]. Additionally, the non-covalent nature of dye binding means the process is reversible, allowing for subsequent destaining and protein recovery for downstream applications [52].
The primary limitation of Coomassie staining is its relatively low sensitivity compared to other methods, with detection limits typically ranging from 5-25 ng per protein band [52] [55]. This makes it unsuitable for detecting low-abundance proteins in complex samples. The traditional method can also be time-consuming, requiring several hours to complete, though rapid protocols and commercial formulations have significantly addressed this limitation [55] [56]. Furthermore, Coomassie staining exhibits variable affinity for different proteins based on their amino acid composition, which can affect quantitative accuracy [52].
Silver Staining
Principles and Mechanisms
Silver staining represents one of the most sensitive colorimetric methods for protein detection in polyacrylamide gels, offering up to 200-fold greater sensitivity than Coomassie staining [54] [58]. The technique operates through the deposition of metallic silver onto protein bands via a chemical development process similar to photographic film development [52]. Silver ions (from silver nitrate or silver-ammonia complexes) bind specifically to functional groups on protein surfaces, particularly carboxylic acid groups (aspartic acid and glutamic acid), imidazole (histidine), sulfhydryls (cysteine), and amines (lysine) [52] [54]. These bound silver ions are subsequently reduced to metallic silver by a developing solution, creating dark brown or black protein bands against a lighter background [52].
The color variation observed in silver-stained gels (from black to yellow) depends on several factors, including the size and density of the silver particles deposited, the specific protein properties, and the development conditions [58]. Two main chemical approaches exist for silver staining: silver nitrate methods (simpler and more consistent) and silver-ammonia complex methods (offering greater staining control but requiring custom gels) [58]. The sensitivity and quality of silver staining are influenced by numerous factors including temperature, gel thickness, reagent purity, and development time, making optimization critical for reproducible results [54].
Protocol and Methodology
A standard silver staining protocol involves multiple sequential steps that must be carefully timed and controlled. After electrophoresis, gels are fixed in a solution of 50% methanol and 10% acetic acid for 30 minutes to immobilize proteins and remove interfering compounds such as SDS and buffers [54]. The gel is then sensitized with sodium thiosulfate solution (0.02%) for 1 minute to enhance subsequent staining sensitivity and contrast [54]. Following rinsing, the gel is impregnated with 0.1% silver nitrate solution for 20 minutes, allowing silver ions to bind to protein functional groups [54]. Development occurs in a solution containing formaldehyde (0.04%) and sodium carbonate (2%) until protein bands reach the desired intensity, typically 2-5 minutes [54]. The development reaction is stopped by transferring the gel to 5% acetic acid, which halts further reduction of silver ions [54]. Throughout the process, high-purity water is essential to prevent background staining from contaminants [58].
Mass spectrometry-compatible silver staining protocols represent an important variant that eliminates or substitutes aldehyde-based reagents (glutaraldehyde and formaldehyde) that cause protein cross-linking and interfere with downstream MS analysis [54] [58]. These compatible protocols use alternative sensitizers such as tetrathionate and thiosulfate, though often at the expense of some staining sensitivity and uniformity [58]. The selection of specific silver staining protocol depends on several factors, including whether precast or custom gels are used, the need for downstream processing like mass spectrometry, the desired balance between staining quality and speed, and laboratory temperature conditions [58].
Applications and Limitations
Silver staining is the method of choice when maximum sensitivity is required for detecting low-abundance proteins without specialized equipment [52]. It is particularly valuable in applications such as proteomic analysis of complex samples, detection of minute protein quantities, and situations where limited sample is available [54]. The technique also provides distinctive color patterns for different proteins on 2D gels, aiding in protein differentiation and identification [52].
Despite its superior sensitivity, silver staining has several significant limitations. The multi-step process is technically demanding, time-consuming (30 minutes to 2 hours), and requires careful attention to detail for reproducible results [52] [55]. Traditional silver staining methods using aldehydes are generally incompatible with mass spectrometry due to protein cross-linking [54]. The technique also has a narrow linear dynamic range, making it less suitable for protein quantification compared to Coomassie or fluorescent methods [55]. Additionally, silver staining is prone to background issues, artifactual staining, and variability based on protein composition and laboratory conditions [54] [58].
Modern Stain-Free Technology
Principles and Mechanisms
Stain-free technology represents a revolutionary approach to protein detection that eliminates the need for traditional staining procedures altogether [53]. This method utilizes trihalo compounds embedded in the gel matrix that, when activated by ultraviolet (UV) irradiation, modify tryptophan residues in proteins [59]. The modification adds a 58-Da moiety to tryptophan side chains, significantly enhancing their native fluorescence under UV light [59]. This allows direct visualization of proteins without the time-consuming staining and destaining steps required by traditional methods.
The stain-free process leverages the inherent fluorescent properties of modified tryptophan residues, with excitation and emission maxima corresponding to common filter sets and laser settings on standard fluorescence imaging instruments [59]. Unlike traditional staining methods that depend on external dyes or metallic deposition, stain-free technology detects proteins based on their intrinsic amino acid composition, specifically their tryptophan content [59]. Consequently, proteins with higher tryptophan content produce stronger signals, while those with little or no tryptophan may be detected less efficiently or require optimization of imaging conditions.
Protocol and Methodology
The stain-free workflow is remarkably streamlined compared to traditional staining methods. Following SDS-PAGE separation, which uses specially formulated stain-free gels containing trihalo compounds, the entire gel is exposed to UV light for a brief activation period (typically 1-5 minutes) [59]. The activated proteins are then immediately visualized using a stain-free compatible imaging system equipped with appropriate UV excitation and emission filters [59]. The entire process from gel completion to image acquisition can be accomplished in less than 30 minutes, compared to several hours for traditional staining methods [59].
This technology integrates seamlessly with standard SDS-PAGE workflows, requiring no changes to running buffers or sample preparation protocols [59]. The same stain-free gel can proceed directly to western blotting or other downstream applications without interference, as the modification does not alter protein size or immunoreactivity [59]. For quantitative applications, the fluorescence signal can be captured and analyzed using standard densitometry software, with the linear dynamic range typically exceeding that of Coomassie staining [59].
Applications and Limitations
Stain-free technology is particularly valuable in high-throughput environments, protein therapeutic development, and quantitative proteomic applications where speed, consistency, and compatibility with downstream processing are paramount [53] [59]. Its rapid workflow enables researchers to assess sample purity at multiple stages of protein purification processes without significantly delaying overall timelines [59]. The technology also serves as an excellent loading control for western blotting, as the total protein pattern can be visualized before transfer, eliminating variations associated with traditional housekeeping protein detection [59].
The primary limitation of stain-free technology is its dependency on tryptophan content for detection sensitivity, potentially resulting in variable staining of proteins with low or absent tryptophan residues [59]. The requirement for specialized gels and UV-compatible imaging equipment represents an initial investment barrier compared to traditional staining methods [53]. Additionally, the technology may be less suitable for certain specialized electrophoresis techniques or non-SDS based separation methods where the trihalo compounds might interfere with separation or where tryptophan modification could affect downstream functional analyses.
Comparative Analysis of Detection Methods
Performance Metrics and Applications
The selection of an appropriate protein detection method requires careful consideration of performance characteristics relative to experimental goals. The following table provides a comprehensive comparison of key parameters across the three detection technologies:
Table 1: Comparison of Protein Detection Methods
| Parameter | Coomassie Staining | Silver Staining | Stain-Free Technology |
|---|---|---|---|
| Sensitivity | 5-25 ng per band [52] [55] | 0.25-0.5 ng per band [52] | 0.25-0.5 ng per band (comparable to silver) [59] |
| Typical Protocol Time | 10 minutes to 2 hours (classical); 10-15 minutes (rapid formats) [52] [55] | 30-120 minutes [52] | <30 minutes total process [59] |
| Detection Mechanism | Visual colorimetric | Visual colorimetric | UV fluorescence imaging |
| Compatibility with Mass Spectrometry | Excellent compatibility [52] [55] | Limited with traditional methods; specific aldehyde-free protocols are compatible [54] [58] | Excellent compatibility [59] |
| Linear Dynamic Range | Broad, suitable for quantification [56] | Narrow, less suitable for quantification [55] | Broad, superior to Coomassie [59] |
| Key Advantages | Simple, cost-effective, reversible, quantitative [52] [56] | Highest sensitivity of colorimetric methods [54] | Speed, no staining reagents, excellent downstream compatibility [53] [59] |
Selection Guidelines
Choosing the optimal detection method depends on multiple experimental factors. Coomassie staining remains the preferred choice for routine protein analysis, educational settings, and situations requiring protein quantification or recovery for downstream mass spectrometry [55] [56]. Its simplicity, low cost, and excellent reproducibility make it ideal for standard laboratory workflows where extreme sensitivity is not required.
Silver staining should be selected when maximum sensitivity is essential for detecting low-abundance proteins and when specialized equipment for fluorescent detection is unavailable [54] [58]. It is particularly valuable in discovery proteomics, detection of minor protein components, and analysis of limited samples. However, researchers should carefully consider the technical complexity, potential for artifacts, and limitations for quantitative work when selecting this method.
Stain-free technology offers the best solution for high-throughput applications, quantitative studies requiring wide dynamic range, and workflows where time efficiency and downstream compatibility are critical [53] [59]. Its rapid turnaround enables more frequent quality control checks during protein purification processes and reduces overall experimental timelines significantly.
Essential Research Reagent Solutions
Successful protein detection requires appropriate laboratory materials and reagents specific to each method. The following table outlines essential components for each detection technology:
Table 2: Essential Research Reagents for Protein Detection Methods
| Detection Method | Key Reagents and Materials | Primary Functions |
|---|---|---|
| Coomassie Staining | Coomassie Brilliant Blue R-250 or G-250 [56] [57] | Protein dye binding through ionic and hydrophobic interactions |
| Methanol, ethanol [56] [57] | Protein fixation, dye solvent | |
| Acetic acid, phosphoric acid, TCA [56] [57] | Protein fixation, pH control for optimal dye binding | |
| Destaining solution [56] | Removal of unbound dye from gel background | |
| Silver Staining | Silver nitrate [54] [58] | Source of silver ions for protein binding |
| Formaldehyde, glutaraldehyde [54] [58] | Enhancing sensitivity (traditional methods) | |
| Sodium thiosulfate [54] [58] | Sensitization for enhanced contrast | |
| Sodium carbonate [54] | Development solution for silver reduction | |
| High-purity water [58] | Preventing background staining from contaminants | |
| Stain-Free Technology | Trihalo compound-containing gels [59] | UV-activated tryptophan modification |
| UV transilluminator or compatible imager [59] | Activation and visualization of modified proteins |
The evolution of protein detection methods from traditional Coomassie staining through silver staining to modern stain-free technologies has significantly enhanced the capabilities of protein research. Each method offers distinct advantages that make it suitable for specific experimental requirements and constraints. Coomassie staining remains a reliable, cost-effective choice for routine applications; silver staining provides unparalleled sensitivity for detecting low-abundance proteins; while stain-free technology delivers unprecedented speed and workflow integration for modern high-throughput environments.
Understanding the principles, protocols, and comparative performance of these detection methods enables researchers to make informed selections based on their specific sensitivity requirements, time constraints, equipment availability, and downstream applications. As protein research continues to advance, particularly in therapeutic development and proteomics, the integration of these detection technologies with complementary separation and analysis methods will remain fundamental to scientific progress. The optimal choice balances practical considerations with experimental needs to ensure reliable, reproducible, and efficient protein detection.
Therapeutic proteins and monoclonal antibodies (mAbs) have revolutionized modern medicine, establishing themselves as a cornerstone of targeted therapies for cancer, autoimmune disorders, and other complex diseases. The field of biologics is undergoing a significant transformation, moving beyond traditional monoclonal antibodies to more complex and highly targeted formats. As of 2025, more than 130 antibody-based drugs have been approved by the U.S. Food and Drug Administration (FDA), reflecting their critical role in modern medicine [60]. The global market for therapeutic antibodies exceeded USD $267 billion in annual sales by 2024, demonstrating their substantial clinical and commercial impact [61]. This expansion is fueled by innovations in protein engineering and sophisticated analytical techniques, with gel electrophoresis remaining a fundamental tool for characterizing these complex biomolecules throughout the drug development pipeline.
The current wave of innovation is dominated by several key trends. Bispecific antibodies (bsAbs) and antibody-drug conjugates (ADCs) now account for approximately 25% of new antibody approvals [62]. Furthermore, the exploration of smaller antibody fragments, particularly nanobodies, offers advantages like superior tissue penetration and high stability [62]. Underpinning all these advancements is the transformative impact of Artificial Intelligence (AI) and Machine Learning (ML), which are revolutionizing the entire antibody discovery and engineering workflow [62] [61]. This whitepaper examines the critical role of protein analysis, with a focus on gel electrophoresis, in advancing these next-generation therapeutic biologics.
Current Trends and Approved Therapeutics
Key Modalities and 2024-2025 Approvals
The therapeutic antibody landscape has diversified dramatically. The following table summarizes the primary modalities and recent key approvals.
Table 1: Key Modalities of Therapeutic Antibodies and Recent Approvals
| Modality | Key Characteristics | Representative Approved Therapies (2024-2025) | Primary Indications |
|---|---|---|---|
| Monoclonal Antibodies (mAbs) | Target a single antigen; foundational technology | Tislelizumab (Tevimbra) [63], Zolbetuximab [63] | Esophageal squamous cell carcinoma, Gastric cancer |
| Bispecific Antibodies (BsAbs) | Engage two different targets simultaneously; novel mechanisms | Tarlatamab [62] [63], Zanidatamab [62] [63], Zenocutuzumab [62] [63] | Oncology (e.g., small cell lung cancer, biliary tract cancers) |
| Antibody-Drug Conjugates (ADCs) | Combine antibody specificity with cytotoxic payload potency | None approved in 2024, though >200 in clinical development [62] [63] | Various solid tumors and hematologic malignancies |
| Nanobodies | Small size for superior tissue penetration; high stability | None listed in top 2024 approvals, but promising pipeline candidates [62] | Targets in central nervous system, difficult-to-reach epitopes |
Quantitative Analysis of the Biologics Pipeline
The pipeline for biologic therapeutics is robust and growing. In 2024, the FDA approved 50 novel drugs, 16 of which were biologics—a figure consistent with the 10-year trend where biologics represent about one-third of all approvals [63]. A remarkable 13 of these biologics were monoclonal antibodies, the highest number since 2015, with six indicated for oncology [63]. Globally, the development pipeline is even more extensive, with 1,516 therapeutic antibody products in clinical development as of August 2025, 207 of which are already marketed worldwide [61]. This data underscores the intense focus and investment in antibody-based modalities.
Analytical Core: Gel Electrophoresis in Biologics Development
The development and quality control of complex biologics demand rigorous analytical methods. Gel electrophoresis serves as a critical, versatile tool from early discovery through manufacturing.
Fundamental Principles and Methodologies
Electrophoresis separates charged molecules in a liquid or semisolid medium under an electric field. The rate of migration (electrophoretic mobility) is governed by the molecule's net charge, size, shape, and the properties of the separation matrix [11] [2]. For proteins and antibodies, Polyacrylamide Gel Electrophoresis (PAGE) is the technique of choice due to the small, uniform pore size of polyacrylamide gels, which provide superior resolution for proteins [22] [3].
There are two primary forms of PAGE used in biologics development:
- SDS-PAGE (Sodium Dodecyl Sulfate-PAGE): Used under denaturing conditions. The anionic detergent SDS binds to proteins, linearizing them and imparting a uniform negative charge. This masks the proteins' intrinsic charge and allows separation based almost exclusively on molecular weight [22] [64]. The process involves boiling the protein sample with SDS and a reducing agent (e.g., β-mercaptoethanol or DTT) to break disulfide bonds [22] [64].
- Native PAGE: Run under non-denaturing conditions without SDS or reducing agents. This preserves the protein's higher-order structure, allowing separation based on the protein's intrinsic charge, size, and shape [22]. It is crucial for analyzing protein complexes, oligomeric states, and biological activity.
Detailed Experimental Protocol: SDS-PAGE for mAb Analysis
The following is a standard protocol for analyzing monoclonal antibody samples using SDS-PAGE.
1. Gel Preparation and Casting:
- Gel Composition: A discontinuous gel system is used, consisting of two layers: a stacking gel (low concentration, ~4-5% acrylamide, pH ~6.8) and a resolving gel (higher concentration, 8-15% acrylamide, pH ~8.8). The stacking gel concentrates the protein samples into a sharp band before they enter the resolving gel, ensuring high-resolution separation [22].
- Polymerization: The polyacrylamide gel is formed by polymerizing acrylamide and bisacrylamide. The reaction is catalyzed by Ammonium Persulfate (APS) and Tetramethylethylenediamine (TEMED) [22]. The concentration of the resolving gel is chosen based on the target protein size; for most mAbs and fragments (e.g., heavy/light chains), a 10-12% gel is typical.
2. Sample Preparation:
- The protein sample (e.g., mAb solution) is mixed with SDS-PAGE loading buffer containing SDS, a reducing agent (e.g., DTT), glycerol, and a tracking dye (e.g., bromophenol blue) [22] [64].
- The mixture is denatured by heating at 95-100°C for 3-5 minutes to ensure complete linearization and SDS binding [22].
3. Electrophoresis Run:
- The prepared gel is placed in a vertical electrophoresis tank and submerged in a running buffer (e.g., Tris-glycine-SDS) [22].
- Denatured samples and a pre-stained protein ladder (for molecular weight estimation) are loaded into the wells.
- An electric current is applied (e.g., 80-150 V, constant voltage). The negatively charged, SDS-coated proteins migrate toward the positive anode. Smaller proteins move faster through the gel matrix than larger ones [11] [22].
4. Visualization and Analysis:
- After electrophoresis, the gel is stained with a protein-binding dye such as Coomassie Brilliant Blue or a more sensitive fluorescent stain (e.g., SYPRO Ruby) to visualize the separated bands [22].
- The gel is imaged, and the molecular weight of unknown proteins is estimated by comparing their migration distance to the known standards in the protein ladder [11] [22].
The Scientist's Toolkit: Essential Reagents for Electrophoresis
Table 2: Key Research Reagent Solutions for Protein Gel Electrophoresis
| Reagent / Material | Function | Key Considerations |
|---|---|---|
| Acrylamide/Bis-acrylamide | Forms the porous polyacrylamide gel matrix that acts as a molecular sieve. | Ratio and total concentration determine pore size; neurotoxin in monomer form—handle with care. |
| SDS (Sodium Dodecyl Sulfate) | Anionic detergent that denatures proteins and confers a uniform negative charge. | Critical for SDS-PAGE; allows separation by molecular weight alone. |
| Reducing Agents (DTT, β-mercaptoethanol) | Breaks disulfide bonds within and between protein chains for complete denaturation. | Essential for analyzing antibody subunits (heavy and light chains). |
| APS & TEMED | Catalyzes the polymerization of acrylamide to form the gel. | TEMED is an accelerator; fresh APS is crucial for complete and timely polymerization. |
| Tris-based Buffers | Provides the ions to carry current and maintains a stable pH during the run. | Common systems are Tris-glycine for SDS-PAGE and Tris-borate for native PAGE. |
| Protein Molecular Weight Ladder | A mixture of proteins of known sizes for estimating the molecular weight of unknown samples. | Pre-stained ladders allow real-time tracking of migration progress. |
| Staining Dyes (Coomassie, SYPRO Ruby) | Binds to proteins to make separated bands visible after the run. | Coomassie is cost-effective; fluorescent stains like SYPRO Ruby offer higher sensitivity. |
Advanced Workflows and Integrated Technologies
As therapeutic formats become more complex, so do the analytical workflows used to characterize them.
Workflow for Characterizing a Bispecific Antibody
The following diagram visualizes a multi-technique analytical workflow for a bispecific antibody, highlighting the role of gel electrophoresis.
Diagram 1: BsAb characterization workflow. SDS-PAGE under reducing conditions checks the purity and correct molecular weight of individual antibody chains. Native PAGE assesses the integrity and correct assembly of the final bsAb molecule. Data from these techniques feed into more advanced analyses.
The Role of Electrophoresis in Addressing PK Challenges
A major challenge in mAb development is optimizing pharmacokinetics (PK), particularly extending half-life and reducing immunogenicity. Gel electrophoresis is vital for analyzing the success of engineering strategies aimed at these goals [65].
- Fc Engineering: Modifications to the Fragment crystallizable (Fc) region (e.g., YTE, LS mutations) increase affinity for the neonatal Fc receptor (FcRn), enhancing antibody recycling and half-life [65]. SDS-PAGE and capillary electrophoresis-sodium dodecyl sulfate (CE-SDS) are used post-engineering to confirm the molecular integrity of the modified mAb and ensure no aggregation or fragmentation has occurred.
- PEGylation: Conjugating polyethylene glycol (PEG) to mAbs increases their hydrodynamic size, reducing renal clearance and improving stability [65]. Gel electrophoresis is a standard method to confirm the successful attachment of PEG and to monitor for the presence of unconjugated mAb, which would appear as a lower molecular weight band.
The development of next-generation therapeutic proteins and monoclonal antibodies is intrinsically linked to advanced analytical capabilities. As this whitepaper has detailed, gel electrophoresis remains an indispensable tool in the scientist's arsenal, providing critical insights into the purity, integrity, size, and assembly of complex biologics from bsAbs to ADCs. Its role in supporting the engineering strategies designed to overcome pharmacokinetic and immunogenicity hurdles is particularly vital. While newer, high-throughput technologies continue to emerge, the simplicity, robustness, and informational power of electrophoresis ensure it will remain a foundational technique. Its continued application, often integrated with other analytical methods, is essential for validating the quality, safety, and efficacy of the innovative biologics that will define the future of targeted therapy.
Achieving Publication-Quality Results: Troubleshooting and Optimizing Your Gel Runs
Gel electrophoresis, and specifically Sodium Dodecyl Sulfate-Polyacrylamide Gel Electrophoresis (SDS-PAGE), serves as a fundamental analytical tool in molecular biology and biochemistry laboratories worldwide. This technique enables researchers to separate complex protein mixtures by molecular weight, providing critical insights into protein composition, purity, and identity. The reliability of this separation is paramount, as downstream applications—from Western blotting to mass spectrometric analysis—depend heavily on the quality of the initial electrophoretic run. Within drug development and basic research, irreproducible or artifact-laden results can compromise data integrity, lead to erroneous conclusions, and ultimately waste valuable time and resources. This guide addresses three of the most pervasive challenges in protein gel electrophoresis: smearing, atypical band shapes, and poor resolution. By framing these issues within the context of the core principles of electrophoresis, we aim to equip researchers with the diagnostic knowledge to not only identify and correct these problems but also to understand their underlying causes, thereby ensuring the generation of robust, publication-quality data.
Foundational Principles of SDS-PAGE
A firm grasp of the foundational principles of SDS-PAGE is a prerequisite for effective troubleshooting. The technique relies on two key mechanisms to separate proteins exclusively by molecular weight. First, the anionic detergent Sodium Dodecyl Sulfate (SDS) denatures proteins and confers upon them a uniform negative charge, effectively masking their intrinsic charge differences [66] [67]. Second, the polyacrylamide gel matrix acts as a molecular sieve, retarding the migration of larger proteins while allowing smaller proteins to migrate more freely toward the anode [67] [43].
Several factors directly influence the electrophoretic mobility of a protein. The pore size of the gel, determined by the concentration of polyacrylamide, must be appropriate for the size range of the target proteins [66]. The strength of the electrical field drives the migration, but excessive voltage generates heat, leading to diffusion and band distortion [68] [69]. The buffer system maintains a stable pH and provides ions to carry the current; improper buffer composition or overuse can disrupt the electrical field and compromise separation [68] [66]. Any deviation in these parameters can manifest as the common problems discussed in this guide.
Experimental Workflow for SDS-PAGE
The typical workflow for a denaturing protein gel electrophoresis experiment involves several critical steps, each with potential pitfalls. Adherence to a standardized protocol is essential for reproducibility.
Table 1: Key Steps in a Standard SDS-PAGE Protocol
| Step | Key Actions | Critical Parameters |
|---|---|---|
| Sample Preparation | Mix protein lysate with Laemmli buffer containing SDS and a reducing agent (e.g., DTT or β-mercaptoethanol). Heat denature at 95-98°C for 5-10 minutes [66]. | Ensure correct SDS-to-protein ratio (~1.4:1); avoid over-boiling which can degrade proteins [68] [70]. |
| Gel Casting | Prepare resolving and stacking gel solutions according to desired percentage. Use catalysts APS and TEMED to initiate polymerization [5]. | Ensure reagents are fresh and fully polymerized; degas solution to prevent uneven polymerization [70] [66]. |
| Loading & Run Setup | Load samples and molecular weight ladder into wells. Submerge gel in running buffer in the electrophoresis apparatus [7]. | Minimize time between loading and starting run to prevent sample diffusion from wells [68] [70]. |
| Electrophoresis | Apply constant voltage (e.g., 150V for a standard mini-gel) until dye front reaches the bottom of the gel [68] [7]. | Monitor voltage and temperature; use lower voltage for better resolution or to manage heat [68] [69]. |
| Post-Run Analysis | Proceed to protein staining (e.g., Coomassie, silver stain) or transfer to membrane for Western blotting [7]. | Handle gels carefully to prevent physical damage; use fresh staining solutions for optimal sensitivity [71]. |
Figure 1: Core SDS-PAGE Workflow. This diagram outlines the fundamental steps in denaturing gel electrophoresis, where proteins are linearized, charged, and separated based on molecular size.
Diagnosing and Troubleshooting Common Artifacts
Protein Smearing
Description: Smearing appears as a continuous, diffuse background of protein stain between distinct bands, often described as a "train track" appearance. It indicates a heterogeneous population of protein sizes or incomplete separation.
Primary Causes and Corrective Actions:
Table 2: Troubleshooting Guide for Protein Smearing
| Root Cause | Mechanism | Corrective Action |
|---|---|---|
| Improper Sample Preparation | Incomplete denaturation leaves proteins with secondary/tertiary structure, causing irregular migration. Protease degradation cleaves proteins into random fragments [69] [66]. | Ensure fresh DTT/β-mercaptoethanol; optimize boiling time (typically 5 min at 98°C) [66]. Keep samples on ice; use protease inhibitors [69]. |
| Overloaded Protein | Excess protein saturates the gel matrix, overwhelming its sieving capacity and leading to aggregated, poorly resolved protein [69] [66]. | Load the minimum amount of protein required for detection. Validate optimal loading for each protein-antibody pair [66]. |
| Incorrect Voltage | Excessively high voltage causes localized overheating, which can denature the gel matrix and cause proteins to diffuse rather than migrate sharply [68] [69]. | Run gel at lower voltage (e.g., 10-15 V/cm) for a longer duration to minimize heat production [68]. |
| Incomplete Gel Polymerization | A soft, incomplete gel matrix has inconsistent pore structure, failing to provide a uniform sieving effect [66]. | Ensure TEMED and APS are fresh and added in correct concentrations. Allow adequate time for complete polymerization before use [66]. |
Atypical Band Shapes (Smiling, Frowning, and Distortion)
Description: Atypical band shapes deviate from the ideal straight, horizontal band. "Smiling" (bands curve upward at the edges) and "frowning" (bands curve downward) are common, as is general distortion or skewing of bands in specific lanes.
Primary Causes and Corrective Actions:
Table 3: Troubleshooting Guide for Atypical Band Shapes
| Problem & Cause | Underlying Issue | Solution |
|---|---|---|
| 'Smiling' Bands(Joule Heating) | Uneven heat distribution across the gel causes the center to become hotter than the edges. Samples in the warmer center migrate faster, creating an upward curve [68] [69]. | Reduce the running voltage. Dissipate heat by running in a cold room, using an ice pack in the apparatus, or using a power supply with constant current mode [68] [69]. |
| 'Frowning' Bands(Poor Heat Dissipation) | The edges of the gel may be cooler than the center due to better contact with the cooling apparatus, causing slower migration at the sides [69]. | Ensure even contact and buffer circulation. Verify the gel apparatus is properly assembled. |
| Edge Distortion(Edge Effect) | Empty lanes at the periphery of the gel create an uneven electric field, distorting the migration of samples in the adjacent lanes [68]. | Do not leave outer wells empty. Load them with a dummy sample, ladder, or running buffer [68]. |
| Skewed Bands(Well Integrity) | Poorly formed wells, due to dirty combs or improper casting, cause samples to leak or start migration unevenly. High salt in samples can also cause local field distortion [70] [71]. | Clean combs thoroughly. Cast gels carefully to avoid well damage. Desalt samples via dialysis or precipitation if necessary [70] [71]. |
Poor Band Resolution
Description: Poor resolution is characterized by broad, poorly defined bands that are too close together to be distinguished as separate entities. This lack of sharpness prevents accurate molecular weight determination and identification.
Primary Causes and Corrective Actions:
Table 4: Troubleshooting Guide for Poor Band Resolution
| Root Cause | Impact on Separation | Corrective Action |
|---|---|---|
| Incorrect Gel Percentage | A gel with pores that are too large will not resolve small proteins; a gel with pores that are too small will not resolve large proteins effectively [66]. | Match the gel percentage to your protein's size. Use lower % gels (e.g., 8-10%) for high MW proteins and higher % gels (e.g., 12-15%) for low MW proteins [68] [66]. |
| Improper Run Time | Running the gel too short prevents sufficient separation. Running too long leads to band diffusion as proteins spread out over time [68] [69]. | Stop the run when the dye front is about 0.5-1 cm from the bottom. Optimize time for high or low MW targets [68]. |
| Incorrect or Depleted Buffer | Running buffer with incorrect ionic strength or pH, or that has been over-used, cannot maintain a stable electric field or proper protein charge, blurring resolution [68] [66]. | Always use fresh running buffer prepared with the correct salt concentration and pH. Avoid re-using buffer multiple times [68] [66]. |
| Protein Aggregation | Proteins, especially membrane proteins, may not be fully solubilized, leading to aggregation that migrates as a heterogeneous mass [70]. | Ensure sufficient SDS is present. For difficult samples, consider a brief sonication or using alternative detergents [70]. |
The Scientist's Toolkit: Essential Reagents and Materials
The quality and appropriateness of reagents are non-negotiable for successful electrophoresis. Below is a summary of key materials and their functions.
Table 5: Essential Research Reagent Solutions for SDS-PAGE
| Reagent/Material | Function | Key Considerations |
|---|---|---|
| Acrylamide/Bis-acrylamide | Forms the cross-linked, porous gel matrix that separates proteins by size [67]. | Neurotoxic in monomeric form; use pre-made solutions for safety. Adjust total percentage (%T) for target protein size [5]. |
| SDS (Sodium Dodecyl Sulfate) | Denatures proteins and confers a uniform negative charge, enabling separation by size alone [66] [67]. | Ensure the SDS-to-protein ratio is sufficient (typically 1.4:1 w/w), especially for membrane proteins [70]. |
| APS & TEMED | Catalysts (initiator and accelerator) for the polymerization reaction of the polyacrylamide gel [5]. | Must be fresh for complete and consistent gel polymerization. Incomplete polymerization causes poor resolution [66]. |
| Running Buffer (e.g., Tris-Glycine) | Carries the electric current and maintains the pH during electrophoresis [68] [43]. | Correct ionic strength is critical. High ionic strength increases heat; low ionic strength reduces resolution [68] [43]. |
| Loading Buffer/Dye | Provides density for well loading and a visible marker (dye front) to track migration [7]. | Contains SDS and reducing agent for denaturation, and glycerol or sucrose to sink the sample [7]. |
Mastering the diagnosis and resolution of smearing, atypical band shapes, and poor resolution transforms gel electrophoresis from a source of frustration into a robust and reliable technique. The path to optimal results is systematic: it begins with scrupulous attention to sample preparation, ensuring complete denaturation and absence of degradation. It requires matching the gel matrix to the experimental target through appropriate acrylamide percentage. It demands prudent management of the electrophoretic conditions, particularly voltage and temperature, to prevent heat-related artifacts. Finally, it is upheld by the consistent use of fresh, high-quality reagents. By adhering to these principles and applying the detailed troubleshooting guidelines provided herein, researchers and drug development professionals can confidently produce high-quality, reproducible data that accelerates discovery and ensures the integrity of their scientific conclusions.
Optimizing Gel Concentration and Running Conditions to Prevent Overheating
Within the framework of basic principles governing gel electrophoresis for protein separation research, the management of heat generated during the process is a fundamental concern. Overheating can severely compromise the integrity of results, leading to artifacts such as band distortion, smearing, and poor resolution [72] [73]. This technical guide provides an in-depth examination of the core strategies to prevent overheating, focusing on the critical interplay between gel concentration and running conditions. Optimizing these parameters is essential for any researcher in molecular biology or drug development seeking reproducible, high-quality protein separation, particularly in techniques like SDS-PAGE which are foundational for subsequent analyses such as Western blotting [74] [75].
Optimizing Gel Concentration for Resolution and Heat Management
The concentration of the gel matrix is the primary factor determining its pore size, which directly governs the resolution of proteins and influences heat dissipation. Selecting the appropriate gel concentration for the target protein's molecular weight is the first and most crucial step in preventing overheating and ensuring sharp bands [72] [76].
Gel Percentage Selection Based on Protein Molecular Weight
The table below provides a guideline for choosing the optimal polyacrylamide gel concentration based on the molecular weight range of the proteins of interest [75].
Table 1: Optimizing Gel Concentration for Protein Separation
| Protein Molecular Weight Range | Recommended Gel Concentration |
|---|---|
| 100 - 600 kDa | 4% |
| 50 - 500 kDa | 7% |
| 30 - 300 kDa | 10% |
| 10 - 200 kDa | 12% |
| 3 - 100 kDa | 15% |
For proteins of a very broad molecular weight range or when the target size is unknown, a gradient gel (e.g., 4-20%) is highly recommended. Gradient gels provide a broader range of separation in a single gel, producing sharper bands and offering better resolution for proteins of similar sizes [76] [74].
The principle behind this is straightforward: a higher concentration of acrylamide creates a denser matrix with smaller pores, which is ideal for resolving smaller proteins. Conversely, a lower percentage gel with larger pores allows larger proteins to migrate more effectively [76] [75]. Using a gel that is too concentrated for a large protein can cause trapping and excessive friction, contributing to localized heating. Conversely, a gel that is too weak may not adequately resolve small proteins and can be more susceptible to physical damage from heat [72].
Controlling Running Conditions to Mitigate Heat Production
The application of an electric field inevitably generates heat (Joule heating) within the electrophoresis system. The key to management is not the elimination of heat, but its control to maintain a stable, cool temperature throughout the run [77].
Key Running Parameters and Troubleshooting
Table 2: Optimized Running Conditions and Troubleshooting for Overheating
| Parameter | Recommended Condition | Consequence of Deviation & Troubleshooting |
|---|---|---|
| Voltage | 100-150 V for mini-gels; 10-15 V/cm of gel length [73] [74]. | Too High: Causes overheating, smiling bands, and smearing [73]. Solution: Reduce voltage and increase run time [72] [73]. |
| Buffer System | Use fresh, correctly prepared 1X running buffer [72] [78]. | Incorrect/Old Buffer: Alters conductivity, causes poor resolution and uneven heating [73] [78]. Solution: Always prepare fresh buffer. |
| Buffer Volume & Cooling | Ensure gel is submerged with 3-5 mm of buffer above it [79]. | Insufficient Buffer: Leads to poor heat dissipation and potential gel melting [79]. Solution: Use adequate buffer; employ a cooling stirrer or run in a cold room [73] [74]. |
| Run Time | Until the dye front reaches the bottom of the gel [73] [74]. | Over-running: Causes proteins, especially low molecular weight ones, to run off the gel [73]. Solution: Monitor the dye front closely. |
A standard practice for maintaining resolution while managing heat is to run the gel at a lower voltage for a longer duration. This approach minimizes heat generation and allows for better heat dissipation, resulting in sharper, better-resolved bands [72] [73].
The Scientist's Toolkit: Essential Research Reagent Solutions
The following reagents and materials are critical for executing a successful and cool protein gel electrophoresis experiment.
Table 3: Essential Reagents and Materials for SDS-PAGE
| Item | Function & Importance for Optimization |
|---|---|
| Acrylamide/Bis-acrylamide | Forms the polyacrylamide gel matrix. The ratio and total concentration (%T) determine pore size. Use molecular biology-grade, fresh reagents for consistent polymerization [76] [80]. |
| APS and TEMED | Catalysts for gel polymerization. Ammonium persulfate (APS) solution should be prepared fresh or stored at 4°C for no more than a month for efficient polymerization [76] [80]. |
| SDS Running Buffer | Provides ions to carry current and maintains pH. Incorrect concentration or the use of old buffer disrupts current flow and pH, leading to poor separation and overheating [72] [73] [78]. |
| SDS Sample Buffer | Contains SDS to denature proteins, glycerol to density the sample, and a tracking dye. Includes a reducing agent (DTT or β-mercaptoethanol) to break disulfide bonds for complete linearization [74]. |
| Pre-cast Gels | Offer superior reproducibility and convenience, with consistent gel thickness and concentration, minimizing one variable in optimization. Ideal for gradient gels [74]. |
| Protein Ladder | Essential for accurately determining the molecular weight of sample proteins and serves as a control for the electrophoresis run's performance [74]. |
| Cooling Apparatus | A magnetic stirrer in the buffer tank or a dedicated cooling unit is invaluable for dissipating heat during runs, especially for longer durations or higher voltages [73] [74]. |
Detailed Experimental Protocol for Optimized SDS-PAGE
This protocol outlines the key steps for preparing and running an SDS-PAGE gel with parameters designed to prevent overheating.
Sample Preparation
- Denaturation: Mix protein samples with an appropriate volume of 2X or 5X SDS sample buffer containing a reducing agent (e.g., DTT or β-mercaptoethanol) [74].
- Heating: Heat the samples at 95°C for 5 minutes to ensure complete denaturation. Inadequate heating can cause aggregation and smearing, while excessive heating can also be detrimental [74].
- Centrifugation: Briefly centrifuge the heated samples at maximum speed for 2-3 minutes to pellet any insoluble debris or aggregates [74].
Gel Selection and Apparatus Setup
- Gel Choice: Select a gel percentage from Table 1 based on your protein's molecular weight. For unknown or broad ranges, use a 4-20% gradient gel [74] [75].
- Assembly: Assemble the gel electrophoresis unit according to the manufacturer's instructions. Ensure the bottom tape has been removed from pre-cast cassettes and that the apparatus is leak-proof [78].
- Buffer: Fill the inner (upper) and outer (lower) chambers with fresh, 1X SDS running buffer. Confirm that the gel wells are completely submerged under 3-5 mm of buffer [79] [78].
Sample Loading and Electrophoresis Run
- Loading: Load equal volumes of prepared samples and protein ladder into the wells. Use gel loading tips for precision and to avoid cross-contamination [74]. Do not leave wells empty to prevent the "edge effect," which distorts bands in peripheral lanes; load a control protein or ladder in unused wells [73].
- Running Conditions: Connect the power supply and initiate the run at the recommended constant voltage (typically 100-150 V for mini-gels) [74].
- Temperature Management: For optimal results, employ active cooling. This can be achieved by:
- Completion: Stop the run immediately when the dye front (typically bromophenol blue) has just reached the bottom of the gel to prevent loss of low molecular weight proteins [73].
Workflow and Troubleshooting Diagrams
Optimization Workflow
The following diagram illustrates the logical decision-making process for optimizing gel electrophoresis conditions to prevent overheating.
Troubleshooting Heat-Related Issues
This diagram maps common overheating symptoms to their primary causes and recommended corrective actions.
In protein separation research, gel electrophoresis is a foundational technique whose reliability is paramount for accurate data interpretation in drug development and proteomic analysis. The integrity of the entire experimental workflow can be compromised by errors introduced during the critical sample loading phase. This technical guide provides an in-depth examination of three pervasive sample loading errors—overloading, improper pipetting, and contamination—detailing their impact on data quality, and outlining robust, actionable protocols for their prevention and correction. A thorough understanding and mitigation of these errors is essential for generating reproducible and high-quality protein data.
Core Principles and the Impact of Loading Errors
The fundamental principle of SDS-PAGE (Sodium Dodecyl Sulfate Polyacrylamide Gel Electrophoresis) is the separation of proteins based primarily on their molecular mass. To achieve this, proteins are denatured and linearized using SDS and a reducing agent, which confers a uniform negative charge, ensuring migration through the polyacrylamide gel matrix is a function of size alone [1]. Any deviation from this ideal state, often caused by loading errors, directly sabotages the separation process.
Sample loading is not merely a preparatory step but a critical parameter that dictates the outcome. Errors at this stage manifest as specific artifacts that can obscure results, lead to misinterpretation, and necessitate costly experiment repetition. Overloading, improper pipetting, and contamination each introduce unique distortions that compromise the quantitative and qualitative analysis of protein samples.
Quantitative Guidelines for Protein Loading
The table below summarizes the recommended protein loads for different gel sizes and staining methods, providing a foundational reference to prevent overloading or underloading [81].
Table 1: Recommended Protein Loads for SDS-PAGE
| Sample Type | Gel Well Size & Gel Thickness | Recommended Protein Mass | Staining Method |
|---|---|---|---|
| Purified Protein | Standard mini-gel well (e.g., 1 mm width) | 0.5 - 4.0 µg | Coomassie Blue |
| Crude Cell Lysate | Standard mini-gel well (e.g., 1 mm width) | 40 - 60 µg | Coomassie Blue |
| Any Sample (for high sensitivity) | Standard mini-gel well | 1/100th of Coomassie load | Silver Staining |
Error 1: Sample Overloading
Manifestations and Underlying Causes
Sample overloading occurs when the mass of protein applied to a well exceeds the gel's capacity for resolution. This error produces characteristic visual artifacts [71] [69]:
- Trailing Smears: A diffuse smear trailing downward from a band indicates an overabundance of protein.
- Warped or U-Shaped Bands: Bands that do not migrate in a straight line, often appearing thicker at the edges, are a classic sign of overloading.
- Fused Bands: Individual protein bands merge, preventing resolution of proteins with similar molecular weights and leading to inaccurate molecular weight determination [71] [69].
The underlying causes are twofold. First, excessive protein mass saturates the SDS-binding capacity, resulting in proteins with heterogeneous charge-to-mass ratios that migrate at different speeds. Second, the high concentration of protein and associated salts in the well creates a localized zone of high conductivity and heat (Joule heating), distorting the electric field and causing aberrant migration [69].
Experimental Protocol to Determine Optimal Load
A simple pre-experiment can determine the ideal loading concentration for a new sample type.
- Prepare a Sample Dilution Series: Create a series of 1:2 dilutions of your protein sample in an appropriate buffer (e.g., 1x SDS-PAGE loading buffer). A suggested starting range is from 40 µg down to 2.5 µg for a crude lysate.
- Load and Run the Gel: Load equal volumes of each dilution into adjacent wells on the same SDS-PAGE gel. Include a molecular weight marker.
- Stain and Analyze: After electrophoresis, stain the gel with Coomassie Blue or a fluorescent protein stain.
- Identify the Optimal Load: The correct load is the highest concentration that produces sharp, well-resolved bands without smearing, distortion, or fusion with adjacent bands. This load should be used for all future experiments with that specific sample type and gel setup.
Error 2: Improper Pipetting
Consequences and Best Practices
Improper pipetting technique directly damages the physical integrity of the gel and introduces variability, leading to:
- Well Damage: Puncturing the bottom or walls of the well with a pipette tip creates an irregular well shape, which causes band distortion and smiling/frowning effects [71].
- Introduction of Bubbles: Air bubbles introduced during loading can displace the sample from the well or create an irregular current flow, resulting in distorted bands [71].
- Sample Loss and Diffusion: Failure to properly sink the sample can lead to sample diffusing out of the well into the surrounding buffer, resulting in faint or absent bands [7].
Adherence to proper pipetting protocol is non-negotiable for precise results. The workflow below outlines the critical steps for error-free sample loading.
Error 3: Contamination
Contamination during sample preparation and loading introduces foreign molecules that interfere with protein migration and staining.
- Nuclease/Protease Contamination: Proteases, even in small amounts (as little as 1 pg), can degrade protein samples if the sample is left in buffer at room temperature before heating, leading to a characteristic smeared appearance from a spectrum of degradation products [71] [81].
- Keratin Contamination: A common artifact in sensitive silver-stained gels, keratin from skin, hair, or dander appears as a heterogeneous cluster of bands around 55-65 kDa. This contamination can originate from the researcher or from contaminated sample buffers [81].
- High Salt Concentration: Samples in high-salt buffers can create a zone of high conductivity in the well, leading to local heating, a distorted electric field, and smeared or distorted bands [71].
Protocol for Diagnosing and Mitigating Contamination
A. Diagnosing Protease Degradation:
- Split the protein sample into two aliquots in SDS-PAGE sample buffer.
- Immediately heat one aliquot at 95-100°C for 5 minutes.
- Leave the other aliquot at room temperature for 2-4 hours, then heat it.
- Run both samples on an SDS-PAGE gel. Additional or smeared bands in the room-temperature sample indicate protease activity [81].
B. Diagnosing Keratin Contamination:
- Run a control lane containing only the SDS lysis buffer (without protein) on the gel.
- After staining (especially silver stain), the appearance of bands in the buffer-only lane confirms the buffer is contaminated with keratin [81].
C. Mitigation Strategies:
- Prevent Degradation: Always heat samples immediately after adding them to the SDS-PAGE sample buffer. For heat-sensitive proteins, heating at 75°C for 5 minutes can inactivate proteases while avoiding cleavage of labile Asp-Pro bonds [81].
- Maintain Aseptic Technique: Wear gloves at all times. Use molecular biology-grade reagents and nuclease-free labware. Aliquot buffers and store them at -80°C to prevent contamination [71].
- Desalt Samples: If the sample is in a high-salt buffer, dilute it in nuclease-free water or use a desalting column, or precipitate and resuspend the protein in a compatible buffer [71].
The Scientist's Toolkit: Essential Research Reagent Solutions
The following table details key reagents and materials critical for preventing sample loading errors and ensuring successful protein electrophoresis.
Table 2: Essential Reagents for Error-Free Sample Loading and Electrophoresis
| Reagent/Material | Function & Importance | Technical Notes & Best Practices |
|---|---|---|
| SDS-PAGE Loading Buffer | Denatures proteins, provides negative charge (via SDS), and reduces disulfide bonds (via DTT/β-mercaptoethanol). The glycerol increases sample density for well loading [1]. | Maintain a 3:1 mass ratio of SDS to protein for complete denaturation [81]. Always include a reducing agent for full linearization. |
| Molecular Weight Markers (Ladder) | Essential reference for estimating protein size and confirming successful electrophoresis run [69]. | Include a ladder in every gel. Choose a ladder with bands spanning the expected molecular weights of your target proteins. |
| Pre-cast Gels | Provide consistency, save time, and eliminate variability introduced by manual gel casting, ensuring reproducible well formation [7]. | Ideal for standardized workflows and avoiding common hand-casting mistakes like poorly formed or connected wells [71]. |
| High-Purity Water & Reagents | Prevents introduction of nucleases, proteases, or contaminants (e.g., keratin) that degrade samples or create background artifacts [71] [81]. | Use only molecular biology-grade, nuclease-free water and reagents. Aliquot buffers to minimize contamination risk. |
| Mixed-Bed Resin | Treats urea solutions to remove cyanate ions that cause protein carbamylation, leading to charge heterogeneity and artifactual bands or spots in 2D-PAGE [81]. | Use to deionize fresh urea solutions for isoelectric focusing (IEF) to prevent protein modification. |
Sample loading is a precise, technique-driven process that demands as much attention as any other step in protein electrophoresis. Overloading, improper pipetting, and contamination are not minor inconveniences but significant sources of error that can invalidate experimental results. By understanding the underlying principles of how these errors manifest and implementing the detailed protocols and best practices outlined in this guide—including the use of dilution series to optimize load, meticulous pipetting technique, and rigorous contamination control—researchers can significantly enhance the reliability, reproducibility, and clarity of their protein separation data. This rigor is fundamental to advancing research and drug development with confidence.
The Importance of Fresh Buffers and Reagents for Consistent Performance
In the realm of protein research, gel electrophoresis stands as a fundamental technique for separating proteins by molecular weight. The reproducibility and accuracy of this technique, however, are profoundly dependent on a factor often overlooked in laboratory practice: the use of fresh buffers and reagents. Within the context of a broader thesis on the basic principles of gel electrophoresis for protein separation research, this whitepaper establishes that consistent performance is not merely an aspiration but an achievable standard through rigorous attention to the chemical integrity of electrophoresis components. The significance of this principle extends across basic research and into critical drug development processes, where irreproducible results can delay therapeutic advancement and compromise scientific validity.
The core challenge lies in the chemical instability of key reagents used in sodium dodecyl sulfate-polyacrylamide gel electrophoresis (SDS-PAGE). Over time or through improper handling, buffers can undergo oxidation, hydrolysis, and microbial growth, leading to altered pH, ionic strength, and electrochemical properties. These changes directly impact the migration of proteins through the polyacrylamide matrix, causing band smearing, aberrant migration, and poor resolution [66] [82]. For researchers and drug development professionals, these artifacts are not mere inconveniences; they represent a fundamental breakdown in the analytical process, potentially leading to misinterpretation of protein size, purity, and quantity.
The Critical Role of Key Reagents in SDS-PAGE
Mechanisms of Reagent Degradation and Their Impact on Electrophoresis
The performance of SDS-PAGE hinges on the precise chemical environment established by its buffers and reagents. Understanding how these components degrade is the first step toward mitigating their failure.
Electrophoresis Running Buffer (Tris-Glycine-SDS): The running buffer facilitates current flow and maintains the pH environment necessary for protein separation. Over time and with reuse, the buffer capacity diminishes due to electrochemical reactions at the electrodes, leading to pH drift. This alters the charge on proteins and the efficiency of the stacking gel system, resulting in decreased resolution and reduced sharpness of protein bands [66]. Furthermore, SDS can precipitate out of solution, particularly at room temperature or upon repeated freezing and thawing, leading to incomplete protein coating and inconsistent migration.
Polyacrylamide Gel Components (APS and TEMED): The polymerization of polyacrylamide gels is catalyzed by ammonium persulfate (APS) and N,N,N',N'-Tetramethylethylenediamine (TEMED). APS is highly hygroscopic and decomposes upon contact with water, losing its ability to generate the free radicals necessary to initiate polymerization. Using degraded APS results in incomplete gel polymerization, manifesting as soft, uneven gels with poor separation resolution and gel distortion during running [37]. TEMED also oxidizes upon exposure to air, reducing its catalytic efficiency.
Sample Preparation Reagents (SDS and Reducing Agents): The denaturing power of SDS-PAGE relies on complete protein unfolding via SDS binding and the reduction of disulfide bonds by agents like dithiothreitol (DTT) or β-mercaptoethanol. Oxidized DTT loses its reducing capacity, leading to incomplete denaturation and the persistence of protein secondary/tertiary structures. This causes proteins to migrate based on both size and shape, leading to incorrect molecular weight estimates and band bending or smearing [66] [37]. SDS, if not fresh, can form micelles of inconsistent size or precipitate, leading to uneven protein binding.
Quantitative Evidence: The Data Behind Degradation
The consequences of using expired or overused reagents are not merely theoretical; they are quantifiable and directly impact data quality. The following table summarizes key experimental observations linked to reagent degradation.
Table 1: Quantitative and Qualitative Impacts of Reagent Degradation in SDS-PAGE
| Reagent | Observed Effect of Degradation | Impact on Data Quality | Experimental Evidence |
|---|---|---|---|
| APS (Ammonium Persulfate) | Failed or delayed gel polymerization; uneven gel texture | Poor band resolution; distorted lanes; protein diffusion | Gels fail to set or are soft and tacky; increased run-to-run variability [37] |
| DTT (Dithiothreitol) | Incomplete disulfide bond reduction; protein aggregation | Band smearing; vertical streaking; higher molecular weight aggregates | Aberrant migration patterns; comparison with fresh DTT shows sharper bands [66] [37] |
| Running Buffer | Decreased buffer capacity; pH drift; SDS precipitation | Poor band separation; loss of stacking; curved bands | Overused buffer leads to "bent" bands and poor resolution compared to fresh buffer [66] |
| SDS in Sample Buffer | Inconsistent protein binding and denaturation | Incorrect molecular weight estimation; fuzzy bands | Proteins migrate anomalously; comparison with fresh SDS shows correct migration [37] |
Experimental Protocols for Reagent Preparation and Quality Assessment
Standardized Protocol for SDS-PAGE Reagent Preparation
To ensure consistency, the following detailed protocols for preparing and storing critical SDS-PAGE reagents should be adopted.
Table 2: Standardized Formulations and Storage Conditions for Key Reagents
| Reagent | Standard Formulation | Preparation Instructions | Optimal Storage & Stability |
|---|---|---|---|
| 10x Running Buffer | 250 mM Tris, 1.92 M Glycine, 1% (w/v) SDS [37] | Dissolve components in deionized water. Do not adjust pH. | Store at room temperature for up to 1 month. Filter through a 0.45 µm membrane if precipitate forms. |
| 10% APS (Ammonium Persulfate) | 10% (w/v) in deionized water [37] | Weigh APS freshly. Dissolve completely in water. Aliquot. | Store aliquots at -20°C for up to 6 months. Avoid freeze-thaw cycles. Discard if a single aliquot is >1 week old at 4°C. |
| 2x Laemmli Sample Buffer | 100 mM Tris-HCl (pH 6.8), 4% SDS, 20% Glycerol, 0.004% Bromophenol Blue [37] | Combine all components except reducing agent. | Store without reducing agent at -20°C indefinitely. Add 10% β-mercaptoethanol or 100 mM DTT fresh before use. |
| Separating Gel (10%) | 3.3 mL 30% Acrylamide/Bis, 2.5 mL 1.5 M Tris-HCl (pH 8.8), 100 µL 10% SDS, 3.9 mL H₂O, 50 µL 10% APS, 5 µL TEMED [37] | Mix all components except APS and TEMED. Degas for 1-2 minutes. Add APS and TEMED last, mix, and pour immediately. | Polymerizes in 20-30 minutes. Use fresh for best results. Cast gels can be stored hydrated at 4°C for up to 1 week. |
Quality Control Assessments for Critical Reagents
Proactive quality control is essential. Implement these simple checks before each run:
APS Activity Test: Mix a small drop of 10% APS with an equal volume of TEMED. Vigorous bubbling and rapid setting indicate good activity. A slow or weak reaction signifies the need to prepare a fresh aliquot [37].
Running Buffer Inspection: Visually inspect for cloudiness or precipitate, which indicates SDS fallout. Check the pH; fresh 1x running buffer should be ~pH 8.3. A significant shift (>0.3 pH units) warrants fresh buffer preparation [66].
DTT/β-Mercaptoethanol Efficacy: Prepare a control sample with a known disulfide-bonded protein (e.g., Antibody IgG). If the reduced form does not produce a sharp band at ~50 kDa (light chain) and ~25 kDa (heavy chain) under reducing conditions, the reducing agent may be compromised.
The Researcher's Toolkit: Essential Reagent Solutions
A well-managed lab maintains a robust inventory of these essential materials to guarantee consistent gel electrophoresis performance.
Table 3: Essential Research Reagent Solutions for SDS-PAGE
| Item / Reagent | Critical Function | Best Practice for Use |
|---|---|---|
| High-Purity Acrylamide/Bis | Forms the porous gel matrix for size-based separation. | Use a 30% stock solution, store at 4°C in the dark, and discard if discolored. |
| Tris Buffers | Provides the required pH environment for stacking (pH 6.8) and separation (pH 8.8). | Prepare 1.0 M and 1.5 M stocks, check pH regularly, and store at 4°C. |
| Ultrapure SDS | Denatures proteins and confers a uniform negative charge. | Prepare a 10-20% stock solution, store at room temperature, and warm if cloudy. |
| Fresh Reducing Agents (DTT) | Breaks disulfide bonds for complete protein denaturation. | Prepare 1 M stock aliquots, store at -20°C, and add to sample buffer just before use. |
| Catalysts (APS & TEMED) | Initiates and catalyzes the gel polymerization reaction. | Use fresh APS aliquots; keep TEMED tightly sealed and stored at 4°C. |
| Protein Ladder (Pre-stained) | Provides molecular weight standards for sample comparison. | Aliquot to avoid repeated freeze-thaw cycles; store as manufacturer recommends. |
Visualizing the Workflow and Impact of Reagents
The following diagram illustrates the sequential workflow of a standardized SDS-PAGE experiment, highlighting the critical points where fresh reagents are non-negotiable for success.
Furthermore, the decision to use fresh versus degraded reagents directly dictates the quality of the experimental outcome, a relationship mapped in the following logic diagram.
The consistent performance of gel electrophoresis is inextricably linked to the chemical fidelity of its buffers and reagents. As demonstrated, the use of fresh, properly formulated components is not a minor detail but a foundational requirement for obtaining reliable, interpretable, and reproducible data. This principle aligns perfectly with the broader thesis of rigorous protein research, where controlling fundamental variables is the bedrock of scientific discovery. For researchers and drug development professionals, adopting the protocols and quality control measures outlined herein is a critical step toward elevating data quality, reducing costly repetitions, and accelerating the translation of research from the bench to impactful applications. The path to consistent performance is clear: it begins with fresh buffers and reagents.
Best Practices for Documentation and Quantitative Analysis of Protein Bands
Within the fundamental research principles of gel electrophoresis for protein separation, the accurate documentation and quantitative analysis of protein bands are not merely final steps but are integral to ensuring data integrity, reproducibility, and biological relevance. For over 40 years, western blotting has been a workhorse technique, evolving from delivering simple 'yes or no' protein detection to enabling reliable measurement of relative changes in protein expression [83]. This shift towards quantitative analysis, however, demands rigorous methodologies. Major journals, funding agencies, and professional societies are now upholding the highest standards of data integrity, issuing updated guidelines for immunoblotting images to guard against data manipulation in a growing age of accessible image editing software [83]. This guide details the best practices for navigating these requirements, from preparing high-quality samples and capturing publication-ready images to performing robust densitometry and normalization, ensuring that research findings are both statistically sound and publication-ready.
Essential Documentation and Journal Publication Standards
Meticulous documentation begins at the bench and ends with adherence to specific journal figure guidelines. A "publication-ready" western blot means different things to different journals, but a common thread is the demand for transparency and an accurate representation of the original data.
Core Documentation Practices
- Maintain Original Images: Always save the original, unprocessed image files of your entire gel or blot. Some journals, like those in the Nature portfolio, require these original images to be published as Supplementary Information [84].
- Minimal Cropping: Avoid over-cropping images. It is essential to retain molecular weight markers and any important bands to provide context. A recent review of published western blot figures found that a majority are cropped, missing essential methodological information [84].
- Consistent Adjustments: If image adjustments like brightness or contrast are necessary, they must be applied uniformly across the entire image. Nonlinear adjustments should be avoided, and any adjustments that are made must be thoroughly documented in the figure legends or methods section [84]. It is never acceptable to digitally alter the data; for example, adjusting contrast to hide background or faint bands is prohibited [84].
- Logical Gel Layout: During experimental design, plan the gel layout with the final figure in mind. Arrange samples logically and avoid placing unrelated samples between those you plan to compare directly [84].
Journal-Specific Submission Guidelines
Top journals have specific requirements for figure submissions. The table below summarizes key guidelines from major publishers.
Table: Journal-Specific Guidelines for Western Blot and Gel Figures
| Journal/Publisher | Preferred File Format (Initial Submission) | Resolution & Color Mode | Key Blot-Specific Guidelines |
|---|---|---|---|
| Nature [83] | RGB, 300+ DPI, inline in .docx or PDF | 300+ DPI, RGB | Discourages quantitative comparisons between different blots; re-arranged lanes must be clearly indicated; high-contrast images discouraged. |
| Science [83] | Single .docx with figures, 300 DPI CMYK | 300 DPI, CMYK | No specific blot guidelines outlined, but certain electronic enhancements or manipulations are forbidden. |
| Cell Press [83] [84] | Separate TIFF or PDF files (<3 MB) | 300 DPI, RGB | Image processing must be minimal and explained; lane removals must be obvious. All papers are screened for image irregularities. |
| Elsevier [83] [84] | EPS, PDF, TIFF, or JPEG | 300-500 DPI, RGB | Adjustments of brightness/contrast are acceptable only if they do not obscure or eliminate information from the original. |
| Wiley [83] | TIFF, PNG, EPS preferred | 300 DPI, file size <10 MB | Specific instructions can vary by journal; authors should review the individual journal's Author Guidelines. |
A universal best practice is to save images in a lossless file format, such as TIFF or PNG, from the start. JPEG format should be avoided for quantification as its compression artifacts can distort band details [85].
Quantitative Analysis of Protein Bands
The transition from qualitative assessment to quantitative analysis requires careful technique, from image capture to data normalization, to ensure that measured differences reflect true biological changes.
Image Acquisition and Pre-processing
The accuracy of quantification is directly dependent on image quality [85].
- Avoid Saturation: Capture images at an exposure time where bands are not overexposed or saturated. Saturated bands lack meaningful detail on protein abundance and make accurate quantification impossible [85]. Using multiple exposures can help ensure bands are within the linear dynamic range of the detection device [85].
- High-Resolution Capture: Acquire images at a high resolution (at least 300 DPI) to ensure band clarity [84].
- Pre-processing in Software: Open-source software like ImageJ/Fiji is widely used for subsequent analysis. The image should be opened and can be converted to 8-bit for analysis. Adjust brightness and contrast using the "Auto" function cautiously, only if bands are not saturated, and apply the same adjustment to all images in an experiment [86]. A background subtraction step (e.g., using a rolling ball algorithm) may also be applied to minimize uneven background noise [86].
Densitometry and Band Quantification
Densitometry measures the optical density of protein bands, which is proportional to the amount of protein present. In ImageJ, two primary methods are employed:
- Gel Analyzer Method: This method simulates a lane profile. After selecting lanes with the rectangular tool, the "Analyze Gels" submenu is used to plot lane profiles, which show peaks representing bands. A baseline is drawn between peaks, and the "Wand" tool is used to select and measure the area under each peak [85] [86].
- Static Region of Interest (ROI) Method: This is a simpler approach where a fixed rectangle or oval is drawn around each band. The "Measure" function (shortcut M) records the Mean Gray Value and Integrated Density. This same ROI can be copied and pasted onto equivalent bands to maintain consistent sizing [86].
For both methods, background correction is critical. This involves measuring a nearby area with no bands and subtracting this background value from the band measurements [85] [86].
Normalization: Ensuring Accuracy and Reproducibility
Normalization accounts for technical variabilities like unequal protein loading or inconsistencies during transfer, distinguishing them from true biological changes [83]. Skillful normalization is key to accuracy and reproducibility [83].
- Housekeeping Protein (HKP) Normalization: This traditional method uses abundant proteins like GAPDH, β-actin, or β-tubulin as internal loading controls. The target protein signal is expressed as a ratio to the HKP. However, this method is falling out of favor because HKP expression is not constant; it can change with cell type, experimental conditions, tissue pathology, and more [83]. Furthermore, HKPs are often highly abundant, leading to early signal saturation [83].
- Total Protein Normalization (TPN): This is increasingly considered the gold standard. TPN normalizes the target protein to the total amount of protein in each lane, not just a single control protein. It is less affected by experimental manipulations, provides a larger dynamic range for detection, and gives information about the quality of your electrophoresis and transfer [83]. TPN can be achieved with a total protein stain or a fluorogenic labeling method performed before antibody probing [83] [85].
Table: Comparison of Normalization Methods for Western Blot Quantification
| Method | Principle | Advantages | Disadvantages |
|---|---|---|---|
| Housekeeping Protein (HKP) [83] | Normalizes target protein to a constitutively expressed internal protein (e.g., GAPDH, Actin). | Familiar and widely used; requires no additional steps beyond standard blotting. | HKP expression can vary with experimental conditions; narrow linear dynamic range; potential for signal saturation. |
| Total Protein Normalization (TPN) [83] [85] | Normalizes target protein to the total amount of protein loaded in the lane. | More reliable and less variable; not affected by changes in single protein expression; wider dynamic range. | Requires an additional staining or labeling step before immunodetection. |
| Internal Standard (BSA) [86] | For SDS-PAGE, uses a known amount of a standard protein (e.g., BSA) loaded on the same gel for calibration. | Allows for absolute quantification (ng of protein); useful for stained gels, not blots. | Not applicable for western blots where proteins are immobilized and probed with antibodies. |
After normalization, relative protein expression is calculated. The normalized density (Target Protein / Loading Control) for each sample is divided by the normalized density of the control sample, yielding a fold change [85]. These fold changes are often expressed on a log scale (e.g., log2) for statistical analysis [85].
Experimental Protocols
Protocol: Protein Quantification by Densitometry in ImageJ/Fiji
This protocol provides a detailed methodology for quantifying protein bands from a stained SDS-PAGE gel, adapted from a recent methods paper [86].
Materials:
- SDS-PAGE gel with protein samples (e.g., stained with Coomassie Brilliant Blue)
- BSA protein standard for calibration
- Flatbed scanner
- Computer with ImageJ/Fiji installed
Method:
- Image Capture: Scan the gel as a grayscale image at 300-600 DPI and save it in a lossless format like TIFF. Ensure bands are not saturated [86].
- Image Pre-processing in ImageJ:
- Open the image in ImageJ.
- (Optional) Convert to 8-bit (
Image > Type > 8-bit). - Adjust brightness/contrast (
Image > Adjust > Brightness/Contrast). Use "Auto" carefully and apply settings consistently. - (Optional) Subtract background (
Process > Subtract Background). Use a rolling ball radius of 50-200 pixels [86].
- Quantification using Static ROI Method:
- Select the rectangular tool and draw a ROI around the first protein band.
- Measure the band (
Analyze > Measureor pressM). This records Mean Gray Value and Integrated Density. - Copy this ROI (
Edit > Selection > Restore Selection) and paste it over the same band in other lanes to ensure consistent sizing. - Correct for background by measuring an empty area near the band and subtracting its value.
- Normalization and Calibration:
- Internal Control: Normalize each sample band against a constant reference band (e.g., a constant BSA load) on the same gel.
- Calibration Curve: Using the BSA standards of known amounts (e.g., 100, 250, 500 ng), build a calibration curve by plotting the measured integrated density against the protein amount (ng). Use the regression equation from this curve to convert the integrated density of unknown sample bands into ng of protein [86].
- Data Export: Export the results table from ImageJ and perform further statistical analysis and graphing in spreadsheet or statistical software.
Workflow Diagram: Quantitative Western Blot Analysis
The following diagram illustrates the logical workflow for the quantitative documentation and analysis of protein bands, from initial experiment to final data interpretation.
Quantitative Western Blot Workflow
The Scientist's Toolkit: Essential Reagents and Materials
The following table lists key reagents and solutions essential for successful protein separation, documentation, and quantitative analysis.
Table: Essential Research Reagents and Materials for Protein Gel Electrophoresis and Analysis
| Item | Function |
|---|---|
| Lysis Buffer (with detergents e.g., SDS) | Breaks open cells and solubilizes proteins for extraction [87]. |
| Protease Inhibitor Cocktail | Added to lysis buffer to prevent protein degradation by endogenous proteases during preparation [87]. |
| BCA or Bradford Assay Reagents | For accurate colorimetric protein quantification to ensure equal loading across gel lanes [87]. |
| SDS-PAGE Loading Buffer (with DTT/β-mercaptoethanol) | Denatures proteins and provides a negative charge for electrophoresis; reducing agents break disulfide bonds [87]. |
| Total Protein Stain (e.g., Coomassie, No-Stain Labeling Reagent) | Used for Total Protein Normalization (TPN) on membranes or gels; provides a superior loading control compared to HKPs [83]. |
| Primary and Secondary Antibodies | Enable specific detection of the target protein on a western blot membrane. |
| ImageJ/Fiji Software | Open-source image analysis platform for performing densitometry and quantifying band intensity [85] [86]. |
Within the framework of basic protein separation research, the principles of meticulous documentation and robust quantitative analysis are foundational to producing reliable and publishable data. The field is moving towards stricter standards, exemplified by the preference for Total Protein Normalization over traditional housekeeping proteins and the requirement for pristine, minimally processed images. By integrating careful experimental design, high-quality image acquisition, rigorous densitometry, and appropriate normalization strategies, researchers can ensure their findings on protein band expression are accurate, reproducible, and meaningful. Adhering to these best practices not only facilitates successful publication in top-tier journals but also strengthens the very foundation of scientific knowledge.
Validating Electrophoresis Data and Comparing Modern Separation Platforms
Gel electrophoresis remains a cornerstone technique in molecular biology and proteomics for separating proteins based on their size and charge. This technical guide provides an in-depth analysis of critical performance parameters—resolution, sensitivity, speed, and reproducibility—within the context of protein separation research. As the field advances toward automated systems and high-throughput applications, rigorous method assessment becomes increasingly crucial for generating reliable data in both academic research and drug development. This whitepaper examines established and emerging electrophoretic techniques, providing researchers with a framework for evaluating and optimizing their experimental approaches for protein analysis, with particular relevance to biomarker discovery, biopharmaceutical development, and clinical diagnostics.
Core Principles of Gel Electrophoresis for Protein Analysis
Gel electrophoresis separates protein molecules through a porous gel matrix under the influence of an electric field. The fundamental mechanism depends on the molecular sieving effect, where smaller proteins migrate more rapidly through the gel network while larger molecules are retarded [3]. This size-based separation is enhanced in techniques like SDS-PAGE, where sodium dodecyl sulfate denatures proteins and confers a uniform negative charge-to-mass ratio, ensuring separation occurs primarily according to molecular weight rather than inherent charge [88].
The gel matrix itself, typically composed of cross-linked polyacrylamide or agarose, creates a porous network that governs separation efficiency. The selection of gel percentage represents a critical optimization parameter, as it determines the effective separation range for proteins of different sizes [89]. Table 1 outlines recommended polyacrylamide percentages for optimal separation of various protein sizes, though actual ranges may vary based on specific cross-linking conditions and buffer systems.
Table 1: Polyacrylamide Gel Percentages for Protein Separation
| % Acrylamide | Effective Separation Range (kDa) |
|---|---|
| 3.5 | >500 kDa |
| 5 | 151-500 kDa |
| 10 | 61-150 kDa |
| 15 | 30-60 kDa |
| 20 | <30 kDa |
Note: Separation ranges are approximate and based on standard denaturing conditions. Actual performance depends on cross-linking ratio, buffer system, and electrophoresis conditions. Adapted from Sambrook, J., Fritsch, E.F., and Maniatis, T. (1989) [89].
The buffer system maintains stable pH throughout electrophoresis, suppressing thermal convection and ensuring consistent protein mobility [3]. Detection typically relies on protein-binding dyes such as Coomassie Brilliant Blue, SYPRO Ruby, or fluorescent tags, with varying sensitivities and dynamic ranges [88]. Recent advances include ruthenium-based fluorescent stains offering high sensitivity and broad linear dynamic ranges, facilitating quantitative proteomic analyses [88].
Critical Performance Parameters
Resolution
Resolution refers to the ability to distinguish between protein bands or spots that migrate close to one another. In gel electrophoresis, resolution is influenced by gel pore size, electric field strength, buffer composition, and sample quality. Higher percentage gels with smaller pores provide greater resolution for lower molecular weight proteins, while lower percentage gels are preferable for separating larger proteins [89].
The migration of marker dyes like Bromophenol Blue and Xylene Cyanol provides practical reference points for monitoring separation progress during electrophoresis. Table 2 illustrates how these dyes migrate at different positions depending on gel percentage, serving as visual aids for estimating separation efficiency.
Table 2: Dye Migration in Denaturing Polyacrylamide Gels
| % Acrylamide | Xylene Cyanol Migration (kDa) | Bromophenol Blue Migration (kDa) |
|---|---|---|
| 5 | 130 kDa | 35 kDa |
| 6 | 106 kDa | 26 kDa |
| 8 | 75 kDa | 19 kDa |
| 10 | 55 kDa | 12 kDa |
| 20 | 28 kDa | 8 kDa |
Adapted from Sambrook, J., Fritsch, E.F., and Maniatis, T. (1989) [89].
Advanced applications like two-dimensional gel electrophoresis (2DE) combine isoelectric focusing (IEF) with SDS-PAGE to resolve thousands of protein isoforms based on both charge and mass [88]. Image processing algorithms can further enhance resolution by adaptively improving contrast and removing background intensity variations, facilitating more accurate spot detection and gel alignment [90].
Sensitivity
Sensitivity defines the lowest amount of protein detectable by the method. While standard Coomassie blue staining typically detects microgram quantities, modern fluorescent stains like SYPRO Ruby can detect proteins in the nanogram range [88]. Colloidal Coomassie formulations (cCBB) offer improved sensitivity with lower background staining [88].
Recent innovations have substantially improved detection sensitivity. Capillary electrophoresis with laser-induced fluorescence (CE-LIF) detection enables highly sensitive analysis of monoclonal antibodies and next-generation biotherapeutics using fluorescent dyes like Chromeo P503 [91]. This approach provides enhanced detection capabilities crucial for analyzing low-abundance proteins in complex mixtures, with applications in biomarker discovery and biopharmaceutical quality control [91].
In-gel activity assays represent another dimension of sensitivity assessment, particularly for enzymatic studies. As demonstrated in recent research on medium-chain acyl-CoA dehydrogenase (MCAD), such assays can quantify enzymatic activity with high sensitivity, detecting less than 1 µg of protein while maintaining linear correlation between protein amount and activity [92].
Speed
Analysis time remains a significant consideration in method optimization, particularly for high-throughput applications. Traditional SDS-PAGE typically requires several hours for separation, staining, and destaining. Capillary SDS (CE-SDS) electrophoresis dramatically reduces analysis times to under 12 minutes per sample while maintaining robust separation [91].
Through strategic optimization of separation parameters—including voltage, temperature, and capillary length—analysis times can be further reduced. Increasing separation voltage from -15kV to -30kV at elevated temperatures (30°C) can decrease separation time from 22 minutes to approximately 9 minutes while maintaining acceptable resolution [91]. Automated systems like the BioPhase 8800 can process 96 samples in under 4.3 hours, representing a substantial throughput improvement over traditional methods [91].
Miniaturized systems and lab-on-a-chip technologies continue to push the boundaries of speed in electrophoretic separations, with ongoing development focused on point-of-care applications [93].
Reproducibility
Reproducibility encompasses both inter-gel consistency (between different gels) and intra-gel uniformity (within the same gel). Method standardization is essential for generating comparable data across experiments and laboratories. Key factors affecting reproducibility include gel composition, staining protocols, sample preparation methods, and imaging conditions [88].
Quantitative gel electrophoresis requires careful attention to multiple variables to ensure reliable results. Sample preparation techniques significantly impact reproducibility, with automated frozen disruption and optimized fractionation protocols improving subsequent proteomic analyses [88]. Standardized staining and destaining procedures minimize gel-to-gel variability, while advanced detection methods like difference gel electrophoresis (DIGE) incorporate internal standards to correct for run-to-run variations [88].
In capillary electrophoresis systems, reproducibility is maintained through careful capillary conditioning protocols and regular surface cleaning to prevent carryover and maintain separation consistency [91]. Automated systems demonstrate excellent inter-capillary reproducibility, with minimal variation in migration times and peak areas across multiple capillaries [91].
Advanced Technical Applications
In-Gel Activity Assays for Enzyme Characterization
Recent research demonstrates the power of adapted native gel electrophoresis combined with in-gel activity staining to characterize enzymatic function. A 2025 study on medium-chain acyl-CoA dehydrogenase (MCAD) deficiency developed a high-resolution clear native PAGE (hrCN-PAGE) assay coupled with colorimetric detection to quantify tetramer-specific activity separately from other protein forms [92].
This innovative approach revealed that certain pathogenic MCAD variants (K329E and R206C) cause tetramer fragmentation into lower molecular mass forms that lack enzymatic activity, while the main tetramer bands retain function [92]. Such insights are impossible with standard spectrophotometric assays that only measure overall activity, highlighting how specialized electrophoretic methods can provide unique biological insights into protein structure-function relationships.
High-Throughput Capillary Electrophoresis
The evolution of capillary electrophoresis with SDS (CE-SDS) addresses the growing demand for high-throughput protein analysis in biopharmaceutical development. Modern CE-SDS systems achieve remarkable throughput by optimizing multiple parameters simultaneously [91]:
- Separation conditions: Elevated voltage (25kV) and temperature (30°C) reduce run times
- Capillary conditioning: Streamlined between-run conditioning minimizes downtime
- Automated workflows: Integration with liquid handlers enables unsupervised sample processing
- Multi-capillary arrays: Parallel analysis of multiple samples increases throughput
These optimized workflows enable analysis of up to 192 samples in 8.5 hours (approximately 1.8 minutes per sample) while maintaining data quality sufficient for critical decision-making in bioprocess development [91].
Experimental Protocols
High-Resolution Clear Native PAGE for In-Gel Activity Assay
This protocol adapts the method described by [92] for determining enzymatic activity of proteins after native electrophoresis separation.
Materials:
- High-resolution clear native PAGE gel (4-16% gradient)
- Mitochondrial protein extracts or purified recombinant protein
- Substrate solution: 100 µM octanoyl-CoA in appropriate buffer
- Electron acceptor: 250 µM nitro blue tetrazolium (NBT) chloride
- Reaction buffer: 50 mM Tris-HCl, pH 8.0
- Standard electrophoresis equipment and power supply
Procedure:
- Prepare mitochondrial-enriched fractions or purified recombinant protein samples.
- Resuspend samples in native sample buffer (50 mM NaCl, 50 mM imidazole/HCl, 2 mM 6-aminohexanoic acid, 1 mM EDTA, pH 7.0).
- Load samples onto 4-16% high-resolution clear native PAGE gel.
- Perform electrophoresis at 4°C with cathode buffer (50 mM Tricine, 15 mM imidazole, pH 7.0) and anode buffer (50 mM imidazole/HCl, pH 7.0).
- Run gel at 100 V for 30 minutes, then increase to 200 V for 2-3 hours.
- After electrophoresis, incubate gel in reaction mixture containing substrate (octanoyl-CoA) and electron acceptor (NBT) in reaction buffer.
- Monitor development of purple diformazan precipitate at room temperature (10-15 minutes).
- Stop reaction by transferring gel to fixing solution (40% methanol, 10% acetic acid).
- Capture images and perform densitometric analysis using appropriate software.
Technical Notes:
- Linear correlation between protein amount and enzymatic activity can be demonstrated with 0.5-5 µg of protein.
- The assay shows sensitivity to detect subtle conformational changes induced by pathogenic variants.
- Method can be adapted for other acyl-CoA dehydrogenases with appropriate substrates.
Ultra-Fast CE-SDS for Monoclonal Antibody Analysis
This protocol, adapted from [91], enables high-throughput analysis of monoclonal antibodies and other biotherapeutic molecules.
Materials:
- BioPhase 8800 system or equivalent CE instrument
- BFS capillary cartridge (8 × 30 cm)
- BioPhase CE-SDS Protein Analysis Kit
- Chromeo P503 dye (0.5 mg/mL working solution)
- IgG control standard (10 µg/mL in SDS sample buffer, pH 9.0)
- β-mercaptoethanol (for reduced conditions)
- Sample plates, reagent plates, and outlet plates
Procedure:
- Prepare samples by diluting in SDS sample buffer to final concentration of 10 µg/mL in 100 µL volume.
- For reduced samples, add 5 µL β-mercaptoethanol and heat at 70°C for 10 minutes.
- Add 5 µL Chromeo P503 dye working solution (0.5 mg/mL) to heat-denatured samples.
- Mix well and incubate at 70°C for 10 minutes until color transitions from deep blue to purple-reddish.
- Transfer samples to sample plate and place in BioPhase 8800 system.
- Use separation method with optimized parameters: -25kV at 30°C.
- Employ modified capillary conditioning: gel rinse for 3 minutes before each injection, with full conditioning every 6 injections.
- Perform LIF detection with excitation at 488 nm and emission at 600 nm.
- Analyze data using BioPhase 8800 software or Empower software.
Technical Notes:
- Method achieves separation in under 12 minutes per sample.
- Resolution between non-glycosylated and glycosylated heavy chains should be ≥1.0 for reliable integration.
- No carryover should be observed in region of interest when proper conditioning protocols are followed.
- Inter-capillary reproducibility should show <5% CV for migration times and <10% CV for corrected peak areas.
Visualization of Method Optimization Workflow
The following diagram illustrates the decision-making process for optimizing electrophoresis method performance based on research objectives:
Research Reagent Solutions
The following table outlines essential reagents and materials for advanced electrophoretic applications, based on protocols discussed in this guide:
Table 3: Essential Research Reagents for Protein Electrophoresis
| Reagent/Material | Function/Purpose | Application Examples |
|---|---|---|
| Polyacrylamide gels (3.5-20%) | Molecular sieving matrix for protein separation | Size-based separation of proteins [89] |
| Nitro blue tetrazolium (NBT) | Electron acceptor in colorimetric activity assays | In-gel detection of dehydrogenase activity [92] |
| Chromeo P503 dye | Fluorescent label for LIF detection | High-sensitivity protein detection in CE-SDS [91] |
| SYPRO Ruby protein stain | Fluorescent protein detection | High-sensitivity staining for proteomics [88] |
| Clear native PAGE reagents | Maintain native protein structure and activity | Separation of protein complexes [92] |
| Capillary cartridges (BFS, 8×30 cm) | Separation pathway for capillary electrophoresis | High-throughput CE-SDS analysis [91] |
| β-mercaptoethanol | Reducing agent for protein denaturation | Sample preparation under reducing conditions [91] |
Comprehensive assessment of method performance in gel electrophoresis requires careful consideration of resolution, sensitivity, speed, and reproducibility as interconnected parameters. As the field evolves toward more automated and miniaturized systems, these fundamental performance metrics remain essential for evaluating both established and emerging technologies. The ongoing development of high-throughput capillary systems, sensitive detection methods, and specialized applications like in-gel activity assays continues to expand the utility of electrophoresis in protein research and biopharmaceutical development. By applying rigorous performance assessment frameworks and optimization strategies, researchers can select the most appropriate electrophoretic methods for their specific protein separation challenges, ensuring generation of reliable, reproducible data across diverse applications from basic research to clinical diagnostics.
Gel electrophoresis is a cornerstone technique in biochemistry and molecular biology laboratories for the separation of macromolecules such as proteins and nucleic acids. The fundamental principle relies on the movement of charged molecules through a porous matrix under the influence of an electric field. Their mobility is determined by factors including size, charge, and shape [1]. This whitepaper provides an in-depth comparative analysis of the two primary implementations of this technique: traditional slab gel electrophoresis and the more modern capillary gel electrophoresis (CGE). Framed within ongoing research into protein separation, this analysis aims to guide researchers and drug development professionals in selecting the appropriate method for their specific analytical needs, from basic research to high-throughput quality control of biopharmaceuticals like monoclonal antibodies and mRNA therapeutics [94] [95].
Core Principles and Methodologies
Slab Gel Electrophoresis
Slab gel electrophoresis involves the separation of samples in a thin, flat layer of gel, typically composed of polyacrylamide for proteins or agarose for large nucleic acids. The gel is submerged in a buffer tank, and samples are loaded into discrete wells. Upon application of an electric field, molecules migrate through the gel matrix at rates inversely proportional to their size [1] [96].
- Protein Separation (SDS-PAGE): For protein analysis, sodium dodecyl sulfate polyacrylamide gel electrophoresis (SDS-PAGE) is the most prevalent form. The ionic detergent SDS denatures proteins and confers a uniform negative charge, allowing separation based almost exclusively on polypeptide mass [1]. A discontinuous buffer system with a stacking gel is used to concentrate samples into sharp bands before they enter the resolving gel, enhancing resolution [1].
- Detection and Analysis: Post-separation, proteins are visualized using stains like Coomassie Brilliant Blue or silver stain. The results are spatial bands that can be photographed and analyzed densitometrically for semi-quantitative assessment [96].
Capillary Gel Electrophoresis (CGE)
Capillary gel electrophoresis miniaturizes the separation process within a narrow-bore fused-silica capillary (typically 25-100 µm in diameter) filled with a sieving matrix. This matrix is often a replaceable, linear polymer solution rather than a cross-linked gel [94] [97]. The capillary format enables the application of very high electric fields (300-600 V/cm) due to efficient heat dissipation [98] [96].
- Separation Mechanism: In CGE, separation is based on the same sieving principle as slab gels. However, detection occurs on-column in real-time via UV absorbance or laser-induced fluorescence (LIF) a few centimeters from the capillary outlet, generating a digital electropherogram [94] [96].
- Automation and Quantification: The entire process—capillary filling, sample injection, separation, and detection—is automated, leading to high reproducibility and precise quantitative data [97]. Sample injection is performed electrokinetically or hydrodynamically, consuming only nanoliters of sample [97].
Direct Technical Comparison: Slab Gel vs. CGE
The following table summarizes the critical differences between the two techniques, highlighting their distinct operational profiles.
Table 1: Technical Comparison of Slab Gel Electrophoresis and Capillary Gel Electrophoresis
| Feature | Slab Gel Electrophoresis | Capillary Gel Electrophoresis (CGE) |
|---|---|---|
| Separation Medium | Hydrated polyacrylamide or agarose slab [96] | Replaceable polymer matrix in a fused-silica capillary [94] [96] |
| Electric Field Strength | 4–10 V/cm [96] | 300–600 V/cm [96] |
| Typical Run Time | 30 minutes to several hours [1] [96] | Minutes to under 40 minutes [99] [96] |
| Sample Volume | Microliters (µL) loaded into wells [96] | Nanoliters (nL) injected [97] [96] |
| Detection Method | Post-run staining (e.g., Coomassie, SYBR Safe) and imaging [96] | On-column, real-time UV or Laser-Induced Fluorescence (LIF) [94] [96] |
| Data Output | Spatial bands on a gel image [98] | Digital electropherogram (peaks) [98] |
| Resolution | Good for routine analysis [96] | Very high; can resolve single-nucleotide or mass differences [96] |
| Throughput & Automation | Multiple samples per gel, but largely manual and labor-intensive [97] [96] | Sequential analysis, but fully automated with autosamplers [96] |
| Preparative Use | Bands can be excised for downstream processing [97] | Primarily analytical; fraction collection is uncommon [96] |
| Cost & Infrastructure | Low equipment and consumable cost [96] | High instrument cost and maintenance fees [96] |
Experimental Workflows
The fundamental difference in how results are generated is illustrated by the distinct workflows for each technique.
- Gel Casting: A polyacrylamide gel is prepared by polymerizing a mixture of acrylamide and bisacrylamide (e.g., 10% for standard separations) using ammonium persulfate (APS) and TEMED as catalysts. A stacking gel with lower acrylamide concentration and pH is cast on top.
- Sample Preparation: Protein samples are mixed with an SDS-containing buffer, often with a reducing agent like β-mercaptoethanol, and heated at 70–100°C to denature.
- Electrophoresis: The gel cassette is mounted in a tank filled with running buffer. Samples and a molecular weight marker are loaded into wells. A constant voltage (e.g., 100-200V) is applied until the dye front migrates to the bottom.
- Post-processing: The gel is immersed in a fixing solution (e.g., methanol-acetic acid) and then stained (e.g., Coomassie Blue). De-staining removes background dye.
- Analysis: Band patterns are visualized and documented under white or UV light. Molecular weights are estimated by comparing band migration to the standard ladder.
- System Preparation: A capillary is filled with a sieving matrix, such as linear polyacrylamide or a proprietary polymer solution in an SDS-containing buffer.
- Sample Injection: The capillary inlet is immersed in the sample vial, and a small volume (nL) is introduced into the capillary via pressure (hydrodynamic) or voltage (electrokinetic) injection.
- Separation: A high voltage (e.g., 10-30 kV) is applied. SDS-protein complexes migrate through the polymer network, separated by size.
- On-column Detection: As complexes pass a detection window near the capillary outlet, they are interrogated by a laser (for LIF) or UV lamp. Fluorescence or absorbance is recorded over time.
- Data Analysis: Software generates an electropherogram where peak area and migration time provide quantitative and sizing information, respectively.
The Scientist's Toolkit: Key Reagent Solutions
Table 2: Essential Reagents and Materials for Gel Electrophoresis
| Item | Function | Application |
|---|---|---|
| Acrylamide/Bis-acrylamide | Forms the cross-linked polyacrylamide gel matrix; pore size determines separation range [1]. | Slab Gel PAGE |
| SDS (Sodium Dodecyl Sulfate) | Denatures proteins and confers a uniform negative charge, enabling separation by size alone [1] [94]. | SDS-PAGE, SDS-CGE |
| Replaceable Polymer Matrix | Acts as a sieving medium for size-based separation; linear polymers like LPA are used in CGE for robustness [94]. | CGE |
| Fluorescent Dyes (SYBR, etc.) | Intercalate or bind to biomolecules for highly sensitive detection, especially with Laser-Induced Fluorescence (LIF) [97] [95]. | CGE, post-stain in gels |
| Molecular Weight Markers | A set of proteins of known mass run alongside samples to enable estimation of unknown protein sizes [1]. | SDS-PAGE, SDS-CGE |
Applications, Advantages, and Disadvantages
Advantages and Disadvantages
Slab Gel Electrophoresis:
- Advantages: Low initial equipment cost; intuitive visual results; multiple samples run in parallel on a single gel; preparative capability (bands can be excised for mass spectrometry or cloning) [97] [96].
- Disadvantages: Time-consuming manual procedures (casting, loading, staining); semi-quantitative results with limited dynamic range; lower resolution; higher reagent consumption and chemical waste [94] [96].
Capillary Gel Electrophoresis:
- Advantages: High speed and automation; excellent resolution and quantitative precision; minimal sample and reagent consumption; digital data output facilitates integration with Laboratory Information Management Systems (LIMS) [94] [96].
- Disadvantages: High capital investment; serial analysis can limit absolute throughput; capillaries can clog; primarily analytical, with limited preparative use [96].
Application Contexts
The choice between techniques is driven by the project's goals.
- Slab gels are ideal for routine quality control (e.g., checking protein expression or PCR products), educational demonstrations, and any application requiring physical recovery of separated biomolecules [97] [96].
- CGE is the preferred choice in regulated environments like biopharmaceuticals for quality control of recombinant monoclonal antibodies (rMAbs) [94] and mRNA therapeutics [95], for high-resolution applications like glycan profiling [96], and in forensic science for short tandem repeat (STR) analysis due to its superior sizing accuracy and reproducibility [99] [100].
Recent Advances and Future Outlook
The field is moving toward increased automation and integration. Automated slab-gel instruments (e.g., Agilent TapeStation) use pre-cast cartridges to digitize the process, bridging the gap between traditional gels and full capillary systems [96]. In CGE, the development of more robust and reproducible polymer matrices has been critical for its adoption in industry [94]. Furthermore, CGE is increasingly being incorporated as one dimension in two-dimensional (2D) separation platforms and directly coupled with mass spectrometry for definitive analyte identification, expanding its utility in proteomics and biomarker discovery [94] [98].
Both slab gel and capillary gel electrophoresis remain vital tools for protein separation research. Slab gel electrophoresis offers simplicity, low cost, and preparative flexibility, securing its place in basic research and teaching labs. In contrast, capillary gel electrophoresis provides superior speed, resolution, automation, and quantitative data integrity, making it indispensable for high-throughput analytics, biopharmaceutical development, and any application where precision and efficiency are paramount. The decision between them is not one of obsolescence but of appropriateness, dictated by the specific requirements of the scientific question at hand.
The Role of Electrophoresis in Orthogonal Analysis for Protein Purity Validation
In the development of biopharmaceuticals, such as therapeutic antibodies and recombinant protein vaccines, demonstrating product purity is a non-negotiable regulatory requirement. Orthogonal analysis refers to the strategy of employing multiple, independent analytical methods that leverage different physical or chemical principles to comprehensively characterize a product's quality attributes. This approach is critical because a single method may overlook certain impurities or provide an incomplete picture of the product's structure. Using methods with different separation mechanisms or detection principles ensures that results are robust and reliable, providing a cross-validated dataset that offers greater confidence in product quality than any single method could deliver alone.
Within this framework, gel electrophoresis serves as a foundational, proteoform-centric tool for protein separation and analysis. Its enduring value lies in its ability to separate proteins based on fundamental properties like molecular size and charge, providing a visual snapshot of a sample's complexity that is intuitive for scientists to interpret. When integrated with other techniques such as size exclusion chromatography (SEC), mass spectrometry (MS), and liquid chromatography (LC), electrophoresis forms a powerful analytical network. This guide details how electrophoresis is strategically combined with these orthogonal methods to validate protein purity, ensuring the safety and efficacy of biological therapeutics through a rigorous, multi-faceted analytical workflow.
Electrophoresis as a Foundational Separation Technique
Core Principles and Methodologies
Gel electrophoresis (GE) separates proteins based on their migration through a gel matrix under the influence of an electric field. The two primary forms used in protein analysis are one-dimensional gel electrophoresis (1D-GE) and two-dimensional gel electrophoresis (2D-GE).
- 1D-GE (typically SDS-PAGE) separates proteins primarily based on their molecular weight. Sodium Dodecyl Sulfate (SDS) denatures the proteins and confers a uniform negative charge, allowing separation by size as molecules travel through the polyacrylamide gel. It is a workhorse method for initial purity assessment, offering a straightforward way to visualize the number and approximate size of proteins in a sample [101].
- 2D-GE provides a higher resolution separation by combining two orthogonal steps: first, proteins are separated according to their isoelectric point (pI) using isoelectric focusing, and subsequently, they are separated by molecular weight using SDS-PAGE. This technique can resolve thousands of individual protein spots on a single gel, making it exceptionally powerful for detecting charge variants, post-translational modifications, and other proteoforms that would co-migrate in a 1D system [101].
A key advancement in 2D-GE is Difference Gel Electrophoresis (DIGE), which allows for sophisticated comparative protein expression profiling. In DIGE, multiple protein samples are labeled with different fluorescent cyanine dyes (e.g., Cy2, Cy3, Cy5) and co-separated on the same 2D gel. This multiplexing minimizes gel-to-gel variability, enabling highly accurate and sensitive quantification of differences in protein abundance between samples, such as diseased versus healthy states [101].
Quantitative and Data Analysis
Modern gel analysis has moved beyond simple visual inspection to sophisticated software-based quantification. Programs like GelExplorer use curve fitting with a nonlinear least-squares optimization to deconvolute overlapping bands. This methodology treats the data in two dimensions, fitting all data across the entire width of the lane. This allows for the accurate determination of intensities from individual, overlapping bands. Empirical studies have demonstrated that a Lorentzian lineshape provides a better model for the contours of an individual gel band than a Gaussian function, leading to more accurate quantification of protein abundance from electrophoresis data [102].
The Orthogonal Method Toolbox
For a comprehensive purity validation, electrophoresis is never used in isolation. It is part of a suite of orthogonal methods, each providing unique and complementary information about the protein product.
Table 1: Key Orthogonal Methods for Protein Purity Validation
| Method | Separation Principle | Key Information Provided | Typical Role in Workflow |
|---|---|---|---|
| SDS-PAGE | Molecular weight (size) | Purity profile, aggregate/ fragment detection, approximate molecular weight [103] | Initial, foundational analysis |
| Size Exclusion Chromatography (SEC) | Hydrodynamic volume (size) | Quantification of soluble aggregates, fragments, and monomers under native conditions [104] [103] | High-resolution quantification of size variants |
| Reversed-Phase Chromatography (RP-HPLC) | Hydrophobicity | Purity based on hydrophobicity, separation of variants with subtle sequence differences [105] | High-sensitivity purity analysis, identity confirmation |
| Mass Spectrometry (MS) | Mass-to-charge ratio | Precise molecular weight, amino acid sequence, post-translational modifications (PTMs) [101] [105] | Definitive identity confirmation and characterization |
| Capillary Electrophoresis (CE/Simple Wes) | Charge and size | Automated, microfluidic analysis of protein size and immunoassay; requires minimal sample [105] | High-throughput sizing and identity check |
The power of this orthogonal approach is exemplified in the characterization of therapeutic antibodies. A 2025 study systematically evaluated a panel of analytical methods on various antibody constructs, including full-length IgG and smaller engineered fragments like scFvs. The study found that while full-length antibodies exhibited high stability and remained monomeric, engineered fragments showed increased aggregation propensity. This was evidenced by higher polydispersity in Dynamic Light Scattering (DLS), early elution peaks in SEC, and altered thermal folding profiles in nanoDSF. The study concluded that integrating orthogonal methods is essential for a robust evaluation of antibody stability and integrity, attributes directly relevant to in vivo performance and safety [103].
Experimental Protocols for Integrated Workflows
Protocol: The GeLC-MS/MS Method for Proteoform Analysis
The GeLC-MS/MS method combines the superior separation power of SDS-PAGE with the identification power of mass spectrometry.
- Sample Preparation: Dilute the protein sample in a suitable buffer. Add Laemmli sample buffer containing SDS and a reducing agent (e.g., DTT) to denature the proteins. Heat the sample at 95°C for 5 minutes.
- Gel Electrophoresis: Load the denatured samples onto a polyacrylamide gel (e.g., 4-12% Bis-Tris gradient gel). Run the gel at a constant voltage (e.g., 80-200V) until the dye front reaches the bottom. Include a molecular weight marker lane [103].
- Staining and Visualization: After electrophoresis, stain the gel with a compatible stain, such as Coomassie Brilliant Blue or a fluorescent protein stain. Destain if necessary and image the gel.
- Gel Excision: Based on the gel image, carefully excise entire protein lanes or specific bands of interest using a clean scalpel. Slice each lane/band into several pieces to facilitate destaining and digestion.
- In-Gel Digestion: Destain the gel pieces, reduce with DTT, and alkylate with iodoacetamide. Then, digest the proteins within the gel matrix using a sequence-grade protease, typically trypsin, overnight at 37°C [101].
- Peptide Extraction: Extract the resulting peptides from the gel pieces using an acetonitrile-containing solution. Dry the pooled extracts in a vacuum concentrator.
- LC-MS/MS Analysis: Reconstitute the peptides in a low-percent acetonitrile/acid solution and inject into the LC-MS/MS system. The liquid chromatography step separates the peptides, which are then analyzed by tandem mass spectrometry for identification [101] [105].
Protocol: Orthogonal Purity and Impurity Analysis for a Recombinant Antigen
This protocol, adapted from a COVID-19 vaccine development study, showcases a modern, high-throughput orthogonal suite [105].
- Primary Purity Analysis via RP-HPLC:
- Column: BioResolve RP with polyphenyl stationary phase (450 Å pore size, 2.7 µm particles).
- Mobile Phase: A: 0.1% Trifluoroacetic Acid (TFA) in water; B: 0.1% TFA in acetonitrile.
- Gradient: Optimized linear gradient from low to high percent of B.
- Detection: UV at 215 nm and 280 nm.
- Flow Rate, Temperature, Injection Volume: Set according to method optimization (e.g., 0.5 mL/min, specified column temperature, 20 µL).
- Fraction Collection: Based on the RP-HPLC chromatogram, automatically collect the main peak and all minor chromatographic features with >1% peak area.
- Orthogonal Identity and Size Analysis (Simple Wes):
- Use the collected fractions (dried and reconstituted) or original sample.
- Load samples and specific antibodies (e.g., anti-RBD, anti-S1, anti-S2) into the designated plates of the Simple Wes instrument.
- Run the automated microcapillary immunoassay. The system separates proteins by size and provides a chemiluminescent signal for immunoreactive species, confirming identity and revealing truncations or aggregates [105].
- Orthogonal Identity and Impurity Identification (LC/MS/MS):
- Subject the RP-HPLC fractions to proteolytic digestion (e.g., with trypsin).
- Analyze the resulting peptides by LC/MS/MS.
- Use the mass spectrometry data to search protein databases, providing definitive identification of the target antigen and any co-eluting host cell proteins (HCPs) [105].
Visualization of Workflows and Relationships
The following diagram illustrates the logical workflow of an orthogonal purity validation strategy, with gel electrophoresis as a central component.
The Scientist's Toolkit: Essential Research Reagents and Materials
Successful execution of these analytical workflows depends on high-quality reagents and materials. The following table details key solutions used in the featured experiments.
Table 2: Research Reagent Solutions for Electrophoresis and Orthogonal Analysis
| Item | Function / Application | Example from Literature |
|---|---|---|
| Polyacrylamide Gels (4-12% Bis-Tris) | Denaturing protein separation by molecular weight; standard matrix for SDS-PAGE [103]. | Invitrogen brand, used for analyzing purified recombinant antibodies [103]. |
| Protein G Chromatography Resin | Affinity purification of antibodies and Fc-fusion proteins from complex mixtures like cell culture supernatant [103]. | Cytiva Protein G Sepharose, used for initial capture of mAbs from Expi293 cell supernatant [103]. |
| Size Exclusion Columns | High-resolution separation of protein monomers, aggregates, and fragments based on hydrodynamic size. | TSKgel G3000SWXL column used for SEC-HPLC analysis of monoclonal antibodies [104]. |
| Reversed-Phase Columns | High-resolution separation of proteins and peptides based on hydrophobicity; ideal for LC-MS. | BioResolve RP column with polyphenyl ligand used for purity analysis of SARS-CoV-2 spike antigen [105]. |
| Micro Spectrophotometer (Nanodrop) | Accurate quantification of protein concentration by measuring absorbance at 280 nm [103]. | Thermo Scientific Nanodrop 200C, used to determine concentration of purified proteins [103]. |
Case Study: Accelerated Vaccine Development
The critical role of orthogonal methods, including advanced electrophoresis techniques, was demonstrated during the accelerated development of a recombinant SARS-CoV-2 protein vaccine [105]. Initially, the project relied on SDS-PAGE and Western Blot for purity and identity. However, the complexity of samples from downstream process development, combined with the low throughput of gels, severely limited the speed of decision-making.
To overcome this, a suite of orthogonal methods was implemented:
- RP-HPLC became the primary method for purity evaluation, offering higher resolution, superior throughput, and consistency.
- Simple Wes provided an automated, microfluidic platform for rapid protein identification and sizing, replacing traditional Western Blots. It was crucial for confirming the identity of the main antigen peak and related truncates in collected RP-HPLC fractions.
- LC/MS/MS delivered definitive identification of the antigen and low-level host cell protein impurities.
This integrated approach provided the rapid, scientifically sound data needed to guide process improvements. It enabled the transition from a Phase 2 study to a global Phase 3 trial in less than two weeks, showcasing how modern orthogonal analytics, which build upon the foundational principles of electrophoresis, can dramatically accelerate biopharmaceutical development without compromising quality [105].
Gel electrophoresis remains an indispensable tool in the analytical scientist's arsenal, providing a proteoform-centric view of protein samples that is both intuitive and information-rich. However, its true power in rigorous purity validation is unlocked when it is deployed as part of an orthogonal analytical strategy. As demonstrated by the characterization of complex biologics like therapeutic antibodies and recombinant vaccines, combining the separation capabilities of GE with the quantitative power of SEC, the resolving power of RP-HPLC, and the definitive identification power of MS creates a robust, cross-validating network. This multi-faceted approach is paramount for ensuring the quality, safety, and efficacy of modern biopharmaceuticals, providing a comprehensive picture of product purity that no single method can achieve alone.
Electrophoresis, a cornerstone technique in biochemical research for the separation of macromolecules, has undergone a revolutionary transformation from traditional slab gel methods to advanced microchip platforms. This evolution is fundamentally reshaping protein separation research by integrating principles of miniaturization, automation, and high-throughput analysis. Where traditional gel electrophoresis provided the foundational technique for separating proteins based on size and charge through a porous gel matrix under an electric field, modern microchip electrophoresis (MCE) has transcended these capabilities by leveraging microfabricated devices. MCE, also described as a hybrid form of electrophoresis and chromatography, miniaturizes capillary electrophoresis onto a planar microfabricated device, consuming minute amounts of samples and reagents while offering rapid, high-resolution separations [106]. The technique's growth is propelled by concurrent advancements in high-throughput protein purification systems, creating a seamless pipeline from protein isolation to analysis that is increasingly vital for drug discovery, proteomics, and diagnostic applications [107].
This technical guide examines the emerging trends in microchip electrophoresis and automation within the context of protein separation research. We will explore the quantitative market landscape driving technological adoption, detail the core principles and comparative advantages of MCE, provide explicit experimental methodologies, visualize integrated workflows, and catalog essential research tools. These developments are not merely incremental improvements but represent a paradigm shift toward more efficient, reproducible, and scalable protein analysis that aligns with the demands of contemporary biological research and therapeutic development.
Market Landscape and Growth Projections
The adoption of microchip electrophoresis and high-throughput protein separation systems is reflected in robust market growth metrics, indicating strong technological acceptance across pharmaceutical, biotechnology, and academic research sectors. These quantitative projections underscore the strategic importance of these technologies in the evolving landscape of life sciences research.
Table 1: Microchip Electrophoresis Market Projections (2025-2035)
| Metric | 2025 Value | 2035 Projected Value | CAGR | Key Drivers |
|---|---|---|---|---|
| Global Market Size | USD 2.9 billion [108] | USD 6.3 billion [108] | 7.8% [108] | Demand for miniaturized/automated separation techniques, personalized medicine, pharmaceutical quality control [108] |
| Pharmaceutical Segment Share | 40.0% of total market revenue [108] | - | - | High-throughput screening, quality control, efficient biomolecule separation in drug development [108] |
| U.S. Market Size | USD 1.1 billion [108] | USD 2.1 billion [108] | 6.7% [108] | Robust biotechnology/pharmaceutical sector, significant research funding [108] |
Table 2: Complementary Protein Separation Technology Markets
| Market Segment | 2024/2025 Value | 2033/2035 Projected Value | CAGR | Notes |
|---|---|---|---|---|
| Global Protein Purification & Isolation Market | USD 11,100.20 million (2025) [109] | USD 30,400.6 million (2035) [109] | 10.6% [109] | Includes instruments, consumables, and various technologies for protein purification [109] |
| U.S. Protein Purification & Isolation Market | USD 3.41 billion (2024) [110] | USD 8.06 billion (2033) [110] | 10.09% [110] | Driven by biopharmaceutical demand and protein-based research [110] |
| Global Protein Separation Systems Market | USD 12.03 billion (2025) [111] | USD 22 billion (2033) [111] | 10.58% [111] | Encompasses broader systems for protein separation [111] |
Geographically, the market exhibits varied growth momentum. China leads with the highest projected CAGR of 10.6% in the microchip electrophoresis sector, followed by India at 9.8%, indicating rapid technological adoption in the Asia-Pacific region. Mature markets like Germany (9.0%), France (8.2%), the UK (7.4%), and the USA (6.7%) continue to expand steadily from established bases [108]. This global growth is technologically fueled by the integration of artificial intelligence (AI) for enhanced data analysis and process optimization, the push for miniaturization and portability of devices, and the increasing adoption of lab-on-a-chip (LOC) technology that integrates multiple laboratory functions onto a single microchip [112] [113]. These trends collectively address the critical needs for efficiency, reproducibility, and speed in protein separation research.
Technical Foundations of Microchip Electrophoresis
From Slab Gel to Microchip: A Comparative Analysis
Microchip electrophoresis represents the convergence of separation science and microfluidics technology. Fundamentally, it operates on the same principle as traditional gel electrophoresis: charged molecules, such as proteins, migrate through a medium under the influence of an electric field, with separation achieved based on differences in their size, charge, and shape [10]. The medium's pore size, buffer conditions (pH and ionic strength), and temperature all remain critical factors influencing separation efficiency [10]. However, MCE transfers this process from a macroscopic gel slab to a network of microfluidic channels etched into a planar chip, typically made of glass, silica, or polymers such as poly(dimethylsiloxane) (PDMS) or poly(methylmethacrylate) [10] [106].
This transition from the macro- to the microscale yields dramatic improvements in analytical performance. The shortened separation pathways and ability to apply higher electric field strengths result in significantly faster analysis times, often reducing separation from hours to seconds or minutes [10] [106]. Furthermore, the miniaturization leads to extremely low consumption of samples and reagents, typically in the nano- to picoliter range, preserving valuable biological materials [106]. The format also lends itself to massive parallelization and integration with other microfluidic functions like mixing, reaction, and concentration, paving the way for fully automated lab-on-a-chip systems [106].
Table 3: Comparison of Electrophoresis Techniques for Protein Separation
| Parameter | Slab Gel Electrophoresis | Capillary Electrophoresis (CE) | Microchip Electrophoresis (MCE) |
|---|---|---|---|
| Principle | Separation in a gel matrix based on size and charge [10] | Separation in a narrow capillary filled with buffer [10] | Miniaturized CE on a planar chip with microfluidic channels [106] |
| Analysis Time | Hours [10] | Minutes [10] | Seconds to minutes [10] [106] |
| Sample Volume | Microliters (μL) | Nanoliters (nL) | Pico- to nanoliters (pL-nL) [106] |
| Throughput | Low (limited by number of wells per gel) | Medium | High (potential for parallel channel operation) [113] |
| Automation Potential | Low | Medium | High (integrated with sample prep/detection) [113] [106] |
| Resolution | Good | High [10] | High (due to short, efficient separations) [10] |
| Key Advantage | Low cost, well-established | High resolution, automated | Speed, minimal reagent use, high-throughput [108] [10] |
| Key Disadvantage | Time-consuming, manual, low throughput | Longer analysis than MCE, more sample than MCE | Can require specialized instrumentation, potential for analyte adsorption to chip walls [106] |
The Role of Automation and High-Throughput Purification
Microchip electrophoresis does not function in isolation; its potential is fully realized when paired with automated, high-throughput protein purification methods. The "make" portion of the design-make-test-analyze cycle in protein research can become a significant bottleneck when relying on traditional, low-throughput purification techniques like manual column chromatography, which might only yield 5-10 purified proteins per week [107].
To address this, several automated purification strategies have been developed:
- Tip-Based Formats: Liquid handlers use pipette tips containing purification resin (e.g., for affinity or ion exchange) to automate binding, washing, and elution steps in a 96-well plate format. This method can theoretically process over 9,000 purifications in 24 hours, dramatically accelerating the workflow [107].
- Magnetic Beads: Magnetic agarose beads functionalized with affinity ligands or ion exchange groups are used to capture target proteins. Using a magnetic rack, beads are separated from solution, enabling semi-automated purification of approximately 100 proteins per day [107].
- Plate-Based Formats: These use filter plates with integrated resin, processed by liquid handlers coupled with centrifugation or vacuum filtration, offering throughput similar to tip-based systems [107].
These automated systems are increasingly integrated with MCE analysis, creating seamless workflows from protein expression and purification to separation and characterization. For instance, Nuclera's eProtein Discovery System exemplifies this trend by automating the workflow from DNA to purified, active protein in under 48 hours, a process that traditionally takes weeks [114].
Integrated Experimental Protocols
Protocol 1: High-Throughput Protein Purification Using Magnetic Beads
This protocol is adapted for efficiency and is suitable for processing dozens to hundreds of protein samples in parallel, ideal for feeding into a downstream microchip electrophoresis analysis.
Principle: Paramagnetic agarose beads are functionalized with affinity ligands (e.g., antibodies, nickel for His-tagged proteins) or ion exchange groups. When mixed with a protein lysate, the target proteins bind to the beads. An external magnet is used to immobilize the beads, allowing for rapid supernatant removal and buffer exchanges.
Materials:
- Lysis buffer (e.g., PBS with protease inhibitors)
- Magnetic agarose beads with appropriate functionalization (e.g., affinity, ion exchange)
- Binding/Wash buffer (optimized for the specific bead chemistry)
- Elution buffer (e.g., low pH buffer, imidazole for His-tag, competitive ligand)
- Cell lysate or clarified protein mixture
- 1.5-2.0 mL microcentrifuge tubes or 96-well plates
- Magnetic separation rack (for tubes or plates)
- Rotator or shaker
Methodology:
- Cell Lysis and Clarification: Lyse cells expressing the target protein using a standard mechanical or chemical method. Centrifuge the lysate at >12,000 × g for 15 minutes at 4°C to remove insoluble debris. Transfer the clarified supernatant to a new tube.
- Equilibration: Resuspend the magnetic bead slurry thoroughly. Add a calculated volume of beads (e.g., 20-50 μL slurry per sample) to a tube. Place the tube on the magnetic rack until the liquid clears. Remove and discard the storage supernatant. Wash the beads twice with 500 μL of Binding/Wash buffer, using the magnet to separate the beads each time.
- Binding: Resuspend the equilibrated beads in the clarified cell lysate. Incubate the mixture for 15-60 minutes at 4°C with constant gentle mixing on a rotator to ensure binding.
- Washing: Place the tube on the magnetic rack. Once the beads are fully captured (solution clears), carefully aspirate and discard the supernatant. Wash the beads 3-4 times with 500 μL of Ice-cold Wash Buffer, fully resuspending the beads each time and using the magnet for separation.
- Elution: After the final wash, fully remove the wash buffer. Resuspend the beads in 50-100 μL of Elution Buffer. Incubate for 5-15 minutes at room temperature with mixing to release the bound protein.
- Collection: Place the tube on the magnetic rack. Once cleared, carefully transfer the eluate (containing the purified protein) to a fresh tube. The purified protein is now ready for immediate analysis by microchip electrophoresis or storage at -80°C.
Protocol 2: Protein Analysis via Microchip Electrophoresis
This protocol outlines a standard procedure for analyzing purified protein samples using a commercial microchip electrophoresis system, following the purification protocol above.
Principle: Purified protein samples are injected into a separation channel on a microchip filled with a sieving polymer or gel. An applied high-voltage electric field separates the proteins based on their size-to-charge ratio. Separated proteins are detected in real-time, often via laser-induced fluorescence (LIF).
Materials:
- Commercial microchip electrophoresis instrument (e.g., from Agilent Technologies, Bio-Rad)
- Protein gel matrix or sieving polymer specific to the instrument
- Protein staining dye (e.g., fluorescent dye compatible with LIF detection)
- Running buffer (commercial kit or prepared as specified)
- Purified protein samples (from Protocol 1)
- Size or charge standards for calibration
- Deionized water
Methodology:
- Chip and Instrument Preparation: Prime the instrument and microchip according to the manufacturer's instructions. Ensure all fluidic reservoirs are filled with the recommended Running Buffer and that the separation channel is filled with the proprietary Gel Matrix.
- Sample Preparation: Dilute the purified protein eluate to a concentration within the instrument's detection range (typically 0.1-1 mg/mL). Mix an aliquot of the diluted protein (e.g., 5 μL) with an appropriate volume of fluorescent dye (if required for detection). Incubate in the dark for 5-10 minutes.
- Sample Loading and Injection: Pipette the stained protein sample into the designated sample well on the microchip. In the instrument software, set the injection parameters (typically electrokinetic injection: 1-5 kV for 5-30 seconds). This loads a nanoliter-scale plug of sample into the separation channel.
- Electrophoretic Separation: Initiate the separation run with a high-voltage field (e.g., 5-15 kV). The separation is rapid, typically complete within 60-180 seconds. The software controls the voltage and timing automatically.
- Detection and Data Analysis: As proteins pass the detection window (aligned with a laser for LIF), the software records the signal as electropherograms (signal vs. time) and can convert these to virtual gel images. Analyze the peaks by comparing their migration times to those of known standards to determine size, purity, and relative quantity.
Workflow Visualization and System Integration
The integration of high-throughput purification with microchip electrophoresis and data analysis creates a powerful, automated pipeline for protein research. The following diagram illustrates the logical flow and decision points within this integrated system.
Integrated High-Throughput Protein Analysis Workflow
Automation and AI are critical enablers of this workflow. As noted at the ELRIG Drug Discovery 2025 conference, the focus has shifted to "automation that saves time, data systems that connect, and biology that better reflects human complexity" [114]. Automated liquid handlers execute the purification protocols with minimal human intervention, while AI-assisted data analysis is revolutionizing the interpretation of MCE results. AI algorithms can automate data interpretation, perform error correction, recognize complex patterns, and even use predictive modeling to optimize experimental conditions for subsequent runs [112]. This creates a closed-loop, iterative system where data from the "analyze" phase directly informs the next "design" and "make" phases, dramatically accelerating the overall research cycle [107].
The Scientist's Toolkit: Essential Research Reagents and Materials
Successful implementation of automated protein separation workflows requires a specific set of reagents, consumables, and instrumentation. The following table details the key components of the research toolkit.
Table 4: Essential Research Reagent Solutions for High-Throughput Protein Separation
| Item | Function/Description | Key Considerations |
|---|---|---|
| Functionalized Magnetic Beads | Agarose beads with surface functional groups (e.g., Protein A, Ni-NTA for His-tags, ion exchange groups) for binding target proteins from a complex mixture [107]. | Choice depends on protein tag and properties; enables semi-automated purification in tube or plate formats. |
| Tip-Based Purification Kits | Disposable pipette tips pre-packed with purification resin for use with automated liquid handlers [107]. | Maximizes throughput (96-well format); ideal for affinity and ion exchange chromatography. |
| Microchip Electrophoresis Kits | Pre-packaged kits containing proprietary gel matrix, running buffer, dye, and standards optimized for specific commercial instruments. | Ensures reproducibility and performance; often includes fluorescent dyes for high-sensitivity detection. |
| Fluorescent Protein Stains | Dyes that non-covalently or covalently bind to proteins for detection via Laser-Induced Fluorescence (LIF) in MCE [10]. | Superior sensitivity for detecting low-abundance proteins compared to traditional Coomassie staining. |
| Sieving Polymer/Matrix | A viscous polymer solution within the microchip separation channel that acts as a molecular sieve, separating proteins by size [10]. | Replaces traditional polyacrylamide gels; formulation is critical for resolution and separation range. |
| Size & Charge Standards | A mixture of proteins of known molecular weight or isoelectric point (pI). | Essential for calibrating the microchip system and accurately determining sample protein size/charge from migration time. |
| Automated Liquid Handler | Robotic system that automates liquid transfer steps in purification protocols (pipetting, washing, elution) [107]. | Core hardware for high-throughput; significantly reduces manual labor and improves reproducibility. |
The convergence of microchip electrophoresis, automation, and high-throughput systems marks a definitive shift in the paradigm of protein separation research. Moving from the manual, time-intensive processes of slab gel electrophoresis to integrated, automated platforms represents more than just a technical improvement; it is a fundamental rethinking of how protein analysis can be scaled and integrated into the modern research pipeline. These technologies collectively address the pressing needs for speed, efficiency, and reproducibility in fields ranging from fundamental proteomics to biopharmaceutical development.
The core advantages are clear: MCE provides unparalleled speed and minimal consumption of precious samples, while automated purification systems break the throughput bottleneck, enabling the processing of hundreds or thousands of proteins in the time it once took to handle a few. The emerging integration of AI and machine learning for data analysis and experimental optimization further tightens this workflow, promising a future of increasingly intelligent and autonomous laboratory systems. For researchers and drug development professionals, mastering these tools is no longer optional but essential for staying at the forefront of protein science and contributing to the accelerated pace of discovery and therapeutic innovation.
Protein separation via gel electrophoresis is a foundational technique in molecular biology and biochemistry, but it is often a preparatory step for more detailed analyses. The true power of electrophoresis is realized when it is integrated with sophisticated downstream applications that enable protein identification, characterization, and functional analysis. Two of the most critical downstream techniques are mass spectrometry (MS), which provides precise molecular identification and characterization, and Western blotting (immunoblotting), which offers high-specificity detection of particular proteins within a complex mixture. This integration forms a cornerstone of modern proteomic research and diagnostic assay development, allowing researchers to move from simple separation to meaningful biological insight. The effectiveness of these advanced applications, however, is profoundly dependent on the quality and appropriateness of the initial electrophoretic separation [11] [115].
Core Principles of Protein Gel Electrophoresis
The Role of SDS-PAGE in Protein Separation
Sodium Dodecyl Sulfate-Polyacrylamide Gel Electrophoresis (SDS-PAGE) is the ubiquitous method for separating proteins based on their molecular weight [115]. The core principle involves using the detergent SDS to denature protein samples and impart a uniform negative charge, thereby negating the influence of a protein's intrinsic charge on its migration through a polyacrylamide gel matrix [31] [11]. Under an electric field, proteins then migrate toward the positive anode, with smaller polypeptides moving faster through the gel's pores than larger ones, resulting in separation by apparent molecular weight [11]. This process creates a predictable and reproducible separation that is essential for subsequent analysis.
Critical Steps in Sample Preparation
The journey to a successful downstream analysis begins with rigorous sample preparation. The objective is to fully denature the protein and linearize the polypeptide chains, ensuring separation is based solely on size.
- Denaturation with SDS: The anionic detergent SDS binds extensively to the hydrophobic regions of proteins, with approximately one SDS molecule binding per two amino acid residues [115]. This coating unfolds the protein's secondary and tertiary structures and confers a uniform negative charge, which dictates the protein's movement toward the positive electrode during electrophoresis [31] [115].
- Reduction of Disulfide Bonds: To achieve complete linearization, disulfide bonds must be broken. This is accomplished using reducing agents such as Beta-Mercaptoethanol (BME) or Dithiothreitol (DTT). These compounds disrupt covalent disulfide linkages between cysteine residues, ensuring individual polypeptide subunits are fully dissociated and denatured [31] [115].
- Heat Denaturation: After adding SDS and a reducing agent, samples are typically heated at 95°C for 5-10 minutes [115]. This application of heat is crucial for destroying hydrogen bonds that stabilize secondary structures like alpha-helices and beta-sheets, further facilitating the complete unfolding of proteins into random coil conformations [115].
Gel Composition and Architecture
The polyacrylamide gel acts as a molecular sieve. Its pore size, and thus its sieving properties, is determined by the concentration of acrylamide; higher percentages create smaller pores better suited for resolving lower molecular weight proteins [11]. The gel is typically cast in a discontinuous system comprising two distinct layers:
- Resolving Gel: This lower layer, with a higher acrylamide concentration (e.g., 10-12%) and a pH of ~8.8, is where the actual size-based separation of proteins occurs [115].
- Stacking Gel: This upper layer, with a lower acrylamide concentration (~4-5%) and a different pH (~6.8), serves to concentrate all protein samples into a sharp, unified band before they enter the resolving gel. This stacking effect is critical for achieving well-defined, sharp bands in the final separation [115].
The polymerization reaction that forms the gel is catalyzed by ammonium persulfate (APS) and TEMED (N,N,N',N'-Tetramethylethane-1,2-diamine), which generate free radicals to initiate the cross-linking of acrylamide and bis-acrylamide monomers [115].
Table 1: Essential Reagents for SDS-PAGE and Their Functions
| Reagent Category | Specific Example(s) | Primary Function in SDS-PAGE |
|---|---|---|
| Denaturing Agent | Sodium Dodecyl Sulfate (SDS) | Unfolds proteins and imparts uniform negative charge [115] |
| Reducing Agent | DTT (Dithiothreitol), BME (Beta-Mercaptoethanol) | Breaks disulfide bonds for complete linearization [31] [115] |
| Gel Matrix Components | Acrylamide, Bis-acrylamide | Forms the cross-linked porous polymer network of the gel [115] |
| Polymerization Catalysts | APS (Ammonium Persulfate), TEMED | Initiates and accelerates the gel formation reaction [115] |
| Running Buffer | Glycine, Tris, SDS | Provides conductivity and maintains pH during electrophoresis [31] |
Integration with Mass Spectrometry Analysis
From Gel Band to Peptide Identification
Mass spectrometry (MS) has become an indispensable tool for identifying proteins and characterizing post-translational modifications. The integration of SDS-PAGE with MS, often termed "geLC-MS/MS," leverages the superior separation and clean-up capabilities of the gel. A protein of interest, separated and visualized in a gel band, is identified by converting it into peptides that can be analyzed by the mass spectrometer. The workflow involves excising the protein band from the gel, digesting it into peptides with an enzyme like trypsin, and then analyzing the resulting peptide mixture by liquid chromatography-tandem mass spectrometry (LC-MS/MS) [116]. The MS data is then used to search protein databases to identify the original protein with high confidence. This approach is particularly powerful for analyzing complex mixtures or for validating the identity of a purified protein.
Special Considerations for Membrane Proteins
Membrane proteins represent over 60% of all drug targets, yet their insoluble nature and reliance on a lipid environment make them notoriously difficult to study using standard protocols that rely on ionic and zwitterionic detergents [116]. These detergents can lead to a loss of functional activity and disrupt key protein-protein and protein-lipid interactions [116].
SMALP Nanodisc Technology: A promising solution is the detergent-free extraction of membrane proteins using Styrene Maleic Acid Lipid Particles (SMALPs) [116]. The SMA copolymer integrates into the lipid bilayer and spontaneously forms nanodiscs that trap membrane proteins within their native lipid environment [116]. This method maintains the protein's structural integrity and functional activity, which is crucial for meaningful downstream analysis by mass spectrometry. Proteins extracted in SMALPs can be affinity-enriched and are compatible with subsequent MS analysis, allowing for the identification of native receptor complexes and their interacting partners without the destabilizing effects of detergents [116].
Experimental Protocol for In-Gel Digestion
The following protocol details the standard procedure for preparing a gel band for mass spectrometric analysis.
- Gel Excision: Following electrophoresis, visualize the gel using a compatible stain (e.g., Coomassie Blue). Excise the band of interest with a clean scalpel, minimizing the amount of excess gel [31].
- Destaining: For Coomassie-stained gels, place the gel piece in a microcentrifuge tube and destain with a solution like 50 mM ammonium bicarbonate in 50% acetonitrile. Vortex until the blue stain is removed from the gel plug.
- Reduction and Alkylation: Hydrate the gel piece in a reducing buffer containing DTT to break any reformed disulfides. Then, alkylate the cysteine residues using iodoacetamide to prevent reformation and modify them for database searching.
- Tryptic Digestion: Remove the liquid and add a sequencing-grade modified trypsin solution in a suitable buffer (e.g., 50 mM ammonium bicarbonate). Allow digestion to proceed, typically overnight at 37°C.
- Peptide Extraction: Extract peptides from the gel piece by adding a solution containing acetonitrile and formic acid. Sonicate and concentrate the pooled extracts to complete dryness in a vacuum centrifuge.
- Desalting: Reconstitute the peptides and desalt them using C-18 material, such as Pierce C-18 spin tips, to remove salts and other impurities that could interfere with the MS analysis [116].
- MS Analysis: The purified peptides are now ready for LC-MS/MS analysis. The resulting spectra are searched against a protein database for identification.
Table 2: Key Reagents for Mass Spectrometry Sample Preparation
| Reagent | Function in MS Sample Prep |
|---|---|
| Trypsin/Lys-C Mix | Proteolytic enzyme that cleaves proteins into peptides for MS analysis [116] |
| Ammonium Bicarbonate | Buffering agent used during digestion to maintain optimal pH for enzyme activity |
| C-18 Material / Spin Tips | Solid-phase medium for desalting and purifying peptide mixtures before MS [116] |
| Acetonitrile | Organic solvent used for destaining, dehydration, and peptide extraction |
| DTT / Iodoacetamide | Reduces and alkylates cysteine residues to prevent disulfide bond reformation |
Integration with Western Blotting (Immunoblotting)
The Western Blotting Workflow
Western blotting is the premier method for detecting a specific protein in a complex sample using antibodies. SDS-PAGE is the critical first separation step in this technique. The overall workflow involves separating proteins by SDS-PAGE, transferring them from the gel onto a stable solid support membrane (typically nitrocellulose or PVDF), and then probing the membrane with antibodies specific to the target protein to visualize its presence and relative abundance [11].
Detailed Experimental Protocol
Protein Transfer:
- Following SDS-PAGE, the gel is assembled into a "sandwich" with a membrane and filter papers.
- This stack is placed in a transfer apparatus filled with a transfer buffer (often containing methanol, which aids in protein binding to the membrane).
- An electric current is applied perpendicular to the gel, driving the separated proteins out of the gel and onto the membrane, where they bind irreversibly.
Blocking:
- The membrane is incubated in a blocking solution, such as 5% non-fat dried skim milk in Tris-buffered saline with Tween 20 (TBS-T) [116].
- This step is critical to saturate non-specific protein-binding sites on the membrane, preventing antibodies from sticking to the membrane itself and reducing background noise.
Immunodetection:
- Primary Antibody Incubation: The blocked membrane is probed with a primary antibody specific to the target protein. This is typically done in blocking buffer or a similar solution, often overnight at 4°C [116].
- Washing: The membrane is thoroughly washed with TBS-T buffer to remove any unbound primary antibody [116].
- Secondary Antibody Incubation: The membrane is then incubated with a species-specific secondary antibody conjugated to a reporter enzyme, such as Horseradish Peroxidase (HRP) [116]. This antibody binds to the primary antibody.
- Washing: A final series of washes removes any unbound secondary antibody.
Detection:
- For HRP-conjugated antibodies, the membrane is incubated with a chemiluminescent substrate (e.g., ECL). The enzyme catalyzes a light-producing reaction.
- The emitted light is captured on X-ray film or with a digital imaging system, revealing the location and intensity of the target protein band.
Critical Factors for Success
- Gel Quality: The clarity of the final Western blot result is directly dependent on the quality of the initial SDS-PAGE separation. Sharp, well-resolved bands in the gel will lead to clean, specific signals on the blot.
- Antibody Specificity: The success of a Western blot hinges on the specificity and affinity of the primary antibody. Validation of antibodies for Western blotting is essential.
- Controls: Appropriate controls, including a molecular weight ladder and loading controls (e.g., detection of a constitutively expressed protein like actin or GAPDH), are mandatory for correct interpretation of results.
Table 3: Essential Reagents for Western Blotting
| Reagent | Function in Western Blotting |
|---|---|
| Transfer Buffer | Medium for electrophoretic transfer of proteins from gel to membrane |
| Nitrocellulose/PVDF Membrane | Solid support that binds proteins post-transfer |
| Blocking Agent (e.g., Skim Milk) | Saturates non-specific binding sites to reduce background [116] |
| Primary Antibody | Binds specifically to the target protein of interest [116] |
| HRP-Conjugated Secondary Antibody | Binds to primary antibody; enzyme catalyzes detection reaction [116] |
| Chemiluminescent Substrate (ECL) | Provides substrate for HRP, producing light for signal detection [116] |
| TBS-T Buffer | Washing buffer to remove unbound antibodies and reduce background [116] |
Conclusion
Gel electrophoresis remains an indispensable and versatile tool in the protein scientist's arsenal, evolving from a foundational analytical method to a sophisticated technology capable of supporting high-stakes biopharmaceutical development. The principles of separation based on size and charge provide a robust framework, while modern methodologies like CGE and stain-free detection offer unprecedented speed, sensitivity, and reproducibility. Mastering troubleshooting is key to generating reliable data, and understanding the comparative strengths of different platforms allows for informed technological selection. Looking forward, the integration of electrophoresis with microfluidics, AI-driven data analysis, and advanced detection methods like mass spectrometry will further solidify its role in accelerating drug discovery, advancing clinical diagnostics, and deepening our understanding of complex proteomes.
References
- 1. Overview of Protein Electrophoresis [https://www.thermofisher.com/us/en/home/life-science/protein-biology/protein-biology-learning-center/protein-biology-resource-library/pierce-protein-methods/overview-electrophoresis.html]
- 2. Electrophoresis [https://pubmed.ncbi.nlm.nih.gov/36251838/]
- 3. Gel Electrophoresis - an overview | ScienceDirect Topics [https://www.sciencedirect.com/topics/agricultural-and-biological-sciences/gel-electrophoresis]
- 4. Protein Purification and Isolation Market Size to Surpass ... [https://www.biospace.com/press-releases/protein-purification-and-isolation-market-size-to-surpass-usd-33-02-billion-by-2034]
- 5. Steps in Nucleic Acid Gel Electrophoresis [https://www.thermofisher.com/us/en/home/life-science/cloning/cloning-learning-center/invitrogen-school-of-molecular-biology/na-electrophoresis-education/na-electrophoresis-workflow.html]
- 6. Agarose Gel Electrophoresis for the Separation of DNA ... [https://pmc.ncbi.nlm.nih.gov/articles/PMC4846332/]
- 7. Gel Electrophoresis Steps [https://azurebiosystems.com/blog/gel-electrophoresis-steps/]
- 8. The Evolution of SDS-Based Protein Separation [https://www.bio-techne.com/resources/blogs/advantages-of-ce-sds]
- 9. Protein Electrophoresis Apparatus 2025-2033 Analysis [https://www.datainsightsmarket.com/reports/protein-electrophoresis-apparatus-1028293]
- 10. Trends development and applications on electrophoresis ... [https://www.sciencedirect.com/science/article/abs/pii/S0039914025005193]
- 11. Mastering Electrophoresis: Techniques, Equipment, and ... [https://www.labx.com/resources/mastering-electrophoresis-techniques-equipment-and-applications-in-dna-rna-and-protei/5535]
- 12. Polysaccharide as a Separation Medium for Gel ... [https://www.mdpi.com/2673-4176/5/3/24]
- 13. SDS-PAGE Analysis of proteins: Principles, methodology ... [https://deepscienceresearch.com/dsr/catalog/book/107/chapter/407]
- 14. Deciphering food proteins: The applications of SDS-PAGE ... [https://www.sciencedirect.com/science/article/abs/pii/S2212429225003025]
- 15. One-dimensional SDS gel electrophoresis of proteins [https://pubmed.ncbi.nlm.nih.gov/18228518/]
- 16. Overview: Electrophoresis Buffers [https://www.bostonbioproducts.com/electrophoresis-buffers-overview/]
- 17. A Database of Accurate Electrophoretic Migration Patterns ... [https://www.sciencedirect.com/science/article/pii/S0022283622005605]
- 18. Protocol for detecting interactions between intrinsically ... [https://pmc.ncbi.nlm.nih.gov/articles/PMC12305580/]
- 19. Affinity Electrophoresis of Proteins for Determination ... [https://www.mdpi.com/1422-0067/26/7/3409]
- 20. Choosing Between Agarose and Polyacrylamide Gels: A Comparative Guide [https://www.labx.com/resources/choosing-between-agarose-and-polyacrylamide-gels-a-comparative-guide/5537]
- 21. Agarose in Electrophoresis: Everything You Need to Know [https://ginobiotech.com/agarose-in-electrophoresis/]
- 22. Polyacrylamide Gel Electrophoresis, How It Works, ... [https://www.technologynetworks.com/analysis/articles/polyacrylamide-gel-electrophoresis-how-it-works-technique-variants-and-its-applications-359100]
- 23. Gel Electrophoresis 101: How to Choose Between Agarose and Polyacrylamide [https://synapse.patsnap.com/article/gel-electrophoresis-101-how-to-choose-between-agarose-and-polyacrylamide]
- 24. Native SDS-PAGE: High Resolution Electrophoretic ... [https://pmc.ncbi.nlm.nih.gov/articles/PMC4517606/]
- 25. Agarose and Polyacrylamide Gel Electrophoresis Methods for Molecular Mass Analysis of 5–500 kDa Hyaluronan - PMC [https://pmc.ncbi.nlm.nih.gov/articles/PMC3207642/]
- 26. Rapid baseline hump-free analysis of therapeutic proteins ... [https://pubmed.ncbi.nlm.nih.gov/40409905/]
- 27. Capillary vs. Gel Electrophoresis: Differences, Advantages, ... [https://www.bostonind.com/blog/capillary-vs-gel-electrophoresis-differences-advantages-and-applications?srsltid=AfmBOooXp2SW95UNNF9xDg_R_4HQMAG5GiadIidiuHWcfwCwpxuGZUnd]
- 28. Capillary Electrophoresis vs. Gel Electrophoresis [https://www.labx.com/resources/capillary-electrophoresis-vs-gel-electrophoresis-a-comprehensive-guide/5548]
- 29. Microchip Electrophoresis [https://www.mdpi.com/2673-8392/1/1/6]
- 30. On-chip protein separation with single-molecule resolution [https://www.nature.com/articles/s41598-020-72463-z]
- 31. DNA Electrophoresis vs Protein Electrophoresis [https://blog.edvotek.com/2025/07/24/dna-electrophoresis-vs-protein-electrophoresis/]
- 32. SDS-PAGE [https://en.wikipedia.org/wiki/SDS-PAGE]
- 33. SDS-PAGE: A Cornerstone of Protein Analysis in Modern ... [https://www.metwarebio.com/sds-page-protein-analysis/]
- 34. SDS-PAGE Protocol [https://neutab.creative-biolabs.com/sds-page-analysis.htm]
- 35. Protein Electrophoresis Using SDS-PAGE: A Detailed ... [https://www.goldbio.com/blogs/articles/protein-electrophoresis-sds-page-overview?srsltid=AfmBOoqsQKWhByg3whisylgo9Xrk7h74fv9uOCwrYkjsYCyRoPbBwzw6]
- 36. SDS-PAGE: The science behind all those bubbles [https://www.antibodiesinc.com/pages/sds-page-demystified?srsltid=AfmBOopFJOv-ReVkC5sSwuduFfHLOI3tAZAmwc0_xWvSMre_4jQ3xYDX]
- 37. How Does SDS-PAGE Work? A Comprehensive Guide [https://www.metwarebio.com/how-sds-page-works-guide/]
- 38. Protein Electrophoresis Using SDS-PAGE: A Detailed ... [https://www.goldbio.com/blogs/articles/protein-electrophoresis-sds-page-overview?srsltid=AfmBOoq0JUeiLgszd5l3UvPRIZN9XANdKp-9eDDOhRjZfbFThImzFfCQ]
- 39. Validation of blue- and clear-native polyacrylamide gel ... [https://pubmed.ncbi.nlm.nih.gov/40966204/]
- 40. and clear-native polyacrylamide gel electrophoresis protocols ... [https://journals.plos.org/plosone/article?id=10.1371/journal.pone.0332065]
- 41. Blue native electrophoresis protocol [https://www.abcam.com/en-us/technical-resources/protocols/blue-native-electrophoresis]
- 42. Informatics and Statistics for Analyzing 2-D Gel ... [https://pmc.ncbi.nlm.nih.gov/articles/PMC3711025/]
- 43. Electrophoresis - StatPearls - NCBI Bookshelf - NIH [https://www.ncbi.nlm.nih.gov/books/NBK585057/]
- 44. The principle and method of polyacrylamide gel ... [https://www.mblbio.com/bio/g/support/method/sds-page.html]
- 45. Gel Electrophoresis: Do's and Don'ts [https://www.amgenbiotechexperience.com/gel-electrophoresis-dos-and-donts]
- 46. Gel Documentation: Best Practices for Nucleic Acid Imaging [https://www.labx.com/resources/gel-documentation-best-practices-for-nucleic-acid-imaging/5570]
- 47. Protein Electrophoresis Using SDS-PAGE: A Detailed ... [https://www.goldbio.com/blogs/articles/protein-electrophoresis-sds-page-overview?srsltid=AfmBOoqpPPNA1qXg1QW4Rm1Ks1Mvft3L2OSVSA6MG6fJ5bJ1mXofcys6]
- 48. Tips for Optimal SDS-PAGE Separation [https://www.rockland.com/resources/tips-for-optimal-sds-page-separation/?srsltid=AfmBOopdMaqZhB0h9NAFAiHNuGCIJKp4MG11Lvn-OxSj-o4I_uJxnF75]
- 49. Western Blot SDS-PAGE [https://www.novusbio.com/support/support-by-application/western-blot-sds-page?srsltid=AfmBOoocKRYvf9uZITkBjkqmsaT6vHuJDedVvZAde3G5PI9VBLvE34CG]
- 50. Novex Tris-Glycine Gels [https://www.thermofisher.com/us/en/home/life-science/protein-biology/protein-gel-electrophoresis/protein-gels/novex-tris-glycine-gels.html]
- 51. An Easy SDS-PAGE Gel Recipe & 10-Step Protocol [https://bitesizebio.com/59429/sds-page-gel-recipe/]
- 52. Protein Gel Staining Methods [https://www.thermofisher.com/us/en/home/life-science/protein-biology/protein-biology-learning-center/protein-biology-resource-library/pierce-protein-methods/protein-gel-stains.html]
- 53. Trends In Protein Separation And Analysis — The Advance ... [https://www.cellandgene.com/doc/trends-in-protein-separation-and-analysis-the-advance-of-stain-free-technology-0001]
- 54. Mastering Silver Staining for Protein Gel Analysis [https://www.abcam.com/en-us/knowledge-center/western-blot/silver-staining-protein-gel-detection-guide]
- 55. Protein Staining Methods: An Overview of 3 of the Best [https://bitesizebio.com/9386/protein-staining-methods/]
- 56. Coomassie blue staining - Proteins and protein analysis [https://www.abcam.com/en-us/knowledge-center/proteins-and-protein-analysis/coomassie-blue-staining]
- 57. Principle and Protocol of Coomassie Brilliant Blue [https://www.creativebiomart.net/resource/principle-protocol-principle-and-protocol-of-coomassie-brilliant-blue-438.htm]
- 58. Silver staining of proteins in polyacrylamide gels - PMC [https://pmc.ncbi.nlm.nih.gov/articles/PMC1971133/]
- 59. Electrophoresis: Enabling Faster Protein Pruification [https://www.bioprocessintl.com/product-characterization/enabling-faster-workflows-with-protein-purification-technologies-improvements-in-chromatography-and-electrophoresis]
- 60. Leading Therapeutic Antibodies Approved by FDA 2025 [https://www.genextgenomics.com/top-10-fda-approved-therapeutic-antibodies-you-should-know-in-2025/]
- 61. Technological advancements in antibody-based therapeutics ... [https://jbiomedsci.biomedcentral.com/articles/10.1186/s12929-025-01190-2]
- 62. Key Trends Shaping Therapeutic Antibodies in 2025 and ... [https://www.diatheva.com/key-trends-shaping-therapeutic-antibodies-in-2025-and-beyond/]
- 63. Monoclonal Antibodies (mAbs) and Proteins: The Biologic ... [https://www.mdpi.com/2227-9059/13/8/1962]
- 64. Protein Separation Techniques for Accurate Sequencing [https://www.creative-proteomics.com/proteinseq/resource/protein-separation-techniques-for-precise-sequencing.htm]
- 65. Optimising Monoclonal Antibody Drug Development for ... [https://pmc.ncbi.nlm.nih.gov/articles/PMC12495925/]
- 66. 6 Best Tips for Troubleshooting Poor Band Separation on ... [https://azurebiosystems.com/blog/6-tips-for-troubleshooting-poor-band-separation-on-sds-page-gels/]
- 67. Gel electrophoresis | Research Starters [https://www.ebsco.com/research-starters/health-and-medicine/gel-electrophoresis]
- 68. Troubleshooting SDS-PAGE Gel Running Issues [https://www.goldbio.com/blogs/articles/troubleshooting-sds-page-gel-running-issues?srsltid=AfmBOoqxCkOfp3llGM3iFb1UhcVXacFZ8Hy5r_0182ZhyY1lKsaw8ERU]
- 69. Troubleshooting Common Electrophoresis Problems and ... [https://www.labx.com/resources/troubleshooting-common-electrophoresis-problems-and-artifacts/5539]
- 70. News - Protein Electrophoresis Common Issues [https://www.gelepchina.com/news/protein-electrophoresis-common-issues/]
- 71. Nucleic Acid Gel Electrophoresis Troubleshooting [https://www.thermofisher.com/us/en/home/life-science/cloning/cloning-learning-center/invitrogen-school-of-molecular-biology/na-electrophoresis-education/na-electrophoresis-troubleshooting.html]
- 72. Mastering Gel Electrophoresis: 10 Tips and Tricks for ... [https://americanlaboratorytrading.com/mastering-gel-electrophoresis-10-tips-and-tricks-for-successful-results/?srsltid=AfmBOooXnv2g0x5K30yvdQ8CtzmBbIBfWKPGLEvh08CzjEmMaHLVOwpi]
- 73. Troubleshooting SDS-PAGE Gel Running Issues [https://www.goldbio.com/blogs/articles/troubleshooting-sds-page-gel-running-issues?srsltid=AfmBOopeNMeU0g6Fd2aybMNg7Mm42g-ID6dfoALCkY7NHZeHORFsDvgM]
- 74. Tips for Optimal SDS-PAGE Separation [https://www.rockland.com/resources/tips-for-optimal-sds-page-separation/?srsltid=AfmBOoqhPNQDtMJULd3NJLW9oFKkNxyrxz_x96vLHCKdEt-FG_QtfsbA]
- 75. SDS-PAGE Optimization for Western Blot [https://www.bosterbio.com/protocol-and-troubleshooting/western-blotting-optimization/sds-page?srsltid=AfmBOopup-6FbhSm89xNCFWPuK8eKkyqe9q2_JiJPa2pAWYVDitYr0Gm]
- 76. Optimization of Electrophoresis Gel Concentration [https://www.aatbio.com/resources/application-notes/optimization-of-electrophoresis-gel-concentration]
- 77. How to Manage Heat Production During Gel ... [https://eureka.patsnap.com/report-how-to-manage-heat-production-during-gel-electrophoresis]
- 78. Protein Gel Electrophoresis Chambers, Power Supplies ... [https://www.thermofisher.com/us/en/home/technical-resources/technical-reference-library/protein-electrophoresis-western-blotting-support-center/protein-gel-electrophoresis-chambers-power-supplies-accessories-support/protein-gel-electrophoresis-chambers-power-supplies-accessories-support-troubleshooting.html]
- 79. Eight Tips to Improve Gel Electrophoresis Results [https://www.thermofisher.com/us/en/home/brands/thermo-scientific/molecular-biology/molecular-biology-learning-center/molecular-biology-resource-library/spotlight-articles/8-DNA-ladder-tips.html]
- 80. Five Considerations for the Nucleic Acid Gel ... [https://www.thermofisher.com/us/en/home/life-science/cloning/cloning-learning-center/invitrogen-school-of-molecular-biology/na-electrophoresis-education/na-electrophoresis-considerations.html]
- 81. Common artifacts and mistakes made in electrophoresis [https://pmc.ncbi.nlm.nih.gov/articles/PMC7295095/]
- 82. Quality assessment and optimization of purified protein samples [https://pmc.ncbi.nlm.nih.gov/articles/PMC4299812/]
- 83. 2024 Guide to Quantitative Western Blot Publication [https://www.thermofisher.com/blog/life-in-the-lab/2023-guide-to-quantitative-western-blot-publication/]
- 84. 2024 Scientific Publication Requirements for Western Blots ... [https://azurebiosystems.com/blog/publication-requirements-for-western-blots-and-gels/]
- 85. Guide to western blot quantification [https://www.abcam.com/en-us/knowledge-center/western-blot/western-blot-quantification]
- 86. Protein quantification in SDS‑PAGE gels by densitometry ... [https://www.protocols.io/view/protein-quantification-in-sds-page-gels-by-densito-g8aubzsex.html]
- 87. Preparing High-Quality Samples for Electrophoresis: Best ... [https://www.labx.com/resources/preparing-high-quality-samples-for-electrophoresis-best-practices/5550]
- 88. | SpringerLink Quantitative Gel Electrophoresis [https://link.springer.com/chapter/10.1007/978-3-319-69682-9_3]
- 89. Gel Electrophoresis Tables [https://www.thermofisher.com/us/en/home/references/ambion-tech-support/rna-electrophoresis-markers/general-articles/gel-electrophoresis-tables.html]
- 90. Adaptive Contrast Enhancement of Two-Dimensional ... [https://pubmed.ncbi.nlm.nih.gov/16983632/]
- 91. Accelerating time to answer with CE-SDS and Laser ... [https://sciex.com/tech-notes/biopharma/unleashing-the-power-of-speed-accelerating-time-to-answer-with]
- 92. High-resolution native electrophoresis in-gel activity assay ... [https://www.nature.com/articles/s41598-025-24684-3]
- 93. Electrophoresis Market Size & Industry Demand 2025-2035 [https://www.futuremarketinsights.com/reports/electrophoresis-market]
- 94. Protein Separation by Capillary Gel Electrophoresis [https://pmc.ncbi.nlm.nih.gov/articles/PMC3227876/]
- 95. A Comprehensive Evaluation of Analytical Method ... [https://pmc.ncbi.nlm.nih.gov/articles/PMC12039171/]
- 96. Capillary vs. Gel Electrophoresis: Differences, Advantages, ... [https://www.bostonind.com/blog/capillary-vs-gel-electrophoresis-differences-advantages-and-applications?srsltid=AfmBOooYDOJWAOvzj2tzYQgGPJeu4l91qq0RABBw1E4PzMjlswh3UcNN]
- 97. CGE Basics [https://diagnostech.co.za/cge-basics/]
- 98. Slab-Gel Electrophoresis - an overview [https://www.sciencedirect.com/topics/chemistry/slab-gel-electrophoresis]
- 99. Comparison of slab gel electrophoresis and capillary ... [https://pubmed.ncbi.nlm.nih.gov/9639885/]
- 100. Comparison of slab gel electrophoresis and capillary ... [https://www.sciencedirect.com/science/article/abs/pii/S0021967397003944]
- 101. Gel electrophoresis-based proteoform separation and ... [https://pubmed.ncbi.nlm.nih.gov/40645673/]
- 102. Quantitative analysis of electrophoresis data: novel curve ... [https://pmc.ncbi.nlm.nih.gov/articles/PMC146501/]
- 103. Enhancing therapeutic antibody profiling: orthogonal ... [https://pmc.ncbi.nlm.nih.gov/articles/PMC12510943/]
- 104. Validation of Protein A chromatography: orthogonal method... [https://www.degruyterbrill.com/document/doi/10.1515/tjb-2024-0186/html?lang=en&srsltid=AfmBOorewmlTCE3rrcFDHOXpL6YhC0zAEL44HyGO07Ds-qlnHdkJvg_b]
- 105. Accelerated vaccine process development by orthogonal ... [https://www.nature.com/articles/s41598-025-96642-y]
- 106. sciencedirect.com/topics/chemistry/ microchip - electrophoresis [https://www.sciencedirect.com/topics/chemistry/microchip-electrophoresis]
- 107. High-Throughput Methods for Protein Purification [https://www.goldbio.com/blogs/articles/high-throughput-methods-for-protein-purification?srsltid=AfmBOoq3Z6VQkLSh27SAP_4KUXBnmNOnHVCchDyWui8UNgawo4LOWl5S]
- 108. Microchip Electrophoresis Market | Global Market Analysis ... [https://www.futuremarketinsights.com/reports/microchip-electrophoresis-market]
- 109. Protein Purification & Isolation Market Size 2025 to 2035 [https://www.futuremarketinsights.com/reports/protein-purification-and-isolation-market]
- 110. US Protein Purification And Isolation Market [https://finance.yahoo.com/news/u-protein-purification-isolation-market-154600946.html]
- 111. Protein Separation Systems Market Latest Report [https://www.linkedin.com/pulse/protein-separation-systems-market-latest-zqpcf/]
- 112. Microchip Electrophoresis Technology Market Future ... [https://www.linkedin.com/pulse/microchip-electrophoresis-technology-market-future-91cff/]
- 113. Global Microchip System Market Electrophoresis -2033: Trends... 2025 [https://www.linkedin.com/pulse/global-microchip-electrophoresis-system-market-zu8re]
- 114. Inside ELRIG's Drug Discovery 2025 [https://www.drugtargetreview.com/article/190237/inside-elrigs-drug-discovery-2025/]
- 115. Protein Electrophoresis Using SDS-PAGE: A Detailed ... [https://www.goldbio.com/blogs/articles/protein-electrophoresis-sds-page-overview?srsltid=AfmBOopH95FtkLyJ1Ce1rvELpTv_30MJ582icBTP-lT5sNT0UIsd7LkH]
- 116. Enrichment of Membrane Proteins for Downstream ... [https://pmc.ncbi.nlm.nih.gov/articles/PMC10415199/]