Preventing Protein Sample Leakage in Electrophoresis: A Complete Guide for Reliable Western Blots and SDS-PAGE
This article provides a comprehensive framework for researchers and drug development professionals to overcome the common yet critical issue of protein samples migrating out of wells before and during electrophoresis.
Preventing Protein Sample Leakage in Electrophoresis: A Complete Guide for Reliable Western Blots and SDS-PAGE
Abstract
This article provides a comprehensive framework for researchers and drug development professionals to overcome the common yet critical issue of protein samples migrating out of wells before and during electrophoresis. Covering foundational principles, optimized methodological protocols, systematic troubleshooting, and advanced validation techniques, this guide delivers practical solutions to ensure sample integrity, improve band resolution, and generate reproducible data in protein analysis workflows, from basic research to biopharmaceutical characterization.
Understanding Why Protein Samples Leak: The Science Behind Well Retention Failure
The Critical Role of Sample Buffer Density in Preventing Well Leakage
Why is sample buffer density critical for preventing well leakage?
The density of the sample buffer is critical because it makes the protein sample heavier than the surrounding running buffer in the electrophoresis tank. This increased density ensures the sample sinks directly to the bottom of the well when loaded, forming a sharp, confined band. Without sufficient density, the sample can diffuse and leak out into the surrounding buffer, leading to sample loss, cross-contamination between lanes, and distorted or failed experiments [1] [2].
The key component that provides this essential density is glycerol [1]. In some protocols, sucrose or Ficoll can be used for a similar purpose. When preparing a sample for SDS-PAGE, the sample loading buffer containing glycerol is mixed with the protein solution. This dense mixture settles at the bottom of the well, physically preventing it from floating away before the electric current is applied [2].
Sample Buffer Composition and Function
Table: Key Components of a Typical Sample Loading Buffer and Their Functions
| Component | Primary Function | Typical Concentration |
|---|---|---|
| Glycerol | Increases density for sinking into wells [1] | 10-20% |
| Tracking Dye | Visualizes sample migration [2] | - |
| SDS | Denatures proteins & imparts negative charge [3] | 1-2% |
| Reducing Agent | Breaks disulfide bonds [3] | 0.1-0.5 M |
| Buffer | Maintains stable pH [4] | e.g., Tris-HCl |
Troubleshooting Guide: Well Leakage and Related Issues
Sample Leaking from Wells
- Problem: Samples spill out during or after loading, leading to distorted bands and cross-contamination [1].
- Possible Causes and Solutions:
- Insufficient Glycerol: Check the concentration of glycerol in your loading buffer. If leakage occurs, increasing the glycerol concentration can help [1].
- Air Bubbles in Wells: Air bubbles can displace sample from the well. Rinse wells with running buffer before loading your sample to displace air bubbles [1].
- Overfilled Wells: Do not load a well beyond 3/4 of its capacity. Load all wells with equal volumes for even migration [1].
Samples Clumping and Not Migrating Properly
- Problem: Protein aggregates remain in the well or bands show poor resolution [1].
- Possible Causes and Solutions:
- Protein Overload: Loading too much protein can cause clumping. Check protein concentration and load a recommended amount (e.g., 10-20 µg per well for a mini-gel) [1].
- Protein Aggregation: Ensure proper sample preparation. Adequately homogenize and sonicate your sample source. Add fresh reducing agents (DTT or beta-mercaptoethanol) to your lysis buffer and sample buffer, and heat the sample (70-100°C) to denature proteins fully [3] [1]. For hydrophobic proteins, consider adding 4-8M urea to the lysate to improve solubility [1].
Smeared Bands
- Problem: Bands are not sharp and appear as smears across the lane [4].
- Possible Causes and Solutions:
- Incomplete Denaturation: Ensure the sample is sufficiently reduced and denatured. Add fresh reducing agent to the loading buffer and boil the sample for 5 minutes at 100°C [4].
- High Salt Concentration: High ionic strength can cause smearing. Keep salt concentrations in your sample below 500 mM where possible [4].
Experimental Protocol: Proper Sample Preparation and Loading
This protocol ensures your protein samples are correctly prepared and loaded to prevent well leakage and achieve optimal separation by SDS-PAGE [3] [1].
Materials Needed:
- Protein sample
- 2X Laemmli Sample Buffer (or similar, containing glycerol, SDS, and a reducing agent)
- Heating block (95-100°C)
- Microcentrifuge tubes
- Micropipette and fine tips
Procedure:
- Sample and Buffer Mixing: Mix your protein sample with an equal volume of 2X sample loading buffer in a microcentrifuge tube [3].
- Denaturation: Cap the tube tightly and heat the mixture at 95-100°C for 5-10 minutes to fully denature the proteins [3] [4].
- Brief Centrifugation: After heating, briefly spin the tube in a microcentrifuge to collect all condensation and solution at the bottom. This ensures you load the entire sample [1].
- Well Preparation: Before loading, use a pipette to gently flush out the wells of the gel with running buffer. This removes potential air bubbles and residual polyacrylamide fragments [1].
- Sample Loading:
- Using a fine pipette tip, slowly dispense the dense, prepared sample into the bottom of the well.
- Take care not to puncture the well bottom with the tip.
- Do not overfill the well; a maximum of 3/4 of the well's volume is a safe practice [1].
- Electrophoresis: Once all samples are loaded, carefully place the lid on the tank and apply the appropriate voltage to begin the run.
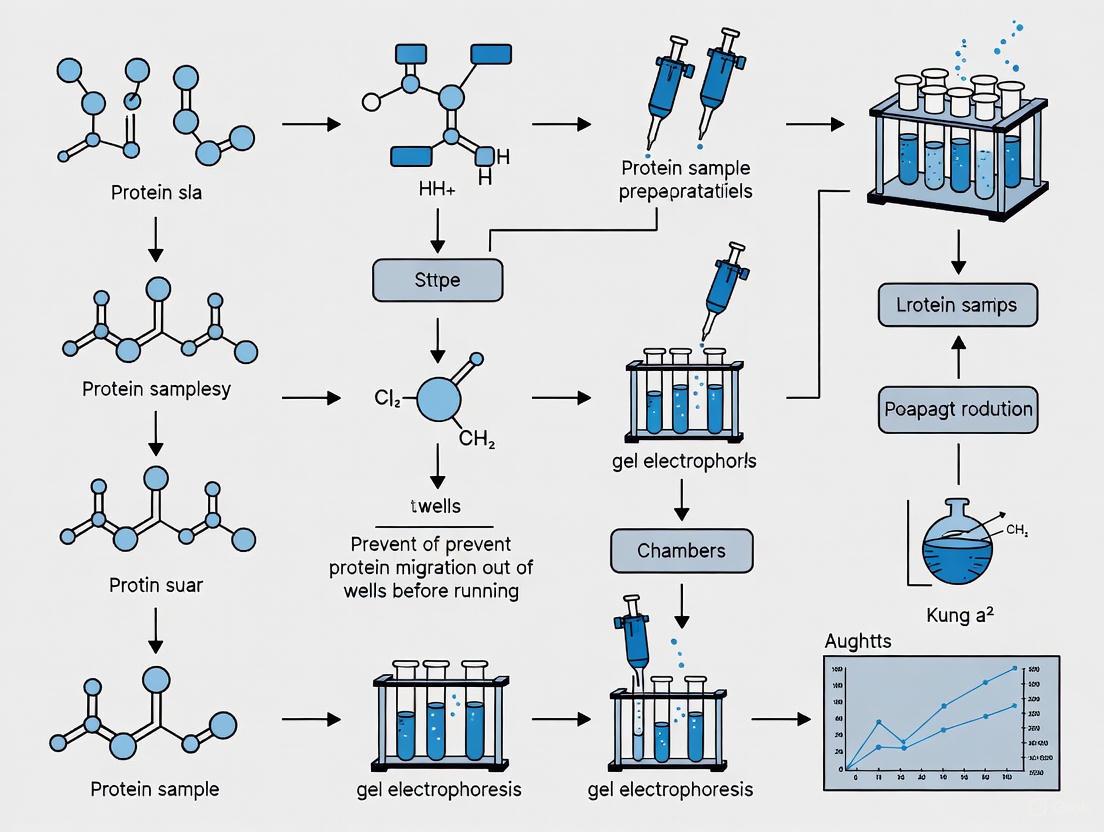
Visual Guide: Sample Loading Workflow and Leakage Prevention
The Scientist's Toolkit: Essential Reagent Solutions
Table: Essential Reagents for Preventing Well Leakage in SDS-PAGE
| Reagent | Function | Considerations |
|---|---|---|
| Sample Loading Buffer | Provides density (glycerol), denaturation (SDS), reduction (DTT/BME), and visualization (dye) [3] [2] | Check glycerol concentration; prepare fresh reducing agent. |
| Running Buffer | (e.g., Tris-Glycine-SDS) Conducts current and maintains pH during electrophoresis [3] [4] | Ensure correct pH and composition; do not reuse excessively. |
| Glycerol | Increases sample density for well loading [1] | Can be added to loading buffer if density is insufficient. |
| Reducing Agents | (DTT or BME) Break disulfide bonds to prevent aggregation [3] [1] | Add fresh before heating; BME has a strong odor. |
FAQ: Addressing Common Concerns
What should I do if my sample buffer does not contain glycerol?
If your commercial loading buffer lacks glycerol or you are preparing it yourself, you can add sterile glycerol to a final concentration of 5-20% to achieve the necessary density.
Can I use other substances to increase sample density?
Yes, sucrose or Ficoll can be used as inert density agents. However, glycerol is standard because it is cost-effective, readily miscible, and does not interfere with protein migration.
My sample still leaks even with sufficient glycerol. What else could be wrong?
The problem might be technique-related. Ensure you are not accidentally introducing air bubbles while loading and that you are using fine pipette tips suitable for the well size. Also, verify that the well itself is not damaged.
How does the tracking dye in the buffer help?
Tracking dyes like bromophenol blue serve two main purposes: they add color to the sample, making it easier to see during loading, and they migrate ahead of the proteins during electrophoresis, allowing you to monitor the progress of the run and stop it before the proteins run off the gel [2].
How Air Bubbles and Improper Loading Technique Compromise Sample Integrity
Troubleshooting Guides
Problem: Sample Leaks or Migrates Unevenly from Well
Q: My protein sample seems to be leaking from the well before electrophoresis begins, resulting in smeared or missing bands. What could be causing this?
A: This is a common issue often traced back to air bubbles introduced during sample loading or an improper pipetting technique that damages the well integrity.
- Primary Cause: Air bubbles trapped under your sample in the well can create a physical barrier and an uneven current path. When current is applied, the electricity will arc around the bubble, causing the sample in the immediate vicinity to heat rapidly and migrate erratically out of the well. An incomplete seal between the sample and the bottom of the well, sometimes caused by not placing the pipette tip deep enough, can also allow sample to leak out prematurely [5].
- Underlying Physics: The presence of an air bubble introduces a high-resistance interface within the conductive buffer. This disrupts the uniform electric field, creating localized hot spots of high current density that can denature proteins and force sample out of the well in an uncontrolled manner [6].
- Solution:
- Proper Pipetting Angle and Depth: Hold the pipette vertically and immerse the tip 2-3 mm below the surface of the buffer in the well, ensuring it is not touching the bottom or sides of the well [5] [7].
- Slow and Controlled Dispensing: Release the plunger slowly and smoothly after aspiration. When dispensing into the well, depress the plunger slowly and steadily to the first stop, pause for a second, and then press to the second stop (blow-out) to ensure the entire sample is expelled without introducing turbulence [7].
- Visual Inspection: Always visually inspect each well after loading. If a bubble is present, carefully aspirate the sample and reload the well.
Problem: Inconsistent Sample Volume Delivery
Q: I am confident in my pipette calibration, but my final protein concentrations or band intensities are inconsistent between replicates. Why?
A: Inconsistent liquid handling, often due to improper technique with different sample types, directly leads to volume inaccuracies that compromise quantitative analysis.
- Primary Cause: Using a standard "forward" pipetting technique for viscous liquids (like concentrated protein or DNA solutions) or volatile compounds can result in under-delivery. For viscous solutions, the liquid tends to coat the inside of the tip, preventing complete ejection. For volatile liquids, evaporation within the tip air cushion can reduce the aspirated volume [5].
- Mass Transfer Principles: The accuracy of air displacement pipettes is highly dependent on the consistent density and surface tension of the liquid. Viscous fluids alter the flow dynamics during aspiration and dispensing, while volatile liquids change the pressure of the air cushion through evaporation, both leading to inaccurate volume delivery [5].
- Solution:
- Technique Selection: Use the reverse pipetting technique for viscous, foamy, or concentrated protein samples. This technique involves depressing the plunger to the second stop before aspiration, which draws in an excess volume. The set volume is then dispensed by pressing only to the first stop, leaving the excess in the tip, which is discarded [5] [7].
- Pipette Type: For extremely viscous or volatile samples, consider using positive displacement pipettes. These instruments use a piston that makes direct contact with the liquid, eliminating the inaccuracies associated with an air cushion [5].
- Pre-rinsing: Pre-rinse a new tip 2-3 times with the solution you are about to pipette. This saturates the air inside the tip with vapor of the liquid, minimizing evaporation and improving accuracy, especially for volatile solutions [8] [7].
Table 1: Impact of Common Pipetting Errors on Sample Integrity
| Error | Direct Consequence | Downstream Effect on Analysis |
|---|---|---|
| Introducing air bubbles during well loading | Uneven electric field; sample heating and erratic migration | Streaked, smeared, or distorted protein bands; loss of sample from the well [6] |
| Using forward mode for viscous samples | Under-delivery of sample volume | Inaccurate protein quantification; inconsistent band intensities between replicates [5] |
| Aspirating or dispensing too quickly | Inaccurate volume transfer; introduction of air bubbles | General data irreproducibility and increased coefficient of variation in assays [7] |
| Using standard tips for volatile liquids | Evaporation within the tip; over-aspiration of sample | Incorrect sample concentration and volume, skewing all quantitative results [5] |
Problem: Cross-Contamination Between Samples
Q: I am seeing unexpected bands in my gels, suggesting my samples are being mixed. How can this happen during loading?
A: Cross-contamination is a critical failure in sample integrity, most frequently caused by a failure in proper tip usage and handling.
- Primary Cause: Reusing pipette tips or allowing the pipette shaft to contact a loaded sample will transfer material from one sample to the next. Aerosols can also be created during rapid dispensing, potentially contaminating adjacent wells [8] [5].
- Solution:
- Single-Use Tips: Always use a new, sterile pipette tip for each sample and for each reagent. This is the most fundamental rule for preventing cross-contamination [8].
- Use the Ejector: Use the pipette's tip ejector mechanism to remove the tip without touching it, preventing contamination from your gloves [5] [7].
- Avoid Splashing: Dispense the sample carefully against the wall of the well or directly into the buffer without touching the well itself with the tip. Avoid rapid dispensing that can create aerosols.
Table 2: Quantitative Impact of Environmental Factors on Pipetting Accuracy
| Environmental Factor | Mechanism of Error | Recommended Mitigation Strategy |
|---|---|---|
| Temperature Discrepancy [5] | Liquid density and air cushion pressure change with temperature. A cold liquid in a warm pipette will contract, leading to over-aspiration. | Allow pipette, tips, and liquids to equilibrate to room temperature for at least 2 hours before use. |
| High Altitude / Low Pressure [5] | Reduced air pressure affects the behavior of the air cushion, leading to inaccuracies. | Pipettes should be calibrated on-site where they are used to account for local atmospheric pressure. |
| Pipette Angle [8] [5] | Holding the pipette at an angle during aspiration changes the hydrostatic pressure, altering the aspirated volume. | Maintain a vertical (90°) pipetting angle during both aspiration and dispensing. |
Experimental Protocols for Ensuring Integrity
Protocol: Forward Pipetting for Aqueous Solutions
This is the standard technique for routine, aqueous buffers and solutions [5].
- Attach Tip: Press the pipette shaft firmly onto a new tip.
- Aspirate: Depress the plunger smoothly to the first stop. Immerse the tip 2-3 mm into the liquid. Slowly release the plunger to draw the sample into the tip. Withdraw the tip from the liquid.
- Dispense: Place the tip against the wall of the well or receiving vessel, just below the surface of any buffer. Depress the plunger smoothly to the first stop. Pause for one second.
- Blow-Out: Press the plunger to the second stop to expel any residual liquid. While holding the plunger at the second stop, withdraw the tip, sliding it up the wall of the vessel.
- Eject: Release the plunger and use the ejector button to discard the tip.
Protocol: Reverse Pipetting for Viscous or Volatile Samples
This technique is preferred for protein solutions, glycerol, and volatile liquids like methanol [5] [7].
- Attach Tip: Press the pipette shaft firmly onto a new tip.
- Aspirate: Depress the plunger all the way to the second stop. Immerse the tip into the liquid. Slowly release the plunger to draw in an excess volume of sample.
- Dispense: Place the tip into the well or receiving vessel. Depress the plunger slowly and steadily only to the first stop. This action dispenses the calibrated volume. A small volume of excess liquid will remain in the tip.
- Eject: Withdraw the pipette and eject the tip, which contains the excess sample. Do not press to the second stop during dispensing, as this will eject the entire contents and defeat the purpose of the technique.
Visual Guide: Sample Integrity Workflow
The following diagram outlines the logical workflow for preventing sample loss, from preparation to loading.
The Scientist's Toolkit: Essential Research Reagent Solutions
Table 3: Key Reagents and Materials for Reliable Sample Loading and Electrophoresis
| Item | Function & Importance | Technical Specification & Best Practice |
|---|---|---|
| Positive Displacement Pipette [5] | Ideal for highly viscous protein samples or volatile solvents. The disposable piston contacts the liquid directly, eliminating air cushion inaccuracies and sample retention. | Use with dedicated capillary pistons (micro-syringe tips). Essential for applications requiring the highest precision with challenging liquids, such as PCR setup or handling concentrated nucleic acids. |
| Filter Pipette Tips [5] | Contain a hydrophobic barrier that prevents aerosols and liquid from entering the pipette shaft, protecting the instrument from corrosion and preventing cross-contamination between samples. | Use when pipetting volatile compounds or when working with potentially infectious or radioactive samples. The filter prevents vapor from contaminating the pipette's interior. |
| Wide Orifice Pipette Tips [5] | Feature a larger opening at the end, which reduces shear forces and prevents clogging when pipetting samples containing large genomic DNA or viscous cellular lysates. | Recommended for transferring high molecular weight DNA or intact chromosomal DNA to prevent shearing and ensure accurate representation of the sample. |
| High-Quality Polypropylene Tips [5] [7] | Ensure a perfect, leak-proof seal with the pipette shaft. Low retention properties minimize sample adhesion to the tip wall, maximizing delivery accuracy and recovery. | Always use tips recommended by the pipette manufacturer. Incompatible tips can lead to poor sealing, air leaks, and inaccurate volumes, directly compromising sample integrity. |
FAQs and Troubleshooting Guides
Why is my protein sample stuck in the well or migrating unevenly?
Answer: Protein aggregation and precipitation in the well are primary causes of failed migration. This occurs when proteins unfold and stick together, forming large clumps that cannot enter the gel matrix. The main hidden causes are:
- Sample Overload: Loading too much protein per well exceeds the gel's capacity, leading to clumping. A general guideline is to load a maximum of 10–15 µg of cell lysate per lane for a mini-gel [9] [10].
- High Salt or Detergent Concentration: High ionic strength can cause protein aggregation and increase conductivity, leading to distorted, dumbbell-shaped bands and lane widening. Ensure your sample's salt concentration does not exceed 100 mM [10].
- Protein Aggregation: This is often due to improper sample preparation. Hydrophobic interactions and disulfide bonds can cause proteins to precipitate [9].
- DNA Contamination: Genomic DNA in cell lysates can increase viscosity, leading to protein aggregation and affecting migration patterns [10].
How can I prevent protein aggregation in my samples?
Answer: Preventing aggregation involves careful sample handling and the use of specific reagents to maintain protein solubility.
- Use Reducing Agents: Add Dithiothreitol (DTT) or β-mercaptoethanol (BME) to your lysis solution. These agents break disulfide bonds that contribute to protein aggregation. The final concentration for SDS-PAGE should be less than 50 mM for DTT or less than 2.5% for β-ME [9] [10].
- Apply Controlled Heat: Heating your lysate (typically 70°C for 10 minutes instead of boiling) can help denature proteins and reduce aggregation without promoting proteolysis or excessive aggregation [9] [10].
- Add Chaotropic Agents: For hydrophobic proteins prone to aggregation, include 4-8M Urea in your lysate solution. This helps denature proteins and keep them in solution [9].
- Ensure Proper Homogenization: Adequate sonication of your sample source (e.g., cell or bacterial culture) followed by centrifugation to remove cell debris is critical for solubility [9].
What can I do if my sample is viscous or has high salt content?
Answer: Viscous samples or those with high salt require cleanup before electrophoresis.
- Perform Dialysis: Use a dialysis device, such as a Slide-A-Lyzer MINI Dialysis Unit, to decrease salt concentration [10].
- Precipitate and Resuspend: Concentrate your samples using a protein concentrator and resuspend them in a lower-salt buffer compatible with electrophoresis [10].
- Shear Genomic DNA: If viscosity is due to DNA contamination, shear the DNA by sonication or enzymatic digestion before loading the sample [10].
Why does my sample leak out of the well during or after loading?
Answer: Sample leakage leads to distorted and smeared bands and is often related to the density of the loading buffer or loading technique.
- Insufficient Glycerol: The loading buffer must contain enough glycerol to increase the density of the sample, allowing it to sink to the bottom of the well. Check the glycerol concentration and increase it if necessary [9].
- Air Bubbles in Wells: Air bubbles can displace your sample. Rinse wells with running buffer before loading your sample to displace air bubbles [9].
- Overfilling Wells: Do not load the well more than 3/4 of its capacity. Overfilling can cause samples to spill into adjacent lanes [9].
Experimental Protocols for Key Scenarios
Protocol 1: Resolving Protein Aggregation
Objective: To solubilize aggregated proteins and ensure clear migration. Materials:
- Lysis Buffer (e.g., RIPA buffer)
- DTT or BME
- Urea
- Sonicator
- Microcentrifuge
Methodology:
- Homogenize: Suspend your cell pellet in an appropriate lysis buffer.
- Sonicate: Sonicate the sample on ice with short bursts (e.g., 3 pulses of 10 seconds each) to break down cells and shear genomic DNA.
- Add Reducers: Supplement your lysis buffer with DTT to a final concentration of 50 mM or BME to 2.5%.
- Add Chaotropes: For stubborn aggregates, add Urea to a final concentration of 4-8M.
- Heat: Heat the sample at 70°C for 10 minutes.
- Clarify: Centrifuge the sample at >12,000 × g for 10 minutes to pellet any insoluble debris. Transfer the supernatant (soluble protein) to a new tube for analysis [9] [10].
Protocol 2: Desalting and Buffer Exchange
Objective: To reduce salt and detergent concentration in a protein sample. Materials:
- Dialysis device (e.g., Slide-A-Lyzer MINI Dialysis Unit, 0.5 mL) OR
- Protein concentrator (e.g., Pierce Protein Concentrators PES, 0.5 mL)
- Low-salt electrophoresis buffer (e.g., Tris-Glycine)
Methodology (using a concentrator):
- Load: Place your protein sample into the concentrator's sample chamber.
- Centrifuge: Follow the manufacturer's instructions for the appropriate centrifuge speed and time to pass the buffer through the membrane, leaving the protein concentrated.
- Resuspend: Add your desired low-salt buffer to the concentrated protein and mix gently. This dilutes the remaining salts and detergents.
- Repeat (Optional): For a more thorough exchange, repeat the concentration and resuspension steps [10].
The tables below consolidate key quantitative guidelines for preventing migration failure.
Table 1: Recommended Reagent Concentrations for SDS-PAGE Samples
| Reagent | Recommended Maximum Concentration | Function | Consequence of Excess |
|---|---|---|---|
| Total Protein | 10-15 µg per lane (mini-gel) [9] [10] | N/A | Clumping in well, poor resolution |
| Salt (e.g., NaCl) | ≤ 100 mM [10] | Ionic strength | Streaking, lane widening, distortion |
| DTT | ≤ 50 mM [10] | Reduces disulfide bonds | Shadow at lane edges |
| β-Mercaptoethanol | ≤ 2.5% [10] | Reduces disulfide bonds | Shadow at lane edges |
| Non-ionic Detergents | Maintain SDS:Detergent ratio ≥ 10:1 [10] | Cell lysis | Lane widening, streaking |
Table 2: Troubleshooting Guide for Common Migration Issues
| Observed Problem | Possible Hidden Cause | Recommended Solution |
|---|---|---|
| Sample stuck in well | Protein aggregation/precipitation | Add reducing agents (DTT/BME); Add 4-8M Urea; Improve homogenization [9] |
| Streaks or smeared bands | High salt concentration; Excess detergent | Desalt via dialysis or concentration; Dilute sample to lower detergent concentration [10] |
| Viscous sample | Genomic DNA contamination | Shear DNA by sonication [10] |
| Sample leaks from well | Low glycerol in loading buffer; Air bubbles; Overfilled well | Increase glycerol concentration; Rinse wells with buffer before loading; Load ≤ 3/4 well volume [9] |
The Scientist's Toolkit: Research Reagent Solutions
Table 3: Essential Reagents for Preventing Protein Aggregation and Ensuring Solubility
| Item | Function/Benefit |
|---|---|
| DTT (Dithiothreitol) | A strong reducing agent that breaks disulfide bonds within and between proteins, preventing aggregation. More stable and less odorous than BME [9] [10]. |
| Urea | A chaotropic agent that disrupts hydrogen bonds and hydrophobic interactions, effectively solubilizing denatured proteins and preventing aggregation [9]. |
| Slide-A-Lyzer MINI Dialysis Device | A simple, ready-to-use device for efficient desalting and buffer exchange of small-volume samples (e.g., 0.5 mL) [10]. |
| Pierce Protein Concentrators | Devices using centrifugal force to rapidly concentrate protein samples and exchange them into a compatible buffer, removing excess salts and detergents [10]. |
| SDS-PAGE Sample Prep Kit | Specialized kits designed to remove contaminants like salts and detergents from protein samples, ensuring clean and clear results in electrophoresis [10]. |
Mechanism and Workflow Diagrams
The following diagram illustrates the decision-making process for troubleshooting protein migration failure, linking symptoms to their hidden causes and corresponding solutions.
This workflow outlines the experimental protocol for preparing a protein sample to prevent aggregation, from initial lysis to final loading.
Analyzing the Impact of Salt and Detergent Concentrations on Sample Behavior
Troubleshooting Guides
Problem 1: Protein Aggregation and Precipitation in the Well
Q: My protein sample appears cloudy or has a precipitate after I add it to the well, preventing it from entering the gel. What could be causing this?
A: This is often caused by inappropriate salt or detergent conditions in your sample buffer, leading to protein aggregation and precipitation.
| Likely Cause | Diagnostic Signs | Recommended Solution |
|---|---|---|
| Low Salt Concentration | Precipitation occurs after cell lysis or when sample is diluted in loading buffer. | Increase the salt concentration (e.g., NaCl to 150-200 mM) to promote "salting in" and enhance protein solubility [11]. |
| High Salt Concentration | Precipitation in concentrated lysates; protein may re-dissolve upon dilution. | Dialyze or desalt the sample into a lower ionic strength buffer. Determine the optimal salt concentration for your protein [11] [12]. |
| Incorrect Detergent Type | Precipitation of membrane proteins; failure to solubilize hydrophobic proteins. | For native proteins, use non-ionic (e.g., Triton X-100) or zwitterionic (e.g., CHAPS) detergents. For denatured proteins, use ionic detergents like SDS [13] [14]. |
| Detergent Concentration Below CMC | Incomplete solubilization; variable results between samples. | Ensure the detergent concentration is well above its Critical Micelle Concentration (CMC) to form micelles and properly solubilize proteins [14]. |
Experimental Protocol to Determine Optimal Salt Concentration:
- Prepare a series of microcentrifuge tubes with identical aliquots of your protein lysate.
- Add an equal volume of loading buffer prepared with varying concentrations of NaCl (e.g., 0, 50, 100, 150, 200, 500 mM).
- Incubate the samples on ice for 30 minutes, then centrifuge at 12,000 rpm for 10 minutes.
- Analyze the supernatant (soluble fraction) and pellet (insoluble fraction) by SDS-PAGE.
- The salt condition that yields the highest target protein in the supernatant is optimal for preventing aggregation [11] [12].
Problem 2: Poor Retention of Sample in the Well
Q: My sample seems to leak or diffuse out of the well before I even start the electrophoresis run. How can I prevent this?
A: Poor well retention is typically related to the density and composition of the loading buffer.
| Likely Cause | Diagnostic Signs | Recommended Solution |
|---|---|---|
| Insufficient Glycerol | Samples easily spill over when loading or diffuse out quickly. | Ensure your loading buffer contains 5-10% glycerol. This increases sample density, keeping it at the bottom of the well [15]. |
| Missing Tracking Dye | Inability to visualize sample position in the well. | Include a small anionic dye like bromophenol blue (0.004%) in the loading buffer to monitor sample integrity [15]. |
| Over-heated Samples | Samples appear overly viscous or stringy, leading to uneven loading. | Avoid boiling samples containing multi-pass membrane proteins. Heat at 70°C for 5-10 minutes instead to prevent aggregation [15]. |
| Protein Overload | Well is overfilled or protein precipitates at high concentration. | Determine protein concentration accurately (e.g., via BCA assay) and do not exceed the well's capacity (typically 10-50 µg protein) [15] [16]. |
Problem 3: Inconsistent Migration Between Replicates
Q: The same protein sample shows different migration patterns or smearing when run on the same gel. Why is this happening?
A: Inconsistencies often stem from variable sample preparation, particularly in reduction and denaturation.
| Likely Cause | Diagnostic Signs | Recommended Solution |
|---|---|---|
| Incomplete Denaturation | Smearing across the lane; protein bands at incorrect molecular weights. | Boil samples in Laemmli buffer containing 1-4% SDS for 5 minutes to fully denature proteins and confer a uniform negative charge [15]. |
| Incomplete Reduction | Multiple bands for a single protein; higher-order complexes visible. | Include fresh reducing agents (2-mercaptoethanol or DTT) in the loading buffer to break disulfide bonds [15]. |
| Protease Degradation | A "smear" of lower molecular weight bands; results degrade over time. | Always include a complete protease inhibitor cocktail in your initial lysis buffer and keep samples on ice [15] [17]. |
| Old or Poor-Quality SDS | High background staining; indistinct or fuzzy protein bands. | Use high-quality, fresh SDS in buffers. Poor SDS results in inefficient protein coating and unclear separation [15]. |
Experimental Protocol for Consistent Sample Preparation:
- Lysis: Lyse cells or tissues in an appropriate ice-cold buffer containing protease inhibitors and a compatible detergent [15] [16].
- Quantification: Determine protein concentration using a compatible assay (e.g., BCA assay works well with detergents) [16].
- Preparation: Mix a fixed amount of protein (e.g., 20 µg) with an equal volume of 2X Laemmli buffer [15].
- Denaturation/Reduction: Vortex and heat samples at 95-100°C for 5 minutes (or 70°C for membrane proteins). Vortex again and briefly centrifuge before loading [15].
Frequently Asked Questions (FAQs)
Q1: How does salt concentration specifically affect my protein's behavior before electrophoresis? Salt influences protein solubility through "salting in" and "salting out." At low concentrations, salt ions shield protein surface charges, increasing solubility ("salting in"). At very high concentrations, salt ions compete for water molecules, causing hydrophobic patches on proteins to aggregate and precipitate ("salting out"). The optimal concentration is protein-specific [11]. Molecular dynamics simulations show that protein structure becomes loose and less stable at certain intermediate salt concentrations (e.g., ~0.8 mol/L for monovalent salts), which can promote aggregation before loading [12].
Q2: I'm studying a membrane protein. Are there special considerations for detergents? Yes, membrane proteins require special care. They are inherently hydrophobic and lack a significant "salting in" phase, making them prone to precipitation [11]. Use non-ionic detergents like dodecyl maltoside to solubilize them in their native state without denaturation [13] [14]. Avoid boiling these proteins after solubilization, as it can cause aggregation; instead, heat at 70°C for 5-10 minutes [15].
Q3: My downstream analysis is sensitive to detergents and salts. How can I remove them without losing my protein? Both dialysis and desalting are effective, but the choice depends on your constraints.
- Desalting (Size Exclusion Chromatography): Best for speed (simple, quick procedure) and small sample volumes (<10 mL). It effectively removes salts but is less efficient at removing small molecules or detergents with large micelles [18].
- Dialysis: A gentler method ideal for buffer exchange, removal of small molecules, and larger sample volumes (up to 250 mL). It is preferred for sensitive proteins prone to denaturation but is a time-consuming process [18].
Q4: How can I accurately measure the concentration of detergent in my sample? A method based on refractive index can be used. This technique involves creating a standard curve of refractive index versus concentration for your specific detergent. The refractive index of your unknown sample is then measured and compared to the standard curve to determine its concentration. This method is sensitive and works for a wide range of detergents [19].
Q5: What is a fundamental check I can do to see if my sample prep is the problem? After lysing your sample, centrifuge it to separate soluble and insoluble fractions. Run both fractions on a gel. If your target protein is in the pellet, your lysis or solubilization conditions (likely related to salt, detergent, or inhibitor cocktail) are insufficient and need optimization [16].
Experimental Workflows and Relationships
Troubleshooting Workflow for Sample Behavior
Sample Preparation and Optimization Protocol
The Scientist's Toolkit: Research Reagent Solutions
| Reagent Category | Specific Examples | Function in Sample Preparation |
|---|---|---|
| Lysis Buffers | RIPA Buffer, NP-40 Buffer | Disrupt cell membranes to release cellular contents. Choice depends on protein localization and required stringency [15] [14]. |
| Protease/Phosphatase Inhibitors | Cocktails (PMSF, Aprotinin, etc.) | Preserve protein integrity by preventing degradation by endogenous proteases and phosphatases during and after lysis [15] [16]. |
| Detergents (Ionic) | SDS, Sodium Deoxycholate | Denature proteins, break protein-protein interactions, and confer uniform negative charge for separation by size [13] [14]. |
| Detergents (Non-Ionic) | Triton X-100, Tween-20 | Solubilize membrane proteins in their native state; used for gentle cell lysis and permeabilization [14]. |
| Detergents (Zwitterionic) | CHAPS, CHAPSO | Denature proteins but are often milder than ionic detergents; useful for isoelectric focusing [13] [14]. |
| Reducing Agents | DTT, β-mercaptoethanol, TCEP | Break disulfide bonds within and between protein molecules, ensuring complete denaturation and linearization [15]. |
| Loading Buffer Components | Glycerol, Bromophenol Blue, SDS, Tris-HCl | Increase sample density, visualize migration, denature proteins, and maintain stable pH [15]. |
| Desalting/Dialysis Tools | Spin Columns, Dialysis Tubing | Remove interfering salts, detergents, or other small molecules via size exclusion or diffusion for buffer exchange [18]. |
Fundamental Principles of Electrophoretic Migration and Well Architecture
In protein and nucleic acid electrophoresis, the successful separation of biomolecules begins long before bands migrate through the gel—it starts with proper sample retention within the wells. The architecture of gel wells and the fundamental principles governing electrophoretic migration are foundational to obtaining reliable, reproducible results in research and drug development. When proteins migrate out of wells prematurely or unevenly, it compromises data integrity, wastes precious samples, and delays critical experiments. This technical guide addresses the core principles and troubleshooting strategies to prevent these issues, ensuring your electrophoretic separations begin on solid footing.
Core Principles: Understanding Electrophoretic Migration
Fundamental Mechanisms
Electrophoresis is a class of separation techniques in which charged protein molecules are transported through a solvent by an electrical field [3]. The mobility of a molecule through an electric field depends on several key factors: field strength, net charge on the molecule, size and shape of the molecule, ionic strength, and properties of the matrix through which the molecule migrates (e.g., viscosity, pore size) [3]. In the presence of an electric field, cations migrate toward the negatively charged cathode, anions migrate toward the positively charged anode, and neutral species remain stationary [20].
For protein electrophoresis, polyacrylamide serves as the ideal matrix due to its controllable pore size, which creates a molecular sieve effect [3]. The most common form of protein electrophoresis—SDS-PAGE—uses the ionic detergent sodium dodecyl sulfate (SDS) to denature proteins and impart a uniform negative charge, allowing separation primarily by molecular mass [3].
The Critical Role of Well Architecture
Well architecture directly influences sample retention and migration in several crucial ways:
- Well Integrity: Poorly formed wells can lead to sample leakage between lanes, resulting in cross-contamination and smearing [21].
- Well Dimensions: The width and depth of wells affect sample concentration and loading capacity. Deep, narrow wells help concentrate the sample into a tight band [21].
- Gel Thickness: Optimal gel thickness (typically 3-4mm for horizontal systems) prevents band diffusion during electrophoresis [21].
- Well Bottom Integrity: Pushing combs too close to the bottom of the gel can create thin areas where samples can leak out prematurely [21].
Troubleshooting Guide: Sample Migration and Well Issues
Problem: Protein Samples Migrating Out of Wells Before Running
Possible Causes and Solutions:
| Cause | Solution |
|---|---|
| Damaged well bottoms | Avoid pushing combs completely to the bottom of the gel cassette; leave approximately 1mm space [21]. |
| Poorly polymerized gels | Ensure proper polymerization time (至少20-30 minutes) and check that all reagents are fresh and properly mixed [22]. |
| Sample density insufficient | Add glycerol or sucrose to sample buffer to increase density; use appropriate loading dye [23]. |
| Improper comb removal | Remove combs slowly and steadily at a 90-degree angle to prevent tearing well walls [21]. |
| High salt concentration in samples | Desalt samples or dilute in nuclease-free water before loading; excess salt creates high conductivity leading to local heating and distortion [24]. |
Problem: Smiling or Frowning Bands
Possible Causes and Solutions:
| Cause | Solution |
|---|---|
| Uneven heat distribution | Reduce voltage to minimize Joule heating; use constant current setting if available [24] [22]. |
| Incorrect buffer concentration | Prepare fresh running buffer at correct concentration; depleted buffer alters system resistance [24]. |
| High salt concentration in samples | Desalt samples or dilute to reduce salt concentration [24]. |
| Overloading wells | Load smaller sample volumes; recommended 0.1-0.2 μg of DNA per millimeter of gel well width [21]. |
Problem: Smearing or Fuzzy Bands
Possible Causes and Solutions:
| Cause | Solution |
|---|---|
| Sample degradation | Keep samples on ice; use protease inhibitors for proteins or nuclease-free conditions for nucleic acids [24] [23]. |
| Excessive voltage | Run gels at lower voltage for longer duration; high voltage causes localized heating and degradation [24]. |
| Incomplete denaturation | For proteins, ensure proper denaturation with SDS and reducing agents; heat samples appropriately [24]. |
| Overloading wells | Reduce sample amount loaded; overloaded wells cause trailing smears and warped bands [21]. |
| Poorly formed wells | Use clean combs and allow sufficient time for wells to form before comb removal [21]. |
Problem: Poor Band Resolution
Possible Causes and Solutions:
| Cause | Solution |
|---|---|
| Incorrect gel concentration | Use appropriate gel percentage for target molecule size; higher percentage for smaller proteins [24] [3]. |
| Overloading wells | Reduce sample concentration or volume; fused bands indicate overload [21]. |
| Incorrect run time | Optimize run duration; too short prevents separation, too long causes diffusion [24]. |
| Voltage too high | Lower voltage improves resolution by reducing diffusion effects [24]. |
| Buffer issues | Use fresh running buffer at correct pH and concentration [24]. |
Experimental Protocols: Optimizing Well Architecture and Migration
Protocol for Casting Gels with Optimal Well Architecture
Materials Needed:
- Acrylamide/bis-acrylamide solution
- Ammonium persulfate (APS)
- TEMED
- Gel cassette and comb
- Buffer
Procedure:
- Prepare resolving gel mixture: Combine acrylamide, buffer, and water in appropriate ratios for desired percentage [3].
- Add polymerization agents: Add 10% APS and TEMED (e.g., 0.3mL APS and 0.03mL TEMED for a 30mL gel mixture) [3].
- Cast gel: Pour between glass plates, leaving space for stacking gel.
- Overlay with solvent: Add water or isopropanol to create even surface.
- Prepare stacking gel: After polymerization, pour stacking gel with lower acrylamide concentration (e.g., 4%) [3].
- Insert comb properly: Position comb without pushing to the very bottom; leave approximately 1mm space [21].
- Allow complete polymerization: Wait at least 20-30 minutes before comb removal [22].
- Remove comb carefully: Pull straight up steadily to prevent well damage [21].
Protocol for Sample Preparation to Prevent Migration Issues
Materials Needed:
- Protein sample
- Lysis buffer (e.g., RIPA buffer)
- Protease inhibitors [23]
- Sample buffer (e.g., Laemmli buffer) [23]
- Reducing agent (DTT or β-mercaptoethanol) [23]
Procedure:
- Lysate preparation: Lyse cells or tissues in appropriate buffer with protease inhibitors to prevent degradation [23].
- Protein quantification: Determine concentration using BCA or Bradford assay [23].
- Prepare sample mixture: Combine sample with sample buffer containing glycerol for density and tracking dye [23].
- Denature proteins: Heat at 70-100°C for 5-10 minutes [3].
- Centrifuge briefly: Spin to remove insoluble material.
- Load properly: Load 0.1-0.2 μg per millimeter of well width; ensure sample volume fills at least 30% of well [21].
Research Reagent Solutions: Essential Materials
| Reagent | Function | Application Notes |
|---|---|---|
| Protease Inhibitors (e.g., PMSF, Aprotinin, Leupeptin) | Prevents protein degradation during sample preparation [23]. | Use cocktail for broad-spectrum protection; add fresh to lysis buffer [23]. |
| SDS (Sodium Dodecyl Sulfate) | Denatures proteins and confers uniform negative charge [3]. | Critical for SDS-PAGE; ensures migration by size rather than charge [3]. |
| DTT or β-mercaptoethanol | Reduces disulfide bonds [23]. | Add fresh to sample buffer; essential for complete denaturation [23]. |
| Acrylamide/Bis-acrylamide | Forms cross-linked polymer network for molecular sieving [3]. | Concentration determines pore size; higher % for smaller proteins [3]. |
| APS and TEMED | Catalyzes acrylamide polymerization [3]. | Fresh APS solution essential for proper gel polymerization [3]. |
| Tris-based Buffers | Maintains pH and provides conducting ions [22] [3]. | Standard for both gel and running buffers [22]. |
Advanced Technical Considerations
Electrical Current Optimization
Current management is crucial for preventing migration artifacts. Recent studies show that electrical current is strongly dependent on buffer composition, particularly the type and concentration of EDTA [22]. Modifications to standard TAE and TBE buffers can reduce current generation, allowing higher voltages without excessive heating [22]. Additionally, using thinner gels and smaller chamber buffer volumes significantly reduces current, improving band resolution [22].
Database of Reference Migration Patterns
For protein researchers, a newly established database of accurate electrophoretic migration patterns for approximately 10,000 human proteins provides valuable reference data for troubleshooting western blot experiments [25]. This resource, available through a user-friendly graphical interface, offers accurate molecular weights measured by SDS-PAGE coupled with mass spectrometry, helping researchers identify abnormal migration patterns resulting from post-translational modifications or splicing events [25].
Frequently Asked Questions (FAQs)
Q1: Why do my protein samples spill into adjacent wells during loading? A: This typically indicates poorly formed wells due to: (1) insufficient gel polymerization time, (2) comb removed too quickly or at an angle, (3) overfilling the gel tray creating connected wells, or (4) comb pushed too close to the bottom. Allow complete polymerization (20-30 minutes), remove comb carefully and steadily, and ensure proper comb placement [21].
Q2: What causes "smiling" or "frowning" band patterns? A: These distortions result from uneven heat distribution across the gel. The center becoming hotter than edges causes "smiling" (faster migration in center). Solutions include: reducing voltage, using constant current setting, ensuring fresh buffer, and desalting samples [24].
Q3: How can I prevent sample degradation during electrophoresis? A: Maintain samples on ice, use protease inhibitors (e.g., PMSF, Aprotinin) in lysis buffer, work quickly, and run gels at lower voltages to reduce heating. For nucleic acids, use nuclease-free reagents and equipment [24] [23].
Q4: What is the optimal gel thickness for preventing diffusion? A: For horizontal agarose gels, 3-4mm thickness is ideal. Gels thicker than 5mm may result in band diffusion during electrophoresis [21].
Q5: Why do bands appear faint even with sufficient sample? A: Possible causes include: (1) incomplete transfer, (2) insufficient staining time, (3) dye degradation, (4) protein concentration too low. Ensure proper staining duration, fresh staining solutions, and load appropriate amount (0.1-0.2 μg per millimeter of well width) [21].
Visual Guide: Troubleshooting Electrophoretic Migration
Mastering electrophoretic migration and well architecture requires attention to both theoretical principles and practical execution. By focusing on proper well formation through careful gel casting and comb placement, optimizing sample preparation with appropriate buffers and additives, and controlling run conditions to manage electrical current and heating, researchers can prevent the common problem of protein samples migrating out of wells prematurely. Implementation of these standardized protocols and troubleshooting approaches will enhance the reliability of electrophoretic separations, providing stronger foundations for downstream analysis in research and drug development workflows.
Optimized Sample Preparation and Loading Protocols for Flawless Electrophoresis
Step-by-Step Guide to Formulating High-Density Loading Buffers with Optimal Glycerol Concentrations
In protein electrophoresis, a common frustration occurs when precious samples leak out of gel wells before or during the run, leading to failed experiments, lost time, and inconclusive results. This problem is primarily addressed by formulating high-density loading buffers that effectively keep samples sedimented at the bottom of the wells. The key component enabling this function is glycerol, which increases the density of the sample solution. This guide provides detailed protocols and troubleshooting advice for creating optimized loading buffers that prevent sample migration, ensuring reliable and reproducible protein separation for research and drug development applications.
Core Component: Understanding Glycerol's Function
Why Glycerol is Essential
Glycerol serves a critical physical function in SDS-PAGE sample loading buffers. By adding density to the solution, it ensures that your protein samples sink to the bottom of the gel wells during loading and remain there until the electrical current is applied [15] [26]. Without sufficient glycerol, aqueous samples can float or diffuse out of the wells, leading to sample cross-contamination, uneven lanes, and complete experimental failure. The anionic dye bromophenol blue is typically included to visualize this dense solution, allowing researchers to confirm proper loading [15] [26].
Optimal Glycerol Concentration
The standard and widely adopted concentration for glycerol in a 2X Laemmli loading buffer is 20% [15]. This concentration provides optimal density for most applications without causing excessive viscosity that might complicate pipetting. For a 6X loading buffer formulation, the glycerol concentration is typically maintained at a similar percentage to ensure proper sample sedimentation [27].
Table 1: Standard Glycerol Concentrations in Loading Buffers
| Buffer Strength | Typical Glycerol Concentration | Primary Function |
|---|---|---|
| 2X Laemmli Buffer | 20% | Increases sample density for proper well sedimentation |
| 6X Loading Buffer | ~20% | Increases sample density for proper well sedimentation |
Complete Loading Buffer Formulation
Standard 2X Laemmli Buffer Recipe
The Laemmli buffer, named after its inventor, remains the gold standard for SDS-PAGE sample preparation [15] [26]. Below is the complete formulation with optimal glycerol concentration:
- 4% SDS - Denatures proteins and confers negative charge
- 10% 2-mercaptoethanol - Reduces disulfide bonds
- 20% glycerol - Provides density to prevent sample leakage [15]
- 0.004% bromophenol blue - Tracking dye to monitor migration
- 0.125 M Tris HCl - Buffering agent, pH 6.8
This formulation can be scaled to create 4X or 6X concentrates to minimize sample dilution, though the glycerol concentration should be maintained at approximately 20% to ensure proper density [15].
Alternative Reducing Agents
While 2-mercaptoethanol is traditional, dithiothreitol (DTT) can be substituted as a reducing agent to break disulfide bonds [15]. Both compounds serve the same function, but DTT is often preferred due to its lower odor and greater stability.
Experimental Protocol: Buffer Preparation and Sample Usage
Step-by-Step Buffer Preparation
- Prepare Tris-HCl buffer: Create a 0.125 M Tris-HCl solution at pH 6.8 using high-purity water
- Add SDS: Incorporate sodium dodecyl sulfate to a final concentration of 4%
- Add glycerol: Include molecular biology-grade glycerol at 20% concentration [15]
- Include reducing agent: Add either 10% 2-mercaptoethanol or an appropriate concentration of DTT
- Add tracking dye: Incorporate bromophenol blue to 0.004%
- Mix thoroughly: Ensure all components are completely dissolved
- Aliquot and store: Portion into convenient volumes and store at -20°C for long-term stability
Sample Preparation Protocol
- Combine samples: Mix protein sample with an equal volume of 2X loading buffer [15]
- Denature proteins: Heat mixture at 95-100°C for 5 minutes or 70°C for 5-10 minutes for membrane proteins [15]
- Brief centrifugation: Spin samples briefly to collect condensation and ensure no liquid remains on tube caps [15]
- Load carefully: Load no more than 3/4 of the well capacity to prevent overflow [28]
- Verify loading: Confirm the dense, colored solution remains at the bottom of wells before initiating electrophoresis
Sample Preparation Workflow
Troubleshooting Common Loading Buffer Issues
Problem: Samples Leaking from Wells
Primary Cause: Insufficient glycerol concentration in loading buffer [28]
Solutions:
- Verify glycerol concentration is exactly 20% in your loading buffer stock
- Check that samples are properly mixed with loading buffer before heating
- Ensure you're not exceeding 3/4 of well capacity during loading [28]
- Rinse wells with running buffer before loading to remove air bubbles that can displace samples [28]
Problem: Protein Aggregation in Wells
Primary Cause: Insufficient reducing agents or denaturation
Solutions:
- Confirm fresh reducing agent (2-mercaptoethanol or DTT) is used [28] [29]
- Ensure complete denaturation by heating at appropriate temperature
- For hydrophobic proteins, consider adding 4-8M urea to lysis solution to reduce aggregation [28]
- Verify proper protein concentration (typically 10 µg per well is sufficient) [28]
Problem: Uneven or Distorted Bands
Primary Cause: Improper loading technique or buffer formulation
Solutions:
- Load equal volumes across all wells using calibrated pipettes
- Ensure loading buffer is thoroughly mixed before use
- Include appropriate controls to identify technique issues
- Check that bromophenol blue is evenly distributed in all samples
Table 2: Troubleshooting Sample Loading Issues
| Problem | Primary Cause | Solution |
|---|---|---|
| Sample leakage from wells | Insufficient glycerol concentration | Verify 20% glycerol in buffer formulation |
| Sample floating in wells | Air bubbles in wells or overfilling | Rinse wells with buffer before loading; don't exceed 3/4 well capacity [28] |
| Protein aggregation | Insufficient reduction or denaturation | Use fresh reducing agents; ensure proper heating; add urea for hydrophobic proteins [28] |
| Uneven bands across lanes | Improper loading technique or uneven volumes | Use calibrated pipettes; load equal volumes; ensure consistent sample preparation |
Research Reagent Solutions
Table 3: Essential Reagents for Loading Buffer Formulation
| Reagent | Function | Optimal Concentration |
|---|---|---|
| Glycerol | Increases density to prevent sample leakage | 20% in 2X buffer [15] |
| SDS (Sodium Dodecyl Sulfate) | Denatures proteins and confers negative charge | 4% in 2X buffer [15] |
| 2-mercaptoethanol or DTT | Reduces disulfide bonds | 10% (2-ME) or appropriate DTT concentration [15] |
| Bromophenol Blue | Tracking dye to monitor electrophoresis progress | 0.004% [15] |
| Tris-HCl | Buffer to maintain pH | 0.125 M, pH 6.8 [15] |
Advanced Formulation Considerations
Glycerol Quality Considerations
The purity of glycerol is crucial for optimal results. Lower purity glycerol (less than 99.5%) can inhibit peroxidase activity if using HRP-based detection systems later in western blotting [29]. Always use high-purity, molecular biology-grade glycerol to prevent interference with downstream applications.
Alternative Density Agents
While glycerol is standard, other density-enhancing agents can be used in specific circumstances:
- Ficoll-400: Used at 15% in some commercial loading dyes as a density agent [27]
- Sucrose: Can be substituted at appropriate concentrations when glycerol is unavailable
However, for most protein electrophoresis applications, 20% glycerol remains the optimal choice due to its proven performance, compatibility with downstream processes, and widespread availability.
Special Applications
For non-denaturing electrophoresis, SDS and reducing agents must be omitted from the loading buffer, though glycerol should be maintained at 20% to ensure proper sample sedimentation [15]. Similarly, when studying proteins that might aggregate when boiled, heating at 70°C for 5-10 minutes is recommended instead of the standard 95-100°C [15].
Frequently Asked Questions (FAQs)
Q1: Can I increase glycerol concentration beyond 20% for better sample retention? A: While technically possible, higher glycerol concentrations significantly increase viscosity, making pipetting difficult and potentially affecting protein migration. The 20% concentration represents an optimal balance between density and practicality for most applications.
Q2: My samples are still leaking despite using 20% glycerol. What should I check? A: First, verify your glycerol is properly mixed in the buffer. Second, ensure you're not overfilling wells - never exceed 3/4 capacity. Third, check for air bubbles by rinsing wells with running buffer before loading. Finally, confirm your protein concentration isn't excessively high, causing abnormal solution properties.
Q3: How long can I store prepared loading buffer, and does glycerol concentration change over time? A: When stored properly at -20°C, loading buffer remains stable for 6-12 months. Glycerol concentration shouldn't change significantly with proper storage, though repeated freeze-thaw cycles should be minimized. Aliquot into working volumes to maintain stability.
Q4: Can I use loading buffer without glycerol for special applications? A: While possible, omission of glycerol requires extreme care during loading as samples will easily diffuse out of wells. This is not recommended for routine work and should only be attempted when glycerol interferes with downstream analysis, with the understanding that sample loss is likely.
Q5: Does glycerol concentration affect protein migration during electrophoresis? A: At the standard 20% concentration (which becomes 10% after mixing with samples), glycerol has minimal effect on migration. However, significantly higher concentrations can slightly retard migration, so consistency in formulation is key for reproducible results.
Protein sample preparation is a critical foundation for successful western blotting and other analytical techniques. In the context of a broader thesis on preventing protein samples from migrating out of wells before running research, effective solubilization becomes paramount. Incomplete solubilization or improper handling of protein samples often leads to aggregation, causing proteins to become trapped in the well instead of entering the gel matrix for proper separation. This guide addresses specific troubleshooting scenarios and provides detailed protocols for advanced solubilization techniques utilizing reducing agents, heating, and urea treatment to ensure complete protein denaturation and solubility.
FAQs: Troubleshooting Solubilization Issues
Why are my proteins getting stuck in the stacking gel or well? Protein aggregation is the primary cause of proteins becoming trapped in the well or stacking gel. This occurs when proteins are not fully denatured and solubilized, causing them to form large complexes too big to enter the gel matrix. Insufficient concentration of SDS, reducing agents, or chaotropic agents like urea can fail to fully disrupt secondary and tertiary structures, leading to aggregation [30]. Additionally, overheating some samples can cause proteins to coagulate, while undegraded genomic DNA can increase sample viscosity, trapping proteins [31].
How can I prevent protein degradation and aggregation during extraction? Maintaining protein integrity requires working on ice to slow enzymatic activity and incorporating protease and phosphatase inhibitors into your lysis buffer to prevent proteolysis and dephosphorylation [23] [32]. For proteins prone to oxidation, include reducing agents like DTT or β-mercaptoethanol in your storage buffers, and consider handling under inert atmospheres [33]. The choice of lysis buffer must match your protein's subcellular localization and the detergent compatibility with downstream antibodies [23].
When should I use urea for protein solubilization? Urea is a chaotropic agent highly effective for solubilizing difficult proteins, particularly hydrophobic membrane proteins or aggregated samples that are insoluble in standard detergents [23] [34]. It works by disrupting hydrogen bonds and unfolding protein structures. Notably, at lower concentrations, urea can paradoxically act as a chemical chaperone to counteract aggregation in crowded environments, while at high concentrations (6-8 M), it is a powerful denaturant [30] [35]. Crucially, urea-containing samples should not be heated above 37°C to prevent the formation of cyanate ions, which can carbamylate proteins and alter their charge and mobility [23].
Troubleshooting Guide: Common Solubilization Problems
Table 1: Troubleshooting Common Protein Solubilization Issues
| Problem | Possible Causes | Recommended Solutions |
|---|---|---|
| Proteins stuck in well | Protein aggregation; Insufficient denaturation; Viscous sample (DNA) | Increase DTT/β-ME concentration; Use 8M urea; Increase SDS; Briefly sonicate or add Benzonase to digest DNA [23] [31] |
| Multiple bands or smearing | Protease degradation; Partial oxidation | Use fresh protease inhibitors; Add higher concentrations of reducing agents (DTT); Work on ice [33] [31] |
| Poor or no signal | Overheating urea-containing samples; Inefficient transfer | Do not heat samples with urea above 37°C [23]; Re-optimize transfer protocol for protein size [36] [37] |
| High background | Protein precipitation; Over-transfer of small proteins | Ensure proper solubilization; For low MW proteins, use smaller pore membrane (0.2 µm) and less methanol in transfer buffer [36] [32] |
Detailed Experimental Protocols
Protocol 1: Urea-Based Solubilization for Difficult Proteins
This protocol is designed for proteins that are insoluble in standard RIPA or NP-40 buffers, such as membrane proteins or aggregated samples [23] [34].
- Lysis Buffer Preparation: Prepare a fresh lysis buffer containing 50 mM Tris-HCl (pH 8.0), 8 M urea, 5 mM DTT, and 1% CHAPS or another compatible detergent. Do not include SDS if subsequent affinity purification is planned.
- Cell Lysis: Resuspend the cell pellet in the urea lysis buffer. For tissues, homogenize directly in the buffer.
- Incubation: Incubate the lysate for 30-60 minutes at room temperature or 37°C with gentle agitation. Critical: Do not heat above 37°C. [23]
- Clarification: Centrifuge the lysate at 16,000 × g for 15 minutes at 15°C to remove any insoluble debris.
- Sample Preparation for SDS-PAGE: Mix the clarified supernatant with standard Laemmli buffer. If the final urea concentration is below 4 M, the sample can be heated at 70-95°C for 5 minutes. For higher urea concentrations, heating at 37°C for 10-20 minutes is recommended to avoid carbamylation.
Protocol 2: Optimized Heating and Reduction for Standard Samples
This is a standard protocol for soluble proteins, ensuring complete denaturation.
- Sample Preparation: Mix your protein sample with an equal volume of 2X Laemmli sample buffer [32]. A standard 1X formulation is: 60 mM Tris-HCl (pH 6.8), 2% SDS, 10% glycerol, 0.01% bromophenol blue.
- Reduction: Add a fresh reducing agent to the sample. Final concentrations of 50-100 mM DTT or 5% β-mercaptoethanol are typical [32].
- Denaturation: Heat the samples at 70-95°C for 5-10 minutes in a heat block or boiling water bath.
- Cooling and Load: Briefly centrifuge the tubes to collect condensation and load the sample onto the gel.
The Scientist's Toolkit: Research Reagent Solutions
Table 2: Essential Reagents for Protein Solubilization
| Reagent | Function | Key Considerations |
|---|---|---|
| Urea | Chaotropic agent that disrupts hydrogen bonds to denature and solubilize proteins. | Use high-purity grade; Do not heat above 37°C to prevent cyanate formation and protein carbamylation [23] [35]. |
| DTT (Dithiothreitol) | Reducing agent that breaks disulfide bonds. | More stable and less odorous than β-mercaptoethanol; Add fresh as it oxidizes in buffer [32]. |
| SDS (Sodium Dodecyl Sulfate) | Ionic detergent that denatures proteins and confers a uniform negative charge. | Can interfere with some antibody epitopes; May not be suitable for native lysis conditions [23] [32]. |
| CHAPS | Zwitterionic detergent effective at solubilizing membrane proteins while preserving protein function. | Milder than SDS; Ideal for protecting protein-protein interactions and functional studies [23]. |
| Protease Inhibitor Cocktail | Chemical mixture that inhibits serine, cysteine, aspartic, and metalloproteases. | Essential for preventing protein degradation during and after lysis; use a broad-spectrum cocktail [23] [31]. |
Experimental Workflow and Decision Guide
The following diagram outlines a logical workflow for troubleshooting and optimizing protein sample solubilization, integrating the use of reducing agents, heating, and urea.
This guide addresses common challenges researchers face when loading protein samples for SDS-PAGE, providing targeted solutions to ensure samples remain in wells and migrate correctly.
Frequently Asked Questions & Troubleshooting
Q1: Why are my protein samples migrating unevenly or spilling between wells?
This is often due to residual polyacrylamide in the wells or issues with sample viscosity.
- Cause: Unpolymerized acrylamide or tiny bits of polyacrylamide left in wells after comb removal can disrupt smooth sample loading and migration. [38]
- Solution: After removing the comb, thoroughly rinse each well with electrophoresis running buffer using a gel-loading pipette tip. [38]
- Cause: Viscous samples, often from genomic DNA contamination or excess cellular debris, can lead to streaking, uneven lanes, and poor resolution. [10]
- Solution: Centrifuge or filter lysates to remove insoluble debris. For genomic DNA contamination, shear the DNA by sonicating the sample or passing it through a narrow-gauge needle to reduce viscosity. [10]
Q2: How do improper sample components affect how my protein loads and runs?
The chemical composition of your sample buffer critically impacts electrophoresis.
- Cause: High salt concentrations (exceeding 100 mM) increase sample conductivity, leading to distorted, wavy, or widened bands that can spread into adjacent lanes. [10]
- Solution: Dialyze samples or use detergent-removal columns to reduce salt concentration. Ensure final salt concentration does not exceed 100 mM. [10]
- Cause: High concentrations of non-ionic detergents (e.g., Triton X-100, NP-40) can interfere with SDS binding to proteins, disrupting the charge-to-mass ratio needed for proper separation. [10]
- Solution: Maintain a ratio of SDS to non-ionic detergent of at least 10:1. Consider using kits designed for SDS-PAGE sample preparation to remove excess detergent. [10]
Q3: What are the consequences of loading an incorrect protein amount?
Improper protein quantification and loading lead to both analytical and detection issues.
| Problem | Consequence | Solution |
|---|---|---|
| Too much protein | Overloaded lanes, poor band resolution, high background, and nonspecific bands. [10] [39] | Reduce load. For mini-gels, a maximum of 0.5 µg per band or 10–15 µg of cell lysate per lane is recommended. [10] |
| Too little protein | Weak or no signal, inability to detect the protein of interest. [39] | Load more protein or concentrate the sample. [39] |
Q4: How can I eliminate bubbles while loading and what problems do they cause?
Air bubbles can displace your sample from the well or disrupt current flow.
- Prevention: Use proper pipetting technique. Place the tip just inside the well and expel the sample slowly and steadily. Watch the well as you pipette to confirm the sample is entering without bubbles.
- Removal: If a bubble is introduced, you can often carefully "flick" the gel tank or use a clean, fine-gauge needle to dislodge it before applying the electric current.
Detailed Experimental Protocols
Protocol 1: Proper Well Preparation and Sample Loading
This protocol ensures clean, clear wells for optimal sample entry.
- Polymerization Check: After the gel has set, gently tilt the casting frame to ensure the gel is solid and has not detached from the plates. [40]
- Comb Removal: Carefully and slowly remove the comb from the gel to avoid tearing the well walls.
- Well Rinsing: Using a pipette and gel-loading tip, thoroughly rinse each well with 1X SDS-PAGE running buffer by pipetting the buffer up and down inside the well. This flushes out unpolymerized acrylamide and other debris. [38]
- Sample Introduction: Place the pipette tip just inside the well, ensuring it is not touching the well walls or bottom. Slowly dispense the sample. The glycerol in the sample buffer will cause it to sink to the bottom of the well. [23]
- Visual Inspection: Check for and address any air bubbles introduced during loading.
Protocol 2: Sample Preparation to Prevent Loading Artifacts
Proper sample handling before loading is crucial for success.
- Lysate Clarification: After lysis, centrifuge your sample at high speed (e.g., 12,000-14,000 x g) for 10-15 minutes at 4°C to pellet insoluble material, and transfer the supernatant to a new tube. [23]
- Protein Quantification: Use a colorimetric assay (e.g., BCA or Bradford assay) to determine protein concentration accurately. Ensure the assay is compatible with your lysis buffer components. [23]
- Sample Buffer Addition: Dilute your protein sample with the appropriate volume of Laemmli (SDS) sample buffer. A standard recipe is 2X Laemmli buffer. [23]
- Denaturation: Heat samples at 95-100°C for 5 minutes to fully denature proteins. [38] After heating, briefly centrifuge samples to collect condensation.
Optimal Loading Ranges & Conditions
The table below summarizes key quantitative guidelines for sample preparation and loading.
| Parameter | Optimal Range / Condition | Notes |
|---|---|---|
| Final Protein Concentration | >0.5 µg/µl, ideally 3-5 µg/µl [23] | Prevents over-dilution by sample buffer. |
| Total Protein Load per Lane (Mini-gel) | ~10-15 µg (cell lysate), max 0.5 µg/band [10] | Prevents overloading and ensures linear detection. |
| Salt Concentration | ≤ 100 mM [10] | Prevents lane distortion and wavy bands. |
| Heating Time | 5 minutes at 95-100°C [38] | Ensures complete denaturation. |
The Scientist's Toolkit: Essential Research Reagent Solutions
| Item | Function in Sample Loading & Preparation |
|---|---|
| Protease Inhibitors (e.g., PMSF, Aprotinin) [23] | Prevent protein degradation in lysates, preserving sample integrity. |
| SDS Sample Buffer (e.g., Laemmli Buffer) [23] | Denatures proteins, adds negative charge, and provides density for well loading. |
| Reducing Agents (e.g., DTT, β-mercaptoethanol) [23] | Breaks disulfide bonds for complete protein unfolding. Final concentration should be <50 mM for DTT. [10] |
| Gel-Loading Pipette Tips | Long, thin tips for precise sample delivery to the bottom of the well without damage. [38] |
| 1X SDS Running Buffer | Facilitates electrical current and provides ions for protein migration; used for well rinsing. [38] |
Workflow for Flawless Sample Loading
The following diagram illustrates the critical steps for preparing and loading your protein samples to prevent them from migrating out of the wells.
Troubleshooting Decision Pathway
Use this logical guide to diagnose and resolve specific sample loading problems.
This guide details a systematic workflow for preparing protein samples for gel electrophoresis, with a specific focus on preventing the common issue of samples migrating out of the wells before the run begins. A robust and reproducible sample preparation method is critical for the accuracy and specificity of subsequent analysis [41]. Improper handling at any stage can lead to protein degradation, modification, or incomplete denaturation, ultimately causing poor resolution and failed experiments.
Troubleshooting Guide: Key Issues and Solutions
Problem 1: Protein Samples Migrating Out of Wells Pre-Run
Why It Happens This occurs when the density of the loaded sample is lower than the running buffer, causing it to diffuse out of the well. It can also be caused by poorly formed wells, overfilling, or damaged agarose/acrylamide.
What You Can Do
- Increase Sample Density: Add density-enhancing reagents like glycerol, sucrose, or Ficoll to your sample buffer to a final concentration of 5-10% (v/v for glycerol). This ensures the sample settles at the bottom of the well [42].
- Check Well Integrity: Ensure wells are fully formed and the gel is properly polymerized. Avoid damaging wells during loading.
- Practice Careful Loading: Do not overfill wells. Manually load samples slowly and steadily to prevent spillover.
- Use a Dye-Containing Buffer: Always include a visible dye (e.g., Bromophenol Blue) in your loading buffer to visually monitor for leakage.
- Pre-Run the Gel: For delicate samples, a brief pre-run of the gel (without samples) at a low voltage can help condition the wells before loading your prepared samples.
Problem 2: Weak or No Signal on Final Blot
Why It Happens This can range from basic oversights to complex transfer or antibody issues, including failed transfer to the membrane, dead antibodies, or a quenched HRP detection system [42].
What You Can Do
- Verify Transfer Efficiency: After transfer, stain the gel with Coomassie Blue to check for residual protein. Stain the membrane with Ponceau S to confirm successful protein transfer [42].
- Troubleshoot Antibodies: Confirm the correct host species for your secondary antibody and check expiration dates. Titrate antibodies to find the optimal concentration and test on a known positive control [42].
- Check Detection System: Ensure no buffers contain sodium azide, which quenches HRP activity. Use fresh ECL substrates [42].
- Review Sample Prep: Verify protein concentration. Load 20–50 µg of total protein per lane. Ensure your lysis buffer contains protease inhibitors to prevent degradation [42].
Problem 3: High Background on Blot
Why It Happens Widespread, non-specific binding causes a dark haze, often due to insufficient blocking, too much antibody, or an incompatible blocking agent [42].
What You Can Do
- Optimize Blocking: Increase blocking time or switch from milk to BSA, especially when detecting phosphoproteins, as milk contains casein [42].
- Adjust Antibody Concentration: Titrate down your primary and secondary antibody concentrations. Perform more thorough washes (5-6 times for 5-10 minutes each with TBST) [42].
- Include Controls: Run a secondary-only control lane to identify if the secondary antibody is causing non-specific binding [42].
- Filter Buffers: Filter antibodies and buffers through a 0.45 µm filter to remove particulates [42].
Problem 4: Non-Specific or Extra Bands
Why It Happens The primary antibody may recognize multiple epitopes (common with polyclonal antibodies), or the target protein may exist in different isoforms or post-translationally modified states (e.g., phosphorylation, glycosylation) [42].
What You Can Do
- Optimize Antibody: Use a monoclonal antibody for higher specificity. Titrate the antibody to the lowest concentration that gives a clean, specific signal [42].
- Research Protein Modifications: Consult databases for known isoforms or modifications of your target protein that could appear as multiple bands.
- Alter Sample Prep: For phosphorylated proteins, use phosphatase inhibitors during lysis. A straighter band may indicate a purer sample or more specific antibody [42].
Frequently Asked Questions (FAQs)
Q1: My protein sample is too dilute. How can I concentrate it without losing material? A: Use protein precipitation methods like acetone or TCA precipitation, followed by resuspension in a smaller volume of your sample buffer. Alternatively, use centrifugal filter units with an appropriate molecular weight cutoff to concentrate your sample.
Q2: Why are my protein bands smiling or frowning? A: "Smiling" or "frowning" bands are often caused by uneven heat distribution across the gel during electrophoresis. Ensure the electrophoresis apparatus is properly assembled and that the buffer is circulating. Running the gel at a lower voltage can help mitigate this.
Q3: What is the critical difference between reducing and non-reducing sample buffer? A: Reducing buffers contain agents like DTT or β-mercaptoethanol that break disulfide bonds, fully denaturing the protein. Non-reducing buffers lack these agents, preserving disulfide bonds and the native quaternary structure of protein complexes. The choice depends on what you aim to detect.
Q4: How can I systematically develop and optimize my sample prep method? A: Use a systematic approach like plate mapping to test multiple variables at once [41]. For example, you can design an experiment that simultaneously evaluates different lysis buffer compositions, extraction times, and volumes to find the optimal combination for your specific protein and cell type.
Experimental Protocol: Systematic Method Development
This protocol uses a plate-based approach to efficiently optimize sample preparation variables.
1. Define Scope and Goal
- Goal: Identify the sample buffer and lysis conditions that yield the highest protein recovery and sharpest bands for your target protein.
- Scope: Test different detergents, reducing agents, and heating conditions.
2. Design the Plate Map
- Systematically test variables. A sample 96-well plate layout is shown below.
| Well | Lysis Buffer | Detergent | Reducing Agent | Heating |
|---|---|---|---|---|
| A1-3 | RIPA | 1% SDS | 100mM DTT | 95°C, 5 min |
| A4-6 | RIPA | 1% SDS | None | 95°C, 5 min |
| B1-3 | RIPA | 1% Triton X-100 | 100mM DTT | 95°C, 5 min |
| B4-6 | RIPA | 1% Triton X-100 | None | 95°C, 5 min |
| C1-3 | Tris-HCl | 1% SDS | 100mM DTT | 70°C, 10 min |
| C4-6 | Tris-HCl | 1% SDS | None | 70°C, 10 min |
3. Execute the Experiment
- Prepare cell pellets in triplicate for each condition.
- Add the respective lysis buffers to the pellets.
- Incubate and heat samples according to the plate map.
- Centrifuge to remove insolubles.
- Load equal volumes of supernatant for SDS-PAGE analysis.
4. Analyze Results
- Assess Western blot signal strength and specificity for your target.
- Use Coomassie-stained gels to evaluate total protein profile and integrity.
- Select the condition that provides the strongest specific signal with the least background and degradation.
Workflow Visualization
Research Reagent Solutions
The following table details essential materials and their functions in the sample preparation workflow.
| Item | Function |
|---|---|
| Lysis Buffer (e.g., RIPA) | Disrupts cells and solubilizes proteins for extraction. |
| Protease/Phosphatase Inhibitors | Prevents protein degradation and maintains post-translational modifications during lysis. |
| Centrifugal Filter Units | Concentrates dilute protein samples or changes buffer composition. |
| BCA/Bradford Assay Kit | Accurately quantifies protein concentration to ensure equal loading across gel lanes. |
| Laemmli Sample Buffer | Denatures proteins and provides color for tracking migration during electrophoresis. |
| Reducing Agent (DTT/BME) | Breaks disulfide bonds for complete protein denaturation. |
| Density Agent (Glycerol/Sucrose) | Increases sample density to prevent diffusion out of wells during loading. |
| Tracking Dye | Provides a visual indicator of electrophoresis progress. |
Quality Control Checkpoints for Sample Integrity Before Electrophoresis
For researchers in drug development and biological sciences, the success of electrophoresis experiments hinges on the integrity of the protein samples prior to loading. Sample degradation or improper preparation directly leads to the frustrating issue of proteins migrating aberrantly or failing to enter the gel matrix, compromising experimental validity and wasting valuable resources. This guide outlines critical quality control checkpoints to ensure sample integrity, providing troubleshooting advice and standardized protocols to prevent common pitfalls and ensure reliable, reproducible results.
Quantitative Quality Control Standards
The following table summarizes the key quantitative benchmarks for assessing sample quality before electrophoresis.
Table 1: Key Quantitative Benchmarks for Sample Quality Control
| Checkpoint | Target Value / Standard | Purpose & Rationale |
|---|---|---|
| Protein Concentration | 20-30 μg per lane for total protein; 100 μg per lane for modified targets (e.g., phosphorylated) [43] [44]. | Ensures optimal and equal loading across lanes for accurate comparison; prevents overloading (smearing) or underloading (weak signal) [45] [10]. |
| Sample Purity (A260/A280) | ~1.8 for DNA; ~2.0 for RNA [45]. | Assesses protein contamination in nucleic acid samples. Deviations indicate contamination that can interfere with downstream analysis [45]. |
| Salt Concentration | Should not exceed 100 mM [10] [46]. | Prevents band distortion, smearing, and uneven migration during electrophoresis due to altered conductivity [10] [46]. |
| Reducing Agent Concentration | <50 mM for DTT/TCEP; <2.5% for β-mercaptoethanol [10] [46]. | Prevents shadowing at lane edges and ensures proper protein denaturation without introducing artifacts [10] [46]. |
| SDS-to-Nonionic Detergent Ratio | Maintain at 10:1 or greater [10] [46]. | Ensures proper protein binding to SDS for accurate separation by size; excess nonionic detergent disrupts migration [10] [46]. |
Troubleshooting Guide: Sample Integrity Issues
Why are my protein bands faint or absent?
Possible Causes and Solutions:
- Insufficient Protein Loaded: Confirm concentration using a spectrophotometer and load at least 20-30 μg of whole cell extract per lane. For low-abundance targets like phosphorylated proteins, increase load to 100 μg per lane [43] [44].
- Protein Degradation: Proteases released during cell lysis can degrade samples. Solution: Always add a fresh protease inhibitor cocktail to the lysis buffer immediately before use and keep samples on ice throughout preparation [45] [43] [44].
- Inefficient Transfer (for Western Blot): If the signal is weak after blotting, check transfer efficiency by staining the gel post-transfer or using prestained markers. For low molecular weight proteins, reduce transfer time to prevent "blow-through" [10] [46].
- Antibody Issues (for Western Blot): Use freshly diluted antibodies at the recommended concentration. Check antibody specificity and ensure it is validated for detecting your target at endogenous levels [43] [44].
What causes smearing or diffuse bands on the gel?
Possible Causes and Solutions:
- Sample Overloading: Do not exceed 0.5 μg of protein per band or 10-15 μg of cell lysate per lane for mini-gels. Overloading is a common cause of smearing and poor resolution [10] [46].
- Nuclease or Protease Degradation: For nucleic acids, ensure all reagents and labware are nuclease-free. For proteins, use protease inhibitors and avoid repeated freeze-thaw cycles [45] [21].
- DNA Contamination: Genomic DNA in cell lysates can increase viscosity, causing protein aggregation and smearing. Solution: Shear DNA by sonication or pass the lysate through a fine-gauge needle [10] [44].
- Presence of Excess Salt or Detergents: High salt concentrations can cause band spreading and distortions. Dialyze samples or use detergent-removal columns to achieve compatible buffer conditions [10] [46].
Why are my bands poorly resolved or stacked closely together?
Possible Causes and Solutions:
- Incorrect Gel Percentage: Use a higher percentage polyacrylamide gel to better resolve smaller molecular weight fragments [21] [47].
- Improper Sample Preparation: For nucleic acids, use a denaturing gel and loading dye for single-stranded molecules (like RNA), but avoid denaturants for double-stranded DNA [21].
- Incorrect Electrical Settings: Very low or high voltage can create suboptimal resolution. Apply voltage as recommended for the size of your molecules and the buffer system [21].
Essential Experimental Protocols
Protocol 1: Cell Lysis and Protein Extraction for Western Blot
This protocol is designed to maximize protein yield while preserving integrity [47].
- Wash & Harvest: Wash adherent cells with cold PBS. Use a cell scraper to dislodge cells and transfer the mixture to a microcentrifuge tube.
- Pellet Cells: Centrifuge at 1500 RPM for 5 minutes at 4°C. Carefully discard the supernatant.
- Lysate Preparation: Add ice-cold cell lysis buffer supplemented with a fresh protease inhibitor cocktail (e.g., 180 μL lysis buffer + 20 μL inhibitor).
- Incubate & Clarify: Incubate on ice for 30 minutes. Centrifuge at 12,000 RPM for 10 minutes at 4°C to pellet insoluble debris.
- Collect Supernatant: Transfer the clarified supernatant (containing the soluble proteins) to a fresh tube. Store on ice or at -80°C for long-term storage.
- Quantify: Measure protein concentration using a spectrophotometer and a reliable assay (e.g., BCA or Bradford assay) [47].
Protocol 2: Sample Denaturation and Loading
Proper denaturation is critical for ensuring proteins migrate according to their molecular weight [47].
- Dilute & Mix: In a fresh tube, combine a measured volume of protein extract (containing 50 μg of protein) with loading buffer (e.g., Laemmli buffer). Use double-distilled water to equalize the volume across all lanes.
- Denature: Heat the samples at 95-100°C for 5 minutes using a heat block or dry bath. This step denatures the proteins and coats them with SDS.
- Brief Centrifugation: Spin down the condensed sample to the bottom of the tube.
- Load: Load the entire volume into the well of the prepared gel. Avoid overloading wells; a general recommendation is 0.1–0.2 μg of sample per millimeter of well width [21].
Sample Integrity Workflow
The following diagram outlines the logical workflow and critical checkpoints for ensuring sample integrity before electrophoresis.
The Scientist's Toolkit: Essential Research Reagents
Table 2: Key Reagents for Maintaining Sample Integrity
| Reagent / Material | Function | Key Consideration |
|---|---|---|
| Protease Inhibitor Cocktail | Inhibits a broad range of proteases to prevent protein degradation during and after cell lysis [43] [44] [47]. | Must be added fresh to the lysis buffer immediately before use for maximum effectiveness [45]. |
| Phosphatase Inhibitor Cocktail | Preserves protein phosphorylation states by inhibiting cellular phosphatases. Essential for detecting phospho-proteins [43] [44]. | Use specific inhibitors like sodium orthovanadate (tyrosine phosphatases) and β-glycerophosphate (serine/threonine phosphatases) [44]. |
| Lysis Buffer with Detergents | Breaks open cells and solubilizes proteins. Common detergents include SDS, Triton X-100, or NP-40 [45]. | The choice of detergent depends on protein localization and the need for denaturing vs. native conditions [45]. |
| Loading Buffer (Laemmli Buffer) | Denatures proteins, adds negative charge (via SDS), and allows samples to sink into wells (via glycerol) [47]. | Always include a reducing agent like DTT or β-mercaptoethanol to break disulfide bonds [47]. |
| Nuclease-Free Water & Labware | Prevents degradation of RNA and DNA samples by ubiquitous RNases and DNases [45] [21]. | Use dedicated, certified nuclease-free supplies and wear gloves when working with RNA [45]. |
Frequently Asked Questions (FAQs)
Why is it critical to quantify my protein sample before electrophoresis?
Accurate quantification ensures equal loading across all lanes, which is a prerequisite for meaningful comparisons between samples. It also ensures the signal is within the detection range of your instrument, preventing issues like overloading (smearing) or underloading (faint bands) [45].
How can I prevent sample degradation during preparation?
The most effective strategy is working quickly on ice or at 4°C and using fresh protease and phosphatase inhibitors in your lysis buffer. Additionally, aliquot samples to avoid repeated freeze-thaw cycles and process them promptly after lysis [45] [43] [44].
What is the difference between sample preparation for SDS-PAGE versus Native PAGE?
For SDS-PAGE (denaturing), samples are heated with SDS and a reducing agent to unfold proteins, masking their native charge. For Native PAGE, these steps are omitted to preserve the protein's native conformation, charge, and biological activity [45].
My sample is too viscous to load easily. What should I do?
Viscosity is often caused by contamination with genomic DNA. Shear the DNA by brief sonication or by repeatedly passing the lysate through a fine-gauge needle (e.g., 24-gauge) before centrifugation [10] [44].
Troubleshooting Protein Leakage: Diagnostic Flowcharts and Corrective Actions
FAQs: Troubleshooting Sample Leakage and Well Integrity
Q1: My protein samples are leaking out of the wells before or during gel electrophoresis. What are the most common causes?
Leakage from wells is typically a technical issue related to the gel apparatus setup or the sample itself. The table below summarizes the primary causes and how to distinguish them.
| Problem Category | Specific Cause | How to Distinguish |
|---|---|---|
| Gel Apparatus Setup | Improperly sealed gel cassette [48] | Visual inspection reveals gaps or misalignment in the glass plates. Leakage is often immediate and severe. |
| Damaged or worn-out seals and gaskets [48] | Leakage occurs consistently across multiple experiments. Inspection shows physical degradation of seals. | |
| Sample & Well Preparation | Overloaded wells [23] | Leakage is accompanied by smeared bands as sample spills into adjacent lanes. |
| Wells not rinsed properly after comb removal [23] | Residual polyacrylamide fragments in the well create uneven surfaces, leading to irregular leakage. | |
| Incorrect sample viscosity or density [23] | Sample does not settle properly in the well and diffuses out quickly upon loading. |
Q2: How can I determine if my protein is being lost due to adsorption to the sample tube rather than well leakage?
This is a classic distinction between a sample issue (adsorption) and a technical error (leakage). To diagnose:
- Check for Physical Leakage: Visually inspect the gel cassette for buffer seepage during the run. After electrophoresis, stain the gel with Coomassie Blue; protein loss only in the well area suggests leakage, while a general faintness suggests adsorption or degradation [23].
- Inspect the Sample Tube: After loading, check if a significant amount of sample remains adhered to the walls of the tube.
- Run a Recovery Test: Centrifuge your sample tube and any collection tube you use. Combine any liquid found with your main sample and re-load. If you recover a significant amount of protein, adsorption was the primary issue [49].
Q3: After confirming there's no physical leakage, what sample-related issues can cause poor protein recovery in the gel?
If the apparatus is sound, the problem often lies in sample preparation, which can cause proteins to migrate poorly or not at all.
| Symptom | Possible Cause | Investigation & Solution |
|---|---|---|
| Protein does not enter the gel | Protein precipitation or aggregation [23] | Ensure fresh reducing agents (DTT, β-mercaptoethanol) are used. Centrifuge sample before loading to pellet insolubles. |
| Smeared bands across the lane | Protease degradation [23] | Always perform lysis on ice with fresh protease inhibitors. Compare fresh vs. freeze-thawed samples. |
| Faint or no signal, despite confirmed loading | Protein adsorption to labware [23] | Use low-protein-binding tubes. Add a carrier protein like BSA (if it doesn't interfere with the assay) or ensure the sample buffer has sufficient SDS. |
Troubleshooting Guide: A Systematic Approach to Diagnosing Leakage
Follow this logical workflow to diagnose the root cause of your protein sample loss.
Detailed Troubleshooting Steps
Step 1: Inspect Gel Apparatus & Wells [48] Thoroughly clean and dry the glass plates before casting the gel. During assembly, ensure the gaskets are clean, pliable, and correctly seated. After polymerization, carefully remove the comb and use a syringe or pipette tip to flush out each well with running buffer to remove any residual polyacrylamide fragments that could create channels for leakage.
Step 2: Observe the Loading Process As you load the sample, watch closely. If the sample immediately streams out of the well or into an adjacent lane, this points strongly to a failure in the physical seal of the gel cassette or a cracked well [48].
Step 3: Check Sample Viscosity & Clarity A cloudy or viscous sample can indicate aggregation or contamination with genomic DNA. Viscous samples, often from tissue lysates, may not settle properly in the well. Solutions include:
- Centrifugation: Clarify the sample at high speed (e.g., 12,000-16,000 x g) for 10 minutes before loading to remove aggregates [50].
- Nuclease Treatment: For viscosity from nucleic acids, add Benzonase or DNase I during sample preparation to digest DNA/RNA [23].
- Dilution: If possible, dilute the sample in loading buffer, ensuring it remains within the detection limit.
Step 4: Analyze the Post-Electrophoresis Gel Stain the gel with Coomassie Blue after the run. The pattern of staining reveals the cause:
- Protein only in and directly around the wells: Indicates technical leakage from the well or massive precipitation that prevented entry into the gel.
- Faint or no protein bands overall: Suggests sample-wide issues like adsorption to tubes, degradation by proteases, or incorrect sample buffer formulation [23].
Experimental Protocols for Prevention and Verification
Protocol 1: Ensuring Proper Gel Cassette Integrity
Objective: To verify the gel apparatus is properly sealed and will not leak during electrophoresis.
Materials:
- Clean glass plates
- Spacers and comb
- Gel casting stand
- Deionized water
Method:
- Assemble the gel cassette according to the manufacturer's instructions on the casting stand.
- Fill the assembled cassette with deionized water to the top of the glass plates.
- Let it stand for 5-10 minutes.
- Observe for any water leakage, particularly from the bottom or sides of the cassette.
- If no leakage is observed, empty the water and proceed with casting the gel. If leakage is detected, disassemble, clean all components, check spacers for debris or damage, and reassemble.
Protocol 2: Preparing a Non-Stick Sample for Reliable Loading
Objective: To create a protein sample with the correct properties to prevent adsorption and ensure it remains in the well.
Materials:
- Protein sample
- 2X Laemmli sample buffer [23]
- Fresh Dithiothreitol (DTT) or β-mercaptoethanol [23]
- Heat block
- Microcentrifuge
Method:
- Mix your protein sample with an equal volume of 2X Laemmli buffer.
- Add fresh DTT to a final concentration of 50-100 mM or β-mercaptoethanol to 5% (v/v). These reducing agents break disulfide bonds to prevent aggregation.
- Denature the sample by heating at 95°C for 5 minutes.
- Briefly centrifuge the sample (10-30 seconds at >10,000 x g) to collect all condensation and potential precipitates at the bottom of the tube [50].
- Load the supernatant carefully into the well. This process ensures the sample is soluble, dense, and ready to enter the gel smoothly.
The Scientist's Toolkit: Essential Reagent Solutions
This table lists key materials and reagents used to prevent and troubleshoot protein sample leakage and loss.
| Item | Function in Preventing Leakage/Loss |
|---|---|
| Fresh Reducing Agents (DTT/β-Me) | Prevents protein aggregation by breaking disulfide bonds, keeping proteins soluble and able to enter the gel [23]. |
| Protease Inhibitor Cocktail | Prevents protein degradation by endogenous proteases during sample prep, preserving full-length protein [23]. |
| Proper Lysis Buffer (e.g., RIPA) | Effectively solubilizes proteins from different cellular compartments, preventing insolubility that leads to well retention [23]. |
| Low-Protein-Binding Tubes | Minimizes adsorptive loss of precious protein sample to the walls of the storage tube [23]. |
| Glycerol (in sample buffer) | Increases the density of the sample, causing it to sink to the bottom of the well and preventing diffusion out [23]. |
| SDS (Sodium Dodecyl Sulfate) | A denaturing detergent that coats proteins with a uniform negative charge, improving solubility and preventing aggregation [23] [36]. |
Comprehensive Troubleshooting Guide for Sample Aggregation and Poor Migration
This guide addresses the common issue of protein samples aggregating and failing to migrate properly out of the wells during gel electrophoresis, a critical step in protein analysis for research and drug development.
Frequently Asked Questions (FAQs)
- Why is my sample stuck in the well? Samples can be immobilized in the well due to several factors, including protein aggregation, sample overload, excess salt leading to local heating, or wells damaged during comb removal [51] [52].
- What causes protein aggregation during sample preparation? Aggregation can occur if the sample is not properly denatured, if the loading buffer is incompatible, or if the sample contains high levels of contaminants like salt or protein [24] [21].
- My sample is smearing; is this related to poor migration? Yes, smearing and poor migration often share common causes, such as sample degradation, excessive voltage, or an incorrect gel concentration [51] [24].
- How can I prevent sample aggregation and ensure clean migration? Ensure complete sample denaturation, avoid overloading the well, desalt or purify samples in high-salt buffers, and use the correct gel percentage and running voltage [24] [52] [21].
Troubleshooting Table: Sample Aggregation and Poor Migration
The table below summarizes the common causes and solutions for samples that fail to migrate properly.
| Problem/Symptom | Possible Cause | Recommended Solution |
|---|---|---|
| Sample stuck in well [51] [52] | Protein or cell debris crosslinking with DNA/RNA; Well overloading; Incorrect voltage or buffer. | Purify sample to remove debris/contaminants; Reduce sample load; Verify power supply settings and use fresh buffer. |
| Sample aggregation [24] [21] | Incomplete denaturation; Incompatible loading buffer; High protein or salt concentration. | Ensure proper denaturation with SDS and heating; Use a compatible loading buffer; Desalt or purify the sample. |
| "Smiling" or "frowning" bands (faster migration in center or edges) [24] | Uneven heat dissipation (Joule heating); High salt concentration in samples; Overloading wells. | Run gel at lower voltage; Desalt samples or dilute to reduce salt; Load smaller sample volumes. |
| Band smearing [51] [24] | Sample degradation; Excessive voltage; Incorrect gel concentration. | Handle samples gently and keep on ice; Run gel at lower voltage; Select appropriate gel percentage for protein size. |
| Faint or no bands [24] [21] | Sample degraded or lost; Insufficient sample concentration; Incorrect staining. | Re-check sample preparation steps; Increase amount of starting material; Prepare fresh staining solution. |
Experimental Protocol for Diagnosing Migration Issues
Follow this detailed protocol to systematically address sample aggregation and poor migration.
Materials
- Sample Preparation: Protein samples, compatible loading dye (e.g., containing SDS), heating block [21].
- Gel Casting: Appropriate percentage acrylamide gel, casting system, well-forming comb [21].
- Electrophoresis: Gel tank, power supply, running buffer (e.g., 1X Tris-Glycine-SDS) [52].
- Visualization: Staining solution (e.g., Coomassie Blue), destaining solution [21].
Procedure
Sample Preparation:
- Mix protein sample with an appropriate loading dye containing SDS to ensure complete denaturation [21].
- Heat denature samples as required (typically 70°C for RNA samples, 95°C for proteins) before loading to prevent formation of undesirable structures [52] [21].
- If smearing occurs, consider diluting or purifying the sample to reduce salt concentration (>50 mM NaCl can cause loss of resolution) or protein contaminants [52] [21].
Gel Casting and Loading:
- Select a gel percentage appropriate for your target protein size. Higher percentages resolve smaller proteins better [52] [21].
- Ensure wells are properly formed. Use a clean comb, avoid pushing it to the very bottom of the gel, and remove it carefully after the gel has solidified to prevent damaged wells that can cause sample leakage [21].
- Do not overload wells. The general recommendation is 0.1–0.2 μg of sample per millimeter of gel well width. Overloading can cause samples to get stuck and create smearing [21].
- Load a sample volume that fills at least 30% of the well to avoid band distortion [21].
Running the Gel:
- Use a running buffer that matches the gel chemistry and has high buffering capacity, especially for runs longer than 2 hours [52] [21].
- Apply optimal voltage. Very high voltage can cause localized heating, leading to band smiling, smearing, or even sample denaturation. Running at a lower voltage for a longer duration often improves resolution [51] [24]. For example, constant voltages of 110-130V are often recommended over 150V to prevent issues [51].
- Ensure the electrodes are connected correctly. The sample wells must be on the cathode (negative) side [21].
The Scientist's Toolkit: Research Reagent Solutions
| Item | Function |
|---|---|
| SDS (Sodium Dodecyl Sulfate) | An ionic detergent that denatures proteins and confers a uniform negative charge, allowing separation by size rather than charge [24] [21]. |
| Loading Dye | Adds density for sinking into wells, contains a visible marker to track migration progress, and often includes SDS for denaturation [53] [54]. |
| β-Mercaptoethanol or DTT | Reducing agents that break disulfide bonds within and between proteins, preventing aggregation and ensuring complete unfolding [24]. |
| Compatible Running Buffer | Provides the ions necessary to carry current and maintain a stable pH during electrophoresis, crucial for proper migration [52] [21]. |
Logical Workflow for Troubleshooting Migration Problems
The diagram below outlines a systematic approach to diagnose and resolve sample aggregation and poor migration.
Optimizing Gel Well Capacity and Loading Volume for Different Protein Concentrations
In protein gel electrophoresis, a foundational technique for drug development and proteomics research, ensuring that samples remain within their wells until the run begins is a fundamental prerequisite for successful analysis. Sample leakage or diffusion prior to electrophoresis can compromise data integrity, leading to failed experiments, wasted precious samples, and inconclusive results. This guide provides a systematic, troubleshooting-focused approach to optimizing gel well capacity and loading volume, directly addressing the core challenge of preventing premature sample migration. By integrating quantitative guidelines, detailed protocols, and actionable solutions, we aim to equip researchers with the knowledge to achieve reproducible, high-quality protein separation.
Understanding Well Capacity and Loading Guidelines
The first step in preventing sample loss is understanding the physical and practical limits of your gel system. Well capacity is not a single value but a function of gel cassette thickness and comb design. Adhering to recommended loading volumes is crucial for preventing overflow, sample leakage, and distorted bands.
Table 1: Recommended Loading Volumes for Precast Mini Gels [55]
| Well Format | Gel Thickness | Recommended Loading Volume | Maximum Loading Volume | Maximum Protein Load per Band |
|---|---|---|---|---|
| 10-well | 1.0 mm | 25 µL | ~42 µL | 0.5 µg |
| 10-well WedgeWell | 1.0 mm | 40 µL | 60 µL | 0.5 µg |
| 15-well | 1.0 mm | 15 µL | ~25 µL | 0.5 µg |
| 15-well WedgeWell | 1.0 mm | 20 µL | 35 µL | 0.25 µg |
A key principle is that the recommended loading volume is typically only about 60% of the theoretical maximum well capacity [55]. This buffer space is essential for containing the sample without spillover. "WedgeWell" combs, which create wells that are wider at the top than the bottom, allow for significantly larger loading volumes compared to standard combs of the same format, providing greater flexibility for dilute samples [55].
Table 2: Recommended Loading Volumes for Midi Gels [55]
| Well Format | Recommended Loading Volume | Maximum Loading Volume |
|---|---|---|
| 12+2-well | 45 µL + 15 µL | 60.7 µL |
| 20-well | 25 µL | - |
| 26-well | 15 µL | - |
Core Challenge: Preventing Premature Sample Migration
Problem Definition and Impact
The phenomenon of protein samples migrating out of the well before the electrophoretic run begins manifests as blank or incomplete lanes after staining, with sample material diffused into the surrounding buffer [56]. This directly undermines experimental validity by causing sample loss, cross-contamination between lanes, and unreliable quantification.
Root Cause Analysis
The primary cause for this issue is a time lag between loading the samples and applying the electric current [56]. The electric current is essential for orchestrating the streamlined, concordant migration of all proteins from the well into the gel matrix. Without this driving force, samples begin to diffuse haphazardly out of the well due to simple concentration gradients. This problem is exacerbated in large gels with many wells, where the loading process itself takes several minutes [56].
Integrated Troubleshooting Guide and FAQs
This section addresses the core issue and other common loading and separation problems.
Table 3: Troubleshooting Guide for Sample Loading and Band Resolution
| Problem | Primary Cause | Recommended Solution |
|---|---|---|
| Samples migrate out of well before run | Lag between loading and applying power [56]. | Minimize the delay; start the run immediately after finishing sample loading. For large gels, load quickly or run fewer samples at once [56]. |
| Smeared Bands | Running gel at excessively high voltage [24] [56]. | Run the gel at a lower voltage (e.g., 10-15 V/cm) for a longer duration [56]. Ensure samples are properly denatured [57]. |
| Poor Band Separation (Resolution) | Incorrect gel percentage for target protein size [24] [58]. | Optimize gel concentration: Use lower % acrylamide for high MW proteins, higher % for low MW proteins (see Table 4). Load less protein [57]. |
| "Smiling" or "Frowning" Bands | Uneven heat distribution across the gel (Joule heating) [24]. | Run gel at lower voltage; use a constant current power supply; ensure buffer level is even across the tank [24]. Run in a cold room or use a cooling apparatus [56]. |
| Faint or No Bands | Sample degradation or insufficient protein concentration [24] [21]. | Check sample integrity and handling. Increase protein load if too faint, but avoid overloading. Verify staining protocol [24] [21]. |
| Edge Effect (distorted peripheral lanes) | Empty wells at the periphery of the gel [56]. | Load dummy samples, ladder, or protein stock into empty wells to standardize the electric field across the entire gel [56]. |
Frequently Asked Questions (FAQs)
Q1: My protein sample is very dilute. How can I load enough protein without overfilling the well? A1: Consider using a gel with a WedgeWell comb, which is designed to accommodate larger volumes (e.g., 40 µL vs. 25 µL for a 10-well mini gel) [55]. Alternatively, you can concentrate your sample using protein precipitation methods or use a specialized buffer that increases sample density.
Q2: I started the run immediately after loading, but I still saw some diffusion. What else could be wrong? A2: Ensure your sample is properly mixed with the loading buffer. The glycerol or sucrose in the loading buffer increases the density of the sample, causing it to sink and remain in the well. If the sample is not adequately mixed, it may not have the necessary density. Also, check that the well was not punctured or damaged during loading, which can provide a path for sample leakage [21].
Q3: How do I know if my poor separation is due to overloading or incorrect gel percentage? A3: Overloading typically causes thick, fuzzy bands that may blend together, while an incorrect gel percentage results in poor separation across a specific size range, compressing bands of interest. If you suspect overloading, run a dilution series of your sample. If the problem is gel percentage, consult an acrylamide percentage selection table (see Table 4) and re-cast your gel [58] [57].
Optimizing Electrophoresis Conditions
Selecting the Correct Gel Percentage
The concentration of polyacrylamide in the resolving gel is the single most important factor for achieving high-resolution separation [24]. The pore size of the gel must be appropriate for the molecular weight (MW) of your target proteins.
Table 4: Optimizing Polyacrylamide Gel Percentage for Protein Separation [58]
| Protein Molecular Weight Range | Recommended Gel Concentration |
|---|---|
| 100 - 600 kDa | 4% |
| 50 - 500 kDa | 7% |
| 30 - 300 kDa | 10% |
| 10 - 200 kDa | 12% |
| 3 - 100 kDa | 15% |
Sample Preparation and Denaturation Protocol
Proper sample preparation is non-negotiable for preventing artifacts and ensuring migration strictly by molecular weight.
Detailed Protocol: Protein Denaturation for SDS-PAGE [57]
- Mix Sample with Loading Buffer: Combine your protein sample with an equal volume of 2X Laemmli SDS-PAGE loading buffer. The buffer should contain SDS (to denature and impart negative charge) and a reducing agent like DTT or β-mercaptoethanol (to break disulfide bonds).
- Denature by Heating: Cap the tubes securely and heat the samples at 98°C for 5 minutes. This step is critical for linearizing the proteins.
- Rapid Cooling: Immediately after heating, place the samples on ice to prevent gradual cooling and renaturation [57].
- Brief Centrifugation: Spin down the condensed liquid from the tube lids before loading.
- Load and Run Promptly: Load the samples onto the gel and initiate electrophoresis as quickly as possible to prevent reformation of secondary structures and diffusion.
Buffer and Electrical Parameter Optimization
- Use Fresh Buffers: Overused or improperly formulated running buffer can compromise protein separation and migration. It is good practice to prepare fresh running buffer before each run [57].
- Control Voltage and Temperature: Running the gel at excessively high voltage generates heat, which can cause protein denaturation, smiling bands, and smearing [24] [56]. If band distortion or smearing occurs, run the gel at a lower constant voltage. For heat-sensitive proteins, run the gel in a cold room or use a unit with a built-in cooling system [57].
The Scientist's Toolkit: Essential Reagents and Materials
Table 5: Research Reagent Solutions for SDS-PAGE
| Item | Function in Experiment |
|---|---|
| SDS (Sodium Dodecyl Sulfate) | An ionic detergent that denatures proteins and confers a uniform negative charge, allowing separation by molecular weight alone [57]. |
| Reducing Agent (DTT or β-mercaptoethanol) | Breaks intramolecular and intermolecular disulfide bonds, ensuring complete protein unfolding and linearization [57]. |
| Polyacrylamide Gel Components (Acrylamide, Bis-acrylamide) | Forms a crosslinked, mesh-like matrix that sieves proteins during electrophoresis. The ratio and concentration determine pore size [58]. |
| TEMED (Tetramethylethylenediamine) | A catalyst that, along with ammonium persulfate (APS), initiates the radical polymerization of acrylamide to form a gel [57]. |
| Tris-Glycine-SDS Running Buffer | Provides the ions necessary to carry current and maintains the pH required for proper protein migration and SDS binding [56] [57]. |
| Protein Loading Dye | Contains a tracking dye (e.g., bromophenol blue) to monitor migration, glycerol to increase sample density for well loading, and SDS to maintain denaturation [56]. |
| Precision Plus Protein Kaleidoscope Ladder | A pre-stained, size-determined standard used to monitor electrophoretic progress and estimate the molecular weight of unknown proteins. |
Experimental Workflow for Optimization
The following diagram visualizes the systematic, iterative process for troubleshooting and optimizing gel loading and electrophoresis conditions, directly addressing the core thesis of preventing sample loss.
FAQs and Troubleshooting Guides
▍Why are my protein bands curved ("smiling")?
"Smiling" bands, where bands curve upward at the edges, are primarily caused by uneven heat distribution during gel electrophoresis. This leads to faster migration in the warmer center of the gel compared to the cooler edges [29].
Solutions:
- Reduce Electrophoresis Voltage: Run the gel at a lower voltage for a longer duration to minimize heat generation [29] [59].
- Improve Heat Dissipation: Perform the electrophoresis in a cold room or use a cooling apparatus to ensure even temperature across the gel [59] [29].
- Check Buffer Concentration: Ensure the running buffer is prepared at the correct concentration, as an incorrect ionic strength can contribute to heating issues [29].
- Avoid Overloading: Reduce the amount of protein loaded per lane, as overloading can exacerbate heating and distortion [29].
▍What causes smearing and diffuse bands across the lanes?
Smearing appears as a continuous, non-discrete protein streak and typically points to issues with sample integrity or buffer composition [60].
Solutions:
- Prevent Protein Degradation: Always prepare samples on ice and include a cocktail of protease inhibitors in the lysis buffer to prevent protein breakdown by endogenous enzymes [60] [59].
- Reduce Sample Viscosity: Shear genomic DNA in the cell lysate by sonicating the sample or passing it through a small-gauge needle. DNA contamination increases viscosity, causing protein aggregation and smearing [10] [60].
- Optimize Salt Concentration: High salt concentrations (e.g., from lysis buffers) can cause band spreading and smearing. Dialyze samples or use a buffer exchange method to ensure the salt concentration does not exceed 100 mM [10] [59].
- Ensure Complete Denaturation: Use fresh reducing agents (like DTT or β-mercaptoethanol) and boil samples properly to fully denature proteins and prevent aggregate formation [29].
▍Why do my bands have poor resolution and appear fuzzy?
Poor resolution, making it difficult to distinguish sharp bands, is often related to problems with the gel itself or the electrophoresis conditions [59] [61].
Solutions:
- Ensure Proper Gel Polymerization: If hand-pouring gels, ensure the acrylamide has polymerized completely and homogeneously. Inconsistent gel formation leads to poor resolution. Consider using commercial pre-cast gels for better reproducibility [59] [29].
- Optimize Gel Percentage: Use a gel percentage appropriate for your protein's molecular weight. Lower percentage acrylamide gels (e.g., 8%) are better for resolving high molecular weight proteins, while higher percentages (e.g., 15%) are better for low molecular weight proteins [59] [61].
- Avoid Excess Detergent: High concentrations of nonionic detergents (Triton X-100, NP-40) in the sample can interfere with SDS binding. Maintain an SDS-to-nonionic detergent ratio of at least 10:1 [10].
- Load an Appropriate Amount of Protein: Overloading the well with too much protein will cause bands to lose resolution and appear blurred. Reduce the protein load per lane [10] [60].
Troubleshooting Data Tables
The following tables summarize common problems, their causes, and proven solutions for achieving sharp, high-resolution protein bands.
Table 1: Troubleshooting "Smiling" Bands
| Problem Cause | Solution | Key Experimental Protocol |
|---|---|---|
| High voltage generates excessive heat | Lower voltage; run gel longer [29] [59]. | Run mini-gels at 80-120V instead of higher voltages. |
| Inefficient heat dissipation | Run electrophoresis in a cold room or with a cooling unit [59] [29]. | Submerge the gel tank in an ice water bath for the duration of the run. |
| Incorrect buffer concentration | Prepare running buffer according to protocol [29]. | For Tris-Glycine-SDS buffer, standard final concentration is 25 mM Tris, 192 mM Glycine, 0.1% SDS. |
Table 2: Troubleshooting Smearing and Diffuse Bands
| Problem Cause | Solution | Key Experimental Protocol |
|---|---|---|
| Protein degradation | Keep samples on ice; add protease inhibitors [60] [59] [23]. | Add 1 mM PMSF and a protease inhibitor cocktail to lysis buffer immediately before use. |
| Genomic DNA contamination | Sonicate sample or treat with DNase [10] [60]. | Sonicate lysate on ice with 3 pulses of 10 seconds each. |
| High salt concentration in sample | Dialyze sample or use desalting columns [10]. | Use a slide-a-lyzer dialysis device to reduce salt to <100 mM. |
| Incomplete protein denaturation | Add fresh reducing agent; boil samples [29] [59]. | Add 50 mM DTT or 2.5% β-mercaptoethanol and heat at 95°C for 5-10 minutes. |
Table 3: Troubleshooting Poor Band Resolution
| Problem Cause | Solution | Key Experimental Protocol |
|---|---|---|
| Improper gel polymerization | Ensure complete gel polymerization; use pre-cast gels [59] [29]. | Add 0.1% (v/v) TEMED and 0.1% (w/v) ammonium persulfate to catalyze polymerization. |
| Unsuitable gel percentage | Match gel percentage to protein size [59] [61]. | Use 8-10% gels for proteins >100 kDa; 12% for 50-100 kDa; 15% for <50 kDa. |
| High nonionic detergent | Maintain high SDS-to-detergent ratio; use detergent removal kits [10]. | Keep the ratio of SDS to nonionic detergent (e.g., Triton X-100) at 10:1 or greater. |
| Too much protein loaded | Reduce protein load per lane [10] [60]. | For a mini-gel, load 10-20 µg of total cell lysate per lane as a starting point. |
Experimental Workflow for Artifact Prevention
The diagram below outlines a logical, step-by-step workflow to diagnose and solve the three common artifacts discussed.
The Scientist's Toolkit: Research Reagent Solutions
Table 4: Essential reagents and materials for preventing common western blot artifacts.
| Item | Function in Prevention |
|---|---|
| Protease Inhibitor Cocktail | Prevents protein degradation by inhibiting serine, cysteine, and metalloproteases, reducing smearing [23]. |
| DNase I | Shears genomic DNA to reduce sample viscosity, preventing protein aggregation and smearing [60]. |
| Dithiothreitol (DTT) | A fresh reducing agent that breaks disulfide bonds to ensure full protein denaturation and prevent aggregates [59] [29]. |
| Slide-A-Lyzer Dialysis Device | Reduces high salt concentrations in samples via buffer exchange, preventing salt-induced smearing and distorted bands [10]. |
| Pre-cast Gels | Ensure consistent and complete acrylamide polymerization, providing uniform pore size for optimal band resolution [59]. |
| Tris-Glycine-SDS Running Buffer | The standard buffer for SDS-PAGE; correct preparation and pH are critical for proper conductivity and heat management [29]. |
| Prestained Protein Marker | Allows visual monitoring of electrophoresis progress and transfer efficiency, helping to diagnose "smiling" and transfer issues [29]. |
Frequently Asked Questions (FAQs)
Q1: Why do my protein samples migrate poorly or spill out of the wells? Poor migration or sample spillage is often due to suboptimal gel composition, incorrect buffer pH, or improper sample preparation. Using a stacking gel with a lower percentage of acrylamide and a different pH (pH 6.8) above the main separating gel helps concentrate the proteins into a sharp band before they enter the separating gel, ensuring they enter the wells cleanly [62].
Q2: How does the voltage setting affect my protein separation? Applying too high a voltage at the start of the run can cause excessive heat, leading to distorted protein bands and poor resolution. It is recommended to use a lower voltage (e.g., 80V) while the samples are in the stacking gel, and then increase the voltage (e.g., 120V) for the separation phase once the proteins have entered the main gel [63].
Q3: My sample buffer contains SDS and reducing agents. Why is this critical? SDS (Sodium Dodecyl Sulfate) denatures proteins and confers a uniform negative charge, allowing separation based primarily on molecular weight. Reducing agents like β-mercaptoethanol or DTT break disulfide bonds, fully unfolding the proteins. This ensures accurate migration and prevents aggregation that could trap protein in the well [62].
Q4: What is the function of the tracking dye in the loading buffer? Small anionic dyes like bromophenol blue serve two key functions: they make the sample dense enough to sink into the well, and they provide a visible migration front to monitor the progress of the electrophoresis run [62].
Troubleshooting Guide: Protein Migration Issues
The following table outlines common issues, their causes, and recommended solutions to prevent proteins from migrating out of wells or spreading poorly.
| Problem | Possible Causes | Recommended Solutions |
|---|---|---|
| Proteins spilling between wells | Damaged or crooked well comb; poorly polymerized gel. | Ensure comb is clean, straight, and fully inserted; allow adequate time for gel polymerization [63]. |
| Protein bands are smeared | Gel polymerization issues; voltage too high; protein degradation. | Prepare fresh gels and reagents; use recommended voltage settings; add fresh protease inhibitors to samples [43] [63]. |
| Uneven migration across the gel | Insufficient or uneven buffer levels; electrode contact issues. | Ensure running buffer fully covers the gel and that electrodes are properly connected to the apparatus [63]. |
| Protein precipitates in well | Insufficient detergent in lysis or loading buffer; protein aggregation. | Ensure sample buffer contains SDS and that the sample was properly heated and denatured [62]. |
| High background noise | Incomplete blocking; non-specific antibody binding. | Optimize blocking conditions with 5% BSA or non-fat milk; validate antibody specificity and concentration [43]. |
Optimized Experimental Protocols and Compositions
Sample Preparation Protocol
Proper sample preparation is the first critical step to prevent protein loss and ensure clean entry into the gel.
- Lysis Buffer Selection: Choose a lysis buffer based on your protein of interest and its subcellular localization. RIPA buffer is effective for whole-cell and membrane-bound proteins [62].
- Add Protease/Phosphatase Inhibitors: Add these inhibitors freshly to the lysis buffer to prevent protein degradation and maintain post-translational modifications. Common inhibitors include PMSF (serine/cysteine proteases) and sodium orthovanadate (tyrosine phosphatases) [64] [62].
- Protein Quantification: Use the BCA assay for accurate protein quantification to ensure equal loading.
- Sample Denaturation: Mix protein lysate with an equal volume of 2x Laemmli buffer [62].
Gel Preparation and Electrophoresis Parameters
The composition of the gel and the electrical settings directly control the efficiency of protein entry and separation.
- Gel Percentage Selection: Choose the appropriate acrylamide concentration for your target protein's size [62].
- Stacking and Separating Gel Formulations: The table below provides standard recipes for a mini-gel system.
- Electrophoresis Settings: Use a two-stage voltage setting for optimal resolution.
Table: Gel Compositions for SDS-PAGE
| Reagent | 10% Separating Gel (for ~16-68 kDa) | 5% Stacking Gel |
|---|---|---|
| H₂O | 5.9 mL | 2.7 mL |
| 30% Acrylamide/Bis | 5.0 mL | 670 µL |
| Tris Buffer | 3.8 mL of 1.5M Tris, pH 8.8 | 500 µL of 1.0M Tris, pH 6.8 |
| 10% SDS | 150 µL | 40 µL |
| 10% APS | 150 µL | 40 µL |
| TEMED | 6 µL | 3 µL |
Workflow for Optimal Protein Migration
The following diagram illustrates the critical steps and decision points in the sample preparation and loading workflow to prevent issues with protein migration.
The Scientist's Toolkit: Key Research Reagent Solutions
The following table details essential materials and their functions for successful and reproducible protein electrophoresis.
| Reagent / Material | Function / Explanation |
|---|---|
| RIPA Lysis Buffer | Effective for extracting whole-cell and membrane-bound proteins; contains ionic and non-ionic detergents for comprehensive lysis [62]. |
| Protease Inhibitor Cocktail | A mixture of inhibitors (e.g., AEBSF, leupeptin) that prevents protein degradation by various protease classes during and after cell lysis [64] [43]. |
| Laemmli Sample Buffer (2x) | Denatures proteins with SDS, reduces disulfide bonds with 2-mercaptoethanol, and provides density and a visible dye for loading [62]. |
| Acrylamide/Bis Solution (30%) | The monomer solution used to create the polyacrylamide gel matrix, the pore size of which determines the separation range of proteins [62]. |
| TEMED & APS (Ammonium Persulfate) | Catalyzes the polymerization of acrylamide to form a stable gel. APS initiates the reaction, and TEMED accelerates it [62]. |
| Tris-Glycine-SDS Running Buffer | Provides the conductive medium and ions necessary for electrophoresis, while the SDS helps maintain protein denaturation during the run. |
| Pre-stained Protein Ladder | A mixture of proteins of known molecular weight, visible by color during the run, allowing for monitoring of progress and estimation of protein size. |
Validating Sample Integrity: Orthogonal Methods and Quality Assessment
Frequently Asked Questions (FAQs)
Q1: Why do my protein samples migrate out of the wells before I even start running the gel?
This is a classic issue caused by a delay between loading the samples and applying the electric current. Without the immediate application of voltage, the proteins begin to diffuse haphazardly out of the wells instead of moving in a cohesive band towards the anode. The solution is to minimize this time lag. Start the electrophoresis run as soon as you finish loading all your samples. If you have a large number of samples to load, consider loading faster or processing fewer gels at once to reduce the diffusion window [66].
Q2: My protein bands are smeared rather than sharp. What could be the cause?
Smeared bands can result from several factors related to sample preparation and gel running conditions [4]. The most common causes and their solutions are summarized in the table below.
| Possible Cause | Solution |
|---|---|
| Incomplete Denaturation [4] | Add fresh reducing agent to the sample buffer and boil samples for 5 minutes at 100°C [4]. |
| High Ionic Strength [4] | Keep salt concentrations (e.g., sodium chloride) below 100-500 mM. Dialyze or desalt samples if necessary [10] [4]. |
| High Voltage [66] | Run the gel at a lower voltage (e.g., 10-15 V/cm gel length) for a longer duration to prevent overheating [66]. |
| DNA Contamination [10] | Shear genomic DNA in cell lysates by sonication or filtration to reduce sample viscosity [10]. |
Q3: The bands on the edges of my gel are distorted. How can I prevent this?
This is known as the "edge effect." It occurs when the outermost wells on the left and right sides of the gel are left empty, leading to uneven electric field distribution and heat across the gel. To prevent this, avoid leaving any wells empty. Load your protein ladder on one end and, if you have unused wells, load a dummy sample like a control lysate or Laemmli buffer into the remaining wells to ensure even current flow [66].
Troubleshooting Guide: Common SDS-PAGE Issues
The following table outlines other frequent problems, their causes, and corrective actions to ensure high-quality results.
| Issue Observed | Possible Cause | Troubleshooting Action |
|---|---|---|
| Weak or Faint Bands | Protein concentration too low or too high [4]. | Accurately determine protein concentration using a Bradford, Lowry, or BCA assay before loading. Optimize the loading amount [32] [4]. |
| 'Smiling' Bands (curved upwards) | Gel and buffer overheated during electrophoresis [66]. | Run the gel at a lower voltage, in a cold room, or use an ice pack in the tank to dissipate heat [66]. |
| Poor Band Resolution | Gel run time too short; acrylamide concentration too high [66]. | Run the gel until the dye front nears the bottom. Use a lower % acrylamide gel, especially for high molecular weight proteins [66]. |
| High Background on Western Blot | Antibody concentration too high; insufficient blocking or washing [10]. | Titrate antibodies to optimal concentration. Ensure adequate blocking time (≥1 hr at RT) and increase number/volume of washes with buffer containing 0.05% Tween-20 [10]. |
| No Signal on Western Blot | Inefficient protein transfer to membrane [10]. | Stain the gel post-transfer with Coomassie to check for residual protein. Use prestained markers to verify transfer. Optimize transfer time and voltage [10]. |
Experimental Workflow and Critical Control Points
The diagram below maps the key stages from sample preparation to final analysis, highlighting critical control points (CCP) where quality checks are essential to prevent issues like pre-run sample migration.
Experimental Workflow with Critical Control Points
Detailed Protocols for Key Steps
1. Protein Quantification and Sample Normalization (CCP1)
- Principle: Ensure equal protein loading across all lanes for accurate downstream comparison and analysis [32].
- Procedure:
- Extract proteins using an appropriate lysis buffer (e.g., RIPA buffer for many applications).
- Perform a colorimetric protein assay, such as the Bradford assay. The dye Coomassie brilliant blue G-250 binds to proteins, and the absorbance shift is measured with a spectrophotometer [32].
- Generate a standard curve using known concentrations of a standard protein like BSA.
- Normalize all sample concentrations to the lowest concentration by diluting with cell lysis buffer.
- Mix the normalized protein extract with an equal volume of 2X Laemmli buffer (60 mM Tris-HCl pH 6.8, 20% glycerol, 2% SDS, 4% beta-mercaptoethanol, 0.01% bromophenol blue) [32].
- Critical Note: Using fresh reducing agents like beta-mercaptoethanol or DTT is crucial for breaking disulfide bonds to ensure proteins are fully denatured and migrate strictly by molecular weight [32] [4].
2. Gel Loading and Electrophoresis (CCP2)
- Principle: Load samples efficiently and begin electrophoresis immediately to prevent diffusion from wells [66].
- Procedure:
- Ensure the gel is properly seated in the apparatus and the tank is filled with running buffer (e.g., Tris-glycine-SDS buffer).
- Briefly centrifuge loaded samples to bring all liquid to the bottom of the tube.
- Load the molecular weight ladder into the first well.
- Load experimental samples into subsequent wells. Do not leave any wells empty to prevent the edge effect [66].
- Immediately after the last sample is loaded, secure the lid and apply a constant voltage (e.g., 150V for a mini-gel) to begin electrophoresis [66].
- Stop the run when the bromophenol blue dye front reaches the bottom of the gel.
The Scientist's Toolkit: Essential Research Reagents
The following table details key reagents used in SDS-PAGE and Western blotting to maintain experimental integrity.
| Reagent | Function | Key Considerations |
|---|---|---|
| SDS (Sodium Dodecyl Sulfate) | A potent anionic detergent that denatures proteins and confers a uniform negative charge, allowing separation by molecular weight only [67] [32]. | Must be in excess (typically 1-2% in sample buffer) to fully coat proteins [67]. |
| Beta-Mercaptoethanol / DTT | Reducing agents that break disulfide bonds within and between protein subunits, ensuring complete unfolding [32] [4]. | Use fresh for each preparation; final concentration of DTT should be <50 mM [32] [10]. |
| Laemmli Buffer | Sample buffer containing SDS, glycerol, a reducing agent, and bromophenol blue to prepare proteins for loading and electrophoresis [32]. | Glycerol adds density; bromophenol blue is a tracking dye [32]. |
| Polyacrylamide Gel | A mesh-like matrix that acts as a molecular sieve. Proteins are separated as they migrate through it under an electric field [67] [32]. | Pore size is altered by acrylamide % (e.g., 12% for 40-100 kDa proteins). A stacking gel (4%) helps concentrate samples [32] [4]. |
| PVDF/Nitrocellulose Membrane | Porous membrane to which separated proteins are transferred (blotted) for antibody probing in Western blotting [32]. | PVDF has higher protein binding capacity and chemical resistance. Must be activated in methanol before use [32]. |
| Tris-Glycine Buffer | The standard running buffer for discontinuous SDS-PAGE. The pH difference between stacking (pH ~6.8) and resolving (pH ~8.8) gels creates a stacking effect for sharp bands [32]. | Maintains optimal pH and provides ions for current flow. Incorrect preparation leads to poor resolution [66] [32]. |
In protein-based research and therapeutic development, ensuring sample integrity is a critical prerequisite for obtaining reliable and reproducible data. A primary challenge faced at the bench is the failure of protein samples to migrate correctly during SDS-PAGE, often manifesting as material remaining in the wells. This issue can derail experiments and lead to significant data misinterpretation. This guide provides a comparative analysis of three foundational analytical techniques—SDS-PAGE, Size Exclusion Chromatography (SEC), and Dynamic Light Scattering (DLS)—to equip researchers with the knowledge to prevent such issues and accurately assess protein quality. By understanding the orthogonal information provided by these methods, scientists can build a robust strategy to diagnose sample problems, optimize preparation protocols, and ensure the integrity of their protein samples before proceeding to downstream applications.
Understanding the Core Technologies
This section outlines the fundamental principles, strengths, and limitations of SDS-PAGE, SEC, and DLS.
Sodium Dodecyl Sulfate-Polyacrylamide Gel Electrophoresis (SDS-PAGE)
- Principle: SDS-PAGE is a denaturing electrophoresis technique that separates proteins based primarily on their molecular mass [68]. The anionic detergent SDS denatures proteins and confers a uniform negative charge, masking the protein's inherent charge. When an electric field is applied, proteins migrate through a polyacrylamide gel matrix, which acts as a molecular sieve; smaller proteins migrate faster than larger ones [68].
- Role in Integrity Assessment: It is a fundamental first-line tool for assessing protein purity and integrity [69]. It can reveal the presence of contaminants, proteolytic fragments, and high-molecular-weight aggregates too large to enter the gel, which appear as material stuck in the wells [70].
- Key Outputs: Band patterns indicating molecular weight, purity, and the presence of degradation or aggregation.
Size Exclusion Chromatography (SEC)
- Principle: SEC separates proteins in their native or near-native state based on their hydrodynamic volume (size and shape) as they pass through a porous resin [71]. Larger molecules elute first because they are excluded from the pores, while smaller molecules that can enter the pores have a longer path and elute later.
- Role in Integrity Assessment: SEC is a high-resolution "gold standard" for quantifying protein homogeneity and aggregation state under solution conditions [71]. It can resolve monomeric protein from smaller fragments or larger soluble aggregates, providing a quantitative profile of the species present in a sample.
- Key Outputs: Chromatogram with peaks corresponding to different oligomeric states (aggregates, monomer, fragments); allows for quantification of monomeric purity.
Dynamic Light Scattering (DLS)
- Principle: DLS measures the Brownian motion of particles in a solution, which is related to their size [72]. The fluctuations in scattered light intensity are used to calculate a diffusion coefficient, which is then converted into a hydrodynamic radius via the Stokes-Einstein equation [72] [69].
- Role in Integrity Assessment: DLS is a rapid, non-destructive technique for assessing sample monodispersity (the uniformity of size distribution) [69]. The Polydispersity Index (PDI) is a key metric; a low PDI (<10%) indicates a monodisperse sample, while a high PDI suggests a mixture of sizes, such as the presence of aggregates [72] [71].
- Key Outputs: Hydrodynamic diameter, Polydispersity Index (PDI), and size distribution profile.
Table 1: Comparative Overview of SDS-PAGE, SEC, and DLS
| Feature | SDS-PAGE | SEC | DLS |
|---|---|---|---|
| Primary Information | Molecular weight, purity, integrity | Hydrodynamic size, aggregation state | Hydrodynamic size, monodispersity |
| Sample State | Denatured | Native / Near-native | Native |
| Throughput | Medium | Low to Medium | High |
| Sample Consumption | Low (µg) | Medium (µg-mg) | Very Low (µL) |
| Quantification | Semi-quantitative (densitometry) | Quantitative | Semi-quantitative |
| Detection of Aggregates | Yes (if large enough) | Yes | Yes |
| Key Limitation | Denaturing conditions may disrupt non-covalent aggregates | Potential for interaction with column resin | Less effective for highly polydisperse mixtures |
Troubleshooting Guides
FAQ 1: Why are my protein samples stuck in the wells during SDS-PAGE?
This is a common issue indicating poor sample integrity or preparation.
- Potential Cause 1: Protein Aggregation or Precipitation. Insoluble protein complexes are too large to enter the gel matrix [70].
- Solution:
- Ensure proper sample preparation by including reducing agents like DTT or β-mercaptoethanol in your lysis and loading buffers to break disulfide bonds [70].
- Heat your samples adequately (typically 95°C for 5-10 minutes) to denature proteins and dissolve aggregates [70].
- For hydrophobic proteins, consider adding urea (4-8 M) to the lysis buffer to improve solubility [70].
- Centrifuge the heated sample briefly before loading to pellet any insoluble material.
- Solution:
- Potential Cause 2: Overloading the Well. Loading too much protein can lead to clumping at the well entrance [70].
- Solution: A good practice is to load no more than 10-20 µg of protein per well and do not fill the well beyond 3/4 of its capacity [70].
- Potential Cause 3: Inadequate Well Flushing.
- Solution: Urea from denaturing gels can leach and form a dense layer in wells. Flush wells thoroughly with running buffer immediately before loading the samples [73].
- Potential Cause 4: Interfering Substances.
- Solution: High salt or detergent concentrations can distort migration. Ensure your sample buffer is correctly formulated with sufficient glycerol (or sucrose) to help the sample sink properly into the well [70].
FAQ 2: My SDS-PAGE looks clean, but my DLS shows high polydispersity. Why the discrepancy?
This highlights the power of using orthogonal methods.
- Explanation: SDS-PAGE is a denaturing technique. It will miss soluble, non-covalent aggregates that are disrupted by SDS and reducing agents. DLS, performed in native conditions, is highly sensitive to the presence of these aggregates, which scatter light more intensely than monomers, leading to a high PDI reading [71].
- Action Plan: Use SEC to confirm the DLS result. SEC can separate and quantify the relative amounts of monomer and soluble aggregates, providing a direct visual confirmation of the heterogeneity detected by DLS [71].
FAQ 3: How can I quickly check if my purified protein is monodisperse before a time-sensitive experiment?
- Recommended Protocol: DLS is the ideal tool for this purpose due to its speed and low sample consumption.
- Equipment: Standard DLS instrument (e.g., Anton Paar Litesizer, Wyatt DynaPro).
- Sample Preparation: Ensure your protein is in a clear, dust-free buffer. Centrifuge the sample at high speed (e.g., 14,000 x g for 10 minutes) to remove any dust or large particulates that can interfere with the measurement.
- Measurement: Pipette a small volume (as low as 2-12 µL) into a clean cuvette. Set the instrument to the appropriate temperature.
- Data Interpretation: Check the Polydispersity Index (PDI). A PDI value below 0.1 (or 10%) is generally indicative of a monodisperse sample [72]. Also, inspect the correlation function; a smooth, single exponential decay suggests a homogeneous sample, while a multi-phasic decay indicates a mixture of sizes [72].
Experimental Protocols for Integrity Assessment
Protocol: Assessing Protein Purity and Integrity by SDS-PAGE
This protocol is adapted from standard procedures for SDS-PAGE analysis [68] [71].
- Sample Preparation:
- Mix purified protein with SDS-PAGE loading buffer (e.g., Laemmli buffer) containing a reducing agent like DTT.
- Heat the samples at 95°C for 5-10 minutes to ensure complete denaturation.
- Briefly centrifuge to collect condensation and any insoluble debris.
- Gel Electrophoresis:
- Staining and Analysis:
- Stain the gel with Coomassie Blue to visualize protein bands (sensitivity ~100 ng) [69]. For higher sensitivity, use silver stain (~1 ng) or fluorescent stains [69].
- Interpret the results: A pure, intact protein should show a single, sharp band at the expected molecular weight. Multiple bands suggest degradation, while smearing or material in the well indicates aggregation or improper preparation [70].
Protocol: Analyzing Aggregation State by Size Exclusion Chromatography (SEC)
This protocol is based on standard SEC practices for protein analysis [71].
- System Setup:
- Use an HPLC or FPLC system equipped with a UV detector (e.g., ÄKTA system).
- Select an appropriate SEC column (e.g., Superdex Increase series from Cytiva) based on the separation range required for your protein.
- Equilibrate the column with at least 2 column volumes of your desired buffer (e.g., PBS).
- Sample Preparation and Injection:
- Clarify the protein sample by centrifugation (e.g., 14,000 x g for 10 minutes).
- Inject a defined volume (e.g., 50-100 µL) of sample onto the column. The protein concentration should be optimized to avoid overloading.
- Chromatography and Data Analysis:
- Run an isocratic elution with the equilibration buffer at a controlled, slow flow rate (e.g., 0.5-1.0 mL/min) for optimal resolution.
- Monitor the eluent by UV absorbance at 280 nm.
- Analyze the chromatogram: A single, symmetric peak indicates a homogeneous sample. An earlier-eluting peak suggests the presence of soluble aggregates, while a later-eluting peak may indicate protein fragments [71].
The following workflow diagram illustrates the decision-making process for diagnosing sample integrity issues using these three techniques:
Essential Research Reagent Solutions
The following table lists key materials and reagents critical for successful sample integrity analysis.
Table 2: Key Reagents and Materials for Protein Integrity Analysis
| Item | Function / Application | Key Considerations |
|---|---|---|
| SDS-PAGE Loading Buffer | Denatures proteins and provides charge for electrophoresis | Must contain SDS; include reducing agents (DTT) for reduced conditions; ensure adequate glycerol for well loading [68] [70]. |
| Polyacrylamide Gels | Matrix for size-based separation | Choose percentage based on target protein size; gradient gels offer wider separation range [68]. |
| SEC Columns | Size-based separation of native proteins | Select pore size (separation range) appropriate for your protein and its potential aggregates [71]. |
| DLS Cuvettes | Hold sample for light scattering measurement | Must be clean and dust-free; small volume cuvettes (e.g., 12 µL) conserve precious samples [72]. |
| High-Purity Sample Tubes | Sample storage and preparation | Use high-quality polypropylene tubes to prevent sample loss, adsorption, or leaching of contaminants that can cause "hang-up" in gels [74] [73]. |
| Buffers and Additives | Maintain protein solubility and stability | Optimize pH, salt concentration; include stabilizers if needed (e.g., amino acids, detergents) to prevent aggregation during analysis. |
Preventing protein samples from migrating out of wells is more than just a troubleshooting exercise—it is a fundamental aspect of ensuring data quality. No single analytical method provides a complete picture of protein integrity. SDS-PAGE is excellent for detecting covalent impurities and severe aggregation but is blind to native-state oligomers. SEC provides a quantitative profile of soluble aggregates and fragments, while DLS offers a rapid, sensitive check for monodispersity and the early onset of aggregation. By integrating these orthogonal techniques, as outlined in the troubleshooting guides and workflows above, researchers can proactively diagnose issues, optimize their sample preparation protocols, and have high confidence in the integrity of their protein samples before committing to costly and time-consuming downstream experiments and drug development processes.
Correlating Sample Preparation Quality with Downstream Analytical Results
The integrity of any analytical experiment in biochemistry and drug development is fundamentally dependent on the quality of sample preparation. Suboptimal preparation can lead to a cascade of failures in downstream analyses, from distorted protein bands in electrophoresis to inaccurate quantitation in chromatographic assays. This technical support center focuses on identifying, troubleshooting, and preventing common sample preparation errors, with a particular emphasis on the thesis of preventing protein samples from migrating out of wells before running research. The following guides and FAQs provide actionable protocols and solutions for researchers and scientists.
Troubleshooting Guide: Sample Preparation and Downstream Effects
The table below summarizes common issues, their potential causes from sample preparation, and their manifestations in downstream analytical techniques like SDS-PAGE and Western Blot.
Table 1: Troubleshooting Guide Linking Sample Preparation to Analytical Results
| Observed Problem | Primary Sample Preparation Cause | Downstream Effect | Solution |
|---|---|---|---|
| Smeared Bands | Excessive salt in sample (≥100 mM) [10] [75] | Streaking, distorted bands, lane widening in SDS-PAGE [10] | Desalt via dialysis, centrifugal filters, or desalting columns [10] |
| Protein Samples Migrated Out of Well Before Run | Long delay between loading samples and applying electric current [76] | Empty or incomplete wells, diffused samples [76] | Start electrophoresis immediately after loading; load samples faster or run fewer samples per gel [76] |
| Poor Band Resolution | Insufficient SDS in sample buffer [75] | Unclear, overlapping protein bands [76] | Add SDS to upper buffer chamber (0.1-0.4% final concentration) [75] |
| Viscous Samples / Protein Aggregation | Genomic DNA contamination in cell lysate [10] | Narrow, uninterpretable lanes; affects protein migration [10] | Shear genomic DNA by sonication or filtration to reduce viscosity [10] |
| Weak or No Signal | Protein degradation from repeated freeze-thaw cycles [77] | Faint or absent bands in Western Blot [10] | Aliquot samples for single use; store at -80°C [77] |
| Nonspecific or Diffuse Bands | Too much protein loaded per lane [10] [75] | Poor resolution, smearing in SDS-PAGE and Western Blot [10] [75] | Reduce the amount of sample loaded per lane [10] |
| High Background (Western Blot) | Incompatible or insufficient blocking buffer [10] | High background noise obscuring target signal [10] | Optimize blocking buffer (e.g., use BSA for phosphoproteins); extend blocking time [10] |
| Sample Loss (LC/MS) | Nonspecific adsorption to container walls [78] [79] | Low analyte recovery, inaccurate quantification [78] | Use low-adsorption polypropylene tubes; add carrier proteins (e.g., BSA) or surfactants to sample [78] |
Frequently Asked Questions (FAQs)
1. Why did my protein sample migrate out of the well before I even started the electrophoresis run?
This occurs due to sample diffusion from the wells during the lag time between loading and applying power. The electric current is necessary to ensure streamlined migration of the negatively charged protein-SDS complexes into the gel matrix. Without it, samples will diffuse haphazardly out of the wells [76].
- Solution: Minimize the time between loading your first sample and starting the run. If you have a large number of samples, consider loading faster or running fewer samples at once [76].
2. How can I prevent sample loss due to adsorption to my tubes and vials, especially for low-concentration samples?
Nonspecific adsorption (NSA) to container walls is a major issue for trace-level analysis. The mechanism depends on the container material: glass can cause both ionic and hydrophobic adsorption, while plastics like polypropylene (PP) primarily cause hydrophobic adsorption [78] [79].
- Solutions:
- Container Choice: For basic compounds, use polypropylene containers to avoid ionic adsorption to glass silanols. For acidic/neutral compounds, both glass and PP can be used, but adsorption must be managed [78].
- Additives: Add a low-concentration (0.1%) non-ionic surfactant or an organic solvent (e.g., 10-50% methanol) to the sample solution to compete for hydrophobic binding sites [78] [79].
- Saturation: Use a carrier protein like Bovine Serum Albumin (BSA) to saturate nonspecific binding sites on the container surface [78].
3. My SDS-PAGE bands are smiling (curved upwards). What caused this and how do I fix it?
"Smiling" bands are typically caused by excessive heat generation during electrophoresis. This heat can cause the gel to expand slightly, leading to uneven migration rates across the gel [76] [75].
- Solution: Run the gel at a lower voltage for a longer duration. You can also perform the electrophoresis in a cold room or use a gel tank that allows for external cooling with an ice pack [76].
4. How do repeated freeze-thaw cycles affect my protein samples, and what is the best way to store them?
Repeated freeze-thaw cycles can degrade proteins, leading to cleavage, aggregation, and loss of function or antigenicity. This manifests as weak signal, extra bands, or smearing in downstream assays [77] [10].
- Solution: Always aliquot samples into single-use volumes prior to the first freeze. Store aliquots at -80°C. Avoid storing samples at -20°C for more than six months for long-term preservation [77].
Key Experimental Protocols
Protocol: Preventing Sample Diffusion in SDS-PAGE
Objective: To ensure proteins enter the gel matrix correctly without pre-run diffusion. Materials: Prepared SDS-PAGE gel, protein samples, running buffer, power supply. Procedure:
- Prepare all samples and thaw all reagents completely before beginning.
- Carefully load your samples into the wells as quickly as possible.
- Crucially, immediately after the last sample is loaded, place the lid on the tank and activate the power supply. Do not pause after loading [76].
- Run the gel at the recommended constant voltage (e.g., 150V for mini-gels). Using a lower voltage (e.g., 80-120V) can also minimize heat generation if diffusion is accompanied by smiling bands [76].
Protocol: Sample Preparation for ELISA to Minimize Variability
Objective: To obtain clean, reproducible samples for accurate ELISA results. Materials: Cell culture, ice-cold PBS, extraction buffer, centrifuge, aliquoting tubes. Procedure (for Cell Extracts):
- Place tissue culture plates on ice and wash cells with ice-cold PBS [77].
- Add extraction buffer (e.g., 0.5 mL per 100 mm plate) and scrape cells. Collect the lysate into a chilled tube [77].
- Vortex the tube briefly and incubate on ice for 15-30 minutes [77].
- Centrifuge at >13,000 rpm for 10 minutes at 4°C to pellet cell debris [77].
- Immediately transfer the supernatant (containing your protein) to new, pre-chilled tubes and aliquot them. Avoid creating foam [77].
- Store aliquots at -80°C. Avoid repeated freeze-thaw cycles by using a fresh aliquot for each experiment [77].
The Scientist's Toolkit: Essential Research Reagents
Table 2: Key Reagent Solutions for Quality Sample Preparation
| Reagent/Material | Function | Key Consideration |
|---|---|---|
| Polypropylene Tubes | Low-adsorption container for sample storage [78] [79] | Preferred over glass for basic compounds to minimize ionic adsorption [78]. |
| Bovine Serum Albumin (BSA) | Blocking agent; carrier protein [78] [10] | Saturates nonspecific binding sites on membranes and container walls [78]. |
| Non-ionic Surfactant (e.g., Tween 20) | Additive to reduce hydrophobic adsorption [78] [10] | Use at ~0.1% in sample or buffer; high concentrations can interfere with assays [78]. |
| Dithiothreitol (DTT) | Reducing agent for disulfide bonds [10] [75] | Prepare fresh; final concentration for SDS-PAGE should be <50 mM [10]. |
| Protease Inhibitor Cocktails | Prevents protein degradation during extraction [10] | Must be added to lysis/extraction buffers immediately before use. |
| SDS (Sodium Dodecyl Sulfate) | Denaturing agent for proteins [75] | Ensures uniform negative charge on proteins for electrophoresis [75]. |
| Desalting Columns / Dialysis Devices | Removes excess salts and contaminants [10] | Critical for samples in high-salt lysis buffers (e.g., RIPA) before electrophoresis [10]. |
Visualization of Sample Preparation Workflow and Pitfalls
The following diagram illustrates the critical decision points in a general protein sample preparation workflow and how errors at each stage lead to specific downstream analytical failures.
Diagram 1: Sample preparation workflow and pitfalls.
Meticulous sample preparation is not merely a preliminary step but the cornerstone of reliable and reproducible analytical data. By understanding the correlations between common preparation errors—such as delayed gel loading, improper container use, and inadequate storage—and their downstream consequences, researchers can proactively troubleshoot and optimize their protocols. Adhering to the detailed guidelines, standardized protocols, and reagent management strategies outlined in this technical support center will empower scientists to prevent critical failures, thereby safeguarding their research outcomes and accelerating progress in drug development and diagnostic applications.
Troubleshooting Guides
Guide 1: Addressing Sample "Hang-Up" in Gel Wells
Problem: Protein or nucleic acid samples remain in the wells of agarose or acrylamide gels during electrophoresis and fail to migrate, resulting in lost data and failed experiments.
Why This Happens:
- Incomplete Sample Resuspension: Precipitated nucleic acids or proteins that are not thoroughly resuspended after ethanol precipitation can cause sample hang-up [73].
- Improper Gel Well Flushing: Wells clogged with unpolymerized acrylamide fragments or dense urea solution can physically block sample entry [73].
- Problematic Sample Tubes: Certain tubes may contain residues that interact with the sample, causing it to stick [73].
- Carrier Interference: The use of specific carriers, like linear acrylamide, to aid in precipitating dilute nucleic acid samples can lead to samples remaining in wells [73].
Solution: A Step-by-Step Troubleshooting Protocol
| Step | Action | Detailed Methodology | Expected Outcome |
|---|---|---|---|
| 1 | Resuspend Pellet Thoroughly | After centrifugation, remove supernatant. Wash pellet with 70-80% cold ethanol, vortex, and centrifuge again. Resuspend in gel loading buffer using the largest possible volume. Heat to 85–95°C for 2–10 minutes to denature strands. Vortex, triturate (pipette up and down), and repeat heating if needed [73]. | A clear, homogenous solution with no visible particles. |
| 2 | Flush Gel Wells | Prior to loading the sample, use a pipettor or syringe with an 18-gauge needle to flush each well thoroughly with running buffer from the reservoir [73]. | Wells are clear of physical obstructions. |
| 3 | Verify Sample Integrity | Use a Geiger counter for radioactive samples to monitor empty tubes after loading, ensuring complete transfer [73]. For proteins, use alternative quantification methods. | Confirmation that the entire sample was loaded into the well. |
| 4 | Change Sample Tube Brand | If hang-up persists, aliquot samples into a different brand or batch of sample tubes. Autoclaved silanized tubes can sometimes leave residue [73]. | Elimination of tube-specific contamination as a cause. |
| 5 | Re-evaluate Carriers & Additives | If using linear acrylamide as a carrier, note it can cause hang-up. Consider alternative carriers like RNA or DNA, or use gel-purified probes to remove unincorporated nucleotides [73]. | Reduced interference from co-precipitants. |
Guide 2: Mitigating Human Errors in Sample Preparation
Problem: Inaccurate or unreliable analytical results due to manual errors during the sample preparation phase.
Why This Happens:
- Calculation & Measurement Errors: Incorrect dilutions, unit conversions, or decimal placement [80] [81] [82].
- Procedural Deviations: Skipping steps, using wrong reagents, or poor technique (e.g., cross-contamination with pipettes) [80] [82].
- Lack of Knowledge: Insufficient training on specific instruments or procedures (e.g., how to properly wash an HPLC column) [80].
Solution: A Systematic Error-Reduction Protocol
| Error Type | Identification Method | Preventive & Corrective Methodology |
|---|---|---|
| Calculation & Data Entry | - Independent cross-verification by a second analyst [81].- Electronic data systems (LIMS) to automate calculations [81]. | - Use of electronic tools for calculations [81].- Peer verification of critical steps like weighing [81]. |
| Sample Preparation | - Review of raw data and deviation reports [81].- Trend analysis of Out-of-Specification (OOS) results [81]. | - Double-checking measurements [82].- Maintaining a clean workspace to prevent contamination [81].- Clear, practical, and regularly reviewed SOPs [81]. |
| Instrument Operation | - Review of system audit trails and logs [81] [83].- Peer review of instrument parameters [81]. | - Regular training and competency assessments [81].- Strict adherence to SOPs and calibration schedules [81]. |
Frequently Asked Questions (FAQs)
Q1: Our lab frequently observes protein samples getting stuck in the wells. We've checked resuspension and wells, but the problem persists. What could be a less obvious cause? A: A often-overlooked cause is the sample tube itself. Sporadic contamination in certain lots of tubes can cause samples to adhere. Consistently try a different supplier's tubes. Furthermore, if you are adding enzymes like proteinase K to your samples, be aware that increasing concentrations of such proteins can themselves lead to increased sample hang-up in the wells [73].
Q2: We are transferring our analytical testing to a new lab. What are the critical sample handling factors to ensure data integrity during the transfer? A: A robust sample transfer strategy is essential. Key factors include [84]:
- Temperature Control: Define and maintain the appropriate temperature during transit (e.g., dry ice for frozen, wet ice for refrigerated). Always include a temperature-monitoring device in the shipment.
- Agitation Management: For liquid samples, minimize headspace to prevent agitation-induced denaturation (e.g., foaming of high-concentration protein solutions).
- Chain of Custody Documentation: Clearly define and document the sample's journey from the source to the analytical bench, including handling instructions upon receipt at the new lab to ensure consistent treatment.
Q3: When investigating a sample prep error, is "human error" an acceptable root cause? A: No. Simply labeling an incident as "human error" does not prevent its recurrence. A proper root cause analysis must identify the underlying systemic failure, such as an unclear SOP, inadequate training, poorly designed process, or lack of necessary controls (e.g., double-checking). Addressing these system weaknesses is what truly fixes the problem [81].
Q4: How can we monitor the long-term health of our analytical methods to catch issues related to sample handling? A: Implement an Analytical Method Maintenance (AMM) program. This involves continuously monitoring assay control results using Statistical Process Control (SPC) charts. By overlaying production sample results and control results on the same chart, you can make "invisible" assay variance "visible." Drifts or spreads in the control data often indicate underlying issues with method components or sample handling that could be affecting your test samples [85].
The Scientist's Toolkit: Key Research Reagent Solutions
| Item | Function | Key Considerations & Troubleshooting Notes |
|---|---|---|
| Linear Acrylamide | A carrier to enhance quantitative precipitation of dilute nucleic acids [73]. | Can cause sample hang-up in gels. If this is a persistent issue, consider alternative carriers like glycogen or RNA/DNA carriers [73]. |
| Gel Loading Buffer | A dye-containing solution to densify samples for well loading and to visualize migration [73]. | Ensure the sample is fully solubilized in the buffer. Using the largest possible volume that fits the well can aid resuspension [73]. |
| Proteinase K | An enzyme used to degrade contaminating proteins in nucleic acid preparations [73]. | Increasing concentrations of Proteinase K can lead to increased sample hang-up in gel wells [73]. |
| Ammonium Persulfate (APS) | A catalyst for polyacrylamide gel polymerization [73]. | Use fresh APS solutions. APS sourced from gelatin capsules has been shown to seriously impede sample migration and should be avoided [73]. |
| Temperature Data Logger | A device placed inside sample shipments to continually record temperature during transit [84]. | Critical for validating sample integrity during transfer. Data from the logger can rule out sample distress as a cause for an Out-of-Specification (OOS) result [84]. |
Visual Workflow: Sample Preparation & Integrity Verification
The following diagram illustrates the critical steps for preparing samples for gel electrophoresis and the parallel process of verifying their integrity, helping to prevent the issue of samples remaining in wells.
Establishing Standard Operating Procedures for Reproducible Protein Analysis
Troubleshooting Guides and FAQs
Common Issue: Protein Samples Migrating Out of Wells Before Running
Q: Why are my protein samples leaking or migrating unevenly out of the wells before the electrophoresis run has started?
A: This is typically caused by issues with sample density, improper well cleaning, or incorrect buffer composition. To prevent this, ensure your sample loading buffer contains glycerol to increase density. Pipette carefully to avoid well damage, and briefly centrifuge the gel after loading to settle samples. Always include a control sample with a visible dye to monitor migration [15].
Common Issue: No or Faint Protein Bands
Q: After electrophoresis and transfer, I am detecting very faint or no bands. What could be the cause?
A: Faint bands can result from several issues in the sample preparation stage [15]:
- Protein Degradation: Proteases may have degraded your sample. Always include a broad-spectrum protease inhibitor cocktail in your lysis buffer and keep samples on ice [15] [86].
- Insufficient Protein Load: The protein concentration might be too low. Accurately determine concentration using an assay (e.g., Bradford, BCA) compatible with your lysis buffer and load at least 20–50 µg of total protein [15].
- Poor Transfer or Detection: Ensure the transfer was efficient and that your antibody incubation conditions are optimal.
Common Issue: High Background or Smearing
Q: My membrane has a high background or shows protein smearing. How can I resolve this?
A: This often points to problems with the sample itself or the blocking step [15]:
- Incomplete Denaturation: If proteins are not fully linearized, they can aggregate. Ensure your sample buffer contains SDS and that you heat denature your samples properly (typically 95–100°C for 5 minutes). For multi-pass membrane proteins prone to aggregation, heating at 70°C for 5–10 minutes is recommended [15].
- Non-specific Antibody Binding: Optimize the concentration of your primary and secondary antibodies. Ensure your blocking buffer is fresh and that you are blocking for a sufficient time.
Common Issue: Unexpected Band Migration or Appearance
Q: My protein of interest is appearing at an unexpected molecular weight, or I see unusual bands. Why?
A: Unusual migration patterns can be due to the protein's characteristics or sample handling [15] [87]:
- Post-Translational Modifications: Glycosylation, phosphorylation, or other modifications can alter a protein's apparent molecular weight. Research known modifications for your protein [15].
- Protein Isoforms: Alternative splicing or processing can create multiple isoforms that run at different sizes [15].
- Variable Migration of Monoclonal Proteins: In studies of monoclonal gammopathies, the M-spike (monoclonal protein) can, on occasion, migrate in the beta or alpha-2 regions, not just the typical gamma region. This requires confirmation with immunofixation [87].
- Incomplete Reduction: Ensure fresh reducing agents (DTT or β-mercaptoethanol) are used in your loading buffer to fully break disulfide bonds [15].
Experimental Protocol: Standardized Sample Preparation for Western Blot
This detailed protocol is designed to ensure reproducible protein extraction and preparation, forming the foundation for reliable analysis [15].
Cell Lysis and Protein Extraction
- Materials: Ice-cold PBS, appropriate lysis buffer (e.g., RIPA buffer), protease inhibitors, cell scraper, microcentrifuge tubes.
- Method:
- Place culture dish on ice and wash cells with ice-cold PBS.
- Aspirate PBS and add ice-cold lysis buffer with protease inhibitors (e.g., 1 mL per 10⁷ cells).
- Scrape adherent cells and transfer the suspension to a pre-cooled microcentrifuge tube.
- Maintain constant agitation for 30 minutes at 4°C.
- Centrifuge at 12,000 rpm for 20 minutes at 4°C.
- Transfer the supernatant (lysate) to a fresh tube and keep on ice [15].
Determination of Protein Concentration
- Method: Perform a Bradford, Lowry, or BCA assay. Use BSA as a standard. Ensure the assay is compatible with your lysis buffer detergents [15].
Sample Denaturation and Reduction
- Materials: 2X Laemmli sample buffer (4% SDS, 10% 2-mercaptoethanol, 20% glycerol, 0.004% bromophenol blue, 0.125 M Tris HCl, pH 6.8) [15].
- Method:
- Mix protein lysate with an equal volume of 2X Laemmli buffer.
- Heat the mixture at 95–100°C for 5 minutes (use 70°C for 5–10 minutes for multi-pass membrane proteins).
- Vortex and briefly centrifuge the sample before loading onto the gel [15].
Data Presentation: Monoclonal Protein Migration Patterns
The following table summarizes case data highlighting that monoclonal proteins (M-spikes) can migrate in regions other than the typical gamma fraction, which is critical for accurate interpretation of serum protein electrophoresis (SPEP) [87].
Table 1: Characteristics of Monoclonal Proteins with Atypical Migration on Capillary Zone Electrophoresis
| Case | Patient Presentation | SPEP Migration Region | Monoclonal Protein Type (IT) | M-protein Concentration (g/dL) | Provisional Diagnosis |
|---|---|---|---|---|---|
| 1 | Back pain, weakness | Beta-1 (β1) | IgA-Lambda | 1.7 | MGUS |
| 2 | Bony pain, lytic lesions | Beta (β) | IgG-Lambda | 4.8 | Multiple Myeloma |
| 3 | Backache, hypercalcemia | Beta (β) | IgA-Lambda | 3.2 | Suspected Multiple Myeloma |
| 4 | Forearm pain, backache | Beta-2 (β2) | IgA-Lambda | 0.4 | MGUS |
| 5 | Weakness, backache | Gamma (γ) | IgA-Kappa | 4.2 | MGUS |
Workflow Visualization
Standardized Protein Analysis Workflow
Protein Migration Troubleshooting Logic
The Scientist's Toolkit: Research Reagent Solutions
Table 2: Essential Reagents for Reproducible Protein Sample Preparation
| Reagent | Function | Key Consideration |
|---|---|---|
| Lysis Buffer (RIPA) | Solubilizes proteins from cells/tissues; composition can be tuned for different cellular compartments [15]. | Must include protease inhibitors immediately before use to prevent degradation [15] [86]. |
| Protease Inhibitor Cocktail | Protects protein sample from degradation by cellular proteases [15]. | Use a broad-spectrum mix; some targets may require specific additional inhibitors [15]. |
| Laemmli Sample Buffer | Denatures proteins (SDS) and reduces disulfide bonds (DTT/β-mercaptoethanol) for proper migration by size [15]. | Contains glycerol to increase sample density, preventing well overflow [15]. |
| Dithiothreitol (DTT) | Reducing agent that breaks disulfide bonds to linearize proteins [15]. | Must be fresh; old stock can oxidize and lose efficacy, leading to improper unfolding. |
| BCA Assay Kit | Colorimetric method for determining protein concentration prior to loading [15]. | Verify compatibility with detergents in your lysis buffer to avoid inaccurate readings [15]. |
Conclusion
Preventing protein sample leakage is not merely a technical detail but a fundamental requirement for generating reliable and reproducible data in protein research and biopharmaceutical development. By integrating the foundational understanding of sample behavior with optimized preparation protocols, systematic troubleshooting approaches, and rigorous validation methods, researchers can significantly enhance the quality of their electrophoretic analyses. The implementation of these strategies ensures accurate protein characterization, supports robust therapeutic antibody development, and advances the reproducibility of biomedical research. Future directions include the development of standardized quality metrics for sample integrity and the integration of automated monitoring systems to further minimize technical variability in protein separation workflows.
References
- 1. Troubleshooting SDS-PAGE Sample Preparation Issues [https://www.goldbio.com/blogs/articles/troubleshooting-sds-page-sample-preparation-issues?srsltid=AfmBOopWHSyLX2kzwuw3athoQM6gjOSCUIbib_6oiIkmePPHe3qCIS2K]
- 2. Loading Dye in Gel Electrophoresis [https://www.thermofisher.com/us/en/home/brands/thermo-scientific/molecular-biology/thermo-scientific-nucleic-acid-electrophoresis-purification/dna-electrophoresis-thermo-scientific/loading-dyes-buffers.html]
- 3. Overview of Protein Electrophoresis [https://www.thermofisher.com/us/en/home/life-science/protein-biology/protein-biology-learning-center/protein-biology-resource-library/pierce-protein-methods/overview-electrophoresis.html]
- 4. Western blotting guide: Part 2, Protein separation by SDS- ... [https://www.jacksonimmuno.com/secondary-antibody-resource/technical-tips/western-blotting-guide-part-2/]
- 5. Guide to Pipetting [https://pipette.com/blog/guide-to-pipetting?srsltid=AfmBOoo55dV7Txq4Ywgc3BlJLwJGqeuS8n9E-1W630jfcpgmJecW0SKZ]
- 6. Understanding ultrafast free-rising bubble capturing on ... [https://www.nature.com/articles/s41467-025-59049-x]
- 7. The Ultimate Guide to Micropipettes (2025 Edition) [https://uniglobalbusiness.com/blogs/scientific-instruments/the-ultimate-guide-to-micropipettes-2025-edition?srsltid=AfmBOoqVBg2UB3YTwd_v7qafKEDOwlXFrFjItCES6lZoyEHjei9Y34WW]
- 8. Pipetting Technique 2025: Accuracy & Contamination Guide [https://niito.kz/pipettes/pipetting-precision-guide/]
- 9. Troubleshooting SDS-PAGE Sample Preparation Issues [https://www.goldbio.com/blogs/articles/troubleshooting-sds-page-sample-preparation-issues?srsltid=AfmBOop8BeE4iVciEfTenNBZ_yXtYbunJDMrxsK75MKjNuJTX3TmuSlX]
- 10. Western Blot Troubleshooting [https://www.thermofisher.com/us/en/home/life-science/protein-biology/protein-biology-learning-center/protein-gel-electrophoresis-information/western-blot-troubleshooting.html]
- 11. Understanding Salting In and Salting Out: Salt as a Protein ... [https://www.goldbio.com/blogs/articles/understanding-salting-in-and-salting-out-salt-as-a-protein-purification-tool?srsltid=AfmBOorL7Vo_GhDx29N9DOO7jrijJY5ibTmmq02551FHR06Bz6toBe10]
- 12. Effects of the Temperature and Salt Concentration on ... [https://pmc.ncbi.nlm.nih.gov/articles/PMC9182825/]
- 13. How Detergents are Extremely Useful in Bioscience ... [https://www.goldbio.com/blogs/articles/how-detergents-are-extremely-useful-in-bioscience-experiments?srsltid=AfmBOopSGEuZ3IxANBH0Q6FYyaig78VXKWeJaKnuX1Via6VjCovVdHju]
- 14. Detergents for Cell Lysis and Protein Extraction [https://www.thermofisher.com/us/en/home/life-science/protein-biology/protein-biology-learning-center/protein-biology-resource-library/pierce-protein-methods/detergents-cell-lysis-protein-extraction.html]
- 15. preparation for western blot | Abcam Sample [https://www.abcam.com/en-us/technical-resources/guides/western-blot-guide/sample-preparation-for-western-blot]
- 16. 5 Steps to Fundamental Protein Preparation [https://www.thermofisher.com/us/en/home/life-science/protein-biology/protein-purification-isolation/5-steps-fundamental-protein-preparation.html]
- 17. Proteomics Sample Preparation FAQ [https://www.metwarebio.com/proteomic-sample-preparation-faq/]
- 18. Dialysis or Desalting? Choosing a Protein Purification Method [https://www.thermofisher.com/blog/life-in-the-lab/dialysis-or-desalting-choosing-a-protein-purification-method/]
- 19. Refractive index-based determination of detergent ... [https://pmc.ncbi.nlm.nih.gov/articles/PMC2279333/]
- 20. 12.7: Electrophoresis [https://chem.libretexts.org/Bookshelves/Analytical_Chemistry/Analytical_Chemistry_2.1_(Harvey)/12%3A_Chromatographic_and_Electrophoretic_Methods/12.07%3A_Electrophoresis]
- 21. Nucleic Acid Gel Electrophoresis Troubleshooting [https://www.thermofisher.com/us/en/home/life-science/cloning/cloning-learning-center/invitrogen-school-of-molecular-biology/na-electrophoresis-education/na-electrophoresis-troubleshooting.html]
- 22. Modification of gel architecture and TBE/TAE buffer ... [https://pmc.ncbi.nlm.nih.gov/articles/PMC4021863/]
- 23. Western Blot: The Complete Guide [https://www.antibodies.com/applications/western-blotting]
- 24. Troubleshooting Common Electrophoresis Problems and ... [https://www.labx.com/resources/troubleshooting-common-electrophoresis-problems-and-artifacts/5539]
- 25. A Database of Accurate Electrophoretic Migration Patterns ... [https://www.sciencedirect.com/science/article/pii/S0022283622005605]
- 26. SDS-PAGE: The science behind all those bubbles [https://www.antibodiesinc.com/pages/sds-page-demystified?srsltid=AfmBOoos8bkIuS9cJG27K6fG_f3Hfe__2ILgb6l2ruZ_pFY2HJnh1Rbu]
- 27. SURE gel electrophoresis: A method for improved ... [https://pmc.ncbi.nlm.nih.gov/articles/PMC11733979/]
- 28. Troubleshooting SDS-PAGE Sample Preparation Issues [https://www.goldbio.com/blogs/articles/troubleshooting-sds-page-sample-preparation-issues?srsltid=AfmBOorPbHNjPOoot-qfIz4Lhpq7J6zkj0nFPGxDnCoSWchIesdbwHBD]
- 29. Western blot troubleshooting guide! [https://www.jacksonimmuno.com/secondary-antibody-resource/technical-tips/western-blot-trouble-shooting/]
- 30. Exploring the role of urea in preventing aggregation ... [https://www.sciencedirect.com/science/article/abs/pii/S0167732225017489]
- 31. Western blotting guide: Part 1, Introduction and Sample ... [https://www.jacksonimmuno.com/secondary-antibody-resource/technical-tips/western-blotting-guide-part-1/]
- 32. Western Blot - StatPearls - NCBI Bookshelf - NIH [https://www.ncbi.nlm.nih.gov/books/NBK542290/]
- 33. Protein Purificaiton Troubleshooting & Best Practices [https://www.bostonind.com/blog/protein-purificaiton-troubleshooting-and-best-practices?srsltid=AfmBOorAmeD6uI5-z8yJc8Eaweb2o0pqveKtqLnxq3w7ojkxHvieOwq9]
- 34. Advances in solubilization and stabilization techniques for ... [https://pmc.ncbi.nlm.nih.gov/articles/PMC11974516/]
- 35. Molecular mechanisms underlying the effects of urea and ... [https://pubmed.ncbi.nlm.nih.gov/40662695/]
- 36. Western blot transfer techniques [https://www.abcam.com/en-us/knowledge-center/western-blot/western-blot-transfer-methods]
- 37. Western Blot Transfer Methods [https://www.thermofisher.com/us/en/home/life-science/protein-biology/protein-biology-learning-center/protein-biology-resource-library/pierce-protein-methods/western-blot-transfer-methods.html]
- 38. Western Blot Protocol [https://www.ptglab.com/support/western-blot-protocol/western-blot-protocol/?srsltid=AfmBOoqbVOTfXePxnLWTFBrkIPALcNX-DaJUZa4S9SGoWnFkVkSp36Pl]
- 39. What went wrong? A Western Blot Troubleshooting Guide [https://precisionbiosystems.com/western-blot-troubleshooting-guide/]
- 40. The Top 10 Western Blotting Mistakes (and Solutions!) [https://bitesizebio.com/19799/the-top-10-western-blotting-mistakes-and-solutions/]
- 41. How do I develop a sample prep method? [https://www.biotage.com/blog/how-do-i-develop-a-sample-prep-method]
- 42. The 8 Western Blot Failures and How to Prevent Them (2025 ... [https://wildtypeone.substack.com/p/the-8-western-blot-failures-and-how?utm_campaign=post&triedRedirect=true]
- 43. 蛋白质印迹法疑难排解指南 - Cell Signaling Technology [https://www.cellsignal.cn/learn-and-support/troubleshooting/western-blot-troubleshooting-guide]
- 44. Western Blotting Troubleshooting Guide [https://www.cellsignal.com/learn-and-support/troubleshooting/western-blot-troubleshooting-guide?srsltid=AfmBOorBk39oxoNFdSxQxqDleljDz_i20b9I4cItu8WVqecVfT4iCsK-]
- 45. Preparing High-Quality Samples for Electrophoresis: Best ... [https://www.labx.com/resources/preparing-high-quality-samples-for-electrophoresis-best-practices/5550]
- 46. Western Blot常见问题指南 - 赛默飞 [https://www.thermofisher.cn/cn/zh/home/life-science/protein-biology/protein-biology-learning-center/protein-gel-electrophoresis-information/western-blot-troubleshooting.html]
- 47. Western Blot: Technique, Theory, and Trouble Shooting [https://pmc.ncbi.nlm.nih.gov/articles/PMC3456489/]
- 48. Methods of Troubleshooting Fine Leak Testing Failures [https://www.imcintertech.com/why-leak-tests-fail-methods-of-troubleshooting-fine-leak-testing-failures/]
- 49. Impact Support Mats Protect Microplates During ... [https://www.labmanager.com/impact-support-mats-protect-microplates-during-centrifugation-5012]
- 50. ELISA Troubleshooting Guide is Here!_AntibodySystem [https://www.antibodysystem.com/archive/469.html]
- 51. Troubleshooting Nucleic Acid Gel Electrophoresis—Solved in ... [https://www.yeasenbio.com/blogs/molecular-biology/troubleshooting-nucleic-acid-gel-electrophoresis-solved-in-one-go]
- 52. Nucleic Acid Gel Electrophoresis and Blotting Support—Troubleshooting | Thermo Fisher Scientific - US [https://www.thermofisher.com/us/en/home/technical-resources/technical-reference-library/nucleic-acid-purification-analysis-support-center/nucleic-acid-electrophoresis-blotting-support/nucleic-acid-electrophoresis-blotting-support-troubleshooting.html]
- 53. Agarose Gel Electrophoresis for DNA Analysis [https://www.protocols.io/view/agarose-gel-electrophoresis-for-dna-analysis-d5yn87ve.html]
- 54. Biotechnology 101 Protocol: Gel Electrophoresis [https://bento.bio/protocol/biotechnology-101/gel-electrophoresis/]
- 55. Recommended Well Loading Volumes & Sample Loads [https://www.thermofisher.com/br/en/home/life-science/protein-biology/protein-gel-electrophoresis/protein-gels/recommended-well-loading-volumes-sample-loads.html]
- 56. Troubleshooting SDS-PAGE Gel Running Issues [https://www.goldbio.com/blogs/articles/troubleshooting-sds-page-gel-running-issues?srsltid=AfmBOor_rPSj35hwZ7c_Ajn9B4ys06YeU73Bk1Kk2n0PT21GdFe5uN7G]
- 57. 6 Best Tips for Troubleshooting Poor Band Separation on ... [https://azurebiosystems.com/blog/6-tips-for-troubleshooting-poor-band-separation-on-sds-page-gels/]
- 58. SDS-PAGE Optimization for Western Blot [https://www.bosterbio.com/protocol-and-troubleshooting/western-blotting-optimization/sds-page?srsltid=AfmBOoqT_hHH88QcdGkE6G-bhtYySFNjZCAKKAfTI7aET6Qr3MAUcND-]
- 59. Western Blot Troubleshooting [https://www.antibodies.com/applications/western-blotting/western-blot-troubleshooting]
- 60. Western Blotting Troubleshooting [https://www.southernbiotech.com/troubleshooting-tips-for-western-blotting/]
- 61. Troubleshooting Western Blot: Common Problems and Fixes [https://synapse.patsnap.com/article/troubleshooting-western-blot-common-problems-and-fixes]
- 62. 蛋白质印迹指南引言 [https://www.assaygenie.com/western-blotting-guide-mandarin?srsltid=AfmBOorXblyqetrdKBCG-oTLLNcnoqY4zoze1UGwxZsjV0KDqFgxwn3y]
- 63. Western Blot实验避坑指南!从“翻车”到“封神”的终极攻略! [https://www.antiby.com/Knowledge1-1274.html]
- 64. 蛋白样品制备方法步骤 - 赛默飞 [https://www.thermofisher.cn/cn/zh/home/life-science/protein-biology/protein-purification-isolation/5-steps-fundamental-protein-preparation.html]
- 65. A large-scale method for the enrichment and identification ... [https://pmc.ncbi.nlm.nih.gov/articles/PMC12412023/]
- 66. Troubleshooting SDS-PAGE Gel Running Issues [https://www.goldbio.com/blogs/articles/troubleshooting-sds-page-gel-running-issues?srsltid=AfmBOopTfg3XFe1VuNuEFGZ9umwpW-cXbv8nmt7SoGi3xFu9uItutboO]
- 67. SDS-PAGE [https://en.wikipedia.org/wiki/SDS-PAGE]
- 68. SDS-PAGE guide: Sample preparation to analysis [https://www.abcam.com/en-us/knowledge-center/western-blot/sds-page-guide]
- 69. Quality assessment and optimization of purified protein samples [https://microbialcellfactories.biomedcentral.com/articles/10.1186/s12934-014-0180-6]
- 70. Troubleshooting SDS-PAGE Sample Preparation Issues [https://www.goldbio.com/blogs/articles/troubleshooting-sds-page-sample-preparation-issues?srsltid=AfmBOoodcbEQfbE2WXKakWkS3jQLdj9zmUjO3z9oLlignJv_Zrmic3ka]
- 71. Enhancing therapeutic antibody profiling: orthogonal ... [https://pmc.ncbi.nlm.nih.gov/articles/PMC12510943/]
- 72. The principles of dynamic light scattering [https://wiki.anton-paar.com/us-en/the-principles-of-dynamic-light-scattering/]
- 73. Preventing Samples from Remaining in the Wells of Your ... [https://www.thermofisher.com/us/en/home/references/ambion-tech-support/ribonuclease-protection-assays/general-articles/preventing-samples-from-remaining-in-the-wells-of-your-gels.html]
- 74. Choosing the Right Tubes for Sample Integrity [https://www.azenta.com/learning-center/blog/choosing-the-right-tubes-for-sample-integrity]
- 75. Protein Gel 1D Electrophoresis Support—Troubleshooting [https://www.thermofisher.com/us/en/home/technical-resources/technical-reference-library/protein-electrophoresis-western-blotting-support-center/protein-gel-1d-electrophoresis-support1/protein-gel-1d-electrophoresis-support-troubleshooting.html]
- 76. Troubleshooting SDS-PAGE Gel Running Issues [https://www.goldbio.com/blogs/articles/troubleshooting-sds-page-gel-running-issues?srsltid=AfmBOoofGwQo6VxOXhCmjXVQpth47bU1tsBk_ZLl7gKhvF75eObIScdv]
- 77. Best Practices for ELISA Sample Handling [https://www.mybiosource.com/learn/best-practices-for-elisa-sample-handling/]
- 78. The Horror of Sample Adsorption to Containers (Part 1) [https://www.shimadzu.com/an/service-support/technical-support/liquid-chromatography/tips_and_tricks/containers-1.html]
- 79. Managing nonspecific adsorption to liquid chromatography ... [https://www.sciencedirect.com/science/article/abs/pii/S0003267023002155]
- 80. Common human errors in analytical pharma [https://www.linkedin.com/posts/jairus-fernandes-senior-research-executive_analyticalpharma-errors-human-activity-7348375609770659840-zhPE]
- 81. Human Errors In Pharmaceutical analysis: How to identify ... [https://pharmaguru.co/human-errors-in-pharmaceutical-analysis/]
- 82. Help for Your New Lab Techs: Avoiding Sample Prep ... [https://blog.omni-inc.com/blog/help-for-your-new-lab-techs-avoiding-sample-prep-mistakes]
- 83. Common DI points of failure: Incomplete Datasets [https://www.gxp-cc.com/insights/blog/common-di-points-of-failure-incomplete-datasets/]
- 84. Strategies for Successful Sample Transfer [https://www.bioprocessintl.com/qa-qc/strategies-for-successful-sample-transfer]
- 85. A Guide for Testing Biopharmaceuticals Part 2: Acceptance ... [https://www.biopharminternational.com/view/guide-testing-biopharmaceuticals-part-2-acceptance-criteria-and-analytical-method-maintenance]
- 86. Protein-Protein Interactions Support—Troubleshooting [https://www.thermofisher.com/us/en/home/technical-resources/technical-reference-library/protein-assays-analysis-support-center/protein-protein-interactions-support/protein-protein-interactions-support-troubleshooting.html]
- 87. Unraveling the Possibilities of Monoclonal Protein ... Migration [https://pmc.ncbi.nlm.nih.gov/articles/PMC9750745/]