Preparative SDS-PAGE and GeLC-MS/MS: A Complete Guide to Protein Fractionation for Advanced Proteomics
This article provides a comprehensive guide to preparative SDS-PAGE for protein fractionation prior to GeLC-MS/MS analysis, a cornerstone technique in modern proteomics.
Preparative SDS-PAGE and GeLC-MS/MS: A Complete Guide to Protein Fractionation for Advanced Proteomics
Abstract
This article provides a comprehensive guide to preparative SDS-PAGE for protein fractionation prior to GeLC-MS/MS analysis, a cornerstone technique in modern proteomics. Tailored for researchers, scientists, and drug development professionals, it covers foundational principles to advanced applications. Readers will gain a deep understanding of SDS-PAGE as a powerful fractionation tool that enhances proteome coverage by reducing sample complexity. The content details optimized protocols for in-gel digestion and peptide extraction, systematic troubleshooting for common pitfalls, and comparative analysis with alternative fractionation methods. Emphasis is placed on practical workflow adaptations for diverse sample types, including challenging clinical and bacterial specimens, to achieve robust protein identification and characterization in biomarker discovery and biopharmaceutical development.
Understanding GeLC-MS/MS: Why SDS-PAGE Fractionation is a Cornerstone of Proteomics
GeLC-MS/MS represents a powerful synergy of classical protein separation techniques and cutting-edge mass spectrometry, establishing itself as a cornerstone method in modern proteomics. This method effectively combines the high resolving power of one-dimensional sodium dodecyl sulfate-polyacrylamide gel electrophoresis (1D SDS-PAGE) with the sensitive identification capabilities of liquid chromatography-tandem mass spectrometry (LC-MS/MS) [1]. In the GeLC-MS/MS workflow, complex protein mixtures are first separated by molecular weight using SDS-PAGE. The entire gel lane is then systematically sliced into multiple bands, and proteins within each gel section are subjected to in-gel digestion with trypsin. The extracted peptides are finally analyzed by nano-flow reversed-phase LC-MS/MS to generate peptide sequence identifications that can be mapped to proteins in sequence databases [1].
The value of this technique lies in its ability to address a fundamental challenge in discovery-based proteomics: maximizing sequence coverage for proteins across a wide concentration range [1]. By fractionating samples at the protein level prior to mass spectrometric analysis, GeLC-MS/MS effectively reduces sample complexity, thereby improving proteome coverage. This approach is particularly valuable for overcoming dynamic range limitations, where peptides from abundant proteins typically dominate MS acquisition time, impeding identification of lower abundance proteins [1]. Compared to alternative fractionation methods, GeLC-MS/MS offers distinct advantages including compatibility with detergents and chaotropes used in sample extraction, built-in sample cleanup during electrophoresis, and the potential to obtain molecular weight information and resolve protein isoforms [1] [2].
Experimental Principles and Workflow
Core Principles of SDS-PAGE Separation
The foundation of GeLC-MS/MS rests on the established principles of SDS-PAGE, which provides size-based separation of proteins. SDS, an anionic detergent, denatures proteins by destroying most secondary and tertiary structures and imparting a uniform negative charge that is proportional to the polypeptide length [3]. This results in separation where migration distance is negatively proportional to the logarithm of molecular weight, allowing for estimation of protein size when compared to appropriate standards [3]. The gel matrix itself serves not only as a separation medium but also as a platform for subsequent processing, effectively removing detergents, buffers, and salts from the protein extract that might interfere with mass spectrometry analysis [2].
Integrated GeLC-MS/MS Workflow
The complete GeLC-MS/MS workflow encompasses multiple stages from sample preparation through data analysis, with each step requiring specific optimization to ensure comprehensive proteome coverage.
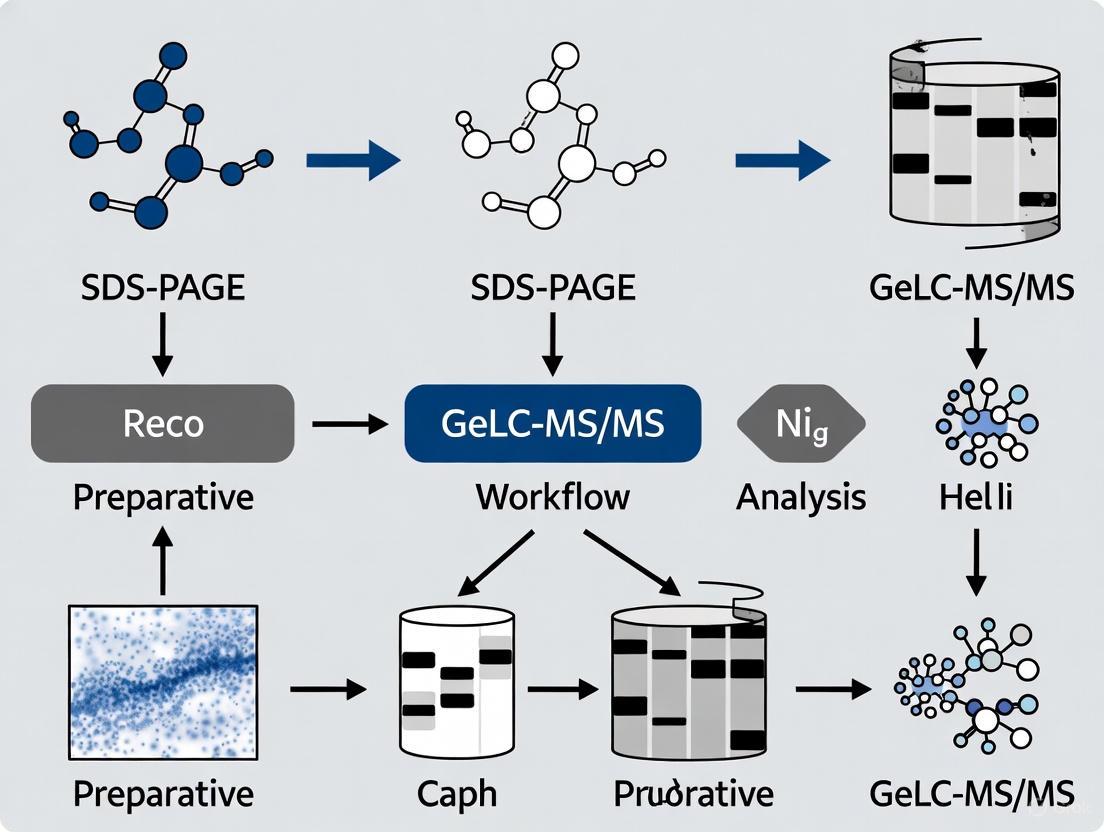
Figure 1: Comprehensive GeLC-MS/MS workflow integrating classical biochemical separation with modern mass spectrometric analysis.
Detailed GeLC-MS/MS Protocol
Sample Preparation and SDS-PAGE Separation
Materials Required:
- Precast Bis-Tris 4-12% gradient gel or self-poured polyacrylamide gel
- Pre-stained protein molecular weight markers
- MES SDS running buffer (20× concentrate)
- LDS sample buffer (4×) containing 2% LDS, 141 mM Tris base, 106 mM Tris-HCl, 0.51 mM EDTA, 10% glycerol, and tracking dyes [1]
- Reducing agent: 500 mM dithiothreitol (DTT) or 2.5% β-mercaptoethanol [1] [3]
Procedure:
- Sample Preparation: Add LDS sample buffer to protein samples along with reducing agent. Heat at 70°C for 10 minutes to denature proteins. Centrifuge at 2,400 × g for 30 seconds to pellet insoluble material [1].
- Gel Setup: Place precast gel into electrophoresis chamber and fill with 1× running buffer diluted from 20× MES SDS running buffer stock [1].
- Sample Loading: Load prepared samples and molecular weight markers into wells. For complex mixtures, load 1-20 μg of protein for analytical gels, or higher amounts (up to 500 μg) for preparative applications [3] [4].
- Electrophoresis: Run gel at constant voltage (80-150 V) until dye front migrates to bottom of gel (approximately 45-90 minutes) [3] [5].
- Protein Visualization: Stain gel with Coomassie Brilliant Blue-based stain (0.1% Coomassie Brilliant Blue G250, 10% glacial acetic acid, 40% methanol) for 1 hour, followed by destaining (25% methanol, 7.5% glacial acetic acid) to visualize protein bands [1].
Whole-Gel Processing and In-Gel Digestion
Materials Required:
- Destain solution: 25 mM ammonium bicarbonate/50% acetonitrile
- Reduction buffer: 5 mM Tris[2-carboxyethyl]phosphine (TCEP) in 25 mM ammonium bicarbonate
- Alkylation buffer: 20 mM iodoacetamide (IAM) in 25 mM ammonium bicarbonate (prepare fresh, light sensitive) [1]
- Trypsin solution: 10 ng/μL sequencing grade trypsin in 25 mM ice-cold ammonium bicarbonate
- Extraction solution: 1% formic acid
Procedure:
- Gel Excision: Excise entire gel lane using clean scalpel or razor blade. For molecular weight correlation, use pre-stained markers as guides [1] [2].
- Gel Slicing: Slice gel lane into 5-20 uniform bands based on molecular weight regions. For higher resolution, increase number of slices [2].
- Destaining: For each gel slice, add 200-500 μL destain solution and incubate at 37°C with shaking for 45 minutes until Coomassie stain is removed. Repeat as necessary [1].
- Reduction: Remove destain solution and add 100-200 μL of 5 mM TCEP solution. Incubate at 60°C for 30 minutes to reduce disulfide bonds [1].
- Alkylation: Remove reduction solution and add 100-200 μL of 20 mM iodoacetamide solution. Incubate at room temperature in darkness for 30 minutes to alkylate cysteine residues [1].
- Trypsin Digestion: Remove alkylation solution, wash gel pieces with 25 mM ammonium bicarbonate, and add sufficient trypsin solution to cover gel pieces (typically 2-3× gel volume). Incubate at 37°C overnight (12-16 hours) [1].
- Peptide Extraction: Following digestion, add extraction solution (1% formic acid) to gel pieces and incubate at 37°C with shaking for 15 minutes. Collect supernatant and repeat extraction twice. Combine all extracts and concentrate using SpeedVac to desired volume for LC-MS/MS analysis [1].
Table 1: Troubleshooting Guide for Common GeLC-MS/MS Issues
| Problem | Potential Cause | Solution |
|---|---|---|
| Poor protein separation in SDS-PAGE | Insufficient sample denaturation | Ensure fresh reducing agent and heating at 70°C for 10 min [1] |
| High background staining | Incomplete destaining | Increase destaining time or change destain solution more frequently [1] |
| Low peptide yield | Incomplete digestion | Use fresh trypsin preparation; ensure proper gel dehydration/rehydration [1] |
| Keratin contamination | Exposure to skin or dust | Use clean gloves and work in dedicated clean area [1] |
LC-MS/MS Analysis and Data Processing
Materials Required:
- Solvent A: 0.1% formic acid in double-distilled water
- Solvent B: 0.1% formic acid in acetonitrile (LC/MS grade)
- Trap column: ZORBAX 300SB-C18, 5 × 0.3 mm, 5 μm particles
- Analytical column: Self-packed 100 μm i.d. × 150 mm fused silica capillary with C18 resin [1]
Procedure:
- Chromatography Setup: Configure nano-flow LC system with trap and analytical columns. Establish gradient method (typically 2-35% solvent B over 60-120 minutes) [1].
- Sample Loading: Load digested peptide samples onto trap column at higher flow rate (5-10 μL/min) for concentration and desalting.
- Peptide Separation: Switch trap column in-line with analytical column and separate peptides using optimized acetonitrile gradient at nano-flow rates (200-300 nL/min).
- Mass Spectrometry Analysis: Operate mass spectrometer in data-dependent acquisition mode, with full MS scans followed by MS/MS fragmentation of most intense ions. Use dynamic exclusion to maximize peptide identifications.
- Data Processing: Convert raw data to peak lists using extractor software (e.g., ProteoWizard). Search resulting MS/MS spectra against protein sequence databases using search engines (e.g., Mascot, ProteinProspector) [1].
- Data Integration: Combine search results from all gel slices to generate comprehensive protein identification and quantification for the entire sample.
Applications and Data Analysis
Quantitative Applications in Proteomics
GeLC-MS/MS has been successfully adapted for quantitative proteomic applications through incorporation of stable isotope labeling methods. A recently developed approach couples GeLC-MS/MS with stable isotope dimethyl labeling, enabling highly accurate comparative analyses [6]. In this method, samples from different conditions are labeled with light and heavy dimethyl isotopes, mixed, and then processed together through the entire GeLC-MS/MS workflow. This strategy eliminates variability from gel extraction and LC-MS/MS procedures, as relative quantification is derived from isotope ratios measured within a single MS injection [6]. This approach is particularly valuable for detecting proteolytic events and subtle changes in protein abundance resulting from disease processes or physiological perturbations.
Proteoform Characterization
Beyond conventional protein identification, GeLC-MS/MS enables characterization of proteoforms - different molecular forms of a protein derived from a single gene. By reconstructing gel distributions of thousands of proteins, researchers can detect multiple proteoforms resulting from alternative splicing, proteolytic processing, and post-translational modifications [7]. This 1DE-MS profiling approach has revealed that approximately 30% of proteins in complex proteomes display more than one proteoform in SDS-PAGE gels, with only 56% showing narrow distributions at their expected molecular weights [7]. This application is particularly valuable for understanding disease mechanisms where specific proteoforms may be differentially regulated.
Table 2: Performance Metrics of GeLC-MS/MS in Proteomic Studies
| Parameter | Performance | Experimental Context |
|---|---|---|
| Protein Identification Overlap | >80% overlap between whole-gel and conventional processing [2] | Human HCT116 cell lysate and mouse tumor tissue |
| Quantitative Reproducibility | R² = 0.94 for spectral counting comparison [2] | Label-free quantitation of 1085 proteins |
| Inter-experiment Reproducibility | >88% protein identification overlap with CV <20% on quantitation [2] | Triplicate analysis of HCT116 cell lysate and FFPE tissue |
| Proteoform Identification | ~30% of proteins showed multiple proteoforms [7] | Analysis of 5906 proteins from rat cerebral cortex |
The Scientist's Toolkit: Essential Research Reagents and Materials
Table 3: Essential Research Reagents for GeLC-MS/MS Workflow
| Reagent/Material | Function | Technical Specifications |
|---|---|---|
| SDS-PAGE Reagents | ||
| LDS Sample Buffer | Protein denaturation and loading | 4× concentrate with 2% LDS, tracking dyes [1] |
| MES Running Buffer | SDS-PAGE electrophoresis | 20× concentrate, 50 mM MES, 50 mM Tris, 0.1% SDS [1] |
| Polyacrylamide Gel | Size-based protein separation | 4-12% Bis-Tris gradient gels for optimal resolution [1] |
| Digestion Reagents | ||
| Sequencing Grade Trypsin | Proteolytic digestion | 10 ng/μL in 25 mM ammonium bicarbonate [1] |
| TCEP | Disulfide bond reduction | 5 mM in 25 mM ammonium bicarbonate [1] |
| Iodoacetamide | Cysteine alkylation | 20 mM in ammonium bicarbonate (prepare fresh) [1] |
| LC-MS/MS Reagents | ||
| Solvent A | Reversed-phase chromatography | 0.1% formic acid in water (LC/MS grade) [1] |
| Solvent B | Peptide elution | 0.1% formic acid in acetonitrile (LC/MS grade) [1] |
| C18 Column | Peptide separation | 100 μm i.d. × 150 mm with 3-5 μm particles [1] |
Methodological Variations and Optimization
Whole-Gel Processing Procedure
To address the bottleneck of manual processing in large-scale GeLC-MS/MS experiments, researchers have developed a streamlined whole-gel (WG) procedure where washing, reduction, and alkylation steps are performed on the intact gel prior to slicing [2]. This approach significantly reduces hands-on time without compromising data quality, demonstrating >80% identification overlap with conventional methods and high quantitative correlation (R²=0.94) [2]. The WG procedure is particularly advantageous for clinical proteomics applications where sample numbers are relatively high and processing efficiency is essential.
Specialized Applications
The versatility of GeLC-MS/MS is evident in its adaptation to various challenging sample types. The method has been successfully applied to formalin-fixed paraffin-embedded (FFPE) tissue with reproducibility exceeding 88% between technical replicates [2]. Additionally, GeLC-MS/MS has proven valuable in protein purification workflows, serving as an alternative to affinity-based methods for achieving single-band purity of recombinant proteins, particularly when tags cannot be efficiently removed through conventional chromatography [4].
Figure 2: Proteoform analysis workflow using GeLC-MS/MS, combining molecular weight and sequence information for comprehensive protein characterization.
The Critical Role of Protein-Level Fractionation in Reducing Sample Complexity
In-depth proteomic analysis of complex biological samples is a fundamental challenge in life science research and drug development. The core obstacle lies in the immense dynamic range of protein concentrations within samples such as plasma or cell lysates, where a few highly abundant proteins can obscure the detection of low-abundance proteins that may have significant biological or diagnostic value [8]. Protein-level fractionation, the separation of intact proteins prior to enzymatic digestion and mass spectrometric analysis, serves as a critical first step in reducing this sample complexity. By dividing the proteome into less complex subsets, researchers can significantly increase the depth of analysis, enabling the identification and characterization of otherwise undetectable protein targets [9] [8].
The strategic implementation of protein-level fractionation is particularly vital for challenging applications such as biomarker discovery, membrane protein analysis, and structural proteomics. This application note details established and emerging fractionation methodologies within the context of preparative SDS-PAGE and GeLC-MS/MS workflows, providing researchers with practical protocols and quantitative data to enhance their proteomic investigations.
Established Fractionation Techniques and Principles
The GeLC-MS/MS Workflow
The GeLC-MS/MS workflow, which combines SDS-PAGE separation with liquid chromatography and tandem mass spectrometry, has long been a cornerstone of in-depth proteomic analysis [9]. In this approach, a complex protein mixture is first separated by molecular weight using SDS-PAGE. The entire gel lane is then excised into multiple fractions, and proteins within each gel piece are subjected to in-gel enzymatic digestion. The resulting peptides are extracted and analyzed by LC-MS/MS, effectively creating a two-dimensional separation that dramatically increases proteomic coverage compared to single-dimension approaches [9].
Principles of SDS-PAGE Separation: SDS-PAGE operates on the principle of separating proteins denatured by the anionic detergent sodium dodecyl sulfate (SDS) based on their molecular mass. The SDS binds to proteins in a relatively constant ratio, imparting a uniform negative charge that causes migration toward the anode during electrophoresis. The polyacrylamide gel matrix acts as a molecular sieve, allowing smaller proteins to migrate faster than larger ones [10]. The selection of an appropriate gel percentage is crucial for optimal resolution, as detailed in Table 1.
Table 1: Recommended Gel Percentages for Optimal Resolution of Different Protein Sizes
| Protein Size Range | Recommended Gel Percentage |
|---|---|
| 4-40 kDa | Up to 20% |
| 12-45 kDa | 15% |
| 10-70 kDa | 12.5% |
| 15-100 kDa | 10% |
| 50-200 kDa | 8% |
| >200 kDa | 4-6% |
Source: [10]
Addressing the Plasma Proteome Challenge
Plasma and serum represent particularly challenging samples for proteomic analysis due to the extreme dynamic range of protein concentrations, spanning up to 10-12 orders of magnitude [8]. Immunodepletion strategies have been developed to address this challenge by selectively removing the most abundant proteins. A well-optimized multiple affinity removal system can eliminate at least 98% of seven targeted high-abundance proteins (including albumin, IgG, and transferrin), which collectively constitute approximately 90% of the total protein mass in plasma [8]. This removal is essential for unmasking lower-abundance potential biomarkers that would otherwise escape detection.
Table 2: Quantitative Performance of Protein Fractionation and Recovery Methods
| Method | Key Performance Metric | Value | Application Context |
|---|---|---|---|
| Multiple Affinity Removal | Removal Efficiency of High-Abundance Proteins | >98% | Human plasma/serum analysis [8] |
| Macroporous Reversed-Phase C18 | Protein Recovery | >95% (98% for immunodepleted serum) | General fractionation and membrane proteins [8] |
| PEPPI-MS | Median Protein Recovery (<100 kDa) | 68% | Top-down and middle-down proteomics [11] [9] |
| PEPPI-MS | Protein Recovery (>100 kDa) | 57% | Top-down and middle-down proteomics [9] |
Advanced and Emerging Fractionation Methodologies
PEPPI-MS: A Breakthrough for Intact Protein Recovery
A significant limitation of conventional GeLC-MS/MS for structural proteomics has been the difficulty of efficiently recovering intact proteins from polyacrylamide gels rather than digested peptides. The recent development of Passively Eluting Proteins from Polyacrylamide Gels as Intact Species for MS (PEPPI-MS) represents a transformative solution to this long-standing challenge [11] [9].
PEPPI-MS utilizes Coomassie Brilliant Blue (CBB) as an extraction enhancer within a specific buffer system (0.05% SDS/100 mM ammonium bicarbonate) to facilitate rapid protein diffusion from homogenized gel pieces [9]. This innovative passive extraction technique enables high-efficiency recovery of intact proteins across a broad molecular weight range (typically 11-245 kDa) within just 10 minutes of shaking, with a median recovery rate of 68% for proteins below 100 kDa [11]. This methodological breakthrough now allows the powerful separation capabilities of SDS-PAGE to be applied to top-down and middle-down proteomics, where analysis of intact proteoforms is essential [11].
Alternative Fractionation Strategies
Beyond gel-based approaches, several other protein-level fractionation techniques offer complementary benefits:
Macroporous Reversed-Phase C18 Chromatography: This liquid-phase fractionation method provides excellent resolution and exceptionally high protein recoveries (>95%), making it particularly valuable for challenging samples such as membrane proteins [8]. The proprietary surface treatment of these columns prevents irreversible adsorption of hydrophobic proteins that typically plague conventional reversed-phase separations.
Solution-Phase, pI-Based Fractionation (OFFGEL Electrophoresis): This system separates proteins according to their isoelectric point while maintaining sample recovery in the liquid phase [8]. Unlike traditional isoelectric focusing in immobilized pH gradient gels, this method eliminates the need for tedious post-separation extraction steps and provides additional pI information that can validate MS-based identifications.
Detailed Experimental Protocols
Standard SDS-PAGE Protocol for Pre-Fractionation
Materials:
- Pre-cast or homemade polyacrylamide gel of appropriate percentage (see Table 1)
- SDS-PAGE running buffer (25 mM Tris base, 192 mM glycine, 0.1% SDS, pH 8.3) [10]
- Protein samples prepared in SDS loading buffer
- Pre-stained molecular weight markers
Procedure:
- Prepare protein samples in SDS loading buffer containing reducing agent (e.g., DTT or β-mercaptoethanol). Heat denature at 70-95°C for 5-10 minutes.
- Load equal amounts of protein (10-50 µg for cell lysates) into gel wells. Include molecular weight markers in a reference lane.
- Assemble electrophoresis apparatus and fill with 1X running buffer.
- Run gel at constant voltage (100 V is standard) for 1-2 hours or until the dye front reaches the bottom of the gel [10].
- Visualize protein separation using compatible staining methods (Coomassie, silver stain, etc.).
PEPPI-MS Workflow for Intact Protein Recovery
Materials:
- Disposable plastic homogenizer (e.g., Bio Masher II) [9]
- PEPPI extraction buffer: 0.05% SDS in 100 mM ammonium bicarbonate [9]
- Aqueous Coomassie Brilliant Blue staining solution [9]
- Rocking or shaking platform
Procedure:
- Following SDS-PAGE separation, stain the gel with aqueous CBB and destain appropriately [9].
- Excise the entire sample lane and divide into fractions based on molecular weight markers. Typically, the region from 245 kDa to 11 kDa is divided into 8 fractions [9].
- For each gel fraction, place the gel piece in a disposable homogenizer and thoroughly grind with a pestle to facilitate extraction.
- Add PEPPI extraction buffer (approximately 3-5 volumes relative to gel volume) and shake vigorously for 10 minutes at room temperature [9].
- Transfer the supernatant containing the extracted proteins to a clean tube.
- Purify recovered proteins through organic solvent precipitation or alternative methods compatible with downstream applications [11].
Integrated Workflow for Deep Plasma Proteome Analysis
Materials:
- Multiple affinity removal column (e.g., for human plasma proteins)
- Macroporous reversed-phase C18 column (4.6 × 50 mm or 4.6 × 100 mm) [8]
- Urea denaturation solution
Procedure:
- Inject 70-300 µL of plasma onto a multiple affinity removal column using manufacturer's recommended buffers to remove highly abundant proteins [8].
- Collect the flow-through fraction containing the low-abundance proteome.
- Denature the immunodepleted sample with urea (final concentration 6-8 M).
- Load the denatured sample directly onto a macroporous reversed-phase C18 column.
- Fractionate proteins using an optimized acetonitrile/water gradient with 0.1% trifluoroacetic acid at elevated temperature (80°C) [8].
- Collect protein fractions across the elution gradient.
- Digest fractions individually with trypsin and analyze by LC-MS/MS.
The Scientist's Toolkit: Essential Research Reagents
Table 3: Essential Research Reagents for Protein-Level Fractionation
| Reagent/Equipment | Function and Application |
|---|---|
| Pre-cast SDS-PAGE Gels | Provide consistent separation performance with minimal preparation time; available in various percentages and formats for different protein size ranges [10]. |
| Multiple Affinity Removal Columns | Selectively remove high-abundance proteins from complex fluids like plasma or serum; essential for biomarker discovery in clinical samples [8]. |
| Macroporous Reversed-Phase C18 Columns | High-recovery fractionation of intact proteins; particularly effective for membrane proteomes due to minimal irreversible binding [8]. |
| PEPPI Extraction Buffer | Enables efficient passive elution of intact proteins from polyacrylamide gels; contains 0.05% SDS in 100 mM ammonium bicarbonate with CBB as enhancer [9]. |
| Aqueous Coomassie Brilliant Blue | Reversible protein stain compatible with PEPPI-MS workflow; enables visualization without compromising downstream MS analysis [9]. |
Protein-level fractionation remains an indispensable strategy for reducing sample complexity in proteomic analyses. The integration of established techniques like SDS-PAGE with innovative approaches such as PEPPI-MS and high-recovery chromatographic methods provides researchers with a powerful toolkit for deep proteome exploration. The protocols and quantitative data presented in this application note offer practical guidance for implementing these methodologies in drug development and basic research settings, enabling more comprehensive protein identification and characterization across diverse sample types. As structural proteomics continues to advance, these fractionation strategies will play an increasingly critical role in bridging the gap between protein identification and functional understanding.
Preparative sodium dodecyl sulfate-polyacrylamide gel electrophoresis (SDS-PAGE) for protein fractionation, followed by gel elution and liquid chromatography-tandem mass spectrometry (GeLC-MS/MS), represents a powerful and robust workflow in proteomic research. This method effectively addresses the challenge of analyzing highly complex protein mixtures by integrating high-resolution protein separation with sensitive mass spectrometric identification. The SDS-PAGE step denatures and separates proteins based on molecular weight, providing a critical fractionation that significantly reduces sample complexity prior to MS analysis. Subsequent in-gel digestion of fractionated proteins and LC-MS/MS analysis enables comprehensive proteome coverage, reliable protein identification, and accurate quantification. This application note details the key advantages, experimental protocols, and practical considerations for implementing preparative SDS-PAGE and GeLC-MS/MS in proteomic studies, particularly highlighting its enhanced proteome coverage, quality control capabilities, and compatibility with diverse sample types.
Key Advantages of the Technology
Enhanced Proteome Coverage
The integration of SDS-PAGE fractionation prior to LC-MS/MS analysis significantly enhances proteome coverage by reducing sample complexity and enabling detection of low-abundance proteins. This multidimensional separation approach distributes the proteome across multiple fractions, decreasing dynamic range limitations and mitigating ion suppression effects during MS analysis.
Table 1: Proteome Coverage Achieved with Different Fractionation Methods
| Separation Method | Number of Proteins Identified | Key Advantages | Reference |
|---|---|---|---|
| GeLC-MS/MS | 856 | Effective complexity reduction; compatible with detergent-containing samples | [12] |
| PAGE-pIEF-LC-MS/MS | 1,287 | Superior coverage; ideal for low-abundance protein detection | [12] |
| pIEF-LC-MS/MS | 647 | High resolution based on isoelectric point | [12] |
| SCASP Method | Comparable to FASP/SP3 | Simple, robust SDS-based preparation; direct digestion without SDS depletion | [13] |
The data demonstrates that combining PAGE with additional separation dimensions dramatically increases proteome coverage. The PAGE-pIEF-LC-MS/MS workflow identified approximately 50% more proteins than GeLC-MS/MS alone, and nearly double the proteins identified by pIEF-LC-MS/MS alone [12]. This enhanced coverage is particularly valuable for detecting low-abundance proteins and post-translationally modified proteoforms that might otherwise be obscured in complex mixtures.
Quality Control and Sample Assessment
A fundamental advantage of preparative SDS-PAGE is the built-in quality control it provides throughout the experimental workflow. Unlike purely solution-based methods, SDS-PAGE enables visual monitoring of protein separation, integrity, and fractionation efficiency at multiple stages:
- Pre-MS Analysis Quality Assessment: Researchers can visually confirm protein separation quality, detect potential degradation (smearing), and verify fractionation boundaries before proceeding to costly MS analysis [14].
- Molecular Weight Verification: The method allows estimation of protein molecular weights by comparing migration distances to standardized markers, providing an additional validation parameter for identifications [14].
- Sample Purity Evaluation: Distinct, well-separated bands indicate pure protein fractions, while smearing or multiple bands may suggest degradation or contamination, enabling researchers to troubleshoot before MS analysis [14].
This visual feedback loop is invaluable for troubleshooting problematic samples and ensuring data quality, particularly when working with challenging sample types or novel experimental conditions.
Compatibility with Diverse and Challenging Samples
Preparative SDS-PAGE exhibits exceptional compatibility with a wide range of sample types, including those containing detergents, salts, and other MS-incompatible components that would typically interfere with LC-MS analysis:
- SDS-Containing Samples: The method naturally accommodates SDS-containing samples, as the detergent is essential for protein denaturation and separation. Recent advances like the SDS-cyclodextrin assisted sample preparation (SCASP) method further enhance compatibility by allowing direct tryptic digestion without SDS depletion steps [13].
- Complex Biological Matrices: SDS-PAGE effectively handles complex samples including tissue homogenates, membrane preparations, and body fluids by separating proteins from non-protein contaminants [15] [16].
- Formalin-Fixed and Paraffin-Embedded (FFPE) Samples: The denaturing conditions effectively reverse formaldehyde cross-links in archived clinical specimens, enabling proteomic analysis of valuable biobank resources [13].
The technology's robustness across diverse sample types makes it particularly valuable for clinical research, biomarker discovery, and analysis of precious limited samples where alternative methods might fail.
Experimental Protocols
Standard GeLC-MS/MS Workflow
The fundamental GeLC-MS/MS protocol involves protein separation by SDS-PAGE, in-gel digestion, and LC-MS/MS analysis. The following detailed methodology ensures optimal results:
Sample Preparation:
- Prepare protein extract in Laemmli buffer (50 mM Tris-HCl, pH 6.8, 2% SDS, 10% glycerol, 5% β-mercaptoethanol, 0.01% bromophenol blue) [17].
- Heat samples at 70°C for 15 minutes to ensure complete denaturation [17].
- For cysteine reduction and alkylation, use Tris(2-carboxyethyl)phosphine (TCEP) and iodoacetamide, respectively, prior to SDS-PAGE [16].
SDS-PAGE Separation:
- Cast discontinuous SDS-polyacrylamide gels with appropriate acrylamide concentration based on target protein size:
- Load prestained molecular weight markers alongside samples for migration monitoring.
- Perform electrophoresis at constant voltage (100-150V) until dye front reaches bottom (~40-60 minutes for mini-gels) [14].
Protein Visualization and Fractionation:
- Stain gels with Coomassie Brilliant Blue, SYPRO Ruby, or compatible fluorescent stains [14].
- Destain with methanol-acetic acid solution until background is clear and protein bands are visible [14].
- Excise entire lanes or specific regions of interest using clean scalpel blades.
- Divide lanes into multiple fractions (typically 10-30 slices) based on molecular weight regions [12].
In-Gel Digestion:
- Destain gel pieces with 50% acetonitrile in 50 mM ammonium bicarbonate [12].
- Dehydrate with 100% acetonitrile and dry in vacuum concentrator.
- Add trypsin solution (10-20 ng/μL in 50 mM ammonium bicarbonate) and incubate at 37°C for 12-16 hours [12] [16].
- Extract peptides with 50% acetonitrile/5% formic acid, followed by 100% acetonitrile.
- Combine extracts and concentrate in vacuum centrifuge.
LC-MS/MS Analysis:
- Reconstitute peptides in 5-20 μL of 5% acetonitrile with 0.1% formic acid [12].
- Analyze by reverse-phase LC-MS/MS using gradient elution (typically 5-38% acetonitrile over 33-120 minutes) [12].
- Operate mass spectrometer in data-dependent acquisition mode, selecting most intense precursors for fragmentation.
Advanced Workflow: PAGE-pIEF-LC-MS/MS
For enhanced proteome coverage, the basic GeLC-MS/MS protocol can be extended with an additional peptide separation dimension:
- After in-gel digestion and peptide extraction, dissolve peptides in 8 M urea with 0.2% IPG buffer [12].
- Separate peptides by in-gel IEF using immobilized pH gradient strips (pH 3-10) [12].
- Fractionate IPG strips into multiple segments (typically 13-36 fractions) [12].
- Extract peptides from each IPG segment and desalt using StageTips or similar methods [12].
- Analyze each fraction by LC-MS/MS separately.
This three-dimensional separation approach (PAGE-pIEF-LC-MS/MS) significantly increases proteome coverage but requires substantially more instrument time and sample handling.
PEPPI-MS for Top-Down Proteomics
For top-down proteomics applications, the PEPPI-MS (Passively Eluting Proteins from Polyacrylamide Gels as Intact Species for MS) method enables efficient recovery of intact proteins:
- Separate proteins by SDS-PAGE and visualize with Coomassie Brilliant Blue [9].
- Excise gel regions of interest and homogenize in disposable plastic homogenizers [9].
- Extract proteins by shaking gel pieces in 0.05% SDS/100 mM ammonium bicarbonate solution for 10 minutes [9].
- Recover extraction solution and purify proteins by organic solvent precipitation.
- Analyze intact proteins by LC-MS using conditions compatible with high molecular weight species.
This method achieves high recovery rates (mean 68% for proteins <100 kDa) and enables top-down proteomics analysis of intact proteoforms [9].
The Scientist's Toolkit: Essential Research Reagents and Materials
Table 2: Essential Research Reagents for Preparative SDS-PAGE and GeLC-MS/MS
| Reagent/Material | Function | Application Notes |
|---|---|---|
| SDS (Sodium Dodecyl Sulfate) | Protein denaturation and uniform charge masking | Critical for disrupting non-covalent interactions and providing mass-based separation [14] |
| Polyacrylamide/Bis-acrylamide | Forming porous gel matrix | Pore size determines separation range; typically 30% stock solution (29:1 acrylamide:bis) [18] |
| Tris(2-carboxyethyl)phosphine (TCEP) | Disulfide bond reduction | More stable than DTT; effective at low concentrations [16] |
| Iodoacetamide | Cysteine alkylation | Prevents reformation of disulfide bonds; use fresh solution [16] |
| Trypsin | Proteolytic digestion | Most common enzyme for bottom-up proteomics; specific for Lys/Arg residues [16] |
| Coomassie Brilliant Blue | Protein staining and extraction enhancer | Compatible with MS; enhances protein recovery in PEPPI-MS [9] |
| Cyclodextrin | SDS complexation in SCASP method | Enables direct digestion without SDS removal; simplifies workflow [13] |
| IodoTMT Reagents | Cysteine-directed isobaric labeling | Enables multiplexed quantitative proteoform analysis in top-down approaches [17] |
Technological Innovations and Optimizations
Recent advancements in preparative SDS-PAGE have addressed longstanding limitations and expanded application possibilities:
Improved Electrophoresis Hardware
Innovative electrode designs, such as double-deck flat electrodes and clamp-shaped electrodes, apply electric fields simultaneously from both top and bottom of gels, creating more uniform migration and reducing band broadening [18]. When combined with field inversion gel electrophoresis (FIGE), these designs enable superior resolution and band sharpness in horizontal SDS-PAGE systems [18].
Alternative SDS-Compatible Protocols
The SDS-cyclodextrin assisted sample preparation (SCASP) method represents a significant simplification of SDS-based workflows. By using cyclodextrin to bind SDS and form CD-SDS complexes in solution, this approach allows direct tryptic digestion without requiring SDS depletion steps, maintaining robustness while reducing processing time [13].
Enhanced Intact Protein Recovery
The development of PEPPI-MS has revolutionized protein recovery from polyacrylamide gels for top-down proteomics. Using Coomassie Brilliant Blue as an extraction enhancer, this method achieves high recovery rates (68% for proteins <100 kDa) through a simple 10-minute shaking protocol, enabling efficient integration of gel-based separation with intact protein MS analysis [9].
Preparative SDS-PAGE combined with GeLC-MS/MS remains a cornerstone technology in proteomics, offering unparalleled advantages in proteome coverage, built-in quality control, and compatibility with diverse and challenging sample types. The continuous innovation in methodologies, from enhanced electrode designs to simplified SDS-compatible protocols, ensures this approach remains relevant in an era of increasingly complex biological questions. For researchers seeking a robust, versatile, and deeply informative proteomics platform, preparative SDS-PAGE with GeLC-MS/MS provides a technically sound solution that balances comprehensive analysis with practical implementation across diverse research environments.
GeLC-MS/MS, which combines one-dimensional sodium dodecyl sulfate-polyacrylamide gel electrophoresis (1D SDS-PAGE) with liquid chromatography-tandem mass spectrometry (LC-MS/MS), represents a robust and reproducible method for qualitative and quantitative proteomic analysis [1]. This technique serves as a powerful analytical approach for fractionating complex protein mixtures at the protein level prior to mass spectrometric analysis, significantly improving proteome coverage [1] [19]. By balancing real-world constraints of sample quantity and instrument availability with the need for optimal proteome coverage, GeLC-MS/MS has found application across nearly every facet of biological research, particularly in drug development studies where characterizing in vitro models is essential [1] [20].
The fundamental principle underlying this workflow involves the size-based separation of proteins by SDS-PAGE, followed by in-gel enzymatic digestion of separated proteins, and subsequent identification and quantification of resulting peptides via LC-MS/MS [1]. This method effectively circumvents challenges posed by sample complexity and wide dynamic range of protein abundances, allowing for isolation of abundant proteins to improve coverage of lower-level proteins [1]. Furthermore, the approach provides the potential to obtain isoform information based on physical separation by molecular weight [1].
Principle of SDS-PAGE Separation
SDS-PAGE is an analytical technique that separates proteins based on their molecular weight [21]. When proteins are electrophoresed through a polyacrylamide gel matrix, smaller proteins migrate faster due to less resistance from the gel matrix [21]. The use of sodium dodecyl sulfate (SDS) and polyacrylamide gel largely eliminates the influence of protein structure and charge, allowing separation based primarily on polypeptide chain length [21].
SDS is a detergent with strong protein-denaturing effects that binds to the protein backbone at a constant molar ratio [21]. In the presence of SDS and reducing agents that cleave disulfide bonds, proteins unfold into linear chains with negative charge proportional to their polypeptide chain length [21]. Polymerized acrylamide forms a mesh-like matrix suitable for separating proteins of typical size, with the gel strength allowing for easy handling [21]. The concentration of acrylamide used determines the resolving power of the gel, with higher concentrations producing smaller pore sizes suitable for separating smaller proteins [21].
Table 1: Key Components of SDS-PAGE and Their Functions
| Component | Function | Technical Considerations |
|---|---|---|
| SDS (Sodium Dodecyl Sulfate) | Denatures proteins and confers negative charge proportional to mass [21] | Ensures separation based primarily on molecular weight |
| Polyacrylamide Gel | Forms porous matrix that separates proteins by size [21] | Concentration typically 6-15%; higher % for smaller proteins [21] |
| Reducing Agent (DTT, β-mercaptoethanol) | Cleaves disulfide bonds for complete unfolding [21] [1] | Essential for proper denaturation of structured proteins |
| Stacking Gel | Concentrates proteins before entering separating gel [21] | Creates discontinuous pH system for sharp bands |
A modification termed native SDS-PAGE (NSDS-PAGE) has been developed to retain functional protein properties while maintaining high resolution [22]. This method involves removing SDS and EDTA from sample buffers, omitting the heating step, and reducing SDS concentration in the running buffer, resulting in retained Zn²⁺ binding in proteomic samples increasing from 26% to 98% compared to standard denaturing conditions [22].
Experimental Protocols
Protein Extraction and Sample Preparation
Efficient protein extraction and isolation prior to GeLC-MS/MS is critical for obtaining an accurate representation of the proteome under study [1]. Proteins can be prepared from various sources including tissues, bodily fluids, cell culture, or immunoprecipitations [1].
Key Steps:
- Mechanical Lysis: Perform mechanical lysis of tissues or cells using appropriate homogenization techniques [1].
- Solubilization: Solubilize proteins in buffer, noting that some protein classes require strong detergents or chaotropes for effective solubilization [1].
- Subcellular Fractionation: Apply subcellular fractionation approaches when specific organellar proteomes are of interest [1].
- Sample Buffer Preparation: Add LDS sample buffer (4×) to protein samples with or without reducing agent [1].
- Denaturation: Heat samples at 70°C for 10 minutes [1].
- Clarification: Centrifuge heated samples at 2,400 × g for 30 seconds to pellet insoluble material [1].
For samples containing incompatible detergents or chaotropes (such as guanidine hydrochloride), protein precipitation prior to solubilization in sample buffer is recommended to avoid streaking and aberrant protein migration during electrophoresis [1].
SDS-PAGE Separation
The following protocol describes the detailed steps for protein separation by SDS-PAGE as part of the GeLC-MS/MS workflow [21] [1]:
Table 2: SDS-PAGE Protocol Components and Conditions
| Step | Components | Conditions |
|---|---|---|
| Gel Preparation | Glass plates, comb, spacer, binder clips [21] | Clean plates with ethanol; assemble casting mold [21] |
| Separating Gel | Acrylamide solution (6-15% depending on target protein size) [21] | Polymerize for 20-30 min; overlay with water to prevent oxygen inhibition [21] |
| Stacking Gel | Low-concentration acrylamide solution [21] | Insert comb after pouring; polymerize to form wells [21] |
| Sample Preparation | Sample buffer (4× LDS), reducing agent (DTT or β-mercaptoethanol) [1] | Heat at 100°C for 3 min; centrifuge at 15,000 rpm for 1 min at 4°C [21] |
| Electrophoresis | Running buffer (e.g., MES SDS), power supply [21] [1] | Run at constant voltage (200V) until dye front reaches bottom [21] [22] |
Detailed Procedure:
- Gel Casting: Gather combs, glass plates, spacers, and binder clips. Thoroughly clean glass plates with ethanol and assemble the gel casting mold [21].
- Separating Gel: Pour acrylamide solution for the separating gel. Overlay with water, isopropanol, or ethanol to prevent contact with air (oxygen inhibits polymerization). Allow acrylamide to polymerize for 20-30 minutes to form a gel, then remove the overlaid liquid [21] [23].
- Stacking Gel: Pour acrylamide solution for the stacking gel, insert a comb, and allow the acrylamide to polymerize [21].
- Gel Assembly: Remove binder clips, spacer, and comb from the gel assembly, and mount the gel in the electrophoresis apparatus using binder clips [21].
- Buffer Addition: Pour running buffer into the upper and lower chambers of the electrophoresis apparatus, and remove air bubbles and small pieces of gel from the wells and under the gel using a syringe [21].
- Sample Loading: Load samples and molecular weight markers in wells [21].
- Electrophoresis: Turn on the power supply, and run the gel until the dye (BPB) in the sample buffer reaches the bottom of the gel [21].
To prevent gel leakage during casting, ensure glass plates are properly aligned and firmly pressed against rubber tubing in the gasket [23]. For optimal results, avoid reusing running buffer from the cathode (inner compartment) to prevent contamination that can cause non-specific bands [23].
In-Gel Digestion Protocol
Following electrophoresis, the entire gel lanes are excised and subdivided into bands for in-gel digestion [1]. The protocol below is based on the original in-gel digestion approach by Rosenfeld et al. with subsequent modifications [1]:
Materials:
- Clean glass plate (large enough for gel placement)
- Gel-cutting devices (razor blades, surgical scalpel)
- Low-protein-binding microcentrifuge tubes (0.65 or 1.5 mL)
- Gel-loading pipette tips
- SpeedVac concentrator
- 25 mM ammonium bicarbonate
- Destain solution: 25 mM ammonium bicarbonate/50% acetonitrile
- Extraction solution: 1% formic acid
- Tris[2-carboxyethyl]phosphine (TCEP)-HCl stock: 5 mM in 25 mM ammonium bicarbonate
- Iodoacetamide (IAM) stock: 20 mM in 25 mM ammonium bicarbonate (prepare fresh, light sensitive)
- Trypsin (10 ng/μL in 25 mM ice-cold ammonium bicarbonate) [1]
Procedure:
- Gel Excision: Excise entire gel lanes and subdivide into bands of interest [1].
- Destaining: Destain gel pieces using 25 mM ammonium bicarbonate/50% acetonitrile to remove Coomassie blue or other stains [1].
- Reduction: Add TCEP solution to reduce disulfide bonds [1].
- Alkylation: Add fresh iodoacetamide solution to alkylate cysteine residues [1].
- Digestion: Add trypsin solution to gel pieces for protein digestion [1].
- Peptide Extraction: Extract peptides from gel pieces using extraction solution (1% formic acid) [1].
- Concentration: Concentrate extracted peptides using a SpeedVac concentrator [1].
LC-MS/MS Analysis
The final stage involves analysis of extracted peptides by liquid chromatography-tandem mass spectrometry [1].
Materials:
- Formic acid (LC/MS grade)
- Solvent A: 0.1% formic acid in double-distilled water
- Solvent B: 0.1% formic acid in acetonitrile (LC/MS grade)
- Trap column: ZORBAX 300SB-C18, 5 × 0.3 mm, 5 μm
- Analytical column: Self-packed, KaSil fritted 100 μm i.d. × 150 mm fused silica capillary packed with Synergi C18 resin
- High-performance LC system capable of nanoliter flow rates with chilled autosampler
- Mass spectrometer with tandem MS capabilities [1]
Chromatography Conditions:
- Mobile phase A: 0.1% formic acid in water
- Mobile phase B: 0.1% formic acid in methanol or acetonitrile
- Column temperature: 45°C
- Injection volume: 1 μL
- Flow rate: 0.15 mL/min with gradient elution [24]
- Gradient program: Initial 20% B, increase to 70% B over 2.0 min, hold for 5.0 min, flush at 90% B for 1.5 min, then re-equilibrate at 20% B [24]
Mass Spectrometry Parameters:
- Ionization: Electrospray ionization (ESI)
- Scan mode: Positive multiple reaction monitoring (MRM) or data-dependent acquisition
- Mass analyzer: Triple quadrupole or high-resolution mass spectrometer (e.g., LTQ Orbitrap) [1] [24]
The Scientist's Toolkit: Essential Research Reagent Solutions
Table 3: Key Research Reagent Solutions for GeLC-MS/MS Workflow
| Reagent/Material | Function | Application Notes |
|---|---|---|
| Polyacrylamide Gel | Forms porous matrix for protein separation [21] | 4-12% Bis-Tris gradient gels common; concentration depends on target protein size [1] |
| SDS Running Buffer | Provides ions for conduction and SDS to maintain protein charge [21] [22] | Standard: 0.1% SDS; NSDS-PAGE: 0.0375% SDS for native conditions [22] |
| LDS Sample Buffer | Denatures proteins and provides tracking dye [1] | Contains glycerol, Tris, LDS, EDTA, Serva Blue G250, phenol red [22] |
| Reducing Agent (DTT) | Cleaves disulfide bonds for complete denaturation [21] [1] | Essential for proper unfolding of structured proteins |
| Coomassie Stain | Visualizes separated proteins after electrophoresis [1] | 0.1% Coomassie Brilliant Blue G250 in 10% acetic acid, 40% methanol [1] |
| Ammonium Bicarbonate | Buffer for in-gel digestion steps [1] | 25 mM solution used for destaining, trypsin dilution, and reagent preparation [1] |
| Sequencing Grade Trypsin | Proteolytic enzyme for protein digestion [1] | Specific cleavage at C-terminal of lysine and arginine; 10 ng/μL concentration [1] |
| TCEP & Iodoacetamide | Reduces and alkylates cysteine residues [1] | Prevents disulfide bond reformation; alkylation must be performed in dark with fresh reagent [1] |
| Formic Acid/ACN | Peptide extraction and LC-MS mobile phase [1] | 1% formic acid for extraction; 0.1% in water/ACN for LC-MS [1] |
Workflow Visualization
The following diagram illustrates the complete GeLC-MS/MS workflow from sample preparation to data analysis:
The GeLC-MS/MS workflow provides an effective and robust strategy for proteomic analysis of complex protein mixtures [1]. By combining the high resolving power of SDS-PAGE with the sensitivity and specificity of LC-MS/MS, this approach enables comprehensive protein identification and quantification across a wide dynamic range of abundances [1]. The method is particularly valuable for samples containing a wide range of protein abundances, as protein-level separation allows for isolation of abundant proteins, thereby improving coverage of lower-level proteins [1].
Successful implementation of this technique requires attention to critical steps including efficient protein extraction, optimal SDS-PAGE conditions, thorough in-gel digestion, and appropriate LC-MS/MS parameters [1]. The protocols and reagents outlined in this application note provide researchers with a solid foundation for establishing GeLC-MS/MS in their laboratories, enabling robust proteomic characterization for basic research and drug development applications [1] [20]. As proteomic technologies continue to advance, GeLC-MS/MS remains a cornerstone method for protein-level fractionation that balances analytical depth with practical implementation considerations [1].
Optimized GeLC-MS/MS Protocols: From Sample Preparation to Peptide Extraction
Efficient Protein Extraction Strategies for Cell Cultures, Tissues, and Body Fluids
Efficient protein extraction is a critical first step in proteomic workflows, especially those involving preparative SDS-PAGE for protein fractionation prior to GeLC-MS/MS analysis. The quality and reproducibility of protein extraction directly impact the depth of proteome coverage and the reliability of downstream mass spectrometry results. This application note provides detailed protocols and strategic guidance for optimizing protein extraction from diverse biological samples, including cell cultures, tissues, and various body fluids, within the context of a comprehensive GeLC-MS/MS research pipeline.
Protein Extraction Fundamentals
Protein extraction aims to solubilize proteins completely while maintaining their integrity and preventing modifications that could compromise subsequent analysis. Efficient extraction requires disrupting cellular structures, inactivating endogenous proteases, and solubilizing proteins in a compatible buffer system. The ideal extraction method provides high yield, excellent reproducibility, and compatibility with downstream processes including SDS-PAGE separation and mass spectrometry analysis.
Sample-Specific Extraction Protocols
Single-Step Extraction for Cell Cultures and Tissues
A recently developed single-step protocol offers significant advantages for protein extraction from mammalian cell lines and tissue samples, providing compatibility with both gel-based and gel-free proteomic approaches [25].
Materials:
- Modified lysis buffer: 7 M Urea, 2 M Thiourea, 10 mM Tris-Cl (pH 8.5)
- Pre-chilled PBS for washing
- Cell scrapers (for adherent cultures)
- Refrigerated centrifuge
- Sonicator with microtip
Protocol:
- Sample Preparation:
- Cell Cultures: Wash cells twice with pre-chilled PBS. For adherent cells, scrape directly in lysis buffer.
- Tissues: Snap-freeze in liquid nitrogen and pulverize using a mortar and pestle or cryogenic grinder.
Lysis Procedure:
- Add modified lysis buffer directly to cell pellets or powdered tissues (recommended buffer-to-sample ratio: 5:1 v/w).
- Vortex vigorously for 30 seconds to homogenize.
- Sonicate on ice with 3 pulses of 10 seconds each at 30% amplitude, with 20-second intervals between pulses.
Clarification:
- Centrifuge at 16,000 × g for 20 minutes at 4°C.
- Carefully transfer the supernatant (containing solubilized proteins) to a fresh tube.
- Determine protein concentration using a compatible assay (e.g., Bradford or BCA).
Compatibility Notes:
- This method eliminates the need for detergent CHAPS, enhancing MS compatibility.
- The protocol is rapid, requiring approximately 30 minutes from sample to soluble protein extract.
- Yields are typically 20-30% higher compared to conventional multi-step methods [25].
Body Fluid Sample Preparation
Body fluids present unique challenges due to their complex composition, wide dynamic range of protein abundances, and potential contaminants. Standardized preparation is essential for reproducible results in biomarker discovery studies [26].
Materials:
- High-Select Top14 Abundant Protein Depletion Mini Spin Columns (or similar)
- Protein precipitation reagents: acetone, methanol, or trichloroacetic acid
- Protease inhibitor cocktails
- Centrifugal filtration devices (e.g., 10-kDa cutoff)
Protocol:
- Initial Processing:
- Centrifuge all body fluid samples at 12,000 × g for 10 minutes at 4°C to remove cells and debris.
- Collect supernatant and determine protein concentration using Bradford assay.
High-Abundance Protein Depletion (for plasma/serum):
- Process samples through abundant protein depletion columns according to manufacturer's instructions.
- This step is crucial for improving detection of low-abundance proteins.
Protein Extraction and Cleanup:
- Precipitate proteins using ice-cold acetone (4:1 ratio, acetone:sample) at -20°C for 4 hours or overnight.
- Centrifuge at 12,000 × g for 15 minutes at 4°C to pellet proteins.
- Wash pellet twice with pre-chilled 80% acetone.
- Air-dry pellet briefly and resuspend in appropriate buffer for SDS-PAGE.
Alternative Methods:
- Ultrafiltration: Use centrifugal filtration devices to concentrate proteins and remove salts.
- Ultrasonic-assisted membrane methods can improve digestion efficiency for urine proteomics [26].
GeLC-MS/MS Optimized Preparation
For samples destined specifically for GeLC-MS/MS analysis, protein extraction must be optimized to ensure compatibility with in-gel digestion and mass spectrometry [1].
Materials:
- LDS sample buffer (4×)
- Reducing agent: Dithiothreitol (DTT) or β-mercaptoethanol
- Alkylating agent: Iodoacetamide (IAM)
- Pre-cast Bis-Tris polyacrylamide gels (4-12% gradient)
- MES SDS running buffer
Protocol:
- Protein Solubilization:
- Combine extracted proteins with LDS sample buffer and 10× reducing agent.
- Heat at 70°C for 10 minutes to denature proteins.
- Centrifuge at 2,400 × g for 30 seconds to pellet insoluble material.
SDS-PAGE Separation:
- Load prepared samples onto pre-cast Bis-Tris 4-12% gradient gels.
- Run at constant voltage (typically 150-200V) until the dye front approaches the bottom.
- Note: Minimal electrophoresis time is required; the goal is mild fractionation, not complete separation.
In-Gel Processing:
- Fix and stain gels with Coomassie Brilliant Blue-based stain.
- Destain until background is clear and protein bands are visible.
- Excise entire gel lanes and subdivide into 10-15 bands of equal size.
- Process each band for in-gel tryptic digestion following standard protocols [1].
Comparative Analysis of Extraction Methods
Table 1: Protein Extraction Method Comparison for Different Sample Types
| Sample Type | Recommended Method | Average Yield | Processing Time | Key Advantages | MS Compatibility |
|---|---|---|---|---|---|
| Mammalian Cell Cultures | Single-step urea/thiourea method [25] | 20-30% higher than conventional methods | ~30 minutes | Minimal steps, high reproducibility, no detergent | Excellent |
| Tissue Samples | Single-step urea/thiourea method with homogenization [25] | 15-25% higher than conventional methods | ~45 minutes | Effective for complex matrices, high proteome coverage | Excellent |
| Plasma/Serum | Abundant protein depletion + acetone precipitation [26] | Varies with depletion efficiency | 4-6 hours (including depletion) | Enhanced low-abundance protein detection | Good to Excellent |
| Urine | Ultrasonic-assisted membrane method [26] | High recovery from dilute samples | ~2 hours | Efficient salt removal, compatible with membrane digestion | Excellent |
| CSF | Acetone precipitation [26] | >80% recovery | ~3 hours | Simplifies complex sample, concentration of low-abundance proteins | Good |
Table 2: Troubleshooting Common Protein Extraction Issues
| Problem | Potential Causes | Solutions | Preventive Measures |
|---|---|---|---|
| Low Protein Yield | Incomplete cell/tissue disruption, protein precipitation inefficiency | Optimize homogenization, extend precipitation time, increase precipitation reagent ratio | Include protease inhibitors, maintain cold temperatures, validate precipitation efficiency |
| Poor SDS-PAGE Resolution | Incomplete solubilization, nucleic acid contamination, salt carryover | Add Benzonase for nucleic acid degradation, desalt via dialysis or filtration, optimize detergent concentration | Use high-quality reagents, ensure complete dissolution of pellets, include chaotropes |
| MS Signal Suppression | Detergent contamination, polymer leaching, salt residues | Implement detergent removal columns, use MS-compatible reagents, extensive washing of gel pieces | Avoid incompatible detergents (e.g., SDS), use high-purity reagents, optimize desalting |
| Protein Degradation | Protease activity, repeated freeze-thaw cycles | Fresh protease inhibitors, single-use aliquots, work quickly on ice | Prepare fresh inhibitors, flash-freeze samples, minimize handling time |
Research Reagent Solutions
Table 3: Essential Materials for Protein Extraction and Processing
| Reagent/Category | Specific Examples | Function/Application | Compatibility Notes |
|---|---|---|---|
| Chaotropic Agents | Urea (7 M), Thiourea (2 M) [25] | Protein denaturation and solubilization without interfering detergents | MS-compatible; avoid heating above 37°C to prevent carbamylation |
| Detergents | SDS (0.1-1%), LDS | Membrane protein solubilization, electrophoresis | Must be removed or minimized for MS analysis; incompatible with MS |
| Reducing Agents | DTT (1-10 mM), TCEP (5-10 mM) [1] | Breakage of disulfide bonds for complete denaturation | TCEP more stable than DTT; use fresh solutions |
| Alkylating Agents | Iodoacetamide (20-50 mM) [1] | Cysteine alkylation to prevent reformation of disulfide bonds | Prepare fresh, protect from light, do not over-alkylate |
| Protease Inhibitors | PMSF, protease inhibitor cocktails | Prevention of protein degradation during extraction | Use broad-spectrum cocktails for complex samples |
| Depletion Kits | High-Select Top14 Abundant Protein Depletion | Removal of high-abundance proteins from plasma/serum | Critical for detecting low-abundance biomarkers |
| Digestion Enzymes | Trypsin (sequencing grade) | Protein digestion for bottom-up proteomics | Must be sequencing grade for reliable MS identification |
Integrated Workflow Visualization
Optimizing protein extraction strategies for specific sample types significantly enhances the quality and depth of proteomic analysis in GeLC-MS/MS workflows. The single-step extraction method provides an efficient approach for cell cultures and tissues, offering improved yields and reproducibility while maintaining compatibility with downstream applications. For complex body fluids, targeted preparation methods including abundant protein depletion and efficient precipitation are essential for comprehensive proteome coverage. By implementing these standardized protocols and utilizing appropriate reagent systems, researchers can achieve more reliable and reproducible results in their proteomic studies, ultimately advancing biomarker discovery and drug development efforts.
In GeLC-MS/MS-based proteomics, sample preparation is a critical determinant of success. The processes of protein denaturation, reduction, and alkylation are indispensable steps for converting complex protein mixtures into peptides amenable to mass spectrometric analysis. These steps ensure complete protein unfolding, break disulfide bonds, and prevent their reformation, thereby facilitating efficient protease digestion and enabling accurate protein identification. Within the context of preparative SDS-PAGE for protein fractionation, optimization of these chemical steps is paramount for achieving maximal protein coverage and reliable quantification, particularly when analyzing limited samples or low-abundance proteins. This application note provides detailed protocols and data-driven recommendations for implementing these foundational procedures within a GeLC-MS/MS workflow.
The Scientist's Toolkit: Essential Reagents for Protein Chemistry
The following table catalogues key reagents used in protein reduction and alkylation, providing researchers with a concise overview of standard options and their properties.
Table 1: Research Reagent Solutions for Protein Reduction and Alkylation
| Reagent Category | Specific Reagents | Primary Function | Key Considerations |
|---|---|---|---|
| Reducing Agents | Dithiothreitol (DTT), Tris(2-carboxyethyl)phosphine (TCEP), β-mercaptoethanol (BME) [27] | Breaks disulfide bonds between cysteine residues [16] | TCEP is less susceptible to oxidation; DTT and BME are sulfur-containing [27] [28] |
| Alkylating Agents | Iodoacetamide (IAA), Chloroacetamide (CAA), Acrylamide (AA) [27] [29] | Covalently modifies cysteine SH-groups to prevent reformation of disulfide bonds [30] | IAA can cause methionine modifications; CAA shows fewer side-reactions [27] [29] |
| Chaotropic Agents | Urea, Thiourea [16] | Denatures proteins and solubilizes hydrophobic regions [16] | Must be of high purity; often used in combination with detergents [16] |
| Proteases | Trypsin, Lys-C [16] | Enzymatically digests proteins into peptides for LC-MS/MS analysis [16] | Trypsin is most common; enzyme-to-substrate ratio and incubation time are critical [16] |
Experimental Protocols for GeLC-MS/MS Sample Preparation
Protocol 1: In-Solution Denaturation, Reduction, and Alkylation for Filter-Aided Sample Preparation (FASP)
This protocol is adapted for processing protein samples prior to digestion in solution, which can then be fractionated by techniques such as strong anion exchange (SAX) before LC-MS/MS analysis [27].
Protein Denaturation and Reduction:
Alkylation:
Digestion and Desalting:
- Proceed with FASP digestion using 30 kDa molecular weight cutoff filters. Wash with 8 M urea in TRIS-HCl (pH 8.5) to remove SDS, then with 0.05 M NH₄HCO₃ (pH 7.8) [27].
- Add trypsin (1:100 enzyme-to-protein ratio) in 0.05 M NH₄HCO₃ and incubate overnight at 37°C in a wet chamber [27].
- Elute peptides, desalt using Oasis HLB cartridges, and dry in a vacuum centrifuge prior to fractionation or LC-MS/MS analysis [27].
Protocol 2: In-Gel Reduction and Alkylation Following SDS-PAGE
This protocol is used after protein separation by SDS-PAGE and excision of gel bands, a core step in the GeLC-MS/MS workflow [1].
Gel Preparation:
- Following electrophoresis, fix and stain the gel with a Coomassie Brilliant Blue-based stain. Destain with a solution of 25% methanol and 7.5% glacial acetic acid until bands are visible [1].
- Excise protein bands of interest and transfer to low-protein-binding microcentrifuge tubes.
Destaining and Dehydration:
- Wash gel pieces with 25 mM ammonium bicarbonate (AmBic).
- Destain by adding 25 mM AmBic in 50% acetonitrile (ACN), vortexing, and incubating until the blue color is removed. Remove the liquid and dehydrate the gel pieces with 100% ACN [1].
Reduction:
- Prepare a 5 mM solution of TCEP-HCl in 25 mM AmBic. Add enough solution to cover the gel pieces and incubate at the manufacturer's recommended temperature and time (e.g., 56°C for 30 minutes) [1].
Alkylation:
- Remove the reduction solution and add a freshly prepared 20 mM solution of iodoacetamide in 25 mM AmBic.
- Incubate in the dark at room temperature for 30 minutes [1].
- Remove the alkylation solution and wash the gel pieces sequentially with 25 mM AmBic and 100% ACN to dehydrate.
In-Gel Digestion:
- Add a trypsin solution (10 ng/µL in 25 mM ice-cold AmBic) to cover the dehydrated gel pieces. Allow the gel to absorb the trypsin solution on ice for 30-60 minutes.
- Remove excess trypsin solution, add a minimal volume of 25 mM AmBic to keep the gel pieces wet, and incubate overnight at 37°C [1].
- Extract peptides from the gel matrix using an extraction solution such as 1% formic acid, followed by 50% ACN. Pool and dry the extracts for LC-MS/MS analysis.
Systematic Evaluation of Reagent Performance
The choice of reducing and alkylating reagents significantly impacts the number of peptide and protein identifications in a GeLC-MS/MS workflow. Systematic comparisons reveal that while reducing agents perform similarly, alkylating agents show considerable variation in performance and side-reaction profiles.
Table 2: Comparative Performance of Reduction and Alkylation Reagents in Proteomic Workflows
| Reagent | Number of Peptide Spectral Matches (PSMs) | Cysteine Alkylation Efficiency | Major Side Reactions / Negative Attributes |
|---|---|---|---|
| DTT (Reducing Agent) | High performance for in-solution and in-gel digested samples [27] | N/A | Traditional, well-understood reagent [27] |
| TCEP (Reducing Agent) | Comparable to DTT [28] | N/A | Less susceptible to oxidation than DTT; operates over a wider pH range [27] [28] |
| β-Mercaptoethanol (Reducing Agent) | High performance for in-gel digested samples [27] | N/A | Frequently used in molecular biology buffers [27] |
| Iodoacetamide (IAA) | High, but lower for methionine-containing peptides [27] [29] | High [28] | Carbamidomethylation of methionine (up to 80% of peptides) [27] [29]; prominent neutral loss during MS/MS; induces Met-to-isoThr conversion [29] |
| Chloroacetamide (CAA) | Superior to IAA and other alkylating agents in number of identified peptides [29] | High [29] | Fewer off-site reactions; minimal Met-to-isoThr conversion; recommended for proteogenomics [29] |
| Acrylamide (AA) | Best results as alkylation reagent in systematic evaluation [27] | Good | Can occur spontaneously from unpolymerized polyacrylamide gels [29] |
Workflow Integration and Data-Driven Decision Making
The reduction and alkylation steps are integral components of the broader GeLC-MS/MS workflow, which leverages the power of SDS-PAGE for protein-level fractionation to reduce sample complexity prior to mass spectrometry.
GeLC-MS/MS Protein Analysis Workflow
The workflow diagram illustrates the central role of reduction and alkylation. The critical function of alkylation is to prevent reformation of disulfide bonds after reduction, ensuring cysteine residues remain permanently modified. This prevents peptides from being linked together, which would complicate chromatography and MS/MS analysis, and ensures that all peptides, including those containing cysteine, can be identified.
Key Considerations for Reagent Selection
- Minimizing Side Reactions: Iodoacetamide, while widely used, leads to carbamidomethylation of methionine side chains. This modification causes a prominent neutral loss during electrospray ionization or MS/MS fragmentation, strongly decreasing identification rates of methionine-containing peptides [27]. For studies where comprehensive coverage of the proteome is desired, particularly in proteogenomics where single peptide identifications are critical, chloroacetamide is a superior choice due to its fewer side reactions [29].
- Optimization of Alkylation Conditions: For IAA, key parameters to optimize include concentration, temperature, and reaction time. Alkylation should be performed in the dark to prevent reagent degradation, and the reaction must be carefully quenched to avoid over-alkylation or other side reactions with amino acids besides cysteine [28].
- Impact on Proteogenomics: Artifactual methionine to isothreonine conversion, which is more prevalent with IAA, can mimic a genuine methionine to threonine substitution at the protein level caused by a genomic single nucleotide polymorphism (SNP). This is a critical consideration for proteogenomic studies, where distinguishing sample preparation artifacts from true biological variants is paramount [29].
Robust and reproducible sample preparation is the foundation of successful GeLC-MS/MS research. The selection and application of reducing and alkylating reagents are not mere routine steps but are critical factors that directly impact experimental outcomes. Evidence-based protocols demonstrate that while several reducing agents (DTT, TCEP, BME) are effective, the choice of alkylating agent requires careful consideration. Chloroacetamide emerges as a highly effective reagent, providing high cysteine alkylation efficiency with minimal side reactions, thereby maximizing peptide identifications and the depth of proteome coverage. By integrating these optimized denaturation, reduction, and alkylation practices into a preparative SDS-PAGE workflow, researchers can significantly enhance the rigor and reproducibility of their structural proteomics and biomarker discovery efforts.
In the field of mass spectrometry-based proteomics, GeLC-MS/MS has established itself as a robust and reproducible method for the qualitative and quantitative analysis of complex protein mixtures [1]. This method involves separating a protein lysate by 1D SDS-PAGE, slicing the entire gel lane into multiple fractions, performing in-gel digestion, and analyzing the resulting peptides by LC-MS/MS [1]. While powerful, conventional in-gel digestion (IGD) procedures present significant bottlenecks in large-scale experiments because each processing step must be repeated individually for every gel slice [2]. The Whole-Gel (WG) processing procedure addresses this limitation by performing key preparation steps on the intact gel before slicing, dramatically reducing hands-on time while maintaining performance comparable to conventional methods [2].
The WG procedure represents a significant technical innovation for laboratories engaged in large-scale differential proteomics, particularly in clinical research where sample numbers can be high and processing efficiency is paramount [2]. By streamlining the most labor-intensive aspects of sample preparation, this method enables researchers to process dozens of samples simultaneously without compromising the quality of protein identification or quantification data. This protocol is especially valuable for core facilities servicing multiple collaborators and dealing with diverse sample types, as it maintains the quality control advantages of visual SDS-PAGE assessment while overcoming the scalability limitations of traditional in-gel digestion approaches [2].
Comparative Workflow Analysis: WG vs. Conventional IGD
Fundamental Workflow Differences
The table below summarizes the key differences between the Whole-Gel procedure and conventional in-gel digestion:
Table 1: Core Differences Between Whole-Gel and In-Gel Digestion Procedures
| Aspect | Whole-Gel (WG) Procedure | Conventional In-Gel Digestion (IGD) |
|---|---|---|
| Initial Step | Protein separation via SDS-PAGE | Protein separation via SDS-PAGE |
| Processing Order | Washing, reduction, alkylation on intact gel | Immediate gel slicing after separation |
| Hands-on Time | Minimal; single processing vessel | Extensive; scales linearly with slice count |
| Scalability | Excellent for large sample numbers | Becomes prohibitive beyond ~10 slices |
| Slicing Step | After destaining, immediately before trypsin addition | Immediately after separation/destaining |
Visual Workflow Comparison
The following diagram illustrates the procedural differences between the conventional and WG approaches:
Step-by-Step Whole-Gel Protocol
Pre-Electrophoresis Sample Preparation
Protein Extraction and Denaturation
- Extract proteins from biological samples using appropriate lysis methods (e.g., needle lysis, Dounce homogenization, sonication) with compatible buffer systems (e.g., 8 M urea, 2% SDS) [31].
- Determine protein concentration using Bradford, BCA, or equivalent assay [31].
Reduction and Alkylation
- Add 5 mM TCEP (tris(2-carboxyethyl)phosphine) to the protein sample and incubate at room temperature for 20 minutes to reduce disulfide bonds [31].
- Add 10 mM iodoacetamide (IAA) to alkylate free cysteines and incubate in the dark at room temperature for 20 minutes [31].
- Quench the reaction with 10 mM DTT (dithiothreitol), incubating in the dark for 20 minutes [31].
Protein Precipitation (for samples requiring cleanup)
- For concentrated samples (>500 μg/mL), use methanol-chloroform precipitation [31]:
- Dilute sample to ~100 μL
- Add 400 μL 100% methanol, vortex
- Add 100 μL 100% chloroform, vortex
- Add 300 μL water, vortex
- Centrifuge at 14,000 × g for 1 minute
- Remove aqueous and organic layers, retaining protein disk
- Wash with 400 μL 100% methanol, vortex, and centrifuge
- For dilute samples, TCA-acetone precipitation is recommended [31].
SDS-PAGE Separation and Staining
Gel Electrophoresis
- Resuspend precipitated protein pellets in SDS sample buffer [31].
- Load samples onto an appropriate SDS-PAGE gel (e.g., 4-12% Bis-Tris gradient gel) [1] [31].
- Run gel at 100-150V for 40-60 minutes or until the dye front reaches the bottom [14].
Visualization
- Stain the gel with a mass spectrometry-compatible Coomassie Brilliant Blue-based stain [1] [31].
- Destain the gel using 25 mM ammonium bicarbonate/50% acetonitrile until protein bands are visible against a clear background [1].
Whole-Gel Processing and Digestion
Whole-Gel Processing Steps
- Washing: Perform all washing steps on the intact gel placed in a suitable container using 25 mL of appropriate solutions [2].
- Reduction: Add reduction solution to cover the entire gel and incubate [2].
- Alkylation: Replace with alkylation solution and incubate in the dark [2].
- Final Wash: Complete the processing with a final washing step to prepare the gel for slicing [2].
Gel Slicing and Digestion
- Carefully slice the entire gel lane into 5-20 equal fractions using a scalpel or gel-cutting device, guided by pre-stained protein markers [2].
- Transfer gel slices to low-protein-binding microcentrifuge tubes [1].
- Add trypsin working solution (10-20 ng/μL in 25 mM ammonium bicarbonate) to cover the gel pieces [1] [31].
- Incubate overnight at 37°C to allow complete protein digestion [2].
Peptide Extraction
- Add peptide extraction solution (1% formic acid, 75% acetonitrile) to each gel slice [31].
- Incubate with agitation for 15 minutes [1].
- Transfer the supernatant to a new tube [1].
- Repeat extraction twice and combine all extracts [1].
- Concentrate peptides using a SpeedVac concentrator [1].
- Desalt peptides using C18 StageTips or equivalent method [31].
- Reconstitute in MS loading buffer (5% formic acid, 5% acetonitrile) for LC-MS/MS analysis [31].
Performance Validation and Applications
Quantitative Performance Comparison
Experimental validation demonstrates that the WG procedure performs comparably to conventional IGD in both protein identification and quantification:
Table 2: Performance Comparison Between WG and IGD Procedures
| Performance Metric | Whole-Gel Procedure | Conventional IGD | Experimental Results |
|---|---|---|---|
| Protein Identification Overlap | 85-95% (HCT116 cell lysate) | Reference standard | Highly similar identification patterns [2] |
| Quantitative Correlation | R² = 0.94 (spectral counting) | Reference standard | Nearly identical quantitative response [2] |
| Reproducibility (triplicate analysis) | >88% ID overlap, CV <20% | Not reported | Suitable for differential expression studies [2] |
| Mr Consistency | Consistent with marker lane | Reference standard | Median calculated Mr matches expected ranges [2] |
Time Efficiency Analysis
The major advantage of the WG procedure becomes evident when processing multiple samples. The hands-on time comparison reveals dramatic efficiency gains:
Table 3: Processing Time Comparison for Different Sample Throughputs
| Processing Stage | 10 Gel Slices (IGD) | 10 Gel Slices (WG) | 90 Gel Slices (IGD) | 90 Gel Slices (WG) |
|---|---|---|---|---|
| Pre-digestion Processing | Moderate | Moderate | Prohibitive | Manageable |
| Trypsin Incubation | Overnight (both methods) | Overnight (both methods) | Overnight (both methods) | Overnight (both methods) |
| Peptide Extraction | Similar for both methods | Similar for both methods | Similar for both methods | Similar for both methods |
| Total Hands-on Time | Marginal difference | Marginal difference | Significantly higher | Significantly lower |
Research Applications
The WG procedure is particularly suited for the following research scenarios:
- Large-scale differential proteomics experiments requiring analysis of multiple sample conditions [2].
- Clinical proteomics studies with relatively high sample numbers, such as biomarker discovery from patient tissues [2].
- Cell line characterization projects involving multiple cell types or treatment conditions [2].
- Formalin-fixed paraffin-embedded (FFPE) tissue analysis, where the method has demonstrated high reproducibility [2].
- Core facility operations servicing multiple collaborators with diverse sample types [2].
Essential Research Reagent Solutions
Successful implementation of the WG procedure requires the following key reagents and materials:
Table 4: Essential Research Reagents for Whole-Gel Processing
| Reagent/Material | Function/Purpose | Specifications/Alternatives |
|---|---|---|
| Precast SDS-PAGE Gels | Protein fractionation by molecular weight | 4-12% Bis-Tris gradient gels recommended [31] |
| Mass Spectrometry-Grade Trypsin | Proteolytic digestion of gel-separated proteins | Sequencing grade, reconstituted in 0.1% acetic acid [1] [31] |
| Reducing Agent (TCEP or DTT) | Breaking protein disulfide bonds | TCEP (5 mM) or DTT (500 mM stock) [1] [31] |
| Alkylating Agent (IAA) | Preventing reformation of disulfide bonds | Iodoacetamide (20-500 mM stock, prepared fresh) [1] [31] |
| Coomassie-Based Stain | Protein visualization after electrophoresis | MS-compatible formulations [1] [31] |
| Destaining Solution | Removing excess stain for band visualization | 25 mM ammonium bicarbonate/50% acetonitrile [1] |
| Peptide Extraction Solution | Recovering peptides from gel matrix | 1% formic acid, 75% acetonitrile [31] |
| C18 StageTips | Desalting and concentrating peptides before MS | Empore C18 disks with custom-assembled tips [31] |
The Whole-Gel processing procedure represents a significant advancement in GeLC-MS/MS methodology, effectively addressing the scalability limitations of conventional in-gel digestion while maintaining equivalent performance in protein identification and quantification. By strategically reorganizing the workflow to perform key processing steps on intact gels before slicing, this method dramatically reduces hands-on time without compromising data quality. The WG procedure is particularly valuable for clinical proteomics and large-scale differential expression studies where sample throughput is a critical consideration. As mass spectrometry-based proteomics continues to evolve toward higher throughput applications, streamlined sample preparation methods like the WG procedure will play an increasingly important role in enabling robust, reproducible, and efficient proteomic analyses.
In-Gel Enzymatic Digestion and Peptide Extraction for Maximum Recovery
Within the context of preparative SDS-PAGE for protein fractionation and GeLC-MS/MS research, the in-gel enzymatic digestion step serves as the critical bridge between protein separation and mass spectrometric identification. First introduced in the early 1990s, this method has undergone substantial refinements to enhance peptide recovery, protein identification rates, and sequence coverage [32]. The fundamental process involves protein destaining, reduction and alkylation of cysteine residues, proteolytic cleavage, and peptide extraction from the gel matrix. For researchers employing GeLC-MS/MS workflows, where entire gel lanes are fractionated into multiple slices for deep proteome coverage, optimization of these steps is paramount for successful identification of low-abundance proteins and comprehensive proteomic analysis [1] [2]. Recent methodological advances have focused on reducing processing time, minimizing sample handling, and improving peptide recovery through optimized reagents and protocols, thereby increasing the efficacy of large-scale proteomic studies, particularly in clinical and drug development settings [33] [2].
Current Methodological Advances
Streamlined Workflows for Enhanced Efficiency
Traditional in-gel digestion protocols involve numerous processing steps for individual gel slices, creating significant bottlenecks in large-scale GeLC-MS/MS experiments. A transformative "whole gel" (WG) approach addresses this limitation by performing washing, reduction, and alkylation steps on the intact gel prior to slicing [2]. This innovation dramatically reduces hands-on time: for processing 90 gel slices, the WG procedure cuts day-one processing time to approximately 145 minutes compared to 355 minutes for conventional in-gel digestion (IGD) [2]. Crucially, this efficiency gain does not compromise data quality, with the WG method demonstrating >88% identification overlap with conventional methods and excellent quantitative correlation (R² = 0.94) in label-free quantitation using spectral counting [2].
Reagent Optimization for Improved Performance
Substantial improvements in protein identification and sequence coverage have been achieved through optimized reduction and alkylation strategies. Replacing traditional dithiothreitol (DTT) and iodoacetamide (IAA) with Tris(2-carboxyethyl)phosphine hydrochloride (TCEP) and chloroacetamide (CAA) enables simultaneous reduction and alkylation at high temperature (70°C for 5 minutes), significantly shortening incubation times while diminishing peptide side reactions [33]. This TCEP/CAA combination improves protein identification and increases sequence coverage compared to conventional approaches [33].
Digestion efficiency has been enhanced through optimized buffer systems. Replacing ammonium bicarbonate (ABC) with HEPES buffer (pH 8.5) allows significant reduction in digestion time while improving trypsin performance and increasing peptide recovery [33]. These reagent optimizations collectively enhance proteomic coverage while reducing processing time, making them particularly valuable for high-throughput proteomic applications in drug development.
Comparative Analysis of Methodological Parameters
Table 1: Comparison of Key Protocol Variations in In-Gel Digestion
| Parameter | Traditional Approach | Updated Approach | Impact on Performance |
|---|---|---|---|
| Reduction | 10 mM DTT, 56°C, 30 min | 10 mM TCEP, 70°C, 5 min | Faster reaction, reduced side products [33] |
| Alkylation | 55 mM IAA, room temperature, 20 min | 40 mM CAA, 70°C, 5 min (simultaneous with reduction) | Shorter incubation, improved cysteine modification [33] |
| Digestion Buffer | 50 mM ammonium bicarbonate (ABC) | 50 mM HEPES, pH 8.5 | Enhanced trypsin activity, reduced digestion time (4h vs overnight) [33] |
| Workflow | Individual slice processing | Whole-gel processing pre-slicing | 60% reduction in processing time for large experiments [2] |
| Digestion Time | Overnight (12-16 hours) | 4 hours with HEPES buffer | Faster turnaround without compromising peptide yield [33] |
Table 2: Quantitative Performance Comparison of Reduction and Alkylation Reagents
| Performance Metric | DTT + IAA (Traditional) | TCEP + CAA (Updated) | Improvement |
|---|---|---|---|
| Protein Identification | Baseline | Increased | Superior identification with updated reagents [33] |
| Sequence Coverage | Baseline | Increased | Higher coverage with TCEP/CAA combination [33] |
| Incubation Time | 50 minutes total | 5 minutes total | 90% reduction in processing time [33] |
| Side Reactions | Baseline | Diminished | Reduced unwanted peptide modifications [33] |
| Handling | Sequential steps | Simultaneous reaction | Simplified workflow [33] |
Detailed Experimental Protocols
Updated In-Gel Digestion Protocol for Maximum Recovery
Materials and Reagents:
- Tris(2-carboxyethyl)phosphine hydrochloride (TCEP)
- Chloroacetamide (CAA)
- HEPES buffer, pH 8.5
- Modified trypsin (sequencing grade)
- HPLC-grade acetonitrile
- Formic acid
- Ammonium bicarbonate
- Coomassie-stained gel pieces
Procedure:
- Gel Preparation: Excise protein bands of interest and cut into 1 mm³ pieces using a clean scalpel. Transfer to low-protein-binding microcentrifuge tubes [34] [35].
Destaining: Wash gel pieces with 100 μL water for 15 minutes with shaking. Remove water and add 50 μL of 50 mM ammonium bicarbonate in 50% acetonitrile. Incubate for 10 minutes with shaking. Repeat until blue color disappears. Add 100% acetonitrile to dehydrate gel pieces (they become white and stick together). Remove acetonitrile and dry in vacuum centrifuge for 10 minutes [36] [37].
Simultaneous Reduction and Alkylation: Prepare fresh solution of 10 mM TCEP and 40 mM CAA in 50 mM HEPES buffer, pH 8.5. Add sufficient solution to cover gel pieces. Incubate at 70°C for 5 minutes with shaking at 650 rpm [33].
Gel Wash: Remove reduction/alkylation solution. Wash gel pieces with 50% ethanol in 50 mM ammonium bicarbonate for 15 minutes at room temperature. Dehydrate with 100% ethanol for 5 minutes. Remove ethanol and dry gel pieces briefly [33].
Enzymatic Digestion: Prepare trypsin solution at 2.5-10 ng/μL in 50 mM HEPES buffer, pH 8.5 [33] [35]. Add sufficient trypsin solution to cover gel pieces and incubate on ice for 30 minutes. Add more HEPES buffer to keep gel pieces covered during digestion. Incubate at 37°C for 4 hours [33].
Peptide Extraction: After digestion, transfer supernatant to a new tube. Extract peptides by adding 25-50 μL of 1% formic acid with 5-minute sonication in a water bath. Transfer supernatant to previous collection. Repeat with 100% acetonitrile with 5-minute sonication. Combine all extracts and dry using a vacuum centrifuge at 50°C [33] [36].
Sample Storage: Reconstitute dried peptides in 10-20 μL of 0.1% formic acid for LC-MS/MS analysis or 0.1% TFA for MALDI-TOF/TOF analysis. Store at -20°C if not analyzing immediately [36].
Whole-Gel Processing Protocol for GeLC-MS/MS
Materials and Reagents:
- Pre-cast SDS-PAGE gels
- Coomassie Brilliant Blue stain
- Destain solution (25% methanol, 7.5% glacial acetic acid)
- DTT and iodoacetamide solutions
- Trypsin, sequencing grade
- Ammonium bicarbonate buffer
Procedure:
- Protein Separation and Staining: Separate complex protein mixture by 1D SDS-PAGE using an appropriate percentage gel (4-12% gradient gels work well for most applications). Stain with Coomassie Brilliant Blue and destain appropriately [1] [2].
Whole-Gel Processing: Place entire gel in a clean container. Perform all washing steps on the intact gel by adding 25 mL of appropriate solutions with gentle agitation:
- Wash with 25 mM ammonium bicarbonate/50% acetonitrile for 15 minutes
- Repeat wash step until destaining is complete
- Reduce with 10 mM DTT in 100 mM ammonium bicarbonate for 45 minutes at 56°C
- Alkylate with 55 mM iodoacetamide in 100 mM ammonium bicarbonate for 30 minutes in the dark
- Wash with 25 mM ammonium bicarbonate/50% acetonitrile followed by 100% acetonitrile [2]
Gel Slicing: After the final processing step, slice the entire gel lane into 5-20 fractions based on molecular weight markers. Cut each slice into 1 mm³ pieces and transfer to individual tubes [2].
Digestion and Extraction: Continue with standard in-gel digestion protocol using trypsin in ammonium bicarbonate buffer overnight at 37°C. Extract peptides as described in section 4.1 [2].
The Scientist's Toolkit: Research Reagent Solutions
Table 3: Essential Reagents for Optimized In-Gel Digestion
| Reagent | Function | Optimal Concentration | Notes |
|---|---|---|---|
| TCEP | Reduction of disulfide bonds | 10 mM | More stable than DTT, enables simultaneous reduction/alkylation [33] |
| Chloroacetamide | Alkylation of cysteine residues | 40 mM | Fewer side reactions than iodoacetamide [33] |
| HEPES Buffer | Digestion buffer | 50 mM, pH 8.5 | Enhances trypsin activity, allows shorter digestion times [33] |
| Modified Trypsin | Proteolytic cleavage | 2.5-10 ng/μL | Resists autolysis, provides specific cleavage [34] [36] |
| Ammonium Bicarbonate | Destaining and washing buffer | 25-100 mM | Volatile salt, easily removed during drying [35] [36] |
| HPLC-grade Acetonitrile | Dehydration and extraction | 50-100% | Essential for peptide extraction and gel processing [34] [36] |
| Formic Acid | Peptide extraction and acidification | 1-5% | Stops enzymatic digestion, aids peptide extraction [35] [36] |
Critical Considerations for Maximum Recovery
Contamination Prevention
Keratin contamination from skin, hair, or dust represents a significant challenge in sensitive proteomic workflows. Implement strict contamination control measures including wearing gloves and lab coats at all times, using clean apparatus for gel running, working in a laminar flow hood when possible, and using siliconized polypropylene tubes with low-retention tips [34] [35]. Plasticizer contamination from repeated solvent exposure to plastics can be avoided by pouring solvents directly from original bottles rather than using plastic pipettes, and storing solvents in glass bottles with Teflon-lined lids [34].
Peptide Loss Mitigation
Significant peptide losses (15-50%) can occur during processing due to washout, adsorption to surfaces, incomplete extraction, and variable ionization efficiency [32]. To minimize these losses:
- Surface Adsorption: Use low-protein-binding tubes and tips. Add acetonitrile (>30% v/v) to extraction solutions to reduce peptide adsorption [32].
- Extraction Efficiency: Perform multiple extractions with solutions of varying pH. Acidic solutions (1% formic acid) extract basic peptides effectively, while organic solvents (ACN) improve recovery of hydrophobic peptides [32] [36].
- Gel Piece Size: Optimal gel piece size of 1 mm³ balances peptide recovery against handling difficulties. Smaller pieces increase surface area but may be lost during liquid transfers [35].
- Extraction Volume: Use sufficient extraction volume (typically 5 times the gel volume) to ensure efficient peptide recovery [36].
The optimized in-gel enzymatic digestion and peptide extraction protocols presented here significantly enhance peptide recovery and protein identification for GeLC-MS/MS-based proteomics. By implementing updated reagent systems featuring TCEP/chloroacetamide for rapid reduction/alkylation and HEPES buffer for efficient digestion, alongside streamlined workflows like the whole-gel processing approach, researchers can achieve superior proteome coverage with reduced processing time. These methodological advances are particularly valuable in drug development contexts where reproducibility, throughput, and sensitivity are paramount. As proteomic technologies continue to evolve, these optimized sample preparation methods will remain foundational for comprehensive protein analysis in complex biological systems.
Within the framework of preparative SDS-PAGE for protein fractionation and GeLC-MS/MS research, the integration of Top-Down Proteomics (TDP) represents a significant methodological advancement for characterizing intact proteoforms. Traditional bottom-up proteomics (BUP), which relies on proteolytic digestion prior to analysis, faces inherent limitations in capturing complete protein structural information, including combinatorial post-translational modifications (PTMs) and genetic variants [38]. In contrast, TDP analyzes intact proteins, preserving the full molecular context and enabling comprehensive proteoform characterization. A major historical challenge for TDP has been the efficient recovery of intact proteins from polyacrylamide gels used in pre-fractionation. The recently developed PEPPI-MS (Passively Eluting Proteins from Polyacrylamide Gels as Intact Species for Mass Spectrometry) protocol directly addresses this limitation, offering a rapid and efficient method for intact protein extraction that is highly compatible with downstream TDP analysis [11]. This application note details the integration of PEPPI-MS into a robust TDP workflow and demonstrates its utility through a comparative analysis of bacterial proteomes, providing researchers with a detailed protocol for deep proteoform-resolved studies.
Comparative Performance of Mass Spectrometry Methods in Bacterial Proteomics
To objectively evaluate the practical benefits of different proteomic approaches, we systematically compared three mass spectrometry methods for profiling bacterial protein composition: MALDI protein fingerprinting, Top-Down Proteomics (TDP), and Bottom-Up Proteomics (BUP) [39] [40]. The performance of each method was assessed based on protein coverage, reproducibility, and species discrimination capability using E. coli and B. subtilis as model organisms.
Table 1: Comparative Performance of Mass Spectrometry Methods in Bacterial Protein Profiling
| Method | Proteins/Peaks Identified (E. coli) | Detection Reproducibility | Key Advantages | Inherent Biases |
|---|---|---|---|---|
| MALDI Fingerprinting | Moderate | Highest | Excellent for rapid species differentiation and identification | Strong bias toward high-abundance, stable, hydrophilic ribosomal proteins |
| Top-Down Proteomics | Lowest | Moderate | Preserves intact proteoform information; identifies combinatorial PTMs | Preferentially detects smaller, soluble proteins; lower coverage |
| Bottom-Up Proteomics | Highest | High | Unparalleled protein coverage and depth | Loses proteoform context; higher overlap between species profiles |
The data reveals a critical trade-off: while BUP provides the most extensive protein coverage, it also shows the greatest protein profile overlap between different bacterial species, potentially obscuring unique taxonomic signatures. Conversely, MALDI fingerprinting, despite lower overall feature count, demonstrates superior reproducibility and effectiveness in distinguishing between species. TDP detected fewer proteins than BUP but proved complementary to MALDI fingerprinting, as both methods showed a bias toward abundant, stable, and hydrophilic bacterial ribosomal proteins [39]. This synergy makes TDP particularly valuable for the discovery of protein markers that are both identifiable and biologically significant.
Integrated Experimental Protocol: PEPPI-MS for Top-Down Proteomics
This section provides a detailed methodology for implementing the PEPPI-MS workflow, from gel-based fractionation to mass spectrometric analysis of intact proteins.
Sample Preparation and SDS-PAGE Fractionation
The initial steps focus on preparing a complex protein sample for high-resolution separation.
- Protein Extraction and Denaturation: Extract proteins from your biological sample (e.g., bacterial pellet, tissue homogenate) using a compatible buffer. Avoid high salt concentrations (>100 mM) and MS-incompatible surfactants. Good's buffers are recommended. If necessary, remove incompatible salts and small molecules using ultrafiltration or size-exclusion spin columns [38]. Precipitate proteins using chloroform/methanol or acetone if surfactants are present. Denature the protein extract in SDS-PAGE loading buffer containing a reducing agent (e.g., 2-3% DTT) by heating at 95°C for 5 minutes [41].
- Preparative Gel Electrophoresis: Cast a standard SDS-polyacrylamide gel. A 1.0 mm thick gel is suitable for preparative loads. Load the denatured protein sample across one or multiple wells. For complex samples, a single large well is effective. Run the gel at constant voltage until the dye front has adequately migrated to achieve sufficient separation of protein bands [41] [42].
- Visualization and Excision: Following electrophoresis, carefully excise the gel lane. Use a clean scalpel or razor blade. For reversible staining, incubate the gel in 0.3 M CuCl₂ solution for 10 minutes. Proteins will appear as clear zones against a blue background. Destain with 0.25 M Tris/0.25 M EDTA (pH 9.0) prior to protein elution [41]. Alternatively, for Coomassie-based staining, fix the gel and stain with CBB R-250. After destaining, excise the protein bands of interest.
PEPPI-MS Intact Protein Elution
This is the core innovation that enables efficient recovery of intact proteins from the gel matrix [11].
- Gel Dicing and Transfer: Place the excised gel band (stained or unstained) on a clean surface. Mince it into small cubes (approximately 1 mm³) using a clean blade. Transfer all gel pieces to a low-protein-binding microcentrifuge tube.
- Passive Elution: Add a sufficient volume of elution buffer (e.g., 50% formic acid, 25% acetonitrile, 15% isopropanol, 10% water) to completely submerge the gel pieces. A volume of 200-500 µL is typical.
- Agitation and Incubation: Securely cap the tube and place it on a laboratory rotator or shaker. Agitate at room temperature for 10 minutes. This short incubation is sufficient for high-yield recovery.
- Protein Recovery: Centrifuge the tube briefly to collect the eluate. Using a pipette, carefully transfer the supernatant, which now contains the eluted intact proteins, to a fresh tube. The median protein recovery efficiency for proteins below 100 kDa is approximately 68% [11].
Top-Down LC-MS/MS Analysis
The eluted proteins are now ready for direct LC-MS/MS analysis without enzymatic digestion.
- Liquid Chromatography Separation: Inject the PEPPI-MS eluate onto a nanoflow or microflow UHPLC system. Use a C4 or C8 reversed-phase chromatography column (e.g., 3 µm particle size, 10-15 cm length) optimized for intact protein separation. Employ a gradient of water (with 0.1% formic acid) and acetonitrile (with 0.1% formic acid) at a controlled temperature of 40-60°C for optimal peak shape and stability [43] [44].
- High-Resolution Mass Spectrometry:
- MS1 Analysis: Acquire full MS scans using a high-resolution mass spectrometer (e.g., Orbitrap, FT-ICR) with a resolution of ≥60,000 (at m/z 400). The goal is to determine the precise molecular mass of the intact protein ions and their charge states [38] [44].
- MS2 Fragmentation: Select the most abundant precursor ions from the MS1 scan for fragmentation. For TDP, electron-based dissociation methods (ExD) like Electron Transfer Dissociation (ETD) or Electron-Capture Dissociation (ECD) are highly recommended as they often yield higher sequence coverage and better preserve labile PTMs compared to collision-induced dissociation (CID) [38] [44]. Alternative methods like UVPD (UV Photodissociation) can also generate extensive sequence information.
- Data Processing and Proteoform Identification: Process the acquired raw data. Use deconvolution algorithms (e.g., Xtract, MaxEnt) to convert the complex multi-charge-state MS1 spectra into single, neutral masses for each proteoform. For MS2 data, search the fragment ion spectra against a protein sequence database using specialized TDP software (e.g., TopPIC, ProSightPC, MSPathFinder) to identify the protein and characterize its modifications with controlled false discovery rates [38] [43].
The following workflow diagram illustrates the complete integrated protocol from sample preparation to data analysis:
The Scientist's Toolkit: Essential Reagents and Materials
Successful implementation of the PEPPI-MS TDP workflow requires specific reagents and instrumentation. The table below lists key solutions and their critical functions.
Table 2: Research Reagent Solutions for PEPPI-MS Top-Down Proteomics
| Item | Function/Description | Key Considerations |
|---|---|---|
| MS-Compatible Lysis Buffer | Protein extraction while maintaining compatibility with MS analysis. | Use Good's buffers; avoid high salt (>100 mM) and non-cleavable surfactants that suppress MS signal [38]. |
| PEPPI Elution Buffer | Passively elutes intact proteins from polyacrylamide gel matrix. | Typically contains acid and organic solvents (e.g., Formic Acid, ACN, Isopropanol); enables ~68% recovery in 10 min [11]. |
| C4/C8 Reversed-Phase LC Column | Separates intact proteins by hydrophobicity prior to MS injection. | Preferred over C18 for larger biomolecules; particle size ≤3 µm, length 10-15 cm [43]. |
| High-Resolution Mass Spectrometer | Measures intact protein mass (MS1) and fragments them (MS2). | Orbitrap or FT-ICR instruments are standard; resolution ≥60,000 required for complex spectra [38] [44]. |
| Top-Down Data Analysis Software | Identifies proteoforms from MS/MS data of intact proteins. | Tools like TopPIC, ProSightPC, MSPathFinder are essential for database searching and PTM localization [38] [43]. |
The integration of preparative SDS-PAGE with the PEPPI-MS protocol effectively bridges a long-standing technological gap in protein analysis, providing a robust and accessible pathway for deep top-down proteomics. This workflow enables the high-resolution fractionation of complex protein mixtures followed by the highly efficient recovery of intact proteins, setting the stage for comprehensive proteoform characterization. As demonstrated in the comparative analysis of bacterial proteomes, this TDP approach delivers unique insights into protein intact mass, sequence variants, and combinatorial PTMs that are often lost in bottom-up strategies. By providing detailed methodologies and performance benchmarks, this application note equips researchers in drug development and basic science to leverage this powerful combination for uncovering new protein biomarkers, validating therapeutic targets, and achieving a more holistic understanding of proteome biology.
Troubleshooting GeLC-MS/MS: Overcoming Common Pitfalls and Enhancing Reproducibility
Within the framework of research utilizing preparative SDS-PAGE for protein fractionation and GeLC-MS/MS analysis, the initial step of protein extraction is paramount. The efficiency and reliability of subsequent analyses are critically dependent on the quality and comprehensiveness of the protein extract. This is particularly true for bacterial samples, where fundamental differences in cell wall architecture between Gram-positive and Gram-negative species present unique challenges for effective lysis and protein recovery. The development of optimized, reproducible extraction protocols is therefore essential for achieving deep proteome coverage, especially for challenging subsets like membrane proteins. This application note provides a systematic, data-driven comparison of protein extraction methodologies, delivering optimized protocols for both Gram-negative and Gram-positive bacteria to enhance outcomes in preparative SDS-PAGE and downstream GeLC-MS/MS workflows [45] [46].
Comparative Performance of Extraction Methods
A recent systematic study evaluated four distinct protein extraction protocols using both data-dependent acquisition (DDA) and data-independent acquisition (DIA) mass spectrometry strategies. The investigation employed Escherichia coli (Gram-negative) and Staphylococcus aureus (Gram-positive) as model organisms to assess the performance of each method [45] [46].
Table 1: Unique Peptide Identification across Different Extraction Methods (DDA Analysis)
| Extraction Method | E. coli Peptides Identified | S. aureus Peptides Identified | Key Characteristics |
|---|---|---|---|
| SDT-Boiling (SDT-B) | Not Specified (Lower than SDT-B-U/S) | Not Specified (Lower than SDT-B-U/S) | Thermal denaturation alone. |
| SDT-Ultrasonication (SDT-U/S) | Not Specified (Lower than SDT-B-U/S) | Not Specified (Lower than SDT-B-U/S) | Mechanical disruption on ice. |
| SDT-Boiling-Ultrasonication (SDT-B-U/S) | 16,560 | 10,575 | Combined thermal and mechanical lysis. |
| SDT-Liquid Nitrogen Grinding-Ultrasonication (SDT-LNG-U/S) | Not Specified (Lower than SDT-B-U/S) | Significantly fewer than SDT-B-U/S | Cryogenic grinding followed by ultrasonication. |
Table 2: Overall Proteomic Analysis Output and Reproducibility
| Performance Metric | E. coli | S. aureus | Notes |
|---|---|---|---|
| Total Unique Peptides (DDA) | 23,912 | 13,150 | Combined from all methods [45] |
| Total Proteins Identified (DDA) | 2,141 | 1,511 | Combined from all methods [45] |
| DIA vs. DDA Peptide Yield | Slightly fewer (21,027) | Slightly fewer (7,707) | DIA demonstrated superior reproducibility [45] |
| Most Reproducible Method (DIA) | SDT-B-U/S (R² = 0.92) | SDT-B-U/S (R² = 0.92) | Highest technical replicate correlation [46] |
The data conclusively shows that the SDT-B-U/S method (thermal denaturation followed by ultrasonication) outperformed all other protocols, delivering the highest number of unique peptide identifications for both bacterial types and exhibiting exceptional reproducibility [45] [46]. This method was also particularly effective in extracting proteins within specific molecular weight ranges (20–30 kDa for E. coli; 10–40 kDa for S. aureus) and significantly improved the recovery of membrane proteins, such as OmpC [46]. Furthermore, ultrasonication-based methods generally surpassed the liquid nitrogen grinding approach for extracting the S. aureus proteome [45].
Detailed Experimental Protocols
The following section details the optimized protocols for bacterial protein extraction, based on the comparative study.
Reagent Preparation
- SDT Lysis Buffer: 4% (w/v) SDS, 100 mM Dithiothreitol (DTT), 100 mM Tris-HCl (pH 7.6). DTT is a reducing agent that breaks disulfide bonds [45] [46].
- Phosphate-Buffered Saline (PBS)
- Pre-cooled Acetone (for precipitation)
- BCA Protein Assay Kit (for quantification)
Bacterial Culture and Pre-treatment
- Culture: Grow E. coli in Luria-Bertani (LB) broth and S. aureus in tryptic soy broth (TSB) to mid-log phase at 37°C with shaking at 225 rpm [46].
- Harvest: Pellet bacterial cells by centrifugation at 9,000 × g for 10 minutes at 4°C.
- Wash: Wash the cell pellet three times with PBS to remove residual culture medium. The pellet can be stored at 4°C until use [46].
Optimized Protocol: SDT-B-U/S (Boiling followed by Ultrasonication)
This is the recommended protocol based on its superior performance [45] [46].
- Resuspension and Boiling: Resuspend the bacterial cell pellet in 5 mL of SDT lysis buffer. Vortex thoroughly to mix. Incubate the suspension in a 98°C water bath for 10 minutes to achieve thermal denaturation and initial lysis [45] [46].
- Cooling and Ultrasonication: Allow the lysate to cool. Subsequently, subject the lysate to ultrasonication on ice using an ultrasonic cell disintegrator at 70% amplitude for a total of 5 minutes, using a cycle of 5 seconds on and 8 seconds off to prevent overheating [45] [46].
- Clarification: Centrifuge the lysate at 10,000 × g for 10 minutes at 4°C to remove cellular debris and insoluble particles. Carefully collect the supernatant, which contains the solubilized proteins [45].
- Protein Precipitation and Quantification:
- Add four volumes of pre-cooled acetone to the supernatant and incubate overnight at -20°C to precipitate proteins.
- Centrifuge at 10,000 × g for 10 minutes at 4°C to pellet the proteins.
- Wash the pellet twice with ice-cold acetone to remove residual SDS and salts.
- Air-dry the pellet briefly and resuspend it in an appropriate volume of 100 mM Tris-HCl buffer.
- Determine the protein concentration using a BCA assay kit [45] [46].
Alternative Protocols
- SDT-B (Boiling only): Follow steps 1, 3, and 4 from section 3.3, omitting the ultrasonication step [45].
- SDT-U/S (Ultrasonication only): Resuspend the cell pellet in SDT buffer and proceed directly to the ultrasonication step (Section 3.3, Step 2), followed by clarification and precipitation [45].
- SDT-LNG-U/S (Liquid Nitrogen Grinding): For a mechanical pre-treatment, transfer the cell pellet to a chilled, sterile mortar and grind vigorously under liquid nitrogen until a fine powder is obtained. Resuspend this powder in SDT lysis buffer, then proceed with ultrasonication, clarification, and precipitation as described above [45] [46].
Workflow Visualization
The following diagram illustrates the logical workflow for selecting and executing the optimal protein extraction protocol based on the research objectives and sample type.
The Scientist's Toolkit: Research Reagent Solutions
Table 3: Essential Materials and Reagents for Protein Extraction
| Item | Function/Application in Protocol |
|---|---|
| Sodium Dodecyl Sulfate (SDS) | Anionic detergent for effective cell lysis and solubilization of membrane proteins [45] [46]. |
| Dithiothreitol (DTT) | Reducing agent in SDT buffer; breaks disulfide bonds in proteins to ensure complete denaturation [45] [46]. |
| Tris-HCl Buffer | Provides a stable pH environment (pH 7.6) for the extraction process [45] [46]. |
| Ultrasonic Cell Disintegrator | Mechanical homogenizer using sound energy to disrupt tough cell walls, especially crucial for Gram-positive bacteria [45]. |
| BCA Protein Assay Kit | Colorimetric method for accurate determination of protein concentration prior to preparative SDS-PAGE [45] [46]. |
The choice of protein extraction methodology has a profound impact on the depth and reproducibility of proteomic analysis in preparative SDS-PAGE and GeLC-MS/MS research. For researchers working with diverse bacterial samples, the combined boiling and ultrasonication method (SDT-B-U/S) in an SDS and DTT-containing buffer provides a robust, universally applicable protocol. It effectively addresses the structural challenges posed by both Gram-negative and Gram-positive bacteria, ensuring high protein recovery, excellent reproducibility, and enhanced detection of membrane proteins. Adopting this optimized workflow is a critical first step toward obtaining high-quality, representative protein fractions for downstream applications.
Managing Detergents and Buffers to Prevent MS Signal Suppression
In mass spectrometry (MS)-based proteomics, particularly within GeLC-MS/MS workflows, the reagents used for protein solubilization and separation can become significant sources of interference. Detergents and salts, while indispensable for cell lysis, protein extraction, and gel electrophoresis, are notorious for suppressing electrospray ionization (ESI) signals, contaminating instrumentation, and impairing chromatographic separation. For researchers employing preparative SDS-PAGE for protein fractionation, the challenge is twofold: leveraging the powerful solubilizing properties of detergents like SDS for membrane proteins, while ensuring their complete removal prior to LC-MS/MS analysis. This application note details practical strategies and optimized protocols to manage these reagents effectively, enabling robust and reproducible proteomic data generation.
The Interference Problem: Signal Suppression and Beyond
The integrity of MS data is critically dependent on sample purity. Common buffer components can severely impact data quality through several mechanisms:
- Signal Suppression: During ESI, detergents and non-volatile salts outcompete analyte molecules for access to limited charges at the droplet surface, drastically reducing the signal intensity of peptides and proteins. The half-maximum suppression concentration (SC50) quantifies this effect, representing the concentration of an additive that reduces the MS signal by 50% [47].
- Chromatographic Interference: Residual ionic detergents like SDS can coat the stationary phase of reversed-phase LC columns, leading to peak broadening, shifting retention times, and a characteristic repeating pattern in the base peak chromatogram [48].
- Ion Source Contamination: Polymers and detergents can accumulate in the ion source and mass analyzer, requiring frequent cleaning and reducing instrumental robustness.
The table below summarizes the SC50 values for common buffer components, illustrating their relative potential for signal suppression.
Table 1: Signal Suppression Potential of Common Buffer Components
| Buffer Component | Type | Reported SC50 (mM) | Mechanism of Interference |
|---|---|---|---|
| SDS (Ionic) | Anionic Detergent | 0.006 | Charge competition, adduct formation [47] |
| Sodium Chloride | Non-Volatile Salt | 1.5 | Adduct formation, increased surface tension [47] |
| Urea | Chaotrope | 120 | Moderate signal suppression [47] |
| Ammonium Acetate | Volatile Salt | > 1,000 | Minimal suppression, MS-compatible [47] |
Strategies and Protocols for Detergent Management
Effective management of detergents involves selecting MS-compatible alternatives where possible and implementing robust depletion strategies when necessary.
Strategy 1: SDS Depletion via KCl Precipitation
For samples where SDS is essential for extraction (e.g., membrane proteomes), potassium chloride (KCl) precipitation offers a direct method to deplete the surfactant while keeping proteins in solution. The following protocol is optimized for intact protein analysis.
Table 2: Key Reagents for KCl Precipitation Protocol
| Reagent | Function | MS-Compatibility Note |
|---|---|---|
| Potassium Chloride (KCl) | Precipitates SDS as insoluble KDS | Highly compatible; excess can be removed [49] |
| Urea | Solubilizing Additive | Maintains protein solubility post-SDS removal; use fresh to avoid carbamylation [49] |
| Sodium Carbonate/NaOH | pH Adjustment | Creates highly basic conditions (pH 12) to weaken SDS-protein interactions [49] |
| Tris Buffer | Buffering Agent | Standard biochemical buffer; compatible with downstream steps [49] |
Experimental Protocol: KCl Precipitation for SDS Removal
This protocol is designed for SDS-solubilized protein extracts, such as those from membrane preparations [49].
- Sample Preparation: Begin with a solubilized protein sample in a buffer containing up to 5% SDS. For optimal recovery, the sample should be in a low-salt buffer.
- Condition Optimization: Based on your sample type, choose the appropriate conditions from the table below to maximize protein recovery and purity.
Table 3: Optimized Conditions for KCl Precipitation of SDS
| Sample Type | Recommended pH | Recommended Additive | Key Outcome |
|---|---|---|---|
| Complex Membrane Proteome | pH 12 | 6 M Urea | Highest membrane protein recovery and identification [49] |
| Soluble Protein Standard | pH 8 | None | Simplicity for well-behaved, non-hydrophobic proteins [49] |
| "Free SDS" Removal | pH 12 | None | Precipitates only unbound SDS; protein-bound SDS remains [49] |
- Precipitation:
- Adjust the sample to the chosen pH and additive condition.
- Add solid KCl to a final concentration of 300 mM while gently vortexing the sample.
- Incubate the mixture for 10-15 minutes at room temperature. A white precipitate of potassium dodecyl sulfate (KDS) will form.
- Clarification: Centrifuge the sample at >15,000 × g for 10 minutes to pellet the KDS precipitate.
- Sample Recovery: Carefully transfer the clarified supernatant, which contains the solubilized proteins, to a fresh tube. The supernatant is now significantly depleted of SDS and can be processed for intact protein MS (top-down) or digested for bottom-up analysis.
This workflow's effectiveness stems from the low solubility of KDS. The use of high pH and urea disrupts hydrophobic interactions between SDS and proteins, preventing co-precipitation and ensuring high protein recovery [49].
Strategy 2: Integrated SDS-PAGE and GeLC-MS/MS Cleanup
Preparative SDS-PAGE is not only a powerful fractionation tool but also an effective detergent removal step. The SDS bound to proteins is left behind as peptides are extracted from the gel matrix. The "Whole Gel" (WG) procedure streamlines this for high-throughput GeLC-MS/MS.
Experimental Protocol: Whole-Gel (WG) Processing for GeLC-MS/MS
This protocol reduces hands-on time by performing key steps on the intact gel lane before slicing [2].
- Preparative SDS-PAGE: Separate the protein complex using a standard SDS-PAGE system. Load an adequate amount of protein (e.g., 100-500 µg) for preparative fractionation.
- Fixing and Staining: After electrophoresis, fix and stain the gel with a compatible stain like Coomassie Blue to visualize the protein bands.
- Whole-Gel Processing (Key Differentiator):
- Destain the entire gel lane.
- Wash the gel with a volatile buffer (e.g., 50 mM ammonium bicarbonate).
- Perform reduction and alkylation on the whole gel by incubating it in DTT (for reduction) and iodoacetamide (for alkylation) solutions. This eliminates the need to perform these steps individually on dozens of gel slices [2].
- Gel Slicing: Following the processing steps, slice the entire gel lane into 5-20 fractions based on molecular weight, guided by the stained protein markers.
- In-Gel Digestion: Dice each gel slice into smaller pieces and proceed with standard in-gel digestion: washing, trypsin incubation, and peptide extraction.
- LC-MS/MS Analysis: Pool peptide extracts from each fraction and analyze by LC-MS/MS. Combining the database search results from all fractions yields a global protein profile of the original sample.
The WG procedure has been demonstrated to yield highly similar protein identification and quantification compared to the conventional in-gel digestion (IGD) method, but with significantly improved efficiency for processing many samples in parallel [2].
The Scientist's Toolkit: Essential Research Reagents
Successful implementation of the above protocols requires the use of specific, high-quality reagents. The following table outlines key solutions and their functions.
Table 4: Research Reagent Solutions for Detergent Management and GeLC-MS/MS
| Reagent / Kit | Primary Function | Application Context |
|---|---|---|
| S-Trap Micro Column | Efficient detergent removal and digestion; ideal for SDS-containing samples without precipitation [50] [48]. | Bottom-up proteomics |
| Potassium Chloride (KCl) | Precipitates SDS from solution while maintaining protein solubility [49]. | SDS removal for intact protein MS or digestion |
| Ice-cold Acetone | Precipitates proteins, effectively removing non-ionic detergents (e.g., Triton, NP-40) [48]. | Non-ionic detergent removal |
| LDS Sample Buffer | Alternative denaturing buffer to SDS; allows formulation of stable 4X solutions with compatible tracking dyes [51]. | Sample preparation for specific gel systems (Bis-Tris) |
| Ammonium Bicarbonate | Volatile MS-compatible buffer for gel washing and digestion steps; leaves no interfering residues [2]. | GeLC-MS/MS buffer |
| Whole Gel Protocol | Streamlines reduction/alkylation for high-throughput GeLC-MS/MS by processing the intact gel [2]. | High-throughput fractionation |
Managing detergents and buffers is a critical, non-negotiable aspect of sample preparation for GeLC-MS/MS. By understanding the mechanisms of MS signal suppression and implementing optimized protocols like KCl precipitation for SDS removal and the Whole-Gel processing method, researchers can confidently use powerful solubilizing agents without compromising downstream mass spectrometric analysis. These strategies ensure the highest quality data from complex samples, particularly for challenging targets like membrane proteins, thereby advancing discovery in proteomics and drug development.
Avoiding Artefactual Modifications During Sample Preparation and Heating
In the context of preparative SDS-PAGE for protein fractionation and GeLC-MS/MS research, the integrity of analysis heavily depends on the quality of sample preparation. Artefactual modifications are unintended structural changes to proteins introduced during experimental procedures, which can compromise data accuracy and lead to erroneous biological conclusions [52] [53]. These artefacts are particularly problematic in drug development, where precise characterization of protein therapeutics, including recombinant monoclonal antibodies (mAbs), is critical for ensuring product quality, safety, and efficacy [53]. This document outlines the common sources of such artefacts and provides detailed protocols to minimize their occurrence, thereby safeguarding the reliability of your proteomic research.
Common Artefactual Modifications and Their Causes
Artefacts can manifest as changes in molecular weight, charge, or quaternary structure. Understanding their origins is the first step toward prevention. The table below summarizes the most frequently encountered artefacts.
Table 1: Common Artefactual Modifications and Their Causes in Protein Sample Preparation
| Artefact Type | Common Causes During Sample Prep | Potential Impact on Analysis |
|---|---|---|
| Disulfide Bond Scrambling [53] | Heating in SDS/LDS buffer without alkylating agent; excessive heating time/temperature [53]. | Overestimation of low molecular weight (LMW) species (e.g., light chain, heavy chain) in CE-SDS and SDS-PAGE [53]. |
| Arbitrary Protein Truncation [52] | Heating in unbuffered guanidinium chloride (low pH); heating in loading buffer prior to gel fractionation [52]. | Appearance of non-native protein fragments, misinterpretation of proteoforms. |
| Chemical Modifications (e.g., +98 Da) [52] | Use of acidic conditions during acetone precipitation [52]. | Incorrect mass assignment, can interfere with PTM analysis. |
| Incomplete Denaturation [53] | Insufficient surfactant (SDS/LDS) binding during sample prep [53]. | Abnormal migration (peak splitting), poor resolution, and inaccurate size assessment. |
| Aggregation & Precipitation [54] | High protein concentration; presence of hydrophobic proteins; high salt/detergent concentrations [54]. | Sample clumping in wells, poor band resolution, and protein loss. |
| Deamidation / Oxidation [52] | Prolonged sample storage at elevated temperatures; exposure to reactive oxygen species [52]. | Altered protein charge and mass, leading to complex or smeared band/peak patterns. |
Detailed Protocols for Artefact-Free Sample Preparation
Protocol: Reduction and Alkylation to Prevent Disulfide Scrambling
Disulfide bond scrambling is a major artefact in SDS-PAGE and CE-SDS analysis, leading to overestimation of LMW species like free light chains (L), heavy chains (H), and hybrid species (HL, HH) [53]. This protocol is designed to prevent such artefacts.
- Principle: The reduction step cleaves native disulfide bonds, while the subsequent alkylation step blocks the free cysteine thiol groups, permanently preventing them from re-oxidizing or forming incorrect (scrambled) disulfide bonds during heating and electrophoresis [53] [16].
- Materials:
- Lysis buffer (e.g., containing 1-2% SDS)
- Reducing agent: Dithiothreitol (DTT) or Tris(2-carboxyethyl)phosphine (TCEP)
- Alkylating agent: Iodoacetamide (IAM) or Chloroacetamide (CAA)
- Incubator or heating block
- Step-by-Step Method:
- Prepare Protein Lysate: Extract proteins using your chosen lysis buffer. Ensure the buffer contains a denaturant like SDS to fully unfold proteins and expose disulfide bonds [16].
- Reduce: Add DTT to a final concentration of 10-20 mM or TCEP to 5-10 mM. Incubate at 37°C for 30 minutes. TCEP is often preferred as it is more stable and does not require a gold foil for protection [55] [16].
- Alkylate: Add IAM to a final concentration of 20-40 mM (typically a slight molar excess over the reducing agent). Incubate at room temperature in the dark for 20-30 minutes. Light-sensitive handling is crucial to maintain reagent efficacy [53] [55].
- Stop Reaction: The alkylation reaction can be stopped by adding a small molar excess of DTT to consume any remaining IAM. Alternatively, proceed directly to the next step.
- Critical Notes:
- Do not skip alkylation. Inclusion of alkylation reagents like IAM, iodoacetic acid, or N-ethylmaleimide has been shown to significantly reduce artefactual LMW species [53].
- Optimize concentration and time. Incomplete reaction depresses digestion efficiency, while over-alkylation can introduce its own artefacts [55].
Protocol: Controlled Heating to Minimize Truncation and Modifications
Heating is a common step to denature proteins, but improper execution is a primary source of artefacts such as truncation and unwanted chemical modifications [52] [53].
- Principle: Applying controlled, minimal heat ensures protein denaturation without inducing non-native cleavage or chemical degradation. Avoiding extreme temperatures and acidic pH during heating is critical.
- Materials:
- Thermostatically controlled heating block or water bath
- Protein sample in a suitably buffered solution
- Step-by-Step Method:
- Buffer Check: Ensure your sample buffer is appropriately buffered at a neutral to slightly basic pH (e.g., Tris-based buffer). Avoid heating in unbuffered acidic solutions like guanidinium chloride, which can cause artefactual truncation at aspartic acid residues [52].
- Heat Application: Incubate the sample at 70°C for 5-10 minutes. This is generally sufficient for denaturation without introducing significant artefacts [53].
- Avoid Over-heating: Do not exceed 90°C or extend heating time unnecessarily. Studies show that artefactual LMW species increase with higher incubation temperatures and longer times [53].
- Critical Notes:
- The common practice of heating at 95°C for 5 minutes can be too harsh for some proteins and should be validated. If artefacts persist, try lower temperatures (e.g., 60-70°C) [53].
- For heat-sensitive proteins, consider denaturation at lower temperatures (37-56°C) for a longer duration or using only chemical denaturation without heat.
Protocol: Ensuring Complete Solubilization and Denaturation
Incomplete denaturation can lead to abnormal migration, poor resolution, and even artefactual peaks in electrophoretic profiles [53] [54].
- Principle: Use adequate concentrations of detergent and chaotropes, combined with physical disruption, to fully solubilize and linearize proteins, ensuring uniform SDS binding and accurate size-based separation [16] [56].
- Materials:
- Lysis buffer with high-quality SDS
- Chaotropic agents (e.g., Urea, Thiourea)
- Sonication device or mechanical homogenizer
- Reducing agents (DTT/TCEP)
- Step-by-Step Method:
- Lysis Buffer Composition: Use a lysis buffer containing 1-2% SDS. For hydrophobic or membrane proteins, consider adding 4-8 M urea or thiourea to the buffer to aid solubilization and prevent aggregation [16] [54].
- Physical Disruption: Sonicate the sample on ice or homogenize thoroughly. This helps break down cellular structures and protein aggregates. Inadequate homogenization is a common cause of protein clumping in wells [54].
- Centrifugation: After lysis and disruption, centrifuge the sample at high speed (e.g., 14,000 x g for 10 minutes) to pellet insoluble debris and aggregates. Transfer the clear supernatant to a new tube for downstream processing [54].
- Critical Notes:
- If abnormal migration (e.g., peak splitting in CE-SDS) occurs, it may indicate poor SDS binding. In rare cases, switching to a surfactant with a longer alkyl chain like sodium hexadecyl sulfate (SHS) can be more effective [53].
- Be mindful that strong SDS buffers must be removed or exchanged before LC-MS/MS analysis, as SDS suppresses ionization [55] [16].
The Scientist's Toolkit: Essential Reagents and Materials
The following table lists key reagents and materials crucial for implementing the protocols described and minimizing artefacts.
Table 2: Key Research Reagent Solutions for Artefact Prevention
| Reagent/Material | Function | Key Considerations for Artefact Prevention |
|---|---|---|
| DTT / TCEP [53] [16] | Reducing agent to break disulfide bonds. | TCEP is more stable and effective than DTT. Use fresh solutions. |
| Iodoacetamide (IAM) [53] [16] | Alkylating agent to cap free cysteines. | Light-sensitive. Must be used in excess after reduction to prevent disulfide scrambling. |
| High-Purity SDS [53] [56] | Denaturing detergent to linearize proteins and confer uniform charge. | Impurities can affect performance. Critical for complete denaturation. |
| Protease Inhibitors [16] | Prevents proteolytic degradation during lysis. | Essential cocktail to preserve native proteoforms and prevent in-vitro truncation. |
| Urea [55] [54] | Chaotrope to aid protein solubilization. | Keep cold to prevent cyanate formation, which can cause protein carbamylation. |
| Molecular Weight Standards [56] | Reference for protein size estimation. | Essential for identifying unexpected bands that may be artefacts. |
Workflow Visualization: An Integrated Strategy
The following diagram summarizes the key decision points and steps in an integrated workflow designed to prevent artefactual modifications during sample preparation for preparative SDS-PAGE and GeLC-MS/MS.
Strategies for Improving Recovery of Low-Abundance and Membrane Proteins
Within the framework of preparative SDS-PAGE for protein fractionation and GeLC-MS/MS research, the effective recovery of low-abundance proteoforms and hydrophobic membrane proteins presents a significant technical challenge. These protein classes are often underrepresented in proteomic analyses due to issues with solubility, dynamic range, and adsorption losses during sample preparation. This application note details targeted strategies to overcome these hurdles, enabling more comprehensive proteome coverage for researchers and drug development professionals. The protocols herein are designed to integrate seamlessly with standard GeLC-MS/MS workflows, enhancing the recovery of critical protein targets without requiring specialized instrumentation.
Quantitative Comparison of Recovery Enhancement Strategies
The following strategies have been quantitatively evaluated for their efficacy in improving protein recovery. The data summarizes key performance metrics from recent studies.
Table 1: Comparison of Strategies for Low-Abundance Protein Recovery
| Strategy | Methodology | Key Advantage | Performance Improvement | Reference |
|---|---|---|---|---|
| In-Gel Sample Preparation (IGSP) | Removal of high-MW glycoproteins via gel clean-up prior to digestion | Reduces interference in complex samples | Increased protein identifications and peptide coverage vs. FASP [57] | |
| PEPPI-MS | Passive protein extraction from gels using CBB as an extraction enhancer | High recovery efficiency without specialized equipment | Mean recovery of 68% (<100 kDa); 57% (>100 kDa) [9] | |
| KCl/SDS Precipitation | SDS depletion via K+ precipitation at high pH with urea | Maintains solubility of intact membrane proteins | Identified 732 membrane proteins (69.3% of total) [58] | |
| Immunodepletion | Spin columns or LC to remove top 2-20 abundant proteins from plasma/serum | Reveals low-abundance proteins | Removes up to 93% of IgG, clarifying the low-abundance proteome [59] |
Table 2: Comparison of SDS Depletion Methods for Membrane Protein Recovery
| Method | Principle | Compatibility | Efficiency / Concern |
|---|---|---|---|
| KCl Precipitation | Precipitates SDS as KDS (potassium dodecyl sulfate) | Intact proteins & peptides | >99.99% SDS depletion; risk of protein co-precipitation [58] |
| Filter-Aided Sample Prep (FASP) | Retains proteins on MW filter; washes away SDS | Proteins (digested to peptides) | Variable protein recovery; slow processing [58] |
| Organic Solvent Precipitation | Pellets proteins; detergents remain in solution | Intact proteins | Requires resolubilization, risking sample loss [58] |
| Commercial Spin Cartridges | Proprietary resin captures SDS | Intact proteins & peptides | High cost; vendor-dependent performance [58] |
Detailed Experimental Protocols
Protocol 1: KCl Precipitation for Enhanced Membrane Protein Recovery
This protocol is optimized for depleting SDS from membrane protein preparations while maintaining protein solubility for intact proteoform analysis, based on the workflow from PMC12286100 [58].
Reagents:
- Lysis Buffer: 50 mM Tris-HCl, 1% (w/v) SDS, pH 8.0
- KCl Solution: 3 M KCl in H₂O
- Urea Buffer: 8 M Urea in 50 mM Ammonium Bicarbonate, pH 12 (adjusted with NaOH)
- Neutralization Buffer: 1 M Tris-HCl, pH 7.0
Procedure:
- Protein Extraction: Homogenize tissue or cell pellets in ice-cold lysis buffer. Incubate for 30 minutes on ice with intermittent vortexing.
- Clarification: Centrifuge the lysate at 16,000 × g for 15 minutes at 4°C. Transfer the supernatant to a new tube.
- Alkaline Conditioning: For every 100 µL of lysate, add 300 µL of Urea Buffer (pH 12). Mix thoroughly by pipetting. Note: High pH weakens SDS-protein interactions, improving depletion efficiency.
- KCl-Induced Precipitation: Add the KCl solution to the sample to achieve a final concentration of 180-300 mM. Vortex immediately and incubate at room temperature for 10 minutes.
- Pellet Precipitate: Centrifuge at 16,000 × g for 10 minutes at room temperature. A white pellet of potassium dodecyl sulfate (KDS) will form.
- Recover Supernatant: Carefully transfer the supernatant, which contains the solubilized proteins, to a clean tube. The supernatant is now depleted of SDS and can be processed for GeLC-MS/MS analysis.
Protocol 2: PEPPI-MS for High-Yield Protein Recovery from Gels
This protocol describes the Passively Eluting Proteins from Polyacrylamide Gels as Intact species for MS (PEPPI-MS) method, enabling efficient recovery of proteoforms from gel slices for top-down or bottom-up analysis [9].
Reagents:
- Aqueous Coomassie Brilliant Blue (CBB) Stain (e.g., EzStain AQua)
- Extraction Buffer: 0.05% (w/v) SDS in 100 mM Ammonium Bicarbonate
- Pre-chilled Acetone
Procedure:
- Gel Electrophoresis: Perform preparative SDS-PAGE according to standard protocols. Do not fix proteins in the gel.
- Reversible Staining: Stain the gel with aqueous CBB for 1 hour. Destain with Milli-Q water until protein bands are visible. Critical: Avoid acetic acid and methanol, which fix proteins.
- Excision: Excise the protein bands or entire lanes of interest using a clean scalpel. Minimize excess gel.
- Homogenization: Place each gel slice into a disposable plastic homogenizer. Thoroughly grind the gel into small pieces using a pestle to maximize surface area.
- Passive Extraction:
- Add 200-500 µL of Extraction Buffer to the homogenized gel. The buffer volume should be ~3x the gel volume.
- Add 10 µL of the aqueous CBB stock solution to the extraction buffer. CBB acts as an extraction enhancer.
- Shake the mixture vigorously for 10 minutes at room temperature.
- Collection: Centrifuge the homogenizer briefly to pellet gel debris. Transfer the supernatant, which contains the extracted proteins, to a low-protein-binding microcentrifuge tube.
- Protein Precipitation (Optional): For buffer exchange or concentration, add 4 volumes of pre-chilled acetone to the supernatant, incubate at -20°C for 2 hours, and centrifuge to pellet proteins. Redissolve the pellet in a buffer compatible with your downstream application.
Workflow Visualization
The following diagram illustrates the integrated workflow for recovering low-abundance and membrane proteins, combining the optimized protocols for SDS depletion and gel-based recovery.
The Scientist's Toolkit: Research Reagent Solutions
Table 3: Essential Materials for Protein Recovery Workflows
| Item | Function / Application | Example / Specification |
|---|---|---|
| Protease/Phosphatase Inhibitor Cocktails | Preserves protein integrity during lysis and extraction by inhibiting endogenous enzymes [60]. | Commercially available cocktails (e.g., serine, cysteine, aspartic protease inhibitors). |
| Mass Spectrometry-Compatible Surfactants | Efficiently solubilize membrane proteins without suppressing MS ionization. | Sodium deoxycholate; RapiGest (acid-labile). |
| Enhanced Matrix Removal (EMR) Cartridges | Pass-through cleanup to remove lipids, fats, and other interferences from complex samples [61]. | Captiva EMR Lipid HF (Agilent). |
| Weak Anion Exchange (WAX) SPE Cartridges | Cleanup for complex samples prior to analysis, particularly for PFAS but applicable to protein prep [61]. | InertSep WAX FF/GCB (GL Sciences). |
| Aqueous Coomassie Brilliant Blue (CBB) | Reversible staining and critical extraction enhancer in the PEPPI-MS protocol [9]. | ATTO EzStain AQua or equivalent. |
| Disposable Plastic Homogenizers | Efficient homogenization of gel pieces for maximum protein recovery during passive elution [9]. | Bio Masher II (Nippi) or similar. |
Within the framework of a thesis on preparative SDS-PAGE for protein fractionation and GeLC-MS/MS research, achieving high analytical accuracy is paramount. Sodium Dodecyl Sulfate-Polyacrylamide Gel Electrophoresis (SDS-PAGE) is a foundational technique for separating proteins by molecular weight, serving as a critical preparatory step for downstream mass spectrometric analysis [62]. The reliability of this workflow, however, is highly dependent on several technical factors. This application note details the critical parameters—gel composition, protein staining, and gel band excision—that directly impact the resolution, detection, and subsequent recovery of proteins. By optimizing these elements, researchers and drug development professionals can ensure the integrity of their protein samples, leading to more reliable and reproducible GeLC-MS/MS data essential for biomarker discovery, drug-target interaction studies, and functional proteomics.
Critical Factor 1: Gel Composition
The composition of the polyacrylamide gel is the primary determinant of protein separation efficiency and resolution in SDS-PAGE. The gel matrix acts as a molecular sieve, and its pore size must be appropriately matched to the molecular weight range of the target proteins to achieve clear separation [56].
Acrylamide Concentration and Pore Size
The porosity of the gel is controlled by the concentrations of acrylamide and the cross-linker bis-acrylamide. Higher percentages of acrylamide create smaller pores, which are better for resolving low molecular weight proteins, while lower percentages create larger pores for separating high molecular weight proteins [62] [56]. A two-layer gel system, comprising a stacking gel and a resolving gel, is standard for achieving sharp, well-defined protein bands.
Table 1: Optimal Acrylamide Concentrations for Protein Separation
| Acrylamide Concentration (%) | Effective Separation Range (kDa) | Primary Application |
|---|---|---|
| 7.5 - 10% | 30 - 200 | High molecular weight proteins |
| 10 - 12% | 15 - 100 | Standard mixture of proteins |
| 12 - 15% | 10 - 70 | Low molecular weight proteins |
Buffer Systems and pH
The discontinuous buffer system is crucial for sharp band formation. The stacking gel, with a lower acrylamide concentration (typically 4-5%) and a pH of ~6.8, concentrates the protein samples into a narrow zone before they enter the resolving gel. The separating gel, with a higher acrylamide concentration and a pH of ~8.8, then resolves the proteins based on size [56]. The use of Tris-Glycine running buffer maintains the necessary pH and ionic strength for consistent protein migration [56]. Factors such as the buffer system and the composition of the gel must be carefully controlled, as they significantly affect the accuracy and reliability of the analysis [62].
Figure 1: SDS-PAGE Gel Workflow and Separation Mechanism
Critical Factor 2: Staining
Following electrophoresis, protein bands must be visualized for analysis and excision. The choice of staining method directly impacts detection sensitivity, dynamic range for quantification, and compatibility with downstream mass spectrometry.
Staining Methods and Their Characteristics
Different staining techniques offer varying balances between sensitivity, ease of use, and MS-compatibility. Coomassie Brilliant Blue is a common, cost-effective method, while silver staining offers much higher sensitivity. Fluorescent dyes provide an excellent balance of sensitivity and MS-compatibility [56].
Table 2: Comparison of Common Protein Staining Methods
| Staining Method | Detection Limit | Compatibility with GeLC-MS/MS | Key Advantages | Key Limitations |
|---|---|---|---|---|
| Coomassie Brilliant Blue | ~10 - 100 ng [56] | Good (requires destaining) | Cost-effective, simple protocol, quantitative potential | Lower sensitivity |
| Silver Staining | ~0.1 - 1 ng [56] | Moderate (requires MS-compatible protocols) | Very high sensitivity | Less quantitative, potential for MS interference |
| Fluorescent Stains (e.g., SYPRO Ruby) | ~1 - 10 ng [56] | Excellent | High sensitivity, wide linear dynamic range, MS-compatible | Requires specific imaging equipment |
Optimizing Band Visualization and Contrast
The accuracy of band identification and excision is dependent on clear, high-contrast visualization. For Coomassie-stained gels, proper destaining is critical to reduce background and enhance band contrast [56]. If digital images of gels require adjustment for publication, it is acceptable practice to apply global adjustments to tonal values and contrast, provided they are applied to the entire image and do not obscure, eliminate, or misrepresent any bands [63]. Partial adjustments that alter the scientific content are not permissible.
Critical Factor 3: Band Excision
The excision of protein bands from the gel is the final preparatory step for GeLC-MS/MS analysis. Precision in this process is critical to minimize keratin contamination and ensure the correct protein is submitted for identification.
Protocol for Optimal Gel Band Excision
The following detailed protocol is designed for a standard Coomassie-stained gel, aiming to maximize protein recovery and minimize contaminants.
Materials:
- Coomassie-stained SDS-PAGE gel
- Clean scalpel or razor blade
- Sterile, DNase/RNase-free pipette tips (low-retention)
- Sterile 0.5 mL microcentrifuge tubes
- MS-grade water
Procedure:
- Visualization: Place the gel on a clean, sterile surface. Use a fresh, clean scalpel for all excision steps.
- Excision: Carefully cut around the band of interest, minimizing the amount of excess gel. For sharp bands, this involves cutting closely to the band's perimeter.
- Transfer: Use a sterile pipette tip to transfer the gel slice to a labeled, sterile 0.5 mL microcentrifuge tube.
- Washing: Add 100 - 200 µL of MS-grade water to the tube, vortex briefly, and incubate for 10 minutes at room temperature. Remove and discard the water. This step helps remove residual staining dye and salts.
- Storage: At this point, gel plugs can be stored at -20°C or processed immediately for in-gel digestion.
Troubleshooting Band Excision
- Smearing: If bands are smeared, it often indicates protein overload or issues with gel polymerization [64]. Re-optimize protein load and gel composition.
- Faint Bands: For faint bands, ensure the protein concentration was sufficient during sample preparation [64]. Using a more sensitive stain like SYPRO Ruby may be necessary for future experiments.
- Contamination: Always wear gloves and use clean, dedicated tools to prevent keratin and other contaminant introduction, which can interfere with MS analysis.
The Scientist's Toolkit: Research Reagent Solutions
The following table lists essential materials and reagents critical for successful and accurate SDS-PAGE and downstream processing.
Table 3: Essential Reagents for SDS-PAGE and GeLC-MS/MS Sample Preparation
| Item | Function | Key Considerations |
|---|---|---|
| Pre-Stained Protein Ladder | Provides real-time tracking of electrophoresis and transfer efficiency; enables molecular weight estimation [65]. | Color-coded bands allow for immediate visual confirmation. Essential for troubleshooting. |
| SDS (Sodium Dodecyl Sulfate) | Anionic detergent that denatures proteins and confers a uniform negative charge, enabling separation by size rather than charge [56]. | Critical for solubilizing membrane proteins, but must be thoroughly removed prior to MS analysis [58]. |
| Reducing Agents (DTT, β-Mercaptoethanol) | Breaks disulfide bonds in proteins, ensuring complete denaturation and linearization [62] [56]. | Must be fresh for effective reduction. DTT is often preferred for its lower odor. |
| Protease Inhibitor Cocktails | Prevents proteolytic degradation of protein samples during extraction and preparation. | Essential for working with sensitive samples like tissues or cell lysates. |
| MS-Grade Water & Solvents | Used in all sample preparation steps for MS analysis, including gel washing and digestion. | Prevents introduction of polymers and contaminants that ionize and interfere with MS detection. |
Figure 2: GeLC-MS/MS Workflow from SDS-PAGE to Protein Identification
The integrity of data generated from a GeLC-MS/MS pipeline is fundamentally rooted in the meticulous optimization of preparative SDS-PAGE. As outlined in this note, researchers must pay critical attention to gel composition to ensure superior resolution, select a staining method aligned with their sensitivity and downstream application needs, and execute precise band excision to minimize contamination. By systematically controlling these factors—gel composition, staining, and band excision—scientists can reliably fractionate complex protein mixtures, thereby ensuring the production of high-quality samples for mass spectrometry. This rigorous approach is indispensable for achieving the reproducible and biologically meaningful results required in advanced proteomic research and drug development.
Benchmarking GeLC-MS/MS: Performance Validation and Comparison to Alternative Techniques
Within proteomic research, the analytical workflow combining sodium dodecyl sulfate–polyacrylamide gel electrophoresis (SDS-PAGE) for protein fractionation with subsequent liquid chromatography-tandem mass spectrometry (GeLC-MS/MS) remains a cornerstone technique for analyzing complex protein mixtures [66]. The reliability of discoveries made using this platform—whether in biomarker identification, drug target validation, or quantitative expression profiling—is fundamentally contingent upon the reproducibility of the entire workflow. This application note addresses the critical need for robust protocols and analytical methods to assess and ensure reproducibility, focusing specifically on the strategic use of technical replicates and the validation of quantitative data through correlation with orthogonal functional assays. We provide a detailed framework for implementing these quality controls, enabling researchers to generate data with the high confidence required for drug development and other translational research applications.
The GeLC-MS/MS Workflow and Reproducibility Challenges
The GeLC-MS/MS workflow involves separating a complex protein lysate by molecular weight using 1D SDS-PAGE, excising the entire gel lane into multiple fractions, performing in-gel tryptic digestion on these fractions, and then identifying and quantifying the resulting peptides using LC-MS/MS [66] [2]. While this method offers advantages such as high tolerance for detergents and buffers and the ability to handle complex samples [2], it is a multi-step process susceptible to technical variability.
Sources of this variability can include:
- Sample Preparation: Inefficiency in protein extraction, reduction, alkylation, and digestion [67].
- Gel Electrophoresis: Differences in gel polymerization, running conditions, and staining [14].
- In-Gel Digestion: Variation in trypsin activity, peptide extraction efficiency, and the manual labor involved in processing multiple gel slices [2].
- LC-MS/MS Analysis: Fluctuations in chromatographic performance, instrument calibration, and MS/MS sampling efficiency [68].
These factors collectively underscore the necessity of incorporating rigorous reproducibility assessments directly into the experimental design.
Experimental Protocols for Assessing Reproducibility
Protocol 1: Whole-Gel Processing for High-Throughput Reproducibility
To minimize variability arising from the manual processing of numerous individual gel slices, the "Whole-Gel" (WG) procedure streamlines the initial stages of sample preparation. This protocol significantly reduces hands-on time and improves consistency, especially when processing large sample sets (e.g., 90 gel slices), as detailed in Figure 1B&C [2].
Procedure:
- Protein Separation and Staining: Separate the protein sample (e.g., 50 µg of a complex cell lysate) on a 1D SDS-PAGE gel (e.g., 4-12% gradient). Run the gel until the dye front has migrated 2-4 cm for optimal fractionation. Fix and stain the gel with a compatible stain like colloidal Coomassie [66] [2].
- Whole-Gel Processing (Pre-Slicing):
- Washing: Place the entire excised gel lane into a container. Wash the intact gel with a series of buffers to destain and remove SDS. This typically involves multiple washes with a 50:50 mixture of ammonium bicarbonate and acetonitrile [2] [68].
- Reduction and Alkylation: Perform reduction and alkylation on the whole gel. Add a reducing agent (e.g., 10 mM dithiothreitol) and incubate at 56°C for 30 minutes. Remove the solution, add an alkylating agent (e.g., 90 mM iodoacetamide), and incubate in the dark for 30 minutes [68].
- Final Washing: Conduct a final series of washes with ammonium bicarbonate/acetonitrile and then pure acetonitrile to dehydrate the gel [2].
- Gel Slicing: Only after the final wash, slice the entire gel lane into the desired number of fractions (e.g., 10-20 slices of equal size) using a scalpel. The slicing can be guided by a pre-stained protein ladder [2].
- In-Gel Digestion: Transfer each gel slice to a separate tube. Add trypsin (recommended protein-to-protease ratio of 5:1) and incubate overnight at 37°C [68].
- Peptide Extraction: Extract peptides from each gel slice by adding a solution of 5% formic acid in acetonitrile, incubating at 37°C, and collecting the supernatant. Repeat this extraction step and combine the supernatants for each fraction. Dry down the extracted peptides and reconstitute for LC-MS/MS analysis [2] [68].
Protocol 2: Incorporating Technical Replicates and Normalization
This protocol outlines how to incorporate technical replicates and normalization strategies to control for variability and enable robust quantitative analysis.
Procedure:
- Technical Replication: Process multiple aliquots of the same biological sample independently through the entire GeLC-MS/MS workflow (from gel separation to LC-MS/MS). For example, run three separate gels from the same HCT116 cell lysate and process them in parallel [2].
- Spike-In Internal Standards: Prior to SDS-PAGE, add known amounts of non-cross-reactive protein standards (e.g., 25 ng each of equine myoglobin and chicken ovalbumin) to the protein extract. These serve as internal controls for normalization (Normalization to Selected Proteins, NSP) [68].
- LC-MS/MS Analysis: Analyze all technical replicate samples and fractions using consistent LC-MS/MS conditions. Use moderate-length reversed-phase gradients (e.g., 70-90 minutes) for analysis [66].
- Data Normalization:
- Total Spectral Count (TSpC) Normalization: Normalize the spectral counts (SpC) for each protein in a run to the total spectral count of that run. The replicate with the highest TSpC is chosen as the reference, and the others are normalized to it [68].
- Normalized Spectral Abundance Factor (NSAF) Normalization: For each protein, calculate the Spectral Abundance Factor (SAF = SpC / protein length). Then, normalize the SAF for each protein to the sum of all SAFs in that run to generate the NSAF [68].
- Normalization to Selected Proteins (NSP): Use the SpC of the spike-in protein standards to generate a correction factor for normalizing the SpC of all identified proteins across runs [68].
Protocol 3: Correlation with Catalytic Activity for Absolute Validation
For studies where protein abundance is linked to function (e.g., enzyme quantification in drug metabolism), correlating MS-derived abundance data with catalytic activity provides the highest level of validation [67].
Procedure:
- Parallel Sample Preparation: Split homogeneous sample material (e.g., human liver microsomes) into two portions.
- GeLC-MS/MS Analysis: Analyze one portion using the GeLC-MS/MS workflow to determine protein abundance (in pmol/mg total protein).
- Activity Assay: Simultaneously, assay the second portion for enzyme-specific catalytic activity. For Uridine-5′-diphospho-glucuronosyltransferases (UGTs), this involves incubating the sample with isoform-specific substrates (e.g., β-estradiol for UGT1A1, propofol for UGT1A9) and measuring the formation of glucuronide metabolites [67].
- Data Correlation and Optimization:
- Plot the measured protein abundance against the corresponding catalytic activity.
- If the initial correlation is poor (e.g., low R² value), systematically re-evaluate the proteomic data analysis steps. This includes reassessing the choice of signature peptides and their fragments, correcting for imperfect isotope-label incorporation in standards, and ensuring consistent protein mass measurement for normalization [67].
- Optimize the parameters until a statistically significant abundance-activity correlation is achieved, confirming the quantitative accuracy of the proteomic measurement.
Data Presentation and Analysis
Quantitative Evaluation of Workflow Reproducibility
The reproducibility of the GeLC-MS/MS workflow can be quantitatively assessed by comparing protein identification and quantification across technical replicates.
Table 1: Reproducibility of Protein Identification in Technical Replicates using the Whole-Gel Procedure. Data derived from triplicate analysis of HCT116 cell lysate and a formalin-fixed paraffin-embedded (FFPE) tumor tissue sample [2].
| Sample Type | Total Proteins Identified (Pooled) | Proteins Identified per Replicate (Mean ± SD) | Overlap in Protein Identifications (%) | Coefficient of Variation (CV) on Spectral Count Quantification (%) |
|---|---|---|---|---|
| HCT116 Cell Lysate | 5386 | 5109 ± 22 | 88.2 | < 20 |
| FFPE Tumor Tissue | Not Specified | Not Specified | > 88 | < 20 |
Table 2: Comparison of Normalization Methods for Spectral Counting Data. The performance of three normalization methods was evaluated based on their ability to correct for day-to-day variation in sample preparation and chromatography using a Magnaporthe oryzae conidia sample [68].
| Normalization Method | Principle | Performance in Correcting Technical Variation |
|---|---|---|
| Total Spectral Count (TSpC) | Normalizes SpC of each protein to the total SpC in a run. Assumes TSpC is conserved between runs. | Excellent. Yielded an almost ideal slope of unity for normalized SpC vs. average normalized SpC plots. |
| Normalized Spectral Abundance Factor (NSAF) | Normalizes SpC by protein length (SAF) and then to the sum of all SAFs in a run. | Excellent. Also yielded an almost ideal slope of unity, performing similarly to TSpC. |
| Normalization to Selected Proteins (NSP) | Uses SpC from spike-in protein standards to generate a correction factor. | Poor. Did not afford effective correction of unnormalized data in the tested model. |
Validating Quantitative Accuracy against Functional Data
The ultimate test of quantitative accuracy in a reproducible workflow is the correlation with independent, orthogonal data.
Table 3: Impact of Data Analysis Optimization on Correlation between Protein Abundance and Catalytic Activity. Data shows the improvement in Spearman correlation (Rₛ) for UGT enzymes after optimizing peptide selection, isotope correction, and normalization [67].
| UGT Enzyme | Initial Correlation with Activity (Rₛ) | Optimized Correlation with Activity (Rₛ) |
|---|---|---|
| 1A1 | 0.40 (P < 0.05) | 0.87 (P < 0.01) |
| 1A3 | 0.79 (P < 0.05) | 0.53 (P < 0.01) |
| 1A4 | No significant correlation | 0.69 (P < 0.01) |
| 1A6 | No significant correlation | 0.66 (P < 0.01) |
| 1A9 | No significant correlation | 0.47 (P = 0.02) |
| 2B7 | 0.40 (P < 0.05) | 0.80 (P < 0.01) |
| 2B15 | No significant correlation | 0.76 (P < 0.01) |
The Scientist's Toolkit: Essential Research Reagents
Table 4: Key Reagent Solutions for GeLC-MS/MS Reproducibility Workflows.
| Research Reagent | Function & Importance in Reproducibility |
|---|---|
| SDS-PAGE Sample Buffer (with DTT) | Denatures proteins, masks native charge, and reduces disulfide bonds, ensuring separation by molecular weight. Critical for consistent protein migration [14] [69]. |
| Polyacrylamide Gels (Gradient) | Provides a molecular sieve for separation. Gradient gels (e.g., 4-12%) offer a broader range for resolving proteins of different sizes in a single run, improving fractionation [14]. |
| Trypsin (Protease) | Enzyme responsible for in-gel digestion, cleaving proteins at lysine and arginine residues. Consistent, high-quality trypsin is vital for reproducible peptide generation [66] [68]. |
| Spectral Counting Normalization Algorithms (TSpC, NSAF) | Computational methods to correct for technical variation in MS/MS data sampling. Essential for accurate label-free quantitative comparisons between replicates and samples [68]. |
| Stable Isotope-Labeled (SIL) Peptides / QconCAT | Internal standards added prior to LC-MS/MS for absolute quantification. Corrects for sample loss and ionization variability, providing a gold standard for quantitative accuracy [67]. |
| Spike-In Protein Standards (e.g., Myoglobin, Ovalbumin) | Exogenous proteins added to samples before processing. Used to monitor and correct for variability across the entire workflow via Normalization to Selected Proteins (NSP) [68]. |
Workflow Diagrams
GeLC-MS/MS Reproducibility Assessment Workflow
The following diagram illustrates the integrated experimental strategy for assessing technical reproducibility and quantitative correlation in a GeLC-MS/MS study.
Ensuring the reproducibility of GeLC-MS/MS workflows is not merely a best practice but a fundamental requirement for generating reliable and actionable proteomic data. As demonstrated, a multi-faceted approach is most effective. Implementing streamlined protocols like the Whole-Gel procedure reduces manual variability and enhances throughput. Systematically employing technical replicates coupled with robust normalization methods, such as Total Spectral Count or NSAF, is crucial for controlling analytical variance. Finally, for absolute confidence in quantitative results, correlation with catalytic activity provides an essential orthogonal validation, revealing potential biases in proteomic data analysis and ensuring that measured abundance reflects biological function. By adopting the detailed protocols and analytical frameworks presented herein, researchers in proteomics and drug development can significantly strengthen the reliability of their findings, thereby de-risking the pipeline from discovery to application.
Within the context of a broader thesis on preparative SDS-PAGE for protein fractionation and GeLC-MS/MS research, this application note provides a direct comparison of two fundamental sample preparation techniques in bottom-up proteomics: GeLC-MS/MS and in-solution digestion. The choice between these methods significantly impacts protein identifications, sequence coverage, and overall analytical workflow efficiency, making their comparative understanding crucial for researchers, scientists, and drug development professionals [70] [1].
GeLC-MS/MS integrates protein separation via one-dimensional SDS-polyacrylamide gel electrophoresis (1D SDS-PAGE) with subsequent in-gel digestion and liquid chromatography-tandem mass spectrometry (LC-MS/MS) analysis [1]. In contrast, in-solution digestion involves the direct enzymatic cleavage of proteins in a liquid medium followed by LC-MS/MS, bypassing the gel electrophoresis step [70] [71]. This analysis will detail the protocols, performance metrics, and specific applications for each method, providing a framework for selecting the optimal approach based on research objectives and sample characteristics.
Performance Comparison and Quantitative Data
A recent systematic study comparing in-gel and urea-based in-solution digestion for the proteome profiling of organ perfusion solutions demonstrated a clear performance differential. The research found that in-solution digestion allowed for the identification of a higher number of peptides and proteins, provided greater sequence coverage, and generated higher confidence data in both kidney and liver perfusate samples [70]. Key pathways identified through this method included complement, coagulation, and antioxidant pathways, along with biomarkers linked to ischemia-reperfusion injury [70].
Table 1: Comparative Performance of In-Solution vs. In-Gel Digestion for Perfusate Analysis
| Performance Metric | In-Solution Digestion | In-Gel Digestion |
|---|---|---|
| Number of Protein Identifications | Highest [70] | Lower [70] |
| Number of Peptide Identifications | Highest [70] | Lower [70] |
| Sequence Coverage | Greater [70] | Reduced [70] |
| Sample Throughput | Higher (Quicker and easier) [70] | Lower (Lengthy process) [70] |
| Risk of Experimental Error/Peptide Loss | Lower [70] | Higher [70] |
| Handling of Complex/Membrane Proteins | Superior (e.g., via S-Trap) [72] | Less effective |
Beyond standard in-solution protocols, modern approaches like the S-Trap digestion method have further enhanced performance. When compared to traditional in-solution digestion, S-Trap digestion with SDS buffer significantly increased the number of identified proteins, including more mitochondrial and membrane-related proteins [72]. Another study highlighted that optimizing MS acquisition frequency and using advanced software could increase protein identifications in complex samples like CHO cell lysates by over 10% without increasing instrument time [73].
Table 2: Advantages and Disadvantages of GeLC-MS/MS and In-Solution Digestion
| Aspect | GeLC-MS/MS | In-Solution Digestion |
|---|---|---|
| Core Principle | Separation of proteins by molecular weight before digestion [1] | Direct digestion of a protein mixture in solution [74] |
| Key Advantage | Pre-fractionation reduces sample complexity; visual QC; effective for abundant protein isolation [1] | Faster, higher throughput, fewer manipulation steps [70] [73] |
| Ideal for | Complex mixtures with wide dynamic range; targeted analysis of specific bands; samples with contaminants [1] | High-throughput applications; quantitative studies; when sample loss must be minimized [70] |
| Major Limitation | Time-consuming, lower peptide yield, potential for human error [70] | Less effective pre-fractionation can lead to fewer IDs in highly complex samples without additional steps [1] |
Experimental Protocols
Detailed GeLC-MS/MS Protocol
The GeLC-MS/MS workflow is a robust method for qualitative and quantitative proteomic analysis, leveraging protein-level fractionation to improve proteome coverage [1].
3.1.1 Protein Separation by 1D SDS-PAGE
- Sample Preparation: Proteins are solubilized in SDS-PAGE sample buffer (e.g., containing LDS) and heated at 70°C for 10 minutes [1]. The use of a reducing agent like dithiothreitol (DTT) is common at this stage.
- Gel Electrophoresis: The denatured protein sample is loaded onto a polyacrylamide gel (e.g., a Bis-Tris 4-12% gradient gel). A pre-stained protein ladder is included for molecular weight reference. Separation is performed using a buffer like MES SDS running buffer [1].
- Staining and Excising: After electrophoresis, proteins are visualized using a Coomassie Brilliant Blue-based stain. The entire gel lane is then systematically excised into multiple bands based on molecular weight using a clean razor blade or scalpel [1].
3.1.2 In-Gel Tryptic Digestion
- Destaining: Gel pieces are placed in low-protein-binding microcentrifuge tubes and destained with a solution of 25 mM ammonium bicarbonate and 50% acetonitrile (ACN) [1].
- Reduction and Alkylation: Proteins within the gel are reduced with a agent like Tris[2-carboxyethyl]phosphine (TCEP) and then alkylated with iodoacetamide (IAM) to modify cysteine residues [1] [73].
- Enzymatic Digestion: Gel pieces are soaked in a solution containing sequencing-grade trypsin (e.g., 10 ng/μL) and incubated at 37°C for several hours or overnight to allow for complete protein digestion [1].
- Peptide Extraction: Following digestion, peptides are extracted from the gel pieces using an solution such as 1% formic acid or 50% ACN/5% formic acid. The supernatant, containing the extracted peptides, is collected and concentrated using a SpeedVac concentrator [1].
3.1.3 LC-MS/MS Analysis
- The extracted peptides are separated by nano-flow reversed-phase liquid chromatography and analyzed by a tandem mass spectrometer (e.g., an LTQ Orbitrap) operating in data-dependent acquisition mode [1].
Detailed In-Solution Tryptic Digestion Protocol
In-solution digestion offers a quicker, more streamlined workflow suitable for a variety of sample types [70] [71] [73].
3.2.1 Denaturation, Reduction, and Alkylation
- Denaturation: The protein sample is denatured using a chaotropic agent (e.g., 6M guanidine-HCL) or a detergent (e.g., SDS) in a buffer such as 25-100 mM ammonium bicarbonate (NH₄HCO₃) at pH ~8 [71] [73]. Heating at 96°C for 5 minutes may also be used [73].
- Reduction: A reducing agent like dithiothreitol (DTT) is added to a final concentration of ~1-10 mM, and the sample is incubated at 55°C for 30 minutes to break disulfide bonds [71] [73].
- Alkylation: Iodoacetamide (IAA) is added to a final concentration of ~20 mM to alkylate the reduced cysteine residues. This reaction is incubated in the dark at room temperature for 30 minutes [73].
3.2.2 Digestion and Cleanup
- Buffer Exchange/Desalting: If incompatible reagents like SDS or urea are used, a cleanup step is critical. This can be achieved via protein precipitation using chloroform/methanol or buffer exchange using spin columns with a molecular weight cut-off [71] [73].
- Trypsin Digestion: Sequencing-grade trypsin is added to the protein solution at an enzyme-to-substrate ratio (typically 1:50 to 1:100). Digestion is carried out at 37°C for 4-18 hours [71] [73].
- Reaction Quenching: The digestion is stopped by acidifying the mixture with formic acid (FA) or trifluoroacetic acid (TFA) to a final concentration of 0.1-0.5% [71] [75].
- Peptide Desalting: The peptide mixture is desalted using a C18 solid-phase extraction tip or column before final LC-MS/MS analysis [73].
Workflow Visualization
The following diagrams illustrate the key procedural steps and decision-making logic for the two methods.
GeLC-MS/MS Workflow
In-Solution Digestion Workflow
Method Selection Guide
The Scientist's Toolkit: Essential Research Reagents
Successful implementation of either proteomic workflow requires specific reagents and materials. The following table details key solutions and their functions.
Table 3: Essential Reagents for GeLC-MS/MS and In-Solution Digestion Workflows
| Reagent/Material | Function/Purpose | Application in |
|---|---|---|
| SDS (Sodium Dodecyl Sulfate) | Strong anionic surfactant for protein denaturation and solubilization [72]. | Sample prep for both (GeLC primary, In-Solution with cleanup) |
| DTT (Dithiothreitol) | Reducing agent to break protein disulfide bonds [1] [73]. | Both methods |
| IAA (Iodoacetamide) | Alkylating agent to cap cysteine residues and prevent reformation of disulfide bonds [1] [73]. | Both methods |
| Trypsin (Sequencing Grade) | Protease that cleaves proteins at the C-terminal side of lysine and arginine residues [1] [71]. | Both methods |
| Ammonium Bicarbonate (NH₄HCO₃) | Volatile buffer used to maintain optimal pH (∼8) for tryptic digestion [71]. | Both methods |
| Coomassie Brilliant Blue | Reversible dye for staining and visualizing proteins post-SDS-PAGE [9] [1]. | GeLC-MS/MS |
| Formic Acid (FA) | Acidifying agent to quench digestion and ion-pairing reagent for LC-MS [1]. | Both methods (post-digestion) |
| S-Trap Micro Spin Column | Commercial device for efficient digestion and cleanup of SDS-solubilized samples, ideal for membrane proteins [72]. | In-Solution Digestion |
| C18 ZipTip / Column | Solid-phase extraction tip for desalting and concentrating peptide mixtures before LC-MS [73]. | Both methods (post-digestion) |
The direct comparison between GeLC-MS/MS and in-solution digestion reveals that the optimal method is contingent upon the specific research goals and sample attributes. In-solution digestion is generally the preferred choice for high-throughput studies where speed, minimal sample loss, and maximum protein identifications are the primary objectives, as demonstrated in profiling organ perfusion solutions [70]. Conversely, GeLC-MS/MS remains a powerful tool for the in-depth analysis of highly complex samples, offering valuable pre-fractionation that can isolate abundant proteins and provide a visual assessment of the proteome [1]. Its utility is also evident in specialized applications, such as top-down proteomics with improved protein recovery techniques like PEPPI-MS [9]. For challenging samples rich in membrane proteins, modern in-solution variants like the S-Trap method offer a compelling alternative, combining the benefits of detergent-based solubilization with efficient cleanup [72]. Ultimately, researchers must weigh the trade-offs between analytical depth, throughput, and sample complexity to select the most appropriate strategy for their proteomic characterization needs.
This application note provides a systematic comparison of three core protein fractionation platforms—SDS-PAGE, Capillary Electrophoresis SDS (CE-SDS), and Liquid-Phase Isoelectric Focusing (IEF)—within the context of preparative proteomics for GeLC-MS/MS research. The data and protocols herein are designed to guide researchers in selecting the optimal separation technology based on the specific requirements of their project, whether for high-resolution purity analysis, high-throughput profiling, or the fractionation of complex protein mixtures for downstream mass spectrometric identification.
The following table summarizes the key operational characteristics of each platform.
Table 1: Key Comparison of Protein Fractionation Platforms
| Parameter | SDS-PAGE | CE-SDS | Liquid-Phase IEF |
|---|---|---|---|
| Separation Principle | Molecular weight (MW) in polyacrylamide gel [76] | Molecular weight (MW) in SDS-filled capillary [77] | Isoelectric point (pI) in liquid phase [78] |
| Typical Analysis Time | 45-90 minutes [76] | ~35 minutes [77] | Varies; often longer for equilibrium [79] |
| Sample Throughput | Moderate (multiple samples per gel) | High (automated) | Moderate to High |
| Detection Method | Post-selection staining (Coomassie, Silver) [1] [2] | On-capillary UV absorbance [77] | Various, post-fractionation |
| Quantitation Capability | Semi-quantitative via software analysis [77] | Highly quantitative, high signal-to-noise [77] | Quantitative depending on downstream detection |
| Key Advantage | High tolerance to buffers/salts, provides sample cleanup [1] [2] | High resolution and reproducibility, automated quantification [80] [77] | Orthogonal separation based on pI, high resolution for charge variants |
| Key Limitation | Manual processing, lower reproducibility, lower resolution [81] [77] | Lower peak capacity for very high MW proteins [78] | Potential for protein precipitation, requires careful sample preparation |
Fractionation at the protein level is a critical step in bottom-up proteomics to reduce sample complexity and enhance the sensitivity and depth of mass spectrometry-based profiling [81]. Among the available techniques, SDS-PAGE is a foundational method that not only separates proteins by molecular weight but also effectively cleans up samples by removing interfering salts, detergents, and contaminants [1] [2]. The GeLC-MS/MS workflow, which couples SDS-PAGE with in-gel digestion and LC-MS/MS, is a robust and widely adopted approach for global proteomic analysis [1].
However, alternative and complementary technologies have emerged. Capillary Electrophoresis SDS (CE-SDS) has become an established tool for high-resolution purity analysis of biopharmaceuticals, increasingly replacing traditional SDS-PAGE due to its automated and quantitative nature [80] [77]. Meanwhile, liquid-phase IEF separates proteins based on their isoelectric point (pI), providing an orthogonal separation mechanism that is highly effective for resolving protein isoforms and charge variants [78].
This document provides a direct, data-driven comparison of these three platforms, including detailed protocols to enable their implementation in a proteomics laboratory.
Performance and Quantitative Data Comparison
Resolution and Sensitivity
A direct comparison of SDS-PAGE and CE-SDS for analyzing a monoclonal antibody and its heat-stressed degradation products reveals significant differences in performance. CE-SDS demonstrated a much higher signal-to-noise ratio, allowing for easy identification and quantitation of low-abundance degradation fragments, including a nonglycosylated IgG species that was not resolved by SDS-PAGE [77]. The quantitative data extracted from the CE-SDS electropherogram showed excellent reproducibility across consecutive runs [77].
Table 2: Resolution and Mass Accuracy Performance
| Metric | SDS-PAGE | CE-SDS / Liquid IEF-MS |
|---|---|---|
| Mass Accuracy | ~1-5% (relative to markers) [69] | ≤ 150 ppm (0.015%) [78] |
| Resolution | Limited for similar MW proteins [81] | 110x greater than SDS-PAGE [78] |
| Peak Capacity | Limited by gel dimensions | 130x greater than SDS-PAGE [78] |
| Sensitivity (Low MW) | Limited by staining | Improved for proteins below 40 kDa [78] |
A study comparing molecular weight (MW) determination found that the selection of the MW marker is critical for both CE-SDS and SDS-PAGE, with deviations in MW determination exceeding 10% when different markers are used. Interestingly, the trueness of MW determination for both techniques was comparable when using well-defined model proteins [80].
Application-Based Selection Guide
The choice of fractionation platform is heavily influenced by the sample type and the primary goal of the analysis.
Table 3: Platform Selection for Specific Applications
| Application / Goal | Recommended Platform(s) | Rationale |
|---|---|---|
| Routine Purity/Stability of mAbs | CE-SDS | Superior resolution and quantitation of fragments and nonglycosylated species [77] |
| Maximum Proteome Coverage | Orthogonal combination of 1D SDS-PAGE and IEF-IPG | The techniques provide complementary protein identifications [81] |
| Preparative Purification | Preparative SDS-PAGE | High resolving power to achieve single-band purity for challenging proteins [4] |
| Analysis of Charge Variants/Isoforms | Liquid-Phase IEF | High-resolution separation based on pI [78] [79] |
| Samples with High Contaminants | SDS-PAGE (GeLC-MS/MS) | High tolerance to salts and detergents; provides sample cleanup [1] [2] |
Detailed Experimental Protocols
Protocol: SDS-PAGE for GeLC-MS/MS Sample Preparation
This protocol is adapted for preparing a complex protein lysate for subsequent in-gel digestion and LC-MS/MS analysis [1] [69] [76].
The Scientist's Toolkit: Key Reagents for SDS-PAGE
| Reagent / Solution | Function / Purpose |
|---|---|
| LDS or SDS Sample Buffer | Denatures proteins and confers a negative charge proportional to mass [1] [76]. |
| Dithiothreitol (DTT) or β-mercaptoethanol | Reducing agent that breaks disulfide bonds [1] [69]. |
| Precast Bis-Tris Gradient Gels (e.g., 4-12%) | Separation matrix; gradient gels improve resolution across a wider MW range [1]. |
| MES SDS Running Buffer | Provides conductive medium and maintains SDS coating on proteins during electrophoresis [1]. |
| Coomassie Brilliant Blue Stain | For post-electrophoresis visualization of protein bands and gel quality control [1] [2]. |
| Molecular Weight Standards | Essential for estimating protein molecular weights and monitoring run progress [1] [76]. |
Procedure:
- Sample Preparation: Dilute protein sample with 4× LDS sample buffer. Add a reducing agent (e.g., DTT) to a final concentration of 10-50 mM. Mix well by pipetting [1] [76].
- Denaturation: Heat the samples at 70-95°C for 5-10 minutes to ensure complete denaturation [69] [76]. After heating, centrifuge at high speed for 3 minutes to pellet any insoluble debris [76].
- Gel Assembly: Place a precast Bis-Tris polyacrylamide gel (e.g., 4-12% gradient) into the electrophoresis chamber. Fill the inner and outer chambers with 1× MES SDS running buffer [1] [76].
- Sample Loading: Load the clarified supernatants into the gel wells. Include an appropriate MW standard ladder in one lane. A typical load for a complex lysate for GeLC-MS/MS is 1-10 µg per band [1] [69].
- Electrophoresis: Run the gel at a constant voltage of 150-200 V until the dye front has migrated out of the gel (approximately 45-90 minutes) [76].
- Post-Run Processing: Dismantle the gel apparatus and carefully remove the gel. Proceed with fixation and Coomassie staining to visualize the protein separation. The entire gel lane can then be excised and sliced into 5-20 fractions for in-gel digestion [1] [2].
Protocol: CE-SDS for Antibody Purity Analysis
This protocol outlines the key steps for analyzing antibody purity using CE-SDS, offering a direct comparison to the SDS-PAGE workflow above [77].
Procedure:
- Sample Preparation: Dilute the antibody sample to 1.0 mg/mL with SDS sample buffer. For non-reduced analysis, heat the sample at 70°C for 3 minutes [77].
- Instrument Setup: Use a commercial CE system equipped with a UV detector and a bare, fused-silica capillary. The capillary is filled with a replaceable SDS-gel buffer [77].
- Sample Injection: Inject the prepared sample into the capillary inlet hydrodynamically or by applying a high voltage (e.g., 5 kV for 20 seconds) [77].
- Separation: Apply an electric field (e.g., 500 V/cm) for 30-35 minutes. Proteins migrate toward the anode and are separated by molecular size [77].
- Detection & Analysis: Proteins are detected by UV absorbance (e.g., 220 nm) near the distal end of the capillary. Data acquisition software automatically generates an electropherogram and quantitates the peak areas for the main antibody and its impurities [77].
Protocol: Liquid-Phase IEF Fractionation
This protocol describes the first-dimension separation of a complex protein mixture by liquid-phase IEF prior to further analysis [81] [78].
Procedure:
- Sample Preparation: Solubilize the protein pellet in IEF buffer containing 7 M urea, 2 M thiourea, 4% CHAPS, and carrier ampholytes. Reduce and alkylate proteins using TCEP and iodoacetamide [81].
- Desalting/Buffer Exchange: Use centrifugal ultrafiltration (e.g., 10 kDa MWCO filters) to adjust the sample conductivity to ≤ 300 µS/cm, which is critical for effective focusing [81].
- Isoelectric Focusing: Load the sample into a liquid-phase IEF apparatus (e.g., an OFFGEL fractionator). Focus the proteins according to the manufacturer's instructions until they reach their isoelectric point in the liquid phase [81] [78].
- Fraction Collection: Upon completion, collect the distinct liquid fractions, each enriched for proteins of a specific pI range.
- Downstream Analysis: The collected fractions can be analyzed directly by MS for intact protein mass determination [78], or further processed (e.g., digested) and separated by a second dimension, such as reversed-phase liquid chromatography [81].
Workflow Integration and Visualization
The following diagrams illustrate the standard workflow for GeLC-MS/MS and the strategic decision-making process for selecting a fractionation platform.
GeLC-MS/MS Proteomics Workflow
Fractionation Platform Selection Guide
SDS-PAGE remains a powerful, accessible, and robust method for protein fractionation, particularly in preparative GeLC-MS/MS workflows where its sample cleanup properties are invaluable. However, for applications demanding high-resolution, quantitative purity analysis—such as in biopharmaceutical development—CE-SDS is a demonstrably superior technology. Liquid-phase IEF provides a critical orthogonal approach for separating proteins based on charge, and its combination with SDS-PAGE in multidimensional strategies offers the most comprehensive solution for profiling complex proteomes. The choice of platform should be guided by the specific analytical goals, required throughput, and the nature of the protein sample.
In clinical and biopharmaceutical development, the precise characterization of protein therapeutics and biomarkers is paramount for ensuring product safety, efficacy, and consistency. Protein heterogeneity, arising from post-translational modifications (PTMs), proteolysis, and genetic variants, presents a significant analytical challenge [82]. Similarly, purity analysis is critical for detecting product-related impurities and ensuring the correct structure of biopharmaceuticals, such as monoclonal antibodies (mAbs) and viral vectors for gene therapy [83] [84]. This application note details integrated workflows utilizing preparative SDS-PAGE for protein fractionation coupled with GeLC-MS/MS for comprehensive protein characterization. We provide validated protocols and data analysis strategies to address protein heterogeneity and purity within the framework of preparative SDS-PAGE and GeLC-MS/MS research, supporting robust biomarker discovery and biopharmaceutical quality control.
Experimental Protocols
Protein Sample Preparation and Pre-Fractionation
Protein Extraction and Stabilization
- Cell Lysis: Use mammalian cell lines (e.g., HCT-116, MCF-7, A549) relevant to the disease model or production system. Employ mechanical lysis methods (e.g., sonication, Dounce homogenization) or detergent-based buffers (e.g., RIPA buffer) for efficient protein extraction [85] [60]. For difficult samples like membrane proteins, use optimized macroporous reversed-phase C18 columns for fractionation with >95% recovery [8].
- Inhibition of Proteolysis: Add protease and phosphatase inhibitor cocktails to lysis buffers immediately upon cell disruption to preserve the native protein state and prevent degradation of labile PTMs [60].
- Subcellular Fractionation: For targeted organelle or compartment analysis, use differential detergent fractionation to isolate nuclear, cytosolic, and membrane protein fractions prior to SDS-PAGE [60].
Protein Clean-up and Quantitation
- Sample Clean-up: Remove contaminants (salts, detergents) incompatible with downstream MS analysis using dialysis, desalting spin columns, or precipitation methods. Methanol-chloroform or trichloroacetic acid (TCA)-acetone precipitation are effective for protein extraction and clean-up from complex matrices [31].
- Protein Quantitation: Determine protein concentration using colorimetric assays (e.g., BCA, Bradford) or more sensitive fluorescent assays. Ensure compatibility between the lysis buffer and the quantitation method chosen [60].
Table 1: Key Reagents for Protein Sample Preparation
| Research Reagent Solution | Function | Example Specifications |
|---|---|---|
| Protease Inhibitor Cocktail | Inhibits serine, cysteine, aspartic proteases, aminopeptidases, and metalloproteases to prevent protein degradation | Ready-to-use mixtures in liquid or tablet form |
| Phosphatase Inhibitor Cocktail | Preserves phosphorylation status by inhibiting serine, threonine, tyrosine, acidic, and alkaline phosphatases | Mixtures compatible with various lysis buffers |
| RIPA Lysis Buffer | Efficient total protein extraction from mammalian cells, often denaturing due to ionic detergents | Contains ionic detergents (e.g., SDS), compatible with SDS-PAGE |
| Non-Ionic Lysis Buffer | Preserves protein function and interactions; used for native-PAGE or activity assays | Contains non-ionic detergents (e.g., NP-40, Triton X-100) |
| Macroporous RPC18 Columns | High-recovery fractionation and desalting of complex protein mixtures, including membrane proteins | 50 mm or 100 mm length; 4.6 mm or 10 mm ID; >95% protein recovery |
Pre-Electrophoresis Protein Denaturation, Reduction, and Alkylation
Perform this step prior to SDS-PAGE to enhance protein digestion and sequence coverage, particularly for cysteine-rich proteins [31].
- Reduction: Add 5 mM Tris(2-carboxyethyl)phosphine (TCEP) or Dithiothreitol (DTT) to the protein sample. Incubate at room temperature for 20 minutes to reduce disulfide bonds [31].
- Alkylation: Add 10 mM Iodoacetamide (IAM) to alkylate free cysteine residues. Incubate in the dark at room temperature for 20 minutes to prevent re-formation of disulfides [31].
- Quenching: Add 10 mM DTT to quench any excess IAM. Incubate in the dark for 20 minutes [31].
Preparative SDS-PAGE and Whole-Gel Processing
Gel Electrophoresis
- Load 1-50 µg of protein for western blotting or up to 1 mg for preparative fractionation onto a 4-12% Bis-Tris gradient gel for optimal resolution across a wide molecular weight range [31] [2].
- Include a pre-stained protein molecular weight marker lane to guide subsequent gel slicing.
Whole-Gel Processing for High-Throughput GeLC-MS/MS The Whole-Gel (WG) procedure significantly reduces manual processing time for large-scale experiments without compromising data quality [2].
- Fixing and Destaining: After electrophoresis, fix and destain the entire gel using a solution of 50% acetonitrile in 50 mM EPPS pH 8.5 [31].
- In-Gel Reduction and Alkylation: Perform reduction and alkylation on the entire gel. Immerse the gel in a reducing agent, followed by an alkylating agent, with thorough washing in between. This replaces performing these steps on individual slices [2].
- Gel Slicing: Following the final wash, slice the entire gel lane into 5-20 uniform fractions based on the pre-stained molecular weight markers [2].
In-Gel Digestion and Peptide Extraction
This protocol can be applied to individual gel bands or slices from the whole-gel procedure.
- Destaining: For Coomassie-stained bands, incubate gel pieces with Destaining Buffer (50% acetonitrile, 50% 100 mM EPPS pH 8.5) until clear [31].
- Dehydration: Shrink gel pieces with 100% acetonitrile and then re-swell with Digestion Buffer (100 mM EPPS pH 8.5) [31].
- Trypsin Digestion: Add trypsin working solution (e.g., 5 µL of 1 µg/µL stock) to cover the gel pieces. Incubate overnight at 37°C [31] [2].
- Peptide Extraction: Extract peptides from the gel pieces by sequential incubation with Peptide Extraction Solution (1% formic acid, 75% acetonitrile). Pool the supernatants and concentrate via vacuum centrifugation [31].
LC-MS/MS Analysis and Data Processing
Liquid Chromatography and Mass Spectrometry
- Desalt concentrated peptides using C18 StageTips or commercial columns prior to LC-MS/MS [31].
- Analyze peptides by nanoflow LC-MS/MS using reversed-phase C18 columns coupled to a high-resolution mass spectrometer (e.g., Orbitrap) [85] [2].
- Use data-dependent acquisition (DDA) or data-independent acquisition (DIA) modes for protein identification and quantification [85].
Data Analysis and Bioinformatics
- Process raw LC-MS/MS data using proteomics software (e.g., Skyline, Proteome Discoverer, ProteomeXchange) to identify and quantify proteins and peptides [85].
- Search data against appropriate protein sequence databases. Use a 1% false discovery rate (FDR) threshold for high-confidence identifications [86].
- For quantitative studies, employ label-free methods based on spectral counting or peptide peak intensities, or labeled strategies like stable isotope dimethyl labeling to improve accuracy [85] [6].
- Perform data normalization (e.g., total ion current or median normalization) to correct for experimental variations [85].
Applications and Data Analysis
Case Study: Validation of GeLC-MS/MS Workflow for Quantitative Proteomics
A comparative study evaluated the performance of the Whole-Gel (WG) procedure against conventional In-Gel Digestion (IGD) using HCT116 cell lysate and mouse tumor tissue [2]. The results demonstrate the robustness and reproducibility of the WG workflow.
Table 2: Performance Comparison of IGD vs. Whole-Gel GeLC-MS/MS
| Performance Metric | In-Gel Digestion (IGD) | Whole-Gel (WG) Procedure | Result |
|---|---|---|---|
| Protein Identification Overlap | Reference Method | Comparative Method | 83% - 95% overlap across gel slices [2] |
| Quantitative Correlation (Spectral Counts) | Reference Method | Comparative Method | R² = 0.94, slope = 0.97 [2] |
| Workflow Reproducibility | Not assessed in study | Triplicate analysis of HCT116 lysate | >88% protein ID overlap, CV <20% on quantitation [2] |
| Hands-on Time for 90 Slices | ~270 minutes | ~105 minutes | ~60% reduction in processing time [2] |
Assessing Protein Heterogeneity: Purity and PTM Analysis
Purity Analysis of Monoclonal Antibodies
- Capillary SDS-PAGE (cSDS): An optimized cSDS method for mAb1 analysis under reduced and non-reduced conditions demonstrated improved robustness over traditional slab gel SDS-PAGE. Key optimizations included using a slightly acidic sample buffer (pH 6.5) to minimize thermally induced fragmentation, and defined incubation conditions (65°C for 5 min) [84].
- Method Qualification: The qualified cSDS method showed a limit of quantitation (LOQ) of 0.02 mg/mL and was linear, accurate, and precise across 0.25–3.0 mg/mL protein concentration [84].
Stoichiometry and PTM Analysis of AAV Capsid Proteins
- An LC-MS method was developed for precise quantification of VP1, VP2, and VP3 proteins in recombinant AAV9 capsids, determining the mean capsid stoichiometry [83].
- Intact mass analysis and peptide mapping confirmed protein sequences and detected critical quality attributes such as deamidation (e.g., at N254, N303/N304 in rAAV9) and oxidation, which can impact viral vector stability and potency [83].
Addressing Variability in Proteomic Analysis
A key study investigating the variability of LC-MS/MS workflows across 17 core facilities for analyzing identical protein corona samples revealed significant heterogeneity in results [86]. Out of 4022 uniquely identified proteins, only 73 (1.8%) were common across all facilities providing semiquantitative analysis [86]. This highlights that sample preparation protocols, instrumentation, and data processing workflows are major sources of variability. Adherence to standardized, detailed protocols like those outlined in this document is therefore critical for generating comparable and reliable data, especially in clinical and regulatory contexts.
Workflow Visualization
The following diagram illustrates the integrated GeLC-MS/MS workflow for protein heterogeneity and purity analysis, incorporating the efficient Whole-Gel processing steps.
Diagram 1: Integrated GeLC-MS/MS workflow for protein analysis. The streamlined Whole-Gel processing step reduces hands-on time and improves reproducibility for large-scale studies [2].
The integrated use of preparative SDS-PAGE and GeLC-MS/MS provides a powerful and versatile platform for the rigorous analysis of protein heterogeneity and purity. The protocols and data presented herein validate this workflow as being capable of supporting critical activities in biopharmaceutical development, including the assessment of critical quality attributes like stoichiometry and PTMs [83], and the reproducible quantification of proteins in complex biological samples for biomarker discovery [2]. Standardization of sample preparation and analytical protocols is essential to minimize inter-laboratory variability and ensure the generation of reliable, high-quality data for regulatory submission and clinical decision-making [86].
Within the context of preparative SDS-PAGE for protein fractionation and GeLC-MS/MS research, evaluating data quality is paramount for generating reliable, publication-ready results. This Application Note details the core data quality metrics—protein identification rates and sequence coverage—used to validate proteomic analyses. We provide a standardized framework for evaluating these metrics, supported by experimental data and detailed protocols, to equip researchers and drug development professionals with the tools for rigorous self-assessment of their GeLC-MS/MS workflows. The guidelines herein ensure that results are both analytically robust and biologically meaningful, a critical consideration in fields like biomarker discovery and therapeutic protein characterization.
Core Data Quality Metrics and Performance Standards
The success of a GeLC-MS/MS experiment is quantitatively measured through specific, reproducible metrics. The table below summarizes the key performance indicators and their typical values from a robust experimental setup.
Table 1: Key Data Quality Metrics for GeLC-MS/MS Analysis
| Metric | Definition | Typical Benchmark Value | Interpretation and Impact |
|---|---|---|---|
| Protein Identification Reproducibility | The overlap in protein identities detected across technical or biological replicates. | >88% overlap [2] | Indicates technical robustness; high values are crucial for differential expression studies. |
| Protein Quantitation Reproducibility | The coefficient of variation (CV) in protein abundance measurements across replicates. | CV <20% [2] | Measures quantitative precision; essential for detecting statistically significant changes. |
| Quantitative Correlation (R²) | The squared correlation coefficient of spectral counts for proteins identified between two methodologies. | R² = 0.94 [2] | Validates the quantitative accuracy of a new protocol against an established one. |
| Protein Identification Overlap | The percentage of commonly identified proteins when comparing two related sample processing methods. | 80-95% [2] | Demonstrates comparable performance between different sample preparation workflows. |
These metrics establish that a well-executed GeLC-MS/MS workflow is highly reproducible, both in identifying proteins and in quantifying their abundance [2]. For instance, the high quantitative correlation (R²=0.94) between the conventional In-Gel Digestion (IGD) and the streamlined Whole-Gel (WG) procedure confirms that the WG method is a viable, high-throughput alternative without sacrificing data quality [2]. Furthermore, protein identifications are consistent with the expected molecular weight ranges based on SDS-PAGE migration, underscoring the integrity of the separation and analysis [2].
Detailed GeLC-MS/MS Protocol for Optimal Data Quality
This protocol is adapted from established methods [1] [2] and focuses on steps critical for achieving high protein identification rates and sequence coverage.
Materials: The Scientist's Toolkit
Table 2: Essential Research Reagents and Equipment for GeLC-MS/MS
| Item Name | Function/Application | Critical Notes for Data Quality |
|---|---|---|
| Pre-cast Bis-Tris Gradient Gels (e.g., 4-12%) | Size-based separation of complex protein mixtures. | High resolving power improves separation of protein isoforms [1]. |
| Mass Spectrometer with MS/MS capability (e.g., LTQ Orbitrap) | Peptide ionization, separation by mass-to-charge ratio, and fragmentation for sequencing. | Instrument sensitivity directly impacts identification of low-abundance proteins [1]. |
| Sequencing-Grade Trypsin | Proteolytic enzyme that cleaves proteins at lysine and arginine residues. | High purity ensures complete, specific digestion, maximizing peptide yield [1]. |
| Tris(2-carboxyethyl)phosphine (TCEP) | Reduces disulfide bonds to denature proteins. | More stable and odorless alternative to dithiothreitol (DTT) [1]. |
| Iodoacetamide (IAM) | Alkylates cysteine residues to prevent reformation of disulfide bonds. | Must be prepared fresh and protected from light to maintain efficacy [1]. |
| Nano-flow LC System | Chromatographically separates peptides prior to MS injection. | Reduces ion suppression, increasing the number of peptides detected [1]. |
| C18 Reverse-Phase Analytical Column | The stationary phase for peptide separation in nanoLC. | Self-packing with high-quality resin (e.g., Synergi C18) improves resolution and peak capacity [1]. |
Step-by-Step Workflow
The following diagram illustrates the core GeLC-MS/MS workflow, highlighting the key decision point between two established processing methods.
Critical Protocol Steps for High-Quality Metrics
Protein Preparation and SDS-PAGE:
- Solubilize protein samples directly in LDS sample buffer, heating at 70 °C for 10 minutes [1]. For samples in incompatible buffers (e.g., containing guanidine hydrochloride), precipitate the protein first (using acetone or TCA) before solubilization in sample buffer to prevent streaking and ensure sharp bands [1].
- Load a pre-stained protein ladder alongside samples. This is critical for correlating the gel region with the molecular weight of identified proteins post-analysis [2].
- Run the gel using MES SDS running buffer until adequate separation is achieved.
Gel Processing: Whole-Gel vs. In-Gel Digestion:
- In-Gel Digestion (IGD): Ideal for analyzing a small number of specific gel bands. The entire lane is excised and sliced into 5-20 fractions. All subsequent steps are performed on individual slices [1] [2].
- Whole-Gel (WG) Processing: Recommended for large-scale experiments where processing many slices becomes a bottleneck. This is the key streamlining step. After destaining, the entire intact gel lane is subjected to washing, reduction, and alkylation steps in a single container. The gel is sliced only immediately prior to the addition of trypsin [2]. This drastically reduces hands-on time and improves reproducibility for multi-sample experiments, with performance equivalent to IGD [2].
Reduction and Alkylation:
- Reduction: Add 5 mM TCEP in 25 mM ammonium bicarbonate and incubate at 60 °C for 30 minutes to break disulfide bonds [1].
- Alkylation: Replace the solution with 20 mM iodoacetamide in 25 mM ammonium bicarbonate (made fresh). Incubate for 20 minutes at room temperature in the dark to alkylate cysteine residues and prevent reformation of disulfide bonds [1].
In-Gel Trypsin Digestion:
- Dilute sequencing-grade trypsin to 10 ng/µL in ice-cold 25 mM ammonium bicarbonate. Add a minimal volume to cover the gel pieces and allow them to rehydrate on ice for 30-45 minutes.
- Remove excess trypsin solution, add a fresh aliquot of ammonium bicarbonate to keep the gel pieces submerged, and incubate overnight at 37 °C [1] [2].
Peptide Extraction and LC-MS/MS Analysis:
- Extract peptides from the gel matrix by adding an extraction solution (e.g., 1% formic acid, 50% acetonitrile) and sonicating for 15-30 minutes. Transfer the supernatant to a new low-protein-binding tube. Concentrate the extracted peptides using a SpeedVac concentrator [1].
- Reconstitute peptides in 0.1% formic acid and analyze by nanoLC-MS/MS. A typical setup uses a trap column for desalting and a self-packed C18 analytical column (e.g., 100 µm i.d. x 150 mm) for separation, with a linear gradient of increasing acetonitrile [1].
- Operate the mass spectrometer in data-dependent acquisition (DDA) mode, where a full MS scan is followed by MS/MS scans on the most intense ions.
Advanced Quantification Strategies and Fragmentation Analysis
To address challenges in accurate quantification, advanced labeling strategies can be integrated into the GeLC-MS/MS workflow. The following diagram outlines a method that provides high quantitative accuracy.
Stable Isotope Dimethyl Labeling: This strategy involves derivatizing peptides from two different samples with "light" or "heavy" dimethyl labels. The key is to mix the two samples immediately after labeling and before SDS-PAGE separation [6]. This creates an internal control, as each peptide appears in the mass spectrometer as a light/heavy pair with a fixed mass difference. The abundance ratio of this pair directly gives the relative quantity of the peptide between the two samples, and this measurement is immune to variations in gel extraction efficiency or LC-MS/MS injection volume [6]. This method is particularly useful for detecting subtle changes in protein abundance and for identifying specific proteolysis events.
Complementary Top-Down Analysis: For characterizing recombinant therapeutic proteins or specific protein isoforms, Top-Down MS provides complementary information to the bottom-up GeLC-MS/MS approach. In Top-Down MS, intact proteins are analyzed and fragmented within the mass spectrometer, without a proteolytic digestion step [87]. This method is powerful for identifying protein fragmentation, post-translational modifications (PTMs), and for sequencing proteins with highly repetitive sequences that are challenging for bottom-up methods [87]. It is best suited for proteins below 50 kDa and can be optimized using various fragmentation techniques (HCD, UVPD, EThcD) to maximize sequence coverage [87].
Conclusion
Preparative SDS-PAGE integrated with GeLC-MS/MS remains an indispensable and robust strategy for in-depth proteomic analysis, effectively balancing practical accessibility with powerful performance. Its unique strength lies in providing visual quality control, effective complexity reduction, and compatibility with a vast range of sample types—from clinical fluids to bacterial lysates. The development of streamlined protocols, such as the whole-gel processing and PEPPI-MS methods, ensures its continued relevance for large-scale clinical and biomarker discovery studies. Future directions will focus on further miniaturization and automation, enhanced coupling with ion mobility and top-down MS platforms for comprehensive proteoform analysis, and the establishment of standardized guidelines to solidify its role in precision medicine and biopharmaceutical quality control.
References
- 1. GeLC-MS/MS Analysis of Complex Protein Mixtures - PMC [https://pmc.ncbi.nlm.nih.gov/articles/PMC4416643/]
- 2. Whole gel processing procedure for GeLC-MS/MS based ... [https://proteomesci.biomedcentral.com/articles/10.1186/1477-5956-11-17]
- 3. SDS-PAGE Protocol [https://www.rockland.com/resources/sds-page-protocol/?srsltid=AfmBOoojHuBvJQwb8h7qAmIfFqRigQdhbZgyTwbtGgpkzILi84R04rEs]
- 4. Preparative SDS PAGE as an Alternative to His-Tag ... [https://pmc.ncbi.nlm.nih.gov/articles/PMC5472695/]
- 5. SDS-PAGE Gel Electrophoresis [https://www.protocols.io/view/sds-page-gel-electrophoresis-7hnhj5e.html]
- 6. Highly accurate and precise quantification strategy using ... [https://www.sciencedirect.com/science/article/pii/S0006291X21003296]
- 7. 1DE-MS Profiling for Proteoform-Correlated Proteomic ... [https://pubmed.ncbi.nlm.nih.gov/36018058/]
- 8. New Sample Fractionation Strategies for Proteomic ... [https://www.chromatographyonline.com/view/new-sample-fractionation-strategies-proteomic-analyses-lc-ms]
- 9. In-depth structural proteomics integrating mass ... [https://www.frontiersin.org/journals/analytical-science/articles/10.3389/frans.2022.1107183/full]
- 10. Western Blot SDS-PAGE [https://www.novusbio.com/support/support-by-application/western-blot-sds-page?srsltid=AfmBOoryVpHjxZ21SiMX5MtgCsVJWNjrcEwsnW_xBv0L460wr2g7QUZ8]
- 11. PEPPI-MS: gel-based sample pre-fractionation for deep top ... [https://pubmed.ncbi.nlm.nih.gov/39820051/]
- 12. Increased proteome coverage by combining PAGE and ... [https://pmc.ncbi.nlm.nih.gov/articles/PMC4285200/]
- 13. SCASP: A Simple and Robust SDS-Aided Sample ... [https://www.sciencedirect.com/science/article/pii/S1535947621000244]
- 14. SDS-PAGE guide: Sample preparation to analysis [https://www.abcam.com/en-us/knowledge-center/western-blot/sds-page-guide]
- 15. Separation methods for food protein purification and analysis [https://www.explorationpub.com/Journals/eff/Article/101043]
- 16. Protein Sample Preparation for Mass Spectrometry [https://www.thermofisher.com/us/en/home/life-science/protein-biology/protein-biology-learning-center/protein-biology-resource-library/pierce-protein-methods/sample-preparation-mass-spectrometry.html]
- 17. Cysteine-Directed Isobaric Labeling Combined with GeLC ... [https://pmc.ncbi.nlm.nih.gov/articles/PMC11894657/]
- 18. Improved Separation in Horizontal Protein SDS-PAGE with ... [https://www.mdpi.com/2409-9279/6/6/106]
- 19. - GeLC / MS Analysis of Complex MS Mixtures | SpringerLink Protein [https://link.springer.com/protocol/10.1007/978-1-4939-0685-7_4]
- 20. Targeted LC- MS / MS Proteomics-Based Strategy To Characterize in... [https://pubmed.ncbi.nlm.nih.gov/30204418/]
- 21. The principle and method of polyacrylamide gel ... [https://www.mblbio.com/bio/g/support/method/sds-page.html]
- 22. Native SDS-PAGE: High Resolution Electrophoretic ... [https://pmc.ncbi.nlm.nih.gov/articles/PMC4517606/]
- 23. The Practical Guide to Running a Perfect Homemade SDS ... [https://bitesizebio.com/25239/making-sds-page-gel-practical-guide/]
- 24. A simple and highly sensitive LC–MS workflow for ... [https://www.nature.com/articles/s41598-024-61522-4]
- 25. A single step and rapid protein extraction protocol ... [https://www.sciencedirect.com/science/article/abs/pii/S1046202323001810]
- 26. Deep Dive on the Proteome of Human Body Fluids [https://cgp.iiarjournals.org/content/18/4/549]
- 27. Systematic Evaluation of Protein Reduction and Alkylation ... [https://pmc.ncbi.nlm.nih.gov/articles/PMC5500753/]
- 28. Evaluation and optimization of reduction and alkylation ... [https://pmc.ncbi.nlm.nih.gov/articles/PMC5698164/]
- 29. Cysteine alkylation methods in shotgun proteomics and ... [https://www.sciencedirect.com/science/article/abs/pii/S1874391920303900]
- 30. Protein Alkylation: Exploring Techniques and Applications [https://www.creative-proteomics.com/resource/protein-alkylation-biochemistry-proteomics.htm]
- 31. Sample preparation for proteomic analysis using a GeLC ... [https://pmc.ncbi.nlm.nih.gov/articles/PMC4959781/]
- 32. In-gel digestion [https://en.wikipedia.org/wiki/In-gel_digestion]
- 33. Updates of the In‐Gel Digestion Method for Protein ... [https://pmc.ncbi.nlm.nih.gov/articles/PMC6492177/]
- 34. In-Gel digestion protocols [https://proteomicsresource.washington.edu/protocols03/ingeldigestion.php]
- 35. In-gel digestion and extraction [https://www.biotech.cornell.edu/core-facilities-brc/facilities/proteomics-metabolomics-facility/protocols/gel-digestion-extraction]
- 36. In-Gel Trypsin Enzymatic Digestion [https://massspec.chem.ox.ac.uk/in-gel-trypsin-enzymatic-digestion]
- 37. In-Gel Digestion – SPARC BioCentre Molecular Analysis [https://lab.research.sickkids.ca/sparc-molecular-analysis/in-gel-digestion/]
- 38. Nature Reviews Methods Primers|Top-Down 蛋白质组学 [https://www.instrument.com.cn/news/20240621/725470.shtml]
- 39. 细菌的蛋白质组成分析 - 高等学校化学学报 [http://www.cjcu.jlu.edu.cn/CN/10.7503/cjcu20240345]
- 40. 细菌的蛋白质组成分析——深入比较三种质谱方法(英文) [https://cjournal.hep.com.cn/0251-0790/CN/1159964044124939116]
- 41. PAGE简介— 基于分子大小的蛋白质分离 [https://www.sigmaaldrich.com/HK/zh/technical-documents/protocol/protein-biology/gel-electrophoresis/sds-page?srsltid=AfmBOoq7jo2V1cyQeBndoK4tBIGTPMEdjMLf0uUp9vQIjnQgK0iiG-rJ]
- 42. SDS-PAGE - 蛋白质电泳 - 欣伯玉生物 [https://www.x-biotech.com/SDS-PAGE?article_id=34]
- 43. Top-Down LC-MS/MS全流程解析:如何实现高效蛋白质鉴定? [https://www.biotech-pack.com/top-down-proteomics-zh16.html]
- 44. 自上而下蛋白质组学 [https://www.thermofisher.cn/cn/zh/home/industrial/mass-spectrometry/proteomics-mass-spectrometry/protein-structure-analysis-mass-spectrometry/top-down-proteomics.html]
- 45. Evaluation of protein extraction methodologies on bacterial ... [https://pmc.ncbi.nlm.nih.gov/articles/PMC12312612/]
- 46. Evaluation of protein extraction methodologies on bacterial ... [https://www.frontiersin.org/journals/microbiology/articles/10.3389/fmicb.2025.1586662/full]
- 47. Best practices and benchmarks for intact protein analysis ... [https://www.nature.com/articles/s41592-019-0457-0]
- 48. Working with Detergents [https://www.rockefeller.edu/proteomics/working-with-detergents/]
- 49. SDS Depletion from Intact Membrane Proteins by KCl ... [https://www.mdpi.com/2227-7382/13/3/30]
- 50. Detergent Screening With Hybrid Detergents Increases ... [https://pmc.ncbi.nlm.nih.gov/articles/PMC12329390/]
- 51. Protein Electrophoresis Buffers and Reagents [https://www.thermofisher.com/us/en/home/life-science/protein-biology/protein-gel-electrophoresis/protein-electrophoresis-buffers-reagents.html]
- 52. Sample preparation and cleanup methods for clinical top- ... [https://pmc.ncbi.nlm.nih.gov/articles/PMC12433189/]
- 53. Analytical artifacts in characterization of recombinant ... [https://www.sciencedirect.com/science/article/abs/pii/S0731708519325713]
- 54. Troubleshooting SDS-PAGE Sample Preparation Issues [https://www.goldbio.com/blogs/articles/troubleshooting-sds-page-sample-preparation-issues?srsltid=AfmBOopIlv5BVEowy2Vx6T7uK6w4XR7iE68msUcPOwv3WepbOhFgUKOk]
- 55. High-Throughput Proteomics Sample Preparation [https://www.metwarebio.com/proteomics-sample-prep-high-throughput-lc-msms/]
- 56. Overview of SDS-PAGE [https://www.creative-proteomics.com/resource/overview-of-sds-page.htm]
- 57. In-gel sample preparation prior to proteomic analysis ... [https://www.sciencedirect.com/science/article/pii/S1874391922000963]
- 58. SDS Depletion from Intact Membrane Proteins by KCl ... [https://pmc.ncbi.nlm.nih.gov/articles/PMC12286100/]
- 59. Bottom-Up Proteomics: Advancements in Sample ... [https://www.mdpi.com/1422-0067/24/6/5350]
- 60. 5 Steps to Fundamental Protein Preparation [https://www.thermofisher.com/us/en/home/life-science/protein-biology/protein-purification-isolation/5-steps-fundamental-protein-preparation.html]
- 61. New Sample Preparation Products and Accessories for ... [https://www.chromatographyonline.com/view/new-sample-preparation-products-and-accessories-for-2024-2025]
- 62. Deciphering food proteins: The applications of SDS-PAGE ... [https://www.sciencedirect.com/science/article/abs/pii/S2212429225003025]
- 63. gel band contrast - proteins [https://biology.stackexchange.com/questions/72786/gel-band-contrast]
- 64. How does Protein Concentration affect SDS PAGE results in ... [https://kendricklabsinc.wordpress.com/2025/09/15/how-does-protein-concentration-affect-sds-page-results-in-research/]
- 65. What Are Pre-Stained Protein Ladders and Why Are They ... [https://nusep.us/blogs/protein-ladder-knowledge-hub/what-are-pre-stained-protein-ladders-and-why-are-they-essential-for-western-blotting-1?srsltid=AfmBOop8dBYgoomrVbDSKJYjU6zeZbNYN1jNEmQ9nN1gNXPwqgFvJGFr]
- 66. Proteome Analysis Using Gel-LC-MS/MS - PMC [https://pmc.ncbi.nlm.nih.gov/articles/PMC6653605/]
- 67. Data Generated by Quantitative Liquid Chromatography ... [https://www.sciencedirect.com/science/article/abs/pii/S009095562405517X]
- 68. Evaluation of Normalization Methods on GeLC-MS ... [https://link.springer.com/article/10.1007/s13361-011-0237-2]
- 69. Preparing protein samples for sds-page [https://www.ruf.rice.edu/~bioslabs/studies/sds-page/denature.html]
- 70. Comparison of in-gel and in-solution proteolysis in the ... [https://clinicalproteomicsjournal.biomedcentral.com/articles/10.1186/s12014-023-09440-x]
- 71. Protein digestion by in-solution tryptic digestion [https://bio-protocol.org/exchange/minidetail?id=5865788&type=30]
- 72. Comparison of protein characterization using In solution ... [https://www.sciencedirect.com/science/article/pii/S0006291X21016612]
- 73. Protein Identification Improvement in Complex Samples ... [https://www.mdpi.com/2076-3417/15/2/666]
- 74. Advanced Proteomics Techniques [https://www.technologynetworks.com/proteomics/articles/exploring-proteomics-techniques-from-mass-spectrometry-to-shotgun-405802]
- 75. Protein Digestion Unveiled: In-Gel vs. In-Solution Techniques [https://www.metwarebio.com/protein-digestion-in-gel-vs-in-solution/]
- 76. SDS-PAGE Protocol [https://www.rockland.com/resources/sds-page-protocol/?srsltid=AfmBOorroCV9FBxZWJeoxlzRd7w4IqVST8wYIQ5iQ1TEQJEa3uUqYmD9]
- 77. Comparing SDS-PAGE and CE-SDS for Antibody Purity ... [https://www.bioprocessintl.com/qa-qc/comparing-sds-page-and-ce-sds-for-antibody-purity-analysis]
- 78. Comparison of the capabilities of liquid isoelectric focusing ... [https://www.sciencedirect.com/science/article/abs/pii/S0378434701003826]
- 79. Comparing Isoelectric Focusing with Gradient SDS-PAGE ... [https://eureka.patsnap.com/report-comparing-isoelectric-focusing-with-gradient-sds-page-efficiency]
- 80. A comparative study of CE-SDS, SDS-PAGE, and Simple ... [https://pubmed.ncbi.nlm.nih.gov/33185281/]
- 81. Comparison of in-gel protein separation techniques ... [https://pmc.ncbi.nlm.nih.gov/articles/PMC4234072/]
- 82. Quantifying Proteins by Mass Spectrometry [https://www.chromatographyonline.com/view/quantifying-proteins-mass-spectrometry]
- 83. Development of LC-MS methods for AAV capsid protein ... [https://pmc.ncbi.nlm.nih.gov/articles/PMC12410343/]
- 84. Method development and validation of capillary sodium ... [https://www.sciencedirect.com/science/article/abs/pii/S073170851000419X]
- 85. LC-MS-based proteomics: insights into natural product- ... [https://www.sciencedirect.com/science/article/pii/S1359644625002478]
- 86. Measurements of heterogeneity in proteomics analysis of the ... [https://pmc.ncbi.nlm.nih.gov/articles/PMC9633814/]
- 87. Characterizing recombinant protein and its fragmentation ... [https://www.sciencedirect.com/science/article/abs/pii/S0731708525004984]