Polyacrylamide vs. Agarose Gel: Choosing the Right Tool for Protein Separation
This article provides a comprehensive guide for researchers and drug development professionals on selecting the appropriate gel electrophoresis matrix for protein analysis.
Polyacrylamide vs. Agarose Gel: Choosing the Right Tool for Protein Separation
Abstract
This article provides a comprehensive guide for researchers and drug development professionals on selecting the appropriate gel electrophoresis matrix for protein analysis. It covers the fundamental principles of agarose and polyacrylamide gels, detailing their specific applications in protein separation methodologies such as SDS-PAGE, Native-PAGE, and 2D-PAGE. The content includes practical protocols, troubleshooting advice for common issues like smeared bands, and a direct comparison of resolution, safety, and suitability for downstream analysis. By synthesizing methodological and validation perspectives, this guide empowers scientists to optimize their protein electrophoresis workflows for more reliable and reproducible results in biomedical research.
Understanding the Core Principles: Why Gel Matrix Matters for Protein Separation
In the realm of molecular biology and biochemistry, gel electrophoresis stands as a cornerstone technique for the separation, analysis, and purification of macromolecules such as proteins and nucleic acids. Central to this method are the matrices used to form the gels, with natural agarose and synthetic polyacrylamide representing the two primary support media. Their unique physical and chemical properties make them indispensable yet distinct tools for researchers. This guide provides a comprehensive, objective comparison between agarose and polyacrylamide gels, with a specific focus on their application in protein separation research. The choice between these matrices is not merely a procedural detail but a critical decision that directly impacts the resolution, accuracy, and reproducibility of experimental results in drug development and basic research. Understanding their fundamental differences enables scientists to select the optimal matrix for their specific experimental needs, whether they are separating large protein complexes or resolving single polypeptides with minute mass differences.
Composition and Structural Properties
The fundamental differences between agarose and polyacrylamide gels begin with their origin and chemical structure, which directly dictate their physical properties and subsequent applications.
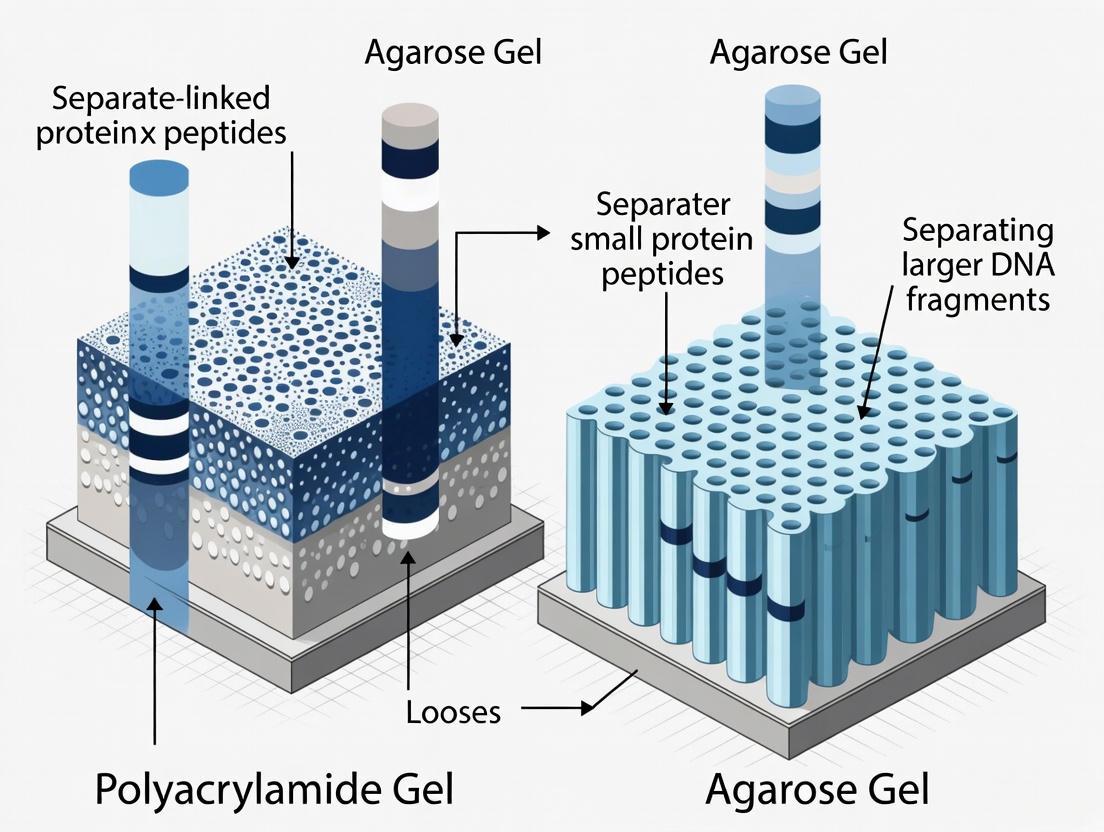
Agarose is a natural linear polysaccharide polymer extracted from seaweed genera such as Gelidium and Gracilaria [1] [2]. It consists of repeated agarobiose (L- and D-galactose) subunits. When dissolved in boiling buffer and allowed to cool, agarose polymers associate non-covalently through hydrogen bonding to form a three-dimensional matrix with relatively large, non-uniform pores [3] [2]. The pore size of this matrix can be coarsely adjusted by altering the agarose concentration, typically between 0.5% to 2% for most applications, with lower percentages creating larger pores and higher percentages creating smaller pores [3] [1]. The gel matrix is characterized by its high gel strength, thermo-reversibility (melts when heated, sets when cooled), and relatively low charge content, though the presence of negatively charged groups like pyruvate and sulfate can lead to electroendosmosis (EEO) during electrophoresis [4] [2].
Polyacrylamide, in contrast, is a synthetic polymer formed through a vinyl addition polymerization reaction between acrylamide monomers and a cross-linking agent, typically N,N'-methylenebisacrylamide (bis-acrylamide) [5] [6] [7]. This polymerization is catalyzed by ammonium persulfate (APS) and stabilized by tetramethylethylenediamine (TEMED). The resulting gel consists of a covalently linked, highly uniform mesh with precisely tunable pore sizes [5]. The pore size is determined by two key parameters: the total concentration of acrylamide and bis-acrylamide (%T), and the percentage of cross-linker (%C) [4] [7]. Higher %T and %C values result in smaller pore sizes. This capacity for fine control over the matrix structure gives polyacrylamide gels their superior resolving power for separating smaller molecules. A critical safety consideration is that the unpolymerized acrylamide monomer is a potent neurotoxin, requiring appropriate personal protective equipment and careful handling during gel preparation [5] [6].
Table 1: Fundamental Properties and Composition
| Property | Agarose Gel | Polyacrylamide Gel |
|---|---|---|
| Chemical Nature | Natural polysaccharide | Synthetic polymer |
| Origin | Seaweed (Gelidium, Gracilaria) | Acrylamide and bis-acrylamide monomers |
| Polymerization | Physical (hydrogen bonding) | Chemical (free-radical vinyl polymerization) |
| Pore Size | Large, non-uniform | Small, uniform, precisely tunable |
| Primary Control Mechanism | Agarose concentration | %T (total monomer) and %C (cross-linker) |
| Toxicity | Non-toxic | Neurotoxic monomer (requires careful handling) |
Separation Mechanisms and Performance
The separation mechanisms in both gel types operate on the principle of molecular sieving, where the gel matrix acts as a sieve that retards the movement of molecules based on their size and physical interaction with the pores. However, the specific dynamics and outcomes differ significantly between the two matrices.
In agarose gels, the large, non-uniform pores are ideal for the separation of large macromolecules. For nucleic acids, the distance traveled is inversely proportional to the logarithm of its molecular weight [1]. The leading model for DNA movement through an agarose gel is "biased reptation," whereby the leading edge moves forward and pulls the rest of the molecule along [1]. For proteins, agarose is generally unsuitable for standard separation due to their smaller size and the large pore size of the gel, which provides little sieving effect. However, agarose gels can be used for the separation of very large protein complexes or under specific conditions like native (non-denaturing) electrophoresis where the goal is to separate based on charge and native structure rather than size alone [7] [2].
Polyacrylamide gels excel in the high-resolution separation of proteins, primarily through the technique of SDS-PAGE (Sodium Dodecyl Sulfate Polyacrylamide Gel Electrophoresis) [6] [7]. In SDS-PAGE, the anionic detergent SDS denatures the proteins and confers a uniform negative charge density, meaning the charge-to-mass ratio is nearly identical for all proteins. This ensures that separation occurs primarily based on polypeptide chain length (molecular weight) rather than intrinsic charge or shape [6] [7]. The migration rate of proteins in SDS-PAGE is inversely proportional to the logarithm of their molecular mass, allowing for accurate size estimation when compared with standard protein markers [6]. For analysis of proteins in their native, folded state, Native-PAGE can be performed, which separates proteins based on a complex function of their intrinsic charge, size, and three-dimensional shape [7]. The tight, uniform mesh of polyacrylamide provides the necessary molecular sieving to resolve proteins that differ in molecular weight by as little as a few thousand Daltons [5].
Table 2: Separation Performance and Applications
| Parameter | Agarose Gel | Polyacrylamide Gel |
|---|---|---|
| Optimal Size Range | DNA: 100 bp to 25 kb (up to megabases with PFGE) [3] [1] [2] | Proteins: 1 to 500 kDa [7]; Small nucleic acids: < 1 kbp [5] |
| Resolution Capability | Low to moderate; separates fragments with >10-50 bp difference | Very high; can resolve proteins with ~2 kDa difference or single-base DNA differences [5] [8] |
| Key Protein Application | Separation of large protein complexes, immunoelectrophoresis [7] [2] | SDS-PAGE, Native-PAGE, 2D-PAGE, Western blotting [3] [7] |
| Key Nucleic Acid Application | DNA/RNA fragment analysis, PCR product verification, plasmid topology [3] [1] | DNA sequencing, SNP analysis, microRNA/oligonucleotide separation [3] [5] |
Experimental Protocols for Protein Separation
SDS-PAGE Using Polyacrylamide Gels
SDS-PAGE is the definitive method for separating proteins based on their molecular weight. The following protocol details a standard procedure for a discontinuous SDS-PAGE system using a mini-gel format.
Research Reagent Solutions:
- Resolving Gel Buffer: 1.5 M Tris-HCl, pH 8.8. Maintains the pH for the separation gel.
- Stacking Gel Buffer: 0.5 M Tris-HCl, pH 6.8. Creates a different pH for sample stacking.
- Acrylamide/Bis-acrylamide Solution: Typically 30-40% stock solution (29:1 or 37.5:1 ratio). Forms the gel matrix.
- Ammonium Persulfate (APS): 10% (w/v) solution in water. Free radical initiator for polymerization.
- TEMED (N,N,N',N'-Tetramethylethylenediamine): Catalyst that stabilizes free radicals to accelerate polymerization.
- Electrophoresis Buffer: Tris-Glycine buffer with 0.1% SDS, pH ~8.3.
- SDS Sample Buffer: Contains SDS (denaturant), glycerol (density agent), bromophenol blue (tracking dye), and often a reducing agent like β-mercaptoethanol or DTT.
- Protein Molecular Weight Marker: A mixture of proteins of known molecular weights for calibration.
Protocol:
- Gel Casting: Set up a gel cassette comprising two glass plates separated by spacers.
- Prepare Resolving Gel: Mix appropriate volumes of water, resolving gel buffer, acrylamide solution, 10% SDS, and APS. Add TEMED last to initiate polymerization and immediately pour the mixture into the cassette, leaving space for the stacking gel. Overlay with water-saturated butanol or isopropanol to create a flat surface.
- Prepare Stacking Gel: After the resolving gel has polymerized (~15-30 minutes), pour off the overlay. Mix stacking gel components (water, stacking gel buffer, acrylamide solution, SDS, APS) and add TEMED. Pour over the resolving gel and immediately insert a comb to create sample wells [7] [9].
Sample Preparation: Dilute protein samples in SDS sample buffer. Heat the samples at 70-100°C for 5-10 minutes to fully denature the proteins [6] [7].
Electrophoresis: Assemble the gel cassette in the electrophoresis tank and fill with electrophoresis buffer. Load equal amounts of protein (10-50 µg) or volume into the wells, including one well for the molecular weight marker. Connect the power supply and run at a constant voltage (e.g., 80-150 V for a mini-gel) until the tracking dye front reaches the bottom of the gel [7].
Post-Electrophoresis Analysis: Following separation, proteins can be visualized using stains like Coomassie Brilliant Blue or Silver Stain. For further analysis, proteins can be transferred to a membrane for Western blotting [6] [7].
Protein Electrophoresis Using Agarose Gels
While not common for standard protein work, agarose gels are used for specific protein applications, primarily when separating large native protein complexes or immunoglobulins.
Protocol:
- Gel Casting: Dissolve agarose powder (typically 1-2%) in an appropriate buffer (e.g., Tris-Acetate-EDTA or Tris-Borate-EDTA) by heating. Cool the solution to approximately 60°C and pour into a horizontal gel tray with a comb in place. Allow to solidify at room temperature [1] [2].
Sample Preparation: For native protein separation, mix the protein sample with a non-denaturing loading buffer containing glycerol and a tracking dye.
Electrophoresis: Place the solidified gel in a horizontal electrophoresis chamber and submerge it in the same running buffer used to cast the gel. Load the samples into the wells. Run the gel at a low constant voltage (e.g., 5-10 V/cm) to prevent heat-induced denaturation of the native proteins [2].
Visualization: After electrophoresis, proteins can be visualized using specific protein stains compatible with agarose, such as Coomassie Blue or Zinc-reverse staining.
Comparative Analysis and Research Considerations
For researchers in drug development and protein science, selecting the appropriate gel matrix is a strategic decision. The following comparative analysis and decision framework are designed to guide this selection process.
Table 3: Practical Considerations for Research Use
| Consideration | Agarose Gel | Polyacrylamide Gel |
|---|---|---|
| Ease of Preparation | Simple and rapid; involves melting and pouring [5] [8] | Complex; requires chemical polymerization with toxic monomers [5] [8] |
| Handling Safety | Non-toxic; minimal safety concerns [5] | Neurotoxic monomer (acrylamide); requires gloves, lab coat, and careful disposal [5] [6] |
| Cost | Low cost per gel | Moderately higher cost, though pre-cast gels are convenient |
| Downstream Processing | Bands can be easily excised for DNA extraction or enzymatic reactions (especially LMP agarose) [1] [2] | Proteins can be transferred to membranes (Western blotting) or excised for mass spectrometry [7] |
| Typical Gel Format | Horizontal slab gel submerged in buffer [1] [2] | Vertical slab gel between glass plates [6] [7] |
The selection criteria can be summarized as follows:
- Choose Agarose for: The separation of very large protein complexes or organelles that would be excluded from or poorly resolved in a polyacrylamide matrix. It is also the matrix of choice when the protein must be maintained in its native, functional state for subsequent activity assays or when the experimental setup requires a horizontal, submerged gel system [7] [2].
- Choose Polyacrylamide for: The vast majority of protein analysis work, especially when the goal is to determine polypeptide molecular weight, assess sample purity, resolve multiple proteins with similar sizes, or prepare samples for downstream applications like immunoblotting or mass spectrometry. Its superior resolving power is essential for detecting minor protein components, post-translational modifications, or protein fragments [5] [7].
Agarose and polyacrylamide gels serve as the foundational matrices for biomolecular separation, each with a distinct and non-overlapping profile of advantages for protein research. Agarose, derived from natural sources, provides a robust, non-toxic, and easily handled matrix ideal for analyzing large protein assemblies in their native conformation. In contrast, the synthetic polyacrylamide gel offers tunable, high-resolution separation essential for modern proteomics, enabling precise analysis of polypeptide mixtures based on molecular weight via SDS-PAGE. The choice is not a matter of superiority but of appropriate application. For researchers and drug development professionals, a clear understanding of the composition, separation mechanisms, and practical considerations of these two gel systems is fundamental to designing efficient experiments, obtaining reliable data, and advancing our understanding of protein structure and function.
In the realms of molecular biology, biochemistry, and pharmaceutical development, the separation of biomolecules is a foundational step in analysis and purification. The efficacy of these separations hinges fundamentally on the pore size and sieving properties of the gel matrix used. This guide provides a detailed comparison between two principal gel matrices—agarose and polyacrylamide—framed within the context of protein separation research. The distinct structural and physicochemical properties of these gels dictate their sieving mechanisms, resolution capabilities, and optimal application ranges. For researchers and scientists in drug development, selecting the appropriate matrix is not merely a technical choice but a critical determinant in the success of downstream analyses, from biomarker discovery to quality control of biotherapeutics. This article objectively compares their performance, drawing on experimental data to elucidate the structural basis for their separation characteristics, providing a definitive guide for informed experimental design.
Structural and Functional Comparison of Gel Matrices
The fundamental difference between agarose and polyacrylamide gels lies in their origin, structure, and the consequent control over their pore networks. Agarose is a natural linear polysaccharide derived from seaweed, which forms a hydrogel via hydrogen bonding, resulting in a matrix characterized by large, non-uniform pores [10] [5]. In contrast, polyacrylamide is a synthetic polymer formed through a co-polymerization reaction between acrylamide monomers and a cross-linker, most commonly N,N'-methylenebisacrylamide (Bis) [5] [11]. This synthetic process allows for precise control over the gel's architecture, creating a tight, highly ordered, and uniform mesh [5].
The formation of these gels also presents different practical considerations. Agarose gels are prepared by simply dissolving the powder in buffer by heating, followed by cooling to form a gel, a process that is straightforward and involves non-toxic materials [5]. Polyacrylamide gel preparation is a more involved chemical process, requiring a polymerization catalyst, such as ammonium persulfate (APS), and an accelerator, often TEMED (N,N,N',N'-Tetramethylethylenediamine) [11] [7]. A critical safety consideration is that the unpolymerized acrylamide monomer is a potent neurotoxin, necessitating careful handling and appropriate personal protective equipment (PPE) [5] [11].
The primary application dichotomy stems from these structural differences. Agarose gels, with their large pore sizes, are the matrix of choice for separating large nucleic acids, such as DNA fragments ranging from 100 base pairs (bp) to over 25 kilobase pairs (kbp) [5]. Polyacrylamide gels, with their finely tunable and small pore sizes, are indispensable for separating proteins and small nucleic acids (e.g., oligonucleotides and small RNAs), offering the high resolution needed to distinguish molecules with minimal size differences [5] [11].
Table 1: Fundamental Characteristics of Agarose and Polyacrylamide Gels
| Characteristic | Agarose Gel | Polyacrylamide Gel |
|---|---|---|
| Chemical Nature | Natural polysaccharide | Synthetic polymer |
| Polymerization | Physical (hydrogen bonding) | Chemical (free-radical) |
| Pore Structure | Large, random, non-uniform [5] | Small, uniform, tunable [5] |
| Pore Size Control | Limited, via concentration [5] | Precise, via %T and %C [11] [7] |
| Primary Applications | Large DNA/RNA separation [5] | Protein separation, small nucleic acids [5] |
| Toxicity | Non-toxic | Neurotoxic monomer [5] |
| Typical Gel Concentration | 0.5% - 3% (standard); up to 14% (high-concentration) [10] | 5% - 20% (varies by application) [11] |
Quantitative Pore Data and Separation Performance
The practical separation performance of these gels is a direct manifestation of their pore architecture. Experimental characterization techniques, including cryogenic scanning electron microscopy (Cryo-SEM) and atomic force microscopy (AFM), have quantified the pore sizes of agarose gels. For instance, a 1.0% agarose gel has an average pore size of approximately 230-240 nm, while a 2.0% gel has a smaller average pore size [12]. This concentration-dependent pore size enables the separation of large DNA molecules, with a 2% agarose gel effectively resolving DNA fragments in the 0.1-1 kbp range [5].
For polyacrylamide, the pore size is determined by the total acrylamide concentration (%T) and the cross-linker ratio (%C). This allows for fine-tuned separation ranges for proteins. For example, a 12% polyacrylamide gel is recommended for separating proteins with molecular weights less than 200 kDa [10]. In the context of DNA, a 15% polyacrylamide gel can resolve fragments as small as 25-150 bp, demonstrating its superior resolution for small molecules compared to agarose [11].
The concept of "anomalous diffusion" within gels, particularly relevant for protein separation, has been explored using techniques like Fluorescence Correlation Spectroscopy (FCS). Studies on agarose gels show that the diffusion of particles becomes anomalous when the ratio of the particle's hydrodynamic radius to the gel's correlation length exceeds approximately 0.4, indicating that the particles begin to experience significant obstruction from the polymer network [13]. This highlights how the gel's structure directly influences molecular mobility.
Table 2: Experimental Separation Ranges and Pore Characteristics
| Gel Type & Concentration | Average Pore Size (nm) | Effective Separation Range | Key Supporting Evidence |
|---|---|---|---|
| Agarose, 1.0% | 230 - 240 nm [12] | Large DNA fragments (≥ 1 kbp) | Cryo-SEM, STED microscopy [12] |
| Agarose, 2.0% | Smaller than 1.0% gel [12] | DNA fragments ~0.1-1 kbp [5] | Cryo-SEM, AFM [12] |
| Polyacrylamide, 5% | N/A | DNA: ~80 - 500 bp [11] | Electrophoretic mobility [11] |
| Polyacrylamide, 12% | N/A | Proteins: < 200 kDa [10] | SDS-PAGE mobility [10] [7] |
| Polyacrylamide, 15% | N/A | DNA: ~25 - 150 bp [11] | Electrophoretic mobility [11] |
Experimental Data on Separation Performance
Resolution of Protein Isoforms
A critical test for any separation matrix in proteomic research is its ability to resolve post-translational modifications (PTMs), which create protein isoforms with subtle differences in charge and mass. A comparative study evaluated 1D SDS-PAGE, 2D IEF-SDS-PAGE (which uses polyacrylamide in both dimensions), and liquid chromatography (LC) for separating phosphorylated isoforms of ovalbumin. The study found that 1D SDS-PAGE, which separates primarily by mass, resulted in only three bands, failing to reveal the full complexity of the sample [14]. In contrast, 2D IEF-SDS-PAGE, which separates first by isoelectric point (pI) and then by mass, exhibited a far more complex pattern, resolving 11 major spots from the same protein sample [14]. This demonstrates the superior capability of polyacrylamide-based 2D electrophoresis to resolve complex isoform patterns, making it the most suitable among the tested methods for detailed PTM analysis.
Analysis of Diffusion and Molecular Sieving
The molecular sieving properties of agarose gels have been quantitatively studied using Fluorescence Correlation Spectroscopy (FCS). This technique probes local mobility and diffusion processes by analyzing fluorescence fluctuations from a small confocal volume [13]. Research using FCS has shown that diffusion of nanoparticles in agarose gel is anomalous, not following classical Fickian law, due to the obstructive nature of the gel matrix [13]. The mean-square displacement of a particle follows a power law, ⟨r²(t)⟩ = Γt^(2/dw), where the fractal dimension of diffusion, dw, diverges from the normal value of 2 as particles become more entrapped [13]. This anomalous behavior becomes significant when the reduced size of the diffusing particle (RA/RC) exceeds ~0.4, where R_C is the gel's correlation length [13]. This data provides a physico-chemical basis for the sieving effect, explaining why larger proteins or complexes are more strongly hindered.
Detailed Experimental Protocols
To provide a practical resource for researchers, this section outlines standard protocols for preparing and using these gels for protein separation.
Protocol for SDS-Polyacrylamide Gel Electrophoresis (SDS-PAGE)
SDS-PAGE is the workhorse method for separating proteins by molecular weight [7].
Gel Casting: Polyacrylamide gels are typically cast between two glass plates. They consist of two layers:
- Resolving Gel: This lower layer has a higher acrylamide concentration (e.g., 8-16%) and a higher pH (Tris-HCl, pH 8.8). It is responsible for separating proteins based on size.
- Example Recipe for a 10% Resolving Gel (for a mini-gel): 7.5 mL of 40% acrylamide solution, 3.9 mL of 1% bisacrylamide, 7.5 mL of 1.5 M Tris-HCl (pH 8.7), water to 30 mL, 0.3 mL of 10% APS, 0.3 mL of 10% SDS, and 0.03 mL TEMED [7]. The SDS ensures proteins are denatured and uniformly charged.
- Stacking Gel: This upper, low-percentage gel (e.g., 5%) has a lower pH (Tris-HCl, pH 6.8). Its function is to concentrate all protein samples into a sharp band before they enter the resolving gel, which dramatically improves resolution [7].
- Resolving Gel: This lower layer has a higher acrylamide concentration (e.g., 8-16%) and a higher pH (Tris-HCl, pH 8.8). It is responsible for separating proteins based on size.
Sample Preparation: Protein samples are diluted in a loading buffer containing SDS, a reducing agent (like DTT or β-mercaptoethanol) to break disulfide bonds, glycerol for density, and a tracking dye. The samples are then heated at 70-100°C to denature the proteins [7].
Electrophoresis: The gel cassette is mounted in a tank filled with running buffer (e.g., Tris-Glycine-SDS). A voltage (e.g., 130-150V for a mini-gel) is applied until the tracking dye reaches the bottom of the gel [7].
Detection: Post-electrophoresis, proteins are visualized by staining with Coomassie Blue, silver stain, or fluorescent dyes [15] [7].
Protocol for High-Concentration Agarose Gel Electrophoresis (HAGE)
While less common for proteins, high-concentration agarose gels (HAGs) can be used for specific applications, such as separating low-molecular-weight proteins or native protein complexes [10].
Gel Preparation: High-concentration agarose (e.g., 6-14%) can be dissolved using an autoclave, which prevents bubble formation compared to microwave heating [10]. The solution is poured into a vertical gel cast, similar to polyacrylamide gels.
Buffer System: The buffer condition is critical for resolution. For protein separation, a system comprising 1 M Tris-Cl for gel preparation, 0.2 M Tris-Cl/0.2% SDS as the upper tank buffer, and 0.2 M Tris-Cl as the lower tank buffer has been used successfully [10].
Electrophoresis and Staining: The gel is run similarly to standard agarose gels, though typically in a vertical apparatus. Post-run, proteins can be stained with standard protein stains like Coomassie Blue [10].
Workflow and Property Visualization
The following diagram illustrates the key properties and decision-making workflow for selecting between agarose and polyacrylamide gels for separation tasks.
Diagram 1: Gel Selection Workflow for Separation Tasks
The Scientist's Toolkit: Essential Research Reagents
Successful gel-based separation relies on a suite of specific reagents, each with a critical function.
Table 3: Key Reagent Solutions for Gel Electrophoresis
| Reagent / Material | Function / Purpose | Application Context |
|---|---|---|
| Acrylamide/Bis-acrylamide | Forms the cross-linked polymer network of polyacrylamide gels. The ratio determines pore size [11] [7]. | Polyacrylamide Gel Electrophoresis |
| Ammonium Persulfate (APS) | Initiator that provides free radicals to drive the acrylamide polymerization reaction [11] [7]. | Polyacrylamide Gel Electrophoresis |
| TEMED | Catalyst (accelerator) that promotes the production of free radicals from APS, essential for gel polymerization [11] [7]. | Polyacrylamide Gel Electrophoresis |
| SDS (Sodium Dodecyl Sulfate) | Ionic detergent that denatures proteins and confers a uniform negative charge, enabling separation by mass alone [5] [7]. | SDS-PAGE |
| Agarose (Low EEO) | Forms the hydrogel matrix via hydrogen bonding; low EEO (Electroendosmosis) is preferable for minimal buffer ion interference [12]. | Agarose Gel Electrophoresis |
| Tris-based Buffers (TAE, TBE) | Provide the conductive medium and maintain stable pH during electrophoresis [10] [16]. | Agarose & Native PAGE |
| Loading Dye | Contains density agents (e.g., glycerol, Ficoll) for sample sedimentation and tracking dyes (e.g., bromophenol blue) to monitor migration [16] [7]. | Agarose & Polyacrylamide Gels |
| Protein Molecular Weight Markers | A set of proteins of known mass run alongside samples to estimate the molecular weight of unknown proteins [7]. | SDS-PAGE |
The choice between agarose and polyacrylamide for protein separation is unequivocally guided by the experimental requirements for resolution and the physical basis of molecular sieving. Polyacrylamide gels, with their synthetic, tunable pore structure, provide the high resolution and small pore sizes necessary for separating proteins and resolving subtle differences like PTMs, as evidenced by their ability to resolve 11 isoforms of ovalbumin where 1D gels showed only three [14]. Their superiority for protein analysis is firmly established. Agarose gels, characterized by larger, random pores, excel in the separation of macromolecules like large nucleic acids and, in high-concentration formulations, can serve as a less-toxic alternative for specific protein separations where the highest resolution is not critical [10] [5]. For the drug development professional or research scientist, this guide underscores that an understanding of the structural basis of pore size and sieving is not academic—it is the foundation for generating reliable, reproducible, and high-quality data in proteomic research and beyond.
In molecular biology and biopharmaceutical development, the separation and analysis of proteins are foundational to understanding disease mechanisms, developing new therapeutics, and ensuring drug quality. The choice of gel matrix for electrophoresis is a critical decision that directly impacts the resolution, accuracy, and success of these analyses. The two primary matrices employed are polyacrylamide and agarose gels, each with distinct properties governed by the fundamental separation principles of charge, size, and shape. While polyacrylamide gel electrophoresis (PAGE) is the established standard for high-resolution protein separation, recent advancements are revitalizing interest in agarose-based systems for specific, often larger-scale, protein analysis applications. This guide provides an objective comparison of these two systems, focusing on their mechanistic principles and experimental performance for protein research.
Structural Foundations: Gel Matrix Architecture
The separation power of any electrophoresis matrix originates from its nanoscale structure, which creates a molecular sieve through which proteins migrate.
Polyacrylamide Gel Structure
Polyacrylamide gels are synthetic polymers created through a chemical polymerization reaction between acrylamide monomers and a cross-linking agent, typically N,N'-methylenebisacrylamide (bis-acrylamide). This reaction forms a covalently linked, three-dimensional mesh network with a uniform, tunable pore size. The pore size is precisely controlled by adjusting the total concentration of acrylamide (%T) and the proportion of cross-linker (%C). Higher %T results in a denser matrix with smaller pores, ideal for separating smaller proteins [5]. This synthetic, ordered structure is key to its high resolving power.
Agarose Gel Structure
Agarose, a natural polysaccharide derived from seaweed, forms a gel through non-covalent hydrogen bonding and physical entanglement of helical bundles [2] [17]. This process creates a three-dimensional lattice with larger, more random pores compared to polyacrylamide. The pore size is influenced by the agarose concentration but is generally less uniform. The structure is more robust at lower concentrations, allowing for the separation of very large macromolecular complexes [2]. The formation of this gel is a thermoreversible process, making it easy to cast and handle [18].
Table 1: Fundamental Structural Properties of Polyacrylamide and Agarose Gels
| Property | Polyacrylamide Gel | Agarose Gel |
|---|---|---|
| Chemical Nature | Synthetic polymer | Natural polysaccharide |
| Formation Mechanism | Covalent chemical polymerization [5] | Non-covalent physical aggregation [2] |
| Pore Size | Small, uniform, and precisely tunable (e.g., 70-130 nm) [5] [17] | Large and non-uniform (e.g., 100-500 nm for a 1% gel) [2] |
| Typical Gel Concentration | 5-20% (for proteins) | 0.5-3% |
| Structural Analogy | Fine, uniform mesh | Random, porous sponge |
Gel Matrix Formation Pathways: This diagram contrasts the covalent, chemical-driven formation of polyacrylamide gels with the physical, heat-dependent gelling process of agarose.
Separation Mechanisms and Quantitative Performance
The structural differences between polyacrylamide and agarose gels directly dictate their separation performance for proteins, influencing resolution, range, and analytical output.
Molecular Sieving in Practice
In both systems, an electric field drives the movement of charged proteins. The gel matrix acts as a sieve, where smaller proteins navigate the pores more easily and migrate faster, while larger proteins are impeded [17]. The primary difference lies in the efficiency of this sieving action due to pore structure. The uniform mesh of polyacrylamide provides a consistent sieving environment, leading to superior resolution of proteins with small size differences. The larger pores of agarose are less effective at sieving small proteins but can accommodate massive complexes that would be entirely excluded from a polyacrylamide gel [2].
Resolution and Effective Range
The superior resolution of polyacrylamide gels allows them to distinguish between proteins differing in molecular weight by as little as a few thousand Daltons, or even a single base pair for nucleic acids [5]. They are the unequivocal choice for analyzing most proteins, which typically fall within the 10-250 kDa range. Agarose gels, with their larger pores, are generally ineffective for resolving standard proteins but excel in separating very large protein complexes, lipoproteins, or viruses [2] [17]. A 2025 study highlighted the use of SDS-capillary agarose gel electrophoresis (SDS-CAGE) for the "rapid analysis of therapeutic proteins in a wide molecular weight range," including a highly glycosylated fusion protein and thyroglobulin (660 kDa), without the baseline disturbances common in traditional polymer matrices [19].
Table 2: Performance Comparison for Protein Separation
| Performance Metric | Polyacrylamide Gel (PAGE) | Agarose Gel |
|---|---|---|
| Resolution | High (can separate ~2 kDa difference) [5] | Low to Moderate |
| Effective Protein Size Range | Excellent for small molecules (proteins, small nucleic acids) [5] | Best for large macromolecules & complexes [2] [19] |
| Best Suited For | SDS-PAGE, Native PAGE, IEF, 2D-Gels [5] | Large protein complexes, native electrophoresis of very large particles [17] |
| Typical Application | Proteomics, protein purity analysis, western blotting | Analysis of fusion proteins, mAb aggregates, lipoprotein profiles [19] |
| Reproducibility | High (due to precise control over pore size) | Moderate (pore size is less uniform) |
Experimental Protocols: From Theory to Practice
The following protocols outline standard methodologies for protein separation using both gel types, highlighting key procedural differences.
SDS-Polyacrylamide Gel Electrophoresis (SDS-PAGE)
SDS-PAGE is the workhorse denaturing method for separating proteins based on molecular weight.
- Principle: Proteins are denatured and coated with the negatively charged detergent sodium dodecyl sulfate (SDS), which masks the protein's intrinsic charge and imparts a uniform charge-to-mass ratio. Separation therefore occurs primarily based on molecular size [5] [20].
- Protocol:
- Gel Casting: Prepare a discontinuous gel system consisting of a stacking gel (low concentration, ~4-5%) and a resolving gel (variable concentration, ~8-16%). The stacking gel pH (6.8) and resolving gel pH (~8.8) create a discontinuity that sharpens protein bands before they enter the resolving gel.
- Sample Preparation: Mix protein samples with SDS-containing loading buffer (includes SDS, a reducing agent like β-mercaptoethanol, glycerol, and a tracking dye). Heat at 95-100°C for 5-10 minutes to fully denature proteins.
- Electrophoresis: Load samples into wells. Apply a constant voltage (e.g., 80-200 V) using Tris-glycine-SDS as the running buffer until the dye front reaches the bottom of the gel.
- Detection: Proteins are visualized by staining with Coomassie Blue, silver stain, or fluorescent dyes. For western blotting, proteins are transferred to a membrane for antibody-based detection.
Native Agarose Gel Electrophoresis for Proteins
Native gel electrophoresis in agarose preserves protein structure and activity, separating based on a combination of charge, size, and shape.
- Principle: Proteins are run in their native, folded state without SDS. Their migration depends on the intrinsic net charge of the protein at the running pH, as well as their size and shape. Proteins with a net negative charge migrate toward the anode, while positively charged proteins migrate toward the cathode [17].
- Protocol:
- Gel Casting: Dissolve agarose powder (typically 0.5-2%) in an appropriate native running buffer (e.g., Tris-acetate, Tris-borate) by heating. Pour the solution into a cast and allow it to set at room temperature [2] [1].
- Sample Preparation: Mix protein samples with a native loading dye (contains glycerol/sucrose for density but no SDS or reducing agents).
- Electrophoresis: Load samples and run at a low, constant voltage (e.g., 5-10 V/cm) to prevent heat-induced denaturation. The run time is often longer than for SDS-PAGE.
- Detection: Proteins can be detected using specific activity stains, general protein stains compatible with native conditions, or by capillary transfer for downstream analysis.
Protein Electrophoresis Workflows: A side-by-side comparison of the denaturing SDS-PAGE process, which simplifies separation to molecular size, versus the native agarose process, which maintains the protein's complex intrinsic properties.
The Scientist's Toolkit: Essential Reagents and Materials
Successful electrophoresis relies on a suite of specialized reagents. The table below details key solutions for both polyacrylamide and agarose gel systems.
Table 3: Essential Research Reagent Solutions for Gel Electrophoresis
| Reagent Solution | Function | Key Components | Application |
|---|---|---|---|
| SDS Sample Buffer | Denatures proteins, imparts uniform negative charge, adds density for loading [20]. | SDS, reducing agent (e.g., DTT), glycerol, tracking dye (e.g., bromophenol blue), Tris buffer. | SDS-PAGE |
| Native Sample Buffer | Adds density to sample for loading without disrupting native structure. | Glycerol or sucrose, tracking dye, Tris buffer (no SDS or reductant). | Native PAGE, Native Agarose GE |
| TAE Buffer | Provides ions to carry current and maintains stable pH during run. | Tris-base, acetic acid, EDTA [1]. | Agarose Gel Electrophoresis |
| Tris-Glycine-SDS Buffer | Running buffer for SDS-PAGE; glycine ion is critical for stacking effect. | Tris-base, glycine, SDS [5]. | SDS-PAGE |
| Coomassie Blue Stain | General protein stain for visualization after electrophoresis. | Coomassie Brilliant Blue dye, methanol, acetic acid. | SDS-PAGE, Native Gels |
| Ethidium Bromide/SYBR Safe | Intercalating dye for fluorescent nucleic acid visualization (often used in protein agarose gels to check for nucleic acid contaminants). | Ethidium bromide or SYBR Safe dye [1]. | Agarose GE (Nucleic Acids) |
Application Scenarios and Selection Guidelines
Choosing between polyacrylamide and agarose hinges on the experimental question, the properties of the target protein, and the required resolution.
Choose Polyacrylamide Gel (PAGE) when:
- Your primary goal is high-resolution separation of standard-sized proteins (10-250 kDa).
- You need to determine protein purity or molecular weight accurately via SDS-PAGE.
- You are performing complex analyses like 2D-gel electrophoresis (combining IEF and SDS-PAGE) or western blotting.
- You need to resolve small nucleic acid fragments (e.g., primers, microRNAs).
Choose Agarose Gel when:
- You are analyzing very large protein complexes, antibodies, fusion proteins, or viruses that are too large to enter a polyacrylamide gel [19].
- You must preserve native protein structure and activity for functional assays post-electrophoresis [17].
- You are analyzing lipoproteins or other macromolecular assemblies in their native state in clinical diagnostics.
- Safety and ease of use are paramount, as agarose is non-toxic and easier to prepare than polyacrylamide, which requires handling neurotoxic monomers [5] [18].
The fundamental separation principles of charge, size, and shape manifest differently in polyacrylamide and agarose gel matrices, defining their respective roles in the protein laboratory. Polyacrylamide gels, with their synthetic, tunable pore structure, offer unparalleled resolution for standard protein analysis and remain the undisputed cornerstone of proteomics. In contrast, agarose gels provide a versatile, safe, and robust platform for separating massive macromolecular complexes under native conditions. Emerging techniques, such as SDS-capillary agarose gel electrophoresis, demonstrate that agarose continues to evolve, offering new solutions for challenging biopharmaceuticals like fusion proteins and monoclonal antibodies [19]. The informed scientist must therefore view these not as competing technologies, but as complementary tools, selecting the matrix that best aligns with their specific protein separation needs.
Gel electrophoresis remains a cornerstone technique in molecular biology and biochemistry laboratories worldwide, serving as a critical tool for the separation and analysis of macromolecules such as proteins and nucleic acids [5]. The fundamental principle of this technique involves the movement of charged molecules through a porous gel matrix under the influence of an electric field, enabling separation based on size, charge, and conformation [2]. The fidelity and reproducibility of an experiment hinge profoundly on the careful selection of the appropriate gel matrix, with polyacrylamide and agarose representing the two primary matrices employed for this purpose [5].
While both gel types function as molecular sieves, their unique physical and chemical properties dictate markedly different suitability for various experimental objectives, particularly in protein separation research [5] [8]. A deep understanding of these differences is not merely academic but is critical for any researcher or drug development professional seeking to optimize workflow, ensure data integrity, and draw meaningful conclusions from electrophoretic analyses. This guide provides a detailed, objective comparison of these two fundamental tools, highlighting their key characteristics, applications, and practical considerations to inform experimental design in a research and development context.
Core Characteristics: A Comparative Analysis
The choice between polyacrylamide and agarose gels is fundamentally guided by the nature of the target molecules and the required resolution. The following table summarizes their core characteristics, providing a quick reference for researchers.
Table 1: Core Characteristics of Agarose and Polyacrylamide Gels for Biomolecular Separation
| Characteristic | Agarose Gel | Polyacrylamide Gel |
|---|---|---|
| Polymer Type | Natural polysaccharide (from seaweed) [2] [21] | Synthetic polymer (acrylamide copolymer) [11] [6] |
| Gel Formation | Physical, thermoreversible (hydrogen bonding) [21] | Chemical, permanent (covalent cross-linking) [5] [6] |
| Typical Pore Size | Large, 100–500 nm [21] | Small, tunable: 5–100 nm [21] |
| Pore Size Control | Adjusted only by agarose concentration [5] | Precisely tuned by %T (total acrylamide) and %C (cross-linker) [5] [6] |
| Primary Application | Separation of large nucleic acids (50 bp - 25 kb) [2] [1] | Separation of proteins and small nucleic acids (< 1 kb) [5] [6] |
| Resolving Power | Lower resolution, suitable for larger molecules [5] | Very high resolution; can distinguish molecules differing by a single base pair or a few thousand Daltons [5] [8] [22] |
| Toxicity & Handling | Non-toxic, safe and easy to handle [5] [8] | Acrylamide monomer is a potent neurotoxin; requires strict safety protocols [5] [11] [6] |
| Gel Strength & Handling | Softer, more flexible [21] | Mechanically strong, easy to handle, and transparent [11] |
The primary application of agarose gel is the separation of nucleic acids, specifically large DNA and RNA fragments [5] [1]. Given the very large size of most DNA fragments, the large, flexible pores of an agarose gel matrix are well-suited for their movement [5]. In contrast, the primary application of a polyacrylamide gel is for the separation of proteins and very small nucleic acid fragments [5]. Proteins are much smaller than most DNA molecules, and the tight, uniform pores of a polyacrylamide gel provide the high resolution necessary to separate them [5] [11]. The most common form of protein electrophoresis using this gel is SDS-PAGE (Sodium Dodecyl Sulfate-Polyacrylamide Gel Electrophoresis) [6]. In this technique, the negatively charged detergent SDS is used to denature proteins and impart a uniform negative charge, ensuring that separation is based almost solely on molecular mass [6].
Table 2: Recommended Gel Concentrations for Different Separation Goals
| Target Molecule | Recommended Gel Type | Optimal Gel Concentration |
|---|---|---|
| DNA > 10 kb | Agarose | 0.5% - 0.8% [5] [21] |
| DNA 100 bp – 10 kb | Agarose | 0.8% – 2% [5] [21] |
| RNA | Agarose (with denaturant) | 1% – 1.2% [21] |
| Proteins (20–200 kDa) | Polyacrylamide | 10% – 12% [21] [6] |
| Small peptides / high-resolution protein separation | Polyacrylamide | 15% – 20% [21] [6] |
| Very large proteins (> 250 kDa) | Polyacrylamide | 5% – 8% [6] |
Experimental Protocol: SDS-PAGE for Protein Separation
For protein separation research, SDS-PAGE is the definitive and most widely used method. The following detailed protocol, central to the comparison with agarose-based protein methods, ensures accurate and reproducible results.
Sample Preparation
The protein sample is mixed with a loading buffer containing SDS (Sodium Dodecyl Sulfate), a reducing agent (such as DTT or 2-mercaptoethanol), and a tracking dye [6]. The SDS detergent denatures the proteins and imparts a uniform negative charge, while the reducing agent breaks disulfide bonds [6]. This critical step ensures that separation is based primarily on polypeptide chain length rather than inherent charge or complex 3D structure. The mixture is then heated at 60-100 °C for several minutes to complete denaturation [6].
Gel Preparation and Casting
Polyacrylamide gels are formed through a chemical polymerization reaction catalyzed by ammonium persulfate (APS) and TEMED (N,N,N',N'-Tetramethylethylenediamine) [11] [6]. The gel is typically composed of two layers:
- Stacking Gel: A low-concentration (~4-5%) gel with large pores, layered on top. Its function is to concentrate all protein samples into a sharp band before they enter the resolving gel [6].
- Resolving Gel (Separating Gel): A higher-concentration gel (e.g., 8-15%) with smaller pores, where the actual size-based separation of proteins occurs [6].
The gels are polymerized between two glass plates sealed in a casting apparatus. The concentration of the resolving gel is chosen based on the molecular weight range of the target proteins, as indicated in Table 2.
Electrophoresis
Once polymerized, the gel is placed in a vertical electrophoresis chamber filled with a running buffer (e.g., Tris-Glycine-SDS buffer) [6]. The prepared samples and a molecular weight marker (protein ladder) are loaded into the wells. An electric field is applied (typically 1-5 V/cm), causing the negatively charged protein-SDS complexes to migrate toward the positive anode [6] [1]. The run is stopped once the tracking dye front reaches the bottom of the gel.
Post-Electrophoresis Processing
Following separation, the gel is typically stained to visualize the protein bands. Coomassie Brilliant Blue is the most common stain, though more sensitive options like silver stain or SYBR dyes are available for low-abundance proteins [6]. For further analysis, such as immunodetection, the separated proteins can be transferred onto a nitrocellulose or PVDF membrane in a procedure known as Western blotting [8].
Diagram 1: SDS-PAGE Experimental Workflow
Research Reagent Solutions: Essential Materials
Successful gel electrophoresis requires precise preparation and the use of specific, high-quality reagents. The following table details the essential materials for a typical SDS-PAGE experiment.
Table 3: Essential Reagents for SDS-PAGE Protein Separation
| Reagent / Material | Function / Purpose | Key Characteristics |
|---|---|---|
| Acrylamide / Bis-acrylamide | Forms the porous gel matrix [6]. | Co-polymer and cross-linker; pore size determined by %T and %C [5] [6]. Neurotoxic in monomeric form [5]. |
| Ammonium Persulfate (APS) | Initiator of the polymerization reaction [6]. | Source of free radicals; requires fresh preparation for efficient polymerization [6]. |
| TEMED | Catalyst for the polymerization reaction [6]. | Accelerates the formation of free radicals from APS [11] [6]. |
| SDS (Sodium Dodecyl Sulfate) | Anionic detergent for sample denaturation [6]. | Denatures proteins and imparts uniform negative charge; ensures separation by mass [6]. |
| Tris-based Buffers | Provides conductive medium and stable pH [6]. | Common buffers: Tris-Glycine for running buffer; Tris-HCl for gel buffer [6]. |
| Loading Dye | Mixed with sample prior to loading [1]. | Contains dye (e.g., Bromophenol Blue) to track migration; glycerol/sucrose to density-load samples [2] [1]. |
| Molecular Weight Marker | Loaded alongside samples for size calibration [6]. | Pre-stained or unstained proteins of known molecular weights; enables estimation of sample protein sizes [6]. |
| Coomassie Blue / Silver Stain | For post-electrophoresis protein visualization [6]. | Coomassie Blue is standard; Silver Stain offers higher sensitivity for low-abundance proteins [6]. |
Advancements and Emerging Applications
While the fundamental principles of gel electrophoresis are well-established, the technique continues to evolve, particularly in the analysis of complex therapeutic proteins. Recent research highlights the innovative application of agarose in capillary electrophoresis for protein analysis, challenging traditional boundaries. This method uses a tetrahydroxyborate cross-linked agarose matrix inside capillaries to enable rapid, high-resolution separation of therapeutic proteins, such as monoclonal antibodies and highly glycosylated fusion proteins [19].
A key advantage reported for this SDS-Capillary Agarose Gel Electrophoresis (SDS-CAGE) is the elimination of the "baseline hump" disturbance—a common challenge in traditional dextran-based polymer networks used for capillary electrophoresis (CE-SDS) of larger biomolecules [19]. This innovation allows for baseline hump-free analysis across a wide molecular weight range, from antibody subunits (~25-50 kDa) to very large proteins like thyroglobulin (660 kDa), offering a robust and efficient platform for the biopharmaceutical industry [19].
Diagram 2: SDS Capillary Agarose Gel Electrophoresis Innovation
The objective comparison between polyacrylamide and agarose gels reveals a clear division of utility based on the properties of the target molecules. For the core task of protein separation research, polyacrylamide gel electrophoresis, particularly in its SDS-PAGE form, is the unequivocal standard. Its superior resolving power, tunable pore structure, and mechanical strength make it indispensable for analyzing proteins and small nucleic acids where high resolution is critical [5] [11] [6].
Conversely, agarose gel electrophoresis excels as the workhorse for the separation of larger nucleic acids, prized for its ease of use, safety, and ability to handle a broad size range of DNA and RNA fragments [5] [2] [1]. The emergence of capillary-based agarose systems for specific protein analysis applications demonstrates that both matrices continue to find relevance in modern, innovative protein characterization workflows [19]. Ultimately, an informed choice between these two foundational tools, grounded in an understanding of their core characteristics and limitations, is a prerequisite for experimental rigor and success in molecular biology and drug development.
Practical Protocols: Implementing Polyacrylamide Gel Electrophoresis for Proteins
The separation of biological macromolecules represents a foundational technique in molecular biology and biochemistry. The fidelity of these separations hinges on the careful selection of the gel matrix, with agarose and polyacrylamide serving as the two primary mediums. A deep understanding of their differences is critical for optimizing experimental workflow and ensuring data integrity [5]. While both matrices function as molecular sieves, their distinct physical and chemical properties dictate their suitability for specific molecules and applications. Agarose gels, composed of polysaccharides derived from seaweed, form a matrix with large, non-uniform pores through non-covalent associations. This structure is ideal for separating large nucleic acids but lacks the resolution for smaller proteins [5]. In contrast, polyacrylamide gels, synthesized from the co-polymerization of acrylamide and bis-acrylamide, create a tight, highly uniform mesh with precisely tunable pore sizes. This level of control makes polyacrylamide the indispensable matrix for high-resolution protein separation, forming the basis of the gold-standard technique known as SDS-PAGE [5] [23].
Table: Fundamental Comparison of Agarose and Polyacrylamide Gel Matrices
| Feature | Agarose Gel | Polyacrylamide Gel |
|---|---|---|
| Chemical Composition | Polysaccharide from seaweed [5] | Synthetic polymer of acrylamide and bis-acrylamide [5] |
| Pore Size | Large, non-uniform [5] | Small, uniform, and precisely tunable [5] |
| Typical Molecules Separated | Large DNA/RNA (100 bp to 25 kbp+) [5] | Proteins (5-250 kDa) and small nucleic acids (< 1 kbp) [5] [23] |
| Primary Application | Nucleic acid electrophoresis (e.g., genotyping, PCR verification) [5] | Protein electrophoresis (e.g., SDS-PAGE, Western blotting) [5] |
| Preparation & Safety | Simple, non-toxic melting and pouring [5] | Complex chemical polymerization; acrylamide monomer is a neurotoxin [5] |
| Resolution | Lower, suitable for large molecules [5] | High, capable of resolving mass differences of a few thousand Daltons [5] |
The SDS-PAGE Method: Principles and Procedures
Sodium dodecyl sulfate–polyacrylamide gel electrophoresis (SDS-PAGE) is a discontinuous electrophoretic system developed by Ulrich K. Laemmli that has become one of the most cited methodologies in life sciences [24] [23]. The power of SDS-PAGE lies in its ability to separate proteins based almost exclusively on their molecular mass by eliminating the influence of the protein's inherent structure and charge.
Core Principles of Denaturation and Separation
The technique relies on the anionic detergent sodium dodecyl sulfate (SDS). During sample preparation, proteins are denatured by heating in the presence of SDS and a reducing agent. SDS binds to the polypeptide backbone at a constant ratio of approximately 1.4 g SDS per gram of protein, which masks the protein's intrinsic charge and confers a uniform negative charge density. This means the charge-to-mass ratio is essentially identical for all proteins [23]. When an electric field is applied, these denatured, SDS-coated polypeptides migrate through the polyacrylamide gel mesh toward the anode. The gel acts as a sieve: smaller proteins navigate the pores more easily and migrate faster, while larger proteins are retarded. This results in the separation of polypeptides strictly by their molecular weight [23].
Detailed Experimental Protocol
The SDS-PAGE procedure is a multi-step process that requires precision for reproducible results.
Gel Production: Polyacrylamide gels are formed via free radical polymerization. A solution of acrylamide, bis-acrylamide (cross-linker), buffer (typically Tris-HCl at pH 8.8 for the resolving gel), SDS, and water is poured between two glass plates. The polymerization reaction is initiated by adding the catalyst TEMED and the radical initiator ammonium persulfate (APS). The gel is cast in two layers: a lower resolving gel (often 10-12% acrylamide) where the actual separation occurs, and an upper stacking gel (4-6% acrylamide at pH 6.8) that concentrates the proteins into a sharp band before they enter the resolving gel, a phenomenon known as the stacking effect [23]. This discontinuous buffer system is key to the high resolution of the Laemmli method.
Sample Preparation: Protein samples are mixed with a loading buffer containing SDS, a reducing agent (such as β-mercaptoethanol or dithiothreitol (DTT) to break disulfide bonds), glycerol, and a tracking dye (e.g., bromophenol blue). The mixture is then heated to 95°C for 5 minutes to fully denature the proteins [23]. A molecular weight size marker is prepared alongside the unknown samples to allow for mass estimation.
Electrophoresis: The denatured samples are loaded into wells in the stacking gel. The gel apparatus is immersed in an electrophoresis buffer (Tris-glycine-SDS) and a constant voltage (typically 100-200 V) is applied. The negatively charged proteins migrate toward the anode. The electrophoresis is stopped once the bromophenol blue dye front reaches the bottom of the gel [23].
Post-Electrophoresis Analysis: Following separation, proteins are fixed and visualized within the gel using stains like Coomassie Brilliant Blue or more sensitive fluorescent stains [23]. Alternatively, proteins can be transferred onto a membrane for Western blot analysis to detect specific antigens using antibodies.
SDS-PAGE Experimental Workflow
Essential Reagents for SDS-PAGE
Successful execution of SDS-PAGE requires a suite of specific research reagents, each with a critical function.
Table: Key Research Reagent Solutions for SDS-PAGE
| Reagent / Material | Function / Purpose |
|---|---|
| Acrylamide / Bis-acrylamide | Forms the cross-linked polyacrylamide gel matrix that acts as the molecular sieve [23]. |
| SDS (Sodium Dodecyl Sulfate) | Denatures proteins and imparts a uniform negative charge, enabling separation by size alone [23]. |
| Reducing Agent (DTT, β-ME) | Cleaves disulfide bonds to ensure complete protein unfolding and subunit separation [23]. |
| TEMED & Ammonium Persulfate | Catalyst and initiator for the free-radical polymerization of the acrylamide gel [23]. |
| Tris-based Buffers | Provides the appropriate pH for gel polymerization (stacking vs. resolving) and the running buffer for electrophoresis [23]. |
| Molecular Weight Marker | A mixture of proteins of known sizes, run alongside samples to estimate the molecular weight of unknown proteins [23]. |
| Coomassie Stain | A dye that binds nonspecifically to proteins, allowing visualization of separated bands in the gel [23]. |
Comparative Analysis: SDS-PAGE vs. Capillary Electrophoresis-SDS
While SDS-PAGE remains the workhorse for protein analysis, technology has evolved. Capillary Electrophoresis-SDS (CE-SDS) has emerged as a powerful, automated alternative that addresses several limitations of traditional gel-based methods [24].
CE-SDS performs SDS-based protein separation within a narrow-bore capillary tube filled with a separation polymer matrix. The process is automated, from sample injection to detection via an on-board UV or fluorescence detector. This fundamental shift in platform from a slab gel to a capillary provides significant advantages [24]. A comparison of key performance metrics highlights the technological evolution.
Table: Quantitative Comparison of SDS-PAGE and CE-SDS Performance
| Performance Metric | Traditional SDS-PAGE | CE-SDS |
|---|---|---|
| Analysis Time | ~1.5 to 3 hours [24] | 5.5 to 25 minutes per sample [24] |
| Throughput | Low to moderate (manual process) | High (automated, 48 or 96 samples per run) [24] |
| Reproducibility | Subject to gel-to-gel variability [24] | High, with superior run-to-run consistency [24] |
| Data Output | Qualitative/Semi-quantitative band intensity [24] | Fully quantitative peak integration [24] |
| Resolution | High | Higher, with minimized band broadening [24] |
| Sample & Reagent Use | Higher volumes | Minimal consumption [24] |
| Safety | Handles toxic acrylamide monomers [5] [24] | Uses pre-polymerized, non-toxic separation matrix [24] |
| Data Format | Gel image (bands) | Electropherogram (peaks) with optional virtual gel view [24] |
The relationship between these techniques and their respective positions in the biopharmaceutical development workflow can be visualized as a progression from a manual, qualitative method to an automated, quantitative one.
Technology Evolution and Application Context
SDS-PAGE rightfully maintains its status as the gold standard for denaturing protein separation by molecular weight. Its foundational principles are robust, reliable, and have enabled decades of discovery in molecular biology. The technique provides an excellent balance of resolution, accessibility, and cost-effectiveness, making it an indispensable tool in research and education. However, the advent of CE-SDS represents a significant technological leap, offering superior quantitative precision, reproducibility, and throughput essential for the rigorous demands of biopharmaceutical development and regulatory filing [24]. While CE-SDS and other advanced methodologies are increasingly adopted for high-stakes analytical testing, SDS-PAGE remains a vital and widely used technique for routine protein analysis, method development, and laboratories where flexibility and initial cost are primary considerations. Its legacy as a cornerstone of biochemical analysis is secure, even as the field continues to evolve toward more automated and quantitative platforms.
In the realm of protein separation, the choice between polyacrylamide and agarose gels is foundational, dictated by the size of the target molecules and the required resolution [5]. While agarose gels, with their large pore sizes, are excellent for separating large nucleic acids and massive protein complexes, polyacrylamide gels provide the fine mesh necessary for high-resolution separation of most proteins [5] [7]. Within polyacrylamide gel electrophoresis (PAGE), the Native-PAGE technique stands out for functional studies. It forsakes denaturing agents to preserve proteins in their natural, folded conformation, allowing scientists to analyze protein complexes, quaternary structures, and enzymatic activity post-separation [7] [25]. This guide provides a detailed comparison of Native-PAGE against other electrophoretic methods, supporting researchers in selecting the optimal technique for their functional protein analysis.
Core Principles and Comparative Analysis of Electrophoresis Techniques
Native-PAGE separates proteins based on their intrinsic charge, size, and three-dimensional shape [7] [26]. Because no denaturants are used, protein subunits within a multimeric complex remain associated, and enzymatic activity is often retained [7] [25]. The migration of a protein depends on its net negative charge density at the gel's alkaline pH and the frictional force it encounters from the gel matrix [25].
In contrast, SDS-PAGE uses the denaturing detergent sodium dodecyl sulfate (SDS) to unfold proteins and impart a uniform negative charge. This ensures separation is based almost exclusively on molecular mass, destroying functional properties [7] [23]. A modified approach, Native SDS-PAGE (NSDS-PAGE), reduces SDS concentrations and omits heating to allow some proteins to retain activity and bound metal ions while still providing high resolution [27].
Agarose gel electrophoresis is less common for routine protein separation but is invaluable for analyzing very large protein complexes or nucleic acids due to its large pore size [5] [26].
The table below summarizes the key operational differences and optimal use cases for these techniques.
Table 1: Comparative Overview of Protein Electrophoresis Techniques
| Feature | Native-PAGE | SDS-PAGE (Denaturing) | Native SDS-PAGE (NSDS-PAGE) | Agarose Gel (for proteins) |
|---|---|---|---|---|
| Separation Basis | Net charge, size, and native shape [7] [25] | Molecular mass [7] [23] | Molecular mass (with retained activity for some proteins) [27] | Size and charge of large complexes [5] |
| Protein State | Native, folded; multimers intact [26] [25] | Denatured, unfolded; subunits dissociated [23] | Partially denatured/native for some proteins [27] | Native |
| Functional Activity | Retained [7] [27] | Destroyed [27] | Retained for many enzymes [27] | Retained [28] |
| Key Reagents | Coomassie G-250 (in some systems) or native buffers [25] | SDS, reducing agents (e.g., DTT, β-ME) [23] | Low SDS, no reducing agent, no heat [27] | Low-melt agarose, native buffers [28] |
| Primary Application | Studying native complexes, enzyme activity, quaternary structure [25] | Molecular weight determination, purity checks [7] | High-resolution separation with retained metal ions/function [27] | Analyzing very large macromolecular complexes [5] [26] |
Supporting Experimental Data: A Focus on Functional Preservation
Experimental data underscores the unique advantage of Native-PAGE and its variants in preserving protein function. A key study compared standard SDS-PAGE, Blue-Native (BN)-PAGE, and NSDS-PAGE for their ability to retain zinc in metalloproteins and preserve enzymatic activity [27].
Table 2: Experimental Comparison of Metal Retention and Enzyme Activity Post-Electrophoresis
| Electrophoresis Method | Zn²⁺ Retention in Proteome Sample | Enzymatic Activity Retention (Model Zn²⁺ Enzymes) | Key Methodological Modifications |
|---|---|---|---|
| SDS-PAGE | 26% | 0 out of 4 active | Sample heated with SDS and reducing agent [27] |
| BN-PAGE | Data not provided in excerpt | 9 out of 9 active | No SDS; Coomassie G-250 used for charge shift [27] |
| NSDS-PAGE | 98% | 7 out of 9 active | SDS removed from sample buffer; running buffer SDS reduced to 0.0375%; no heating or EDTA [27] |
This data demonstrates that NSDS-PAGE offers a powerful compromise, achieving near-complete retention of bound metal ions while maintaining the high resolution of traditional SDS-PAGE. Furthermore, most enzymes tested remained functional after separation under these modified conditions [27]. Separately, native agarose gels have been successfully used to monitor the formation and stability of protein complexes, with direct in-gel fluorescence visualization confirming the preservation of protein functionality [28].
Essential Methodologies for Native Gel Electrophoresis
Standard Native-PAGE Protocol Using a Tris-Glycine System
This is a common method for separating proteins under native conditions [25].
- Gel Preparation: Cast a polyacrylamide gel (typically between 6-16%) without SDS. The gel consists of a single resolving gel layer without a stacking gel in some traditional systems [7].
- Sample Preparation: Mix the protein sample with a native sample buffer (e.g., Tris-Glycine Native Sample Buffer containing glycerol and a tracking dye like Bromophenol Blue). Crucially, do not add SDS, reducing agents, or heat the sample [26] [25].
- Electrophoresis: Load the samples and run the gel in a native running buffer (e.g., Tris-Glycine Native Running Buffer) at a constant voltage, typically on ice or in a cold room to minimize denaturation [7]. The pH (8.3-9.5) ensures most proteins carry a net negative charge and migrate toward the anode [25].
- Detection: After electrophoresis, proteins can be visualized using stains like Coomassie Brilliant Blue. For functional analysis, activity stains can be applied directly to the gel, or proteins can be transferred to a membrane via western blotting under native conditions [28] [7].
Alternative Protocol: NativePAGE Bis-Tris System with Coomassie G-250
This system, based on Blue Native PAGE, is particularly useful for membrane proteins and complexes [25].
- Gel Preparation: Use pre-cast Bis-Tris gels at a near-neutral pH (e.g., 3-12% or 4-16% gradients).
- Sample Preparation: Dilute the protein sample in NativePAGE Sample Buffer. Add non-ionic detergent if needed and the NativePAGE 5% G-250 Additive, which contains the Coomassie dye [25].
- Electrophoresis: The cathode buffer contains Coomassie G-250 dye, which continuously binds to proteins during the run, imparting a negative charge and allowing even basic proteins (which would normally be positively charged) to migrate toward the anode [25].
- Post-Electrophoresis: For western blotting, use PVDF membranes, as nitrocellulose binds the Coomassie dye too tightly [25].
The following workflow diagram illustrates the key decision points and steps in a typical Native-PAGE experiment.
The Scientist's Toolkit: Essential Reagents for Native-PAGE
Successful Native-PAGE experiments require specific reagents tailored to preserve protein native state. The following table details key solutions and their functions.
Table 3: Essential Research Reagent Solutions for Native-PAGE
| Reagent / Solution | Function / Purpose | Key Considerations |
|---|---|---|
| Acrylamide/Bis-acrylamide Mix | Forms the porous gel matrix for size-based separation [7]. | Pore size is tuned by concentration (%T); higher % for smaller proteins [5] [26]. |
| Tris-Glycine Native Running Buffer | Conducts current and maintains alkaline pH for protein migration [25]. | Standard pH of 8.3-9.5 ensures most proteins are negatively charged [25]. |
| Native Sample Buffer (Tris-Glycine) | Stabilizes sample for loading; contains glycerol for density and a tracking dye [25]. | Lacks SDS and reducing agents like DTT or β-mercaptoethanol [26]. |
| Coomassie G-250 Dye (for BN-PAGE) | Binds proteins non-specifically, imparting negative charge while maintaining native state [25]. | Essential for running membrane proteins and proteins with basic pI in Bis-Tris systems [25]. |
| PVDF Membrane | Membrane for western blotting after NativePAGE Bis-Tris gels [25]. | Required because nitrocellulose binds Coomassie G-250 too tightly [25]. |
| APS (Ammonium Persulfate) & TEMED | Catalyze the polymerization of acrylamide to form the gel [7]. | Use fresh APS for complete and timely polymerization [29]. |
The selection of an appropriate electrophoresis method is critical for successful protein analysis. For researchers focused on functional studies—where the preservation of enzymatic activity, protein-protein interactions, and native structure is paramount—Native-PAGE and its advanced variants like NSDS-PAGE are indispensable tools. While SDS-PAGE remains the gold standard for determining molecular weight and assessing purity, its denaturing nature sacrifices functional information. Native techniques, particularly when leveraging the right buffer and dye systems, provide a unique window into the active world of proteins, bridging the gap between high-resolution separation and biologically relevant functional data. This makes them particularly valuable in drug discovery and biochemical research where understanding protein function in its native context is the ultimate goal.
Two-dimensional polyacrylamide gel electrophoresis (2D-PAGE) remains an indispensable tool in proteomics for separating complex protein mixtures. This technique provides unparalleled resolution by combining two orthogonal separation parameters: isoelectric point and molecular weight. Despite the emergence of liquid chromatography-mass spectrometry (LC-MS) platforms, 2D-PAGE maintains unique advantages for visualizing intact proteins, detecting post-translational modifications, and providing direct quantitative comparisons. This guide examines the technical aspects of maximizing 2D-PAGE resolution while objectively comparing its performance against alternative separation methodologies within the context of polyacrylamide versus agarose gel matrices.
In the post-genomic era, proteomics plays a vital role in biomedical research by directly analyzing the functional molecules within biological systems [30]. While genomic and transcriptomic data provide foundational information, they fail to reveal critical protein-level changes including post-translational modifications (PTMs) that directly control cellular activities [30]. Among separation techniques, two-dimensional polyacrylamide gel electrophoresis (2D-PAGE) represents a mainstay orthogonal approach for simultaneously fractionating, identifying, and quantifying proteins when coupled with mass spectrometric identification [31].
The resolving power of 2D-PAGE remains unsurpassed for proteomic analysis, capable of separating thousands of proteins in a single gel [32]. First introduced more than three decades ago, the technique has evolved significantly through methodological improvements while maintaining its fundamental principle of separating proteins based on independent physicochemical properties [31]. This guide explores the capabilities of 2D-PAGE for complex proteomic samples, provides detailed experimental protocols, and objectively compares its performance against alternative separation technologies.
Fundamental Principles of 2D-PAGE Separation
Core Separation Mechanism
2D-PAGE consists of two sequential separation steps that exploit different protein properties:
First Dimension - Isoelectric Focusing (IEF): Proteins are separated based on their isoelectric point (pI) under denaturing conditions. Proteins migrate through a pH gradient until they reach the position where their net charge is zero [33]. This separation occurs in immobilized pH gradient (IPG) strips containing covalently incorporated buffering side chains [34].
Second Dimension - SDS-PAGE: The focused proteins from the first dimension are further separated based on molecular weight using sodium dodecyl sulfate-polyacrylamide gel electrophoresis (SDS-PAGE) [33]. The SDS detergent denatures proteins and imparts a uniform negative charge, ensuring separation correlates with molecular mass [5].
The orthogonal separation principle ensures that proteins are resolved as distinct spots rather than the bands observed in one-dimensional electrophoresis [34]. This two-parameter separation provides significantly enhanced resolution compared to either method alone [31].
Theoretical Basis for High Resolution
The exceptional resolving power of 2D-PAGE stems from the statistical independence of the two separation parameters. It is highly improbable that different protein molecules share both identical isoelectric points and molecular weights [31]. This theoretical foundation enables the technique to resolve complex mixtures into hundreds to thousands of discrete protein spots [34]. In practice, a single 2D separation of a complex mixture such as a whole-cell or tissue extract typically produces 1,000-2,000 well-resolved spots when using sensitive detection methods [34].
Table 1: Key Performance Metrics of 2D-PAGE for Proteomic Analysis
| Performance Metric | Capability | Technical Considerations |
|---|---|---|
| Resolution Capacity | 5,000+ theoretical spots; 1,000-2,000 practical spots per gel [34] | Limited by protein abundance range and detection method sensitivity |
| Dynamic Range | 4-5 orders of magnitude | Limited by staining sensitivity; abundant proteins can mask low-abundance ones [31] |
| Molecular Weight Range | ~10-250 kDa | Effectiveness decreases for very large (>250 kDa) or very small (<10 kDa) proteins |
| pI Separation Range | Typically pH 3-10 | Narrow-range IPG strips (e.g., pH 4-7) enhance resolution for specific pI ranges [34] |
| Protein Load Capacity | Micrograms to milligrams | Varies with gel size; standard gels: 50μg-1mg; large-format: up to several mg [34] |
Figure 1: 2D-PAGE Workflow illustrating the sequential separation process combining isoelectric focusing (first dimension) and SDS-PAGE (second dimension)
Comparative Analysis: 2D-PAGE Versus Alternative Separation Matrices
Polyacrylamide Versus Agarose Gel Matrices
The choice between polyacrylamide and agarose gel matrices is fundamental to electrophoretic separation optimization. Each matrix possesses distinct structural and performance characteristics that determine their suitability for specific applications.
Table 2: Performance Comparison: Polyacrylamide vs. Agarose Gel Matrices
| Characteristic | Polyacrylamide Gel | Agarose Gel |
|---|---|---|
| Matrix Structure | Synthetic polymer of acrylamide and bis-acrylamide forming uniform, tunable pores [5] | Polysaccharide polymer from seaweed forming large, non-uniform pores [5] |
| Pore Size Control | Precise control via %T (total monomer) and %C (crosslinker) [5] | Limited control via agarose concentration (0.8-2%) [5] |
| Primary Applications | Protein separation (SDS-PAGE, Native PAGE), small nucleic acids (<1 kbp) [5] | Large nucleic acids (100 bp to 25+ kbp) [5] |
| Resolution Capability | High resolution for small molecules; can separate proteins differing by ~1 kDa [5] | Lower resolution; suitable for larger macromolecules [5] |
| Safety Considerations | Neurotoxic monomer requiring strict safety protocols [5] | Non-toxic; safer handling [5] |
| Preparation Complexity | Chemical polymerization requiring catalysts [5] | Simple melting and pouring [5] |
| Compatibility with 2D-PAGE | Ideal for both dimensions of 2D-PAGE | Not suitable for protein separation in 2D-PAGE |
2D-PAGE Versus Liquid Chromatography-MS Platforms
While gel-free proteomic approaches like shotgun LC-MS have gained popularity, 2D-PAGE maintains distinct advantages for specific applications:
Advantages of 2D-PAGE:
- Visual Mapping: Provides direct visual confirmation of protein expression changes and post-translational modifications through positional shifts [31]
- Intact Protein Analysis: Resolves full-length proteins, enabling study of proteoforms and isoforms [31]
- Post-translational Modification Detection: PTMs that alter charge or mass (phosphorylation, glycosylation) appear as characteristic spot shifts [31]
- Comparative Quantitation: Differential analysis through software or fluorescent labeling (DIGE) [31]
Limitations of 2D-PAGE:
- Throughput: Lower throughput compared to LC-MS approaches [30]
- Dynamic Range Limitations: High-abundance proteins can mask low-abundance species [31]
- Hydrophobic Protein Resolution: Difficulty resolving membrane and highly hydrophobic proteins [31]
- Extreme pI Proteins: Limited effectiveness for very acidic (pI <3.0) or basic (pI >8.0) proteins [34]
Experimental Protocols for Maximizing 2D-PAGE Resolution
First Dimension: Isoelectric Focusing with IPG Strips
Materials and Reagents:
- IPG Strips (appropriate pH range)
- Urea (ultrapure)
- CHAPS or Triton X-100 detergent
- Dithiothreitol (DTT) or tributylphosphine (TBP)
- IPG Buffer corresponding to strip pH range
- Rehydration buffer
Protocol [34]:
- Sample Preparation: Prepare protein extract in appropriate lysis buffer containing urea (8M), CHAPS (2-4%), carrier ampholytes, and reducing agent.
- IPG Strip Rehydration: Apply sample either by active rehydration (incorporating sample during strip rehydration) or cup loading (applying sample after rehydration).
- IEF Program: Run focused separation using stepwise voltage increments:
- Step 1: 150-300 V for 1-2 hours (removal of salts)
- Step 2: Gradient to 1000 V (1-2 hours)
- Step 3: Gradient to 5000-8000 V (2-4 hours)
- Step 4: Hold at 5000-8000 V until 30,000-50,000 Vhr total achieved
- Strip Storage: After IEF, strips can be stored at -80°C or processed directly for second dimension.
Critical Parameters for Optimization:
- pH Range Selection: Use wide-range IPG strips (pH 3-10) for initial analysis, then narrow-range strips (e.g., pH 4-7) for enhanced resolution [34]
- Sample Loading: Optimize protein load based on detection method (50-100 μg for silver stain; 200-500 μg for Coomassie)
- Voltage Programming: Gradually increase voltage to prevent protein precipitation and ensure proper focusing
Second Dimension: SDS-PAGE Separation
Materials and Reagents:
- Acrylamide/bis-acrylamide solution
- SDS-PAGE running buffer
- Equilibration buffer (urea, SDS, glycerol, Tris-HCl)
- Agarose sealing solution
Protocol [34]:
- IPG Strip Equilibration: Incubate focused IPG strips in equilibration buffer containing SDS and reducing agent (15-20 minutes).
- Gel Casting: Prepare uniform SDS-PAGE gels appropriate for protein size range:
- Standard format: 16-18 cm × 16-18 cm × 1 mm
- Large format: 20-25 cm × 20-25 cm × 1 mm for enhanced resolution
- Strip Transfer: Place equilibrated IPG strip onto SDS-PAGE gel and seal with agarose solution.
- Electrophoresis: Run at constant current or voltage with cooling:
- Initial: 10-15 mA/gel until tracking dye enters resolving gel
- Main separation: 20-40 mA/gel until dye front reaches bottom
Resolution Enhancement Strategies:
- Gel Size Selection: Larger format gels (e.g., 24 cm) provide superior resolution but require specialized equipment [31]
- Acrylamide Concentration: Gradient gels (e.g., 8-16%) enhance resolution across broad molecular weight ranges
- Running Conditions: Maintain constant temperature (15-20°C) to prevent diffusion-related spot broadening
Advanced Technical Considerations
The Scientist's Toolkit: Essential Research Reagents
Table 3: Essential Reagents for High-Resolution 2D-PAGE
| Reagent Category | Specific Examples | Function and Importance |
|---|---|---|
| Chaotropes | Urea, Thiourea | Disrupt hydrogen bonds to denature proteins and maintain solubility during IEF [34] |
| Detergents | CHAPS, Triton X-100, SB 3-10 | Solubilize hydrophobic proteins while maintaining compatibility with IEF [31] |
| Reducing Agents | DTT, DTE, TBP | Break disulfide bonds to ensure complete protein unfolding [34] |
| Carrier Ampholytes | IPG Buffers, soluble ampholytes | Establish and maintain pH gradient during IEF separation [34] |
| Staining Reagents | SYPRO Ruby, Deep Purple, Colloidal Coomassie | Detect separated proteins with high sensitivity and MS-compatibility [31] |
Troubleshooting Common Resolution Limitations
Problem: Horizontal Streaking
- Cause: Incomplete focusing, sample precipitation, or insufficient detergent
- Solution: Extend focusing time, increase detergent concentration, include thiourea (2M)
Problem: Vertical Streaking
- Cause: Improper equilibration or protein aggregation
- Solution: Optimize equilibration time, include fresh reducing agent
Problem: Low Spot Resolution
- Cause: Inappropriate pH range, excessive sample load, or poor transfer between dimensions
- Solution: Use narrow-range IPG strips, optimize protein load, ensure proper strip contact with second-dimension gel
Recent Methodological Advances
2D-Differential Gel Electrophoresis (2D-DIGE)
2D-DIGE represents a significant advancement that minimizes gel-to-gel variability through multiplex fluorescent labeling [31]. This technique involves labeling different protein samples with distinct cyanine dyes (Cy2, Cy3, Cy5), then pooling and separating them on the same 2D gel [30]. The internal standardization improves quantitative accuracy and statistical confidence in comparative proteomics [31].
Solubilization Enhancements for Challenging Proteins
Significant progress has been made in solubilizing membrane and hydrophobic proteins, traditionally problematic for 2D-PAGE. Novel detergent combinations including cationic benzyldimethyl-n-hexadecylammonium chloride and zwitterionic SB 3-10 have improved resolution of hydrophobic proteins with GRAVY index as low as 0.56 [31]. Additional advances include:
- Commercial IPG Strips: Enhanced reproducibility and ease of use [34]
- Sensitive Detection Methods: Fluorescent dyes (SYPRO Ruby) with detection limits below 1 ng [31]
- Integrated Workflows: Improved compatibility with mass spectrometric analysis [31]
Figure 2: 2D-DIGE Workflow showing multiplex fluorescent labeling of samples for enhanced quantitative comparison
Two-dimensional PAGE maintains a crucial position in the proteomics technology landscape, offering unparalleled resolution for complex protein mixtures. While mass spectrometry-based approaches excel in throughput and sensitivity for certain applications, 2D-PAGE provides unique capabilities for intact protein analysis, visual proteome mapping, and detection of post-translational modifications. The continued technical evolution of 2D-PAGE, particularly through advancements like 2D-DIGE and improved solubilization strategies, ensures its ongoing relevance in basic research, biomarker discovery, and drug development. For researchers requiring comprehensive analysis of complex proteomes, 2D-PAGE remains an indispensable tool when applied with appropriate technical expertise and understanding of both its capabilities and limitations.
Within the framework of evaluating polyacrylamide gel versus agarose gel for protein separation, it is crucial to recognize that agarose gels are typically unsuitable for resolving most proteins due to their large pore sizes. Polyacrylamide gel electrophoresis (PAGE) is the established method for high-resolution protein separation, primarily due to the controllable, small pore sizes of polyacrylamide matrices. Within this domain, native PAGE techniques represent a sophisticated branch designed to preserve protein complexes in their functional, folded states. Among these, Blue-Native (BN-) and Clear-Native (CN-) PAGE have emerged as preeminent techniques for the analysis of multi-subunit protein complexes, particularly those embedded in membranes [35] [36]. Originally developed by Hermann Schägger in the 1990s, BN-PAGE has become an indispensable tool in the functional proteomics toolkit, enabling researchers to dissect the assembly, stoichiometry, and interactions of intricate cellular machinery [35] [37]. This guide provides an objective comparison of these two powerful techniques, detailing their protocols, applications, and performance to inform method selection for researchers and drug development professionals.
Fundamental Principles and Key Distinctions
Both BN-PAGE and CN-PAGE are microscale techniques for the isolation of membrane protein complexes under native conditions, preserving their quaternary structure and biological activity [35] [38]. This stands in stark contrast to denaturing techniques like SDS-PAGE, which dismantle complexes into individual polypeptide subunits. The core difference between BN- and CN-PAGE lies in the method used to impose a charge shift on hydrophobic membrane proteins, thereby ensuring their solubility and migration towards the anode during electrophoresis.
BN-PAGE utilizes the anionic dye Coomassie Blue G-250, which binds non-covalently to the surface of hydrophobic proteins. This binding provides a uniform negative charge, driving electrophoretic migration and preventing protein aggregation [35] [39]. CN-PAGE, specifically the high-resolution clear-native electrophoresis (hrCN-PAGE) variant, replaces the blue dye with non-colored mixtures of anionic and neutral detergents in the cathode buffer. These mixed micelles similarly impose a charge shift to enhance protein solubility and anodic migration without the colored dye [38].
Table 1: Core Principles and Characteristics of BN-PAGE and CN-PAGE
| Feature | BN-PAGE | CN-PAGE |
|---|---|---|
| Primary Charge-Shift Agent | Coomassie Blue G-250 dye [35] | Mixtures of anionic and neutral detergents [38] |
| Gel Appearance During Run | Blue | Clear |
| Key Advantage | Superior resolution and reduced protein aggregation; robust for western blot analysis [35] | No dye interference for in-gel activity assays or fluorescence studies [35] [38] |
| Key Disadvantage | Dye can interfere with downstream in-gel activity stains and fluorescence detection [38] | Can suffer from enhanced protein aggregation and band broadening in its basic form [38] |
| Ideal for Western Blot | Excellent [35] | Compatible |
| Ideal for In-Gel Activity | Limited by dye interference [38] | Superior [35] [38] [40] |
Experimental Protocols and Workflow
The following protocols, validated by Aref et al. (2025), outline the core steps for analyzing mitochondrial oxidative phosphorylation (OXPHOS) complexes, a common application for these techniques [35] [41] [37]. The workflow can be adapted for other membrane protein complexes.
Core Experimental Workflow
The general procedure for both BN- and CN-PAGE involves sample preparation, native gel electrophoresis, and downstream analysis. A key distinction is the choice of detergent for solubilization, which determines whether individual complexes or supercomplexes are resolved.
Detailed Methodologies
Sample Preparation
This shortened extraction procedure is optimized for small patient samples [35] [37].
- Solubilization: Resuspend a pellet containing mitochondria (e.g., from 0.4 mg of sedimented mitochondria) in 40 µL of a buffer containing 0.75 M 6-aminocaproic acid and 50 mM Bis-Tris, pH 7.0, supplemented with protease inhibitors [39].
- Detergent Addition: Add 7.5 µL of 10% n-dodecyl-β-D-maltoside (for individual complexes) or digitonin (for preserving supercomplexes) [35]. Mix and incubate on ice for 30 minutes.
- Clarification: Centrifuge at high speed (e.g., 72,000 x g for 30 minutes, or ~16,000 x g in a microcentrifuge) to remove insoluble material. Collect the supernatant [39].
- Sample Loading Preparation: Add 2.5 µL of a 5% Coomassie Blue G-250 solution in 0.5 M aminocaproic acid to the supernatant for BN-PAGE only. For CN-PAGE, no dye is added to the sample [35] [38].
Native Gel Electrophoresis
- Gel Casting: Manually cast a linear gradient native polyacrylamide gel (e.g., 4–16% or 3–12%) using the Mini-Protean Tetra system. A gradient gel improves resolution across a wide molecular weight range [35] [39]. Commercial pre-cast gels are also available.
- Electrophoresis Conditions:
- BN-PAGE Cathode Buffer: 50 mM Tricine, 15 mM Bis-Tris, 0.02% Coomassie Blue G-250, pH 7.0 [39].
- CN-PAGE Cathode Buffer: Contains mixtures of anionic and neutral detergents instead of Coomassie dye [38].
- Anode Buffer (both): 50 mM Bis-Tris, pH 7.0 [39].
- Run the gel at constant voltage (e.g., 150 V) for approximately 2 hours, or until the dye front approaches the bottom of the gel [39].
Downstream Applications
- In-Gel Activity Staining: For CN-PAGE gels, catalytic activity of complexes like Complex I, II, IV, and V can be visualized directly in the gel using histochemical staining methods that form colored precipitates [35] [38] [40]. The absence of Coomassie dye prevents interference.
- Western Blot Analysis: The resolved complexes can be transferred to a PVDF membrane for immunodetection with specific antibodies. BN-PAGE is excellent for this application [35] [39].
- Two-Dimensional Electrophoresis (2D BN/SDS-PAGE): A lane from the first-dimension BN/CN-PAGE gel is excised, soaked in SDS buffer, and placed on top of an SDS-PAGE gel. This separates the complexes into their individual protein subunits, revealing composition and stoichiometry [35] [42] [39].
Comparative Performance and Experimental Data
The choice between BN-PAGE and CN-PAGE significantly impacts the quality and type of data obtained from downstream applications. The following table synthesizes performance data from key studies.
Table 2: Comparative Performance in Key Downstream Applications
| Application / Metric | BN-PAGE Performance | CN-PAGE Performance | Supporting Experimental Data |
|---|---|---|---|
| Resolution of Complexes | High-resolution separation of individual OXPHOS complexes and supercomplexes [35] | High-resolution comparable to BN-PAGE when using mixed detergents (hrCN-PAGE) [38] | Validation on A549, HEK293T, and fibroblast cell lines showing distinct bands for Complexes I-V and supercomplexes [35] [41] |
| In-Gel Activity Staining | Dye interferes with colorimetric detection; less sensitive [35] [38] | Superior; no dye interference markedly improves sensitivity [35] [38] [40] | Linear correlation (R² >0.99) between protein amount and in-gel activity for MCAD tetramers using hrCN-PAGE [40]. Enhanced Complex V staining with protocol modification [35] |
| Fluorescence Detection | Coomassie dye quenches fluorescence, making detection impossible [38] | Enables in-gel detection of fluorescently labeled proteins and complexes [38] | Direct visualization of fluorescent protein tags and reactive dye-labeled membrane complexes within the gel matrix [38] |
| Complex III Activity | No established in-gel activity stain [35] [37] | First in-gel histochemical staining protocol for respiratory complex III demonstrated [38] | Functional assay for Complex III developed specifically for hrCN-PAGE, a capability not available with BN-PAGE [38] |
Essential Research Reagent Solutions
Successful execution of BN- and CN-PAGE relies on specific reagents that maintain the integrity of native complexes.
Table 3: Key Reagents for BN-PAGE and CN-PAGE Protocols
| Reagent | Function | Key Consideration |
|---|---|---|
| n-Dodecyl-β-D-maltoside (DDM) | Mild, non-ionic detergent for solubilizing membrane proteins while keeping individual complexes intact [35] [39] | Ideal for resolving individual OXPHOS complexes (I-V) [35] |
| Digitonin | Very mild, non-ionic detergent for gentle membrane solubilization [35] | Preserves weaker interactions, allowing analysis of supercomplexes (e.g., respirasomes) [35] [43] |
| Coomassie Blue G-250 | Anionic dye that binds proteins, providing charge for electrophoresis and preventing aggregation [35] [39] | Used exclusively in BN-PAGE. Critical for performance but interferes with some downstream assays [38] |
| 6-Aminocaproic Acid | Zwitterionic salt; provides ionic strength but zero net charge at pH 7.0 to support solubilization without affecting electrophoresis [35] | Replaces NaCl in buffers to maintain native conditions [35] |
| Bis-Tris | Buffer compound used in gel and anode buffers at pH 7.0 [39] | Provides a suitable pH environment for native protein separation [35] |
| Protease Inhibitors (e.g., PMSF) | Prevents proteolytic degradation of protein complexes during extraction [39] | Essential for obtaining intact complexes and accurate representation of the complexome |
BN-PAGE and CN-PAGE are complementary, high-resolution techniques within the native PAGE arsenal. BN-PAGE remains the gold standard for high-resolution separation and western blot analysis of protein complexes, while CN-PAGE is unequivocally superior for functional assays, including in-gel catalytic activity measurements and fluorescence studies. The recent validation of optimized protocols confirms that both methods are robust, semi-quantitative, and reproducible [35] [37]. The choice between them should be guided by the specific research question: BN-PAGE for structural and compositional analysis, and CN-PAGE for functional proteomics. As the field of proteomics continues to evolve toward more quantitative and functional analyses, the role of CN-PAGE, with its unique advantages for activity-based profiling, is likely to expand significantly.
In the realm of protein research utilizing polyacrylamide gel electrophoresis (PAGE), the choice of buffer system is a critical determinant for successful separation, resolution, and accurate analysis of protein samples. While polyacrylamide gels provide the molecular sieve through which proteins separate based on size, the buffer system establishes the chemical environment that governs this process [7]. This guide focuses on the objective comparison between the traditional Tris-glycine buffer system and modern alternatives such as Tris-tricine, Tris-acetate, and composite buffers. For researchers, scientists, and drug development professionals, selecting the appropriate buffer system is paramount for obtaining reliable, reproducible results in applications ranging from routine protein analysis to the characterization of complex biopharmaceuticals like monoclonal antibodies [44].
The fundamental principle of PAGE relies on creating a discontinuous system where ions in the gel and running buffers form moving boundaries that stack proteins into sharp bands before they enter the resolving gel. In the traditional Tris-glycine system described by Laemmli, chloride ions act as the fast-moving "leading" ion, while glycinate ions serve as the slow-moving "trailing" ion in the stacking gel [45] [7]. Proteins, having an intermediate mobility, are concentrated into a narrow zone between these ionic fronts. While this system has been the gold standard for decades, its limitations in resolving extreme molecular weight ranges have driven the development of alternative formulations that offer superior performance for specific applications [45] [44].
The Separation Mechanism: How Buffer Chemistry Governs Protein Migration
The electrophoretic separation of proteins is governed by the complex interplay between ions in the buffer system. Understanding this mechanism is crucial for selecting the appropriate buffer for a given application.
The Traditional Tris-Glycine System
In the classic Tris-glycine discontinuous buffer system for SDS-PAGE, three primary ions interact to achieve protein separation [46] [7]:
- Chloride ions (-), supplied by the gel buffer, serve as the leading ion due to their high electrophoretic mobility and strong attraction to the anode.
- Glycine ions (-), the primary anion provided by the running buffer, function as the trailing ion because they are only partially negatively charged at the stacking gel pH (6.8).
- Tris base (+) is a common cation present in both the gel and running buffers, providing the conductive medium.
During electrophoresis, these ions establish an operating pH of 9.5 in the separating region of the gel [46]. The system relies on the differential mobility of chloride and glycinate ions across the different pH environments of the stacking and resolving gels. This difference creates a moving boundary that concentrates protein samples into sharp bands before they enter the resolving gel, where separation primarily by molecular weight occurs [7].
Advanced Multi-Ion Buffer Systems
Modern buffer formulations have introduced more complex ionic arrangements to overcome the limitations of the traditional system. The Tris-Tricine-HEPES buffer utilizes multiple ionic boundaries to enhance separation capabilities [45]. In this system:
- Chloride remains the fastest running anion (leading ion).
- Tricine ions exhibit intermediate mobility.
- HEPES ions migrate more slowly than Tricine.
- Protein ions travel slowest of all, following the other anions.
This creates three distinct moving boundaries throughout the gel (Chloride > Tricine ion > HEPES ion > protein ions), significantly improving the resolving power compared to the two-boundary system of Tris-glycine buffers [45]. The different pKa values of Tricine (7.4–8.8) and HEPES (6.8–8.2) cover the entire pH range of both stacking and resolving gels, creating a vertical pH gradient that confers differential mobilities to these anions along the separation path.
The following diagram illustrates the key differences in separation mechanisms between traditional and advanced buffer systems:
Comparative Analysis of Buffer System Performance
Separation Range and Resolution
Different buffer systems exhibit distinct performance characteristics in resolving proteins across the molecular weight spectrum. The table below summarizes the key separation capabilities of each buffer system:
Table 1: Separation Range and Resolution Characteristics of PAGE Buffer Systems
| Buffer System | Effective Separation Range | Small Protein Resolution (<15 kDa) | Large Protein Resolution (>150 kDa) | Key Advantages |
|---|---|---|---|---|
| Tris-Glycine | 8-250 kDa [46] | Poor [45] | Good up to 250 kDa [46] | Low cost, well-established protocol [45] |
| Tris-Tricine | 1-100 kDa [45] | Excellent [45] | Poor above 100 kDa [45] | Superior resolution of small proteins [47] [45] |
| Tris-Acetate | 15-450 kDa [45] | Moderate (improved over Tris-Glycine) | Excellent [45] | Better for large proteins and complexes [45] [44] |
| Tris-Tricine-HEPES (FRB) | 15-450 kDa [45] | Excellent | Excellent | Wide-range separation in single gel [45] |
As evidenced by the data, modern buffer formulations address specific limitations of the traditional Tris-glycine system. While Tris-glycine provides adequate separation for standard molecular weight ranges (8-250 kDa) [46], it demonstrates poor resolution of small proteins (<15 kDa) even when using higher percentage acrylamide gels [45]. The Tris-tricine system, developed specifically to address this limitation, provides excellent resolution of low molecular weight proteins but cannot simultaneously resolve both small (<15 kDa) and large (>100 kDa) proteins in the same gel [45].
For comprehensive proteomic analyses requiring broad separation ranges, the Tris-Tricine-HEPES fast-running buffer (FRB) enables gradient-like simultaneous separation of both small (<10 kDa) and large (>400 kDa) proteins in a single percentage polyacrylamide gel [45]. This composite buffer system represents a significant advancement for researchers needing to analyze complex protein mixtures with diverse molecular weights.
Analysis Speed and Throughput Considerations
The duration of electrophoretic separation represents a critical factor in high-throughput laboratory environments. Traditional buffer systems require extended run times—at least 1 hour for Tris-glycine and up to 5 hours for Tris-tricine systems [45]. Attempting to accelerate these processes by increasing voltage typically results in excessive Joule heating, which can compromise gel integrity and protein resolution.
The novel Tris-Tricine-HEPES buffer significantly reduces running time to approximately 35 minutes (150 V for 15 min followed by 200 V for 20 min) without generating excessive heat [45]. This represents a substantial improvement in throughput for applications requiring frequent protein analysis, such as quality control in biopharmaceutical development or proteomic screening.
Application-Specific Performance
Different research applications demand specific performance characteristics from electrophoresis buffer systems:
Serum Protein Analysis: For separation of major serum proteins in native-PAGE, a modified Tris-tricine system demonstrated superior performance compared to traditional Tris-glycine and Tris-barbital buffer systems [47]. This modified system proved effective on both native polyacrylamide gels and cellulose acetate membranes.
Monoclonal Antibody Characterization: In the analysis of IgG1 and IgG2 monoclonal antibodies, a Tris-acetate buffer system provided sharper bands, more accurate molecular weight determination, higher resolution, and better estimation of sub-fragments compared to Tris-glycine [44]. The results obtained with Tris-acetate SDS-PAGE showed closer correlation with capillary gel electrophoresis, an important consideration for biopharmaceutical quality control.
Cell Lysate Analysis: For complex protein mixtures such as cell lysates, Tris-glycine gels with WedgeWell formats demonstrate excellent resolution and capacity to handle higher protein and lysis buffer loads without streaking or smearing [46]. This performance advantage is particularly evident when comparing commercial Tris-glycine gels against competitors' formulations at protein loads above 20-24 μg.
Experimental Protocols and Methodologies
Standard Tris-Glycine SDS-PAGE Protocol
The traditional discontinuous SDS-PAGE using Tris-glycine buffers remains a fundamental technique in most laboratories. Below is a standardized protocol based on current methodologies:
Table 2: Standard Protocol for Tris-Glycine SDS-PAGE
| Step | Component | Specifications | Purpose |
|---|---|---|---|
| Gel Preparation | Resolving Gel | 30% Acrylamide/Bis Solution 37.5:1, 1.5 M Tris-HCl (pH 8.8), 10% APS, 10% SDS, TEMED [7] | Protein separation by molecular weight |
| Stacking Gel | 5% acrylamide, Tris-HCl (pH 6.8) [7] | Sample concentration before separation | |
| Sample Preparation | Sample Buffer | Novex Tris-Glycine SDS Sample Buffer [46] | Protein denaturation and charging |
| Denaturation | Heat at 70-100°C for 3-5 minutes [7] | Complete protein denaturation | |
| Electrophoresis | Running Buffer | 25 mM Tris, 192 mM glycine, 0.1% SDS, pH 8.3 [45] [46] | Conduct current and maintain pH |
| Conditions | Constant voltage (100-150 V) for 60-90 minutes [45] | Optimal protein separation |
Tris-Tricine-HEPES Fast-Running Buffer Protocol
For researchers requiring rapid separation across a broad molecular weight range, the Tris-Tricine-HEPES fast-running buffer (FRB) protocol offers significant advantages:
Gel Casting: Prepare polyacrylamide gels of various concentrations (8%, 10%, 15%) using standard protocols [45]. The resolving gel contains 30% Acrylamide/Bis Solution 37.5:1 in appropriate buffer systems, while the stacking gel consists of 5% polyacrylamide.
Running Buffer Preparation: Prepare the novel running buffer containing Tris, Tricine, and HEPES. Systematic variation of HEPES concentrations (25, 50, 75, and 100 mM) achieves a final pH in the range of 7.5-8 without further pH adjustment [45].
Electrophoresis Conditions: Run gels using pre-set "fast run" conditions: 150 V for 15 minutes followed by 200 V for 20 minutes (total running time of 35 minutes) [45].
Downstream Applications: Transfer separated proteins to membranes for western blotting using standard protocols. The FRB system maintains compatibility with standard western blotting techniques [45].
Tris-Acetate Protocol for Monoclonal Antibodies
For characterization of monoclonal antibodies, the Tris-acetate system provides superior results:
Gel Preparation: Use 6-20% gradient gels with Tris-acetate buffer system instead of Tris-glycine [44].
Running Buffer: Prepare modified Tris-acetate running buffer as specified in commercial formulations or published protocols [45] [44].
Electrophoresis: Run under standard conditions comparable to Tris-glycine systems but with improved resolution of antibody fragments [44].
Analysis: Compare results with capillary gel electrophoresis for validation [44].
Essential Research Reagent Solutions
Successful protein separation requires specific laboratory reagents and materials. The following table outlines key solutions for implementing the buffer systems discussed in this guide:
Table 3: Essential Research Reagents for Protein Electrophoresis
| Reagent/Material | Function | Application Notes |
|---|---|---|
| Acrylamide/Bis Solution | Forms polyacrylamide gel matrix | Standard 37.5:1 ratio for optimal crosslinking [7] |
| Tris Base | Common cation in buffer systems | Provides buffering capacity in both gel and running buffers [46] [7] |
| Glycine | Trailing ion in traditional systems | Only partially charged at stacking gel pH (6.8) [7] |
| Tricine | Trailing ion in alternative systems | Improved resolution of low molecular weight proteins [47] [45] |
| HEPES | Composite buffer component | Expands separation range in FRB system [45] |
| SDS (Sodium Dodecyl Sulfate) | Protein denaturant | Confers uniform negative charge (1.4g SDS:1g protein) [7] |
| APS (Ammonium Persulfate) | Polymerization initiator | Forms free radicals for acrylamide crosslinking [7] |
| TEMED | Polymerization catalyst | Accelerates gel formation [7] |
| Precast Gels | Ready-to-use separation matrix | Commercial options available for all buffer systems [46] |
The optimal choice of buffer system for polyacrylamide gel electrophoresis depends primarily on the specific research requirements and protein characteristics. Tris-glycine buffers remain a cost-effective and reliable choice for routine separation of proteins within the 8-250 kDa range, particularly for standard western blotting and protein analysis workflows [46]. However, for specialized applications, alternative buffer systems offer significant advantages.
For comprehensive proteomic analyses requiring resolution of both small and large proteins in a single gel, the Tris-Tricine-HEPES fast-running buffer provides unparalleled performance with reduced run times [45]. For research focused on low molecular weight proteins (<15 kDa), Tris-tricine systems deliver superior resolution, while Tris-acetate buffers excel in separating large proteins and complexes, particularly for monoclonal antibody characterization [45] [44].
When selecting a buffer system, researchers should consider the specific molecular weight range of interest, required resolution, throughput needs, and downstream applications. As electrophoretic methodologies continue to advance, these buffer formulations provide powerful tools for unraveling the complexities of proteomes in basic research and drug development.
In the realm of protein research and drug development, gel electrophoresis stands as a cornerstone technique for separating and analyzing complex protein mixtures. The fidelity of this separation hinges on a critical choice: selecting the appropriate sieving matrix to resolve target proteins based on their molecular size. Within the broader context of polyacrylamide gel versus agarose gel research, it is well-established that polyacrylamide gels are the unequivocal matrix for protein separation, offering a tunable pore structure that can be optimized for high-resolution analysis. Agarose gels, formed from polysaccharide chains with large, non-uniform pores, are excellent for separating large nucleic acids but lack the resolving power required for most proteins, which are considerably smaller [5] [48]. This guide provides a detailed comparison of how gel percentage and gradient techniques optimize the sieving range of polyacrylamide gels, enabling researchers to make informed decisions that enhance the precision and reliability of their protein data.
Fundamental Principles of Polyacrylamide Gel Separation
Polyacrylamide gels are synthetic matrices formed through the co-polymerization of acrylamide and N,N'-methylenebisacrylamide (bis-acrylamide). The acrylamide forms linear chains, while bis-acrylamide acts as a cross-linker, creating a three-dimensional mesh with highly uniform pores [5]. The sieving properties of this mesh are precisely controlled by two parameters: the total monomer concentration (%T) and the cross-linker ratio (%C). A higher %T results in a denser matrix with smaller pores, which is optimal for resolving smaller proteins, while a lower %T creates larger pores for separating larger proteins [5] [49].
The most common form of protein electrophoresis is Sodium Dodecyl Sulfate-Polyacrylamide Gel Electrophoresis (SDS-PAGE). The SDS detergent denatures proteins and imparts a uniform negative charge, ensuring that separation occurs primarily based on polypeptide chain length rather than native charge or shape [5]. For specialized applications requiring the separation of very small proteins (1-100 kDa) or peptides, Tricine-SDS-PAGE systems are often employed, as they provide superior resolution in the lower molecular weight range compared to traditional glycine-based systems [50].
Optimizing Sieving Range: Gel Percentage and Resolution
The concentration of the polyacrylamide gel is the primary factor determining its effective separation range. Selecting the correct percentage is crucial for achieving optimal resolution of your target proteins.
Table 1: Optimizing Polyacrylamide Gel Percentage for Protein Separation
| Gel Percentage (%T) | Effective Separation Range for Proteins | Common Applications and Notes |
|---|---|---|
| 6-8% | 50 - 200 kDa | Ideal for resolving very large protein complexes and polypeptides [49]. |
| 10% | 20 - 100 kDa | A standard, versatile concentration for a broad range of proteins [49]. |
| 12% | 10 - 60 kDa | Suitable for many common cellular proteins; provides high resolution for medium-sized proteins [49]. |
| 15% | 5 - 45 kDa | Optimal for resolving smaller peptides and proteins [49]. |
For the highest resolution, SDS-PAGE is typically performed using a discontinuous gel system composed of two layers: a low-percentage stacking gel (e.g., 4%) that concentrates all protein samples into a sharp starting band, and a higher-percentage resolving gel (e.g., 10-15%) where the actual size-based separation occurs [49]. This dual-layer system is fundamental to achieving the sharp bands characteristic of high-quality protein electrophoresis.
Advanced Optimization: The Power of Gradient Gels
While single-percentage gels are effective for many applications, polyacrylamide gradient gels represent a powerful tool for resolving complex protein mixtures with a wide molecular weight distribution. A gradient gel has a pore size that continuously decreases (and acrylamide concentration that increases) from the top to the bottom of the gel.
This architecture offers three key advantages [49] [51]:
- Broader Resolution Range: A single gradient gel (e.g., 4-15% or 5-20%) can resolve proteins across a much wider size spectrum than a fixed-percentage gel, eliminating the need to run multiple gels [51].
- Sharper Band Focus: As proteins migrate, they progressively encounter smaller pores, which slows and "focuses" each protein band at its respective pore size limit, leading to sharper bands [49] [51].
- Enhanced Separation of Similar Sizes: The focusing effect improves the separation of proteins with very similar molecular weights [51].
Table 2: Comparative Analysis of Fixed vs. Gradient Gel Electrophoresis
| Feature | Fixed-Percentage Gel | Gradient Gel |
|---|---|---|
| Pore Structure | Uniform throughout the gel | Continuously changing pore size |
| Optimal Resolution Range | Narrow, centered on a specific size | Very broad, from small to large proteins |
| Band Sharpness | Good | Superior, due to the focusing effect |
| Ease of Preparation | Simple | More complex, requires a pouring gradient |
| Ideal Use Case | Routine analysis of proteins within a known, limited size range | Analysis of complex, unknown, or widely distributed samples; high-resolution applications |
A simplified method for creating customizable gradient gels without specialized mixing equipment has been demonstrated, where a broad-range molecular weight marker and HEK293 cell lysate separated on a hand-poured 4-15% gradient gel showed resolution comparable to a commercial pre-cast gel [51].
Experimental Protocols for Gel Preparation and Electrophoresis
Protocol 1: Standard SDS-PAGE with a Fixed-Percentage Resolving Gel
This is a foundational protocol for protein separation [5] [49].
Gel Casting:
- Resolving Gel: Prepare the chosen acrylamide percentage (e.g., 12%) in Tris-HCl buffer (pH ~8.8) with 0.1% SDS. Add catalysts Ammonium Persulfate (APS) and Tetramethylethylenediamine (TEMED) to initiate polymerization. Pour the solution and overlay with water or alcohol to ensure a flat interface.
- Stacking Gel: After polymerization of the resolving gel, prepare a low-percentage gel (e.g., 4%) in Tris-HCl buffer (pH ~6.8) with 0.1% SDS. Add APS and TEMED, pour over the resolving gel, and insert a comb.
Sample Preparation: Mix protein samples with an SDS-containing loading dye. Heat denature at 95-100°C for 5 minutes to fully denature the proteins.
Electrophoresis: Load samples into the wells. Run the gel in a Tris-Glycine-SDS running buffer at a constant voltage. Typical settings are 80-100 V during the stacking phase and 120-150 V during the resolving phase, until the dye front reaches the bottom of the gel.
Protocol 2: Customizable Linear Gradient Gel Preparation
This protocol adapts a simplified method for creating gradient gels without a gradient mixer [51].
- Solution Preparation: Prepare two solutions: a "Low" % acrylamide solution (e.g., 4%) and a "High" % acrylamide solution (e.g., 15%), each containing the appropriate buffer and SDS.
- Sequential Pouring: First, pipette the higher density (higher %) solution into the gel cassette. Then, slowly pipette the lower density (lower %) solution on top. The diffusion at the interface between the two layers over 5-10 minutes creates an adequate linear gradient.
- Polymerization: After allowing the gradient to form, add APS and TEMED to the entire cassette to polymerize the gel. A stacking gel is then cast on top as in Protocol 1.
- Electrophoresis: The gel is run similarly to a fixed-percentage gel, but often at lower initial voltages to allow for proper protein entry into the gradient.
The Scientist's Toolkit: Essential Reagents for PAGE
Table 3: Key Research Reagent Solutions for Polyacrylamide Gel Electrophoresis
| Reagent / Material | Function and Role in Separation | Safety and Handling Notes |
|---|---|---|
| Acrylamide/Bis-acrylamide | The monomer and cross-linker that form the porous gel matrix. The ratio determines pore size and gel properties. | Potent neurotoxin in monomeric form. Wear gloves, mask, and a lab coat when handling powder [5] [29]. |
| Ammonium Persulfate (APS) | A catalyst that generates free radicals to initiate the polymerization reaction. | Use fresh aliquots; old APS may lead to incomplete polymerization [29]. |
| TEMED | A catalyst that stabilizes free radicals and accelerates the polymerization process. | --- |
| SDS (Sodium Dodecyl Sulfate) | A detergent that denatures proteins and confers a uniform negative charge, enabling separation by size alone [5]. | --- |
| Tricine Buffer | A trailing ion used in Tris-Tricine-SDS-PAGE for superior resolution of low molecular weight proteins (1-100 kDa) [50]. | --- |
| Pre-cast Gels | Commercially available gels of fixed or gradient composition. | Offer convenience and reproducibility while minimizing exposure to toxic acrylamide monomers [29]. |
The optimization of gel percentage and the strategic use of gradient gels are fundamental to unlocking the full potential of polyacrylamide gel electrophoresis for protein analysis. While fixed-percentage gels provide a straightforward solution for routine separations within a predictable size range, gradient gels offer unparalleled resolution for complex and unknown samples. The choice between these two approaches should be guided by the specific experimental needs: the molecular weight range of the target proteins, the required resolution, and the complexity of the protein mixture. By applying the principles and protocols outlined in this guide, researchers and drug development professionals can strategically optimize the sieving range of their electrophoresis experiments, thereby generating more reliable, reproducible, and high-quality data that drives scientific discovery forward.
Troubleshooting and Optimization: Achieving Sharp Bands and Reproducible Results
In protein separation research, the choice between polyacrylamide and agarose gel electrophoresis is foundational to experimental success. While polyacrylamide gels are the standard for protein separation due to their small, uniform pore sizes enabling high-resolution separation of polypeptides, agarose gels are typically reserved for large proteins, protein complexes, or native state analyses [5] [10]. This comparison guide objectively evaluates their performance in preventing the most common artifacts—smeared bands, streaking, and smiling effects—that plague protein research. A nuanced understanding of these matrices allows researchers to optimize their protocols, ensuring data integrity and accelerating discovery in drug development.
Gel Matrix Comparison: Polyacrylamide vs. Agarose for Protein Separation
The table below summarizes the core characteristics of each gel type relevant to protein separation workflows.
Table 1: Characteristics of Polyacrylamide vs. Agarose Gels for Protein Separation
| Feature | Polyacrylamide Gel (PAG) | Agarose Gel (AG) |
|---|---|---|
| Primary Application | High-resolution separation of proteins and small nucleic acids (SDS-PAGE, Native PAGE) [5] | Separation of large nucleic acids; large proteins, protein complexes, or antibodies in native states [5] [10] |
| Typical Pore Size | Small, uniform, and highly tunable [5] | Large and non-uniform [5] |
| Resolution Capacity | High; can separate proteins differing by a few thousand Daltons [5] | Lower; suitable for larger size differences [5] |
| Toxicity & Handling | Neurotoxic monomer (acrylamide) requires strict safety protocols [5] | Non-toxic; safer and easier to handle [5] |
| Typical Artifact Profile | Prone to smiling, smearing, and edge effects under suboptimal conditions [52] | Less common for proteins; potential for smearing and diffusion due to large pores |
Troubleshooting Common Artifacts in Polyacrylamide Gels
For polyacrylamide gel electrophoresis (PAGE), particularly SDS-PAGE, specific artifacts can compromise data interpretation. The following section details their causes and solutions, with a focus on experimental protocols for mitigation.
Smeared Bands
Smeared bands appear as blurry, diffused streaks rather than sharp, distinct bands, hindering accurate analysis.
Table 2: Troubleshooting Smeared Bands in SDS-PAGE
| Cause | Recommended Solution | Experimental Protocol Insight |
|---|---|---|
| High Voltage / Heat | Run gel at 10-15 V/cm or lower voltage for longer time [52]. | Excessive heat denatures proteins unpredictably. Monitor buffer temperature; run in a cold room or with ice packs [52]. |
| Sample Overloading | Load 0.1–0.2 μg of protein per mm of well width [53]. | Overloading exceeds the gel's separation capacity. Pre-determine protein concentration before loading. |
| Sample Degradation | Use fresh protease inhibitors; maintain samples on ice [53]. | Degradation creates a heterogeneous mixture of protein fragments. |
| Improper Buffer | Ensure running buffer is correctly prepared and has adequate buffering capacity [52] [53]. | Exhausted or incorrect buffer ions disrupt uniform charge and migration. |
Smiling Effects
The "smiling" effect, where bands curve upwards at the edges, is caused by uneven heat distribution across the gel.
Table 3: Troubleshooting Smiling Effects in SDS-PAGE
| Cause | Recommended Solution | Experimental Protocol Insight |
|---|---|---|
| Excessive Heat Generation | Run gel at lower voltage for a longer duration [52]. | The center of the gel becomes warmer than the edges, causing faster migration in the center. |
| Inadequate Cooling | Use a cooling apparatus, run in a cold room, or place ice packs in the tank [52]. | Active cooling is essential for maintaining even temperature. Ensure circulating coolant is pre-chilled. |
Improper Separation and Streaking
Poorly resolved or distorted bands, including vertical streaking, indicate issues with sample integrity or gel composition.
Table 4: Troubleshooting Improper Separation and Streaking
| Cause | Recommended Solution | Experimental Protocol Insight |
|---|---|---|
| Incomplete Denaturation | Ensure sample buffer contains sufficient SDS and reducing agent (e.g., DTT); heat samples at 95°C for 5-10 minutes [53]. | Proteins must be fully linearized and uniformly charged. |
| Poor Well Integrity | Use clean, undamaged combs; avoid pushing comb to bottom of cassette; remove comb carefully after polymerization [53]. | Poorly formed wells cause sample leakage and distorted bands. |
| Edge Effect | Load all wells with sample or protein ladder; do not leave peripheral wells empty [52]. | Empty edge lanes alter the electric field, distorting migration in adjacent lanes. |
| Incorrect Gel Percentage | Use lower acrylamide percentage for high molecular weight proteins; optimize concentration for target protein size [52]. | A gel that is too dense will not resolve large proteins; one that is too loose will not resolve small proteins. |
Diagram 1: A troubleshooting workflow for common gel artifacts, outlining initial diagnostic steps.
Experimental Data: High-Concentration Agarose as an Emerging Alternative
Recent investigations challenge the conventional application boundaries of agarose gels. A 2023 study demonstrated that high-concentration agarose gels (HAGs) up to 14% could be prepared using an autoclave, enabling high-resolution separation of both low-molecular-weight nucleic acids and proteins [10].
Table 5: Experimental Performance of High-Concentration Agarose Gels (HAGs)
| Parameter | Performance Metric | Experimental Condition |
|---|---|---|
| Protein Separation Range | Good resolution in the 10–200 kDa range [10] | Buffer: 1 M Tris-Cl gel, 0.2 M Tris-Cl/0.2% SDS (upper tank), 0.2 M Tris-Cl (lower tank) [10] |
| DNA Resolution | 2–5 bp differences in 50–200 bp range resolved [10] | 6–8% HAG with TBE + 0.2% NaCl [10] |
| Advantage | More accurate size-based separation for curved DNA molecules; higher UV transparency; lower toxicity [10] | Compared to traditional PAG [10] |
This protocol highlights that with optimized buffer conditions, agarose can venture into the traditional domain of polyacrylamide, offering a non-toxic alternative for specific protein separation needs, though polyacrylamide remains the gold standard for highest-resolution proteoform analysis [54].
The Scientist's Toolkit: Essential Reagent Solutions
Successful electrophoresis relies on a suite of critical reagents. The table below details key components for SDS-PAGE.
Table 6: Essential Research Reagent Solutions for SDS-PAGE
| Reagent / Material | Function | Key Consideration |
|---|---|---|
| Acrylamide/Bis-acrylamide | Forms the porous gel matrix for size-based separation [5]. | Neurotoxic monomer; requires PPE. Ratio of bis-acrylamide determines pore size [5]. |
| SDS (Sodium Dodecyl Sulfate) | Denatures proteins and imparts a uniform negative charge, ensuring separation is based on mass alone [5]. | Critical for reliable molecular weight estimation. Must be of high purity. |
| APS and TEMED | Catalyzes the polymerization reaction of the polyacrylamide gel [5]. | Fresh APS is required for efficient and consistent gel polymerization. |
| Tris-based Running Buffer | Conducts current and maintains stable pH during electrophoresis [52] [53]. | Incorrect concentration or pH leads to poor resolution and band artifacts [52]. |
| Loading Dye | Provides density for well loading and a visible migration front; often contains a reducing agent [55]. | Dyes with similar molecular size to the protein of interest can mask bands [53]. |
| Protein Ladder | Provides molecular weight standards for size estimation and run control. | Essential for interpreting results and confirming system performance. |
Preventing common artifacts in protein gel electrophoresis requires a rigorous, methodical approach. For the vast majority of protein separation tasks, polyacrylamide gels offer the necessary resolution and robustness, provided that protocols for voltage, cooling, and sample preparation are meticulously optimized [5] [52]. Meanwhile, emerging research on high-concentration agarose gels presents a viable, lower-toxicity alternative for specific applications, particularly with larger proteins or when toxicity is a primary concern [10]. By understanding the underlying causes of artifacts and systematically applying the troubleshooting strategies and experimental data outlined in this guide, researchers and drug development professionals can ensure the generation of high-quality, reproducible data critical for scientific advancement.
In the comparative analysis of polyacrylamide gel vs agarose gel for protein separation, the journey to clear, interpretable results begins long before the electrical current is applied. The critical stages of sample preparation—denaturation, reduction, and proper loading—fundamentally dictate the success of downstream separation and analysis. While the choice between polyacrylamide and agarose matrices is determined by the target molecule size and desired resolution, this selection is ultimately futile without proper upfront processing [5]. Polyacrylamide gels, with their small, uniform pore structures, are the cornerstone of high-resolution protein separation, capable of distinguishing molecules differing by as little as a few thousand Daltons [5] [7]. However, this high-resolution potential can only be realized when proteins are uniformly linearized and charged, a state achieved through meticulous sample preparation.
The principle of protein electrophoresis relies on overcoming the complex three-dimensional structures and variable charge densities inherent to native proteins. Without systematic denaturation and reduction, proteins would migrate according to their combined molecular characteristics—size, charge, and shape—making accurate size determination impossible [7]. The strategic implementation of denaturation, reduction, and loading buffers transforms this complex challenge into a manageable separation based primarily on molecular weight, enabling researchers across molecular biology and drug development to obtain reliable, reproducible data for critical decision-making in therapeutic protein characterization and quality control [24] [56].
The Denaturation and Reduction Workflow: A Detailed Breakdown
The process of preparing a protein sample for electrophoresis involves a precise sequence of steps designed to unravel its native structure and impart a uniform charge. The workflow can be visualized as follows, illustrating the transformation of a native protein into a fully denatured and reduced state ready for separation:
Core Principles and Mechanisms
Denaturation: The process begins with heat denaturation at 95°C for 5-10 minutes, which disrupts hydrogen bonds and van der Waals forces that maintain secondary and tertiary structures [7]. This crucial step unfolds the protein into a random coil conformation, exposing the hydrophobic core to the surrounding solution.
Reduction: Simultaneously, reducing agents such as β-mercaptoethanol or dithiothreitol (DTT) cleave disulfide bonds that covalently link cysteine residues [7] [57]. This action separates polypeptide subunits, ensuring each chain migrates independently according to its molecular weight rather than as part of a complex multimeric structure.
SDS Binding: The anionic detergent sodium dodecyl sulfate (SDS) binds to the denatured polypeptide backbone at a constant ratio of approximately 1.4 g SDS per 1.0 g of protein [7]. This uniform coating masks the protein's intrinsic charge and creates a consistent charge-to-mass ratio across all polypeptides, ensuring migration through the polyacrylamide matrix correlates directly with molecular size.
Essential Reagents and Their Molecular Functions
The following toolkit details the critical components of sample preparation buffers, their specific concentrations, and their mechanistic roles in ensuring successful protein separation.
Research Reagent Solutions
| Reagent | Typical Concentration | Primary Function | Mechanistic Action |
|---|---|---|---|
| SDS (Sodium Dodecyl Sulfate) | 1-2% (w/v) | Denaturation & Charge Uniformity | Binds polypeptide backbone; imparts uniform negative charge; disrupts hydrophobic interactions [7]. |
| Reducing Agent (β-mercaptoethanol or DTT) | 5% (v/v) or 100mM | Disulfide Bond Reduction | Cleaves covalent disulfide linkages between cysteine residues; ensures subunit separation [7] [57]. |
| Tris-HCl Buffer | 50-100mM, pH 6.8 | pH Stabilization | Maintains optimal pH during sample preparation; provides conductive ions [7]. |
| Glycerol | 10-20% (v/v) | Density Agent | Increases sample density for facile well loading; prevents diffusion into upper buffer [7]. |
| Tracking Dye (Bromophenol Blue) | 0.01-0.1% (w/v) | Migration Monitor | Visualizes migration progress through gel matrix; co-migrates with dye front [29]. |
| Urea | 6-8M | Alternative Denaturant | Disrupts hydrogen bonding; used in specific applications alongside or instead of SDS [57]. |
| Inorganic Salts (LiBr) | 6-8M | Specialized Denaturant | Disrupts water network structure; entropy-driven denaturation for specific protein types [57]. |
Gel Matrix Selection: Polyacrylamide vs. Agarose for Protein Analysis
The choice between polyacrylamide and agarose gels represents a critical decision point in experimental design, with each matrix offering distinct advantages for specific separation needs. The following comparison and experimental data illustrate their differing capabilities:
Comparative Analysis of Gel Matrices
| Parameter | Polyacrylamide Gel | Agarose Gel |
|---|---|---|
| Typical Applications | Protein separation (SDS-PAGE), small nucleic acids (<1000 bp) [5] [29] | Large nucleic acids (500 bp to 25,000+ bp) [58] [5] |
| Separation Mechanism | Molecular sieving through tunable, uniform pores [5] | Molecular sieving through large, non-uniform pores [5] |
| Pore Size Control | Precise (via %T and %C) [58] [7] | Limited (via agarose concentration) [58] |
| Typical Resolution | High (can distinguish ~1-5% MW difference) [5] | Low (for proteins); Moderate (for large DNA) [5] |
| Optimal Protein Size Range | 5-300 kDa (depending on %T) [7] | Not recommended for standard protein separation [5] |
| Polymerization | Chemical (APS/TEMED) [58] [7] | Physical (cooling/hydrogen bonding) [58] |
| Toxicity Concerns | Neurotoxic monomer (acrylamide) [29] [5] | Non-toxic [5] |
Experimental Separation Ranges for Polyacrylamide Gels
The following table provides detailed experimental data for polyacrylamide gel formulations, demonstrating their resolving power for proteins of different sizes under denaturing conditions:
Recommended Polyacrylamide Gel Percentages for Protein Separation
| Gel Type | % Acrylamide | Efficient Separation Range | Optimal Application |
|---|---|---|---|
| Denaturing Gels (SDS-PAGE) | 6% | 40-300 bases | Large polypeptides |
| 8% | 30-200 bases | Standard protein separation | |
| 10% | 20-100 bases | Standard protein separation | |
| 12% | 10-50 bases | Small polypeptides | |
| Non-denaturing Gels (Native-PAGE) | 5.0% | 80-500 bp | Medium proteins |
| 8.0% | 60-400 bp | Small-medium proteins | |
| 12.0% | 50-200 bp | Small proteins | |
| 15.0% | 25-150 bp | Very small proteins |
Note: Denaturing gel ranges are expressed in bases for single-stranded nucleic acids or equivalent polypeptide length; Non-denaturing gel ranges are expressed in base pairs (bp) for double-stranded nucleic acids or equivalent protein hydrodynamic size [58].
Detailed Experimental Protocols for Protein Separation
Standard SDS-PAGE Sample Preparation Protocol
This foundational protocol describes the essential steps for preparing protein samples for denaturing polyacrylamide gel electrophoresis, optimized for molecular weight determination.
Sample Dilution and Buffer Preparation:
Denaturation and Reduction:
Gel Loading and Electrophoresis:
- Load 10-50 μL of prepared sample per well (typically 10-20 μg total protein for Coomassie staining; 1-5 μg for silver staining).
- Include appropriate molecular weight markers in at least one well.
- Run electrophoresis at constant voltage (100-150V for mini-gels) until dye front approaches bottom of gel (typically 45-90 minutes) [7].
Horizontal SDS-PAGE Alternative Protocol
This specialized protocol adapted from a published methodology [59] offers an alternative approach using horizontal polyacrylamide gel systems.
Gel Preparation:
- Prepare acrylamide solution (e.g., 10% w/v acrylamide/bis-acrylamide 19:1) in 1X TBE or TAE buffer with 0.1% SDS [59].
- Add 15 μL TEMED and 45 μL 20% ammonium persulfate per 10 mL acrylamide solution to initiate polymerization.
- Pour gel using specialized horizontal casting apparatus or between silanized glass plates.
Sample Preparation:
- Denature protein samples in buffer containing 50 mM Tris (pH 6.8), 1% SDS, 2% β-mercaptoethanol, 0.01% bromophenol blue at 95°C for 5 minutes [59].
- Centrifuge at 10,000 × g for 10 minutes to remove insoluble material.
Electrophoresis Conditions:
- Perform electrophoresis in 1X TBE or TAE buffer with 0.1% SDS at 7 V/cm [59].
- Run until bromophenol blue tracking dye migrates to desired position (typically 45-60 minutes for 6 cm gels).
Comparative Analysis and Data Interpretation
Troubleshooting Common Sample Preparation Issues
The relationship between sample preparation artifacts and final data quality can be visualized through the following troubleshooting workflow:
Quantitative Analysis of Electrophoretic Results
For researchers in drug development, accurate quantification of electrophoretic data is essential for characterizing therapeutic proteins such as monoclonal antibodies. The implementation of proper sample preparation enables precise analysis of critical quality attributes:
Purity Assessment: Well-prepared samples yield sharp, distinct bands that allow accurate quantification of main product versus fragments and aggregates [24]. Incomplete denaturation or reduction manifests as additional bands or smearing that complicates this assessment.
Size Heterogeneity: Reduced CE-SDS analysis of antibodies should clearly resolve non-glycosylated heavy chain (NGHC) from heavy chain (HC) and light chain (LC), with typical resolution values (Rs) ≥1.65 achievable with optimized protocols [19].
Reproducibility Metrics: Properly prepared samples demonstrate excellent run-to-run reproducibility with migration time RSD <0.3% and peak area RSD <5%, meeting stringent biopharmaceutical quality control requirements [19].
The interplay between meticulous sample preparation and appropriate gel matrix selection forms the foundation of successful protein electrophoresis in research and biopharmaceutical applications. While this analysis has contrasted polyacrylamide and agarose matrices, the evidence unequivocally establishes polyacrylamide as the indispensable medium for protein separation, with agarose serving complementary roles in nucleic acid analysis [5]. The critical steps of denaturation, reduction, and buffer optimization transform complex biological samples into analyzable components, enabling researchers to leverage the high-resolution capability of polyacrylamide gels.
For drug development professionals, this integrated approach—combining rigorous sample preparation with optimized electrophoretic conditions—provides the reliability and reproducibility required for therapeutic protein characterization, lot release testing, and regulatory filings [24] [56]. As electrophoretic technologies continue evolving toward capillary-based systems and automated platforms, the fundamental principles of sample preparation remain constant [19] [24]. Mastering these core techniques ensures researchers can generate high-quality data, make informed decisions about product quality, and ultimately contribute to the development of safe, effective biotherapeutics.
The choice between polyacrylamide and agarose gel electrophoresis is a fundamental decision in molecular biology and biochemistry, profoundly impacting the success of protein and nucleic acid separation. While the gel matrix itself provides the foundation for separation, the electrophoretic conditions—specifically voltage, temperature, and run time—serve as critical adjustable parameters that determine resolution, band sharpness, and analytical accuracy. These factors directly influence the electrophoretic mobility of molecules and the molecular sieving properties of the gel matrix [60]. For researchers engaged in protein separation research, optimizing these parameters is not merely a procedural step but a necessary requirement for obtaining reproducible, publication-quality results.
The distinct physical properties of polyacrylamide and agarose gels necessitate different optimization strategies. Polyacrylamide gels, with their smaller, uniform pore sizes, are ideally suited for high-resolution separation of proteins and small nucleic acids [5]. In contrast, agarose gels, characterized by larger, non-uniform pores, excel in separating larger DNA fragments [5] [1]. This guide provides a detailed, evidence-based comparison of how voltage, temperature, and run time interact with these different matrices, offering researchers a clear framework for optimizing electrophoresis conditions within the broader context of gel selection for protein separation.
Fundamental Principles: Gel Types and Their Properties
Polyacrylamide Gel Electrophoresis (PAGE) for Protein Separation
Polyacrylamide gel is a synthetic polymer formed through the co-polymerization of acrylamide and a crosslinker, N,N'-methylenebisacrylamide (bis-acrylamide) [5] [61]. The polymerization reaction, typically catalyzed by ammonium persulfate (APS) and tetramethylethylenediamine (TEMED), creates a highly tunable mesh with precisely controllable pore sizes [58] [61]. The key advantage of PAGE lies in this tunability; by adjusting the total concentration of acrylamide and bis-acrylamide (%T), researchers can fine-tune the gel's pore size to achieve superior resolution for molecules with minimal mass differences [5].
For protein analysis, PAGE is most commonly performed under denaturing conditions using sodium dodecyl sulfate (SDS). In SDS-PAGE, proteins are denatured and linearized, and the SDS detergent imparts a uniform negative charge, ensuring that separation occurs almost exclusively based on molecular weight rather than intrinsic charge or shape [5] [61]. This allows for accurate size estimation and comparison. Under non-denaturing or native PAGE conditions, the protein's higher-order structure, biological activity, and interactions are preserved, with separation influenced by the molecule's intrinsic charge, size, and shape [61].
Agarose Gel Electrophoresis for Nucleic Acids
Agarose, a polysaccharide derived from seaweed, forms a gel through non-covalent associations of linear polymer chains that create a matrix with relatively large pore sizes [5] [1]. While its primary application is the separation of large DNA fragments (from 100 bp to 25 kb and beyond) [5] [1], its simplicity and non-toxic nature make it a laboratory staple. Its pore structure is less uniform than that of polyacrylamide and cannot be as precisely controlled, though the pore size can be influenced by adjusting the agarose concentration [5]. For the core focus of protein separation research, agarose is generally not the matrix of choice due to its larger pore size, which is ineffective for resolving most proteins.
Comparative Properties of Agarose and Polyacrylamide Gels
Table 1: Key Characteristics of Agarose and Polyacrylamide Gels
| Feature | Agarose Gel | Polyacrylamide Gel (PAGE) |
|---|---|---|
| Chemical Nature | Polysaccharide from seaweed [5] | Synthetic polymer (acrylamide copolymer) [5] |
| Pore Size | Large, non-uniform [5] | Small, uniform, and highly tunable [5] |
| Typical Applications | Large DNA/RNA fragments [5] | Proteins, small nucleic acids (< 1 kbp) [5] |
| Optimal Separation Range | 100 bp to 25 kb for DNA [1] | 5 - 250 kDa for proteins (SDS-PAGE) [61] |
| Resolution Capability | Lower (can resolve fragments differing by ~5-10 nucleotides) [58] | Higher (can resolve proteins differing by a few thousand Daltons, or single nucleotides in DNA) [5] [58] |
| Gel Formation | Physical (cooling of heated solution) [5] | Chemical (polymerization reaction) [5] |
| Toxicity | Non-toxic [5] | Neurotoxic monomer (acrylamide) [5] [29] |
Optimizing Electrophoresis Conditions: A Comparative Analysis
The fidelity of electrophoretic separation is highly dependent on run conditions. Voltage, temperature, and run time are interlinked parameters that must be balanced to prevent artifacts like band smearing, distortion, or poor resolution.
Voltage and Run Time Optimization
Voltage directly controls the electrical field strength, driving the migration of charged molecules. However, higher voltages are not always better, as they generate resistive heat.
- Agarose Gels (for context): For nucleic acid separation in agarose, a common voltage range is 1-10 V/cm (measured as the distance between electrodes) [1] [29]. Sharpest bands are often obtained by running gels at lower voltages (e.g., 0.25–0.5 V/cm) overnight [29]. High voltages (>5-10 V/cm) can cause overheating, leading to gel melting, band smearing (especially for fragments >10 kb), and the "smiling effect" where bands in center lanes curve upwards due to uneven heat distribution [62] [29].
- Polyacrylamide Gels (for proteins): PAGE can generally tolerate higher voltage gradients than agarose due to its superior mechanical strength and smaller size. However, excessive voltage remains a primary cause of overheating. Running an SDS-PAGE gel too fast at high voltage can cause protein band distortion [63]. For native PAGE, where preserving protein structure is critical, lower voltages are often recommended to prevent heat-induced denaturation [61].
Table 2: Optimizing Voltage and Run Time for Different Gels
| Gel Type | Recommended Voltage | Typical Run Time | Key Considerations & Experimental Data |
|---|---|---|---|
| Agarose | 0.25 - 10 V/cm [1] [29] | 30 min to overnight, depending on voltage [29] | Data: Running a gel at 100 V for 1 hour provides good separation of PCR products [1]. Tip: To resolve large DNA fragments (>10 kb), use lower voltages to prevent smearing [29]. |
| Polyacrylamide (SDS-PAGE) | Often 80-200 V, depending on gel size and system | 45-90 min for mini-gels | Principle: The discontinuous buffer system (stacking and resolving gels) allows application of higher voltages once samples enter the resolving gel [61]. Tip: High voltage can cause "smiling" effects and distortion; monitor temperature [62] [63]. |
| Polyacrylamide (Native PAGE) | Lower voltages than SDS-PAGE [61] | Longer than SDS-PAGE | Principle: Lower voltages help maintain proteins in their native state by minimizing heat generation [61]. |
Temperature Control and Its Impact
Temperature is a critical, often overlooked parameter. The Joule heating effect—heat generated when current passes through the buffer—can significantly impact separation quality.
- Effects of Overheating: Excessive heat causes band smearing and distortion by increasing molecular diffusion and can even lead to gel melting (particularly for low-percentage agarose) [63]. In protein gels, heat can cause protein denaturation in native PAGE or uneven migration in SDS-PAGE [61] [63].
- Optimization Strategies:
- Agarose Gels: If overheating occurs, run the gel at a lower voltage for a longer time [63]. Ensure the gel apparatus has an adequate volume of buffer to act as a heat sink [63].
- Polyacrylamide Gels: For consistent results, some protocols recommend running protein gels in a cold room or using a circulating water cooler to dissipate heat, especially for longer runs or higher voltages.
The following diagram illustrates the decision-making process for optimizing these key conditions.
Experimental Protocols for Key Methodologies
Protocol: Standard SDS-PAGE for Protein Separation
This protocol outlines the foundational method for denaturing protein electrophoresis, based on the Laemmli system [61].
I. Gel Preparation (Discontinuous System)
- Prepare the Resolving Gel: Mix components for the desired acrylamide percentage (e.g., 8-12% for most proteins). A typical mixture includes acrylamide/bis-acrylamide solution, Tris-HCl buffer (pH 8.8), SDS, and water. Polymerize by adding APS and TEMED. Pour the solution immediately and overlay with isopropanol or water for a flat interface [61].
- Prepare the Stacking Gel: Once the resolving gel has set, pour off the overlay. Prepare a lower-percentage gel (e.g., 4-5%) with Tris-HCl buffer (pH 6.8), SDS, APS, and TEMED. Pour on top of the resolving gel, insert a comb, and allow to polymerize [61].
II. Sample Preparation
- Mix protein samples with SDS-PAGE loading dye (containing Tris, glycerol, SDS, bromophenol blue, and often a reducing agent like β-mercaptoethanol) [61].
- Heat denature samples at 95-100°C for 3-5 minutes to fully linearize the proteins [61].
- Centrifuge briefly to bring down condensation [61].
III. Electrophoretic Run
- Assemble the gel in the electrophoresis tank and fill with running buffer (e.g., Tris-Glycine-SDS) [61].
- Load samples and appropriate protein molecular weight markers into the wells.
- Connect to a power supply and run at a constant voltage. For a mini-gel, begin at 80-100 V until samples migrate through the stacking gel, then increase to 120-150 V for the remainder of the run. Monitor the migration of the dye front [61].
- Stop the run when the dye front reaches the bottom of the gel.
IV. Visualization
- Proteins are typically visualized post-run by staining with Coomassie Brilliant Blue or more sensitive stains like silver stain [63].
Protocol: Native PAGE for Native Protein Separation
This protocol is used when preserving protein structure and activity is essential.
Key Modifications from SDS-PAGE:
- No Denaturants: SDS and reducing agents are omitted from the sample buffer, gel, and running buffer [61].
- No Heat: The sample is not heated prior to loading [61].
- Lower Voltage: The gel is often run at lower voltages and/or in a cold room to minimize heat generation and prevent denaturation during the run [61].
- Specialized Buffers: The running buffer is typically Tris-based without SDS, such as Tris-Glycine or Tris-Borate-EDTA (TBE) at the appropriate pH [61].
The Scientist's Toolkit: Essential Reagents and Materials
Successful and reproducible electrophoresis relies on high-quality, specific reagents. The following table details key solutions and their critical functions in the process.
Table 3: Research Reagent Solutions for Gel Electrophoresis
| Reagent/Material | Function | Key Considerations |
|---|---|---|
| Acrylamide/Bis-acrylamide | Forms the cross-linked polymer matrix of PAGE gels [5] [61]. | Neurotoxin in monomeric form; handle with gloves; pre-mixed solutions reduce risk [5] [29]. |
| SDS (Sodium Dodecyl Sulfate) | Denatures proteins and confers a uniform negative charge for separation by mass in SDS-PAGE [5] [61]. | Purity is critical for consistent results. |
| APS & TEMED | Ammonium Persulfate (APS) and TEMED catalyze the polymerization of acrylamide gels [58] [61]. | Use fresh APS aliquots for complete polymerization [29]. |
| Tris-Based Buffers (TAE/TBE) | Carry current and maintain stable pH during run. TAE (Tris-Acetate-EDTA) and TBE (Tris-Borate-EDTA) are common for DNA; protein gels use Tris-Glycine etc. [62] [61]. | TBE provides sharper bands but borate can inhibit enzymes in downstream steps [62] [29]. |
| Loading Dye | Contains a tracking dye (e.g., Bromophenol Blue) to monitor migration and glycerol to increase sample density for well loading [62] [1]. | Dye migration varies with gel type and percentage; know its equivalence to your target molecule size [62] [29]. |
| Protein Molecular Weight Marker | A mixture of proteins of known sizes run alongside samples to estimate the molecular weight of unknown proteins [61]. | Essential for quantitative analysis. |
The optimization of electrophoresis conditions is a precise science that hinges on a deep understanding of the interplay between gel matrix properties and run parameters. For protein separation research, polyacrylamide gel electrophoresis is the unequivocal method of choice, offering the tunable pore structure and high resolution necessary to separate molecules based on subtle differences in size or charge. As demonstrated, variables such as voltage, run time, and temperature are not standalone settings but interconnected factors that collectively determine the success of an experiment. High voltage shortens run time but risks overheating and band distortion, while lower voltage and extended run times generally yield superior resolution at the cost of convenience.
Mastering these conditions enables researchers to push the boundaries of analytical resolution, whether the goal is to resolve a protein doublet, identify a single nucleotide polymorphism, or characterize native protein complexes. By applying the systematic optimization strategies and detailed protocols outlined in this guide, scientists and drug development professionals can ensure that their electrophoretic separations are not only successful but are also robust, reproducible, and of the highest quality.
In the field of protein separation research, the choice between polyacrylamide and agarose gel electrophoresis is fundamental. While both techniques serve to separate macromolecules based on size, their inherent properties and associated risks present researchers with a critical trade-off between resolving power and laboratory safety. Polyacrylamide gels, formed through the chemical polymerization of acrylamide and bis-acrylamide, provide the high resolution necessary for separating proteins and small nucleic acids [5] [8]. However, this performance comes with significant safety considerations, as the unpolymerized acrylamide monomer is a potent neurotoxin and suspected carcinogen [64] [5] [65]. In contrast, agarose gels, derived from seaweed polysaccharides, are non-toxic and simpler to prepare but offer substantially lower resolution for protein separation [5] [66]. This guide provides a comprehensive objective comparison of these systems, with a focused emphasis on the safe handling protocols required for neurotoxic acrylamide monomers, equipping researchers with the knowledge to make informed decisions that protect both their experimental integrity and personal wellbeing.
Understanding the Hazards: Acrylamide Toxicity and Exposure Pathways
Acrylamide (ACR) presents a documented health risk in laboratory settings. The International Agency for Research on Cancer (IARC) classifies it as a Group 2A substance, meaning it is "probably carcinogenic to humans" [64]. Its primary and most clearly established effect in humans is neurotoxicity.
Mechanisms of Neurotoxicity
The neurotoxic effects of acrylamide arise from several interconnected biological mechanisms [64]:
- Axonal Degeneration: ACR can form covalent adducts with cysteine residues in presynaptic nerve terminals, deactivating essential proteins and impairing neurotransmitter release, leading to nerve terminal degeneration [64].
- Oxidative Stress: ACR metabolism induces oxidative stress, which directly and indirectly contributes to nerve cell damage and apoptosis (programmed cell death) [64].
- Inflammatory Response: ACR exposure can trigger neuroinflammation, potentially involving pathways like the NOD-like receptor protein 3 (NLRP3) inflammasome [64].
Reports of occupational exposure have documented symptoms including muscle weakness, numbness in hands and feet, sweating, unsteadiness, and clumsiness [65]. Animal studies further support its neurotoxic potential, showing effects on motor skills and learning ability [64] [65].
Routes of Laboratory Exposure
In a research context, exposure to unpolymerized acrylamide can occur through:
- Inhalation: Breathing in airborne dust when handling the powdered monomer.
- Dermal Contact: Absorption through the skin during gel preparation or handling of solutions [65].
- Accidental Ingestion: Via contaminated hands or food.
It is crucial to note that acrylamide can cross the blood-brain barrier, allowing it to exert direct toxic effects on the central nervous system [64].
Figure 1: Acrylamide exposure pathways and neurotoxicity mechanisms in the lab.
Objective Gel System Comparison: Performance and Safety Data
Selecting the appropriate gel matrix requires a clear understanding of performance capabilities and safety profiles. The following tables provide a direct comparison of key characteristics, separation ranges, and hazard classifications.
Table 1: Performance and Physical Characteristics Comparison
| Feature | Polyacrylamide Gel | Agarose Gel |
|---|---|---|
| Gel Matrix Composition | Synthetic polymer of acrylamide and bis-acrylamide [5] | Polysaccharide extracted from seaweed [5] |
| Polymerization | Chemical polymerization (requires catalyst) [5] | Physical gelation upon cooling [5] |
| Pore Size | Small, uniform, and tunable via %T and %C [5] | Large, non-uniform, adjusted via gel percentage [5] [66] |
| Typical Molecules Separated | Proteins, small DNA/RNA (< 1 kbp) [5] [8] | Large DNA/RNA (100 bp to 25 kbp and beyond) [5] [66] |
| Resolution | High (can separate molecules differing by a single base pair or a few kDa) [5] [8] | Lower, suitable for larger molecules [5] |
| Primary Application | Protein electrophoresis (SDS-PAGE, Native PAGE) [5] | Nucleic acid electrophoresis (DNA, RNA) [5] [66] |
Table 2: Safety and Practical Handling Comparison
| Aspect | Polyacrylamide Gel | Agarose Gel |
|---|---|---|
| Toxicity of Components | Unpolymerized acrylamide is a potent neurotoxin and suspected carcinogen [64] [5] [65] | Non-toxic [5] |
| Preparation Safety Requirements | Mandatory PPE (gloves, lab coat), use of fume hood for weighing powder, careful handling to avoid exposure [5] | Standard laboratory precautions; no significant toxic hazards [5] |
| Ease of Preparation | More complex; requires precise chemical mixing and polymerization [5] | Simple; dissolved in buffer by heating, then poured [5] [66] |
| Typical Gel Concentrations for Proteins | 8-16% for standard SDS-PAGE; gradient gels (e.g., 4-20%) for broad MW ranges [67] | Generally not suitable for most proteins; high-concentration gels (6-14%) proposed for limited applications [68] |
| Effective Protein Separation Range | Excellent for proteins ~5-200 kDa [67] | Limited resolution for proteins; one study reports 10-200 kDa on high-concentration gels [68] |
Experimental Protocols for Safe and Effective Electrophoresis
Standard SDS-PAGE Protocol for Protein Separation Using Polyacrylamide Gels
This protocol is widely used for denaturing protein electrophoresis and requires strict safety measures.
Research Reagent Solutions:
- Acrylamide/Bis-acrylamide Solution (30%): Pre-mixed neurotoxic reagent; prefer commercially prepared solutions to minimize powder handling [5].
- Tris-HCl Buffer (1.5 M, pH 8.8): For resolving gel.
- Tris-HCl Buffer (0.5 M, pH 6.8): For stacking gel.
- Sodium Dodecyl Sulfate (SDS), 10%: Denaturing agent.
- Ammonium Persulfate (APS), 10%: Polymerization catalyst.
- Tetramethylethylenediamine (TEMED): Polymerization accelerator.
- Electrophoresis Buffer (Tris-Glycine-SDS): Running buffer.
- Protein Samples: Prepared in Laemmli buffer with reducing agents.
Safety-Critical Workflow:
- Personal Protective Equipment (PPE): Don nitrile gloves and a lab coat before handling any reagents. Safety glasses are recommended [5].
- Gel Solution Preparation: If weighing acrylamide powder is unavoidable, perform this step exclusively in a functioning fume hood to prevent inhalation of dust. Use a dedicated weighing spatula [5] [65].
- Casting the Gel: Combine all components except TEMED and APS in the fume hood. Add TEMED and APS last to initiate polymerization, mix gently to avoid introducing bubbles, and immediately pipette the solution into the gel cassette. Carefully overlay with isopropanol or water for a flat interface.
- Polymerization: Allow the gel to polymerize completely (typically 30 minutes) in the fume hood. Once polymerized, the polyacrylamide is much safer, but gloves should still be worn as unreacted monomer may be present.
- Electrophoresis: Assemble the gel apparatus, load samples, and run at appropriate constant voltage.
- Clean-Up: Decontaminate all equipment that contacted unpolymerized acrylamide (e.g., glass plates, spatulas) thoroughly. Dispose of solid waste according to institutional hazardous chemical regulations.
Figure 2: Safety-focused SDS-PAGE workflow for polyacrylamide gels.
Protein Separation Using High-Concentration Agarose Gels
While not common, recent methodologies suggest high-concentration agarose gels (HAGs) can separate proteins, offering a non-toxic alternative for certain applications [68].
Research Reagent Solutions:
- High-Gelling Temperature Agarose: For stable high-concentration gels.
- Tris-Cl Buffer (1 M, pH ~8.3): For gel preparation and electrophoresis.
- SDS Solution (20%): For denaturing conditions.
- Protein Loading Buffer: Contains SDS and reducing agent.
- Protein Stain: Coomassie Blue or similar.
Methodology:
- Gel Preparation: Dissolve agarose (6-14%) in 1 M Tris-Cl buffer by autoclaving. Cool to approximately 60°C, add SDS to 0.1% if denaturing conditions are desired, and cast the gel using a vertical cassette [68].
- Buffer System: Use 0.2 M Tris-Cl/0.2% SDS as the upper tank (cathode) buffer and 0.2 M Tris-Cl as the lower tank (anode) buffer [68].
- Electrophoresis: Load samples and run at constant voltage. The conditions may require optimization based on gel concentration and protein size.
- Detection: Stain the gel with a standard protein stain like Coomassie Blue.
The Scientist's Toolkit: Essential Research Reagents and Safety Equipment
Table 3: Essential Research Reagents and Safety Materials
| Item | Function | Safety Considerations |
|---|---|---|
| Acrylamide/Bis-acrylamide (30% solution) | Forms the porous gel matrix for separation [5] | Neurotoxin; use pre-mixed solutions; wear gloves [5] |
| Agarose (High-Gelling Temperature) | Forms the gel matrix for nucleic acids or, at high %, for proteins [68] | Non-toxic; standard lab handling [5] |
| TEMED | Accelerates the polymerization of polyacrylamide gels [5] | Corrosive; handle in fume hood; wear gloves [5] |
| Ammonium Persulfate (APS) | Initiates the free-radical polymerization of polyacrylamide gels [5] | Irritant; handle with gloves [5] |
| SDS (Sodium Dodecyl Sulfate) | Denatures proteins and confers uniform negative charge for SDS-PAGE [5] | Irritant; avoid inhalation of powder [5] |
| Nitrile Gloves | Primary barrier against dermal exposure to neurotoxins | Mandatory for handling acrylamide; check for tears [5] |
| Fume Hood | Engineering control to prevent inhalation of toxic dusts/vapors | Essential for weighing acrylamide powder and preparing solutions [5] [65] |
| Lab Coat and Safety Glasses | Protects skin and eyes from splashes | Required when handling liquid neurotoxins or catalysts [5] |
The choice between polyacrylamide and agarose gel electrophoresis involves a critical balance between analytical requirements and laboratory safety. Polyacrylamide gels are the unequivocal choice for high-resolution protein separation, a capability indispensable for advanced research and drug development. However, this performance is inextricably linked to the mandatory implementation of rigorous safety protocols to mitigate the risks associated with the neurotoxic acrylamide monomer. Agarose gels, while non-toxic and easier to handle, provide limited utility for protein research, though emerging methods with high-concentration gels may offer alternatives for specific applications. Ultimately, the informed researcher must prioritize safety without compromising scientific rigor, ensuring that the pursuit of discovery is protected by a foundation of conscientious laboratory practice. By adhering to the comparative data, experimental protocols, and safety guidelines outlined in this article, scientists can navigate this critical trade-off with confidence and responsibility.
In protein research utilizing gel electrophoresis, the choice of staining method is a critical determinant for successful visualization and analysis. Within the context of separating proteins via polyacrylamide gel electrophoresis (SDS-PAGE) or analyzing very high-molecular-weight (HMW) complexes with agarose gel electrophoresis, researchers must select a staining strategy that balances sensitivity, cost, throughput, and compatibility with downstream applications [67] [69]. This guide provides an objective comparison of two foundational approaches: the colorimetric dye Coomassie Blue and modern fluorescent staining methods. The selection between these stains, and indeed the choice of gel matrix, is guided by the specific experimental aims, whether for routine protein quantification, high-sensitivity proteomic discovery, or the analysis of HMW protein complexes that benefit from the larger pore sizes of agarose-based gels [69].
Fundamental Principles and Staining Mechanisms
Coomassie Blue Staining
Coomassie Brilliant Blue is an anionic triphenylmethane dye that binds non-covalently to proteins through two primary mechanisms: ionic interactions between its sulfonic acid groups and positively charged amino acid residues (arginine, lysine, and histidine), and hydrophobic interactions with non-polar protein regions [70]. Upon binding, the dye's absorbance spectrum shifts, causing a color change from reddish-brown to brilliant blue and allowing for the visualization of distinct protein bands against a clear background [70]. The two common variants are Coomassie R-250 (reddish hue), often used in standard gel staining protocols, and Coomassie G-250 (greenish hue), frequently employed in colloidal staining formulations and the Bradford protein assay [70].
Fluorescent Staining
Fluorescent stains operate on the principle of fluorescence, where a fluorophore absorbs light at a specific excitation wavelength and subsequently emits light at a longer, lower-energy wavelength—a phenomenon known as the Stokes Shift [71]. These dyes typically interact non-covalently with proteins, often targeting primary amines, and enable detection through specialized imaging systems that provide the correct excitation light and capture the emitted fluorescence [72] [73]. A key advancement is the discovery that Coomassie Blue itself can function as a near-infrared fluorescent dye when imaged with infrared-capable instruments, providing sensitivity that can rival dedicated fluorescent stains like Sypro Ruby at a fraction of the cost [73] [74].
The following diagram illustrates the core mechanisms of action for both staining methods:
Performance Comparison: Quantitative Data
The choice between staining methods is largely driven by performance metrics. The table below summarizes key quantitative data for Coomassie Blue and a representative fluorescent stain, Sypro Ruby, based on comparative studies.
Table 1: Performance Comparison of Coomassie Blue and Fluorescent Stains
| Performance Metric | Coomassie Blue (Traditional) | Coomassie Blue (Infrared Fluorescence) | Sypro Ruby (Fluorescent) |
|---|---|---|---|
| Detection Sensitivity | ~10 ng protein [73] | <1 ng protein [73] | <1 ng protein [73] |
| Linear Dynamic Range | ~1 order of magnitude [73] | Significantly exceeds Sypro Ruby [73] | ~2 orders of magnitude [73] |
| Inter-protein Variability | Moderate to High [73] | Assessed as comparable or superior to Sypro Ruby [73] | Lower than Coomassie [73] |
| Cost per Gel (Example) | ~$3.50 - $8.33 (Various commercial kits) [73] | Cost of standard Coomassie [74] | ~$11.69 [73] |
| Compatibility with MS | Yes [70] [74] | Yes [73] | Yes [73] |
Beyond these core metrics, each method presents distinct advantages and limitations that influence their application in specific research scenarios.
Table 2: Advantages and Disadvantages at a Glance
| Staining Method | Key Advantages | Key Disadvantages |
|---|---|---|
| Coomassie Blue | Low cost; easy to use; high reproducibility; mass spectrometry compatible; no specialized equipment needed for basic visualization [70] [74]. | Lower sensitivity than fluorescent methods; can be time-consuming; traditional formulations use hazardous organic solvents [70] [74]. |
| Fluorescent Staining | High sensitivity; large linear dynamic range; multiplexing capability; suitable for live-cell imaging [72] [73]. | High cost; requires specific imaging equipment; susceptible to photobleaching; potential for high background noise [72]. |
Experimental Protocols
Coomassie Blue Staining Protocol
The following protocol is adapted for a standard 1.0 mm polyacrylamide gel, using a traditional Coomassie R-250 formulation [75] [70].
Materials Required:
- Staining Solution: 0.1% (w/v) Coomassie R-250 in 40% ethanol (or methanol) and 10% acetic acid.
- Destaining Solution: 10% ethanol (or methanol) and 7.5% acetic acid in deionized water.
- Orbital shaker, staining container, microwave oven (optional), and deionized water [75] [70].
Procedure:
- Fixing & Washing (Optional but Recommended): After electrophoresis, place the gel in a staining container. Rinse with deionized water 3 times for 5 minutes each to remove SDS and buffer salts that can interfere with dye binding [75].
- Staining: Submerge the gel in sufficient Coomassie staining solution (e.g., 100 ml) to cover it completely. For accelerated staining, loosely cover the container and heat in a microwave for approximately 1 minute without boiling. Then, incubate with gentle agitation on an orbital shaker for at least 15 minutes to 1 hour at room temperature [75] [70].
- Destaining: Decant the staining solution. Add destaining solution to cover the gel. Again, heating for 1 minute in a microwave can accelerate the process. Continue gentle agitation, changing the destaining solution as needed, until the gel background is clear and protein bands are sharply defined [75].
- Storage & Imaging: For long-term storage, keep the gel in 1% acetic acid or water. Image the gel using a standard white-light gel documentation system [70].
While specific protocols vary by product, a general workflow for a fluorescent stain like Sypro Ruby is as follows [72]:
Materials Required:
- Fluorescent Stain (e.g., Sypro Ruby).
- Fixation Solution: Often 50% ethanol (or methanol) and 10% acetic acid.
- Wash Buffer: Typically a dilute solution of ethanol or acetic acid.
- Orbital shaker, protective foil to limit light exposure, and a fluorescent gel imager with appropriate excitation/emission filters.
Procedure:
- Fixing: Post-electrophoresis, fix the gel in fixation solution for 30 minutes to several hours. This step precipitates proteins and removes interfering compounds.
- Washing: Rinse the gel with wash buffer or deionized water to prepare for staining.
- Staining: Incubate the gel in the fluorescent stain, protected from light, for 30 minutes to several hours (or as per manufacturer's instructions) with gentle agitation.
- Destaining/Washing: Rinse the gel briefly with wash buffer or deionized water to reduce background fluorescence.
- Imaging: Visualize and capture the image using a fluorescent scanner or gel documentation system equipped with the correct excitation and emission wavelengths for the dye used.
The workflow for both staining strategies within the context of protein separation research is summarized below:
Applications in Protein Research and Proteomics
The application of these staining methods is highly dependent on the research goals and the chosen separation gel. Polyacrylamide gels are the workhorse for the vast majority of protein separations, providing high resolution for proteins typically up to several hundred kDa. In contrast, agarose gels, or composite gels like 2-hydroxyethyl agarose/polyacrylamide (HEAG/PAM), are strategically employed for the effective separation of very high-molecular-weight (HMW) proteins (e.g., >100-500 kDa) that are difficult to resolve in standard polyacrylamide matrices due to their small pore size [67] [69].
- Routine Analysis and Protein Quantification: For quick checks of protein expression, purity, or yield in SDS-PAGE, Coomassie Blue remains the most cost-effective and straightforward method. Its wide linear dynamic range when used with infrared fluorescence detection also makes it suitable for robust quantitative analyses [73] [70].
- High-Sensitivity Proteomics and Biomarker Discovery: When analyzing complex samples with low-abundance proteins, such as in 2D gel electrophoresis for proteomic studies, fluorescent stains like Sypro Ruby are often preferred due to their superior sensitivity and lower inter-protein variability, enabling the detection of a larger proportion of the proteome [73].
- Downstream Protein Identification: Both Coomassie Blue and Sypro Ruby are compatible with mass spectrometry (MS), a key requirement for modern proteomics. This allows for the excising of protein bands/spots from the gel for subsequent in-gel digestion and MS-based identification [73] [70] [74].
- Multiplexing Experiments: A unique strength of fluorescent staining is multiplex detection, where multiple proteins or protein modifications can be visualized in the same gel by using dyes with non-overlapping emission spectra [72]. This is not possible with a single Coomassie Blue stain.
The Scientist's Toolkit: Essential Research Reagent Solutions
Successful gel staining requires more than just the dye. The following table lists key reagents, solutions, and equipment essential for implementing the staining strategies discussed.
Table 3: Essential Reagents and Equipment for Protein Gel Staining
| Item | Function/Description | Example Use Case |
|---|---|---|
| Coomassie R-250 / G-250 | The active dye for colorimetric protein detection. | Preparing laboratory-made staining solutions [70]. |
| SimplyBlue SafeStain | A ready-to-use, pre-mixed Coomassie-based stain. | Fast and convenient staining without preparing solutions [75]. |
| Sypro Ruby | A ruthenium-based, MS-compatible fluorescent stain. | High-sensitivity detection of low-abundance proteins in proteomics [73]. |
| Methanol & Acetic Acid | Key components of fixing, staining, and destaining solutions. | Precipitating proteins in gels and fixing them for staining [75] [70]. |
| Orbital Shaker | Provides gentle and consistent agitation. | Ensuring even staining and destaining across the entire gel [75] [70]. |
| White Light Gel Imager | Standard system for capturing images from colorimetric stains. | Documenting Coomassie Blue-stained gels [70]. |
| Fluorescence Gel Imager | System with specific excitation/emission filters. | Essential for visualizing and quantifying fluorescently stained gels [72] [73]. |
| Infrared Fluorescence Imager | Specialized system for near-IR detection. | Enabling high-sensitivity detection of Coomassie Blue via its infrared fluorescence [73]. |
Validation and Direct Comparison: Agarose vs. Polyacrylamide for Protein Analysis
In the field of protein separation research, the selection of an appropriate electrophoresis gel matrix is a fundamental decision that directly impacts the accuracy, efficiency, and reproducibility of experimental results. This guide provides a detailed, objective comparison between two principal gel matrices: polyacrylamide and agarose. Within the broader thesis of optimizing protein separation methodologies, this analysis focuses on critical performance parameters including resolution capabilities, effective separation ranges, and sample throughput.
The fundamental distinction between these gels arises from their structural properties. Polyacrylamide gels form through a chemical polymerization process, creating a synthetic mesh with highly uniform, tunable pore sizes ideal for separating smaller biomolecules [5]. In contrast, agarose gels, composed of a polysaccharide polymer, form a matrix with larger, non-uniform pores through physical setting, making them suitable for larger molecules [5] [76]. This structural difference dictates their specific applications in protein research.
Performance Comparison Table
The following table summarizes the key characteristics of polyacrylamide and agarose gels for protein separation.
| Performance Characteristic | Polyacrylamide Gel | Agarose Gel |
|---|---|---|
| Primary Application in Protein Research | Standard method (SDS-PAGE, Native PAGE) [5] [76] | Very large proteins (200-4,000 kDa) using specialized vertical SDS systems [76] |
| Effective Separation Range | Proteins from a few to thousands of kDa; superior for separating proteins with mass differences of a few kDa [5] | Limited application; primarily for very large protein complexes [76] |
| Gel Pore Structure | Small, uniform, and precisely tunable [5] | Large, non-uniform [5] [76] |
| Resolution | High; can resolve molecules differing by a single base pair in DNA or a few kDa in proteins [5] [76] | Low to moderate; suitable for larger molecules where high resolution is not critical [5] |
| Sample Throughput | Lower; typically 10-20 samples per gel (mini-gel format), longer run times [67] [77] | Higher; compatible with larger gel formats and faster run times [62] [77] |
| Toxicity & Handling | Neurotoxic monomer (acrylamide); requires safety protocols [5] | Non-toxic; safer and easier to handle [5] |
Experimental Protocols for Key Applications
Denaturing Protein Electrophoresis (SDS-PAGE) using Polyacrylamide Gels
SDS-PAGE is the cornerstone technique for separating proteins based on molecular weight.
- Gel Preparation: Gels are formed by polymerizing acrylamide and a crosslinker, N,N'-methylenebisacrylamide (Bis), in the presence of a catalyst (ammonium persulfate, APS) and a stabilizer (N,N,N',N'-Tetramethylethylenediamine, TEMED). The total monomer concentration (%T) determines pore size. For example, a 10-20% gel is used for separating small proteins [5] [76]. Safety Note: Unpolymerized acrylamide is a potent neurotoxin; gloves and a lab coat must be worn [5].
- Sample Preparation: Protein samples are denatured by heating in a buffer containing Sodium Dodecyl Sulfate (SDS) and a reducing agent (e.g., β-mercaptoethanol). SDS coats proteins with a uniform negative charge, ensuring separation is based solely on molecular mass [5] [76].
- Electrophoresis Conditions: A vertical gel apparatus is used. The gel is submerged in a running buffer (typically Tris-Glycine-SDS). Proteins are loaded into wells, and a constant voltage (e.g., 150-200 V for mini-gels) is applied until the tracking dye migrates to the bottom [77].
Native Protein Electrophoresis using Polyacrylamide Gels
For analyzing proteins in their folded, native state, non-denaturing (native) PAGE is employed. The protocol is similar to SDS-PAGE but excludes SDS and reducing agents from the gel and sample buffers. Separation depends on the protein's intrinsic charge, size, and shape [5] [76]. This method is useful for studying protein complexes and enzymatic activity.
Electrophoresis of Very Large Proteins using Agarose Gels
While not standard, agarose gels can separate very large proteins (200-4,000 kDa) using a vertical system combined with SDS [76]. The protocol involves:
- Gel Preparation: Dissolving agarose powder in buffer by heating, then pouring into a cassette. Low-percentage gels (e.g., 1-2%) are used for large molecules [66] [78].
- Sample Preparation: Similar to SDS-PAGE, using SDS to denature and charge the proteins.
- Electrophoresis Conditions: Running the gel in a vertical apparatus with an appropriate buffer. Though faster, the resolution is lower than that achieved with polyacrylamide [76].
Decision Workflow for Gel Selection
The following diagram illustrates the critical decision-making process for selecting the appropriate gel type based on experimental goals.
Research Reagent Solutions
The following table lists essential reagents and their functions for electrophoresis workflows.
| Research Reagent | Function/Purpose |
|---|---|
| Acrylamide/Bis-acrylamide | Forms the crosslinked polymer matrix of polyacrylamide gels [5]. |
| Agarose | Polysaccharide polymer that forms the porous matrix of agarose gels [5]. |
| SDS (Sodium Dodecyl Sulfate) | Denatures proteins and imparts a uniform negative charge, allowing separation by mass in SDS-PAGE [5] [76]. |
| TEMED & Ammonium Persulfate (APS) | Catalyst system for the polymerization of acrylamide gels [79]. |
| TAE & TBE Buffer | Common running buffers. TBE has higher buffering capacity, suitable for longer runs [62] [77]. |
| Protein Ladder (Standard) | Contains proteins of known molecular weight for sizing experimental protein bands [62]. |
| Sample Loading Buffer | Contains dye to visualize sample migration and glycerol to make sample dense enough to sink into wells [62] [77]. |
| Coomassie Blue/SYBR Safe | Stains for visualizing proteins (Coomassie) or nucleic acids (SYBR Safe) post-electrophoresis [62] [79]. |
For protein separation research, the data clearly establishes polyacrylamide gels as the superior matrix for the vast majority of applications requiring high resolution, such as SDS-PAGE and native PAGE. Their tunable, uniform pore structure provides unmatched capability to resolve proteins with small mass differences. Agarose gels play a niche role in the separation of very large protein complexes, leveraging their larger pore sizes, but at the cost of lower resolution. The choice between them should be guided by the target protein size and the resolution requirements of the experiment, with polyacrylamide being the default for rigorous protein analysis.
In the realm of protein separation research, the fundamental choice between polyacrylamide and agarose gel matrices dictates the success of analyzing macromolecular complexes. While sodium dodecyl sulfate-polyacrylamide gel electrophoresis (SDS-PAGE) reigns supreme for separating most proteins, its resolving power dramatically diminishes for very large molecular weight proteins and supramolecular structures. This limitation arises from the restricted pore size of polyacrylamide gels, which impedes the migration of massive protein complexes [5] [80]. For over a decade, the analytical biopharma community has sought solutions to the technical challenges of separating high molecular weight biopharmaceuticals, indicating a clear need for novel gel compositions [81].
This guide objectively compares the performance of agarose versus polyacrylamide gels for protein separation, with a specialized focus on the application of agarose for analyzing very large complexes. The data reveal that SDS agarose gel systems provide a transformative approach for proteins with subunit sizes greater than 200 kDa, enabling clear separation of proteins with molecular masses extending to an astonishing 4,000 kDa [82] [80]. This capability proves particularly valuable for characterizing complex new biopharmaceutical modalities, including therapeutic antibodies, fusion proteins, and other massive protein assemblies that defy analysis by conventional SDS-PAGE.
Fundamental Differences: Agarose vs. Polyacrylamide Gel Matrices
Structural and Chemical Properties
The divergent separation capabilities of agarose and polyacrylamide gels stem from their distinct structural and chemical properties. Agarose is a polysaccharide polymer derived from red algae, composed of repeating disaccharide units of D-galactose and 3,6-anhydro-α-L-galactose [83]. When heated and cooled, agarose chains form helical fibers that assemble into a three-dimensional matrix with large, non-uniform pores ranging from 50-200 nm in diameter, depending on concentration [58] [83]. This matrix formation is reversible through heating, a valuable property for recovering separated biomolecules.
In contrast, polyacrylamide is a synthetic polymer created through chemical polymerization of acrylamide monomers cross-linked by N,N'-methylenebisacrylamide (bis-acrylamide) [5]. This reaction forms a covalently stabilized mesh with uniform, precisely tunable pore sizes typically between 2-15 nm, significantly smaller than those in agarose gels [58]. The pore size can be finely controlled by adjusting the total acrylamide concentration (%T) and cross-linker ratio (%C), enabling exceptional resolution for separating smaller proteins [5].
Table 1: Fundamental Properties of Agarose and Polyacrylamide Gels
| Property | Agarose Gels | Polyacrylamide Gels |
|---|---|---|
| Chemical Nature | Polysaccharide from red algae [5] [83] | Synthetic polymer [5] |
| Polymerization | Physical (hydrogen bonding upon cooling) [58] [83] | Chemical (free radical reaction) [5] [58] |
| Pore Size | Large, non-uniform (50-200 nm) [83] | Small, uniform, tunable (2-15 nm) [5] [58] |
| Pore Control | Limited, concentration-dependent [5] | Precise, adjustable via %T and %C [5] |
| Toxicity | Non-toxic [5] | Neurotoxic monomer [5] [29] |
| Gel Preparation | Simple melting and pouring [5] | Complex chemical polymerization [5] |
Separation Principles and Molecular Weight Ranges
The different pore structures of agarose and polyacrylamide gels determine their optimal applications for biomolecule separation. Agarose gels excel with very large molecular weight proteins (>200 kDa) and nucleic acids, leveraging their large pores that permit massive complexes to migrate according to size [82] [80]. The separation relies on the molecular sieving effect as molecules navigate through the random mesh of polymer chains.
Polyacrylamide gels provide superior resolution for small to medium-sized proteins and small nucleic acid fragments, with their tightly controlled pore sizes enabling separation of molecules differing by only a few thousand Daltons in molecular weight or single base pairs in nucleic acids [5] [58]. For protein separation, SDS-PAGE employs the detergent sodium dodecyl sulfate to denature proteins and impart a uniform negative charge, ensuring separation occurs primarily based on molecular mass rather than intrinsic charge [5] [84].
Table 2: Optimal Separation Ranges for Agarose and Polyacrylamide Gels
| Gel Type | Concentration | Optimal Separation Range (Proteins) | Optimal Separation Range (Nucleic Acids) |
|---|---|---|---|
| Agarose | 0.5% | - | 1,000-30,000 bp [83] [29] |
| 1.0% | - | 500-10,000 bp [83] [29] | |
| 1.5% | - | 200-3,000 bp [83] | |
| 2.0% | - | 50-2,000 bp [83] | |
| Special Formulations | 200-4,000 kDa [82] [80] | - | |
| Polyacrylamide | 5% | - | 80-500 bp [29] |
| 8% | - | 60-400 bp [29] | |
| 10% | 20-200 kDa (est. from SDS-PAGE) | 20-100 bases (denaturing) [58] | |
| 12% | 10-100 kDa (est. from SDS-PAGE) | 25-150 bp (non-denaturing) [58] [29] | |
| 15% | 5-50 kDa (est. from SDS-PAGE) | 10-50 bases (denaturing) [58] |
Analytical Applications: Agarose Gels for Very Large Protein Complexes
Technical Advantages for High Molecular Weight Protein Analysis
Agarose gel electrophoresis provides transformative capabilities for analyzing very large protein complexes that cannot be resolved by traditional SDS-PAGE. The large pore structure of agarose gels permits migration and separation of massive protein assemblies with subunit sizes exceeding 200 kDa, a range where polyacrylamide gels typically fail due to pore size restrictions [82] [80]. Recent advancements in capillary agarose gel electrophoresis have demonstrated "baseline hump-free" separation of therapeutic proteins across a wide molecular weight range, solving a long-standing challenge in biopharmaceutical analysis [81].
The resolving power of SDS vertical agarose gel systems enables clear separation of proteins with molecular masses spanning from 200 to 4,000 kDa, encompassing massive structural proteins, viral coat proteins, and supramolecular complexes [82] [80]. This extended separation range proves particularly valuable for characterizing complex biopharmaceuticals like therapeutic antibodies and fusion proteins, where accurate size-based analysis is essential for quality control and regulatory approval [81].
Experimental Evidence and Performance Data
Recent studies with tetrahydroxyborate cross-linked agarose matrices have demonstrated exceptional separation efficiency for large therapeutic proteins. Using capillaries as short as 10 cm effective length, researchers achieved rapid analysis (~5 minutes) of intact anti-SARS-CoV-2 therapeutic antibodies and their subunits with excellent reproducibility (RSD <0.3% for migration time and <5% for peak area) [81].
The same methodology successfully resolved the high molecular weight thyroglobulin (660 kDa) and the highly glycosylated fusion protein etanercept, exploiting the stable baseline at the upper molecular weight range of the separation trace [81]. The technique provided high resolution between closely migrating non-glycosylated heavy chains and heavy chain fragments (resolution value of 1.65), demonstrating precision comparable to traditional methods but for much larger proteins [81].
Methodological Guide: SDS Agarose Gel Electrophoresis for Large Proteins
Detailed Protocol for Vertical SDS Agarose Gel Electrophoresis
The successful separation of very large proteins requires specific methodological adaptations beyond standard agarose gel protocols. Below is a comprehensive procedure optimized for high molecular weight protein complexes:
Gel Preparation: Utilize high-quality, large pore-sized agarose such as SeaKem Gold agarose [82]. Prepare a 1-2% agarose solution in SDS running buffer by heating until completely dissolved. Pour the molten agarose into a vertical gel casting system and allow it to solidify completely. The vertical setup minimizes gel distortion and improves band sharpness for large proteins.
Sample Preparation: Denature protein samples in SDS sample buffer containing 2% SDS and 5% β-mercaptoethanol or DTT as reducing agents [84]. Heat samples at 90°C for 5 minutes to ensure complete denaturation and linearization of large protein complexes. For extremely large proteins (>1000 kDa), extend heating time to 10 minutes to ensure complete unfolding.
Electrophoresis Conditions: Employ Tris-glycine or Tris-acetate running buffer systems with SDS [80]. A critical technical modification is the inclusion of a reducing agent in the upper reservoir buffer (e.g., 10 mM DTT or β-mercaptoethanol) to maintain proteins in a reduced state during separation and prevent reformation of disulfide bonds that can impede migration [82] [80]. Run gels at constant voltage (typically 50-100V) for 2-4 hours, depending on gel size and protein size range.
Post-Electrophoresis Processing: After separation, proteins can be visualized using standard protein stains such as Coomassie Blue, silver stain, or fluorescent dyes [84] [85]. For subsequent analysis like Western blotting, transfer proteins to membranes using extended transfer times to ensure efficient movement of large proteins out of the gel matrix.
Capillary Agarose Gel Electrophoresis for Advanced Applications
Recent technological advancements have introduced capillary-based agarose gel electrophoresis systems that offer superior performance for therapeutic protein analysis:
Gel Composition: Transiently cross-linked agarose matrices with tetrahydroxyborate stabilizers provide exceptional separation efficiency while eliminating the baseline disturbances commonly observed with dextran-based formulations [81].
Instrumentation: Employ fused silica capillaries with effective lengths as short as 10 cm, enabling remarkably fast analysis times of approximately 5 minutes per sample [81].
Separation Parameters: Apply voltages optimized for rapid separation while maintaining resolution. The system demonstrates excellent run-to-run reproducibility with migration time RSD <0.3% and peak area RSD <5%, meeting rigorous analytical standards for biopharmaceutical characterization [81].
Table 3: Research Reagent Solutions for Agarose-Based Protein Electrophoresis
| Reagent/Material | Function/Application | Specifications |
|---|---|---|
| SeaKem Gold Agarose | Optimal matrix for large protein separation [82] | Large pore-sized agarose |
| SDS Sample Buffer | Protein denaturation and charging [84] | Contains 2% SDS, reducing agents |
| Tetrahydroxyborate | Agarose cross-linking agent [81] | Enables transient gel stabilization |
| DTT/β-Mercaptoethanol | Maintaining protein reduction during run [82] [80] | Added to upper reservoir buffer |
| Tris-Glycine/SDS Buffer | Running buffer for protein separation [80] | Maintains pH and conductivity |
| Coomassie Blue/Sypro Ruby | Protein detection and visualization [84] [85] | Staining options |
Comparative Performance Analysis: Experimental Data Interpretation
Resolution and Efficiency Metrics
Direct comparison of agarose and polyacrylamide gel systems reveals distinct performance advantages for specific applications. Agarose gels exhibit superior resolution for proteins exceeding 200 kDa, with demonstrated separation of proteins up to 4,000 kDa—a range inaccessible to conventional SDS-PAGE [82] [80]. The large pore structure enables unhindered migration of massive complexes, while specialized formulations eliminate baseline disturbances that complicate quantification in traditional systems [81].
Modern capillary agarose electrophoresis delivers exceptional reproducibility with run-to-run migration time relative standard deviation (RSD) below 0.3% and peak area RSD under 5%, performance metrics that rival or exceed those achievable with polyacrylamide systems for high molecular weight separations [81]. The technique also enables high resolution between closely migrating species, evidenced by resolution values of 1.65 between non-glycosylated heavy chains and their fragments in therapeutic antibody analysis [81].
Application-Specific Performance Considerations
The optimal gel matrix selection depends heavily on the specific analytical requirements and protein characteristics:
Therapeutic Protein Analysis: Agarose-based capillary electrophoresis provides robust analysis of monoclonal antibodies, antibody-drug conjugates, and fusion proteins, offering hump-free baselines that facilitate accurate quantification—a critical requirement for biopharmaceutical development and quality control [81].
Highly Glycosylated Proteins: The open matrix of agarose gels accommodates the extensive hydrodynamic volume of heavily glycosylated proteins like etanercept, which migrate anomalously in polyacrylamide gels due to their large carbohydrate moieties [81].
Supramolecular Complexes: Native agarose gel electrophoresis enables analysis of protein complexes in their folded state, providing insights into stoichiometry and assembly states that would be disrupted by the denaturing conditions of SDS-PAGE.
The comparative analysis of agarose and polyacrylamide gel systems for protein separation reveals distinct application domains where each matrix excels. Polyacrylamide gels remain the gold standard for routine protein analysis, particularly for molecules under 200 kDa, offering superior resolution, tunable pore sizes, and well-established methodologies for most research applications. Their tight matrix structure enables separation of proteins with minimal molecular weight differences, making them indispensable for proteomics and standard protein characterization.
Agarose gels emerge as the specialized solution for analyzing very large protein complexes, supramolecular structures, and high molecular weight therapeutic proteins that exceed the separation range of SDS-PAGE. With demonstrated capability to resolve proteins from 200 to 4,000 kDa, agarose-based electrophoresis addresses a critical gap in the protein analyst's toolkit [82] [80]. The recent development of baseline hump-free capillary agarose electrophoresis further establishes this technology as essential for biopharmaceutical applications requiring precise quantification of massive protein assemblies [81].
Strategic gel selection should be guided by protein size, required resolution, safety considerations, and downstream applications. For large complexes and supramolecular structures, agarose gel electrophoresis provides an powerful, accessible, and robust platform that enables research previously constrained by technical limitations. As protein therapeutics continue to increase in molecular complexity and size, agarose-based separation methods will play an increasingly vital role in advancing biopharmaceutical characterization and development.
In protein separation research, the choice between polyacrylamide and agarose gel electrophoresis is fundamental, dictating the resolution, accuracy, and ultimately, the validity of the experimental results. While polyacrylamide gels,
with their small pore sizes, are the undisputed standard for separating most proteins based on molecular weight, agarose gels find a niche in specialized applications such as the analysis of very large protein complexes or nucleic acid-protein interactions. This guide objectively compares the performance of these two mediums, focusing on the critical follow-up techniques that validate the separation: the use of molecular weight markers for size determination and in-gel activity assays for functional confirmation. The reliability of data in downstream applications—from western blotting to mass spectrometric profiling—hinges on the precise and accurate validation of the initial separation [15]. Within the context of a broader thesis on gel selection, this guide provides researchers and drug development professionals with the experimental data and protocols necessary to make an informed choice and to implement robust validation of their results.
Gel Comparison: Polyacrylamide vs. Agarose for Protein Separation
The selection of a gel matrix is the first and most critical step in designing an electrophoresis experiment. The following table provides a direct comparison of the key characteristics of polyacrylamide and agarose gels for protein analysis.
Table 1: Comparison of Polyacrylamide and Agarose Gels for Protein Separation
| Feature | Polyacrylamide Gel | Agarose Gel |
|---|---|---|
| Typical Use Case | Standard protein separation (SDS-PAGE), high-resolution analysis [86] | Very high molecular weight proteins (>500 kDa), protein complexes, nucleic acids [29] [8] |
| Separation Matrix | Cross-linked polymer of acrylamide and bis-acrylamide [8] | Polysaccharide derived from seaweed [29] [8] |
| Pore Size | Small, tunable by adjusting acrylamide concentration [8] | Large, tunable by adjusting agarose percentage [29] [8] |
| Resolution | High; can separate proteins differing by ~1-2% in mass [87] [8] | Low; suitable for resolving large size differences [8] |
| Optimum Size Range | 1 - 500 kDa [8] | > 500 kDa (for proteins) [8] |
| Handling & Safety | Complex preparation; acrylamide is a neurotoxin [29] [8] | Simple and safe preparation [8] |
As the data indicates, polyacrylamide gels are the workhorse for routine protein separation due to their superior resolving power. However, for specific challenges, such as analyzing massive protein complexes, the larger pore structure of agarose gels may be necessary, albeit at the cost of resolution [8].
Experimental Data and Performance Comparison
Quantitative Performance Metrics
The theoretical advantages of polyacrylamide gels translate into tangible performance benefits, as evidenced by experimental data. The following table summarizes key quantitative metrics that impact the sensitivity and reliability of profiling in proteomic applications.
Table 2: Analytical Performance of Gel-Based Fractionation Techniques in Proteomic Profiling
| Technique | Profiling Sensitivity | Dynamic Range | Average Peptides per Protein | Key Advantage |
|---|---|---|---|---|
| 1-D SDS-PAGE | High | High | Good | Effective complexity reduction for LC-ESI-MS/MS [15] |
| IEF-IPG | High | High | Highest | Superior for quantitative and structural protein characterization [15] |
| 2-D PAGE | Moderate | Moderate | Good | Orthogonal separation by pI and MW [15] |
A comparative study of gel-based separation techniques for mass spectrometry found that while 1-D SDS-PAGE and isoelectric focusing in immobilized pH gradients (IEF-IPG) yielded the highest number of protein identifications, the IEF-IPG technique resulted in the highest average number of detected peptides per protein. This is a significant advantage for both quantitative analysis and confident protein characterization [15]. It is important to note that all techniques provided complementary identification results, suggesting that an orthogonal combination of methods can maximize profiling sensitivity.
Special Considerations for High Molecular Weight (HMW) Proteins
The transfer of HMW proteins (>150 kDa) from the gel to a membrane for western blotting is a common bottleneck. Experimental data demonstrates that successful validation of HMW proteins requires optimization of both the gel chemistry and transfer conditions.
- Gel Chemistry: A comparison of serially diluted A431 cell lysate showed a dramatic improvement in the detection of ~190 kDa EGFR when using a 3–8% Tris-acetate gel instead of a popular 4–20% Tris-glycine gel. While 750 ng of protein was needed for visualization on the Tris-glycine gel, only 9 ng was required on the Tris-acetate gel, highlighting a significant increase in transfer efficiency and sensitivity [88].
- Transfer Time: For HMW proteins, increasing the transfer time is critical. Research using the iBlot 2 Gel Transfer Device showed that for a ~190 kDa protein, extending the transfer time from the standard 7 minutes to 8-10 minutes at 25 V resulted in the most efficient transfer and detection [88].
- Gel Pretreatment: When not using an ideal gel chemistry like Tris-acetate, a quick equilibration step in 20% ethanol before transfer can greatly enhance the transfer of HMW proteins. This step removes contaminating salts and adjusts the gel to its final size, preventing overheating and improving transfer efficiency [88].
Detailed Experimental Protocols
Standard SDS-PAGE Protocol for Protein Separation
This is a foundational protocol for separating proteins by molecular weight using a polyacrylamide gel, a prerequisite for subsequent validation [86].
- Gel Preparation: Cast a polyacrylamide gel with an appropriate acrylamide percentage for your target protein size range. The gel consists of a stacking gel (e.g., 5%) and a resolving gel (e.g., 8%, 10%, 12% or 15%).
- Sample Preparation: Mix protein samples with Laemmli loading buffer, which contains SDS and a reducing agent like DTT [89]. Heat the samples at 95-100°C for 5-10 minutes to fully denature the proteins.
- Electrophoresis: Load the samples and a molecular weight marker into the wells. Submerge the gel in running buffer and apply a constant voltage (e.g., 80 V through the stacking gel, then 120 V through the resolving gel) until the dye front reaches the bottom of the gel [89].
In-Gel Protein Digestion for Mass Spectrometry (GeLC-MS/MS)
This protocol outlines how to process gel-separated proteins for identification by mass spectrometry, a powerful validation method [15].
- Gel Staining and Excision: After electrophoresis, stain the gel with a compatible stain (e.g., Coomassie Brilliant Blue or SYPRO Ruby) to visualize protein bands. Excise the bands of interest using a clean scalpel.
- Destaining and Washing: For Coomassie-stained gels, destain the gel pieces with a solution of 50% methanol and 10% acetic acid. Wash the pieces with 50% acetonitrile in 25 mM ammonium bicarbonate to remove residual stain and acid.
- Reduction and Alkylation: Reduce proteins by incubating gel pieces with 10 mM DTT at 56°C for 30-60 minutes. Then, alkylate with 55 mM iodoacetamide at room temperature in the dark for 30 minutes.
- In-Gel Digestion: Wash and dehydrate the gel pieces with acetonitrile. Add a sequencing-grade modified trypsin (10-15 ng/µL) in a minimal volume of digestion buffer (25 mM ammonium bicarbonate) and incubate at 37°C for 4-16 hours.
- Peptide Extraction: Extract peptides from the gel pieces by adding a solution containing 50% acetonitrile and 1-5% formic acid. Combine the supernatants and concentrate the extracted peptides in a vacuum centrifuge for LC-ESI-MS/MS analysis.
Optimized Western Blotting for HMW Proteins
This protocol provides specific modifications for the successful transfer and detection of HMW proteins [88].
- Gel Selection: Use a low-percentage Tris-acetate gel (e.g., 3-8%) for optimal separation and transfer of HMW proteins.
- Gel Equilibration (if needed): If using a Bis-Tris or Tris-glycine gel, submerge the gel in 20% ethanol for 5-10 minutes at room temperature with gentle shaking prior to transfer.
- Membrane and Stack Preparation: Assemble the transfer stack according to the manufacturer's instructions for a wet, semi-dry, or dry transfer system.
- Transfer Conditions: Increase the transfer time beyond standard protocols. For a rapid dry transfer system like the iBlot 2, use a program with a run time of 8-10 minutes at 20-25 V for proteins >150 kDa.
- Detection: Proceed with standard blocking, antibody probing, and visualization steps.
Experimental Workflow and Decision Pathway
The following diagram illustrates the logical workflow for separating and validating proteins, incorporating key decision points for gel selection and validation methods based on experimental goals.
Diagram 1: Protein Separation and Validation Workflow.
The Scientist's Toolkit: Key Research Reagent Solutions
Successful execution of the described experiments relies on a set of essential reagents and materials. The following table details these key items and their functions.
Table 3: Essential Reagents for Gel Electrophoresis and Validation
| Item | Function | Key Considerations |
|---|---|---|
| Acrylamide/Bis-Acrylamide | Forms the cross-linked polyacrylamide gel matrix for size-based separation [86]. | A neurotoxin in powder form; use with appropriate PPE or purchase pre-mixed solutions [29]. |
| SDS (Sodium Dodecyl Sulfate) | Denatures proteins and confers a uniform negative charge, allowing separation by size alone [86]. | Critical for SDS-PAGE. Quality can affect band sharpness. |
| Molecular Weight Markers (Protein Ladder) | Provides size standards for estimating the molecular weight of unknown proteins [86]. | Can be prestained for real-time tracking or unstained for higher accuracy. |
| Laemmli Loading Buffer | Contains SDS, a reducing agent (e.g., β-mercaptoethanol or DTT), glycerol, and a tracking dye for sample preparation [89]. | The reducing agent breaks disulfide bonds for full denaturation. |
| SYPRO Ruby / Coomassie Dye | Fluorescent (SYPRO) or colorimetric (Coomassie) stains for visualizing proteins in gels post-electrophoresis [87] [15]. | SYPRO Ruby is more sensitive and compatible with MS. Coomassie is cost-effective. |
| PVDF or Nitrocellulose Membrane | The solid support for western blotting; proteins are transferred from the gel onto this membrane [88]. | PVDF is more durable and has higher protein binding capacity. |
| Primary & Secondary Antibodies | Enable immunodetection of a specific target protein (primary) and generate a signal (secondary) [88]. | Specificity and titer are paramount for a clean, strong signal. |
| Trypsin, Sequencing Grade | Protease used for in-gel digestion of proteins into peptides for mass spectrometric analysis [15]. | Sequencing grade ensures high purity and minimal autolysis. |
The validation of results through molecular weight markers and complementary assays is not merely a final step, but an integral part of the experimental design that begins with the informed selection of a separation matrix. For the vast majority of protein research, polyacrylamide gel electrophoresis remains the gold standard, offering the resolution required for reliable size estimation and downstream functional analysis. Agarose gels, while less common, provide a necessary tool for tackling specific challenges involving very large biomolecules. The experimental data and protocols provided here underscore that rigorous validation is achievable through careful optimization of conditions, particularly for difficult targets like HMW proteins. By applying these comparison guidelines and detailed methodologies, researchers can ensure the accuracy and credibility of their data, thereby strengthening the foundation for scientific discovery and drug development.
The choice of gel matrix for protein separation—agarose or polyacrylamide—fundamentally shapes the landscape of downstream analytical techniques. For researchers in biomedical science and drug development, selecting the appropriate gel is a critical decision point that determines the success of Western blotting and mass spectrometry applications. While polyacrylamide gels have long been the standard for protein work, recent methodological advances have expanded the utility of agarose gels into domains once exclusive to their polyacrylamide counterparts. This guide provides a comparative analysis of both matrices, examining their performance characteristics through experimental data to inform evidence-based protocol selection.
Gel Fundamentals: A Structural and Functional Comparison
The divergent properties of agarose and polyacrylamide gels stem from their distinct chemical compositions and structural architectures.
Polyacrylamide gels are synthetic polymers created through the co-polymerization of acrylamide and bis-acrylamide, forming a tight, highly uniform mesh with precisely tunable pore sizes. This controlled pore structure enables superior resolution for separating proteins and small nucleic acids, typically through techniques like SDS-PAGE where separation occurs primarily based on molecular mass [90] [5]. A significant handling consideration is that the unpolymerized acrylamide monomer is a potent neurotoxin, requiring strict safety protocols during gel preparation [5].
Agarose gels are derived from natural seaweed polysaccharides that form a porous matrix through non-covalent associations when cooled. The resulting pore structure is larger and less uniform than polyacrylamide, making it ideal for separating larger molecules like DNA fragments and proteins under native conditions. Agarose gels are non-toxic and significantly simpler to prepare, requiring only dissolution in buffer and pouring into molds without chemical polymerization [90] [5].
Table 1: Fundamental Properties of Agarose and Polyacrylamide Gels
| Property | Agarose Gel | Polyacrylamide Gel |
|---|---|---|
| Origin | Natural polymer (seaweed) | Synthetic polymer |
| Pore Size | Large, non-uniform | Small, uniform, tunable |
| Polymerization | Physical (cooling) | Chemical (toxic monomers) |
| Typical Protein Applications | Native protein separation, large complexes | SDS-PAGE, high-resolution separation |
| Safety Considerations | Non-toxic | Neurotoxic monomer (requires PPE) |
| Primary Separation Mechanism | Molecular sieving (large molecules) | Molecular sieving (small molecules) |
Western Blotting Compatibility
Western blotting remains a cornerstone technique for protein analysis, and both gel types offer distinct advantages and limitations for this application.
Polyacrylamide Gels: The Established Standard
Polyacrylamide gels, particularly through SDS-PAGE separation, represent the conventional platform for Western blotting. The denaturing conditions of SDS-PAGE ensure proteins are linearized and uniformly negatively charged, facilitating efficient transfer to membranes during electroblotting. The fine pore structure of polyacrylamide enables high-resolution separation of proteins, allowing distinction of molecules with minimal mass differences—a crucial capability for detecting post-translational modifications or closely related protein isoforms [90] [91].
Recent innovations have further enhanced polyacrylamide utility. A novel 96-well polyacrylamide gel system conforming to standard microplate dimensions demonstrates significantly increased throughput. This horizontal submerged gel electrophoresis approach provides an approximately 8-fold improvement in efficiency for cost and time while maintaining compatibility with both wet and semi-dry transfer methods, though with a tradeoff of reduced molecular weight resolution due to shorter migration distances [92].
Agarose Gels: Emerging Applications
While traditionally limited for protein work, agarose gels have demonstrated unexpected utility in Western blotting applications, particularly for native protein analysis. Research has established protocols for blotting proteins separated by agarose native gel electrophoresis to PVDF membranes after soaking the gel in SDS-containing transfer buffer. This approach preserves native protein structures and complexes, enabling analysis of phosphorylation states (e.g., MAP kinase) and oligomerization phenomena (e.g., β-galactosidase) that might be disrupted by denaturing conditions [91].
The key advantage of agarose in this context is the maintenance of native protein conformation, allowing researchers to probe structural aspects of proteins and their complexes. However, the larger pore structure of agarose gels results in significantly lower resolution compared to polyacrylamide, making them unsuitable for distinguishing proteins of similar mass [91].
Table 2: Western Blotting Performance Comparison
| Parameter | Agarose Gel | Polyacrylamide Gel |
|---|---|---|
| Transfer Efficiency | Requires SDS-soaking for efficient transfer [91] | High efficiency for SDS-PAGE separated proteins [93] |
| Native Protein Analysis | Excellent (preserves complexes) [91] | Limited (denaturing conditions typical) |
| Resolution | Lower (broader bands) [91] | High (sharp bands) [90] |
| Throughput Potential | Standard format | High (96-well format available) [92] |
| Typical Applications | Native complexes, oligomerization studies [91] | Standard protein characterization, phospho-analysis [91] |
Mass Spectrometry Compatibility
Mass spectrometry has become indispensable for proteomic analysis, and gel compatibility significantly impacts downstream MS results.
Polyacrylamide Gels: The Proteomics Workhorse
Polyacrylamide gels serve as the primary separation medium for most bottom-up proteomics workflows. Following electrophoresis, proteins are typically subjected to in-gel digestion with trypsin before LC-MS/MS analysis. The fine polyacrylamide matrix is compatible with MS analysis, though precautions must be taken to remove polyacrylamide residues that could interfere with chromatography or ionization [94].
The high resolution of polyacrylamide gels is particularly valuable for MS-based proteomics, as it reduces sample complexity by separating proteins prior to digestion, thereby enhancing proteome coverage. Modern high-resolution mass spectrometers combined with polyacrylamide separations enable "precision proteomics" approaches that can identify and quantify nearly all fragmented peptide peaks with extremely high accuracy [94].
Agarose Gels: Specialized Applications
Agarose gels find particular utility in MS analysis of large proteins and complexes. A technique known as polyacrylamide lamination enables MS-compatible staining and in-gel digestion of proteins initially separated by agarose IEF (isoelectric focusing). This approach combines the advantage of agarose—separation of large proteins and complexes—with the MS compatibility of polyacrylamide, creating a seamless laminate gel suitable for sensitive detection and protein identification [95].
For specialized applications like preparative gel electrophoresis-electrodialysis, agarose gels effectively clean up complex biological samples such as organoid cell medium prior to LC-MS analysis. This method significantly reduces matrix interferences, improving sensitivity and selectivity for challenging targets like insulin [96].
Additionally, low-melting point agarose has emerged as an optimal embedding medium for MALDI mass spectrometry imaging and laser-capture microdissection-based proteomics. Unlike other embedding compounds that cause ion suppression, 2% low-melting point agarose provides structural support for sectioning without interfering with MS analysis, producing results comparable to non-embedded samples [97].
Table 3: Mass Spectrometry Compatibility Comparison
| Parameter | Agarose Gel | Polyacrylamide Gel |
|---|---|---|
| In-Gel Digestion | Possible with lamination technique [95] | Standard protocol [94] |
| Large Protein Analysis | Excellent for large proteins/complexes [95] | Limited for very large complexes |
| Sample Cleanup | Effective for complex matrices [96] | Less common for this application |
| MS Imaging Compatibility | Excellent (low-melting point agarose) [97] | Not typically used for tissue embedding |
| Proteome Coverage | Lower resolution limits complexity reduction | High resolution enhances coverage [94] |
Experimental Protocols
Western Blotting from Agarose Native Gels
For researchers requiring native protein analysis, Western blotting from agarose gels follows a modified protocol:
Methodology: Following native electrophoresis in His/Mes buffer, agarose gels are soaked in Tris-glycine-SDS running buffer to impart uniform negative charge to proteins. Transfer to PVDF membranes is performed using a semi-dry transfer system. This approach has successfully demonstrated application for analyzing recombinant antibody expression, phosphorylation states of MAP kinase, and oligomerization of β-galactosidase [91].
Key Considerations:
- Soaking in SDS-containing buffer is essential for efficient transfer
- Native conditions preserve protein complexes and activity
- Resolution is inferior to polyacrylamide systems
Polyacrylamide Lamination for MS Analysis
To enable MS compatibility for agarose-separated proteins, a lamination technique has been developed:
Methodology: After protein separation via agarose IEF, a layer of polyacrylamide is poured over the agarose gel, creating a durable laminate that can be detached from its polyester support. The resulting gel is amenable to MS-compatible staining (sensitivity of 20-50 ng/band for myoglobin using acidic silver staining) and standard in-gel digestion protocols for generation of tryptic peptides for MALDI-MS analysis [95].
Key Considerations:
- Combines large protein separation capability of agarose with MS compatibility of polyacrylamide
- Enables analysis of proteins separated in agarose IEF that would otherwise be challenging for MS
Decision Framework: Selecting the Appropriate Gel Matrix
Choosing between agarose and polyacrylamide requires careful consideration of experimental goals and downstream applications.
Select agarose gels when:
- Analyzing proteins under native conditions is essential [91]
- Working with large protein complexes that may not enter polyacrylamide gels [95]
- Performing preparative separation for sample cleanup prior to LC-MS [96]
- Utilizing MALDI-MS imaging with embedded tissues (low-melting point agarose) [97]
Select polyacrylamide gels when:
- High-resolution separation is required for complex protein mixtures [90] [94]
- Standard Western blotting under denaturing conditions is sufficient [93]
- Maximum proteome coverage for bottom-up proteomics is desired [94]
- High-throughput analysis is needed (96-well format) [92]
Essential Research Reagent Solutions
Successful implementation of either electrophoretic method requires specific reagents and materials optimized for each matrix.
Table 4: Essential Research Reagents for Gel Electrophoresis
| Reagent/Material | Function | Agarose-Specific | Polyacrylamide-Specific |
|---|---|---|---|
| Low-Melting Point Agarose | Tissue embedding for MS imaging | Critical for MALDI-MSI [97] | Not applicable |
| Acrylamide/Bis-acrylamide | Gel formation | Not used | Essential component [5] |
| TEMED/Ammonium Persulfate | Polymerization catalyst | Not used | Required for polymerization [93] |
| SDS Transfer Buffer | Western transfer facilitation | Required for efficient transfer [91] | Standard component |
| PVDF/Nitrocellulose Membranes | Protein immobilization | Compatible with modified protocols [91] | Standard for Western blotting [93] |
| Modified Running Buffer | Electrophoresis acceleration | Not typically modified | Tris-glycine-HEPES for fast runs [93] |
The decision between agarose and polyacrylamide gels for protein separation requires careful evaluation of downstream applications. Polyacrylamide remains the superior choice for high-resolution Western blotting and bottom-up proteomics, offering exceptional resolving power and established protocols. However, agarose gels provide unique capabilities for native protein analysis, large complex separation, and specialized MS applications. Recent methodological advances have expanded the utility of both matrices, enabling researchers to select the optimal platform based on specific experimental requirements in drug development and basic research.
Selecting the appropriate gel matrix is a critical, foundational step in protein electrophoresis, directly determining the resolution, accuracy, and success of an experiment. Within the context of protein separation research, the choice fundamentally hinges on the specific analytical goals, as the physicochemical properties of agarose and polyacrylamide gels cater to vastly different applications. This guide provides a structured, data-driven framework to help researchers navigate this essential decision.
Fundamental Principles and Comparative Analysis
Gel electrophoresis separates proteins based on their migration through a porous matrix under an electric field. The key differentiator between agarose and polyacrylamide lies in the structure and size of these pores.
- Agarose Gels are formed from a polysaccharide polymer derived from seaweed, creating a matrix with large, non-uniform pores through non-covalent association of polymer chains [5]. This structure is ideal for separating very large macromolecules.
- Polyacrylamide Gels are synthetic polymers created through a chemical reaction between acrylamide and a cross-linker (bis-acrylamide). This forms a tight, highly ordered mesh with uniform, tunable pores. The pore size can be precisely controlled by adjusting the total monomer concentration (%T) and the cross-linker ratio (%C), making it superior for separating smaller molecules with high resolution [5].
The following table summarizes the core differences that inform their application domains.
Table 1: Core Characteristics of Agarose and Polyacrylamide Gels
| Feature | Agarose Gel | Polyacrylamide Gel |
|---|---|---|
| Pore Size | Large, non-uniform [5] | Small, uniform, and tunable [5] |
| Typical Molecules Separated | Large DNA/RNA (100 bp to 25 kbp and beyond) [5] | Proteins, small DNA/RNA fragments (< 1 kbp) [5] |
| Sieving Mechanism | Random mesh of polymer chains [5] | Defined mesh with consistent pore size [5] |
| Primary Application | Nucleic acid electrophoresis [5] | Protein electrophoresis (SDS-PAGE, Native PAGE) [5] |
| Preparation | Simple melting and pouring [5] | Chemical polymerization (requires a catalyst) [5] |
| Toxicity | Non-toxic [5] | Acrylamide monomer is a potent neurotoxin [5] |
| Resolution | Lower (sufficient for large molecules) [5] | Higher (can distinguish minute mass differences) [5] |
Experimental Protocols for Protein Separation
For protein separation, polyacrylamide gel electrophoresis (PAGE) is the unequivocal standard. The most common form is SDS-PAGE (Sodium Dodecyl Sulfate-PAGE), which allows for separation based almost exclusively on molecular weight.
Detailed SDS-PAGE Protocol
Principle: The anionic detergent SDS denatures proteins and confers a uniform negative charge per unit mass, overriding the proteins' inherent charge. This ensures migration through the polyacrylamide gel is determined solely by polypeptide chain length [5].
Materials & Reagents:
- Polyacrylamide Gel: Pre-cast gels are commercially available (e.g., from Invitrogen [98]) or can be hand-cast using acrylamide/bis-acrylamide solutions.
- SDS-PAGE Running Buffer: Typically Tris-Glycine buffer containing SDS.
- Protein Sample Buffer: Contains SDS, a reducing agent (e.g., DTT or β-mercaptoethanol) to break disulfide bonds, glycerol, and a tracking dye.
- Protein Standards: A mixture of proteins of known molecular weight for calibration.
- Electrophoresis Apparatus: Includes a gel tank and power supply.
Workflow:
- Sample Preparation: Mix protein samples with SDS-PAGE sample buffer. Heat the samples at 95-100°C for 5-10 minutes to ensure complete denaturation.
- Gel Setup: Place the polyacrylamide gel into the electrophoresis chamber and fill the buffer chambers with running buffer.
- Loading: Carefully load the prepared samples and molecular weight standards into the wells of the gel.
- Electrophoresis: Connect the power supply and run the gel at a constant voltage (e.g., 120-200V) until the tracking dye front reaches the bottom of the gel.
- Detection: Following separation, proteins are typically visualized using stains like Coomassie Brilliant Blue or silver stain, or transferred to a membrane for western blotting.
GeLC-MS/MS: A Powerful Fractionation Application
A key application of SDS-PAGE in proteomics is GeLC-MS/MS (Gel Electrophoresis Liquid Chromatography Tandem Mass Spectrometry). In this technique, a complex protein sample is first separated on a 1-D SDS-PAGE gel. The entire gel lane is then excised into multiple fractions (bands), each of which is subjected to in-gel enzymatic digestion. The resulting peptide mixtures from each fraction are finally analyzed by nanoLC-MS/MS [15]. This method effectively fractionates complex samples at the protein level, simplifying the peptide mixture for MS analysis and improving profiling sensitivity and dynamic range [15].
Data-Driven Decision Matrix
The choice between gel types is not a matter of preference but of technical requirement. The following decision matrix provides a clear framework for selection based on experimental goals.
Protein Separation Decision Workflow
The Scientist's Toolkit: Essential Research Reagents
Successful protein electrophoresis relies on a set of key reagents and materials. The following table outlines essential solutions and their functions.
Table 2: Essential Reagents for Protein Gel Electrophoresis
| Research Reagent Solution | Function | Key Considerations |
|---|---|---|
| Polyacrylamide Gel Matrix | Forms the sieving matrix for high-resolution separation of proteins. | Pore size is tuned via %T and %C. Pre-cast gels offer convenience and reproducibility [98]. |
| SDS (Sodium Dodecyl Sulfate) | Denatures proteins and imparts a uniform negative charge, enabling separation by mass alone [5]. | Critical for SDS-PAGE. Must be of high purity. |
| APS & TEMED | Ammonium persulfate (APS) and Tetramethylethylenediamine (TEMED) catalyze the polymerization of acrylamide to form the gel [99]. | Unpolymerized acrylamide is a neurotoxin; proper safety gear (gloves, lab coat) is essential [5]. |
| Tris-Glycine-SDS Buffer | The standard running buffer for SDS-PAGE; provides ions for conductivity and maintains pH. | |
| Loading Buffer/Dye | Contains a dye to track migration and glycerol to density-load samples into wells. | Includes SDS and a reducing agent. |
| Protein Molecular Weight Standard | A cocktail of known proteins used to estimate the molecular weight of unknown samples. | Essential for calibration and analysis. |
The decision between agarose and polyacrylamide for protein separation is unequivocally resolved in favor of polyacrylamide gels. Their tunable, uniform pore structure provides the high resolution necessary to separate proteins, which are typically much smaller than the DNA fragments routinely analyzed on agarose gels [5]. As demonstrated, techniques like SDS-PAGE and its application in GeLC-MS/MS are cornerstone methods in biochemistry and proteomics, enabling everything from routine protein analysis to deep, sensitive profiling of complex biological samples. By applying the decision matrix and protocols outlined in this guide, researchers can make an informed, technically sound choice that ensures the integrity and success of their experiments.
Conclusion
The choice between polyacrylamide and agarose gels for protein separation is not a matter of superiority but of specific application. Polyacrylamide gels, with their tunable, small pore sizes, are unequivocally the workhorse for high-resolution separation of most proteins, enabling precise analysis by molecular weight via SDS-PAGE or by native charge and structure via Native-PAGE. Agarose gels serve a niche but vital role in analyzing very large protein complexes. The ongoing validation of techniques like BN-PAGE for studying oxidative phosphorylation complexes underscores the evolving role of gel electrophoresis in functional proteomics. As research moves towards more complex biomarker discovery and analysis of protein-protein interactions, a firm grasp of these foundational tools remains critical for advancing drug development and clinical diagnostics, ensuring that researchers can extract the maximum amount of reliable data from their samples.
References
- 1. Agarose Gel Electrophoresis for the Separation of DNA ... [https://pmc.ncbi.nlm.nih.gov/articles/PMC4846332/]
- 2. Agarose gel electrophoresis [https://en.wikipedia.org/wiki/Agarose_gel_electrophoresis]
- 3. Agarose vs Polyacrylamide: A Comparative Analysis [https://www.assaygenie.com/blog/agarose-vs-polyacrylamide?srsltid=AfmBOoo_fG8k38Rgj2b3Gbjboz9AwmGKlQf7xgtbaDmAX70ufq8OyC0O]
- 4. Five Considerations for the Nucleic Acid Gel ... [https://www.thermofisher.com/us/en/home/life-science/cloning/cloning-learning-center/invitrogen-school-of-molecular-biology/na-electrophoresis-education/na-electrophoresis-considerations.html]
- 5. Choosing Between Agarose and Polyacrylamide Gels [https://www.labx.com/resources/choosing-between-agarose-and-polyacrylamide-gels-a-comparative-guide/5537]
- 6. Polyacrylamide gel electrophoresis [https://en.wikipedia.org/wiki/Polyacrylamide_gel_electrophoresis]
- 7. Overview of Protein Electrophoresis [https://www.thermofisher.com/us/en/home/life-science/protein-biology/protein-biology-learning-center/protein-biology-resource-library/pierce-protein-methods/overview-electrophoresis.html]
- 8. Gel Electrophoresis 101: How to Choose Between Agarose ... [https://synapse.patsnap.com/article/gel-electrophoresis-101-how-to-choose-between-agarose-and-polyacrylamide]
- 9. Polyacrylamide gel electrophoresis: a versatile tool for the ... [https://pmc.ncbi.nlm.nih.gov/articles/PMC9887536/]
- 10. A method for high-concentration agarose gel preparation ... [https://www.sciencedirect.com/science/article/abs/pii/S0141813023002441]
- 11. Polyacrylamide Gel - an overview [https://www.sciencedirect.com/topics/medicine-and-dentistry/polyacrylamide-gel]
- 12. Evaluation of techniques used for visualisation of hydrogel ... [https://pubs.rsc.org/en/content/articlehtml/2023/ma/d2ma00932c]
- 13. Size Effects on Diffusion Processes within Agarose Gels [https://pmc.ncbi.nlm.nih.gov/articles/PMC1304142/]
- 14. Comparison of different separation technologies for ... [https://www.sciencedirect.com/science/article/abs/pii/S0021967306011319]
- 15. Comparison of in-gel protein separation techniques ... [https://pmc.ncbi.nlm.nih.gov/articles/PMC4234072/]
- 16. SURE gel electrophoresis: A method for improved ... [https://pmc.ncbi.nlm.nih.gov/articles/PMC11733979/]
- 17. Polysaccharide as a Separation Medium for Gel ... [https://www.mdpi.com/2673-4176/5/3/24]
- 18. What is Agarose? A Comprehensive Guide to Its Properties ... [https://ingreland.com/insights/what-is-agarose/]
- 19. Rapid baseline hump-free analysis of therapeutic proteins ... [https://www.sciencedirect.com/science/article/pii/S0003267025005410]
- 20. Trends development and applications on electrophoresis ... [https://www.sciencedirect.com/science/article/abs/pii/S0039914025005193]
- 21. Understanding Pore Size and Gel Properties – PAM ... [https://witcarbon.com/agarose-vs-polyacrylamide-understanding-pore-size-and-gel-properties/]
- 22. What are the advantages of polyacrylamide gel? [https://www.aatbio.com/resources/faq-frequently-asked-questions/what-are-the-advantages-of-polyacrylamide-gel]
- 23. SDS-PAGE [https://en.wikipedia.org/wiki/SDS-PAGE]
- 24. The Evolution of SDS-Based Protein Separation [https://www.bio-techne.com/resources/blogs/advantages-of-ce-sds]
- 25. Native PAGE Gels | Thermo Fisher Scientific - US [https://www.thermofisher.com/us/en/home/life-science/protein-biology/protein-gel-electrophoresis/protein-gels/specialized-protein-gels/nativepage-bis-tris-gels.html]
- 26. Western blotting guide: Part 2, Protein separation by SDS- ... [https://www.jacksonimmuno.com/secondary-antibody-resource/technical-tips/western-blotting-guide-part-2/]
- 27. Native SDS-PAGE: High Resolution Electrophoretic ... [https://pmc.ncbi.nlm.nih.gov/articles/PMC4517606/]
- 28. Native Agarose Gels and Contact Blotting as Means to ... [https://pmc.ncbi.nlm.nih.gov/articles/PMC10604731/]
- 29. Running agarose and polyacrylamide gels [https://eu.idtdna.com/page/support-and-education/decoded-plus/running-agarose-and-polyacrylamide-gels/]
- 30. High-throughput proteomics: a methodological mini-review [https://www.nature.com/articles/s41374-022-00830-7]
- 31. Basics and recent advances of two dimensional [https://pmc.ncbi.nlm.nih.gov/articles/PMC3996944/]
- 32. 2D protein electrophoresis: can it be perfected? [https://www.sciencedirect.com/science/article/abs/pii/S0958166999800044]
- 33. Advanced Proteomics Techniques [https://www.technologynetworks.com/proteomics/articles/exploring-proteomics-techniques-from-mass-spectrometry-to-shotgun-405802]
- 34. UNIT 10.4 Comparing Complex Protein Samples Using Two ... [https://pmc.ncbi.nlm.nih.gov/articles/PMC6579672/]
- 35. and clear-native polyacrylamide gel electrophoresis protocols ... [https://journals.plos.org/plosone/article?id=10.1371/journal.pone.0332065]
- 36. Differences between SDS PAGE and Native PAGE [https://www.geeksforgeeks.org/biology/differences-between-sds-page-and-native-page/]
- 37. Validation of blue- and clear-native polyacrylamide gel ... [https://pubmed.ncbi.nlm.nih.gov/40966204/]
- 38. High Resolution Clear Native Electrophoresis for In-gel ... [https://www.sciencedirect.com/science/article/pii/S153594762031690X]
- 39. Blue native electrophoresis protocol [https://www.abcam.com/en-us/technical-resources/protocols/blue-native-electrophoresis]
- 40. High-resolution native electrophoresis in-gel activity assay ... [https://www.nature.com/articles/s41598-025-24684-3]
- 41. Validation of blue- and clear-native polyacrylamide gel ... [https://pmc.ncbi.nlm.nih.gov/articles/PMC12445495/]
- 42. Two-dimensional Blue Native/SDS Gel Electrophoresis of ... [https://www.sciencedirect.com/science/article/pii/S1535947620334228]
- 43. Qualitative and quantitative evaluation of thylakoid complexes ... [https://plantmethods.biomedcentral.com/articles/10.1186/s13007-022-00858-2]
- 44. Improving SDS-PAGE method for monoclonal antibodies [https://pubmed.ncbi.nlm.nih.gov/33596474/]
- 45. The gradient-like separation and reduced running time with ... [https://www.sciencedirect.com/science/article/abs/pii/S0003269722002457]
- 46. Novex Tris-Glycine Gels [https://www.thermofisher.com/us/en/home/life-science/protein-biology/protein-gel-electrophoresis/protein-gels/novex-tris-glycine-gels.html]
- 47. A comparison of Tris-glycine and Tris-tricine buffers for the ... [https://pubmed.ncbi.nlm.nih.gov/21818850/]
- 48. Agarose vs Polyacrylamide: A Comparative Analysis [https://www.assaygenie.com/blog/agarose-vs-polyacrylamide?srsltid=AfmBOorhFTHfijxT1kWLlW_Pr9GAJcUKGiEga-ntA3d7mYuPaxv01BF0]
- 49. of Electrophoresis Optimization Concentration | AAT Bioquest Gel [https://www.aatbio.com/resources/application-notes/optimization-of-electrophoresis-gel-concentration]
- 50. Tricine-sodium dodecyl sulfate- polyacrylamide electrophoresis for... gel [https://pubmed.ncbi.nlm.nih.gov/2449095/]
- 51. A method for easily customizable gradient gel ... [https://www.sciencedirect.com/science/article/abs/pii/S0003269716301701]
- 52. Troubleshooting SDS-PAGE Gel Running Issues [https://www.goldbio.com/blogs/articles/troubleshooting-sds-page-gel-running-issues?srsltid=AfmBOoomhtw07DoZrUzfct_2ummw2sHd8bWLN7qz5Rd5Fz8FqUcoPM7D]
- 53. Nucleic Acid Gel Electrophoresis Troubleshooting [https://www.thermofisher.com/us/en/home/life-science/cloning/cloning-learning-center/invitrogen-school-of-molecular-biology/na-electrophoresis-education/na-electrophoresis-troubleshooting.html]
- 54. Gel electrophoresis-based proteoform separation and ... [https://pubmed.ncbi.nlm.nih.gov/40645673/]
- 55. Agarose Gel Electrophoresis: Principle, Parts, Steps, Uses [https://microbenotes.com/agarose-gel-electrophoresis/]
- 56. SDS-PAGE Electrophoresis Market - Global Forecast 2025- ... [https://www.researchandmarkets.com/reports/6140756/sds-page-electrophoresis-market-global?srsltid=AfmBOooIJv7gdNmxIwp95n1Cis-i84QYetBrSwDOsZaiM5mspREn-Ggk]
- 57. Entropy-driven denaturation enables sustainable protein ... [https://www.nature.com/articles/s41467-025-61959-9]
- 58. Steps in Nucleic Acid Gel Electrophoresis [https://www.thermofisher.com/us/en/home/life-science/cloning/cloning-learning-center/invitrogen-school-of-molecular-biology/na-electrophoresis-education/na-electrophoresis-workflow.html]
- 59. Electrophoresis of proteins and DNA on horizontal sodium ... [https://pmc.ncbi.nlm.nih.gov/articles/PMC1538630/]
- 60. Electrophoresis [https://pubmed.ncbi.nlm.nih.gov/36251838/]
- 61. Electrophoresis, How It... | Technology Networks Polyacrylamide Gel [https://www.technologynetworks.com/analysis/articles/polyacrylamide-gel-electrophoresis-how-it-works-technique-variants-and-its-applications-359100]
- 62. Eight Tips to Improve Gel Electrophoresis Results [https://www.thermofisher.com/us/en/home/brands/thermo-scientific/molecular-biology/molecular-biology-learning-center/molecular-biology-resource-library/spotlight-articles/8-DNA-ladder-tips.html]
- 63. Mastering Gel Electrophoresis: 10 Tips and Tricks for ... [https://americanlaboratorytrading.com/mastering-gel-electrophoresis-10-tips-and-tricks-for-successful-results/?srsltid=AfmBOoqjJetSVFApxDOsYKnxU2LMEibRVrjRhrlRWLFt8dpr1_k0fLzL]
- 64. The Mechanism of Acrylamide-Induced Neurotoxicity [https://pmc.ncbi.nlm.nih.gov/articles/PMC8993146/]
- 65. Acrylamide | Public Health Statement | ATSDR [https://wwwn.cdc.gov/TSP/PHS/PHS.aspx?phsid=1113&toxid=236]
- 66. Choosing the right agarose percentage for gel ... [https://www.minipcr.com/choosing-the-right-agarose-percentage/]
- 67. Agarose and Polyacrylamide Gel Electrophoresis Methods for ... [https://pmc.ncbi.nlm.nih.gov/articles/PMC3207642/]
- 68. A method for high-concentration agarose gel preparation ... [https://pubmed.ncbi.nlm.nih.gov/36693602/]
- 69. A 2-hydroxyethyl agarose/polyacrylamide gel enhanced ... [https://www.sciencedirect.com/science/article/abs/pii/S0039914010004790]
- 70. Coomassie blue staining - Proteins and protein analysis [https://www.abcam.com/en-us/knowledge-center/proteins-and-protein-analysis/coomassie-blue-staining]
- 71. A Guide to Selecting Fluorescent Dyes and Ligands [https://blog.addgene.org/illuminating-choices-a-guide-to-selecting-fluorescent-dyes-and-ligands]
- 72. Fluorescent Staining Overview [https://visikol.com/blog/2023/05/03/fluorescent-staining-overview/]
- 73. Coomassie Blue as a Near-infrared Fluorescent Stain [https://pmc.ncbi.nlm.nih.gov/articles/PMC3861728/]
- 74. Coomassie Blue SDS-PAGE Gel Trends: A Conventional ... [https://www.labconscious.com/green-lab-tips/2018/9/11/coomassie-blue-sds-page-trends]
- 75. Coomassi Blue Staining [https://www.thermofisher.com/us/en/home/references/protocols/proteins-expression-isolation-and-analysis/staining-protein-gels/coomassie-staining.html]
- 76. Electrophoresis Gel Selection [https://www.aatbio.com/resources/application-notes/electrophoresis-gel-selection]
- 77. Agarose Gel Electrophoresis - an overview [https://www.sciencedirect.com/topics/biochemistry-genetics-and-molecular-biology/agarose-gel-electrophoresis]
- 78. Agarose Gel Percentage Guide: Choosing the Right Matrix ... [https://synapse.patsnap.com/article/agarose-gel-percentage-guide-choosing-the-right-matrix-for-your-dna]
- 79. Analysis of RNA by Analytical Polyacrylamide Gel ... [https://www.sciencedirect.com/science/article/pii/B9780124200371000166]
- 80. Protein electrophoresis in agarose gels for separating high ... [https://pubmed.ncbi.nlm.nih.gov/22585481/]
- 81. Rapid baseline hump-free analysis of therapeutic proteins ... [https://pubmed.ncbi.nlm.nih.gov/40409905/]
- 82. Electrophoretic Separation of Very Large Molecular Weight ... [https://pubmed.ncbi.nlm.nih.gov/30426419/]
- 83. What is Agarose and Agarose Gel? [https://www.bocsci.com/resources/what-is-agarose-and-agarose-gel.html?srsltid=AfmBOooAMmsDB0iwFEwPMKU6w8fxxNUIylLWooCeGKuk8XvLJdpMOTS4]
- 84. DNA Electrophoresis vs Protein Electrophoresis [https://blog.edvotek.com/2025/07/24/dna-electrophoresis-vs-protein-electrophoresis/]
- 85. Pre-Cast Denaturing Gels for High Resolution Nucleic Acid ... [https://www.thermofisher.com/us/en/home/references/protocols/nucleic-acid-purification-and-analysis/dna-protocol/pre-cast-denaturing-gels-for-high-resolution-nucleic-acid-analysis.html]
- 86. How SDS-PAGE Separates Proteins [https://azurebiosystems.com/blog/how-sds-page-separates-proteins/]
- 87. Capillary vs. Gel Electrophoresis: Differences, Advantages, ... [https://www.bostonind.com/blog/capillary-vs-gel-electrophoresis-differences-advantages-and-applications?srsltid=AfmBOorqUdxC_CtSHs5INi7I3Gq6JpDI8rccR9-EnY3RFGCljaZLrHpz]
- 88. Successful Transfer High Molecular Weight Proteins during ... [https://www.thermofisher.com/us/en/home/life-science/protein-biology/protein-biology-learning-center/protein-biology-resource-library/protein-biology-application-notes/successful-transfer-high-mw-proteins-western-blotting.html]
- 89. Comparative Analysis of Structural Characterisation and ... [https://pmc.ncbi.nlm.nih.gov/articles/PMC12385734/]
- 90. Agarose vs Polyacrylamide: A Comparative Analysis [https://www.assaygenie.com/blog/agarose-vs-polyacrylamide?srsltid=AfmBOooAusL01k8RHwv8xGtolDXpHiCAl_JtuwXwDZq4i9_MTIjQkVQK]
- 91. Western blotting analysis of proteins separated by agarose ... [https://www.sciencedirect.com/science/article/abs/pii/S0141813020349187]
- 92. A 96-Well Polyacrylamide Gel for Electrophoresis and ... [https://pubmed.ncbi.nlm.nih.gov/38765957/]
- 93. Comprehensive Optimization of Western Blotting - PMC [https://pmc.ncbi.nlm.nih.gov/articles/PMC10453944/]
- 94. Precision proteomics: The case for high resolution and high ... [https://pmc.ncbi.nlm.nih.gov/articles/PMC2587563/]
- 95. Polyacrylamide lamination enables mass spectrometry ... [https://pubmed.ncbi.nlm.nih.gov/17722206/]
- 96. Preparative agarose gel electrophoresis for reducing ... [https://www.sciencedirect.com/science/article/pii/S0021967324000426]
- 97. Low-melting point agarose as embedding medium for ... [https://www.nature.com/articles/s41598-023-45799-5]
- 98. Protein Gel Selection Guide [https://www.thermofisher.com/us/en/home/life-science/protein-biology/protein-gel-electrophoresis/protein-gels/protein-gel-selection-guide.html]
- 99. Entanglement-controlled gels for versatile artifact cleaning [https://www.nature.com/articles/s40494-025-02108-9]