PCR Cycling Mastery: A Scientist's Guide to Denaturation, Annealing, and Extension
This comprehensive guide delves into the core thermal cycling steps of the Polymerase Chain Reaction (PCR)—denaturation, annealing, and extension—providing researchers, scientists, and drug development professionals with both foundational knowledge and...
PCR Cycling Mastery: A Scientist's Guide to Denaturation, Annealing, and Extension
Abstract
This comprehensive guide delves into the core thermal cycling steps of the Polymerase Chain Reaction (PCR)—denaturation, annealing, and extension—providing researchers, scientists, and drug development professionals with both foundational knowledge and advanced application strategies. It covers the fundamental principles and biochemistry governing each step, explores methodological variations and specialized protocols, offers proven troubleshooting and optimization techniques for challenging samples, and discusses rigorous validation and comparative analysis of PCR methods. By synthesizing current best practices and emerging trends, this article serves as an essential resource for optimizing assay performance, ensuring data reliability, and applying PCR techniques effectively in biomedical research and clinical diagnostics.
The Fundamental Principles of PCR Thermal Cycling
The polymerase chain reaction (PCR) is a foundational technique in molecular biology, enabling the exponential amplification of specific DNA sequences from minimal starting material. Since its development by Kary Mullis in 1983, PCR has become an indispensable tool across biological research, clinical diagnostics, and drug development [1] [2]. At the heart of this method lies a cyclic three-step process: denaturation, annealing, and extension. These steps work in concert to selectively replicate a target DNA region through repeated temperature cycles, facilitated by a thermostable DNA polymerase and sequence-specific primers [1] [3]. This guide provides an in-depth examination of the core PCR mechanism, detailing the biochemical principles, key parameters, and practical protocols that ensure efficient and specific DNA amplification.
The Fundamental Three-Step Cycle
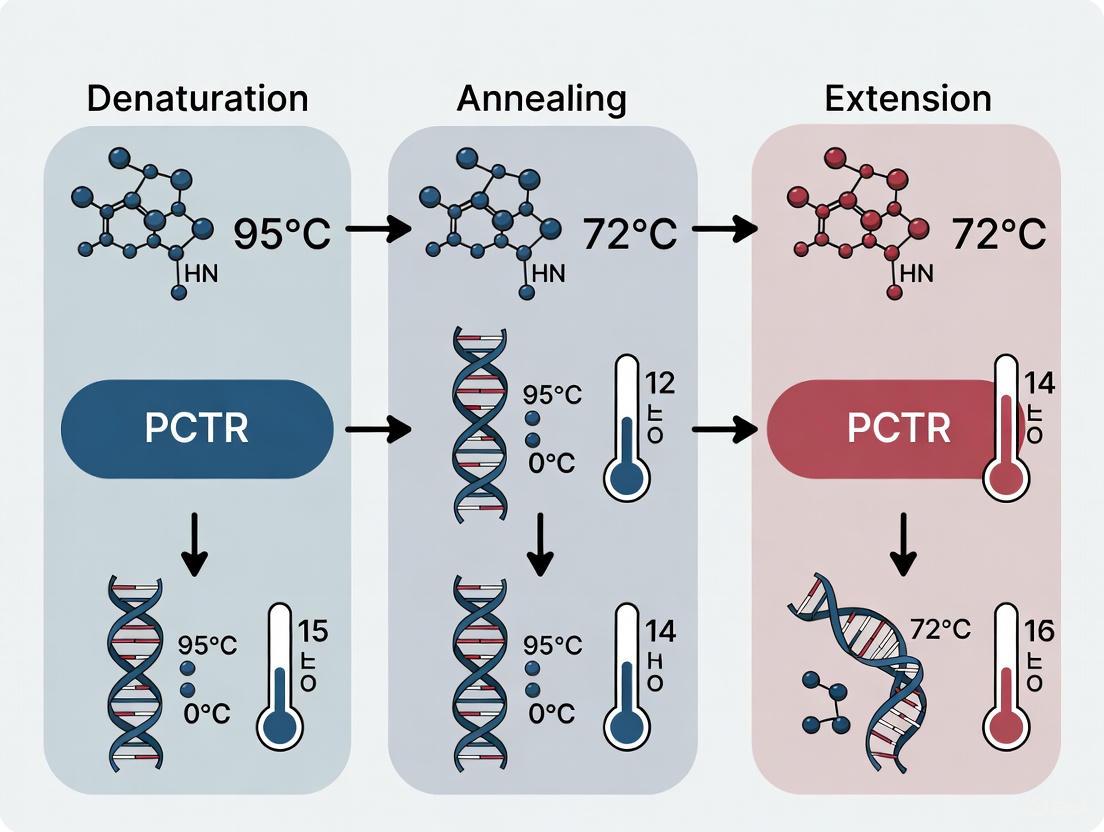
The PCR process employs repeated thermal cycling to drive the targeted amplification of DNA. Each cycle theoretically doubles the amount of target DNA, leading to exponential accumulation. The core mechanism consists of three sequential temperature-dependent steps.
The diagram above illustrates the cyclical nature of PCR. The process begins with a double-stranded DNA template and repeats the three core steps 25-40 times, resulting in millions of copies of the target sequence [1] [3].
Denaturation
The denaturation step involves heating the reaction mixture to a high temperature, typically between 94°C and 98°C, for 15-60 seconds [4]. At this temperature, the hydrogen bonds between complementary base pairs in the double-stranded DNA (dsDNA) molecule break, causing the two strands to separate into single-stranded DNA (ssDNA) molecules [2] [3]. This separation provides the necessary single-stranded templates for the primers to bind in the subsequent step.
- Initial Denaturation: The first cycle often includes a longer initial denaturation step (1-3 minutes) to ensure complete separation of complex DNA templates, such as genomic DNA, and to activate hot-start DNA polymerases [4].
- Key Considerations: DNA with high GC content ((>65\%)) often requires longer denaturation or higher temperatures due to the stronger bonding between guanine and cytosine [4]. Inadequate denaturation can lead to poor amplification efficiency.
Annealing
Following denaturation, the reaction temperature is rapidly lowered to a range typically between 55°C and 70°C for 30 seconds to 2 minutes [2] [4]. During this phase, short, single-stranded DNA oligonucleotides known as primers bind (anneal) to their complementary sequences on the flanking regions of the target DNA [1] [5]. The primers serve as starting points for the DNA polymerase.
- Primer Design and Melting Temperature (Tm): The annealing temperature is critical for reaction specificity and is determined by the primers' melting temperature (Tm), which is the temperature at which 50% of the primer-duplex dissociates [4].
- Temperature Optimization: An annealing temperature 3-5°C below the calculated Tm of the primers is a common starting point [4]. If nonspecific amplification occurs, the temperature can be increased incrementally. Conversely, low yield may necessitate a lower annealing temperature [4] [5].
Extension
The final step involves raising the temperature to the optimal range for the DNA polymerase, usually 70-75°C, for 1-2 minutes per kilobase of the target amplicon [4] [5]. The DNA polymerase binds to the primer-template hybrid and catalyzes the addition of free deoxynucleoside triphosphates (dNTPs) to the 3' end of the primer, synthesizing a new DNA strand complementary to the template in the 5' to 3' direction [1] [2].
- DNA Polymerase: Thermostable enzymes like Taq DNA polymerase (from Thermus aquaticus) are essential, as they withstand the high temperatures of the denaturation step without being inactivated [1] [5].
- Final Extension: A single, longer final extension step (5-15 minutes) is often added after the last cycle to ensure any remaining single-stranded DNA is fully extended [4]. This is particularly important for applications like cloning, where complete 3'-dA tailing is necessary [4].
Quantitative Parameters for PCR Optimization
Efficient amplification requires careful optimization of cycling parameters. The tables below summarize key quantitative data for the core PCR steps and cycle numbers.
Table 1: Temperature and Time Parameters for Standard PCR Steps
| Step | Typical Temperature Range | Typical Time Range | Key Influencing Factors |
|---|---|---|---|
| Initial Denaturation | 94–98°C | 1–3 minutes | DNA complexity (e.g., gDNA vs. plasmid), GC content, polymerase activation [4] |
| Denaturation (Cyclic) | 94–98°C | 15–60 seconds | DNA length and GC content; higher/longer for GC-rich templates [4] |
| Annealing | 55–70°C | 30 seconds – 2 minutes | Primer Tm, sequence specificity, buffer composition (e.g., salt concentration) [4] [6] |
| Extension | 70–75°C | 1–2 minutes/kb | DNA polymerase synthesis rate, amplicon length [4] [5] |
| Final Extension | 70–75°C | 5–15 minutes | Amplicon length, need for complete polymerization and 3'-dA tailing [4] |
Table 2: PCR Cycle Number Determination
| Scenario | Recommended Number of Cycles | Rationale |
|---|---|---|
| Routine Amplification | 25–35 | Standard balance between high yield and minimal non-specific byproducts [4] |
| Low DNA Copy Number (<10 copies) | Up to 40 | Increases probability of amplifying low-abundance targets [4] |
| Maximum Cycle Limit | Not recommended >45 | High risk of non-specific amplification and reagent depletion leading to plateau phase [4] |
| Unbiased Amplification (e.g., NGS) | Lower numbers preferred | Reduces amplification bias and errors for sensitive downstream applications [4] |
Advanced PCR Protocols and Methodologies
Standard Three-Step PCR Protocol
The following is a detailed methodology for a standard three-step PCR, suitable for amplifying a wide range of targets [5].
Reaction Setup
- Prepare a 50 µL reaction mixture on ice containing:
- Template DNA: 10–500 ng (2 µL) [5].
- 10X Taq Buffer with MgCl₂: 5 µL (provides optimal chemical environment and divalent cations) [5].
- dNTP Mix (10 mM each): 1 µL (building blocks for new DNA strands) [5].
- Forward Primer (10 µM): 2.5 µL [5].
- Reverse Primer (10 µM): 2.5 µL [5].
- Taq DNA Polymerase (5 units/µL): 0.2 µL [5].
- Sterile dH₂O: 36.8 µL to reach the final volume [5].
- For multiple reactions, a master mix minimizes pipetting error and ensures consistency.
- Prepare a 50 µL reaction mixture on ice containing:
Thermal Cycling
- Load the reaction tubes into a thermal cycler and run the following program:
Product Analysis
- Analyze 2 µL of the PCR product by agarose gel electrophoresis to verify the size and concentration of the amplification [5].
Two-Step PCR Protocol
In some cases, a two-step PCR protocol can be used. This method combines the annealing and extension steps into one, which shortens the total run time.
- Procedure: After the initial denaturation, cycles consist of a high-temperature denaturation step (e.g., 95°C for 10 seconds) followed by a combined anneal/extension step at 60–68°C for 30 seconds [7]. This is feasible when the annealing temperature of the primers is close to the optimal extension temperature of the polymerase.
Real-Time Quantitative PCR (qPCR) Protocol
qPCR allows for the real-time detection and quantification of amplified DNA during the reaction. The protocol often uses a two-step cycling process and fluorescent reporting systems [7].
Reaction Setup: Similar to standard PCR, but includes a fluorescent dye (e.g., SYBR Green I) or sequence-specific probes (e.g., TaqMan) [7].
Thermal Cycling (Example for dual-labeled probes) [7]:
- Initial Denaturation: 95°C for 2–10 minutes (for polymerase activation).
- Cycling (40 times):
- Denaturation: 95°C for 10 seconds.
- Anneal/Extension: 60°C for 30 seconds (fluorescence is measured at this step in each cycle).
The Scientist's Toolkit: Essential Research Reagent Solutions
Table 3: Key Reagents for PCR Setup and Optimization
| Reagent | Function | Typical Concentration | Optimization Notes |
|---|---|---|---|
| Taq DNA Polymerase | Thermostable enzyme that synthesizes new DNA strands. | 0.2–2.5 units/50 µL reaction [5] | Lacks proofreading activity; for high-fidelity needs, use enzymes like Pfu [1] [6] |
| Primers | Short DNA sequences that define the start and end of the target amplicon. | 0.2–1 µM each [6] | Should have similar Tm; design to avoid self-complementarity and dimer formation [6] |
| dNTPs | Nucleotide building blocks (dATP, dCTP, dGTP, dTTP) for DNA synthesis. | 200 µM each [5] | Use balanced solutions to prevent misincorporation [5] |
| MgCl₂ | Essential cofactor for DNA polymerase activity; stabilizes primer-template duplex. | 1.5–2.5 mM [5] [6] | Concentration critically affects specificity and yield; requires titration [6] |
| Reaction Buffer | Provides optimal pH and ionic conditions for the polymerase. | 1X concentration | May contain stabilizers; specialized buffers can enable universal annealing temperatures [4] |
| Template DNA | The source DNA containing the target sequence to be amplified. | 10–500 ng (genomic DNA) [5] | Purity is critical; contaminants can inhibit polymerase [2] [6] |
| Additives (DMSO, BSA) | Enhancers that can help amplify difficult templates (e.g., GC-rich regions). | DMSO: 1–10% [5] | Can lower the effective Tm of primers; use may require optimization of annealing temperature [4] |
Troubleshooting Common PCR Issues
- No/Low Amplification: Can result from insufficient template, poor primer binding, or inefficient denaturation. Potential solutions include increasing template quality/quantity, lowering the annealing temperature in 2–3°C increments, increasing denaturation time/temperature (especially for GC-rich templates), and adding enhancers like DMSO or betaine [4] [5] [6].
- Nonspecific Bands/Primer-Dimers: Caused by primers binding to non-target sequences or to each other. This can be addressed by increasing the annealing temperature, titrating MgCl₂ concentration, using a hot-start polymerase, or redesigning primers for improved specificity [4] [6].
- PCR Optimization Balance: The conditions that maximize product yield are often different from those that ensure high specificity or fidelity. The optimal protocol must be planned according to the primary requirement of the downstream application [6].
The core mechanism of PCR—denaturation, annealing, and extension—is a powerful demonstration of how controlled temperature cycling can drive the exponential amplification of DNA. Mastering this process requires a deep understanding of the biochemical principles and a meticulous approach to optimizing reaction components and cycling parameters. As PCR continues to be a cornerstone technique in scientific research and clinical diagnostics, advancements in enzyme engineering, instrumentation, and microfluidics promise to further enhance its speed, sensitivity, and accessibility [8]. The principles detailed in this guide provide a foundation for researchers to effectively utilize and innovate upon this transformative technology.
DNA denaturation, the process of separating double-stranded DNA into single strands, is a foundational step in the polymerase chain reaction (PCR) and a critical focus area for researchers and drug development professionals. The efficiency of this process directly governs the success of downstream amplification and analysis. This technical guide provides an in-depth examination of the temperature and time parameters required for effective DNA denaturation, situating this core step within the broader context of PCR cycling. It synthesizes established protocols with optimization strategies for challenging templates, offering a structured framework for experimental design and implementation in molecular research.
The polymerase chain reaction (PCR) has revolutionized biological research and diagnostics since its introduction by Kary Mullis, serving as a cornerstone technique for amplifying specific DNA sequences [2]. The process relies on thermal cycling to repeatedly copy a target DNA segment, enabling its detection and analysis. PCR's extreme sensitivity allows for the amplification of a target sequence from a single copy, making it invaluable for applications ranging from infectious disease diagnosis to genetic disorder screening and forensic analysis [2] [9].
The PCR process consists of three primary steps that are cycled multiple times: denaturation, annealing, and extension [4] [2]. Denaturation, the focus of this guide, is the initial step in each cycle where double-stranded DNA (dsDNA) is separated into single strands. This separation is crucial as it provides the necessary template for primers to bind in the subsequent annealing step. During denaturation, the reaction temperature is raised to typically 94–98°C, disrupting the hydrogen bonds between complementary base pairs and causing the two DNA strands to dissociate [4] [9]. The efficiency of this strand separation is paramount; incomplete denaturation can lead to significantly reduced amplification yields and compromised assay sensitivity [4] [9]. Understanding and optimizing the temperature and time requirements for DNA denaturation is, therefore, a fundamental prerequisite for successful PCR experimentation and reliable scientific results.
The Mechanism and Kinetics of DNA Denaturation
DNA denaturation, often referred to as DNA melting, is a physical process that involves the dissociation of the double-stranded helix into two single strands. This transition from a duplex to a single-stranded state is induced by the application of heat, which provides sufficient energy to break the hydrogen bonds between adenine-thymine (A-T) and guanine-cytosine (G-C) base pairs, as well as to disrupt the base-stacking interactions that stabilize the double helix.
The kinetics of this process are complex and influenced by the DNA's molecular characteristics. A foundational theory suggests that for large DNA molecules, denaturation can occur through a diffusional unwinding of the two strands, where the change in free energy as the molecule unwinds provides a directional bias [10]. Experimental evidence indicates that for DNA molecules with a molecular weight below approximately 20 × 10^6, the relaxation time (τ0) for the helix-coil transition varies with the square of the molecular weight, while for larger molecules, the relaxation time becomes nearly independent of size, potentially due to the presence of single-strand breaks that facilitate the process [10]. Furthermore, recent single-molecule studies have revealed that double-stranded DNA under mechanical tension can undergo cooperative elongation into states such as S-DNA, with the B-DNA to S-DNA transition occurring much faster than internal dsDNA melting, highlighting the role of force and the potential existence of transient intermediates in the denaturation pathway [11].
Key Factors Influencing Denaturation Efficiency
The temperature and time required for complete DNA denaturation are not universal; they are significantly affected by several chemical and physical properties of the DNA template and the reaction environment. The following factors are paramount:
- GC Content: DNA sequences with high guanine-cytosine (GC) content (>65%) are more stable and require more stringent denaturation conditions. This is due to the three hydrogen bonds in G-C base pairs, compared to the two in A-T base pairs [4]. Consequently, GC-rich templates often benefit from longer incubation periods or higher denaturation temperatures to achieve complete strand separation [4].
- Template Complexity and Size: The physical size and structural complexity of the DNA template directly impact denaturation. Mammalian genomic DNA, with its large size and associated proteins, often requires longer denaturation times compared to simpler templates like plasmids or PCR products [4].
- Salt and Buffer Composition: The ionic strength of the PCR buffer is a critical factor. Buffers with high salt concentrations can stabilize the double helix, necessitating higher denaturation temperatures (e.g., 98°C) to achieve separation [4]. Divalent cations, such as Mg2+, are essential for DNA polymerase activity but also bind to the DNA backbone, increasing its stability.
- Additives and Co-solvents: Reagents like dimethyl sulfoxide (DMSO), glycerol, formamide, and betaine can be incorporated into the reaction mix to facilitate denaturation [4] [5]. These compounds act as DNA destabilizing agents, effectively lowering the melting temperature (Tm) of the DNA by interfering with hydrogen bonding and base stacking. For instance, 10% DMSO can decrease the annealing temperature by 5.5–6.0°C, and a similar principle applies to denaturation [4].
Experimental Parameters for DNA Denaturation
Standard Temperature and Time Guidelines
Establishing the correct denaturation conditions is a balance between achieving complete strand separation and maintaining the activity of the thermostable DNA polymerase. The table below summarizes the standard and optimized parameters for the DNA denaturation step in PCR.
Table 1: Temperature and Time Parameters for DNA Denaturation in PCR
| Step Type | Typical Temperature Range | Typical Time Range | Key Considerations |
|---|---|---|---|
| Initial Denaturation | 94–98°C [4] [12] | 1–3 minutes [4]; up to 10 minutes for complex DNA [9] | Essential for complex/genomic DNA; activates hot-start polymerases [4]. |
| Cycle Denaturation | 94–98°C [4] | 15–30 seconds [12] [5]; 0.5–2 minutes [4] | Must be optimized based on template and enzyme. |
| GC-Rich Template Denaturation | Up to 98°C [4] | 3–5 minutes (initial); extended cycle times [4] | Increased time/temperature is critical; can be combined with additives like betaine or DMSO [4] [5]. |
Optimization Strategies for Challenging Templates
Routine amplification may not require extensive optimization, but challenging templates demand a systematic approach to denaturation.
- Troubleshooting Incomplete Denaturation: A common symptom of incomplete denaturation is a significant decrease in or complete absence of PCR product. This can be resolved by:
- Increasing the denaturation temperature: Raising the temperature from 95°C to 98°C can be effective, especially in buffers with high salt content [4].
- Increasing the denaturation time: For complex or GC-rich DNA, incrementally extending the denaturation time during cycling can improve yields [4].
- Incorporating additives: Adding DMSO (1-3%), formamide, or betaine can enhance strand separation of GC-rich templates without necessarily increasing the temperature, thus preserving polymerase longevity [4] [5].
- Preventing Polymerase Inactivation: While achieving complete denaturation is crucial, it is equally important to consider the stability of the DNA polymerase. Prolonged incubation at temperatures above 95°C can denature some polymerases, such as Taq DNA Polymerase, leading to reduced activity over many cycles [4]. For protocols requiring stringent or prolonged denaturation, using a highly thermostable enzyme (e.g., derived from Archaea) is recommended, as these enzymes are engineered to withstand prolonged high temperatures [4].
Denaturation in the Context of Complete PCR Cycling
DNA denaturation cannot be viewed in isolation; it is the first step in a cyclic process that includes primer annealing and enzymatic extension. The parameters for each step are interdependent and must be harmonized for successful amplification.
Integration with Annealing and Extension
- Annealing Step: Immediately following denaturation, the reaction temperature is rapidly lowered to typically 45–60°C to allow primers to bind (anneal) to their complementary sequences on the single-stranded DNA templates [2] [9]. The optimal annealing temperature is determined by the melting temperature (Tm) of the primers and often requires empirical optimization. If nonspecific amplification is observed, increasing the annealing temperature in increments of 2–3°C can enhance specificity [4] [12].
- Extension Step: The temperature is then raised to 70–75°C, the optimal temperature for thermostable DNA polymerases like Taq. The duration of this step depends on the length of the amplicon and the speed of the polymerase. A common guideline is 1 minute per kilobase for Taq DNA Polymerase [4] [12]. For amplicons less than 1 kb, 45–60 seconds is often sufficient [12].
Table 2: Core Cycling Parameters for Standard PCR
| PCR Step | Temperature Range | Time Guideline | Primary Function |
|---|---|---|---|
| Denaturation | 94–98°C [4] [9] | 15–30 sec [12] [5] | Separates dsDNA into single strands. |
| Annealing | 45–60°C [2] [9]; 5°C below primer Tm [5] | 15–60 sec [12] [5] | Allows primers to bind to target sequences. |
| Extension | 70–75°C [4] [9] (often 72°C) | 1 min/kb for Taq [4] [12]; 2 min/kb for Pfu [4] | Polymerase synthesizes new DNA strand. |
Cycle Number and Final Extension
The three-step cycle of denaturation, annealing, and extension is typically repeated 25–35 times [4]. The number of cycles should be optimized based on the starting template concentration; for very low copy numbers (fewer than 10 copies), up to 40 cycles may be required [4]. Exceeding 45 cycles is generally not recommended as it can lead to the accumulation of nonspecific products and reaction by-products [4]. Following the last cycle, a final extension step of 5–15 minutes at 72°C is often included to ensure that all amplicons are fully extended and to facilitate the addition of 3'-A overhangs if Taq polymerase is used for cloning purposes [4] [12] [5].
The Scientist's Toolkit: Essential Reagents for PCR and Denaturation
Table 3: Key Research Reagent Solutions for PCR Experiments
| Reagent | Typical Concentration/Final Amount | Critical Function in PCR |
|---|---|---|
| DNA Polymerase | 0.5–2.0 units per 50 µl reaction [12] | Enzyme that synthesizes new DNA strands; thermostability is crucial for denaturation. |
| dNTP Mix | 200 µM of each dNTP (dATP, dCTP, dGTP, dTTP) [12] [5] | The building blocks for DNA synthesis. |
| Primers (Forward & Reverse) | 0.1–0.5 µM each [12] | Short oligonucleotides that define the start and end of the target sequence to be amplified. |
| MgCl₂ | 1.5–2.0 mM (optimal for Taq) [12] | Essential cofactor for DNA polymerase activity; concentration must be optimized. |
| PCR Buffer | 1X concentration | Provides optimal chemical environment (pH, salts) for polymerase activity and denaturation. |
| Template DNA | 1 pg–10 ng (plasmid); 1 ng–1 µg (genomic) [12] | The source DNA containing the target sequence to be amplified. |
| Additives (DMSO, Betaine) | e.g., 1–10% DMSO [4] [5] | Aids in denaturation of GC-rich templates and resolution of secondary structures. |
DNA denaturation is a critical, efficiency-determining step in the PCR process. Successful strand separation hinges on the precise application of temperature and time parameters, which are influenced by the DNA template's GC content, complexity, and the reaction buffer's composition. While standard protocols provide a reliable starting point—typically 94–98°C for 15–30 seconds per cycle—researchers must be prepared to optimize these conditions for challenging templates. This optimization may involve increasing temperature or time, or incorporating destabilizing additives. A comprehensive understanding of denaturation, integrated with the careful optimization of the entire PCR thermal profile, is fundamental to achieving robust, specific, and high-yield amplification in research and diagnostic applications.
Primer annealing is a critical determinant of polymerase chain reaction (PCR) success, governed by the precise interplay between melting temperature (Tm) and reaction specificity. This technical guide examines the thermodynamic principles underlying Tm calculation and their practical impact on annealing efficiency. Within the broader context of PCR cycling steps—denaturation, annealing, and extension—optimized annealing conditions ensure specific primer binding to complementary target sequences while minimizing spurious amplification. We explore advanced primer design strategies, experimental validation methodologies, and reagent solutions that enable researchers to achieve high-fidelity amplification across diverse molecular biology applications, from basic research to pharmaceutical development.
The polymerase chain reaction (PCR) consists of three fundamental steps that cycle repeatedly: denaturation of double-stranded DNA templates, annealing of oligonucleotide primers to flanking regions of the target sequence, and extension of the primers by a thermostable DNA polymerase [1]. Primer annealing serves as the recognition phase of this process, where short, single-stranded DNA molecules bind to their complementary sequences on the separated template strands, providing the necessary starting point for DNA synthesis [2]. The annealing temperature must be carefully optimized to balance two competing objectives: sufficient stability for primer-template binding and sufficient stringency to avoid non-specific amplification.
The specificity of PCR amplification hinges primarily on the annealing step [13]. During this phase, the reaction temperature is lowered to enable primers to hybridize to their target sequences. If the temperature is too low, primers may bind to partially complementary sites, leading to amplification of non-target products. Conversely, if the temperature is too high, primer binding may be insufficient to initiate replication, resulting in poor amplification yield [14]. The melting temperature (Tm)—defined as the temperature at which 50% of the primer-template duplexes dissociate into single strands—provides a critical reference point for establishing appropriate annealing conditions [14].
Within the broader framework of PCR cycling parameters, annealing functions as the central recognition event that bridges the preparatory denaturation step and the productive extension step. Its optimization requires understanding of both the molecular thermodynamics of nucleic acid hybridization and the practical considerations of reaction setup.
The Fundamental Principles of Melting Temperature (Tm)
Thermodynamic Definition and Significance
The melting temperature (Tm) represents a fundamental thermodynamic property of nucleic acid duplexes, defined as the temperature at which half of the primer molecules exist in single-stranded form and half are annealed to their exact complementary sequence [14]. This parameter serves as a quantitative measure of duplex stability, reflecting the cumulative energy contributions of hydrogen bonding between complementary bases and base-stacking interactions between adjacent nucleotide pairs [15].
From a practical perspective, Tm establishes the thermal window for specific primer-template interactions during PCR. At temperatures significantly below Tm, primers bind stably but may lack specificity, potentially hybridizing to near-complementary sequences. At temperatures approaching or exceeding Tm, the primer-template duplex becomes unstable, dissociating before the polymerase can initiate DNA synthesis [14]. Therefore, the annealing temperature (Ta) is typically set 3–10°C below the calculated Tm to maintain the kinetic energy of molecular motion while preserving stable binding between perfectly matched sequences [14] [13].
Key Factors Influencing Tm
Multiple factors collectively determine the Tm of a primer-template duplex, with each contributing to the overall binding stability:
- Primer Length: Tm increases with primer length due to additional stabilizing interactions. Most effective primers range from 18–30 nucleotides, providing sufficient sequence for specific recognition while maintaining practical Tm values [13].
- GC Content: Guanine-cytosine base pairs, stabilized by three hydrogen bonds, confer greater thermal stability than adenine-thymine pairs, which form only two hydrogen bonds. Consequently, primers with higher GC content exhibit higher Tm values [15]. Optimal primers generally contain 40–60% GC content [16].
- Salt Concentration: Cations in the reaction buffer, particularly monovalent ions like K⁺ and Na⁺, shield the negatively charged phosphate backbone of DNA, reducing electrostatic repulsion between complementary strands and thereby increasing Tm [14].
- Chemical Modifications: Modified bases such as locked nucleic acids (LNAs) or minor groove binders (MGBs) can significantly enhance duplex stability, elevating Tm beyond what would be predicted from sequence alone [14].
- Mismatches: Non-complementary base pairs between primer and template destabilize the duplex, lowering the effective Tm. This effect is most pronounced when mismatches occur near the 3' end of the primer, where extension initiates [16].
Table 1: Factors Affecting Primer Melting Temperature
| Factor | Effect on Tm | Optimal Range | Mechanism |
|---|---|---|---|
| Primer Length | Increases with length | 18-30 nucleotides | More stabilizing base-stacking interactions |
| GC Content | Increases with GC% | 40-60% | Additional hydrogen bonds in G-C pairs |
| Salt Concentration | Increases with [Na⁺] | Reaction-dependent | Shielding of phosphate group repulsion |
| Primer Concentration | Minor increase | 0.05-1.0 µM | Mass action favors duplex formation |
| Mismatches | Decreases | 0 (preferred) | Reduced complementarity and stability |
Calculating Melting Temperature: Formulas and Methods
Fundamental Calculation Methods
Several algorithms with varying complexity and accuracy exist for calculating primer Tm. The choice of method depends on the required precision, primer characteristics, and available reaction parameters.
The Wallace Rule provides a simple approximation for shorter primers (14-20 nucleotides): Tm = 2°C × (A + T) + 4°C × (G + C), where A, T, G, and C represent the count of each nucleotide in the primer [15]. For example, a primer with 6A, 6T, 3G, and 3C would have Tm = 2°C × (6+6) + 4°C × (3+3) = 24°C + 24°C = 52°C [15]. While computationally simple, this method ignores significant factors like salt concentration and nearest-neighbor effects.
More accurate salt-adjusted formulas incorporate ionic conditions: Tm = Tm(Wallace) + 16.6 × log[Na⁺], where [Na⁺] represents the sodium ion concentration in moles/liter [15]. This correction improves prediction accuracy for reactions with non-standard buffer compositions.
The most thermodynamically precise approach uses the nearest-neighbor method, which accounts for the sequence-dependent stability of adjacent base pairs, salt concentrations, primer concentration, and pH [17] [14]. This method forms the basis for modern algorithmic predictions in software tools like Thermo Fisher's Tm Calculator and IDT's OligoAnalyzer [17] [14].
Advanced Calculation Considerations
For degenerate primers—mixtures of slightly different oligonucleotides used to amplify related sequences—Tm calculation becomes more complex. Strategies to maintain efficiency include positioning conserved bases at the 3'-end and reducing degeneracy at the 5'-end [18]. Similarly, for primers with chemical modifications, experimental validation often becomes necessary as standard calculators may not accurately predict the Tm-enhancing effects of modifications like MGB or LNA [14].
Table 2: Comparison of Tm Calculation Methods
| Method | Complexity | Accuracy | Best Applications | Limitations |
|---|---|---|---|---|
| Wallace Rule | Low | Low | Quick estimates, short primers | Ignores salt, sequence context |
| Salt-Adjusted | Medium | Medium | Standard PCR design | Still ignores sequence context |
| Nearest-Neighbor | High | High | Critical applications, long primers | Requires specialized software |
Tm and Primer Specificity: The Molecular Relationship
Thermodynamic Basis of Specificity
The relationship between Tm and specificity stems from the differential stability of perfectly matched versus mismatched primer-template duplexes. A single base pair mismatch typically reduces duplex stability by 4–12°C, depending on its position and nature [16]. This stability difference enables specific amplification when the annealing temperature is carefully optimized.
At an annealing temperature approximately 3–7°C below the Tm of perfectly matched sequences, primers bind efficiently to intended targets while discriminating against imperfect matches [14]. This specificity window arises because mismatched duplexes, having lower effective Tm, remain unstable at temperatures that support binding of perfectly complementary sequences. The position of the mismatch significantly influences this effect, with 3'-end mismatches having the greatest impact on amplification efficiency due to their disruption of the polymerase initiation site [16].
Design Strategies for Enhanced Specificity
Several primer design strategies leverage the Tm-specificity relationship to improve PCR performance:
- 3'-End Stability: Designing primers with higher stability at the 3'-terminal region (often implemented via a "GC clamp"—one or two G or C bases in the last five nucleotides) enhances specificity by ensuring efficient initiation of extension while maintaining discrimination against mismatched templates [16].
- Balanced Tm Values: Forward and reverse primers should have Tm values within 2–3°C of each other to ensure synchronous binding during the annealing phase [16] [13]. Significant disparities can lead to asymmetric amplification and reduced yield.
- Temperature Gradients: Empirical testing using temperature gradient PCR provides the most reliable optimization, as actual reaction conditions may differ from theoretical predictions [17]. This approach identifies the optimal compromise between yield and specificity for each primer-template system.
Diagram 1: Tm determines PCR specificity through annealing temperature.
Experimental Protocols for Tm Determination and Annealing Optimization
Computational Tm Prediction and Primer Design
Protocol 1: In Silico Primer Design and Tm Calculation
- Target Sequence Identification: Obtain the reference target sequence from curated databases (e.g., NCBI RefSeq) in FASTA format [16].
- Primer Design Parameters: Using tools like NCBI Primer-BLAST or Primer3, set the following constraints [16]:
- Product size: 200–500 bp for standard applications
- Primer length: 18–30 nucleotides
- Tm range: 58–72°C with forward/reverse Tm difference ≤2°C
- GC content: 40–60%
- Avoid 3' end complementarity and repetitive sequences
- Specificity Verification: Utilize the integrated BLAST functionality to screen candidate primers against the appropriate genome background, eliminating those with significant off-target binding potential [16].
- Secondary Structure Analysis: Employ tools like IDT's OligoAnalyzer to evaluate potential hairpin formation and self-dimerization, rejecting primers with stable secondary structures (ΔG < -9 kcal/mol) [14] [16].
Protocol 2: Temperature Gradient PCR for Empirical Optimization
- Reaction Setup: Prepare a master mix containing template DNA, buffer, dNTPs, DNA polymerase, and primer pair at 0.05–1.0 µM final concentration [13].
- Thermal Cycler Programming: Implement a temperature gradient spanning 8–10°C across different reaction tubes or blocks, centered on the calculated Tm minus 5°C [17].
- Cycling Parameters:
- Initial denaturation: 95°C for 2 minutes
- 30–35 cycles of:
- Denaturation: 95°C for 15–30 seconds
- Annealing: Gradient temperatures for 30–60 seconds
- Extension: 72°C (or polymerase-specific temperature) for 1 minute per kb
- Final extension: 72°C for 5–10 minutes
- Product Analysis: Resolve PCR products by agarose gel electrophoresis. Identify the optimal annealing temperature as the highest temperature that produces strong, specific amplification without artifacts [17].
Troubleshooting Common Annealing-Related Issues
- Non-specific Amplification: Increase annealing temperature in 2°C increments or redesign primers with higher specificity [16].
- Primer-Dimer Formation: Screen for self-complementarity, particularly at the 3' ends, and adjust primer concentration [13].
- Poor Yield: Lower annealing temperature, optimize Mg²⁺ concentration, or verify primer quality and concentration [16].
- Asymmetric Amplification: Ensure forward and reverse primers have matched Tm values (±2°C) and check for sequence variations in the template [16].
Advanced Applications and Special Considerations
Degenerate Primers and Multiplex PCR
Degenerate primers, consisting of mixtures related oligonucleotides, present unique Tm challenges. These primers can identify unknown coding sequences or detect genetic variants within gene families [18]. Successful implementation requires strategic design with conserved bases preferentially positioned at the 3'-end to ensure specific initiation, while degeneracy is concentrated toward the 5'-end where it has less impact on binding specificity [18].
Multiplex PCR, which amplifies multiple targets simultaneously, demands careful Tm matching across all primer pairs to ensure uniform amplification efficiency. Advanced tools like ThermoPlex automate this process using DNA thermodynamics to design target-specific multiplex PCR primers that work under unified cycling conditions [19]. These tools analyze sequence alignments of all relevant targets and non-targets to generate compatible primer sets within minutes [19].
Extreme PCR and Rapid Cycling
Pushing the kinetic limits of PCR, extreme PCR reduces cycling times by 10–60 fold through optimized denaturation, annealing, and extension parameters [20]. For annealing, this requires 300–1000 ms below the annealing threshold temperature, with precise temperature control enabling complete PCR of short products in less than 15 seconds [20]. Such rapid cycling depends on increased primer and polymerase concentrations alongside instrument designs capable of precise temperature transitions and maintenance.
GC-Rich Templates and Challenging Sequences
Amplification of GC-rich templates (>60% GC content) requires specialized approaches due to the increased Tm and stable secondary structures. Recommended strategies include [13]:
- Space GC residues evenly throughout the primer sequence
- Avoid runs of three or more G/C bases at the 3' end
- Incorporate additives like DMSO or betaine to reduce secondary structure
- Use polymerases specifically formulated for high GC content
- Implement a two-step PCR protocol with combined annealing/extension
Diagram 2: Primer design and validation workflow.
Table 3: Research Reagent Solutions for PCR Optimization
| Reagent/Resource | Function | Application Notes |
|---|---|---|
| Thermostable DNA Polymerases | Catalyzes DNA synthesis | Choice depends on fidelity, processivity, and proofreading needs [1] |
| Buffer Systems | Maintains pH, provides cofactors | Mg²⁺ concentration critical; often optimized empirically [2] |
| Tm Calculation Tools | Predicts melting temperature | Thermo Fisher Calculator, IDT OligoAnalyzer provide condition-specific Tms [17] [14] |
| Primer Design Software | Designs optimized primers | Primer-BLAST integrates design with specificity checking [16] |
| Additives (DMSO, Betaine) | Reduces secondary structure | Particularly useful for GC-rich templates [16] |
| Nucleotide Mix | Building blocks for DNA synthesis | Quality affects error rate and processivity [2] |
Primer annealing, guided by the precise determination and application of melting temperature, represents both an art and science in modern molecular biology. The thermodynamic principles underlying Tm calculation provide a foundation for predicting primer behavior, while empirical validation remains essential for protocol optimization. As PCR methodologies evolve toward higher multiplexing, rapid cycling, and challenging templates, the relationship between Tm and specificity continues to inform experimental design across basic research and drug development. By applying the principles and protocols outlined in this technical guide, researchers can systematically approach primer design and annealing optimization to achieve robust, specific amplification in diverse experimental contexts.
The extension phase, or elongation step, is a critical stage of the polymerase chain reaction (PCR) where the DNA polymerase enzyme synthesizes a new complementary DNA strand. Following the denaturation and annealing steps, the reaction temperature is raised to the optimal range for the DNA polymerase to function, enabling it to add nucleotides to the 3' end of each primer annealed to the template DNA [2] [21]. The efficiency and fidelity of this phase directly determine the yield, accuracy, and reliability of the entire amplification process. For researchers and drug development professionals, a deep understanding of the variables that govern the extension phase is fundamental to experimental success, from diagnostic assay development to genetic engineering.
Core Mechanism of DNA Synthesis during Extension
During the extension phase, DNA polymerase catalyzes the template-directed synthesis of new DNA strands. The enzyme requires a primer annealed to a single-stranded DNA template to initiate synthesis [2]. It then proceeds in the 5′ to 3′ direction, sequentially adding deoxynucleoside triphosphates (dNTPs) that are complementary to the template strand [1]. This activity generates sequences complementary to the template strands, effectively creating exact copies of the target DNA region located between the two primers [2].
All DNA polymerases possess this core 5′→ 3′ polymerase activity, which is the incorporation of nucleotides to extend the primers at their 3' ends [1]. The process is repeated over multiple cycles in a thermal cycler, resulting in the exponential amplification of the target DNA fragment [2] [1].
Figure 1: The DNA Synthesis Mechanism during PCR Extension. This diagram illustrates the logical sequence of the core extension process, beginning with the annealed primer-template complex and culminating in the synthesis of a new DNA strand by DNA polymerase.
Optimizing Critical Extension Parameters
The efficiency of the extension phase is controlled by several key parameters that must be optimized for specific experimental needs.
Temperature
The extension temperature is raised to the optimal temperature for the DNA polymerase, which is generally between 70°C and 75°C for most thermostable enzymes [4]. A lower extension temperature of 68°C is often preferred for two-step PCR protocols and when amplifying longer templates (>4 kb), as it dramatically improves yields of longer amplification products by reducing the depurination rate [22]. For standard three-step PCR and amplification of short fragments (<4 kb), 72°C is recommended [22].
Time
The extension time required depends on the synthesis rate of the DNA polymerase and the length of the target DNA [4]. A general rule of thumb is 1 minute per kilobase (kb) for Taq DNA Polymerase [4]. However, "fast" enzymes are now available that can synthesize DNA at rates of 10-20 seconds per kb [22]. It is crucial to ensure the time is sufficient for full-length replication; insufficient time results in incomplete products visible as a smear on an agarose gel [4]. Excessively long extension times should be avoided as they can promote the generation of unwanted non-specific products [23].
DNA Polymerase Selection
The choice of DNA polymerase is a critical decision that affects extension speed, fidelity, and success with complex templates.
- Taq DNA Polymerase: Isolated from Thermus aquaticus, this is the most widely used polymerase. Its optimal extension temperature is 70-75°C [4]. A key drawback is its lack of proofreading (3'→5' exonuclease) activity, leading to a relatively high error rate and making it generally unsuitable for amplifying fragments longer than 5 kb [1].
- Pfu DNA Polymerase: Derived from Pyrococcus furiosus, this enzyme has proofreading activity, resulting in higher fidelity (lower error rate) than Taq [23]. However, it is a "slower" enzyme, typically requiring 2 minutes per kb during extension [4].
- Engineered "Fast" Enzymes: Modern polymerases (e.g., SpeedSTAR HS, SapphireAmp Fast, PrimeSTAR GXL) are engineered for speed and performance, allowing for much shorter extension times of 5-20 seconds per kb [22]. Many are also blends designed to offer a balance of speed, fidelity, and the ability to amplify long or complex templates.
Table 1: Key Characteristics of Common DNA Polymerases
| Polymerase | Optimal Extension Temperature | Typical Extension Rate | Proofreading Activity | Primary Use Cases |
|---|---|---|---|---|
| Taq | 70-75°C [4] | 1 min/kb [4] | No [1] | Routine amplification, PCR for cloning (with A-tailing) |
| Pfu | 72-75°C | 2 min/kb [4] | Yes [23] | High-fidelity amplification for cloning and sequencing |
| Engineered "Fast" Enzymes (e.g., Platinum II Taq) | 68-72°C [22] | 5-20 sec/kb [22] | Varies | Fast cycling, high-throughput applications, complex templates |
A Detailed Experimental Protocol for Extension Optimization
This protocol provides a methodology to systematically optimize the extension phase for a specific target.
Materials and Reagents
Table 2: Essential Research Reagents for PCR Optimization
| Reagent | Function | Typical Final Concentration |
|---|---|---|
| Thermostable DNA Polymerase | Enzyme that synthesizes new DNA strands. | 0.5-2.5 units/50 μL reaction [24] |
| 10X PCR Buffer | Provides optimal pH and salt conditions for the polymerase. | 1X |
| MgCl₂ Solution | Essential cofactor for DNA polymerase activity. | 1.5-2.0 mM (may require optimization) [23] |
| dNTP Mix | Building blocks (dATP, dCTP, dGTP, dTTP) for new DNA synthesis. | 50-200 μM each [24] [23] |
| Forward and Reverse Primers | Define the start and end of the target sequence. | 0.1-0.5 μM each [23] |
| Template DNA | The DNA sample containing the target sequence to be amplified. | 10 pg - 1 μg (depends on complexity) [22] [23] |
| Nuclease-Free Water | Solvent to bring the reaction to its final volume. | Q.S. |
Procedure
Reaction Setup: Prepare a master mix on ice containing all common reagents to minimize pipetting error. A sample setup for a 50 μL reaction is shown below [24]:
- Sterile Nuclease-Free Water: Q.S. to 50 μL
- 10X PCR Buffer: 5 μL
- dNTP Mix (10 mM total): 1 μL
- MgCl₂ (25 mM): variable (e.g., 1.2 μL for 1.5 mM final)
- Forward Primer (20 μM): 1 μL
- Reverse Primer (20 μM): 1 μL
- DNA Polymerase (e.g., 1 U/μL): 0.5 μL
- Template DNA: variable volume
- Gently mix the reaction by pipetting up and down [24].
Thermal Cycling: Place the tubes in a thermal cycler and run a program with the following core structure:
- Initial Denaturation: 94-98°C for 1-3 minutes. [4]
- Cycling (25-35x):
- Denaturation: 94-98°C for 15-30 seconds.
- Annealing: Calculated Tm ± 5°C for 15-30 seconds.
- Extension: Vary this step for optimization (see Section 4.3).
- Final Extension: 72°C for 5-10 minutes to ensure all products are fully extended. [4] [21]
Analysis: Analyze the PCR products using agarose gel electrophoresis. A single, sharp band of the expected size indicates successful and specific amplification.
Optimization Strategy
To optimize the extension phase, set up a series of reactions where a single parameter is varied at a time while keeping all others constant.
- Extension Time Gradient: If your target is 2 kb and using a standard Taq polymerase, test a range of extension times from, for example, 45 seconds to 3 minutes to find the minimal time that produces a strong, specific product [4].
- Temperature for Challenging Templates: For GC-rich templates, a standard temperature of 72°C is often used. However, for AT-rich templates (>80-85% AT), the extension temperature can be lowered to 65-60°C to improve yield [22].
- Magnesium Concentration: If yield remains low after optimizing time and temperature, titrate MgCl₂ concentration in increments of 0.5 mM, typically between 1.0 and 4.0 mM, as Mg²⁺ is an essential cofactor for polymerase activity [21] [23].
Troubleshooting Common Extension Phase Issues
| Problem | Potential Cause | Solution |
|---|---|---|
| No/Smeared Bands | Extension time too short; enzyme activity depleted. | Increase extension time; use a highly thermostable enzyme; check reagent integrity. [4] |
| Non-specific Bands | Extension time too long. | Shorten the extension time to the minimum required. [23] |
| Low Yield | Suboptimal extension temperature; insufficient dNTPs/Mg²⁺; poor polymerase performance on template. | Optimize extension temperature; ensure dNTPs are 50-200 μM; titrate Mg²⁺; switch polymerases (e.g., to one for GC-rich targets). [22] [23] |
| Incomplete Products | Excessive depurination during long denaturation steps. | Minimize denaturation time, especially for long targets (>10 kb). [22] |
The Scientist's Toolkit: Key Reagent Solutions
Table 3: Essential Research Reagent Solutions
| Item | Function | Considerations for Extension |
|---|---|---|
| PCR Tubes/Plates | Vessels for the reaction. | Thin-walled for efficient thermal transfer; compatibility with thermal cycler. |
| Thermal Cycler | Automates temperature cycling. | Precise temperature control and fast ramp rates are critical for reproducibility and optimization. [1] |
| dNTPs | Nucleotide building blocks. | Use balanced solutions; high concentrations can reduce fidelity, low concentrations reduce yield. [23] |
| MgCl₂ Solution | Cofactor for DNA polymerase. | Concentration directly influences enzyme activity and fidelity; requires optimization. [22] [23] |
| PCR Additives (e.g., DMSO, Betaine) | Reduce secondary structure, lower Tm. | Can be crucial for amplifying GC-rich templates (1-10% DMSO). [22] [24] |
The extension phase is far from a mere "waiting period" in the PCR process. It is a dynamic synthesis step governed by the intricate interplay between enzyme characteristics, buffer conditions, and template properties. Mastery over its parameters—temperature, time, and polymerase selection—is not an abstract exercise but a practical necessity for researchers aiming to develop robust diagnostic assays, conduct high-throughput genetic analysis, or produce accurate constructs for drug discovery. By applying the systematic optimization and troubleshooting strategies outlined in this guide, scientists can ensure their PCR experiments consistently achieve high yield, specificity, and fidelity.
The polymerase chain reaction (PCR) is a cornerstone technique of modern molecular biology, enabling the precise amplification of specific DNA fragments from minimal starting material. Since its introduction by Kary Mullis in 1985, for which he was later awarded the Nobel Prize in Chemistry, PCR has become an indispensable tool in basic research, clinical diagnostics, and drug development [2] [1]. The power of PCR lies in its cyclic nature, where a series of temperature steps repeatedly copy the target DNA, leading to an exponential accumulation of millions of copies in a short time. Understanding the intricacies of each step within the PCR cycle—initial denaturation, denaturation, annealing, extension, and final extension—is critical for optimizing assays, ensuring reliability, and accurately interpreting results, especially in sensitive applications like diagnostic test development and quantitative gene expression analysis [2] [25]. This guide provides an in-depth technical examination of the complete PCR process, from the first cycle to data analysis.
Core Principles of PCR
At its core, PCR is a biochemical process that amplifies a specific region of DNA defined by two short, single-stranded DNA molecules known as primers. The process relies on a thermostable DNA polymerase, an enzyme that synthesizes new DNA strands complementary to the target template [1]. The most historically significant of these enzymes is Taq DNA polymerase, isolated from the thermophilic bacterium Thermus aquaticus [2]. Its thermostability—the ability to withstand the high temperatures required for DNA denaturation—was a pivotal discovery that allowed for the automation of PCR using thermal cyclers [1]. The technique involves a series of three fundamental steps—denaturation, annealing, and extension—that are typically repeated for 25-40 cycles to achieve sufficient amplification [2] [25].
The PCR Cycling Steps
A standard PCR run consists of several stages, each with a specific function. The following workflow diagram illustrates the complete process and the logical relationship between these stages.
Initial Denaturation
The first step in PCR is the initial denaturation, which is critical for separating the double-stranded template DNA into single strands, making them accessible for primer binding. This step is typically performed at 94–98°C for 1–3 minutes [25]. The exact conditions depend on the complexity of the template DNA; for example, mammalian genomic DNA or templates with high GC content (e.g., >65%) may require longer incubation or higher temperatures for complete separation [25]. This step also serves to activate hot-start DNA polymerases and can help inactivate heat-labile contaminants [25].
Cyclic Steps
Following the initial denaturation, the reaction undergoes 25-40 cycles of three core steps.
Denaturation: Each cycle begins with a brief denaturation step, typically at 94–98°C for 15–60 seconds, to re-separate the newly formed DNA strands [25]. Inadequate denaturation can lead to poor amplification yields, particularly for long or GC-rich targets [25].
Annealing: The reaction temperature is then lowered to allow the primers to bind (anneal) to their complementary sequences on the single-stranded DNA templates. The optimal annealing temperature is primer-specific and is determined by the primer's melting temperature (Tm), which can be calculated using various formulas that consider length, GC content, and salt concentration [25]. A common starting point is 3–5°C below the calculated Tm of the primers [25]. The annealing step generally lasts 15–60 seconds [25]. Optimization is crucial; if nonspecific products are observed, the temperature can be increased. Conversely, low yield may necessitate a lower annealing temperature [25].
Extension: During this step, the DNA polymerase synthesizes a new DNA strand by adding nucleotides to the 3' end of each primer. The temperature is raised to the enzyme's optimal activity temperature, usually 70–75°C [2] [25]. The extension time depends on the length of the amplicon and the synthesis speed of the polymerase. For instance, Taq DNA polymerase typically requires 1 minute per kilobase of target DNA [25]. In some protocols, if the annealing temperature is sufficiently high, the annealing and extension steps can be combined into a single two-step PCR, shortening the total run time [25].
Final Extension
A single final extension step of 5–15 minutes at 72°C is often performed after the last cycle. This ensures that any remaining single-stranded DNA is fully extended, increasing the yield of full-length products [25]. This step is particularly important for applications like TA cloning, where a final extension of up to 30 minutes is recommended to ensure the addition of a single 'A' base to the 3' ends of the PCR product by enzymes like Taq polymerase [25].
Quantitative PCR (qPCR) Data Analysis
In quantitative PCR (qPCR), also known as real-time PCR, the accumulation of DNA is monitored in real-time using fluorescent dyes or probes [2]. Data analysis revolves around the Quantification Cycle (Cq), the cycle number at which the fluorescent signal crosses a defined threshold [2] [26]. Accurate Cq determination depends on proper baseline correction and threshold setting.
- Baseline Correction: The baseline is the fluorescent signal level during the initial cycles (e.g., cycles 5-15) before detectable amplification occurs. It represents background fluorescence. Correcting for this baseline is essential for accurate Cq values. Incorrect baseline settings can lead to significant errors in Cq determination [26].
- Threshold Setting: The threshold is a fluorescence level set within the exponential phase of amplification, above the baseline. It must be set at a level where all amplification curves for the targets being compared are parallel, indicating similar reaction efficiencies. The absolute Cq value depends on the threshold setting, but the difference in Cq (ΔCq) between samples should be independent of the threshold if set correctly within the parallel, exponential phase [26].
The table below summarizes the primary quantification methods used in qPCR.
Table 1: Common qPCR Data Analysis Methods
| Method | Principle | Key Assumptions/Requirements | Typical Applications |
|---|---|---|---|
| Standard Curve Quantification [26] | Cq values of unknown samples are compared to a standard curve of known concentrations. | A dilution series of a standard with known concentration must be run alongside samples. | Absolute quantification; determining exact copy numbers. |
| Comparative ΔΔCq Method [26] [27] | Fold-change is calculated using the formula 2^–ΔΔCq, comparing target gene Cq to a reference gene and a control sample. | The amplification efficiency of the target and reference gene is approximately equal and close to 100% (a doubling of product each cycle). | Relative gene expression analysis. |
| Efficiency-Adjusted Model (Pfaffl Method) [26] [27] | Similar to ΔΔCq, but incorporates the actual, calculated amplification efficiency (E) of each assay instead of assuming 100%. | The amplification efficiencies for the target and reference genes must be known from validation experiments. | Relative gene expression when amplification efficiencies are known but not 100%. |
Essential PCR Protocols and Reagents
A standard PCR protocol involves combining template DNA, forward and reverse primers, dNTPs, a thermostable DNA polymerase, and a reaction buffer in a single tube [28]. The following table details key reagent solutions and their functions.
Table 2: Key Research Reagent Solutions for PCR
| Reagent | Function | Key Considerations |
|---|---|---|
| Thermostable DNA Polymerase (e.g., Taq) [2] [28] | Enzyme that synthesizes new DNA strands during the extension phase. | Taq polymerase is thermostable but lacks proofreading activity. Pfu and other high-fidelity enzymes offer 3'→5' exonuclease (proofreading) activity for greater accuracy [1]. |
| Primers [2] [25] | Short, single-stranded DNA sequences that define the start and end of the target region to be amplified. | Typically 20-25 nucleotides long. The design and annealing temperature are critical for specificity and efficiency [2]. |
| Deoxynucleotide Triphosphates (dNTPs) [28] | The building blocks (dATP, dCTP, dGTP, dTTP) used by the DNA polymerase to synthesize new DNA. | Added to the reaction mix as a equimolar solution. |
| Reaction Buffer [28] [25] | Provides optimal chemical conditions (pH, salts) for polymerase activity. | Often contains magnesium ions (Mg²⁺), which is a essential cofactor for Taq and other DNA polymerases. The MgCl₂ concentration may require optimization [28]. |
| Template DNA [28] | The DNA sample containing the target sequence to be amplified. | Can be genomic DNA, cDNA, plasmid DNA, etc. Purity and quantity affect amplification; common inhibitors include phenol, EDTA, and heparin [2]. |
| Additives (e.g., DMSO, Betaine) [25] | Assist in amplifying difficult templates. | Can help denature DNA with high GC content or strong secondary structure by lowering the template's melting temperature [25]. |
Detailed Standard Protocol Using Taq Polymerase
- Prepare Reaction Mix: Assemble the following components in a PCR tube on ice [28]:
- 1X PCR Buffer (often supplied with the enzyme, may contain MgCl₂)
- 0.2 mM each dNTP
- 0.5-1.0 µM each forward and reverse primer
- 1-2 Units of Taq DNA Polymerase
- 10-100 ng of template DNA
- Nuclease-free water to the final volume (e.g., 50 µL)
- Thermal Cycling: Place the tubes in a thermal cycler and run the following program [28] [25]:
- Initial Denaturation: 95°C for 2-3 minutes. (1 cycle)
- Amplification Cycle:
- Denaturation: 95°C for 15-30 seconds.
- Annealing: 55-72°C (primer-specific) for 15-60 seconds.
- Extension: 72°C for 1 minute per kilobase of expected product. (Repeat for 25-35 cycles)
- Final Extension: 72°C for 5-10 minutes. (1 cycle)
- Hold: 4°C indefinitely.
- Product Analysis: Analyze the amplified DNA by agarose gel electrophoresis and ethidium bromide staining to visualize the size and quantity of the PCR product [28].
The polymerase chain reaction is a powerful yet methodical technique whose success hinges on a deep understanding of its full cycle. From the initial activation and strand separation to the meticulously optimized cyclic steps of denaturation, annealing, and extension, and through to the final product maturation, each phase plays a vital role in determining the specificity, yield, and fidelity of the amplification. For researchers and drug development professionals, mastering these parameters and the associated data analysis methods—especially in the context of qPCR—is fundamental to generating robust, reproducible, and meaningful scientific data. As PCR continues to be a foundational tool in molecular biology, a precise comprehension of its complete workflow remains essential.
Advanced PCR Protocols and Specialized Applications
Tailoring Cycling Parameters for Different PCR Types (qPCR, RT-PCR, Multiplex)
The polymerase chain reaction (PCR) stands as a foundational technique in molecular biology, with its effectiveness fundamentally dependent on the precise optimization of thermal cycling parameters. While the core principles of denaturation, annealing, and extension are universal, their specific application must be tailored to the distinct requirements of different PCR methodologies to achieve optimal sensitivity, specificity, and efficiency. Within the context of broader PCR research, understanding these subtleties is paramount for advancing diagnostic applications and drug development. This technical guide provides an in-depth analysis of cycling parameter optimization for three critical PCR variants: quantitative PCR (qPCR), reverse transcription PCR (RT-PCR), and multiplex PCR. By synthesizing current research and established protocols, we aim to equip researchers and scientists with the framework necessary to design robust, reproducible, and efficient amplification strategies for their specific applications.
Core Principles of PCR Cycling
The three fundamental steps of PCR—denaturation, annealing, and extension—form a cycle that is repeated to exponentially amplify a target DNA sequence. The precise temperature and duration of each step must be carefully controlled and are influenced by the reaction components and the instrument itself.
Denaturation: This initial step involves heating the reaction to a high temperature (typically 94–98°C) to separate the double-stranded DNA template into single strands. The complexity and GC-content of the template are key considerations; for instance, GC-rich templates may require higher temperatures or longer denaturation times for complete strand separation [4]. Incomplete denaturation can lead to inefficient amplification and reduced yield.
Annealing: The temperature is lowered (typically within a 45–65°C range) to allow primers to bind (anneal) to their complementary sequences on the single-stranded DNA templates. The annealing temperature (Ta) is one of the most critical parameters to optimize and is primarily determined by the melting temperature (Tm) of the primers [4]. Using a Ta too low can result in non-specific binding and primer-dimer formation, while a Ta too high can reduce reaction efficiency due to insufficient primer binding [29].
Extension: The temperature is raised to the optimal working temperature for the DNA polymerase (e.g., 68–72°C for Taq polymerase). During this step, the polymerase synthesizes a new DNA strand complementary to the template. The extension time is directly proportional to the length of the amplicon and the processivity of the enzyme. A common starting point is 1 minute per kilobase for standard polymerases, though faster enzymes can significantly reduce this time [4].
The following workflow outlines the systematic approach to optimizing these core parameters for any given assay.
Method-Specific Optimization Strategies
Quantitative PCR (qPCR)
qPCR builds upon standard PCR by enabling real-time monitoring of amplification, requiring stringent optimization to ensure that the quantification cycle (Cq) accurately reflects the initial template concentration. A primary consideration is the choice of detection chemistry.
Table 1: Comparison of qPCR Detection Methods
| Feature | SYBR Green (Dye-Based) | Hydrolysis Probe (TaqMan) | Hairpin Probe (Molecular Beacon) |
|---|---|---|---|
| Principle | Binds double-stranded DNA [30] | Probe cleavage by 5'→3' exonuclease activity [31] | Fluor-quencher separation upon target binding [31] |
| Specificity | Lower (requires melt curve) [31] | High (sequence-specific) [30] | High (sequence-specific) [31] |
| Multiplexing | Not possible | Yes (with different dyes) [31] | Yes (with different dyes) |
| Cost & Setup | Lower cost, simpler setup [30] | Higher cost, requires probe design | Higher cost, requires probe design |
| Key Optimization | Primer concentration, melt curve analysis [29] | Probe and primer concentration | Probe and primer concentration |
Key cycling parameters for qPCR often utilize a two-step protocol (combining annealing and extension, e.g., at 60°C) for speed and efficiency, especially with hydrolysis probes [29]. However, for assays with challenging primer design, a three-step protocol (with separate annealing and extension steps) may be beneficial. The use of a hot-start DNA polymerase is strongly recommended to prevent non-specific amplification and primer-dimer formation that can skew quantification [32]. Furthermore, high-resolution melt curve analysis is an indispensable tool for validating assay specificity in dye-based qPCR, as it can distinguish target amplicons from non-specific products based on their characteristic melting temperatures (Tm) [33] [31].
Reverse Transcription PCR (RT-PCR)
RT-PCR begins with RNA and involves a reverse transcription (RT) step to generate complementary DNA (cDNA), which is then amplified. The critical distinction lies in the integration of this initial step.
- One-Step vs. Two-Step RT-PCR: In the one-step protocol, the reverse transcription and PCR amplification are performed in a single tube with a unified buffer. This approach is faster, minimizes contamination risk, is easier to automate, and is ideal for high-throughput applications [31]. Conversely, the two-step protocol performs the RT reaction first, and then an aliquot of the cDNA is used in a subsequent PCR. The primary advantage of the two-step method is that the cDNA product can be stored and used for multiple amplification reactions, allowing for the analysis of many different targets from a single RNA sample [31].
Table 2: One-Step vs. Two-Step RT-PCR Comparison
| Characteristic | One-Step RT-PCR | Two-Step RT-PCR |
|---|---|---|
| Workflow | Combined RT and PCR in one tube [34] | Separate RT and PCR reactions [31] |
| Speed | Faster, more convenient [31] | More time-consuming |
| Contamination Risk | Lower | Higher (from tube handling) |
| cDNA Utility | Single use | Can be used for multiple targets [31] |
| Optimization Flexibility | Compromised; single buffer for both steps | Independent optimization of RT and PCR steps [31] |
| Sample Throughput | Ideal for high-throughput [31] | Ideal for multiple analyses from one sample |
Optimization must account for both enzymatic processes. Research indicates that buffer composition significantly impacts the performance of 1-Step RT-qPCR, affecting metrics like Cq values, amplification efficiency, and product Tm [34]. The cycling parameters for the PCR amplification stage follow the same principles as standard qPCR, but the initial steps must include conditions optimal for the reverse transcriptase (e.g., 37°C for 15 minutes for GoScript Reverse Transcriptase, followed by its inactivation and polymerase activation at 95°C) [34].
Multiplex PCR
Multiplex PCR involves the simultaneous amplification of multiple targets in a single reaction, demanding rigorous optimization to ensure all primer pairs function efficiently without interfering with one another.
- Primer Design: The foundation of a successful multiplex assay is primer design. All primers should have closely matched melting temperatures (Tm within 5°C) to allow for a common annealing temperature [32]. They must be highly specific to their intended targets to prevent mispriming or cross-hybridization, which can be checked using tools like OligoArchitect to minimize self- and cross-dimer formation [29].
- Primer and Probe Concentration: Not all primer pairs will perform optimally at the same concentration in a multiplex setting. It is often necessary to titrate primer concentrations (typically between 50-500 nM) to balance the amplification efficiency of all targets. Reducing the concentration of primers for highly abundant targets can prevent them from dominating the reaction and depleting reagents [29].
- Hot-Start Polymerase: The use of a robust hot-start polymerase is non-negotiable in multiplex PCR to suppress non-specific amplification and primer-dimer formation during reaction setup [32] [35].
- Buffer and Additives: The PCR buffer must be capable of supporting the simultaneous amplification of multiple loci. Specialized master mixes are often formulated with isostabilizing components to facilitate this [32]. A recent study developing a multiplex assay for respiratory pathogens successfully utilized a 5× One Step U* Mix and optimized primer/probe ratios to achieve a 100% detection rate for their targets [36].
The relationship between these critical factors for multiplex assay development is illustrated below.
Advanced Considerations & Experimental Protocols
Fast and Extreme PCR
Advances in instrumentation and enzyme technology have enabled dramatic reductions in PCR cycle times. Fast PCR leverages highly processive polymerases and thin-walled reaction tubes to allow for shorter denaturation, annealing, and extension steps [32]. For very short amplicons, Extreme PCR pushes this further, with cycling times potentially under 15 seconds. This requires specialized instruments and optimized reagent concentrations, with studies showing that 200-500 ms above the denaturation threshold and 300-1000 ms below the annealing threshold can be sufficient for maximal efficiency [37].
Troubleshooting Common Issues
Even with careful planning, assays may require fine-tuning. The table below outlines common symptoms and their potential solutions.
Table 3: Troubleshooting Guide for PCR Cycling Parameters
| Observation | Potential Cause | Recommended Optimization |
|---|---|---|
| No or low amplification | Annealing temperature too high, insufficient extension time | Lower Ta in 2-3°C increments; increase extension time [4] |
| Non-specific bands/peaks | Annealing temperature too low, primer concentration too high | Increase Ta in 2-3°C increments; titrate to lower primer concentration [29] [4] |
| Primer-dimer formation | Annealing temperature too low, primer design issues, no hot-start enzyme | Increase Ta; redesign primers to avoid 3' complementarity; use hot-start polymerase [29] [32] |
| Poor efficiency in multiplex | Imbalanced primer efficiency, reagent limitation | Titrate individual primer pair concentrations; use a specialized multiplex master mix [29] [35] |
Protocol: Optimization of Primer Annealing Temperature
This is a fundamental protocol applicable to all PCR types.
- Reaction Setup: Prepare a master mix containing all standard reaction components: buffer, dNTPs, DNA polymerase, template, and primers.
- Gradient PCR: Aliquot the master mix into a thermal cycler capable of generating a temperature gradient across the block (e.g., from 55°C to 65°C).
- Cycling: Run the PCR with the denaturation and extension times fixed, while the annealing step uses the gradient.
- Analysis: Analyze the results via gel electrophoresis (endpoint PCR) or melt curve analysis (qPCR). The optimal annealing temperature is the highest temperature that produces the highest yield of the specific product and the lowest yield of non-specific products or primer-dimers [29] [4].
Protocol: Buffer Optimization for 1-Step RT-qPCR
Based on a study using the Promega PCR Optimization Kit [34].
Master Mix Preparation: For each buffer to be tested (e.g., Buffers A-H), prepare an intermediate 2X master mix. A sample formulation for a 25µL reaction is:
- 1X PCR Buffer (from the kit, contains dNTPs)
- 0.05 U/µL GoTaq Hot Start Polymerase
- 0.2 U/µL GoScript Reverse Transcriptase
- 1 U/µL Recombinant RNasin Ribonuclease Inhibitor
- 2 mM MgCl₂ (concentration may require optimization)
- 1X BRYT Green Dye (or SYBR Green I)
- 30 nM CXR (passive reference dye, if required by instrument)
- 200 nM forward and reverse primers
Reaction Assembly: Combine the 2X master mix with RNA template and nuclease-free water.
Cycling Conditions: Run on a real-time PCR instrument with cycling conditions such as:
- Reverse Transcription: 37°C for 15 min
- Initial Denaturation/Activation: 95°C for 10 min
- 45 Cycles:
- Denaturation: 95°C for 10 s
- Annealing/Extension: 62°C for 1 min
- Melt Curve Analysis: 60°C to 95°C with continuous fluorescence reading.
Data Analysis: Select the buffer that provides the lowest Cq value, highest amplification efficiency (~90-110%), a single distinct peak in melt curve analysis, and no signal in the no-template control (NTC) [34].
The Scientist's Toolkit: Essential Reagents for Optimization
Table 4: Key Research Reagent Solutions for PCR Optimization
| Reagent / Kit | Primary Function | Application Context |
|---|---|---|
| Hot-Start DNA Polymerase | Inhibits polymerase activity at low temps to prevent non-specific amplification [32] | Essential for multiplex, qPCR, and high-specificity assays |
| PCR Optimization Kit (e.g., Promega) | Provides a panel of buffered solutions with varying salt/additive compositions [34] | Systematic identification of optimal buffer conditions for a new assay |
| One-Step RT-qPCR Systems | Combines reverse transcriptase and DNA polymerase in a unified buffer [34] | Streamlined RNA quantification; ideal for high-throughput viral testing |
| Multiplex PCR Master Mix | Specially formulated buffer with balanced salt and additive concentrations [32] [35] | Enables simultaneous amplification of multiple targets without cross-interference |
| GC-Rich Enhancers (DMSO, Betaine) | Lowers DNA melting temperature, disrupts secondary structures [4] [32] | Amplification of GC-rich templates (>65%) that are prone to forming stable structures |
| dsDNA Binding Dyes (BRYT Green, SYBR Green) | Fluorescently labels all double-stranded DNA for detection in qPCR [30] [34] | Cost-effective, flexible qPCR for single-target assays; requires melt curve validation |
The meticulous tailoring of cycling parameters is not a mere procedural formality but a critical determinant of success in modern PCR applications. As this guide has detailed, the optimal conditions for denaturation, annealing, and extension vary significantly across qPCR, RT-PCR, and multiplex PCR, driven by their unique technical demands. The advent of fast-cycling enzymes, specialized buffers, and sophisticated probe systems provides researchers with an powerful toolkit for optimization. By adhering to a systematic approach—beginning with rigorous in silico design, followed by empirical testing of parameters like annealing temperature and buffer composition, and culminating in rigorous specificity checks—scientists can develop robust and reliable PCR assays. This precision is the cornerstone upon which advancements in gene expression analysis, clinical diagnostics, and drug development are built, ensuring that PCR remains an indispensable technique in the molecular sciences.
Within the framework of polymerase chain reaction (PCR) research, a thorough understanding of the cycling steps—denaturation, annealing, and extension—is fundamental. However, conventional PCR protocols often fail when confronted with complex templates, such as those with high guanine-cytosine (GC) content or long amplicons. These challenges stem from the intrinsic physicochemical properties of DNA that hinder enzyme processivity and primer binding fidelity. This guide provides an in-depth technical overview of the strategies and methodologies required to successfully amplify these difficult targets, equipping researchers with the knowledge to optimize their experimental outcomes.
The Core Challenge: Biochemical Hurdles of Complex Templates
Amplifying complex DNA sequences requires an understanding of the specific obstacles they present.
- GC-Rich Regions (>65% GC): The primary challenge with GC-rich templates arises from the triple hydrogen bonds between G and C bases, compared to the double bonds in A-T pairs [38]. This makes the DNA duplex more thermostable and resistant to denaturation [39]. Furthermore, these regions have a high propensity to form stable secondary structures—such as hairpins, knots, and tetraplexes—that can physically block the progression of the DNA polymerase, leading to truncated amplicons or complete PCR failure [40] [41].
- Long Amplicons (>5 kb): The amplification of long DNA fragments is particularly susceptible to the cumulative effects of DNA damage. Incorrect template quality, depurination at high temperatures or low pH, and DNA breakage during isolation can prevent the synthesis of full-length products [42]. The probability of the polymerase dissociating before completing the synthesis also increases with amplicon length, making enzyme processivity and fidelity critical factors.
The following diagram illustrates the logical workflow for diagnosing and addressing common PCR issues with complex templates.
Optimizing PCR Cycling Parameters
The standard three-step PCR cycle must be meticulously adjusted to overcome the challenges posed by difficult templates. The parameters for each step are interdependent and require careful balancing.
Denaturation
For complex templates, the denaturation step is critical for ensuring complete separation of the DNA strands.
- Initial Denaturation: For GC-rich templates, a longer initial denaturation of 2–4 minutes at 98°C is recommended to fully separate the stubborn double-stranded DNA [43] [42]. For long amplicons, however, the denaturation time should be minimized (e.g., 15-30 seconds at 98°C) to reduce depurination and DNA damage [42].
- Cycle Denaturation: Subsequent cycles should use a higher denaturation temperature (98°C) for GC-rich templates, while standard temperatures (94–95°C) can be sufficient for long amplicons, provided the initial denaturation is effective [4] [42].
Annealing
The annealing temperature (Ta) is a key determinant for specificity and yield.
- Calculation: The Ta is typically set 3–5°C below the primer melting temperature (Tm) [4]. The Tm can be calculated using the nearest-neighbor method, which accounts for salt concentrations and is considered more accurate [4]. Online calculators provided by enzyme manufacturers (e.g., NEB Tm Calculator) are highly recommended.
- Optimization: If nonspecific products are observed, the Ta should be increased in increments of 2–3°C. Conversely, if yield is low, the Ta can be lowered [4]. For primers with a Tm above 68°C, a two-step PCR protocol (combining annealing and extension) is often beneficial [42].
Extension
The extension phase must be tailored to the DNA polymerase and the amplicon length.
- Temperature: A lower extension temperature of 68°C is preferred for long amplicons as it reduces the rate of depurination [42]. For shorter, standard fragments, 72°C is common.
- Time: Extension time is proportional to the length of the amplicon and the synthesis rate of the polymerase. While Taq polymerase may require ~1 minute/kb, high-fidelity enzymes like Pfu may need 2 minutes/kb [4]. "Fast" polymerases can significantly reduce this time [42]. A final extension step of 5–15 minutes is crucial to ensure all products are fully synthesized and, if using Taq, to add 3´ A-overhangs for cloning [4] [43].
The table below summarizes the key parameter adjustments for different template types.
Table 1: PCR Cycling Parameter Adjustments for Complex Templates
| Parameter | Standard Target | GC-Rich Target | Long Amplicon Target |
|---|---|---|---|
| Initial Denaturation | 94–95°C for 1–3 min [4] | 98°C for 2–4 min [43] [42] | 94–98°C for 1–3 min; minimize time to limit depurination [42] |
| Cycle Denaturation | 94–95°C for 15–30 sec [44] | 98°C for 10–30 sec [42] | 94–98°C for 15–30 sec [4] |
| Annealing Temperature | 5°C below primer Tm [4] | May require higher Ta for specificity; test gradients [38] | Use primers with Tm > 68°C; consider touchdown PCR [42] |
| Extension Time | 1 min/kb (polymerase-dependent) [4] | 1–2 min/kb (polymerase-dependent) | Longer times needed; 1 min/kb for Taq, 2 min/kb for Pfu [4] |
| Extension Temperature | 68–72°C [43] [44] | 68–72°C | 68°C is preferred to reduce depurination [42] |
| Final Extension | 5 min at 68–72°C [44] | 5–15 min at 68–72°C [4] | 5–15 min at 68°C [43] |
| Cycle Number | 25–35 [4] | Up to 40 for low-copy targets [4] | 25–35; more cycles may require longer extension [43] |
Advanced Reagents and Formulations
The choice of reagents goes beyond standard protocols and is pivotal for success.
DNA Polymerase Selection
Not all DNA polymerases are created equal. Blended enzyme systems often provide the best results for complex templates.
- GC-Rich Templates: Polymerases like OneTaq (a blend of Taq and a high-fidelity polymerase) are ideal as they are supplied with specialized GC buffers and enhancers [43] [38]. Q5 High-Fidelity DNA Polymerase is another excellent option due to its high processivity and ability to handle secondary structures [38] [39].
- Long Amplicons: Enzymes with high processivity and proofreading activity (3'→5' exonuclease) are essential. PrimeSTAR GXL DNA Polymerase and Takara LA Taq are specifically designed for long-range PCR, as they can efficiently synthesize DNA over many kilobases without dissociating [42] [39].
PCR Additives and Enhancers
Additives can dramatically improve amplification by destabilizing secondary structures and lowering DNA melting temperatures.
- Betaine: This is a highly effective additive for GC-rich templates. It equalizes the stability of AT and GC base pairs, promoting more uniform strand separation and preventing the formation of secondary structures [40] [41].
- DMSO (Dimethyl Sulfoxide): DMSO interferes with the formation of hydrogen bonds and can help denature stable DNA structures. It is commonly used at concentrations of 2.5–10% [38] [42]. Note that it can inhibit some DNA polymerases at higher concentrations.
- GC Enhancers: Commercial proprietary formulations, such as the OneTaq High GC Enhancer or Q5 High GC Enhancer, often contain a optimized mix of additives and are a convenient and reliable solution [43] [38].
Magnesium and dNTP Concentration
Magnesium ion (Mg²⁺) concentration is a critical cofactor for polymerase activity.
- Optimization: While a concentration of 1.5–2.0 mM is standard for many polymerases, challenging templates may require fine-tuning. If no product is formed, try increasing the Mg²⁺ in 0.2–0.5 mM increments up to 4 mM. If non-specific bands appear, try lowering the concentration [43] [44].
- dNTPs: Typical concentrations are 200 µM of each dNTP. Higher concentrations can be beneficial for long PCR but may reduce fidelity, while lower concentrations (50-100 µM) can enhance fidelity at the cost of yield [44].
Table 2: Research Reagent Solutions for Complex PCR Templates
| Reagent Category | Specific Examples | Function & Application Notes |
|---|---|---|
| Specialized Polymerases | OneTaq DNA Polymerase [43] | Enzyme blend for routine and GC-rich PCR; supplied with GC Buffer. |
| Q5 High-Fidelity DNA Polymerase [38] [39] | High-fidelity enzyme ideal for long, difficult, and GC-rich amplicons. | |
| PrimeSTAR GXL DNA Polymerase [42] [39] | Optimized for long-range amplification and complex genomic templates. | |
| PCR Additives | Betaine (1–1.5 M) [40] [41] | Equalizes DNA base-pair stability; disrupts secondary structures in GC-rich regions. |
| DMSO (2.5–10%) [38] [42] | Aids in denaturation of DNA duplexes; lowers melting temperature. | |
| Commercial GC Enhancer [43] [38] | Proprietary formulations for maximum performance with GC-rich targets. | |
| Buffer Systems | OneTaq GC Reaction Buffer [43] | Specifically formulated for amplicons with >65% GC content. |
| KAPA HiFi Buffer [39] | Proprietary system for enhanced denaturation of GC-rich regions. |
Experimental Protocols for Key Methodologies
Optimized Protocol for GC-Rich Templates
The following protocol, adapted from research on amplifying GC-rich nicotinic acetylcholine receptor subunits, provides a robust starting point [40] [41].
- Polymerase: Use a high-fidelity, GC-tolerant polymerase such as Platinum SuperFi or Phusion High-Fidelity.
- Reaction Setup:
- 1X GC Buffer (provided with the enzyme)
- 10–20% GC Enhancer (e.g., OneTaq High GC Enhancer) or a combination of 1 M Betaine and 5% DMSO [43] [41].
- 1.5–2.0 mM MgCl₂ (adjust if needed).
- 200 µM of each dNTP.
- 0.2–0.5 µM of each primer.
- 1–10 ng of genomic DNA or 1 pg–1 ng of plasmid DNA.
- 1.25–2.5 units of DNA polymerase per 50 µL reaction.
- Cycling Conditions:
- Initial Denaturation: 98°C for 2–4 minutes.
- 35 Cycles:
- Denaturation: 98°C for 10–30 seconds.
- Annealing: Temperature gradient from 65–75°C (optimize for primer set) for 15–30 seconds.
- Extension: 72°C for 1–2 minutes per kb (adjust based on polymerase speed).
- Final Extension: 72°C for 5–10 minutes.
- Hold: 4°C.
Optimized Protocol for Long Amplicons
This protocol emphasizes template integrity and sustained polymerase activity for synthesizing long DNA fragments [42].
- Polymerase: Use a long-range, high-fidelity enzyme like PrimeSTAR GXL or Takara LA Taq.
- Reaction Setup:
- 1X proprietary reaction buffer (often provided with Mg²⁺ optimized).
- 200 µM of each dNTP.
- 0.2–0.5 µM of each primer (designed with Tm > 68°C).
- High-quality, intact genomic DNA (10–100 ng for mammalian DNA).
- Higher enzyme concentration (e.g., 2.5 units per 50 µL reaction).
- Cycling Conditions (Two-Step PCR is often beneficial):
- Initial Denaturation: 94°C for 1–2 minutes.
- 30–35 Cycles:
- Denaturation: 98°C for 10–20 seconds.
- Annealing/Extension: 68°C for 1–2 minutes per kb (use polymerase-specific recommendations).
- Final Extension: 68°C for 10–15 minutes.
- Hold: 4°C.
Successfully amplifying GC-rich regions and long amplicons is a common hurdle in molecular biology that demands a systematic and informed approach. Moving beyond standard protocols requires a holistic strategy that integrates optimized thermal cycling parameters, specialized enzyme systems, and strategic use of reaction additives. By understanding the underlying biochemical challenges and applying the tailored methodologies outlined in this guide, researchers can reliably overcome these obstacles, thereby advancing their work in gene characterization, cloning, and drug development. The process is iterative, but with a structured troubleshooting workflow and the right toolkit, robust and reproducible amplification of complex templates is an achievable goal.
Hot-start DNA polymerases represent a critical advancement in polymerase chain reaction (PCR) technology, specifically engineered to overcome the challenge of nonspecific amplification that plagues conventional PCR. By remaining inactive at lower temperatures encountered during reaction setup, these enzymes prevent the extension of misprimed sequences and primer-dimer formation. This technical guide explores the mechanisms, implementation, and optimization of hot-start DNA polymerases within the framework of PCR cycling steps—denaturation, annealing, and extension. Through detailed methodologies, quantitative comparisons, and practical tools, this whitepaper provides researchers and drug development professionals with the comprehensive knowledge necessary to enhance assay specificity, sensitivity, and reproducibility in genetic research and diagnostic applications.
The polymerase chain reaction (PCR) is a foundational technique in molecular biology, enabling the exponential amplification of specific DNA sequences through repetitive thermal cycling. The core process involves three fundamental steps: denaturation (separating double-stranded DNA), annealing (binding primers to complementary sequences), and extension (synthesizing new DNA strands). A persistent challenge in conventional PCR is nonspecific amplification, where DNA polymerases exhibit enzymatic activity at temperatures below the optimal annealing temperature, leading to the amplification of non-target sequences [45] [46].
This nonspecific activity occurs primarily during reaction setup at room temperature, where primers can bind to non-complementary sequences with low homology (mispriming) or to each other (primer-dimer formation) [47]. The DNA polymerase may then extend these incorrectly bound primers, generating spurious amplification products that compete with the target amplicon for reagents, ultimately reducing PCR yield, sensitivity, and reliability [46] [47]. Hot-start DNA polymerase technology was developed specifically to address this limitation by inhibiting the enzyme's activity until high temperatures are reached during the first denaturation step, thereby ensuring that amplification initiates only under stringent conditions [45].
The Mechanism of Hot-Start DNA Polymerases
Hot-start DNA polymerases are engineered to remain inactive during PCR reaction setup at room temperature. The inhibitory modifier is released or degraded during the initial high-temperature denaturation step, activating the enzyme only after the reaction mixture has reached a temperature that prevents nonspecific primer binding [48] [46]. The specific mechanisms of inhibition vary by technology, each with distinct advantages and operational considerations.
Comparison of Hot-Start Technologies
The table below summarizes the primary hot-start technologies employed in commercial DNA polymerases.
Table 1: Key Characteristics of Major Hot-Start Technologies
| Technology Type | Mechanism of Inhibition | Activation Requirements | Key Advantages | Potential Limitations |
|---|---|---|---|---|
| Antibody-Based [46] [47] | An antibody binds the polymerase's active site, blocking activity. | Short initial denaturation (e.g., 2 min at 94°C) degrades the antibody [46]. | Rapid activation; full restoration of native enzyme activity [47]. | Presence of exogenous animal-origin proteins [47]. |
| Chemical Modification [47] | Covalent attachment of chemical groups blocks the active site. | Longer initial denaturation (e.g., 10 min) required to remove modifiers [49] [47]. | Stringent inhibition; animal-origin free [47]. | Can affect amplification of long targets (>3 kb); full activity not always restored [47]. |
| Aptamer-Based [48] [50] | An engineered oligonucleotide binds the enzyme via non-covalent interactions. | Reversible, temperature-dependent dissociation; no dedicated activation step needed [48] [50]. | Fast activation; animal-origin free; reversible binding [48] [50]. | May be less stringent; stability at room temperature can vary [47]. |
| Affibody-Based [47] | A small, engineered protein domain binds to the polymerase. | Short initial denaturation step. | Less exogenous protein than antibody methods; animal-origin free [47]. | May be less stringent than antibody-based methods [47]. |
The following diagram illustrates the general operational mechanism of a hot-start DNA polymerase throughout the PCR cycling process.
Integrating Hot-Start Polymerases into PCR Cycling Parameters
The efficacy of hot-start DNA polymerases is fully realized only when integrated with optimally designed PCR cycling parameters. The inhibited enzyme becomes a functional component during the initial denaturation step, aligning its activation with the establishment of specific amplification conditions.
Critical Phases of the PCR Cycle
1. Initial Denaturation and Polymerase Activation This first step in the thermal cycler serves a dual purpose: it separates the double-stranded DNA template into single strands, and it activates the hot-start polymerase [4]. The temperature and duration of this step are critical and depend on the polymerase and the template.
- Temperature: Typically 94–98°C [4].
- Duration: 1–3 minutes for most templates, though GC-rich or complex genomic DNA may require longer incubation [4].
- Hot-Start Consideration: The duration must be sufficient to fully activate the enzyme. Antibody-based methods typically require only a short incubation (e.g., 2 minutes), while chemically modified polymerases may need a longer period (e.g., 10 minutes) [49] [46].
2. Denaturation in Subsequent Cycles In each cycle, a brief denaturation step (0.5–2 minutes at 94–98°C) ensures the amplified products are single-stranded for the next round of priming [4]. Highly thermostable hot-start polymerases are advantageous here, as they resist inactivation during repeated exposure to high temperatures.
3. Primer Annealing for Specificity The reaction is cooled to a temperature (typically 45–65°C) that allows primers to bind specifically to their complementary sequences [4]. The hot-start mechanism is crucial here; by preventing activity at lower temperatures, it ensures no polymerase is available to extend primers that bind non-specifically at this stage.
- Annealing Temperature: Is determined by the primer's melting temperature (Tm) and often requires optimization. A higher annealing temperature increases stringency and specificity [4].
- Formula for Tm estimation: ( T_m = 4(G + C) + 2(A + T) ) provides a simple estimate, though more accurate methods like the Nearest Neighbor method are preferred [4].
4. Primer Extension The temperature is raised to the optimum for the DNA polymerase (usually 70–75°C) for synthesis of the new DNA strand [4]. The extension time is determined by the length of the amplicon and the synthesis speed of the polymerase (e.g., 1 min/kb for Taq, 2 min/kb for Pfu) [4].
Quantitative Impact on PCR Performance
The benefits of hot-start DNA polymerases are quantifiable across key performance metrics. The following table synthesizes experimental data from comparative studies.
Table 2: Quantitative Performance Comparison of Hot-Start vs. Standard DNA Polymerases
| Performance Metric | Standard DNA Polymerase | Hot-Start DNA Polymerase | Experimental Context & Notes |
|---|---|---|---|
| Non-Specific Amplification | Significant spurious bands and primer-dimer formation [46]. | Drastically reduced or eliminated non-target products [46]. | Visual assessment by gel electrophoresis [46]. |
| Target Amplicon Yield | Reduced due to competition for reagents by non-specific products [46]. | Increased yield of the desired product [46] [47]. | Measured via fluorescence or gel densitometry [46]. |
| Analytical Sensitivity (LOD) | Can be significantly compromised [49]. | Enables detection of low copy numbers (e.g., down to a single copy) [49]. | A study showed a >10⁶-fold difference in sensitivity when switching polymerases without optimization [49]. |
| Room-Temperature Setup Stability | Nonspecific amplification increases with setup time [46]. | Stable for up to 72 hours without loss of specificity [46]. | Essential for high-throughput automated systems [46]. |
Experimental Protocol: Evaluating and Validating a Hot-Start Polymerase
Directly substituting a polymerase in an established assay without re-validation can lead to catastrophic failure, including a complete loss of signal or a million-fold reduction in sensitivity [49]. The following protocol provides a framework for evaluating a new hot-start polymerase using a well-characterized qPCR assay as a model.
Research Reagent Solutions
Table 3: Essential Reagents for Hot-Start PCR Evaluation
| Reagent / Material | Function / Description | Example / Specification |
|---|---|---|
| Hot-Start DNA Polymerase | The enzyme under evaluation; the core component of the reaction. | Can be a standalone enzyme or part of a ready-to-use mastermix [49]. |
| Template DNA | Contains the target sequence to be amplified. | Use a standardized, well-quantified sample (e.g., genomic DNA, plasmid). |
| Target-Specific Primers & Probe | Oligonucleotides that define the amplicon and enable quantification. | Designed for a specific, well-characterized assay (e.g., L. monocytogenes prfA assay) [49]. |
| dNTPs | The building blocks (nucleotides) for new DNA synthesis. | A balanced mixture of dATP, dCTP, dGTP, and dTTP. |
| PCR Buffer | Provides optimal chemical environment (pH, salts) for the polymerase. | Often supplied with the enzyme; MgCl₂ concentration is a key variable [48] [49]. |
| MgCl₂ Solution | A critical co-factor for DNA polymerase activity. | Concentration often requires optimization; typically 1.5–4.0 mM [49]. |
| Nuclease-Free Water | Solvent for the reaction, free of contaminating nucleases. |
Methodological Workflow
The following diagram outlines the key stages in the experimental workflow for validating a hot-start polymerase.
STEP 1: Initial Assessment under Standard Conditions
- Prepare a calibration curve using serial dilutions of template DNA (e.g., from 10⁶ to 10¹ copies per reaction) [49].
- Run the qPCR assay using the thermal profile and reagent concentrations (especially MgCl₂) originally published or standardized for a different polymerase.
- Analysis: Assess the quantification cycle (Cq), amplification efficiency (ideally 90-105%), linearity (R² > 0.98), and the maximum fluorescence signal [49].
STEP 2: Optimization of Critical Parameters If performance is suboptimal, iterate using the following parameters:
- MgCl₂ Concentration: Titrate MgCl₂ (e.g., 1.5 mM to 4.0 mM in 0.5 mM increments) as it profoundly affects enzyme activity and specificity [49].
- Thermal Profile: Adjust the denaturation and extension times. For challenging templates, a combined annealing/extension step at a higher temperature (e.g., 59°C) can be tested [49].
- For antibody-based polymerases, ensure the initial denaturation is sufficient for activation.
STEP 3: Final Validation using Advanced Metrics
- Poisson Analysis: At the limit of detection (low copy numbers), use digital PCR or statistical methods based on Poisson distribution to confirm the assay's ability to detect a single molecule [49].
- PCR-Stop Analysis: Analyze the reaction products at different cycles to ensure specific product accumulation without the appearance of non-specific byproducts later in the cycling process [49].
Discussion and Future Perspectives
The adoption of hot-start DNA polymerases has become a standard best practice in PCR, driven by the unequivocal benefits of enhanced specificity and yield. The global market for these enzymes is projected to grow from an estimated $800 million in 2025 to approximately $1.3 billion by 2033, reflecting their entrenched role in life sciences [51]. This growth is fueled by expanding applications in genomics, personalized medicine, and PCR-based diagnostics for infectious diseases [51] [52].
Future developments are focused on engineering next-generation enzymes that combine hot-start capability with other critical properties. Key trends include the development of enzymes with:
- Higher Fidelity: Reduced error rates for applications like cloning and NGS [46].
- Enhanced Processivity: Improved ability to amplify long, complex, or GC-rich templates [46].
- Fast Cycling Formulations: Optimized for speed in mastermix formats for high-throughput applications [4] [52].
As PCR continues to be a cornerstone of genetic research and molecular diagnostics, the strategic selection and rigorous validation of hot-start DNA polymerases remain fundamental to achieving reliable, reproducible, and specific amplification results.
Polymersse chain reaction (PCR) serves as a fundamental technique in molecular biology, enabling the exponential amplification of specific DNA sequences. The core of this method lies in thermal cycling, which facilitates the controlled replication of target DNA regions. While the conventional three-step PCR protocol delineates discrete stages for denaturation, annealing, and extension, the two-step approach combines the annealing and extension phases into a single step. This technical guide examines both cycling protocols within the broader context of PCR cycling step research, providing researchers and drug development professionals with evidence-based criteria for selecting the appropriate methodology for their specific applications. The choice between these protocols significantly impacts assay speed, specificity, and success, particularly when dealing with challenging templates or demanding throughput requirements [32] [53].
Table 1: Core Components of PCR Cycling Protocols
Table comparing the fundamental steps and parameters of two-step versus three-step PCR protocols.
| Parameter | Three-Step PCR | Two-Step PCR |
|---|---|---|
| Step Sequence | Denaturation → Annealing → Extension | Denaturation → Combined Annealing/Extension |
| Typical Denaturation Temperature | 95°C [54] | 95°C [32] |
| Typical Annealing Temperature | 45-60°C (5°C below primer Tm) [54] | Often set at 60°C [32] |
| Typical Extension Temperature | 72°C [54] | Same as annealing step (e.g., 60°C) |
| Optimal DNA Polymerase | Standard Taq polymerase | Highly processive enzymes [32] |
| Primary Applications | Standard amplification, complex templates | Fast PCR, simplified protocols |
| Key Advantages | Enhanced specificity for challenging primers; better for longer amplicons | Faster run times; simplified optimization |
Fundamental PCR Cycling Steps
The PCR process relies on repeated temperature cycles that facilitate the enzymatic replication of DNA. Understanding these core steps provides context for comparing two-step and three-step approaches.
Core Mechanism
The transformational power of PCR lies in its ability to exponentially amplify a single DNA molecule into millions of copies through repetitive temperature cycling. Without the thermal cycler instrument that automates this process, the enzymatic replication of DNA would remain a laborious manual procedure [53]. The core mechanism, whether executed in two or three steps, revolves around the principle of DNA denaturation and synthesis.
Denaturation: This initial high-temperature step (typically 95°C) involves the separation of double-stranded DNA templates into single strands by breaking the hydrogen bonds between complementary base pairs. The thermal cycler must achieve and maintain this elevated temperature quickly and uniformly across all reaction vessels, as insufficient temperature can lead to incomplete strand separation and poor amplification efficiency [53] [54].
Primer Annealing: Following denaturation, the temperature is rapidly decreased to allow short, single-stranded oligonucleotide primers to bind to their complementary sequences on the template DNA. The precision of thermal control during this step is paramount for assay specificity. Excessive temperature prevents primer binding and reduces yield, while insufficient temperature permits non-specific binding and amplification of unintended products [53].
Extension: In the final step, the temperature is raised to the optimal working temperature of the thermostable DNA polymerase (typically 72°C). The enzyme binds to the primer-template complex and synthesizes a new complementary DNA strand by adding nucleotides to the 3' end of the primer. The duration of this step is directly proportional to the length of the target DNA amplicon [53] [54].
These three steps constitute one complete cycle, with each cycle theoretically doubling the amount of target DNA, leading to exponential amplification [54]. The operational performance of a thermal cycler—encompassing temperature accuracy, uniformity, and ramp rate—directly influences the specificity, efficiency, and yield of the reaction [53].
Two-Step PCR Protocol
The two-step PCR protocol represents a streamlined approach that combines the annealing and extension phases of the traditional three-step method into a single temperature step.
Methodology and Workflow
In two-step PCR, the thermal cycling protocol consists of denaturation followed by a combined annealing/extension step. This consolidation is possible when the optimal annealing temperature of the primers and the optimal extension temperature for the DNA polymerase are within a few degrees of each other [32]. The typical workflow involves:
Initial Denaturation: A single prolonged heating step at 95°C for 2-5 minutes to ensure complete separation of double-stranded DNA templates [54].
Cycling Phase:
- Denaturation: Short bursts at 95°C for 15-30 seconds to denature the newly formed DNA strands.
- Combined Annealing/Extension: A single temperature step typically ranging from 60°C to 68°C for 30-60 seconds, during which both primer binding and DNA synthesis occur.
Final Extension: An optional single extended incubation at the combined temperature to ensure complete synthesis of all amplification products.
This protocol is particularly suitable for targets with higher GC content, as the increased temperature throughout the combined step helps prevent secondary structure formation that can impede amplification [32].
Experimental Considerations
Implementation of two-step PCR requires careful consideration of several experimental parameters:
Primer Design: Primers should be designed with melting temperatures (Tm) compatible with the enzyme's optimal extension temperature. Ideally, primer Tm values should be within 3-5°C of the desired combined annealing/extension temperature [32].
DNA Polymerase Selection: Highly processive DNA polymerases are essential for successful two-step PCR, as they can maintain high amplification efficiency despite the shortened incubation times and potentially suboptimal temperature compromise [32]. These enzymes are capable of incorporating a greater number of nucleotides during each binding event, making them ideal for fast cycling conditions.
Temperature Optimization: While many two-step protocols use a standardized temperature of 60°C for the combined step [32], optimization may be necessary for specific primer-template systems. Modern thermal cyclers with gradient functionality allow empirical determination of the optimal temperature across multiple samples simultaneously [53].
Cycle Timing: Extension times can typically be shortened to 1/2 to 1/3 of the duration required for Taq polymerase when using highly processive enzymes [32]. For targets shorter than 500 bp, significant reductions in extension time are possible without compromising product yield.
Two-Step PCR Workflow: This simplified protocol combines annealing and extension into a single temperature step.
Three-Step PCR Protocol
The three-step PCR protocol represents the conventional and most widely implemented approach, maintaining distinct temperature phases for each stage of the amplification process.
Methodology and Workflow
The three-step protocol maintains clear separation between each stage of the amplification process, providing finer control over reaction specificity. The standard workflow encompasses:
Initial Denaturation: A single extended heating at 95°C for 2-5 minutes (up to 10 minutes for complex templates) to ensure complete separation of all double-stranded DNA molecules [54].
Cycling Phase (repeated 25-35 times):
- Denaturation: Brief incubation at 95°C for 15-60 seconds to melt the newly synthesized DNA duplexes.
- Annealing: Temperature reduction to 45-60°C (approximately 5°C below the primer Tm) for 30-60 seconds to facilitate specific primer-template hybridization [54].
- Extension: Incubation at 72°C for 20-60 seconds (approximately 1 minute per kb of amplicon) to enable DNA synthesis by thermostable polymerase.
Final Extension: A single prolonged incubation at 72°C for 5-10 minutes to ensure complete extension of any partial amplification products.
This method is particularly advantageous when primers with significantly different melting temperatures must be used in the same reaction, or when amplifying longer fragments that require optimal enzyme activity during extension [32].
Experimental Considerations
Implementation of three-step PCR requires attention to several critical parameters:
Temperature Optimization: Each step requires precise temperature control. The annealing temperature is particularly critical and should be optimized based on the primer Tm, typically starting at 5°C below the calculated Tm [54]. Gradient thermal cyclers are invaluable for this optimization process [53].
Time Parameters: While standard protocols suggest 1 minute per kb for extension, shorter products (<500 bp) can be amplified with reduced extension times. Denaturation times can also be minimized, particularly when using highly thermostable polymerases [32].
Enzyme Selection: While Taq polymerase remains effective for many three-step applications, engineered enzymes with proofreading activity (3'→5' exonuclease) are preferable for applications requiring high fidelity, such as cloning or sequencing [1].
Specificity Enhancements: Additional strategies like "hot-start" PCR can be incorporated to enhance specificity by preventing polymerase activity during reaction setup, thereby reducing primer-dimer formation and non-specific amplification [32].
Three-Step PCR Workflow: This traditional protocol maintains distinct temperature phases for each amplification stage.
Comparative Analysis: Performance and Applications
Choosing between two-step and three-step PCR protocols requires careful consideration of their performance characteristics across different application scenarios.
Speed and Efficiency
The two-step protocol offers significant advantages in terms of processing time. By eliminating the temperature transition between annealing and extension, overall cycle time is reduced. When combined with highly processive DNA polymerases and fast-ramping thermal cyclers, two-step PCR can achieve dramatic time savings—up to 4x faster than conventional protocols according to some enzyme manufacturers [32]. This acceleration is particularly valuable in high-throughput screening environments and diagnostic applications where rapid results are essential.
Specificity and Yield
The three-step protocol generally provides superior specificity, particularly for complex templates or suboptimal primer pairs. The ability to independently optimize annealing and extension temperatures allows finer control over primer binding stringency. Research indicates that higher annealing temperatures help destabilize primer-dimers and nonspecific primer-template complexes, thus minimizing undesirable amplification [32]. This independent temperature control makes three-step PCR more suitable for multiplex applications where multiple primer pairs with varying Tm values must function in a single reaction.
Template Considerations
The nature of the DNA template significantly influences protocol selection:
GC-Rich Templates: Two-step PCR often performs better with GC-rich targets because the higher combined annealing/extension temperature helps denature secondary structures that can form in these sequences [32]. Additionally, the continuous elevated temperature prevents reformation of these structures during the amplification process.
Long Amplicons: Three-step PCR is generally preferred for amplifying longer fragments (>3 kb) because the dedicated extension at the polymerase's optimal temperature (72°C) ensures maximum processivity and fidelity during synthesis [32].
Complex Samples: For direct PCR from crude samples (without nucleic acid purification), the two-step protocol may be advantageous as it reduces opportunities for nonspecific amplification that can occur during temperature transitions [32].
Table 2: Protocol Selection Guide by Application
Table outlining recommended protocols based on specific research applications and template characteristics.
| Application/Parameter | Recommended Protocol | Rationale |
|---|---|---|
| Fast Screening | Two-Step | Reduced cycle time increases throughput [32] |
| High-Fidelity Applications | Three-Step | Optimal polymerase activity during separate extension [32] |
| GC-Rich Templates | Two-Step | Higher temperature prevents secondary structures [32] |
| Long Amplicons (>3 kb) | Three-Step | Dedicated extension at optimal polymerase temperature [32] |
| Multiplex PCR | Three-Step | Independent optimization of annealing for multiple primer sets [32] |
| Direct PCR (unpurified samples) | Two-Step | Reduced nonspecific amplification during transitions [32] |
| Primers with Different Tms | Three-Step | Fine control over annealing stringency [32] |
Advanced Technical Considerations
Data Analysis and Quantitation
For quantitative applications (qPCR), the cycling protocol can impact data analysis procedures. Accurate quantification requires proper baseline correction and threshold setting, regardless of the cycling method used [55]. The baseline should be established using early cycles (typically 5-15) to define background fluorescence, avoiding the initial cycles (1-5) that may contain reaction stabilization artifacts [55]. The threshold must be set within the exponential phase of amplification where all amplification curves are parallel, ensuring consistent ΔCq values between samples [55].
Troubleshooting Common Issues
Non-specific Amplification: In two-step PCR, this can often be addressed by increasing the combined annealing/extension temperature or switching to a hot-start polymerase. In three-step PCR, increasing the annealing temperature typically resolves this issue [32].
Low Yield: For two-step protocols, extending the combined step duration or optimizing primer design may help. For three-step protocols, ensuring the extension time is sufficient (approximately 1 minute/kb) is critical [54].
Primer-Dimer Formation: More common in two-step protocols with suboptimal temperature conditions. Increasing temperature or using hot-start enzymes can minimize this effect [32].
The Scientist's Toolkit: Essential Research Reagents
Table of key reagents and their functions in PCR protocol optimization.
| Reagent/Equipment | Function | Considerations for Protocol Selection |
|---|---|---|
| Highly Processive DNA Polymerase | Extends primers along template strands | Essential for two-step PCR; enables shorter extension times [32] |
| Hot-Start Polymerase | Prevents non-specific amplification during reaction setup | Beneficial for both protocols; enhances specificity [32] |
| dNTPs | Building blocks for DNA synthesis | Standard concentration 200 μM each; quality affects fidelity [54] |
| MgCl₂ | Cofactor for DNA polymerase activity | Concentration typically 1.5-5.5 mM; requires optimization [54] |
| Gradient Thermal Cycler | Enables temperature optimization across multiple samples | Critical for protocol development; ensures temperature accuracy [53] |
| GC Enhancers | Additives that facilitate denaturation of GC-rich templates | Particularly useful for two-step PCR of challenging templates [32] |
The selection between two-step and three-step PCR protocols represents a significant methodological decision that directly impacts experimental outcomes. The two-step approach offers advantages in speed, simplicity, and efficiency for straightforward applications and high-throughput workflows. Conversely, the three-step protocol provides superior specificity, flexibility for challenging primer sets, and better performance with complex templates. Researchers should base their selection on template characteristics, primer properties, throughput requirements, and available instrumentation. As PCR technologies continue to evolve, with innovations in enzyme engineering, instrumentation, and detection methodologies enhancing both approaches [56] [8], this fundamental understanding of cycling protocols remains essential for optimizing molecular diagnostics and research applications.
The Polymerase Chain Reaction (PCR) is a foundational technique that has revolutionized molecular biology since its introduction by Kary Mullis in 1985 [2]. This method enables the enzymatic amplification of specific DNA sequences from minute starting quantities, making it an indispensable tool across research and clinical settings. The core principle of PCR involves repeated thermal cycling of three key steps—denaturation, annealing, and extension—to exponentially replicate a target DNA region [2] [57]. This process relies on a thermostable DNA polymerase, with Taq polymerase from Thermus aquaticus being the most commonly used enzyme due to its stability at high temperatures [2].
The versatility of PCR stems from its ability to be adapted and integrated with numerous other technologies. Its exceptional sensitivity and specificity allow for the detection and analysis of genetic material even from single cells or degraded samples [57]. As a result, PCR has become the gold standard for a vast array of applications, from basic research to advanced diagnostics and therapeutic development [2] [58]. This technical guide explores the pivotal role of PCR in three critical fields: gene cloning, Next-Generation Sequencing (NGS), and diagnostic assays, providing detailed methodologies and current advancements for the scientific community.
Core PCR Principles and Cycling Parameters
The efficiency and success of any PCR-based application are dictated by the precise optimization of the reaction components and thermal cycling conditions. The fundamental process involves cycling a reaction mixture through three temperature stages to achieve exponential amplification of the target DNA [2] [25].
The Three Fundamental Steps
Denaturation: This first step involves heating the reaction mixture to a high temperature, typically between 94°C and 98°C, for 15-60 seconds. The heat disrupts the hydrogen bonds between complementary base pairs, separating the double-stranded DNA into single strands, which then serve as templates for the primers [25] [57]. An initial, longer denaturation step of 1-3 minutes is often used at the start of the reaction to ensure complete separation of complex DNA templates, such as genomic DNA [25].
Annealing: The reaction temperature is subsequently lowered to a range typically between 55°C and 72°C for 30 seconds to 2 minutes. This allows the forward and reverse primers to bind (anneal) to their complementary sequences on the single-stranded DNA templates [2] [25]. The optimal annealing temperature is primarily determined by the melting temperature (Tm) of the primers and is critical for specificity [25].
Extension: In the final step, the temperature is raised to the optimal range for the DNA polymerase, usually 70°C to 75°C, for 20 seconds to 2 minutes. The polymerase enzyme synthesizes a new DNA strand by adding nucleotides complementary to the template strand, starting from the 3' end of each primer [2] [57]. The duration of this step depends on the length of the DNA fragment being amplified and the synthesis speed of the polymerase [25].
These three steps constitute one cycle, which is typically repeated 25-40 times, leading to an exponential accumulation of the target DNA amplicon [25]. A final extension step is often added after the last cycle to ensure all amplicons are fully synthesized [25].
Critical Reaction Components
The quality and fidelity of PCR amplification are contingent on the careful preparation of the reaction mixture. Key components must be selected and optimized for the specific application.
Table 1: Essential Components of a PCR Reaction Mixture
| Component | Function | Typical Concentration/Range |
|---|---|---|
| Template DNA | The DNA sample containing the target sequence to be amplified. | 1–100 ng of genomic DNA; 1–10 ng of plasmid DNA [57] |
| DNA Polymerase | Thermally stable enzyme that synthesizes new DNA strands. | 0.5–2.5 units per 50 μL reaction [25] |
| Primers | Short, single-stranded DNA oligonucleotides that define the start and end of the target sequence. | 0.1–1.0 μM each [2] [57] |
| dNTPs | Deoxyribonucleotide triphosphates (dATP, dCTP, dGTP, dTTP); the building blocks for new DNA strands. | 200 μM each [57] |
| Reaction Buffer | Provides optimal pH and salt conditions (including Mg²⁺) for polymerase activity. | 1X concentration [25] |
| MgCl₂ | Essential cofactor for DNA polymerase activity. | 1.5–5.5 mM (requires optimization) [57] |
Optimization of Cycling Parameters
Achieving high specificity and yield often requires fine-tuning the cycling parameters. The annealing temperature is one of the most critical variables; it can be estimated using the formula Tm = 4(G + C) + 2(A + T) and is often set 3–5°C below the calculated Tm of the primers [25]. The use of a thermal cycler with a gradient function is highly recommended for empirical optimization [25]. Furthermore, the number of cycles should be determined based on the starting template quantity, with 25–35 cycles being standard. Exceeding 45 cycles is not advised as it can lead to high background and nonspecific amplification [25].
The following diagram illustrates the workflow and output of a standard PCR process:
PCR in Gene Cloning
PCR cloning is a rapid method for inserting a DNA fragment of interest into a cloning vector without the mandatory use of restriction enzymes [59]. It is particularly valuable for cloning fragments that are not available in large amounts and for high-throughput projects [60] [59].
Key Methodologies and Workflows
Two primary strategies are employed in PCR cloning:
TA Cloning: This method leverages the terminal transferase activity of Taq DNA polymerase, which non-templatedly adds a single adenine (A) residue to the 3' end of PCR products [59]. The "A-tailed" PCR fragment is then ligated into a specialized "T-tailed" vector that has a complementary thymine (T) overhang, using T4 DNA ligase [59].
Blunt-End Cloning: When using high-fidelity DNA polymerases (often derived from Archaea), the resulting PCR product has no 3' extensions—it is "blunt-ended" [59]. These fragments can be ligated directly into a blunt-ended vector. Alternatively, "activated" vectors containing covalently attached enzymes like Topoisomerase I can facilitate joining [59].
A third, widely used approach involves designing gene-specific primers with additional 5' sequences, a method that overlaps with cloning for mutagenesis. These add-on sequences can be restriction sites for traditional digestion/ligation cloning, or vector-compatible sequences for more advanced ligation-independent or recombination-based cloning (e.g., Gibson Assembly) [60].
Detailed Experimental Protocol: TA Cloning
This protocol outlines the steps for cloning a standard PCR amplicon using a TA vector system.
Amplify Insert: Perform PCR using Taq DNA polymerase or a similar enzyme that adds a single 3'-A overhang.
- Use standard cycling conditions appropriate for the primer-template system.
- Critical Note: If a proofreading polymerase is used, an extra step of A-tailing must be performed before ligation.
Purify PCR Product: Run the PCR reaction on an agarose gel and excise the band of the correct size. Purify the DNA from the gel slice using a gel extraction kit to remove primers, enzymes, and non-specific products.
Prepare Ligation Reaction:
- Combine the following in a microcentrifuge tube:
- 50-100 ng of TA vector
- Molar ratio of insert:vector (a 3:1 ratio is a common starting point)
- 1μL of T4 DNA Ligase 10X Buffer
- 1μL of T4 DNA Ligase
- Nuclease-free water to 10μL.
- Incubate the reaction at room temperature for 1 hour or 16°C overnight.
- Combine the following in a microcentrifuge tube:
Transform Competent Cells:
- Thaw chemically competent E. coli cells on ice.
- Add 2-5μL of the ligation reaction to 50μL of competent cells and mix gently. Incubate on ice for 30 minutes.
- Heat-shock the cells at 42°C for exactly 30 seconds, then immediately return to ice for 2 minutes.
- Add 250μL of LB or SOC medium and incubate at 37°C for 1 hour with shaking.
Screen for Recombinants:
- Plate the transformation culture on LB agar plates containing the appropriate antibiotic (e.g., ampicillin).
- Colonies can be screened by PCR using vector-specific primers that flank the insertion site or by colony PCR. The presence of an insert and its correct orientation can be determined by the size of the PCR product or subsequent restriction analysis [60].
The Scientist's Toolkit: PCR Cloning Reagents
Table 2: Essential Reagents for PCR Cloning
| Reagent/Solution | Function | Key Considerations |
|---|---|---|
| High-Fidelity or Taq DNA Polymerase | Amplifies the insert with minimal errors or adds A-overhangs. | Choice depends on cloning strategy (blunt-end vs. TA) [59]. |
| TA or Blunt-End Cloning Vector | Linearized plasmid for inserting the PCR fragment. | Often contain toxic "suicide genes" for positive selection of recombinants [59]. |
| T4 DNA Ligase | Joins the insert and vector by forming phosphodiester bonds. | Essential for TA and blunt-end cloning [59]. |
| Chemically Competent E. coli | Host cells for plasmid propagation after ligation. | Transformation efficiency is critical for success with low-yield ligations. |
| Agarose Gel Electrophoresis System | Separates and purifies the correct PCR product from the reaction. | Ensures a clean insert for ligation, improving efficiency. |
| Selection Antibiotics | Selects for bacterial cells that have taken up the plasmid. | Must match the resistance marker on the vector. |
PCR in Next-Generation Sequencing (NGS)
In the realm of Next-Generation Sequencing (NGS), PCR is indispensable for constructing sequencing libraries, despite the availability of PCR-free protocols for applications like whole-genome sequencing [61] [62]. The majority of NGS sample preparation strategies involve at least one PCR step to amplify and tag the genetic material, making it compatible with the sequencing platform [61].
Role of PCR in NGS Workflow
PCR is utilized at several critical junctures in the NGS pipeline:
Library Amplification: This is the primary application. After fragmenting the DNA and ligating platform-specific adapters, PCR is used to amplify the entire library. This enriches for fragments that have successfully ligated adapters on both ends and generates sufficient quantity for sequencing [61] [60]. This step is crucial when working with low-input samples, such as in single-cell RNA sequencing or forensic applications [61].
Target Enrichment (Amplicon Sequencing): For targeted sequencing, PCR is used to amplify specific genomic regions of interest. In amplicon sequencing, multiplexed primers are designed to generate a library of overlapping PCR products that cover the target loci, which are then sequenced [61]. This approach is widely used in cancer research for somatic mutation detection and in metagenomics for 16S rRNA sequencing [61].
Quality Control and Quantification: Quantitative PCR (qPCR) is a standard method for accurately quantifying the concentration of the final NGS library before loading it onto the sequencer, ensuring optimal cluster density and data quality [61].
Detailed Experimental Protocol: NGS Library Amplification
This protocol describes the PCR amplification of an adapter-ligated NGS library.
Prepare PCR Reaction:
- Combine the following components on ice:
- 25μL of 2X High-Fidelity PCR Master Mix
- 5μL of Illumina P5 and P7 primer mix (or platform-specific primers)
- 10μL of the purified, adapter-ligated DNA library
- Nuclease-free water to 50μL.
- Critical Note: Use a high-fidelity DNA polymerase to minimize the introduction of errors that could be misinterpreted as genetic variants [61].
- Combine the following components on ice:
Perform Thermal Cycling:
- Use the following cycling conditions, optimized for the polymerase:
- Initial Denaturation: 98°C for 2 minutes
- Cycle 10-15 times (avoid over-cycling to prevent bias and duplication):
- Denaturation: 98°C for 20 seconds
- Annealing: 60°C for 30 seconds
- Extension: 72°C for 1 minute
- Final Extension: 72°C for 5 minutes
- Hold: 4°C
- Use the following cycling conditions, optimized for the polymerase:
Purify Amplified Library:
- Clean up the PCR reaction using SPRI (solid-phase reversible immobilization) beads to remove excess primers, enzymes, and salts. This is a standard purification method in NGS workflows.
- Elute the purified library in a low-EDTA TE buffer or nuclease-free water.
Validate and Quantify Library:
- Assess the library's size distribution and quality using a Bioanalyzer or TapeStation.
- Precisely quantify the library using qPCR with standards specific to the sequencing platform to ensure accurate molarity for clustering.
The workflow for NGS library preparation, where PCR plays a central role, is summarized below:
Technical Considerations for NGS PCR
The requirements for PCR in NGS are stringent. Low amplification bias is essential to ensure that the final library accurately represents the original population of DNA fragments, preventing the over-representation of some sequences and the loss of others [61]. Furthermore, high fidelity is non-negotiable, as polymerase errors during amplification can lead to false-positive variant calls [61]. Finally, high efficiency is needed to generate robust libraries from limited and potentially degraded samples, which is common in clinical and forensic contexts [61].
PCR in Diagnostic Assays
PCR has become a cornerstone of molecular diagnostics, offering unparalleled sensitivity and specificity for detecting pathogens, genetic mutations, and biomarkers [2] [58]. Its role was globally highlighted during the COVID-19 pandemic, where reverse transcription PCR (RT-PCR) served as the primary diagnostic method for detecting SARS-CoV-2 RNA [2].
Key Diagnostic Modalities
Several advanced PCR formats have been developed to meet the demands of clinical diagnostics:
Quantitative PCR (qPCR) / Real-Time PCR: This method allows for the monitoring of DNA amplification in real-time using fluorescent dyes or probes [2]. It provides both qualitative detection and quantitative measurement of the target's initial concentration, which is vital for assessing viral load or gene expression levels [2]. The quantification cycle (Cq) is the key metric for this analysis [2].
Digital PCR (dPCR): As the third generation of PCR technology, dPCR involves partitioning a PCR reaction into thousands of nanoreactors (droplets or microchambers) and performing amplification on each partition individually [63]. An end-point fluorescence measurement is taken, and the fraction of positive partitions is used to calculate the absolute concentration of the target nucleic acid using Poisson statistics, without the need for a standard curve [63]. This makes dPCR exceptionally powerful for detecting rare genetic mutations (e.g., in liquid biopsies for oncology) and for achieving absolute quantification with high precision [63].
Immuno-PCR (I-PCR): This hybrid technique combines the specificity of an immunoassay with the exponential amplification power of PCR [64]. It uses a DNA molecule linked to an detection antibody as a reporter, which is then amplified by PCR to detect antigens or antibodies with a sensitivity that can be 100,000 times greater than that of a traditional ELISA [64]. While highly sensitive, its clinical adoption has been limited by assay complexity [64].
Multiplex PCR and Syndromic Testing: A significant advancement in diagnostics is the ability to test for multiple pathogens in a single reaction. Syndromic testing panels can simultaneously detect dozens of viruses, bacteria, or parasites that cause similar symptoms (e.g., respiratory or gastrointestinal infections), enabling rapid differential diagnosis and improving patient management [58].
Detailed Experimental Protocol: SARS-CoV-2 Detection by RT-qPCR
This protocol exemplifies a standard diagnostic workflow for viral RNA detection.
Sample Collection and RNA Extraction:
- Collect a nasopharyngeal or oropharyngeal swab from the patient and place it in viral transport media [2].
- Extract viral RNA from the specimen using a commercial automated or manual nucleic acid extraction kit. Elute the RNA in nuclease-free water.
Reverse Transcription and qPCR Setup:
- Use a one-step or two-step RT-qPCR kit. For a one-step reaction, combine:
- 5μL of extracted RNA
- 10μL of 2X RT-qPCR Master Mix
- 1μL of SARS-CoV-2 specific primer/probe mix (targeting, for example, the N and E genes)
- Nuclease-free water to 20μL.
- Critical Note: Include positive controls (synthetic RNA) and negative controls (nuclease-free water) in each run.
- Use a one-step or two-step RT-qPCR kit. For a one-step reaction, combine:
Run Thermal Cycling and Analyze Data:
- Load the plate into a real-time PCR instrument and run the following program:
- Reverse Transcription: 50°C for 15 minutes (if one-step)
- Initial Denaturation/Enzyme Activation: 95°C for 2 minutes
- Cycle 45 times:
- Denaturation: 95°C for 15 seconds
- Annealing/Extension: 60°C for 1 minute (with fluorescence acquisition)
- After the run, set the fluorescence threshold and determine the Cq value for each sample. A sample is generally considered positive if the Cq value is below a validated cut-off.
- Load the plate into a real-time PCR instrument and run the following program:
The Scientist's Toolkit: Diagnostic PCR Reagents
Table 3: Key Reagents for PCR-Based Diagnostics
| Reagent/Solution | Function | Key Considerations |
|---|---|---|
| TaqMan Probes / Molecular Beacons | Sequence-specific fluorescent probes for real-time detection in qPCR. | Provide high specificity and are essential for multiplexing [2]. |
| Reverse Transcriptase | Enzyme that synthesizes cDNA from an RNA template. | Critical for detecting RNA viruses (RT-PCR) [2]. |
| dPCR Partitioning Oil & Chips | Creates thousands of nanoreactions for absolute quantification. | The core consumable for digital PCR systems [63]. |
| Biotin-Streptavidin System | Links antibodies to DNA reporter molecules in Immuno-PCR. | A universal conjugation system that improves assay flexibility [64]. |
| Multiplex PCR Master Mix | Optimized buffer and enzyme for amplifying multiple targets. | Must prevent primer-dimer formation and ensure balanced amplification [58]. |
Emerging Trends and Future Directions
The evolution of PCR technology continues, driven by interdisciplinary innovations. Key trends shaping its future include:
Advanced Multiplexing and Automation: The development of highly multiplexed PCR tests for syndromic panels is expected to become more sophisticated and widespread [58]. Coupled with full automation, this will make comprehensive testing more cost-effective and accessible, potentially moving from central laboratories to hospital wards, clinics, and even for home use [58].
Liquid Biopsy and Circulating Tumor DNA (ctDNA) Detection: The use of ultra-sensitive PCR and dPCR for detecting ctDNA in blood samples is poised to revolutionize oncology [63] [58]. This non-invasive "liquid biopsy" approach shows immense promise for early cancer detection, monitoring treatment response, and detecting minimal residual disease, potentially leading to a significant reduction in unnecessary chemotherapy treatments [58].
Point-of-Care and Portable Devices: The miniaturization of PCR instrumentation is a major focus. Future developments may lead to portable, even wearable, PCR devices that enable continuous health monitoring and rapid diagnosis in field settings [58].
Integration with Artificial Intelligence (AI): AI is being leveraged to streamline the design of multiplex PCR assays and to analyze the vast amounts of diagnostic data generated. This integration enhances global disease surveillance and improves the prediction and prevention of future outbreaks [58].
From its inception as a revolutionary method for amplifying DNA, PCR has matured into an indispensable engine driving progress in gene cloning, next-generation sequencing, and clinical diagnostics. The precise control over the core cycling steps—denaturation, annealing, and extension—provides a flexible and powerful framework that can be tailored to an ever-expanding range of applications. As the technology continues to advance through improvements in multiplexing, sensitivity, miniaturization, and data analysis, its role in research and medicine is set to grow even further. PCR will undoubtedly remain at the forefront of scientific discovery, enabling deeper insights into genetics and disease, and paving the way for more personalized and effective healthcare.
Proven Strategies for PCR Troubleshooting and Optimization
The polymerase chain reaction (PCR) is a foundational technique in molecular biology, enabling the amplification of specific DNA sequences from minimal template material. Despite its widespread use, the technique is prone to specific amplification issues that can compromise experimental results. This guide provides an in-depth analysis of three common PCR challenges—no product, low yield, and non-specific bands—framed within the critical context of the three PCR cycling steps: denaturation, annealing, and extension. A thorough understanding of how reaction components interact with these thermal cycling parameters is essential for effective troubleshooting and achieving robust, reliable amplification [4] [65] [66]. The following sections will dissect the causes and present systematic solutions for these prevalent problems.
The Foundation: The PCR Cycle and Its Steps
A standard PCR cycle consists of three fundamental steps, each with a distinct purpose and specific temperature requirements. The precise execution of these steps is crucial for successful DNA amplification.
Denaturation
This initial step involves heating the reaction mixture to a high temperature (typically 94–98°C) for 20 seconds to 3 minutes. The heat disrupts the hydrogen bonds between complementary bases, separating the double-stranded DNA template into two single strands. This provides the necessary single-stranded templates for primer binding. Incomplete denaturation, especially of GC-rich templates, is a common source of amplification failure [4] [65].
Annealing
Following denaturation, the temperature is lowered to typically between 45°C and 65°C for 20–60 seconds. This allows the forward and reverse primers to bind (anneal) to their complementary sequences on the single-stranded DNA template. The annealing temperature is one of the most critical parameters for reaction specificity; a temperature that is too low can lead to non-specific binding and spurious amplification, while a temperature that is too high may prevent primers from binding at all, resulting in no product [4] [66].
Extension
In the final step, the temperature is raised to the optimal working temperature for the DNA polymerase (usually 68–72°C for 30–60 seconds per kilobase of product). During this phase, the thermostable DNA polymerase synthesizes a new DNA strand by adding nucleotides to the 3' end of the annealed primer, creating a complementary copy of the DNA template. Insufficient extension time can lead to truncated products or low yield [4] [65].
These three steps are repeated 25–40 times in a thermal cycler, leading to the exponential amplification of the target DNA sequence [66].
The diagram below illustrates the logical workflow for diagnosing the most common PCR issues, linking observed symptoms to their potential causes within the reaction setup and cycling parameters.
Issue 1: No Amplification or Low Yield
The complete absence of a PCR product or a yield that is significantly lower than expected is a frequent challenge. This issue typically stems from failures in one or more of the core PCR steps or reaction components.
Primary Causes and Experimental Solutions
Suboptimal Annealing Temperature: If the annealing temperature is too high, primers cannot bind to the template. Conversely, a temperature that is too low can cause non-productive binding.
- Solution: Calculate the melting temperature (Tm) of both primers. The simplest formula is Tm = 4(G + C) + 2(A + T). Start with an annealing temperature 3–5°C below the lowest Tm of the primer pair [4]. Use a thermal cycler with a gradient function to empirically determine the optimal annealing temperature across a range (e.g., 50–65°C) in a single experiment [4] [67].
Poor Template DNA Quality or Quantity: The template may be degraded, contain PCR inhibitors (e.g., phenol, EDTA, heparin), or be present at an insufficient concentration [68] [67].
- Solution: Analyze template DNA integrity by agarose gel electrophoresis. A tight, high-molecular-weight band indicates good quality, whereas a smear suggests degradation. Quantify DNA using spectrophotometry (A260/A280 ratio of ~1.8 indicates pure DNA) or fluorometry. For genomic DNA, use 1 ng–1 µg per 50 µL reaction; for plasmid DNA, 1 pg–10 ng is typically sufficient [68] [67]. If inhibitors are suspected, further purify the template by ethanol precipitation or use a commercial cleanup kit [68].
Insufficient Reaction Components: Critical reagents may be missing, degraded, or present at incorrect concentrations.
- Solution: Prepare a fresh master mix, ensuring all components are properly thawed and mixed. Verify the concentration of Mg2+, a critical cofactor for DNA polymerase. The typical final concentration is 1.5 mM, but optimization from 0.5–5.0 mM in 0.2–1 mM increments may be necessary [68] [24]. Ensure dNTPs are not degraded and are at an equimolar concentration of 200 µM each [68] [24].
Inadequate Denaturation or Extension: Complex templates (e.g., GC-rich regions) may require higher denaturation temperatures or longer times. Long amplicons need longer extension times.
- Solution: For GC-rich templates (>65%), increase the denaturation temperature to 98°C or include additives like betaine, DMSO (1-10%), or formamide (1.25-10%) in the reaction to facilitate strand separation [4] [67] [24]. For long amplicons, adjust the extension time according to the polymerase's synthesis rate; 1 minute/kb for Taq polymerase and 2 minutes/kb for proofreading enzymes like Pfu [4].
The table below summarizes the quantitative parameters for troubleshooting no product and low yield issues.
Table 1: Troubleshooting No Product and Low Yield
| Problem Cause | Specific Parameter | Recommended Range/Adjustment |
|---|---|---|
| Annealing Temperature | Temperature | Start at 3–5°C below primer Tm; optimize using a gradient [4] |
| Primer Concentration | Molarity in reaction | 0.1–1.0 µM (typically 0.2 µM each primer) [67] |
| Mg2+ Concentration | mM in reaction | 1.5 mM is standard; optimize from 0.5–5.0 mM [68] [24] |
| dNTP Concentration | µM of each dNTP | 200 µM of each dNTP (dATP, dCTP, dGTP, dTTP) [24] |
| Cycle Number | Number of cycles | 25–35 cycles standard; up to 40 for low-copy templates [4] |
| Extension Time | Time per kb of product | 1 min/kb for Taq; 2 min/kb for Pfu [4] |
Issue 2: Non-Specific Amplification
The appearance of multiple bands, smears, or bands of incorrect size on an electrophoresis gel indicates that primers are binding to non-target sequences, a problem intimately linked to the stringency of the annealing step.
Primary Causes and Experimental Solutions
Annealing Temperature is Too Low: This is the most common cause of non-specific amplification, as it allows primers to bind to sequences with partial complementarity.
- Solution: Increase the annealing temperature in increments of 2–3°C [4]. Perform a gradient PCR to find the highest temperature that still yields the specific product. If non-specific products persist, consider Touchdown PCR, a method that starts with a higher, more stringent annealing temperature and gradually decreases it in subsequent cycles [67].
Primer Design Flaws: Primers with self-complementarity (leading to hairpin loops) or complementarity to each other (leading to primer-dimers) can cause artefacts. Primers with low specificity for the target sequence will also bind off-target.
- Solution: Redesign primers using software tools (e.g., NCBI Primer-BLAST). Ensure primers are 18–25 nucleotides long, have a GC content of 40–60%, and lack runs of single bases or self-complementary regions, especially at the 3' ends. The Tm for both primers should be within 5°C of each other [24].
Excessive Enzyme or Primer Concentration: High concentrations can promote mispriming and the formation of primer-dimers.
Premature Polymerase Activity: Some DNA polymerases have residual activity at room temperature, which can lead to non-specific priming during reaction setup.
Too Many Cycles: Excessive cycling (beyond ~35-40 cycles) can lead to the accumulation of non-specific products that become visible after the target amplicon has plateaued.
Table 2: Troubleshooting Non-Specific Bands and Smears
| Problem Cause | Specific Parameter | Recommended Range/Adjustment |
|---|---|---|
| Low Annealing Temp | Temperature | Increase by 2–3°C increments; use gradient [4] |
| Excess Mg2+ | mM in reaction | Decrease by 0.2–1.0 mM increments from standard 1.5 mM [68] |
| Excess Primers | µM in reaction | Titrate down from 1.0 µM to 0.1 µM [68] [67] |
| Excess Polymerase | Units per reaction | Use manufacturer's recommended amount; do not exceed [67] |
| High Cycle Number | Number of cycles | Reduce to 25–35 cycles [4] [68] |
| Long Annealing Time | Seconds per cycle | Shorten to 20–30 seconds to minimize off-target binding [67] |
The Scientist's Toolkit: Essential Reagents and Solutions
A successful PCR experiment relies on a suite of carefully selected and quality-controlled reagents. The table below details key research reagent solutions and their critical functions in the amplification process.
Table 3: Key Research Reagent Solutions
| Reagent | Function/Purpose | Key Considerations |
|---|---|---|
| Hot-Start DNA Polymerase | Enzyme engineered to be inactive at room temperature, preventing non-specific amplification during reaction setup. Activated by high initial denaturation temperature [69] [67]. | Critical for improving specificity and yield. Available in antibody-based and chemically modified formats. |
| PCR Buffer with Mg2+ | Provides optimal salt and pH conditions (typically pH 8.0-9.5) for polymerase activity. Often includes a pre-optimized concentration of MgCl₂ [24] [66]. | If Mg2+ is separate, it must be titrated. Some buffers are formulated for universal annealing temperatures. |
| dNTP Mix | The building blocks (dATP, dCTP, dGTP, dTTP) for synthesizing new DNA strands [66]. | Must be equimolar and free of nucleases. Unbalanced concentrations increase error rate [67]. |
| PCR-Grade Water | Solvent for the reaction, certified to be free of nucleases, DNA/RNA contaminants, and PCR inhibitors. | Essential for preventing false negatives or degraded products. Do not substitute with DNase/RNase-free water that may contain ions. |
| PCR Enhancers/Additives | Chemicals like betaine, DMSO, and BSA that help amplify difficult templates (e.g., GC-rich, high secondary structure) [67] [24]. | DMSO and formamide lower the DNA melting temperature; adjust annealing temperature accordingly [4]. |
| Template DNA Purification Kit | For isolating high-quality, inhibitor-free DNA from various sample types (tissue, blood, cells). | Kits based on silica columns are standard. Essential for removing contaminants like heparin, hemoglobin, or ionic detergents [2] [67]. |
Advanced Optimization and Systematic Workflow
For persistent problems, a structured approach that integrates multiple factors is required. The following workflow diagram outlines a systematic protocol for diagnosing and resolving complex PCR failures, from initial assessment to advanced solutions.
- Implement Rigorous Controls: Always include a positive control (with a known working template and primer set) and a negative control (no template DNA) in every experiment. The positive control verifies that all reaction components are functional, while the negative control detects contamination [70] [24].
- Verify Template DNA Integrity and Purity: Re-analyze template DNA by gel electrophoresis to confirm it is intact and of high molecular weight. Check the A260/A280 ratio (ideally ~1.8) and A260/A230 ratio (ideally >2.0) to detect contaminants like phenol, proteins, or salts [67].
- Perform Gradient PCR for Annealing Optimization: Set up a single reaction master mix and aliquot it into several tubes. Use the thermal cycler's gradient function to test a range of annealing temperatures (e.g., 5°C above and below the calculated Tm) in a single run. Analyze the products by gel electrophoresis to identify the temperature that gives the strongest specific band with the least background [4] [68].
- Titrate Critical Reagents: Set up a series of reactions where the concentration of a single component (e.g., Mg2+, primers, or dNTPs) is varied while keeping all others constant. This systematic approach identifies the optimal concentration for a specific primer-template combination [68] [24].
- Employ Additives for Challenging Templates: For GC-rich sequences or templates with complex secondary structures, include additives in the master mix. Betaine (0.5 M to 2.5 M) can help equalize the stability of GC and AT base pairs, while DMSO (1-10%) helps disrupt secondary structures. Note that these additives often require a lowering of the annealing temperature [67] [24].
Diagnosing and resolving common PCR amplification issues requires a methodical approach grounded in a deep understanding of the three core cycling steps—denaturation, annealing, and extension. Problems of no product, low yield, and non-specific bands are most frequently addressed by optimizing the annealing temperature, ensuring primer specificity, using hot-start enzymes, and verifying template quality. By systematically applying the troubleshooting strategies, quantitative adjustments, and experimental protocols outlined in this guide, researchers and drug development professionals can significantly enhance the robustness, specificity, and success rate of their PCR assays, thereby ensuring the reliability of their downstream molecular analyses.
Polymersse Chain Reaction (PCR) serves as a fundamental cornerstone in modern molecular biology, enabling precise detection and analysis of amplified DNA across research, diagnostic, and therapeutic applications [2]. At the core of every successful PCR assay lies meticulous primer design—a critical process that determines the specificity, sensitivity, and efficiency of nucleic acid amplification. Within the broader context of understanding PCR cycling steps (denaturation, annealing, extension), primer optimization emerges as the most significant variable influencing experimental outcomes [71]. For researchers and drug development professionals, mastering primer design principles is not merely advantageous but essential for generating reliable, reproducible data that can withstand scientific scrutiny. This technical guide provides a comprehensive framework for primer design optimization, integrating established principles with advanced computational and experimental validation methodologies to ensure robust PCR performance across diverse applications.
Core Principles of Primer Design
Effective primer design balances multiple thermodynamic and sequence-based parameters to achieve optimal binding specificity and amplification efficiency. The following principles represent the foundation upon which all successful PCR assays are built.
Fundamental Physical and Chemical Parameters
Primer length, melting temperature, and GC content constitute the primary determinants of primer behavior during thermal cycling. Adherence to empirically validated ranges for these parameters significantly enhances the probability of successful amplification.
Table 1: Fundamental Primer Design Parameters and Optimal Ranges
| Parameter | Optimal Range | Technical Rationale | Special Considerations |
|---|---|---|---|
| Length | 18-30 nucleotides [72] [73] [74] | Balances specificity with efficient annealing; shorter primers bind more efficiently but may lack specificity [72] [73]. | Complex templates (e.g., genomic DNA) often require longer primers (~24-30 nt) for sufficient specificity [74]. |
| Melting Temperature (Tm) | 65-75°C ideal [72]; 54°C minimum [73] | Determines annealing temperature (Ta); critical for specific binding. | Primer pairs should have Tm values within 5°C of each other [72] [74]. |
| GC Content | 40-60% [72] [73] [74] | Ensures balanced binding strength; GC bonds (3 H-bonds) are stronger than AT bonds (2 H-bonds) [73]. | Sequences with GC content >60% risk secondary structure formation and non-specific binding [73] [74]. |
| GC Clamp | G or C at 3' end [72] | Promotes stronger binding due to stronger hydrogen bonding at the critical priming site. | Avoid more than 3 consecutive G or C bases at the 3' end to prevent non-specific binding [72] [73]. |
Avoiding Common Structural Pitfalls
Secondary structures and complementary sequences represent the most common sources of PCR failure beyond improper thermodynamic parameters.
- Primer-Dimer Formation: Caused by inter-primer homology (complementarity between forward and reverse primers) or intra-primer homology (self-complementarity) [72] [73]. These dimers compete for reagents and can become the predominant amplification product, particularly in qPCR applications where they falsely elevate background fluorescence [71].
- Hairpin Structures: Intramolecular interactions within a primer can create stable secondary structures that inhibit proper template binding [73] [74]. These structures are particularly problematic when they involve the 3' end, where extension initiates.
- Repetitive Sequences: Runs of four or more identical bases (e.g., AAAA) or dinucleotide repeats (e.g., ATATAT) can promote mispriming and synthetic difficulties, and should be avoided [72].
Computational Design and In Silico Validation
Modern primer design leverages sophisticated computational tools to navigate the complexity of genomic sequences and automate the optimization process, particularly for large-scale experiments.
Integrated Primer Design Workflows
Advanced computational pipelines now combine primer design with specificity analysis to create robust workflows suitable for scaling across multiple target sites. The CREPE (CREate Primers and Evaluate) pipeline exemplifies this approach by fusing the capabilities of Primer3 with In-Silico PCR (ISPCR) [75]. This integrated system designs primer pairs and subsequently evaluates their likelihood of binding to off-target sites across the genome, providing a specificity score that informs primer selection [75].
Diagram: Workflow for Computational Primer Design and Validation
Specificity Analysis and Off-target Evaluation
Primer specificity must be confirmed through comprehensive in silico analysis before experimental validation. Tools such as Primer-BLAST and ISPCR identify potential off-target binding sites by searching for complementary sequences across relevant genomes [75] [71]. The CREPE evaluation script further refines this analysis by categorizing off-target amplicons as high-quality (concerning) or low-quality (non-concerning) based on their normalized percent match (80-100% match considered concerning) to the intended target [75]. This computational triage enables researchers to prioritize primer pairs with minimal risk of amplifying unintended sequences, thereby increasing experimental efficiency and reliability.
Experimental Optimization and Validation
Computational design provides an essential foundation, but empirical validation remains indispensable for confirming primer performance under actual reaction conditions.
Establishing Robust Cycling Parameters
PCR cycling parameters must be optimized to complement the thermodynamic properties of designed primers. The three fundamental cycling steps—denaturation, annealing, and extension—each require specific considerations.
Table 2: PCR Cycling Parameters for Optimal Primer Performance
| Cycling Step | Temperature Range | Duration | Optimization Considerations |
|---|---|---|---|
| Initial Denaturation | 94-98°C [25] | 1-3 minutes [25] | Critical for complex/GC-rich templates; required for hot-start polymerase activation [25]. |
| Denaturation | 94-98°C [25] | 15-60 seconds [25] | GC-rich targets may require higher temperatures or longer durations [25]. |
| Annealing | Ta = Tm - (3-5°C) [25] | 15-60 seconds [25] [76] | Must be determined empirically; use gradient PCR; increase if non-specific products form [25] [71]. |
| Extension | 70-75°C (enzyme-dependent) [25] | 1-2 min/kb (enzyme-dependent) [25] | "Fast" enzymes require less time than "slow" enzymes (e.g., Taq vs. Pfu) [25]. |
| Cycle Number | 25-40 cycles [25] | - | >45 cycles increases nonspecific products; <25 cycles may yield insufficient product [25]. |
| Final Extension | 72°C [25] | 5-15 minutes [25] | Ensures complete synthesis; critical for 3'-dA tailing for TA cloning [25]. |
Stepwise qPCR Assay Validation
For quantitative applications, primer validation requires rigorous assessment of amplification efficiency and specificity through a systematic protocol.
- Annealing Temperature Optimization: Initially set the annealing temperature 3-5°C below the calculated Tm of the primers, then test a temperature gradient (e.g., 55-72°C) [25] [77]. Select the highest temperature that provides robust, specific amplification [25].
- Efficiency Determination: Prepare a standard curve using serial dilutions (typically 1:10) of template cDNA or DNA [77]. Amplify each dilution in triplicate and plot the quantification cycle (Cq) values against the logarithm of the template concentration. Calculate efficiency using the formula: ( E = (10^{-1/slope} - 1) \times 100\% ) [2]. Optimal primers demonstrate efficiency between 95-105% (R² ≥ 0.99) [77].
- Specificity Verification: Analyze amplification products using melt curve analysis (for SYBR Green-based assays) or gel electrophoresis to confirm a single product of expected size without primer-dimer formation [71] [77].
- Robustness Testing: Evaluate primer performance across different reagent lots, template concentrations, and thermal cyclers to ensure consistent results under varying laboratory conditions [71].
Advanced Applications and Special Considerations
Primer Design for Challenging Templates
Certain template characteristics demand specialized design strategies to overcome inherent amplification challenges.
- GC-Rich Templates (>65% GC content): Distribute GC residues evenly throughout the primer; avoid consecutive G/C runs, particularly at the 3' end [74]. Consider using PCR additives such as DMSO, betaine, or glycerol (typically 5-10%) to reduce secondary structure formation and lower melting temperatures [25].
- qPCR Probes: When designing dual-labeled hydrolysis probes, maintain a length of 15-30 nucleotides with a Tm approximately 5-10°C higher than the primers [73]. Avoid guanine (G) at the 5' end as it can quench fluorophore fluorescence [73].
- Pan-Specific Primers for Viral Detection: For pathogens with high sequence diversity (e.g., poliovirus with ~70% identity across serotypes), design primers from conserved regions identified through multiple sequence alignment of representative isolates [78]. Tools such as varVAMP can automate the identification of these conserved regions suitable for pan-specific recognition [78].
The Scientist's Toolkit: Essential Research Reagents
Table 3: Essential Reagents for Primer-Dependent Applications
| Reagent | Function | Technical Considerations |
|---|---|---|
| Thermostable DNA Polymerase | Catalyzes DNA synthesis during extension step [2]. | Choice affects fidelity (Taq vs. high-fidelity), speed ("fast" enzymes), and specificity (hot-start versions) [25]. |
| dNTPs | Building blocks for DNA synthesis [2]. | Quality and concentration critical for efficient extension; typical concentration 200μM each dNTP. |
| PCR Buffer | Provides optimal chemical environment [25]. | Salt concentration (especially [Mg²⁺] and [K⁺]) significantly affects Tm and primer specificity [25] [71]. |
| Template DNA/RNA | Target nucleic acid for amplification. | Quality and quantity must be consistent; 1-100 ng typically sufficient for genomic DNA [2]. |
| Nuclease-Free Water | Solvent for reaction components. | Must be pure and free of nucleases to prevent primer and template degradation. |
| PCR Additives | Enhance amplification of difficult templates [25]. | DMSO, betaine, or formamide can help denature GC-rich secondary structures [25]. |
Optimal primer design represents a multidimensional challenge requiring integrated consideration of thermodynamic principles, computational validation, and empirical optimization. By adhering to the established parameters for length, melting temperature, and GC content—while rigorously avoiding secondary structures—researchers establish a foundation for successful amplification. Subsequent experimental validation, particularly of annealing temperature and amplification efficiency, transforms in silico predictions into robust laboratory assays. For the drug development professional, this systematic approach to primer optimization ensures that PCR data generated throughout the research pipeline meets the stringent reproducibility standards required for regulatory approval and clinical application. As PCR methodologies continue to evolve, these core principles of primer design will remain essential for extracting biologically meaningful information from complex nucleic acid samples.
The polymerase chain reaction (PCR) stands as a cornerstone technique in molecular biology, with its efficiency fundamentally dependent on the precise optimization of core reaction components. Within the context of broader PCR cycling research—encompassing denaturation, annealing, and extension steps—the fine-tuning of magnesium ions (Mg²⁺), deoxynucleotides (dNTPs), and DNA polymerase concentration represents a critical determinant of success. These components interact in complex ways with cycling parameters to influence everything from amplicon specificity to overall yield [79]. While thermal cycling conditions have remained relatively unchanged for decades, recent advancements demonstrate that systematic optimization of reaction chemistry can yield significant improvements in both productivity and environmental sustainability [76]. This technical guide provides an in-depth examination of these key reaction components, offering evidence-based protocols for researchers and drug development professionals seeking to enhance their PCR methodologies.
Magnesium Concentration Optimization
The Fundamental Role of Mg²⁺ in PCR
Magnesium chloride (MgCl₂) serves as an essential cofactor for thermostable DNA polymerases, directly facilitating the enzymatic activity responsible for DNA synthesis [79]. Beyond this primary function, Mg²⁺ influences reaction efficiency through multiple mechanisms: it stabilizes the double-stranded DNA structure, affects primer-template binding stability, and interacts with other reaction components including dNTPs [80]. The ion concentration requires precise optimization because it exists in a delicate balance—it can be chelated by dNTPs, template DNA, and even buffer components, reducing its effective availability for the polymerase enzyme [79].
Quantitative Optimization Guidelines
A comprehensive meta-analysis of magnesium optimization in PCR revealed a strong logarithmic relationship between MgCl₂ concentration and DNA melting temperature, with optimal concentrations typically falling between 1.5 and 3.0 mM [80]. Within this range, every 0.5 mM increase in MgCl₂ concentration was associated with a 1.2°C increase in DNA melting temperature [80]. Template characteristics significantly influence optimal concentration requirements, with complex genomic DNA templates generally requiring higher Mg²⁺ concentrations compared to simpler plasmid or viral templates [80].
Table 1: Effects of Magnesium Concentration on PCR Outcomes
| Mg²⁺ Concentration | Impact on PCR Efficiency | Observed Results | Recommended Applications |
|---|---|---|---|
| < 1.5 mM | Suboptimal polymerase activity | Reduced or no product formation | Not recommended |
| 1.5 - 2.0 mM | Optimal for most applications | High specificity and yield | Standard PCR with Taq polymerase [79] |
| 2.0 - 3.0 mM | Enhanced stability for complex templates | Improved yield for GC-rich targets | Genomic DNA, high GC content [80] |
| > 3.0 mM | Reduced specificity | Increased spurious products | Special applications only |
Interference from Competing Metal Ions
The presence of contaminating metal ions can significantly inhibit PCR amplification by competing with magnesium at the polymerase active site or through direct DNA damage [81]. Studies have identified zinc, tin, iron(II), and copper as particularly potent inhibitors, with IC₅₀ values significantly below 1 mM [81]. Calcium, commonly encountered in bone samples, acts as a competitive inhibitor by binding to the polymerase in place of magnesium [81]. The susceptibility to metal inhibition varies between polymerase enzymes, with KOD polymerase demonstrating greater resistance compared to Q5 and Taq polymerases [81]. Calcium-induced inhibition can be reversed through the addition of ethylene glycol-bis(2-aminoethylether)-N,N,N′,N′-tetraacetic acid (EGTA), which selectively chelates calcium without affecting magnesium availability [81].
dNTP Concentration Optimization
Balancing Yield and Fidelity
Deoxynucleotides (dNTPs) serve as the fundamental building blocks for DNA synthesis in PCR. Their concentration requires careful optimization as it directly influences both reaction yield and amplification fidelity. Standard concentrations of 200 µM for each dNTP generally provide balanced performance for most applications [79]. However, specific research goals may necessitate deviation from this standard—lower concentrations of 50-100 µM can enhance fidelity by reducing misincorporation rates, though this comes at the cost of reduced overall yield [79]. Conversely, higher dNTP concentrations may improve yields in long-range PCR but simultaneously reduce replication fidelity [79].
Interaction with Magnesium Ions
The dNTP-Mg²⁺ relationship represents a critical interaction that must be considered during optimization. dNTPs chelate magnesium ions, effectively reducing the free Mg²⁺ concentration available for polymerase function [79]. This interaction necessitates that magnesium concentration be optimized relative to dNTP concentration, typically with a 0.5-1.0 mM higher Mg²⁺ concentration than the total dNTP concentration [79]. Failure to maintain this balance can result in suboptimal polymerase activity even with apparently sufficient magnesium in the reaction mix.
Table 2: dNTP Concentration Guidelines for Various Applications
| dNTP Concentration (each dNTP) | Effect on PCR | Advantages | Disadvantages | Best For |
|---|---|---|---|---|
| 50 - 100 µM | Enhanced fidelity | Reduced misincorporation errors | Lower overall yield | High-fidelity applications, cloning |
| 200 µM (standard) | Balanced performance | Reliable yield with acceptable fidelity | May not optimize either parameter | Routine PCR, diagnostic applications |
| > 200 µM | Increased yield | Better amplification of long targets | Reduced fidelity, higher error rate | Long-range PCR, difficult templates |
DNA Polymerase Concentration Optimization
Enzyme-Specific Requirements
DNA polymerase concentration directly influences the efficiency and specificity of PCR amplification. The optimal concentration varies depending on the specific polymerase formulation and the nature of the target template. For Taq DNA Polymerase, the recommended concentration typically ranges from 0.5 to 2.0 units per 50 µl reaction, with 1.25 units often representing the ideal balance [79]. However, this range may require adjustment based on template complexity and PCR cycling conditions. Excessive polymerase concentration can decrease specificity by promoting non-specific priming and amplifying spurious products, while insufficient enzyme results in poor yield due to inadequate product formation across cycles [79].
Thermostability Considerations
The thermostability of the DNA polymerase determines its ability to withstand the repeated high-temperature denaturation steps throughout PCR cycling. While Taq polymerase demonstrates sufficient stability for most standard applications, prolonged incubation above 95°C can lead to gradual denaturation and activity loss [4]. For protocols requiring extended denaturation times, particularly with GC-rich templates, more thermostable enzymes derived from Archaea may prove advantageous [4]. Alternatively, researchers can compensate for reduced Taq activity by adding enzyme after the initial denaturation step or incorporating a slightly higher-than-recommended amount at the reaction outset [4].
Integrated Experimental Optimization Protocols
Systematic Magnesium Titration Protocol
A methodical approach to magnesium optimization begins with establishing a concentration gradient across a logical range:
Prepare a master mix containing all reaction components except magnesium, dividing it equally across 6-8 PCR tubes.
Add MgCl₂ to create a concentration series from 0.5 mM to 4.0 mM in 0.5 mM increments.
Amplify using standard cycling conditions appropriate for your target.
Analyze results by agarose gel electrophoresis—note both product yield and specificity.
Select the optimal concentration that provides the strongest specific product with minimal background amplification [79] [80].
This empirical approach remains the gold standard for magnesium optimization, as it accounts for template-specific characteristics and buffer composition effects that computational predictions cannot fully accommodate.
Component Interaction Analysis
The interdependent nature of PCR components necessitates a holistic optimization strategy. The following workflow illustrates the systematic approach to balancing magnesium, dNTP, and polymerase concentrations:
Annealing Temperature Optimization in Relation to Mg²⁺ Concentration
Given that Mg²⁺ concentration influences primer-template binding stability, annealing temperature optimization should follow magnesium titration:
Calculate primer melting temperatures using appropriate algorithms that account for salt concentrations, particularly magnesium [4].
Begin with an annealing temperature 3–5°C below the calculated Tm of the lower-melting-temperature primer [4].
Employ a thermal gradient across a practical range (typically 45–65°C) to empirically determine the optimal annealing temperature [82].
Increase temperature incrementally if nonspecific products are observed; decrease if yield is insufficient [4].
Higher Mg²⁺ concentrations typically allow for higher annealing temperatures due to increased stabilization of primer-template duplexes [80].
Advanced Considerations for Challenging Templates
Templates with Extreme GC Content
GC-rich templates present particular challenges due to their increased thermodynamic stability and tendency to form secondary structures. These templates often benefit from elevated Mg²⁺ concentrations (up to 3.0-4.0 mM) to enhance polymerase processivity [80]. Additionally, longer initial denaturation times (up to 5 minutes) and higher denaturation temperatures (98°C) may be necessary to fully separate strands [4]. Incorporating additives such as DMSO, betaine, or formamide can further improve amplification efficiency by reducing secondary structure formation and effectively lowering the melting temperature of GC-rich regions [4].
Low-Copy Number and Inhibited Samples
When working with limited template DNA or samples containing PCR inhibitors, several adjustments to standard protocols may prove beneficial:
Increase polymerase concentration toward the upper end of the recommended range (2.0 units/50µl for Taq) to counteract partial enzyme inhibition [79].
Implement a hot-start protocol to prevent primer-dimer formation and non-specific amplification during reaction setup [4].
Increase cycle number up to 40 cycles while monitoring for plateau effects [4].
Consider alternative polymerases such as KOD, which demonstrates greater resistance to metal ion inhibition [81].
The Scientist's Toolkit: Essential Research Reagents
Table 3: Key Reagents for PCR Component Optimization
| Reagent/Solution | Function in Optimization | Typical Working Concentration | Critical Notes |
|---|---|---|---|
| MgCl₂ stock solution (25-50 mM) | Magnesium concentration adjustment | 1.5-4.0 mM final concentration | Concentration affects Tm, specificity, and yield [79] [80] |
| dNTP mix (10-25 mM each) | Nucleotide substrate provision | 50-200 µM each dNTP final concentration | Higher concentrations reduce fidelity; chelates Mg²⁺ [79] |
| Thermostable DNA polymerase | DNA strand elongation | 0.5-2.0 units/50µl reaction | Excessive amounts increase non-specific products [79] |
| PCR buffer (10X) | Reaction environment maintenance | 1X final concentration | Buffer composition affects Mg²⁺ availability and denaturation efficiency [4] |
| EGTA (ethylene glycol-bis(β-aminoethyl ether)-N,N,N′,N′-tetraacetic acid) | Calcium ion chelation | 0.1-1.0 mM final concentration | Reverses calcium-induced inhibition without affecting Mg²⁺ [81] |
| Betaine (5M stock) | GC-rich template amplification | 0.5-1.5 M final concentration | Reduces secondary structure; equalizes Tm of AT vs. GC base pairs [4] |
The precise optimization of Mg²⁺, dNTP, and DNA polymerase concentrations represents a fundamental aspect of PCR methodology that directly influences the success of amplification across diverse applications. Rather than existing as independent variables, these components participate in a complex interplay that must be balanced through systematic experimentation. The protocols and guidelines presented in this technical review provide researchers with a methodological framework for component optimization that complements broader investigations into PCR cycling parameters. As PCR technology continues to evolve, with emerging approaches including machine learning-guided optimization and sustainability-focused protocol shortening [76] [83], the fundamental principles of component balancing remain essential for achieving reliable, specific, and efficient DNA amplification in both research and diagnostic contexts.
Within the framework of polymerase chain reaction (PCR) research, mastering the three core cycling steps—denaturation, annealing, and extension—is fundamental. However, even with precise control over these parameters, many researchers encounter significant challenges when amplifying difficult templates, such as those with high GC content or complex secondary structures. PCR additives are specialized chemical agents introduced into the reaction mixture to overcome these hurdles. They work by modulating the reaction environment to improve efficiency, yield, and specificity. This guide provides an in-depth examination of key additives, including Dimethyl Sulfoxide (DMSO), Bovine Serum Albumin (BSA), and Betaine, framing their use as an advanced, essential extension of standard PCR cycling optimization. For researchers and drug development professionals, understanding and deploying these tools is critical for generating robust, reproducible genetic data from the most challenging amplification targets.
Mechanism of Action: How Additives Enhance PCR
PCR additives enhance amplification through a few key mechanistic pathways. They can be categorized based on their primary function, though some additives operate through multiple mechanisms simultaneously.
Additives that Reduce Secondary Structures
DNA templates with high GC content (>60%) are prone to forming stable, complex secondary structures and hairpins that hinder the progression of the DNA polymerase. Certain additives work by destabilizing these structures.
- Betaine: Betaine (also known as trimethylglycine) is an osmoprotectant that reduces the formation of secondary structures. It functions by eliminating the base pair composition dependence of DNA melting, making it particularly effective for amplifying GC-rich sequences [84] [85]. It achieves this by interacting with the negatively charged groups on the DNA strand, reducing electrostatic repulsion and thus the stability of the double helix [84].
- Dimethyl Sulfoxide (DMSO): DMSO is thought to reduce secondary structural stability of DNA by interacting with water molecules around the DNA, which reduces hydrogen bonding and effectively lowers the melting temperature (Tm) of the DNA [84] [85]. This allows the DNA strands to separate more easily at lower temperatures. However, a significant drawback is that DMSO also reduces the activity of Taq DNA polymerase, necessitating a careful balance in its concentration [84].
Additives that Reduce Non-Specific Priming
Non-specific amplification occurs when primers bind to non-target sequences, leading to unwanted products. The following additives increase the stringency of primer binding.
- Formamide: This organic solvent is believed to bind to the major and minor grooves of DNA, destabilizing the double helix and lowering its melting temperature [84] [85]. This action promotes the specific binding of primers to the template DNA and reduces the occurrence of non-specific amplification [84].
- Tetramethylammonium Chloride (TMAC): TMAC increases hybridization specificity by interacting with the negatively charged phosphate groups on the DNA backbone. This forms a charge shield that reduces electrostatic repulsion between DNA strands, making primer-template binding more stable and specific. It is often recommended for use with degenerate primers [84] [85].
Additives that Mitigate Inhibition and Provide Cofactors
Some additives protect the reaction from inhibitors or provide essential components for the polymerase enzyme.
- Bovine Serum Albumin (BSA): BSA plays a crucial role in reducing the effect of contaminants. It binds to and neutralizes PCR inhibitors commonly found in sample preparations, such as phenolic compounds, humic acids, and immunoglobulins [84] [86]. Furthermore, BSA can prevent reaction components from adhering to the walls of the tube [85]. Notably, research shows that BSA can act as a powerful co-enhancer when used with organic solvents like DMSO or formamide, significantly increasing the yield of GC-rich templates, though it may lose effectiveness after prolonged exposure to high temperatures [87].
- Magnesium Ions (Mg²⁺): Magnesium is an essential cofactor for DNA polymerase [84] [88]. It is required for the enzyme's catalytic activity and facilitates the binding of dNTPs during the formation of phosphodiester bonds [84] [88]. The optimal concentration is critical, as too little can lead to no product, and too much can increase non-specific amplification [89] [85].
The following diagram illustrates how these key additives intervene at different stages of the PCR cycle to overcome common challenges.
Diagram: Key PCR additives and their primary points of intervention during the thermal cycling process to overcome specific challenges.
Quantitative Data and Application Guidelines
To be used effectively, additives must be applied at optimized concentrations. The following tables summarize the recommended usage for common PCR additives.
Table 1: Additives for Managing Template Secondary Structure and Specificity
| Additive | Recommended Concentration | Primary Mechanism | Typical Application | Key Considerations |
|---|---|---|---|---|
| DMSO | 2–10% [90] [84] [85] | Reduces DNA secondary structure; lowers Tm [84] [85]. | GC-rich templates [85]. | Reduces Taq polymerase activity; requires concentration balance [84] [85]. |
| Betaine | 1–1.7 M [84] [85] | Reduces secondary structure; eliminates base composition dependence of Tm [84] [85]. | GC-rich templates; difficult secondary structures [84]. | Use betaine or betaine monohydrate, not hydrochloride, to avoid pH changes [84] [85]. |
| Formamide | 1–5% [84] [85] | Binds DNA grooves, destabilizes double helix; lowers Tm [84] [85]. | Increases specificity; reduces non-specific priming [84]. | Effective within a narrow concentration range [87]. |
| TMAC | 15–100 mM [84] [85] | Increases hybridization specificity; increases Tm [84]. | PCR with degenerate primers [84] [85]. | Reduces electrostatic repulsion between DNA strands [84]. |
| Non-ionic Detergents | 0.1–1% [84] | Reduces secondary structure stability [84]. | Can neutralize SDS contamination [85]. | May increase non-specific amplification [84]. |
Table 2: Additives for Providing Cofactors and Combating Inhibition
| Additive | Recommended Concentration | Primary Mechanism | Typical Application | Key Considerations |
|---|---|---|---|---|
| Mg²⁺ | 1.5–2.0 mM (optimal start) [89] | Essential DNA polymerase cofactor; stabilizes primer-template binding [84] [88]. | Required for all PCR reactions. | Free concentration is chelated by dNTPs; optimize from 1.0–4.0 mM in 0.5 mM steps [89] [85]. |
| BSA | 0.1–0.8 mg/mL [84] [85] | Binds and neutralizes inhibitors (e.g., phenols, humic acid) [84] [86]. | Environmental samples; plasmid preps from bacteria; with organic solvents [87]. | Can be a powerful co-enhancer with DMSO/formamide; may denature over many cycles [87]. |
Experimental Protocols for Optimization
The following protocols provide detailed methodologies for systematically testing and implementing additives in PCR reactions.
Protocol 1: Optimization of Magnesium Concentration
Magnesium ion (Mg²⁺) concentration is one of the most critical factors to optimize, as it directly affects enzyme activity, specificity, and fidelity [89] [85].
- Reaction Setup: Prepare a master mix containing all standard PCR components: 1X reaction buffer, 0.2 mM of each dNTP, 0.1–0.5 µM of each primer, 1.25 units of Taq DNA Polymerase, and template DNA (e.g., 1–50 ng genomic DNA) [89].
- Mg²⁺ Titration: Aliquot the master mix into multiple PCR tubes. Supplement each tube with MgCl₂ to a final concentration ranging from 1.0 mM to 4.0 mM, in increments of 0.5 mM [89] [85]. Include a negative control with no template DNA.
- Thermal Cycling: Run the reactions using your standard cycling parameters. An example for a 0.5 kb amplicon is:
- Initial Denaturation: 95°C for 2 minutes
- 25–35 Cycles:
- Denaturation: 95°C for 15–30 seconds
- Annealing: 5°C below primer Tm for 15–30 seconds
- Extension: 68°C for 45–60 seconds
- Final Extension: 68°C for 5 minutes [89]
- Analysis: Analyze the PCR products by agarose gel electrophoresis. The optimal Mg²⁺ concentration will produce a strong, specific band of the expected size with minimal to no non-specific products or primer-dimer [89].
Protocol 2: Testing Additives for GC-Rich Templates
This protocol tests single additives and combinations, such as BSA with DMSO, which can have a synergistic effect [87].
- Reaction Setup: Prepare a master mix as in Protocol 1, using the optimal Mg²⁺ concentration determined previously.
- Additive Titration: Aliquot the master mix into several tubes. Add additives individually and in combination:
- Thermal Cycling: Use cycling parameters with an extended initial denaturation time (3–5 minutes) to ensure full denaturation of the GC-rich template [25]. A higher denaturation temperature (e.g., 98°C) may also be beneficial [25].
- Analysis: Compare gel band intensity and specificity across conditions. The combination of BSA and an organic solvent like DMSO often yields a significant increase in product yield for GC-rich targets [87].
Protocol 3: Using a Gradient Thermocycler for Annealing Temperature Optimization
Even with additives, the annealing temperature (Ta) must be optimized for each primer pair.
- Reaction Setup: Prepare a master mix with all components, including any optimized additives.
- Plate Setup: Aliquot the master mix into a gradient thermal cycler. Set the instrument to a temperature gradient that spans a range, for example, from 50°C to 65°C [25].
- Thermal Cycling: Run the PCR with the gradient function enabled for the annealing step.
- Analysis: After electrophoresis, identify the well(s) with the strongest specific product and the cleanest background. The temperature for those wells is the optimal annealing temperature for that primer pair [25]. If non-specific products are observed, increase the Ta in increments of 2–3°C; if yield is low, decrease the Ta [25].
The Scientist's Toolkit: Essential Research Reagents
A well-stocked lab has key reagents at hand for troubleshooting PCR experiments.
Table 3: Essential Research Reagent Solutions for PCR Optimization
| Reagent / Solution | Function in PCR Optimization |
|---|---|
| MgCl₂ Solution (25-50 mM) | Allows for empirical optimization of magnesium concentration, the most critical cofactor [89] [85]. |
| DMSO (Molecular Biology Grade) | Used to destabilize secondary structures in GC-rich templates [84] [85]. |
| Betaine (5M Stock) | Additive of choice for neutralizing the effects of high GC content and breaking secondary structures [84] [85]. |
| Acetylated BSA (10-20 mg/mL) | Neutralizes a wide range of PCR inhibitors carried over from sample preparation (e.g., phenols, humic acids) [84] [86]. |
| PCR-Grade Water | Used for diluting templates and reaction components; ensures the absence of nucleases and contaminants. |
| dNTP Mix (10 mM each) | Provides balanced nucleotide concentrations to prevent misincorporation and ensure high yield [88] [86]. |
| Hot-Start DNA Polymerase | Reduces non-specific amplification and primer-dimer formation by inhibiting polymerase activity until the first high-temperature step [91]. |
Troubleshooting Common PCR Problems with Additives
Table 4: Troubleshooting Guide for Common PCR Challenges
| Problem | Possible Cause | Additive-Based Solutions | Protocol Adjustments |
|---|---|---|---|
| No Product | Excessive secondary structure (GC-rich). | Add Betaine (1-1.7 M) or DMSO (2-10%) [84] [85]. | Increase denaturation time/temperature [25]. |
| Inhibitors in the sample. | Add BSA (0.1-0.8 mg/mL) [84] [86]. | Clean up template DNA; increase polymerase amount [88]. | |
| Low Mg²⁺ concentration. | Titrate Mg²⁺ from 1.0–4.0 mM [89] [85]. | Review calculations for dNTP-Mg²⁺ interaction. | |
| Non-specific Bands / Smearing | Annealing temperature too low. | Add Formamide (1-5%) or TMAC (15-100 mM) to increase specificity [84] [85]. | Increase annealing temperature in 2–3°C increments [25]. |
| Excess Mg²⁺ or enzyme. | Optimize Mg²⁺ concentration; avoid excess. | Reduce polymerase amount; use hot-start polymerase [91] [88]. | |
| Primer-Dimer | Primer interactions at low temperatures. | BSA can sometimes help [84]. | Use hot-start polymerase; optimize primer design and concentration [91] [88]. |
Polymersse chain reaction (PCR) stands as a cornerstone technique in molecular biology, with its efficacy profoundly dependent on the precise optimization of thermal cycling parameters. This in-depth technical guide examines the systematic refinement of denaturation, annealing, and extension conditions within the context of contemporary PCR research. We synthesize recent findings on accelerated protocols, polymerase fidelity, and kinetic requirements to provide researchers and drug development professionals with a framework for enhancing amplification efficiency, specificity, and yield. The protocols and data presented herein facilitate robust experimental outcomes across diverse applications, from basic research to diagnostic assay development.
The fundamental PCR process encompasses three temperature-dependent stages—denaturation, annealing, and extension—that are repeated cyclically to exponentially amplify target DNA sequences [1] [65]. While this core principle remains unchanged since its inception, significant advancements have emerged in our understanding of the kinetic parameters governing each stage [20]. Modern thermal cyclers and engineered DNA polymerases have unlocked potential for substantial protocol modifications that reduce process times while maintaining or improving amplification success [76]. This guide explores the systematic optimization of these critical parameters, providing a scientific foundation for protocol development tailored to specific experimental requirements in research and pharmaceutical applications.
Core Principles of PCR Cycling
The Three Fundamental Steps
The PCR amplification process relies on the precise cycling of three temperature-dependent reactions:
Denaturation: This initial step involves heating the reaction mixture to 94–98°C for 20–30 seconds, causing the dissociation of double-stranded DNA into single strands by breaking hydrogen bonds between complementary bases [65]. Efficient denaturation is critical for providing single-stranded template for primer binding.
Annealing: The temperature is lowered to 50–65°C for 20–40 seconds, allowing primers to bind to their complementary sequences on the single-stranded DNA templates [65]. This step determines the specificity of the amplification, with temperature optimization being crucial to minimize non-specific binding.
Extension: Also known as elongation, this step occurs at 68–72°C for 30–60 seconds per kilobase, during which DNA polymerase synthesizes new DNA strands by adding nucleotides to the 3' end of the primers [92] [65]. The duration depends on both the length of the amplicon and the processivity of the DNA polymerase employed.
Kinetic Considerations in Modern PCR
Recent research has revealed that traditional cycling parameters often incorporate excessive time allocations for each stage. Kinetic studies demonstrate that DNA denaturation requires merely 200–500 ms above the denaturation threshold, while annealing is achieved within 300–1000 ms below the annealing threshold when reagent concentrations are optimized [20]. These findings enable the design of extreme PCR protocols that reduce total cycling times by 10–60 fold compared to conventional methods while maintaining high amplification efficiency [20].
Parameter-Specific Optimization Guidelines
Denaturation Conditions
Denaturation efficiency depends on both temperature and duration, with optimal conditions ensuring complete strand separation without unnecessary polymerase inactivation.
Table 1: Denaturation Optimization Parameters
| Parameter | Standard Range | Rapid/Range | Key Considerations |
|---|---|---|---|
| Temperature | 94–98°C | 98°C | Higher temperatures improve GC-rich template denaturation |
| Duration | 15–30 seconds | 5 seconds | 200–500 ms above threshold is sufficient [20] |
| Initial Denaturation | 2 minutes at 95°C | 1 minute | Longer for difficult templates; avoid excessive duration |
Annealing Conditions
Annealing represents the most variable parameter in PCR optimization, with temperature being primer-specific and critical for amplification specificity.
Temperature Determination: The annealing temperature should be optimized based on the primer melting temperature (Tm), typically starting 5°C below the calculated Tm of the lower-Tm primer [92]. Modern approaches utilize a temperature gradient to empirically determine optimal conditions.
Time Considerations: While standard protocols recommend 15–30 seconds, kinetic studies demonstrate that effective annealing occurs within 300–1000 ms under optimal reagent concentrations [20]. Recent research successfully reduced annealing to 25 seconds without compromising yield [76].
Specificity Enhancement: For challenging templates with secondary structure or high GC content, increasing annealing temperature in 2°C increments can dramatically improve specificity. Touchdown PCR protocols systematically decrease annealing temperature during initial cycles to enhance specificity.
Extension Conditions
Extension parameters must balance reaction completeness with polymerase fidelity and process time.
Table 2: Extension Parameter Optimization
| Parameter | Standard Protocol | Enhanced Protocols | Notes |
|---|---|---|---|
| Temperature | 68°C (Taq) | 68–72°C | Polymerase-dependent |
| Time per kb | 60 seconds | 25–45 seconds | Enzyme-dependent [76] |
| Final Extension | 5 minutes at 68°C | 2–3 minutes | Completes all strands |
| Enzyme Speed | ~1 kb/min (Taq) | Up to 4 kb/min (KlenTaq) | KlenTaq extends ~70 bp/s [20] |
Cycle Number Optimization
Cycle number directly influences yield, specificity, and error accumulation:
- Standard Range: 25–35 cycles typically provide sufficient amplification for most applications [92] [65].
- Low Template Samples: Up to 40 cycles may be necessary for limited starting material, but this increases error probability and background.
- High Template Concentration: As few as 20–25 cycles may suffice when template is abundant, improving fidelity [92].
- Plateau Effect: Excessive cycling (>40 cycles) typically provides diminishing returns as reagents become depleted and reaction efficiency declines.
Integrated Cycling Protocols
Standard Cycling Conditions
For a typical 500 bp amplicon with Taq DNA polymerase, the following protocol serves as a robust starting point [92]:
- Initial Denaturation: 95°C for 2 minutes
- 25–35 Cycles:
- Denaturation: 95°C for 15 seconds
- Annealing: 55°C for 15 seconds (temperature primer-dependent)
- Extension: 68°C for 45 seconds
- Final Extension: 68°C for 5 minutes
- Hold: 4°C indefinitely
Accelerated Protocol
Research demonstrates that significantly shortened protocols can maintain amplification success while reducing process time and energy consumption by 46–50% [76] [20]:
- Initial Denaturation: 95°C for 1 minute
- 30 Cycles:
- Denaturation: 95°C for 5 seconds
- Annealing: 60°C for 25 seconds
- Extension: 72°C for 25 seconds (for 1.5 kb fragments)
- Final Extension: 72°C for 2 minutes
This accelerated approach has been validated for 16S rRNA gene amplification (1466 bp fragment) across templates with varying GC content [76].
Extreme PCR Protocol
For applications requiring maximum speed with short amplicons (<500 bp), extreme PCR conditions can achieve cycle times under 15 seconds [20]:
- Denaturation: 500 ms at 95°C+
- Annealing: 1000 ms at Tm-5°C
- Extension: Time calculated based on polymerase speed (e.g., 1 second per 70 bp for KlenTaq)
- Enhanced reagent concentrations (primers and polymerase) support these rapid kinetics
Experimental Optimization Workflow
The following diagram outlines a systematic approach to PCR optimization:
Polymerase Selection and Fidelity
DNA polymerase selection profoundly influences optimal cycling conditions and amplification success. Different polymerases exhibit varying characteristics that necessitate parameter adjustments:
Table 3: Polymerase Selection Guide
| Polymerase Type | Extension Rate | Proofreading | Error Rate | Optimal Use Cases |
|---|---|---|---|---|
| Taq DNA Polymerase | ~1 kb/min | No | ~10⁻⁵ | Routine PCR, genotyping |
| KOD plus Neo | ~1–2 kb/min | Yes | ~10⁻⁶ | High-fidelity applications [93] |
| PrimeSTAR GXL | ~1–2 kb/min | Yes | ~10⁻⁶ | Long-range PCR (up to 13.6 kb) [94] |
| KlenTaq | ~4 kb/min | No | ~10⁻⁵ | Extreme PCR, rapid cycling [20] |
Studies comparing 14 different PCR kits revealed statistically significant differences in error profiles, chimera formation, and amplification bias depending on the DNA polymerase employed [93]. Kits containing KOD plus Neo polymerase demonstrated superior performance in parameters associated with chimeras, top hit similarity, and deletions, particularly at elevated annealing temperatures (65°C) [93].
Impact on Downstream Applications
Next-Generation Sequencing
In library preparation for next-generation sequencing, PCR cycle number directly impacts duplicate read rates. Research demonstrates that for RNA input amounts below 125 ng, 34–96% of reads may be discarded as PCR duplicates, with this percentage increasing with lower input amounts and decreasing with fewer PCR cycles [95]. This reduction in read diversity leads to fewer genes detected and increased noise in expression counts, highlighting the critical importance of cycle number optimization in sequencing workflows.
Quantitative PCR (qPCR)
For quantitative PCR applications, amplification efficiency must be precisely determined, as small differences (as little as 4%) in efficiency can translate to 400% error in quantification [96]. Model-based analysis methods that account for efficiency variations between samples provide more accurate quantification than methods assuming constant efficiency [96]. Stepwise optimization of primer sequences, annealing temperatures, primer concentrations, and cDNA concentration range is essential for achieving R² ≥ 0.9999 and efficiency = 100 ± 5%—prerequisites for reliable 2−ΔΔCt analysis [77].
The Scientist's Toolkit: Essential Research Reagents
Table 4: Key Reagents for PCR Optimization
| Reagent | Function | Optimization Considerations |
|---|---|---|
| DNA Polymerase | Enzymatic DNA synthesis | Selection based on fidelity, speed, and template requirements [93] [94] |
| MgCl₂ | Cofactor for polymerase activity | 1.5–2.0 mM optimal for Taq; concentration affects specificity [92] |
| dNTPs | Nucleotide substrates | 200 µM each dNTP standard; lower concentrations (50-100 µM) enhance fidelity [92] |
| Primers | Target sequence recognition | 0.1–0.5 µM each primer; higher concentrations increase spurious amplification [92] |
| Buffer | Reaction environment | pH, salt concentration affect enzyme activity and primer binding |
| Template DNA | Amplification target | 1pg–10 ng (plasmid); 1ng–1µg (genomic); higher concentrations reduce specificity [92] |
| DMSO | Secondary structure reduction | Add 2–5% for GC-rich templates or difficult amplicons [94] |
Systematic optimization of PCR cycling conditions—denaturation, annealing, and extension parameters—remains essential for achieving robust, specific, and efficient amplification. Recent research demonstrates that significant reductions in process time are achievable without compromising yield or specificity, benefiting both laboratory efficiency and environmental sustainability. The integration of polymerase-specific characteristics with empirically determined optimal parameters enables researchers to develop tailored protocols that address specific experimental challenges. As PCR continues to evolve as a foundational technology in life science research and diagnostic applications, continued refinement of cycling conditions will further enhance its utility across diverse scientific disciplines.
Ensuring Accuracy: PCR Assay Validation and Technique Comparison
Establishing Rigorous Validation Protocols for Laboratory-Developed Tests (LDTs)
The development and implementation of Laboratory-Developed Tests (LDTs) have become increasingly critical in modern diagnostic and research settings, particularly for addressing highly specialized clinical needs not met by commercially available assays. The U.S. Food and Drug Administration (FDA) has established a new regulatory framework through its May 6, 2024 Final Rule, which phases out the enforcement discretion historically applied to LDTs and now regulates them as medical devices under the Federal Food, Drug, and Cosmetic Act [97]. This evolving landscape necessitates rigorous validation protocols to ensure analytical validity, clinical utility, and regulatory compliance.
Within this context, polymerase chain reaction (PCR)-based methodologies form the technological backbone for a substantial proportion of LDTs. A comprehensive understanding of PCR fundamentals—specifically the denaturation, annealing, and extension steps—provides the essential foundation for developing robust validation protocols. This guide establishes rigorous validation frameworks tailored to PCR-based LDTs, integrating technical specifications with current regulatory expectations.
PCR Fundamentals: Core Principles for LDT Development
The PCR Process: Three Essential Steps
The polymerase chain reaction is a biochemical process capable of amplifying a single DNA molecule into millions of copies in a short time through repeated temperature cycling [1]. Each cycle consists of three fundamental steps:
- Denaturation: The sample is heated to 95–98°C to separate double-stranded DNA templates into single strands by disrupting hydrogen bonds between complementary bases [1] [66]. This step typically lasts 10–60 seconds in subsequent cycles after an initial longer denaturation.
- Annealing: The temperature is lowered to 45–60°C to allow short, synthetic DNA primers to bind flanking regions of the target DNA sequence [1] [66]. The optimal annealing temperature is primer-specific and critical for reaction specificity.
- Extension: The temperature is raised to 72°C, the optimal working temperature for Taq DNA polymerase, which synthesizes new complementary DNA strands by adding nucleotides to the 3' end of each primer [1] [66]. The duration depends on target length and polymerase speed.
These three steps are repeated for 25–40 cycles, resulting in exponential amplification of the target DNA sequence [1] [2]. The theoretical doubling of product each cycle generates millions to billions of copies from the initial target, enabling detection and analysis.
PCR Master Mix Components
A standardized PCR reaction requires several essential components, each serving a specific function in the amplification process [66]:
Table 1: Essential Components of a PCR Master Mix
| Component | Function | Typical Concentration |
|---|---|---|
| PCR-grade water | Certified free of contaminants, nucleases, and inhibitors | Volume adjuster |
| dNTPs | Nucleotide "building blocks" (dATP, dCTP, dGTP, dTTP) for new DNA synthesis | 200μM each |
| Forward/Reverse Primers | Short, single-stranded DNA sequences that anneal specifically to flank target sequence | 200nM each |
| DNA Polymerase | Enzyme that synthesizes new complementary DNA strands (e.g., Taq polymerase) | 1–2.5 units/reaction |
| Buffer | Provides optimal chemical environment for polymerase activity | 1X concentration |
| Magnesium Chloride | Cofactor that increases polymerase activity and primer annealing | 1.5–2.5mM |
Advanced PCR Technologies for LDTs
Beyond conventional PCR, several advanced amplification technologies offer enhanced capabilities for specialized LDT applications:
Quantitative PCR (qPCR): Also called real-time PCR, this method enables detection and measurement of amplified DNA as it is generated through fluorescent chemistry, allowing for target quantification rather than mere detection [66]. The quantification cycle (Cq) represents the fractional number of cycles required for the fluorescence signal to cross the detection threshold and is inversely correlated with the initial target quantity [98].
Reverse Transcription PCR (RT-PCR): This technique incorporates an initial reverse transcription step to convert RNA into complementary DNA (cDNA) before amplification, enabling detection and analysis of RNA targets such as messenger RNA or RNA viruses [66].
Digital Droplet PCR (ddPCR): This third-generation PCR method partitions samples into thousands of nanoliter-sized droplets, with each serving as an independent amplification reaction. ddPCR provides absolute quantification without standard curves and demonstrates superior precision for detecting rare mutations and copy number variations [66].
Regulatory Framework for LDTs
FDA Phaseout Policy Timeline
The FDA's revised approach to LDT regulation follows a phased implementation schedule with specific requirements for each stage [97]:
Table 2: FDA LDT Regulatory Phaseout Timeline
| Stage | Deadline | Key Requirements |
|---|---|---|
| Stage 1 | May 2025 | Medical Device Reporting (MDR), Complaint Files, Corrections and Removals |
| Stage 2 | November 2026 | Labeling requirements, Establishment registration and device listing |
| Stage 3 | May 2027 | Quality system regulation (QSR) requirements, including design controls |
| Stage 4 | November 2027 | Premarket review for high-risk LDTs (Class III) |
| Stage 5 | May 2028 | Premarket review for moderate and low-risk LDTs (Class II and I) |
Quality System Requirements
Laboratories developing LDTs must establish comprehensive quality management systems that address [97]:
- Design Controls: Documented procedures for designing LDTs that meet predefined user needs and intended uses, including design verification and validation.
- Medical Device Reporting (MDR): Established procedures for reporting adverse events and product problems to the FDA.
- Complaint Files: Systems for receiving, documenting, and evaluating complaints about LDT performance.
- Corrections and Removals: Procedures for addressing non-conforming tests and implementing corrective actions.
Validation Protocol Framework for PCR-Based LDTs
Analytical Validation Parameters
Rigorous analytical validation must demonstrate that an LDT consistently meets predefined performance specifications across critical parameters [97]:
Table 3: Essential Analytical Validation Parameters for PCR-Based LDTs
| Parameter | Experimental Protocol | Acceptance Criteria |
|---|---|---|
| Analytical Sensitivity | Limit of Detection (LoD) determined via serial dilution of standardized target; Probit analysis recommended | ≤ target concentration clinically relevant; 95% hit rate |
| Analytical Specificity | Cross-reactivity testing against genetically similar organisms and normal flora; interference studies | No amplification with non-target organisms; ≤10% impact from interferents |
| Precision | Repeatability (within-run) and reproducibility (between-run, operator, lot) studies with multiple replicates | CV ≤ 10-15% for quantitative assays; 100% concordance for qualitative |
| Accuracy/Method Comparison | Comparison to reference method (if available) or well-validated predicate device using clinical samples | ≥90% positive/negative agreement with 95% confidence |
| Reportable Range | For quantitative assays, linearity demonstrated across clinically relevant concentrations using diluted clinical samples or reference standards | R² ≥ 0.98; linearity demonstrated across claimed range |
Establishing PCR Efficiency and Quantification
For quantitative PCR-based LDTs, establishing and monitoring PCR efficiency is fundamental to accurate target quantification. The kinetic equation of PCR is expressed as NC = N0 × EC, where NC is the number of amplicons after cycle C, N0 is the initial target quantity, and E is the amplification efficiency (theoretically 2 for 100% efficiency) [98].
Proper qPCR data analysis requires [98]:
- Baseline Correction: Using appropriate methods not solely dependent on early cycle fluorescence, which can introduce variability
- Threshold Setting: Placing the quantification threshold within the exponential phase of amplification, best identified using logarithmic fluorescence plots
- Efficiency Correction: Accounting for reaction-specific efficiency values rather than assuming 100% efficiency, which introduces quantification bias
Advanced approaches now enable determination of the absolute target quantity (Ncopy) at the start of the reaction using amplification curve characteristics and known reaction component concentrations, facilitating direct interlaboratory comparisons [98].
Implementation and Quality Control
Workflow Integration
The following workflow illustrates the complete process from PCR fundamentals to validated LDT implementation:
The Scientist's Toolkit: Research Reagent Solutions
Table 4: Essential Research Reagents for PCR-Based LDT Development
| Reagent Category | Specific Examples | Function in LDT Development |
|---|---|---|
| DNA Polymerases | Taq DNA polymerase, Pfu polymerase, high-fidelity enzymes | Catalyzes DNA synthesis; choice impacts specificity, fidelity, and application |
| Nucleotides | dNTPs (dATP, dCTP, dGTP, dTTP) | Building blocks for new DNA strand synthesis |
| Primers & Probes | Sequence-specific primers, TaqMan probes, molecular beacons | Defines target specificity; enables detection and quantification |
| Reverse Transcriptase | AMV reverse transcriptase, M-MLV | Converts RNA to cDNA for RT-PCR and RT-qPCR applications |
| Sample Prep Kits | QIAamp DNA extraction kits, QIAamp Fast DNA Stool Mini Kit | Isolates and purifies nucleic acids from clinical specimens |
| Inhibition Removal | PCR inhibitor removal columns, dilution buffers | Reduces PCR inhibitors from complex matrices (e.g., stool, blood) |
Quality Control and Laboratory Safety
Implementation of PCR-based LDTs requires stringent quality control measures and laboratory safety practices [2]:
- Contamination Control: Physical separation of pre- and post-amplification areas with dedicated equipment and reagents
- Environmental Controls: Limiting airflow and movement in PCR workspace; using laminar flow hoods with UV lighting
- Process Controls: Incorporation of positive, negative, and internal amplification controls in each run
- Personal Protective Equipment: Consistent use of face masks, gloves, and hair covers during testing procedures
- Reagent Management: Proper storage and aliquoting of enzymes, buffers, and primers; immediate discarding of unused reagents
Establishing rigorous validation protocols for PCR-based Laboratory-Developed Tests requires integration of fundamental molecular principles with evolving regulatory requirements. The stepwise approach outlined in this guide—from understanding PCR thermodynamics to implementing comprehensive analytical validation—provides a framework for developing robust, reliable LDTs that meet both clinical needs and regulatory standards. As the FDA's phased implementation proceeds, laboratories must prioritize documentation, quality systems, and thorough validation studies to ensure their LDTs deliver accurate, reproducible results for patient care and research applications.
In polymerase chain reaction (PCR) research, the reliability of any experimental outcome hinges on the rigorous validation of three fundamental parameters: specificity, sensitivity, and reproducibility. Within the context of PCR cycling steps—denaturation, annealing, and extension—these parameters determine whether results accurately reflect biological truth or are merely artifacts of the process. Specificity ensures that the amplification process exclusively targets the intended DNA sequence. Sensitivity defines the lowest detectable amount of target nucleic acid, crucial for applications like pathogen detection in early infection stages or minimal residual disease monitoring in oncology. Reproducibility guarantees that results remain consistent across different runs, operators, and laboratories, forming the foundation for trustworthy scientific conclusions and clinical diagnostics [99] [2].
This technical guide provides an in-depth examination of these core validation parameters, offering detailed methodologies for their assessment and optimization, with a particular focus on their interplay with PCR cycling dynamics. The guidelines presented herein are essential for researchers, scientists, and drug development professionals seeking to generate robust, reliable, and interpretable PCR data.
Specificity
Definition and Importance
Specificity in PCR refers to the ability of the amplification reaction to generate only the intended target amplicon, without producing non-specific products such as primer-dimers or off-target amplifications. High specificity is paramount for accurate downstream applications, including clinical diagnostics, where false positives can lead to incorrect treatment decisions, and in research settings, where contamination or misidentification can compromise experimental validity. The annealing temperature during PCR cycling is perhaps the most critical factor influencing specificity, as it determines the stringency of primer binding to the template DNA [4] [100].
Experimental Assessment of Specificity
Specificity is typically validated through a combination of bioinformatic and empirical methods.
- Bioinformatic Analysis: Before laboratory testing, primer sequences must be analyzed in silico using tools like BLAST to ensure they are unique to the target gene and lack significant homology to non-target sequences, particularly at the 3' ends. Primer design software should be used to check for self-complementarity, hairpin formation, and primer-dimer potential [88].
- Empirical Verification: Following amplification, reaction products are separated by agarose gel electrophoresis. A specific reaction produces a single, discrete band of the expected size. For further confirmation, the amplicon can be subjected to restriction enzyme digestion to generate a predictable fragment pattern or sent for Sanger sequencing to verify its identity [2] [100]. In real-time PCR using intercalating dyes, specificity can be assessed by analyzing the melt curve, which should display a single, sharp peak at the expected melting temperature (Tm) for the target amplicon.
Optimization Strategies for Maximum Specificity
- Annealing Temperature Optimization: The most powerful approach is to optimize the annealing temperature. A general rule is to start 3–5°C below the calculated Tm of the primers. If non-specific products are observed, incrementally increase the temperature by 2–3°C in subsequent reactions. The use of a thermal cycler with a gradient function allows for the efficient testing of a range of temperatures in a single run [4].
- Primer Design: Primers should be 15–30 nucleotides long with a GC content of 40–60%. The 3' end should be stabilized with a G or C base (GC clamp) but should not contain runs of three or more G/C nucleotides, as this can promote mispriming. The Tm values for the forward and reverse primers should be within 5°C of each other [88] [101].
- Hot-Start DNA Polymerase: Utilizing a hot-start enzyme, which is inactive until a high-temperature activation step, prevents primer-dimer formation and non-specific extension during reaction setup and the initial denaturation cycle [100].
- Mg²⁺ Concentration: Since Mg²⁺ is a cofactor for DNA polymerase, high concentrations can reduce specificity by stabilizing non-specific primer-template interactions. The optimal concentration for Taq DNA Polymerase is typically 1.5–2.0 mM, but titration in 0.5 mM increments may be necessary for challenging assays [101].
- Additives: For templates with high GC content or strong secondary structure, additives like dimethyl sulfoxide (DMSO) at 1–10% or formamide at 1.25–10% can help denature stable structures and improve specificity [100].
Sensitivity
Definition and Importance
Sensitivity defines the lowest quantity of a target nucleic acid that can be reliably detected by the PCR assay. It is often expressed as the limit of detection (LoD). High sensitivity is critical for applications such as detecting low-abundance pathogens, monitoring minimal residual disease in cancer, analyzing single cells, and using low-input samples from precious sources [99] [2]. The efficiency of the initial denaturation step and the number of PCR cycles directly impact an assay's sensitivity.
Experimental Determination of Limit of Detection (LoD)
The LoD is established through a dilution series of a known quantity of the target nucleic acid.
- Template Serial Dilution: A stock solution of the target DNA or RNA (e.g., a plasmid containing the insert or synthesized oligonucleotide) is quantified and serially diluted, typically in a 10-fold series, in a background of non-target DNA (e.g., yeast tRNA or salmon sperm DNA) to mimic the complexity of a real sample.
- Replication and Probabilistic Analysis: Each dilution is amplified in a sufficient number of replicates (e.g., 12-24) to account for stochastic effects at low copy numbers. The LoD is defined as the lowest concentration at which ≥95% of the replicates test positive [99]. This probabilistic approach is essential because, at very low concentrations, the target molecule may not be present in every aliquot of the sample due to Poisson distribution.
Table 1: Example of LoD Determination for a Pathogen Detection Assay
| Target Copy Number | Positive Replicates | Total Replicates | Detection Rate |
|---|---|---|---|
| 1000 | 12 | 12 | 100% |
| 100 | 12 | 12 | 100% |
| 10 | 11 | 12 | 91.7% |
| 1 | 6 | 12 | 50% |
In this example, the LoD would be 10 copies, as it is the lowest concentration achieving a detection rate of ≥95%.
Optimization Strategies for Enhanced Sensitivity
- Cycle Number: Increasing the number of amplification cycles to 40 can enhance detection from low-copy-number templates. However, over-cycling (beyond 45 cycles) is not recommended as it can lead to high background and nonspecific amplification [4] [102].
- DNA Polymerase and Template Quality: Use a high-sensitivity DNA polymerase formulation. Ensure template DNA is of high quality and free of inhibitors, such as phenol, EDTA, or heparin, which can dramatically reduce sensitivity [2] [88].
- Efficient Denaturation: For GC-rich templates, a longer initial denaturation time (up to 3-5 minutes) or a higher denaturation temperature (98°C) can ensure complete separation of DNA strands, making the target more accessible to primers [4].
- Enrichment Strategies: In diagnostic applications like cosmetic testing, a short enrichment culture (20-24 hours) prior to DNA extraction can increase the number of target organisms, thereby improving the assay's effective sensitivity [99].
Figure 1: Experimental Workflow for Determining Limit of Detection (LoD)
Reproducibility
Definition and Importance
Reproducibility, also referred to as precision, measures the degree of agreement between repeated measurements of the same sample under defined conditions. It encompasses intra-assay precision (within a single run), inter-assay precision (across different runs, days, or operators), and inter-laboratory precision. High reproducibility is non-negotiable for longitudinal studies, multi-center clinical trials, and any scenario where results are compared over time or across locations [103]. Variations in the extension temperature and time, as well as reagent lot consistency, are major factors affecting reproducibility.
Experimental Assessment of Reproducibility
Reproducibility is quantified by measuring the variation (standard deviation - SD) and calculating the coefficient of variation (CV) among replicate measurements.
- Replicate Strategy: To assess precision, a minimum of three replicates (technical replicates) of the same sample should be included within a single run for intra-assay precision. For inter-assay precision, the same sample should be tested in separate runs on different days, ideally by different operators using different reagent lots [103].
- Statistical Analysis: For quantitative PCR (qPCR) data, the mean quantity (or mean Cq value) and standard deviation (SD) are calculated for the replicate group. The CV is then determined as (SD / Mean) × 100%. A lower CV indicates higher precision. For example, a study on Standardized Competitive RT-PCR (StaRT-PCR) demonstrated excellent reproducibility with a CV of less than 3.8% when the native template to competitive template ratio was kept close to 1:1 [104].
Table 2: Inter-Sample Variability Assessment for Reproducibility
| Amplification Cycle Number | Mean Transcript Number | Standard Deviation (SD) | Coefficient of Variation (CV) |
|---|---|---|---|
| 20 | 150,369 | 3,013 | 2.00% |
| 23 | 144,224 | 3,047 | 2.11% |
| 26 | 139,305 | 7,355 | 5.28% |
| 29 | 135,205 | 997 | 0.70% |
| 32 | 135,138 | 2,175 | 1.61% |
| 35 | 135,413 | 2,797 | 2.00% |
Source: Adapted from data on StaRT PCR variability [104]
Optimization Strategies for Improved Reproducibility
- Master Mix Preparation: The most effective method to minimize well-to-well variation is to prepare a single master mix containing all common components (water, buffer, dNTPs, enzyme, primers), which is then aliquoted into individual reaction tubes. This ensures all samples are exposed to an identical reagent environment [100].
- Pipetting Technique and Calibration: Use calibrated pipettes and ensure proper technique, especially for viscous liquids. For multi-channel pipettes, check that volume delivery is consistent across all channels. Centrifuging the sealed plate before running the PCR brings all liquid to the bottom of the wells and removes air bubbles, ensuring consistent thermal conduction [103].
- Standardized Protocols and Instrument Maintenance: Adhere to standardized, validated protocols from sample collection through DNA extraction to amplification. Regular maintenance and calibration of thermal cyclers, including temperature verification, are essential for run-to-run consistency [99] [103].
- Passive Reference Dyes and Multiplexing: In qPCR, using a passive reference dye (e.g., ROX) corrects for minor fluctuations in reaction volume and optical path length, thereby improving precision. When performing relative quantification, multiplexing the target and normalizer genes in the same well provides a built-in precision correction [103].
Figure 2: Hierarchy and Measurement of Reproducibility (Precision)
The Scientist's Toolkit: Essential Reagents and Materials
The consistent performance of a validated PCR assay depends on the quality and consistency of its core components. The following table details key reagents and their critical functions in ensuring specificity, sensitivity, and reproducibility.
Table 3: Research Reagent Solutions for PCR Validation
| Reagent/Material | Function & Role in Validation | Optimization Notes |
|---|---|---|
| Hot-Start DNA Polymerase | Enzyme engineered to be inactive at room temperature. Critical for enhancing specificity by preventing non-specific priming and primer-dimer formation during reaction setup. | Choice between antibody-mediated or chemically modified hot-start. Select based on required fidelity (proofreading for cloning), processivity (for long amplicons), and extension speed [102] [100]. |
| Primers | Synthetic oligonucleotides that define the target sequence. Their design and quality are the primary determinants of assay specificity and efficiency. | Must be designed with appropriate length (15-30 nt), Tm (55-70°C), and GC content (40-60%). HPLC purification is recommended for applications requiring high accuracy, such as cloning [88] [101]. |
| dNTPs | The building blocks (dATP, dCTP, dGTP, dTTP) for new DNA strands. Their quality and concentration affect sensitivity, fidelity, and yield. | Use balanced concentrations (typically 200 µM each). Higher concentrations can increase yield but reduce fidelity; lower concentrations (50-100 µM) can enhance fidelity [88] [101]. |
| Magnesium Chloride (MgCl₂) | Essential cofactor for DNA polymerase activity. Concentration critically influences specificity, fidelity, and product yield. | Optimal concentration is often 1.5-2.0 mM for Taq polymerase. Titrate in 0.5 mM increments if non-specific products are observed or if yield is low [100] [101]. |
| Buffer/Additives | The reaction environment. Additives help overcome challenges posed by complex templates and improve overall robustness. | DMSO (1-10%) helps with GC-rich templates. BSA (~400 ng/µL) can counteract the effect of inhibitors in complex samples [4] [100]. |
| Standardized Reference Material | A sample of known quantity and identity used for calibration and validation of assay performance across runs. Essential for establishing reproducibility and quantifying sensitivity (LoD). | Used in serial dilutions for standard curves and precision studies. Should be stable, well-characterized, and mimic the test sample matrix as closely as possible [99] [104]. |
Quantitative gene expression profiling and copy number alteration (CNA) analysis are imperative tools in modern molecular diagnostics and therapeutic development, providing critical insights into patient prognostic and predictive status [105]. Among the various technologies available, real-time polymerase chain reaction (PCR) has long been established as the gold standard for validating results of global genomic profiling methods across diverse research and clinical applications [105]. However, newer platforms such as the nCounter NanoString analysis system have emerged as promising alternatives, offering unique advantages for multiplexed analysis of nucleic acids without requiring enzymatic reactions [105] [106]. This technical guide provides an in-depth comparative analysis of these platforms, framed within the context of understanding PCR cycling steps (denaturation, annealing, extension) and their impact on research outcomes. For researchers, scientists, and drug development professionals, selecting the appropriate validation technology is crucial to exclude the probability of random events and false-positive/negative results while balancing throughput requirements, sensitivity needs, and practical laboratory considerations [105].
Real-Time PCR: Amplification-Based Detection
Real-time PCR operates through cyclic amplification of target DNA sequences using thermal cycling to repeatedly denature double-stranded DNA, anneal sequence-specific primers, and extend new DNA strands with a thermostable DNA polymerase. The process relies on fluorescent detection systems that monitor accumulation of PCR products in real-time during each amplification cycle [25]. Key cycling parameters include initial denaturation (94-98°C for 1-3 minutes), followed by 25-40 cycles of denaturation (94-98°C for 15-30 seconds), primer annealing (typically 50-60°C for 15-30 seconds), and extension (68-72°C for 1 minute per kb) [25] [107]. A final extension step (68°C for 5-15 minutes) ensures complete replication of all amplicons [25]. Critical reaction components include DNA template (1pg–10 ng for plasmid, 1ng–1µg for genomic DNA), primers (0.1-0.5 µM each), magnesium chloride (1.5-2.0 mM), dNTPs (200 µM each), and thermostable DNA polymerase (0.5–2.0 units per 50 µl reaction) [107].
nCounter NanoString: Hybridization-Based Digital Detection
The nCounter NanoString system employs a fundamentally different approach without requiring enzymatic amplification [108]. The technology utilizes unique color-coded reporter probes attached to complementary capture probes that hybridize directly to target DNA or RNA molecules through overnight incubation [105] [108]. Following hybridization, samples are transferred to a purification station that removes excess probes, then immobilized onto streptavidin-coated cartridges [108]. A digital analyzer equipped with a charge-coupled device (CCD) camera scans the cartridge lanes, counting individual fluorescent barcodes across multiple fields of view (typically 280 per lane) to provide direct digital quantification of target molecules [108]. This single-step hybridization process eliminates amplification biases but relies on sufficient target concentration for detection sensitivity.
Visual Comparison of Workflows
The following workflow diagrams illustrate the fundamental procedural differences between these two technological approaches:
Critical Performance Comparison in Research Applications
Technical Comparison and Capabilities
Table 1: Platform Characteristics and Technical Specifications
| Parameter | Real-Time PCR | nCounter NanoString |
|---|---|---|
| Fundamental Principle | Enzymatic amplification with fluorescent detection | Direct hybridization with digital barcode counting |
| Throughput Capacity | Low to medium (typically <10-plex per reaction) | High (up to 800 targets simultaneously) [108] |
| Sample Quality Requirements | Requires high-quality, amplifiable DNA | Tolerates lower-quality samples (e.g., FFPE) [108] |
| Hands-on Time | Moderate (reaction setup plus data analysis) | Minimal after hybridization [105] |
| Amplification Required | Yes (exponential amplification) | No (direct detection) [106] |
| Dynamic Range | 7-8 log orders of magnitude [109] | 5 log orders of magnitude [108] |
| Sensitivity to Low-Abundance Targets | High (amplification enables detection of rare targets) | Lower for low-abundance transcripts [108] |
| Multiplexing Capability | Limited without specialized designs | Extensive native multiplexing capability [105] [108] |
| Sample Input Requirement | 1pg–10 ng (plasmid) or 1ng–1µg (genomic) [107] | 200ng RNA for gene expression [106] |
Correlation and Agreement Across Platforms
Multiple studies have directly compared the performance of real-time PCR and nCounter technologies across various applications, with correlation coefficients varying significantly based on experimental context:
Table 2: Method Comparison Studies Across Research Applications
| Study Context | Sample Type | Key Findings | Correlation Coefficients |
|---|---|---|---|
| Oral Cancer CNA Validation [105] | 119 oral squamous cell carcinoma samples | Weak to moderate correlation for CNAs; contrasting prognostic associations | Spearman's ρ = 0.188-0.517 |
| Head and Neck Cancer Biomarkers [110] | Locally advanced HNSCC tumors | Higher correlation for gene expression; nCounter more comparable to PCR | Median ρ = 0.84 (nCounter vs. PCR) |
| Cardiac Allograft Gene Expression [106] | Cynomolgus monkey cardiac allografts | Variable and sometimes weak correlation; platform-specific biases | Variable and sometimes weak |
| Technology Review Assessment [108] | mRNA and miRNA samples | nCounter better for low-quality samples; PCR more sensitive | Platform-dependent |
The oral cancer CNA validation study demonstrated particularly important discrepancies, with Cohen's kappa score showing no agreement between platforms for 9 of 24 genes, slight to fair agreement for 5 genes, and moderate to substantial agreement for only 8 genes [105]. Most strikingly, the ISG15 gene was associated with better prognosis when measured by real-time PCR but with poor prognosis when measured by nCounter across recurrence-free, disease-specific, and overall survival endpoints [105].
Experimental Protocols for Platform Comparison
Protocol for Copy Number Alteration Validation in Oral Cancer
A comprehensive comparative study published in Scientific Reports provides a robust methodological framework for evaluating real-time PCR and nCounter performance [105]:
Sample Preparation and DNA Extraction
- Collect 119 oral squamous cell carcinoma samples (as described in the parent cohort of 127 patients)
- Extract DNA using standardized protocols, ensuring sufficient quantity and quality
- Use female pooled DNA as reference for both methods to normalize copy number calculations
Real-Time PCR Methodology
- Design TaqMan assays based on probe sequences from array CGH platform to cover similar gene regions
- Perform reactions in quadruplicate as per MIQE (Minimum Information for Publication of Quantitative Real-Time PCR Experiments) guidelines [105]
- Utilize appropriate cycling parameters: initial denaturation at 95°C for 10 minutes, followed by 40 cycles of denaturation at 95°C for 15 seconds, and annealing/extension at 60°C for 1 minute
- Analyze data using the ΔΔCq method for relative quantification
nCounter NanoString Methodology
- Design three probes for genes associated with amplification and five probes for genes associated with deletion
- Use single reactions without replicates as per manufacturer's guidelines [105]
- Hybridize samples overnight according to standard nCounter protocols
- Process through Prep Station for purification and Digital Analyzer for scanning
Statistical Analysis
- Calculate Spearman's rank correlation coefficient for continuous CNA measurements
- Compute Cohen's Kappa score to assess agreement on gain/loss classifications
- Generate Kaplan-Meier curves with Log-rank test to associate CNAs with clinical outcomes including recurrence-free survival (RFS), disease-specific survival (DSS), and overall survival (OS)
Protocol for Gene Expression Comparison in Transplant Models
A study published in Cellular Immunology provides an alternative framework for gene expression comparison [106]:
Sample Processing
- Obtain scheduled periodic collections of cardiac allotransplant tissues from cynomolgus monkeys
- Rapidly snap-freeze graft myocardium in liquid nitrogen and store at -80°C until use
- Isolate total RNA using RNeasy Plus Universal Mini Kit according to manufacturer's instructions
- Assess RNA purity and integrity by capillary electrophoresis using Agilent Bioanalyzer
Reverse Transcription and Platform Analysis
- Reverse transcribe 1μg of RNA into cDNA using SuperScript VILO Master Mix
- For real-time PCR: Perform assays on ABI Prism 7900 using inventoried TaqMan assays, run reactions in duplicate with 50 ng cDNA per reaction, use HPRT1 as housekeeping gene, calculate relative expression using ΔΔCT method
- For nCounter: Process 200ng of unamplified RNA per sample through NanoString nCounter System using custom codeset, normalize data using nSolver Analysis Software based on geometric mean of positive controls and reference gene HPRT1
Data Comparison
- Apply linear regression analysis to compare fold change results between platforms
- Calculate Pearson's correlation coefficient to assess strength of correlation
- Perform Student's t-tests on fold changes from each platform, considering p<0.05 statistically significant
PCR Cycling Optimization for Comparative Studies
Key Optimization Parameters for Reliable Real-Time PCR
Optimal PCR cycling parameters are fundamental for generating reliable, reproducible data in comparative platform studies. The denaturation step (typically 94-98°C for 15-30 seconds) must completely separate double-stranded DNA templates without excessively degrading polymerase activity [25]. For GC-rich templates (>65% GC content), higher denaturation temperatures or longer incubation times may be necessary, as demonstrated by improved yield of a GC-rich 0.7 kb fragment with extended initial denaturation times [25].
The annealing temperature represents the most critical optimization parameter, determined by calculating primer melting temperatures (Tm) using either the basic formula [Tm = 4(G + C) + 2(A + T)] or more accurate salt-adjusted calculations [25] [107]. A starting point 3-5°C below the lowest Tm of primer pairs is recommended, with subsequent optimization in 2-3°C increments – increasing temperature to enhance specificity when nonspecific products appear, or decreasing temperature when amplification is inefficient [25]. The presence of additives like DMSO, glycerol, formamide, or betaine requires downward adjustment of annealing temperatures as these reagents decrease primer-template duplex stability [25].
Extension time depends on both amplicon length and polymerase characteristics, with typical recommendations of 1 minute per kb for Taq DNA polymerase and 2 minutes per kb for Pfu DNA polymerase [25] [107]. Recent advancements demonstrate that shortened cycling parameters (5s denaturation, 25s annealing, 25s extension for 30 cycles) can successfully amplify 1466bp 16S rRNA fragments while reducing program duration by 46% and electricity consumption by 50% [76].
Relationship Between PCR Components and Cycling Conditions
The following diagram illustrates the interconnected optimization requirements for reliable real-time PCR results:
Research Reagent Solutions for Platform Implementation
Table 3: Essential Research Reagents and Materials for Platform Operation
| Reagent/Material | Function/Application | Implementation Considerations |
|---|---|---|
| Taq DNA Polymerase | Enzyme for PCR amplification with 5'→3' polymerase activity and terminal transferase activity | Thermostable; requires magnesium (1.5-2.0 mM optimal); typical usage 0.5-2.0 units/50μl reaction [107] |
| Sequence-Specific Primers | Bind complementary target sequences during annealing for amplification | Typically 20-30 nucleotides; 40-60% GC content; Tm 42-65°C; 0.1-0.5μM final concentration [107] |
| dNTP Mix | Building blocks for DNA strand synthesis during extension | Typically 200μM each dNTP; lower concentrations (50-100μM) enhance fidelity but reduce yield [107] |
| Magnesium Chloride | Cofactor for polymerase activity; affects primer annealing and template denaturation | Critical optimization parameter (1.5-2.0 mM initial); chelated by dNTPs and nucleic acids [107] |
| nCounter Reporter Probes | Color-coded probes for target detection without amplification | Six-position fluorescent barcodes permit multiplex detection of up to 800 targets [108] |
| nCounter Capture Probes | Immobilize target-probe complexes to cartridge surface | Biotin-labeled 3' end binds streptavidin-coated cartridge [108] |
| Hybridization Buffers | Facilitate specific probe-target binding in nCounter | Optimized for overnight hybridization without enzymatic reactions [105] [108] |
| Reference DNA/RNA | Normalization control for quantitative comparisons | Female pooled DNA for CNA studies; housekeeping genes (HPRT1) for expression [105] [106] |
Discussion and Research Implications
Platform Selection Guidelines for Specific Applications
The comparative data reveals distinct advantage profiles for each platform that should guide technology selection based on research objectives:
Choose Real-Time PCR When:
- Validating genomic biomarkers identified through global profiling studies [105]
- Analyzing limited gene targets (<10-plex) with maximum sensitivity
- Working with low-abundance targets requiring amplification
- Prioritizing established gold-standard methodology for publicational acceptance
- When cost considerations favor established, widely available technology
Choose nCounter NanoString When:
- Conducting multiplexed analysis of moderate numbers of targets (50-800)
- Processing degraded or low-quality samples (e.g., FFPE tissues) [108]
- Laboratory workflow efficiency is prioritized (less hands-on time) [105]
- Avoiding amplification biases is methodologically critical
- Sample quantity is not limiting but quality may be compromised
Implications for PCR Cycling Parameter Research
The significant discrepancies observed between platforms, particularly in clinical outcome associations [105], underscore the critical importance of PCR optimization in generating reliable, translatable data. Inconsistent PCR cycling parameters, suboptimal reagent concentrations, or inadequate quality control measures may contribute to platform discordance and limit reproducibility across studies. The finding that gene signatures generally demonstrate better transferability between measurement methods than individual genes [110] suggests that multi-analyte approaches may mitigate platform-specific technical variations.
Future research should prioritize standardized reporting of PCR optimization parameters, including detailed denaturation, annealing, and extension conditions, to enhance cross-platform comparability. Additionally, the development of platform-agnostic analytical frameworks that accommodate technical differences while preserving biological signals represents an important direction for molecular diagnostics development.
Real-time PCR remains the robust, gold-standard method for validating genomic biomarkers, particularly when rigorous optimization of cycling parameters and reaction components is implemented [105]. However, nCounter NanoString offers compelling advantages in multiplexing efficiency, workflow simplification, and compatibility with challenging sample types [105] [108]. The observed discrepancies in CNA validation and prognostic associations between these platforms highlight the profound impact that technological selection and optimization can have on research conclusions and clinical interpretations [105]. Researchers must carefully consider their specific application requirements, sample characteristics, and throughput needs when selecting between these platforms, while maintaining rigorous technical standards and validation protocols regardless of the chosen methodology. As molecular diagnostics continues to advance, understanding the technical foundations, limitations, and optimal applications of each platform will be essential for generating reliable, translatable scientific knowledge.
Quantitative real-time PCR (qPCR) is a cornerstone technique in molecular biology, diagnostics, and drug development. Its extreme sensitivity, which allows for the detection of minute quantities of nucleic acids, also renders it vulnerable to contamination and technical variability [2]. Historically, a lack of consensus on how to perform and interpret qPCR experiments led to publications with insufficient methodological detail, making it difficult for readers to evaluate the quality of the results or for other scientists to repeat the experiments [111]. To address these challenges, the Minimum Information for Publication of Quantitative Real-Time PCR Experiments (MIQE) guidelines were established in 2009 [111]. These guidelines provide a standardized framework designed to ensure the reproducibility, transparency, and credibility of qPCR data, thereby upholding the integrity of the scientific literature. A revised version, MIQE 2.0, has been released to reflect advances in technology and the evolving complexities of qPCR applications [112]. For researchers working within the broader context of PCR, understanding and adhering to these guidelines is fundamental to generating robust and reliable data.
The Foundation: Core Principles of PCR Cycling
To appreciate the specific requirements of the MIQE guidelines, one must first understand the fundamental steps of the polymerase chain reaction that form the basis of qPCR. The PCR process is a biochemical method for exponentially amplifying a specific DNA target sequence through repeated temperature cycles.
The Three Fundamental Steps
The core PCR cycle consists of three sequential steps that are typically repeated 25-40 times:
- Denaturation: The double-stranded DNA template is heated to a high temperature (typically 95°C) to break the hydrogen bonds between complementary base pairs, resulting in two single-stranded DNA molecules [2] [1] [3].
- Annealing: The reaction temperature is lowered (typically to a range of 55°C to 65°C) to allow short, synthetic DNA molecules called primers to bind (anneal) to their complementary sequences on the single-stranded DNA template [2] [3]. These primers flank the target region that is to be amplified.
- Extension/Elongation: The temperature is raised to the optimal temperature for the DNA polymerase (e.g., 70-80°C for Taq polymerase). The enzyme synthesizes a new DNA strand by adding free nucleotides to the 3' end of the primers, creating a complementary copy of the DNA template [2] [1].
Key Reagents and Their Functions
The following table details the essential components required to execute these PCR steps.
Table 1: Essential Components of a PCR Reaction
| Component | Function | Key Details |
|---|---|---|
| DNA Polymerase | Enzyme that synthesizes new DNA strands. | Thermostable enzymes like Taq polymerase (from Thermus aquaticus) are essential to withstand denaturation temperatures [2] [1]. |
| Primers | Short, single-stranded DNA sequences. | Provide a starting point for DNA synthesis; bind to flanking regions of the target DNA [3]. Typically 20-25 nucleotides long [2]. |
| Template DNA | The DNA sample containing the target sequence. | The strand the polymerase uses for amplification; can be genomic DNA, cDNA, etc. [3]. |
| Nucleotides (dNTPs) | Deoxynucleoside triphosphates (dATP, dCTP, dGTP, dTTP). | The building blocks used by the DNA polymerase to synthesize the new DNA strands [3]. |
| Buffer Solution | Aqueous solution containing salts and additives. | Provides the optimal chemical environment (pH, ionic strength) for polymerase activity and primer annealing [2]. |
The relationship between these steps and components is summarized in the workflow below.
The MIQE Guidelines: Ensuring qPCR Reproducibility and Reliability
While standard PCR is qualitative, qPCR allows for the quantification of the initial amount of a nucleic acid target. This is achieved by monitoring the accumulation of amplified DNA in real-time using fluorescent dyes or probes [2]. The MIQE guidelines were created to tackle the specific challenges associated with the quantitative nature of this technique.
The Purpose and Evolution of MIQE
The primary goal of the MIQE guidelines is to ensure the reliability of results, promote consistency between laboratories, and increase experimental transparency [111]. By providing a checklist of minimum information required for publication, the guidelines empower reviewers and readers to critically assess the validity of the qPCR protocols used. Full disclosure of reagents, sequences, and analysis methods is necessary for other investigators to reproduce results [111]. Since their original publication in 2009, qPCR technologies and applications have expanded significantly. The recent MIQE 2.0 revision provides updates and new recommendations tailored to these contemporary complexities, offering clearer guidance on sample handling, assay design, validation, and data analysis [112].
Key Reporting Requirements: A MIQE Checklist
Adherence to MIQE requires comprehensive documentation of the entire qPCR workflow. The following table synthesizes core requirements from the MIQE guidelines, highlighting critical information that must be reported.
Table 2: Core MIQE Guidelines Checklist for qPCR Experiment Reporting
| Category | Specific Information to Report | MIQE Importance |
|---|---|---|
| Sample & Nucleic Acids | - Sample source and collection method.- Storage conditions and handling.- Nucleic acid quantification and quality assessment (e.g., A260/A280 ratio, RIN).- Details of DNA digestion (for RNA analysis). | Ensures sample integrity and suitability for qPCR; critical for reproducibility [111] [113]. |
| Assay Design | - Primer and probe sequences (or unique assay ID with context sequence).- Location and amplicon length.- In silico specificity validation. | Essential for verifying target specificity and enabling other labs to use the same assay [114] [111]. |
| qPCR Protocol | - Complete reagent details (polymerase, buffer, Mg²⁺ concentration).- Exact primer/probe concentrations.- Full thermal cycling conditions.- Instrument and reaction vessel details. | Allows for exact replication of the experimental conditions [111]. |
| Data Analysis & Validation | - Cq (Quantification Cycle) value determination method.- PCR efficiency and correlation coefficient from standard curve.- Normalization method (e.g., reference genes).- Statistical analysis details.- Results for all replicates, including outliers. | The foundation for reliable quantification; Cq values must be converted into efficiency-corrected target quantities [2] [112]. |
A critical MIQE principle is the disclosure of assay sequence information. For commercially available assays like TaqMan assays, providing the Assay ID is a start, but full compliance requires the amplicon context sequence or probe context sequence [114]. This sequence information is vital for verifying that the assay truly targets the gene of interest.
Implementing MIQE in Diagnostic Assay Development
For scientists and drug development professionals, integrating MIQE principles into the development and validation of diagnostic assays is crucial for achieving regulatory compliance and clinical utility.
Experimental Protocol for a MIQE-Compliant qPCR Assay
The following is a detailed methodology for a MIQE-compliant gene expression assay using reverse transcription qPCR (RT-qPCR).
Sample Preparation and RNA Extraction:
- Collect samples under standardized conditions and immediately stabilize RNA using RNase inhibitors or flash-freezing in liquid nitrogen.
- Extract total RNA using a validated method (e.g., silica-column based kits). Avoid reagents that inhibit PCR, such as phenol or EDTA [2].
- Quantify RNA concentration using a spectrophotometer (e.g., Nanodrop) and assess purity via A260/A280 ratio (acceptable range: 1.8-2.0). Evaluate RNA integrity using an instrument such as a Bioanalyzer, reporting the RNA Integrity Number (RIN) [113].
cDNA Synthesis:
- Treat RNA samples with DNase I to remove contaminating genomic DNA. MIQE notes that while a no-reverse transcription (no-RT) control is essential when first validating a sample type, it may be considered "desirable" once the sample is confirmed DNA-free [113].
- Synthesize cDNA using a reverse transcriptase enzyme with consistent amounts of total RNA (e.g., 100 ng - 1 µg) across all samples in a randomized plate layout to minimize technical bias.
qPCR Assay Design and Validation:
- Design primers and probes to span an exon-exon junction where possible to avoid genomic DNA amplification.
- Validate assay specificity by performing a BLAST search against the relevant genome database and by analyzing amplification products using melt curve analysis (if using intercalating dyes) or gel electrophoresis.
- Determine PCR efficiency for each assay by running a standard curve with a minimum of 5 points of serially diluted (e.g., 1:5) cDNA. The efficiency, calculated from the slope of the standard curve, should be between 90-110% (corresponding to a slope of -3.6 to -3.1) [2].
qPCR Run and Data Analysis:
- Run each sample and assay in technical replicates (at least triplicates).
- Include necessary controls: no-template control (NTC) to detect contamination, and no-RT control if required.
- Set the quantification cycle (Cq) threshold consistently within the exponential phase of amplification for all assays.
- Export and report the raw Cq data for all replicates and samples as emphasized in MIQE 2.0 [112].
- Normalize the data using at least one, but preferably multiple, validated reference genes that are stable under the experimental conditions.
- Calculate relative gene expression using a robust model, such as the ΔΔCq method, incorporating the PCR efficiency values for each assay [2].
The Scientist's Toolkit: Essential Reagents and Materials
The following table lists key research reagent solutions and their specific functions in a MIQE-compliant qPCR workflow.
Table 3: Essential Research Reagent Solutions for qPCR
| Reagent/Material | Function in qPCR Workflow |
|---|---|
| RNA Stabilization Reagent | Preserves RNA integrity from the moment of sample collection, preventing degradation by RNases. |
| DNase I, RNase-free | Digests contaminating genomic DNA in RNA samples to prevent false-positive signals in RT-qPCR. |
| Reverse Transcriptase Kit | Synthesizes complementary DNA (cDNA) from an RNA template for subsequent qPCR amplification. |
| Hot-Start DNA Polymerase | Reduces non-specific amplification and primer-dimer formation by requiring heat activation. |
| Sequence-Specific Probes | Provide high specificity for target detection through fluorescence (e.g., TaqMan, Molecular Beacons). |
| Intercalating Dye | Binds to double-stranded DNA and fluoresces, allowing for amplicon detection without a specific probe. |
| Nuclease-Free Water | Serves as a solvent and diluent, ensuring no enzymatic degradation of primers, probes, or templates. |
| Validated Reference Gene Assays | Enable accurate normalization of target gene expression data by controlling for technical and biological variation. |
The entire process, from sample to result, must be meticulously documented and controlled, as illustrated in the following workflow that integrates the PCR cycle with MIQE checkpoints.
The MIQE guidelines are an indispensable tool for the modern molecular biologist. By rigorously adhering to these standards, researchers, scientists, and drug development professionals can ensure that their qPCR data is not only publishable but also reproducible, reliable, and scientifically sound. As qPCR technology continues to evolve with new applications in areas like single-cell analysis and liquid biopsy, the principles enshrined in MIQE and its updated version, MIQE 2.0—transparency, comprehensive reporting, and rigorous validation—will remain fundamental to maintaining the integrity of scientific research and the development of robust diagnostic assays. Integrating these guidelines into the foundational understanding of PCR's denaturation, annealing, and extension steps creates a complete framework for generating high-quality, trustworthy data.
Quantitative PCR (qPCR) is a cornerstone technique in molecular biology, clinical diagnostics, and drug development for quantifying nucleic acids. The accurate interpretation of its results hinges on a thorough understanding of two fundamental parameters: the Quantification Cycle (Cq) and the PCR Amplification Efficiency [115]. The Cq value indicates the cycle number at which the amplification curve crosses the quantification threshold, signaling a significant increase in fluorescence over the background [116]. Amplification efficiency represents the proportion of template molecules that are duplicated in each PCR cycle during the exponential phase of the reaction [115]. These parameters are mathematically intertwined; the Cq value is inversely proportional to the logarithm of the initial target quantity and directly dependent on the reaction efficiency [116]. Proper calculation and interpretation of these values are therefore critical for deriving biologically meaningful quantitative data, a requirement emphasized by the MIQE (Minimum Information for Publication of Quantitative Real-Time PCR Experiments) guidelines to ensure reproducibility and reliability of qPCR results [112].
Core Concepts: Cq, Ct, and the Mathematics of Amplification Efficiency
The Quantification Cycle (Cq) and Its Determinants
The Quantification Cycle (Cq), also known as the Threshold Cycle (Ct), is a fractional cycle number at which the amplification curve intersects a predefined threshold [117] [116]. This value is a primary output of all qPCR instruments and forms the basis for subsequent quantification. The relationship between Cq and the initial target concentration is described by the equation:
Cq = log(Nq) - log(N₀) / log(E) [116]
Where:
- Nq is the number of amplicon molecules at the quantification threshold
- N₀ is the initial number of target molecules in the reaction
- E is the amplification efficiency (fold increase per cycle)
This equation demonstrates that Cq depends not only on the initial target quantity (N₀) but also on the PCR efficiency (E) and the level at which the quantification threshold is set [116]. Consequently, a lower Cq value indicates a higher starting concentration of the target sequence, provided that efficiency and threshold settings are consistent across compared reactions.
The Mathematical Foundation of PCR Efficiency
The underlying principle of qPCR quantification is that during the exponential amplification phase, the amount of PCR product theoretically doubles with each cycle, which corresponds to 100% efficiency [115] [118]. The basic equation describing PCR kinetics is:
Nc = N₀ × E^c [116]
Where:
- Nc is the number of target copies after cycle c
- N₀ is the starting number of target copies
- E is the amplification efficiency (ranging from 1 to 2)
- c is the number of amplification cycles
When the amplification reaches the quantification threshold, the equation becomes:
Nq = N₀ × E^Cq [116]
A quick method for interpreting Cq values applies a rule of thumb: with an input of 10 template copies and PCR efficiency between 1.8 and 2, a Cq value of approximately 35 will be observed [116]. Using this reference, the initial target quantity for any observed Cq can be estimated with the formula: N = 10 × E^(35 - Cq) [116].
Calculation of PCR Efficiency Using a Standard Curve
The most common method for determining PCR efficiency involves generating a standard curve with serial dilutions of a known template concentration [118] [119]. The procedure involves the following steps:
- Prepare a serial dilution series of the template (typically 5-10 fold dilutions covering at least 3 orders of magnitude)
- Run qPCR amplification for all dilution points in replicate
- Record the Cq values for each dilution
- Plot Cq values against the logarithm of the initial template concentration
- Perform linear regression analysis to obtain the slope of the trendline
The amplification efficiency is then calculated using the formula:
Efficiency = 10^(-1/slope) - 1 [119]
This efficiency value is often expressed as a percentage: Percentage Efficiency = (10^(-1/slope) - 1) × 100% [115].
Table 1: Relationship Between Standard Curve Slope and PCR Efficiency
| Slope | Efficiency (Value) | Efficiency (%) | Interpretation |
|---|---|---|---|
| -3.32 | 2.00 | 100% | Ideal efficiency |
| -3.58 | 1.80 | 90% | Acceptable range |
| -3.10 | 2.20 | 120% | Potentially problematic |
| -4.00 | 1.58 | 79% | Low efficiency |
Theoretical maximum efficiency is 100% (slope = -3.32), meaning the template doubles every cycle [115] [119]. In practice, efficiencies between 90% and 110% are generally considered acceptable [118]. Efficiencies significantly exceeding 100% often indicate technical issues such as polymerase inhibition in concentrated samples, pipetting errors, or the presence of contaminants [118].
Experimental Protocols for Determining qPCR Efficiency
Standard Curve Method for Efficiency Determination
Principle: This method calculates amplification efficiency based on the relationship between Cq values and the logarithm of known template concentrations in a serial dilution series [115] [119].
Protocol:
Template Dilution Preparation:
- Start with a template stock solution of known concentration (e.g., purified PCR product, plasmid DNA, or synthetic oligonucleotide)
- Prepare a minimum of 5 serial dilutions with constant dilution factor (typically 1:3 to 1:10), spanning at least 3 orders of magnitude
- Use the same dilution buffer for all standards to maintain consistent chemical composition
- Include at least three replicates per dilution point to assess technical variability
qPCR Setup and Running:
- Use identical reaction components and volumes for all standards and samples
- Include no-template controls (NTCs) to detect contamination
- Run amplification using cycling parameters optimized for the specific assay
- Ensure sufficient cycles to detect the most diluted standard (typically 40-45 cycles)
Data Collection and Analysis:
- Record Cq values for all standard dilutions
- Plot Cq values (y-axis) against the logarithm of the initial template concentration (x-axis)
- Perform linear regression analysis to determine the slope and correlation coefficient (R²)
- Calculate efficiency using the formula: E = 10^(-1/slope) [119]
- Discard any outlier data points that significantly deviate from the linear trend
Troubleshooting:
- If the correlation coefficient (R²) is below 0.98, check pipetting accuracy and template quality
- If efficiency falls outside the 90-110% range, optimize primer concentrations or redesign assays
- If inhibition is suspected in concentrated samples (leading to >100% efficiency), exclude the most concentrated points from the calculation [118]
Baseline Correction and Threshold Setting for Accurate Cq Determination
Proper determination of Cq values requires correct instrument setup for baseline correction and threshold setting [117].
Baseline Correction Protocol:
- Set the baseline to encompass cycles where amplification remains at background levels, typically cycles 5-15
- Avoid the first few cycles (1-5) which may contain reaction stabilization artifacts
- Ensure the baseline period ends before any visible amplification begins for any sample
- Manually adjust if the automatically set baseline causes amplification curves to fall below the zero line [117]
Threshold Setting Protocol:
- Set the threshold within the exponential phase of all amplification curves
- View amplification plots in logarithmic fluorescence scale to better identify the parallel linear phase
- Position the threshold high enough to avoid background fluorescence variations
- Ensure the threshold intersects all amplification curves in their parallel regions when comparing multiple samples [117]
- Maintain the same threshold for all samples that will be directly compared
Table 2: Troubleshooting Common Cq and Efficiency Issues
| Problem | Potential Causes | Solutions |
|---|---|---|
| Efficiency >110% | Polymerase inhibition in concentrated samples, pipetting errors, contaminants [118] | Dilute samples, purify template, check pipette calibration |
| Efficiency <90% | Suboptimal primer design, reagent concentrations, or reaction conditions [118] | Redesign primers, optimize Mg²⁺ concentration, adjust annealing temperature |
| High variability between replicates | Pipetting inaccuracies, bubble formation, uneven plate heating | Use precision pipettes, centrifuge plates, ensure thermal cycler calibration |
| Non-parallel amplification curves | PCR inhibition varying between samples, poor assay specificity [115] | Purify problematic samples, check for amplification artefacts, optimize sample dilution |
Impact of Efficiency on Data Interpretation and Quantification
Efficiency-Corrected Relative Quantification
The most accurate method for relative quantification accounts for the actual amplification efficiency of each assay. The Pfaffl method provides an efficiency-corrected calculation for relative expression ratio [117]:
Ratio = (Etarget)^(ΔCqtarget) / (Eref)^(ΔCqref)
Where:
- Etarget and Eref are the amplification efficiencies of target and reference genes, respectively
- ΔCqtarget and ΔCqref are the Cq differences between samples for target and reference genes
This approach is more reliable than the simplified ΔΔCq method which assumes perfect (100%) efficiency for all assays [117]. When efficiencies differ between assays, using the assumption of 100% efficiency can lead to substantial inaccuracies in calculated expression ratios [116].
Implications of Efficiency Variation on Data Interpretation
Variations in PCR efficiency have profound effects on quantitative interpretation:
- Small efficiency differences create large quantitative errors: A 5% difference in efficiency (95% vs. 100%) can result in a 2.5-fold error in calculated expression ratio after 30 cycles [116]
- Cq values are comparable only when efficiencies are equal: Direct comparison of Cq values between different assays or samples is only valid when amplification efficiencies are identical [115]
- Threshold setting affects Cq values: The absolute Cq value depends on where the threshold is set, though ΔCq values between samples remain constant if thresholds are set in parallel regions of amplification curves [117]
Visual assessment of amplification curves provides a valuable quality control measure. When plotted on a logarithmic fluorescence scale, amplification curves with the same efficiency should appear parallel during their exponential phases [115]. Non-parallel curves indicate differing efficiencies and potential quantification inaccuracies.
The Scientist's Toolkit: Essential Reagents and Materials
Table 3: Key Research Reagent Solutions for qPCR Efficiency Analysis
| Reagent/Material | Function | Considerations |
|---|---|---|
| High-Quality DNA Polymerase | Enzymatic amplification of target sequence | Select thermostable enzymes with consistent performance; hot-start versions reduce primer-dimer formation [4] |
| Optimized Reaction Buffer | Provides optimal chemical environment for amplification | Should contain appropriate salt concentrations (e.g., KCl ~50 mM) and Mg²⁺ levels (typically 1.5-4 mM); Mg²⁺ concentration affects enzyme activity and fidelity [120] |
| Standard Curve Template | Known concentration material for efficiency calculation | Pure, accurately quantified template (plasmid, PCR product, synthetic oligo); should be sequence-identical to target [117] |
| qPCR Plates and Seals | Reaction vessels with optimal optical properties | Ensure compatibility with qPCR instrument; proper sealing prevents evaporation and well-to-well contamination |
| PCR Additives (DMSO, Betaine) | Enhance amplification of difficult templates | DMSO (2.5-5%) improves amplification of GC-rich targets by disrupting secondary structures [120] |
| Nuclease-Free Water | Solvent for reactions and dilutions | Must be free of nucleases and contaminants that could inhibit polymerase activity [118] |
Workflow Visualization
Diagram 1: qPCR Efficiency Calculation and Application Workflow
This workflow outlines the key steps in determining and applying qPCR amplification efficiency, from experimental setup through data analysis. The process begins with preparation of a standard curve dilution series, followed by qPCR amplification and proper baseline and threshold settings to ensure accurate Cq determination. Linear regression analysis of the standard curve enables efficiency calculation, which must be validated before being applied to correct quantitative data from experimental samples.
Accurate interpretation of Cq values and precise calculation of PCR efficiency are fundamental to reliable qPCR quantification. The mathematical relationship between these parameters dictates that efficiency variations directly impact quantitative results, potentially leading to substantial errors in gene expression ratios or target concentration estimates. The standard curve method remains the most robust approach for efficiency determination, though proper implementation requires careful attention to experimental details including template quality, dilution accuracy, and appropriate data analysis procedures. By adhering to optimized protocols, validating efficiency values, and applying efficiency-correct calculations, researchers can ensure the accuracy and reproducibility of their qPCR data, fulfilling the standards set by MIQE guidelines and advancing research credibility in molecular biology, diagnostics, and drug development.
Conclusion
Mastering the intricacies of PCR thermal cycling—denaturation, annealing, and extension—is fundamental to achieving reliable and reproducible results in both research and clinical diagnostics. A deep understanding of the underlying principles enables the development of robust assays, while advanced methodological knowledge allows for adaptation to specialized applications. Proactive troubleshooting and systematic optimization are critical for overcoming challenges posed by complex templates or demanding experimental conditions. Finally, rigorous validation and a clear understanding of the comparative strengths of different PCR platforms are indispensable for ensuring data integrity, particularly in drug development and clinical decision-making. As PCR technology continues to evolve, with trends pointing towards extreme speed, digital quantification, and greater automation, the foundational knowledge of its core cycling steps will remain the bedrock upon which next-generation molecular diagnostics and research breakthroughs are built.
References
- 1. PCR Basics | Thermo Fisher Scientific - US [https://www.thermofisher.com/us/en/home/life-science/cloning/cloning-learning-center/invitrogen-school-of-molecular-biology/pcr-education/pcr-reagents-enzymes/pcr-basics.html]
- 2. Polymerase Chain Reaction (PCR) - StatPearls - NCBI - NIH [https://www.ncbi.nlm.nih.gov/books/NBK589663/]
- 3. Module 4.2: Denaturation, Annealing, and Primer Extension [https://pressbooks.umn.edu/cvdl/chapter/module-4-4-denaturation-annealing-and-primer-extension/]
- 4. PCR Cycling Parameters—Six Key Considerations for ... [https://www.thermofisher.com/us/en/home/life-science/cloning/cloning-learning-center/invitrogen-school-of-molecular-biology/pcr-education/pcr-reagents-enzymes/pcr-cycling-considerations.html]
- 5. What is Polymerase Chain Reaction (PCR) [https://www.addgene.org/protocols/pcr/]
- 6. PCR Optimization: Factors Affecting Reaction Specificity ... [https://www.mybiosource.com/learn/pcr-optimization-factors-affecting-reaction-specificity-and-efficien/]
- 7. Quantitative PCR Basics [https://www.sigmaaldrich.com/US/en/technical-documents/technical-article/genomics/qpcr/quantitative-pcr?srsltid=AfmBOooMmRSGSkBopr-CBAzHD42l88sL4riP85sl2su7B2B6zWPs6bk7]
- 8. A roadmap to high-speed polymerase chain reaction (PCR) [https://www.sciencedirect.com/science/article/pii/S0956566323007728]
- 9. Polymerase Chain Reaction [https://www.sigmaaldrich.com/US/en/technical-documents/technical-article/genomics/pcr/polymerase-chain-reaction?srsltid=AfmBOoqu2tlTXvLWnuPo8aYOV6ZMxQPs5nK1BDzK6T-LGHCfWz0bQgge]
- 10. The kinetics of DNA denaturation [https://www.sciencedirect.com/science/article/abs/pii/S0022283664801777]
- 11. Force-induced melting and S-DNA pathways for DNA ... [https://pubmed.ncbi.nlm.nih.gov/PMC11724298]
- 12. Guidelines for PCR Optimization with Taq DNA Polymerase [https://www.neb.com/en-us/tools-and-resources/usage-guidelines/guidelines-for-pcr-optimization-with-taq-dna-polymerase?srsltid=AfmBOoqt2LBhlyXAhDz5nJLEHKm5AJ1WpO-caF-MAsNFkswjJ8dXUzsU]
- 13. Proven tips for PCR primer design [https://www.neb.com/en-us/nebinspired-blog/proven-tips-for-pcr-primer-design?srsltid=AfmBOoqsp2VDQlfY7sm_OLNSMJAXU9kX9a7wsjTTIFR-VNHVOS_RSbve]
- 14. Why is melting temperature important in PCR? | IDT [https://www.idtdna.com/page/support-and-education/decoded-plus/the-importance-of-tm-in-molecular-biology-applications/]
- 15. How to Calculate the Melting Temperature (Tm) of a PCR Primer [https://www.letstalkacademy.com/how-to-calculate-the-melting-temperature-tm-of-a-pcr-primer/]
- 16. How to Design Primers for DNA Sequencing | Practical Lab ... [https://www.cd-genomics.com/resource-how-to-design-primers-for-dna-sequencing.html]
- 17. Tm Calculator for Primers [https://www.thermofisher.com/us/en/home/brands/thermo-scientific/molecular-biology/molecular-biology-learning-center/molecular-biology-resource-library/thermo-scientific-web-tools/tm-calculator.html]
- 18. Strategies to Improve Efficiency and Specificity of ... [https://pubmed.ncbi.nlm.nih.gov/28540700/]
- 19. an automated design tool for target-specific multiplex PCR ... [https://pubmed.ncbi.nlm.nih.gov/41221025/]
- 20. The kinetic requirements of extreme qPCR [https://www.sciencedirect.com/science/article/pii/S2214753518300299]
- 21. Polymerase Chain Reaction [https://www.sigmaaldrich.com/US/en/technical-documents/technical-article/genomics/pcr/polymerase-chain-reaction?srsltid=AfmBOopGVRPiWmPRJBdLRcM11LzHX4abSRrG7We7kcQZ9lSVioPTpQgY]
- 22. Optimizing your PCR [https://www.takarabio.com/learning-centers/pcr/faq/optimization?srsltid=AfmBOorREs_hMW_B1FQNtEwOgXVemLqXghqxAc916Ew7XgnTz1uowwC0]
- 23. Faster PCR Optimization [https://bitesizebio.com/31937/optimizing-your-pcr-faster/]
- 24. Polymerase Chain Reaction: Basic Protocol Plus ... [https://pmc.ncbi.nlm.nih.gov/articles/PMC4846334/]
- 25. PCR Cycling Parameters—Six Key Considerations for ... [https://www.thermofisher.com/us/en/home/life-science/cloning/cloning-learning-center/invitrogen-school-of-molecular-biology/pcr-education/pcr-reagents-enzymes/pcr-cycling-considerations.html/1000]
- 26. PCR/qPCR Data Analysis [https://www.sigmaaldrich.com/US/en/technical-documents/technical-article/genomics/qpcr/data-analysis?srsltid=AfmBOoo-vDiO4xcskZMKEnGNGBq0VSj1CRuo5N_DNn8rF7G_Zp2dlnME]
- 27. An R package for qPCR data processing and visualization [https://pmc.ncbi.nlm.nih.gov/articles/PMC9513427/]
- 28. Standard PCR Protocol [https://www.sigmaaldrich.com/US/en/technical-documents/protocol/genomics/pcr/standard-pcr?srsltid=AfmBOopABL-8C0tpdV5RtxceE0F1Xtq-J7Cquviu6KZeAEcJj9h2rVQQ]
- 29. PCR Assay Optimization and Validation [https://www.sigmaaldrich.com/US/en/technical-documents/technical-article/genomics/pcr/assay-optimization-and-validation?srsltid=AfmBOoom_5iV4wc0fpm_0PD9xWGeqWc5mYZOX8FxOtQJHZ7jkQR57rbm]
- 30. How qPCR Works [https://www.sigmaaldrich.com/CI/en/technical-documents/technical-article/genomics/qpcr/how-qpcr-works]
- 31. qPCR and RT-qPCR [https://www.promega.com/resources/guides/nucleic-acid-analysis/qpcr-and-rt-qpcr-amplification/]
- 32. PCR Methods - Top Ten Strategies [https://www.thermofisher.com/us/en/home/life-science/cloning/cloning-learning-center/invitrogen-school-of-molecular-biology/pcr-education/pcr-reagents-enzymes/pcr-methods.html]
- 33. Optimization of the real-time PCR platform method using ... [https://www.nature.com/articles/s41598-025-16972-9]
- 34. How to Optimize RT-qPCR using the PCR Optimization Kit [https://worldwide.promega.com/resources/pubhub/2017/rt-qpcr-using-the-pcr-optimization-kit/]
- 35. Development and optimization of multiplex PCR for rapid ... [https://www.sciencedirect.com/science/article/abs/pii/S1045105625000156]
- 36. Development and clinical validation of a novel multiplex ... [https://www.nature.com/articles/s41598-025-16434-2]
- 37. The kinetic requirements of extreme qPCR [https://pubmed.ncbi.nlm.nih.gov/31285997/]
- 38. Four tips for PCR amplification of GC-rich sequences [https://www.neb.com/en-us/nebinspired-blog/four-tips-for-pcr-amplification-of-gc-rich-sequences?srsltid=AfmBOooNI2GOPVBV-cv-lzcjhTBs3pH-p96WDm7lJYm3Sn5l7MzODg5H]
- 39. Best PCR Kits for Difficult Templates (High GC Content, ... [https://synapse.patsnap.com/article/best-pcr-kits-for-difficult-templates-high-gc-content-low-yield]
- 40. Optimizing PCR amplification of GC-rich nicotinic ... [https://www.sciencedirect.com/science/article/pii/S2405580825001396]
- 41. Optimizing PCR amplification of GC-rich nicotinic ... [https://pmc.ncbi.nlm.nih.gov/articles/PMC12145843/]
- 42. Optimizing your PCR [https://www.takarabio.com/learning-centers/pcr/faq/optimization?srsltid=AfmBOorIKPnSNbBYOqkZU5ptT2lk7S7-9zHLu4kuvxoLQGV0UXZEZyXa]
- 43. Guidelines for PCR Optimization with OneTaq® and ... [https://www.neb.com/en-us/tools-and-resources/usage-guidelines/guidelines-for-pcr-optimization-with-onetaq-and-onetaq-hot-start-dna-polymerases?srsltid=AfmBOorvGr7eyN3WLXH2QWxfTLkJwFbuJyfobuAPXSgAfVLQr5zpikNl]
- 44. Guidelines for PCR Optimization with Taq DNA Polymerase [https://www.neb.com/en-us/tools-and-resources/usage-guidelines/guidelines-for-pcr-optimization-with-taq-dna-polymerase?srsltid=AfmBOoqn0kTEvrDD-kSw-vGJKyqf1_Hjx_gQDBSP9fjGC_mugkZKpaQ7]
- 45. What is Hot Start PCR? [https://www.sigmaaldrich.com/US/en/technical-documents/technical-article/genomics/pcr/what-is-hot-start-pcr?srsltid=AfmBOoocmOBd7fJ88_OcdrgphAp5vJ0yDvpc-vZ9ZEmL9q-VALFA7twC]
- 46. DNA Polymerase—Four Key Characteristics for PCR [https://www.thermofisher.com/us/en/home/life-science/cloning/cloning-learning-center/invitrogen-school-of-molecular-biology/pcr-education/pcr-reagents-enzymes/dna-polymerase-characteristics.html]
- 47. How is Hot-Start Technology Beneficial For Your PCR [https://www.thermofisher.com/us/en/home/brands/thermo-scientific/molecular-biology/molecular-biology-learning-center/molecular-biology-resource-library/spotlight-articles/hot-start-technology-benefits-PCR.html]
- 48. Hot Start Taq DNA Polymerase [https://www.neb.com/en-us/products/m0495-hot-start-taq-dna-polymerase?srsltid=AfmBOooC8GZRV253EEslpg7vaJN5H0LSdYCXGr0APAVeAYcg_RXz0Dyf]
- 49. Essential role of polymerases for assay performance [https://pmc.ncbi.nlm.nih.gov/articles/PMC6287537/]
- 50. FAQ: What are Hot Start and WarmStart ® polymerases ... [https://www.neb.com/en-us/faqs/2023/08/02/what-are-hot-start-and-warmstart-polymerases-and-when-would-i-use-them?srsltid=AfmBOoprJ-vPOVfqxBrg16_E2jbY0ElseHSJTR4e28covQ80DQjHu5oQ]
- 51. Hot Start DNA Polymerase Market's Role in Emerging Tech [https://www.datainsightsmarket.com/reports/hot-start-dna-polymerase-561324]
- 52. DNA Polymerase Market Size Forecasts USD 420 Million ... [https://www.biospace.com/press-releases/dna-polymerase-market-size-forecasts-usd-420-million-in-2025]
- 53. PCR and Thermal Cycler Technology: Fundamentals, ... [https://www.labx.com/resources/pcr-and-thermal-cycler-technology-fundamentals-applications-and-emerging-trends-in-dna/5577]
- 54. Polymerase Chain Reaction [https://www.sigmaaldrich.com/US/en/technical-documents/technical-article/genomics/pcr/polymerase-chain-reaction?srsltid=AfmBOopQ7PBrKSS0r0tZ1njTgAf0bnqV90Q-_BcBONbi7nE9XlpajPu-]
- 55. PCR/qPCR Data Analysis [https://www.sigmaaldrich.com/US/en/technical-documents/technical-article/genomics/qpcr/data-analysis?srsltid=AfmBOorl_GM9ctPbly7O3c6SlYUR_X74G9GaX6MhyQeV6PqiBChKulPe]
- 56. Advancing quantitative PCR with color cycle multiplex ... [https://pmc.ncbi.nlm.nih.gov/articles/PMC11417387/]
- 57. Polymerase Chain Reaction [https://www.sigmaaldrich.com/US/en/technical-documents/technical-article/genomics/pcr/polymerase-chain-reaction?srsltid=AfmBOoqPgk4YlQBEssU4-AjPgaB48u9HqrONWUFwtZUOV_zZbPTQMHMg]
- 58. A brighter future with advances in PCR [https://www.nature.com/articles/d42473-024-00261-6]
- 59. PCR Cloning Method [https://www.neb.com/en-us/applications/cloning-and-synthetic-biology/pcr-cloning?srsltid=AfmBOoq9FJOY06vs8OkNs330wDnFWBrsy6-O3jE9rx2pciJ9yzP4BFe3]
- 60. PCR Applications—Top Seven Categories [https://www.thermofisher.com/us/en/home/life-science/cloning/cloning-learning-center/invitrogen-school-of-molecular-biology/pcr-education/pcr-reagents-enzymes/pcr-applications.html]
- 61. PCR for NGS [https://sequencing.roche.com/global/en/article-listing/pcr-for-ngs.html]
- 62. Next-Generation Sequencing Technology: Current Trends ... [https://pmc.ncbi.nlm.nih.gov/articles/PMC10376292/]
- 63. Digital PCR: from early developments to its future application ... [https://pubs.rsc.org/en/content/articlehtml/2025/lc/d5lc00055f]
- 64. Review Immuno-PCR: Advancements, and applications for ... [https://www.sciencedirect.com/science/article/abs/pii/S0009898125002888]
- 65. Three Steps of PCR Cycle – Denaturation, Annealing, and ... [https://www.letstalkacademy.com/three-steps-of-pcr-cycle-denaturation-annealing-extension/]
- 66. How does PCR work and what are its 3 steps? | INTEGRA [https://www.integra-biosciences.com/united-states/en/blog/article/how-does-pcr-work]
- 67. PCR Troubleshooting Guide | Thermo Fisher Scientific - US [https://www.thermofisher.com/us/en/home/life-science/cloning/cloning-learning-center/invitrogen-school-of-molecular-biology/pcr-education/pcr-reagents-enzymes/pcr-troubleshooting.html]
- 68. PCR Troubleshooting Guide [https://www.neb.com/en-us/tools-and-resources/troubleshooting-guides/pcr-troubleshooting-guide?srsltid=AfmBOooF8edxjpBrmTVctxsE6F7ZedRcBUh2B2l689xGzMo1rKIqD5RC]
- 69. Troubleshooting Non-Specific Amplification [https://bento.bio/resources/bento-lab-advice/troubleshooting-non-specific-amplification-with-bento-lab/]
- 70. PCR Troubleshooting Tips [https://www.sigmaaldrich.com/US/en/technical-documents/technical-article/genomics/pcr/pcr-troubleshooting-tips?srsltid=AfmBOooIO1LD-bRy1xC8Byuv2SYH8-8c7sKrJXDHj-LiaaDUL5b27WxY]
- 71. qPCR primer design revisited - PMC - PubMed Central - NIH [https://pmc.ncbi.nlm.nih.gov/articles/PMC5702850/]
- 72. PCR Primer Design Tips - Behind the Bench [https://www.thermofisher.com/blog/behindthebench/pcr-primer-design-tips/]
- 73. Primer design guide - 5 tips for best PCR results [https://the-dna-universe.com/2022/09/05/primer-design-guide-the-top-5-factors-to-consider-for-optimum-performance/]
- 74. Proven tips for PCR primer design [https://www.neb.com/en-us/nebinspired-blog/proven-tips-for-pcr-primer-design?srsltid=AfmBOoruuSt0DVYD1b-vi20G4xDg8Tg_qHTGG6SNazawdM2ZokxexQu3]
- 75. A Computational Tool for Large-Scale Primer Design and ... [https://pmc.ncbi.nlm.nih.gov/articles/PMC12469620/]
- 76. Amplifying PCR productivity and environmental ... [https://www.sciencedirect.com/science/article/pii/S0300908424000312]
- 77. An optimized protocol for stepwise optimization of real-time ... [https://www.nature.com/articles/s41438-021-00616-w]
- 78. Primer and primer scheme design for pan-specific ... [https://training.galaxyproject.org/training-material/topics/sequence-analysis/tutorials/viral_primer_design/tutorial.html]
- 79. Guidelines for PCR Optimization with Taq DNA Polymerase [https://www.neb.com/en/tools-and-resources/usage-guidelines/guidelines-for-pcr-optimization-with-taq-dna-polymerase?srsltid=AfmBOop99DxCiWN1G1OQiyvRRyK8HjCmh_EC_7nAVTcc7jGqhJT4MJJS]
- 80. Comprehensive review and meta-analysis of magnesium ... [https://pubmed.ncbi.nlm.nih.gov/40436087/]
- 81. Impact of metal ions on PCR inhibition and RT- ... [https://link.springer.com/article/10.1007/s00414-020-02363-4]
- 82. PCR Assay Optimization and Validation [https://www.sigmaaldrich.com/US/en/technical-documents/technical-article/genomics/pcr/assay-optimization-and-validation?srsltid=AfmBOorqHyH3mIUvH5SgB_TfFyOluHIIHvj9PoNj-kYuvqv2os0j23kT]
- 83. Developing a Machine Learning 'Smart' Polymerase Chain ... [https://www.mdpi.com/2073-4425/15/9/1199]
- 84. Enhancement of DNA amplification efficiency by using ... [https://www.bocsci.com/blog/enhancement-of-dna-amplification-efficiency-by-using-pcr-additives/?srsltid=AfmBOooEUQdVgPaPUGiWkkG16NPvs4Rq2vQl4dGdvCFf6CtxkWD11cIb]
- 85. Just What Do All These Additives Do? [https://bitesizebio.com/19420/just-what-do-all-these-additives-do/]
- 86. A Comprehensive Guide to Understanding Influences on ... [https://www.sbsgenetech.com/blog/a-comprehensive-guide-to-understanding-influences-on-pcr-reactions?srsltid=AfmBOore0N5rKd9ZOYjWs3_4ySU5lA4_HtOi_d-KZ8e3eAgHQbv7Q-LJ]
- 87. Bovine serum albumin further enhances the effects of organic ... [https://pmc.ncbi.nlm.nih.gov/articles/PMC3466135/]
- 88. PCR Setup—Six Critical Components to Consider [https://www.thermofisher.com/us/en/home/life-science/cloning/cloning-learning-center/invitrogen-school-of-molecular-biology/pcr-education/pcr-reagents-enzymes/pcr-component-considerations.html]
- 89. Guidelines for PCR Optimization with Taq DNA Polymerase [https://www.neb.com/en-us/tools-and-resources/usage-guidelines/guidelines-for-pcr-optimization-with-taq-dna-polymerase?srsltid=AfmBOopgBJ6bSA_3hE97QueAdr9bmlfcTKMLIPdDs7TWl3KdP6vKc4w0]
- 90. Optimizing PCR: One Scientist's Not So Fond Memories [https://www.promegaconnections.com/optimizing-pcr-one-scientists-not-so-fond-memories/]
- 91. PCR Amplification | An Introduction to PCR Methods [https://www.promega.com/resources/guides/nucleic-acid-analysis/pcr-amplification/]
- 92. Guidelines for PCR Optimization with Taq DNA Polymerase [https://www.neb.com/en-us/tools-and-resources/usage-guidelines/guidelines-for-pcr-optimization-with-taq-dna-polymerase?srsltid=AfmBOopLnsSk-vo3SjHEbqEYWkTotIUHx-EjkvBksbQjtXN1FSwNU818]
- 93. Comparing PCR-generated artifacts of different ... [https://www.sciencedirect.com/science/article/pii/S2534970822000163]
- 94. Long-range PCR in next-generation sequencing [https://www.nature.com/articles/srep05737]
- 95. The impact of PCR duplication on RNAseq data generated ... [https://genomebiology.biomedcentral.com/articles/10.1186/s13059-025-03613-7]
- 96. Model based analysis of real-time PCR data from DNA ... [https://pmc.ncbi.nlm.nih.gov/articles/PMC1838433/]
- 97. Laboratory Developed Tests | Areas of Focus [https://clsi.org/standards-development/specialty-areas/laboratory-developed-tests/]
- 98. Analysis of qPCR Data: From PCR Efficiency to Absolute ... [https://www.preprints.org/manuscript/202510.2485]
- 99. Development of real-time PCR methods for quality control ... [https://pmc.ncbi.nlm.nih.gov/articles/PMC12058689/]
- 100. Optimizing PCR: Proven Tips and Troubleshooting Tricks [https://www.the-scientist.com/optimizing-pcr-proven-tips-and-troubleshooting-tricks-71660]
- 101. Guidelines for PCR Optimization with Taq DNA Polymerase [https://www.neb.com/en-us/tools-and-resources/usage-guidelines/guidelines-for-pcr-optimization-with-taq-dna-polymerase?srsltid=AfmBOoqvG78-O0Ld5gRs7jZMw4YOUkBIv9wF5E77oy8g-ZvxocGk64NE]
- 102. Free Guide: Top 5 PCR Optimization Tips - Yeasen [https://www.yeasenbio.com/blogs/molecular-biology/free-guide-top-5-pcr-optimization-tips]
- 103. Quantitative PCR (qPCR) Data Analysis [https://www.thermofisher.com/us/en/home/life-science/pcr/real-time-pcr/real-time-pcr-learning-center/gene-expression-analysis-real-time-pcr-information/precision-qpcr.html]
- 104. Sensitivity and reproducibility of standardized-competitive RT ... [https://pmc.ncbi.nlm.nih.gov/articles/PMC344741/]
- 105. Comparison of real-time PCR and nCounter NanoString ... [https://www.nature.com/articles/s41598-025-08036-9]
- 106. Multi-Gene Technical Assessment of qPCR and Nanostring ... [https://pmc.ncbi.nlm.nih.gov/articles/PMC7060784/]
- 107. Guidelines for PCR Optimization with Taq DNA Polymerase [https://www.neb.com/en-us/tools-and-resources/usage-guidelines/guidelines-for-pcr-optimization-with-taq-dna-polymerase?srsltid=AfmBOooXKNYbipVVZUHhysHOCZGql3PwuSN-rJlEBP5uR9eGCdXdQK1M]
- 108. Challenges and opportunities in processing NanoString ... [https://pmc.ncbi.nlm.nih.gov/articles/PMC11087919/]
- 109. Transferring a Quantitative Molecular Diagnostic Test to ... [https://www.sciencedirect.com/science/article/pii/S152515781730524X]
- 110. Comparison of GeneChip, nCounter, and Real-Time PCR ... [https://www.sciencedirect.com/science/article/pii/S1525157820300763]
- 111. The MIQE guidelines: minimum information for publication ... [https://pubmed.ncbi.nlm.nih.gov/19246619/]
- 112. MIQE 2.0: Revision of the Minimum Information for ... [https://pubmed.ncbi.nlm.nih.gov/40272429/]
- 113. MIQE: Real-Time PCR Experiment Standards [https://www.sigmaaldrich.com/US/en/technical-documents/technical-article/genomics/qpcr/minimum-information-for-publication-of-quantitative-real-time-pcr-experiments?srsltid=AfmBOopZX0NuYCqXU38bItQGRBFM3tDyO-IWn-B8R-GGWyfGSWSwXYpk]
- 114. MIQE Guidelines | Thermo Fisher Scientific - US [https://www.thermofisher.com/us/en/home/life-science/pcr/real-time-pcr/real-time-pcr-assays/why-choose-taqman-assays/publish-real-time-pcr-results.html]
- 115. Efficiency of Real-Time PCR [https://www.thermofisher.com/us/en/home/life-science/pcr/real-time-pcr/real-time-pcr-learning-center/real-time-pcr-basics/efficiency-real-time-pcr-qpcr.html]
- 116. Use and Misuse of Cq in qPCR Data Analysis and Reporting [https://pmc.ncbi.nlm.nih.gov/articles/PMC8229287/]
- 117. PCR/qPCR Data Analysis [https://www.sigmaaldrich.com/US/en/technical-documents/technical-article/genomics/qpcr/data-analysis?srsltid=AfmBOorXG0SBkYeDFWu21VLh4uftOUmLgJbTUR51-baj_nqBBkOcgPpU]
- 118. Understanding qPCR Efficiency and Why It Exceeds 100% [https://biosistemika.com/blog/qpcr-efficiency-over-100/]
- 119. Is there a formula for calculating the efficiency of a qPCR ... [https://oligos.biosearchtech.com/support/faqs/fluorogenic-probe-and-primers/is-there-a-formula-for-calculating-the-efficiency-of-a-qpcr-reaction]
- 120. Optimizing your PCR [https://www.takarabio.com/learning-centers/pcr/faq/optimization?srsltid=AfmBOoqcnEJ4XvFwwaywp3dOj5O8fYlhxj1pCCYBWiQ-F2gPqs0VmpFY]