PCR Amplification: Principles, Methods, and Cutting-Edge Applications in Biomedical Research
This article provides a comprehensive exploration of Polymerase Chain Reaction (PCR) amplification, a cornerstone technique in molecular biology.
PCR Amplification: Principles, Methods, and Cutting-Edge Applications in Biomedical Research
Abstract
This article provides a comprehensive exploration of Polymerase Chain Reaction (PCR) amplification, a cornerstone technique in molecular biology. Tailored for researchers, scientists, and drug development professionals, it covers foundational principles from DNA denaturation to extension. The scope extends to established and emerging PCR methodologies, including quantitative, digital, and reverse transcription PCR, highlighting their applications in pathogen detection, gene expression analysis, and diagnostics. A dedicated section on systematic troubleshooting and optimization is included to enhance experimental success. The article concludes with a comparative analysis of PCR technologies, evaluating their performance in sensitivity, accuracy, and suitability for modern clinical and research applications, offering a holistic guide for leveraging PCR in advanced biomedical research.
The Core Engine of Molecular Biology: Unraveling the Fundamental Principles of PCR
The invention of the Polymerase Chain Reaction (PCR) in 1985 by Kary Mullis, for which he was awarded the Nobel Prize in Chemistry, represents a watershed moment in molecular biology that has fundamentally reshaped biomedical research and clinical diagnostics [1]. This technique, which allows for the targeted amplification of specific DNA fragments from minimal starting material, rapidly became a cornerstone technology in laboratories worldwide. PCR's core principle involves the cyclic, exponential amplification of DNA through repeated rounds of denaturation, annealing, and extension, enabling the generation of millions of copies of a target sequence from just a single template [1] [2].
The evolution of PCR technology has been marked by significant innovations, primarily driven by the pursuit of greater specificity, sensitivity, speed, and quantification capabilities. The initial adoption of Taq polymerase, a thermostable DNA polymerase isolated from Thermus aquaticus, was a pivotal advancement that allowed the reaction to be automated without the need to add fresh enzyme after each denaturation cycle [1] [3]. From these foundational beginnings, PCR technology has diversified into numerous advanced formats including quantitative real-time PCR (qPCR), reverse transcription PCR (RT-PCR), digital PCR (dPCR), and nested PCR, each with distinct applications and advantages that have solidified PCR's indispensable role in modern life sciences, from basic research to applied clinical diagnostics [1] [2].
Fundamental Principles of PCR Amplification
The polymerase chain reaction operates on the fundamental principle of enzymatic amplification of a specific DNA region defined by two oligonucleotide primers. The process is cyclic and exponential, with each cycle theoretically doubling the amount of the target DNA fragment. The core reaction comprises three essential steps that are repeated 25-40 times in a automated thermal cycler [1] [3].
Core Reaction Steps
Denaturation: The double-stranded DNA template is heated to 94-95°C for 20-30 seconds, causing the separation of the complementary strands by breaking the hydrogen bonds between base pairs. This provides single-stranded templates for the primers to bind.
Annealing: The reaction temperature is lowered to 55-72°C for 20-40 seconds, allowing the forward and reverse primers to hybridize to their complementary sequences on the single-stranded DNA templates. The optimal annealing temperature is primer-specific and critically influences reaction specificity.
Extension: The temperature is raised to 72°C, the optimal temperature for Taq DNA polymerase activity. The enzyme synthesizes new DNA strands by adding nucleotides to the 3' ends of the annealed primers, creating complementary copies of the DNA template. Extension time varies from 15 seconds to several minutes depending on the length of the target amplicon [1] [3].
Essential Reaction Components
The standard PCR reaction mixture contains several key components that must be carefully optimized for efficient amplification:
- Template DNA: Can be as little as 1-100 ng of genomic DNA or equivalent.
- Primers: Two synthetic oligonucleotides (typically 20-25 nucleotides long) that are complementary to the flanking regions of the target sequence.
- Taq DNA Polymerase: A thermostable enzyme that withstands repeated heating to 95°C without significant loss of activity.
- Deoxynucleotide Triphosphates (dNTPs): The building blocks (dATP, dCTP, dGTP, dTTP) for new DNA synthesis.
- Reaction Buffer: Provides optimal ionic conditions and pH (typically Tris-HCl) and may contain magnesium chloride (MgCl₂), which is an essential cofactor for Taq polymerase activity [1] [3].
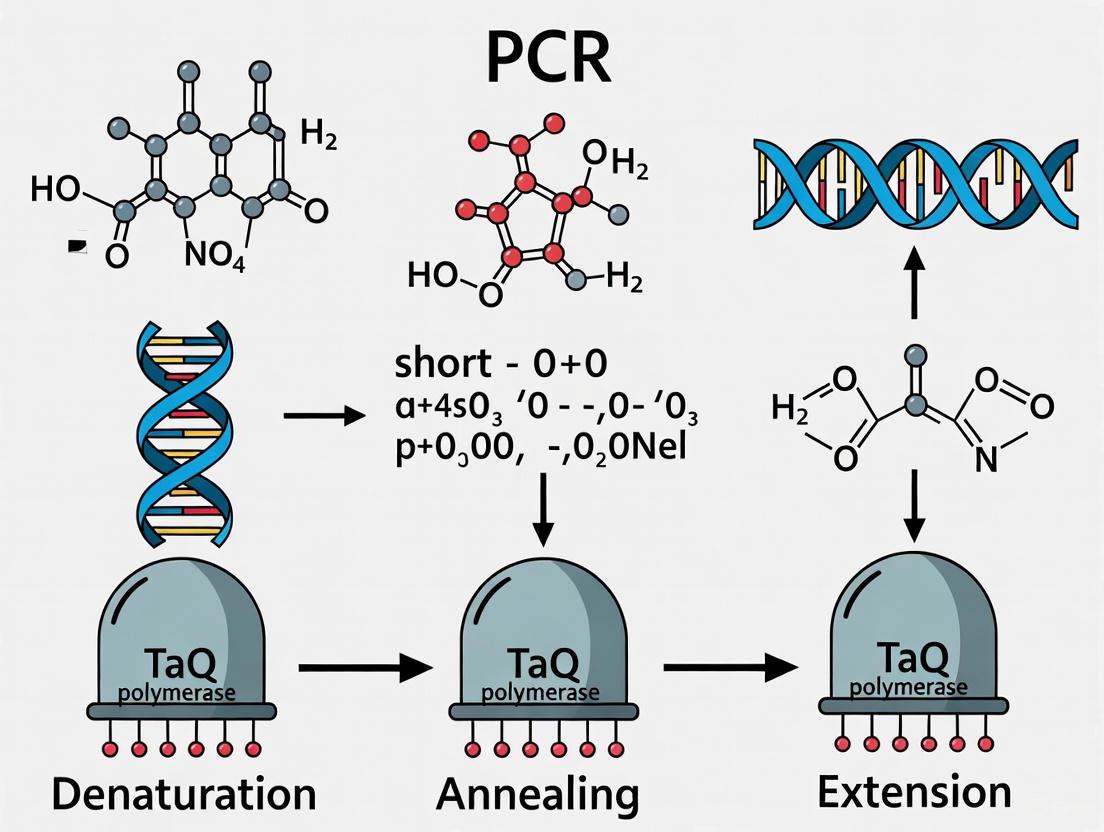
The following workflow diagram illustrates the iterative nature of the PCR process and its exponential amplification outcome:
Evolution of PCR Technologies
The fundamental PCR methodology has undergone substantial technological evolution, giving rise to specialized formats that address specific research and diagnostic needs. The table below summarizes the key characteristics of major PCR generations and variants:
Table 1: Evolution of PCR Technologies and Their Key Characteristics
| Technology | Primary Application | Quantification Capability | Key Advancement | Sensitivity |
|---|---|---|---|---|
| Conventional PCR | DNA amplification, endpoint analysis | Qualitative/Semi-quantitative | Thermocycling with Taq polymerase | 1-100 ng DNA [1] |
| Quantitative Real-Time PCR (qPCR) | Gene expression, pathogen quantification | Relative quantification | Real-time fluorescence monitoring | High (detects <5-fold changes) [1] |
| Reverse Transcription PCR (RT-PCR) | RNA detection, gene expression analysis | Relative quantification | Reverse transcriptase for cDNA synthesis | High (detects low abundance mRNA) [1] |
| Digital PCR (dPCR) | Rare variant detection, absolute quantification | Absolute quantification | Sample partitioning & Poisson statistics | Single molecule detection [2] [4] |
| Nested PCR | Low abundance targets, high specificity | Qualitative | Two rounds with internal primers | Very High [2] |
| Multiplex PCR | Pathogen panels, genetic screening | Qualitative/Semi-quantitative | Multiple primer sets in one reaction | Variable [2] |
Quantitative Real-Time PCR (qPCR)
qPCR represents a significant advancement over conventional PCR by enabling monitoring of amplification progress in real-time through fluorescent detection systems. This technology utilizes either intercalating DNA dyes (e.g., SYBR Green) or sequence-specific fluorescent probes (e.g., TaqMan) to generate signals proportional to the amount of amplified DNA [1]. The key analytical parameter in qPCR is the quantification cycle (Cq), defined as the number of cycles required for the fluorescence to cross a threshold value above background. Cq values are inversely proportional to the initial template amount, allowing for relative quantification when compared to reference genes [1]. During the COVID-19 pandemic, RT-PCR served as the primary diagnostic method due to its high sensitivity, specificity, and rapid turnaround time for detecting SARS-CoV-2 [1].
Digital PCR (dPCR)
dPCR represents the third generation of PCR technology and enables absolute quantification of nucleic acids without the need for standard curves. This technique works by partitioning a single PCR reaction into thousands of individual microreactions, with some partitions containing one or more target molecules and others containing none [4]. After endpoint amplification, the fraction of negative partitions is counted and the initial target concentration is calculated using Poisson statistics [4]. A recent 2025 study demonstrated that dPCR outperformed qPCR for quantifying periodontal pathobionts, showing superior sensitivity and precision, particularly effective in detecting low-level bacterial loads [4]. dPCR's partitioning-based principle improves precision, suitability for multiplex analyses, and detection of low abundant targets within complex clinical samples [4].
Advanced Methodologies and Experimental Protocols
Standard PCR Protocol
A basic PCR protocol utilizing Taq DNA polymerase follows these standardized steps [3]:
Reaction Setup:
- Combine in a PCR tube:
- 10× Reaction Buffer: 5 µL
- dNTP Mix (10 mM each): 1 µL
- Forward Primer (10 µM): 1 µL
- Reverse Primer (10 µM): 1 µL
- Template DNA: 1 µL (1-100 ng)
- Taq DNA Polymerase: 0.5 µL (2.5 units)
- MgCl₂ (if required): Variable concentration
- Nuclease-free water: to 50 µL total volume
- Combine in a PCR tube:
Thermal Cycling:
- Initial Denaturation: 95°C for 2-5 minutes
- 25-35 cycles of:
- Denaturation: 95°C for 30 seconds
- Annealing: 55-65°C (primer-specific) for 30 seconds
- Extension: 72°C for 1 minute per kb of amplicon
- Final Extension: 72°C for 5-10 minutes
- Hold: 4°C indefinitely
Product Analysis:
- Analyze amplified DNA by agarose gel electrophoresis (1.5-2% agarose)
- Visualize using ethidium bromide or other DNA stains under UV light [3]
Digital PCR Experimental Workflow
The protocol for digital PCR involves additional steps for sample partitioning and analysis [4]:
Reaction Mixture Preparation:
- Prepare 40 µL reaction mixture containing:
- 10 µL of sample DNA
- 10 µL of 4× Probe PCR Master Mix
- 0.4 µM of each specific primer
- 0.2 µM of each specific probe
- Optional restriction enzyme (e.g., 0.025 U/µL Anza 52 PvuII)
- Nuclease-free water to volume
- Prepare 40 µL reaction mixture containing:
Partitioning and Amplification:
- Transfer reaction mixture to nanoplate (e.g., QIAcuity Nanoplate 26k)
- Instrument performs automatic partitioning into ~26,000 partitions
- Thermal cycling conditions:
- Initial activation: 2 minutes at 95°C
- 45 amplification cycles of: 15 seconds at 95°C, 1 minute at 58°C
Imaging and Data Analysis:
- Endpoint fluorescence imaging across multiple channels
- Count positive and negative partitions using thresholding software
- Calculate absolute concentration using Poisson statistics [4]
The following workflow illustrates the dPCR process and its advantage in absolute quantification:
Research Reagent Solutions
Table 2: Essential Research Reagents for PCR-Based Experiments
| Reagent/Category | Function | Application Notes |
|---|---|---|
| Taq DNA Polymerase | DNA synthesis during amplification | Thermostable; 5'→3' polymerase activity; requires Mg²⁺ cofactor [3] |
| Reverse Transcriptase | Synthesizes cDNA from RNA templates | Essential for RT-PCR; derived from retroviruses [1] |
| dNTP Mix | Nucleotide substrates for DNA synthesis | Balanced solution of dATP, dCTP, dGTP, dTTP (10 mM each) [3] |
| Sequence-Specific Primers | Target recognition and amplification initiation | Typically 20-25 nucleotides; designed with similar Tm [1] |
| Fluorescent Probes/Dyes | Detection of amplified products | Hydrolysis probes (TaqMan) or intercalating dyes (SYBR Green) [1] |
| MgCl₂ Solution | Cofactor for polymerase activity | Concentration optimization critical (1.5-4.0 mM) [3] |
| Restriction Enzymes | Reduce nonspecific amplification in dPCR | e.g., Anza 52 PvuII used in dPCR protocols [4] |
Current Research Applications and Technological Advancements
Clinical Diagnostics and Disease Monitoring
PCR technologies have become indispensable in clinical diagnostics, enabling rapid detection and quantification of pathogens with high sensitivity and specificity. qPCR and dPCR are extensively used for:
- Infectious Disease Detection: Identification and viral load monitoring for pathogens including HIV, hepatitis B and C, SARS-CoV-2, human papillomavirus, and herpes simplex virus, with sensitivity often exceeding 99% for viruses like HIV [1] [5].
- Cancer Biomarker Analysis: Detection of rare mutations in cancer biopsy samples, quantification of copy number variations, and identification of genetic markers for cancer diagnosis and monitoring. dPCR is particularly valuable for detecting minor DNA targets like point mutations and chromosomal translocations [5].
- Non-Invasive Prenatal Testing (NIPT): qPCR is used in NIPT to identify chromosomal abnormalities in fetuses with high accuracy (>99%) [5].
- Antibiotic Resistance Profiling: Rapid detection of antibiotic-resistant strains including Staphylococcus aureus, Staphylococcus epidermidis, Helicobacter pylori, and Enterococcus [1].
Biotechnology and Research Innovations
Recent advancements in PCR technology have focused on enhancing speed, sensitivity, and applicability across diverse fields:
- Microfluidic PCR Platforms: Development of continuous-flow PCR, oscillating-flow PCR, and natural convective PCR systems that enable rapid thermal cycling and miniaturization of reactions [2].
- Photonic PCR: Utilization of photothermal effects to accelerate thermal cycling, significantly reducing thermal inertia and enabling ultrafast amplification with lower energy consumption [2].
- AI-Enhanced Analysis: Integration of machine vision and neural networks in digital PCR systems to enhance the accuracy of positive microchamber identification in chip-based analyses [2].
- Deep Learning for Amplification Efficiency Prediction: Implementation of one-dimensional convolutional neural networks (1D-CNNs) to predict sequence-specific amplification efficiencies based on sequence information alone, addressing non-homogeneous amplification in multi-template PCR reactions [6].
Market Trends and Adoption
The global quantitative PCR (qPCR) market is experiencing robust growth, estimated at $5 billion in 2025 and projected to exhibit a Compound Annual Growth Rate (CAGR) of 7-8% from 2025 to 2033, reaching an estimated market value of approximately $8.5-9 billion by 2033 [7]. Key drivers include:
- Increasing prevalence of infectious diseases and demand for rapid diagnostics
- Rising adoption in personalized medicine and targeted therapies
- Expansion into food safety and environmental monitoring applications
- Continuous technological innovations leading to improved sensitivity and automation [7] [5]
North America currently holds the major market share due to strong research infrastructure, high adoption rates in clinical diagnostics, and presence of leading diagnostics companies [5].
Future Perspectives and Emerging Trends
The evolution of PCR technology continues with several emerging trends shaping its future applications:
- Integration with CRISPR Technologies: Combining dPCR, qPCR, and CRISPR systems is ushering in the era of genomic medicine, providing customized therapies at the molecular level [5].
- Point-of-Care Testing (POCT): Development of portable, automated PCR platforms for rapid on-site diagnosis outside central laboratories, significantly reducing detection time and operational complexity [2].
- Digital PCR Advancements: New dPCR systems with enhanced multiplexing capabilities and improved sensitivity for detecting trace amounts of specific DNA and RNA targets not typically detectable by conventional PCR methods [5].
- Single-Cell Analysis: Application of dPCR and advanced qPCR techniques for gene expression analysis at the single-cell level, enabling unprecedented resolution in cellular heterogeneity studies [2].
- Artificial Intelligence Integration: AI-powered software for improved data analysis and interpretation, with deep learning models being employed to predict sequence-specific amplification efficiencies and optimize experimental outcomes [7] [6].
The continued innovation in PCR technologies ensures their central role in advancing precision medicine, with future developments focusing on integration of speed, sensitivity, and multifunctionality, ultimately shifting PCR from a specialized laboratory tool to a distributed diagnostic platform accessible across diverse healthcare settings [2].
The Polymerase Chain Reaction (PCR) is a foundational technique in molecular biology, serving as a cornerstone for a vast array of applications from basic research to clinical diagnostics. Introduced by Kary Mullis in 1985, for which he was later awarded the Nobel Prize in Chemistry, PCR is a laboratory nucleic acid amplification technique that enables the precise detection and synthesis of millions to billions of copies of a specific DNA sequence from a minimal sample [1]. This in-depth technical guide deconstructs the core thermal cycling process—denaturation, annealing, and extension—framed within the broader thesis that a meticulous understanding of these parameters is fundamental to the rigor, reproducibility, and success of all subsequent PCR-based amplification research.
The Core Principles of PCR Amplification
At its essence, PCR is a cyclic, enzyme-driven reaction that mimics DNA replication in vitro. The process relies on the activity of a thermostable DNA polymerase, most commonly Taq polymerase isolated from Thermus aquaticus, which can withstand the repeated high temperatures required [1] [8]. The amplification is primed by short, single-stranded DNA sequences (primers) that are complementary to and flank the target region of interest within the template DNA [8].
The power of PCR lies in its exponential amplification. Each cycle of denaturation, annealing, and extension theoretically doubles the amount of the target DNA sequence. Typically, after 25 to 40 cycles, this results in a millions- or even billions-fold amplification of the target fragment [8]. This exponential growth eventually plateaus as reagents are consumed, DNA polymerase activity decreases, and by-products accumulate [1] [8]. The number of cycles is therefore a critical consideration; while more cycles (up to ~40) may be needed for low-abundance targets, exceeding ~45 cycles often leads to the accumulation of nonspecific products [9].
Deconstructing the PCR Thermal Cycle
The PCR process is facilitated by a thermal cycler, which automates the precise temperature changes required for each step. A standard PCR cycle is broken down into three fundamental steps, each with a distinct biochemical purpose.
Step 1: Denaturation
The cycle begins with the denaturation phase, where the reaction mixture is heated to a high temperature, typically between 94°C and 98°C, for 0.5 to 2 minutes in each subsequent cycle [9]. During this step, the high thermal energy disrupts the hydrogen bonds holding the double-stranded DNA template together, causing it to separate into two single strands. This provides the necessary single-stranded templates for the primers to bind in the next step. The initial denaturation at the start of the PCR run is often longer (1-3 minutes) to ensure complete separation of all template molecules and to activate hot-start DNA polymerases [9]. Template DNA with high GC content (>65%) may require longer denaturation times or higher temperatures due to the stronger triple hydrogen bonding between G and C bases [9].
Step 2: Annealing
Following denaturation, the temperature is lowered to the annealing temperature, which typically ranges from 45°C to 60°C for 30 to 60 seconds [8]. This cooling allows the forward and reverse primers to hydrogen-bond (anneal) to their complementary sequences on the single-stranded template DNA, flanking the target region. The annealing temperature is a critical parameter for reaction specificity and must be optimized. It is determined based on the melting temperature (Tm) of the primers, often starting 3-5°C below the lowest Tm of the primer pair [9]. Using an annealing temperature that is too low can result in nonspecific primer binding and spurious amplification products, while a temperature that is too high may yield little to no product [9].
Step 3: Extension
The final step is extension (or elongation), where the temperature is raised to the optimal working temperature for the DNA polymerase, generally 70°C to 75°C for 20 to 60 seconds per cycle [9] [8]. During this phase, the DNA polymerase synthesizes a new DNA strand complementary to the template strand by adding nucleotides (dNTPs) to the 3' end of the annealed primer, extending it in the 5' to 3' direction. The extension time depends on the length of the amplicon and the synthesis rate of the polymerase; for example, Taq polymerase typically requires 1 minute per kilobase, while a high-fidelity enzyme like Pfu may require 2 minutes per kilobase [9] [8]. A final extension step of 5-15 minutes is often added after the last cycle to ensure all amplicons are fully synthesized [9] [8].
The following diagram illustrates the cyclical and exponential nature of this three-step process.
The table below summarizes the key quantitative parameters for each step of a standard PCR cycle, providing a reference for experimental design.
Table 1: Standard PCR Cycling Parameters for a Three-Step Protocol [1] [9] [8]
| PCR Step | Temperature Range (°C) | Time Range | Key Function | Critical Influencing Factors |
|---|---|---|---|---|
| Initial Denaturation | 94–98 | 1–3 minutes | Separates dsDNA; activates enzyme | Template complexity (e.g., genomic DNA), GC content |
| Denaturation (Cyclic) | 94–98 | 0.5–2 minutes | Separates newly formed dsDNA | GC content, buffer salt concentration |
| Annealing | 45–60 | 30–60 seconds | Primer binding to template | Primer Tm, specificity, presence of co-solvents (DMSO) |
| Extension | 70–75 | 20–60 sec/kb | DNA synthesis by polymerase | Amplicon length, polymerase synthesis rate |
| Final Extension | 70–75 | 5–15 minutes | Completes all amplicons | Amplicon length and composition; A-tailing for cloning |
The Scientist's Toolkit: Essential PCR Reagents
A successful PCR reaction requires a precise master mix of several key components, each playing a vital role in the amplification process [8].
Table 2: Essential Components of a PCR Master Mix [1] [8]
| Reagent | Function | Typical Concentration/Type |
|---|---|---|
| Template DNA | The target DNA sequence to be amplified. | Genomic DNA, cDNA, or plasmid DNA (1-100 ng). |
| DNA Polymerase | Enzyme that synthesizes new DNA strands. | Thermostable (e.g., Taq, Pfu); choice affects fidelity and speed. |
| Forward/Reverse Primers | Short DNA sequences that define the start and end of the target. | 20-25 nucleotides; sequence-specific to the target. |
| Deoxynucleotides (dNTPs) | The building blocks (A, T, C, G) for new DNA strands. | Equal concentrations of dATP, dCTP, dGTP, dTTP. |
| Buffer Solution | Provides optimal chemical environment for the polymerase. | pH 8.0-9.5; may contain salts and additives. |
| Magnesium Chloride (MgCl₂) | Essential cofactor for DNA polymerase activity; stabilizes primer binding. | Concentration requires optimization (e.g., 1.5-2.5 mM). |
| PCR-Grade Water | Nuclease-free water to bring the reaction to volume. | Certified free of contaminants and inhibitors. |
Advanced Methodologies: Experimental Protocols for PCR Optimization
To ensure robust and specific amplification, researchers must optimize key parameters. The following protocols detail established methodologies for this purpose.
Protocol for Annealing Temperature Optimization
Objective: To determine the optimal annealing temperature for a primer set to maximize specific product yield and minimize nonspecific amplification [9].
- Reaction Setup: Prepare a master mix containing all standard PCR components—buffer, dNTPs, MgCl₂, DNA polymerase, template DNA, and forward/reverse primers. Aliquot the master mix into multiple PCR tubes or a multi-well plate.
- Gradient Programming: Use a thermal cycler with a gradient function. Set a temperature gradient across the block that spans a range, for example, from 5°C below to 5°C above the calculated average Tm of the primers.
- PCR Amplification: Run the standard three-step PCR protocol with the denaturation and extension steps held constant, while the annealing step uses the predefined temperature gradient for 30-60 seconds across all wells.
- Product Analysis: Analyze the PCR products using agarose gel electrophoresis. Visualize the DNA bands under UV light.
- Result Interpretation: The optimal annealing temperature is identified as the highest temperature within the gradient that produces a single, intense band of the expected size. Higher temperatures generally enhance specificity [9].
Protocol for Cycle Number Determination
Objective: To establish the minimum number of PCR cycles required to generate sufficient product while avoiding the plateau phase, which can bias results and reduce reproducibility [9].
- Experimental Setup: Set up multiple identical PCR reactions with the same master mix and template.
- Amplification and Sampling: Place all reaction tubes in the thermal cycler. At the end of cycles 25, 30, 35, 40, and 45, carefully remove one tube from the cycler. (Note: This may require pausing the cycler, which can affect efficiency. Alternative strategies include setting up separate, identical reactions programmed for different final cycle numbers).
- Analysis: Analyze all samples simultaneously by agarose gel electrophoresis and/or quantitative methods like spectrophotometry.
- Result Interpretation: The ideal cycle number is in the linear phase of amplification, just before the yield increase begins to plateau. This is indicated by a strong, specific band that does not increase significantly with additional cycles and shows no signs of nonspecific products at higher cycle numbers [9].
Evolution of PCR: Key Variants and Applications
The fundamental three-step cycle has been adapted and enhanced to serve diverse research and diagnostic purposes, significantly expanding the utility of PCR.
- Real-Time Quantitative PCR (qPCR): This technique allows for the quantification of DNA amplification in real-time as the reaction occurs, rather than only at the end. It utilizes fluorescent dyes (intercalating or probe-based) and a thermal cycler equipped with a fluorescence detector. A key output is the Cycle Threshold (Cq), which correlates inversely with the initial amount of target template [1] [8]. qPCR is the gold standard for gene expression analysis, pathogen load quantification, and was pivotal in diagnostics during the COVID-19 pandemic [1] [10].
- Reverse Transcription PCR (RT-PCR): This method is used to amplify RNA targets. It involves an initial step where the RNA template is first converted into complementary DNA (cDNA) using the enzyme reverse transcriptase. This cDNA then serves as the template for a standard PCR amplification, enabling the study of gene expression and RNA viruses [1] [8].
- Digital Droplet PCR (ddPCR): A more recent and highly precise variant, ddPCR partitions a sample into thousands of nanoliter-sized droplets. Each droplet acts as an individual PCR reaction. After amplification, the droplets are analyzed for fluorescence to provide an absolute count of target molecules without the need for a standard curve, offering superior precision for detecting rare mutations and copy number variations [8].
The logical relationships and workflow selection between these core PCR types are depicted below.
The deconstruction of the PCR cycle into its core components—denaturation, annealing, and extension—reveals a process of elegant simplicity yet profound depth. Each parameter, from temperature and timing to reagent composition and cycle number, is a critical variable that directly influences the efficiency, specificity, and yield of amplification. A thorough and nuanced understanding of these principles is not merely an academic exercise; it is the bedrock of experimental rigor in molecular biology. As PCR continues to evolve into more sophisticated forms like qPCR and ddPCR, the foundational knowledge of its cyclic mechanism remains the essential framework upon which reliable, reproducible, and impactful scientific research is built.
The Polymerase Chain Reaction (PCR) represents a cornerstone technology in molecular biology, enabling the exponential amplification of specific DNA sequences from minimal starting material. First developed by Kary Mullis in the 1980s, this technique has revolutionized biomedical research, clinical diagnostics, and drug development [1] [11]. The power of PCR hinges on the precise interplay of core biochemical components that work in concert to replicate target DNA sequences through repeated thermal cycling. Within the context of PCR amplification research, understanding the function, optimization, and interaction of these essential elements—template DNA, primers, DNA polymerase (such as Taq polymerase), and deoxynucleoside triphosphates (dNTPs)—is fundamental to experimental success [12] [11]. This technical guide provides an in-depth examination of these critical components, offering detailed methodologies and quantitative data to inform research practices and protocol development for scientists and drug development professionals.
Core Components of PCR Amplification
Template DNA
Template DNA serves as the foundational blueprint for amplification, providing the specific sequence that will be copied exponentially during the PCR process. The template can originate from various sources, including genomic DNA (gDNA), complementary DNA (cDNA), plasmid DNA, or previously amplified PCR products [12]. The composition and complexity of the DNA source significantly influence the optimal input amounts required for efficient amplification. For instance, while only 0.1–1 ng of plasmid DNA is typically sufficient, 5–50 ng of the more complex gDNA may be required in a standard 50 µL reaction [12]. This disparity reflects the differing sequence complexity and target accessibility between these DNA sources.
The quality and purity of the template DNA are equally critical. Impurities such as proteins, RNA, or chemical contaminants can inhibit polymerase activity and compromise amplification efficiency [13]. Traditional DNA extraction methods often employ SDS to disrupt cellular membranes and protease K to digest DNA-binding proteins, followed by organic solvent purification (e.g., phenol-chloroform) and alcohol precipitation to yield pure DNA suitable for PCR [13]. In clinical settings where rapid turnaround is essential, simplified extraction methods that lyse pathogens and remove inhibitory proteins enable direct PCR amplification without extensive purification [13]. For RNA templates, which require conversion to cDNA before amplification, guanidine isothiocyanate or protease K methods are commonly employed, with strict RNase control to preserve RNA integrity [13].
Table 1: Template DNA Requirements for PCR Amplification
| Template Type | Recommended Amount (50 µL reaction) | Key Considerations |
|---|---|---|
| Plasmid DNA | 0.1–1 ng | Low complexity, high copy number |
| Genomic DNA (gDNA) | 5–50 ng | High complexity, single copy targets |
| cDNA | 1–10 ng | Dependent on original mRNA abundance |
| PCR Products | Diluted 1:10–1:1000 | Purification recommended to remove carryover reagents |
Theoretical considerations suggest that under ideal conditions, a single copy of DNA could suffice for amplification [12]. In practice, however, amplification efficiency depends heavily on reaction components, parameters, and DNA polymerase sensitivity. Furthermore, the DNA polymerase itself should be certified for controlled low levels of residual DNA to minimize false-positive signals in sensitive applications [12].
Primers
PCR primers are synthetic, single-stranded DNA oligonucleotides, typically 15–30 nucleotides in length, that are designed to bind flanking sequences of the target region through complementary base pairing [12] [14]. These molecules provide the free 3'-hydroxyl group required by DNA polymerases to initiate DNA synthesis, thereby defining the exact start and end points of the amplification product [11] [14]. A standard PCR utilizes two primers—a forward and a reverse primer—oriented on opposite DNA strands, effectively "bookending" the target sequence to be amplified [14]. The distance between these primers determines the size of the final amplicon, which typically ranges from hundreds to several thousand base pairs for most applications [14].
Primer design represents a critical factor in PCR specificity and efficiency. Optimal primers adhere to several key parameters: they should exhibit melting temperatures (Tm) between 55–70°C, with less than 5°C difference between the primer pair; possess GC content of 40–60% with uniform nucleotide distribution; and be devoid of self-complementarity, significant secondary structure, or complementarity to each other (particularly at 3' ends) to prevent primer-dimer formation and mispriming [12] [13] [15]. The 3' end of the primer is especially critical—it should avoid more than three consecutive G or C bases to minimize nonspecific priming, yet the inclusion of a single G or C nucleotide can promote beneficial "anchoring" and extension [12] [15].
Table 2: Primer Design Guidelines and Optimization Parameters
| Parameter | Optimal Range/Characteristic | Impact on PCR |
|---|---|---|
| Length | 15–30 nucleotides | Specificity and binding efficiency |
| Melting Temperature (Tm) | 55–70°C (within 5°C for pair) | Annealing temperature optimization |
| GC Content | 40–60% | Stability of primer-template binding |
| 3' End Sequence | Avoid >3 G/C; preferably ends with C or G | Specificity and priming efficiency |
| Secondary Structures | No self-complementarity or hairpins | Prevents failed amplification |
| Concentration | 0.1–1 µM | Balance between yield and specificity |
In practice, primers are typically used at concentrations ranging from 0.1–1 µM in the reaction mix [12]. Higher concentrations may increase nonspecific amplification and primer-dimer formation, while lower concentrations can reduce target yield or prevent amplification entirely [12]. For specialized applications such as PCR cloning, non-template sequences including restriction sites or promoter sequences can be incorporated as 5' extensions without significantly impacting amplification efficiency [12].
DNA Polymerase
DNA polymerase is the enzymatic workhorse of PCR, responsible for synthesizing new DNA strands complementary to the template by incorporating nucleotides in a 5' to 3' direction [12] [13]. The discovery and implementation of thermostable DNA polymerases, beginning with Taq DNA polymerase isolated from Thermus aquaticus, revolutionized PCR technology by enabling automated thermal cycling without the need for enzyme replenishment after each denaturation step [1] [16] [13]. Taq polymerase exhibits a half-life of approximately 40 minutes at 95°C, incorporates nucleotides at a rate of about 60 bases per second at 70°C, and can typically amplify targets up to 5 kb in length, making it suitable for standard PCR applications [12] [13].
Modern PCR utilizes DNA polymerases with enhanced characteristics engineered for improved performance. Four key properties define polymerase functionality:
- Specificity: Refers to the enzyme's ability to amplify only the intended target. Nonspecific amplification can be minimized through "hot start" technology, where polymerase activity is chemically or immunologically inhibited until the initial high-temperature denaturation step, preventing primer-dimer formation and mispriming during reaction setup [16].
- Thermostability: Critical for withstanding repeated denaturation temperatures. While Taq polymerase is sufficiently stable for many applications, enzymes from hyperthermophilic archaea like Pyrococcus furiosus (Pfu polymerase) offer greater stability, with Pfu being approximately 20 times more stable than Taq at 95°C [16].
- Fidelity: Represents the accuracy of DNA replication. Proofreading DNA polymerases possess 3'→5' exonuclease activity that corrects misincorporated nucleotides, resulting in significantly lower error rates. High-fidelity enzymes are essential for applications like cloning, sequencing, and mutagenesis [16].
- Processivity: Defines the number of nucleotides incorporated per enzyme binding event. Highly processive polymerases are advantageous for amplifying long templates, GC-rich sequences, and targets with secondary structures, as well as for reactions containing PCR inhibitors [16].
Table 3: DNA Polymerase Characteristics and Applications
| Characteristic | Impact on PCR Performance | Application Considerations |
|---|---|---|
| Specificity (Hot-Start) | Reduces nonspecific amplification and primer-dimers | Essential for high-throughput and sensitive detection assays |
| Thermostability | Determines resistance to prolonged high temperatures | Critical for GC-rich templates and complex secondary structures |
| Fidelity (Proofreading) | Lower error rates in amplified sequences | Required for cloning, sequencing, and functional studies |
| Processivity | Efficiency in amplifying long or difficult templates | Important for long-range PCR and inhibitor-tolerant reactions |
In a typical 50 µL reaction, 1–2 units of DNA polymerase are generally sufficient, though difficult templates or the presence of inhibitors may require adjustment of enzyme concentration [12]. However, excessive enzyme amounts can promote nonspecific amplification [12].
Deoxynucleoside Triphosphates (dNTPs)
Deoxynucleoside triphosphates (dNTPs)—consisting of dATP, dCTP, dGTP, and dTTP—serve as the essential building blocks for DNA synthesis, providing both the nucleotides for chain elongation and the energy required for polymerization through their high-energy phosphate bonds [17] [15]. These components are typically added to PCR reactions in equimolar concentrations to ensure balanced incorporation into the newly synthesized DNA strands [12] [18]. The recommended final concentration for each dNTP in standard PCR applications is generally 0.2 mM, though this may be optimized based on specific reaction conditions and requirements [12] [13].
The concentration of dNTPs requires careful optimization, as both excessive and insufficient amounts can inhibit PCR. High dNTP concentrations can be inhibitory, while concentrations below approximately 0.010–0.015 mM (the estimated Km for these substrates) can limit polymerization efficiency [12]. Furthermore, dNTPs interact with other reaction components, particularly magnesium ions (Mg²⁺), which serve as essential cofactors for DNA polymerase and form complexes with dNTPs that reduce their effective availability [12] [13]. This interaction necessitates balancing dNTP and Mg²⁺ concentrations—when dNTP concentrations are increased, Mg²⁺ concentrations may also need adjustment to maintain optimal reaction conditions [12].
dNTP solutions are inherently acidic and require neutralization (typically to pH 7.0–7.5 with NaOH or Tris) for stable long-term storage at -20°C [13] [15]. Repeated freeze-thaw cycles should be avoided to prevent degradation, and small aliquots are recommended for frequent use [13]. For applications demanding high sensitivity, "PCR-grade" dNTPs with exceptional purity (>99%) and minimal contaminating dNDPs (<0.9%) can improve amplification efficiency, particularly for low-copy-number targets [18].
Modified dNTPs find utility in specialized applications. For example, dUTP can substitute for dTTP in conjunction with uracil DNA glycosylase (UDG) pretreatment to prevent carryover contamination from previous PCR products [12]. Similarly, biotinylated, fluorescently labeled, or other modified dNTPs can be incorporated to facilitate downstream detection, capture, or analysis of amplified products, though compatibility with the specific DNA polymerase must be verified [12] [18].
Experimental Protocols and Methodologies
Optimization of PCR Components: A Stepwise Experimental Approach
Objective: To systematically optimize the concentration of Mg²⁺, dNTPs, and primers for the amplification of a specific target sequence. Background: The efficiency and specificity of PCR amplification are highly dependent on the balanced interaction of reaction components. Magnesium ions (Mg²⁺) serve as essential cofactors for DNA polymerase activity and facilitate primer-template binding [12] [13]. However, Mg²⁺ also binds to dNTPs, reducing their effective concentration [12]. This protocol outlines a multivariate approach to establish optimal conditions for a novel PCR assay.
Materials and Reagents:
- Template DNA (e.g., 10-50 ng genomic DNA)
- Forward and reverse primers (100 µM stock solutions)
- Taq DNA polymerase with recommended 10X reaction buffer
- dNTP mix (10 mM each)
- MgCl₂ solution (25 mM)
- Molecular biology grade water
- Thermal cycler
- Agarose gel electrophoresis equipment
Methodology:
- Primer Optimization:
- Prepare a master mix containing fixed concentrations of template DNA, DNA polymerase, dNTPs, and Mg²⁺.
- Aliquot the master mix and add forward and reverse primers to achieve final concentrations of 0.1, 0.3, 0.5, 0.7, and 1.0 µM.
- Perform amplification using standard cycling conditions.
- Analyze products by agarose gel electrophoresis to identify the primer concentration yielding the highest specific product intensity with minimal primer-dimer formation.
dNTP Titration:
- Using the optimal primer concentration determined above, prepare reactions containing each dNTP at concentrations of 0.05, 0.1, 0.2, 0.3, and 0.5 mM.
- Maintain a constant Mg²⁺ concentration (e.g., 1.5 mM) initially.
- Perform amplification and analyze results to identify the dNTP concentration producing maximal yield without nonspecific amplification.
Mg²⁺ Concentration Optimization:
- Using the optimized primer and dNTP concentrations, prepare reactions containing MgCl₂ at concentrations of 0.5, 1.0, 1.5, 2.0, 3.0, and 4.0 mM.
- Perform amplification and analyze products to determine the Mg²⁺ concentration yielding the strongest specific amplification.
Expected Outcomes: The optimal conditions will produce a single, intense band of the expected size on an agarose gel, with minimal to no nonspecific products or primer-dimers. The relationship between components is often interactive; therefore, final validation using all optimized parameters together is essential.
Assessment of DNA Polymerase Fidelity
Objective: To evaluate the fidelity of a DNA polymerase using a lacZ-based blue/white colony screening assay. Background: PCR fidelity refers to the accuracy of DNA sequence replication, typically expressed as the error rate (number of misincorporated nucleotides per total nucleotides synthesized) [16]. DNA polymerases with proofreading activity (3'→5' exonuclease) generally exhibit higher fidelity than non-proofreading enzymes.
Materials and Reagents:
- Test DNA polymerases (e.g., standard Taq vs. high-fidelity enzyme)
- lacZ gene fragment in plasmid vector
- Competent E. coli cells
- LB agar plates containing appropriate antibiotic and X-Gal
- Standard PCR components
Methodology:
- Amplify the lacZ gene fragment using the test DNA polymerases under recommended conditions.
- Purify the PCR products and clone them into a suitable vector system.
- Transform competent E. coli cells with the recombinant plasmids and plate on LB agar containing X-Gal.
- Incubate plates and count the number of blue (functional LacZ) and white (mutated LacZ) colonies.
- Calculate the error rate using the formula: Error rate = (number of white colonies / total colonies) / (length of amplified fragment in base pairs).
Expected Outcomes: A high-fidelity DNA polymerase will produce a higher percentage of blue colonies, indicating correct amplification of the lacZ sequence, and consequently will have a lower calculated error rate compared to a standard fidelity enzyme.
Schematic Representation of PCR Component Interactions
PCR Mechanism and Component Roles
Research Reagent Solutions
Table 4: Essential Reagents for PCR Amplification Research
| Reagent Category | Specific Product Examples | Research Applications | Technical Considerations |
|---|---|---|---|
| Hot-Start DNA Polymerases | Antibody-mediated hot-start Taq, Chemically modified hot-start enzymes | High-throughput screening, Diagnostic assay development, Cloning | Reduces nonspecific amplification; enables room-temperature setup [16] |
| High-Fidelity DNA Polymerases | Pfu polymerase, Engineered high-fidelity enzymes | Site-directed mutagenesis, Cloning, NGS library preparation | Lower error rates through 3'→5' proofreading activity [16] |
| PCR-Grade dNTPs | HPLC-purified dNTP mixes, Modified dNTPs (biotin-labeled, fluorescent) | Quantitative PCR, Sequencing, Probe-based detection | High purity (>99%) critical for sensitive applications; modified dNTPs require compatible polymerases [18] [15] |
| Optimized Primer Synthesis | HPLC-purified primers, Modified primers (biotin, fluorescent) | Probe-based assays, Cloning, Mutagenesis | Purification essential for long/modified primers; 5' modifications possible without affecting amplification [12] [15] |
| PCR Enhancers | Betaine, DMSO, BSA, Formamide | Difficult templates (GC-rich, secondary structure) | Betaine and DMSO improve amplification of GC-rich targets; BSA stabilizes polymerase against inhibitors [15] |
The meticulous selection and optimization of core PCR components—template DNA, primers, DNA polymerase, and dNTPs—form the foundation of successful amplification in research and diagnostic applications. Template quality and quantity establish the fundamental parameters for amplification feasibility, while precisely designed primers confer the requisite specificity to target the sequence of interest. The DNA polymerase choice dictates critical performance characteristics including fidelity, processivity, and tolerance to challenging templates, with modern engineered enzymes offering significant advantages over early PCR enzymes. Finally, dNTPs provide the essential building blocks for DNA synthesis, with their concentration and purity directly impacting both yield and accuracy. The interrelationship between these components, particularly the crucial balance between Mg²⁺ and dNTP concentrations, necessitates systematic optimization for each new assay. As PCR technologies continue to evolve, particularly in the realms of quantitative analysis and point-of-care diagnostics, the fundamental principles governing these core components remain essential knowledge for researchers and drug development professionals advancing molecular analysis techniques.
The Polymerase Chain Reaction (PCR) is a cornerstone technique of modern molecular biology, enabling the precise amplification of specific DNA sequences from minimal starting material. The successful execution of this enzymatic process is fundamentally dependent on the instrument that drives it: the thermal cycler [19]. For researchers and drug development professionals, a profound understanding of thermal cycler technology is not merely operational but foundational to experimental integrity. This instrument guarantees the exacting and repetitive temperature transitions that define PCR, directly influencing the specificity, sensitivity, and yield of the amplification process [19]. This guide provides an in-depth examination of thermal cycler instrumentation, its core principles, and its critical role in advancing PCR amplification research.
The Core Mechanism of PCR and Instrumental Demands
The PCR process consists of three fundamental steps that are repeated for 25-40 cycles, each requiring precise temperature control managed by the thermal cycler [19] [1].
Denaturation
The initial and highest temperature step involves the separation of the double-stranded DNA template into single strands, typically at 94–95 °C [19] [1]. High thermal energy overcomes the hydrogen bonds holding the complementary base pairs together. The thermal cycler must achieve and maintain this elevated temperature quickly and uniformly across all reaction vessels. Insufficient temperature or poor uniformity can lead to incomplete strand separation, resulting in poor amplification efficiency and yield [19].
Primer Annealing
Following denaturation, the temperature is rapidly lowered to allow short, single-stranded oligonucleotide primers to bind to their complementary sequences on the template DNA [19]. This annealing temperature is critical and typically ranges from 55 °C to 72 °C, optimized based on the primer's melting temperature (Tm) [1]. The precision of the thermal cycler during this step is paramount for assay specificity. Too high an annealing temperature prevents primer binding and reduces yield, while too low a temperature allows non-specific binding, leading to amplification of unintended products [19] [20].
Extension
In the final step, the temperature is raised to the optimum working temperature of the thermostable DNA polymerase (e.g., 72 °C for Taq polymerase) [19] [21]. The polymerase binds to the primer-template complex and synthesizes a new complementary DNA strand [19]. The duration of the extension step is proportional to the length of the target amplicon and the processivity of the enzyme [19] [20]. These three steps constitute one cycle, with the number of cycles determining the degree of amplification [19].
The following diagram illustrates the continuous relationship between these three steps and the corresponding performance of the thermal cycler:
Thermal Cycler Components and Performance Metrics
The operational performance of a thermal cycler is determined by its core components and their technical specifications, which directly impact the reliability and reproducibility of PCR results [19].
Essential Thermal Cycler Components
Table 1: Core Components of a Thermal Cycler
| Component | Function | Critical Performance Indicator |
|---|---|---|
| Peltier Elements | Solid-state heat pumps responsible for rapid and precise heating and cooling of the reaction block [19]. | Ramp Rate: Measured in °C/s (e.g., 4–6 °C/s for standard cyclers) [19]. |
| Thermal Block | The metal block (typically aluminum) that holds the reaction tubes or plates [19]. | Temperature Uniformity: Consistency across all wells (ideally ±0.5 °C) [19]. |
| Heated Lid | Maintains the temperature of the air immediately above the reaction liquid (usually >100 °C) [19]. | Condensation Prevention: Eliminates liquid evaporation from the sample tubes [19]. |
| Interface/Software | Provides programmability for complex protocols and data management [19]. | Gradient Functionality: Ability to set a linear temperature gradient across the block for rapid assay optimization [19]. |
Key Performance Metrics for Laboratory Workflows
For professional use, several metrics are evaluated to select a thermal cycler appropriate for specific laboratory workflows [19]:
- Temperature Accuracy: Refers to how closely the actual block temperature matches the programmed setpoint. High accuracy (typically ±0.25 °C) is non-negotiable for protocol consistency [19].
- Temperature Uniformity: This is a measure of the maximum temperature variance across the entire thermal block at any given moment. Poor uniformity can result in different wells completing amplification at different rates, compromising data comparability [19].
- Ramp Rate: The speed at which the thermal cycler transitions between temperatures. Faster ramp rates reduce overall run time and can increase reaction specificity by limiting the duration that reaction components are at suboptimal temperatures [19].
- Calibration and Maintenance: Regular calibration using certified temperature probes is essential to ensure continued accuracy. The professional laboratory must maintain rigorous documentation of all calibration and service activities [19].
Advanced PCR Applications and Corresponding Instrument Requirements
The fundamental cycling process has been adapted into several sophisticated methodologies, each placing specific demands on thermal cycler instrumentation.
Quantitative PCR (qPCR)
qPCR incorporates fluorescence reporters to monitor the accumulation of PCR products in real-time [19] [22]. The thermal cycler must provide highly stable and uniform temperatures to ensure consistent enzyme activity and fluorescence signal acquisition [19]. Furthermore, the instrument requires an integrated optical system—including an excitation light source and a detector—to measure fluorescence at the end of each extension step [19]. Data is interpreted using the cycle threshold (Cq), which is the cycle number at which the fluorescence crosses a defined threshold, correlating with the initial amount of target DNA [22] [23].
Reverse Transcription PCR (RT-PCR)
This protocol begins with a reverse transcription step, where the enzyme reverse transcriptase synthesizes a complementary DNA (cDNA) strand from an RNA template [19] [1]. Modern thermal cyclers must be capable of programming this extended, lower-temperature initial phase (typically 37–55 °C) before transitioning into the standard three-step cycling profile [19]. This method was crucial for COVID-19 diagnostics using SARS-CoV-2 RNA [1].
Digital PCR (dPCR)
dPCR represents a third evolution of PCR technology, based on the principle of compartmentalization [19]. A sample is partitioned into thousands of individual reactions, so that a target molecule is either present or absent in each one. The thermal cycler requirement is similar to qPCR but must be compatible with the partitioning mechanism (e.g., microfluidic chips or droplet generators). After endpoint PCR amplification, the fraction of positive reactions is counted to enable absolute quantification of the target nucleic acid without the need for a standard curve [19].
Experimental Protocols: From Standard to Advanced Methods
Standard PCR Protocol
A typical PCR reaction mixture includes template DNA, forward and reverse primers, thermostable DNA polymerase (e.g., Taq polymerase), dNTPs, and reaction buffer with magnesium ions [21].
Table 2: Standard PCR Reaction Setup
| Reagent | Function | Final Concentration/Amount |
|---|---|---|
| Template DNA | The DNA sequence to be amplified. | 1–100 ng (or 1–10 ng for plasmid DNA) [21]. |
| Forward & Reverse Primers | Short DNA sequences that define the start and end of the amplified region. | 0.1–1 µM each [21]. |
| Taq DNA Polymerase | Enzyme that synthesizes new DNA strands. | 0.5–2.5 units per 50 µL reaction [21]. |
| dNTP Mix | Building blocks (dATP, dCTP, dGTP, dTTP) for new DNA strands. | 200 µM each [21]. |
| PCR Buffer | Provides optimal pH and salt conditions for the enzyme. | 1X concentration (often supplied with MgCl₂) [21]. |
| Magnesium Chloride (MgCl₂) | Cofactor essential for DNA polymerase activity. | 1.5–2.0 mM (often requires optimization) [21]. |
Cycling Parameters for a Conventional Thermal Cycler [21]:
- Initial Denaturation: 94–95 °C for 2–5 minutes.
- Amplification (25–35 cycles):
- Denaturation: 94–95 °C for 30 seconds.
- Annealing: 55–72 °C for 30 seconds (temperature primer-specific).
- Extension: 72 °C for 1 minute per 1 kb of amplicon length.
- Final Extension: 72 °C for 5–10 minutes.
- Hold: 4–10 °C indefinitely.
Fast PCR and VPCR Protocol
To achieve faster PCR, cycling parameters can be modified. The "VPCR" method demonstrates that amplification can be completed during the dynamic heating and cooling process itself, omitting holding times [24]. A reaction using this protocol can save over two-thirds of the amplification time [24].
Sample VPCR Protocol for a 500 bp Amplicon [24]:
- Reagents: Use a highly processive DNA polymerase (e.g., KAPA2G Robust) for better efficiency with short contact times.
- Cycling Conditions:
- Denaturation: 94 °C for 0 seconds.
- Annealing/Extension: 60 °C for 0 seconds.
- Number of cycles: 30.
- Note: This method relies on the thermal cycler's ramp rate to control the time the reaction spends in each temperature transition phase. The successful amplification of a 500 bp fragment in under 17 minutes has been demonstrated using this approach [24].
The Scientist's Toolkit: Essential Research Reagent Solutions
Table 3: Key Reagents for PCR Experimentation
| Reagent / Kit | Specific Function | Application Context |
|---|---|---|
| Hot-Start DNA Polymerase | Enzyme modified to be inactive at room temperature, preventing non-specific amplification during reaction setup [20]. | Essential for high-specificity applications like multiplex PCR and assays with complex templates. |
| SYBR Green I Dye | Fluorescent intercalating dye that binds double-stranded DNA, allowing real-time detection of amplicon accumulation [22]. | qPCR for gene expression analysis; requires dissociation curve analysis to verify specificity. |
| TaqMan Probe | Sequence-specific oligonucleotide with a fluorescent reporter and quencher; fluorescence increases upon cleavage during amplification [22]. | qPCR for highly specific detection of single targets or multiple targets (multiplexing) with different colored dyes. |
| One-Step RT-PCR Kit | Combines reverse transcriptase and DNA polymerase in a single buffer, allowing cDNA synthesis and PCR in the same tube [22]. | Ideal for high-throughput RNA virus detection (e.g., SARS-CoV-2 testing) and gene expression from limited RNA samples. |
| GC-Rich Enhancer | Additives like DMSO or proprietary commercial solutions that help denature DNA templates with high GC content [20]. | Critical for amplifying difficult templates with GC content >65%, which form stable secondary structures. |
Emerging Trends and Future Directions
Thermal cycler technology continues to evolve in response to the demands of modern molecular biology. Key trends include:
- Miniaturization and Microfluidics: The use of miniaturized reaction chambers (e.g., chips or capillary tubes) drastically reduces thermal mass, allowing for ultra-fast ramp rates exceeding 10 °C/s and significantly reducing reaction volumes (down to nanoliters) and consumables costs [19].
- Automation and Integration: Next-generation thermal cyclers are designed with robotic plate handling features, standardized communication protocols, and a minimized footprint for seamless integration into automated laboratory workstations, which is critical for high-volume diagnostic and drug development pipelines [19].
- The Rise of Isothermal Amplification: While not replacing PCR, isothermal methods (e.g., LAMP, RPA) that amplify DNA at a single, constant temperature are gaining traction for certain applications. These methods eliminate the need for thermal cycling, potentially simplifying instrumentation, though they still require precise temperature control [19].
The thermal cycler is far more than a simple programmable heating block; it is the crucial guarantor of the precise and repeatable physical conditions that make specific DNA amplification possible [19]. For the research scientist or drug development professional, operational proficiency must extend beyond simply loading samples and starting a pre-programmed protocol. A comprehensive understanding of thermal cycler principles—including the critical roles of temperature uniformity, ramp rate, and block calibration—is fundamental to designing robust experiments, troubleshooting assays, and generating reliable, reproducible data. As PCR technology continues to advance with techniques like ultra-fast VPCR and highly multiplexed digital PCR, the instrumentation driving amplification will likewise evolve, maintaining its central role in the landscape of molecular biology research and diagnostic development.
The Polymerase Chain Reaction (PCR) stands as a cornerstone technique in molecular biology, enabling the exponential amplification of specific DNA sequences from minimal starting material. First developed by Kary Mullis in 1983, this enzymatic assay revolutionized biological science by allowing researchers to selectively amplify and detect target DNA fragments across diverse applications from clinical diagnostics to genomic research [25] [26]. The fundamental power of PCR lies in its ability to generate millions to billions of copies of a target DNA sequence through repeated thermal cycling, making previously undetectable sequences accessible for analysis and manipulation [26] [27].
Understanding the exponential nature of PCR amplification and the factors influencing amplicon yield is crucial for researchers across disciplines. The technique's exponential amplification occurs because the products of one cycle serve as templates in subsequent cycles, theoretically leading to a doubling of the target sequence with each cycle [26]. However, in practice, amplification efficiency is rarely 100%, and the reaction eventually reaches a plateau phase where product accumulation ceases [28]. This technical guide explores the core principles governing PCR amplification dynamics, focusing specifically on the relationship between cycle numbers and amplicon yield within the broader context of PCR amplification research.
The Mathematical Framework of Exponential Amplification
Theoretical Foundation and Efficiency Calculations
The fundamental principle of PCR is exponential amplification, where the number of amplicon copies theoretically doubles with each cycle. This relationship can be mathematically represented as:
N = N₀ × (1 + E)^n
Where:
- N = final number of amplicon copies
- N₀ = initial number of template copies
- E = amplification efficiency (ranging from 0 to 1, where 1 represents 100% efficiency)
- n = number of PCR cycles
In ideal conditions with 100% efficiency (E=1), the equation simplifies to N = N₀ × 2^n, demonstrating perfect doubling each cycle [29]. For example, a single DNA molecule amplified over 30 cycles would yield approximately 1.07 × 10^9 copies. However, in practice, amplification efficiency is typically below 100% due to various limiting factors, resulting in reduced final yields [30].
PCR efficiency is experimentally determined using a standard curve with known template concentrations. The efficiency is calculated from the slope of the standard curve using the formula:
PCR efficiency = [10^(-1/slope)] - 1
An ideal slope of -3.32 represents 100% efficiency, with values between -3.6 and -3.1 (90-110% efficiency) generally considered acceptable [30]. The quantification cycle (Cq) value, which represents the cycle number at which fluorescence exceeds background levels, is inversely proportional to the logarithm of the initial template concentration, forming the basis for this calculation [29].
Quantitative Yield Projections Across Cycles
The following table illustrates theoretical amplicon yield based on different amplification efficiencies and cycle numbers, starting from a single template copy:
Table 1: Theoretical Amplicon Yield Based on Efficiency and Cycle Number
| Cycle Number | 100% Efficiency (Copies) | 95% Efficiency (Copies) | 90% Efficiency (Copies) | 80% Efficiency (Copies) |
|---|---|---|---|---|
| 10 | 1,024 | 628 | 393 | 185 |
| 20 | 1.05 × 10^6 | 3.95 × 10^5 | 1.55 × 10^5 | 3.42 × 10^4 |
| 30 | 1.07 × 10^9 | 2.48 × 10^8 | 6.13 × 10^7 | 6.34 × 10^6 |
| 40 | 1.10 × 10^12 | 1.56 × 10^11 | 2.38 × 10^10 | 1.17 × 10^9 |
The significant divergence in yields across efficiency values highlights the critical importance of reaction optimization. For instance, after 30 cycles, a template with 80% efficiency produces nearly 40-fold fewer copies than one with 100% efficiency [29]. This efficiency directly impacts sensitivity in diagnostic applications and accuracy in quantitative studies.
Figure 1: Exponential Amplification Cycle in PCR. The process of denaturation, annealing, and extension repeats with each cycle, theoretically doubling the amplicon quantity each time. Critical temperature ranges for each step are based on standard laboratory protocols [9] [1] [31].
The Plateau Phase: Limiting Factors in Late-Stage Amplification
Mechanisms of Amplification Arrest
Despite the theoretical exponential nature of PCR, all reactions eventually reach a plateau phase where amplification efficiency declines and product accumulation ceases. Common explanations for this phenomenon include reagent depletion (dNTPs, primers, enzyme activity), competition between product reannealing and primer binding, and accumulation of inhibitors [28]. Experimental evidence challenges some conventional assumptions about the primary causes of plateau phase. Studies systematically evaluating these factors demonstrate that primer depletion constitutes a major limiting factor, rather than DNA polymerase inactivation or dNTP depletion [28]. This primer depletion is assay-dependent, influenced by primer design characteristics and the propensity for primer-dimer formation.
Product accumulation contributes to plateau through two mechanisms: (1) competition between primer annealing and product re-hybridization during the annealing step, and (2) blocking of DNA polymerase activity by double-stranded amplicons [28]. However, experiments adding non-target amplicons to reactions show that inhibition can be counteracted by increasing DNA polymerase concentration or extending annealing/extension times, suggesting product accumulation alone does not fully explain plateau formation [28].
Experimental Evidence on Plateau Causes
Table 2: Experimental Assessment of Proposed Plateau Phase Causes
| Proposed Cause | Experimental Evidence | Impact on Plateau |
|---|---|---|
| Primer depletion | Increased primer concentrations elevate both amplification rates and end-product yields [28] | High impact; assay-dependent based on primer characteristics |
| DNA polymerase inactivation | Thermostable polymerases retain significant activity beyond typical cycle numbers; adding fresh enzyme late in cycling provides minimal yield improvement [28] | Lower impact than traditionally assumed |
| dNTP depletion | No significant evidence of dNTP limitation in controlled experiments [28] | Minimal direct impact |
| Product accumulation | Adding high amounts of non-target amplicons inhibits amplification, but this is reversible with enzyme supplementation or longer extension [28] | Moderate impact; primarily through polymerase binding |
| Product reannealing | Target amplicons acting as templates are less inhibitory than non-target amplicons [28] | Contributes to efficiency decline in late cycles |
The plateau phase has practical implications for experimental design, particularly in quantitative PCR. Since amplification efficiency decreases variably during late cycles, quantitative analysis must occur during the exponential phase where efficiency remains relatively constant [29] [26]. Most qPCR assays typically run for 40-45 cycles, with samples containing low target concentrations reaching detection threshold in later cycles [29].
Advanced Research: Sequence-Specific Amplification Efficiency
Deep Learning Approaches to Efficiency Prediction
Recent research has revealed that amplification efficiency varies significantly between sequences even under identical reaction conditions, particularly in multi-template PCR applications essential to next-generation sequencing and DNA data storage [6]. This sequence-dependent efficiency results in skewed abundance data, compromising quantitative accuracy. Even minimal efficiency differences of just 5% below average can cause approximately two-fold under-representation after only 12 PCR cycles [6].
Advanced deep learning approaches now enable prediction of sequence-specific amplification efficiencies. One-dimensional convolutional neural networks (1D-CNNs) trained on synthetic DNA pools achieve high predictive performance (AUROC: 0.88, AUPRC: 0.44) based on sequence information alone [6]. These models facilitate the design of inherently homogeneous amplicon libraries, addressing a fundamental challenge in multiplexed PCR applications.
Mechanistic Insights from Model Interpretation
The CluMo (Motif Discovery via Attribution and Clustering) deep learning interpretation framework has identified specific motifs adjacent to adapter priming sites associated with poor amplification efficiency [6]. This analysis elucidated adapter-mediated self-priming as a major mechanism causing low amplification efficiency, challenging established PCR design assumptions. This insight enables targeted sequence optimization to minimize amplification bias in multi-template experiments.
Implementation of these predictive models reduces the required sequencing depth to recover 99% of amplicon sequences fourfold, significantly enhancing efficiency in genomics, diagnostics, and synthetic biology applications [6]. This approach demonstrates how understanding sequence-specific amplification dynamics can directly improve experimental outcomes and resource utilization.
Figure 2: Experimental Workflow for Sequence-Specific Efficiency Analysis. Research methodology for identifying sequence motifs affecting PCR efficiency, involving synthetic DNA pools, serial amplification, and deep learning analysis [6].
Essential Methodologies for Amplification Efficiency Analysis
Quantitative PCR (qPCR) Protocol for Efficiency Determination
Principle: Quantitative PCR monitors DNA amplification in real-time using fluorescent reporters, allowing precise determination of amplification efficiency and initial template quantity [29] [30]. The quantification cycle (Cq) represents the cycle number at which fluorescence exceeds background threshold, inversely correlating with initial template concentration [29].
Procedure:
- Prepare a dilution series of template DNA with at least 5 concentrations spanning 3-6 orders of magnitude
- Run qPCR reactions with all dilutions in replicates (minimum n=3)
- Plot Cq values versus log10 template concentration to generate a standard curve
- Calculate PCR efficiency from the slope using: Efficiency = [10^(-1/slope)] - 1
- Validate efficiency against acceptable range (90-110%, corresponding to slope of -3.6 to -3.1) [30]
Critical Steps:
- Set appropriate baseline correction using early cycles (typically cycles 5-15) to eliminate background fluorescence effects [29]
- Establish fluorescence threshold within the exponential phase where amplification plots are parallel [29]
- Include no-template controls to detect contamination or primer-dimer formation [30]
Multi-Template PCR Efficiency Analysis Protocol
Principle: This protocol evaluates sequence-dependent amplification biases in multiplexed PCR reactions using synthetic DNA pools and deep sequencing [6].
Procedure:
- Design a synthetic oligonucleotide pool containing thousands of random sequences with common adapter sequences
- Perform serial PCR amplification with intermediate sampling points (e.g., 6 reactions of 15 cycles each)
- Sequence samples after each amplification stage to track sequence-specific coverage changes
- Fit coverage data to exponential amplification model to calculate sequence-specific efficiency (εᵢ)
- Categorize sequences by amplification efficiency (e.g., low: <80%, medium: 80-100%, high: >100%)
- Validate efficiency classifications through orthogonal single-template qPCR experiments
Applications:
- Identify sequence motifs associated with poor amplification
- Train predictive models for amplification efficiency
- Optimize adapter and primer designs for homogeneous multiplex amplification [6]
The Scientist's Toolkit: Essential Research Reagents
Table 3: Key Reagent Solutions for PCR Amplification Research
| Reagent/Category | Function & Importance | Representative Examples & Notes |
|---|---|---|
| Thermostable DNA Polymerases | Catalyzes DNA synthesis; thermostability enables reaction automation | Taq DNA polymerase: Standard for routine PCR [25]. Pfu DNA polymerase: Proofreading activity for high-fidelity applications [31]. Blends: Often combine processivity and proofreading |
| Reaction Buffers | Provides optimal chemical environment for amplification | Mg²⁺ concentration: Critical cofactor; typically 1.5-2.5 mM; requires optimization [31]. Salt concentration: KCl at 50 mM preferred for longer products [31]. Additives: DMSO (2.5-5%) improves GC-rich template amplification [31] |
| Primers | Sequence-specific amplification; defines target region | Design: 20-25 nucleotides; balanced A/T and G/C content [1]. Tm calculation: Nearest-neighbor method most accurate [9]. Concentration: Typically 0.1-0.5 µM each; significantly impacts yield and plateau [28] |
| dNTPs | Building blocks for DNA synthesis | Concentration: 200 µM each dNTP standard; excess can reduce fidelity [31]. Quality: Degraded dNTPs significantly reduce amplification efficiency |
| Template DNA | Target for amplification | Amount: 10-100 ng genomic DNA; 1-10 ng plasmid DNA [31]. Quality: Integrity crucial for long amplicons; purity affects polymerase activity [31] |
| Fluorescent Detection Systems | Enables real-time monitoring in qPCR | DNA-binding dyes: SYBR Green I; cost-effective but less specific [30]. Hydrolysis probes: TaqMan; sequence-specific detection [30]. Other chemistries: Molecular beacons, scorpion probes |
The exponential power of PCR represents both its greatest strength and most significant technical challenge. While theoretical models predict perfect doubling with each cycle, practical implementation reveals complex interactions between reaction components, template sequences, and amplification conditions that influence efficiency. Understanding these dynamics enables researchers to optimize protocols for specific applications, particularly in quantitative and multi-template scenarios where efficiency variations directly impact results.
Recent advances in deep learning and high-throughput analysis provide new insights into sequence-specific amplification biases, offering pathways to overcome long-standing limitations in multiplex PCR applications. As PCR continues to evolve, the precise understanding and control of amplification efficiency will remain fundamental to its application across biological research, clinical diagnostics, and emerging fields such as DNA data storage.
Beyond Basic Amplification: A Guide to PCR Variants and Their Research Applications
Real-Time Quantitative PCR (qPCR), also known as quantitative real-time PCR, is a fundamental technique in molecular biology that combines the amplification of target DNA sequences with the simultaneous quantification of the amplified products. This method provides a powerful tool for measuring the concentration of specific nucleic acid sequences in a sample with high sensitivity and specificity. Unlike traditional PCR that measures product at the end of the reaction, qPCR monitors the accumulation of PCR products in real time as the reaction progresses, enabling accurate quantification of the initial template amount [22].
Fundamental Principles of Fluorescent Detection
At the core of qPCR technology is the detection and quantification of PCR products through fluorescent signaling. As the target DNA is amplified, the fluorescence signal increases proportionally to the amount of DNA generated. The process relies on monitoring the fluorescence during the exponential phase of amplification, where the reaction efficiency is optimal and most consistent [22].
The quantitative endpoint in qPCR is typically expressed as the Threshold Cycle (Ct), also known as the quantification cycle (Cq). The Ct is defined as the PCR cycle number at which the reporter fluorescence exceeds a predetermined threshold, set above the baseline signal but within the exponential amplification phase [22] [32]. This Ct value is inversely proportional to the logarithm of the initial template concentration—a sample with a higher starting concentration will yield a lower Ct value, while a sample with lower starting concentration will yield a higher Ct value [22].
Detection Chemistries
qPCR utilizes two primary fluorescence detection chemistries, each with distinct mechanisms and applications:
Table 1: Comparison of qPCR Fluorescent Detection Chemistries
| Chemistry Type | Mechanism | Advantages | Limitations |
|---|---|---|---|
| SYBR Green | Intercalates nonspecifically into double-stranded DNA | Cost-effective; simple assay design; no probe required | Less specific; can bind to nonspecific products or primer-dimers |
| TaqMan Probes (Hydrolysis Probes) | Sequence-specific probes with reporter/quencher dyes; cleavage releases fluorescence | High specificity; enables multiplexing with different dyes | More expensive; requires specialized probe design |
SYBR Green Chemistry: SYBR Green dye binds nonspecifically to the minor groove of double-stranded DNA, emitting fluorescence only when bound. As PCR product accumulates, more dye molecules bind, resulting in increased fluorescence [22]. While cost-effective and straightforward to implement, this method requires careful optimization and validation to ensure specificity, typically through dissociation curve analysis performed after amplification to verify a single, specific product [33].
TaqMan Probe Chemistry (Hydrolysis Probes): This fluorogenic 5' nuclease assay utilizes sequence-specific oligonucleotide probes labeled with a reporter fluorophore at the 5' end and a quencher molecule at the 3' end [32]. When intact, the proximity of the quencher suppresses reporter fluorescence through Fluorescence Resonance Energy Transfer (FRET). During amplification, the 5' to 3' exonuclease activity of Taq DNA polymerase cleaves the probe, separating the reporter from the quencher and resulting in increased fluorescence proportional to the amount of amplified product [22] [32].
Quantification Methods in qPCR
qPCR data can be analyzed using either absolute or relative quantification methods, each suitable for different experimental questions.
Absolute Quantification
Absolute quantification determines the exact copy number or concentration of a target sequence in a sample by comparing Ct values to a standard curve generated from known concentrations of a reference standard [34]. This method is particularly valuable in applications such as viral load testing, pathogen quantification, and gene copy number determination [35] [34].
Relative Quantification
Relative quantification compares the expression level of a target gene between different samples relative to a reference gene (endogenous control). This approach is widely used in gene expression studies where changes in expression levels under different experimental conditions are of interest [36] [22]. The most common calculation methods include:
Comparative CT (ΔΔCT) Method: This approach calculates the fold change in gene expression using the formula 2−ΔΔCt, where ΔΔCt represents the difference between the ΔCt values (Ct target - Ct reference) of experimental and control samples [22]. This method assumes optimal and nearly identical PCR efficiencies (90-110%) for both target and reference genes [36] [34].
Normalized Relative Quantity (NRQ): For experiments where PCR efficiency varies significantly, the NRQ method provides a more robust alternative by incorporating actual PCR efficiency values (E) into the calculation: NRQ = (Etarget^−Cttarget) / (Ereference^−Ctreference) [36]. This approach does not require PCR efficiency to be close to 100%, increasing the number of primers available for use [36].
Alternative Quantitative Endpoints: Recent methodological advances have introduced additional quantification approaches that address limitations of the traditional CT method. The f0% method estimates the initial fluorescence as a percentage of the predicted maximum fluorescence, reportedly reducing the coefficient of variation and absolute relative error compared to the CT method [35]. The Cy0 method fits amplification data to Richard's equation and determines the intersection of a tangent at the inflection point with the abscissa [35].
Experimental Design and Workflow
The following diagram illustrates the core workflow and detection logic in a qPCR experiment:
qPCR Experimental Workflow and Detection Logic
Essential Experimental Protocols
RNA Quality Control: For gene expression studies using RT-qPCR, high-quality RNA is crucial. RNA should be extracted from fresh or properly stabilized tissue, with integrity verified before use. Partially degraded RNA may not accurately represent gene expression levels [33].
Reverse Transcription: RNA targets must first be reverse transcribed into complementary DNA (cDNA) using reverse transcriptase enzymes [37] [38]. This can be performed through one-step RT-qPCR (combining reverse transcription and PCR in a single tube) or two-step RT-qPCR (performing reverse transcription and PCR in separate reactions) [37] [22]. Two-step protocols offer greater flexibility for analyzing multiple targets from a single cDNA pool [37].
Primer and Probe Design: Effective primer design is critical for successful qPCR. Primers should be 18-30 bases in length with a melting temperature (Tm) of 60-64°C, and GC content between 35-65% [39]. For gene expression studies, primers should ideally span an exon-exon junction to prevent amplification of contaminating genomic DNA [37] [33]. When using TaqMan probes, the probe Tm should be 5-10°C higher than the primer Tm, and should avoid a G at the 5' end to prevent fluorophore quenching [39].
PCR Efficiency Validation: PCR efficiency should be validated for each primer pair using a standard curve of serial dilutions [34]. The efficiency is calculated using the formula: Efficiency (%) = (10^(-1/slope) - 1) × 100, with acceptable efficiency ranging between 90-110% [34] [33]. The slope of the standard curve should ideally fall between -3.6 and -3.1 [33].
Essential Controls
Proper experimental controls are crucial for validating qPCR results:
- No Template Control (NTC): Contains all reaction components except nucleic acid template to detect reagent contamination [33].
- No Reverse Transcriptase Control ("No RT" Control): For RT-qPCR, this control contains all components except reverse transcriptase to detect genomic DNA contamination [37] [33].
- Reference Genes: For relative quantification, stably expressed endogenous control genes are essential for normalization. Reference genes should demonstrate consistent expression across all experimental conditions [36] [33].
The Scientist's Toolkit: Essential Research Reagents
Table 2: Key Research Reagents and Materials for qPCR Experiments
| Reagent/Material | Function | Key Considerations |
|---|---|---|
| Thermostable DNA Polymerase | Enzymatic synthesis of new DNA strands; often Taq polymerase | Hot-start versions reduce nonspecific amplification; may require proofreading activity for long targets [38] [25] |
| Fluorescent Detection System | Signal generation for real-time monitoring | Choice between SYBR Green or TaqMan probes based on specificity needs and budget [22] |
| Reverse Transcriptase | Converts RNA to cDNA for RT-qPCR | AMV and M-MLV are common; high thermal stability helps with structured RNA [37] [38] |
| qPCR Primers | Sequence-specific amplification | Must be designed for specificity and optimal efficiency; can be sequence-specific, oligo(dT), or random [37] [39] |
| qPCR Probes | Sequence-specific detection (TaqMan) | Should have Tm 5-10°C higher than primers; double-quenched probes reduce background [39] |
| Master Mix | Pre-mixed reaction components | Improves reproducibility; may include reference dyes for well-to-well normalization [33] |
| Reference Genes | Normalization control for relative quantification | Should have stable expression across experimental conditions; often 18S rRNA, GAPDH, or β-actin [36] [33] |
Advanced Technical Considerations
Data Analysis and Normalization
Accurate data analysis in qPCR requires proper baseline and threshold setting. The baseline should be established from the initial cycles where no significant increase in fluorescence occurs, typically cycles 3-15 [34]. The threshold should be set in the exponential phase of amplification where PCR efficiency is optimal [22] [33]. Modern qPCR instruments often include algorithms for automated baseline and threshold determination [33].
For relative quantification, the selection of appropriate reference genes is critical. Commonly used housekeeping genes may exhibit variable expression under different experimental conditions, potentially leading to normalization errors [36]. Using multiple reference genes and validation with software tools such as geNorm, NormFinder, or BestKeeper can improve normalization accuracy [36].
Troubleshooting and Optimization
Common optimization strategies include:
- Annealing Temperature Optimization: The annealing temperature should be approximately 5°C below the primer Tm to ensure specific binding while maintaining efficiency [39].
- Template Quality Assessment: RNA integrity should be verified, as degraded samples can skew quantification results [33].
- Inhibition Testing: The presence of PCR inhibitors can reduce reaction efficiency; serial dilution of samples can help identify inhibition [35].
- Specificity Verification: For SYBR Green applications, dissociation curve analysis should show a single peak indicating specific amplification [33].
Reverse Transcription PCR (RT-PCR) is a powerful molecular biology technique that enables the enzymatic amplification of RNA sequences. This process serves as a critical bridge between RNA analysis and established PCR methods, allowing researchers to study gene expression by first converting RNA into a more stable complementary DNA (cDNA) copy. The core principle involves using a reverse transcriptase enzyme to synthesize cDNA from an RNA template, followed by traditional PCR amplification of the resulting DNA [40]. This methodology has revolutionized molecular biology by providing a means to analyze RNA with the sensitivity and specificity of PCR, making it indispensable for applications ranging from basic research to clinical diagnostics.
Within the broader context of PCR amplification research, RT-PCR represents a specialized adaptation that addresses the fundamental challenge of RNA's inherent instability. Unlike DNA, RNA is more susceptible to degradation and cannot serve as a direct template for conventional PCR. The development of RT-PCR thus provided researchers with a robust tool to explore the transcriptome, enabling precise detection and quantification of RNA molecules that serve as key indicators of cellular activity [37] [41]. The technique gained particular prominence during the COVID-19 pandemic, when it became the benchmark technology for detecting SARS-CoV-2 RNA, demonstrating its critical role in modern molecular diagnostics [41].
Core Principles and Methodology
The RT-PCR Workflow
The RT-PCR process transforms RNA into amplifiable DNA through a series of enzymatic reactions. The procedure begins with RNA extraction from biological samples, followed by a reverse transcription step that produces cDNA. This cDNA then serves as the template for exponential amplification through repeated PCR cycles [41] [40]. The initial reverse transcription reaction is catalyzed by reverse transcriptase, an RNA-dependent DNA polymerase that synthesizes a complementary DNA strand using the RNA template. Following this conversion, the standard PCR process takes over, employing thermal cycling to denature the DNA, anneal sequence-specific primers, and extend new DNA strands through the action of a thermostable DNA polymerase [40].
Enzymatic Components
The success of RT-PCR depends on several key enzymatic components that work in concert to convert and amplify nucleic acids:
Reverse Transcriptase: This RNA-dependent DNA polymerase is the cornerstone enzyme of RT-PCR, responsible for synthesizing the first cDNA strand from the RNA template. Commonly used reverse transcriptases are derived from retroviral sources such as Moloney murine leukemia virus (MMLV) and Avian myeloblastosis virus (AMV) [37] [42]. These enzymes possess unique properties including the ability to function at higher temperatures, which helps overcome RNA secondary structures that might otherwise impede cDNA synthesis.
DNA Polymerase: Following reverse transcription, a thermostable DNA polymerase such as Taq polymerase (isolated from Thermus aquaticus) drives the PCR amplification process. This enzyme remains active through repeated high-temperature cycles (95°C for denaturation) and synthesizes new DNA strands by sequentially adding nucleotides to the 3' end of primers [1] [40].
RNase H Activity: Some reverse transcriptases possess intrinsic RNase H activity, which degrades the RNA strand in RNA-DNA hybrids. While this activity can be detrimental when attempting to produce full-length cDNA transcripts, it is often beneficial in qPCR applications as it facilitates the melting of RNA-DNA duplexes during initial PCR cycles [37].
Table 1: Essential Enzymatic Components of RT-PCR
| Enzyme | Source | Primary Function | Optimal Temperature Range |
|---|---|---|---|
| Reverse Transcriptase | MMLV, AMV | Synthesizes cDNA from RNA template | 40-50°C [40] |
| Taq DNA Polymerase | Thermus aquaticus | Amplifies cDNA through PCR | 72-80°C [1] |
| RNase H | E. coli or enzyme component | Degrades RNA in RNA-DNA hybrids | 37°C [37] |
One-Step vs. Two-Step RT-PCR
RT-PCR can be performed using either a one-step or two-step approach, each with distinct advantages and limitations. The choice between these methods depends on experimental goals, throughput requirements, and the need for flexibility in downstream applications.
In one-step RT-PCR, both reverse transcription and PCR amplification occur sequentially in the same reaction tube using a single buffer system. This approach utilizes sequence-specific primers for both reactions and offers several practical advantages, including reduced handling time, minimal pipetting steps, and lower contamination risk due to fewer tube transfers [37] [42]. The closed-tube nature of one-step protocols makes them particularly suitable for high-throughput applications and diagnostic testing where processing multiple samples rapidly is essential [37].
Two-step RT-PCR separates the reverse transcription and amplification processes into distinct reactions performed in different tubes with optimized conditions for each step. In this approach, the initial cDNA synthesis often uses universal primers (such as oligo(dT) or random hexamers) to create a stable cDNA library that can be stored and used for multiple PCR reactions targeting different genes [37] [42]. This provides greater experimental flexibility, as the same cDNA pool can be used to analyze numerous targets across different experimental conditions. The two-step method also allows researchers to optimize reaction conditions independently and is generally more sensitive than the one-step approach [41].
Table 2: Comparison of One-Step vs. Two-Step RT-PCR Methodologies
| Parameter | One-Step RT-PCR | Two-Step RT-PCR |
|---|---|---|
| Reaction Setup | Single tube, combined reactions [37] | Separate tubes for RT and PCR [37] |
| Handling Time | Shorter [41] | Longer due to multiple steps [37] |
| Contamination Risk | Lower [37] [42] | Higher due to tube transfers [37] |
| Experimental Flexibility | Limited to specific targets | High; same cDNA for multiple targets [42] |
| Sensitivity | Lower [37] | Higher [37] [41] |
| Optimal Use Cases | High-throughput screening, diagnostics [37] | Multiple gene analysis, gene expression studies [42] |
Experimental Design and Protocols
Primer Design Strategies
Effective primer design is critical for successful RT-PCR experiments, directly impacting specificity, efficiency, and accuracy. Several primer options are available for the reverse transcription step, each with distinct advantages depending on experimental goals:
Oligo(dT) Primers: These primers consist of a stretch of 12-18 thymine residues that anneal to the poly(A) tail of eukaryotic mRNA. Oligo(dT) priming generates full-length cDNA but exhibits a 3' bias and is unsuitable for RNA without poly(A) tails. Anchored oligo(dT) primers, which contain one G, C, or A residue at the 3' end, provide more specific binding at the 5' end of the poly(A) tail [37].
Random Primers: Typically hexamers or nonamers, these short sequences anneal at multiple points along RNA transcripts, enabling reverse transcription of the entire RNA population (including rRNA and tRNA). This approach generates shorter cDNA fragments but is ideal for transcripts with significant secondary structure or when analyzing RNA without poly(A) tails [37] [42].
Sequence-Specific Primers: These custom-designed primers target specific mRNA sequences, resulting in a highly specific cDNA pool. While this method offers increased sensitivity for particular targets, it is limited to amplifying predefined genes of interest [37].
For the PCR amplification step, primers should be designed according to standard guidelines: 18-24 nucleotides in length, 40-60% GC content, and melting temperatures (Tm) of 60-65°C with minimal difference (<5°C) between forward and reverse primers [43]. To prevent amplification of contaminating genomic DNA, primers should ideally span exon-exon junctions, with one primer potentially crossing an exon-intron boundary [37] [42]. When designing primers for genes with unknown intron-exon structure, selecting annealing sites 300-400 bp apart increases the likelihood of spanning an intron in eukaryotic DNA [42].
Comprehensive RT-PCR Protocol
Pre-Experiment Planning and RNA Quality Control
Proper experimental design is essential for generating reliable, reproducible RT-PCR results. The planning phase should include:
Biological and Technical Replication: Incorporate at least three independent biological replicates per treatment condition to account for natural variation. For each biological replicate, run at least two technical replicates to assess technical variability [44].
Reference Gene Selection: Choose stable reference genes (e.g., ACTB, GAPDH, HPRT1) with consistent expression across all experimental conditions for data normalization [43]. Validate multiple potential reference genes to identify the most stable ones for your specific experimental system.
Experimental Controls:
- No-Template Control (NTC): Contains all reaction components except cDNA template to detect reagent contamination [43].
- No-Reverse-Transcriptase Control (-RT): Omits reverse transcriptase enzyme to identify genomic DNA contamination [37] [43].
- Positive Control: Uses a sample with known expression of the target gene to verify assay functionality [43].
RNA Isolation and Quality Assessment: Isolate RNA using column-based methods (e.g., RNeasy kits) or TRIzol extraction. Assess RNA quality by:
Two-Step RT-PCR Procedure
Table 3: Step-by-Step Two-Step RT-PCR Experimental Protocol
| Step | Components | Conditions | Purpose |
|---|---|---|---|
| 1. cDNA Synthesis | RNA template (500-1000 ng), Reverse transcriptase, dNTPs (0.5 mM each), Primers (oligo(dT)/random/gene-specific), RNase inhibitor, Reaction buffer [43] | 25°C for 10 min (primer annealing), 50-55°C for 30-60 min (cDNA synthesis), 85°C for 5 min (enzyme inactivation) [43] | Convert RNA to stable cDNA |
| 2. PCR Setup | cDNA template (1-5 μL of 1:10 dilution), DNA polymerase, Gene-specific primers (0.2-0.5 μM each), dNTPs (0.2 mM each), MgCl₂ (1.5-3 mM), Reaction buffer [43] | 95°C for 3-5 min (initial denaturation) | Prepare amplification reaction |
| 3. Amplification | Same as above | 30-40 cycles of: 95°C for 15-30 sec (denaturation), 55-65°C for 30 sec (annealing), 72°C for 30-60 sec (extension) [1] | Exponential amplification of target |
| 4. Product Analysis | PCR products, Agarose gel (1-2%), DNA ladder, Ethidium bromide or SYBR Safe | Electrophoresis at 5-8 V/cm, UV visualization | Confirm specific amplification |
Quantitative Analysis (qRT-PCR)
For quantitative applications, the process incorporates fluorescent detection:
- Detection Chemistry: Use intercalating dyes (SYBR Green) or sequence-specific probes (TaqMan) for real-time monitoring of amplification [41] [43].
- Data Analysis: Calculate quantification cycle (Cq) values and determine amplification efficiency (E) using standard curves or amplification curve analysis [44]. Normalize data using reference genes and apply statistical methods (ANOVA for balanced designs) to compare gene expression across samples [44].
Research Reagent Solutions
Table 4: Essential Reagents and Kits for RT-PCR Experiments
| Reagent/Kits | Function | Examples & Specifications |
|---|---|---|
| RNA Isolation Kits | Purify intact, DNA-free RNA from biological samples | Column-based kits (RNeasy from Qiagen), TRIzol reagent [43] |
| Reverse Transcription Kits | Convert RNA to cDNA with high efficiency | Includes reverse transcriptase, buffer, dNTPs, primers (NEB LunaScript, Thermo Fisher SuperScript VILO) [43] |
| qPCR Master Mixes | Provide optimized components for quantitative detection | Contains DNA polymerase, dNTPs, MgCl₂, fluorescent dyes/probes (SYBR Green, TaqMan assays) [43] |
| Primer Sets | Sequence-specific amplification of targets | Validated primers with 90-110% amplification efficiency, designed to span exon-exon junctions [43] |
| Nuclease-Free Water | Diluent for reactions | Free of RNases and DNases to prevent nucleic acid degradation [43] |
| RNase Decontamination Solutions | Eliminate RNases from work surfaces and equipment | RNaseZap and similar products to maintain RNA integrity [43] |
Applications in Research and Development
RT-PCR serves as a fundamental tool in numerous research and diagnostic applications, particularly in the pharmaceutical and biomedical sectors. The technique's exceptional sensitivity and specificity make it invaluable for:
Gene Expression Analysis: Quantifying changes in mRNA levels in response to experimental treatments, disease states, or developmental processes. RT-PCR enables researchers to monitor transcriptional regulation with high precision, making it essential for understanding gene function and regulatory networks [37] [43].
Pathogen Detection and Viral Load Monitoring: Identifying and quantifying RNA viruses in clinical and research samples. The COVID-19 pandemic highlighted this application, with RT-PCR serving as the gold standard for SARS-CoV-2 detection [41] [1]. The technique is similarly employed for HIV, influenza, hepatitis C, and other viral pathogens.
Drug Development and Validation: Assessing compound effects on gene expression patterns during pharmaceutical development. RT-PCR helps identify drug mechanisms, evaluate efficacy, and detect potential off-target effects by monitoring expression changes in pathway-specific genes [43].
RNAi Validation: Confirming successful knockdown of target genes following RNA interference experiments by quantifying remaining mRNA levels after siRNA or shRNA treatment [37] [43].
Biomarker Discovery and Validation: Identifying and verifying RNA-based biomarkers for disease diagnosis, prognosis, and treatment response prediction. The quantitative nature of RT-PCR makes it ideal for validating candidates identified through high-throughput screening methods like microarrays or RNA-seq [43].
Cancer Research: Detecting tissue-specific mutant alleles, fusion transcripts, and aberrant gene expression patterns characteristic of oncogenic transformation [40]. RT-PCR can identify unique mRNAs produced by cancer cells, aiding in both diagnosis and minimal residual disease monitoring.
Digital PCR (dPCR) represents the third generation of Polymerase Chain Reaction technology, enabling the absolute quantification of nucleic acid targets without the need for standard curves. This method provides a direct and precise approach to measuring the concentration of DNA, cDNA, or RNA molecules in a sample. The core principle of dPCR involves partitioning a PCR reaction into thousands of miniature reactions, so that each partition contains zero, one, or a few target molecules. Following end-point amplification, the presence or absence of fluorescence in each partition is counted as a simple "yes" or "no," creating a digital output [45] [46]. This binary readout, analogous to the ones and zeros of digital computing, simplifies instrumentation and data analysis while providing exceptional precision [45]. The absolute quantification is then calculated using Poisson statistics to account for the random distribution of molecules across the partitions [45] [47]. Within the broader context of PCR amplification research, dPCR addresses key limitations of previous technologies by offering a method that is highly resistant to PCR inhibitors and capable of detecting rare targets in complex backgrounds, thereby opening new possibilities in clinical diagnostics and fundamental research [46].
The Fundamental Principle of dPCR
Core Mechanism: Partitioning and End-Point Detection
The digital PCR process transforms a bulk nucleic acid sample into thousands of individual data points through a simple yet powerful workflow. A standard PCR reaction mixture—containing template nucleic acids, primers, probes, nucleotides, enzymes, and buffers—is divided into numerous micro-compartments, or partitions [45]. These partitions can be nano-liter chambers on a microfluidic chip (cdPCR) or pico-liter droplets in a water-oil emulsion (ddPCR) [46]. Each partition acts as an individual PCR reactor. During the amplification process, partitions containing at least one copy of the target sequence will generate a fluorescent signal (recorded as "1" or "on"), while those without the target will not (recorded as "0" or "off") [45] [48]. This fundamental on/off nature of the detection process is what makes the technique "digital" [45]. Unlike quantitative real-time PCR (qPCR), which relies on measuring the amplification curve in real-time, dPCR uses an end-point measurement, making it less susceptible to fluctuations in amplification efficiency [46].
The Role of Poisson Statistics in Absolute Quantification
After amplification and fluorescence detection, the ratio of positive to negative partitions is used to calculate the absolute concentration of the target molecule in the original sample. Since the template molecules are randomly distributed across the partitions, Poisson statistics are applied to determine the true average number of copies per partition (λ) and to correct for the probability that a positive partition may have contained more than one target molecule [45] [46].
The Poisson distribution formula is given by: ( P(k) = \frac{e^{-\lambda} \lambda^k}{k!} ) where ( P(k) ) is the probability that a partition contains ( k ) target molecules, and ( \lambda ) is the average number of target molecules per partition [45].
The most critical calculation in dPCR analysis determines λ from the observed fraction of negative partitions. The proportion of partitions that are negative (contain zero target molecules) is given by ( P(0) = e^{-\lambda} ). Therefore, ( \lambda = -\ln(1 - p) ), where ( p ) is the fraction of positive partitions [45]. The absolute copy number concentration in the original sample is then calculated using λ and the known partition volume [45].
The following diagram illustrates the complete dPCR workflow, from sample partitioning to final quantification:
dPCR in the Context of PCR Evolution
The development of dPCR marks a significant evolution in nucleic acid amplification technologies. The first generation of PCR, often called end-point PCR, relied on gel electrophoresis for qualitative analysis and was limited by low sensitivity and laborious processes [46]. The second generation, real-time quantitative PCR (qPCR), introduced fluorescence detection for quantification but depended on standard curves and relative comparison to reference genes [46]. The concept of dPCR was first described in 1988 [45] and further developed in 1999 when researchers performed limiting dilution to detect K-RAS mutations [46]. The method gained practical utility with the incorporation of microfluidic technologies in the 2000s, which enabled automated and precise partitioning [46]. The first commercial dPCR systems emerged in 2006-2007, with droplet-based dPCR (ddPCR) introduced in 2011, making the technology more accessible and high-throughput [45] [46].
The table below summarizes the key differences between the primary PCR technologies:
Table 1: Comparison of PCR Technologies
| Feature | Digital PCR (dPCR) | Quantitative PCR (qPCR) | End-Point PCR |
|---|---|---|---|
| Principle | Partitioning + End-point detection | Real-time fluorescence monitoring | Gel electrophoresis |
| Quantification | Absolute, without standards [45] [48] | Relative, requires standard curve [48] [46] | Qualitative/Semi-quantitative |
| Sensitivity | Very High (can detect rare mutations) [45] [46] | High | Low |
| Precision | Superior, high reproducibility [45] | Good | Variable |
| Tolerance to Inhibitors | High [45] [46] | Moderate to Low [46] | Low |
| Dynamic Range | Narrower [45] | Wide [46] | N/A |
| Primary Application | Absolute quantification, rare allele detection, CNV [45] | Gene expression, pathogen quantification [46] | Target detection, cloning |
Key Methodologies and Protocols
Partitioning Technologies: cdPCR vs. ddPCR
The method of sample partitioning defines the two main types of dPCR systems. Chip-based dPCR (cdPCR) utilizes microfluidic technology to divide the reaction mix into nanoliter reaction chambers on a chip [46]. Integrated fluidic circuits, such as those used in the BioMark system, can contain 10,000 to 40,000 microchambers, while the QuantStudio3D system uses a chip with 20,000 chambers [46]. These systems produce partitions of even volume, which minimizes volume variance in calculations [46]. Droplet-based dPCR (ddPCR), such as the Bio-Rad QX100/200 systems, employs water-in-oil emulsion technology to generate millions of picoliter-sized droplets, partitioning each sample into 20,000 droplets [49] [46]. The RainDro system can create even higher numbers, between 1,000,000 and 10,000,000 droplets per reaction [46]. While droplets may have slight volume variations, commercial systems implement standardized procedures and Poisson correction to ensure accurate results [46].
Essential Research Reagents and Materials
A successful dPCR experiment requires careful selection of reagents and materials tailored to the specific platform and application. The following table details key components of the dPCR research toolkit:
Table 2: Essential Research Reagent Solutions for dPCR
| Reagent/Material | Function | Example/Note |
|---|---|---|
| dPCR Supermix | Provides enzymes, dNTPs, and buffer for amplification [49] | Bio-Rad 2× ddPCR supermix [49]; often optimized for probe-based detection |
| Primers & Probes | Target-specific amplification and detection | Hydrolysis probes (e.g., Dual-Labeled Probes with 5' fluorophore and 3' quencher) [49]; mediator probes for multiplexing [50] |
| Partitioning Oil | Creates water-in-oil emulsion for droplet formation | Droplet generation oil is critical for stable droplet formation in ddPCR [49] |
| dPCR Plates/Cartridges | Vessel for partitioning and amplification | 8-chamber cartridges (Bio-Rad ddPCR) [49]; nanoplates (QIAcuity) [45] |
| Sealing Foils | Prevents evaporation and cross-contamination | Pierceable foil heat seal for post-partitioning plate sealing [49] |
| Template DNA/RNA | The target nucleic acid for quantification | Should be high quality and free of inhibitors; gDNA may require restriction digest for optimal partitioning [49] |
Detailed Experimental Protocol: Bio-Rad QX100 System
The following protocol provides a detailed methodology for conducting a ddPCR experiment using the Bio-Rad QX100 system, which is representative of standard dPCR workflows [49]:
- Reaction Setup: Prepare a 20-25 µL PCR reaction mix containing template DNA, 2× ddPCR supermix, and a 20× primer/probe mix. The recommended template quantity is 100 ng of genomic DNA for a single-copy target, but this may need optimization based on target abundance [49].
- Droplet Generation: Load 20 µL of the prepared reaction mix into a designated well of an 8-chamber cartridge. Add 70 µL of droplet generation oil to the adjacent oil well. Place a rubber gasket over the cartridge to create a vacuum seal and load the cartridge into the QX100 Droplet Generator. The instrument will generate approximately 20,000 droplets per sample [49].
- Transfer and Seal: Using a multichannel pipette, carefully transfer 40 µL of the generated droplets to a semi-skirted 96-well PCR plate. Seal the plate with pierceable foil using a heat sealer [49].
- PCR Amplification: Place the sealed plate in a thermal cycler. Use standard two-step qPCR thermal cycling conditions. It is recommended to optimize the annealing/extension temperature for new primer/probe sets using a temperature gradient [49].
- Droplet Reading and Analysis: After thermal cycling, transfer the plate to the QX100 Droplet Reader. The reader will aspirate each sample and read the end-point fluorescence in each droplet (e.g., FAM and HEX channels). Analyze the data using the instrument's software (e.g., Quantasoft), which applies Poisson statistics to calculate the absolute concentration of the target in copies per microliter [49].
Advanced Applications and Current Research
Key Research Applications
The unique advantages of dPCR make it particularly suitable for applications that require high sensitivity, precision, and absolute quantification [45].
- Rare Mutation Detection and Liquid Biopsy: dPCR is exceptionally powerful for detecting and quantifying rare somatic mutations, such as those in KRAS, NRAS, and BRAF genes, in a background of wild-type DNA [45] [50]. This capability is crucial for liquid biopsy applications, where it can identify circulating tumor DNA (ctDNA) in patient blood plasma with variant allele frequencies as low as 0.1% or even 0.001% [46] [50]. This allows for non-invasive cancer diagnosis, monitoring of treatment response, and detection of minimal residual disease.
- Copy Number Variation (CNV) Analysis: The absolute quantification capability of dPCR enables highly precise determination of gene copy numbers, making it a robust tool for identifying amplifications or deletions in genomic DNA [45] [46]. This is valuable in cancer genomics and research into genetic disorders.
- Viral Load Monitoring and Pathogen Detection: dPCR can absolutely quantify viral nucleic acids (e.g., HIV, SARS-CoV-2) without relying on standards, improving the accuracy of viral load monitoring [45] [46]. It has been effectively used to quantify SARS-CoV-2 in wastewater [45]. Its high tolerance to inhibitors also makes it suitable for direct detection of pathogens in complex sample matrices.
- Next-Generation Sequencing (NGS) Support: dPCR is used to quality-control and absolutely quantify NGS libraries before sequencing, ensuring accurate and reproducible results [45] [46]. It can also be employed to validate findings from NGS experiments [46].
Recent Technical Advances
Current research continues to push the boundaries of dPCR capabilities, particularly in the realm of multiplexing. A 2024 study demonstrated the development of a generic fluorogenic 6-plex reporter set based on mediator probe technology [50]. This innovation decouples target detection from signal generation, allowing pre-optimized fluorescence signals to be used with different target panels. This system successfully quantified single-nucleotide polymorphism (SNP) targets for KRAS, NRAS, and BRAF down to 0.4 copies per microliter against a high wild-type background, achieving a variant allele frequency of 0.1% [50]. This significantly simplifies the development of complex, multiplexed dPCR assays.
Another area of active development is data analysis. Accurate classification of partitions based on end-point fluorescence is critical for reliable quantification, especially in multiplex experiments. A 2024 benchmarking study evaluated 11 different clustering algorithms for classifying partitions in duplex dPCR experiments [51]. The study developed a novel method for simulating realistic dPCR data, including challenges like "rain" (partitions with intermediate fluorescence), and provided guidelines for selecting the most appropriate clustering method based on specific data characteristics [51]. Tools like these are essential for ensuring the accuracy and reproducibility of dPCR results as the technology is increasingly adopted in clinical and research settings.
Digital PCR has firmly established itself as a powerful tool in the molecular biology arsenal, enabling absolute quantification of nucleic acids with exceptional precision and sensitivity. Its core principle of sample partitioning, combined with Poisson statistical analysis, provides a direct and robust method for counting target molecules, free from the constraints of standard curves. While techniques like qPCR remain invaluable for a wide range of applications, dPCR excels in specific niches, including rare allele detection, copy number variation analysis, and precise viral load quantification. Ongoing advancements, particularly in high-order multiplexing and sophisticated data analysis algorithms, continue to expand its utility in both basic research and clinical diagnostics. As the technology evolves and becomes more accessible, dPCR is poised to play an increasingly critical role in advancing our understanding of biology and improving disease management.
The Polymerase Chain Reaction (PCR) is a cornerstone technique in molecular biology, enabling the amplification of specific DNA fragments from a complex pool of DNA through repeated cycles of denaturation, annealing, and extension [26] [1]. Despite its revolutionary impact, conventional PCR faces significant challenges with specificity, particularly through the generation of non-specific amplification products and primer-dimers during reaction setup at sub-optimal temperatures [52] [53]. Hot-Start PCR addresses these limitations by employing specialized biochemical mechanisms to inhibit DNA polymerase activity until elevated temperatures are reached during the first denaturation step [53]. This technical guide examines the principles, methodologies, and applications of Hot-Start PCR within broader PCR amplification research, providing researchers and drug development professionals with detailed protocols and analytical frameworks for implementation.
The Specificity Challenge in Conventional PCR
Mechanisms of Non-Specific Amplification
In conventional PCR, all reaction components are mixed at room temperature, creating a permissive environment for several non-specific amplification events:
- Mis-priming: At lower temperatures during sample preparation and thermal cycler ramping, primers can bind transiently to regions of the target DNA with partial complementarity, leading to the initiation of DNA synthesis from non-target sites [52].
- Primer-dimer formation: Primers can hybridize to each other through complementary sequences, particularly at their 3' ends, and become extended by DNA polymerase. These primer artifacts then compete with the desired target for amplification resources throughout the PCR process [52].
- Enzymatic activity at suboptimal temperatures: Thermostable DNA polymerases like Taq polymerase retain residual activity at ambient temperatures, facilitating these non-specific extension events before thermal cycling begins [53].
Impact on Experimental Results
These non-specific amplification phenomena compete with the target amplification for essential reaction components, including primers, nucleotides, and DNA polymerase [52]. The consequences manifest as:
- Reduced target yield, particularly problematic for low copy number targets
- Decreased amplification efficiency and sensitivity
- Compromised results in downstream applications including cloning, sequencing, and diagnostic detection
Fundamental Principles of Hot-Start PCR
Hot-Start PCR employs strategic modifications to block DNA polymerase activity during reaction setup, with activation occurring only after the first high-temperature denaturation step. The core principle involves maintaining PCR components in an inactive state until the reaction mixture reaches stringent temperatures (typically >90°C), preventing non-specific priming events that occur at lower temperatures [53].
Table 1: Comparison of Conventional PCR vs. Hot-Start PCR
| Parameter | Conventional PCR | Hot-Start PCR |
|---|---|---|
| Polymerase Activity at Room Temperature | Active | Blocked/Inactive |
| Non-Specific Products | Common | Significantly Reduced |
| Primer-Dimer Formation | Frequent | Minimized |
| Target Yield | Variable, Often Lower | Higher and More Consistent |
| Sensitivity | Moderate | Enhanced, Especially for Low Copy Targets |
| Application in Multiplex PCR | Challenging | More Suitable |
Molecular Mechanisms of Hot-Start Activation
Several biochemical approaches have been developed to implement the Hot-Start principle, each with distinct mechanisms and activation requirements:
Antibody-Based Inhibition
A neutralizing monoclonal antibody binds to the DNA polymerase active site, sterically blocking enzymatic activity until the antibody is denatured at elevated temperatures (typically during the initial denaturation step at 95°C) [53] [54].
Chemical Modification
DNA polymerase is chemically modified to render it inactive at lower temperatures. The modifications are reversed through heat incubation during the initial denaturation step, restoring full enzymatic functionality [53].
Physical Separation
Critical reaction components (e.g., magnesium ions or DNA polymerase) are physically separated from the rest of the reaction mixture until the first high-temperature step is reached, often through wax barriers or specialized tube systems [52].
Primer-Based Approaches
Primers contain thermolabile modifications that block DNA polymerase extension until the modifications are removed by heat. The 4-oxo-1-pentyl (OXP) phosphotriester modification at the 3'-terminal internucleotide linkages represents one such approach, where elevated temperatures convert the modified primers to unmodified, extendable substrates [52].
dNTP-Mediated Hot-Start
Deoxynucleoside triphosphates (dNTPs) are modified with thermolabile protecting groups at the 3' terminus, blocking incorporation by DNA polymerase until the protecting groups are removed during heat activation at 95°C [54]. This approach can be implemented by replacing just one or two natural nucleotides with Hot-Start dNTPs to prevent nonspecific amplification [54].
The following diagram illustrates the operational workflow and comparative mechanisms of major Hot-Start PCR methods:
Experimental Implementation and Methodologies
Protocol: dNTP-Mediated Hot-Start PCR
This protocol utilizes thermolabile protecting groups on dNTPs to block nonspecific amplification [54].
Reagent Preparation and Handling
- Hot-Start dNTPs: Available as a blended mix (2μM or 10μM solutions of dATP, dCTP, dGTP, and dTTP) or as individual CleanAmp dNTPs [54].
- Storage: Store at -20°C; avoid more than 20 freeze-thaw cycles. Aliquot stocks to maintain stability. Can be stored for up to 15 days at 4°C as a stock solution [54].
- Thawing: Thaw at room temperature or on ice (do not heat), then mix by vortexing and pulse centrifugation [54].
- DNA Polymerase: Both native and recombinant Taq DNA polymerases work effectively with Hot-Start dNTPs [54].
Reaction Setup
Table 2: Reaction Components for dNTP-Mediated Hot-Start PCR
| Component | Volume for 1 Reaction | Final Concentration |
|---|---|---|
| 10× PCR Buffer | 2.5 μL | 1× |
| 25 mM MgCl₂ | 2.5 μL | 2.5 mM |
| Hot-Start dNTP Mix (400 μM) | 2.5 μL | 400 μM |
| Forward Primer (10 μM) | 1.0 μL | 0.4 μM |
| Reverse Primer (10 μM) | 1.0 μL | 0.4 μM |
| Taq DNA Polymerase (5 U/μL) | 0.25 μL | 1.25 U |
| Template DNA | Variable | 1-100 ng |
| Nuclease-Free Water | To 25 μL | - |
- Prepare a master mix containing all components except template DNA on ice [54].
- Mix gently by pipetting up and down (do not vortex to protect the enzyme) [54].
- Aliquot 20 μL of master mix into each PCR tube [54].
- Add 5 μL of template DNA for a final reaction volume of 25 μL [54].
- Cap, label, and pulse spin tubes to collect reaction solution at the bottom [54].
Thermal Cycling Conditions
Table 3: Thermal Cycling Parameters for dNTP-Mediated Hot-Start PCR
| Step | Temperature | Time | Notes |
|---|---|---|---|
| Initial Activation | 95°C | 5-10 minutes | Critical for Hot-Start dNTP activation |
| Denaturation | 95°C | 30 seconds | |
| Annealing | 55-65°C | 30 seconds | Primer-specific temperature |
| Extension | 68-72°C | 1 minute per kb | |
| Final Extension | 68-72°C | 5-10 minutes | |
| Hold | 4°C | ∞ |
- Cycle steps 2-4 for 25-35 repetitions [54].
- For multiplex reactions with four or more targets, add KCl to a final concentration of 100 mM to improve results [54].
Protocol: Primer-Based Hot-Start with OXP Modifications
This approach utilizes primers with thermolabile 4-oxo-1-pentyl (OXP) phosphotriester modifications at 3'-terminal internucleotide linkages [52].
Primer Design and Synthesis
- Introduce one or two OXP phosphotriester modification groups at the 3'-terminal and 3'-penultimate internucleotide linkages [52].
- OXP modifications impair DNA polymerase primer extension at lower temperatures but revert to natural phosphodiester linkages at elevated temperatures (95°C) [52].
- Modified primers can be synthesized using standard solid-phase oligonucleotide synthesis with specialized phosphoramidite chemistry [52].
Experimental Workflow
The following diagram outlines the experimental workflow for evaluating OXP-modified primers in Hot-Start PCR:
Evaluation Methods
- Endpoint PCR with agarose gel electrophoresis to visualize specific vs. non-specific products [52]
- Real-time PCR with SYBR Green I dye to monitor amplification efficiency [52]
- TaqMan probe detection for specific target quantification [52]
- One-step reverse transcription PCR (RT-PCR) for RNA target detection [52]
Research Reagent Solutions
Table 4: Essential Reagents for Hot-Start PCR Implementation
| Reagent Category | Specific Examples | Function & Mechanism |
|---|---|---|
| Hot-Start DNA Polymerases | Antibody-inactivated Taq, Chemically modified enzymes | Core enzymatic activity blocked until heat activation |
| Modified dNTPs | CleanAmp dNTPs with thermolabile protecting groups | Blocks incorporation until protecting groups removed at 95°C |
| Modified Primers | OXP phosphotriester-modified primers | Prevents primer extension until modifications removed by heat |
| Specialized Buffers | MgCl₂-containing buffers, KCl additives | Optimizes reaction conditions, especially for multiplex applications |
| Activation Additives | Specific chemical activators | Component-specific activation mechanisms |
Performance Analysis and Quantitative Assessment
Efficacy in Improving Specificity
Studies demonstrate that OXP-modified primers significantly improve amplification specificity when substituted for unmodified primers [52]. Key findings include:
- Substantial reduction in primer-dimer formation and mis-priming artifacts
- Enhanced efficiency of nucleic acid target amplification, particularly for low copy number targets
- Successful application across conventional PCR, one-step RT-PCR, and real-time PCR with both SYBR Green I and TaqMan probe detection methods [52]
Quantitative Performance Metrics
Table 5: Quantitative Performance Comparison of Hot-Start Methods
| Performance Metric | Conventional PCR | Antibody-Mediated Hot-Start | dNTP-Mediated Hot-Start | Primer-Based Hot-Start (OXP) |
|---|---|---|---|---|
| Non-Specific Products | High | Significantly Reduced | Significantly Reduced | Significantly Reduced |
| Sensitivity (Low Copy Detection) | Moderate | High | High | High |
| Amplicon Size Range | Up to 5 kb | Up to 5 kb | Up to 2 kb | Similar to conventional |
| Activation Time | N/A | 2-10 minutes at 95°C | 5-10 minutes at 95°C | 5-10 minutes at 95°C |
| Compatibility with RT-PCR | Standard | High | Requires cDNA purification | High |
Applications in Research and Diagnostic Contexts
Hot-Start PCR technology has enabled advancements across multiple domains:
- Genetic testing and clinical diagnostics: Enhanced specificity critical for detecting low-abundance mutations [52] [1]
- Pathogen detection: Improved sensitivity for blood-borne infectious agents and biohazardous microbes [52]
- Forensic analysis: Reduced false positives in sample-limited scenarios [52] [1]
- Gene expression studies: More accurate quantification in reverse transcription quantitative PCR (RT-qPCR) [1]
- Next-generation sequencing: Improved library preparation efficiency and specificity [52]
Hot-Start PCR represents a significant refinement of conventional PCR methodology, directly addressing the fundamental challenge of amplification specificity through controlled enzymatic activation. The diverse implementation strategies—including antibody inhibition, chemical modification, dNTP-mediated, and primer-based approaches—provide researchers with multiple pathways to suppress non-specific amplification during reaction setup. The experimental protocols and analytical frameworks presented in this guide offer researchers and drug development professionals comprehensive methodologies for implementing Hot-Start PCR across basic research and diagnostic applications. As PCR continues to evolve as a cornerstone technology in molecular biology, Hot-Start principles remain essential for applications demanding the highest levels of specificity and reliability, particularly in clinical diagnostics, forensic analysis, and next-generation sequencing workflows.
The Polymerase Chain Reaction (PCR) stands as a foundational technique in molecular biology, but conventional methods face limitations when analyzing multiple genomic regions or large DNA fragments. These challenges have driven the development of two powerful specialized approaches: Multiplex PCR and Long-Range PCR. Multiplex PCR enables the simultaneous amplification of multiple specific DNA targets in a single reaction, significantly increasing throughput and conserving valuable samples [55] [56]. Long-Range PCR overcomes the technical constraints that limit the amplification of DNA segments beyond 5 kilobases (kb), enabling the analysis of larger genomic structures [57] [58]. When combined, these techniques form a robust platform for comprehensive genetic analysis, from detecting pathogen panels to sequencing extensive genomic regions. This technical guide examines the principles, optimization strategies, and applications of these advanced PCR methodologies within the broader context of PCR amplification research, providing scientists with the framework to implement these powerful techniques in diagnostic, research, and drug development settings.
Principles of Multiplex PCR
Fundamental Concepts and Development
Multiplex PCR is a variant of conventional PCR that permits the simultaneous amplification of more than one target of interest in a single reaction by incorporating more than one pair of primers [56]. This method was first described in 1988 as an approach to detect deletion mutations in the dystrophin gene and has since evolved into a sophisticated diagnostic and research tool [55] [59]. The fundamental principle remains based on the ability of DNA polymerase to synthesize new complementary DNA strands from template strands, with multiple primers acting as starting points for different DNA sequences simultaneously [59].
The reaction proceeds through the same three fundamental steps as standard PCR—denaturation, annealing, and elongation—but with the critical difference that all primer sets must function efficiently under a single set of cycling conditions. The products generated are of varying sizes, each specific to different DNA sequences, allowing for differentiation typically through gel electrophoresis or other detection methods [59]. Multiplex reactions can be categorized as either single-template (amplifying multiple regions from a single DNA molecule) or multiple-template (amplifying targets from different DNA sources), with both approaches utilizing several primer pairs in one reaction mixture [59].
Key Technical Challenges and Solutions
The development of efficient multiplex PCR assays presents several technical challenges that must be addressed through careful optimization. The primary obstacle is the increased potential for spurious amplification products, primarily due to the formation of primer dimers—a by-product where two primer molecules hybridize to each other because they share a string of complementary bases [55] [59]. DNA polymerase can then amplify these primer dimers, which competes for PCR reagents and potentially inhibits amplification of the target DNA sequences [59].
Another significant challenge is preferential amplification, where certain templates are amplified more efficiently than others due to differences in GC content, primer binding efficiency, gene copy number, or the presence of secondary structures in the template DNA [55]. This can lead to biased representation of targets in the final amplification products. Two major classes of processes induce this bias: PCR drift (caused by stochastic fluctuations in reagent interactions, particularly at low template concentrations) and PCR selection (where inherent properties of certain templates favor their amplification) [55].
Table 1: Key Challenges in Multiplex PCR and Their Solutions
| Challenge | Underlying Cause | Optimization Strategy |
|---|---|---|
| Primer-dimer formation | Complementary sequences between primers | Careful primer design using in silico tools; use of hot start PCR |
| Preferential amplification | Differences in primer efficiency, GC content, or target accessibility | Primer optimization for similar Tm; use of PCR enhancers like betaine or DMSO |
| Low amplification efficiency | Competition for reagents; suboptimal conditions | Adjustment of primer concentrations; optimization of Mg²⁺ and dNTP concentrations |
| Formation of spurious products | Mis-priming due to multiple primer sets | Empirical testing of primer combinations; use of touchdown PCR protocols |
To overcome these challenges, several methodological improvements have been adopted. Hot start PCR has proven particularly valuable, as it often eliminates nonspecific reactions caused by primer annealing at low temperatures before thermocycling commences [55]. This approach has been made more practicable through nonmechanical hot start methodologies using specially modified forms of Taq polymerase. Additionally, nested PCR approaches can be incorporated to enhance sensitivity and specificity, though this adds complexity to the experimental design [55].
Figure 1: Evolution of PCR Techniques from Standard to Multiplex and Long-Range Formats
Principles of Long-Range PCR
Technical Basis and Historical Development
Long-range PCR refers to the amplification of DNA targets over 5kb in length that typically cannot be amplified using routine PCR methods or reagents [57]. While standard PCR efficiently amplifies fragments up to 3-4kb, longer targets present substantial challenges due to the accumulation of errors and the decreased processivity of standard DNA polymerases. The breakthrough in long-range PCR came with the development of specialized polymerase blends that combine the speed of conventional Taq polymerase with the proofreading activity of other polymerases [57].
Traditional long-range PCR has been performed using a blend of Taq DNA polymerase (for fast elongation) with a small amount of proofreading polymerase (for accuracy) [57]. The proofreading enzyme repairs DNA mismatches incorporated at the 3' end of the growing strand, allowing Taq polymerase to continue elongation much further than it would otherwise, resulting in longer DNA amplification products. More recent advances have led to modified high-fidelity polymerases with enhanced DNA binding, resulting in highly processive and accurate amplification of long fragments without the need for enzyme blends [57].
Overcoming Amplification Barriers
Amplifying long DNA fragments presents unique challenges that must be addressed through specialized reagents and conditions. Difficult DNA regions include those with high GC content, repetitive sequences, or complex secondary structures that can cause polymerase stalling [60] [61]. These regions may require specialized additives or modified cycling conditions to achieve successful amplification.
The polymerase selection is particularly critical for long-range PCR. Standard Taq polymerase lacks 3'→5' exonuclease activity and may incorporate incorrect nucleotides during elongation, leading to truncated products when amplifying long templates [57]. Proofreading polymerases such as Pfu or those included in commercial long-range kits can recognize and remove mismatched nucleotides, significantly improving fidelity and success with long amplicons [57].
Table 2: Comparison of Long-Range PCR Polymerase Systems
| Polymerase Type | Key Features | Advantages | Typical Applications |
|---|---|---|---|
| Taq-only | Fast elongation but no proofreading | Rapid amplification; cost-effective | Fragments up to 3-4kb |
| Taq + Proofreading blend | Combination of speed and accuracy | Can amplify up to 20kb+ fragments; reduced error rate | Genome mapping; cloning large inserts |
| Engineered high-fidelity | Enhanced processivity with proofreading | Single enzyme system; high accuracy | Complex templates; GC-rich regions |
Reaction conditions for long-range PCR also differ significantly from standard protocols. Extension times must be considerably longer—typically 1 minute per kilobase or more—to allow complete synthesis of long templates [58]. Template quality is also paramount; DNA degradation or impurities that might not affect short amplicons can completely prevent amplification of long fragments. Additionally, specialized buffers containing enhancers such as betaine, dimethyl sulfoxide (DMSO), or glycerol are often essential to destabilize secondary structures and facilitate the amplification of complex templates [60] [61] [58].
Optimization and Enhancement Strategies
Primer Design Considerations
Successful multiplex and long-range PCR requires meticulous primer design to ensure specific and efficient amplification of all targets. For multiplex PCR, primers must be designed to have nearly identical optimum annealing temperatures and minimal homology either internally or to one another [55]. Ideal primers typically have a length of 18-30 bp or more and a GC content of 35-60% [55]. Each primer pair should produce distinct amplicon sizes with sufficient difference (usually >20 bp) to allow clear resolution by gel electrophoresis or other detection methods [59].
For long-range PCR, primer design focuses on ensuring highly specific binding to avoid spurious initiation sites that could lead to truncated products. Primers are typically longer (25-35 bp) and may have higher melting temperatures to promote specific binding to unique genomic sequences [58]. Avoiding primers with significant secondary structure or self-complementarity is particularly important for long amplicons, as these can dramatically reduce amplification efficiency.
Advanced computational tools are now essential for designing primers for both applications. In silico design tools help identify potential primer-dimer formations, hairpin structures, and cross-homology that could compromise reaction specificity [59]. These tools also help balance the melting temperatures of all primers in a multiplex reaction and ensure that all potential amplicons can be distinguished by size or detection method.
PCR Enhancers and Additives
PCR enhancers are additives included in PCR to enhance amplification through various mechanisms [60] [61]. These compounds address specific challenges in both multiplex and long-range PCR and can significantly improve success rates with difficult templates.
Betaine (also known as trimethylglycine) is one of the most valuable additives, particularly for GC-rich templates. It acts as a destabilizing agent, reducing the melting temperature of GC-rich sequences and helping to prevent the formation of secondary structures [55] [61]. Betaine functions as an osmoprotectant, increasing the resistance of the polymerase to denaturation [55]. Studies have demonstrated that betaine significantly improves the amplification efficiency of long GC-rich targets that would otherwise fail to amplify [58].
Dimethyl sulfoxide (DMSO) facilitates DNA denaturation by disrupting base pairing, particularly in GC-rich regions [55] [61]. It may also stabilize DNA polymerase and reduce nonspecific primer binding. Typical concentrations range from 1-10%, with higher concentrations potentially inhibiting the reaction.
Other enhancers include glycerol, which can stabilize polymerase enzymes; bovine serum albumin (BSA), which helps counteract PCR inhibitors; and specialized commercial enhancer cocktails that combine multiple compounds for maximum effect [55] [60]. The choice of enhancer depends on the specific challenges presented by the template DNA and the PCR application.
Table 3: Common PCR Enhancers and Their Applications
| Additive | Common Concentration | Mechanism of Action | Primary Applications |
|---|---|---|---|
| Betaine | 0.5-1.5 M | Reduces base stacking interactions; equalizes Tm | GC-rich templates; long-range PCR |
| DMSO | 1-10% | Disrupts base pairing; stabilizes polymerase | GC-rich templates; complex secondary structures |
| Glycerol | 5-15% | Stabilizes polymerase enzyme | Long-range PCR; enhances enzyme processivity |
| BSA | 0.1-0.8 μg/μL | Binds inhibitors; stabilizes reaction | Multiplex PCR; problematic samples |
| Formamide | 1-5% | Lowers melting temperature | Reduces secondary structure; improves specificity |
Reaction Component Optimization
Beyond additives, careful optimization of standard PCR components is essential for successful multiplex and long-range applications. Magnesium concentration (Mg²⁺) is particularly critical, as it affects primer annealing, enzyme activity, and product specificity. While standard PCR typically uses 1.5-2.0 mM Mg²⁺, multiplex reactions may require slightly higher concentrations (2.0-3.0 mM) to compensate for binding to multiple primer sets and templates [55]. However, excessive Mg²⁺ can reduce specificity, so empirical optimization is recommended.
dNTP concentrations must be balanced to support simultaneous amplification of multiple targets without promoting misincorporation. Typical concentrations range from 200-400 μM of each dNTP for multiplex reactions. For long-range PCR, adequate dNTPs are essential to complete synthesis of long templates, but excess can reduce fidelity.
Polymerase selection and concentration often differs from standard PCR. Multiplex reactions may require increased enzyme concentrations (up to four to five times greater than uniplex PCR) to achieve optimal amplification of all targets [55]. For long-range PCR, specialized enzyme blends or high-processivity polymerases are essential, with concentrations typically following manufacturer recommendations for the specific target length.
Research Reagent Solutions
The successful implementation of multiplex and long-range PCR depends on appropriate selection of research reagents and kits. Commercial solutions have been developed to address the specific challenges of these advanced PCR applications.
Table 4: Essential Research Reagents for Advanced PCR Applications
| Reagent Category | Specific Examples | Function and Features | Application Context |
|---|---|---|---|
| Specialized Polymerases | VeriFi Hot Start Polymerase; PrimeSTAR GXL | Proofreading activity; high processivity; hot start capability | Long-range PCR; high-fidelity applications |
| Enhancement Additives | Betaine; DMSO; Commercial enhancer cocktails | Reduce secondary structure; stabilize enzymes; improve yield | GC-rich templates; complex amplicons |
| Optimized Buffer Systems | LA PCR Buffer II; Proprietary commercial buffers | Balanced Mg²⁺; specialized salts; pre-added enhancers | Maximizing performance with difficult targets |
| Commercial Multiplex Kits | Qiagen Multiplex PCR Kit; Agilent hybrid capture | Pre-optimized primer blends; enhanced specificity | Multi-target detection; clinical diagnostics |
| Nucleic Acid Purification | QIAamp DNA mini kit; AMPure XP beads | High-quality template preparation; PCR product cleanup | Critical for long-range PCR; NGS library prep |
Commercial multiplex PCR kits such as those from Qiagen and Agilent provide pre-optimized reaction conditions and components that support simultaneous amplification of multiple targets [59]. These kits typically include specialized buffer formulations, enhanced polymerase systems, and sometimes primer design services to ensure successful multiplexing. For example, Qiagen's multiplex PCR kit is reported to work with up to 16 primer pairs, making it suitable for applications such as transgenic organism typing or microsatellite analysis [59].
For long-range PCR, specialized polymerase blends are available from multiple manufacturers. These often combine the processivity of Taq with the proofreading capability of enzymes such as Pfu to achieve accurate amplification of fragments up to 20 kb or more [57]. Systems such as Takara's LA Taq Hot-Start DNA Polymerase or PCR Biosystems' VeriFi polymerase have been specifically engineered for long, accurate amplification and are frequently used in conjunction with enhancers like betaine for challenging templates [57] [58].
Experimental Protocols
Standardized Multiplex PCR Protocol
Based on optimized methodologies from the literature, the following protocol provides a robust starting point for multiplex PCR development:
Reaction Setup:
- Prepare a master mix containing:
- 1X PCR buffer (typically supplied with polymerase)
- 2.0-3.0 mM MgCl₂ (concentration requires optimization)
- 200-400 μM of each dNTP
- 0.1-1.0 μM of each primer (concentrations may vary per primer set)
- 0.5-2.5 units of hot start DNA polymerase per reaction
- Potential additives: 0.5-1.0 M betaine or 2-5% DMSO
- Template DNA: 10-100 ng genomic DNA or equivalent
- Nuclease-free water to final volume
- Prepare a master mix containing:
Thermal Cycling Conditions:
- Initial denaturation: 95°C for 2-5 minutes
- 30-40 cycles of:
- Denaturation: 95°C for 30 seconds
- Annealing: 55-65°C for 45-90 seconds (temperature requires optimization)
- Extension: 72°C for 30-60 seconds per kb of expected product
- Final extension: 72°C for 5-10 minutes
- Hold at 4°C
Post-Amplification Analysis:
- Analyze products by agarose gel electrophoresis (2-3% agarose)
- Alternatively, use capillary electrophoresis for higher resolution
- For quantitative applications, use real-time detection with probe-based systems
This protocol should be optimized for specific applications through empirical testing of annealing temperatures, primer concentrations, and Mg²⁺ levels. Internal controls are recommended to monitor amplification efficiency and detect potential inhibition [55] [56].
Multiplex Long-Range PCR Protocol
For applications requiring both long amplification and multiple targets, such as the NGS-based multiplex long-range PCR described for autoinflammatory disease genes [58], the following protocol provides a framework:
Reaction Setup:
- Prepare a master mix containing:
- 1X LA PCR Buffer II (Mg²⁺ plus)
- 1.25 units of LA Taq Hot-Start DNA Polymerase
- 1.25 units of PrimeSTAR GXL DNA Polymerase (or similar proofreading enzyme)
- 400 μM of each dNTP
- 5 μl of Betaine (approximately 1-1.5 M final concentration)
- 0.2 μM of each primer in the multiplex mixture
- 1-25 ng of template genomic DNA
- Nuclease-free water to 25 μl final volume
- Prepare a master mix containing:
Thermal Cycling Conditions:
- Initial denaturation: 95°C for 3 minutes
- 34 cycles of:
- Denaturation: 95°C for 30 seconds
- Annealing: 58°C for 40 seconds
- Extension: 68°C for 12 minutes (adjust based on target length)
- Final extension: 72°C for 12 minutes
- Hold at 4°C
Product Analysis and Purification:
- Verify amplification by agarose gel electrophoresis
- Purify products using magnetic bead-based cleanups (e.g., Agencourt AMPure XP)
- Quantify using fluorometric methods (e.g., Qubit dsDNA assays)
This protocol has been successfully used to amplify fragments up to 11.78 kb in a multiplex format for sequencing applications [58]. The combination of a high-processivity polymerase with a proofreading enzyme, along with betaine as an enhancer, provides the necessary components for successful long-range multiplex amplification.
Figure 2: Comprehensive Workflow for Multiplex Long-Range PCR Experimental Design
Applications in Research and Diagnostics
Diagnostic Applications
Multiplex PCR has found extensive application in diagnostic microbiology, where simultaneous detection of multiple pathogens provides significant advantages over single-target assays. In clinical virology, multiplex assays have been developed to detect panels of viruses causing similar symptoms, such as herpesviruses (HSV-1, HSV-2, VZV, CMV, HHV-6, EBV) in cases of meningitis, encephalitis, or meningoencephalitis [55]. Similarly, respiratory virus panels can detect influenza A and B, RSV, parainfluenza viruses, adenovirus, and other pathogens from a single sample [55].
An important advancement in diagnostic multiplex PCR is the detection of resistance markers alongside pathogen identification. For example, the ResistancePlus MG kit enables simultaneous detection of Mycoplasma genitalium and macrolide resistance-associated mutations in the 23S rRNA gene [62]. This approach provides clinicians with essential information for targeted therapy, addressing the growing challenge of antimicrobial resistance. Clinical validation studies have demonstrated high sensitivity (98.9%) and specificity (100%) for pathogen detection, with good performance for resistance marker identification (95.4% sensitivity, 95.8% specificity) [62].
In bacterial diagnostics, multiplex quantitative PCR (MQ-PCR) assays have been developed for comprehensive pathogen detection. One such assay for lower respiratory tract infections can qualitatively and quantitatively detect 12 bacterial pathogens with a limit of detection of 1000 copies/ml and efficiency >95% [63]. When applied to clinical samples with appropriate cutoffs (≥10⁵ copies/ml in sputum and ≥10⁴ copies/ml in BALF), this MQ-PCR demonstrated 77% sensitivity and 94% specificity, detecting more coinfection cases than traditional culture methods [63].
Research Applications
In research settings, multiplex long-range PCR has enabled sophisticated genetic analyses that were previously challenging or cost-prohibitive. The combination of long-range amplification with multiplexing creates a powerful tool for targeted sequencing, as demonstrated by a nine-gene panel for autoinflammatory diseases (AIDs) [58]. This approach amplifies coding sequences, UTRs, and intronic regions of genes such as MEFV, MVK, TNFRSF1A, and NLRP3, with amplicons up to 11.78 kb [58]. The method provides comprehensive coverage of difficult genomic regions, including GC-rich sequences, while remaining more cost-effective than whole-exome or whole-genome sequencing.
In food forensics and agricultural research, multiplex PCR has been applied to species identification and pathogen detection. For example, multiplex assays have been developed for simultaneous identification of six meat species (beef, chicken, ostrich, lamb/mutton, pork, and horse) without prior DNA extraction [56]. These assays demonstrate sensitivity as low as 12,500 copies of mitochondrial DNA and remain effective in processed food products where DNA may be degraded [56]. Similarly, in plant health monitoring, multiplex PCR enables simultaneous detection of multiple viral, bacterial, and fungal pathogens in crops such as citrus, banana, and cucurbits [56].
Advanced applications continue to emerge, including "double gene-targeted" multiplex PCR that provides redundant targeting for increased reliability [56]. This approach targets two different genes for the same species, ensuring that if one target is compromised by food processing or degradation, the other will still provide detection. Such innovations demonstrate the continuing evolution of multiplex PCR methodologies to address increasingly complex analytical challenges.
Multiplex and Long-Range PCR represent significant advancements in molecular amplification technology, each addressing distinct limitations of conventional PCR while offering complementary benefits when combined. Multiplex PCR dramatically increases analytical throughput and efficiency by enabling simultaneous detection of multiple targets, while Long-Range PCR extends the accessible genomic landscape by amplifying fragments previously considered beyond practical limits. The successful implementation of these techniques requires careful attention to primer design, reaction optimization, and the strategic use of enhancing additives—with betaine, specialized polymerase blends, and optimized buffer systems playing particularly important roles.
As molecular diagnostics and research continue to advance, the integration of these techniques with next-generation sequencing platforms and automated analysis systems will further expand their applications. The ongoing development of more robust enzyme systems, improved enhancer cocktails, and sophisticated design algorithms promises to make these powerful techniques more accessible and reliable. For researchers and drug development professionals, mastery of multiplex and long-range PCR provides essential tools for comprehensive genetic analysis, from rapid pathogen detection to the characterization of complex genomic regions underlying human disease.
The Polymerase Chain Reaction (PCR) is a foundational nucleic acid amplification technique that has profoundly reshaped molecular biology and associated fields since its invention by Kary Mullis [2] [1]. Functioning as a molecular photocopier, PCR enables the exponential amplification of specific DNA sequences from minimal starting material, achieving million-fold amplification within hours [2]. The core principle involves repeated thermal cycling through three phases: denaturation (separating DNA strands at high temperature, typically ~95°C), annealing (allowing primers to bind to complementary sequences at 55–72°C), and extension (DNA polymerase synthesizes new strands at 75–80°C) [1]. This process, facilitated by the thermostable Taq polymerase, allows for precise detection and analysis of amplified DNA, establishing PCR as the gold standard for diagnosing infections and screening genetic disorders due to its exceptional sensitivity and specificity [1].
This technical guide explores the evolution of PCR from a simple amplification tool to a sophisticated analytical platform driving precision medicine. We will examine advanced methodological adaptations, detailed experimental protocols for key applications, and the integration of machine learning to optimize amplification efficiency, all framed within the core principles of PCR amplification research.
Advancements in PCR Technologies
The continuous innovation in PCR has generated specialized methodologies tailored for specific clinical and research applications. The progression from traditional PCR to advanced forms like quantitative, digital, and microfluidic PCR has collectively enhanced sensitivity from micrograms to single molecules [2].
Core PCR Methodologies
Nested PCR: This technique employs two successive sets of primers to amplify a specific target, significantly enhancing specificity and sensitivity by reducing non-specific amplification products [2]. A primary round of amplification is performed with an outer primer pair, followed by a secondary round using inner primers that bind within the first amplicon. While this complexity makes it less precise for quantitative analysis, its high sensitivity makes it invaluable for detecting low-abundance pathogens, such as Porphyromonas gingivalis in atherosclerotic plaques [2] and hard-to-detect tick-borne pathogens [2].
Quantitative Real-Time PCR (qPCR): qPCR incorporates fluorescent reporters into the reaction system, enabling real-time monitoring of amplicon accumulation and allowing for quantitative analysis of the target nucleic acid [2]. The key quantitative parameter is the quantification cycle (Cq), the cycle number at which fluorescence exceeds a defined threshold [1]. Lower Cq values indicate higher initial target concentrations. Assay efficiency, ideally at 100% (corresponding to a doubling of product each cycle), is critical for accurate quantification [1]. Its high sensitivity and rapid turnaround time made it the cornerstone for SARS-CoV-2 diagnostics during the COVID-19 pandemic [1] [64].
Digital PCR (dPCR): dPCR represents a paradigm shift by enabling absolute quantification without standard curves. It partitions a PCR mixture into thousands of individual reactions (e.g., droplet emulsions or microchambers), allowing precise counting of target molecules at the single-DNA level [2] [64]. This partitioning makes dPCR exceptionally robust against inhibitors present in complex sample matrices and provides superior accuracy for quantifying intermediate viral loads, as demonstrated in respiratory virus diagnostics [64]. Platforms include droplet-based (ddPCR) and chip-based systems like the QIAcuity, which uses fixed nanowells for high-throughput processing [64].
Multiplex PCR (mPCR): This approach allows simultaneous amplification of multiple distinct target sequences in a single reaction by using multiple pairs of specific primers [2]. While powerful for high-throughput applications, it requires careful optimization to prevent competition between primers and the generation of false-positive products [2].
Emerging Platforms and Applications
Recent technological advancements are pushing the boundaries of PCR performance and accessibility:
Microfluidic PCR: Technologies like continuous-flow PCR, oscillating-flow PCR, and natural convective PCR integrate amplification into portable, automated platforms [2]. These systems reduce detection time and operational complexity, making them particularly valuable for point-of-care testing (POCT) in resource-limited settings and for field applications [2]. A hand-held, real-time, AI-assisted capillary convection PCR system has been developed for on-site diagnosis of pathogens like the African swine fever virus [2].
Photonic PCR: This emerging technology utilizes photothermal effects to accelerate thermal cycling, significantly reducing thermal inertia and enabling ultrafast amplification with lower energy consumption [2]. It demonstrates the potential for next-generation ultrafast, miniaturized PCR devices [2].
AI-Enhanced PCR: The application of machine vision and neural networks in digital PCR systems has significantly enhanced the accuracy of positive microchamber identification in chip-based analyses [2]. Furthermore, deep learning models, specifically one-dimensional convolutional neural networks (1D-CNNs), are now being used to predict sequence-specific amplification efficiencies in complex, multi-template PCR reactions, addressing long-standing challenges of amplification bias [6].
Table 1: Comparative Analysis of Major PCR Technologies
| Technology | Key Principle | Quantification Capability | Key Advantage | Primary Application Context |
|---|---|---|---|---|
| Traditional PCR | Endpoint detection of amplified DNA | Qualitative | Simplicity, cost-effectiveness | Initial pathogen screening, genotyping |
| Quantitative PCR (qPCR) | Fluorescence-based real-time monitoring | Relative quantification | High throughput, well-established | Gene expression, viral load monitoring [1] |
| Digital PCR (dPCR) | Limiting dilution & Poisson statistics | Absolute quantification | Superior precision, resistant to inhibitors [64] | Rare allele detection, liquid biopsies, copy number variation |
| Nested PCR | Two sequential amplification rounds | Qualitative | High specificity and sensitivity [2] | Detection of low-abundance targets (e.g., chronic infections) |
| Multiplex PCR (mPCR) | Multiple primer sets in one reaction | Qualitative/Semi-quantitative | High-plex target screening | Pathogen panels, forensic markers |
Clinical and Research Applications
PCR's versatility has made it an indispensable tool across diverse fields, from routine clinical diagnostics to cutting-edge research.
Viral Detection and Pathogen Identification
PCR is the gold standard for detecting viral pathogens due to its high sensitivity and specificity. Key applications include:
- Respiratory Infections: During the 2023–2024 "tripledemic," qPCR and dPCR were critical for detecting and quantifying influenza A/H1N1, influenza A/H3N2, influenza B, RSV, and SARS-CoV-2 [64]. dPCR demonstrated superior accuracy, particularly for high viral loads of influenza A, influenza B, and SARS-CoV-2, and for medium loads of RSV, offering greater consistency and precision than Real-Time RT-PCR [64].
- Other Viral Pathogens: PCR routinely detects human papillomavirus (HPV), herpes simplex virus (HSV), varicella-zoster virus (VZV), hepatitis viruses (B, C, D, E), enteroviruses, and cytomegalovirus (CMV) [1].
- Bacterial, Fungal, and Parasitic Detection: Real-time PCR enables rapid identification of species like Mycobacterium tuberculosis, Legionella pneumophila, Chlamydia trachomatis, Aspergillus fumigatus, and Toxoplasma gondii [1]. It is also effective in detecting antibiotic-resistant strains such as methicillin-resistant Staphylococcus aureus (MRSA) [1].
- Fulminant Diseases: The speed and sensitivity of real-time PCR make it optimal for diagnosing life-threatening conditions like meningitis and sepsis, enabling timely, targeted treatment and reducing inappropriate antibiotic use [1].
Cancer Biomarker Analysis and Genetic Research
In oncology, PCR facilitates the diagnosis and understanding of malignant diseases.
- Gene Expression Profiling: Reverse Transcription PCR (RT-PCR) and qPCR are used to evaluate quantitative differences in gene expression, helping to identify oncogenes, tumor suppressor genes, and signaling pathways involved in carcinogenesis [1].
- Mutation Detection: PCR is instrumental in screening for disease-associated mutations, both in utero and in adult samples, including point mutations and specific alleles linked to hereditary cancers [1].
- Liquid Biopsies: dPCR's ability to absolutely quantify rare alleles makes it exceptionally powerful for detecting circulating tumor DNA (ctDNA) in liquid biopsies, enabling non-invasive cancer monitoring, detection of minimal residual disease, and analysis of treatment resistance [64].
Other Key Applications
- Forensic Analysis: DNA fingerprinting for identification.
- Prenatal Genetic Testing: Screening for carrier status and genetic disorders.
- Food Safety: Detecting foodborne pathogens like Listeria monocytogenes and E. coli [1].
Experimental Protocols
This section provides detailed methodologies for key applications cited in this guide.
Application: Precise quantification of viral RNA loads for influenza A, influenza B, RSV, and SARS-CoV-2 in respiratory samples.
Workflow:
Materials & Reagents:
- Samples: 122 nasopharyngeal swabs, 1 bronchoalveolar lavage (BAL) sample.
- RNA Extraction System: KingFisher Flex system with MagMax Viral/Pathogen kit (Thermo Fisher Scientific).
- dPCR Platform: QIAcuity instrument (Qiagen) with nanowell plates (~26,000 wells).
- Assay Kits: Commercially validated primer-probe mixes specific for Influenza A, Influenza B, RSV, SARS-CoV-2, and an internal control in a 5-plex format.
- Software: QIAcuity Suite Software v.0.1 for data analysis.
Detailed Procedure:
- Nucleic Acid Extraction: Perform RNA extraction from respiratory samples using the automated KingFisher Flex system according to the manufacturer's protocol for the MagMax Viral/Pathogen kit.
- dPCR Reaction Setup: Prepare the dPCR master mix according to the commercial kit's instructions, optimizing primer and probe concentrations as necessary. Combine the extracted RNA with the master mix.
- Partitioning and Amplification: Load the reaction mixture into the QIAcuity nanowell plate. The instrument automatically partitions the sample into approximately 26,000 individual reactions. Run the endpoint PCR using the manufacturer's recommended thermal cycling protocol.
- Data Acquisition and Analysis: The QIAcuity imager reads the fluorescent signal in each well post-amplification. Use the QIAcuity Suite Software to analyze the data, which automatically calculates the absolute copy number (copies per microliter) of each target based on Poisson statistics.
Application: Relative quantification of gene expression levels in biological samples.
Workflow:
Materials & Reagents:
- RNA Extraction Kit: RNase-free reagents, including DNase I for genomic DNA removal.
- Reverse Transcriptase: Enzyme for synthesizing complementary DNA (cDNA) from RNA templates.
- qPCR Master Mix: Contains DNA polymerase, dNTPs, Mg²⁺, and optimized buffer. Choose between:
- Intercalating Dyes (e.g., SYBR Green): Cost-effective; requires amplicon specificity validation.
- Sequence-Specific Probes (e.g., TaqMan): Higher specificity; recommended for multiplexing.
- Primers and Probes: Designed for target and reference genes (see Section 5.1).
- qPCR Instrument: Real-time thermal cycler with appropriate optical system (e.g., Bio-Rad CFX96, Thermo Fisher QuantStudio 7).
Detailed Procedure:
- RNA Isolation and DNase Treatment: Extract high-quality total RNA from tissues or cells using an RNase-free protocol. Treat the RNA with DNase I to eliminate contaminating genomic DNA.
- Reverse Transcription (RT): Synthesize cDNA from the purified RNA using reverse transcriptase and oligo(dT) and/or random hexamer primers.
- qPCR Reaction Setup: Prepare reactions containing the qPCR master mix, forward and reverse primers, probe (if using), and cDNA template. Include no-template controls (NTCs) and negative controls.
- Thermal Cycling and Data Acquisition: Run the plate in the real-time PCR instrument. A standard cycling protocol includes: initial denaturation (95°C for 2-5 min), followed by 40-45 cycles of denaturation (95°C for 15-30 sec), and combined annealing/extension (60°C for 30-60 sec, with fluorescence acquisition).
- Data Analysis: Determine the Cq value for each reaction. Normalize the target gene Cq to the Cq of a stable reference gene (housekeeping gene) to calculate ΔCq. Use the ΔΔCq method to calculate relative fold-change differences between experimental and control samples, applying efficiency correction for accurate results [1].
The Scientist's Toolkit
Research Reagent Solutions
Successful PCR experiments depend on carefully selected and optimized reagents.
Table 2: Essential Reagents for PCR Experiments
| Reagent / Material | Function / Description | Key Considerations & Selection Criteria |
|---|---|---|
| DNA Polymerase | Enzyme that synthesizes new DNA strands. | Taq polymerase is thermostable and standard for routine PCR. High-fidelity enzymes are available for cloning. |
| Primers | Short, single-stranded DNA sequences that define the target region for amplification. | 18-30 bases; Tm of 60-64°C; difference between primer Tms < 2°C; GC content 35-65%; avoid self-complementarity and secondary structures (ΔG > -9 kcal/mol) [39]. |
| Hydrolysis Probes | Sequence-specific oligonucleotides with a 5' fluorophore and 3' quencher for detection in qPCR. | Tm should be 5-10°C higher than primers; avoid G at 5' end; double-quenched probes (e.g., with ZEN/TAO) reduce background fluorescence [39]. |
| dNTPs | Deoxynucleotide triphosphates (dATP, dCTP, dGTP, dTTP); the building blocks for new DNA. | Quality and concentration are critical for efficient amplification and high yield. |
| Buffer & MgCl₂ | Provides optimal ionic and pH conditions for polymerase activity. Mg²⁺ is a essential cofactor. | Mg²⁺ concentration (typically 1.5-5.0 mM) can be optimized to enhance specificity and yield. |
| Nucleic Acid Template | The DNA or RNA sample containing the target sequence to be amplified. | Purity is critical; common inhibitors include heparin, hemoglobin, and ionic detergents. Purification may be needed [1]. |
Primer and Probe Design Guidelines
Proper design is paramount for assay specificity and efficiency [39]:
- Amplicon Design: Target amplicons of 70–150 base pairs for optimal amplification. Design assays to span an exon-exon junction when working with RNA to prevent genomic DNA amplification.
- Software Tools: Utilize free online tools for design and analysis, such as IDT's OligoAnalyzer Tool (for analyzing Tm, hairpins, and dimers) and PrimerQuest Tool (for generating customized designs). Always perform a BLAST analysis to ensure primer specificity [39].
The evolution of PCR technology is characterized by a continuous push towards greater speed, sensitivity, and integration. Future directions focus on the seamless convergence of multiple advanced capabilities [2]. The market for qPCR alone is projected for significant expansion, driven by demand for precise diagnostics, with an estimated market size of USD 6,500 million by 2025 [65].
Key trends shaping the future of PCR include:
- Integration and Automation: The shift towards fully integrated, automated, high-throughput systems that combine sample preparation, amplification, and analysis streamlines workflows, reduces human error, and increases reproducibility [65].
- Point-of-Care Testing (POCT): The development of compact, portable, and user-friendly microfluidic PCR devices is decentralizing molecular diagnostics, enabling rapid on-site testing in clinics, field settings, and remote areas [2] [65].
- Artificial Intelligence and Data Science: The application of deep learning models, such as 1D-CNNs, to predict sequence-specific amplification efficiencies addresses fundamental biases in multi-template PCR, opening new avenues for optimizing DNA amplification in genomics, diagnostics, and synthetic biology [6]. AI is also being used to enhance the accuracy of analyzing dPCR results [2].
- Complementarity with Sequencing: PCR and Next-Generation Sequencing (NGS) are increasingly used in synergistic workflows, with qPCR often employed for the validation of NGS findings and for targeted, quantitative analysis [65].
In conclusion, PCR has evolved from a fundamental laboratory technique into a dynamic and versatile platform that is critical for both basic research and advanced clinical diagnostics. Its ongoing innovation, particularly in the realms of absolute quantification, miniaturization, and computational integration, ensures that PCR will remain a cornerstone of life sciences, propelling further advancements in precision medicine and molecular analysis.
Maximizing PCR Performance: A Scientist's Guide to Troubleshooting and Optimization
The Polymerase Chain Reaction (PCR) is a foundational technique in molecular biology, enabling the exponential amplification of specific DNA fragments from complex mixtures. Its revolutionary impact spans diagnostic testing, pathogen detection, genetic disorder screening, and fundamental biomedical research [66] [1]. Despite its widespread adoption and apparent simplicity, the intricate biochemistry of PCR is susceptible to a range of pitfalls that can compromise experimental results. These challenges primarily manifest as a complete lack of amplification, low product yield, or the generation of non-specific bands. Success hinges on the precise optimization of reaction components and cycling conditions [66] [67]. This guide provides an in-depth technical examination of these common PCR pitfalls, framing the troubleshooting process within the core principles of PCR amplification research to equip scientists with the knowledge to achieve robust and reliable results.
The Core Principles of PCR Amplification
A thorough understanding of PCR dynamics is essential for effective troubleshooting. The process involves repeated thermal cycling through three fundamental steps: denaturation (separating double-stranded DNA), annealing (allowing primers to bind to complementary sequences), and extension (synthesizing new DNA strands) [1]. Theoretically, amplification follows an exponential curve, doubling the DNA product with each cycle. However, in practice, the reaction eventually plateaus as reagents are depleted, the polymerase loses efficiency, and inhibitory products accumulate [68].
The stringency of the reaction is a critical concept, determined by factors such as annealing temperature and magnesium ion (Mg²⁺) concentration. A reaction with low stringency (e.g., low annealing temperature) may yield non-specific products, whereas a reaction with high stringency (e.g., high annealing temperature) might produce no product at all [66]. The goal of optimization is to find the perfect balance where conditions are stringent enough to ensure specific primer binding but permissive enough to allow efficient amplification of the intended target.
The following workflow outlines a systematic approach to diagnosing and resolving the most frequent PCR problems:
Troubleshooting Common PCR Pitfalls
No Amplification or Low Yield
A failure to generate any visible product or obtaining a low yield is a frequent challenge with several potential culprits, ranging from reagent quality to cycling parameters.
Table 1: Causes and Solutions for No Amplification/Low Yield
| Category | Specific Cause | Recommended Solution |
|---|---|---|
| Template DNA | Poor integrity or degradation [66] [69] | Re-purify template; assess integrity via gel electrophoresis [70] [71]. |
| Low purity (PCR inhibitors present) [66] [1] | Re-purify using ethanol precipitation or specialized kits to remove salts, phenol, or proteins [69]. | |
| Insufficient quantity [66] | Use 10-200 ng of genomic DNA; for plasmids, use 1 pg-10 ng per 50 μL reaction [66] [71]. | |
| High complexity (e.g., GC-rich regions) [67] [69] | Use PCR additives like DMSO (1-10%), formamide (1.25-10%), or betaine [66] [67]. | |
| Primers | Poor design or specificity [71] | Redesign primers (length: 15-30 nt; GC: 40-60%; Tm: 52-68°C) [72] [67]. |
| Degraded or old stocks [69] | Aliquot primers to minimize freeze-thaw cycles; prepare fresh stocks [73]. | |
| Low concentration [71] | Optimize final concentration, typically between 0.1-1 μM (often 0.4-0.5 μM works well) [68] [67]. | |
| Reaction Components | Incorrect Mg²⁺ concentration [66] | Optimize Mg²⁺ concentration, typically between 0.5-5.0 mM, as it is a critical cofactor [67] [69]. |
| Degraded or unbalanced dNTPs [71] | Use fresh, aliquoted dNTPs with balanced equimolar concentrations (20-200 μM each) [70] [67]. | |
| Insufficient or inactive polymerase [66] | Use a hot-start polymerase to prevent pre-extension activity; ensure enzyme is fresh and stored properly [68] [69]. | |
| Cycling Conditions | Annealing temperature too high [66] | Use a gradient thermal cycler to determine the optimal temperature, often 3-5°C below the primer Tm [70] [69]. |
| Insufficient number of cycles [71] | Increase cycle number to 30-40, particularly for low-copy-number templates [68]. | |
| Extension time too short [71] | Ensure extension time is sufficient for the amplicon length (e.g., 1 min/kb for standard polymerases) [67]. |
Non-Specific Bands and Primer-Dimer Formation
The appearance of multiple bands or a smear on an agarose gel, often alongside the desired product, indicates a lack of reaction specificity. Primer-dimer, a short, spurious product formed by the self-annealing of primers, is a common subtype of this issue [66].
Table 2: Causes and Solutions for Non-Specific Bands and Primer-Dimer
| Category | Specific Cause | Recommended Solution |
|---|---|---|
| Reaction Stringency | Annealing temperature too low [66] [71] | Increase annealing temperature incrementally (e.g., in 1-2°C steps) [70] [69]. |
| Excessive Mg²⁺ concentration [69] | Lower Mg²⁺ concentration, as high levels reduce fidelity and promote non-specific binding [69]. | |
| Primers | High primer concentration [66] [69] | Reduce primer concentration to within the optimal range of 0.1-1 μM to minimize primer-dimer risk [68] [67]. |
| Complementarity at 3' ends [67] | Redesign primers to avoid 3' complementarity, which promotes primer-dimer formation [66] [69]. | |
| Binding to off-target sequences [66] | Use BLAST or other tools to check primer specificity; consider increasing primer length for greater specificity [70] [72]. | |
| Polymerase & Setup | Non-hot-start polymerase activity [66] | Switch to a hot-start polymerase, which is inactive until heated, preventing mis-priming during reaction setup [68] [69]. |
| Excess enzyme [69] | Reduce the amount of polymerase in the reaction [69]. | |
| Template concentration too high [66] | Use less template DNA to reduce the likelihood of non-specific priming events [70]. | |
| Cycling Conditions | Too many cycles [69] | Reduce the number of cycles (e.g., to 25-35) to prevent the accumulation of non-specific products late in the reaction [69]. |
Detailed Experimental Protocols for Optimization
Protocol 1: Optimizing Annealing Temperature Using a Gradient PCR
The annealing temperature is one of the most critical parameters for specificity [66].
- Reaction Setup: Prepare a master mix containing all standard PCR components: template DNA, primers, dNTPs, polymerase, and buffer with Mg²⁺. Aliquot the master mix evenly across a row of PCR tubes or wells.
- Thermal Cycling: Program the thermal cycler to run a gradient across the selected row during the annealing step. The gradient should span a range of temperatures, for example, from 5°C below the lowest primer Tm to 10°C below it in 1°C increments [70].
- Analysis: Resolve the PCR products using agarose gel electrophoresis. The optimal annealing temperature is the highest temperature that produces a strong, specific band of the expected size.
Protocol 2: Magnesium Titration for Reaction Efficiency
Mg²⁺ is an essential cofactor for DNA polymerase, and its concentration can dramatically affect yield and specificity [66] [67].
- Reaction Setup: Prepare a set of reactions where the Mg²⁺ concentration is varied. A typical range is 0.5 mM to 5.0 mM in 0.5 mM increments. It is crucial that the buffer used does not already contain Mg²⁺, or this must be accounted for in the final concentration.
- Thermal Cycling: Run all reactions using the same cycling protocol, with an annealing temperature based on prior knowledge or a gradient result.
- Analysis: Analyze the products by gel electrophoresis. Identify the Mg²⁺ concentration that yields the strongest specific product with the least background.
The Scientist's Toolkit: Essential Research Reagent Solutions
Selecting the right reagents is paramount for successful PCR. The following table details key components and their optimized functions.
Table 3: Key Research Reagent Solutions for PCR
| Reagent / Solution | Function & Role in Amplification | Optimization Tips |
|---|---|---|
| Hot-Start DNA Polymerase | A modified enzyme inactive at room temperature, preventing non-specific amplification and primer-dimer formation during reaction setup [66] [67]. | Choose based on application: standard Taq for routine PCR, high-fidelity proofreading enzymes (e.g., Pfu) for cloning [67]. |
| PCR Additives (DMSO, BSA, Betaine) | Modifies nucleic acid melting behavior. DMSO disrupts secondary structures in GC-rich templates; BSA binds inhibitors; betaine equalizes Tm [66] [67]. | Titrate concentrations (e.g., DMSO at 1-10%, BSA at 400 ng/μL) as high amounts can inhibit the polymerase [67] [69]. |
| MgCl₂ / MgSO₄ Solution | Serves as an essential cofactor for DNA polymerase activity. Concentration directly influences primer annealing, specificity, and enzyme fidelity [66] [67]. | Requires optimization for each primer-template system. Note that some polymerases (e.g., Pfu) perform better with MgSO₄ [69]. |
| dNTP Mix | The building blocks (dATP, dCTP, dGTP, dTTP) for nascent DNA strand synthesis [67]. | Use balanced, equimolar concentrations (e.g., 200 μM each). Aliquot to prevent degradation from repeated freeze-thaw cycles [70] [69]. |
| High-Quality Primer Pairs | Short, single-stranded DNA sequences that define the start and end points of amplification by binding complementarily to the template [1]. | Design with optimal length (15-30 nt), GC content (40-60%), and Tm. Avoid self-complementarity. Resuspend and store properly [72] [67]. |
Navigating the common pitfalls of PCR—whether no amplification, low yield, or non-specific bands—requires a systematic and principled approach. The process is inherently an exercise in optimization, balancing the stringency and efficiency of the enzymatic reaction. By methodically investigating template quality, primer design, reagent concentrations, and thermal cycling parameters, researchers can transform a failing PCR into a robust and reliable assay. The principles and protocols outlined in this guide provide a framework for this troubleshooting process, empowering scientists to advance their research with confidence. As PCR continues to be a cornerstone technique in life sciences and drug development, mastering its nuances remains an essential skill for every researcher.
In the realm of polymerase chain reaction (PCR) research, effective amplification serves as the cornerstone for countless molecular biology applications, from gene cloning to diagnostic assay development. At the heart of every successful PCR experiment lies a fundamentally sound primer design. Primers, the short single-stranded DNA fragments that initiate DNA synthesis, determine the specificity, efficiency, and yield of the amplification process [74] [75]. Poorly designed primers can lead to a cascade of experimental failures, including non-specific amplification, primer-dimer formation, and complete absence of the desired product. For researchers and drug development professionals, mastering primer design is not merely a technical exercise but a critical competency that directly impacts research validity and development timelines. This whitepaper establishes a comprehensive framework for primer design mastery, focusing on the core principles of optimal length, melting temperature (Tm), GC content, and dimer avoidance within the broader context of PCR amplification research.
Core Parameters for Optimal Primer Design
The efficacy of a primer is governed by several interdependent physicochemical properties. Balancing these parameters is essential for creating robust PCR assays that perform reliably under standard thermal cycling conditions.
Primer Length and Specificity
Primer length directly influences both specificity and hybridization efficiency. The optimal length for PCR primers generally falls between 18 and 30 nucleotides [74] [76] [75]. This range provides a perfect equilibrium; shorter primers (below 18 bases) may lack the specificity required to bind uniquely to a single site in complex genomic DNA, while excessively long primers (over 30 bases) exhibit slower hybridization rates and reduced annealing efficiency [77]. For homogeneous templates, such as plasmids, primers at the shorter end of this spectrum are often adequate. However, for complex backgrounds like genomic DNA, longer primers (e.g., 24-30 nucleotides) are recommended to enhance specificity and prevent off-target binding [75].
Melting Temperature (Tm) and Annealing Temperature
The melting temperature (Tm) is the temperature at which 50% of the DNA duplex dissociates into single strands and is a critical determinant for selecting the PCR annealing temperature (Ta) [77]. Primer pairs should be designed to have Tm values within 5°C of each other to ensure both primers bind to their respective targets with similar efficiency during the annealing step [74] [75]. The ideal Tm range for primers is between 65°C and 75°C [74], though a range of 54°C to 65°C is also commonly effective [77]. The annealing temperature is typically set 2-5°C below the Tm of the primers [77]. Several formulas can calculate Tm, with the choice depending on primer length and reaction conditions, as summarized in Table 1.
Table 1: Common Methods for Calculating Primer Melting Temperature (Tm)
| Calculation Method | Formula | Applicability | Key Assumptions |
|---|---|---|---|
| Basic Rule of Thumb [77] | Tm = 4(G+C) + 2(A+T) | Quick estimation | Na+-only buffers; less accurate for long primers. |
| Salt-Adjusted Equation [77] | Tm = 81.5 + 16.6(log[Na+]) + 0.41(%GC) – 675/(primer length) | Longer primers (>13 nt) | Accounts for monovalent ion concentration and GC content. |
| Modified Thermodynamics [78] | (Algorithm-based, e.g., Allawi & SantaLucia) | Most accurate for modern polymerases | Considers nearest-neighbor interactions and precise buffer composition. |
GC Content and Sequence Distribution
GC content, the percentage of guanine and cytosine bases in the primer, affects the strength of the primer-template binding due to the three hydrogen bonds in G-C base pairs versus two in A-T pairs [77]. The optimal GC content for a primer is between 40% and 60% [74] [77] [75]. A content below 40% can result in primers that bind too weakly, while exceeding 60% increases the risk of non-specific, high-affinity binding [77]. Furthermore, the sequence should avoid mononucleotide repeats (e.g., ACCCC) or dinucleotide repeats (e.g., ATATATAT), as these can complicate synthesis and promote mispriming [74] [75]. It is also crucial to ensure a balanced distribution of GC-rich and AT-rich domains and to avoid regions of secondary structure in the template [74]. A GC clamp—the presence of one or two G or C bases at the 3' end of the primer—strengthens the terminal binding thanks to the stronger hydrogen bonding of GC pairs [74] [77]. However, more than three G or C bases at the 3' end should be avoided, as this can promote non-specific binding [77].
Avoiding Primer-Dimers and Secondary Structures
A critical aspect of primer design is minimizing interactions that lead to primer-dimer artifacts and secondary structures. Primer-dimers are short, unintended amplification products that form when primers anneal to each other via complementary sequences, rather than to the template DNA [79] [80]. This consumes reaction reagents and reduces the yield of the desired product. Similarly, primers should be free of self-complementarity to prevent hairpin loops, where a single primer folds back on itself [74] [77]. These secondary structures can obstruct the DNA polymerase, leading to failed amplification. To prevent these issues, designers must avoid intra-primer homology (more than 3 bases that complement within the primer) and inter-primer homology (complementary sequences between the forward and reverse primers, especially at their 3' ends) [74] [75]. The following workflow outlines a logical process for designing primers while proactively avoiding these pitfalls.
Experimental Protocols and Optimization Strategies
In Silico Design and Analysis Protocol
The primer design process begins with computational analysis before any wet-bench experimentation.
- Sequence Retrieval and Target Identification: Acquire the target DNA sequence from a trusted database (e.g., NCBI). Identify the precise region to be amplified.
- Primer Sequence Selection: Using dedicated software, select forward and reverse primer sequences that are 18-30 nucleotides long and have a GC content between 40-60%.
- Computational Validation: Subject the candidate primer sequences to analysis with tools like the IDT OligoAnalyzer [76] or NEB Tm Calculator [81]. Key parameters to check include:
- Self-Complementarity: Keep the score low to prevent hairpins.
- Self 3'-Complementarity: This must be especially low to prevent primer-dimer formation.
- Hetero-Dimer Formation: Analyze the interaction between the forward and reverse primers to ensure they lack complementary regions.
- Specificity Check: Perform an in silico PCR or a BLAST search against the appropriate genome database to confirm the primers will bind uniquely to the intended target.
- Final Selection: Choose the primer pair with the most balanced properties (length, Tm, GC content) and the lowest potential for forming secondary structures or dimers.
Wet-Bench Optimization and Troubleshooting
Even well-designed primers require empirical optimization. The following protocol outlines a systematic approach to validating and refining PCR conditions.
- Reconstitution and Dilution: Resuspend the synthesized primers in sterile, nuclease-free water or TE buffer to create a concentrated stock (e.g., 100 µM). Prepare a working solution (e.g., 10 µM) to use in PCR setups. Accurate concentration measurement via spectrophotometer is critical [75].
- Initial PCR Setup: Set up the initial reaction using the DNA polymerase manufacturer's recommended protocol, including buffer, dNTPs, and MgCl₂.
- Annealing Temperature Gradient: Perform a thermal cycling reaction using an annealing temperature gradient, starting about 6–10°C below the calculated Tm and increasing up to the extension temperature [78]. This is the most effective single step for optimizing specificity.
- No-Template Control (NTC): Always include an NTC containing all reaction components except the template DNA. The appearance of amplification products in the NTC indicates primer-dimer formation or contamination [79].
- Analysis: Analyze the PCR products and the NTC on an agarose gel. A successful reaction will show a single, sharp band of the expected size in the sample lanes and a clear NTC.
When primer-dimers are observed, a systematic troubleshooting workflow, as detailed below, is essential to resolve the issue.
The Scientist's Toolkit: Research Reagent Solutions
Selecting the right reagents is paramount for translating a theoretical primer design into a successful experimental outcome. The following table catalogues essential materials and their functions in PCR setup and optimization.
Table 2: Essential Research Reagents for PCR Primer Design and Optimization
| Reagent / Tool | Function / Application | Key Considerations |
|---|---|---|
| Hot-Start DNA Polymerase | Minimizes non-specific amplification and primer-dimer formation by remaining inactive until a high-temperature activation step [79] [80]. | Critical for complex templates or multiplex PCR. Different polymerases offer varying fidelity and processivity. |
| HPLC-Purified Primers | Provides high-purity primers by removing short synthesis byproducts that can compete for annealing and lead to non-specific artifacts [74] [75]. | Recommended for cloning applications and critical assays. |
| Tm Calculator (e.g., NEB, ThermoFisher) | Accurately calculates primer melting temperature and suggests optimal annealing temperatures based on specific polymerase and buffer chemistry [78] [81]. | More reliable than simple formulas as it accounts for precise buffer composition. |
| Primer Design Software (e.g., IDT OligoAnalyzer) | Evaluates primer sequences for Tm, secondary structures (hairpins), self-dimers, and cross-dimers during the in silico design phase [76] [77]. | An essential first step to identify and eliminate problematic primers before synthesis. |
| No-Template Control (NTC) | A critical quality control reaction to detect contamination or primer-dimer formation independent of the template [79]. | Should always be run alongside experimental samples. A clean NTC confirms assay specificity. |
Mastering the principles of primer design—optimal length, Tm balancing, appropriate GC content, and the proactive avoidance of secondary structures and dimers—is a fundamental requirement for robust and reproducible PCR amplification. This mastery directly fuels progress in pharmaceutical research and development, where the integrity of genetic data is non-negotiable. By adhering to the guidelines and protocols outlined in this whitepaper, researchers can systematically overcome common PCR challenges, minimize experimental artifacts, and ensure that their results truly reflect the biological phenomena under investigation. In the rigorous context of drug development, where efficiency and accuracy are paramount, a disciplined approach to primer design is not just a best practice; it is a critical determinant of success.
The polymerase chain reaction (PCR) remains a cornerstone technique in molecular biology, with its efficacy critically dependent on the precise optimization of reaction conditions. This whitepaper synthesizes current research to provide a rigorous framework for optimizing magnesium ion (Mg2+) concentration, buffer chemistry, and thermal cycling parameters. Evidence demonstrates that systematic calibration of these components is not merely procedural but fundamental to achieving high amplification efficiency, specificity, and fidelity, directly impacting the success of downstream applications in diagnostics, drug development, and genetic research [82] [83]. The following sections provide detailed protocols and quantitative guidelines to empower researchers in developing robust, reproducible PCR assays.
Magnesium Ion (Mg2+) Concentration Optimization
As an essential cofactor for DNA polymerase, Mg2+ concentration is a primary determinant of PCR success. It influences enzyme activity, primer-template annealing stability, and reaction fidelity. A 2025 meta-analysis of 61 studies established a clear quantitative relationship between MgCl2 concentration and DNA melting temperature, providing an evidence-based starting point for optimization [82].
Quantitative Effects and Recommended Ranges
Table 1: Effects of MgCl2 Concentration on PCR Efficiency and Specificity
| MgCl2 Concentration | Impact on PCR Process | Effect on Reaction Output |
|---|---|---|
| < 1.0 mM | Reduced polymerase activity; unstable primer-template duplex. | Low or failed yield [83]. |
| 1.5 - 3.0 mM (Optimal Range) | Optimal enzyme function and duplex stability. A 0.5 mM increase raises Tm by ~1.2°C [82]. | High efficiency and specificity [82] [67]. |
| > 3.0 mM | Decreased specificity; promotes non-specific primer binding; reduces fidelity [83]. | Non-specific amplification; smeared or multiple bands on gel electrophoresis [83]. |
Template-Dependent Optimization
The optimal Mg2+ concentration is not universal and must be tailored to the template DNA. The meta-analysis found that genomic DNA, due to its complexity, generally requires higher Mg2+ concentrations than simpler plasmid or PCR product templates [82]. Furthermore, templates with high GC content often benefit from marginally higher Mg2+ concentrations to stabilize the DNA duplex.
Experimental Protocol: Mg2+ Titration
Objective: To empirically determine the optimal MgCl2 concentration for a specific primer-template system.
Methodology:
- Prepare a master mix containing all standard PCR components: template DNA, primers, dNTPs, polymerase, and buffer—excluding MgCl2.
- Aliquot the master mix into separate reaction tubes.
- Add MgCl2 from a stock solution to each tube to create a concentration gradient. A standard titration range is 1.0 mM to 3.0 mM in increments of 0.5 mM [82] [67].
- Run the PCR cycles using standard conditions for the target.
- Analyze the results using agarose gel electrophoresis. The optimal condition produces a single, intense band of the expected size with minimal to no non-specific products.
PCR Cycling Parameters
Thermal cycling conditions control the denaturation, annealing, and extension of the DNA template. While conventional protocols are well-established, recent research demonstrates that shortened cycling times can maintain high yield while improving productivity and laboratory sustainability [84].
Parameter-Specific Optimization Guidelines
Table 2: Optimization of PCR Cycling Parameters
| Cycling Step | Typical Parameters | Optimization Guidelines | Influencing Factors |
|---|---|---|---|
| Initial Denaturation | 94-98°C for 1-3 min [9] | Increase time (up to 5 min) for GC-rich templates or complex gDNA [9] [67]. | DNA complexity, GC content, buffer salts [9]. |
| Denaturation | 94-98°C for 10-60 sec/cycle [9] [67] | Use shortest effective time to preserve polymerase activity. | |
| Annealing | 5°C below Tm for 30-60 sec/cycle [9] | Critical for specificity. Use gradient PCR. Start 3-5°C below primer Tm, adjust in 2-3°C increments [9]. | Primer Tm, presence of additives (DMSO lowers Tm) [9] [67]. |
| Extension | 70-80°C; 1-2 min/kb/cycle [9] [67] | Varies with polymerase speed and amplicon length. "Fast" enzymes require less time [9]. | DNA polymerase type, amplicon length [9]. |
| Cycle Number | 25-35 cycles [9] | Use minimum cycles needed for sufficient yield. >45 cycles increases nonspecific products [9]. | Template copy number. |
| Final Extension | 70-80°C for 5-15 min [9] | Ensure full-length product; crucial for TA cloning (30 min recommended) [9]. | Amplicon length, polymerase activity. |
Advanced Protocol: Shortened Cycling for Enhanced Sustainability
A 2024 study successfully amplified a 1466 bp 16S rRNA fragment from bacteria with varying GC content using significantly shortened cycles, demonstrating that protocol durations can often be reduced without sacrificing yield [84].
Methodology:
- Target: 1466 bp 16S rRNA gene fragment.
- Cycling Parameters:
- Denaturation: 5 seconds
- Annealing: 25 seconds
- Extension: 25 seconds
- Total Cycles: 30
- Result: The shortened protocol reduced program duration by 46% and electricity consumption by 50% compared to a typical 16S PCR protocol, while still producing amplicon with sufficient yield for downstream sequencing [84].
The Scientist's Toolkit: Essential Reagents for PCR Optimization
Table 3: Key Reagents and Their Functions in PCR Optimization
| Reagent / Tool | Function / Purpose | Application Notes |
|---|---|---|
| MgCl₂ Solution | Essential cofactor for DNA polymerase activity [83] [67]. | Titration is critical; typical optimal range 1.5-3.0 mM [82]. |
| Thermostable DNA Polymerase | Catalyzes DNA synthesis. Choice affects fidelity, speed, and specificity. | High-Fidelity (e.g., Pfu): For cloning. Hot-Start Taq: Reduces pre-cycling mispriming [83] [67]. |
| dNTP Mix | Building blocks for new DNA strands. | Use balanced concentrations (typically 20-200 µM each); excess can reduce fidelity [67]. |
| PCR Buffer (with KCl, Tris-HCl) | Provides optimal ionic environment and pH for polymerase activity. | Tris buffer maintains pH ~8.0-8.5 at room temperature; pH shifts during cycling [83]. |
| GC-Rich Enhancers / Additives | Improve amplification of difficult templates. | DMSO (1-10%): Disrupts secondary structures [83] [67]. Betaine (1-2 M): Homogenizes base-pair stability [83]. |
| Gradient Thermal Cycler | Allows empirical testing of different annealing temperatures in a single run. | Essential for efficient annealing temperature optimization [9]. |
Integrated Experimental Workflow for PCR Optimization
A systematic approach that interlinks Mg2+ concentration, buffer conditions, and cycling parameters is required for developing a robust PCR assay. The following workflow diagrams the logical progression from initial setup to final validation.
The optimization of Mg2+ concentration, buffer conditions, and cycling parameters is a foundational principle in PCR amplification research. As evidenced by recent studies, a deliberate and iterative optimization strategy, moving beyond "one-size-fits-all" protocols, is critical for assay success. The quantitative guidelines and detailed protocols provided here serve as a blueprint for researchers to achieve high efficiency, specificity, and fidelity in their amplification experiments. By adopting these evidence-based practices, scientists and drug development professionals can enhance the reliability of their molecular data, thereby accelerating discoveries and diagnostic advancements.
The polymerase chain reaction (PCR) stands as a cornerstone technique in molecular biology, genomics, and diagnostic research. Its principle of amplifying specific DNA sequences from minimal input material is fundamental to advancements in disease research, drug development, and genetic analysis. However, the technique's exquisite sensitivity also renders it vulnerable to two major challenges that can compromise experimental integrity: contamination from extraneous nucleic acids and inhibition by substances co-purified with the target template [85] [86]. Contamination can lead to false-positive results, eroding the reliability of findings, while inhibition can cause false negatives, reduced sensitivity, and inaccurate quantification [85] [86]. Within the context of rigorous PCR amplification research, implementing a systematic defense against these issues is not merely good practice but a fundamental prerequisite for generating reproducible and valid data. This guide provides an in-depth examination of the sources of contamination and inhibition and outlines a comprehensive, actionable strategy to combat them.
Understanding and Preventing PCR Contamination
PCR contamination primarily arises from two sources: cross-contamination between samples and carryover contamination from amplification products of previous PCR reactions [86]. A single aerosol droplet of a previous PCR amplicon can contain as many as 10^6 copies of the product, posing a significant risk for false positives in subsequent runs [85]. The consequences are severe, ranging from erroneous data publication to misdiagnosis in clinical settings, with documented cases of patient mismanagement linked to false-positive PCR results [85].
A Multi-Barrier Defense Strategy
A robust contamination control plan employs multiple, redundant barriers, encompassing laboratory workflow, techniques, and enzymatic controls.
Physical Separation and Workflow Design: The most effective single measure is the physical separation of laboratory activities [85] [87] [88]. A unidirectional workflow must be established across at least three distinct areas:
- Reagent Preparation Area: A dedicated, clean space for preparing and aliquoting PCR master mixes. This area must be free of templates and amplified products [87].
- Sample Preparation Area: A separate space for nucleic acid extraction and template addition. This area should operate under negative air pressure to contain template nucleic acids [87].
- Amplification and Analysis Area: A confined space for thermocycling and post-PCR analysis, also under negative pressure to prevent the escape of amplicons [87]. Movement of personnel, equipment, and consumables must be strictly unidirectional, from pre-amplification to post-amplification areas, with no return [87] [88].
Meticulous Laboratory Practice: Technical practices are critical for preventing aerosol generation and transfer.
- Decontamination: Regularly clean work surfaces and equipment with 10% sodium hypochlorite (bleach), which causes oxidative damage to nucleic acids, followed by ethanol to remove the bleach [85] [87] [88]. UV irradiation can also be used to decontaminate surfaces and equipment by inducing thymidine dimers in DNA [85].
- Pipetting: Use aerosol-resistant filter tips and positive-displacement pipettes [86] [88].
- Handling: Open tubes carefully, spin them down before opening, and keep them capped as much as possible [86] [87].
- Reagents: Aliquot all reagents into single-use volumes to avoid contaminating entire stocks [86] [88].
Experimental and Enzymatic Controls:
- No-Template Controls (NTCs): The essential diagnostic for contamination. NTCs contain all reaction components except the template DNA. Any amplification in the NTC indicates contamination [86] [88].
- Uracil-N-Glycosylase (UNG): This enzymatic method is the most widely used for preventing carryover contamination [85] [88]. In this system, dTTP in the PCR master mix is replaced with dUTP. Consequently, all newly synthesized amplicons incorporate uracil. In subsequent reactions, UNG enzyme is added to the master mix. It hydrolyzes any uracil-containing contaminant amplicons prior to PCR thermal cycling. The UNG is then inactivated during the initial high-temperature denaturation step, allowing the new PCR to proceed with native DNA template [85]. It is most effective for thymine-rich amplicons and less so for GC-rich targets [85] [88].
The following workflow diagram summarizes the core principles of a contamination-free PCR laboratory setup and practice:
Understanding and Overcoming PCR Inhibition
PCR inhibition occurs when substances in the sample prevent or reduce the efficiency of the amplification reaction. These inhibitors can act through various mechanisms, including degrading or sequestering nucleic acids, chelating essential metal ions like Mg²⁺, or directly inhibiting DNA polymerase activity [89]. Common inhibitors include polyphenolics (humic and fulvic acids, tannins), melanin, complex polysaccharides, bile salts, hemoglobin, and calcium carbonate [90] [91] [89]. The source of inhibition can be the original sample matrix (e.g., soil, blood, wastewater) or can be introduced during the DNA extraction process [91] [92].
Strategic Approaches to Mitigate Inhibition
A multi-pronged approach is often necessary to effectively overcome inhibition.
Sample Pre-treatment and DNA Extraction Optimization: The first line of defense is a DNA extraction method optimized for the specific sample type. This may involve mechanical lysis enhancements, the use of specific buffers like cetyltrimethylammonium bromide (CTAB) to complex polysaccharides and polyphenolics, or incorporating purification steps with Chelex-100 resin to chelate metal ions that act as DNase cofactors [91] [92].
Post-Extraction Purification: Commercial inhibitor removal kits are highly effective for cleaning DNA extracts. These kits often contain column matrices specifically designed to bind and remove common inhibitors like humic acids, tannins, and melanin [90] [89]. One such kit has been demonstrated to efficiently eliminate polyphenolics, yielding DNA and RNA with ≥80% recovery and ready for enzymatic reactions [90].
PCR Enhancement Reagents: The strategic addition of specific compounds to the PCR mix can neutralize the effects of many inhibitors. The table below summarizes key PCR enhancers, their mechanisms of action, and effective concentrations.
Table 1: Common PCR Enhancers and Their Applications
| Additive | Mechanism of Action | Effective Concentration | Notes and Applications |
|---|---|---|---|
| BSA | Binds to inhibitors (e.g., polyphenolics), preventing them from interacting with the polymerase [89]. | 0.1 - 0.8 µg/µL | Inert protein; effective against a broad range of inhibitors in complex samples like wastewater [89]. |
| T4 gp32 | Single-stranded DNA binding protein that stabilizes DNA, prevents secondary structure, and binds inhibitors like humic acids [89]. | 0.2 µg/µL | Found to be one of the most effective additives for removing inhibition in wastewater samples [89]. |
| DMSO | Disrupts base pairing, reducing the melting temperature of DNA and preventing secondary structure formation [93]. | 1 - 10% | Particularly useful for amplifying GC-rich templates (>60% GC) [93]. |
| Betaine | Equalizes the contribution of GC and AT base pairs to DNA stability, reducing secondary structure in GC-rich regions [93]. | 0.5 - 1.5 M | Also known as trimethylglycine; often used in combination with DMSO for challenging GC-rich targets [93]. |
| Formamide | Destabilizes DNA double helix, similar to DMSO, aiding in denaturation of difficult templates [89] [93]. | 1 - 5% | Can be used as a PCR enhancer, though efficacy can vary [89]. |
| Glycerol | Stabilizes enzymes and can improve PCR efficiency and specificity [89]. | 5 - 10% | Helps protect DNA polymerase from denaturation [89]. |
- Dilution and Alternative Polymerases: A simple but effective strategy is to dilute the extracted DNA sample. This dilutes the inhibitors to a sub-critical concentration but also dilutes the target DNA, which can reduce sensitivity and is not suitable for low-copy-number targets [89]. Furthermore, selecting inhibitor-tolerant DNA polymerases engineered for robustness in the presence of common inhibitors can significantly improve performance [89].
The following workflow provides a systematic experimental approach for diagnosing and overcoming PCR inhibition:
Specialized Challenges and Solutions
Amplifying GC-Rich Templates
Genes with a high GC content (>60%) present a unique challenge due to strong hydrogen bonding and the formation of stable secondary structures that hinder polymerase progression [93]. A multi-faceted optimization is required:
- Additives: Use a combination of DMSO (1-10%) and Betaine (0.5-1.5 M) to destabilize secondary structures and equalize the melting temperatures of GC and AT regions [93].
- Polymerase Choice: Employ high-fidelity, proofreading polymerases specifically formulated with GC buffers [93].
- PCR Cycling Conditions: Implement touchdown or slow-down PCR protocols, and consider increasing the denaturation temperature [93].
- Primer Design: Design longer primers with melting temperatures optimized for the specific protocol [93].
Low-Biomass and Microbiome Studies
In studies of samples with expected low bacterial burden (e.g., tissue microbiomes, air samples), contamination from laboratory reagents themselves becomes a critical concern [94]. This has led to the concept of the "kitome" – contaminating bacterial DNA present in DNA extraction kits and PCR reagents [94].
- Critical Practices: It is essential to include multiple negative control reactions (e.g., water blanks processed through extraction and amplification) to identify contaminating DNA sequences [94].
- Experimental Validation: A recent study found bacterial DNA contamination in seven out of nine commercial PCR enzymes, detectable via endpoint PCR and Sanger sequencing [94]. This underscores the need for rigorous reagent quality control in sensitive applications.
The Scientist's Toolkit: Essential Reagents for Contamination and Inhibition Control
Table 2: Key Research Reagent Solutions
| Reagent / Kit | Function | Specific Application Example |
|---|---|---|
| UNG/dUTP System | Enzymatic degradation of carryover contamination from previous PCRs [85] [88]. | Standard pre-amplification step in diagnostic qPCR assays to prevent false positives. |
| Inhibitor Removal Kits | Silica-column or chemical-based removal of polyphenolics, humics, tannins, and other inhibitors from DNA/RNA extracts [90]. | Cleaning DNA extracted from complex matrices like soil, wastewater, or plant material prior to PCR [90] [89]. |
| T4 Gene 32 Protein (gp32) | Single-stranded DNA binding protein that stabilizes DNA and binds inhibitors, enhancing PCR robustness [89]. | Added to PCR mix for efficient amplification from highly inhibitory samples like wastewater (at 0.2 µg/µL) [89]. |
| BSA | Binds to a wide range of PCR inhibitors, preventing their interaction with the polymerase [89]. | A general-purpose additive to mitigate inhibition in samples like blood, plant, and fecal DNA. |
| DMSO & Betaine | Additives that destabilize DNA secondary structures and reduce DNA melting temperature [93]. | Critical for the successful amplification of GC-rich DNA sequences (>60% GC). |
| Inhibitor-Tolerant Polymerases | Engineered DNA polymerases resistant to common inhibitors found in complex samples. | Amplification directly from crude samples or samples where purification is inefficient. |
Combating contamination and inhibition is a non-negotiable aspect of PCR research that demands a systematic and vigilant approach. There is no single solution; rather, success lies in implementing a multi-layered defense strategy. This includes establishing a rigorous laboratory workflow with physical separation of pre- and post-PCR activities, routinely employing negative controls for diagnostics, and strategically utilizing enzymatic and chemical additives like UNG and PCR enhancers. Furthermore, researchers must tailor their approach to their specific sample type and target, whether that involves optimizing DNA extraction for shells of endangered species [91], using T4 gp32 for wastewater analysis [89], or combining DMSO and betaine for GC-rich genes [93]. By integrating these principles and tools into their daily practice, researchers and drug development professionals can ensure the generation of reliable, high-quality data that forms a solid foundation for scientific discovery and diagnostic accuracy.
The polymerase chain reaction (PCR) is a foundational technique in molecular biology, yet the amplification of difficult DNA templates remains a significant challenge that tests our understanding of the underlying biochemical principles. Templates characterized by high GC content (>60%), complex secondary structures, or the presence of PCR inhibitors in sample matrices often lead to complete amplification failure or unsatisfactory yields [61] [95]. These challenges arise from fundamental molecular interactions: GC-rich sequences form stable secondary structures that impede polymerase progression, while inhibitors present in complex biological samples can sequester essential cofactors or directly inhibit enzyme activity [89] [96].
Within this framework, PCR additives serve as crucial tools for manipulating reaction dynamics to favor specific amplification. Among the most effective enhancements are dimethyl sulfoxide (DMSO), betaine, and bovine serum albumin (BSA), which act through distinct yet potentially complementary mechanisms to overcome amplification barriers [61] [97]. This technical guide examines the precise mechanisms, optimization strategies, and practical applications of these three enhancers, providing researchers with an evidence-based framework for their implementation within a systematic PCR optimization workflow.
Mechanistic Actions of Key PCR Enhancers
Individual Mechanisms of Action
Dimethyl Sulfoxide (DMSO) functions primarily by reducing the secondary structural stability of DNA. It achieves this through interaction with water molecules surrounding the DNA strand, effectively reducing hydrogen bonding and thereby lowering the melting temperature (Tm) of the DNA [96]. This destablizing action facilitates primer binding to template DNA and subsequent polymerase elongation, particularly in GC-rich regions where strong hydrogen bonding creates exceptionally stable secondary structures [96] [61]. However, this benefit comes with a significant trade-off: DMSO simultaneously reduces Taq polymerase activity, necessitating careful concentration optimization to balance template accessibility with enzymatic function [96].
Betaine (betaine monohydrate) operates as an osmoprotectant that improves amplification efficiency through a different physicochemical mechanism. Also known as trimethylglycine, betaine interacts with negatively charged groups on the DNA strand, reducing electrostatic repulsion between DNA strands and consequently diminishing secondary structure formation [96] [61]. This property makes betaine particularly effective for amplifying GC-rich templates. Additionally, betaine increases reaction specificity by eliminating the dependence of DNA melting temperature on base pair composition, creating more uniform melting behavior across heterogeneous sequences [96] [98].
Bovine Serum Albumin (BSA) enhances PCR through multiple protective mechanisms rather than direct interaction with DNA. As a nonspecific binding protein, BSA neutralizes various PCR inhibitors commonly found in complex samples, including phenolic compounds, humic acids, and other contaminants from environmental or biological sources [89] [96] [95]. By sequestering these inhibitors, BSA prevents their interaction with DNA polymerase, thereby preserving enzymatic activity. Additionally, BSA reduces the adhesion of reaction components to tube walls, increasing overall reaction efficiency and consistency across replicates [96] [95].
Comparative Enhancement Profiles
Table 1: Comparative Analysis of PCR Enhancers for Difficult Templates
| Enhancer | Primary Mechanism | Optimal Concentration | Template Specificity | Key Applications | Potential Drawbacks |
|---|---|---|---|---|---|
| DMSO | Reduces DNA secondary structure by disrupting hydrogen bonding, lowering Tm | 2-10% (typically 5%) [99] [97] | GC-rich templates (>60% GC) [96] [61] | ITS2 DNA barcodes [99], GC-rich targets [95] | Inhibits Taq polymerase at higher concentrations (>10%) [96] |
| Betaine | Reduces electrostatic repulsion between DNA strands, eliminates base composition dependence of Tm | 0.5-2.5 M (typically 1-1.7 M) [96] [100] | GC-rich templates, eliminates secondary structures [96] | Plant DNA barcodes [99], extreme GC-rich sequences [61] | Betaine hydrochloride may affect pH; betaine monohydrate preferred [96] |
| BSA | Binds and neutralizes PCR inhibitors, stabilizes polymerase | 0.1-0.8 mg/mL (up to 10 μg/μL) [95] [100] | Inhibitor-containing samples (e.g., wastewater, soil) [89] [95] | Environmental samples, wastewater analysis [89], GC-rich templates with solvents [95] | Heat-sensitive; may require supplemental addition during long cycling [95] |
Experimental Optimization and Protocol Design
Systematic Optimization Approaches
The effective implementation of PCR enhancers requires systematic optimization rather than arbitrary addition. For initial screening, prepare a master reaction mixture containing all standard components (template, primers, dNTPs, polymerase, and buffer), then aliquot into separate tubes for additive testing [95]. Include a negative control without any enhancer to establish baseline performance. Test each enhancer individually across their recommended concentration ranges: DMSO at 2%, 5%, and 10%; betaine at 0.5 M, 1.0 M, and 1.7 M; and BSA at 0.1 mg/mL, 0.4 mg/mL, and 0.8 mg/mL [96] [97] [100].
Following individual assessment, evaluate synergistic combinations based on the initial results. The DMSO-BSA combination has demonstrated particular efficacy for GC-rich templates, with BSA shown to further enhance the effects of organic solvents [95]. Similarly, DMSO and betaine have been successfully paired for extremely challenging templates [99] [61]. When combining enhancers, reduce individual concentrations by 30-50% initially to avoid cumulative inhibitory effects, then adjust based on performance.
A strategic thermal cycling approach can further enhance results. For templates with pronounced secondary structure, implement a "touchdown" PCR protocol with enhanced denaturation conditions. Extend the initial denaturation step to 3-5 minutes at 95°C and incorporate brief (10-15 second) denaturation pulses at 98°C within the cycling parameters when using DMSO or betaine [61]. These modifications work synergistically with enhancers to overcome structural barriers to amplification.
Quantitative Assessment of Enhancement Efficacy
Table 2: Experimental Efficacy of PCR Enhancers Across Template Types
| Enhancer | Concentration | Template Type | Amplification Efficacy | Experimental Context |
|---|---|---|---|---|
| DMSO | 5% | Plant ITS2 DNA barcodes (GC-rich) | 91.6% PCR success rate (vs. 0% without) [99] | 12 plant species from different families [99] |
| Betaine | 1 M | Plant ITS2 DNA barcodes (GC-rich) | 75% PCR success rate [99] | Same as above; effective alternative to DMSO [99] |
| DMSO + Betaine | 5% DMSO + 1 M Betaine | Plant ITS2 DNA barcodes | No improvement over DMSO alone [99] | Not synergistic in this application [99] |
| BSA | 0.8 mg/mL | Wastewater samples (inhibitors) | Eliminated false negatives [89] | Viral detection in inhibitor-rich wastewater [89] |
| BSA + DMSO | 10 μg/μL BSA + 5% DMSO | GC-rich DNA (0.4-7.1 kb) | Significant yield increase vs. DMSO alone [95] | Azospirillum brasilense genomic DNA (GC>65%) [95] |
| T4 gp32 | 0.2 μg/μL | Wastewater samples | Most significant inhibition removal [89] | Superior to BSA for certain inhibitor types [89] |
Specialized Protocol for GC-Rich Templates with BSA-DMSO Synergy
For exceptionally challenging GC-rich templates (≥70% GC content), a specialized protocol leveraging the BSA-DMSO synergy has demonstrated significant efficacy [95]:
Reaction Setup: Prepare a 50 μL reaction containing:
- 1X PCR buffer with 1.5 mM MgCl₂ (baseline concentration)
- 200 μM of each dNTP
- 0.2-0.5 μM of each primer
- 50-100 ng template DNA
- 1.25-2.5 U thermostable DNA polymerase
- 5% DMSO
- 0.8 mg/mL BSA
- Adjust with nuclease-free water to final volume
Thermal Cycling Parameters:
- Initial denaturation: 95°C for 3-5 minutes
- 35 cycles of:
- Denaturation: 95°C for 30 seconds
- Annealing: Temperature gradient based on primer Tm for first 5 cycles, then 3°C above calculated Tm for remaining cycles
- Extension: 68°C for 1 minute per kb of expected product
- Final extension: 68°C for 7 minutes
BSA Supplementation Strategy: For amplicons >3 kb or with extreme GC content (>75%), pause the thermal cycler after every 10 cycles and briefly centrifuge tubes. Add a BSA supplement (0.2 mg/mL final concentration) to maintain enhancement throughout the reaction, as BSA exhibits some temperature sensitivity during extended cycling [95].
Decision Framework for Enhancer Selection
The selection of appropriate PCR enhancers should follow a systematic decision pathway based on template characteristics and amplification challenges. The following workflow provides a logical framework for method development:
Advanced Applications and Integration with Complementary Methods
Integration with Other Molecular Techniques
The strategic application of PCR enhancers extends beyond conventional PCR to more specialized amplification methods. In reverse transcription PCR (RT-PCR), DMSO and betaine have demonstrated particular utility in overcoming secondary structure in RNA templates during the reverse transcription step, with betaine proving effective for full-length cDNA synthesis of long transcripts [61]. For long-range PCR applications (amplifying products >5 kb), enhancer combinations including DMSO, glycerol, and BSA help maintain polymerase processivity across extended templates while stabilizing enzyme function through longer extension times [38] [61].
In multiplex PCR systems, where multiple primer pairs compete for resources, betaine and TMAC (tetramethylammonium chloride) can increase hybridization specificity, reducing primer-dimer formation and improving balanced amplification across targets [61] [100]. For wastewater-based epidemiology and environmental DNA analysis, where potent inhibitors are ubiquitous, BSA and T4 gene 32 protein (gp32) have demonstrated superior performance in neutralizing inhibitors compared to dilution-based methods alone [89].
Research Reagent Solutions for PCR Enhancement
Table 3: Essential Research Reagents for PCR Enhancement
| Reagent Category | Specific Examples | Function in PCR Enhancement | Implementation Considerations |
|---|---|---|---|
| Organic Solvents | DMSO, Formamide, Glycerol | Disrupt DNA secondary structure, lower melting temperature | DMSO most effective at 5%; formamide more narrow concentration range (1-5%) [96] [95] |
| Osmoprotectants | Betaine monohydrate | Reduces DNA strand electrostatic repression, equalizes Tm | Use 1-1.7 M; betaine hydrochloride may affect pH [96] [61] |
| Stabilizing Proteins | BSA, T4 gp32 protein | Binds inhibitors, stabilizes enzymes | BSA effective at 0.1-0.8 mg/mL; gp32 more potent for some inhibitors (0.2 μg/μL) [89] [95] |
| Detergents | Tween-20, Triton X-100 | Neutralizes SDS contamination, reduces secondary structure | Use at 0.1-1%; higher concentrations inhibitory [89] [97] |
| Salts & Cofactors | TMAC, MgCl₂, KCl | Increases hybridization specificity, essential polymerase cofactor | TMAC (15-100 mM) for degenerate primers; MgCl₂ (1.0-4.0 mM) requires precise optimization [98] [100] |
| Polymerase Systems | Taq polymerase, Proofreading polymerases | Foundation of amplification | Polymerase mixtures often beneficial for long templates; hot-start variants reduce nonspecific amplification [38] [61] |
The optimization of challenging PCR templates through strategic enhancer application represents both an art and science within molecular biology research. DMSO, betaine, and BSA each address distinct amplification barriers through fundamentally different mechanisms, offering researchers a multifaceted toolkit for method development. The experimental evidence demonstrates that DMSO at 5% concentration can achieve >90% success rate with previously unamplifiable GC-rich templates, while BSA can eliminate false negatives in inhibitor-rich samples [99] [89]. Most significantly, the synergistic combination of BSA with organic solvents such as DMSO provides enhanced benefits for the most challenging templates, enabling amplification across a broad size range (0.4-7.1 kb) of GC-rich targets [95].
Successful implementation requires systematic optimization rather than arbitrary addition, with concentration titration being essential given the narrow effective range of many enhancers. Furthermore, thermal cycling parameters must be co-optimized with enhancer selection, as modified denaturation temperatures and times work synergistically with these chemical additives. Through this rigorous, evidence-based approach, researchers can successfully amplify previously intractable templates, advancing diagnostic capabilities and research applications across the molecular sciences.
qPCR vs. dPCR: A Critical Comparative Analysis for Diagnostic and Research Validation
The evolution of Polymerase Chain Reaction (PCR) from a qualitative tool to a quantitative analytical technique represents a cornerstone of modern molecular biology. At the heart of this evolution lies a fundamental dichotomy: relative versus absolute quantification. These two approaches underpin how researchers measure nucleic acids, each with distinct philosophical frameworks, technical requirements, and applications in research and drug development.
Quantitative real-time PCR (qPCR) enables relative quantification, measuring target amounts relative to a reference or control sample. In contrast, digital PCR (dPCR) provides absolute quantification, directly counting individual DNA molecules without requiring standard curves [101] [102]. This technical guide examines both methodologies within the broader context of PCR amplification principles, addressing their theoretical foundations, practical implementations, performance characteristics, and appropriate applications to equip researchers with the knowledge to select the optimal quantification strategy for their experimental goals.
Fundamental Principles of Quantification
Relative Quantification with Quantitative PCR (qPCR)
qPCR, also known as real-time PCR, monitors the amplification of DNA during each PCR cycle via fluorescence detection. The key metric is the quantification cycle (Cq) or threshold cycle (Ct), which represents the cycle number at which the fluorescence signal crosses a predetermined threshold above background levels [101] [103]. This value inversely correlates with the initial target concentration—lower Cq values indicate higher starting amounts [103].
qPCR relies on standard curves constructed from samples with known concentrations to quantify unknowns [101] [48]. These curves establish the relationship between Cq values and initial template quantities, enabling extrapolation of target concentrations in experimental samples [48]. For relative quantification, the comparative Cq method (2^-ΔΔCq) normalizes target gene expression to reference genes (e.g., housekeeping genes) and compares this ratio to a calibrator sample (often an untreated control) [48].
Absolute Quantification with Digital PCR (dPCR)
dPCR takes a fundamentally different approach by partitioning a single PCR reaction into thousands of nanoscale reactions—either in droplets or nanowells [101] [102]. After endpoint PCR amplification, each partition is analyzed for fluorescence to determine whether it contains the target sequence (positive) or not (negative) [101] [103].
The absolute quantification is calculated using Poisson statistics based on the ratio of positive to negative partitions, providing a direct count of target molecules in the original sample without requiring standard curves [101] [48]. This binary approach transforms quantification from a relative measurement dependent on references to an absolute counting process [102].
Table 1: Core Principles of qPCR and dPCR
| Parameter | Quantitative PCR (qPCR) | Digital PCR (dPCR) |
|---|---|---|
| Quantification Type | Relative or absolute (requires standard curve) | Absolute |
| Fundamental Principle | Real-time fluorescence monitoring during exponential amplification | Endpoint detection in partitioned reactions |
| Key Measurement | Quantification cycle (Cq) | Ratio of positive to negative partitions |
| Statistical Foundation | Linear regression from standard curves | Poisson statistics |
| Dependency on References | Requires standard curves and/or reference genes | No standards or endogenous controls needed |
| Primary Output | Cq value or relative expression fold-change | Copies per microliter |
Methodological Frameworks and Experimental Protocols
qPCR Experimental Workflow and Normalization Strategies
The qPCR workflow begins with careful experimental design addressing normalization, replication, and controls. According to MIQE guidelines, researchers should include estimates of analytical sensitivity, specificity, accuracy, and precision [104]. Normalization is crucial for distinguishing biological variation from technical artifacts caused by run-to-run variation, differences in nucleic acid quantity/quality, pipetting errors, and enzymatic efficiencies [104].
For absolute quantification using standard curves, precise serial dilution of known standards is critical. Plasmid DNA or in vitro transcribed RNA are commonly used, with concentration measured by A260 and converted to copy number using molecular weight [48]. However, these standards degrade during storage, significantly affecting PCR efficiency, with cloned target sequences demonstrating better stability than PCR products [105]. Accurate pipetting is essential as standards must be diluted over several orders of magnitude (typically 10^6–10^12-fold) [48].
Efficiency standardization using the formula ECq = E^-ΔCq (where E is amplification efficiency and ΔCq is the difference between sample and reference standard Cqs) can minimize run-to-run variation [104]. This approach calculates efficiency-standardized Cq values using target- and matrix-specific reference standards included on each plate.
dPCR Experimental Workflow and Partitioning Chemistry
The dPCR workflow begins with partitioning the PCR mixture into thousands of individual reactions using either droplet-based or nanowell-based systems [102] [64]. Platforms like QIAcuity employ nanoplate technology that integrates partitioning, thermocycling, and imaging into a single automated instrument, enabling processing from sample to result in under two hours [102].
A critical consideration is optimizing the digital concentration—ensuring appropriate template dilution to achieve 0.5-5 copies per partition for precise Poisson correction [48]. Sample partitioning provides inherent advantages including increased tolerance to PCR inhibitors and reduced sensitivity to amplification efficiency variations [102]. Unlike qPCR, which collects data during the exponential phase, dPCR uses endpoint detection, making it less affected by changes in amplification efficiency [102].
Special attention must be paid to sample handling, as dPCR is particularly susceptible to molecule loss through adsorption to tube surfaces. Using low-binding plastics and minimal freeze-thaw cycles is recommended [48]. Dead volume in microfluidic systems (up to 30-50%) can also result in loss of analyzable sample, especially problematic with low-input precious samples like cell-free DNA [106].
Technical Comparison and Performance Metrics
Sensitivity, Precision, and Dynamic Range
dPCR demonstrates superior sensitivity for detecting rare mutations and low-abundance targets, capable of detecting mutation rates as low as 0.1% compared to >1% for qPCR [102]. This high signal-to-noise ratio makes dPCR particularly valuable for liquid biopsy analysis and rare allele detection [101] [102].
In precision assessment, dPCR achieves lower coefficients of variation, especially for low-abundance targets, due to its statistical counting approach [103]. However, qPCR offers a broader dynamic range, accommodating a larger range of sample concentrations without dilution [103]. dPCR's dynamic range is limited by partition count; samples exceeding this range require dilution before analysis [103].
A 2025 study comparing dPCR and Real-Time RT-PCR for respiratory virus detection found dPCR demonstrated superior accuracy, particularly for high viral loads of influenza A, influenza B, and SARS-CoV-2, and greater consistency in quantifying intermediate viral levels [64].
Table 2: Performance Characteristics of qPCR vs. dPCR
| Performance Metric | qPCR | dPCR |
|---|---|---|
| Detection Sensitivity | Mutation rate >1% [102] | Mutation rate ≥0.1% [102] |
| Precision | Good, but variable due to primer efficiency and PCR conditions [103] | Higher precision, lower coefficient of variation [103] |
| Dynamic Range | Broad [103] | Limited by partition number [103] |
| Tolerance to Inhibitors | Moderate [102] | High [102] [48] |
| Accuracy of Quantification | Dependent on standard curve quality [105] | Absolute counting [101] |
| Reproducibility Across Laboratories | Well-established protocols [102] | Higher precision for better reproducibility [102] |
Practical Considerations: Throughput, Cost, and Workflow
qPCR maintains advantages in throughput and speed, with samples read during thermal cycling and established protocols for high-throughput applications [101] [103]. It processes large-volume samples more effectively, valuable for detecting low concentrations in larger volumes [103].
dPCR requires pre-PCR partitioning and post-PCR analysis of each partition, potentially slowing processing per sample [103]. However, advancements like nanoplate-based systems have substantially accelerated workflows through simultaneous reading of all sample partitions and front-end automation [102].
Cost considerations favor qPCR for routine applications, while dPCR's superior precision commands premium pricing. The requirement for specialized instrumentation and consumables also contributes to dPCR's higher per-sample cost, though this gap is narrowing as the technology matures.
Applications in Research and Drug Development
Appropriate Applications for qPCR
qPCR remains the gold standard for numerous applications where its throughput, dynamic range, and established protocols provide distinct advantages:
- Gene expression analysis: Relative quantification perfectly suits comparative studies of gene expression across different conditions or treatments [101]
- Pathogen detection and microbiome analysis: High-throughput capabilities enable efficient screening of clinical and environmental samples [101] [102]
- Routine diagnostic testing: Well-established protocols and commercial kits support standardized clinical applications [104]
- High-throughput screening: When processing large sample numbers quickly and cost-effectively is prioritized [101]
Applications Benefiting from dPCR Precision
dPCR excels in applications demanding absolute quantification, exceptional sensitivity, or superior precision:
- Liquid biopsy analysis: Detecting rare mutations in circulating tumor DNA [101]
- Copy number variation analysis: Absolute quantification provides precise determination of gene copy differences [101] [102]
- Viral load quantification: Absolute counting without standard curves improves accuracy [101] [64]
- Low-abundance target detection: Superior sensitivity enables detection of rare transcripts or pathogens [101]
- Quality control of reference standards: Absolute quantification helps characterize and validate standards used in qPCR [105]
Emerging Methodologies and Future Directions
While dPCR represents a significant advancement over qPCR, emerging technologies aim to address remaining limitations. Countable PCR, for instance, eliminates partitioning entirely, using a matrix-based system to isolate and amplify true single molecules in large reaction volumes with 3D imaging [106]. This approach claims to overcome Poisson statistics limitations, dead volume issues, and dynamic range constraints of traditional dPCR [106].
Methodological refinements continue to improve both technologies. In qPCR, data preprocessing approaches like "taking-the-difference" – subtracting fluorescence in former cycles from latter cycles – reduce background estimation error compared to traditional background subtraction methods [107]. Weighted linear regression and mixed models also improve precision in qPCR efficiency estimation [107] [108].
The integration of dPCR into automated systems like the QuantStudio Absolute Q and QIAcuity platforms demonstrates the trend toward streamlined workflows that make absolute quantification more accessible for routine use [101] [102]. As these technologies evolve, the distinction between relative and absolute quantification may blur, potentially leading to integrated systems capable of both approaches within a single platform.
The choice between relative (qPCR) and absolute (dPCR) quantification depends fundamentally on experimental goals, sample characteristics, and resource constraints. qPCR remains ideal for high-throughput relative quantification studies where cost-effectiveness and established protocols are prioritized. Its broad dynamic range and flexibility make it suitable for most routine applications where ultra-high precision is not required.
dPCR excels when absolute quantification is essential, particularly for rare variant detection, complex sample matrices, or when standardized reference materials are unavailable. Its precision, sensitivity, and resistance to inhibitors make it particularly valuable for clinical diagnostics, biomarker validation, and regulatory applications requiring uncompromising accuracy.
Understanding the principles, capabilities, and limitations of both approaches enables researchers to strategically deploy these powerful technologies. As molecular analysis continues to drive advancements in research and drug development, the appropriate selection of quantification methodologies will remain critical for generating robust, reproducible, and biologically meaningful results.
The Scientist's Toolkit: Essential Research Reagent Solutions
Table 3: Key Reagents and Materials for PCR Quantification
| Reagent/Material | Function | Application Notes |
|---|---|---|
| Reference Standards | Calibrate qPCR assays and control for inter-run variation | Plasmid DNA or in vitro transcribed RNA with known concentration; cloned sequences more stable than PCR products [48] [105] |
| Matrix-Specific Controls | Normalize for sample-specific effects | Prepare in same matrix as samples (e.g., serum, oral fluid) to match extraction efficiency [104] |
| Low-Binding Plastics | Minimize sample loss during preparation | Critical for dPCR to prevent molecule adhesion; use low-binding tubes and low-retention tips [48] |
| Partitioning Consumables | Create nanoreactors for dPCR | Droplet generators or nanowells (e.g., QIAcuity nanoplates); quality affects Poisson statistics accuracy [102] [106] |
| Multiplex Master Mixes | Enable simultaneous target detection | Optimized for either qPCR or dPCR; require balancing of primer/probe concentrations [64] |
| Inhibition-Resistant Enzymes | Maintain amplification efficiency | Particularly important for complex samples (e.g., blood, soil) in qPCR; dPCR inherently more tolerant [102] |
PCR Quantification Method Selection
Within the framework of principles governing PCR amplification research, the accurate characterization of an assay's performance at its lower limits is fundamental. Two concepts are paramount in this context: analytical sensitivity and the limit of detection (LoD). Although sometimes used interchangeably in casual discourse, these terms represent distinct and specific performance characteristics. Their precise understanding, differentiation, and application are critical for researchers, scientists, and drug development professionals who rely on PCR for everything from basic gene expression studies to the development of cutting-edge molecular diagnostics.
This technical guide provides an in-depth, head-to-head comparison of these two concepts. It clarifies their unique definitions, mathematical foundations, and experimental determination protocols, with a consistent focus on their application in PCR and qPCR. The aim is to equip practitioners with the knowledge to properly validate their assays, interpret data correctly, and communicate performance characteristics unambiguously.
Definitions and Core Concepts
Analytical Sensitivity
In analytical chemistry and PCR research, analytical sensitivity is formally defined as the slope of the analytical calibration curve [109] [110]. It quantifies the change in the output signal for a unit change in the concentration of the analyte. In the context of qPCR, the "signal" is typically the quantification cycle (Cq) value, and the analyte concentration is the amount of target nucleic acid.
- Mathematical Expression: For a calibration function ( y = f(x) ), where ( y ) is the measurement result (e.g., Cq) and ( x ) is the concentration, sensitivity ( S ) is defined as the differential quotient ( S = \frac{dy}{dx} ) [109].
- Practical Implication: A steeper slope (higher analytical sensitivity) indicates that a small change in analyte concentration produces a large change in the measured signal, meaning the assay is better at distinguishing between closely spaced concentrations [110].
Limit of Detection (LoD)
The Limit of Detection (LoD) is defined as the lowest concentration of an analyte that can be reliably distinguished from a blank sample (containing no analyte) with a specified degree of certainty [109] [111]. It is a measure of detection feasibility, not necessarily accurate quantification.
- IUPAC Definition: "The limit of detection, expressed as the concentration, ( cL ), or the quantity, ( qL ), is derived from the smallest measure, ( x_L ), that can be detected with reasonable certainty for a given analytical procedure" [109].
- Key Principle: The LoD is determined by the inherent uncertainties (noise) in the measurement system. Its definition and quantification must therefore be based on statistics, accounting for the variability in both blank and low-concentration samples [109] [111].
The Critical Distinction
Confusion often arises because in some fields, like the ELISA industry, "sensitivity" is colloquially used to refer to the detection limit [110]. However, for precise scientific communication, the distinction is crucial. Analytical sensitivity is about the responsiveness of the signal to concentration changes, while the LoD is about the minimum concentration that can be confidently deemed "present." An assay can have high analytical sensitivity (a very steep calibration curve) but a poor LoD if background noise is high, and vice versa.
Quantitative Comparison and Statistical Foundations
The following table summarizes the core differences between analytical sensitivity and the Limit of Detection, highlighting their unique definitions, what they measure, and how they are determined.
Table 1: Head-to-Head Comparison of Analytical Sensitivity and Limit of Detection
| Feature | Analytical Sensitivity | Limit of Detection (LoD) |
|---|---|---|
| Core Definition | Slope of the analytical calibration curve [109] [110]. | Lowest analyte concentration reliably distinguished from a blank [109] [111]. |
| What It Measures | Responsiveness of the signal to changes in concentration. | Minimum concentration for reliable detection. |
| Primary Focus | Ability to discriminate between small concentration differences. | Confidence in detecting the presence versus absence of the analyte. |
| Typical Units | Signal change per unit concentration (e.g., ∆Cq/ng/µL). | Concentration (e.g., copies/µL, ng/mL). |
| Determination Basis | Linear regression of calibration curve. | Statistical analysis of blank and low-concentration sample variability [111]. |
| Relationship to PCR | Related to the efficiency (E) of the amplification, where E = 10^(-1/slope) - 1 [1]. | Determined by probing low-concentration samples and assessing hit rate [112] [113]. |
The statistical determination of LoD involves two key components: the Limit of Blank (LoB) and the LoD itself, as defined by organizations like the Clinical and Laboratory Standards Institute (CLSI) in its EP17 guideline [111].
Limit of Blank (LoB): The highest apparent analyte concentration expected to be found when replicates of a blank sample (containing no analyte) are tested.
Formula: ( LoB = mean{blank} + 1.645 \times SD{blank} ) (assuming a Gaussian distribution) [111]. This establishes a threshold where 95% of blank measurements will fall below, defining a 5% false positive rate (Type I error, α).
Limit of Detection (LoD): The lowest concentration at which an analyte can be reliably detected, defined such that it minimizes false negatives.
Formula: ( LoD = LoB + 1.645 \times SD_{low concentration sample} ) [111]. This formula ensures that 95% of measurements from a sample at the LoD will exceed the LoB, resulting in a ≤5% false negative rate (Type II error, β).
These statistical relationships are foundational for designing experiments to determine the LoD for a PCR assay.
Table 2: Key Statistical Parameters for LoD Determination
| Parameter | Description | Sample Type | Recommended Replicates (Establishment) | Key Formula |
|---|---|---|---|---|
| LoB | Highest concentration expected from a blank sample. | Sample containing no analyte (e.g., nuclease-free water) [111]. | 60 [111] | ( LoB = mean{blank} + 1.645(SD{blank}) ) |
| LoD | Lowest concentration reliably distinguished from LoB. | Sample with low concentration of analyte [111]. | 60 [111] | ( LoD = LoB + 1.645(SD_{low}) ) |
| LoQ | Lowest concentration quantified with predefined precision and bias. | Sample at or above the LoD concentration [111]. | 60 [111] | ( LoQ \geq LoD ) |
Experimental Protocols for Determination
Determining Analytical Sensitivity in qPCR
The analytical sensitivity in qPCR is derived from the standard curve.
- Prepare Standard Dilutions: Serially dilute a standard of known concentration (e.g., gBlock, plasmid DNA, or synthetic RNA) across a range that spans the expected concentrations in test samples. A minimum of 5 dilution points is recommended, with multiple replicates per dilution.
- Run qPCR Assay: Amplify all standard dilutions using the optimized qPCR protocol.
- Generate Standard Curve: Plot the log of the known starting concentration of each standard against the mean Cq value obtained for that dilution.
- Perform Linear Regression: Fit a line to the data points. The slope of this line is used to calculate PCR efficiency (( E = 10^{-1/slope} - 1 )), and the slope itself is a key component of analytical sensitivity [109] [1]. The coefficient of determination (R²) should be reported to indicate the linearity of the curve.
Determining Limit of Detection (LoD) in PCR/qPCR
The LoD is determined empirically by testing replicates of samples containing very low concentrations of the target [112] [111] [114]. The following protocol outlines the key steps, with the logic flow illustrated in the diagram below.
Diagram 1: LoD Determination Workflow
The experimental steps corresponding to the workflow are:
- Prepare Samples: Create a dilution series of the target analyte (e.g., pathogen genome, transcript) in the appropriate matrix (e.g., TE buffer, negative serum, extracted nucleic acids from negative background) at concentrations near the expected detection limit [113].
- Test Replicates: For each low concentration in the series, test a sufficient number of replicates. Best practices recommend at least 20 measurements at, above, and below the likely LoD, with 60 replicates being common for a robust establishment [111] [114].
- Analyze and Interpret Data: Calculate the hit rate (proportion of positive results, e.g., Cq < a predetermined cutoff) for each concentration. The LoD is often defined as the lowest concentration that achieves a hit rate of ≥95% [111] [113]. As shown in the workflow, if the hit rate is insufficient, a higher concentration must be tested until the 95% threshold is met.
The Scientist's Toolkit: Essential Reagents and Materials
The following table details key reagents and materials required for the experiments described above, along with their critical functions in ensuring accurate and reproducible results.
Table 3: Research Reagent Solutions for PCR Sensitivity and LoD Studies
| Reagent / Material | Function | Critical Considerations for Sensitivity/LoD |
|---|---|---|
| Taq DNA Polymerase | Enzyme that synthesizes new DNA strands during PCR [25]. | Thermostability and fidelity are crucial for efficient and accurate amplification, especially of low-copy targets [25]. Hot-start versions are recommended to reduce nonspecific amplification [38]. |
| Primers | Short oligonucleotides that define the start and end of the target sequence to be amplified [1]. | Specificity, optimal annealing temperature, and absence of self-complementarity are vital to prevent primer-dimer and false positives, which directly impact LoD [1]. |
| dNTPs | Deoxynucleotide triphosphates (dATP, dCTP, dGTP, dTTP); the building blocks for new DNA strands [38]. | Purity and appropriate concentration are essential for efficient amplification and minimizing misincorporation errors. |
| Standard Reference Material | Material of known concentration and purity used to generate the standard curve (e.g., gBlock, plasmid DNA) [113]. | Accurate quantification and serial dilution are fundamental for a reliable standard curve and correct determination of analytical sensitivity and LoD [113]. |
| Negative Control Matrix | The substance that mimics the patient sample but contains no target (e.g., nuclease-free water, negative serum) [111]. | Used to determine the LoB. It must be commutable with real patient specimens to ensure clinical relevance [111]. |
Advanced Considerations in PCR Research
The Role of Reverse Transcription (RT) in Sensitivity
For RNA targets (RT-qPCR), the reverse transcription step is a major factor influencing overall sensitivity and LoD. The efficiency of converting RNA to cDNA can vary significantly based on the reverse transcriptase enzyme used, primer choice (oligo(dT), random, or gene-specific), and RNA quality [38]. Inefficient RT can introduce a significant bottleneck, limiting the amount of template available for qPCR amplification, thereby raising the practical LoD.
Impact of PCR Inhibitors
The extreme sensitivity of PCR makes it susceptible to false negatives caused by inhibitors present in biological samples (e.g., hemoglobin, heparin, ionic detergents, phenol) [1] [38]. These substances can co-purify with nucleic acids and inhibit either the reverse transcriptase or DNA polymerase. The presence of inhibitors effectively degrades the assay's practical LoD in real-world samples, making purification and quality control of nucleic acid templates a critical step.
From Detection to Quantification: The Limit of Quantification (LoQ)
It is crucial to recognize that the LoD is not the same as the Limit of Quantification (LoQ). The LoQ is the lowest concentration at which the analyte can not only be detected but also measured with acceptable precision (imprecision) and accuracy (bias) [109] [111] [110]. While a sample at the LoD can be declared "positive," its concentration cannot be reliably quantified. The LoQ is always at a concentration equal to or higher than the LoD. A common definition for LoQ is the concentration that results in a inter-assay CV of 20% [111].
Analytical sensitivity and the Limit of Detection are complementary yet fundamentally different pillars of assay characterization in PCR research. Analytical sensitivity, defined by the calibration curve's slope, describes an assay's power to resolve small concentration differences. In contrast, the Limit of Detection, derived from statistical analysis of blank and low-concentration samples, defines the absolute lower boundary of detection with statistical confidence.
A deep understanding of this distinction is not merely an academic exercise; it is a practical necessity. For researchers developing novel assays, it guides optimization and validation. For scientists in drug development, it informs decisions about the suitability of an assay for measuring biomarkers at low levels. A robust, well-defined LoD, determined through rigorous statistical protocols, is especially critical in clinical diagnostics, where the consequences of a false negative can be severe. By adhering to these principles and methodologies, professionals can ensure their PCR data is both reliable and meaningful, solidifying the technique's status as the gold standard in molecular analysis.
Polymersase chain reaction (PCR) amplification is a cornerstone of modern molecular biology, yet its efficacy is frequently compromised in real-world applications by the presence of inhibitory substances in complex sample matrices. These inhibitors, which vary widely across sample types, can interact with PCR components through multiple mechanisms—binding to DNA polymerase, degrading nucleic acids, or chelating essential cofactors—ultimately leading to reduced sensitivity, complete amplification failure, or false-negative results [115] [116]. The resilience of PCR to these challenging matrices represents a critical research frontier with substantial implications for diagnostic accuracy, food safety monitoring, and environmental testing.
Understanding and overcoming matrix effects requires a systematic approach to inhibitor identification, detection, and mitigation. Complex samples such as herbal products, cosmetics, clinical specimens, and food matrices contain diverse inhibitory compounds including polyphenols, polysaccharides, bile salts, heme, and heavy metals that interfere with amplification efficiency [117] [116] [118]. This technical guide examines the principles underlying PCR inhibition and presents validated methodologies to enhance amplification reliability across challenging sample types, framed within the broader context of PCR amplification research principles focused on robustness and reproducibility.
Understanding PCR Inhibitors in Complex Matrices
PCR inhibitors originate from diverse sources and exhibit varied mechanisms of interference with the amplification process. Table 1 categorizes common inhibitors, their sources, and primary mechanisms of action.
Table 1: Common PCR Inhibitors and Their Characteristics
| Inhibitor Category | Example Sources | Primary Mechanism of Interference |
|---|---|---|
| Organic Compounds | Blood (heme, hemoglobin), herbal matrices (polyphenols, tannins) [116] [118] | Interaction with DNA polymerase; degradation of nucleic acids |
| Ionic Substances | Urine (urea), saline samples, soil (calcium ions) [117] [118] | Chelation of essential magnesium cofactors; disruption of enzyme activity |
| Complex Polysaccharides | Feces, plant materials [118] | Binding to nucleic acids; increased viscosity |
| Proteins & Lipids | Milk (collagen), muscle tissue (myoglobin) [118] | interference with DNA polymerase activity |
| Laboratory Chemicals | Heparin, formalin, detergents [117] | Direct inhibition of polymerase; DNA modification |
Prevalence of Inhibition Across Sample Types
The frequency of PCR inhibition varies significantly across different specimen matrices. A comprehensive analysis of 386,706 specimens revealed an overall inhibition rate of 0.87% when inhibitors were assessed pre-extraction, dropping to 0.01% when assessed post-extraction [117]. This substantial reduction highlights the effectiveness of proper sample processing. Inhibition rates differed markedly by sample type: urine and formalin-fixed, paraffin-embedded tissue exhibited rates exceeding 1%, while other matrices like cerebrospinal fluid, EDTA-blood, and properly processed swabs demonstrated significantly lower inhibition rates [117].
Detection and Monitoring of PCR Inhibition
Internal Control Strategies
Effective detection of PCR inhibition requires robust internal control strategies. The Clinical and Laboratory Standards Institute (MM3-A2) recommends implementing inhibition controls particularly when false-negative results could have significant consequences [117]. Two primary approaches exist:
- Pre-extraction controls: Involve adding control nucleic acid or whole organisms to an aliquot of the clinical specimen before extraction. This method detects inhibition originating from both the sample matrix and processing method but increases processing complexity and cost [117].
- Post-extraction controls: Involve adding control templates after nucleic acid extraction but before amplification. This approach specifically identifies inhibition carried over from the extraction process and is more cost-effective for high-volume testing [117].
Quantitative Assessment of Inhibition
The degree of PCR inhibition can be quantitatively assessed by comparing cycle threshold (Ct) values between samples and controls. In studies of herbal matrices, researchers observed a Ct delay of 1.48 ± 1.05 cycles in inhibited samples compared to controls [116]. The use of an internal positive control in a multiplex real-time PCR format enables continuous monitoring of inhibition across different sample batches and matrices [116].
Methodologies for Overcoming PCR Inhibition
Sample Processing and Purification Techniques
Effective sample preprocessing and DNA purification significantly reduce inhibitor carryover. Specific approaches include:
- Dilution and Centrifugation: For complex herbal matrices, a series of centrifugation steps combined with sample dilution effectively removed PCR inhibitors, enabling successful Salmonella detection even in challenging matrices like chamomile, sage, and mint [116].
- Chemical Additives: Incorporating additives such proteinase K during processing of respiratory specimens improves lysis efficiency and reduces inhibitor presence [117].
- Specialized DNA Extraction Kits: Utilizing optimized commercial kits like the PowerSoil Pro Kit (Qiagen) with automated extraction systems (e.g., QIAcube Connect) enhances DNA purity from complex cosmetic matrices [115].
Nanoparticle-Enhanced PCR (nanoPCR)
Nanoparticles serve as effective PCR facilitators through multiple mechanisms, including superior thermal conductivity, catalytic properties, and electrostatic interactions with PCR components [118]. Table 2 outlines nanoparticles with demonstrated efficacy in enhancing PCR resilience.
Table 2: Nanoparticles for Enhancing PCR Performance in Challenging Matrices
| Nanomaterial Type | Optimal Size Range | Optimal Concentration | Mechanism of Action |
|---|---|---|---|
| Gold (Au) NPs | 13-100 nm [118] | 0.7-1.6 nM [118] | Improved thermal conductivity; interaction with polymerase and primers |
| Carbon Nanotubes (CNTs) | 1-30 nm [118] | 2-4 ng/μL [118] | Enhanced heat transfer; surface interactions with DNA |
| Graphene Oxide (GO) | 20-70 nm [118] | 20-400 ng/μL [118] | Single-stranded DNA binding; prevents mispriming |
| Silver (Ag) NPs | 10-20 nm [118] | 0.4-2 nM [118] | Thermal conductivity; catalytic activity |
| Zinc Oxide (ZnO) NPs | 35-1000 nm [118] | 10-200 ng/μL [118] | Surface charge interactions; thermal properties |
Alternative Amplification Strategies
- Photothermal PCR: Utilizing nanomaterials with excellent light absorption and heat conversion capabilities (e.g., gold nanorods, carbon-based materials) enables precise thermal cycling through photothermal conversion mechanisms, reducing dependency on conventional thermal cyclers and potentially mitigating some inhibition pathways [118].
- Microfluidic Integration: Combining nanoparticle-assisted PCR with microfluidic platforms reduces reaction volumes, decreases potential inhibitor concentrations, and enables rapid, parallel processing of multiple samples [118].
Experimental Protocols for Resilient PCR
Protocol for Inhibitor-Removal from Herbal Matrices
This protocol, adapted from research on Salmonella detection in inhibitory herbs, effectively removes PCR inhibitors through sequential centrifugation [116]:
- Sample Preparation: Create a 10% (w/v) suspension of the herbal material (chamomile, sage, or mint) in an appropriate buffer.
- Initial Centrifugation: Centrifuge the suspension at 3,500 × g for 10 minutes to remove coarse particulate matter.
- Supernatant Collection: Transfer the supernatant to a new microcentrifuge tube.
- High-Speed Centrifugation: Centrifuge at 14,000 × g for 5 minutes to pellet remaining fine particles and inhibitor complexes.
- Bacterial Concentration: If detecting bacterial pathogens, concentrate bacterial cells by centrifuging the supernatant at 5,000 × g for 10 minutes.
- Pellet Resuspension: Resuspend the pellet in PCR-compatible buffer for direct amplification or DNA extraction.
- Validation: Include an internal positive control in the PCR reaction to confirm removal of inhibitors, indicated by a Ct value delay of ≤1.5 cycles compared to control reactions [116].
Protocol for Microbial Detection in Cosmetic Products
This method, verified according to ISO guidelines, enables reliable detection of microorganisms in complex cosmetic formulations [115]:
Sample Inoculation and Enrichment:
- Spike 1 g aliquots of cosmetic products with low inoculum levels (3-5 CFU) of target microorganisms (E. coli, S. aureus, P. aeruginosa, C. albicans).
- Dilute samples in 9 mL of Eugon broth and incubate at 32.5°C for 20-24 hours. For highly inhibitory matrices (e.g., antimicrobial soaps), extend enrichment to 36 hours and implement a 1:100 dilution.
- Include uninoculated blanks for each cosmetic matrix.
DNA Extraction:
- Combine 250 μL of enrichment culture with 800 μL of CD1 solution (PowerSoil Pro Kit).
- Vortex for 10 minutes at maximum speed using a bead-beating step.
- Centrifuge at 15,000 × g for 1 minute and transfer 650 μL of supernatant to automated extraction system.
- Process using QIAcube Connect with elution volumes according to manufacturer specifications.
- Include extraction controls (medium control, zero control, extraction control).
Real-time PCR Amplification:
- Use commercial rt-PCR kits validated for each pathogen (e.g., SureFAST PLUS for bacteria, dtec-rt-PCR for C. albicans).
- Analyze each DNA extract in duplicate with appropriate positive and no-template controls.
- Implement thermal cycling conditions according to manufacturer specifications with inclusion of internal reaction controls.
Method Verification:
- Compare rt-PCR results with standard culture methods (ISO 21150, 22717, 22718, 18416).
- Validate method performance through sensitivity, specificity, and limit of detection calculations across multiple replicates and cosmetic matrices.
The Scientist's Toolkit: Essential Research Reagents
Table 3: Key Research Reagent Solutions for Inhibitor-Resilient PCR
| Reagent/Kit | Function | Application Context |
|---|---|---|
| PowerSoil Pro Kit (Qiagen) | DNA purification from inhibitor-rich samples | Effective for cosmetic matrices and soil samples [115] |
| SureFAST PLUS RT-PCR Kit | Pathogen detection with internal controls | Bacterial detection in food and cosmetic products [115] |
| MagNA Pure LC System | Automated nucleic acid extraction | High-throughput processing of clinical specimens [117] |
| Proteinase K | Digestion of inhibitory proteins | Processing of respiratory specimens and tissue samples [117] |
| Gold Nanoparticles (13-100 nm) | PCR facilitation through thermal enhancement | Improving amplification efficiency in inhibitory conditions [118] |
| Stool Transport & Recovery Buffer | Preservation and dilution of fecal samples | Reducing inhibitor concentration in stool specimens [117] |
Workflow and Pathway Visualizations
PCR Inhibition Detection and Mitigation Workflow
Nanoparticle Enhancement Mechanisms in PCR
Building resilience to inhibitors and complex matrices represents an essential advancement in PCR amplification research, transforming the technique from a controlled laboratory method to a robust analytical tool capable of functioning in real-world scenarios. The integration of systematic inhibitor detection, optimized sample processing methodologies, and nanomaterial-enhanced amplification creates a comprehensive framework for addressing matrix-related challenges. As PCR applications continue to expand into increasingly complex sample types, the principles outlined in this technical guide—standardized validation, appropriate internal controls, and strategic mitigation approaches—provide researchers with evidence-based strategies to ensure amplification reliability. Future developments in photothermal PCR, microfluidic integration, and tailored nanoparticle systems promise to further enhance the resilience of molecular amplification in the most challenging sample matrices.
The concurrent surge of multiple respiratory viruses, a phenomenon colloquially known as a "tripledemic," presents significant challenges to public health systems and clinical diagnostics. This case study examines the detection of SARS-CoV-2 (COVID-19), influenza, and respiratory syncytial virus (RSV) during the 2025-2026 respiratory disease season, framing the discussion within core principles of PCR amplification research. The accurate identification and quantification of these co-circulating pathogens rely heavily on advanced molecular techniques, particularly optimized polymerase chain reaction (PCR) protocols that can distinguish between viruses with similar clinical presentations but distinct genetic signatures. As of November 2025, respiratory illness activity was at low levels nationally, though with emerging signals including increasing RSV activity in southeastern and southern regions and rising emergency department visits among children aged 0-4 years [119]. The Centers for Disease Control and Prevention (CDC) projected that the 2025-2026 fall and winter respiratory disease season would likely see a similar number of combined peak hospitalizations compared to the previous season, based on historical trends, expert opinion, and scenario modeling [120]. This context makes the technical aspects of detection methodologies particularly critical for accurate surveillance and clinical management.
Epidemiological Context and Surveillance Data
The tripledemic concept reflects the complex interplay of three major respiratory viruses with overlapping seasonal patterns and clinical manifestations. Understanding their individual and combined behavior is essential for developing effective diagnostic strategies.
National Surveillance Metrics and Activity Levels
National surveillance systems employ multiple metrics to track respiratory virus activity, including emergency department visits for viral respiratory illness, test positivity rates, and wastewater monitoring [121]. The CDC's acute respiratory illness (ARI) metric captures a broad range of diagnoses from emergency department visits, offering a more complete picture than previous influenza-focused surveillance systems [121]. This metric categorizes activity levels (Very Low, Low, Moderate, High, and Very High) using a standardized methodology based on the mean and standard deviation of historical baseline data [121].
Table: National Respiratory Virus Activity Overview (2025-2026 Season Projections)
| Virus | Projected Peak Hospitalization Rate | Confidence Level | Key Epidemiological Notes |
|---|---|---|---|
| COVID-19 | Similar to or higher than 2024-2025 season | Moderate | Potential emergence of variant with immune-escape properties; national peak typically in late December/early January [120] |
| Influenza | Moderate severity classification | Moderate | 2024-2025 was high-severity season; back-to-back high severity seasons uncommon since 2003-2004 [120] |
| RSV | Similar to 2024-2025 season (within 20%) | Moderate | Increased activity in Southeastern U.S.; immunization products reducing hospitalizations in high-risk groups [119] [120] |
| Combined Burden | Similar to 2024-2025 season (within 20%) | Low to Moderate | Dependent on timing and magnitude of individual virus peaks; potential for multiple peaks [120] |
Regional Variation and Early Warning Systems
Substantial regional variation characterizes tripledemic dynamics, with the Southeast and Southern U.S. typically experiencing earlier RSV activity [119] [120]. Wastewater surveillance has emerged as a critical early warning tool, detecting viral shedding before clinical cases manifest. As of 2025, wastewater monitoring for SARS-CoV-2 provided national, regional, and state-level data, while influenza tracking was limited to influenza A viruses (without subtype differentiation) [121]. These data are particularly valuable as they capture infections regardless of symptom status, though interpretation requires consideration of factors like population coverage and non-human sources of influenza A detection [121].
PCR Methodologies for Multiplex Detection
The accurate detection and differentiation of tripledemic pathogens demand sophisticated molecular approaches that address the challenges of multi-template amplification while maintaining sensitivity and specificity across diverse genetic targets.
Fundamental PCR Optimization Principles
Optimal PCR results require careful optimization of reaction conditions that influence both specificity and efficiency. Key parameters include primer concentration and design, annealing temperature, MgCl₂ concentration, template quality and concentration, polymerase selection, and buffer composition [122]. Without proper optimization, numerous issues can arise, including absent or inefficient amplification of target templates, nonspecific bands, primer-dimer formation, and mutations due to incorrect nucleotide incorporation [122].
The goals of PCR optimization are to maximize specificity and efficiency such that the amplified product faithfully represents the intended target sequence. This process can be conceptualized as "balancing a chain of dominos" – altering one parameter creates cascading effects throughout the amplification process [122]. For respiratory virus detection, where false negatives and false positives carry significant clinical implications, optimization is particularly crucial.
Table: Critical PCR Optimization Parameters and Their Impact
| Parameter | Optimal Range/Considerations | Impact on Specificity and Efficiency |
|---|---|---|
| Primer Concentration | 0.2-1μM [122] | Lower concentrations can reduce non-specific product formation; insufficient amounts yield lower product |
| Annealing Temperature | 55°C-65°C for fragments 100-500bp [122] | Lower temperatures increase specificity but may reduce yield; higher temperatures can increase yield at specificity's expense |
| MgCl₂ Concentration | 1.5-2.5mM (starting point 2mM) [122] | Stabilizes primer-template binding; affects polymerase activity; significantly influences reaction consistency |
| Template Quality | High-quality extracted DNA/RNA; recommended length 200-500bp [122] | Poor template quality leads to nonspecific amplification or false negatives/positives |
| Polymerase Selection | Taq for high yield; Vent or Pfu for high fidelity [122] | Trade-offs between efficiency (T7, Taq) and accuracy (T4, Vent, Pfu); most accurate enzymes not thermostable |
Multi-Template PCR Challenges and Solutions
Multi-template PCR, essential for parallel amplification of different viral targets, presents unique challenges compared to single-template amplification. Non-homogeneous amplification due to sequence-specific amplification efficiencies often results in skewed abundance data, compromising accuracy and sensitivity [6]. Even slight differences in amplification efficiency between templates (as little as 5% below average) can lead to drastic underrepresentation after just 12 PCR cycles – a relevant concern given that library preparation for Illumina sequencing typically uses approximately this number of cycles [6].
Recent research has identified that poor amplification efficiency is often reproducible and sequence-specific, independent of traditional confounding factors like GC content [6]. Deep learning approaches using one-dimensional convolutional neural networks (1D-CNNs) have demonstrated high predictive performance (AUROC: 0.88) in identifying sequences with poor amplification efficiency based on sequence information alone [6]. The CluMo (Motif Discovery via Attribution and Clustering) interpretation framework has identified specific motifs adjacent to adapter priming sites as closely associated with poor amplification, challenging long-standing PCR design assumptions [6].
Experimental Protocol for Respiratory Virus Detection
A robust experimental protocol for respiratory virus detection during tripledemic conditions incorporates the following methodological considerations:
Sample Collection and Nucleic Acid Extraction:
- Collection of nasopharyngeal or oropharyngeal swabs in appropriate viral transport media
- RNA extraction using silica-based membrane columns or magnetic bead technologies
- Quality assessment of extracted nucleic acids via spectrophotometry (A260/A280 ratios) or fluorometry
- Inclusion of extraction controls to monitor for inhibition and cross-contamination
Reverse Transcription and Amplification:
- Use of reverse transcriptase with high processivity and thermal stability
- Incorporation of RNase inhibitors to maintain RNA integrity
- Multiplex primer design targeting conserved regions of SARS-CoV-2 (e.g., N, E, or RdRp genes), influenza (matrix or nucleoprotein genes), and RSV (fusion or nucleoprotein genes)
- Implementation of "hot start" techniques to minimize non-specific amplification during reaction setup [122]
- Optimization of cycling conditions with particular attention to annealing temperature gradients and extension times
Detection and Analysis:
- Real-time PCR monitoring using TaqMan probes or SYBR Green chemistry
- Implementation of standard curves for absolute quantification when needed
- Inclusion of internal amplification controls to distinguish true negatives from reaction failure
- Cross-validation with orthogonal detection methods when unusual patterns emerge
Advanced Technical Considerations
Deep Learning Applications in PCR Optimization
The application of deep learning to PCR optimization represents a paradigm shift in addressing amplification bias. By training one-dimensional convolutional neural networks (1D-CNNs) on reliably annotated datasets derived from synthetic DNA pools, researchers can predict sequence-specific amplification efficiencies based on sequence information alone [6]. This approach has demonstrated particular value in identifying the approximately 2% of sequences with very poor amplification efficiency (as low as 80% relative to population mean), which become progressively underrepresented and may disappear entirely from sequencing data after multiple amplification cycles [6].
The CluMo framework enables mechanistic understanding of template-dependent PCR inhibition by identifying specific sequence motifs linked to poor amplification efficiency. This approach has elucidated adapter-mediated self-priming as a major mechanism causing low amplification efficiency, challenging conventional PCR design assumptions [6]. The practical implementation of these insights reduces the required sequencing depth to recover 99% of amplicon sequences fourfold, significantly improving the efficiency of diagnostic applications [6].
Reagent Solutions for Respiratory Virus Detection
Table: Essential Research Reagents for Respiratory Virus Detection PCR
| Reagent Category | Specific Examples | Function and Application Notes |
|---|---|---|
| Polymerase Enzymes | Taq polymerase, Vent, Pfu, reverse transcriptase | Taq provides high yield; Vent/Pfu offer higher fidelity; selection depends on priority of efficiency vs. accuracy [122] |
| Primer/Probe Sets | SARS-CoV-2 (N1, N2, E gene), influenza (A/B matrix), RSV (A/B fusion) | Target conserved regions; multiplex compatibility; avoidance of cross-reactivity with human genome and other pathogens |
| Buffer Components | MgCl₂, dNTPs, stabilizers, enhancers | MgCl₂ concentration critical (1.5-2.5mM); mono- and disaccharides (e.g., sucrose) can enhance specificity [122] |
| Sample Processing | Viral transport media, nucleic acid extraction kits, RNase inhibitors | Maintain RNA integrity; minimize inhibitors; quality control measures essential for reproducible results |
| Controls | Synthetic RNA standards, extraction controls, no-template controls | Quantification standards; monitor extraction efficiency; detect contamination in reagent preparation |
Discussion and Future Directions
The detection of respiratory viruses during tripledemic conditions highlights the critical importance of robust, optimized PCR methodologies in public health and clinical diagnostics. The interplay between epidemiological surveillance and molecular detection creates a feedback loop where surveillance data informs testing strategies, while diagnostic accuracy strengthens surveillance systems. The 2025-2026 season projections, suggesting similar combined hospitalization burden to the previous season but with potential shifts in individual virus dynamics, underscore the need for flexible, multiplex detection approaches [120].
Future directions in respiratory virus detection include the integration of point-of-care testing with centralized surveillance, the development of increasingly multiplexed panels covering emerging pathogens alongside established threats, and the application of machine learning approaches to both assay design and result interpretation. The demonstrated success of deep learning in predicting sequence-specific amplification efficiencies suggests a pathway toward more predictable and uniform multi-template PCR, potentially overcoming one of the most persistent challenges in quantitative molecular diagnostics [6].
As PCR remains a foundational technology for respiratory virus detection, ongoing optimization aligned with principles of reaction specificity and efficiency will continue to enhance our capacity to monitor and respond to complex respiratory disease dynamics. The tripledemic context serves as both a challenge and opportunity to refine these methodologies for improved public health outcomes.
The rapid and accurate identification of pathogens causing bloodstream infections is a critical challenge in clinical diagnostics. Despite advances in medical science, these infections continue to pose significant threats, with mortality rates reaching up to 50% [123]. The timely administration of targeted antimicrobial therapy is crucial for improving patient outcomes, reducing morbidity, and controlling the emergence of antibiotic resistance [124].
This case study examines the comparative effectiveness of digital Polymerase Chain Reaction (dPCR) and conventional blood culture methods for pathogen detection. Framed within the broader principles of PCR amplification research, we explore how technological innovations in nucleic acid amplification are transforming diagnostic paradigms. The evolution from basic PCR to advanced quantitative and digital platforms represents a fundamental shift in molecular diagnostics, enabling unprecedented sensitivity and specificity in pathogen identification [2].
Technical Foundations: PCR Amplification Principles
The polymerase chain reaction (PCR), introduced by Kary Mullis in 1985, has become a cornerstone of molecular biology, earning the Nobel Prize in Chemistry for its transformative impact on genetic analysis [1]. This section outlines the core principles that underpin the PCR technologies discussed in this case study.
Fundamental PCR Mechanism
PCR is a biochemical process that amplifies specific DNA sequences through repeated temperature cycles, generating millions of copies from a single template molecule [25]. The technique targets specific DNA fragments within a sample and amplifies them through three fundamental steps repeated over 25-40 cycles [1]:
- Denaturation: Double-stranded DNA templates are heated to 94-95°C to separate the complementary strands by breaking hydrogen bonds between base pairs.
- Annealing: The temperature is lowered to 55-72°C, allowing short DNA primers to bind (anneal) to their complementary sequences flanking the target region.
- Extension: The temperature is raised to the optimum for DNA polymerase (typically 70-74°C), enabling the enzyme to extend the primers by synthesizing new DNA strands in the 5' to 3' direction using the original strands as templates [38].
The efficiency of this process enables theoretical amplification of a target sequence by a factor of over a million in just 20 cycles [38]. The discovery of thermostable DNA polymerases, particularly Taq polymerase from Thermus aquaticus, revolutionized PCR by allowing automation of the thermal cycling process without the need to add fresh enzyme after each denaturation step [25].
Evolution to Digital PCR
Digital PCR (dPCR) represents a third-generation nucleic acid analytical technique that enables absolute quantification of target molecules without requiring standard curves [123]. This method is based on partitioning a PCR reaction into thousands of individual micro-reactions (either droplet emulsions or physically isolated chambers) such that each compartment contains either zero or one (or a few) target DNA molecules [2]. Following endpoint PCR amplification, the fraction of positive reactions is counted, and the original number of target molecules is calculated using Poisson statistics [125].
This partitioning approach provides dPCR with significant advantages for complex samples, including increased resistance to PCR inhibitors and the ability to detect rare targets [2]. These technical advancements make dPCR particularly suitable for clinical applications such as blood pathogen detection, where sensitivity, specificity, and quantification are essential for effective diagnosis and treatment.
Experimental Protocol: Comparative Study Design
A recent retrospective study provides robust comparative data on blood pathogen detection methods [123]. The following section details the experimental methodology used in this investigation.
Patient Enrollment and Sample Collection
The study involved 149 patients with suspected bloodstream infections retrieved from a hospital information system between January 1, 2023, and December 31, 2024 [123]. The inclusion criteria were:
- Fever at admission (≥38.0°C)
- Definite focus of infection
- Increased white blood cell (WBC) count (≥10.0 × 10⁹/L), C-reactive protein (CRP) level (≥10 mg/L), and/or procalcitonin (PCT) level (≥0.05 ng/mL)
All participants provided informed consent, and the study was approved by the appropriate Ethics Committee [123]. Venous blood samples were collected from each patient using standard aseptic procedures, with samples allocated for both blood culture and dPCR analysis.
Blood Culture Methodology
The conventional blood culture method was performed according to standard clinical procedures [123]:
- Sample Collection: Two sets of blood culture samples were collected for anaerobic and aerobic culture, with a venous blood collection volume of 10 mL per culture set.
- Incubation: Samples were incubated at 37°C in the BacT/ALERT 3D automated culture system.
- Pathogen Identification: Positive samples underwent Gram staining, followed by subculture on Columbia blood agar plates at 37°C with 5% CO₂ for 18-24 hours.
- Confirmation: Isolated pathogens were definitively identified using the Vitek 2 Compact automated system.
Digital PCR Methodology
The dPCR analysis followed an optimized protocol for pathogen detection from blood samples [123]:
- Sample Preparation: Whole blood samples were collected in EDTA tubes, and plasma was immediately separated by centrifugation at 1,600 × g for 10 minutes.
- DNA Extraction: Plasma DNA was extracted using commercial nucleic acid extraction kits (Pilot Gene Technology) and the Auto-Pure10B Nucleic Acid Purification System according to manufacturer instructions.
- dPCR Setup: 15 μL of extracted DNA was added to a reaction mixture containing fluorescent probes and primers specific for multiple pathogens.
- Partitioning and Amplification: The reaction solution was partitioned into approximately 20,000 droplets using a droplet digital PCR system (Pilot Gene).
- Detection and Analysis: Six fluorescence channels (FAM, VIC, ROX, CY5, CY5.5, A425) were used to identify microorganisms, with data analyzed using Gene PMS software.
It should be noted that the pre-designed dPCR panel did not include primers/probes for Salmonella enterica or Streptococcus sanguinis, as these pathogens were outside the intended clinical scope of the kit [123].
Workflow Visualization
The following diagram illustrates the comparative workflows for blood pathogen detection using culture and dPCR methods:
Figure 1: Comparative Workflows for Blood Pathogen Detection
Results and Comparative Analysis
The comparative study revealed significant differences in the performance characteristics of dPCR and blood culture methods. The quantitative findings are summarized below.
Detection Sensitivity and Pathogen Spectrum
The study demonstrated substantial disparities in detection capability between the two methods [123]:
Table 1: Pathogen Detection Performance Comparison
| Parameter | Blood Culture | Digital PCR |
|---|---|---|
| Positive Specimens | 6/149 (4.0%) | 42/149 (28.2%) |
| Total Pathogen Strains Detected | 6 | 63 |
| Bacterial Species Detected | 5 | 8 |
| Fungal Species Detected | 0 | 2 |
| Viral Species Detected | 0 | 3 |
| Polymicrobial Infections Identified | 0 | 14 |
The dPCR method detected a substantially wider range of pathogens, including bacteria, fungi, and viruses, while blood culture was limited to bacterial species [123]. Notably, dPCR identified 14 cases of polymicrobial infections (10 double, 2 triple, 1 quadruple, and 1 quintuple infection), which were completely missed by blood culture [123].
The most frequently detected bacteria by dPCR were Acinetobacter baumannii (n=11) and Streptococcus spp. (n=10) [123]. The concentrations of pathogens detected by dPCR varied from 25.5 to 439,900 copies/mL, demonstrating the technique's wide dynamic range and sensitivity for absolute quantification [123].
Turnaround Time and Clinical Utility
Time-to-result represents a critical factor in the management of bloodstream infections:
Table 2: Time Efficiency and Analytical Performance
| Parameter | Blood Culture | Digital PCR |
|---|---|---|
| Average Detection Time | 94.7 ± 23.5 hours | 4.8 ± 1.3 hours |
| Time Range | 48-120 hours | 3-6 hours |
| Quantification Capability | Semi-quantitative | Absolute quantification |
| Impact of Prior Antibiotics | Significant reduction in sensitivity | Minimal impact |
| Resistance Gene Detection | Not available | Possible with optimized panels |
The dramatically shorter turnaround time of dPCR (approximately 4.8 hours versus 94.7 hours for blood culture) enables more rapid clinical decision-making regarding antibiotic therapy [123]. This time advantage is particularly crucial for septic patients, where delays in appropriate treatment significantly increase mortality risk.
Methodological Limitations
Both methods demonstrated specific limitations in the study:
- Blood Culture failed to detect fastidious or slow-growing organisms and showed significantly reduced sensitivity in patients who had received prior antibiotic therapy [123].
- Digital PCR was unable to detect pathogens not included in its pre-designed panel (Salmonella enterica and Streptococcus sanguinis in this study) and could not provide antibiotic susceptibility profiles, which are routinely available from culture-based methods [123].
Advanced Technical Considerations
Methodological Innovations in PCR
The field of PCR technology continues to evolve with several methodological advancements enhancing diagnostic capabilities:
- Multiplex PCR: This approach allows simultaneous amplification of multiple targets using different primer pairs in a single reaction, enabling comprehensive pathogen detection panels [2]. However, competition between primer pairs can sometimes lead to biased amplification or false positives [2].
- Hot-Start PCR: This technique reduces nonspecific amplification by keeping the DNA polymerase inactive until the first high-temperature denaturation step, achieved through antibody-mediated inhibition, aptamer binding, or chemical modification [38].
- Microfluidic PCR: The integration of PCR with microfluidic chip technology enables miniaturization, rapid thermal cycling, and automation, facilitating point-of-care testing applications [2].
Recent research has also addressed amplification efficiency challenges in multi-template PCR reactions. Deep learning approaches using one-dimensional convolutional neural networks (1D-CNNs) can predict sequence-specific amplification efficiencies based on sequence information alone, helping to design optimized amplification systems that minimize biased results [6].
Alternative Rapid Identification Methods
Beyond dPCR, other technologies are emerging to address the limitations of traditional culture:
- MALDI-TOF Mass Spectrometry: This method enables rapid pathogen identification directly from positive blood cultures in less than 30 minutes, compared to 24-48 hours for conventional methods [124]. The AUTOF MS1000 system demonstrated 100% concordance with traditional identification methods while significantly reducing turnaround time [124].
- Metagenomic Next-Generation Sequencing (mNGS): This culture-independent approach allows comprehensive detection of bacteria, fungi, viruses, and parasites by sequencing all nucleic acids in a sample [126]. While offering broad detection capability, mNGS has limitations in detecting some Gram-positive bacteria and fungi compared to culture methods [126].
Research Toolkit: Essential Reagents and Materials
The following table outlines key reagents and materials required for implementing digital PCR in blood pathogen detection:
Table 3: Research Reagent Solutions for Blood Pathogen Detection
| Reagent/Material | Function | Specific Example |
|---|---|---|
| Nucleic Acid Extraction Kit | Isolation of DNA from plasma samples | Pilot Gene Technology kits with Auto-Pure10B System [123] |
| dPCR Master Mix | Provides optimal buffer conditions, dNTPs, and polymerase | Pilot Gene Technology dPCR kits with fluorescent probes [123] |
| Pathogen-Specific Primers/Probes | Target recognition and amplification | Pre-designed panels for multiple pathogens [123] |
| Droplet Generation Oil | Creates stable water-in-oil emulsions | Proprietary oils compatible with droplet dPCR systems |
| Microfluidic Chips/Cartridges | Physical partitioning of reactions | Disposable cartridges for chip-based dPCR systems |
| Quantitative Standards | Validation of detection sensitivity and quantification | Synthetic DNA controls with known concentrations |
| Negative Controls | Detection of contamination | Nuclease-free water and extraction controls |
This case study demonstrates that digital PCR offers significant advantages over traditional blood culture for pathogen detection in bloodstream infections, including higher sensitivity, substantially shorter detection time, broader pathogen spectrum coverage, and absolute quantification capability. The 7-fold higher detection rate of dPCR (28.2% versus 4.0% for blood culture) highlights its potential to transform clinical diagnostics for sepsis and other serious infections [123].
Nevertheless, blood culture remains essential for providing antibiotic susceptibility profiles and detecting organisms not targeted by molecular panels. The optimal diagnostic approach likely involves a complementary strategy, using rapid molecular methods like dPCR for initial identification and guidance of empiric therapy, while awaiting culture results for definitive antibiotic selection.
Future developments in PCR technology, including improved multiplexing capabilities, integration with microfluidic systems for point-of-care testing, and enhanced resistance gene detection, will further strengthen the role of molecular methods in the diagnostic landscape. As these technologies continue to evolve, they promise to deliver increasingly precise, personalized approaches to the management of infectious diseases, ultimately improving patient outcomes through faster, more accurate pathogen identification.
The landscape of nucleic acid amplification testing (NAAT) has evolved far beyond the original polymerase chain reaction (PCR), presenting researchers and drug development professionals with a critical strategic decision: selecting the optimal amplification technology for their specific application. The North American NAAT market, a indicator of global trends, is projected to grow from $3.28 billion in 2024 to $7.64 billion by 2033, demonstrating the rapid adoption and economic significance of these technologies [127]. This growth is fueled by technological advances, rising diagnostic demand, and widespread applications in identifying infectious diseases, genetic mutations, and oncology biomarkers.
Framed within the broader thesis of PCR amplification research principles, this guide provides a structured framework for selecting among quantitative PCR (qPCR), digital PCR (dPCR), and isothermal amplification methods. The choice is not merely technical but foundational, influencing experimental validity, cost efficiency, and translational potential in drug development. Each technology offers distinct advantages in sensitivity, precision, and operational workflow, making the selection process critical for generating reliable, actionable data in both basic research and clinical applications.
The evolution of PCR technology represents a continuous pursuit of greater precision, sensitivity, and operational efficiency. Understanding the fundamental principles of each major platform is the first step in the selection framework.
Quantitative PCR (qPCR): Also known as real-time PCR, qPCR revolutionized molecular biology by enabling the monitoring of DNA amplification in real-time through fluorescent detection. This method builds on traditional PCR by adding fluorescent dyes or probes that bind to DNA and emit a signal during each reaction cycle. Specialized optics within the qPCR machine detect this signal and generate amplification curves and Ct values (cycle threshold), delivering both presence and precise quantity of the target DNA [128]. Unlike standard PCR, it eliminates the need for gel electrophoresis and manual analysis, reducing hands-on time and error risk [128].
Digital PCR (dPCR): As the latest PCR variant, dPCR expands capabilities by enabling absolute quantification of nucleic acids without requiring a standard curve. This is achieved through sample partitioning, where a PCR sample is compartmentalized into thousands or millions of subsamples, resulting in either a single or no copy in each partition [129]. The key attributes of sensitivity and absolute quantification make dPCR ideally suited for applications where qPCR falls short, particularly in detecting rare targets among abundant ones [129]. A 2025 study comparing dPCR and qPCR for detecting periodontal pathobionts demonstrated dPCR's superior sensitivity and precision, especially for low-level bacterial loads [4].
Isothermal Amplification: Techniques such as Loop-Mediated Isothermal Amplification (LAMP) and Recombinase Polymerase Amplification (RPA) offer a compelling alternative by eliminating the need for thermal cycling. LAMP, in particular, stands out for its high sensitivity and specificity and can be adapted for real-time monitoring without fluorescence by using changes in color or turbidity instead [129]. This adaptation simplifies the optics and makes systems less demanding, suitable for point-of-care applications. However, isothermal methods are generally less established for multiplexing and can have higher reagent costs compared to PCR [129].
Table 1: Core Principles of Major Nucleic Acid Amplification Technologies
| Technology | Amplification Principle | Detection Method | Quantification Capability |
|---|---|---|---|
| qPCR | Thermal cycling with fluorescence monitoring | Fluorescence detection during cycles | Relative quantification via standard curve |
| dPCR | End-point PCR after sample partitioning | End-point fluorescence reading | Absolute quantification via Poisson statistics |
| LAMP | Isothermal amplification with strand-displacing polymerase | Turbidity, colorimetric, or fluorescence | Qualitative/Semi-quantitative |
PCR Technology Selection Workflow
Decision Framework: Application, Cost, and Operational Factors
Selecting the appropriate amplification technology requires a systematic evaluation of application requirements against operational constraints and performance characteristics.
Application-Driven Selection
The fundamental question in technology selection is the primary experimental objective. Different research questions demand different technological capabilities:
Use qPCR when your application requires robust relative quantification with high throughput. This includes gene expression analysis, viral load monitoring, and microbial quantification where establishing precise fold-changes is sufficient. qPCR excels in applications requiring high specificity through melt curve analysis and is well-established for standardized diagnostic tests [128]. Its high throughput capacity makes it ideal for screening large sample numbers, such as in pandemic surveillance where millions of tests were conducted daily using pooling techniques [129].
Use dPCR when your application demands absolute quantification, superior precision, or detection of rare targets. This includes copy number variation analysis, rare mutation detection, liquid biopsy applications, and quality control of reference materials. dPCR's partitioning-based principle improves precision, suitability for multiplex analyses, and detection of low-abundant targets within a high background of other target sequences in complex clinical samples [4]. Its tolerance to inhibitors and ability to provide absolute quantification without standard curves makes it invaluable for applications where exact molecule numbers are critical.
Use isothermal amplification when speed, simplicity, or point-of-care application is the priority. LAMP and RPA are particularly valuable in resource-limited settings, field testing, and rapid diagnostics where thermal cycling equipment is impractical [129]. These methods provide compelling alternatives when the primary need is qualitative detection rather than precise quantification, though semi-quantitative approaches are emerging.
Quantitative Performance Comparison
A rigorous evaluation of analytical performance is essential for matching technology capabilities to application requirements. Recent comparative studies provide empirical data for informed decision-making.
Table 2: Analytical Performance Comparison of PCR Technologies
| Performance Parameter | qPCR | dPCR | Isothermal (LAMP) |
|---|---|---|---|
| Precision (CV%) | Moderate (varies with target concentration) | High (median CV%: 4.5%) [4] | Moderate to High |
| Limit of Detection | 1-10 copies/reaction [129] | 1-3 copies/reaction [129] | 10-100 copies/reaction [129] |
| Dynamic Range | 6-7 logarithms [129] | 4-5 logarithms [129] | 3-4 logarithms |
| Accuracy at Low Targets | Moderate (false negatives <3 log₁₀ Geq/mL) [4] | High (detects low bacterial loads) [4] | Moderate |
| Multiplexing Capacity | High (with multiple channels) | Moderate (partition limited) | Limited |
A 2025 comparative study of dPCR and qPCR for periodontal pathobiont detection quantitatively demonstrated dPCR's superior performance characteristics. The research found dPCR showed high linearity (R² > 0.99) and significantly lower intra-assay variability (median CV%: 4.5%) than qPCR, with comparable accuracy and agreement [4]. Most notably, dPCR demonstrated superior sensitivity, detecting lower bacterial loads, particularly for P. gingivalis and A. actinomycetemcomitans [4]. Bland-Altman plots highlighted good agreement at medium/high loads but significant discrepancies at low concentrations (< 3 log₁₀Geq/mL), resulting in qPCR false negatives and a 5-fold underestimation of A. actinomycetemcomitans prevalence in periodontitis patients [4].
Cost and Operational Considerations
Beyond performance characteristics, practical considerations of cost, throughput, and operational complexity significantly influence technology selection for both research and clinical environments.
Equipment and Reagent Costs: Conventional PCR thermal cyclers represent the most affordable upfront investment, making them accessible for educational labs and basic research [128]. qPCR systems command a higher price point due to integrated fluorescence detection optics and specialized software [128]. dPCR systems typically require the highest capital investment, with additional costs for specialized partitioning chips and consumables [129]. Isothermal methods may have lower equipment costs but often feature higher per-test reagent expenses compared to standard PCR [129].
Throughput and Workflow Efficiency: qPCR systems generally offer the highest throughput capabilities, with standard 96-well and 384-well formats enabling rapid processing of hundreds of samples simultaneously [128]. dPCR throughput has improved with newer systems but remains generally lower than qPCR due to partitioning limitations and imaging requirements [129]. Isothermal methods excel in rapid results, with typical amplification times of 15-60 minutes, significantly faster than conventional PCR or qPCR [129].
Operational Complexity and Training Requirements: qPCR protocols are well-established with extensive standardized workflows, though they require technical expertise in data interpretation and assay validation [128]. dPCR introduces additional complexity in partition handling and Poisson distribution-based data analysis [129]. Isothermal amplification offers the simplest operational workflow, requiring minimal technical training and being most suitable for decentralized testing environments [129].
Table 3: Operational and Economic Comparison of PCR Technologies
| Operational Factor | qPCR | dPCR | Isothermal (LAMP) |
|---|---|---|---|
| Equipment Cost | Moderate to High [128] | High [129] | Low to Moderate [129] |
| Cost per Test | Low to Moderate [128] | High [129] | Moderate to High [129] |
| Throughput | High (96-384 well formats) [128] | Moderate (limited by partitions) [129] | Variable |
| Time to Result | 30 minutes - 2 hours [128] | 1 - 3 hours | 15 - 60 minutes [129] |
| Ease of Use | Moderate (requires training) | Moderate to High (complex analysis) | Low (minimal training) [129] |
Cost vs Performance Trade-offs
Experimental Protocols and Methodologies
Translating the selection framework into practical application requires standardized methodologies. Below are detailed protocols for implementing the critical comparison experiments cited in this guide.
Protocol: Comparative Analysis of qPCR and dPCR Performance
This protocol is adapted from the 2025 study that demonstrated dPCR's superior sensitivity for detecting periodontal pathobionts [4], providing a template for conducting similar comparative evaluations.
Sample Preparation and DNA Extraction
- Collect biological samples appropriate to your research context (e.g., subgingival plaque, tissue biopsies, cell cultures).
- Extract DNA using a validated kit such as the QIAamp DNA Mini kit (Qiagen) following manufacturer's instructions [4].
- Quantify DNA concentration using spectrophotometry and normalize samples to a consistent concentration (e.g., 10 ng/μL) for comparative analysis.
- Include appropriate control samples: positive controls with known target concentrations, negative controls without template, and inhibition controls if applicable.
qPCR Assay Conditions
- Prepare reaction mixtures containing:
- 10-100 ng template DNA
- 1X TaqMan Universal PCR Master Mix or equivalent
- 900 nM forward and reverse primers
- 250 nM hydrolysis probe
- Nuclease-free water to final volume (typically 20-25 μL)
- Perform amplification using standard qPCR cycling conditions:
- Initial denaturation: 95°C for 10 minutes
- 40-45 cycles of: 95°C for 15 seconds, 60°C for 1 minute
- Analyze results using standard curve quantification or comparative Ct method for relative quantification.
dPCR Assay Conditions
- Prepare reaction mixtures using a commercial dPCR master mix (e.g., QIAcuity Probe PCR Kit):
- 10 μL sample DNA
- 10 μL 4X Probe PCR Master Mix
- 0.4 μM of each specific primer
- 0.2 μM of each specific probe
- 0.025 U/μL restriction enzyme (e.g., Anza 52 PvuII)
- Nuclease-free water to 40 μL final volume
- Load samples into dPCR plates (e.g., QIAcuity Nanoplate 26k)
- Perform partitioning and amplification with conditions:
- Initial denaturation/enzyme activation: 2 minutes at 95°C
- 45 amplification cycles: 15 seconds at 95°C, 1 minute at 58°C
- Perform endpoint fluorescence reading and analyze with manufacturer's software using Poisson correction
Data Analysis and Comparison
- Calculate precision using coefficient of variation (CV%) between replicates
- Determine limits of detection (LoD) using serial dilutions
- Assess accuracy through agreement analysis (Bland-Altman plots)
- Compare sensitivity and specificity using clinical samples or validated reference materials
Protocol: Isothermal Amplification (LAMP) Assay
This protocol provides a framework for implementing LAMP as an alternative to PCR-based methods, particularly for rapid detection applications [129].
Reaction Setup
- Prepare LAMP master mix containing:
- 1X isothermal amplification buffer
- 6-8 LAMP primers (F3, B3, FIP, BIP, LF, LB)
- 8 mM MgSO₄
- 1.4 mM dNTPs
- 0.32 U/μL Bst DNA polymerase
- Template DNA (1-10 μL)
- Nuclease-free water to 25 μL final volume
- Incubate reactions at 60-65°C for 15-60 minutes
- Terminate reaction by heating to 80°C for 5 minutes
Detection Methods
- Real-time monitoring using intercalating dyes (e.g., SYTO 9, EvaGreen)
- Endpoint detection via turbidity measurement (precipitation of magnesium pyrophosphate)
- Colorimetric detection using pH-sensitive dyes (phenol red) or hydroxy naphthol blue
- Lateral flow dipstick detection for binary result interpretation
Validation Against Reference Methods
- Compare results with qPCR or culture-based methods
- Determine clinical sensitivity and specificity
- Assess reproducibility across operators and equipment
Essential Research Reagent Solutions
Successful implementation of nucleic acid amplification technologies requires careful selection of core reagents and materials. The following table details key components and their functions in typical experimental workflows.
Table 4: Essential Research Reagents for Nucleic Acid Amplification Workflows
| Reagent Category | Specific Examples | Function in Assay | Technology Application |
|---|---|---|---|
| DNA Polymerases | Taq Polymerase, Bst Polymerase | Enzymatic DNA synthesis and amplification | All PCR variants, LAMP |
| Fluorescence Detection Systems | SYBR Green, TaqMan Probes, Molecular Beacons | Real-time detection and quantification | qPCR, dPCR |
| Master Mix Formulations | 10X Taq Buffer with MgCl₂, dNTP mix | Optimal chemical environment for amplification | All PCR variants |
| Sample Preparation Kits | QIAamp DNA Mini Kit | Nucleic acid extraction and purification | Upstream processing for all methods |
| Partitioning Reagents | QIAcuity Nanoplate 26k | Sample compartmentalization for absolute quantification | dPCR specifically |
| Primer/Probe Sets | Custom oligonucleotides | Target-specific binding and amplification | All amplification methods |
The decision framework presented provides a systematic approach to selecting nucleic acid amplification technologies based on application requirements, performance characteristics, and operational constraints. As the NAAT market continues its robust growth [127], understanding these technological trade-offs becomes increasingly critical for researchers and drug development professionals.
Future advancements in PCR technology will likely focus on increasing multiplexing capabilities, integrating artificial intelligence for data analysis, and developing practical point-of-care applications [129]. The convergence of these technologies with microfluidics, nanotechnology, and computational biology will further expand their role in genomics and molecular biology. By applying the structured decision framework outlined in this guide—evaluating application needs against cost, throughput, and performance requirements—research organizations can optimize their molecular toolkit selection to advance both basic science and translational drug development.
Conclusion
PCR remains an indispensable and dynamically evolving technology in biomedical research. From its foundational three-step cycling process to the sophisticated quantitative capabilities of qPCR and dPCR, the technique offers unparalleled sensitivity and specificity. The future of PCR lies in the refinement of these methodologies, with dPCR poised for greater adoption as costs decrease, particularly for applications requiring absolute quantification and detection of rare targets. The integration of machine learning for predicting amplification efficiency, as evidenced by recent deep learning models, represents a frontier for optimizing assay design and overcoming sequence-dependent bias. For researchers and drug development professionals, a deep understanding of both established principles and emerging trends is crucial for leveraging PCR's full potential in advancing diagnostics, therapeutic development, and fundamental biological discovery.
References
- 1. Polymerase Chain Reaction (PCR) - StatPearls - NCBI - NIH [https://www.ncbi.nlm.nih.gov/books/NBK589663/]
- 2. A comprehensive review of methodological and ... [https://www.sciencedirect.com/science/article/abs/pii/S0734975025002058]
- 3. Standard PCR Protocol [https://www.sigmaaldrich.com/US/en/technical-documents/protocol/genomics/pcr/standard-pcr?srsltid=AfmBOopky1ApUxJTaOgQHJcSYV1Ro0lq6ABzpOWN3OrpUMoc1jviksOC]
- 4. Digital PCR outperforms quantitative real-time PCR for the ... [https://pmc.ncbi.nlm.nih.gov/articles/PMC12288185/]
- 5. Digital PCR (dPCR) and Real-Time PCR (qPCR) Market ... [https://www.pharmiweb.com/press-release/2025-05-15/digital-pcr-dpcr-and-real-time-pcr-qpcr-market-growth-driven-by-key-trends-and-a-7-cagr]
- 6. Predicting sequence-specific amplification efficiency in ... [https://www.nature.com/articles/s41467-025-64221-4]
- 7. Quantitative PCR 2025-2033 Trends and Competitor ... [https://www.datainsightsmarket.com/reports/quantitative-pcr-1170480]
- 8. How does PCR work and what are its 3 steps? | INTEGRA [https://www.integra-biosciences.com/united-states/en/blog/article/how-does-pcr-work]
- 9. PCR Cycling Parameters—Six Key Considerations for ... [https://www.thermofisher.com/us/en/home/life-science/cloning/cloning-learning-center/invitrogen-school-of-molecular-biology/pcr-education/pcr-reagents-enzymes/pcr-cycling-considerations.html]
- 10. Deep Dive into Real-Time Quantitative PCR Analysis [https://www.datainsightsmarket.com/reports/real-time-quantitative-pcr-analysis-1210636]
- 11. Polymerase Chain Reaction (PCR) - NCBI - NIH [https://www.ncbi.nlm.nih.gov/probe/docs/techpcr/]
- 12. PCR Setup—Six Critical Components to Consider [https://www.thermofisher.com/us/en/home/life-science/cloning/cloning-learning-center/invitrogen-school-of-molecular-biology/pcr-education/pcr-reagents-enzymes/pcr-component-considerations.html]
- 13. Five Essential Elements of PCR [https://www.bocsci.com/resources/five-essential-elements-of-pcr.html?srsltid=AfmBOorpYHFRBXTxin1Bsvtpx4M5YXKfKbWR6RRIWQQuG5I4X9RW9VDa]
- 14. What are PCR primers? [https://www.minipcr.com/what-are-pcr-primers/]
- 15. dNTPs and Primers in PCR [https://www.bocsci.com/resources/dntps-and-primers-in-pcr.html?srsltid=AfmBOorenJzys4bxXAyI1m8pgeCyP_O_ag0jkklDgphrjT1__eMaxKna]
- 16. DNA Polymerase—Four Key Characteristics for PCR [https://www.thermofisher.com/us/en/home/life-science/cloning/cloning-learning-center/invitrogen-school-of-molecular-biology/pcr-education/pcr-reagents-enzymes/dna-polymerase-characteristics.html]
- 17. Using dNTP in Polymerase Chain Reaction (PCR) [https://www.biochain.com/blog/using-dntp-in-polymerase-chain-reaction-pcr/]
- 18. Deoxynucleotide Triphosphates and Buffer Components [https://link.springer.com/chapter/10.1007/978-1-4020-6241-4_6]
- 19. and PCR Technology: Fundamentals, Applications... Thermal Cycler [https://www.labx.com/resources/pcr-and-thermal-cycler-technology-fundamentals-applications-and-emerging-trends-in-dna/5577]
- 20. PCR Methods - Top Ten Strategies [https://www.thermofisher.com/us/en/home/life-science/cloning/cloning-learning-center/invitrogen-school-of-molecular-biology/pcr-education/pcr-reagents-enzymes/pcr-methods.html]
- 21. Standard PCR Protocol [https://www.sigmaaldrich.com/US/en/technical-documents/protocol/genomics/pcr/standard-pcr?srsltid=AfmBOoqJKe8j4BYUf1hyu2VhYCvuZScZwvkkvbx1BcpkVSUjdUW0FBu9]
- 22. Introduction to Quantitative PCR (qPCR) Gene Expression ... [https://www.thermofisher.com/us/en/home/life-science/pcr/real-time-pcr/real-time-pcr-learning-center/gene-expression-analysis-real-time-pcr-information/introduction-gene-expression.html]
- 23. PCR/qPCR Data Analysis [https://www.sigmaaldrich.com/US/en/technical-documents/technical-article/genomics/qpcr/data-analysis?srsltid=AfmBOoqAugZ88RrRChGeOON5vOKuIcOoLiik1MwYA6QXXCAwfBoXpvL5]
- 24. using “V” Shape Polymerase ... Chain Reaction Thermal Cycling [https://pmc.ncbi.nlm.nih.gov/articles/PMC6485190/]
- 25. PCR Basics | Thermo Fisher Scientific - US [https://www.thermofisher.com/us/en/home/life-science/cloning/cloning-learning-center/invitrogen-school-of-molecular-biology/pcr-education/pcr-reagents-enzymes/pcr-basics.html]
- 26. Polymerase Chain Reaction (PCR) - PMC [https://pmc.ncbi.nlm.nih.gov/articles/PMC4102308/]
- 27. Polymerase Chain Reaction (PCR) [https://www.genome.gov/genetics-glossary/Polymerase-Chain-Reaction-PCR]
- 28. Challenging the proposed causes of the PCR plateau phase [https://www.sciencedirect.com/science/article/pii/S2214753518300196]
- 29. PCR/qPCR Data Analysis [https://www.sigmaaldrich.com/US/en/technical-documents/technical-article/genomics/qpcr/data-analysis?srsltid=AfmBOoq8UtNyMReQKww0uchH_LFEQP_xaK5Uzd7uo5iFkU15GrKABtEo]
- 30. High-Throughput Data Analysis for qPCR [https://www.neb.com/en-us/tools-and-resources/feature-articles/development-of-a-high-throughput-data-analysis-method-for-quantitative-real-time-pcr?srsltid=AfmBOoqJxw_rAoLcgLL9kMjCkl_GR77RvbY06LCaIkCEkMLHWnwHx_1i]
- 31. Optimizing your PCR [https://www.takarabio.com/learning-centers/pcr/faq/optimization?srsltid=AfmBOorMUd7WTIyKqEvTDHUuaB0OexZMIqZ6ycq6MJ5sQsxQ_dBNbU4C]
- 32. Real-Time qRT-PCR - NCBI - NIH [https://www.ncbi.nlm.nih.gov/probe/docs/techqpcr/]
- 33. Ten Tips for Successful qPCR - Behind the Bench [https://www.thermofisher.com/blog/behindthebench/ten-tips-for-successful-qpcr/]
- 34. How To Interpret RT-qPCR Results [https://www.goldbio.com/blogs/articles/how-to-interpret-rt-qpcr-results?srsltid=AfmBOopeASKJOUW3x5KWMN-OXNqdMTgS-KMMQdmV3GEAfc6Emm2yceXZ]
- 35. a reliable and accurate approach for qPCR analysis | BMC ... [https://bmcbioinformatics.biomedcentral.com/articles/10.1186/s12859-024-05630-y]
- 36. Real-Time Quantitative PCR: Primer Design, Reference ... [https://pmc.ncbi.nlm.nih.gov/articles/PMC10384377/]
- 37. Basic Principles of RT-qPCR [https://www.thermofisher.com/us/en/home/brands/thermo-scientific/molecular-biology/molecular-biology-learning-center/molecular-biology-resource-library/spotlight-articles/basic-principles-rt-qpcr.html]
- 38. PCR Amplification | An Introduction to PCR Methods [https://www.promega.com/resources/guides/nucleic-acid-analysis/pcr-amplification/]
- 39. Rules and Tips for PCR & qPCR Primer Design | IDT [https://www.idtdna.com/page/support-and-education/decoded-plus/how-to-design-primers-and-probes-for-pcr-and-qpcr/]
- 40. Reverse Transcription PCR (RT-PCR): Principle, Enzymes ... [https://microbenotes.com/rt-pcr-definition-principle-enzymes-types-steps-uses/]
- 41. The Basics of Reverse Transcription PCR (RT-PCR) [https://www.excedr.com/resources/the-basics-of-reverse-transcription-pcr-rt-pcr]
- 42. RT-PCR | Reverse transcription PCR [https://www.qiagen.com/us/knowledge-and-support/knowledge-hub/bench-guide/pcr/real-time-rt-pcr/guidelines-for-rt-pcr]
- 43. A Detailed Guide to Quantitative RT-PCR (qRT-PCR) Protocols [https://www.clyte.tech/post/a-detailed-guide-to-quantitative-rt-pcr-qrt-pcr-protocols?srsltid=AfmBOopVWtkTCMERxWUADdD8pvRgn2I3fJq-5iBb9iKjgt8NYuf0pzM7]
- 44. Real-Time Quantitative RT-PCR: Design, Calculations, and ... [https://pmc.ncbi.nlm.nih.gov/articles/PMC2685626/]
- 45. Fundamentals of digital PCR [https://www.qiagen.com/us/knowledge-and-support/knowledge-hub/bench-guide/pcr/digital-pcr/what-is-digital-pcr]
- 46. Principles of digital PCR and its applications in current ... [https://pmc.ncbi.nlm.nih.gov/articles/PMC6943456/]
- 47. dPCR for Beginners [https://www.qiagen.com/us/applications/digital-pcr/beginners]
- 48. Absolute vs. Relative Quantification for qPCR [https://www.thermofisher.com/us/en/home/life-science/pcr/real-time-pcr/real-time-pcr-learning-center/real-time-pcr-basics/absolute-vs-relative-quantification-real-time-pcr.html]
- 49. dPCR Protocol [https://www.sigmaaldrich.com/US/en/technical-documents/protocol/genomics/qpcr/dpcr?srsltid=AfmBOorDjsH9WwWPHrdt1D3uwSAqzvr_wh9TAs5k2Opn7gq6p4qfS8Kc]
- 50. Generic Reporter Sets for Colorimetric Multiplex dPCR ... [https://pmc.ncbi.nlm.nih.gov/articles/PMC11355019/]
- 51. Benchmarking digital PCR partition classification methods ... [https://pmc.ncbi.nlm.nih.gov/articles/PMC10981767/]
- 52. Hot Start PCR with heat-activatable primers [https://pmc.ncbi.nlm.nih.gov/articles/PMC2582603/]
- 53. What is Hot Start PCR? [https://www.sigmaaldrich.com/US/en/technical-documents/technical-article/genomics/pcr/what-is-hot-start-pcr?srsltid=AfmBOopsnioVB3AcM0y6d24fR8XFbBSht5SS2s_szyN_foZxTNCti8NR]
- 54. dNTP Hot Start PCR Protocol [https://www.sigmaaldrich.com/US/en/technical-documents/protocol/genomics/pcr/dntp-mediated-hot-start-pcr?srsltid=AfmBOoo32CUdOHlcHbq9dnbuDFmqyZXYYLy1RfsEd91HM9egRw2DP3Ys]
- 55. Multiplex PCR: Optimization and Application in Diagnostic ... [https://pmc.ncbi.nlm.nih.gov/articles/PMC88949/]
- 56. Multiplex Polymerase Chain Reaction - an overview [https://www.sciencedirect.com/topics/agricultural-and-biological-sciences/multiplex-polymerase-chain-reaction]
- 57. Long Range PCR [https://pcrbio.com/applications/pcr/long-range-pcr/]
- 58. Next Generation Sequencing Based Multiplex Long-Range ... [https://pmc.ncbi.nlm.nih.gov/articles/PMC8219981/]
- 59. What is multiplex PCR? [https://frontlinegenomics.com/what-is-multiplex-pcr/]
- 60. Types, mechanisms, and applications in long-range PCR [https://pubmed.ncbi.nlm.nih.gov/35231536/]
- 61. Types, mechanisms, and applications in long-range PCR [https://www.sciencedirect.com/science/article/abs/pii/S0300908422000499]
- 62. Evaluation of a Commercial Multiplex Quantitative PCR ... [https://pmc.ncbi.nlm.nih.gov/articles/PMC5328467/]
- 63. Development and evaluation of a multiplex quantitative ... [https://www.sciencedirect.com/science/article/pii/S1201971222003162]
- 64. Comparative Performance of Digital PCR and Real-Time RT ... [https://pmc.ncbi.nlm.nih.gov/articles/PMC12474457/]
- 65. Comprehensive Analysis and Forecasts 2025-2033 [https://www.datainsightsmarket.com/reports/quantitative-pcr-1215800]
- 66. Troubleshooting: Common... | MyBioSource Learning Center PCR [https://www.mybiosource.com/learn/pcr-troubleshooting-common-problems-and-solutions/]
- 67. Optimizing PCR: Proven Tips and Troubleshooting Tricks [https://www.the-scientist.com/optimizing-pcr-proven-tips-and-troubleshooting-tricks-71660]
- 68. Free Guide: Top 5 PCR Optimization Tips [https://www.yeasenbio.com/blogs/molecular-biology/free-guide-top-5-pcr-optimization-tips]
- 69. Troubleshooting Guide | Thermo Fisher Scientific - RU PCR [https://www.thermofisher.com/ru/ru/home/life-science/cloning/cloning-learning-center/invitrogen-school-of-molecular-biology/pcr-education/pcr-reagents-enzymes/pcr-troubleshooting.html]
- 70. The Essential PCR Troubleshooting Checklist [https://bitesizebio.com/343/the-essential-pcr-troubleshooting-checklist/]
- 71. PCR Basic Troubleshooting Guide [https://www.creative-biogene.com/blog/pcr-basic-troubleshooting-guide]
- 72. How to optimize qPCR in 9 steps? [https://westburg.eu/knowledge/pcr_qpcr/hate_optimizing_qpcr]
- 73. PCR Troubleshooting Tips [https://www.sigmaaldrich.com/US/en/technical-documents/technical-article/genomics/pcr/pcr-troubleshooting-tips?srsltid=AfmBOopUMnIv28T8pjiyH1410SRlzBtqKBISkjeZVh9qRFVfinWwuqHz]
- 74. PCR Primer Design Tips - Behind the Bench [https://www.thermofisher.com/blog/behindthebench/pcr-primer-design-tips/]
- 75. Proven tips for PCR primer design [https://www.neb.com/en-us/nebinspired-blog/proven-tips-for-pcr-primer-design?srsltid=AfmBOooD1xBHLYXn1SZBNy61syn8I04vp2MAFFLxXLJIuqKICtH3R7v-]
- 76. What is the optimal length of a primer? | IDT [https://www.idtdna.com/pages/support/faqs/what-is-the-optimal-length-of-a-primer-]
- 77. Primer design guide - 5 tips for best PCR results [https://the-dna-universe.com/2022/09/05/primer-design-guide-the-top-5-factors-to-consider-for-optimum-performance/]
- 78. Tm Calculator for Primers [https://www.thermofisher.com/us/en/home/brands/thermo-scientific/molecular-biology/molecular-biology-learning-center/molecular-biology-resource-library/thermo-scientific-web-tools/tm-calculator.html]
- 79. Troubleshooting primer dimer in PCR [https://www.minipcr.com/primer-dimer-pcr/]
- 80. PCR Optimization: Strategies To Minimize Primer Dimer [https://genemod.net/blog/pcr-optimization]
- 81. NEB Tm Calculator [https://tmcalculator.neb.com/]
- 82. Comprehensive review and meta-analysis of magnesium ... [https://pubmed.ncbi.nlm.nih.gov/40436087/]
- 83. Optimizing PCR Reaction Conditions for High Fidelity and ... [https://www.labx.com/resources/optimizing-pcr-reaction-conditions-for-high-fidelity-and-yield/5579]
- 84. Amplifying PCR productivity and environmental ... [https://www.sciencedirect.com/science/article/pii/S0300908424000312]
- 85. Preventing PCR Amplification Carryover Contamination in ... [https://www.annclinlabsci.org/content/34/4/389.long]
- 86. How to prevent PCR contamination [https://www.minipcr.com/how-to-prevent-pcr-contamination/]
- 87. The Devil in the Details: Contamination in a PCR Lab [https://www.rapidmicrobiology.com/news/the-devil-in-the-details-contamination-in-a-pcr-lab]
- 88. Avoiding Contamination | Thermo Fisher Scientific - ES [https://www.thermofisher.com/us/en/home/life-science/pcr/real-time-pcr/real-time-pcr-learning-center/real-time-pcr-basics/good-laboratory-practice-avoid-contamination-qpcr-experiments.html]
- 89. Evaluation of PCR-enhancing approaches to reduce ... [https://www.sciencedirect.com/science/article/abs/pii/S0048969724069250]
- 90. OneStep PCR Inhibitor Removal Kit [https://www.zymoresearch.com/products/onestep-pcr-inhibitor-removal-new-kit?srsltid=AfmBOoro9gYUWd46okmYQUxvn6SWYSgwgEhnMAb9oiSARLNMp8hdTDMI]
- 91. From Shell to Sequence: Optimizing DNA Extraction and ... [https://www.mdpi.com/2073-4441/17/8/1162]
- 92. Optimization of conditions to extract high quality DNA for ... [https://www.sciencedirect.com/science/article/pii/S1319562X16301140]
- 93. Optimizing PCR amplification of GC-rich nicotinic ... [https://pmc.ncbi.nlm.nih.gov/articles/PMC12145843/]
- 94. Bacterial DNA Contamination of Commercial PCR Enzymes [https://pmc.ncbi.nlm.nih.gov/articles/PMC12029200/]
- 95. Bovine serum albumin further enhances the effects of organic ... [https://bmcresnotes.biomedcentral.com/articles/10.1186/1756-0500-5-257]
- 96. Enhancement of DNA amplification efficiency by using ... [https://www.bocsci.com/blog/enhancement-of-dna-amplification-efficiency-by-using-pcr-additives/?srsltid=AfmBOopsNHPb2P7xd6axGXr1jj7k0SXlPsz719-xYHZOIxGFGqpwVwjr]
- 97. PCR Problems? Try an Additive [https://bitesizebio.com/24/pcr-problems-try-an-additive/]
- 98. Comprehensive evaluation of molecular enhancers of the ... [https://www.nature.com/articles/srep37837]
- 99. DMSO and betaine significantly enhance the PCR ... [https://pubmed.ncbi.nlm.nih.gov/32433893/]
- 100. PCR Additives & Buffer Selection [https://www.aatbio.com/resources/application-notes/pcr-additives-buffer-selection]
- 101. Digital PCR (dPCR) vs Real-Time PCR (qPCR) [https://firalismolecularprecision.com/2025/04/09/dpcr-qpcr-differences/]
- 102. dPCR vs qPCR [https://www.qiagen.com/us/applications/digital-pcr/beginners/dpcr-vs-qpcr]
- 103. Comparing qPCR and dPCR: Choosing the Right ... [https://krakensense.com/blog/comparing-qpcr-and-dpcr-choosing-the-right-technology]
- 104. Normalizing real-time PCR results in routine testing - PMC [https://pmc.ncbi.nlm.nih.gov/articles/PMC10734596/]
- 105. Comparison of different standards for real-time PCR-based ... [https://www.sciencedirect.com/science/article/pii/S0022175910000062]
- 106. The hidden limits of digital PCR and what comes next [https://countablelabs.com/blog/the-hidden-limits-of-digital-pcr-and-what-comes-next]
- 107. Comparison of Analytic Methods for Quantitative Real-Time ... [https://pmc.ncbi.nlm.nih.gov/articles/PMC4642823/]
- 108. How good is a PCR efficiency estimate: Recommendations ... [https://www.sciencedirect.com/science/article/pii/S2214753515000169]
- 109. Chapter 7 - Sensitivity and Limit of Detection [https://www.sciencedirect.com/science/chapter/bookseries/pii/S092234870870220X]
- 110. The difference between sensitivity and detection range in ... [https://www.bosterbio.com/blog/post/the-difference-between-sensitivity-and-the-minimum-level-of-assay-range-in-elisa-testing?srsltid=AfmBOop2dJ5swDZZ72t963mp271yCSrswvn87U6MfjuiUiyZD41Q2WZ6]
- 111. Limit of Blank, Limit of Detection and Limit of Quantitation [https://pmc.ncbi.nlm.nih.gov/articles/PMC2556583/]
- 112. Methods to determine limit of detection and ... [https://www.sciencedirect.com/science/article/pii/S2214753516300286]
- 113. Analytical Sensitivity [https://www.apsnet.org/DAVN/Tools/Calculators/Pages/Analytical-Sensitivity.aspx]
- 114. Molecular Diagnostics - Part 5: Analytical Sensitivity and ... [https://blog.seracare.com/molecular-serology-blog/verification-part5]
- 115. Development of real-time PCR methods for quality control ... [https://pmc.ncbi.nlm.nih.gov/articles/PMC12058689/]
- 116. Methods To Improve Molecular Detection of Salmonella in ... [https://www.sciencedirect.com/science/article/pii/S0362028X22068454]
- 117. Inhibition Controls for Qualitative Real-Time PCR Assays [https://pmc.ncbi.nlm.nih.gov/articles/PMC4042775/]
- 118. Nanomaterials in PCR: exploring light-to-heat conversion ... [https://www.nature.com/articles/s41378-025-00898-3]
- 119. Respiratory Illnesses Data Channel [https://www.cdc.gov/respiratory-viruses/data/index.html]
- 120. 2025-2026 Respiratory Disease Season Outlook | CFA [https://www.cdc.gov/cfa-qualitative-assessments/php/data-research/season-outlook25-26.html]
- 121. Respiratory Virus Activity Levels [https://www.cdc.gov/respiratory-viruses/data/activity-levels.html]
- 122. PCR Optimization: Factors Affecting Reaction Specificity ... [https://www.mybiosource.com/learn/pcr-optimization-factors-affecting-reaction-specificity-and-efficien/]
- 123. Comparative analysis between digital PCR and blood ... [https://www.frontiersin.org/journals/medicine/articles/10.3389/fmed.2025.1615409/full]
- 124. Rapid pathogen identification directly from positive blood ... [https://www.sciencedirect.com/science/article/abs/pii/S0732889325003062]
- 125. PCR: A Comprehensive Guide [https://biopathogenix.com/pcr-a-comprehensive-guide/]
- 126. Comparison of pathogen detection performance between ... [https://www.frontiersin.org/journals/cellular-and-infection-microbiology/articles/10.3389/fcimb.2025.1563962/full]
- 127. North America Nucleic Acid Amplification Testing Market [https://www.globenewswire.com/news-release/2025/11/28/3196056/28124/en/North-America-Nucleic-Acid-Amplification-Testing-Market-Analysis-Report-2025-2033-Technological-Advances-Rising-Diagnostic-Demand-and-Widespread-Applications.html]
- 128. PCR and Real-Time PCR: Differences in Results, Cost ... [https://www.labconsulting.at/pcr-and-real-time-pcr-differences/]
- 129. Quantitative or digital PCR? A comparative analysis for ... [https://www.sciencedirect.com/science/article/abs/pii/S0165993624001584]