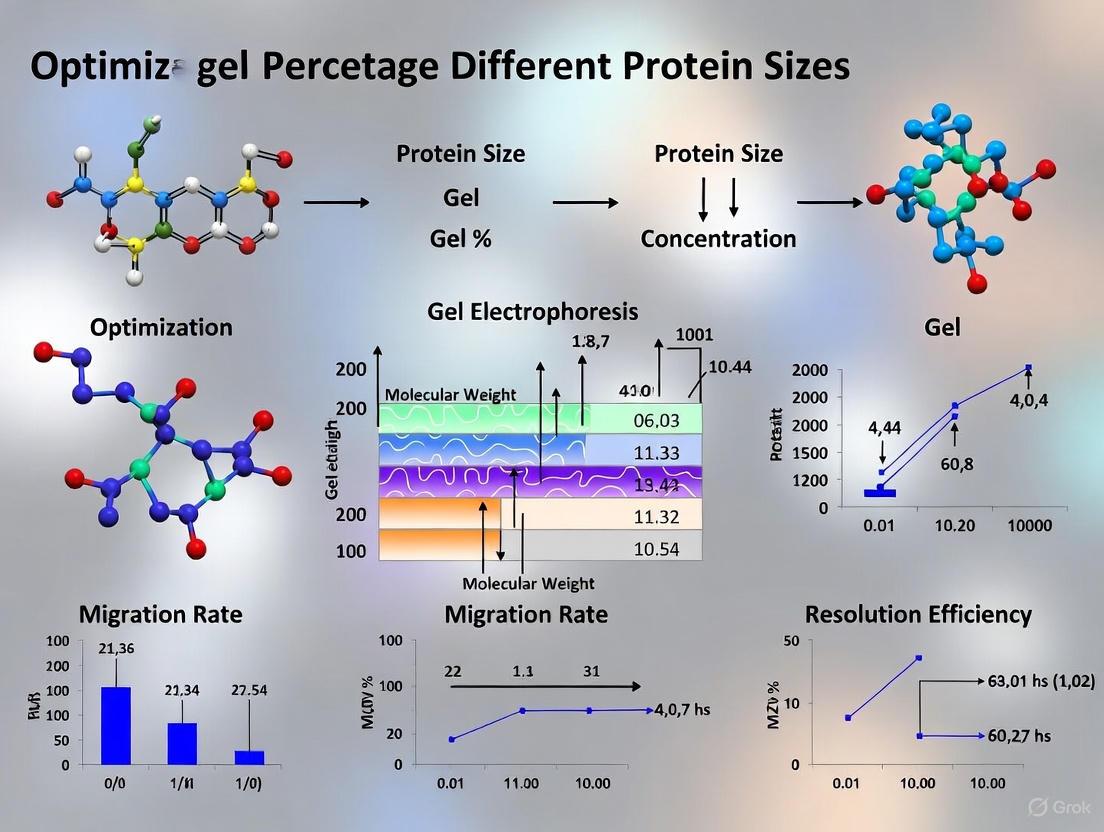
Optimizing Protein Separation: A Comprehensive Guide to Gel Percentage Selection for Different Protein Sizes
This article provides researchers, scientists, and drug development professionals with a detailed guide to optimizing polyacrylamide gel percentages for SDS-PAGE to achieve superior resolution of proteins across different molecular weight...
Optimizing Protein Separation: A Comprehensive Guide to Gel Percentage Selection for Different Protein Sizes
Abstract
This article provides researchers, scientists, and drug development professionals with a detailed guide to optimizing polyacrylamide gel percentages for SDS-PAGE to achieve superior resolution of proteins across different molecular weight ranges. It covers the foundational principles of electrophoretic separation, practical methodologies for gel selection and protocol execution, advanced troubleshooting for common issues like smearing and poor resolution, and validation techniques to ensure accurate protein characterization. By synthesizing core concepts with current optimization strategies, this resource aims to enhance experimental reproducibility and reliability in protein analysis for biomedical research.
The Science of Size-Based Separation: Core Principles of SDS-PAGE
Understanding the Role of SDS in Protein Denaturation and Charge Uniformity
Frequently Asked Questions (FAQs)
FAQ 1: What is the fundamental role of SDS in protein denaturation? Sodium dodecyl sulfate (SDS) is an anionic detergent that plays two critical, interdependent roles. First, it denatures proteins by breaking non-covalent bonds—such as hydrogen bonds, hydrophobic interactions, and ionic bonds—that maintain secondary and tertiary structures [1]. This process linearizes the polypeptide chains. Second, SDS imparts a uniform negative charge by binding to the protein backbone at a nearly constant ratio of approximately 1.4 grams of SDS per gram of protein [1] [2]. This binding overwhelms the protein's intrinsic charge, resulting in a consistent charge-to-mass ratio for all proteins [3].
FAQ 2: Why is charge uniformity essential for SDS-PAGE? Charge uniformity ensures that the electrophoretic mobility of proteins is determined solely by their molecular weight [1] [4]. When all proteins in a mixture have a similar negative charge density, they will migrate through the polyacrylamide gel matrix based only on size. Smaller proteins move faster through the pores, while larger ones move more slowly. Without this uniform charge, a protein's native charge would influence its migration, preventing accurate molecular weight estimation [5].
FAQ 3: Can SDS denature a protein that has no charged amino acids? Yes. Research using a specially engineered chargeless protein (a cellulose-binding domain with all ionizable side chains replaced by neutral residues) has demonstrated that SDS can unfold it in a manner similar to charged proteins [2]. This indicates that while electrostatic interactions can enhance binding, formal protein charges are not an absolute requirement for SDS-induced unfolding. The hydrophobic interactions between the alkyl chains of SDS and the protein backbone are a significant driving force for denaturation [2] [6].
FAQ 4: What is the function of a reducing agent in SDS-PAGE sample preparation? Reducing agents, such as β-mercaptoethanol or dithiothreitol (DTT), are added to the sample buffer to break disulfide bonds [1]. These covalent bonds are not disrupted by SDS alone. By breaking disulfide bonds, the reducing agent ensures that multi-subunit proteins are dissociated into their individual polypeptides and that all proteins are fully linearized, allowing for accurate separation based on the molecular weight of the polypeptide chains [1] [4].
Troubleshooting Guide
This guide addresses common issues related to SDS denaturation and charge uniformity that can compromise SDS-PAGE results.
| Problem | Possible Cause | Suggested Solution |
|---|---|---|
| Poor Band Resolution [5] [7] [8] | Incomplete denaturation; Protein aggregation; Incorrect gel percentage. | Ensure proper sample prep: boil 5 min at 98°C, then place immediately on ice [5]. Load appropriate protein amount to prevent aggregation [5]. Choose gel % based on protein size (see Table 2). |
| Smeared Bands [5] [7] [8] | Gel run at too high voltage; Insufficient SDS in sample; High salt concentration. | Run gel at lower voltage for longer time [7]. Ensure sample buffer has correct SDS concentration [8]. Dialyze high-salt samples before loading [8]. |
| Atypical Band Migration [5] | Incomplete denaturation; Protein not fully linearized. | Increase boiling time slightly (avoid protein degradation) [5]. Use fresh reducing agent (DTT/β-mercaptoethanol) to break all disulfide bonds [8]. |
| Missing or Weak Bands [8] | Protein degraded by proteases; Proteins ran off gel. | Use protease inhibitors during sample prep. Avoid freeze-thaw cycles. Use higher % gel for small proteins to prevent them from running off [8]. |
| "Smiling" or "Frowning" Bands [7] [4] | Uneven heat distribution across gel. | Run gel at lower voltage to reduce heating. Place apparatus in cold room or use a cooled tank [7]. |
Optimizing Gel Percentage for Different Protein Sizes
The polyacrylamide gel acts as a molecular sieve. Its pore size, determined by the acrylamide concentration, must be matched to the size of your target proteins for optimal separation [5].
- High-percentage Gels (e.g., 12-20%): Have smaller pores and are ideal for resolving low molecular weight proteins (<30 kDa), which would otherwise migrate too quickly and poorly resolve in a loose matrix [5] [4].
- Low-percentage Gels (e.g., 8-10%): Have larger pores and are best for high molecular weight proteins (>100 kDa). A matrix that is too tight will prevent large proteins from migrating efficiently [5] [4].
- Gradient Gels (e.g., 4-20%): Provide a pore size gradient and are excellent for resolving a wide mixture of proteins of different sizes simultaneously, offering high resolution across a broad mass range [4].
Table 2: Gel Percentage Selection Guide Based on Protein Size [1] [4]
| Gel Percentage | Effective Separation Range (kDa) | Best For |
|---|---|---|
| 8% | 25 - 200 | Very high molecular weight proteins. |
| 10% | 15 - 100 | Standard separation for a broad range. |
| 12% | 10 - 70 | Mid-to-low molecular weight proteins. |
| 15% | 5 - 50 | Low molecular weight proteins and peptides. |
| 4-20% Gradient | 10 - 300 | Complex mixtures with diverse protein sizes. |
The Scientist's Toolkit: Essential Reagent Solutions
Table 3: Key Reagents for SDS-PAGE Experiments [1] [4]
| Reagent | Function in SDS-PAGE |
|---|---|
| SDS (Sodium Dodecyl Sulfate) | Denatures proteins and confers a uniform negative charge, enabling separation by size alone. |
| Acrylamide/Bis-acrylamide | Forms the cross-linked polyacrylamide gel matrix that acts as a molecular sieve. |
| Reducing Agent (DTT or BME) | Breaks disulfide bonds to fully linearize proteins and dissociate subunits. |
| Tris-Glycine Buffer | The standard running buffer that maintains pH and ionic strength for consistent protein migration. |
| Ammonium Persulfate (APS) & TEMED | Catalyzes the polymerization reaction of acrylamide and bis-acrylamide to form the gel. |
| Tracking Dye (Bromophenol Blue) | Provides a visible front to monitor the progress of electrophoresis. |
| Glycerol | Adds density to the sample buffer, allowing it to sink to the bottom of the gel wells during loading. |
Experimental Protocol: Standard SDS-PAGE Sample Preparation and Electrophoresis
This protocol ensures complete protein denaturation and charge uniformity for reliable results [1] [4].
Part A: Sample Preparation
- Mix Sample with Buffer: Combine your protein sample with an equal volume of 2X Laemmli SDS-PAGE sample buffer. A standard buffer contains:
- SDS (for denaturation and charging)
- A reducing agent like DTT or β-mercaptoethanol (to break disulfide bonds)
- Glycerol (for density)
- Bromophenol blue (tracking dye)
- Tris buffer (to maintain pH)
- Denature Proteins: Heat the mixture at 98°C for 5 minutes in a heat block or boiling water bath [5].
- Cool Samples: Immediately after heating, place the samples on ice to prevent renaturation. Slow cooling can allow proteins to refold [5].
- Brief Centrifugation: Spin down the tubes briefly to collect all condensation before loading the gel.
Part B: Gel Electrophoresis
- Assemble Apparatus: Place the polymerized polyacrylamide gel into the electrophoresis tank.
- Add Running Buffer: Fill the inner and outer chambers with Tris-glycine running buffer, which also contains SDS.
- Load Samples: Carefully load the denatured samples and a protein molecular weight marker (ladder) into the wells.
- Apply Current: Connect the power supply and run the gel. A common setting is 100-150 volts constant voltage. Run until the dye front reaches the bottom of the gel [4].
- Visualization: After electrophoresis, disconnect the power, remove the gel, and stain (e.g., with Coomassie Blue or a fluorescent dye) to visualize the separated protein bands [1].
SDS Denaturation Mechanism and Workflow
The following diagram illustrates the mechanism of SDS-mediated protein denaturation and the subsequent workflow for SDS-PAGE.
The polyacrylamide gel matrix is a fundamental tool in biochemical research, serving as a molecular sieve to separate proteins and nucleic acids based on size. The effectiveness of this separation hinges on the gel's pore size, which is precisely controlled by the concentration of acrylamide and crosslinker. This technical resource center provides researchers with essential knowledge for optimizing gel electrophoresis conditions, addressing common experimental challenges, and understanding the underlying principles that govern macromolecular migration through the gel matrix. Mastery of these factors is critical for obtaining high-resolution separations, accurate molecular weight determinations, and reproducible results in applications ranging from basic research to pharmaceutical development.
FAQ: Fundamental Principles of Gel Matrix and Pore Size
1. What creates the molecular sieve in a polyacrylamide gel? The molecular sieve is created by the three-dimensional mesh network formed when acrylamide monomers polymerize into long chains cross-linked by bisacrylamide. The average pore diameter of this mesh is determined by the total concentration of acrylamides (%T) and the concentration of the cross-linker (%C). The pore size is reduced as the total acrylamide concentration increases [9].
2. How does pore size affect the migration of proteins during SDS-PAGE? In SDS-PAGE, proteins are denatured and coated with the negatively charged detergent SDS, giving them a uniform charge-to-mass ratio. During electrophoresis, these proteins are separated primarily by size because the gel matrix acts as a sieve: smaller proteins navigate through the pores more easily and migrate faster, while larger proteins are impeded and migrate more slowly [10] [4].
3. What is the difference between SDS-PAGE and Native PAGE in terms of separation? SDS-PAGE is a denaturing technique where proteins are separated primarily by molecular weight, as SDS masks the proteins' intrinsic charges. In contrast, Native PAGE is a non-denaturing technique where proteins retain their native conformation, quaternary structure, and enzymatic activity. Consequently, separation in Native PAGE depends on a combination of the protein's intrinsic charge, size, and shape [10] [11].
4. How do I choose the right acrylamide percentage for my protein of interest? The optimal acrylamide concentration depends on the molecular weight of the target protein. Lower percentage gels (with larger pores) are better for resolving high molecular weight proteins, while higher percentage gels (with smaller pores) are ideal for separating low molecular weight proteins [10] [12]. Refer to the table in the "Troubleshooting Guide" section for specific recommendations.
5. Why are gradient gels sometimes used? Gradient gels, which have a low percentage of acrylamide at the top and a high percentage at the bottom, provide a broader range of separation in a single gel. The gradient of pore sizes allows for sharper band resolution across a wide spectrum of protein molecular weights. The stacking effect of the gradient itself can also concentrate samples before separation, sometimes eliminating the need for a separate stacking gel [10] [4].
Troubleshooting Guide: Resolving Common Electrophoresis Issues
1. Problem: Smiling or Frowning Bands
- Potential Causes: Uneven sample loading, excessive sample, improper buffer composition, extended gel running times, or irregular current distribution across the gel [4].
- Solutions: Ensure even sample loading across all wells, avoid overloading wells, carefully monitor gel run time and voltage, and confirm even distribution of buffer and current in the tank. Optimizing sample preparation with reducing agents can also help prevent aggregation that leads to distortion [4].
2. Problem: Incomplete Protein Separation
- Potential Causes: Insufficient run time, incorrect acrylamide concentration for the target protein size, or improper buffer preparation [4].
- Solutions: Allow sufficient time for the dye front to reach the bottom of the gel. Adjust the acrylamide concentration to better match the size of your proteins (see Table 1). Double-check that the running buffer is correctly prepared and has the proper ionic strength and pH [4].
3. Problem: Gel Polymerization Problems
- Potential Causes: Improper gel casting, incomplete polymerization, or impurities that inhibit the polymerization reaction [4].
- Solutions: Ensure glass plates are thoroughly clean. Use fresh ammonium persulfate (APS) and TEMED, as they are critical for initiating and catalyzing the polymerization reaction. Degas the gel solution to remove oxygen, which can inhibit polymerization [9].
4. Problem: A single protein appears as multiple bands
- Potential Causes: Proteolytic degradation, incomplete denaturation, or the presence of post-translational modifications (e.g., glycosylation) that can alter mobility [4].
- Solutions: Include protease inhibitors in your sample preparation and keep samples on ice. Ensure samples are heated sufficiently (typically 70-100°C) in the presence of SDS and reducing agents like DTT or β-mercaptoethanol to fully denature the protein [4] [9].
5. Problem: High Background Staining
- Potential Causes: Inadequate destaining or over-staining of the gel.
- Solutions: Follow the recommended staining and destaining protocol for your chosen stain (e.g., Coomassie, silver stain). For Coomassie, destaining in a solution of methanol and acetic acid helps remove background dye until bands are clear [4].
Table 1: Optimizing Gel Percentage for Protein Separation
| Target Protein Size Range | Recommended Acrylamide Concentration |
|---|---|
| 100 - 600 kDa | 4% - 6% |
| 50 - 300 kDa | 7% - 8% |
| 30 - 200 kDa | 10% |
| 10 - 100 kDa | 12% - 15% |
Table 2: Pore Size and Separation Characteristics of Common Gel Types
| Gel Type | Typical Pore Size Range | Ideal Separation Range | Key Applications |
|---|---|---|---|
| Agarose | ~50 - 200 nm [13] [14] | Large nucleic acids, protein complexes | DNA gels, analysis of large macromolecular assemblies [15] [14] |
| Polyacrylamide | ~5 - 140 nm [13] | Proteins, small nucleic acids | SDS-PAGE, Native PAGE, sequencing gels [15] [10] |
Experimental Protocols and Methodologies
Protocol 1: Standard SDS-PAGE Gel Casting and Electrophoresis
This protocol outlines the foundational steps for preparing and running a denaturing protein gel [16].
- Gel Casting Setup: Thoroughly clean the glass plates with ethanol and assemble the gel casting mold with spacers.
- Preparing the Resolving Gel: Mix the acrylamide solution for the resolving gel according to the desired percentage (see Table 1). Add the polymerization initiators, ammonium persulfate (APS) and the catalyst TEMED, and mix gently. Pour the solution between the glass plates, leaving space for the stacking gel.
- Polymerization: Overlay the resolving gel with water-saturated butanol or isopropanol to prevent contact with air, which inhibits polymerization. Allow the gel to polymerize completely (typically 20-30 minutes).
- Preparing the Stacking Gel: Pour off the overlay liquid. Prepare a lower-percentage acrylamide solution for the stacking gel, add APS and TEMED, and pour it over the resolving gel. Immediately insert a comb to create sample wells.
- Sample Preparation: Mix protein samples with SDS-PAGE sample buffer (containing SDS and a reducing agent like DTT). Heat the samples at 70-100°C for 3-10 minutes to denature the proteins [4] [16].
- Electrophoresis: Mount the gel cassette in the electrophoresis chamber and fill the upper and lower chambers with running buffer. Load the denatured samples and molecular weight markers into the wells. Apply a constant voltage (e.g., 100-150 V for a mini-gel) until the dye front reaches the bottom of the gel [4].
Protocol 2: Native SDS-PAGE for Metalloprotein Analysis
This modified protocol minimizes denaturation, allowing for the separation of proteins while retaining bound metal ions and, in many cases, enzymatic activity [11].
- Sample Preparation: Mix the protein sample with a modified native sample buffer (e.g., 100 mM Tris HCl, 150 mM Tris base, 10% glycerol, 0.0185% Coomassie G-250, pH 8.5). Crucially, omit SDS, EDTA, and the heating step to preserve the native state of the proteins [11].
- Gel Pre-Run: Pre-run precast polyacrylamide gels (e.g., 12% Bis-Tris) at 200V for 30 minutes in double-distilled H₂O to remove storage buffer and any unpolymerized acrylamide.
- Running Buffer: Use a running buffer with a significantly reduced SDS concentration (e.g., 0.0375% SDS) and no EDTA [11].
- Electrophoresis: Load the unheated samples and run the gel at a constant voltage (e.g., 200V) at room temperature.
Visualizing the Process: Workflows and Relationships
Electrophoresis Separation Principle
Troubleshooting Decision Workflow
The Scientist's Toolkit: Essential Reagents and Materials
Table 3: Key Research Reagent Solutions for PAGE
| Reagent/Material | Function | Key Considerations |
|---|---|---|
| Acrylamide/Bis-acrylamide | Forms the cross-linked polymer network (gel matrix). | The ratio (e.g., 1:35 bis:acrylamide) and total concentration (%T) determine pore size. Acrylamide monomer is a neurotoxin; handle with care [10] [9]. |
| Ammonium Persulfate (APS) | Free-radical initiator for polymerization. | Prepare a fresh 10% solution for optimal polymerization efficiency [10]. |
| TEMED | Catalyst that promotes free radical formation by APS, accelerating polymerization. | Add just before casting the gel, as polymerization begins rapidly [10]. |
| SDS (Sodium Dodecyl Sulfate) | Ionic detergent that denatures proteins and confers a uniform negative charge. | Critical for denaturing SDS-PAGE. A thiol reagent (DTT, β-mercaptoethanol) is often added to reduce disulfide bonds [10] [4]. |
| Tris-based Buffers | Provides the conductive medium and maintains stable pH during electrophoresis. | Discontinuous systems (different pH in stacking vs. resolving gel) are used to concentrate samples into sharp bands before separation [10]. |
| Molecular Weight Markers | A set of proteins of known sizes run alongside samples for molecular weight calibration. | Essential for estimating the molecular weight of unknown proteins and monitoring the progress of the run [10] [4]. |
| Coomassie/Silver Stains | Dyes used for visualizing protein bands after electrophoresis. | Coomassie is simple and compatible with mass spectrometry; silver stain offers higher sensitivity for detecting low-abundance proteins [4]. |
The Tris-Glycine discontinuous buffer system is a foundational technique for protein separation using SDS-PAGE. This system employs different pH levels and ionic compositions in the stacking and resolving gels to concentrate protein samples into sharp bands before separation by molecular weight. Understanding the distinct roles of Tris, glycine, and the carefully controlled pH is essential for optimizing protein resolution and troubleshooting experimental issues.
The system operates using three key ions: chloride (Cl⁻) from the gel buffer acts as the highly mobile leading ion; glycine from the running buffer serves as the trailing ion due to its pH-dependent charge; and Tris base (H⁺) is the common cation present throughout the system [17]. The strategic manipulation of pH controls the charge state of glycine, creating the stacking effect that is crucial for achieving sharp protein bands.
Frequently Asked Questions (FAQs)
What is the primary function of the discontinuous buffer system? The discontinuous buffer system ensures that all protein samples enter the resolving gel at the same time and in a highly concentrated, narrow band. Without this stacking effect, proteins would enter the resolving gel at different times from the typically deep wells (around 1 cm), resulting in smeared and poorly resolved bands [18] [19].
Why is glycine crucial for the stacking process? Glycine is an amino acid whose charge state varies dramatically with pH. In the pH 8.3 running buffer, glycine is predominantly a negatively charged glycinate anion. When it enters the pH 6.8 stacking gel, its charge shifts, and it becomes primarily a neutral zwitterion [18] [19]. This change causes glycine to migrate much more slowly in the electric field compared to the chloride ions, creating a steep voltage gradient that "stacks" the proteins into a tight band.
What are the specific pH values in the different parts of the system? The system uses three critical pH levels that create the discontinuities essential for its function [19]:
- Stacking Gel: pH 6.8
- Resolving Gel: pH 8.8
- Running Buffer: pH 8.3
How does the operating pH in the resolving gel differ? During electrophoresis, the interaction of the gel and buffer ions in the Tris-Glycine system establishes an actual operating pH of approximately 9.5 in the separating region of the gel, which is higher than the initial pH of the resolving gel buffer [17].
The Scientist's Toolkit: Essential Reagents and Their Functions
| Component | Function | Key Characteristics |
|---|---|---|
| Tris-HCl [18] [19] | Buffering agent in gels; maintains pH in stacking (6.8) and resolving (8.8) gels. | pKa of ~8.1; ideal for biological systems in pH 7-9 range. |
| Glycine [17] [18] | Trailing ion in running buffer; charge state changes with pH to enable stacking. | Zwitterionic at pH 6.8; anionic at high pH. Key to discontinuity. |
| SDS (Sodium Dodecyl Sulfate) [18] [10] | Denatures proteins; confers uniform negative charge. | Masks intrinsic protein charge; allows separation by size only. |
| Acrylamide/Bis-Acrylamide [10] | Forms cross-linked polymer gel matrix; acts as a molecular sieve. | Pore size determines resolution range; concentration is varied. |
| Ammonium Persulfate (APS) & TEMED [18] [10] | Catalyzes acrylamide polymerization. | APS produces free radicals; TEMED acts as a catalyst. |
Experimental Protocol & Conditions
The following table summarizes standard electrophoresis conditions for a Mini Gel format using the XCell SureLock Mini-Cell, requiring 200 mL for the upper buffer chamber and 600 mL for the lower buffer chamber [17].
Table 1: Standard Electrophoresis Conditions for Tris-Glycine Mini Gels
| Parameter | SDS-PAGE Condition | Native-PAGE Condition |
|---|---|---|
| Gel Type | Tris-Glycine (SDS-PAGE) | Tris-Glycine (Native-PAGE) |
| Applied Voltage | 125 V (constant) | 125 V (constant) |
| Expected Current (Start) | 30-40 mA | 6-12 mA |
| Expected Current (End) | 8-12 mA | 3-6 mA |
| Approximate Run Time | 90 minutes | 1-12 hours |
| Tracking Dye | Bromophenol blue | Bromophenol blue |
| Stop Point | Dye front reaches bottom of gel | As required for separation |
Detailed Sample Preparation Methodology
For Denaturing SDS-PAGE:
- Mix Sample: Combine your protein sample with an equal volume of 2X Tris-Glycine SDS Sample Buffer [17].
- Reduce (if needed): For reduced samples, add a reducing agent like NuPAGE Reducing Agent (10X DTT) or β-mercaptoethanol to a final concentration of 1X or 2.5%, respectively. Add this immediately before electrophoresis for best results [17].
- Denature: Heat the sample at 85°C for 2-5 minutes to fully denature the proteins. Avoid heating at 100°C as it can lead to proteolysis [17].
- Load: Load the denatured sample immediately onto the gel.
For Non-Denaturing (Native) PAGE:
- Mix Sample: Combine your protein sample with an equal volume of 2X Tris-Glycine Native Sample Buffer [17].
- Do Not Heat or Add Reducer: Heating or adding reducing agents will denature the proteins, defeating the purpose of native PAGE [17].
- Load: Load the prepared sample onto the gel.
Critical Note: For optimal results, do not run reduced and non-reduced samples on the same gel. If necessary, never load them in adjacent lanes to prevent carry-over effects of the reducing agent [17].
Troubleshooting Common Issues
Problem: Smeared protein bands across the gel.
- Cause & Solution: Incomplete stacking can cause smearing. Ensure your stacking gel is at the correct pH (6.8) and that the running buffer is freshly prepared at pH 8.3. Avoid overloading the gel with protein [20].
Problem: Poor reproducibility between runs.
- Cause & Solution: Inconsistent buffer preparation is a common culprit. Always record the precise reagents and procedures used. When adjusting pH, avoid "overshooting" the target, as adding extra acid or base to correct the pH alters the ionic strength. Always measure the pH of the buffer at room temperature before adding it to the electrophoresis tank [21].
Problem: Bands are curved or distorted, particularly at high protein loads.
- Cause & Solution: This is often a sign of protein or buffer overload. The gel may have difficulty accommodating the sample volume or the high ionic strength of the sample buffer. Use a gel with higher well capacity (e.g., WedgeWell format) and ensure your sample is prepared in the recommended buffer [20].
Problem: Protein bands are diffuse and poorly resolved.
- Cause & Solution: The acrylamide percentage might be incorrect for your target protein size. Use Table 2 to select an appropriate gel percentage. For a broader range of separation, a gradient gel (e.g., 4-20%) is recommended [10].
Table 2: Optimizing Gel Percentage for Protein Separation
| Acrylamide Percentage (%)) | Effective Separation Range (kDa) |
|---|---|
| 7% | 50 - 500 |
| 10% | 20 - 300 |
| 12% | 10 - 200 |
| 15% | 3 - 100 |
Visualization of the Stacking Mechanism
The diagram below illustrates the step-by-step process of how the discontinuous buffer system uses Tris, glycine, and pH to stack and separate proteins.
Key Takeaways for Optimal Results
- pH is Critical: The precise pH of each component (stacking gel, resolving gel, and running buffer) is non-negotiable for proper stacking and separation. Always verify pH during buffer preparation.
- Glycine's Role is Key: The pH-dependent charge transition of glycine from anion to zwitterion and back to anion is the engine of the discontinuous buffer system.
- Match the Gel to Your Protein: Using the correct acrylamide percentage for your protein's molecular weight is essential for high-resolution separation.
- Consistency in Buffer Preparation: Meticulous attention to buffer preparation details, including the type of salt and the pH adjustment procedure, is vital for reproducible results.
SDS-PAGE (Sodium Dodecyl Sulfate–Polyacrylamide Gel Electrophoresis) is a foundational technique for separating proteins based on their molecular weight. The core principle is that proteins are denatured and linearized by the ionic detergent SDS, which coats them with a uniform negative charge. When an electric field is applied, these proteins migrate through a polyacrylamide gel matrix, where smaller proteins move faster than larger ones. The gel percentage—the concentration of acrylamide—directly determines the gel's pore size and is the most critical factor for achieving optimal resolution for your protein of interest [22] [23] [10].
This technical resource center provides targeted FAQs and troubleshooting guides to help you optimize this fundamental relationship for your research.
➤ Frequently Asked Questions (FAQs)
How does gel percentage affect protein separation?
The polyacrylamide gel acts as a molecular sieve. The pore size within this sieve is inversely related to the gel percentage [10].
- High-Percentage Gels (e.g., 15-20%): Have small pore sizes, ideal for resolving low molecular weight proteins. Small proteins are slowed down and thus separated effectively [22] [23].
- Low-Percentage Gels (e.g., 4-8%): Have large pore sizes, allowing high molecular weight proteins to navigate through the matrix more freely. Large proteins would be trapped or poorly separated in a high-percentage gel [22] [24].
How do I choose the correct gel percentage for my protein?
Select a gel percentage where your protein's molecular weight falls in the middle of the gel's effective separation range for best resolution. The table below provides a general guideline.
| Target Protein Size (kDa) | Recommended Gel Percentage |
|---|---|
| >200 kDa | 4-6% [24] / 4% [22] |
| 50-200 kDa | 8% [24] / 7-8% [25] |
| 15-100 kDa | 10% [25] [24] |
| 10-70 kDa | 12.5% [25] [24] |
| 12-45 kDa | 15% [25] [24] |
| 4-40 kDa | Up to 20% [25] [24] |
Pro Tip: If your target protein has multiple isoforms or you are probing for several proteins of widely differing sizes, use a gradient gel (e.g., 4-20%). It provides a continuous range of pore sizes, sharpens protein bands, and resolves a much broader spectrum of protein weights on a single gel [25] [10].
What is the purpose of the two different gel layers?
A standard SDS-PAGE gel has two distinct layers, each with a specific function [23] [10]:
Stacking Gel (Top Layer)
- Composition: Lower acrylamide concentration (e.g., 4-5%) and pH (~6.8).
- Function: To "stack" or concentrate all protein samples into a very sharp, tight band before they enter the resolving gel. This is achieved through a discontinuous buffer system involving glycine ions, creating a steep voltage gradient that herds proteins into a thin line [23].
Resolving Gel (Bottom Layer)
➤ Troubleshooting Guides
Problem: Poor or Blurry Band Resolution
| Potential Cause | Solution |
|---|---|
| Incorrect gel percentage | Refer to the selection table above. A 10% gel is a good starting point for a 50 kDa protein, but a 200 kDa protein requires a 6% gel [22] [24]. |
| Poorly polymerized gel | Ensure ammonium persulfate (APS) and TEMED, the polymerization catalysts, are fresh. Inactive catalysts lead to inconsistent gel formation and poor separation [25] [10]. |
| Sample overload | Load 15-40 µg of total protein per mini-gel well. Overloading leads to thick, diffuse bands that cannot resolve properly [25]. |
| Incorrect running buffer pH | Prepare running buffer fresh and confirm the pH is 8.3. An incorrect pH disrupts the glycine ion front, ruining the stacking effect [23] [24]. |
Problem: Uneven or Smiled Bands
| Potential Cause | Solution |
|---|---|
| Running voltage too high | Excessive voltage generates heat, causing bands to "smile" (curve upwards at the edges). Run the gel at a lower voltage (e.g., 100-120V) or use a cooling apparatus [24] [10]. |
| Air bubbles or imperfect gel polymerization | Ensure the gel cassette is properly assembled and the gel has polymerized uniformly. Imperfections can create alternative migration paths for proteins [25]. |
Problem: Protein Runs at Unexpected Molecular Weight
| Potential Cause | Solution |
|---|---|
| Post-translational modifications | Glycosylation or phosphorylation can alter a protein's apparent size. Glycosylated proteins may appear as diffuse, higher molecular weight bands [23]. |
| Incomplete denaturation | Ensure your sample buffer contains sufficient SDS and reducing agent (BME or DTT) and that the sample was heated adequately (70-100°C) to fully linearize the proteins [23] [10]. |
➤ Visualizing the Separation Process
The following diagram illustrates the logical workflow of how gel percentage influences pore size and, ultimately, protein separation in SDS-PAGE.
➤ The Scientist's Toolkit: Essential Reagents for SDS-PAGE
| Reagent | Function |
|---|---|
| SDS (Sodium Dodecyl Sulfate) | An ionic detergent that denatures proteins, linearizes them, and confers a uniform negative charge, eliminating the influence of native protein charge [23] [10]. |
| Acrylamide/Bis-Acrylamide | The monomers that polymerize to form the porous gel matrix. The ratio and total concentration determine the gel's pore size [25] [10]. |
| APS & TEMED | Ammonium persulfate (APS) and TEMED are catalysts that initiate and accelerate the polymerization reaction of acrylamide to form the polyacrylamide gel [25] [10]. |
| Tris-Glycine Buffer | The standard running buffer (pH 8.3). Glycine's charge dynamics in the discontinuous pH system are crucial for the stacking effect in the stacking gel [23] [24]. |
| Laemmli Sample Buffer | Contains SDS for denaturation, glycerol to weigh down the sample, a reducing agent (e.g., BME) to break disulfide bonds, and a tracking dye [23]. |
| Molecular Weight Marker | A mixture of pre-stained or unstained proteins of known sizes, run alongside samples to extrapolate the molecular weight of unknown proteins [25]. |
Practical Guide: Selecting and Running the Perfect Gel for Your Target Protein
This technical support center is framed within the broader research thesis of optimizing polyacrylamide gel percentages for the accurate separation and analysis of proteins of different molecular weights. Selecting the correct gel percentage is a fundamental step in SDS-PAGE (Sodium Dodecyl Sulfate-Polyacrylamide Gel Electrophoresis), as it directly impacts resolution, band sharpness, and the success of downstream applications like western blotting.
Core Recommendations: Gel Percentage vs. Protein Size
The table below summarizes the recommended gel percentages for resolving proteins within specific molecular weight ranges. These recommendations are based on the principle that lower percentage gels (with larger pore sizes) are better for resolving high molecular weight proteins, while higher percentage gels (with smaller pore sizes) are optimal for low molecular weight proteins.
Table 1: Recommended Gel Percentage for Protein Separation
| Protein Size Range (kDa) | Recommended Gel Percentage (%) | Comments |
|---|---|---|
| > 500 kDa | 3 - 6 | Use for very large protein complexes; gels are fragile and require careful handling. |
| 100 - 500 kDa | 4 - 8 | Optimal range for large proteins; provides good resolution and band sharpness. |
| 50 - 200 kDa | 8 - 12 | Standard range for many high-molecular-weight proteins. |
| 30 - 100 kDa | 10 - 12 | A common range for a wide variety of proteins. |
| 10 - 200 kDa | 4 - 20 (Gradient) | Gradient gels provide a broad separation range and superior band sharpness. |
| 10 - 100 kDa | 12 - 15 | Standard range for many medium-sized proteins. |
| 5 - 50 kDa | 15 - 20 | Optimal for small proteins and peptides. |
| < 10 kDa | 16 - 20 (Tricine gels preferred) | Tricine-SDS-PAGE is more effective than Glycine-SDS-PAGE for very small peptides. |
Troubleshooting Guides & FAQs
Poor Resolution and Band Shape
Q: My protein bands are smeared or diffuse. What could be the cause? A: Band smearing can result from several factors:
- Incorrect Gel Percentage: The most common cause. A gel percentage that is too high will compress high-MW proteins, while a percentage that is too low will fail to resolve low-MW proteins. Refer to Table 1.
- Overloading: Too much protein loaded per well.
- Incomplete Polymerization: Uneven pore formation in the gel.
- Sample Degradation: Proteolysis of the protein sample.
Q: My protein of interest runs at the dye front. What should I do? A: This indicates the protein is too small for the gel's pore size.
- Solution: Increase the gel percentage (e.g., from 12% to 15% or 18%) to create a smaller pore matrix that can resolve smaller proteins. For very small peptides (<10 kDa), switch to a Tricine-based buffer system.
Q: My high molecular weight protein is trapped in the stacking gel or does not enter the resolving gel. A: The gel pores are too small for the large protein to migrate through.
- Solution: Decrease the gel percentage (e.g., from 10% to 6% or 8%) to create larger pores. Ensure the sample buffer contains a sufficient concentration of SDS and reducing agent to fully denature the protein.
Gel Polymerization and Handling Issues
Q: My gel polymerizes too quickly or too slowly. A: Polymerization time is controlled by catalysts Ammonium Persulfate (APS) and TEMED.
- Too Fast: Reduce the amount of TEMED and/or APS. The gel may polymerize unevenly.
- Too Slow: Ensure your APS solution is fresh (prepare fresh monthly and store at 4°C). Slightly increase the amount of TEMED and/or APS.
Q: There is a curvature ("smile effect") in my protein bands. A: This is often due to excessive heat generation during electrophoresis.
- Solution: Run the gel at a lower constant voltage or use a cooling apparatus. Ensure the electrophoresis buffer is properly mixed.
Experimental Protocol: Casting and Running a Discontinuous SDS-Polyacrylamide Gel
This protocol details the standard method for preparing a Tris-Glycine SDS-PAGE gel.
Materials:
- Acrylamide/Bis-acrylamide solution (29:1 or 30:0.8)
- Tris-HCl (1.5 M, pH 8.8 for Resolving Gel; 0.5 M, pH 6.8 for Stacking Gel)
- 10% (w/v) Sodium Dodecyl Sulfate (SDS)
- 10% (w/v) Ammonium Persulfate (APS) in water (freshly prepared)
- N,N,N',N'-Tetramethylethylenediamine (TEMED)
- Water-Saturated Butanol or Isopropanol
- Tris-Glycine-SDS Running Buffer (25 mM Tris, 192 mM Glycine, 0.1% SDS, pH ~8.3)
- Protein Molecular Weight Standard
- 2X Laemmli Sample Buffer (62.5 mM Tris-HCl pH 6.8, 2% SDS, 25% Glycerol, 0.01% Bromophenol Blue, 5% β-mercaptoethanol)
- Gel casting system and electrophoresis chamber
Methodology:
Assemble the Gel Casting Unit: Clean the glass plates and spacers, and assemble the cassette according to the manufacturer's instructions. Ensure it is leak-proof.
Prepare the Resolving Gel: In a beaker or conical flask, mix the components for the desired gel percentage (see table below for a 12% gel example). Add TEMED last, swirl gently to mix, and immediately pipette the solution into the gel cassette, leaving space for the stacking gel.
Table 2: Resolving Gel Formulation for a 12% Gel (10 mL volume)
Component Volume (mL) H₂O 3.3 1.5 M Tris (pH 8.8) 2.5 10% SDS 0.1 30% Acrylamide/Bis 4.0 10% APS 0.1 TEMED 0.004 Overlay and Polymerize: Carefully overlay the resolving gel solution with water-saturated butanol or water to create a flat, even interface. Allow the gel to polymerize completely (typically 20-30 minutes).
Prepare and Cast the Stacking Gel: Pour off the overlay. In a new tube, prepare the stacking gel solution (see table below). Add TEMED, mix, and pipette onto the polymerized resolving gel. Immediately insert a clean comb, avoiding bubbles.
Table 3: Stacking Gel Formulation for a 4% Gel (5 mL volume)
Component Volume (mL) H₂O 3.05 0.5 M Tris (pH 6.8) 1.25 10% SDS 0.05 30% Acrylamide/Bis 0.65 10% APS 0.05 TEMED 0.005 Sample Preparation: Mix your protein samples with an equal volume of 2X Laemmli Sample Buffer. Heat the samples at 95-100°C for 5-10 minutes to denature the proteins. Centrifuge briefly.
Electrophoresis: Once the stacking gel has polymerized, carefully remove the comb. Place the gel cassette into the electrophoresis chamber and fill the inner and outer chambers with running buffer. Load equal volumes of prepared samples and protein standards into the wells. Run the gel at a constant voltage (e.g., 80-120 V for a mini-gel) until the dye front reaches the bottom of the gel.
Visualizing the Gel Selection Logic
Title: Gel Percentage Selection Logic Flow
Experimental Workflow for SDS-PAGE
Title: SDS-PAGE Experimental Workflow
The Scientist's Toolkit: Essential Research Reagent Solutions
Table 4: Key Reagents for SDS-PAGE Experiments
| Reagent | Function |
|---|---|
| Acrylamide/Bis-acrylamide | Forms the cross-linked polyacrylamide matrix that acts as the molecular sieve for protein separation. |
| Tris-HCl Buffer | Provides the appropriate pH for gel polymerization and electrophoresis. |
| Sodium Dodecyl Sulfate (SDS) | An ionic detergent that denatures proteins and confers a uniform negative charge, allowing separation based primarily on size. |
| Ammonium Persulfate (APS) | A catalyst that, along with TEMED, initiates the free-radical polymerization of acrylamide. |
| TEMED | Stabilizes free radicals and accelerates the polymerization reaction initiated by APS. |
| Glycine | The trailing ion in the discontinuous buffer system that allows proteins to stack into sharp bands before entering the resolving gel. |
| β-mercaptoethanol (or DTT) | A reducing agent that breaks disulfide bonds in proteins, ensuring complete denaturation. |
| Coomassie Brilliant Blue (or Silver Stain) | Dyes used to visualize separated protein bands after electrophoresis. |
| Protein Molecular Weight Standard | A mixture of proteins of known sizes run alongside samples to estimate the molecular weight of unknown proteins. |
Sodium dodecyl sulfate-polyacrylamide gel electrophoresis (SDS-PAGE) is a foundational technique in biochemistry and molecular biology, widely used for separating proteins based on their molecular weight [4]. This technique plays an essential role in analyzing protein mixtures, determining protein size, and studying protein-protein interactions by denaturing proteins and providing reliable size estimation [4]. The method was refined in 1970 by Ulrich Laemmli, who incorporated SDS to allow proteins to be separated primarily based on molecular weight, significantly improving the resolution of protein bands [4]. For researchers focused on optimizing gel percentage for different protein sizes, understanding the intricacies of SDS-PAGE is crucial for obtaining clear, interpretable results. This technical support guide provides a comprehensive protocol and troubleshooting resource to address the specific challenges professionals encounter in protein separation experiments.
Principles of SDS-PAGE
SDS-PAGE separates proteins based primarily on their molecular weight through two key mechanisms. First, SDS (sodium dodecyl sulfate), an anionic detergent, denatures proteins by breaking non-covalent bonds and unfolding secondary and tertiary structures into linear molecules [4]. During this process, SDS binds uniformly to the protein backbone at a constant ratio of approximately 1.4 g SDS per 1.0 g protein, imparting a uniform negative charge that masks the protein's intrinsic charge [4]. This creates a consistent charge-to-mass ratio across all proteins in the sample.
Second, electrophoresis drives these negatively charged protein-SDS complexes through a porous polyacrylamide gel matrix under an electric field [4]. The polyacrylamide gel acts as a molecular sieve, with smaller proteins migrating faster and traveling further through the gel, while larger proteins encounter greater resistance and move more slowly [4]. This size-dependent separation allows researchers to estimate molecular weights by comparing protein migration distances to those of known molecular weight standards.
Step-by-Step SDS-PAGE Protocol
Sample Preparation
Proper sample preparation is critical for successful SDS-PAGE separation. Proteins must be denatured and linearized before electrophoresis.
Prepare Sample Buffer: Create a Laemmli buffer containing SDS (for denaturation and negative charge), a reducing agent (DTT or β-mercaptoethanol to break disulfide bonds), glycerol (to add density for gel loading), and a tracking dye (bromophenol blue to monitor migration) [26].
Mix Sample with Buffer: Combine your protein sample with an appropriate volume of sample buffer. Typical ratios range from 1:1 to 1:4 (sample:buffer), depending on protein concentration.
Denature Proteins: Heat the sample-buffer mixture at 95-100°C for 5-10 minutes to ensure complete denaturation and SDS binding [4]. For heat-sensitive proteins, incubate at 60°C to prevent aggregation [8].
Centrifuge: Briefly centrifuge samples to collect condensation and ensure all material is at the bottom of the tube before loading.
Gel Preparation and Selection
Polyacrylamide gels are formed by polymerizing acrylamide and bis-acrylamide, creating a cross-linked matrix with pores that separate proteins by size [25]. The pore size is determined by the total acrylamide concentration (%T) and the cross-linker concentration (%C) [25].
Table 1: Gel Percentage Selection Based on Protein Molecular Weight
| Protein Size (kDa) | Recommended Gel Percentage (%) |
|---|---|
| 4-40 | 20 |
| 12-45 | 15 |
| 10-70 | 12.5 |
| 15-100 | 10 |
| 25-200 | 8 |
| 30-300 | 10 |
| 50-500 | 7 |
| 100-600 | 4 |
Data compiled from [27] [25] [26]
For complex samples with proteins of widely varying molecular weights, gradient gels (e.g., 4-20% acrylamide) provide enhanced resolution across a broad size range [4].
Gel Casting Protocol [26]:
Prepare Resolving Gel: Mix components according to Table 2 in a clean container. Add TEMED last to initiate polymerization. Pour immediately into gel cassette, leaving space for stacking gel.
Overlay with Isopropanol: Carefully add a layer of isopropanol or water on top of the resolving gel to create a flat interface. Allow 30-45 minutes for complete polymerization.
Prepare Stacking Gel: After polymerization, pour off isopropanol and prepare stacking gel mixture. Pour over resolving gel and immediately insert comb.
Polymerize Stacking Gel: Allow stacking gel to polymerize for 20-30 minutes. Carefully remove comb and rinse wells with running buffer or water to remove unpolymerized acrylamide.
Table 2: SDS-PAGE Gel Formulation for 4 x 0.75-mm Thick Gels
| Component | Amount for X% Resolving Gel | Amount for Stacking Gel |
|---|---|---|
| Acrylamide, 30% | (0.5 × X) mL | 1.98 mL |
| Tris, 0.5 M, pH 6.8 | 0 mL | 3.78 mL |
| Tris, 1.5 M, pH 8.8 | 3.75 mL | 0 mL |
| SDS, 10% w/v | 150 µL | 150 µL |
| H₂O | (11.02 - (0.5 × X)) mL | 9 mL |
| TEMED | 7.5 µL | 15 µL |
| APS, 10% w/v | 75 µL | 75 µL |
| Total Volume | 15 mL | 15 mL |
Recipe adapted from [26]
Gel Electrophoresis
Assemble Gel Apparatus: Place polymerized gel into electrophoresis chamber according to manufacturer instructions.
Add Running Buffer: Fill inner and outer chambers with SDS-PAGE running buffer (typically Tris-Glycine with 0.1% SDS) [25].
Load Samples and Markers: Using gel loading tips or a micro-syringe, load 15-40 µg total protein per mini-gel well [25]. Include appropriate molecular weight markers in at least one well. Load around 80% of well capacity to avoid bubble formation and spillage into adjacent wells [25].
Run Electrophoresis: Connect to power supply and run at constant voltage. Standard practice is running at 100-150 volts for 40-60 minutes, or until the dye front reaches the bottom of the gel [4] [28]. For better resolution, use lower voltage for longer run times.
Stop Electrophoresis: When the dye front reaches the bottom of the gel, turn off power. Do not store the gel but proceed immediately to downstream applications like staining or Western blotting [25].
SDS-PAGE Workflow: This diagram illustrates the sequential steps in the SDS-PAGE protocol, from sample preparation through final analysis.
Troubleshooting Common SDS-PAGE Issues
Gel Running and Separation Problems
Q1: Why are my protein bands smeared or poorly resolved?
- Possible Cause: Running gel at too high voltage [28] [8].
Solution: Reduce voltage by 25-50% and increase run time. Standard practice is 100-150V for 40-60 minutes [28] [8].
Possible Cause: Protein concentration too high or sample volume too large [8].
Solution: Reduce amount of protein loaded or increase protein concentration in sample. For mini-gels, load 15-40 µg total protein per well [25].
Possible Cause: Incorrect gel percentage for target protein size [8].
- Solution: Refer to Table 1 and select appropriate gel percentage based on protein molecular weight.
Q2: Why do I have "smiling" or "frowning" bands (curved bands)?
- Possible Cause: Uneven heat distribution during electrophoresis, causing the center of the gel to run hotter than the edges [28] [8].
- Solution: Run gel at lower voltage for longer time, use a cooled apparatus, or place ice packs in the gel-running apparatus [28].
Q3: Why are the bands in the periphery of my gel distorted?
- Possible Cause: Edge effect from empty wells [28].
- Solution: Do not leave wells empty. Load molecular weight markers or any available protein sample in unused wells to maintain consistent current flow across the gel [28].
Q4: Why is my protein sample migrating out of the wells before running the gel?
- Possible Cause: Delay between sample loading and starting electrophoresis [28].
- Solution: Start electrophoresis immediately after loading all samples. Minimize time between loading first sample and applying power [28].
Gel Polymerization and Casting Issues
Q5: Why is my gel taking too long to polymerize or not polymerizing at all?
- Possible Cause: Old or improperly prepared ammonium persulfate (APS) or TEMED [8].
Solution: Prepare fresh 10% APS solution and use fresh TEMED. Increase amounts of APS and TEMED if necessary [8].
Possible Cause: Temperature too low [8].
- Solution: Cast gels at room temperature to ensure proper polymerization.
Q6: Why are my sample wells crooked or poorly formed?
- Possible Cause: Comb removed before stacking gel fully polymerized [8].
Solution: Allow stacking gel to polymerize for 30 minutes before removing comb [8].
Possible Cause: Air bubbles or debris during gel casting.
- Solution: Ensure gel mixture is well-mixed and degassed before pouring. Tap gel cassette to remove air bubbles before inserting comb.
Protein Staining Issues
Q7: Why are my protein bands faint or weak after Coomassie staining?
- Possible Cause: Insufficient protein loaded [8] [29].
Solution: Increase protein amount loaded per well. For Coomassie staining, higher protein concentrations are typically needed compared to silver staining or Western blotting [29].
Possible Cause: Proteins have run off the gel [8].
Solution: Use a higher percentage acrylamide gel or reduce run time to prevent small proteins from exiting the gel [8].
Possible Cause: SDS interference [30].
- Solution: Wash gel extensively with water or 50% methanol/10% acetic acid before staining to remove residual SDS [30] [29].
Q8: Why is there high background staining with Coomassie blue?
- Possible Cause: Insufficient destaining or presence of residual SDS and salt [29].
- Solution: Implement additional washing steps before staining and increase destaining time with multiple changes of destaining solution (25% methanol/10% acetic acid) [30] [29].
The Scientist's Toolkit: Essential Research Reagents
Table 3: Essential Reagents for SDS-PAGE Experiments
| Reagent | Function | Key Considerations |
|---|---|---|
| Acrylamide/Bis-acrylamide | Forms the cross-linked polyacrylamide gel matrix that separates proteins by size | Typically used as 30% w/w solution at 37.5:1 ratio; neurotoxin - always wear gloves [25] [26] |
| SDS (Sodium Dodecyl Sulfate) | Denatures proteins and provides uniform negative charge | Critical for masking intrinsic protein charge; ensures separation by molecular weight only [4] |
| TEMED | Initiates gel polymerization | Works with ammonium persulfate to catalyze acrylamide polymerization; use fresh for optimal results [26] [8] |
| Ammonium Persulfate (APS) | Free radical source for gel polymerization | Prepare fresh 10% solution for consistent polymerization [26] |
| Tris Buffers | Maintain pH during electrophoresis | Resolving gel uses Tris pH 8.8; stacking gel uses Tris pH 6.8 [26] |
| Molecular Weight Markers | Reference for estimating protein size | Prestained markers allow tracking during electrophoresis; unstained markers provide higher accuracy [25] |
| Coomassie Brilliant Blue | Protein stain for visualization | R-250 for standard staining; G-250 for colloidal staining; sensitivity ~5-30 ng depending on protein [29] |
Optimization for Different Protein Sizes
Selecting the appropriate gel percentage is crucial for effective separation of target proteins. The principle is straightforward: higher acrylamide concentrations create smaller pore sizes, ideal for separating smaller proteins, while lower concentrations suit larger proteins [4]. For proteins of unknown size or complex mixtures with broad molecular weight ranges, gradient gels (e.g., 4-20% acrylamide) provide superior resolution across multiple size classes in a single gel [4] [25].
When precise molecular weight determination is needed, ensure you include appropriate molecular weight markers that bracket your protein of interest. Note that the apparent molecular weight of markers can shift slightly depending on the running buffer and pH conditions used [25]. For the most accurate size estimation, run standards and samples on the same gel under identical conditions.
For specialized applications like western blotting, transfer efficiency must also be considered when selecting gel percentage. Higher percentage gels may require longer transfer times, particularly for larger proteins. Balancing separation resolution with downstream application requirements is key to successful experimental design.
Advanced Techniques and Alternatives
For complex protein samples, two-dimensional electrophoresis (2-DE) provides superior separation by first resolving proteins based on isoelectric point (pI) and then by molecular weight using SDS-PAGE [4]. This technique enables the visualization of thousands of proteins in a single gel, aiding in the analysis of post-translational modifications and protein isoforms [4].
When protein native structure must be preserved, Native PAGE electrophoresis without SDS can be used, separating proteins based on both size and charge [4]. This technique is valuable for studying protein complexes, oligomeric states, and enzymatic activity.
Recent advancements in SDS-PAGE have focused on reducing runtime while maintaining resolution through optimized buffer compositions and increased applied voltage [4]. These modifications make the technique more efficient while maintaining its fundamental separation principles, ensuring its continued relevance in biochemical research.
Utilizing Gradient Gels for Broad-Range Separation of Complex Protein Mixtures
What are gradient gels and why use them?
Answer: Gradient gels are polyacrylamide gels formulated with a continuous range of acrylamide concentrations, typically from a low percentage at the top to a high percentage at the bottom [31]. Unlike fixed-concentration gels, this gradient creates a pore structure with increasingly smaller sizes, allowing a single gel to resolve a much broader range of protein molecular weights than a fixed-concentration gel [31] [25]. The key advantages include:
- Broad-Range Separation: You can resolve proteins from very small to very large sizes on a single gel, which is especially useful when your sample is limited and you cannot run multiple gels at different percentages [31].
- Sharper Bands: As proteins migrate, the leading edge of a band encounters smaller pores and slows down, while the trailing edge continues moving faster. This "piles up" the protein into a sharper, more defined band [31].
- Improved Resolution of Similar-Sized Proteins: The sharpening effect helps put more distance between proteins of very similar molecular weights, making it easier to distinguish them, which is crucial for publicatio n-quality data [31].
How does a gradient gel resolve proteins of different sizes?
Answer: The separation relies on the molecular sieving effect of the polyacrylamide matrix. The low-concentration region, with larger pores, allows high molecular weight proteins to migrate and separate effectively. The high-concentration region, with smaller pores, provides the resolving power for low molecular weight proteins [31]. A protein will migrate until it reaches a gel pore size that is too small for it to pass through easily, at which point its migration slows dramatically. This results in all proteins of a given size "stacking" at a specific point in the gradient, leading to sharper bands.
Experimental Protocols & Methodologies
How do I choose the right gradient?
Answer: Selecting the appropriate gradient depends on the molecular weights of the proteins you are targeting. The table below provides a guideline based on common experimental needs [31].
Table 1: Selecting a Gradient Gel Based on Protein Size Range
| Range of Protein Sizes | Low / High Acrylamide Percentages | Typical Application |
|---|---|---|
| 4 – 250 kDa | 4% / 20% | Discovery work; analyzing an unknown sample. |
| 10 – 100 kDa | 8% / 15% | Targeted analysis of a broad, but defined, range. |
| 50 – 75 kDa | 10% / 12.5% | Optimizing resolution for similarly sized proteins. |
For context, the table below shows the protein size ranges resolved by common fixed-percentage gels, illustrating why multiple fixed gels would be needed without a gradient [31] [25].
Table 2: Protein Size Resolution by Fixed-Percentage Gels
| Protein Size (kDa) | Gel Acrylamide (%) |
|---|---|
| 4–40 | 20 |
| 12–45 | 15 |
| 10–70 | 12.5 |
| 15–100 | 10 |
| 25–200 | 8 |
Protocol: Preparing a Gradient Gel
Answer: You can either purchase pre-cast gradient gels or prepare them in the laboratory. Hand-casting requires practice but is more cost-effective and produces less waste [31].
Method 1: Using a Gradient Maker This method uses a two-chambered gradient mixer [31].
- Prepare Solutions: In separate containers, prepare the low-percentage and high-percentage acrylamide solutions. Do not add the polymerization initiators (Ammonium Persulfate (APS) and TEMED) until you are ready to pour.
- Setup: Place the low-concentration solution in the "reservoir" chamber (the one connected to the outlet) and the high-concentration solution in the "mixing" chamber. Ensure the connecting valve is closed.
- Initiate Polymerization: Add APS and TEMED to both solutions and stir the high-concentration solution.
- Pour: Open the connecting valve and the outlet stopcock simultaneously. Use a pump or gravity flow to draw the solution from the low-concentration chamber through the high-concentration chamber and into the gel casting plates. The gradient forms as the high-concentration solution is continuously diluted with the low-concentration solution.
Method 2: Pipette Mixing with an Air Bubble (Quick Hack) This is a faster, simplified method for creating a gradient [31].
- Prepare Solutions: Prepare your low and high concentration acrylamide solutions in separate conical tubes, this time including TEMED and APS.
- Aspirate: Using a 5 or 10-mL serological pipette, draw up half of the total volume needed from the low-concentration tube, then the other half from the high-concentration tube. The solutions will be layered in the pipette.
- Mix: Gently aspirate a small air bubble (~0.5 mL) into the pipette. As the air bubble travels up the pipette, it mixes the two acrylamide solutions, creating a gradient.
- Cast: Slowly pipette the mixed gradient solution into the gel cast.
The following diagram illustrates the workflow for the two methods of preparing a gradient gel.
Troubleshooting Guide
FAQ: My high molecular weight proteins are not resolving well. What should I do?
Answer: Poor resolution of high molecular weight (HMW) proteins (>150 kDa) is a common challenge.
- Problem: Using a standard 4-20% Tris-glycine gradient gel can compact HMW proteins into a very narrow region at the top, leading to poor resolution and inefficient transfer for western blotting [32].
- Solution:
- Use a Specialized Gel: For HMW proteins, switch to a low-percentage Tris-acetate gel (e.g., 3-8%). The Tris-acetate buffer system and gel matrix are designed with a more open structure, allowing HMW proteins to migrate further and achieve better separation [32].
- Optimize Transfer Conditions: If performing a western blot, increase the transfer time. For rapid dry transfer systems, increase the time from the standard 7 minutes to 8-10 minutes to ensure large proteins move completely out of the gel and onto the membrane [32].
- Gel Equilibration: When not using a Tris-acetate gel, a pre-transfer equilibration step in 20% ethanol for 5-10 minutes can improve HMW protein transfer efficiency by removing buffer salts and shrinking the gel to its final size [32].
FAQ: I am seeing smeared bands across my gel. How can I fix this?
Answer: Band smearing can result from several issues in sample preparation and gel running conditions.
- Cause 1: Incomplete Denaturation. If proteins are not fully unfolded, they may not bind SDS uniformly and will not separate cleanly by size [33] [34].
- Cause 2: Overloaded Protein. Loading too much protein can overwhelm the gel's capacity, causing bands to smear [34].
- Cause 3: Running Voltage Too High. Excessive voltage generates heat, which can cause uneven migration and smearing [35].
- Fix: Run the gel at a lower voltage. If "smiling" bands (curved bands upward at the edges) appear along with smearing, it is a classic sign of overheating. Run the gel in a cold room or with ice packs to dissipate heat [35].
FAQ: My protein bands are fuzzy and not sharp. What is the cause?
Answer: Fuzzy or poorly resolved bands are often a consequence of the issues above, but can also be specific to the gel itself.
- Cause: Using a fixed-concentration gel for a mixture of proteins with a wide size range. A fixed percentage gel is optimized for a narrow size range [31].
- Fix: Switch to a gradient gel. As explained previously, the gradient naturally sharpens bands as they migrate [31]. Also, ensure you are using the correct buffer system; for instance, MOPS buffer can provide greater resolution between bands compared to MES [31].
The Scientist's Toolkit: Essential Reagents & Materials
Table 3: Key Research Reagent Solutions for Gradient Gel Electrophoresis
| Reagent / Material | Function | Key Considerations |
|---|---|---|
| Acrylamide/Bis-acrylamide | Forms the porous polyacrylamide gel matrix. | Potent neurotoxin; always wear gloves. The ratio of bis-acrylamide (cross-linker) affects pore size [25]. |
| Ammonium Persulfate (APS) | Chemical initiator for acrylamide polymerization. | Freshly prepared solutions are recommended for consistent gel polymerization [25]. |
| TEMED | Catalyst that accelerates the polymerization reaction initiated by APS. | |
| SDS (Sodium Dodecyl Sulfate) | Denaturing detergent that binds to and linearizes proteins, imparting a uniform negative charge. | Allows separation based primarily on molecular weight rather than native charge or shape [33] [25]. |
| Reducing Agents (DTT, β-mercaptoethanol) | Breaks disulfide bonds within and between protein subunits. | Essential for complete denaturation and accurate molecular weight determination [36] [34]. Omit for "non-reducing" PAGE. |
| Tris-based Running Buffers | Conducts current and maintains stable pH during electrophoresis. | Choice of buffer (e.g., Tris-glycine, Tris-acetate, MOPS, MES) affects resolution and protein mobility [31] [32]. |
| Molecular Weight Markers | Standards of known size used to estimate the molecular weight of unknown proteins. | Can be prestained (for real-time monitoring) or unstained (for higher accuracy). Apparent size can shift with different buffer systems [25]. |
| Protein Stains (Coomassie, SYPRO Ruby, Silver stain) | Visualize separated protein bands on the gel. | Vary in sensitivity, cost, and compatibility with downstream mass spectrometry analysis [37]. |
Advanced Applications & Integration with Downstream Analyses
How are gradient gels used in western blotting and proteomics?
Answer: Gradient gels, particularly 4-20% Tris-glycine gels, are a popular starting point for western blotting because they allow researchers to screen for multiple proteins of different sizes from the same sample load [32] [34]. For proteomic studies, gel-based separation via 1-D SDS-PAGE (often using gradient gels) followed by in-gel digestion of sliced gel bands and LC-MS/MS analysis (GeLC-MS/MS) is a common and powerful fractionation strategy to reduce sample complexity and increase profiling sensitivity for mass spectrometry [37].
Proper protein sample preparation is a critical foundation for successful western blotting and electrophoretic analysis. Within the broader context of optimizing gel percentages for different protein sizes, consistent and complete protein denaturation is non-negotiable. This process, primarily governed by the use of reducing agents and the application of precise heating, ensures that proteins are linearized and uniformly negatively charged, allowing their migration in the gel to correlate accurately with their molecular weight. This guide addresses frequently asked questions and troubleshooting scenarios to help researchers navigate the nuances of this fundamental step.
Frequently Asked Questions (FAQs)
1. Why is a reducing agent necessary in the sample buffer?
Protein structures are stabilized by disulfide bonds, which are covalent linkages between cysteine residues. Heat alone, even above 100°C, cannot break these bonds [38]. Reducing agents, such as Dithiothreitol (DTT) or β-mercaptoethanol, are added to the loading buffer to break these disulfide bonds, both within and between polypeptide chains [38] [39]. This action ensures the protein is fully denatured into a linear primary structure, which is essential for precise separation by molecular weight during SDS-PAGE.
2. Do I always need to heat my samples at 100°C?
No, the optimal temperature depends on the nature of your target protein. While 100°C is standard for many soluble proteins, it can be detrimental to others. Membrane proteins, due to their hydrophobic nature, tend to aggregate and form large complexes when boiled at high temperatures, which can prevent them from entering the gel [38]. For such proteins, a lower denaturation temperature is often recommended.
The table below summarizes the guidelines for different protein types:
Table: Recommended Sample Denaturation Temperatures
| Protein Type | Recommended Temperature | Rationale |
|---|---|---|
| Ordinary Soluble Proteins | 95–100°C for 5 minutes | Ensures complete denaturation and linearization [39]. |
| Membrane Proteins | Often 70°C or lower; sometimes as low as 30°C | Prevents aggregation and precipitation of hydrophobic proteins [38]. |
| General Guideline | 70°C for 10 minutes | A safer starting point to avoid proteolysis and protein aggregation; recommended by some protocols [40]. |
3. My protein sample was extracted with a denaturing lysis buffer. Do I still need to heat it with loading buffer?
Yes. While denaturing lysates (e.g., RIPA buffer) disrupt the higher-order structure of proteins during extraction, this denaturation may be incomplete [38]. Heating the sample in an SDS-containing loading buffer guarantees that all proteins are fully linearized. Furthermore, the loading buffer contains glycerol to make the sample dense enough to sink into the gel wells, and a tracking dye to monitor electrophoresis progress [38] [39].
4. Do I need to re-boil a frozen protein sample that was already heated once?
It depends on the storage time. For "fresh" samples that have been frozen for only a week or two, re-boiling is typically unnecessary because the reducing agent is still active and the proteins remain denatured [38]. However, after prolonged storage, the reducing agent can be consumed, allowing new disulfide bonds to form and potentially causing precipitation. In this case, it is necessary to re-denature the sample at the original temperature and add fresh reducing agent [38].
Troubleshooting Guide
Table: Common Problems and Solutions Related to Denaturation
| Problem | Possible Cause | Solution |
|---|---|---|
| Weak or No Signal | Sample degradation due to overheating during preparation. | Avoid boiling; instead, heat samples at 70°C for 10 minutes to prevent proteolysis [41] [40]. |
| Protein Aggregation | Boiling of membrane or other heat-sensitive proteins. | Titrate the denaturation temperature (30°C, 37°C, 50°C, 70°C) to find the optimal condition that prevents aggregation [38]. |
| Multiple Bands or Smearing | Incomplete denaturation or disulfide bond reformation. | Ensure the sample buffer contains a fresh reducing agent (DTT or β-mercaptoethanol) and that the heating step was performed correctly [42]. |
| High Background | Excessive reducing agent in the sample buffer. | Ensure the final concentration of DTT is less than 50 mM and β-mercaptoethanol is less than 2.5% [41]. |
Research Reagent Solutions
Table: Essential Reagents for Protein Denaturation
| Reagent | Function | Example |
|---|---|---|
| Reducing Agent | Breaks disulfide bonds within and between proteins for complete linearization. | Dithiothreitol (DTT), β-Mercaptoethanol, Tris(2-carboxyethyl)phosphine (TCEP) [38] [41]. |
| SDS Sample Buffer | Denatures proteins and provides negative charge for electrophoretic migration. | Laemmli buffer (contains SDS, glycerol, Tris-HCl, and tracking dye) [39] [40]. |
| Protease Inhibitors | Prevents protein degradation by endogenous proteases during sample preparation. | PMSF, Protease Inhibitor Cocktail Tablets [40] [43]. |
| Lysis Buffer | Extracts proteins from cells or tissues; can be denaturing or non-denaturing. | RIPA Buffer (for total/membrane proteins), NP-40 Buffer (for cytoplasmic proteins) [40]. |
Experimental Workflow and Decision Pathway
The following diagrams illustrate the standard workflow for sample preparation and the key decision points for applying heat.
Sample Preparation Workflow
Heating Condition Decision Pathway
Choosing and Using Molecular Weight Markers for Accurate Size Estimation
FAQs on Molecular Weight Markers
Q1: Why is my molecular weight marker not showing any bands? If you see no bands, it could be because the marker was heated or improperly stored. Molecular weight markers should not be heated, as this can degrade the proteins. Always refer to the manufacturer's datasheet for specific handling and dilution instructions. Prepare aliquots to avoid repeated freeze-thaw cycles and store them as recommended [44].
Q2: The bands in my marker look smeared and lack resolution. What went wrong? Smeared bands can result from several issues related to gel electrophoresis conditions. Using an inappropriate gel percentage for your protein's size range is a common cause. Excess salt or detergent in your samples can also cause band distortion and smearing. Ensure the salt concentration in your sample does not exceed 100 mM and that the ratio of SDS to non-ionic detergents is at least 10:1 [45].
Q3: How do I choose the right type of molecular weight marker for my detection method? Your choice of marker depends on your detection system. Using a marker designed for chemiluminescence in a fluorescence-based system, or vice versa, will yield no signal. The table below summarizes the compatible detection methods for various types of markers [44].
| Marker Type | Visible by Eye | Chemiluminescence | 700 nm Channel (Fluorescence) | 800 nm Channel (Fluorescence) |
|---|---|---|---|---|
| One-Color Near-Infrared | ||||
| Chameleon 700 Pre-Stained | ||||
| Chameleon 800 Pre-Stained | ||||
| Chameleon Duo Pre-Stained | ||||
| WesternSure Pre-Stained Chemiluminescent |
Q4: My protein of interest is at 180 kDa. Why did it transfer poorly? Large proteins (>200 kDa) require lower percentage gels (4-6% acrylamide) for sufficient resolution and efficient transfer. Using a standard 12% gel can hinder the migration and transfer of large proteins. For a 180 kDa protein, an 8% gel is recommended. Additionally, you can add 0.01–0.05% SDS to your transfer buffer to help pull large proteins out of the gel and onto the membrane [45] [46].
Troubleshooting Common Problems
Problem: Weak or No Signal from the Marker
- Possible Cause: Incompatible detection method.
- Solution: Confirm that your marker is designed for your specific imaging system (e.g., chemiluminescence, fluorescence at 700 nm or 800 nm) [44].
Problem: Bands are Uneven or Distorted
- Possible Cause: The marker is contaminated or degraded.
- Solution: Avoid using expired markers. Ensure the marker has not been exposed to multiple freeze-thaw cycles by preparing single-use aliquots. Always use fresh, high-quality running buffers [47] [45].
Problem: Inaccurate Size Estimation
- Possible Cause: The gel percentage is not optimal for your target protein size.
- Solution: Match the gel percentage to the molecular weight range of your protein. The table below provides general guidance [46].
| Protein Size Range | Recommended Gel Percentage |
|---|---|
| 4 - 40 kDa | Up to 20% |
| 12 - 45 kDa | 15% |
| 10 - 70 kDa | 12.5% |
| 15 - 100 kDa | 10% |
| 50 - 200 kDa | 8% |
| > 200 kDa | 4 - 6% |
Experimental Protocol: SDS-PAGE with Molecular Weight Markers
This protocol outlines the key steps for running an SDS-PAGE gel with a molecular weight marker to achieve accurate size estimation of your proteins.
Materials Needed:
- Pre-cast or self-cast polyacrylamide gel of appropriate percentage [46]
- Protein samples prepared in SDS-PAGE sample buffer
- Molecular weight marker (e.g., Odyssey One-Color, Chameleon Duo, WesternSure) [44]
- 1X Running Buffer (25 mM Tris base, 192 mM glycine, 0.1% SDS, pH 8.3) [46]
- Electrophoresis apparatus and power supply
Procedure:
- Prepare the Gel and Apparatus: Secure a polyacrylamide gel in the electrophoresis chamber. Fill the inner and outer chambers with 1X running buffer [46].
- Prepare Samples and Marker: Dilute your protein samples in SDS-PAGE sample buffer. Do not heat your molecular weight marker unless specified by the manufacturer. Prepare the marker according to its datasheet, diluting it to the same volume as your sample wells [44].
- Load the Gel: Using a clean microsyringe, load equal amounts of protein (10-50 µg for cell lysate) into the wells. In one well, load the prepared molecular weight marker [46].
- Run the Gel: Connect the apparatus to a power supply with the cathode (negative, black) at the top and the anode (positive, red) at the bottom. Run the gel at a constant voltage of 100-150 V until the dye front has migrated to the bottom of the gel (typically 1-2 hours) [46].
- Proceed to Detection: Following electrophoresis, proceed to the appropriate downstream application, such as western blotting or direct staining, using a detection method compatible with your chosen marker [44].
The Scientist's Toolkit: Research Reagent Solutions
| Item | Function |
|---|---|
| Pre-Stained Protein Ladder | Provides visual confirmation of electrophoresis progress and allows for monitoring of transfer efficiency during western blotting [44]. |
| Unstained Protein Standard | Used for precise molecular weight estimation after protein staining (e.g., Coomassie). Not suitable for direct visualization during gel runs [44]. |
| Fluorescent Protein Ladder | Essential for near-infrared (NIR) fluorescence detection systems. Enables multiplexing and can be used for direct molecular weight determination on the blot without additional steps [44]. |
| Chemiluminescent Protein Ladder | Contains conjugated enzymes (e.g., HRP) that react with chemiluminescent substrates, allowing it to be detected alongside your target proteins on film or with a digital imager [44]. |
| SDS-PAGE Running Buffer | (25 mM Tris base, 192 mM glycine, 0.1% SDS) Conducts current and maintains the pH environment necessary for the separation of proteins by size during electrophoresis [46]. |
Beyond the Basics: Advanced Troubleshooting and Optimization Strategies
Troubleshooting FAQs
This guide addresses common SDS-PAGE issues to help you obtain publication-quality results, framed within the critical context of optimizing gel percentage for your specific protein targets.
Why do my protein bands curve into a "smiling" shape, and how can I fix this?
- Cause: The "smiling" effect, where bands curve upwards at the edges, is primarily caused by excessive heat generated during electrophoresis [48].
- Solution:
What causes smeared bands across my gel, and how can I achieve sharp bands?
- Cause: Smeared bands can result from several factors, including running the gel at too high a voltage, insufficient sample preparation, or protein aggregation [48] [49].
- Solution:
- Optimize voltage: Run the gel at 10-15 Volts/cm gel length instead of high voltage [48].
- Ensure complete protein denaturation: Add reducing agents like DTT or Beta-mercaptoethanol (BME) to your lysis solution to break protein aggregates [49].
- Improve protein solubility: For hydrophobic proteins, consider adding 4-8M urea to the lysate [49].
- Remove debris: Centrifuge samples before loading to pellet insoluble material [50].
Why are my protein bands poorly resolved or blurry?
- Cause: Poor resolution, where bands appear blurry or fail to separate, is often due to incorrect gel concentration, short run time, or issues with the running buffer [48].
- Solution:
- Use the correct gel percentage: Ensure the acrylamide percentage of your resolving gel is appropriate for the molecular weight of your target protein (see Table 1 for guidance) [51] [48] [26].
- Increase run time: Run the gel longer for better separation, especially for high molecular weight proteins. A common indicator is to run the gel until the dye front is near the bottom [48].
- Check running buffer: Remake the running buffer if band resolution is poor, as improper ion concentration can disrupt current flow and pH [48].
Why do the bands in the outer lanes of my gel appear distorted?
- Cause: This "edge effect" is often due to empty wells on the periphery of the gel [48].
- Solution:
- Avoid empty wells. Load all wells with experimental samples, protein ladder, or a control protein. If you have unused wells, load them with Laemmli buffer [48].
My samples migrated out of the wells before I started the gel run. What happened?
- Cause: The samples diffused out of the wells during the lag time between loading and applying the electric current [48].
- Solution:
- Minimize the delay. Start electrophoresis immediately after loading the last sample. For large gels with many wells, try to load samples quickly or run fewer samples at once [48].
- Check the loading buffer. Ensure it contains a sufficient concentration of glycerol (or sucrose) to increase sample density, helping it sink and remain in the well [49] [52].
Optimizing Gel Percentage for Protein Separation
Selecting the correct polyacrylamide percentage is fundamental to resolving proteins of different sizes. The table below provides a guideline for choosing the optimal gel composition based on your protein's molecular weight.
Table 1: Optimal SDS-PAGE Gel Percentage for Resolving Proteins by Molecular Weight [51] [26]
| Size of Protein (kDa) | % Acrylamide in Resolving Gel |
|---|---|
| 4 - 40 | 20% |
| 12 - 45 | 15% |
| 10 - 70 | 12.5% |
| 15 - 100 | 10% |
| 25 - 200 | 8% |
| >200 | 4-6% |
For proteins with a wide range of molecular weights or when probing for multiple targets of different sizes, gradient gels (where acrylamide concentration increases from top to bottom) are recommended for optimal separation across sizes [51].
Experimental Workflow for SDS-PAGE Troubleshooting
The following diagram outlines a logical workflow for diagnosing and resolving the common SDS-PAGE issues discussed in this guide.
Research Reagent Solutions
This table details key reagents used in SDS-PAGE and their critical functions in ensuring a successful experiment.
Table 2: Key Reagents for SDS-PAGE and Their Functions
| Reagent | Function |
|---|---|
| SDS (Sodium Dodecyl Sulfate) | Denatures proteins and confers a uniform negative charge, allowing separation by size rather than native charge [52]. |
| Acrylamide/Bis-acrylamide | Forms a cross-linked polyacrylamide gel matrix with pores that separate proteins based on size [52]. |
| Tris Buffer | Maintains stable pH during gel polymerization and electrophoresis [52]. |
| Glycine | A key component of the running buffer; its charge state changes with pH, enabling the stacking effect in discontinuous buffer systems [52]. |
| TEMED & Ammonium Persulfate (APS) | Catalyzes the polymerization reaction of acrylamide to form the gel [26] [52]. |
| Glycerol | Added to sample buffer to increase density, ensuring samples sink to the bottom of the wells [49] [52]. |
| Bromophenol Blue | A tracking dye that allows visual monitoring of protein migration during electrophoresis [52]. |
| Beta-Mercaptoethanol (BME) or DTT | Reducing agents that break disulfide bonds in proteins, aiding complete denaturation [49] [52]. |
Frequently Asked Questions (FAQs)
Q1: How do I choose the correct gel percentage for my protein sample? The gel percentage determines the pore size of the polyacrylamide matrix, which directly impacts the resolution of proteins based on their molecular weight [4]. The key is to match the gel pore size to the size of your target proteins [4] [53].
- Low-percentage gels (e.g., 8%) have larger pores and are better for separating high molecular weight proteins.
- High-percentage gels (e.g., 15%) have smaller pores and are ideal for resolving low molecular weight proteins. For a mixture of proteins with a wide mass range, a gradient gel (e.g., 4-20%) provides a continuous range of pore sizes for optimal separation across the entire gel [4].
Q2: What are the best practices for setting voltage and run time to prevent band smearing? Band smearing can result from overheating or running the gel for an incorrect duration [53]. A two-step voltage approach is often recommended [54]:
- Start with a low voltage (e.g., 80V) as the samples move through the stacking gel. This allows proteins to concentrate into sharp bands before entering the separating gel.
- Increase the voltage (e.g., to 120V) once the samples have entered the separating gel to complete the run efficiently. Running the gel at too high a voltage can generate excessive heat, leading to distorted bands and poor separation [53]. The run is typically complete when the dye front (e.g., bromophenol blue) reaches the bottom of the gel. A standard 10-12% gel usually runs for about 80-90 minutes [54].
Q3: Can I reuse electrophoresis buffer, and how does buffer quality affect results? Electrophoresis buffer can typically be reused 1-2 times [54]. However, for optimal and reproducible results, it is best to use freshly prepared buffer. Old or improperly prepared buffers can have altered pH and ionic strength, which can lead to poor band resolution and distorted migration patterns [53]. Always prepare fresh 10x stock and dilute it to 1x just before use [54].
Q4: My protein bands are curved ("smiling" or "frowning"). What causes this? Uneven band curvature is often a sign of uneven heat distribution across the gel [4]. This can be caused by:
- Irregular current distribution.
- Inadequate buffer levels, preventing efficient heat dissipation.
- An improperly seated gel apparatus. Ensure the gel tank is properly assembled, the buffer fully submerges the gel, and the apparatus is placed on a level surface. Running the gel at a slightly lower voltage can also help mitigate overheating [4].
Troubleshooting Guide
The table below outlines common electrophoresis issues, their potential causes, and recommended solutions.
| Problem | Possible Causes | Recommended Solutions |
|---|---|---|
| Smiling or frowning bands [4] | Uneven heat distribution; Improper current; Overloading sample | Ensure even buffer distribution; Avoid well overloading; Use lower voltage for cooling [4] |
| Smearing bands [53] | Well overloading; Running gel too fast; Protein degradation; Old buffer | Reduce protein load volume; Lower running voltage; Check sample integrity; Use fresh buffer [53] |
| Incomplete protein separation [4] | Insufficient run time; Incorrect gel percentage; Poor buffer condition | Allow sufficient run time; Adjust acrylamide % for protein size; Use fresh buffer [4] |
| No bands visible [53] | Protein/DNA degradation; Incorrect staining/detection; Faulty sample prep | Check biomolecule integrity; Verify staining protocol; Ensure correct sample prep [53] |
| Gel polymerization issues [4] | Old or contaminated reagents; Incorrect reagent ratios; Improper handling | Use fresh acrylamide, APS, TEMED; Ensure accurate measurements; Handle gel cassette with care [4] |
Experimental Protocols for Optimization
Protocol 1: Optimizing Voltage and Run Time for Clarity This protocol is designed to systematically determine the ideal voltage and run time for your specific SDS-PAGE setup to achieve sharp, well-resolved bands.
- Gel Preparation: Cast a standard SDS-polyacrylamide gel (e.g., 12% separating gel) suitable for your protein size range [4] [53].
- Sample Loading: Load identical protein samples and a molecular weight marker into multiple wells.
- Electrophoresis Run:
- Place the gel cassette in the tank filled with fresh 1x SDS-running buffer.
- Phase 1 (Stacking): Run the gel at a constant 80V until the dye front has completely entered the separating gel.
- Phase 2 (Separation): Increase the voltage to a constant 120V. Continue running until the dye front is approximately 0.5-1 cm from the bottom of the gel [54].
- Analysis: After staining, assess band sharpness and resolution. If bands are smeared, repeat the run at a lower voltage (e.g., 100V during the separation phase) for a longer duration. If separation is poor and run time is too long, consider a slightly higher voltage, ensuring the gel does not overheat.
Protocol 2: Evaluating Buffer Reuse on Resolution This protocol tests the impact of buffer reuse on separation quality.
- Buffer Preparation: Prepare a fresh batch of 1x electrophoresis buffer.
- Initial Run: Use the fresh buffer to run a control gel with your standard protein sample. Document the results.
- Reuse and Test: Use the same buffer for a second, identical electrophoresis run. After each run, compare the band clarity, sharpness, and migration distance of the molecular weight marker to the initial run.
- Criteria for Discard: Discard the buffer if you observe any band distortion, smearing, or significant changes in migration patterns compared to the fresh buffer control [54].
Research Reagent Solutions
The table below lists essential reagents for SDS-PAGE and their critical functions in the separation process.
| Reagent | Function |
|---|---|
| SDS (Sodium Dodecyl Sulfate) | Denatures proteins and confers a uniform negative charge, enabling separation primarily by molecular weight [4]. |
| Polyacrylamide | Forms a cross-linked gel matrix that acts as a molecular sieve [4]. |
| APS & TEMED | Catalyze and initiate the polymerization of acrylamide to form the gel [55]. |
| Tris-Glycine Buffer | A standard discontinuous buffer system for SDS-PAGE that helps concentrate samples into sharp bands before separation [4]. |
| Loading Dye | Contains a tracking dye to monitor migration and glycerol/sucrose to make samples dense for easy well loading [53]. |
| Coomassie Blue/Silver Stain | Dyes used for post-electrophoresis visualization of protein bands, with silver staining being more sensitive [4] [53]. |
The Scientist's Toolkit: Electrophoresis Optimization Workflow
The diagram below outlines a logical workflow for troubleshooting and optimizing your electrophoresis conditions to achieve clear results.
Electrophoresis Optimization Workflow
Key Optimization Parameters at a Glance
For quick reference, the following tables consolidate key quantitative data for optimizing SDS-PAGE conditions.
Table 1: Gel Percentage Selection Guide [4] [53]
| Gel Percentage (% Acrylamide) | Optimal Protein Size Range |
|---|---|
| 8% | 25 - 200 kDa |
| 10% | 15 - 100 kDa |
| 12% | 10 - 70 kDa |
| 15% | 5 - 50 kDa |
Table 2: Recommended Voltage and Run Time Guidelines [54]
| Gel Percentage | Stacking Gel Voltage | Separating Gel Voltage | Approximate Run Time |
|---|---|---|---|
| 10-12% | 80V | 120V | 80-90 minutes |
| 15% | 80V | 120V | Extended (e.g., 100-120 min) |
FAQ: How can I identify if my protein of interest has post-translational modifications (PTMs) that might affect its migration?
Answer: Proteins with PTMs often exhibit anomalous migration on gels due to altered mass and charge. Two primary high-throughput methods are used for identification.
Mass Spectrometry (MS) Identification: This is the cornerstone technique for PTM discovery and validation. The process involves enzymatically digesting the protein into peptides, which are then separated by liquid chromatography (LC) and analyzed by tandem mass spectrometry (MS/MS). The MS/MS data reveals the mass shifts and fragmentation patterns that pinpoint the specific modified amino acid residues [56]. Common enrichment strategies are required prior to MS analysis to overcome the low abundance of modified peptides [56].
Antibody-Based Screening: This method uses antibodies immobilized on a microarray to simultaneously detect multiple proteins and their specific PTMs [56].
- Motif Antibodies: Recognize a conserved sequence pattern around a modification site (e.g., R-R-x-S/T for PKA phosphorylation) and can detect a broad range of proteins with that motif [56].
- Site-Specific Antibodies: Bind to a single, specific modification on a particular protein (e.g., phosphorylation of Serine 15 on p53) [56]. This allows for highly targeted analysis but requires a specific antibody for each site.
FAQ: My protein has an extreme pI (very high or very low). How does this affect my electrophoresis and how can I troubleshoot it?
Answer: A protein's isoelectric point (pI) is the pH at which it has no net charge [57] [58]. Standard SDS-PAGE relies on SDS to impart a uniform negative charge, but extreme pI values can cause issues even in denatured gels.
Effects and Solutions:
- Problem: Altered mobility and inaccurate molecular weight estimation. Proteins with extreme pI may not bind SDS uniformly, leading to aberrant migration [57].
- Solution: Use high-resolution techniques designed for charge-based separation.
- Isoelectric Focusing (IEF): Separates proteins based purely on pI within a stable pH gradient. It can resolve proteins differing by only 0.01 pH units, making it ideal for characterizing charge variants [57] [58].
- Capillary IEF (cIEF): A miniaturized, automated version of IEF performed in a capillary, offering superior reproducibility and sensitivity with minimal sample consumption. It is widely used in biopharmaceutical quality control [57] [58].
Troubleshooting Table: Extreme pI Proteins
| Problem | Cause | Solution |
|---|---|---|
| Smearing or broad bands | Protein at or near its pI in the running buffer, leading to low solubility and aggregation [57] [58]. | - Ensure sample buffer is sufficiently denaturing.- Run the gel at a pH far from the protein's theoretical pI.- Consider IEF-based methods for analysis. |
| Inaccurate molecular weight | Non-uniform SDS binding due to extreme charge composition [57]. | - Use the protein's pI to inform data interpretation.- Confirm size using an alternative method like size-exclusion chromatography. |
| Protein precipitation | Solution pH is at the protein's pI, minimizing electrostatic repulsion [57] [58]. | - Adjust the pH of all solutions to be at least 1 pH unit away from the protein's pI.- Include chaotropes (e.g., urea) in the buffer. |
FAQ: My target protein is highly hydrophobic. What special handling does it require for gel analysis?
Answer: Hydrophobic proteins, such as membrane proteins, are prone to aggregation and poor solubility in aqueous buffers.
Key Strategies:
- Lysis and Solubilization: Use strong, non-ionic or zwitterionic detergents. RIPA buffer is commonly used, but detergents like CHAPS may be more effective for some membrane proteins [59].
- Preventing Aggregation: Ensure the presence of an adequate concentration of detergent throughout the entire process, from lysis to the running buffer, to keep the protein solubilized [59].
- Identification of Hydrophobic Regions: Tools like Blobulator can detect contiguous hydrophobic subsequences ("h-blobs") in a protein sequence from its amino acid sequence alone. This helps predict potential solubility issues and identify structured hydrophobic cores or transmembrane regions [60].
Troubleshooting Table: Hydrophobic Proteins
| Problem | Cause | Solution |
|---|---|---|
| Protein aggregation | Insufficient or ineffective detergent [59]. | - Screen different detergents (e.g., Triton X-100, NP-40, CHAPS).- Avoid boiling samples with certain detergents to prevent precipitation. |
| Smearing in the well | Large, insoluble protein complexes that cannot enter the gel [61]. | - Centrifuge lysate at high speed to remove insolubles before loading.- Increase the amount of reducing agent (DTT, β-mercaptoethanol) to break disulfide bonds.- Use gradient gels for better resolution of large complexes. |
| High background | Non-specific binding of antibodies to hydrophobic regions (in Western blotting). | - Increase the concentration of detergent (e.g., Tween-20) in the wash and blocking buffers. |
FAQ: What are the best practices for enriching low-abundance proteins before gel electrophoresis?
Answer: For proteins with low expression, like many GPCRs, direct analysis from a whole-cell lysate is often impossible without enrichment.
- Immunoprecipitation (IP): This is the most specific method. It uses an antibody against your target protein (or an epitope tag) to pull it out of the complex lysate mixture, dramatically increasing its effective concentration for downstream analysis [59].
- Wheat Germ Agglutinin (WGA) Beads: A broad-specificity method ideal for heavily glycosylated proteins. WGA binds to N-acetylglucosamine residues, enriching glycoproteins from a sample [59].
FAQ: How can I analyze my gel electrophoresis images more accurately and efficiently?
Answer: Traditional gel analysis software can be time-consuming and prone to user bias. Modern AI-powered tools now offer a superior alternative.
- GelGenie: This is an open-source, AI-based application that uses a trained U-Net model to automatically identify and segment bands in gel images through pixel classification [62]. It requires no expert knowledge, works in seconds for a wide range of gel conditions (including faint, blurry, or warped bands), and has been shown to match or surpass the quantitation accuracy of traditional software like GelAnalyzer [62].
Experimental Workflow for Challenging Proteins
The following diagram outlines a logical workflow for handling proteins with PTMs, extreme pI, or hydrophobic character.
The Scientist's Toolkit: Essential Research Reagents
The following table details key reagents and tools essential for working with challenging proteins.
Table: Key Reagent Solutions for Protein Analysis
| Reagent / Tool | Function | Example Use-Case |
|---|---|---|
| Phosphatase Inhibitors | Prevent dephosphorylation of proteins during lysis, preserving PTM state [59]. | Phosphoproteomics studies; analyzing signaling pathways. |
| Protease Inhibitors | Prevent proteolytic degradation of proteins during and after cell lysis [59]. | Handling all protein types, especially critical for fragile or low-abundance targets. |
| CHAPS Detergent | A zwitterionic detergent effective at solubilizing membrane proteins while maintaining protein function [59]. | Extraction and analysis of GPCRs and other transmembrane proteins. |
| Urea | A chaotropic agent that disrupts hydrogen bonding, helping to solubilize and denature difficult proteins [59]. | Solubilizing inclusion bodies or highly aggregated proteins. |
| Blobulator | A bioinformatics toolkit that identifies hydrophobic modules ("blobs") from protein sequence [60]. | Predicting solubility issues and identifying hydrophobic regions before an experiment. |
| Motif Antibodies | Detect a specific PTM (e.g., phosphorylation) across multiple proteins that share a consensus sequence [56]. | Initial screening of kinase activity in a pathway. |
| Site-Specific Antibodies | Detect a PTM at a single, specific amino acid on a single protein [56]. | Validating a specific regulatory event on a known protein. |
| WGA Beads | Enrich glycosylated proteins from complex lysates through affinity binding [59]. | Pre-concentration of GPCRs or other glycoproteins prior to Western blot. |
Troubleshooting Guides
Why am I seeing faint or absent bands on my gel?
Faint bands are commonly caused by issues related to sample preparation, gel running conditions, or visualization techniques [61].
| Possible Cause | Recommended Solution |
|---|---|
| Low Sample Quantity | Load minimum of 0.1–0.2 μg of DNA or RNA per millimeter of gel well width. Use deep, narrow well combs [61]. |
| Sample Degradation | Use molecular biology grade reagents, wear gloves, and prevent nuclease contamination [61]. |
| Gel Over-run | Monitor run time and dye migration to prevent small molecules from running off the gel [61]. |
| Low Stain Sensitivity | Increase stain concentration/duration; for thick/high-% gels, allow longer staining period [61]. |
How can I resolve smeared bands in my gel?
Smeared bands result from problems with the gel itself, sample preparation, or running conditions [61].
| Possible Cause | Recommended Solution |
|---|---|
| Sample Overloading | Do not exceed 0.1–0.2 μg of sample per millimeter of well width [61]. |
| Sample Degradation | Ensure labware is nuclease-free and follow good laboratory practices for handling nucleic acids [61]. |
| Incorrect Gel Thickness | Cast horizontal agarose gels to 3–4 mm thickness; >5 mm can cause diffusion [61]. |
| High Salt in Sample Buffer | Dilute loading buffer, or purify/precipitate sample to remove excess salt [61]. |
| Incorrect Voltage/Time | Apply recommended voltage for nucleic acid size; very low/high voltage causes suboptimal resolution [61]. |
What should I do if my bands are poorly separated?
Poorly separated, stacked bands often stem from an incorrect gel matrix or issues during the run [61].
| Possible Cause | Recommended Solution |
|---|---|
| Incorrect Gel Percentage | Use appropriate gel percentage for your target fragment size (see Gel Selection Table). Adjust water volume after boiling agarose to prevent % increase from evaporation [61]. |
| Suboptimal Gel Type | Use polyacrylamide gels for resolving nucleic acids <1,000 bp [61]. |
| Sample Overloading | Avoid using more sample than necessary [61]. |
| Poorly Formed Wells | Ensure comb is clean, don't push it to bottom of gel tray, avoid overfilling tray, allow solidification time [61]. |
Frequently Asked Questions (FAQs)
How do I quickly modify a traditional RNA extraction protocol for difficult plant tissues?
A modified SDS-based RNA extraction protocol has been developed for recalcitrant tissues high in polyphenols and polysaccharides, such as Musa spp. (banana) [63]. Key modifications to the standard SDS/phenol method include [63]:
- Refining the RNA extraction buffer composition.
- Optimizing the SDS and heat incubation steps.
- Using LiCl for more effective RNA precipitation. This protocol resulted in high-intensity ribosomal RNA bands on gels and high RNA integrity numbers (RIN 7.8–9.9), confirming its suitability for downstream applications like qRT-PCR [63].
What are the primary advantages of using pre-mixed reagent systems?
Pre-mixed systems offer significant operational benefits:
- Time Savings: Eliminates the time required for weighing powders and mixing solutions [64].
- Consistency and Reproducibility: Removes the inherent variation that comes with making gels by hand, ensuring more reliable and repeatable results across experiments [64].
- Reduced Error Potential: Minimizes mistakes in formulation, leading to more robust and predictable outcomes [64].
How do I select the correct gel percentage for my protein experiment?
The optimal gel concentration depends on the molecular weight (MW) of your target protein. Use this table as a guide for SDS-PAGE optimization [65]:
| Protein MW Range | Recommended Gel Concentration |
|---|---|
| 100 - 600 kDa | 4% |
| 50 - 500 kDa | 7% |
| 30 - 300 kDa | 10% |
| 10 - 200 kDa | 12% |
| 3 - 100 kDa | 15% |
My gel is running very slowly. What adjustments can I make?
Run time is influenced by several factors [64]:
- Voltage: Increasing the voltage can reduce run time. However, excessively high voltage can cause overheating, gel melting, and fuzzy bands [64].
- Gel Composition: Higher percentage gels have smaller pores and require longer runs or higher voltage, but they are also more prone to melting if the voltage is too high [64].
- Degree of Separation Required: Higher resolution of closely sized molecules requires longer run times [64]. Always balance voltage and time to prevent heat-related artifacts.
Experimental Workflows & Visualization
SDS-PAGE Optimization Workflow
Troubleshooting Logic for Common Gel Issues
The Scientist's Toolkit: Research Reagent Solutions
| Essential Material | Function in Experiment |
|---|---|
| Pre-cast Gels | Ready-to-use gels providing consistency, saving time, and removing variation from hand-casting [64]. |
| Agarose & Polyacrylamide | Matrix-forming polymers for separating nucleic acids (agarose) or proteins/small nucleic acids (polyacrylamide) [64]. |
| SDS (Sodium Dodecyl Sulfate) | Ionic detergent that linearizes proteins and imparts a uniform negative charge, allowing separation by molecular weight alone [65]. |
| Loading Buffer/Dye | Contains dye for visual tracking and glycerol to increase sample density, ensuring it sinks into wells [64]. |
| Running Buffer | Provides conductive salt ions to carry electrical current throughout the gel during electrophoresis [64]. |
| Protein Ladder | Standardized molecular weight markers loaded alongside samples for accurate size determination of unknown proteins [64]. |
| Staining Solution | Chemical (e.g., Coomassie, fluorescent dyes) used to visualize separated biomolecules after electrophoresis [61]. |
Ensuring Accuracy: Validation, Comparative Analysis, and Downstream Applications
Frequently Asked Questions (FAQs)
Q1: Why is assessing signal-to-noise ratio critical in gel electrophoresis? A high signal-to-noise ratio is fundamental for obtaining reliable and reproducible data. It enhances the accuracy of protein detection by improving the contrast between the specific protein bands and the background, which is essential for precise quantification and for detecting low-abundance proteins [66]. A poor ratio can lead to misinterpretation of results, such as missing faint bands or mistaking artifacts for true signals [66].
Q2: What are the primary sources of background noise in gel electrophoresis? The main sources of background noise include:
- Background Staining: Caused by impurities in the gel matrix or buffer, and is a predominant source of error in quantitative analysis [67].
- Non-specific Bands/Smears: Arise from sample-related issues like partial digestion or contamination [66].
- Electrical Noise: Fluctuations in current or voltage during the run can cause band distortions [66].
- Detection System Limitations: The finite sensitivity and dynamic range of imaging systems (e.g., CCD cameras) can contribute to noise [66].
Q3: Which staining method offers the best signal-to-noise ratio for protein detection? Near-infrared (NIR) detection of gels stained with Colloidal Coomassie Blue (CCB) has been demonstrated to provide an excellent signal-to-noise ratio. This method markedly reduces the irregular background signal common in gels and offers sensitivity comparable to or better than fluorescent stains, with a total error of just 5% (RSD%) for main assays [67].
Q4: How can I improve the precision of my gel electrophoresis results? Precision can be improved by:
- Utilizing detection methods that reduce background, such as NIR imaging [67].
- Systematically optimizing experimental parameters. Key factors that significantly affect precision include destaining time, staining temperature, the type of detergent in the sample buffer (SDS vs. LDS), and the age of the gels [67].
- Note that the influence of these factors can be unique to each protein or protein class, so optimization may need to be individualized [67].
Troubleshooting Guides
High Background Staining
| Symptom | Possible Cause | Recommended Solution |
|---|---|---|
| Uniform haze across the gel | Impurities in gel matrix or buffer [66] | Use high-quality, ultra-pure reagents [66]. |
| Suboptimal staining/destaining [67] | Optimize destaining time and staining temperature empirically [67]. | |
| Non-specific bands or smears | Sample overloading [68] | Load recommended amounts: ≤2 µg for purified protein or ≤20 µg for complex lysates for Coomassie stain [68]. |
| Incomplete denaturation [68] | Ensure thorough heating at 95°C for 5 minutes for complete denaturation [68]. |
Poor Signal-to-Noise Ratio
| Symptom | Possible Cause | Recommended Solution |
|---|---|---|
| Faint bands obscured by background | Inefficient detection method [67] | Switch to a detection method with lower inherent background, such as NIR imaging for CCB-stained gels [67]. |
| Low abundance of target protein | Use more sensitive staining methods (e.g., fluorescent stains) or increase sample loading within the optimal range [68]. | |
| Irregular migration ("smiling" effect) | Excessive heat during electrophoresis [68] | Maintain a constant temperature between 10°C-20°C by using a magnetic stirrer in the buffer chamber or lowering the running current [68]. |
Quantitative Data on Staining Techniques
The following table summarizes key performance characteristics of different protein detection methods as discussed in the literature, highlighting their impact on signal-to-noise assessment.
Table 1: Comparison of Protein Detection Method Characteristics
| Detection Method | Reported Sensitivity / Total Error | Key Advantages | Key Limitations / Noise Sources |
|---|---|---|---|
| CCB with NIR Imaging | Total error: 5% RSD% [67] | Excellent signal-to-noise ratio; cost-effective; compatible with mass spectrometry [67]. | Requires access to an NIR imaging system. |
| CCB with Standard Densitometry | Not specified, but higher background than NIR [67] | Low cost; ease of use [67]. | High background staining limits sensitivity [67]. |
| Fluorescence Stains | Sensitivity comparable to NIR/CCB [67] | High sensitivity [67]. | Can be costly [67]. |
| Chemiluminescent Detection | High sensitivity (wide dynamic range) [69] [70] | Very high sensitivity for Western blotting; digital capture possible [69]. | Signal depends on enzyme reaction time, temperature, and substrate concentration [69]. |
Experimental Protocol: Validating Separation and Transfer Efficiency
This protocol outlines key steps to validate the gel electrophoresis and protein transfer steps, which are prerequisites for accurate signal-to-noise assessment.
Materials Required
- SDS-PAGE gel (pre-cast or hand-cast)
- Protein molecular weight marker (pre-stained and unstained) [69] [71]
- Electrophoresis and transfer apparatus [69]
- Nitrocellulose or PVDF membrane [69]
- Reversible protein stain (e.g., Ponceau S or superior alternatives) [69]
Methodological Steps
- Sample Preparation: Prepare samples in a loading buffer containing a reducing agent (e.g., DTT) and denature by heating at 95°C for 5 minutes [71] [68].
- Gel Electrophoresis: Load an equal amount of protein (e.g., 10-40 µg of lysate) alongside the molecular weight markers. Run the gel according to the manufacturer's instructions, ensuring optimal voltage and time to prevent "smiling" or over-running [71] [68].
- Post-Electrophoresis Check (Optional): After separation, stain the gel with a protein stain (e.g., Coomassie Blue) to confirm proper separation and that protein has moved out of the wells. This confirms separation but not membrane binding [69].
- Protein Transfer: Use electrophoretic transfer (e.g., wet, semi-dry, or dry transfer) to move proteins from the gel to a membrane [69].
- Validation of Transfer Efficiency:
- Stain the Membrane: After transfer, use a reversible stain like Ponceau S to visualize the total protein pattern on the membrane. This confirms that proteins have successfully bound to the membrane [69].
- Stain the Gel (Post-Transfer): Subsequently stain the gel to confirm that most proteins have been transferred out. The gel should appear largely clear [69].
Diagram 1: Protein Separation & Transfer Validation Workflow
The Scientist's Toolkit: Research Reagent Solutions
Table 2: Essential Reagents for Gel Electrophoresis and Validation
| Reagent / Material | Function / Explanation |
|---|---|
| SDS-PAGE Gel | Polyacrylamide matrix for separating proteins by molecular weight. Gradient gels (e.g., 4-20%) are versatile for a wide size range [71] [68]. |
| SDS Sample Buffer | Denatures proteins and imparts a uniform negative charge, allowing separation based primarily on size [71] [68]. |
| Reducing Agents (DTT, β-ME) | Break disulfide bonds in proteins to ensure complete denaturation to primary structure [71] [68]. |
| Molecular Weight Marker | Essential for accurately determining the size of separated proteins and serves as a control for the separation quality [71] [68]. |
| Nitrocellulose/PVDF Membrane | Binds proteins after transfer, providing a surface for subsequent staining and antibody probing [69]. |
| Reversible Membrane Stain (Ponceau S) | A quick and reversible method to visually confirm successful protein transfer onto the membrane before proceeding with immunoblotting [69]. |
| Blocking Buffer (e.g., BSA, Milk) | Blocks unused binding sites on the membrane to prevent nonspecific antibody binding, which is crucial for reducing background noise [69]. |
Diagram 2: Signal-to-Noise Optimization Pathways
Gel electrophoresis is a foundational technique in molecular biology and biochemistry, enabling the separation of proteins based on their size and charge. The principle involves applying an electric field to move charged protein molecules through a gel matrix, which acts as a molecular sieve. Smaller proteins migrate more quickly through the pores, while larger ones lag behind, resulting in distinct bands corresponding to different molecular weights [72] [73]. Within this framework, researchers must choose between two primary gel formats: pre-cast gels, which are commercially manufactured and ready-to-use, and hand-cast gels, which are manually prepared in the laboratory. This choice is particularly critical for research focused on optimizing gel percentage for different protein sizes, as it directly impacts separation efficiency, reproducibility, and experimental workflow. This analysis provides a comparative evaluation of both formats to guide researchers in selecting the appropriate system for their specific protein separation needs.
Technical Comparison: Pre-cast vs. Hand-cast Gels
The choice between pre-cast and hand-cast gels involves trade-offs across several technical and practical dimensions. The following table summarizes the key comparative characteristics.
Table 1: Technical Comparison between Pre-cast and Hand-cast Gels
| Characteristic | Pre-cast Gels | Hand-cast Gels |
|---|---|---|
| Gel Composition & Quality | Highly consistent, optimized polymer blends | Variable; dependent on reagent quality and technician skill |
| Shelf Life | Several months when stored properly | Should be used within 1-2 days of casting |
| Availability | Immediate use; no preparation time | Require significant preparation time (1-2 hours) |
| Customization Flexibility | Low; limited to available commercial formats | High; gel percentage, buffer systems, and additives can be fully tailored |
| Cost per Gel | Higher | Significantly lower |
| Technical Skill Required | Low | High; requires training for consistent results |
| Optimal Use Cases | Routine analysis, high-throughput screening, standardized protocols | Method development, unusual protein sizes, specialized techniques |
Troubleshooting Guide: Frequently Asked Questions
Q1: My protein bands appear smeared on both pre-cast and hand-cast gels. What could be the cause?
Smeared bands are a common issue that can arise from multiple factors. The primary cause is often running the gel at too high a voltage, which generates excessive heat and causes protein denaturation and band distortion [74]. For SDS-PAGE, a standard practice is to run the gel at around 150V, or 10-15 volts per cm of gel. Using a lower voltage for a longer run time often yields superior results. Other causes include:
- Sample Overloading: Do not overload wells. A general recommendation is 0.1–0.2 μg of protein per millimeter of gel well width [61].
- Sample Degradation: Proteases in the sample can cause degradation. Always add sample buffer and heat the sample (75-100°C for 5 minutes) immediately to inactivate proteases [75].
- Improper Sample Preparation: Ensure proteins are fully denatured and linearized. For SDS-PAGE, this involves treating samples with sodium dodecyl sulfate (SDS) and a reducing agent like DTT [72].
Q2: I am not getting proper separation between my protein bands. How can I improve resolution?
Poorly separated or unresolved bands indicate suboptimal separation conditions.
- Incorrect Gel Percentage: The concentration of polyacrylamide is critical. Use lower percentages (e.g., 8-10%) for high molecular weight proteins and higher percentages (e.g., 12-15%) for low molecular weight proteins [74] [54].
- Insufficient Run Time: Run the gel until the dye front is nearing the bottom. For high molecular weight proteins, a longer run time may be necessary for proper resolution [74].
- Improper Buffer: Incorrectly prepared running buffer with the wrong ion concentration can disrupt current flow and pH, leading to poor separation. Always remake the running buffer according to the correct recipe [74].
Q3: Why are the bands in the outermost lanes of my pre-cast gel distorted?
This is a classic "edge effect." It occurs when the outermost wells are left empty, leading to an uneven electric field across the gel [74]. To prevent this, load a sample, such as a protein ladder or a control protein, into every well. If you have empty wells, load an equal volume of 1x loading buffer to prevent sample spreading and field distortion [54].
Q4: My samples diffused out of the wells before I started the run. What happened?
This occurs when there is a significant time lag between loading the samples and applying the electric current. The electric current ensures streamlined migration from the wells. Without it, samples will diffuse haphazardly [74]. To avoid this, start the electrophoresis run immediately after you finish loading all your samples.
Experimental Protocol: Optimizing Gel Percentage for Protein Size Separation
Objective: To empirically determine the optimal polyacrylamide gel percentage for resolving a target protein mixture using a hand-cast gel system.
Background: The gel matrix acts as a molecular sieve. Optimizing its pore size (determined by the %T - total acrylamide concentration) is essential for achieving high-resolution separation [72] [73].
Materials:
- Research Reagent Solutions: The following table details essential materials and their functions for hand-cast gel electrophoresis.
Table 2: Key Research Reagent Solutions for SDS-PAGE
| Reagent / Material | Function |
|---|---|
| Acrylamide/Bis-acrylamide Solution | Forms the cross-linked polyacrylamide gel matrix that acts as a molecular sieve. |
| SDS (Sodium Dodecyl Sulfate) | Denatures proteins and confers a uniform negative charge, allowing separation based primarily on size. |
| Tris-HCl Buffer | Maintains a stable pH during gel polymerization and electrophoresis. |
| Ammonium Persulfate (APS) | Initiates the free-radical polymerization of acrylamide. |
| TEMED (Tetramethylethylenediamine) | Catalyzes the polymerization reaction of acrylamide. |
| Glycine Running Buffer | Provides ions for conductivity and maintains the pH required for protein migration during the run. |
| Protein Molecular Weight Ladder | A set of proteins of known sizes used to estimate the molecular weight of unknown samples. |
| Coomassie Blue Stain | A dye that binds to proteins, allowing visualization of separated bands as dark blue bands on a clear background [72]. |
Methodology:
- Gel Casting: Prepare and cast a series of hand-cast SDS-polyacrylamide gels with different percentages (e.g., 8%, 10%, 12%, and 15%). Ensure the stacking gel is consistent (typically 4-5%) across all gels.
- Sample Preparation: Dilute your protein sample to a known concentration (e.g., 1-2 μg/μL). Mix the protein sample with an equal volume of 2x SDS-PAGE loading buffer. Heat the samples at 75-95°C for 5 minutes to denature the proteins [75]. Centrifuge briefly to pellet any insoluble material.
- Electrophoresis: Load an equal mass of protein (e.g., 20-40 μg for a crude sample for Coomassie staining) into each well. Include a protein ladder in one well. Run the gels at a constant voltage (e.g., 80V through the stacking gel, then 120V through the resolving gel) until the dye front reaches the bottom [54].
- Visualization & Analysis: Stain the gels with Coomassie Blue or a more sensitive fluorescent stain. Destain as needed. Image the gels and analyze the sharpness and resolution of the bands of interest.
Expected Outcome: Lower percentage gels (8-10%) will better resolve high molecular weight proteins, while higher percentage gels (12-15%) will provide superior separation of low molecular weight proteins. The optimal percentage provides the clearest, sharpest, and most well-resolved bands for your specific target proteins.
Decision Framework and Workflow
The following diagram illustrates the logical decision-making process for selecting between pre-cast and hand-cast gels and the subsequent experimental workflow.
Gel Selection and Experimental Workflow
The choice between pre-cast and hand-cast gels is not a matter of one being universally superior to the other. Instead, it is a strategic decision that should align with the specific goals of the research project. For the central thesis of optimizing gel percentage for different protein sizes, hand-cast gels offer an indispensable level of customization and cost-effectiveness for method development. Once the optimal conditions are established, pre-cast gels provide unparalleled consistency and efficiency for routine, high-throughput analysis. By understanding the strengths and limitations of each format, as detailed in this analysis, researchers and drug development professionals can make informed decisions that enhance the quality, reproducibility, and efficiency of their protein separation experiments.
The transition of proteins from a polyacrylamide gel to a solid support membrane, known as protein transfer, is a fundamental step in western blotting that directly influences the sensitivity, specificity, and overall success of protein detection [76]. This process immobilizes separated proteins onto a membrane surface, creating a replica of the gel's protein pattern while enabling efficient probing with antibodies [76]. Efficient transfer is vital for generating reliable data in protein research, drug development, and diagnostic applications. However, transfer efficiency varies significantly with protein size, creating a central technical challenge for researchers working with diverse protein targets. Large proteins (>100 kDa) often transfer inefficiently due to their slow migration through the gel matrix, while small proteins (<20 kDa) may pass completely through standard membranes if transfer conditions are not properly optimized [35] [76]. This technical support guide provides comprehensive troubleshooting advice and optimized protocols to address these protein size-specific challenges, ensuring successful western blot transfers across the molecular weight spectrum.
Troubleshooting FAQs: Addressing Common Transfer Problems
Q1: My high molecular weight protein (>100 kDa) shows weak or no signal after transfer. What could be wrong?
A: Weak signal for large proteins typically indicates inefficient transfer from the gel to the membrane. Several factors can contribute to this problem:
- Insufficient transfer time or voltage: Large proteins migrate slowly and require extended transfer periods [76]. Solution: Increase transfer time (e.g., overnight at low voltage for wet transfer) or use higher field strength [41] [76].
- Incorrect membrane pore size: Standard 0.45 µm membranes may impede large protein retention. Solution: For proteins >150-200 kDa, ensure you are using a standard 0.45 µm pore size, as smaller pores (0.2 µm) are typically recommended for low molecular weight proteins [35].
- Inadequate SDS in transfer buffer: SDS helps dissociate large proteins from the gel matrix. Solution: Add 0.01–0.05% SDS to your transfer buffer to facilitate movement of large proteins out of the gel [41]. However, note that methanol in the transfer buffer helps proteins bind to the membrane but can also remove SDS and cause precipitation of large proteins—finding the right balance is key [76].
- Transfer method limitation: Semi-dry transfer systems often struggle with large proteins. Solution: Switch to a traditional wet (tank) transfer system, which provides better efficiency for high molecular weight proteins [35] [76].
Q2: My low molecular weight protein (<20 kDa) appears faint or is missing from the blot. How can I improve detection?
A: Small proteins often transfer too efficiently, potentially passing completely through the membrane:
- Protein blow-through: Small proteins can rapidly pass through standard 0.45 µm membrane pores. Solution: Use a membrane with smaller pore size (0.2 µm or 0.1 µm) to better retain low molecular weight proteins [35].
- Excessive transfer time: Over-transfer can cause small proteins to pass through the membrane. Solution: Reduce transfer time (e.g., 30-60 minutes instead of overnight) [76].
- Insufficient membrane binding: Solution: Ensure your transfer buffer contains 10-20% methanol, which enhances protein binding to the membrane by increasing hydrophobicity and removing SDS [76] [77]. PVDF membranes typically have higher binding capacity for small proteins than nitrocellulose [76].
- Diagnostic test: Perform a double-membrane transfer: place a second membrane behind the first during transfer. If signal appears on the second membrane, your protein is blowing through the first membrane [35].
Q3: I notice uneven background staining or strange patterns on my membrane after development. What causes this?
A: Irregular background patterns typically indicate technical issues during the transfer process:
- Incomplete contact between gel and membrane: Air bubbles trapped between gel and membrane create untransfered regions. Solution: Carefully roll a glass tube or roller across the sandwich during assembly to remove air bubbles [41] [35].
- Inconsistent buffer composition or contamination: Solution: Prepare fresh transfer buffer and filter before use. Ensure equipment is clean and contamination-free [41].
- Non-uniform transfer field: Solution: Check that electrodes are clean and properly positioned. For semi-dry transfer, ensure the membrane and filter papers are cut to exact gel dimensions without overhang [76].
- Membrane handling issues: Solution: Always wear gloves when handling membranes, as oils from skin can create uneven background. Keep the membrane moist throughout the process [41].
Q4: My protein bands appear distorted or smeared after transfer. How can I achieve sharper bands?
A: Band distortion can originate from multiple sources:
- Gel electrophoresis issues: Incomplete denaturation or reduction of samples causes aggregation. Solution: Ensure fresh reducing agent (DTT, β-mercaptoethanol) is used in sample buffer and heating is adequate (5-10 minutes at 95°C for most proteins) [41] [33].
- Salt concentration too high: High salt increases conductivity and causes heating. Solution: Desalt samples or ensure salt concentration does not exceed 100-500 mM [41] [33].
- Transfer overheating: Excessive current generates heat that distorts protein bands. Solution: Perform transfer in a cold room or with a cooling unit [78] [35].
- Protein overloading: Too much protein per lane causes over-saturation. Solution: Reduce protein load to 10-15 μg per lane for cell lysates [41] [79].
Optimization Strategies by Protein Size
Transfer Method Selection
Different electroblotting methods offer distinct advantages for specific protein size ranges. The table below compares the primary transfer methods:
Table 1: Comparison of Western Blot Transfer Methods
| Parameter | Wet (Tank) Transfer | Semi-Dry Transfer | Dry Transfer |
|---|---|---|---|
| Transfer Time | 30 minutes to overnight | 10-60 minutes | As few as 3-7 minutes |
| Buffer Volume | Large (500-1000 mL) | Minimal (50-200 mL) | Pre-hydrated stacks, no additional buffer |
| Efficiency for Large Proteins (>100 kDa) | Excellent | Moderate to Poor | Good |
| Efficiency for Small Proteins (<20 kDa) | Good (with optimization) | Excellent | Good |
| Cooling Requirement | Often required for long transfers | Sometimes needed | Minimal |
| Flexibility | High | Moderate | System-dependent |
Wet transfer systems generally provide the most consistent results across a broad molecular weight range, particularly for challenging large proteins, while semi-dry systems offer speed and convenience for routine applications with small to medium-sized proteins [76]. Dry blotting systems provide a balance of speed and performance but require specialized equipment and consumables [76].
Buffer Composition Optimization
Transfer buffer composition significantly impacts protein mobility and membrane binding. The standard Towbin buffer (25 mM Tris, 192 mM glycine, 20% methanol, pH 8.3) can be modified to optimize transfer of specific protein sizes [76] [77]:
Table 2: Transfer Buffer Optimization for Different Protein Sizes
| Protein Size | Methanol Concentration | SDS Addition | Special Considerations |
|---|---|---|---|
| Large Proteins (>100 kDa) | 10-15% | 0.01-0.05% | Higher SDS helps move large proteins from gel |
| Small Proteins (<20 kDa) | 15-20% | None | Higher methanol prevents blow-through |
| Standard Range (20-100 kDa) | 15-20% | None | Standard Towbin buffer works well |
| Very Large Proteins (>200 kDa) | 10% | 0.05-0.1% | Consider extended transfer time |
Methanol plays a dual role: it facilitates protein binding to the membrane but can also precipitate large proteins, particularly when SDS is removed [76] [77]. The addition of SDS promotes protein elution from the gel but can reduce membrane binding efficiency if present in excess [76].
Essential Protocols for Optimized Transfer
Standard Wet Transfer Protocol for Mixed Molecular Weight Proteins
This protocol provides a balanced approach for transferring proteins across a broad size range (15-150 kDa):
- Gel Equilibration: Following electrophoresis, equilibrate the polyacrylamide gel in transfer buffer for 5-15 minutes to remove electrophoresis contaminants and prevent gel expansion during transfer [77].
- Membrane Preparation: For nitrocellulose, hydrate in transfer buffer. For PVDF, briefly wet in 100% methanol, then rinse in transfer buffer [76].
- Sandwich Assembly: On the cathode (-) core, assemble in this order: fiber pad, filter paper, gel, membrane, filter paper, fiber pad. Roll each layer with a test tube to remove air bubbles [76] [77].
- Transfer Conditions: Place sandwich in tank filled with chilled transfer buffer. Transfer at constant current (300-400 mA) for 60-90 minutes or at lower current (30-50 mA) overnight at 4°C [76].
- Post-Transfer Verification: Stain membrane with Ponceau S or reversible protein stain to confirm transfer efficiency before proceeding to blocking [35].
High Molecular Weight Protein Transfer Protocol (>100 kDa)
For large proteins, use these modifications to the standard protocol:
- Reduce Methanol: Decrease methanol concentration to 10% in transfer buffer to prevent protein precipitation [76].
- Add SDS: Include 0.01-0.05% SDS in transfer buffer to facilitate protein movement from gel [41].
- Extended Transfer Time: Transfer at constant voltage (25-30V) overnight at 4°C [76].
- Membrane Selection: Use PVDF membranes for better retention of large proteins [76].
Low Molecular Weight Protein Transfer Protocol (<20 kDa)
For small proteins, these adjustments prevent over-transfer:
- Increase Methanol: Use 20% methanol in transfer buffer to enhance membrane binding [76].
- Reduce Transfer Time: Transfer for 30-45 minutes at standard current/voltage [76].
- Membrane Pore Size: Use 0.2 µm or 0.1 µm pore size membranes to prevent blow-through [35].
- No SDS: Omit SDS from transfer buffer to slow migration and enhance binding [76].
The Scientist's Toolkit: Essential Materials for Western Blot Transfer
Table 3: Essential Research Reagents and Materials for Protein Transfer
| Item | Function | Selection Considerations |
|---|---|---|
| PVDF Membrane | Protein binding surface | Higher protein binding capacity, better for low abundance targets, requires methanol activation [76] |
| Nitrocellulose Membrane | Protein binding surface | Lower background for some applications, compatible with various detection systems [76] |
| Transfer Buffer (Towbin) | Conducting medium for electrophoresis | Standard contains Tris, glycine, methanol; modifiable for protein size [76] [77] |
| Methanol | Transfer buffer component | Enhances protein binding to membrane, removes SDS from proteins [76] [77] |
| SDS | Transfer buffer additive | Facilitates protein elution from gel, particularly for large proteins [41] |
| Filter Paper | Sandwich component | Provides even pressure and buffer distribution; must be cut to gel size [76] |
| Molecular Weight Markers | Size standards | Prestained markers visualize transfer progress; unstained markers provide accurate size determination [35] |
| Ponceau S Stain | Reversible membrane stain | Quick assessment of transfer efficiency before antibody probing [35] |
Workflow and Decision Framework
The following diagram illustrates the systematic workflow for optimizing western blot transfer based on protein size and experimental requirements:
Western Blot Transfer Optimization Workflow
Successful western blot transfer requires careful consideration of protein size and appropriate optimization of transfer methods, buffers, and membranes. By understanding the distinct challenges presented by different molecular weight proteins and implementing the targeted troubleshooting strategies outlined in this guide, researchers can significantly improve transfer efficiency and detection sensitivity across their experimental systems. The systematic approach presented here—incorporating appropriate transfer methods, optimized buffer compositions, and size-specific protocols—provides a framework for addressing the most common challenges in protein immunoblotting, enabling more reliable and reproducible results in protein research and drug development.
Correlating Gel Percentage Performance with Downstream Analytical Results
How does gel percentage fundamentally affect my experimental results?
The gel percentage, which determines the pore size of the polyacrylamide or agarose matrix, is a fundamental parameter that directly controls the resolution of biomolecules during electrophoresis. Selecting the appropriate gel percentage is not merely a preparatory step but a critical factor that determines the success and reliability of downstream analytical results. The relationship is straightforward: smaller pore sizes in higher percentage gels provide better resolution for smaller molecules, while larger pore sizes in lower percentage gels are necessary for larger molecules to migrate effectively. An incorrect gel percentage can lead to poor separation, distorted bands, and ultimately, compromised data interpretation for critical applications such as protein quantification, purity assessment, and molecular weight determination. This guide will provide detailed troubleshooting and best practices to ensure your gel percentage selection optimizes the integrity of your downstream analysis.
Troubleshooting Guides and FAQs
FAQ: How do I choose the correct gel percentage for my protein or nucleic acid sample?
The choice depends primarily on the molecular size of your target molecules. The table below summarizes the recommended gel percentages for optimal separation of proteins and nucleic acids.
Table 1: Optimal Gel Percentage Based on Molecular Size
| Molecule Type | Size Range | Recommended Gel Percentage | Key Considerations |
|---|---|---|---|
| Proteins (SDS-PAGE) | < 10 kDa | 15-20% | Provides a tight matrix for resolving small peptides and low MW proteins. |
| 10 - 50 kDa | 12-15% | Standard range for most routine protein analysis. | |
| 50 - 150 kDa | 8-12% | Ideal for large proteins; lower percentages facilitate easier migration. | |
| Double-Stranded DNA | < 1,000 bp | Polyacrylamide Gel (3-20%) | Polyacrylamide offers superior resolution for small fragments [61] [80]. |
| 100 bp - 3 kb | Agarose (1-2%) | Standard agarose concentrations for a wide range of DNA fragments. | |
| > 3 kb | Agarose (0.7-1.0%) | Low-percentage gels allow large DNA molecules to migrate. | |
| mRNA / RNA | Varies (e.g., ~4,000 nt) | Denaturing Capillary Gel Electrophoresis | For long-chain mRNA, parameters like gel polymer concentration, denaturant, and capillary temperature are crucial for separating full-length and defective RNAs [81] [82]. |
Troubleshooting Guide: Poor Band Separation and Resolution
Table 2: Troubleshooting Poor Band Separation
| Observed Problem | Potential Cause Related to Gel Percentage | Solutions & Recommendations |
|---|---|---|
| Poorly separated, stacked bands | Gel percentage is too low for the molecular size. | Increase the gel percentage to create a tighter sieve for better size discrimination [61] [80]. |
| Gel percentage is too high, trapping larger molecules. | Decrease the gel percentage to allow larger molecules to migrate into the gel. | |
| Banded smearing or diffused bands | Gel percentage is inappropriate, causing similar-sized molecules to co-migrate. | Optimize gel percentage and ensure the use of denaturing gels for single-stranded nucleic acids like RNA [61] [80]. |
| Sample overloading relative to the gel's capacity. | Do not overload wells; a general recommendation is 0.1–0.2 μg of sample per millimeter of gel well width [61] [80]. | |
| "Smile" or "frown" effects | Gel overheating due to excessive voltage. | Lower the voltage to prevent uneven heating; "smile" bands can indicate electrophoresis that is too fast [83]. |
FAQ: Why do I see unexpected or non-specific bands in my protein gel/Western blot?
Unexpected bands can often be traced to sample preparation or issues orthogonal to, but interacting with, gel percentage.
- Protein Degradation: Nuclease contamination or improper handling can cause random fragmentation, appearing as a smear or multiple lower molecular weight bands. Always use fresh protease inhibitors and keep samples on ice [83].
- Post-Translational Modifications (PTMs): Phosphorylation, glycosylation, or other PTMs can alter a protein's apparent molecular weight, causing shifts or multiple specific bands. This is a biological reality, not an artifact [83].
- Antibody Cross-Reactivity: In Western blotting, a non-specific antibody may bind to proteins other than the target. Verify antibody specificity and optimize antibody concentration to reduce high background or non-specific signals [83].
- Incomplete Denaturation: If samples are not properly heated in SDS-PAGE sample buffer, protein complexes may not fully dissociate, leading to high molecular weight aggregates or irregular bands [36].
Experimental Protocols: Correlating Gel Percentage with Analytical Outcomes
Detailed Protocol: Optimizing mRNA Analysis Using Capillary Gel Electrophoresis
The integrity of mRNA therapeutics is critically dependent on accurate chain-length distribution analysis. The following protocol, adapted from recent research, demonstrates how systematic optimization of gel polymer concentration directly impacts the resolution and quality of downstream results [81] [82].
Key Research Reagent Solutions:
- Sieving Polymer: A replaceable, entangled polymer network (e.g., polyvinylpyrrolidone-based) for capillary gel electrophoresis.
- Denaturant: A chemical additive (e.g., formamide) to maintain RNA in a single-stranded state.
- Fluorescent Dye: An intercalating dye compatible with laser-induced fluorescence detection.
- Running Buffer: An appropriate alkaline buffer to maintain denaturing conditions.
Methodology:
- Sample Preparation: Dilute mRNA samples in a nuclease-free buffer. For comparison, use a known mRNA vaccine standard.
- Parameter Optimization: Systematically vary key analytical parameters:
- Gel Polymer Concentration: Test a range to find the optimal sieving for the target mRNA length (e.g., ~4,000 nucleotides).
- Capillary Temperature: Evaluate temperatures between 20-50°C to influence RNA conformation and separation efficiency.
- Denaturant Concentration: Optimize the concentration to prevent secondary structure formation without degrading the RNA.
- Preheating Treatment: Apply a controlled heat denaturation step prior to injection to ensure complete unfolding.
- Capillary Electrophoresis Run: Perform separations using a capillary gel electrophoresis system with fluorescence detection.
- Data Analysis: Compare the resolution of full-length mRNA from shortmer and longmer impurities under different conditions. The separation quality is quantified by the baseline resolution between peaks.
Expected Outcome: Under optimized conditions (e.g., specific gel concentration and capillary temperature), RNAs of approximately 4,000 nucleotides can be effectively separated from defective RNAs differing by ≥200 nucleotides. This level of resolution is superior to conditions recommended in general guidelines and is essential for accurate quality control of mRNA therapeutics [81].
Detailed Protocol: Protein Immuno-PAGE with Online Fluorescence Imaging
This novel 2025 protocol illustrates how gel percentage selection is integral to a quantitative immunoassay, directly affecting the accuracy of downstream protein quantification [84].
Methodology:
- Immunocomplex Formation: Incubate the target protein (e.g., human transferrin) with a fluorescein isothiocyanate (FITC)-labeled antibody. Formaldehyde is used to cross-link the complex, stabilizing it for electrophoresis.
- Gel Electrophoresis: Load the cross-linked immunocomplexes onto a pre-cast polyacrylamide gel (e.g., 4%-20% gradient gel). A gradient gel is ideal as it provides a broad separation range in a single run.
- Online Fluorescence Imaging: During electrophoresis, use an online fluorescence imaging system to capture real-time data. This avoids the need for post-electrophoresis processing like staining and destaining, which can cause band diffusion.
- Quantitative Analysis: The key principle is that the fluorescence signal from the free antibody band is inversely proportional to the target protein concentration. Analyze the gel images with software like ImageJ to measure the fluorescence intensity of the free antibody bands.
- Calibration Curve: Generate a standard curve by plotting the known antigen concentrations against the measured free antibody fluorescence signals.
Correlation with Gel Percentage: The use of a 4%-20% gradient gel ensures that the large immunocomplexes, the free antibodies, and other protein components are effectively resolved. Poor resolution due to an incorrect gel percentage would lead to overlapping bands, making it impossible to accurately quantify the free antibody and, consequently, the target protein. This method demonstrated a wide linear range (5.0–200.0 mg/L) and excellent recovery rates (98.2%–105.0%), validating the effectiveness of the chosen separation conditions [84].
Visualizing the Optimization Workflow
The following diagram illustrates the decision-making process for selecting and optimizing gel percentage to achieve high-quality downstream analytical results.
Optimization Workflow for Gel Electrophoresis
The Scientist's Toolkit: Essential Reagents and Materials
Table 3: Key Research Reagent Solutions for Gel Electrophoresis
| Item | Function / Role in Experiment |
|---|---|
| Polyacrylamide Gel | A chemical polymer matrix with uniform, adjustable pore size for high-resolution separation of proteins and small nucleic acids [36]. |
| Agarose Gel | A polysaccharide polymer matrix used for the separation of larger nucleic acid fragments (100 bp to >25 kb) [36]. |
| SDS (Sodium Dodecyl Sulfate) | An ionic detergent that denatures proteins and imparts a uniform negative charge, allowing separation based primarily on molecular weight in SDS-PAGE [36]. |
| Loading Dye | A colored, dense solution for visualizing sample loading and tracking migration progress during the run. Contains a marker dye like bromophenol blue [84]. |
| Molecular Weight Ladder | A mixture of molecules of known sizes loaded alongside samples to estimate the molecular weight of unknown bands [36]. |
| Fluorescent Stain (e.g., SYBR Green, Coomassie Blue) | A dye that intercalates with nucleic acids or binds to proteins, allowing visualization under specific light (UV or white light) [61] [36]. |
| Transfer Buffer | A specially formulated buffer used in Western blotting to facilitate the transfer of proteins from the gel onto a membrane [83]. |
| Capillary Gel Electrophoresis System | An automated, high-resolution system using polymer-filled capillaries for sieving, enabling quantitative analysis of macromolecules like mRNA and proteins [81] [85]. |
Conclusion
Selecting the optimal gel percentage is a critical, foundational step that dictates the success of protein separation by SDS-PAGE. A methodical approach—from understanding core principles to applying tailored protocols and rigorous troubleshooting—is essential for obtaining clear, reproducible, and interpretable results. Mastering this technique not only improves the daily analysis of proteins but also strengthens the validity of downstream applications like western blotting, which is crucial for advancing drug discovery, diagnostics, and fundamental biomedical research. Future directions will likely involve further integration of automated systems and refined chemistries that push the limits of resolution and sensitivity for characterizing complex proteomes.
References
- 1. Overview of SDS-PAGE [https://www.creative-proteomics.com/resource/overview-of-sds-page.htm]
- 2. Can a Charged Surfactant Unfold an Uncharged Protein? [https://pmc.ncbi.nlm.nih.gov/articles/PMC6289093/]
- 3. SDS-Page - Ask A Biologist [https://askabiologist.asu.edu/sds-page]
- 4. SDS-PAGE guide: Sample preparation to analysis [https://www.abcam.com/en-us/knowledge-center/western-blot/sds-page-guide]
- 5. 6 Best Tips for Troubleshooting Poor Band Separation on ... [https://azurebiosystems.com/blog/6-tips-for-troubleshooting-poor-band-separation-on-sds-page-gels/]
- 6. SDS protein interactions [https://www.sciencedirect.com/science/article/abs/pii/S0301462225001462]
- 7. Troubleshooting SDS-PAGE Gel Running Issues [https://www.goldbio.com/blogs/articles/troubleshooting-sds-page-gel-running-issues?srsltid=AfmBOoo8WJeCyVFxE_VyybUAoo7oufKPmnlYMCDYILx1PYu1_tI5VEoL]
- 8. Troubleshooting Sodium Dodecyl Sulfate- Polyacrylamide ... [https://www.hycultbiotech.com/sds-page/troubleshooting/]
- 9. Polyacrylamide gel electrophoresis [https://en.wikipedia.org/wiki/Polyacrylamide_gel_electrophoresis]
- 10. Overview of Protein Electrophoresis [https://www.thermofisher.com/us/en/home/life-science/protein-biology/protein-biology-learning-center/protein-biology-resource-library/pierce-protein-methods/overview-electrophoresis.html]
- 11. Native SDS-PAGE: High Resolution Electrophoretic ... [https://pmc.ncbi.nlm.nih.gov/articles/PMC4517606/]
- 12. SDS-PAGE Optimization for Western Blot [https://www.bosterbio.com/protocol-and-troubleshooting/western-blotting-optimization/sds-page?srsltid=AfmBOorjYiDFty6TPJSP17xNUKzXb2B6DEMNsfPJeCEUSZ3KV93YOZEI]
- 13. Electrophoresis of DNA in agarose gels, polyacrylamide ... [https://pmc.ncbi.nlm.nih.gov/articles/PMC2757927/]
- 14. Polysaccharide as a Separation Medium for Gel ... [https://www.mdpi.com/2673-4176/5/3/24]
- 15. Agarose Gel Electrophoresis - an overview [https://www.sciencedirect.com/topics/materials-science/agarose-gel-electrophoresis]
- 16. The principle and method of polyacrylamide gel ... [https://www.mblbio.com/bio/g/support/method/sds-page.html]
- 17. One-Dimensional SDS and... | Thermo Fisher Scientific - DJ [https://www.thermofisher.com/dj/en/home/references/protocols/proteins-expression-isolation-and-analysis/sds-page-protocol/one-dimensional-sds-and-non-denaturing-gel-electrophoresis.html]
- 18. SDS-PAGE: The science behind all those bubbles [https://www.antibodiesinc.com/pages/sds-page-demystified?srsltid=AfmBOopZihtsujbhTyUblafOdVQ3p50u5pUprCux_2fGuvt6NL-Jco8X]
- 19. How SDS-PAGE Works: 7 Key Points Every Scientist ... [https://bitesizebio.com/580/how-sds-page-works/]
- 20. Novex Tris-Glycine Gels [https://www.thermofisher.com/us/en/home/life-science/protein-biology/protein-gel-electrophoresis/protein-gels/novex-tris-glycine-gels.html]
- 21. Buffer Preparation — Hints, Tips and Common Errors [https://www.chromatographyonline.com/view/buffer-preparation-hints-tips-and-common-errors-0]
- 22. SDS-PAGE Optimization for Western Blot [https://www.bosterbio.com/protocol-and-troubleshooting/western-blotting-optimization/sds-page?srsltid=AfmBOorcJAbUXFxLExKdLTMTI1y7y-NFVBKl95Pwm1ASHqTheiHPi7Y7]
- 23. SDS-PAGE: The science behind all those bubbles [https://www.antibodiesinc.com/pages/sds-page-demystified?srsltid=AfmBOop7tqeRy5yXZ4o3bZCLbeh5Qp88esyyWLSuDpJioAX6jcj6bg6d]
- 24. Western Blot SDS-PAGE [https://www.novusbio.com/support/support-by-application/western-blot-sds-page?srsltid=AfmBOoqxN4pMpwoA5kAnDcpdCHcqXAGGfuG5Xx8swk_10HSkdjzaO_ov]
- 25. Electrophoresis in western blot [https://www.abcam.com/en-us/technical-resources/guides/western-blot-guide/electrophoresis]
- 26. An Easy SDS - PAGE Recipe & 10-Step Gel Protocol [https://bitesizebio.com/59429/sds-page-gel-recipe/]
- 27. - SDS Optimization Tips & Guide | Boster Bio PAGE [https://www.bosterbio.com/protocol-and-troubleshooting/western-blotting-optimization/sds-page]
- 28. Troubleshooting SDS-PAGE Gel Running Issues [https://www.goldbio.com/blogs/articles/troubleshooting-sds-page-gel-running-issues?srsltid=AfmBOorEiDqrT63P9NA-5crX7LycjFNCUW07GqtvLQSAV79RRVl457PL]
- 29. Coomassie Staining SDS-PAGE: Common Issues & Fixes [https://thesiliconreview.com/2025/05/troubleshooting-coomassie-blue-staining-in-sds-page-common-issues-and-fixes]
- 30. Protein Stains Support—Troubleshooting [https://www.thermofisher.com/us/en/home/technical-resources/technical-reference-library/protein-electrophoresis-western-blotting-support-center/protein-stains-support/protein-stains-support-troubleshooting.html]
- 31. A Guide to Gradient Gels: The Why's and How's [https://bitesizebio.com/47184/gradient-gels/]
- 32. Successful Transfer High Molecular Weight Proteins during ... [https://www.thermofisher.com/us/en/home/life-science/protein-biology/protein-biology-learning-center/protein-biology-resource-library/protein-biology-application-notes/successful-transfer-high-mw-proteins-western-blotting.html]
- 33. Western blotting guide: Part 2, Protein separation by SDS- ... [https://www.jacksonimmuno.com/secondary-antibody-resource/technical-tips/western-blotting-guide-part-2/]
- 34. Tips for Optimal SDS-PAGE Separation [https://www.rockland.com/resources/tips-for-optimal-sds-page-separation/?srsltid=AfmBOorTJTElM4b8gorQV0d7Q9a97xhRcjeBIsnJCR0asGq4-OgkZyWa]
- 35. Troubleshooting and Optimizing a Western Blot [https://blog.addgene.org/troubleshooting-and-optimizing-a-western-blot]
- 36. Mastering Electrophoresis: Techniques, Equipment, and ... [https://www.labx.com/resources/mastering-electrophoresis-techniques-equipment-and-applications-in-dna-rna-and-protei/5535]
- 37. Comparison of in-gel protein separation techniques ... [https://pmc.ncbi.nlm.nih.gov/articles/PMC4234072/]
- 38. Is Heating Sample Skippable for Western Blotting? [https://www.biossusa.com/blogs/news/is-heating-sample-skippable-for-western-blotting?srsltid=AfmBOopBVBiXyZAneWa3oPyrXEdyXF0v77ruatmzT8OXFe5hXKK3FODP]
- 39. Western Blot: Technique, Theory, and Trouble Shooting [https://pmc.ncbi.nlm.nih.gov/articles/PMC3456489/]
- 40. Western Blot Sample Preparation Protocol [https://www.thermofisher.com/us/en/home/life-science/protein-biology/protein-biology-learning-center/protein-gel-electrophoresis-information/western-blot-protocols/western-blot-sample-preparation.html]
- 41. Western Blot Troubleshooting [https://www.thermofisher.com/us/en/home/life-science/protein-biology/protein-biology-learning-center/protein-gel-electrophoresis-information/western-blot-troubleshooting.html]
- 42. Western Blot Troubleshooting Guide [https://www.bio-techne.com/resources/protocols-troubleshooting/western-blotting-troubleshooting]
- 43. Western Blotting Troubleshooting Guide [https://www.cellsignal.com/learn-and-support/troubleshooting/western-blot-troubleshooting-guide?srsltid=AfmBOor2taaRpNWkaOtslDHXO_wVJ3Br8eZqcPyywUWPAsW70QY-KIUe]
- 44. Choose a Molecular Weight Marker Wisely [https://www.licorbio.com/blog/choosing-a-molecular-weight-marker]
- 45. Western Blot Troubleshooting | Thermo Fisher Scientific - MX [https://www.thermofisher.com/mx/es/home/life-science/protein-biology/protein-biology-learning-center/protein-gel-electrophoresis-information/western-blot-troubleshooting.html]
- 46. Western Blot SDS-PAGE [https://www.novusbio.com/support/support-by-application/western-blot-sds-page?srsltid=AfmBOooZJ4ioezzFomkbFkPAxT37OBU7Oze-mzrBBpEiLxYD6GNnInhK]
- 47. Tips for Troubleshooting Problems Gel Electrophoresis [https://www.linkedin.com/advice/3/how-can-you-troubleshoot-issues-gel-electrophoresis-wnvof]
- 48. Troubleshooting SDS-PAGE Gel Running Issues [https://www.goldbio.com/blogs/articles/troubleshooting-sds-page-gel-running-issues?srsltid=AfmBOopQagGIE5WXWY2TMvHgfu5oLTSrr1eQzFyLnExl9RNOk8GtDF5_]
- 49. Troubleshooting SDS-PAGE Sample Preparation Issues [https://www.goldbio.com/blogs/articles/troubleshooting-sds-page-sample-preparation-issues?srsltid=AfmBOooe4hpa_384k-4U-y-v8qHNfh7wR9MPL-AYstQiNDNdzpqVJynW]
- 50. SDS-PAGE带出现纹理现象的原因以及解决方法 [https://www.instrument.com.cn/application/Solution-964099.html]
- 51. Western Blot SDS-PAGE [https://www.novusbio.com/support/support-by-application/western-blot-sds-page?srsltid=AfmBOooXpvaqvIUqfRy5epVlmwrU8fP-3W8XS-yV0LRKdKYWvxCUi_ay]
- 52. SDS-PAGE: The science behind all those bubbles [https://www.antibodiesinc.com/pages/sds-page-demystified?srsltid=AfmBOooHw4ajeYy3c5jxlmfR7Fo0UjrzKQHCmHd_ThOR2FBSyxy-tqOA]
- 53. Mastering Gel Electrophoresis: 10 Tips and Tricks for ... [https://americanlaboratorytrading.com/mastering-gel-electrophoresis-10-tips-and-tricks-for-successful-results/?srsltid=AfmBOoqhPFxUvCK5Q6xz_ykyo6RpYNGyl8o9i8YRBSur1MDm9B53ibbi]
- 54. Optimizing Gel Electrophoresis: Best Practices for Sample ... [https://www.gelepchina.com/news/optimizing-gel-electrophoresis-best-practices-for-sample-volume-voltage-and-timing/]
- 55. Five Considerations for the Nucleic Acid Gel ... [https://www.thermofisher.com/us/en/home/life-science/cloning/cloning-learning-center/invitrogen-school-of-molecular-biology/na-electrophoresis-education/na-electrophoresis-considerations.html]
- 56. How to Identify or Screen Protein Modification Sites [https://www.creative-proteomics.com/ptms-proteomics/resource-how-to-identify-or-screen-protein-modification-sites.htm]
- 57. Isoelectric Point for Protein Analysis and ... [https://www.creative-proteomics.com/blog/isoelectric-point-protein-analysis.htm]
- 58. Understanding the Isoelectric Point of Proteins [https://www.metwarebio.com/protein-isoelectric-point-analysis/]
- 59. Western Blot: The Complete Guide [https://www.antibodies.com/applications/western-blotting]
- 60. Revealing protein sequence organization via contiguous ... [https://pmc.ncbi.nlm.nih.gov/articles/PMC10827107/]
- 61. Nucleic Acid Gel Electrophoresis Troubleshooting [https://www.thermofisher.com/us/en/home/life-science/cloning/cloning-learning-center/invitrogen-school-of-molecular-biology/na-electrophoresis-education/na-electrophoresis-troubleshooting.html]
- 62. GelGenie: an AI-powered framework for gel ... [https://www.nature.com/articles/s41467-025-59189-0]
- 63. Optimized SDS-Based Protocol for High-Quality RNA ... [https://pmc.ncbi.nlm.nih.gov/articles/PMC11858800/]
- 64. Gel Electrophoresis Steps [https://azurebiosystems.com/blog/gel-electrophoresis-steps/]
- 65. SDS-PAGE Optimization for Western Blot [https://www.bosterbio.com/protocol-and-troubleshooting/western-blotting-optimization/sds-page?srsltid=AfmBOorOz2eAw27V70NMmFtHZwOF9DweSNQM5JjdegW4v2YYfhEMxl_S]
- 66. How to Minimize System Noise in Gel Electrophoresis ... [https://eureka.patsnap.com/report-how-to-minimize-system-noise-in-gel-electrophoresis-output]
- 67. Improving precision in gel electrophoresis by stepwisely ... [https://www.sciencedirect.com/science/article/abs/pii/S0731708509002696]
- 68. Tips for Optimal SDS-PAGE Separation | Rockland [https://www.rockland.com/resources/tips-for-optimal-sds-page-separation/]
- 69. Western Blotting: Products, Protocols, & Applications [https://www.thermofisher.com/us/en/home/life-science/protein-biology/protein-biology-learning-center/protein-biology-resource-library/pierce-protein-methods/overview-western-blotting.html]
- 70. Review Signal amplification strategies in ... [https://www.sciencedirect.com/science/article/abs/pii/S1385894723054190]
- 71. Western blot protocol [https://www.abcam.com/en-us/technical-resources/protocols/western-blot]
- 72. DNA Electrophoresis vs Protein Electrophoresis [https://blog.edvotek.com/2025/07/24/dna-electrophoresis-vs-protein-electrophoresis/]
- 73. Trends development and applications on electrophoresis ... [https://www.sciencedirect.com/science/article/abs/pii/S0039914025005193]
- 74. Troubleshooting SDS-PAGE Gel Running Issues [https://www.goldbio.com/blogs/articles/troubleshooting-sds-page-gel-running-issues?srsltid=AfmBOorEicQWN1adWjbLmv07sDFdkZeASYo-j6FVqStiLJeoRoCbb74y]
- 75. Common artifacts and mistakes made in electrophoresis [https://pmc.ncbi.nlm.nih.gov/articles/PMC7295095/]
- 76. Western Blot Transfer Methods [https://www.thermofisher.com/us/en/home/life-science/protein-biology/protein-biology-learning-center/protein-biology-resource-library/pierce-protein-methods/western-blot-transfer-methods.html]
- 77. Western Blot - StatPearls - NCBI Bookshelf - NIH [https://www.ncbi.nlm.nih.gov/books/NBK542290/]
- 78. Troubleshooting SDS-PAGE Gel Running Issues [https://www.goldbio.com/blogs/articles/troubleshooting-sds-page-gel-running-issues?srsltid=AfmBOopHpz4KP7SFAbul9Nnwg6Qf_YSqEHeinGa9ydvD5i1zaJ1Qm6GP]
- 79. Troubleshooting SDS-PAGE Sample Preparation Issues [https://www.goldbio.com/blogs/articles/troubleshooting-sds-page-sample-preparation-issues?srsltid=AfmBOopxCCU11lSeuqiQb6duGk-AHW2gwaIopTrsUgRq1cxvuF59gqXH]
- 80. 核酸电泳常见问题及疑难解答 - 赛默飞 [https://www.thermofisher.cn/cn/zh/home/life-science/cloning/cloning-learning-center/invitrogen-school-of-molecular-biology/na-electrophoresis-education/na-electrophoresis-troubleshooting.html]
- 81. Analytical factors for optimization of chain-length ... [https://www.sciencedirect.com/science/article/pii/S002196732500367X]
- 82. Optimizing mRNA Analysis Using Capillary Electrophoresis [https://www.chromatographyonline.com/view/optimizing-mrna-analysis-using-capillary-electrophoresis]
- 83. Western Blot 常见问题与解决方案:蛋白质分析实验优化指南 [https://www.abinscience.cn/archive/192.html]
- 84. 基于聚丙烯酰胺凝胶电泳结合在线荧光成像的蛋白质特异性 ... [https://pmc.ncbi.nlm.nih.gov/articles/PMC12412021/]
- 85. Separation and analysis of proteins by capillary ... [https://www.sciencedirect.com/science/article/abs/pii/S0003267025007172]