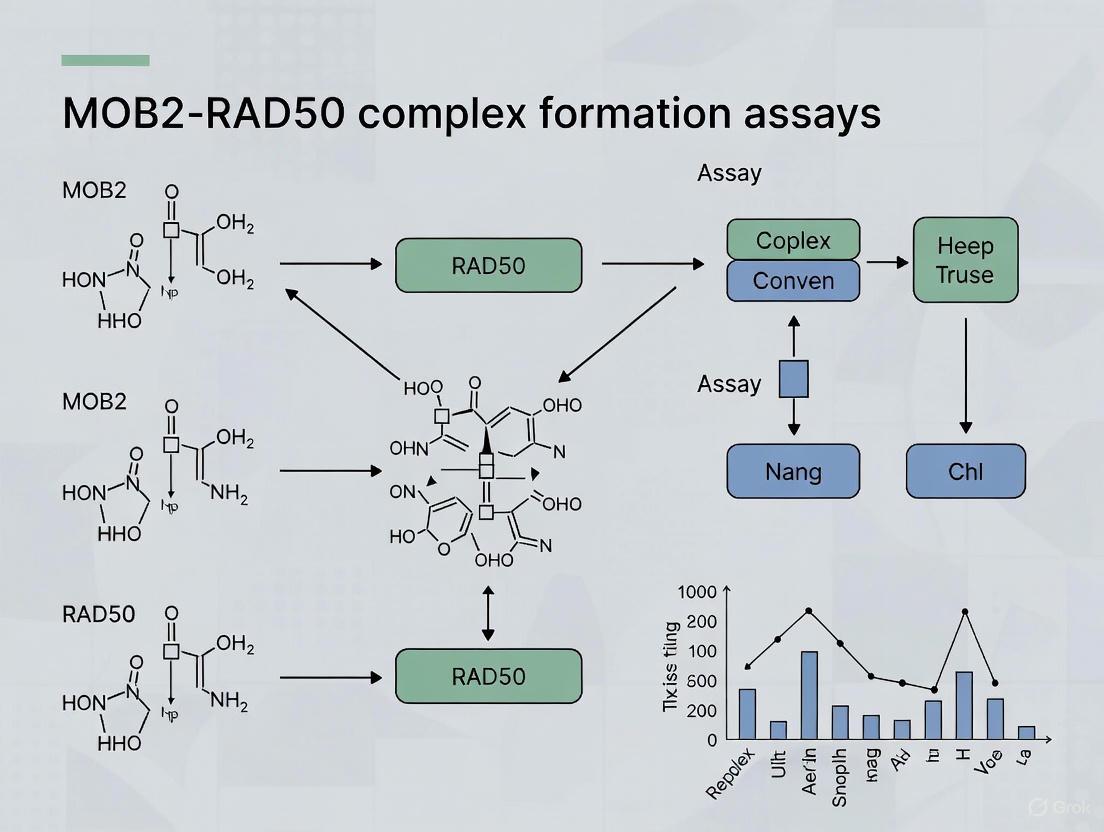
Optimizing MOB2-RAD50 Complex Assays: A Guide for DNA Repair Research and Therapeutic Development
This article provides a comprehensive methodological guide for researchers and drug development professionals aiming to study the MOB2-RAD50 protein complex, a key interaction in the DNA Damage Response (DDR).
Optimizing MOB2-RAD50 Complex Assays: A Guide for DNA Repair Research and Therapeutic Development
Abstract
This article provides a comprehensive methodological guide for researchers and drug development professionals aiming to study the MOB2-RAD50 protein complex, a key interaction in the DNA Damage Response (DDR). We cover the foundational biology of the MOB2-RAD50-MRN complex in homologous recombination repair and its implications in cancer cell survival and therapy resistance. The content details established and emerging assay techniques, offers robust troubleshooting and optimization strategies, and outlines rigorous validation protocols. By enabling reliable assessment of this complex, the guide aims to support the development of novel cancer therapeutics, including PARP inhibitor combination strategies and biomarker discovery.
The MOB2-RAD50 Axis: Unraveling Its Core Role in DNA Damage Repair and Cancer Biology
Understanding MOB Proteins and the MOB2-RAD50 Complex
What are MOB proteins and why are they important in cancer research?
MOB (Mps one binder) proteins are a highly conserved family of eukaryotic scaffold proteins that function as critical signal transducers in essential intracellular pathways. They lack enzymatic activity but regulate key cellular processes through protein-protein interactions, particularly with members of the NDR/LATS kinase family. In humans, seven different MOB proteins (hMOB1A, hMOB1B, hMOB2, hMOB3A, hMOB3B, hMOB3C, and hMOB4) are encoded by distinct gene loci, each with specialized functions [1].
MOB proteins have gained significant attention in cancer research due to their roles as both tumor suppressors and oncogenic regulators. MOB1 functions as a core component of the Hippo pathway, acting as a tumor suppressor, while MOB2 has emerged as a significant regulator with dual functions in both kinase regulation and DNA damage response [1]. The discovery that MOB2 interacts with RAD50, a crucial component of the MRE11-RAD50-NBS1 (MRN) DNA damage sensor complex, has opened new avenues for understanding genomic instability in cancer and developing targeted therapies [2].
What is the functional significance of the MOB2-RAD50 interaction?
The MOB2-RAD50 interaction represents a critical interface between scaffold proteins and DNA damage repair machinery. Research has demonstrated that MOB2 directly binds to RAD50, facilitating the recruitment of the entire MRN complex and activated ATM kinase to DNA damage sites [2]. This interaction is essential for proper DNA damage response signaling, cell cycle checkpoint activation, and ultimately cell survival following genotoxic stress.
Table: Core Components of the MOB2-RAD50-DNA Damage Response Axis
| Component | Function | Cellular Role |
|---|---|---|
| MOB2 | Scaffold protein | Regulates NDR kinases, promotes RAD50 function, integrates cAMP/PKA signaling |
| RAD50 | DNA damage sensor | ATPase-dependent DNA binding, bridge formation between DNA ends |
| MRE11 | Nuclease | DNA end resection, repair initiation |
| NBS1 | Adaptor protein | Recruits ATM, facilitates complex assembly |
| ATM | Kinase | Master regulator of DNA damage signaling |
The biological importance of this interaction is underscored by clinical findings that RAD50 deficiencies in humans are associated with bone marrow failure and immunodeficiency disorders, highlighting the critical nature of proper MRN complex function in maintaining tissue homeostasis [3].
Essential Reagents and Experimental Setup
Research Reagent Solutions for MOB2-RAD50 Complex Studies
Table: Key Research Reagents for MOB2-RAD50 Complex Formation Assays
| Reagent Category | Specific Examples | Function/Application |
|---|---|---|
| Cell Lines | RPE1-hTert, U2-OS, LN-229, T98G, SF-539, SF-767 | Model systems for studying MOB2 expression and function [4] [2] |
| Molecular Tools | pLEXA-N-hMOB2 (full-length), pTER shRNA constructs, pCDH-MOB2 overexpression vectors | Genetic manipulation of MOB2 expression [4] [2] |
| Antibodies | Anti-MOB2, Anti-RAD50, Anti-V5 tag, Anti-phospho-ATM substrates | Detection and immunoprecipitation of complex components [4] [2] |
| Chemical Modulators | Forskolin (cAMP activator), H89 (PKA inhibitor), Doxorubicin (DNA damage inducer) | Pathway modulation to study signaling interactions [4] [2] |
| Assay Systems | Chick Chorioallantoic Membrane (CAM) model, Mouse xenografts, Clonogenic survival assays | In vivo and in vitro functional validation [4] |
What are the optimal cell culture conditions for MOB2-RAD50 complex studies?
For consistent results in MOB2-RAD50 interaction studies, maintain the following conditions:
- Cell Lines: RPE1-hTert, U2-OS, and GBM lines (LN-229, T98G, SF-539, SF-767) are well-characterized models [4] [2]
- Media Formulations: Use DMEM supplemented with 10% fetal calf serum for most lines. For BJ-hTert fibroblasts, use DMEM:Medium199 (4:1) with 10% FCS and Gentamicin (50 μg/ml) [2]
- Transfection Protocols: Utilize Fugene 6, Lipofectamine RNAiMax, or Lipofectamine 2000 according to manufacturer instructions for plasmid and siRNA delivery [2]
- Selection Antibiotics: Employ appropriate concentrations of blasticidin, zeocin, puromycin, or G418 for maintaining stable cell lines [2]
Step-by-Step Experimental Protocols
Protocol 1: Co-Immunoprecipitation of Endogenous MOB2-RAD50 Complex
Purpose: To isolate and detect native MOB2-RAD50 complexes from cell lysates.
Reagents Required:
- Lysis Buffer: 50 mM Tris-HCl (pH 7.5), 150 mM NaCl, 1% NP-40, 5 mM EDTA, supplemented with fresh protease and phosphatase inhibitors
- Antibodies: Anti-MOB2 antibody, species-matched control IgG, Protein A/G beads
- Wash Buffer: 50 mM Tris-HCl (pH 7.5), 150 mM NaCl, 0.1% NP-40
- Elution Buffer: 1X SDS sample buffer
Procedure:
- Culture approximately 5×10^6 cells per condition until 80-90% confluent
- Wash cells with ice-cold PBS and lyse in 500 μL lysis buffer for 30 minutes at 4°C with gentle agitation
- Clear lysates by centrifugation at 16,000 × g for 15 minutes at 4°C
- Pre-clear supernatant with 20 μL Protein A/G beads for 30 minutes at 4°C
- Incubate pre-cleared lysate with 2-4 μg anti-MOB2 antibody or control IgG overnight at 4°C
- Add 30 μL Protein A/G beads and incubate for 2-4 hours at 4°C
- Wash beads 4 times with 500 μL wash buffer
- Elute bound proteins with 40 μL 1X SDS sample buffer by heating at 95°C for 5 minutes
- Analyze by immunoblotting using anti-RAD50 and anti-MOB2 antibodies [2]
Protocol 2: Monitoring DNA Damage-Dependent MOB2-RAD50 Recruitment
Purpose: To assess MOB2 and RAD50 recruitment to chromatin following DNA damage induction.
Reagents Required:
- Buffer A: 10 mM Pipes, 100 mM NaCl, 300 mM sucrose, 3 mM MgCl2, 5 mM EDTA, 1 mM EGTA, 50 mM NaF, 0.1 mM Na3VO4, 0.1% Triton X-100, plus protease inhibitors
- Buffer B: 3 mM EDTA, 0.2 mM EGTA, plus protease inhibitors
- DNA Damage Inducers: Doxorubicin (1-5 μM) or ionizing radiation (2-10 Gy)
- Benzonase nuclease (optional)
Procedure:
- Treat cells with DNA damage inducers or vehicle control for appropriate durations
- Harvest cells with ice-cold PBS, centrifuge at 1,000 × g for 2 minutes at 4°C
- Resuspend cell pellet in Buffer A and incubate for 10 minutes on ice
- Centrifuge at 1,300 × g for 5 minutes at 4°C; collect supernatant as cytosolic fraction
- Wash pellet once with Buffer A, then lyse in Buffer B for 10 minutes at 4°C
- Centrifuge at 1,700 × g for 5 minutes at 4°C; collect supernatant as chromatin-bound fraction
- Optional: Treat chromatin fraction with Benzonase to release tightly-associated proteins
- Analyze both fractions by immunoblotting for MOB2, RAD50, and chromatin markers (e.g., histone H3) [2]
Troubleshooting Common Experimental Issues
Why do I observe inconsistent MOB2-RAD50 co-immunoprecipitation results?
Potential Causes and Solutions:
Problem: Low complex stability during lysis Solution: Optimize lysis conditions by reducing detergent concentration (0.5-0.8% NP-40), shorten lysis time (15-20 minutes), and maintain consistent temperature (4°C throughout)
Problem: Endogenous complex disruption in overexpression systems Solution: Use inducible expression systems with tight regulation (tetracycline-inducible), titrate expression to near-physiological levels, and include multiple time points post-induction [2]
Problem: DNA damage-dependent variability Solution: Standardize DNA damage induction protocols with precise dosages (e.g., doxorubicin concentration, IR dose), include time course experiments, and use appropriate damage controls
How can I enhance detection of chromatin-associated MOB2-RAD50?
Optimization Strategies:
- Fractionation Validation: Always verify fractionation efficiency using cytoplasmic (tubulin), nuclear (lamin), and chromatin (histone H3) markers
- Nuclease Treatment: Incorporate Benzonase (25-50 U/mL) or micrococcal nuclease treatment to release tightly chromatin-bound complexes
- Cross-linking: For transient interactions, consider mild formaldehyde cross-linking (0.1-0.3% for 5-10 minutes) followed by quenching
- Salt Optimization: Test different salt concentrations (150-300 mM NaCl) in wash buffers to reduce non-specific binding while preserving specific interactions
Data Interpretation and Validation
What controls are essential for validating MOB2-RAD50 interactions?
Table: Critical Experimental Controls for MOB2-RAD50 Studies
| Control Type | Purpose | Expected Outcome |
|---|---|---|
| IgG Control | Non-specific antibody binding | No detectable MOB2 or RAD50 in immunoprecipitate |
| MOB2 Depletion | Specificity of interaction | Reduced RAD50 co-precipitation with MOB2 knockdown |
| RAD50 Mutants | Functional domain mapping | Identification of MOB2-binding deficient RAD50 variants [2] |
| DNA Damage Induction | Pathway context dependency | Enhanced complex formation after genotoxic stress |
| Cellular Fractionation | Subcellular localization | Chromatin enrichment after DNA damage |
How do I distinguish between direct and indirect MOB2-RAD50 interactions?
Experimental Approaches:
- Yeast Two-Hybrid Analysis: Screen for direct interactions using full-length and domain fragments of both proteins [2]
- Reconstitution Assays: Purify recombinant MOB2 and RAD50 proteins for in vitro binding studies
- Domain Mapping: Test interaction with RAD50 truncation mutants to identify essential binding domains
- Competition Experiments: Assess whether MOB2 binding competes with known RAD50 interactors
The original yeast two-hybrid screen that identified the MOB2-RAD50 interaction revealed that RAD50 was one of only four novel binding partners identified multiple times, supporting the biological significance of this direct interaction [2].
Technical FAQs
Can MOB2 function independently of NDR kinases in DNA damage response?
Yes. Research has demonstrated that MOB2's role in DNA damage response operates through mechanisms independent of its established NDR kinase regulatory functions. Several key observations support this conclusion:
- MOB2 still promotes DDR signaling, cell survival, and cell cycle checkpoint activation even when NDR manipulations do not produce similar phenotypes [2]
- The MOB2-RAD50 interaction facilitates recruitment of the MRN complex and activated ATM to DNA damage sites independently of NDR signaling [2]
- MOB2 mutants defective in NDR binding can still rescue certain cellular phenotypes, indicating separable functional domains [4]
What is the relationship between MOB2's role in cancer and DNA damage response?
MOB2 appears to function as a tumor suppressor through dual mechanisms that converge on genomic stability:
FAK/Akt Pathway Regulation: MOB2 negatively regulates the FAK/Akt pathway involving integrin, thereby suppressing migration and invasion in glioblastoma models [4]
DNA Damage Response: Through its interaction with RAD50, MOB2 supports proper DNA damage signaling and repair, preventing accumulation of genomic instability [2]
cAMP/PKA Integration: MOB2 participates in cAMP/PKA signaling-mediated inhibition of cell migration and invasion, positioning it as an integrator of multiple cancer-relevant pathways [4]
How does MOB2 expression correlate with cancer patient outcomes?
Clinical evidence demonstrates significant correlation between MOB2 expression and cancer progression:
- Glioblastoma: MOB2 is significantly downregulated at both mRNA and protein levels in GBM compared to low-grade gliomas and normal brain tissue [4]
- Survival Analysis: Low MOB2 expression significantly correlates with poor prognosis in glioma patients based on TCGA data analysis [4]
- Therapeutic Implications: MOB2 deficiency may sensitize cells to specific DNA damaging agents, suggesting potential for biomarker-driven therapy selection
These clinical correlations underscore the importance of understanding MOB2-RAD50 complex formation and function in the context of cancer biology and therapeutic development.
Frequently Asked Questions (FAQs)
Q1: What is the primary function of the MRN complex in the DNA Damage Response (DDR)? The MRE11-RAD50-NBS1 (MRN) complex is a primary sensor for DNA double-strand breaks (DSBs). Its core functions include detecting and binding to broken DNA ends, processing these ends via its nuclease activities, tethering DNA ends to prevent their separation, and activating the central DDR kinase, ATM. Through these actions, it orchestrates the initial cellular response to one of the most lethal forms of DNA damage [5] [6].
Q2: My co-immunoprecipitation (Co-IP) assay shows weak RAD50-hMOB2 interaction. What could be the cause? Weak interaction signals can arise from several factors:
- Indirect Nature of the Interaction: hMOB2 interacts with the RAD50 subunit of the pre-formed MRN complex [7]. Your Co-IP may be capturing this endogenous complex rather than a direct binary interaction. Confirm the presence of other MRN components (MRE11, NBS1) in your pull-down.
- Cell Lysis Conditions: The MRN complex is large and conformationally dynamic. Use gentle lysis buffers to preserve native protein structures and complex integrity. Avoid harsh detergents that might disrupt weaker or transient interactions.
- hMOB2 Competition: hMOB2 competes with hMOB1 for binding to the kinase STK38. Overexpression of hMOB1 could potentially sequester shared binding partners and indirectly affect your results [7].
Q3: What are the critical controls for a successful MRN complex formation assay? Essential controls for your experiment should include:
- Genetic Knockdown/Knockout: Use siRNA or knockout cell lines for MRE11, RAD50, or NBS1. A valid assay will show abolished complex formation in these conditions [8].
- Nuclease-Deficient Mutant: Include a nuclease-deficient MRE11 mutant (e.g., H129N). While it may not directly prevent complex assembly, it serves as a critical control for the functional output of the complex [9].
- ATM Inhibition: Treat cells with an ATM inhibitor (e.g., KU-55933). This tests the dependency of certain MRN complex functions and phosphorylation events on ATM activity [7].
Q4: How can I stabilize the MRN complex for in vitro studies? MRN complex stability is highly dependent on the coordinated expression and interaction of all three subunits.
- Co-expression: The most effective method is to co-express MRE11, RAD50, and NBS1 together in a baculovirus or mammalian system. Expressing subunits individually often leads to instability and poor yields, as the proteins rely on each other for stability [8].
- ATP Presence: Include non-hydrolyzable ATP analogs (e.g., ATPγS) in your purification buffers. RAD50's ATPase activity drives conformational changes, and stabilizing the ATP-bound state can help maintain a uniform complex structure [9].
Q5: Why do my MRE11 protein levels appear low in Western blots, despite normal mRNA levels? MRE11 expression is primarily regulated post-transcriptionally. Your observations are consistent with established biology. The protein stability of MRE11 is heavily dependent on its successful assembly into the MRN complex with RAD50 and NBS1. Low MRE11 protein, despite normal mRNA, typically indicates a failure in complex assembly, potentially due to low levels of RAD50 or NBS1, or the presence of post-transcriptional regulators like microRNAs (e.g., miR-153) that target MRE11 mRNA [8]. Always assess MRE11 at the protein level (e.g., via Western blot or IHC) for accurate quantification.
Troubleshooting Guide
This guide addresses common experimental issues related to the MRN complex and RAD50 interactions.
Table 1: Troubleshooting MRN Complex and RAD50 Assays
| Problem | Potential Cause | Suggested Solution |
|---|---|---|
| Low protein yield of recombinant MRN subunits | Instability of individual subunits; improper folding. | Co-express MRE11, RAD50, and NBS1 together in a single system to promote mutual stabilization [8]. |
| Inconsistent MRN complex activity in nuclease assays | Uncontrolled MRE11 nuclease activity; improper reaction conditions. | Use nuclease-deficient MRE11 mutants (e.g., H129N) as negative controls. Systematically optimize divalent cation (Mn2+ or Mg2+) concentration and pH [9] [10]. |
| Poor recruitment of MRN to damage sites | Disruption to upstream regulators; complex instability. | Investigate the status of the ATM-CHK2 axis and WDFY2, a protein that promotes MRN complex formation at DSBs [11]. Verify component integrity. |
| High background in DNA tethering assays | Non-specific protein-DNA interactions. | Increase salt concentration in the assay buffer gradually. Include non-specific competitor DNA (e.g., sheared salmon sperm DNA) to reduce background binding [12]. |
| Variable results in RAD50-hMOB2 interaction studies | The interaction is transient or context-dependent (e.g., DNA damage). | Induce DNA damage (e.g., with bleomycin or ionizing radiation) prior to lysis to stimulate the interaction. Ensure co-immunoprecipitation is performed under native conditions [7]. |
Research Reagent Solutions
Table 2: Essential Reagents for MRN Complex Research
| Reagent | Function/Application | Key Details |
|---|---|---|
| siRNA/shRNA Oligos | Genetic knockdown of MRN components (MRE11, RAD50, NBS1) or associated proteins (hMOB2, WDFY2). | Validated sequences are available in literature; e.g., hMOB2 siRNA sequences are available upon request from Qiagen [7]. |
| ATM Inhibitor (KU-55933) | A specific small-molecule inhibitor used to probe ATM-dependent signaling pathways downstream of the MRN complex. | Used at typical concentrations of 10-20 µM to block ATM kinase activity and its phosphorylation of MRN subunits [7]. |
| MRE11 Inhibitor (Mirin) | Inhibits MRE11 nuclease activity and blocks ATM activation, useful for dissecting MRN's catalytic functions. | Commonly used to study the role of MRE11 nuclease activity in HR and checkpoint signaling [8]. |
| DNA Damaging Agents | Induce DSBs to activate and recruit the MRN complex. Essential for functional assays. | Bleomycin: Directly causes DSBs.Mitomycin C (MMC): Causes DNA interstrand crosslinks, leading to replication fork collapse and DSBs [7]. |
| hMOB2 Antibodies | Detect hMOB2 expression and localization; used in Western blotting, immunofluorescence, and immunoprecipitation. | Rabbit monoclonal antibodies have been produced and described for specific detection [7]. |
| Non-hydrolyzable ATP (ATPγS) | Locks RAD50 in its ATP-bound, dimerized conformation, stabilizing the complex for structural studies. | Used in cryo-EM studies to resolve the ATP-bound state of the MRN complex [9]. |
Experimental Protocols
Protocol 1: Co-immunoprecipitation (Co-IP) for Analyzing hMOB2-MRN Interaction
Application: Confirming the physical interaction between hMOB2 and the MRN complex in cells.
Methodology:
- Cell Culture and Transfection: Culture relevant cell lines (e.g., U2OS, HCT116). Transfect with plasmids encoding hMOB2 or control vectors using a transfection reagent like Fugene 6 or Lipofectamine 2000 [7].
- DNA Damage Induction (Optional but recommended): To enhance the interaction, treat cells with a DNA-damaging agent such as bleomycin (e.g., at 10 µg/mL for several hours) or irradiate cells (e.g., 5-10 Gy) before harvesting [7].
- Cell Lysis: Lyse cells in a gentle, non-denaturing lysis buffer (e.g., RIPA buffer or NP-40 based buffer) supplemented with protease and phosphatase inhibitors. Keep samples on ice to preserve protein complexes.
- Immunoprecipitation: Incubate the cell lysate with an antibody against your target protein (e.g., anti-RAD50 or anti-hMOB2). Use a species-matched IgG as a negative control. Protein A/G beads are then added to capture the antibody-antigen complex.
- Washing and Elution: Wash the beads extensively with lysis buffer to remove non-specifically bound proteins. Elute the bound proteins by boiling in SDS-PAGE sample buffer.
- Analysis: Analyze the eluates by Western blotting. Probe for hMOB2, RAD50, MRE11, and NBS1 to confirm the specific co-precipitation of the entire MRN complex [7].
Protocol 2: Clonogenic Survival Assay with hMOB2 Deficiency
Application: Evaluating the functional consequence of hMOB2 loss on cell survival after DNA damage, particularly in response to PARP inhibitors.
Methodology:
- Gene Knockdown: Transduce or transfect cells with hMOB2-specific siRNA or shRNA to create a knockdown model. Always include a non-targeting scramble siRNA as a control [7].
- Cell Plating: Plate a defined number of cells (e.g., 200-1000, depending on expected toxicity) into multi-well plates. Ensure the cell density allows for the formation of distinct colonies.
- Drug Treatment: The next day, treat cells with a dose range of your DNA-damaging agent of interest. For hMOB2 studies, this is highly relevant for PARP inhibitors like Olaparib, Rucaparib, or Veliparib [7].
- Colony Formation: Incubate the cells for a period of 1-3 weeks, allowing them to proliferate and form colonies. Refresh the culture medium with or without drugs every 3-4 days.
- Staining and Counting: After incubation, fix the colonies with methanol or ethanol and stain with crystal violet. Count only colonies containing >50 cells.
- Data Analysis: Calculate the surviving fraction for each condition. The expected outcome is that hMOB2-deficient cells will show increased sensitivity (a lower surviving fraction) to PARP inhibitors compared to control cells, indicating a synthetic lethal interaction [7].
Signaling Pathway & Experimental Workflow
MRN-hMOB2 Signaling in DNA Double-Strand Break Repair
Experimental Workflow for hMOB2-MRN Functional Analysis
The discovery of the interaction between human MOB2 (hMOB2) and RAD50 was a pivotal advancement in understanding the cellular response to DNA damage. Prior to this finding, the biological functions of hMOB2, particularly in maintaining genomic integrity, were largely unknown. Through a targeted yeast two-hybrid (Y2H) screen, researchers identified RAD50, a core component of the MRE11-RAD50-NBS1 (MRN) complex, as a direct binding partner of hMOB2 [2] [13]. This interaction provides a mechanistic explanation for hMOB2's role in promoting DNA damage response (DDR) signaling and cell cycle progression [2] [14] [13].
Key Experimental Findings:
- The Y2H screen of a human tissue cDNA library using full-length hMOB2 as bait identified 28 putative interactors, with RAD50 being one of only four proteins identified multiple times, confirming a statistically significant interaction [2].
- This biochemical interaction facilitates the recruitment of the entire MRN complex and activated ATM kinase to sites of DNA damage, positioning hMOB2 as a novel regulator of early DDR signaling [2] [13].
- Functionally, hMOB2 deficiency causes accumulation of endogenous DNA damage, hypersensitivity to exogenous DNA-damaging agents, and impaired cell cycle checkpoint activation [2] [13] [7].
Experimental Protocols: The Yeast-Two-Hybrid Screen
The following section details the methodology used to discover the hMOB2-RAD50 interaction.
Detailed Y2H Screening Protocol
The original experiment employed a classic yeast two-hybrid approach, often referred to as the "interaction trap" [15].
Step-by-Step Workflow:
- Bait Construction: The full-length coding sequence of human MOB2 was cloned into a plasmid to create a fusion protein with a DNA-binding domain (DBD). This construct (pLexA-N-hMOB2) served as the "bait" [2].
- Prey Library: A "prey" library was used, consisting of human cDNA fragments from multiple tissues cloned into a plasmid to create fusion proteins with a transcriptional activation (TA) domain. The library had a high complexity of 2.8 x 10^6 clones with an average insert size of 1.58 kb [2].
- Co-Transformation & Selection: The bait plasmid and the prey library were co-introduced into a suitable yeast reporter strain. This strain contained a reporter gene (e.g., HIS3 or lacZ) whose expression was dependent on the interaction between the bait and prey proteins [2] [15].
- Screening: Approximately 1 x 10^6 yeast transformants were screened. Yeast colonies where a bait-prey interaction occurred were selected based on their ability to activate the reporter gene(s), such as growing on histidine-deficient media (if HIS3 was used) [2] [15].
- Identification of Positives: From the initial screen, 59 bait-dependent hits were obtained. The prey plasmids from these colonies were isolated and sequenced to identify the interacting proteins. RAD50 was identified in-frame in four independent hits, confirming it as a bona fide hMOB2 interactor [2].
The diagram below visualizes the core mechanism of the Yeast-Two-Hybrid system used in this discovery.
Validation & Follow-up Experiments
Following the initial Y2H screen, the interaction was validated in human cells using more physiologically relevant assays [2]:
- Co-Immunoprecipitation (Co-IP): The hMOB2-RAD50 interaction was confirmed by expressing the proteins in mammalian cell lines (e.g., COS-7), followed by immunoprecipitation and immunoblotting.
- Functional Analysis in DDR: The role of hMOB2 in the MRN complex was probed through chromatin fractionation experiments. These assays demonstrated that depleting hMOB2 with specific shRNAs impaired the recruitment of both the MRN complex and activated ATM to chromatin after induction of DNA damage.
The Scientist's Toolkit: Research Reagent Solutions
This table catalogs the key reagents essential for replicating the Y2H screen and subsequent validation studies.
| Reagent / Material | Function / Application | Specific Examples / Notes |
|---|---|---|
| Y2H Bait Plasmid | Expresses DBD-hMOB2 fusion protein. | pLexA-N-hMOB2 (used in the study) [2]. |
| Normalized Human cDNA Library | Source of "prey" genes for screening. | A normalized universal human tissue cDNA library in a vector like pGADT7-recAB was used [2]. |
| Yeast Reporter Strain | Host for transformation; contains reporter genes. | Should contain selectable markers like HIS3 or lacZ for interaction detection [15]. |
| siRNAs / shRNAs targeting hMOB2 | For functional knockdown of hMOB2 in human cells. | Qiagen siRNAs; pTER/-shRNA vectors for stable knockdown [2] [7]. |
| Antibodies for Validation | For Co-IP and immunoblotting to confirm the interaction. | Custom rabbit monoclonal anti-hMOB2; commercial antibodies against RAD50, MRE11, NBS1, ATM, and phospho-ATM (Ser1981) [2] [7]. |
| Cell Lines for Functional Assays | Model systems to study the biological role of the interaction. | RPE1-hTert, U2-OS, BJ-hTert fibroblasts, HCT116 [2] [7]. |
| DNA Damaging Agents | To induce DNA damage and probe MRN/hMOB2 function. | Doxorubicin, Ionizing Radiation (IR), Bleomycin, Mitomycin C [2] [7]. |
FAQs & Troubleshooting Guide
Q1: Our Y2H screen with hMOB2 yielded a high number of false positives. How can we increase the stringency of the assay?
- A: Implement multiple strategies to minimize false positives [15]:
- Include Controls: Always run a "prey-only" control to establish the baseline level of reporter activation.
- Vary Expression Levels: Overexpression can force non-physiological interactions. Use promoters that allow you to titrate down the expression levels of both bait and prey proteins.
- Independent Validation: Never rely solely on Y2H data. Confirm any identified interaction with an orthogonal method, such as co-immunoprecipitation in a mammalian cell line [2] [15].
Q2: We are unable to detect any interactors for hMOB2 in our Y2H screen, despite a positive control working. What could be the cause?
- A: This common problem, known as a false negative, can be addressed by [15]:
- Check Fusion Configuration: The fusion protein's structure might block the binding site. Clone and screen using both N-terminal and C-terminal fusions of hMOB2 to the DBD.
- Optimize Protein Expression: Ensure your bait protein is expressed and stable in yeast. Use immunoblotting with an antibody against the DBD or hMOB2 itself to confirm.
- Consider Post-Translational Modifications: If hMOB2 requires a specific modification to bind RAD50, this might not occur in yeast. Co-expressing the relevant kinase in the yeast strain might be necessary.
Q3: After validating the hMOB2-RAD50 interaction biochemically, how can we determine its functional significance in the DNA Damage Response?
- A: The established functional assays include [2] [7]:
- Chromatin Recruitment Assays: Perform chromatin fractionation followed by immunoblotting for MRN components (RAD50, MRE11) and activated ATM in control and hMOB2-depleted cells after inducing DNA damage.
- Cell Survival Assays: Use clonogenic assays to test if hMOB2 deficiency sensitizes cells to DSB-inducing agents like ionizing radiation or bleomycin.
- HR Repair Assays: Employ dedicated reporter assays (e.g., DR-GFP) to quantitatively measure Homologous Recombination efficiency upon hMOB2 knockdown [7].
Q4: What is the broader biological and clinical significance of the hMOB2-RAD50 interaction?
- A: This interaction positions hMOB2 as a novel supporter of genome integrity. Defects in this pathway have direct implications for cancer [2] [7]:
- Cancer Mechanism: hMOB2 loss leads to accumulated DNA damage and can trigger cell cycle arrest, suggesting a tumor-suppressive function. Its gene shows loss of heterozygosity in several carcinomas.
- Biomarker Potential: Cancer cells with low hMOB2 expression show hypersensitivity to PARP inhibitors, similar to BRCA-deficient cells. This suggests hMOB2 expression could be a biomarker for guiding PARP inhibitor therapy [7].
The diagram below summarizes the functional role of the hMOB2-RAD50 interaction within the DNA Damage Response pathway.
The key quantitative findings from the studies on hMOB2 are summarized below for easy reference.
Table 1: Key Quantitative Findings from hMOB2 Studies
| Parameter Investigated | Experimental Result | Experimental Context |
|---|---|---|
| Y2H Screen Efficiency | 4 out of 28 putative interactors were identified multiple times; RAD50 was confirmed in-frame in 4/4 hits [2]. | Screening of 1 x 10^6 yeast transformants from a human cDNA library. |
| Cell Survival Post-Damage | hMOB2 depletion sensitized cells to DNA-damaging agents (Doxorubicin, IR) [2] [13]. | Clonogenic survival assays in U2-OS cells. |
| Tumor Database Analysis | The MOB2 gene shows loss of heterozygosity (LOH) in >50% of bladder, cervical, and ovarian carcinomas (TCGA) [2] [7]. | Bioinformatic analysis of The Cancer Genome Atlas. |
| PARP Inhibitor Sensitivity | hMOB2 deficiency sensitizes cancer cells to multiple PARP inhibitors (Olaparib, Rucaparib, Veliparib) [7]. | Cell survival assays in ovarian cancer cell lines. |
The functional consequence of MOB2's interaction with the MRN complex is the enhancement of the DNA damage response (DDR) signaling. Research demonstrates that hMOB2 interacts directly with RAD50, a core component of the MRE11-RAD50-NBS1 (MRN) DNA damage sensor complex. This interaction facilitates the recruitment of the entire MRN complex and activated ATM kinase to DNA damaged chromatin. By supporting this crucial early step in DDR, MOB2 promotes efficient DNA damage signaling, cell survival, and appropriate cell cycle checkpoint activation following genotoxic stress [2] [16].
MOB2 in the DNA Damage Response Pathway
Experimental Protocols & Methodologies
Detecting MOB2-RAD50 Protein Interaction
Co-Immunoprecipitation (Co-IP) Assay Protocol
- Purpose: To confirm the physical interaction between MOB2 and RAD50 proteins in cells.
- Detailed Workflow:
- Cell Lysis: Harvest transfected or endogenous cells and lyse in appropriate ice-cold lysis buffer (e.g., containing 17 mM Tris pH 8.0, 50 mM NaCl, 0.3% Triton X-100, plus protease and phosphatase inhibitors) [17].
- Pre-clearing: Incubate lysates with control IgG and protein A/G beads to reduce non-specific binding.
- Immunoprecipitation: Incubate pre-cleared lysates with antibody against MOB2, RAD50, or control IgG. Protein A/G beads are then added to capture the antibody-protein complex.
- Washing: Pellet beads and wash 3-5 times with lysis buffer to remove unbound proteins.
- Elution & Analysis: Elute bound proteins by boiling in SDS sample buffer. Analyze by SDS-PAGE and immunoblotting using antibodies against both MOB2 and RAD50 to confirm co-precipitation [2].
- Expected Outcome: Detection of RAD50 in MOB2 immunoprecipitates, and vice-versa, confirms a specific interaction.
Yeast Two-Hybrid (Y2H) Screen Protocol
- Purpose: To identify novel direct binding partners of MOB2, which originally revealed its interaction with RAD50.
- Detailed Workflow:
- Bait Construction: Clone full-length human MOB2 cDNA into a pLexA DNA-binding domain vector.
- Library Screening: Transform the bait construct along with a normalized universal human tissue cDNA library (e.g., pGADT7-recAB based) into a suitable yeast strain.
- Selection: Plate transformants on selective media lacking leucine, tryptophan, and histidine to select for interacting clones.
- Validation: Isolate positive clones, sequence the prey plasmids, and retest interactions to eliminate false positives [2].
- Expected Outcome: Identification of direct protein interactors, with RAD50 being a major hit for MOB2.
Assessing MRN/ATM Recruitment to Damage Sites
Chromatin Fractionation Assay Protocol
- Purpose: To evaluate the recruitment of MRN components and activated ATM to DNA damaged chromatin in a MOB2-dependent manner.
- Detailed Workflow:
- Induction of DNA Damage: Treat cells (e.g., RPE1-hTert, U2-OS) with a DNA-damaging agent such as Doxorubicin (e.g., 0.5-1 μM) or Ionizing Radiation (IR) [2] [18].
- Cellular Fractionation: Harvest cells and resuspend in hypotonic buffer A (e.g., 10 mM Pipes, 100 mM NaCl, 300 mM sucrose, 3 mM MgCl2, 0.1% Triton X-100) to lyse the plasma membrane and isolate the cytosolic fraction (supernatant).
- Chromatin Isolation: Pellet the nuclear fraction and lyse in buffer B (e.g., 3 mM EDTA, 0.2 mM EGTA) to solubilize chromatin-associated proteins.
- Analysis: Centrifuge to separate soluble nuclear material from the insoluble fraction. Analyze the chromatin-enriched fraction by immunoblotting for MRN components (RAD50, MRE11, NBS1), phosphorylated ATM (Ser1981), and MOB2 [2].
- Expected Outcome: MOB2 deficiency should reduce the presence of MRN components and phospho-ATM in the chromatin fraction after damage.
Table 1: Functional Consequences of MOB2 Manipulation on DNA Damage Response
| Experimental Readout | MOB2 Knockdown/Deficiency | MOB2 Proficiency | Experimental Context |
|---|---|---|---|
| Endogenous DNA Damage | Accumulation of DNA damage [2] [16] | Prevents accumulation of endogenous damage [2] | Untransformed human cells, no exogenous damage |
| p53/p21-dependent G1/S Arrest | Induced [2] [16] | Prevented [2] | Untransformed human cells |
| Cell Survival Post-IR/Doxorubicin | Decreased [2] [16] | Promoted [2] | Clonogenic assays |
| ATM Activation & Signaling | Impaired (reduced ATM, CHK2 phosphorylation) [2] [16] | Supported [2] | Post-ionizing radiation or doxorubicin |
| MRN Recruitment to Chromatin | Impaired [2] | Facilitated [2] | Chromatin fractionation after damage |
| Homologous Recombination (HR) Efficiency | Impaired (reduced RAD51 foci/stabilization) [19] | Promoted [19] | DR-GFP reporter assay / RAD51 foci analysis |
| Sensitivity to PARP Inhibitors | Increased [19] | Standard sensitivity [19] | Ovarian and other cancer cells |
Table 2: Key Domain Interactions Between MOB2 and RAD50
| Protein | Interacting Domain/Region | Functional Significance |
|---|---|---|
| MOB2 | Full-length protein used as bait [2] | Successfully identified RAD50; specific MOB2 interaction domain not fully mapped. |
| RAD50 | Two distinct domains identified [16] | Interaction is functionally relevant for MRN recruitment; precise domains not specified in results. |
The Scientist's Toolkit: Research Reagent Solutions
Table 3: Essential Reagents for MOB2-MRN Complex Research
| Reagent / Resource | Function / Application | Examples / Key Specifications |
|---|---|---|
| siRNAs / shRNAs vs. MOB2 | Functional knockdown to study loss-of-function phenotypes. | Qiagen siRNAs; Tetracycline-inducible (Tet-on) pTER or pMKO.1 retro vectors for stable knockdown [2]. |
| Antibody: Anti-MOB2 | Detection (WB, IF), Immunoprecipitation. | Validation for specific applications is required. |
| Antibody: Anti-RAD50 | Detection (WB, IF), Immunoprecipitation. | To monitor protein levels and interaction. |
| Antibody: Anti-phospho-ATM (Ser1981) | Marker for activated ATM. | Rockland #200-301-400; critical for assessing DDR activation [17]. |
| Antibody: Anti-γH2AX (Ser139) | Marker for DNA Double-Strand Breaks. | Upstate #05-636; used in immunofluorescence and WB [17]. |
| DNA Damaging Agents | Induction of controlled DNA damage. | Doxorubicin (Topo II poison); Etoposide; Ionizing Radiation (IR) [2] [18]. |
| Cell Lines | Model systems for DDR studies. | RPE1-hTert (untouched telomerase), BJ-hTert fibroblasts, U2-OS, H1299, isogenic ATM+/- lines [2] [18] [17]. |
Troubleshooting Guide & FAQ
FAQ 1: We confirmed MOB2 binds RAD50, but our chromatin fractionation assay shows no defect in MRN recruitment upon MOB2 knockdown. What could explain this?
- Potential Cause 1: Compensation or Redundancy. In your specific cell type or under your experimental conditions, other proteins might compensate for the loss of MOB2 in facilitating MRN recruitment.
- Potential Cause 2: Alternative MOB2 Functions. MOB2's primary role in the DDR might be context-dependent. Recent research shows hMOB2 is also crucial later in the HR repair pathway by stabilizing RAD51 on resected DNA, a step downstream of initial MRN recruitment [19].
- Troubleshooting Steps:
- Verify the efficiency of your MOB2 knockdown in the assay.
- Use an alternative DNA damaging agent (e.g., switch from IR to Doxorubicin).
- Probe for a later HR defect by checking RAD51 focus formation in your MOB2-deficient cells [19].
FAQ 2: Is the role of MOB2 in DDR dependent on its known function as an NDR kinase regulator?
- Answer: No, current evidence indicates it is NDR-independent. Knockdown of NDR1/2 kinases does not recapitulate the DNA damage accumulation or G1/S cell cycle arrest seen with MOB2 knockdown. Conversely, overexpression of a hyperactive NDR1 mutant does not cause a similar phenotype. This points to MOB2 functioning in the DDR through alternative partners like RAD50 [2] [16].
FAQ 3: What is the translational relevance of studying MOB2 in DNA damage repair?
- Answer: MOB2 has emerging potential as a predictive biomarker for cancer therapy.
- PARP Inhibitor Sensitivity: Cancer cells with low levels of MOB2 are significantly more sensitive to PARP inhibitors (e.g., Olaparib), similar to cells with defects in other HR genes [19].
- Patient Stratification: Reduced MOB2 expression is associated with increased overall survival in ovarian carcinoma patients, suggesting it could help identify patients most likely to benefit from PARP inhibitor treatment [19].
Experimental Workflow for MOB2-RAD50 Complex Analysis
MOB2 is an evolutionarily conserved protein that plays a critical, non-canonical role in the Homologous Recombination (HR) pathway by ensuring the stabilization of the RAD51 recombinase on resected single-strand DNA (ssDNA) overhangs at DNA double-strand breaks (DSBs). Its function is essential for effective DSB repair, and its deficiency impairs HR, sensitizing cells to DNA-damaging agents and creating therapeutic opportunities. This technical support center provides a detailed guide for researchers investigating the MOB2-RAD51 axis, with a focus on troubleshooting common experimental challenges in optimizing MOB2-RAD50 complex formation assays and related methodologies [19].
Core Mechanism: How MOB2 Stabilizes RAD51
hMOB2 promotes homologous recombination-mediated double-strand break repair by facilitating the accumulation and stabilization of the RAD51 recombinase on damaged chromatin. The stabilization of RAD51 on ssDNA is a pivotal step in HR, as the RAD51-ssDNA filament is the active species that catalyzes the homology search and strand exchange. hMOB2 is required for this stabilisation process; its absence leads to inadequate RAD51 loading, compromising the entire HR repair pathway [19].
The diagram below illustrates the key mechanistic role of MOB2 in RAD51 stabilization at a DNA double-strand break site.
Frequently Asked Questions (FAQs)
Q1: What is the fundamental role of MOB2 in homologous recombination? MOB2 is a crucial regulator of HR that acts by supporting the phosphorylation and accumulation of the RAD51 recombinase on resected ssDNA overhangs. It stabilizes RAD51 on damaged chromatin, which is essential for the formation of the functional nucleoprotein filament that performs the homology search and strand invasion steps in HR [19].
Q2: How does MOB2 deficiency affect cancer cell response to therapy? Loss of MOB2 renders cancer cells, including ovarian carcinoma models, more vulnerable to FDA-approved PARP inhibitors. This is because MOB2 deficiency creates a functional HR defect, mimicking a BRCA-like state and leading to synthetic lethality with PARP inhibition. Reduced MOB2 expression correlates with increased overall survival in ovarian carcinoma patients, suggesting its potential as a stratification biomarker for targeted therapies [19].
Q3: What are the key experimental challenges in studying MOB2-RAD51 interactions? Common challenges include:
- Difficulty in detecting stable RAD51 foci by immunofluorescence in MOB2-deficient cells
- Optimization of co-immunoprecipitation conditions to capture transient MOB2-RAD51 complexes
- Proper design of controls for functional HR assays when MOB2 is knocked down
- Distinguishing MOB2's specific role from other RAD51 mediators like RAD52 and BRCA2
Q4: How can MOB2 expression be leveraged for patient stratification? MOB2 expression may serve as a candidate stratification biomarker for HR-deficiency targeted cancer therapies, particularly PARP inhibitor treatments. Low MOB2 levels can identify tumors with functional HR defects that may respond better to these targeted therapies, complementing genetic approaches like next-generation sequencing [19].
Troubleshooting Guide: MOB2-RAD51 Assays
Problem 1: Weak or Inconsistent RAD51 Foci Formation
Potential Causes and Solutions:
| Observation | Possible Cause | Solution |
|---|---|---|
| High background, low signal-to-noise ratio in immunofluorescence | Inefficient DNA damage induction; suboptimal antibody concentration | - Titrate DNA damaging agent (e.g., 2-10 Gy IR, 1-5 µM camptothecin)- Optimize antibody dilution (typically 1:200-1:1000 for primary) |
| No RAD51 foci in control cells | Improper cell cycle synchronization; RAD51 not actively engaged in HR | - Synchronize cells in S/G2 phase where HR is active- Include positive control (known HR-proficient cell line) |
| RAD51 foci form but disappear rapidly in MOB2-competent cells | Over-fixation or harsh permeabilization damaging nuclear structure | - Reduce fixation time (10-15 min in 4% PFA)- Use milder detergents (e.g., 0.1-0.5% Triton X-100) |
Problem 2: Inconsistent Results in MOB2-RAD50 Complex Formation Assays
Potential Causes and Solutions:
| Observation | Possible Cause | Solution |
|---|---|---|
| Failure to detect MOB2-RAD50 interaction in co-IP | Weak/transient interaction; improper lysis conditions | - Use crosslinker (e.g., DSG) before lysis to stabilize transient interactions- Optimize salt concentration (150-300 mM NaCl) in lysis buffer |
| High non-specific binding in pull-down assays | Antibody quality; insufficient washing | - Validate antibody specificity using MOB2-knockdown controls- Increase wash stringency (e.g., add 0.1% SDS to wash buffer) |
| Variable complex formation between experiments | Inconsistent DNA damage induction; cell confluency differences | - Standardize DNA damage protocol across experiments- Maintain consistent cell confluency (70-80%) pre-treatment |
Problem 3: Poor Viability in MOB2-Deficient Cells Post-Treatment
Potential Causes and Solutions:
| Observation | Possible Cause | Solution |
|---|---|---|
| Excessive cell death in MOB2-knockdown cells after PARP inhibition | Extreme HR deficiency causing synthetic lethality | - Titrate PARP inhibitor concentration (start with low nM range)- Reduce treatment duration (24-48 hours maximum) |
| High basal apoptosis in MOB2-deficient lines without treatment | Accumulation of endogenous DNA damage | - Use inducible knockdown system instead of constitutive knockout- Analyze cells at earlier time points post-knockdown |
Experimental Protocols
Protocol 1: RAD51 Foci Immunofluorescence Assay for HR Function
Purpose: To visualize and quantify RAD51 filament formation at DNA damage sites, a key readout for MOB2 function in HR.
Reagents Required:
- Cells with MOB2 manipulation (knockdown/overexpression) and appropriate controls
- DNA damaging agent (e.g., ionizing radiation, 2-10 Gy; or camptothecin, 1 µM)
- Primary anti-RAD51 antibody (e.g., Abcam ab133534)
- Fluorescently-labeled secondary antibody
- Fixative (4% paraformaldehyde in PBS)
- Permeabilization buffer (0.5% Triton X-100 in PBS)
- Blocking buffer (5% BSA in PBS)
- Mounting medium with DAPI
Procedure:
- Induce DNA Damage: Treat cells with chosen DNA damaging agent. Include untreated controls.
- Recovery Incubation: Incubate cells for 2-6 hours at 37°C to allow foci formation.
- Fixation: Aspirate medium and add 4% PFA for 15 minutes at room temperature.
- Permeabilization: Wash with PBS, then permeabilize with 0.5% Triton X-100 for 10 minutes.
- Blocking: Incubate with blocking buffer for 1 hour at room temperature.
- Primary Antibody: Incubate with anti-RAD51 antibody (1:500 in blocking buffer) overnight at 4°C.
- Secondary Antibody: Wash 3× with PBS, then incubate with fluorescent secondary antibody (1:1000) for 1 hour at room temperature in the dark.
- Mounting: Wash 3× with PBS, mount with DAPI-containing medium, and seal coverslips.
- Imaging & Analysis: Acquire images using confocal microscopy. Quantify RAD51 foci per nucleus (typically >50 nuclei per condition).
Troubleshooting Note: MOB2-deficient cells should show significantly reduced RAD51 foci compared to wild-type controls, particularly at early time points (2-4 hours) post-DNA damage [19].
Protocol 2: Co-immunoprecipitation of MOB2-RAD50 Complex
Purpose: To detect physical interaction between MOB2 and RAD50 under DNA damage conditions.
Reagents Required:
- Lysis buffer (50 mM Tris-HCl pH 7.5, 150 mM NaCl, 1% NP-40, plus protease/phosphatase inhibitors)
- Crosslinker (DSS or DSG, 2 mM stock in DMSO) - optional
- Protein A/G agarose beads
- Anti-MOB2 or anti-RAD50 antibody for immunoprecipitation
- Control IgG (species-matched)
- Wash buffer (lysis buffer with 300 mM NaCl for increased stringency)
- Elution buffer (0.1 M glycine pH 2.5-3.0 or Laemmli buffer for direct denaturation)
Procedure:
- Induce DNA Damage: Treat cells with appropriate DNA damaging agent.
- Cell Lysis: Harvest cells and lyse in ice-cold lysis buffer (30 minutes on ice).
- Crosslinking (Optional): Add DSS to 0.5 mM final concentration, incubate 30 minutes at room temperature, then quench with 1 M Tris pH 7.5.
- Pre-clearing: Centrifuge lysates (14,000 × g, 15 minutes), transfer supernatant to new tube, add protein A/G beads (30 minutes, 4°C), then remove beads.
- Immunoprecipitation: Add specific antibody or control IgG (1-2 µg per 500 µg lysate), incubate overnight at 4°C with rotation.
- Capture Complexes: Add protein A/G beads (50 µl slurry), incubate 2-4 hours at 4°C.
- Washing: Pellet beads, wash 3-4 times with wash buffer.
- Elution: Elute proteins with glycine buffer (neutralize with Tris) or directly with Laemmli buffer by boiling (5 minutes, 95°C).
- Analysis: Analyze by SDS-PAGE and western blotting for MOB2 and RAD50.
Critical Step: Include both DNA-damaged and untreated samples to demonstrate damage-dependent complex formation.
Research Reagent Solutions
Table: Essential Reagents for MOB2-RAD51 Research
| Reagent | Function/Application | Example Products/Sources |
|---|---|---|
| Anti-MOB2 Antibody | Detection of MOB2 expression and localization in IF, WB | Sigma-Aldrich HPA039173; Santa Cruz sc-51552 |
| Anti-RAD51 Antibody | Visualization of RAD51 foci formation in IF | Abcam ab133534; Millipore 05-530 |
| Anti-RAD50 Antibody | Detection of RAD50 in complex formation assays | Cell Signaling 3427S; Abcam ab89 |
| PARP Inhibitors | Functional testing of HR deficiency in MOB2-deficient cells | Olaparib (AZD2281); Rucaparib (AG-014699) |
| DNA Damage Inducers | Induction of DSBs for HR activation | Camptothecin (topoisomerase inhibitor); Etoposide; Bleomycin |
| HR Reporter Assays | Functional measurement of HR efficiency | DR-GFP reporter; Rad51-GFP foci formation assays |
| MOB2 siRNAs/shRNAs | Knockdown of MOB2 expression | Dharmacon ON-TARGETplus; Sigma MISSION shRNA |
| RAD51 Expression Vectors | Complementation assays | Addgene plasmid # 17972; Origene RC200042 |
Experimental Workflow for MOB2-RAD50 Complex Studies
The diagram below outlines a comprehensive experimental approach for investigating MOB2-RAD50 complex formation and its functional consequences in homologous recombination.
Table: Key Quantitative Findings in MOB2-RAD51 Research
| Parameter | Experimental Finding | Significance/Interpretation |
|---|---|---|
| HR Efficiency in MOB2-deficient cells | Significant reduction in RAD51 foci formation (>70% decrease) [19] | MOB2 is essential for efficient RAD51 loading onto damaged chromatin |
| PARP Inhibitor Sensitivity | Enhanced sensitivity in MOB2-low cancer cells [19] | MOB2 deficiency creates synthetic lethality with PARP inhibition |
| Patient Survival Correlation | Reduced MOB2 expression correlates with increased overall survival in ovarian carcinoma [19] | Suggests MOB2 as a potential biomarker for patient stratification |
| RAD51 Stabilization Mechanism | MOB2 supports RAD51 phosphorylation and accumulation on ssDNA [19] | Provides mechanistic insight into how MOB2 promotes HR |
| Rad52-mediated Rad51 loading | Rad55-Rad57 enhances Rad51 binding by ~60% [20] | Context for comparing MOB2's role with other RAD51 regulators |
Advanced Technical Considerations
For researchers developing more sophisticated assays for MOB2-RAD50 complex formation, consider these advanced approaches:
Single-Molecule Analysis: Techniques like optical tweezers and single-molecule fluorescence, as used in RAD52-RAD51 studies, can provide insights into the dynamics of MOB2-mediated RAD51 filament formation. These approaches can visualize individual binding events and filament extension in real-time [20].
Structural Mass Spectrometry: Crosslinking mass spectrometry (XL-MS) has been successfully used to map interaction sites between RAD51 and its mediators like RAD52. Similar approaches could identify precise MOB2-RAD51 interaction motifs [20].
Functional Complementation Assays: As developed for RAD51 studies in meiosis, in vivo knockdown and protein complementation systems can help dissect MOB2 functional domains without complete genetic knockout [21].
Contextual Interpretation: When interpreting results, remember that RAD51 has both canonical (strand exchange) and non-canonical roles in DNA repair. MOB2's effects may extend beyond traditional HR to include replication fork protection and other genome maintenance functions [22].
Frequently Asked Questions (FAQs)
FAQ 1: What are the primary cellular consequences of MOB2 deficiency in cancer cells? MOB2 deficiency leads to the accumulation of endogenous DNA damage, which triggers a p53/p21-dependent G1/S cell cycle arrest in untransformed cells [2]. In cancer cells, this deficiency impairs homologous recombination (HR)-mediated DNA repair, sensitizing them to DNA-damaging agents and PARP inhibitors [23] [19]. Additionally, MOB2 loss enhances malignant phenotypes in glioblastoma (GBM), including increased clonogenic growth, migration, invasion, and resistance to anoikis [4].
FAQ 2: What is the mechanistic role of MOB2 in the DNA Damage Response (DDR)? MOB2 interacts directly with RAD50, a component of the MRE11-RAD50-NBS1 (MRN) complex, which is a critical DNA damage sensor [2]. This interaction facilitates the recruitment of the entire MRN complex and activated ATM (Ataxia Telangiectasia Mutated) kinase to sites of DNA damage [2]. Furthermore, MOB2 is required for the stabilization and accumulation of the RAD51 recombinase on resected single-strand DNA (ssDNA) overhangs, a key step in HR repair [23] [19].
FAQ 3: How can MOB2 expression levels influence cancer therapy strategies? Reduced MOB2 expression correlates with increased sensitivity to PARP inhibitors in ovarian and other cancers [23] [19]. This is because low MOB2 levels create a homologous recombination-deficient (HRD) state, making cancer cells vulnerable to PARP inhibition through synthetic lethality. Consequently, MOB2 expression may serve as a predictive biomarker for patient stratification for HRD-targeted therapies, including PARP inhibitor treatments [19].
Troubleshooting Guides
Issue 1: Inconsistent Results in MOB2-RAD50 Co-Immunoprecipitation (Co-IP)
- Potential Cause: Instability of the MRN complex or non-specific interactions.
- Solution:
- Ensure fresh protease and phosphatase inhibitors are added to all lysis and wash buffers.
- Validate the specificity of your anti-MOB2 and anti-RAD50 antibodies using cell lines with MOB2 knockout/knockdown.
- Include a rigorous negative control, such as an IgG control, and a positive control, like a lysate from cells treated with a DNA-damaging agent (e.g., doxorubicin).
- As a complementary approach, consider using a proximity-dependent biotin identification (BioID) assay to map the MOB2 interactome, as this technique can capture transient or weak interactions [24].
Issue 2: High Background in HR Repair Reporter Assays after MOB2 Depletion
- Potential Cause: Off-target effects of MOB2 knockdown or activation of alternative DNA repair pathways.
- Solution:
- Use at least two distinct siRNA or shRNA sequences to ensure the phenotype is specific.
- Perform a rescue experiment by expressing an RNAi-resistant wild-type MOB2 cDNA and confirm it restores HR efficiency.
- Monitor the protein levels of key HR players (e.g., RAD51, BRCA1) and NHEJ factors to rule out compensatory pathway activation.
Table 1: Phenotypic Impact of MOB2 Manipulation in GBM Models
| Cell Line / Model | MOB2 Manipulation | Impact on Proliferation | Impact on Migration/Invasion | Impact on Clonogenic Growth | Citation |
|---|---|---|---|---|---|
| LN-229 & T98G (GBM) | Knockdown (shRNA) | Significantly Increased | Significantly Enhanced | Significantly Enhanced | [4] |
| SF-539 & SF-767 (GBM) | Overexpression | Significantly Decreased | Significantly Reduced | Significantly Reduced | [4] |
| In vivo CAM Model | Knockdown | Not Reported | Enhanced Invasion | Not Reported | [4] |
| In vivo CAM Model | Overexpression | Not Reported | Decreased Invasion | Not Reported | [4] |
| Mouse Xenograft | Overexpression | Decreased Tumor Growth | Not Reported | Not Reported | [4] |
Table 2: MOB2 Deficiency and Response to DNA-Damaging Agents
| Cancer Cell Type | MOB2 Status | Treatment | Observed Effect | Citation |
|---|---|---|---|---|
| Ovarian & other cancers | Deficiency | PARP Inhibitors | Increased Sensitivity & Cell Death | [23] [19] |
| Ovarian & other cancers | Deficiency | DSB-inducing agents (e.g., IR, MMC) | Reduced Cell Survival | [23] [19] |
| GBM cells | Deficiency | Not Applicable | Accumulation of Endogenous DNA Damage | [2] |
| Untransformed cells | Deficiency | Not Applicable | p53/p21-dependent G1/S Arrest | [2] |
Detailed Experimental Protocols
Protocol 1: Chromatin Isolation to Assess MRN Complex Recruitment This protocol is used to investigate the recruitment of the MRN complex and ATM to damaged chromatin, a process facilitated by MOB2 [2].
- Cell Culture and Treatment: Seed cells (e.g., RPE1-hTert, U2-OS) and treat with a DNA-damaging agent like doxorubicin (e.g., 1 µM for 4 hours) or expose to ionizing radiation (e.g., 10 Gy).
- Harvesting: Wash cells with ice-cold PBS and scrape them into a cold collection tube.
- Fractionation:
- Resuspend the cell pellet in Buffer A (10 mM Pipes pH 6.8, 100 mM NaCl, 300 mM sucrose, 3 mM MgCl₂, 5 mM EDTA, 1 mM EGTA, 0.1% Triton X-100, plus protease and phosphatase inhibitors).
- Incubate on ice for 10 minutes to permeabilize the plasma membrane.
- Centrifuge at 1,300 × g for 5 minutes at 4°C. The supernatant is the cytosolic fraction.
- Wash the pellet (containing nuclei and chromatin) once with Buffer A.
- Lyse the pellet in Buffer B (3 mM EDTA, 0.2 mM EGTA, plus inhibitors, pH 8.0) for 10 minutes at 4°C.
- Centrifuge at 1,700 × g for 5 minutes at 4°C. The supernatant is the chromatin-bound fraction.
- Analysis: Analyze the chromatin-bound fraction by immunoblotting for proteins of interest (e.g., RAD50, MRE11, NBS1, phospho-ATM (Ser1981), MOB2, with Histone H3 serving as a loading control).
Protocol 2: Immunofluorescence for RAD51 Foci Formation This assay quantifies HR repair efficiency, which is impaired in MOB2-deficient cells [23] [19].
- Cell Preparation: Seed cells on glass coverslips and transfer to medium containing 10 µM BrdU 24 hours before irradiation.
- DNA Damage Induction: Expose cells to 10 Gy of ionizing radiation.
- Post-Irradiation Incubation: Return cells to the incubator for a specific time (e.g., 4-6 hours) to allow for RAD51 foci formation.
- Fixation and Permeabilization: Fix cells with 4% paraformaldehyde for 15 minutes, then permeabilize with 0.5% Triton X-100 in PBS for 10 minutes.
- Denaturation and Staining: Denature DNA with 2M HCl for 30 minutes, then neutralize with 0.1M Borate buffer (pH 8.5). Block with 5% BSA and incubate with primary anti-RAD51 antibody, followed by a fluorescent secondary antibody.
- Imaging and Quantification: Counterstain nuclei with DAPI and mount coverslips. Image using a fluorescence microscope and quantify the number of RAD51 foci per nucleus in at least 50 BrdU-positive (S-phase) cells.
Signaling Pathway and Experimental Workflow
MOB2 Deficiency Disrupts HR-Mediated DNA Repair
The Scientist's Toolkit: Research Reagent Solutions
Table 3: Essential Reagents for MOB2 and DNA Repair Studies
| Reagent / Material | Function / Application | Example Use Case |
|---|---|---|
| Anti-MOB2 Antibody | Detection of endogenous MOB2 protein via immunoblot (IB), immunofluorescence (IF), and immunohistochemistry (IHC). | Validating MOB2 knockdown or overexpression efficiency [4] [2]. |
| Anti-RAD50 Antibody | Co-immunoprecipitation (Co-IP) and chromatin fractionation to study MOB2-RAD50-MRN complex interaction and recruitment. | Confirming the physical interaction between MOB2 and the MRN complex [2]. |
| Anti-RAD51 Antibody | Quantification of RAD51 foci formation by IF; a key readout for homologous recombination (HR) efficiency. | Assessing the functional impact of MOB2 loss on HR repair [23] [19]. |
| PARP Inhibitors (e.g., Olaparib) | Selective targeting of HR-deficient cells; used for synthetic lethality studies. | Determining the therapeutic vulnerability of MOB2-deficient cancer cells [23] [19]. |
| DNA-Damaging Agents (e.g., Doxorubicin, IR) | Induction of DNA double-strand breaks (DSBs) to activate the DNA damage response and repair pathways. | Studying the role of MOB2 in the cellular response to exogenous DNA damage [2]. |
| shRNA/siRNA targeting MOB2 | Genetic knockdown to deplete MOB2 and study loss-of-function phenotypes. | Establishing models to investigate the consequences of MOB2 deficiency [4] [23]. |
| pCDH-MOB2 Plasmid | Ectopic expression of MOB2 for rescue experiments or gain-of-function studies. | Confirming the specificity of RNAi phenotypes and studying MOB2 overexpression effects [4]. |
Bench-Level Protocols: Techniques for Detecting and Quantifying MOB2-RAD50 Interactions
Troubleshooting Guides and FAQs
Frequently Asked Questions
Q1: My input control shows the protein is present, but I get no signal in my Co-IP. What are the most common causes? This is often due to the lysis buffer disrupting protein-protein interactions. Strong denaturing buffers like RIPA can dissociate complexes; use a milder lysis buffer like Cell Lysis Buffer #9803 for Co-IP. Other causes include low protein expression, epitope masking, or insufficient antibody binding to beads [25] [26].
Q2: I see a band for my prey protein in the negative control (bead-only or isotype control). Does this mean my interaction is non-specific? Not necessarily, but it requires investigation. This background signal can indicate non-specific binding of the prey protein to the beads, the antibody, or plastic consumables. Pre-clearing your lysate, using a different bead type, or switching to low-binding tubes can resolve this [25] [27].
Q3: My target protein runs near 25 kDa or 50 kDa and is obscured by the antibody heavy or light chains on the western blot. How can I fix this? This common issue, called antibody masking, has several solutions:
- Use antibodies from different species for the IP and the western blot [25].
- Use a biotinylated primary antibody for western blot and detect with Streptavidin-HRP [25].
- Use a light-chain-specific secondary antibody for western blotting [25] [26].
Q4: My Co-IP suggests an interaction, but another technique does not. Why the discrepancy? Co-IP detects interactions in a near-native state but can only capture complexes stable under the lysis and wash conditions used. Other techniques might detect weak or transient interactions that Co-IP misses. Conversely, Co-IP can detect indirect interactions mediated by a third protein, which might be interpreted as a direct interaction without further validation [28] [29].
Troubleshooting Common Co-IP Problems
Problem 1: Low or No Signal
| Potential Cause | Discussion | Recommended Solution |
|---|---|---|
| Disrupted Protein Interactions | Stringent lysis buffers (e.g., RIPA) contain ionic detergents that can denature proteins and disrupt native complexes. | Use a mild, non-denaturing lysis buffer [25]. |
| Low Abundance or Epitope Masking | The target protein may be expressed at low levels, or its antibody epitope may be buried within the protein complex. | Confirm protein expression via input control. Try an antibody targeting a different epitope [25] [26]. |
| Suboptimal Antibody-Bead Binding | The affinity of Protein A/G varies by antibody host species and immunoglobulin subclass. | Use Protein A beads for rabbit IgG and Protein G beads for mouse IgG for highest binding affinity [25] [30]. |
| Protein Degradation | Proteases in the lysate can degrade your target protein and its partners. | Always add fresh protease and phosphatase inhibitors to the lysis buffer and perform all steps on ice or at 4°C [25] [28]. |
Problem 2: High Background or Non-Specific Bands
| Potential Cause | Discussion | Recommended Solution |
|---|---|---|
| Non-Specific Binding to Beads | Proteins can stick non-specifically to the bead matrix or the IgG of the antibody itself. | Include a bead-only control and an isotype control. Pre-clear the lysate by incubating with beads alone before the IP [25] [31]. |
| Insufficient Washing | Unbound proteins are not adequately removed before elution. | Increase the number of washes. Optimize wash buffer stringency by adjusting salt or detergent concentrations [26] [28]. |
| Antibody Concentration Too High | Excess antibody can increase non-specific binding. | Titrate the antibody to find the optimal concentration that maximizes signal-to-noise [26] [28]. |
| Post-Translational Modifications | Modifications like phosphorylation or glycosylation can cause multiple bands to appear. | Consult resources like PhosphoSitePlus. Include phosphatase inhibitors in your lysis buffer if needed [25]. |
Specific Considerations for MOB2-RAD50 Complex Research
Research indicates that the MOB2 protein can interact with the DNA damage response protein RAD50, a member of the MRE11-RAD50-NBS1 (MRN) complex, in a manner independent of the NDR kinase signaling pathway [4]. Successfully studying this specific endogenous complex requires careful experimental design.
- Maintaining Complex Integrity: The MOB2-RAD50 interaction may be transient or require specific conditions. Perform all lysis and immunoprecipitation steps at 4°C using mild, non-denaturing lysis buffers to preserve the complex. Avoid sonication or vortexing after lysis [31].
- Validating Functional Interactions: Given that other proteins like WDFY2 are also known to promote MRN complex formation, proper controls are essential to confirm the specificity of your MOB2-RAD50 Co-IP [11]. The use of cell lines with MOB2 knockdown or knockout can serve as a critical negative control.
Research Reagent Solutions
This table lists key reagents essential for setting up a Co-IP experiment, particularly in the context of studying endogenous complexes like MOB2-RAD50.
| Item | Function & Rationale |
|---|---|
| Cell Lysis Buffer (#9803) | A mild, non-denaturing lysis buffer recommended for Co-IP to preserve protein-protein interactions [25]. |
| Protease/Phosphatase Inhibitor Cocktail (#5872) | Added fresh to lysis buffer to prevent protein degradation and maintain post-translational modifications during sample preparation [25]. |
| Protein A & G Beads | Solid support for binding antibody-antigen complexes. Protein A has higher affinity for rabbit IgG, while Protein G is better for mouse IgG [25] [30]. |
| Magnetic Beads | Offer ease of use, lower nonspecific binding, and better compatibility with automation compared to traditional agarose beads [31]. |
| Phosphatase Inhibitors (Sodium Orthovanadate, β-glycerophosphate) | Crucial for studying signaling pathways, these inhibitors maintain the phosphorylation status of proteins during lysis and IP [25]. |
Experimental Workflow and Validation
A well-executed Co-IP relies on a clear workflow and rigorous validation. The diagram below outlines the key steps for a Co-IP, from sample preparation to analysis.
Essential Controls for Valid Results
Interpreting your Co-IP data requires a complete set of controls to account for experimental artifacts [27].
- Input Control: 1-10% of your initial cell lysate, saved before adding any antibody or beads. This confirms the presence of your bait and prey proteins in the starting material [29].
- Positive Control: A sample where the bait protein is known to be expressed and can be immunoprecipitated (e.g., GFP-tagged bait with GFP-only control) to verify your IP conditions are working [27].
- Negative Controls: Critical for distinguishing specific interactions from background noise.
- Bead-Only Control: Lysate incubated with beads but no antibody. Identifies proteins that stick non-specifically to the bead matrix [25].
- Isotype Control: Lysate incubated with beads bound to a non-specific antibody of the same isotype as your IP antibody. Identifies proteins that bind non-specifically to the antibody's Fc region or other parts [25].
- Genetic Negative Control: If possible, use cells where the bait protein is absent (knockdown or knockout) to confirm the specificity of the pull-down [27].
Proximity-dependent biotin identification (BioID) is a powerful methodology for mapping protein-protein interactions and the local proteomic environment within a living cell. In the context of optimizing MOB2-RAD50 complex formation assays, BioID offers a unique advantage by capturing both stable and transient interactions that are crucial for understanding the dynamics of the MRE11-RAD50-NBS1 (MRN) complex, a key sensor of DNA double-strand breaks (DSBs) [11]. The technique relies on the fusion of a protein of interest (the "bait") to a promiscuous biotin ligase (BirA*). In the presence of excess biotin, this ligase generates reactive biotinoyl-5′-AMP molecules that covalently attach to lysine residues of nearby proteins (the "preys") [32]. These biotinylated proteins can then be isolated under denaturing conditions using streptavidin-based affinity purification and identified via mass spectrometry [32] [33].
The labeling radius of BioID is estimated to be approximately 10–20 nm, enabling the identification of both direct binding partners and proximal proteins that may not physically interact [32]. This feature is particularly beneficial for studying complexes like the MRN complex, as it allows researchers to capture its core components as well as regulatory factors that may be recruited transiently during DNA damage response. A key strength of BioID is its ability to capture weak or transient interactions, a history of which is preserved through the stable biotin tag, making it ideal for studying dynamic cellular processes [32]. Furthermore, because the biotinylation occurs in living cells prior to lysis, and purification is performed under stringent, denaturing conditions, BioID minimizes the recovery of false-positive interactions that can result from post-lysis protein associations [34] [32].
Key Research Reagent Solutions for BioID
The following table details essential reagents and their functions for a typical BioID experiment, which are foundational for any study aiming to optimize the MOB2-RAD50 complex formation assay.
Table 1: Key Research Reagents for BioID Experiments
| Reagent | Function in BioID Experiment |
|---|---|
| Promiscuous Biotin Ligase (BirA*) | Engineered core component (R118G mutant of E. coli BirA) that generates and releases reactive biotinoyl-5′-AMP to label proximal proteins [32]. |
| Biotin | Essential co-factor added to the cell culture medium; substrate for the BirA* enzyme [35]. |
| Streptavidin-coated Magnetic Beads | High-affinity solid-phase matrix for the purification of biotinylated proteins and their complexes under denaturing conditions [35]. |
| Stable Inducible Cell Line | Cell system (e.g., Flp-In T-REx 293) allowing controlled, moderate expression of the bait-BirA* fusion protein to minimize artifacts [33]. |
| MAC-tag | A versatile tag that combines Strep-III, BirA*, and an HA epitope, enabling both AP-MS and BioID from a single construct [33]. |
Experimental Protocol for a Standard BioID Workflow
The protocol below outlines the critical steps for conducting a BioID experiment, which can be adapted to study the MOB2-RAD50 complex.
- Construct Generation: Clone the cDNA of your protein of interest (e.g., RAD50 or MOB2) into an appropriate BioID vector (e.g., pcDNA3.1-myc-BioID) to create an N- or C-terminal fusion with the BirA* gene. The choice of terminus should preserve the correct localization and function of the bait protein [32] [35].
- Cell Line Development and Biotinylation: Generate a stable cell line expressing the bait-BirA* fusion protein. The use of an inducible system (e.g., Tet-On) is highly recommended to control expression levels. Culture the cells and induce fusion protein expression (e.g., with 2 µg/mL doxycycline for 24 hours). Subsequently, add biotin (e.g., 50 µM) to the culture medium for a defined labeling period (typically 15–24 hours) to allow for proximity-dependent biotinylation [35].
- Cell Lysis and Protein Extraction: Harvest the cells and lyse them using a RIPA buffer supplemented with protease and phosphatase inhibitors. Sonication may be employed to ensure complete lysis and reduce viscosity [35].
- Affinity Purification: Incubate the clarified cell lysate with streptavidin-coated magnetic beads for several hours at 4°C to capture the biotinylated proteins. Wash the beads extensively with RIPA buffer, followed by washes with other buffers (e.g., PBS), to remove non-specifically bound proteins [35].
- Protein Identification and Analysis: Process the captured proteins on-beads for mass spectrometry (LC-MS/MS) analysis. The resulting data should be analyzed using software like MaxQuant, searching against a relevant protein database. Identify high-confidence proximal proteins by comparing the results from the bait-BirA* sample to control samples (e.g., BioID alone or non-biotin-treated cells) [35].
Diagram 1: Standard BioID experimental workflow, from construct generation to protein identification.
BioID Variants and Advanced Methodologies
To address specific experimental challenges, several advanced versions of BioID have been developed. The table below compares three key variants.
Table 2: Comparison of BioID Methodologies
| Method | Key Feature | Advantage | Relevance to MRN Complex Research |
|---|---|---|---|
| Conventional BioID | Uses BirA* (R118G) fused directly to the bait protein [32]. | Well-established protocol; suitable for many soluble and structured proteins. | A proven starting point for initial interactome mapping. |
| BioID2 | Uses a smaller, engineered biotin ligase from Aquifex aeolicus [34]. | Smaller tag size (26.6 kDa) reduces potential for steric hindrance and functional disruption of the bait [34]. | Beneficial for bait proteins sensitive to large tags or with size-restricted locales. |
| 2C-BioID (Two-Component) | Separates the biotin ligase (FKBP-BioID) from the bait protein (FRB-tagged) until induced by a dimerizer [34]. | Prevents spurious biotinylation during bait synthesis/trafficking; allows temporal control; provides built-in control for background subtraction [34]. | Ideal for studying tightly regulated processes like DNA damage response, enabling precise timing of interaction mapping. |
| MAC-tag | A single construct combining BirA* with a Strep-tag for purification and an HA epitope for visualization [33]. | Enables complementary AP-MS and BioID analysis from one cell line, improving throughput and reproducibility [33]. | Provides a comprehensive view of both stable (AP-MS) and proximal (BioID) interactions for RAD50/MOB2. |
Diagram 2: A comparison of conventional BioID and the inducible 2C-BioID system.
Frequently Asked Questions (FAQs) and Troubleshooting
Q1: What are the primary advantages of using BioID over co-immunoprecipitation (co-IP) for studying the MRN complex? BioID offers several key advantages: (1) It captures weak and transient interactions, which are common in dynamic complexes like the MRN complex during DNA damage response [32]. (2) The biotinylation occurs in live cells before lysis, and purification uses stringent conditions, dramatically reducing post-lysis artifacts and false positives common in co-IP [34] [32]. (3) It is particularly well-suited for studying insoluble cellular structures, such as those associated with chromatin and DNA repair foci [32].
Q2: My bait protein is large and localizes to the inner nuclear membrane. Could the BirA* tag disrupt its function or localization? Yes, this is a known concern. The original BirA* tag is ~35 kDa, which can interfere with the function or correct localization of some bait proteins, especially those with size-restricted access like inner nuclear membrane proteins [34]. To mitigate this, consider using BioID2, a smaller ligase (~26.6 kDa), or the 2C-BioID system, which physically separates the ligase from the bait until the experiment is induced, thus avoiding interference during protein trafficking [34].
Q3: How can I distinguish specific proximal proteins from non-specific background in my BioID data? Robust experimental design is critical. Always include control cell lines expressing BioID alone (no bait) or an unrelated bait. The high-confidence interactors for your bait protein (e.g., RAD50) are those significantly enriched over these controls. The 2C-BioID system offers a built-in advantage here, as the non-induced state (FKBP-BioID without dimerizer) provides an excellent internal control for background biotinylation [34]. Statistical analysis and fold-change thresholds (e.g., ≥3-fold enrichment) are typically applied to mass spectrometry data to define specific hits [35].
Q4: The background in my streptavidin blot is too high after purification. What could be the cause? High background can result from several factors:
- Incomplete washing: Ensure you perform multiple stringent washes of the streptavidin beads with RIPA and other buffers (e.g., PBS) [35].
- Endogenous biotinylated proteins: Mammalian cells contain a few naturally biotinylated proteins (e.g., carboxylases). These will appear in your blot and MS data but are easily identified and filtered out computationally.
- Overly long biotin incubation: Extremely long labeling times can increase non-specific background. Optimize the incubation period for your specific system [32].
Q5: How can I apply BioID to study the dynamics of MRN complex assembly at DNA damage sites? The 2C-BioID system is ideally suited for this. You can induce DNA damage and then immediately add the dimerizer to initiate biotinylation specifically during the repair process, providing a "temporal snapshot" of complex formation [34]. Furthermore, recent research has shown that regulators like WDFY2 are phosphorylated by the ATM-CHK2 axis upon DNA damage, promoting MRN complex formation [11]. Studying such regulators with BioID can reveal dynamic changes in the proximal proteome in response to DNA damage signals.
Frequently Asked Questions (FAQs)
Q1: What is the primary function of chromatin fractionation in studying the DNA damage response?
Chromatin fractionation is a key biochemical technique used to separate and analyze chromatin-bound proteins from soluble nuclear and cytoplasmic proteins. In DNA damage response (DDR) studies, it enables researchers to specifically investigate the recruitment, retention, and stability of DNA repair complexes—such as the MRN (MRE11-RAD50-NBS1) complex and associated regulators like MOB2—at sites of DNA damage. This is crucial for understanding how repair pathways are chosen and regulated to maintain genome stability [2].
Q2: My chromatin fractionation shows low yield of chromatin-bound proteins. What could be the cause?
Low chromatin yield is a common issue with several potential causes and solutions, as outlined in the table below.
| Possible Cause | Solution |
|---|---|
| Insufficient cell/tissue starting material | Increase initial cell quantity; ensure accurate cell counting before processing [36] [37]. |
| Incomplete cell lysis | Visually confirm complete lysis of nuclei under a microscope after the lysis step [36]. |
| Over-crosslinking | Reduce crosslinking time (optimize between 5-30 minutes) and ensure formaldehyde is fresh and properly quenched [37] [38]. |
| Protein degradation | Always perform lysis and subsequent steps at 4°C using ice-cold buffers, and add fresh protease inhibitors immediately before use [38]. |
Q3: How can I confirm that a protein of interest is specifically recruited to damaged chromatin?
To confirm specific recruitment, you must induce DNA damage in your experimental system and include appropriate controls. A proper experiment should include:
- A positive control: A known DNA damage marker, such as γH2AX or phosphorylated ATM.
- A negative control: A non-chromatin bound protein.
- An experimental control: Cells that have not been subjected to a DNA-damaging agent.
- Technical control: Verification of successful chromatin fractionation by probing for histone proteins (chromatin-bound fraction) and tubulin or Lamin B (soluble nuclear fraction) [2].
Q4: I am studying the MOB2-RAD50 interaction. What specific role does this play in the DDR?
Research has shown that human MOB2 (hMOB2) directly interacts with RAD50, a core component of the MRN complex. This interaction facilitates the recruitment of the entire MRN complex and activated ATM to damaged chromatin. This function is independent of its role in NDR kinase signaling and is essential for efficient DDR signaling, cell survival, and cell cycle checkpoint activation after DNA damage [2].
Troubleshooting Guide: Common Problems and Solutions
The table below summarizes frequent issues encountered during chromatin fractionation assays for DDR studies and how to resolve them.
| Problem | Possible Causes | Recommended Solutions |
|---|---|---|
| High Background in Fractionation | Non-specific binding of proteins to chromatin or incomplete washing. | Increase stringency of wash buffers (e.g., increase salt concentration); ensure all buffers are kept cold [37] [38]. |
| Instability of Complexes at Damage Sites | Complexes may be prematurely disassembled due to cellular regulation. | For MRN complex studies, research indicates that deubiquitinases like Usp28 can stabilize the complex. Investigating post-translational modifications like Nbs1 ubiquitination may be relevant [39]. |
| Poor Antibody Efficiency in Follow-up IP/WB | Over-crosslinking can mask epitopes; antibody is not suitable for chromatin-bound proteins. | Optimize cross-linking time and temperature. Use ChIP-validated or IP-validated antibodies where possible. Verify antibody specificity by Western blot [37] [38]. |
| Inconsistent Recruitment Data | Variability in DNA damage induction or cell cycle stage of population. | Standardize the method and dose of DNA damage induction (e.g., concentration of drugs like doxorubicin, IR dose). Consider synchronizing cell cycle to reduce heterogeneity, as repair pathway choice (e.g., NHEJ vs. HR) is cell cycle-dependent [40] [2]. |
The Scientist's Toolkit: Key Research Reagent Solutions
| Reagent / Material | Function in the Assay |
|---|---|
| MOB2 Antibodies | To detect and quantify the recruitment of MOB2 to the chromatin fraction and its co-localization with repair factors. |
| MRN Complex Antibodies (RAD50, MRE11, NBS1) | Essential markers to monitor the successful recruitment of the core DNA damage sensor complex to chromatin [2] [39]. |
| DNA Damage Inducers (e.g., Doxorubicin, Etoposide, IR) | Agents used to create controlled DNA double-strand breaks (DSBs) in experimental cell systems [2] [41]. |
| Phospho-Specific Antibodies (e.g., γH2AX, pATM) | Gold-standard markers for validating the induction of DNA damage and the activation of the DNA damage response pathway [40] [41]. |
| Protease and Phosphatase Inhibitors | Crucial for preserving the post-translational modifications (e.g., phosphorylations, ubiquitinations) that regulate protein function and complex stability during the fractionation process [38]. |
| Chromatin Fractionation Kits | Provide optimized buffers and protocols for efficient separation of chromatin-bound proteins from soluble nuclear and cytoplasmic fractions. |
Experimental Pathway and Workflow
The following diagram illustrates the core signaling pathway and key experimental steps for studying MOB2-RAD50 complex recruitment in response to DNA damage.
Immunofluorescence analysis of RAD51 foci serves as a critical functional biomarker for assessing homologous recombination (HR) repair status in cells. Homologous recombination is a high-fidelity DNA repair pathway essential for maintaining genome integrity, and its dysfunction increases cellular sensitivity to DNA-damaging agents like PARP inhibitors. RAD51, a central recombinase protein, forms visible nuclear foci at sites of DNA double-strand breaks (DSBs) during successful HR initiation. The presence of these foci indicates functional HR, while their absence suggests HR deficiency, making this assay particularly valuable for cancer research and therapeutic development [42] [43].
The relevance of RAD51 foci analysis extends to investigating regulators of the DNA damage response, including the MOB2-RAD50 complex. Recent research has established that hMOB2 promotes MRN complex (MRE11-RAD50-NBS1) formation at DNA damage sites, facilitating HR-mediated DNA repair. Through direct interactions with MRE11 and NBS1, WDFY2 (WD40- and FYVE domain-containing protein 2) bridges the MRE11-RAD50 subcomplex with NBS1, thereby promoting MRN complex formation at DSBs and subsequent DNA end resection—a critical step for RAD51 loading. WDFY2 deficiency, as well as non-phosphorylatable mutants, results in impaired HR repair and reduced cell survival following DNA damage [11]. Similarly, hMOB2 is required for the stabilization of RAD51 on damaged chromatin, and its deficiency sensitizes cancer cells to PARP inhibitors, suggesting MOB2 expression may serve as a candidate stratification biomarker for HR-deficiency targeted therapies [19].
Experimental Protocols
Standard Protocol for RAD51 Immunofluorescence
The following protocol is adapted from established methods for detecting RAD51 foci in cultured cells [44] [43]:
Cell Preparation and Plating: Plate 5 × 10⁴ cells on collagen-coated coverslips in a 6-well plate and allow them to grow for 48 hours. For three-dimensional cultures or patient-derived samples, mechanical dissociation may be required prior to plating.
DNA Damage Induction: Expose cells to 4 Gy ionizing radiation (IR) using an X-ray irradiator. Alternatively, treat cells with DNA-damaging agents such as 1 μM cisplatin for 24 hours.
Fixation: At the appropriate time point post-treatment (typically 8 hours for IR), rinse cells with PBS and fix with either:
- 70% ethanol for 15 minutes at room temperature, OR
- Formalin for 15 minutes at room temperature
Permeabilization: Incubate cells with 0.1% Triton X-100 in PBS for 15 minutes on ice.
Blocking: Incubate cells for 1 hour in PBS containing 1% blocking reagent (e.g., Roche blocking reagent or 1-3% BSA).
Primary Antibody Incubation: Incubate with anti-RAD51 antibody (1:100-1:500 dilution) overnight at 4°C.
Secondary Antibody Incubation: Wash cells with PBS, then incubate with fluorescent-conjugated secondary antibody (e.g., anti-rabbit FITC or Alexa Fluor 594 at 1:2000 dilution) for 1 hour in the dark.
Mounting and Visualization: After PBS washes, mount coverslips on microscope slides using antifade mounting medium with DAPI. Analyze using fluorescence or confocal microscopy.
Critical Timing Considerations
The optimal timing for RAD51 foci assessment varies by DNA damage agent:
- Ionizing radiation: 8 hours post-treatment [43]
- Cisplatin: 24 hours post-treatment [44]
- Other agents may require empirical determination
Troubleshooting Guides
Common Experimental Issues and Solutions
Table 1: Troubleshooting RAD51 Immunofluorescence Issues
| Problem | Possible Causes | Solutions |
|---|---|---|
| Weak or No Signal | Antibody degradation or low concentration [45] | Titrate antibodies; ensure proper storage; use bright fluorochromes (e.g., PE, Alexa Fluor 594) |
| Inadequate permeabilization [45] | Optimize permeabilization protocol (concentration, duration); verify with control antibodies | |
| Low antigen accessibility [45] | Ensure cells are in S/G2 phase (assess with geminin staining); optimize fixation method [42] | |
| Epitope damage from over-fixation [45] | Limit fixation time (<15 minutes); use fresh paraformaldehyde (1%) | |
| High Background | Non-specific antibody binding [45] | Include Fc receptor blocking step; use isotype controls; increase blocking time |
| Unwashed antibodies [45] | Add thorough washing steps with PBS containing 0.1% Tween-20 after each incubation | |
| Autofluorescence [45] | Include unstained control; use viability dyes to gate out dead cells; use fluorochromes in red channel | |
| No Foci Formation | Functional HR deficiency [42] [43] | Include positive control (HR-proficient cell line); verify DNA damage induction (γH2AX staining) |
| Improper cell cycle stage [42] | Assess cell cycle distribution; RAD51 foci primarily form in S/G2 phases | |
| MOB2/MRN complex dysfunction [11] [19] | Validate upstream HR components (e.g., MRE11, RAD50, MOB2) |
Specific Considerations for MOB2-RAD50 Research Context
When investigating MOB2-RAD50 complex formation in relation to RAD51 foci:
MOB2 Depletion Impact: hMOB2 deficiency impairs RAD51 stabilization on damaged chromatin, reducing foci formation [19]. Include MOB2-modulated cells (knockdown/overexpression) as experimental controls.
MRN Complex Connection: WDFY2 promotes MRN complex formation through direct interactions with MRE11 and NBS1, bridging MRE11-RAD50 with NBS1 [11]. Assess MRN components when RAD51 foci are impaired.
Phosphorylation Status: WDFY2 is phosphorylated at serine 84 by the ATM-CHK2 axis, priming it for recruitment to DSBs [11]. Consider phospho-specific antibodies when relevant.
Quantitative Assessment and Data Interpretation
Scoring and Analysis Criteria
Table 2: Quantitative Standards for RAD51 Foci Analysis
| Parameter | Standard Criteria | Clinical/Research Application |
|---|---|---|
| Positive Cell Threshold | ≥10 RAD51 foci per nucleus [43] | Determines HR-proficient cell population |
| Cell Cycle Gating | Geminin-positive (S/G2) cells [42] | Ensures analysis in relevant cell cycle phases |
| DNA Damage Control | γH2AX staining confirmation [42] | Verifies DSB induction regardless of HR status |
| Background Subtraction | Unstained and isotype controls [45] | Eliminates non-specific signal |
| HR Deficiency Threshold | <5 RAD51 foci per nucleus in S/G2 cells [42] | Predicts PARP inhibitor sensitivity |
Validation of Antibody Specificity
Proper antibody validation is essential for accurate RAD51 foci interpretation:
RNAi Control: Demonstrate nearly complete loss of immunofluorescence signal upon RAD51 depletion using siRNA [46].
Genetic Control: Use HR-deficient cells (e.g., BRCA1-mutant) as negative controls for RAD51 foci formation.
Western Blot Correlation: Confirm antibody specificity by Western blot showing a single band at appropriate molecular weight [46].
Research Reagent Solutions
Table 3: Essential Reagents for RAD51 Foci Assays
| Reagent | Function | Specific Examples |
|---|---|---|
| Anti-RAD51 Antibody | Primary detection of RAD51 protein | Santa Cruz Biotech (1:500) [43]; Commercial antibodies with RNAi validation [46] |
| Fluorophore-conjugated Secondary Antibodies | Signal detection | Goat anti-rabbit Alexa Fluor 594 (1:2000) [43]; Anti-rabbit FITC (1:200) [44] |
| Nuclear Counterstain | Nuclear visualization | DAPI (4′,6-diamidino-2-phenylindole) [44] [43] |
| Mounting Medium | Slide preservation | Antifade mounting medium with DAPI (Vector Laboratories) [44] |
| Blocking Reagents | Reduce non-specific binding | 1% blocking reagent (Roche) [44]; 1-3% BSA or serum [45] |
| Permeabilization Agents | Enable antibody intracellular access | 0.1% Triton X-100 [44] |
| DNA Damage Inducers | Positive control for foci formation | Ionizing radiation (4 Gy) [43]; Cisplatin (1 μM) [44] |
FAQs
Q1: How can I distinguish specific RAD51 foci from non-specific signal? A: Include rigorous controls: (1) RAD51-depleted cells via RNAi to demonstrate signal loss [46], (2) unstained and isotype controls for background subtraction [45], and (3) HR-proficient and deficient cell lines as positive and negative controls [42] [43].
Q2: What are the common pitfalls in quantifying RAD51 foci? A: Key pitfalls include: (1) analyzing cells in wrong cell cycle phases (focus on S/G2 via geminin staining) [42], (2) over-fixation damaging epitopes [45], (3) improper threshold setting for positive cells (use ≥10 foci/nucleus standard) [43], and (4) not verifying DNA damage induction with γH2AX staining [42].
Q3: How does MOB2 affect RAD51 foci formation? A: hMOB2 promotes homologous recombination by stabilizing RAD51 on damaged chromatin. hMOB2 deficiency results in impaired RAD51 foci formation and increased sensitivity to PARP inhibitors, establishing it as a regulator of HR efficiency [19].
Q4: What microscopy methods are most suitable for RAD51 foci imaging? A: For publication-quality images, confocal microscopy is recommended [47]. Ensure consistent capture parameters when comparing protein levels between samples, and show individual channels alongside merged images for clarity [47] [48].
Q5: How can I make my RAD51 images accessible to color-blind readers? A: Avoid red/green combinations; instead use magenta/green or include grayscale channels for each individual signal [48]. Many journals now require accessible color schemes, and tools like ImageJ (Image > Color > Dichromacy) can simulate color-blindness for verification [48].
Pathway Integration: MOB2/RAD50 in RAD51 Foci Formation
This technical support center is designed to assist researchers in troubleshooting and optimizing assays that investigate the relationship between the integrity of the MOB2-RAD50 complex and cellular responses to PARP inhibitors (PARPis). The MOB2-RAD50 complex is a critical component of the MRE11-RAD50-NBS1 (MRN) complex, which acts as a primary sensor of DNA double-strand breaks (DSBs) and facilitates the recruitment of activated ATM to damaged chromatin [2]. Assays measuring this complex are essential for understanding DNA damage response (DDR) signaling and predicting PARPi sensitivity, particularly in the context of BRCA-deficient tumors [49] [50]. The following guides address common experimental challenges and provide standardized protocols to ensure reliable and reproducible results.
Troubleshooting Guides
Low Signal in MOB2-RAD50 Co-Immunoprecipitation (Co-IP)
Problem: Faint or undetectable bands when probing for MOB2 or RAD50 after co-immunoprecipitation.
Solutions:
- Confirm Antibody Specificity: Validate antibodies using knockout cell lines (e.g., MOB2-knockdown or RAD50-deficient cells) to ensure the absence of non-specific bands.
- Optimize Lysis Conditions: Use a mild, non-denaturing lysis buffer (e.g., containing 0.1% Triton X-100) to preserve protein-protein interactions. Avoid repeated freezing and thawing of lysates [2].
- Increase DNA Damage Induction: Treat cells with a DNA-damaging agent (e.g., 2-4 Gy of ionizing radiation or 1-2 µM doxorubicin) 1-2 hours before lysis to enhance the MOB2-RAD50 interaction [2].
- Chromatin Fractionation: Since the functional interaction occurs on chromatin, perform a chromatin-cytosol separation. Resuspend the cell pellet in Buffer A (10 mM Pipes, 100 mM NaCl, 300 mM sucrose, 3 mM MgCl₂, 0.1% Triton X-100, and protease/phosphatase inhibitors), incubate on ice, and collect the chromatin-enriched fraction for IP [2].
High Background Noise in Immunofluorescence Staining
Problem: Excessive non-specific staining obscuring RAD50 or γ-H2AX foci quantification.
Solutions:
- Titrate Antibodies: Perform a dilution series for primary and secondary antibodies to find the optimal signal-to-noise ratio.
- Implement Stringent Washes: After antibody incubation, wash cells three times with PBS containing 0.1% Tween-20.
- Use Blocking Buffer: Block cells for 1 hour at room temperature with 5% Bovine Serum Albumin (BSA) in PBS before antibody application.
- Include Appropriate Controls: Always process negative control samples (no primary antibody) and positive controls (cells treated with, for example, 10 Gy IR) in parallel.
Poor Correlation in PARP Inhibitor Sensitivity Assays
Problem: MOB2/RAD50 complex integrity does not correlate with expected PARPi sensitivity in clonogenic survival assays.
Solutions:
- Verify BRCA Status: Confirm the BRCA1/2 proficiency or deficiency of your cell lines. The synthetic lethal effect of PARPi is most pronounced in HR-deficient backgrounds [49] [50]. Use validated isogenic models (e.g., BRCA1/2 wild-type vs. mutant pairs) for the most reliable results [51].
- Check for Compensatory Pathways: Be aware that residual HR activity or backup DNA repair pathways like RAD52-mediated single-strand annealing (SSA) can confer PARPi resistance. Consider co-inhibition of RAD52 in BRCA-deficient models [49].
- Standardize Drug Exposure Time: For long-term assays, use fresh culture medium containing PARPi and replenish it every 3-4 days. For a 28-day clonogenic assay, continuous exposure is typically required to observe complete eradication of BRCA-deficient cells [49].
Frequently Asked Questions (FAQs)
Q1: What is the biological significance of the MOB2-RAD50 interaction in the context of PARP inhibitor response?
A1: hMOB2 directly interacts with RAD50, a key component of the MRN DNA damage sensor complex. This interaction facilitates the recruitment of the entire MRN complex and activated ATM to sites of DNA damage. A fully functional MOB2-RAD50 complex promotes efficient DNA damage signaling and repair. In BRCA-deficient cells, where the homologous recombination (HR) pathway is compromised, the integrity of this complex becomes critical for survival. PARP inhibitors induce DNA damage that requires HR for repair. Therefore, cells with impaired MOB2-RAD50 complex formation may exhibit compromised DDR and heightened sensitivity to PARPi, similar to the synthetic lethality observed in BRCA-deficient cells [2] [50].
Q2: Which cell lines are most appropriate for studying MOB2-RAD50 in PARPi response?
A2: The choice of cell line is critical. The table below summarizes recommended models.
Table 1: Cell Line Models for MOB2-RAD50 and PARPi Response Research
| Cell Line | BRCA Status | Relevant Features | Best Use in Experiments |
|---|---|---|---|
| U2-OS [2] | BRCA-proficient | Suitable for chromatin recruitment studies [2] | MRN complex recruitment to chromatin |
| HCC1937 [49] | BRCA1-deficient | RAD51 foci formation is RAD52-dependent [49] | Studying backup DNA repair pathways |
| MDA-MB-436 [49] | BRCA1-deficient | Well-characterized for PARPi sensitivity [49] | Clonogenic survival assays with PARPi+RAD52i |
| ID8 Trp53-/- Brca1-/- [51] | Brca1-deficient (Murine) | Isogenic model; reflects patient tumor-like PARPi response [51] | Validating findings in a genetically controlled background |
| RPE1-hTert [2] | BRCA-proficient (Immortalized) | Near-diploid, genetically stable; used for Tet-inducible systems [2] | Studying MOB2 overexpression/knockdown without confounding genomic instability |
Q3: How can I quantitatively measure the functional output of the MOB2-RAD50 complex?
A3: Several functional assays can be used, often in combination.
Table 2: Functional Assays for MOB2-RAD50 Complex Activity
| Assay Type | What It Measures | Key Readouts |
|---|---|---|
| Neutral Comet Assay [49] | Levels of DNA double-strand breaks (DSBs) | Tail moment; increased DSBs upon PARPi treatment indicate deficient repair. |
| Immunofluorescence (Foci Formation) [49] | Recruitment of DNA repair proteins to damage sites | γ-H2AX foci (DSB marker); RAD50 or MRE11 foci (MRN complex recruitment). |
| Clonogenic Survival Assay [49] | Long-term cell reproductive viability after treatment | Colony-forming units; synergistic cell killing with PARPi+RAD52i in BRCA-deficient cells [49]. |
| HR/SSA Reporter Assay [49] | Efficiency of specific DNA repair pathways (HR, SSA) | % of GFP+ cells after I-SceI-induced DSB; residual HR/SSA activity. |
Q4: We are observing variable PARPi responses in our BRCA-wildtype cell lines. What could be the cause?
A4: PARPi sensitivity is not exclusive to BRCA1/2 mutations. Several other factors can influence the response, which is why using isogenic models is strongly recommended [51]. Key factors include:
- High PARP1 Expression: Cell lines with high PARP1 mRNA expression have been correlated with increased sensitivity to PARPis like olaparib, independent of BRCA status [51].
- Genomic Instability: Cell lines with a high fraction of altered genome may show reduced PARPi sensitivity. Models with lower genomic instability often provide cleaner, more interpretable results [51].
- Alterations in Other HR Genes: Mutations in genes like PALB2, RAD51, or RAD54 can also confer PARPi sensitivity [49].
- Status of the MRN Complex: As your research focuses on RAD50, any defect in the MRN complex (MRE11, RAD50, NBS1) could alter DDR and thus the cellular response to PARPi [2] [50].
Key Experimental Protocols
Standard Protocol: Chromatin Recruitment Assay for MOB2-RAD50
This protocol is used to assess the recruitment of the MOB2-RAD50 complex to chromatin upon DNA damage [2].
- Cell Culture and Treatment: Seed RPE1-hTert or U2-OS cells at a consistent confluence. The next day, induce DNA damage using 2-4 Gy of ionizing radiation or 1 µM doxorubicin.
- Incubation: Allow cells to recover for 1-2 hours in a CO₂ incubator at 37°C to permit protein recruitment to damage sites.
- Harvesting: Wash cells with ice-cold PBS and scrape them into a cold PBS solution.
- Chromatin-Cytosol Separation:
- Centrifuge cells at 1,000 × g for 2 min at 4°C.
- Resuspend the cell pellet in Buffer A (10 mM Pipes pH 6.8, 100 mM NaCl, 300 mM sucrose, 3 mM MgCl₂, 5 mM EDTA, 1 mM EGTA, 0.1% Triton X-100, 50 mM NaF, 0.1 mM Na₃VO₄, and protease inhibitors).
- Incubate on ice for 10 minutes to lyse the cell membrane.
- Centrifuge at 1,300 × g for 5 min at 4°C. The supernatant is the cytosolic fraction.
- Wash the pellet once with Buffer A.
- Lyse the pellet (chromatin) for 10 min at 4°C in Buffer B (3 mM EDTA, 0.2 mM EGTA, and protease inhibitors).
- Centrifuge at 1,700 × g for 5 min at 4°C. The supernatant is the chromatin-enriched fraction [2].
- Analysis: Analyze the chromatin fraction by western blotting for MOB2, RAD50, and histone H3 (loading control).
Standard Protocol: Co-Immunoprecipitation of MOB2 and RAD50
This protocol is used to confirm the direct physical interaction between MOB2 and RAD50 [2].
- Prepare Lysate: Prepare total cell lysates or chromatin-enriched fractions (as above) using a non-denaturing lysis buffer.
- Pre-clear: Incubate the lysate with Protein A/G beads for 30-60 minutes at 4°C with gentle agitation. Centrifuge to remove beads.
- Immunoprecipitation: Incubate the pre-cleared lysate with an antibody against MOB2 (or RAD50) overnight at 4°C with gentle rotation. Include a control with a non-specific IgG.
- Capture Complexes: Add Protein A/G beads and incubate for 2-4 hours at 4°C.
- Wash: Pellet the beads and wash 3-5 times with ice-cold lysis buffer.
- Elute: Resuspend beads in 2X Laemmli sample buffer and boil for 5-10 minutes.
- Analysis: Analyze the eluted proteins by SDS-PAGE and western blotting, probing for RAD50 (if you immunoprecipitated MOB2) or MOB2 (if you immunoprecipitated RAD50).
Signaling Pathways and Workflows
MOB2-RAD50 in DNA Damage Response and PARPi Sensitivity
Research Reagent Solutions
Table 3: Essential Reagents for MOB2-RAD50 and PARPi Response Research
| Reagent / Tool | Function / Application | Example & Notes |
|---|---|---|
| PARP Inhibitors | Induce replication stress and DSBs; synthetic lethality in HR-deficient cells. | Olaparib, Talazoparib; use at clinically relevant concentrations (e.g., 1-10 µM) [49]. |
| RAD52 Inhibitors | Attenuate backup DNA repair (SSA, RAD52-HR); enhances PARPi lethality. | 6-hydroxy-DL-dopa (Dopa), D-I03, F79 aptamer [49]. |
| DNA Damaging Agents | Induce defined DNA lesions to study complex recruitment and function. | Ionizing Radiation, Doxorubicin, Cisplatin [2] [49]. |
| MOB2 shRNA/Plasmids | To genetically manipulate MOB2 expression (knockdown or overexpression). | pTER constructs for shRNA; pT-Rex for inducible expression [2]. |
| Specific Antibodies | For detection, IP, and IF of target proteins. | Anti-MOB2, Anti-RAD50, Anti-γ-H2AX (DSB marker), Anti-phospho-ATM [2] [49]. |
| Isogenic Cell Line Pairs | Gold standard for controlling genetic background. | ID8 Trp53-/- vs. ID8 Trp53-/- Brca1-/- [51]. |
| HR/SSA Reporter Assays | Quantify DNA repair pathway activity. | DR-GFP (HR), SA-GFP (SSA) reporters with I-SceI expression vector [49]. |
Frequently Asked Questions (FAQs)
1. What is the therapeutic goal of silencing RAD50 in cancer research? The primary goal is to disrupt the DNA damage repair (DDR) machinery in cancer cells, thereby sensitizing them to treatments like radiotherapy (RT) and chemotherapy. The RAD50 protein is a pivotal component of the MRE11-RAD50-NBS1 (MRN) complex, which is one of the first sensors and responders to DNA double-strand breaks (DSBs). By using siRNA to knock down RAD50 expression, you can inhibit this repair pathway, preventing cancer cells from fixing therapy-induced DNA damage and leading to increased cell death [52] [53] [5].
2. What are the key challenges in delivering siRNA for RAD50 silencing? Effective siRNA delivery faces several extracellular and intracellular barriers:
- Extracellular: Short half-life in the bloodstream (6 min to 1 hour) and rapid renal clearance due to its low molecular weight; degradation by serum endonucleases; and potential activation of the immune system, leading to undesirable immunological reactions.
- Intracellular: Difficulty crossing the negatively charged plasma membrane due to siRNA's own negative charge and hydrophilicity; entrapment and degradation within endosomes/lysosomes after cellular uptake; and the critical need for escape into the cytoplasm where it can load into the RNA-induced silencing complex (RISC) [54].
3. How does the described RAD50-siRNA nanoparticle system overcome delivery challenges? The cited research uses a novel polymer-lipid based nanoparticle (RAD50-siRNA-NP) that addresses these challenges through several key features:
- Stability and Preservation: The nanoparticle formulation successfully preserves siRNA activity during circulation.
- Cellular Uptake: It facilitates cellular internalization via endocytosis.
- Lysosomal Escape: The nanoparticle is engineered to enable escape from the lysosome, a crucial step for the siRNA to reach the cytoplasm.
- Alternative Stabilization: The formulation uses a biocompatible terpolymer (polysorbate-80 and poly (methacrylic acid)-grafted starch) instead of PEG-lipid for surface stabilization, which may help avoid potential PEG-related immunogenic side effects and can enhance tumor targeting [52] [53].
4. What in vitro and in vivo evidence supports the efficacy of this approach? Recent studies in triple-negative breast cancer (TNBC) models provide strong quantitative evidence for the efficacy of RAD50-siRNA-NPs, summarized in the table below.
Table 1: Efficacy Data for RAD50-siRNA-NPs in TNBC Models
| Model | Metric | Result with RAD50-siRNA-NPs + RT vs. RT Alone | Citation |
|---|---|---|---|
| In Vitro (MDA-MB-231 cells) | DNA DSBs (γH2AX biomarker) | ~2-fold higher level | [52] [53] |
| Radiation dose for 50% colony reduction | 2.5-fold lower | [52] [53] | |
| In Vivo (Orthotopic Tumors) | RAD50 protein knockdown (via intratumoral injection) | 53% knockdown | [52] [53] |
| DNA DSBs | ~2-fold increase | [52] [53] | |
| Cancer cell apoptosis | 4.5-fold increase | [52] [53] | |
| Tumor growth inhibition | 2.5-fold increase | [52] [53] |
5. Can this strategy be applied to research on the MOB2-RAD50 complex? While the cited research focuses on the MRN complex and enhancing radiotherapy, the core methodology is directly applicable. The RAD50-siRNA-NP system is a tool for specifically and efficiently reducing cellular RAD50 protein levels. You can adapt this delivery platform to investigate how RAD50 depletion affects its interaction with other partners, like MOB2, by analyzing co-immunoprecipitation or complex formation assays post-knockdown. The principle of using nanoparticle-mediated siRNA delivery to manipulate protein expression for functional studies is universally applicable to RAD50 interactome research [52] [53].
Troubleshooting Guides
Problem 1: Poor RAD50 Knockdown Efficiency
Potential Causes and Solutions:
- Cause: Inefficient Cellular Uptake
- Solution: Verify that your nanoparticle formulation is being internalized by your cell line. Use fluorescently labelled siRNA and perform flow cytometry or confocal microscopy to track uptake. Ensure the nanoparticle size and surface charge (zeta potential) are optimized for your specific cell type [53] [54].
- Cause: Ineffective Endosomal/Lysosomal Escape
- Cause: Low siRNA Bioactivity
- Solution: Ensure the siRNA encapsulation process during nanoparticle synthesis does not damage the siRNA. Check the integrity of the siRNA post-formulation by gel electrophoresis. Always use a validated positive control siRNA (e.g., against GAPDH) in your experiments to confirm that the RNAi machinery in your cells is functional [52] [55].
Problem 2: High Cytotoxicity from Nanoparticles Alone
Potential Causes and Solutions:
- Cause: Cationic Lipid/Polymer Toxicity
- Solution: Cationic components, while useful for complexing anionic siRNA, can be membrane-disruptive and toxic. Titrate the ratio of lipid/polymer to siRNA to find the minimum effective concentration. Consider switching to or incorporating newer, more biocompatible cationic or ionizable lipids, which are less toxic, especially at high transfection efficiencies [54] [55].
- Solution: The terpolymer-based system described in the research is a promising alternative to reduce toxicity associated with other cationic delivery systems [53].
- Cause: Immune Activation
- Solution: Some siRNA sequences can trigger an innate immune response. Use siRNA designs with chemical modifications (e.g., 2'-O-methyl, 2'-fluoro) in the ribose sugar-phosphate backbone to reduce immunostimulation. Check for elevated levels of interferon or cytokine markers in your culture system if you suspect this issue [54].
Problem 3: Inconsistent Radiosensitization Effect
Potential Causes and Solutions:
- Cause: Incomplete RAD50 Knockdown
- Solution: A partial knockdown might be insufficient to disrupt the robust MRN complex. Always quantify the knockdown efficiency at the protein level by Western blotting 24-48 hours after transfection and immediately prior to radiation. Optimize the siRNA dose and timing to ensure maximal knockdown at the time of radiation [52] [5].
- Cause: Suboptimal Timing of Radiation
- Solution: The cited protocol used pretreatment with RAD50-siRNA-NPs followed by RT. The timing is critical because RAD50 levels are strongly upregulated 24 hours after RT. Administer radiation at the point of maximal RAD50 knockdown, which should be determined empirically for your system (e.g., 48-72 hours post-transfection) [52] [53].
- Cause: Compensatory DNA Repair Mechanisms
- Solution: Cancer cells may upregulate alternative DDR pathways. Consider combining RAD50 silencing with inhibitors of other key DDR proteins (e.g., ATM, ATR, DNA-PK) to achieve a more potent synthetic lethal effect and overcome redundancy [5].
Experimental Protocols for Key Assays
Protocol 1: In Vitro Radiosensitization Clonogenic Assay
Purpose: To measure the long-term ability of a single cell to proliferate and form a colony after radiation, the gold standard for determining radiosensitivity [52].
Detailed Methodology:
- Seed Cells: Seed triplicate sets of 60-mm culture dishes with a low density of cells (e.g., 200-1000 cells per dish, depending on expected survival) to ensure isolated colony formation.
- Transfect: 24 hours after seeding, treat cells with RAD50-siRNA-NPs, scrambled siRNA-NPs (negative control), or leave untreated.
- Irradiate: 48-72 hours post-transfection, expose dishes to a range of radiation doses (e.g., 0, 2, 4, 6, 8 Gy). Include non-irradiated controls for all treatment groups.
- Incubate: Return dishes to the incubator and allow cells to grow for 1-3 weeks, until visible colonies (typically >50 cells) form in the control dishes.
- Fix and Stain: Aspirate media, gently rinse with PBS, fix with methanol or ethanol for 15 minutes, and then stain with a crystal violet or methylene blue solution for 30 minutes.
- Count and Analyze: Count the number of colonies manually or with an automated colony counter. Calculate the surviving fraction (SF) for each dose: SF = (Number of colonies formed) / (Number of cells seeded × Plating Efficiency of control). Plot SF vs. radiation dose to generate survival curves.
Protocol 2: Assessing DNA Damage via γH2AX Foci Immunofluorescence
Purpose: To quantify the initial levels and repair kinetics of DNA double-strand breaks, a direct indicator of RAD50 knockdown efficacy and radiosensitization [52] [53].
Detailed Methodology:
- Culture and Treat: Seed cells on glass coverslips in a multi-well plate. Treat with RAD50-siRNA-NPs and appropriate controls.
- Irradiate and Fix: At the chosen time point post-transfection, irradiate cells (e.g., with 2 Gy) and then fix them at specific time points post-IR (e.g., 0.5, 2, 6, 24 hours) using 4% paraformaldehyde for 15 minutes. Include a non-irradiated control.
- Permeabilize and Block: Permeabilize cells with 0.5% Triton X-100 for 10 minutes and block with 5% bovine serum albumin (BSA) for 1 hour.
- Stain: Incubate with a primary antibody against phospho-histone H2AX (Ser139, γH2AX) overnight at 4°C. The next day, wash and incubate with a fluorescently labelled secondary antibody (e.g., Alexa Fluor 488) for 1 hour in the dark. Counterstain nuclei with DAPI.
- Image and Quantify: Image cells using a fluorescence microscope with a 60x objective. Acquire 50-100 random nuclei per sample. Count the number of distinct γH2AX foci within each nucleus using image analysis software (e.g., ImageJ).
- Interpret: Successful RAD50 knockdown should result in a significantly higher number of γH2AX foci at early time points and/or a persistence of foci at later time points, indicating impaired DSB repair.
Signaling Pathways and Experimental Workflows
siRNA-Mediated RAD50 Knockdown and DNA Damage Response Pathway
The following diagram illustrates the molecular mechanism by which RAD50-siRNA nanoparticles enhance radiotherapy.
Diagram: Mechanism of RAD50-siRNA Nanoparticles in Enhancing Radiotherapy.
Experimental Workflow for Evaluating RAD50-siRNA Nanoparticles
The diagram below outlines a comprehensive experimental workflow from nanoparticle preparation to data analysis.
Diagram: Experimental Workflow for RAD50-siRNA Nanoparticle Evaluation.
The Scientist's Toolkit: Research Reagent Solutions
Table 2: Essential Materials and Reagents for RAD50-siRNA Experiments
| Item | Function/Description | Example/Note |
|---|---|---|
| RAD50-targeting siRNA | The active therapeutic agent that specifically degrades RAD50 mRNA. | Design sequences complementary to the human RAD50 transcript; always use a scrambled siRNA as a negative control. |
| Polymer-Lipid Nanoparticle System | Delivery vehicle to protect siRNA and facilitate cellular uptake and endosomal escape. | Composed of lipids and a terpolymer (e.g., polysorbate-80 and PMAA-grafted starch) as an alternative to PEG [53]. |
| Cell Line Model | A biologically relevant in vitro system for testing. | Triple-negative breast cancer MDA-MB-231 cells were used in the cited study [52] [53]. |
| Ionizing Radiation Source | To induce DNA double-strand breaks and test radiosensitization. | Clinical-grade irradiators (e.g., X-ray or Cesium-137). |
| Anti-RAD50 Antibody | To validate knockdown efficiency at the protein level via Western Blot. | Ensure specificity for the RAD50 protein. |
| Anti-γH2AX (Ser139) Antibody | To detect and quantify DNA double-strand breaks via immunofluorescence. | Key biomarker for assessing DNA damage and repair kinetics. |
| Clonogenic Assay Reagents | To measure long-term cell survival and reproductive integrity after treatment. | Methanol, crystal violet stain, cell culture plates. |
| Apoptosis Detection Kit | To quantify programmed cell death (e.g., TUNEL, Annexin V assay). | Validates therapeutic efficacy at inducing cell death. |
Solving Common Pitfalls: A Practical Guide to Enhancing Assay Specificity and Reproducibility
Frequently Asked Questions (FAQs)
FAQ 1: Why is the choice of lysis buffer so critical for studying protein complexes like MOB2-RAD50? The lysis buffer is fundamental because it must achieve two competing goals: it needs to be strong enough to break open the cell and nuclear membranes to release your complex, but gentle enough to preserve the native, non-covalent interactions that hold the MOB2-RAD50 complex together. Harsh conditions can denature proteins or disrupt complex formation, leading to loss of signal and inaccurate results in your assay [56] [57].
FAQ 2: My lysis buffer contains non-ionic detergent, but my protein yield is low. What could be wrong? Low yield with a non-ionic detergent often points to incomplete lysis, especially if you are working with cells with robust walls. Yeast and fungal cells, commonly used in RAD50 studies, have tough cell walls that often require a combination of mechanical and chemical lysis. Consider incorporating a mechanical method like bead beating or sonication alongside your detergent-based buffer to ensure complete cellular disruption [56] [57].
FAQ 3: I am concerned about post-lysis degradation of my complex. How can I prevent this? To prevent degradation, your lysis protocol must inactivate proteases and phosphatases immediately upon cell rupture. This is achieved by:
- Always performing lysis on ice with pre-chilled buffers.
- Adding protease and phosphatase inhibitor cocktails to your lysis buffer fresh before each use.
- Processing lysates quickly and moving immediately to the next step, such as clarification or analysis, to minimize degradation time [56].
FAQ 4: How can I quickly check if my lysis conditions successfully preserved the MOB2-RAD50 complex? Native techniques are key for this verification. Native PAGE (Polyacrylamide Gel Electrophoresis) can show if the complex remains intact and migrates at its expected size, unlike denaturing SDS-PAGE. Furthermore, advanced techniques like Native Mass Spectrometry (nMS) with online buffer exchange (OBE) can directly assess the oligomeric state and integrity of purified complexes in a matter of minutes [58].
Troubleshooting Guide
Table 1: Common Problems and Solutions in Lysis Optimization
| Problem | Potential Cause | Recommended Solution |
|---|---|---|
| Low Protein Yield | Inefficient disruption of tough cell walls (e.g., yeast). | Combine chemical lysis with mechanical methods like bead milling or sonication [56] [57]. |
| Complex Disassembly | Buffer is too stringent (e.g., high salt, ionic detergents like SDS). | Switch to milder non-ionic (e.g., Triton X-100) or zwitterionic detergents and optimize salt concentration [56] [59]. |
| Protein Degradation | Protease activity post-lysis. | Use ice-cold buffers, include protease inhibitors, and reduce processing time [56]. |
| High Sample Viscosity | Release of genomic DNA. | Add Benzonase or DNase I to the lysis buffer to digest nucleic acids. |
| Inconsistent Results | Uncontrolled lysis conditions or timing. | Standardize all parameters: cell number, lysis duration, agitation, and temperature. |
Table 2: Lysis Buffer Additives for Complex Integrity
| Additive | Function | Example & Concentration | Consideration for MOB2-RAD50 |
|---|---|---|---|
| Detergents | Solubilize lipid membranes. | Non-ionic: 0.1-1% Triton X-100 [56]. | Preserves protein-protein interactions; ideal for co-IP. |
| Salts | Modulate ionic strength. | 150 mM KCl or NaCl [59]. | Stabilizes electrostatic interactions; essential for RAD50 oligomerization [59]. |
| Reducing Agents | Prevent disulfide bond formation. | 1 mM DTT or 5 mM β-mercaptoethanol [56]. | Maintains cysteine residues in reduced state. |
| Stabilizing Cofactors | Maintain protein activity and structure. | 1-5 mM MgCl₂, 1 mM ATP/ADP. | RAD50 is an ATPase; cofactors are critical for its functional conformation [59] [60]. |
| Enzyme Inhibitors | Prevent proteolysis and dephosphorylation. | Protease & Phosphatase Inhibitor Cocktails. | Mandatory for preserving post-translational modifications and complex integrity. |
Detailed Experimental Protocol: Optimizing Lysis for MOB2-RAD50 Co-Immunoprecipitation
This protocol provides a framework for systematically testing different lysis conditions to maximize the recovery of intact MOB2-RAD50 complexes.
Objective: To identify the optimal lysis buffer formulation for the efficient co-immunoprecipitation of the MOB2-RAD50 complex from S. cerevisiae.
Materials:
- Yeast culture expressing tagged MOB2 and/or RAD50.
- Lysis Buffers (to be tested in parallel):
- Buffer A (Mild): 20 mM HEPES pH 7.5, 150 mM KCl, 0.5% Triton X-100, 5 mM MgCl₂, 1 mM DTT, protease inhibitors.
- Buffer B (Moderate): 20 mM HEPES pH 7.5, 300 mM KCl, 1% Triton X-100, 5 mM MgCl₂, 1 mM DTT, protease inhibitors.
- Buffer C (High Stringency): 20 mM HEPES pH 7.5, 500 mM KCl, 1% NP-40, 5 mM MgCl₂, 1 mM DTT, protease inhibitors.
- Mechanical disruption system (e.g., bead beater with glass beads).
- Refrigerated centrifuge.
Method:
- Cell Harvesting: Grow yeast to mid-log phase and harvest equal cell pellets for each condition.
- Washing: Wash cells once with cold PBS supplemented with cycloheximide to arrest translation.
- Lysis:
- Resuspend each pellet in 1 mL of the respective cold lysis buffer (A, B, or C).
- Perform mechanical lysis by bead beating for 3 cycles of 30 seconds each, with 1-minute cooling intervals on ice.
- Clarification: Centrifuge the lysates at 13,000 × g for 15 minutes at 4°C to remove cell debris and insoluble material.
- Analysis:
- Take a small aliquot of the supernatant (total lysate) for SDS-PAGE and Western blotting to assess total protein levels of MOB2 and RAD50.
- Use the remainder of the supernatant for your co-immunoprecipitation protocol with an antibody against your tag.
- Evaluation: Analyze both the total lysate and the co-IP eluate by Western blot. The optimal condition is the one that yields the strongest signal for RAD50 in the co-IP with MOB2, indicating successful complex preservation.
The Scientist's Toolkit: Research Reagent Solutions
Table 3: Essential Reagents for MOB2-RAD50 Complex Analysis
| Reagent / Material | Function in Experiment | Specific Example |
|---|---|---|
| Non-ionic Detergents | Gentle solubilization of cell membranes while preserving protein-protein interactions. | Triton X-100, NP-40 [56] [61]. |
| Protease Inhibitor Cocktail | Prevents proteolytic degradation of target proteins and complexes during and after lysis. | Commercially available tablets or solutions (e.g., cOmplete Mini, Roche) [56] [61]. |
| Bead Beating System | Effective mechanical disruption for tough cell walls like those in yeast. | Glass or ceramic beads agitated at high speed [56] [57]. |
| DNase I / Benzonase | Reduces lysate viscosity by digesting genomic DNA, improving pipetting and chromatography. | Add to lysis buffer at 25-50 U/mL. |
| Online Buffer Exchange (OBE) Columns | Rapidly desalts and exchanges buffers for native mass spectrometry analysis, providing a quick check of complex integrity. | Self-packed P6 columns or commercial equivalents [58]. |
| ATP/ADP and Mg²⁺ | Essential cofactors for RAD50 ATPase activity, crucial for maintaining its correct conformational state [59] [60]. | 1-5 mM MgCl₂, 1 mM ATP. |
Workflow and Pathway Diagrams
Lysis Optimization Workflow
MOB2-RAD50 in DNA Repair Context
Validating Antibody Specificity for MOB2 and RAD50 Immunoprecipitation
The MOB kinase activator 2 (MOB2) and RAD50 complex plays a critical role in maintaining genomic stability through DNA damage response signaling. MOB2 promotes DNA damage response signaling, cell survival, and cell cycle arrest following DNA damage by interacting with RAD50, a key component of the MRE11-RAD50-NBS1 (MRN) DNA damage sensor complex [2]. This interaction facilitates the recruitment of the MRN complex and activated ATM to damaged chromatin, positioning the MOB2-RAD50 complex as essential for proper DNA repair machinery function [2]. Validating antibody specificity for immunoprecipitation (IP) experiments is therefore paramount for accurate investigation of this interaction, as improperly validated antibodies can lead to irreproducible results and incorrect scientific conclusions [62].
Antibody Validation Fundamentals
Principles of Antibody Validation
Antibody validation encompasses specificity, selectivity, sensitivity, and reproducibility to ensure accurate target detection [62]. Specificity describes the antibody's ability to discriminate between its target epitope and other epitopes, defined by its affinity for the target. Selectivity refers to whether the antibody binds exclusively to its intended analyte within a complex protein mixture. Sensitivity relates to the antibody's capacity for target detection in a given experimental setting, while reproducibility encompasses consistent antibody performance across different lots and experimental repetitions [62].
For immunoprecipitation experiments specifically, researchers should implement the six complementary pillars of antibody validation: genetic strategies, orthogonal methods, independent antibody validation, biological verification, immunocapture followed by mass spectrometry, and bioinformatic validation [62].
Application-Specific Validation
Antibodies must be validated specifically for immunoprecipitation applications, as performance varies across techniques [62]. An antibody validated for western blotting may not work effectively for IP due to differences in how the target protein is presented and the different binding conditions required. For IP experiments, antibodies must recognize their target in its native conformation within protein complexes, unlike western blotting where proteins are denatured [62].
MOB2 and RAD50 Biology
MOB2 is a conserved regulator belonging to the MOB1/phocein family that stimulates the autophosphorylation and kinase activity of STK38 and STK38L [63]. Recent research has revealed novel functions of hMOB2 in DNA damage response and cell cycle regulation, where it promotes DDR signaling, cell survival, and cell cycle arrest after exogenously induced DNA damage [2]. Under normal growth conditions, hMOB2 prevents the accumulation of endogenous DNA damage and subsequent p53/p21-dependent G1/S cell cycle arrest [2]. More recently, hMOB2 has been shown to promote homologous recombination (HR) double-strand break repair by supporting the stabilization of RAD51 on damaged chromatin [19].
RAD50 and the MRN Complex
RAD50 is a member of the structural maintenance of chromosomes (SMC) family and plays an important role in cell cycle checkpoint signaling and double-strand break repair in response to DNA damage [64]. It forms the essential MRN complex with MRE11 and NBS1, which becomes activated in response to DNA damage [64]. In normal human cells, the MRN complex acts to tether linear DNA molecules, providing a flexible link between DNA ends, with genomic instability and cancer development observed in cells with genetic mutations affecting MRN complex proteins [64]. ATM-dependent phosphorylation of RAD50 at Ser635 in response to DNA damage is particularly important for regulating downstream signaling, DNA repair, and checkpoint control [64].
The following diagram illustrates the essential DNA damage response pathway mediated by the MOB2-RAD50 interaction:
Experimental Protocols
Immunoprecipitation Protocol for MOB2-RAD50 Complex
Day 1: Cell Lysis and Preparation
- Grow cells to 70-80% confluence in appropriate medium. Treat cells with DNA damaging agent (e.g., 1-5 Gy ionizing radiation or 1µM doxorubicin) if studying DNA damage response [2].
- Wash cells twice with ice-cold PBS.
- Lyse cells using Cell Lysis Buffer (recommended: Cell Signaling Technology #9803) [65]. Avoid using RIPA buffer for co-IP experiments as it may disrupt protein-protein interactions [65].
- Add fresh protease and phosphatase inhibitors to lysis buffer (sodium pyrophosphate 2.5mM, beta-glycerophosphate 1.0mM, sodium orthovanadate 2.5mM) [65].
- Incubate cells with lysis buffer for 10 minutes on ice, then scrape and transfer to microcentrifuge tube.
- Sonicate lysates (3 pulses of 10 seconds each) to ensure nuclear rupture, DNA shearing, and optimal protein recovery [65].
- Centrifuge at 13,000 × g for 10 minutes at 4°C. Transfer supernatant to new tube.
- Determine protein concentration using Bradford or BCA assay.
Day 1: Pre-clearing and Immunoprecipitation
- Pre-clear lysate by incubating with Protein A/G beads for 30-60 minutes at 4°C to reduce non-specific binding [65].
- Centrifuge at 2,500 × g for 5 minutes and transfer supernatant to new tube.
- Add 1-5 µg of specific antibody or control IgG to 500 µg of total protein. Incubate overnight at 4°C with gentle rotation.
Day 2: Bead Capture and Washing
- Add 20-50 µl of Protein A/G beads to each sample. For rabbit antibodies, use Protein A beads; for mouse antibodies, use Protein G beads [65].
- Incubate for 2-4 hours at 4°C with gentle rotation.
- Centrifuge at 2,500 × g for 5 minutes and carefully remove supernatant.
- Wash beads 3-4 times with 1 ml ice-cold lysis buffer (5 minutes per wash with rotation).
- After final wash, completely remove supernatant.
Day 2: Elution and Analysis
- Add 2X Laemmli sample buffer to beads.
- Heat at 95-100°C for 5-10 minutes.
- Centrifuge at 10,000 × g for 1 minute and load supernatant onto gel for western blot analysis.
Essential Controls for IP Validation
Include these critical controls in every immunoprecipitation experiment:
- IgG control: Non-specific antibody to identify non-specific binding [65]
- Bead-only control: Beads without antibody to account for protein-bead interactions [65]
- Input lysate control: Total cell lysate to confirm target protein expression [65]
- Knockdown/knockout control: Lysate from cells with target protein depleted to confirm antibody specificity [62]
Troubleshooting Guide
Common Issues and Solutions
| Problem | Possible Causes | Solutions |
|---|---|---|
| Low/No Signal | Protein-protein interactions disrupted by stringent lysis conditions [65] | Use mild lysis buffer (e.g., Cell Lysis Buffer #9803) instead of RIPA; ensure sonication step included [65] |
| Low target protein expression [65] | Check expression in cell/tissue type using BioGPS or Human Protein Atlas; include positive control [65] | |
| Epitope masking [65] | Use antibody recognizing different epitope region; check epitope information on manufacturer website [65] | |
| Multiple Bands or Non-specific Binding | Non-specific binding to beads or IgG [65] | Include bead-only and isotype controls; pre-clear lysate [65] |
| Protein isoforms or post-translational modifications [65] | Check for known isoforms on UniProt; research PTMs using PhosphoSitePlus [65] | |
| High Background | Incomplete blocking | Optimize blocking conditions; use different blocking agents |
| Inadequate washing | Increase wash number or stringency; include mild detergent in wash buffer | |
| Target Signal Obscured by IgG | Heavy/light chain interference [65] | Use different species antibodies for IP and WB; use light chain-specific secondary [65] |
Research Reagent Solutions
Essential Materials for MOB2-RAD50 IP
| Reagent | Function | Recommended Products |
|---|---|---|
| Cell Lysis Buffer | Extracts proteins while preserving native interactions | Cell Signaling Technology #9803 [65] |
| Protease/Phosphatase Inhibitors | Prevents protein degradation and maintains phosphorylation | Cell Signaling Technology #5872 [65] |
| MOB2 Antibodies | Detects and immunoprecipitates MOB2 | Boster Bio A08906 (validated for WB) [63] |
| RAD50 Antibodies | Detects and immunoprecipitates RAD50 | Thermo Fisher Scientific MA1-23269 (validated for WB, IHC, IP) [66] |
| Phospho-Specific RAD50 Antibodies | Detects phosphorylation at specific sites (e.g., Ser635) | Cell Signaling Technology #14223 [64] |
| Protein A/G Beads | Captures antibody-protein complexes | Species-specific recommendations: Protein A for rabbit antibodies, Protein G for mouse antibodies [65] |
Validation Methodologies
Genetic Strategies for Specificity Confirmation
CRISPR/Cas9-mediated knockout or siRNA knockdown of MOB2 or RAD50 provides the most compelling evidence of antibody specificity [62]. Following target protein depletion, specific antibodies should show significantly reduced signal in immunoprecipitation experiments compared to wild-type controls. This approach is particularly valuable for validating antibodies against ubiquitously expressed proteins where negative control cell types are unavailable [62].
Orthogonal Validation Methods
Complementary techniques should be employed to verify IP results:
- Western Blotting: Confirm target protein size and abundance from complex mixtures [67]
- Immunofluorescence/ICC: Verify cellular localization and expression patterns [62]
- ELISA: Provide quantitative analysis of protein expression levels [67]
- Mass Spectrometry: Identify all proteins in immunoprecipitated complexes [62]
The following workflow diagram outlines the comprehensive antibody validation process for MOB2-RAD50 immunoprecipitation studies:
Frequently Asked Questions
Q1: Why should I avoid RIPA buffer for MOB2-RAD50 co-immunoprecipitation experiments? RIPA buffer contains ionic detergents like sodium deoxycholate that help disrupt nuclear membranes and solubilize cellular components but can denature proteins and disrupt protein-protein interactions [65]. Since the MOB2-RAD50 interaction may be sensitive to stringent denaturing conditions, use milder lysis buffers such as Cell Lysis Buffer #9803 to preserve native complexes [65].
Q2: How can I confirm my RAD50 antibody specifically recognizes RAD50 and not related proteins? Perform knockdown/knockout validation where RAD50 expression is reduced using siRNA or CRISPR/Cas9 [62]. A specific antibody will show significantly diminished signal in depleted cells compared to controls. Additionally, use multiple antibodies targeting different RAD50 epitopes to confirm results, and verify the antibody detects the correct molecular weight (approximately 153 kDa) [64].
Q3: What are the key controls for interpreting MOB2-RAD50 co-IP results? Essential controls include: (1) IgG control to identify non-specific binding, (2) bead-only control to account for protein-bead interactions, (3) input lysate to confirm protein expression, (4) known positive interaction control, and (5) genetic knockdown/knockout controls to confirm specificity [65] [62].
Q4: My MOB2-RAD50 IP shows multiple bands on western blot. What could cause this? Multiple bands may result from: (1) Protein isoforms or splice variants, (2) Post-translational modifications (phosphorylation, ubiquitination), (3) Protein degradation products, or (4) Non-specific binding [65]. Check databases like UniProt for known isoforms and PhosphoSitePlus for PTMs. If bands aren't present in input control, the issue may be non-specific binding to beads or IgG [65].
Q5: How does MOB2 functionally interact with the MRN complex in DNA damage response? hMOB2 interacts directly with RAD50, facilitating recruitment of the complete MRE11-RAD50-NBS1 (MRN) complex to DNA damage sites [2]. This interaction promotes homologous recombination repair by stabilizing RAD51 on resected single-strand DNA overhangs and supports DNA damage checkpoint activation [2] [19]. These functions occur independent of NDR kinase signaling, indicating a direct role for MOB2 in DNA damage response machinery [2].
Thorough validation of antibody specificity for MOB2 and RAD50 immunoprecipitation is fundamental to obtaining reliable data on this critical DNA repair complex. Implementation of genetic strategies, orthogonal validation methods, appropriate controls, and optimized buffer conditions ensures accurate detection of this interaction. Properly validated reagents and protocols enable researchers to confidently investigate the MOB2-RAD50 complex and its role in maintaining genomic stability, with potential implications for cancer research and therapeutic development.
Troubleshooting Guide: DNA Damage Induction
| Problem Area | Specific Issue | Potential Cause | Recommended Solution |
|---|---|---|---|
| DNA Damage Agent Dosage | Insufficient DDR activation | Sub-optimal concentration of DNA damaging agent [2] | Titrate doxorubicin (e.g., 0.2-1.0 µM) or IR (e.g., 2-10 Gy); confirm via γH2AX immunofluorescence [2]. |
| Excessive cell death | Concentration of DNA damaging agent is too cytotoxic [2] | Reduce dose; perform clonogenic survival assays to establish a tolerable yet effective range [2]. | |
| Cell Cycle Arrest (G1/S) | Weak or inconsistent arrest | Inefficient MOB2 knockdown or low DNA damage levels [16] | Validate MOB2 KD efficiency by immunoblotting; optimize siRNA transfection protocol [16]. |
| Arrest not observed | p53/p21 pathway impairment [16] | Use untransformed human cells (e.g., RPE1-hTert, BJ-hTert) with an intact p53 pathway [2] [16]. | |
| MRN Complex Recruitment | Defective MRN/ATM recruitment | Disruption of MOB2-RAD50 interaction [2] | Verify complex formation via co-immunoprecipitation after DNA damage [2]. |
| HR Repair Efficiency | Impaired RAD51 focus formation | hMOB2 deficiency affecting RAD51 stabilization [19] | Monitor RAD51 foci formation by immunofluorescence 6-8 hours after IR [19]. |
Frequently Asked Questions (FAQs)
Q1: What are the key biological readouts confirming successful DNA damage induction in the context of MOB2-RAD50 research? Successful DNA damage induction is confirmed by multiple molecular readouts: phosphorylation of ATM and its downstream target CHK2, the formation of γH2AX foci (marking DSB sites), and the recruitment of the MRN complex and activated ATM to damaged chromatin. In the context of MOB2 function, a successful experiment should also show that MOB2 knockdown impairs these events and sensitizes cells to DNA-damaging agents [2] [16].
Q2: My MOB2 knockdown cells are not showing the expected G1/S cell cycle arrest despite DNA damage. What could be wrong? This issue often stems from an inefficient knockdown of MOB2. First, confirm the knockdown efficiency at the protein level using immunoblotting. Second, ensure you are using untransformed human cell lines (like RPE1-hTert or BJ fibroblasts) that possess a functional p53/p21 pathway, as this arrest is p53/p21-dependent [16]. Finally, verify that your DNA damage induction is sufficient to trigger the checkpoint by checking for p21 upregulation and p53 phosphorylation.
Q3: How can I experimentally demonstrate that MOB2's role in the DDR is independent of its known regulation of NDR kinases? To dissect this, you can perform parallel experiments where you knock down MOB2 versus knock down NDR1/2. The phenotype of MOB2 loss (accumulation of DNA damage, G1/S arrest) is not phenocopied by the loss of NDR1/2, indicating an NDR-independent mechanism [16]. Furthermore, you can use a MOB2 mutant that is defective in NDR binding (such as MOB2-H157A). If this mutant can still rescue the DDR defects upon MOB2 knockdown, it confirms the existence of an NDR-independent pathway, likely through the direct interaction with RAD50 [2] [4].
Q4: We are studying homologous recombination (HR) deficiency. How is MOB2 relevant to these pathways? Recent research has identified hMOB2 as a regulator of HR. hMOB2 supports the phosphorylation and stable accumulation of the RAD51 recombinase on resected single-strand DNA overhangs, a critical step in HR-mediated repair. Consequently, deficiency in hMOB2 impairs HR efficiency and sensitizes cancer cells to PARP inhibitors, similar to other HR-deficient cells [19].
The Scientist's Toolkit: Research Reagent Solutions
| Essential Material | Function / Application in MOB2-RAD50 Assays | Key Considerations |
|---|---|---|
| RPE1-hTert / BJ-hTert Cells | Non-transformed human cell models for studying p53/p21-dependent G1/S arrest [2] [16] | Preferred over cancer lines for cell cycle checkpoint studies due to intact p53 pathways. |
| Doxorubicin | Topoisomerase II poison; induces DNA double-strand breaks for DDR activation [2] | Use in low µM range (e.g., 0.2-1 µM). Wash out for recovery experiments. |
| X-ray Irradiation (IR) | Directly induces DNA double-strand breaks; allows for precise timing of damage [2] | Typical doses range from 2-10 Gy. Confirm damage with γH2AX staining. |
| si/shRNAs targeting MOB2 | To deplete endogenous MOB2 and study loss-of-function phenotypes [2] [16] [4] | Always validate knockdown efficiency by immunoblotting. |
| Plasmids for Wild-Type & Mutant MOB2 | For rescue experiments and structure-function analysis (e.g., MOB2-H157A mutant) [4] | The H157A mutant is defective in NDR binding, useful for probing NDR-independent functions [4]. |
| Antibodies for Co-IP | To study MOB2-RAD50 protein-protein interaction (e.g., anti-MOB2, anti-RAD50) [2] | Perform co-immunoprecipitation 1-2 hours after DNA damage induction. |
| Antibodies for DDR Markers | Readouts for successful DNA damage induction (e.g., p-ATM, γH2AX, p-CHK2) [2] [16] [19] | Use for immunoblotting and immunofluorescence. |
Experimental Workflow & Protocol Details
A. Core Protocol: Inducing DNA Damage and Analyzing MOB2 Function
Methodology for assessing MOB2's role in DNA damage response and cell cycle arrest, based on published research [2] [16]:
Cell Culture and Preparation:
- Culture untransformed human cells (e.g., RPE1-hTert, BJ-hTert) under standard conditions.
- Seed cells at a consistent confluence for all experiments to ensure uniformity.
Gene Knockdown:
- Transfect cells with validated siRNAs or shRNAs targeting MOB2. A non-targeting scramble siRNA should be used as the negative control.
- Allow 48-72 hours for efficient protein knockdown before proceeding to DNA damage induction. Always confirm knockdown efficiency by immunoblotting.
DNA Damage Induction:
- Ionizing Radiation (IR): Expose cells to a defined dose of X-rays (e.g., 5-10 Gy). For the equipment used in the cited studies, irradiation was performed at a rate of 5 Gy/min [2].
- Chemical Inducers: Treat cells with doxorubicin (e.g., 0.5 µM for 4-24 hours). For recovery experiments, wash the cells three times with complete media and allow them to recover in fresh medium without the drug [2].
Downstream Analysis (1-24 hours post-damage):
- Immunoblotting: Analyze the activation of the DDR pathway by probing for phosphorylated ATM (Ser1981), CHK2, and p53. Also, check for p21 upregulation.
- Immunofluorescence: Fix cells and stain for γH2AX foci to quantify DSBs, and for RAD51 to assess homologous recombination repair [19].
- Co-Immunoprecipitation: Lyse cells 1-2 hours after damage. Use an anti-MOB2 antibody to immunoprecipitate the protein complex and probe for RAD50 to confirm interaction [2].
- Clonogenic Survival Assay: After DNA damage, re-seed cells at low density and allow them to form colonies for 10-14 days to assess long-term survival and reproductive integrity [2].
- Cell Cycle Analysis: Use flow cytometry (e.g., Propidium Iodide staining) to monitor the induction of a G1/S arrest [16].
B. Key Workflow Visualization
The following diagram illustrates the logical sequence of experiments and the expected phenotypic outcomes when investigating MOB2 function.
Signaling Pathway Diagram
The diagram below outlines the molecular signaling pathway through which MOB2 influences the DNA Damage Response, highlighting its critical interactions.
This technical support guide provides targeted strategies for a central challenge in molecular biology: capturing transient, weak protein-protein interactions. For researchers focusing on the MOB2-RAD50 complex, a key interaction in the DNA damage response [68], this is particularly critical. Such interactions are often characterized by weak affinities (in the µM range) and short lifetimes (seconds or less), making them difficult to study with conventional methods [69]. The following FAQs and troubleshooting guides are designed to help you overcome these specific experimental hurdles.
FAQs: Core Concepts and Method Selection
What makes transient protein-protein interactions so difficult to study?
Transient interactions, unlike stable complexes, are defined by several intrinsic properties that complicate their analysis [70] [69]:
- Weak Affinity: They typically have dissociation constants (Kd) in the micromolar (µM) range.
- Short Lifespan: The complexes form and dissociate rapidly, often in seconds or less.
- Context Dependency: Their occurrence is often dependent on specific cellular conditions, such as post-translational modifications (e.g., phosphorylation) or the presence of other co-factors [71].
- Disordered Regions: They are frequently mediated by intrinsically disordered protein regions, which do not have a stable structure until bound to their partner [72] [69].
Most conventional techniques, like co-immunoprecipitation (Co-IP) or yeast two-hybrid (Y2H), are biased toward detecting stable interactions and often fail to capture these fleeting events without specific modifications [71] [69].
Why is the MOB2-RAD50 interaction a relevant model for a transient complex?
Research has established that human MOB2 (hMOB2) is a novel regulator of the DNA damage response and interacts with the RAD50 component of the MRE11-RAD50-NBS1 (MRN) complex [68]. This interaction supports the recruitment of the MRN complex and activated ATM kinase to sites of DNA damage, facilitating efficient DNA repair via homologous recombination [68]. Given the dynamic nature of DNA repair signaling, the MOB2-RAD50 complex is a functionally important example of a transient interaction that requires specialized methods for its study.
What are the primary strategies for stabilizing a transient complex like MOB2-RAD50?
The two most common strategies for stabilizing transient complexes for biochemical and structural studies are:
- Chemical Crosslinking: Using membrane-permeable crosslinkers like DSS (Disuccinimidyl suberate) to covalently "freeze" interactions inside the cell before lysis [73].
- Engineering Linked Constructs: Creating a single gene construct where the minimum binding region (MBR) of one protein is fused to its binding partner using a flexible, glycine-rich peptide linker. This method effectively increases the local concentration of the binding partners, trapping the interaction [72].
Troubleshooting Guides
Guide 1: Troubleshooting Co-Immunoprecipitation (Co-IP) for Weak Interactions
| Problem | Possible Cause | Solution |
|---|---|---|
| No co-precipitated protein detected | The interaction is too weak and dissociates during washing steps. | Use crosslinkers (e.g., DSS) prior to lysis to covalently capture the complex [73]. |
| The "prey" protein is degraded. | Ensure protease inhibitors are included in the lysis buffer [73]. | |
| Low abundance or expression of the complex. | Increase the amount of lysate used for the pulldown and employ a more sensitive detection system [73]. | |
| False positive results | Non-specific binding of the "prey" protein to the antibody or resin. | Include a rigorous negative control using a non-treated affinity support (minus bait protein) [73]. |
| The antibody itself recognizes the co-precipitated protein. | Use monoclonal antibodies or pre-adsorb polyclonal antibodies against a sample devoid of the primary target [73]. |
Guide 2: Troubleshooting Crosslinking Experiments
| Problem | Possible Cause | Solution |
|---|---|---|
| No crosslinked product formed | The crosslinker is inactive or inhibited. | Use fresh crosslinkers and ensure the buffer does not contain primary amines (e.g., Tris, glycine) that would out-compete the reaction [73]. |
| Incorrect crosslinker for the application. | For intracellular crosslinking (e.g., for MOB2-RAD50), use a membrane-permeable crosslinker like DSS [73]. | |
| The pH is improper for the reaction. | Confirm that the pH is suitable for the specific crosslinker used (often pH 7.5-8.5 for amine-reactive linkers) [73]. | |
| High non-specific background | Crosslinking concentration or time is too high. | Optimize the crosslinker concentration and incubation time to minimize non-context-specific interactions. |
Guide 3: Troubleshooting Linked Constructs for Crystallography
This guide is based on a proven method for trapping transient interactions, such as between Calmodulin and its binding partners, which is analogous to trapping MOB2-RAD50 [72].
| Problem | Possible Cause | Solution |
|---|---|---|
| The fused protein is poorly expressed or insoluble | The linker is too rigid or short, causing steric hindrance. | Use a flexible, glycine-rich linker (e.g., (Gly)₅ or (Gly)₈) to allow natural docking [72]. |
| Crystals of the complex cannot be obtained | The linker disrupts the natural interaction interface. | Perform computational modeling (e.g., with DeepView) to optimize the linker length and attachment points before construction [72]. |
| The complex is not homogeneous. | Purify the linked construct using size-exclusion chromatography (SEC) and verify its monodispersity with dynamic light scattering (DLS) before crystallization trials [72]. |
Experimental Protocols
Protocol 1: Trapping Transient Complexes with a Glycine-Linked Construct
This protocol outlines a method to create a covalently linked protein-peptide complex for structural studies, ideal for situations where co-crystallization has repeatedly failed [72].
1. Identify the Minimum Binding Region (MBR):
- Use sequence analysis and existing literature to define the shortest peptide from one partner (e.g., a region of RAD50) that retains the ability to bind to the other (e.g., MOB2).
- Compare different peptide lengths (e.g., 19 aa vs. 24 aa) using Isothermal Titration Calorimetry (ITC) to select the MBR with the highest affinity [72].
2. Computational Modeling and Linker Design:
- Dock the MBR onto the structure of the full-length binding partner using software like DeepView [72].
- Measure the distance between the C-terminus of one protein and the N-terminus of the MBR in the docked model.
- Design a flexible (Gly)₅ or (Gly)₈ linker to span this distance without constraining the natural binding pose.
3. Construct the Linked Gene via Fusion PCR:
- Round 1 PCR: Amplify the gene of the full-length protein (e.g., MOB2) with a reverse primer that incorporates the linker sequence at its C-terminus.
- Round 2 PCR: Amplify the MBR gene (e.g., from RAD50) with a forward primer incorporating the same linker at its N-terminus.
- Round 3 PCR: Use the products from Rounds 1 and 2 as templates with the outermost primers to fuse the genes, creating the final
MOB2-(Gly)ₙ-RAD50-MBRconstruct [72].
4. Express and Validate the Linked Complex:
- Express the recombinant protein in a suitable system (e.g., E. coli BL21(DE3)) and purify it via Ni-NTA and Size Exclusion Chromatography (SEC).
- Characterize the complex using SEC and DLS to confirm it is well-folded, intact, and homogeneous, making it suitable for crystallization [72].
Protocol 2: Using Crosslinkers to Capture Complexes for Pull-Down Assays
Workflow Overview:
Step-by-Step Details:
- Crosslinking: Culture cells expressing your proteins of interest (e.g., MOB2 and RAD50). Add a membrane-permeable, amine-reactive crosslinker like DSS (Disuccinimidyl suberate) directly to the culture medium. Gently swirl and incubate at room temperature for 10-30 minutes [73].
- Quenching: Stop the reaction by adding Tris-HCl (pH 7.5) to a final concentration of 20-50 mM and incubate for 15 minutes to quench unreacted crosslinker.
- Cell Lysis: Wash the cells and lyse them using a standard RIPA buffer supplemented with protease inhibitors.
- Immunoprecipitation: Proceed with your standard pulldown protocol using an antibody against your bait protein (e.g., MOB2).
- Analysis: Analyze the eluted proteins by Western Blot to detect the crosslinked complex. For identifying novel partners, the sample can be analyzed by Mass Spectrometry.
The Scientist's Toolkit: Research Reagent Solutions
| Reagent / Tool | Function in Experiment | Key Consideration |
|---|---|---|
| DSS (Disuccinimidyl Suberate) | Membrane-permeable crosslinker; covalently links closely associated proteins in live cells, "freezing" transient interactions for downstream analysis [73]. | Ensure buffers are free of primary amines (e.g., Tris, Glycine) during the crosslinking reaction. |
| Glycine-Rich Linker (e.g., (Gly)₅) | A flexible polypeptide spacer used to fuse a protein to its binding partner's MBR, trapping the complex for structural studies [72]. | Length must be optimized via computational modeling to allow natural binding without steric hindrance. |
| Size Exclusion Chromatography (SEC) | A critical final purification step to isolate monodisperse, properly formed linked complexes and remove aggregates [72]. | Verifies the complex is intact and homogeneous, a prerequisite for crystallization. |
| No-Stain Protein Labeling Reagent | A fluorogenic label for total protein normalization (TPN) in Western Blots, providing a superior loading control over traditional housekeeping proteins [74]. | Essential for accurate quantitation of protein expression and interaction levels in blot-based assays. |
| Membrane-Permeable Crosslinkers | A class of reagents that can cross the cell membrane to fix intracellular protein complexes, such as the nuclear MOB2-RAD50 complex [73]. | Impermeable crosslinkers (e.g., BS³) will only work on cell surface proteins. |
Troubleshooting High Background in Chromatin Fractionation
In the context of research focused on optimizing assays for MOB2-RAD50 complex formation, a critical step involves the clean isolation of chromatin-bound proteins. High background in chromatin fractionation, where non-chromatin associated proteins contaminate the final fraction, is a frequent technical hurdle that can obscure results and lead to inaccurate conclusions about protein complex localization. This guide addresses the common causes of this issue and provides targeted solutions to ensure the integrity of your chromatin fractionation experiments.
Frequently Asked Questions (FAQs) & Troubleshooting Guide
1. What does "high background" in chromatin fractionation typically mean? High background refers to the unwanted presence of soluble, non-chromatin associated proteins in your final chromatin-enriched pellet. This contamination suggests that the separation between the soluble cytoplasmic/nuclear fraction and the chromatin-bound fraction was incomplete. In the context of studying the MOB2-RAD50 complex, which is recruited to chromatin upon DNA damage [2] [19], a dirty chromatin fraction could lead to false positives or mischaracterization of the complex's recruitment dynamics.
2. What are the most common causes of high background contamination? The primary causes often relate to lysis and wash buffer stringency. The table below summarizes these causes and their effects.
Table: Common Causes of High Background in Chromatin Fractionation
| Cause | Effect on Experiment |
|---|---|
| Insufficient Lysis Buffer Stringency | Fails to properly remove soluble proteins that are non-specifically associated with or trapped near chromatin. |
| Over-sonication of Chromatin | Can create small, soluble chromatin fragments that remain in the soluble fraction, or disrupt genuine protein-chromatin interactions. |
| Inadequate Washing of Chromatin Pellet | Leaves residual soluble proteins from the lysis buffer in the final sample. |
| Crosslinking Artifacts (if used) | Excessive crosslinking can cause protein aggregation, leading to non-specific co-precipitation of soluble proteins with chromatin [75]. |
3. How can I optimize my buffers to reduce background? Buffer composition is critical for clean fractionation. The goal is to use a lysis buffer that is stringent enough to strip away non-chromatin bound proteins while preserving genuine chromatin interactions. A typical chromatin fractionation protocol involves a series of buffers with increasing stringency [2].
Table: Optimized Buffer Components for Chromatin Fractionation
| Buffer Component | Function | Optimization Tip |
|---|---|---|
| Detergent (e.g., Triton X-100) | Solubilizes membranes and releases soluble proteins. | Use a concentration of 0.1% - 0.5% in the initial lysis buffer. Ensure it is included to prevent trapping soluble proteins [2]. |
| Salt (e.g., NaCl) | Disrupts ionic protein-protein interactions. | Titrate salt concentration (e.g., 100-300 mM) in wash buffers. Higher salt reduces non-specific binding but may disrupt weak genuine interactions. |
| Chelating Agent (e.g., EDTA/EGTA) | Chelates divalent cations, disrupting some chromatin-associated complexes. | Include in wash buffers (e.g., 3 mM EDTA, 0.2 mM EGTA) to help dissociate non-specifically bound proteins [2]. |
4. My buffers are optimized, but I still get high background. What else should I check? The mechanical preparation of chromatin is equally important. Sonication is a key step for shearing chromatin into manageable fragments, but over-sonication can be detrimental. It can create soluble chromatin fragments and artificially increase the apparent background. Always titrate your sonication conditions (power and duration) to achieve the desired DNA fragment size (200-1000 bp) with the minimal necessary energy input. Furthermore, ensure thorough but gentle washing of the chromatin pellet after each centrifugation step without disturbing the pellet itself.
5. How can I validate the quality of my chromatin fractionation? The best practice is to probe for specific protein markers in each fraction via Western blot.
Table: Essential Control Markers for Fractionation Validation
| Fraction | Valid Marker | Invalidating Marker (Indicates Contamination) |
|---|---|---|
| Soluble Cytoplasmic/Nuclear | α-Tubulin, GAPDH | Histone H3 (if strongly present) |
| Chromatin-Enriched | Histone H3 (core chromatin component) | α-Tubulin, GAPDH |
A clean chromatin fraction should show a strong signal for Histone H3 and minimal to no signal for soluble markers like α-Tubulin. In a successful MOB2-RAD50 assay, you would expect to see RAD50 and its partner MRE11 (components of the MRN complex) in the chromatin fraction after DNA damage, while their levels in the soluble fraction might decrease correspondingly [76] [19].
Detailed Optimized Chromatin Fractionation Protocol
This protocol is adapted from methodologies used in studies of DNA damage response proteins [2].
Reagents Needed:
- Buffer A: 10 mM Pipes (pH 6.8), 100 mM NaCl, 300 mM Sucrose, 3 mM MgCl₂, 5 mM EDTA, 1 mM EGTA, 50 mM NaF, 0.1 mM Na₃VO₄, 0.1% Triton X-100, 1 mM Benzamidine, 4 μM Leupeptin, 0.5 mM PMSF, 1 mM DTT.
- Buffer B: 3 mM EDTA, 0.2 mM EGTA, 1 mM Benzamidine, 4 μM Leupeptin, 0.5 mM PMSF, 1 mM DTT (pH 8.0).
Procedure:
- Harvest and Wash: Harvest cells with ice-cold PBS. Centrifuge at 1,000 × g for 2 min at 4°C. Discard supernatant.
- Initial Lysis: Resuspend the cell pellet in Buffer A. Incubate on ice for 10 minutes. This buffer, containing Triton X-100, will lyse the cell membrane and solubilize cytoplasmic and some nuclear proteins.
- Separation of Soluble Fraction: Centrifuge the lysate at 1,300 × g for 5 minutes at 4°C. Carefully transfer the supernatant – this is your soluble fraction (S1) containing cytoplasmic and nucleoplasmic proteins.
- Wash Pellet: Wash the pellet once with Buffer A to remove any remaining soluble contaminants. Centrifuge again at 1,300 × g for 5 minutes at 4°C. Discard the supernatant.
- Chromatin Solubilization: Lyse the pellet (containing crude chromatin) for 10 minutes at 4°C in Buffer B. This EDTA/EGTA-rich buffer chelates magnesium and other cations, helping to dissociate proteins and solubilize chromatin.
- Isolation of Chromatin-Enriched Fraction: Centrifuge this suspension at 1,700 × g for 5 minutes at 4°C. The resulting supernatant is your chromatin-enriched fraction (S2). The final pellet, if any, contains nuclear matrix or insoluble debris.
- Analysis: Analyze the soluble (S1) and chromatin-enriched (S2) fractions by Western blotting using the validation markers described above.
Chromatin Fractionation Workflow. This diagram outlines the key steps for separating soluble proteins from chromatin-bound proteins, highlighting the critical buffer exchange points.
The Scientist's Toolkit: Research Reagent Solutions
Table: Essential Reagents for Chromatin Fractionation and Analysis
| Reagent | Function in Assay |
|---|---|
| PIPES Buffer | Maintains stable pH during the fractionation process, which is critical for preserving protein interactions [2]. |
| Triton X-100 Detergent | A non-ionic detergent used to permeabilize cell membranes and solubilize cytoplasmic and nucleoplasmic proteins without dissolving chromatin [2]. |
| EDTA/EGTA | Chelating agents that bind divalent cations (Mg²⁺, Ca²⁺). This disrupts metalloproteinase activity and helps dissociate protein complexes from chromatin, enhancing fraction purity [2]. |
| Protease Inhibitors (PMSF, Leupeptin) | Essential to prevent proteolytic degradation of proteins during the isolation process, preserving the integrity of complexes like MOB2-RAD50 [2]. |
| Phosphatase Inhibitors (NaF, Na₃VO₄) | Preserve the phosphorylation status of proteins, which is crucial for studying DNA damage response pathways where protein activity is often phosphorylation-dependent [2]. |
| Anti-Histone H3 Antibody | A primary validation marker for the chromatin-enriched fraction via Western blot [77]. |
| Anti-α-Tubulin Antibody | A primary validation marker for the soluble cytoplasmic fraction via Western blot. |
| Anti-RAD50 / Anti-MRE11 Antibodies | For specifically assessing the recruitment of the MRN complex to the chromatin fraction in response to DNA damage in MOB2-RAD50 assays [2] [76] [19]. |
Achieving a clean chromatin fraction is a foundational technique for accurately studying chromatin-associated complexes like MOB2-RAD50. The path to low background hinges on two pillars: the precise formulation and use of sequential, increasingly stringent buffers to wash away soluble proteins, and the validation of fraction purity using well-chosen control markers. By systematically troubleshooting these areas, you can significantly improve the quality of your data and the reliability of your conclusions on complex formation and recruitment.
FAQs: Normalization in Quantitative Analysis
1. What is normalization in quantitative analysis and why is it critical for my MOB2-RAD50 assays? Normalization adjusts values measured on different scales to a common scale, which is crucial for making accurate comparisons. In your MOB2-RAD50 research, it accounts for technical variations (e.g., in protein concentration, sample loading, or signal detection) that are unrelated to the biological effect you are studying. This process reduces bias and ensures that the quantitative differences you observe in complex formation are genuine, thereby enhancing the reliability and reproducibility of your results [78].
2. My assay results are inconsistent between replicates. Could normalization help? Yes. Inconsistent replicates often stem from unaccounted technical variation. First, ensure you are correctly using biological replicates (measurements from different biological samples) rather than inflating your sample size with technical replicates (repeated measurements from the same sample), as treating technical replicates as biological ones is a form of pseudoreplication that invalidates statistical analysis [79]. Implementing a robust normalization strategy, such as using a housekeeping protein or total protein stain in your western blots, can help control for this variation and make your replicate measurements more consistent [80].
3. How do I choose the best normalization method for my data? The choice depends on your data type and experimental context. There is no single "best" method; you must empirically determine the most suitable one for your assay [81] [80]. A recommended practice is to compare the performance of different normalization methods using specific figures of merit for your quantitative model. The table below summarizes common methods:
Table: Common Normalization Methods for Quantitative Biological Data
| Method | Description | Best Use Case |
|---|---|---|
| Total Sum Scaling (TSS) | Normalizes each sample by its total signal (e.g., total lane density in a blot). | Preliminary normalization for western blots or proteomic data [81]. |
| Variance Stabilization Normalization (Vsn) | A robust method that reduces variation between technical replicates and performs well in differential analysis [82]. | Proteomic and microarray data where variance is not constant across measurements [82]. |
| Z-Score Standardization | Rescales data to have a mean of 0 and a standard deviation of 1 [78]. | Comparing results from different experiments or assays on a common scale [78]. |
| Linear Regression Normalization | Adjusts data based on a linear model, performing systematically well in various data sets [82]. | Datasets with a strong linear relationship between technical artifacts and the measured signal. |
4. What are the consequences of poor experimental design that normalization cannot fix? Normalization cannot rescue a fundamentally flawed experiment. Key design flaws include:
- Confounding Factors: An unaccounted variable that influences your results. For example, if all your control samples were processed by one technician and all treatment samples by another, you cannot distinguish the treatment effect from the technician effect [79].
- Incorrect Randomization: Failure to randomly assign samples to treatment groups can introduce bias and make groups incomparable [79].
- Underpowered Studies: Using too few biological replicates means your experiment lacks the sensitivity to detect a true effect, leading to false negatives [79].
Troubleshooting Guide: MOB2-RAD50 Complex Formation Assays
Table: Common Issues and Solutions in MOB2-RAD50 Research
| Problem | Potential Cause | Solution |
|---|---|---|
| High background noise in co-immunoprecipitation (co-IP) | Non-specific antibody binding or insufficient washing. | - Optimize antibody concentration and washing stringency.- Include an irrelevant IgG antibody as an isotype control. |
| Variable complex yield between experiments | Inconsistent cell lysis or protein quantification. | - Use a standardized lysis protocol with fresh protease inhibitors.- Normalize protein lysates using a quantitative method (e.g., BCA assay) before IP. |
| Weak or non-reproducible signal | Low expression of MOB2 or RAD50; unstable protein-protein interaction. | - Validate expression levels of both proteins via immunoblotting.- Use crosslinkers (e.g., DSP) post-lysis to stabilize transient interactions [24]. |
| Failure to detect functional consequence | Assay is not probing the correct downstream pathway. | - Monitor phosphorylation of ATM, a key kinase recruited by the MRN complex, as a functional readout [2] [83]. |
The Scientist's Toolkit: Research Reagent Solutions
Table: Essential Reagents for MOB2-RAD50 Complex Studies
| Reagent / Material | Function in the Experiment |
|---|---|
| Anti-RAD50 Antibody | For immunoprecipitation of the endogenous MRE11-RAD50-NBS1 (MRN) complex from cell lysates [2]. |
| Anti-MOB2 Antibody | For detecting MOB2 in pull-downs and western blots, and for confirming the interaction with RAD50 [2]. |
| Protein A/G Agarose Beads | Solid matrix for immobilizing antibodies to capture antigen-antibody complexes during IP. |
| Dithiobis(succinimidyl propionate) (DSP) | A cell-permeable, reversible crosslinker that stabilizes transient protein interactions for analysis [24]. |
| Control IgG | A critical negative control to establish the specificity of the IP signal. |
| Phospho-ATM (Ser1981) Antibody | To detect activated ATM as a downstream functional readout of successful MRN complex recruitment to DNA damage sites [2]. |
Experimental Workflow & Pathway Diagrams
MOB2-RAD50 Co-IP Workflow
The following diagram outlines a rigorous protocol for co-immunoprecipitation to study the MOB2-RAD50 interaction.
MOB2 in DDR Signaling Pathway
This diagram illustrates the proposed role of MOB2 in the DNA Damage Response (DDR), based on current research.
Beyond the Basics: Orthogonal Validation and Comparative Analysis with Related Pathways
Troubleshooting Guide: FAQs on MOB2 and RAD50 Genetic Manipulation
Q1: After a successful CRISPR knockout of MOB2 confirmed by genotyping, why do I still detect protein expression in my western blot?
This is a common issue often related to protein isoform expression or ineffective sgRNAs.
- Cause 1: Alternative Protein Isoforms. Your sgRNA may not target an exon common to all prominent protein isoforms. If the edit only affects some isoforms, others may still be expressed and detected [84].
- Solution: Redesign sgRNAs to target a shared early exon present in all major transcript variants of your gene. Use genomic databases like Ensembl to analyze all isoforms before designing your guides [84].
- Cause 2: Ineffective sgRNA. Some sgRNAs can induce high INDEL rates (e.g., 80%) at the genomic level but fail to abolish protein expression, often due to in-frame edits that do not trigger nonsense-mediated decay [85].
- Solution: Integrate Western blot analysis as a mandatory validation step in your knockout workflow. Use the optimized iCas9 system to rapidly screen multiple sgRNAs and select those that consistently show protein depletion [85].
Q2: What are the functional consequences of MOB2 depletion in glioblastoma (GBM) models, and how can I ensure my phenotypic assays are relevant?
MOB2 acts as a tumor suppressor in GBM. Its loss enhances malignant phenotypes, which provides a clear benchmark for your experiments.
- Expected Phenotypes: Stable depletion of MOB2 in GBM cell lines (e.g., LN-229, T98G) significantly potentiates clonogenic growth, migration, invasion, and resistance to anoikis (detachment-induced cell death) [4]. In vivo, MOB2 depletion enhances GBM cell invasion in chick chorioallantoic membrane (CAM) models [4].
- Validation: Ensure your phenotypic assays (e.g., Transwell migration/invasion, colony formation) recapitulate these known effects. Use positive control cell lines with confirmed MOB2 knockdown from published studies as a benchmark [4].
Q3: When studying the MOB2-RAD50 interaction, what is a critical consideration regarding RAD50 variants?
RAD50 is highly polymorphic, and different missense variants can have separation-of-function effects, differentially impacting the DNA damage response (DDR) and other cellular processes.
- The Challenge: Eight cancer-related RAD50 missense variants were all capable of forming the MRN complex. However, they supported the DNA damage response and mitotic progression to different extents. Some variants showed impaired function in both, while for others, these functions were separable [86].
- Solution: When performing rescue experiments with RAD50, do not assume all variants are functionally equivalent. Genotype your cell lines and carefully select the specific RAD50 variant you are working with, as this can majorly influence your experimental outcomes in DDR assays [86].
Q4: My CRISPR editing efficiency in human pluripotent stem cells (hPSCs) is low and variable. How can I optimize this system for knocking out MOB2 or RAD50?
Use an optimized, inducible-Cas9 (iCas9) system in hPSCs that has been refined for high efficiency.
- Key Optimization Parameters: Systematically refine critical factors including cell tolerance to nucleofection stress, transfection methods, sgRNA stability, nucleofection frequency, and the cell-to-sgRNA ratio [85].
- Expected Outcomes: This optimized system can achieve stable INDEL efficiencies of 82–93% for single-gene knockouts and over 80% for double-gene knockouts [85]. For sgRNA design, the Benchling algorithm provided the most accurate predictions in this system [85].
Table 1: Functional Impact of RAD50 Missense Variants on DNA Damage Response and Mitotic Progression
| RAD50 Variant | MRN Complex Formation | DNA Damage Response to Epirubicin | Mitotic Progression | Pathogenic Likelihood |
|---|---|---|---|---|
| Variant Set 1 | Capable [86] | Impaired | Slowed | Likely Pathogenic [86] |
| Variant Set 2 | Capable [86] | Impaired | Normal | Separation-of-Function [86] |
| Variant Set 3 | Capable [86] | Normal | Slowed | Separation-of-Function [86] |
Table 2: Optimized iCas9 System Performance in hPSCs for Gene Knockout
| Experiment Type | Target Gene | INDEL Efficiency | Key Parameter |
|---|---|---|---|
| Single-Gene Knockout | Not Specified | 82% - 93% | Optimized cell/sgRNA ratio & nucleofection [85] |
| Double-Gene Knockout | Not Specified | >80% | Co-delivery of two sgRNAs [85] |
| Large Fragment Deletion | Not Specified | Up to 37.5% (homozygous) | Dual sgRNA design [85] |
| Ineffective sgRNA Example | ACE2 (Exon 2) | 80% (genomic) | 0% (protein loss); required redesign [85] |
Experimental Protocols
Protocol 1: Proximity-Dependent Biotin Identification (BioID) for Mapping MOB Protein Interactomes
Purpose: To define the global interactome and proximity landscape of MOB proteins, including MOB2, in their native cellular context [87].
Methodology:
- Generate Stable Cell Lines: Create tetracycline-inducible HEK293 or HeLa Flp-In T-REx cells expressing BirA-FLAG-tagged MOB proteins (bait), BirA-FLAG, or BirA*-FLAG-EGFP (negative controls) [87].
- Induce Expression and Biotinylation: Induce bait protein expression with tetracycline and incubate with biotin to allow proximity-dependent biotinylation of neighboring proteins [87].
- Cell Lysis and Affinity Purification: Lyse cells and perform streptavidin-based affinity purification under denaturing conditions to isolate biotinylated proteins [87].
- Mass Spectrometry Analysis: Identify the purified proteins using liquid chromatography with tandem mass spectrometry (LC-MS/MS) [87].
- Bioinformatic Analysis: Compare prey protein abundances between bait and control samples to identify specific proximal interactors. Use specificity scoring (e.g., MOB Specificity Score - MoSS) to rank interactions [87].
Protocol 2: Validating MOB2's Role in DNA Damage Response and Cell Cycle Regulation
Purpose: To mechanistically investigate how MOB2 supports the DNA damage response (DDR) and cell cycle progression, independent of its role in NDR kinase regulation [2].
Methodology:
- Gene Silencing: Knock down MOB2 expression in RPE1-hTert or BJ-hTert cells using specific shRNAs delivered via lentiviral transduction [2].
- Induce DNA Damage: Treat MOB2-deficient and control cells with a DNA-damaging agent such as doxorubicin or ionizing radiation (IR) [2].
- Functional Assays:
- Clonogenic Survival Assay: Plate cells at low density after DNA damage and allow them to form colonies to assess long-term cell survival [2].
- Comet Assay: Quantify the level of endogenous DNA damage in cells under normal conditions or at various time points after exposure to IR [2].
- Cell Cycle Analysis: Use flow cytometry to profile cell cycle distribution and check for activation of G1/S checkpoints, particularly a p53/p21-dependent arrest [2].
- Mechanistic Investigation:
Signaling Pathways and Experimental Workflows
Diagram 1: MOB2 Knockdown/Knockout Functional Impact
Diagram 2: Optimized CRISPR Knockout Workflow
The Scientist's Toolkit: Research Reagent Solutions
Table 3: Essential Reagents and Tools for MOB2/RAD50 Research
| Reagent / Tool | Function / Application | Example / Note |
|---|---|---|
| Inducible Cas9 System (iCas9) | Allows tunable, high-efficiency knockout in hPSCs and other sensitive cell lines. | hPSCs-iCas9 line with AAVS1-safe harbor integration [85]. |
| Chemical-Modified sgRNA (CSM-sgRNA) | Enhances sgRNA stability within cells, improving editing efficiency. | Features 2’-O-methyl-3'-thiophosphonoacetate modifications on both ends [85]. |
| BioID Proximity Labeling | Maps protein-protein interactions and proximal proteomes in live cells. | BirA*-FLAG-tagged MOB constructs to identify novel interactors like RAD50 [87]. |
| cAMP / PKA Pathway Modulators | Investigates MOB2's role in cAMP/PKA signaling, which regulates FAK/Akt. | Forskolin (activator) and H89 (inhibitor) [4]. |
| FAK/Akt Pathway Inhibitors | Tests therapeutic potential and pathway dependency in MOB2-deficient models. | PF562271 and VS-4718 (clinical trial stage) [4]. |
| RAD50 Missense Variants | Studies separation-of-function effects on DNA repair vs. mitosis. | Validated lentiviral constructs for functional complementation assays [86]. |
For researchers investigating specific protein complexes, such as the MOB2-RAD50 complex crucial for DNA damage response, selecting and optimizing the right interaction assay is critical [2]. No single method provides a perfect picture; each has unique strengths and limitations. Co-immunoprecipitation (Co-IP), Proximity-dependent Biotin Identification (BioID), and Förster/Bioluminescence Resonance Energy Transfer (FRET/BRET) represent three foundational techniques across the spectrum of interaction detection. This guide provides a direct comparison, troubleshooting advice, and methodological protocols to help you robustly cross-validate your findings, with a particular focus on applications in DNA damage and cancer research [2] [1].
The following table provides a high-level comparison of the three techniques to guide your initial selection.
Table 1: Core Characteristics of Co-IP, BioID, and FRET/BRET
| Feature | Co-Immunoprecipitation (Co-IP) | Proximity Labeling (BioID) | FRET/BRET |
|---|---|---|---|
| Principle | Antibody-based capture of a target protein and its direct binding partners from cell lysate [88]. | Proximity-dependent biotinylation of nearby proteins by a promiscuous ligase (e.g., BirA*) fused to the bait protein in live cells [89] [90] [91]. | Energy transfer between two fluorophores/luciferases on interacting proteins, requiring very close proximity (<10 nm) [90]. |
| Detection Context | Static, in cell lysates (post-lysis) [88]. | In live cells, preserving spatial context [90] [91]. | In live cells, real-time monitoring [90]. |
| Temporal Resolution | Low (captures a snapshot at lysis) [88]. | Medium (labeling occurs over minutes to hours) [90]. | High (real-time, sub-second kinetics) [90]. |
| Spatial Resolution | None (spatial information is lost upon lysis) [88]. | Medium (~10-20 nm radius) [90] [91]. | Very High (1-10 nm) [90]. |
| Ideal for... | Confirming stable, direct protein complexes [88]. | Mapping microenvironments, identifying weak/transient interactions, and studying insoluble complexes [89] [90]. | Quantifying direct binding, kinetics, and dynamic changes in interactions [90]. |
Table 2: Detailed Practical Comparison for Experimental Planning
| Parameter | Co-IP | BioID | FRET/BRET |
|---|---|---|---|
| Throughput | Medium | Medium to High | Low to Medium |
| Key Advantages | - Mature, widely understood protocol [88]- Does not require protein fusion | - Captures weak/transient interactions [90]- Works for membrane proteins and insoluble structures [90]- Provides spatial context | - Quantifies direct binding- Provides kinetic data (affinity, rate constants)- Highly sensitive |
| Key Limitations | - Cannot capture transient interactions [89]- High background from nonspecific binding [89] [88]- Loses spatial information [90] | - Requires fusion protein expression- Labels proximal, not necessarily direct, interactors- Longer labeling times can increase background [90] | - Requires dual labeling- Strict distance limitation- Signal can be sensitive to orientation |
To visualize the fundamental working principles of these techniques, the following diagram illustrates their core mechanisms.
Technique Selection Guide
Choosing the right technique depends on the biological question. The following flowchart provides a structured decision-making aid, framed within the context of MOB2-RAD50 complex analysis.
Troubleshooting Common Problems
Co-Immunoprecipitation (Co-IP) Troubleshooting
Table 3: Common Co-IP Issues and Solutions
| Problem | Possible Cause | Solution |
|---|---|---|
| High Background/ Nonspecific Binding | - Insufficient washing [88]- Antibody concentration too high [88]- Abundant proteins (e.g., actin) binding nonspecifically | - Increase wash stringency (e.g., higher salt: 120-1000 mM NaCl) [88]- Titrate antibody to optimize signal-to-noise [88]- Pre-clear lysate [88] |
| No Interaction Detected | - Interaction is transient or weak [89] [88]- Lysis buffer disrupts the complex [88]- Antibody is low quality or epitope is masked | - Use chemical crosslinkers to stabilize the complex [88]- Test milder, non-ionic detergents (e.g., NP-40, Triton X-100) [88]- Verify antibody specificity using knockout controls [88] |
| Antibody Bands Obscure Results | Antibody heavy/light chains co-elute and appear on gel [88]. | - Crosslink antibody to beads before IP [88]- Use biotinylated antibody with streptavidin beads [88]- Use covalently immobilized anti-tag beads for tagged bait proteins [88] |
BioID Proximity Labeling Troubleshooting
Table 4: Common BioID Issues and Solutions
| Problem | Possible Cause | Solution |
|---|---|---|
| High Background in MS | - Incomplete washing [90]- Endogenous biotinylated proteins- Non-specific labeling | - Use stringent wash buffers (e.g., 0.1% SDS, 1% Triton X-100) and increase wash cycles [90]- Block with avidin/biotin pre-treatment [90]- Include rigorous negative controls (e.g., BirA*-only) [90] |
| Low or No Labeling | - Bait protein mislocalized- BirA* fusion is unstable or inactive- Insufficient biotin or labeling time | - Confirm bait localization with fluorescence microscopy [90] [91]- Verify fusion protein expression by Western blot [90] [91]- Optimize biotin concentration (typically 50 µM) and duration [90] |
| Bait Protein is Toxic | Constitutive expression of the fusion protein is toxic to cells [90]. | - Use an inducible promoter system to control expression timing [90]- Consider using Split-BioID/TurboID, where labeling activity is contingent on partner interaction [90] |
FRET/BRET Troubleshooting
Table 5: Common FRET/BRET Issues and Solutions
| Problem | Possible Cause | Solution |
|---|---|---|
| No Assay Window | - Incorrect instrument filter setup [92]- Donor and acceptor are too far apart (>10 nm)- No interaction occurring | - Verify instrument configuration and filter sets for your specific FRET/BRET pair [92]- Ensure proper positive and negative controls are used- Check protein expression and localization |
| Low Signal-to-Noise Ratio | - Low expression of donor/acceptor- Spectral bleed-through (crosstalk)- High background noise | - Optimize transfection for balanced donor/acceptor expression- Use ratiometric data analysis (Acceptor/Donor) to correct for variances [92]- Include control cells with donor or acceptor only to measure and subtract bleed-through |
| Inconsistent EC50/IC50 Values | Differences in compound stock solutions between labs or experiments [92]. | - Carefully standardize the preparation and storage of stock solutions [92]- Use internal controls in each experiment |
Experimental Protocols
Validating the MOB2-RAD50 Interaction via Co-IP
This protocol is adapted from methods used to identify RAD50 as a novel binding partner of hMOB2 [2].
- Cell Lysis: Culture RPE1-hTert or other relevant cells. Lyse cells using a mild, non-denaturing lysis buffer (e.g., containing 120 mM NaCl, 0.5% NP-40, or Triton X-100) supplemented with protease and phosphatase inhibitors. Avoid sonication or vortexing to preserve protein complexes [88].
- Pre-clearing (Optional): Incubate the cell lysate with the beaded support (e.g., Protein A/G agarose or magnetic beads) alone for 30-60 minutes at 4°C. Pellet the beads and collect the supernatant to reduce nonspecific binding.
- Immunoprecipitation: Incubate the pre-cleared lysate with an antibody against your target protein (e.g., anti-MOB2) or against a tag (e.g., anti-HA for HA-tagged MOB2) for 2-4 hours to overnight at 4°C with gentle agitation.
- Capture: Add the appropriate beaded support (e.g., Protein A/G) and incubate for 1-2 hours to capture the antibody-antigen complex.
- Washing: Pellet the beads and wash 3-4 times with cold lysis buffer. Handle samples gently during centrifugation to prevent loss of bound complexes [88].
- Elution: Elute the bound proteins by boiling the beads in SDS-PAGE sample buffer or by using a low-pH elution buffer.
- Analysis: Analyze the eluates by SDS-PAGE and Western blotting, probing for the bait (MOB2), the putative partner (RAD50), and controls for specificity.
Mapping the MOB2 Interactome using BioID
This protocol synthesizes common steps from commercial and academic service providers [90] [91] [93].
- Vector Construction: Subclone the gene for your bait protein (MOB2) into a BioID vector (e.g., pcDNA3.1-BirA, pLenti-BirA) to create an N- or C-terminal fusion with the promiscuous biotin ligase (BirA* or TurboID). Validate the construct by sequencing.
- Stable Cell Line Development: Transfect or transduce your cell line of choice (e.g., HEK293) with the fusion construct. Generate stable monoclonal lines using antibiotic selection (e.g., puromycin). Validate fusion protein expression and correct subcellular localization via Western blot and fluorescence microscopy [90] [91].
- Biotin Incubation: Add biotin (typically 50 µM) to the culture medium for the required labeling period (e.g., 16-24 hours for BioID, 10-30 minutes for TurboID) under normal physiological conditions (37°C, 5% CO₂).
- Cell Lysis and Capture: Lyse cells using a strong denaturing buffer (e.g., RIPA with 1% SDS). Incubate the clarified lysate with streptavidin-coated magnetic beads to capture biotinylated proteins. Perform stringent washes (e.g., with 2 M NaCl, 1% SDS) to minimize nonspecific binding [90].
- Mass Spectrometry (MS) Preparation: On-bead digest the captured proteins with trypsin. Desalt the resulting peptides and analyze by high-resolution LC-MS/MS.
- Data Analysis: Process raw MS data using software like MaxQuant. Compare protein identification lists from the bait sample (MOB2-BirA) against control samples (e.g., BirA-only) to filter out background and identify significantly enriched proximal interactors.
Confirming Direct Binding with FRET/BRET
- Construct Design: Create fusion constructs of your protein pair (e.g., MOB2 and RAD50) with a suitable FRET pair (e.g., CFP/YFP) or a BRET pair (e.g., Luciferase/GF2). Consider optimal tag placement (N- or C-terminal) to avoid disrupting functional domains.
- Cell Transfection: Transfect cells with a constant amount of donor construct and a titrating amount of acceptor construct to perform a saturation binding experiment. Include controls expressing donor alone and acceptor alone.
- Signal Measurement:
- For FRET: Measure donor and acceptor fluorescence after exciting the donor. The FRET efficiency is calculated from the acceptor emission upon donor excitation, corrected for bleed-through.
- For BRET: Measure the luminescence from the luciferase (donor) and the fluorescence from the acceptor. The BRET ratio is calculated as (Acceptor Emission) / (Donor Emission).
- Data Analysis: Plot the BRET/FRET ratio as a function of the acceptor/donor expression ratio. A hyperbolic curve that reaches saturation is indicative of a specific interaction. The Z'-factor can be used to assess the robustness of the assay for screening purposes [92].
Research Reagent Solutions
Table 6: Essential Reagents for Protein Interaction Studies
| Reagent / Tool | Function / Application | Key Considerations |
|---|---|---|
| Anti-HA / c-Myc Agarose | Beads with covalently immobilized antibodies for IP/Co-IP of tagged bait proteins, minimizing antibody contamination [88]. | Ideal for tagged proteins when a high-quality IP antibody for the endogenous protein is unavailable. |
| Streptavidin Magnetic Beads | High-affinity capture of biotinylated proteins in BioID and other biotin-based pulldowns [90] [91]. | Preferable to agarose for lower nonspecific binding and ease of use [88]. |
| BirA* (R118G Mutant) | The original promiscuous biotin ligase used in BioID. Activates biotin to label proximate proteins [89] [90] [91]. | Requires longer labeling times (12-24 hrs); can be less efficient than newer variants. |
| TurboID / miniTurbo | Engineered promiscuous biotin ligases with much faster labeling kinetics (minutes) than BirA* [90]. | Excellent for capturing rapid dynamics, but requires careful control of labeling time to avoid background. |
| Crosslinking Reagents (e.g., DSS, DTBP) | Stabilize transient or weak protein-protein interactions in Co-IP by forming covalent bonds [88]. | Can be used in live cells or lysates. Optimization of crosslinker length and concentration is critical. |
| LanthaScreen Eu-labeled Antibodies | Provide a long-lifetime, stable donor for TR-FRET assays, reducing background fluorescence and improving signal-to-noise [92]. | Essential for high-performance, homogeneous TR-FRET binding or cellular assays. |
FAQs: Addressing Common Queries
Q1: For studying the MOB2-RAD50 complex in DNA damage, which single technique should I start with? For an unknown complex, BioID is an excellent starting point because it can reveal the interaction neighborhood of MOB2 in live cells under DNA damage conditions, potentially identifying RAD50 and other members of the MRN complex (MRE11-RAD50-NBS1) without prior assumptions about the interaction stability [2]. This mapping can then inform targeted validation with Co-IP or FRET.
Q2: How can I be sure that an interaction identified by BioID is direct and not just from nearby proteins in the same compartment? You cannot assume direct binding from BioID alone, as it labels proteins within a ~10-20 nm radius [90] [91]. BioID results must be cross-validated with a technique that confirms direct contact. Follow up a positive BioID hit (like MOB2-RAD50) with a Co-IP (to confirm a stable complex) or, ideally, a FRET/BRET assay (which requires <10 nm proximity, strongly indicative of direct binding) [90].
Q3: My Co-IP for MOB2 consistently shows high background. What is the most critical step to optimize? The most impactful step is often increasing the stringency of your wash buffers [88]. Systematically titrating the salt concentration (NaCl from 120 mM up to 500 mM or even 1 M) can disrupt nonspecific ionic interactions without necessarily disrupting strong, specific complexes. Also, ensure you are not vortexing or harshly agitating your beads during washes, as this can disrupt true complexes [88].
Q4: Can I use BioID in animal models or primary cells to study MOB2 in a more physiological context? Yes, but it requires optimization. For in vivo models, TurboID is often preferred because it requires lower biotin doses and shorter labeling times, reducing potential toxicity [90]. For primary cells, use lentiviral delivery for stable expression of the bait-BirA* fusion protein. Careful controls are even more critical in these complex systems [90].
FAQs: Core Concepts and Differentiation
Q1: What are the key functional differences between MOB2-RAD50 and MOB1-NDR kinase interactions?
MOB2-RAD50 and MOB1-NDR represent functionally distinct complexes. The MOB2-RAD50 interaction is primarily involved in the DNA Damage Response (DDR), where MOB2 supports the recruitment of the MRE11-RAD50-NBS1 (MRN) complex and activated ATM to DNA damaged chromatin [16]. In contrast, MOB1 forms complexes with NDR1/2 kinases and functions as a core regulator in Hippo signaling and mitotic exit networks, controlling processes like cell cycle progression and morphogenesis [16] [94] [95].
Q2: How can I experimentally confirm whether my observed cellular phenotype is specifically linked to MOB2-RAD50 versus MOB1-NDR?
Knockdown approaches with phenotypic analysis are effective for differentiation. MOB2 knockdown triggers a p53/p21-dependent G1/S cell cycle arrest due to accumulated DNA damage, a phenotype not observed with NDR1/2 knockdown [16]. If your phenotype involves DDR defects (e.g., sensitivity to ionizing radiation or doxorubicin), it likely involves MOB2-RAD50. For phenotypes related to cell polarity, morphogenesis, or Hippo signaling, investigate MOB1-NDR interactions [16] [95].
Q3: What controls are essential for specificity in co-immunoprecipitation experiments?
Essential controls include:
- Vector-only transfection control to identify non-specific binding.
- Interaction specificity controls: Co-IP with MOB1 to demonstrate it does not bind RAD50, and with MOB2 to show it does not bind LATS kinases [16].
- Cellular fractionation when studying RAD50 interactions, as the MRN complex is nuclear localized [16].
- Phosphorylation status assessment for MOB1 interactions, as its binding can be phosphorylation-dependent [94].
Q4: Are there known separation-of-function mutations that specifically disrupt one interaction but not the others?
While single point mutations specifically disrupting MOB2-RAD50 have been experimentally challenging to generate [16], the field has successfully used domain-specific approaches. For RAD50, missense variants differentially affect DNA damage response versus other functions [86]. For MOB proteins, targeting specific binding surfaces has proven effective - the phosphopeptide-binding infrastructure mediates MOB1 interaction with MST1/2, while a distinct surface mediates binding to LATS and NDR kinases [94].
Troubleshooting Guides
Problem: Inconsistent MOB2-RAD50 Co-Immunoprecipitation Results
Potential Cause 1: Transient nature of the interaction The MOB2-RAD50 interaction may be transient or weak, making it difficult to capture consistently without stabilization [16] [96].
- Solution: Implement crosslinking methods prior to lysis. Use reversible formaldehyde crosslinking (1% formaldehyde for 5-10 minutes) to stabilize native complexes before purification [96].
Potential Cause 2: Interference from competing MOB2-NDR complexes Endogenous MOB2 may be sequestered in complexes with NDR kinases, reducing available MOB2 for RAD50 binding [16].
- Solution: Optimize lysis conditions using milder detergents (e.g., digitonin) and include NDR kinase competitive peptides (based on the MOB2-binding interface) during lysis to favor MOB2-RAD50 complex preservation.
Potential Cause 3: Epitope masking in tagged constructs C-terminal tags on either MOB2 or RAD50 may interfere with complex formation.
- Solution: Test multiple tag positions (N-terminal, C-terminal) and different tags (Strep-tag, FLAG, HA). Consider using the Twin-Strep-tag system, which has demonstrated success in capturing challenging interactions [96].
Problem: Differentiating Direct vs. Indirect Interactions in MOB Complexes
Potential Cause: Presence of bridging proteins or complex contamination Apparent interactions in pull-down assays may result from intermediary proteins or non-specific binding.
- Solution: Implement a combination of approaches:
- Size-exclusion chromatography with multi-angle light scattering (SEC-MALS) to determine complex stoichiometry.
- Recombinant purified protein interactions to test direct binding without cellular factors.
- Yeast two-hybrid analysis as used in the original identification of RAD50 as a MOB2 binding partner [16].
Problem: Low Signal in Endogenous Complex Detection
Potential Cause: Low abundance of native complexes or antibody sensitivity Endogenous MOB2-RAD50 complexes may be present in low quantities, particularly without DNA damage induction.
- Solution:
- Induce DNA damage using γ-irradiation (5-10 Gy) or topoisomerase II inhibitors (e.g., 1μM doxorubicin) 1-2 hours before harvesting to enhance complex formation [16].
- Use proximity ligation assays (PLA) with validated antibodies to visualize endogenous complexes in situ.
- Implement tandem affinity purification with the TIE-UP-SIN method, which combines metabolic labeling with crosslinking for enhanced sensitivity [96].
Experimental Protocols & Data Analysis
Validated Protocol: Co-IP for MOB2-RAD50 with Crosslinking
Materials:
- Reversible crosslinker: 1% formaldehyde in PBS
- Quenching solution: 1.25M glycine (final concentration 125mM)
- Lysis buffer: 50mM HEPES (pH7.4), 150mM NaCl, 1% digitonin, protease/phosphatase inhibitors
- Immunoprecipitation: Anti-MOB2 antibody (validated) or Strep-Tactin beads for tagged MOB2
Procedure:
- Crosslinking: Treat cells with 1% formaldehyde for 10min at room temperature with gentle agitation.
- Quenching: Add glycine to 125mM final concentration, incubate 5min.
- Wash: Rinse cells twice with ice-cold PBS.
- Lysis: Harvest cells in lysis buffer, incubate 30min on ice with occasional vortexing.
- Clarification: Centrifuge at 16,000×g for 15min at 4°C.
- Immunoprecipitation: Incubate supernatant with antibody-bound beads for 2h at 4°C.
- Washing: Wash beads 4× with lysis buffer (5min each).
- Elution: Use 2× Laemmli buffer with 5% β-mercaptoethanol at 95°C for 30min to reverse crosslinks.
- Analysis: Proceed to Western blot with RAD50 and MOB2 antibodies.
Quantitative Comparison of MOB Protein Interactions
Table 1: Key Characteristics of MOB Protein Complexes
| Parameter | MOB2-RAD50 | MOB2-NDR | MOB1-NDR | MOB1-LATS |
|---|---|---|---|---|
| Primary Function | DNA Damage Response | Cell Cycle Progression | Hippo Signaling, Mitotic Exit | Hippo Tumor Suppressor Pathway |
| Interaction Strength | Transient, requires stabilization [16] | Stable [16] | Stable, phosphorylation-dependent [94] | Stable, phosphorylation-dependent [94] |
| Cellular Localization | Nuclear [16] | Cytoplasmic/Nuclear [16] | Cytoplasmic/Nuclear [94] | Cytoplasmic/Nuclear [94] |
| Response to DNA Damage | Enhanced complex formation [16] | Unknown | Possibly regulated | Possibly regulated |
| Competitive Binding | Not observed with MOB1 [16] | Competes with MOB1 for NDR binding [16] | Competes with MOB2 for NDR binding [16] | Not competitive with NDR binding [94] |
Table 2: Troubleshooting Matrix for Common Experimental Issues
| Problem | MOB2-RAD50 Assay | MOB1-NDR Assay | Specificity Controls |
|---|---|---|---|
| No Interaction Detected | Implement formaldehyde crosslinking [96] | Check MOB1 phosphorylation status [94] | Test reciprocal co-IPs |
| High Background | Optimize digitonin concentration (0.5-1%) | Increase salt wash (250-500mM NaCl) | Include vector-only control |
| Inconsistent Between Replicates | Induce DNA damage for synchronization [16] | Maintain consistent phosphorylation conditions | Use stable isotope normalization [96] |
| Weak Signal | Tandem affinity purification [96] | Enhance MST1/2 kinase activity [94] | Increase protein input |
Research Reagent Solutions
Table 3: Essential Research Reagents for MOB Interaction Studies
| Reagent | Specific Application | Function/Utility | Validation Tips |
|---|---|---|---|
| Twin-Strep-Tag System | Affinity purification of MOB complexes | High specificity, mild elution conditions [96] | Compare tagged vs. endogenous protein localization |
| Formaldehyde (1%) | Reversible crosslinking | Stabilizes transient interactions [96] | Optimize incubation time (5-15min) for each cell type |
| 15N Isotope Labeling | Quantitative MS (TIE-UP-SIN method) | Internal standard for interaction quantification [96] | Confirm labeling efficiency (>95%) by MS |
| Digitocin Lysis Buffer | Membrane protein complex preservation | Mild detergent maintains protein complexes [96] | Compare efficiency with NP-40, Triton X-100 |
| Phos-tag Gels | Monitoring MOB1 phosphorylation | Detects phosphorylation-dependent mobility shifts [94] | Treat cells with phosphatase inhibitors during lysis |
Method Visualization Workflows
MOB Complex Specificity Testing Workflow
MOB Protein Interaction Network
TIE-UP-SIN Method for Enhanced PPI Detection
FAQ: Unraveling MOB2's Primary DNA Repair Function
Question: What is the definitive role of hMOB2 in DNA repair pathways, and how does it differ from its other cellular functions?
Answer: Research has firmly established that hMOB2 is a key regulator of the homologous recombination (HR) pathway for double-strand break (DSB) repair [7] [23] [19]. Its role is distinct from previously reported interactions with NDR kinases. While hMOB2 was initially characterized as an inhibitor of NDR1/2 kinases, its critical function in preventing endogenous DNA damage accumulation operates independently of NDR signaling [2] [16]. The core mechanism involves hMOB2's interaction with the RAD50 component of the MRN (MRE11-RAD50-NBS1) complex, which facilitates the recruitment of this essential DNA damage sensor to damaged chromatin [2]. Subsequently, hMOB2 supports the phosphorylation and stable accumulation of the RAD51 recombinase on resected single-strand DNA overhangs, a vital step for error-free HR repair [7].
FAQ: Troubleshooting MOB2-RAD50 Interaction Assays
Question: What are the common challenges in confirming MOB2-RAD50 complex formation, and how can they be resolved?
Answer: A significant challenge is that, although the interaction between hMOB2 and RAD50 has been validated via yeast two-hybrid screens and co-immunoprecipitation, generating point mutants that specifically disrupt this binding has proven difficult [16]. This can hinder functional studies aiming to link the interaction directly to phenotypic outcomes.
Troubleshooting Guide:
- Problem: Inability to co-immunoprecipitate endogenous MOB2 and RAD50.
- Solution: Ensure proper cell lysis conditions that preserve protein complexes. Use crosslinking agents if the interaction is transient or weak. Verify the specificity of your antibodies with knockout cell controls.
- Problem: Unclear functional readout of the MOB2-RAD50 interaction in HR assays.
- Solution: Employ well-established HR reporter assays (e.g., DR-GFP) in parallel. A successful MOB2-RAD50 interaction should be necessary for efficient HR repair, measured by reporter reconstitution [7]. Correlate interaction defects with HR deficiency markers, such as impaired RAD51 foci formation.
FAQ: Validating HR-Specific Deficiencies in MOB2-Depleted Cells
Question: How can I confirm that the DNA repair defect observed in my MOB2-knockdown model is specific to homologous recombination and not other pathways?
Answer: To conclusively demonstrate HR-specific deficiency, a multi-assay approach is required. The table below summarizes key experiments and the expected outcomes for an HR defect.
Table 1: Experimental Stratification for Verifying HR Deficiency in MOB2-Depleted Cells
| Assay Type | HR-Specific Readout | Expected Result with MOB2 Loss | Alternative Pathway Readout (Control) |
|---|---|---|---|
| Reporter-Based Repair Assay [7] | DR-GFP (Homologous Recombination) | Significant reduction in GFP+ cells | EJ5-GFP (Non-Homologous End Joining) |
| RAD51 Foci Formation [7] [19] | IR-induced RAD51 nuclear foci | Impaired formation/stabilization of foci | ⬌ 53BP1 foci (NHEJ-related) may be unchanged or increased |
| Clonogenic Survival [7] | Sensitivity to PARP inhibitors (Olaparib, Rucaparib) | Marked reduction in survival | Sensitivity to other DNA damaging agents can be compared |
Experimental Protocol: RAD51 Foci Immunofluorescence Assay
- Cell Preparation: Seed cells on coverslips and transfer to media containing 10 µM BrdU 24 hours before irradiation.
- DNA Damage Induction: Irradiate cells with 10 Gy IR or treat with a relevant DSB-inducing agent.
- Fixation and Permeabilization: At 4-6 hours post-IR, fix cells with 4% paraformaldehyde for 15 minutes and permeabilize with 0.5% Triton X-100 for 5 minutes.
- Denaturation and Staining: Denature DNA with 3M HCl for 15 minutes, then neutralize with 0.1M Sodium Borate. Block with 5% BSA and incubate with anti-RAD51 primary antibody overnight at 4°C.
- Visualization and Quantification: Incubate with fluorescent secondary antibody and counterstain with DAPI. Score RAD51 foci in at least 50 BrdU-positive (S-phase) nuclei per condition [7].
Scientist's Toolkit: Key Reagents for MOB2 and DNA Repair Research
Table 2: Essential Research Reagents for MOB2-RAD50 and HR Pathway Studies
| Reagent / Material | Function / Application | Key Details / Example |
|---|---|---|
| hMOB2 Antibodies | Detection and localization of endogenous hMOB2. | Rabbit monoclonal antibodies (e.g., from Epitomics) [7]. |
| siRNA/shRNA for MOB2 | Knockdown of MOB2 expression to study loss-of-function. | Qiagen; sequences available upon request from cited studies [2] [7]. |
| PARP Inhibitors | Selective targeting of HR-deficient cells. | Olaparib, Rucaparib, Veliparib [7] [19]. |
| HR Reporter Cell Lines | Quantitative measurement of HR repair efficiency. | U2OS DR-GFP cell line [7]. |
| RAD51 Antibodies | Assessing HR functionality via foci formation. | Critical for immunofluorescence to visualize active HR repair [7]. |
Diagram 1: MOB2 in HR Pathway
FAQ: Interpreting MOB2 Expression in Cancer Models
Question: We observe variable MOB2 expression in patient-derived cancer models. What is the clinical and functional significance of this finding?
Answer: Variable MOB2 expression has significant implications for cancer biology and therapy. The human MOB2 gene displays loss of heterozygosity (LOH) in over 50% of bladder, cervical, and ovarian carcinomas [2] [7]. Reduced MOB2 expression correlates with increased overall survival in ovarian carcinoma patients, likely due to accumulated genomic instability [7] [19]. Functionally, low MOB2 levels create a synthetically lethal interaction with PARP inhibitors. Because MOB2 deficiency impairs HR, cancer cells become reliant on PARP-mediated backup repair pathways. Inhibiting PARP in this context leads to cell death [7] [23]. Therefore, assessing MOB2 status may serve as a predictive biomarker for patient stratification in therapies targeting HR deficiency.
Correlating Complex Formation with Functional HR Deficiency using RAD51 Biomarkers
Core Concepts: RAD51 as a Functional HRD Biomarker
What is the primary advantage of using RAD51 foci as a biomarker over genomic scar assays?
Genomic scar assays (e.g., HRD scores based on LOH, TAI, LST) reflect the historical accumulation of genomic instability in a tumor and may persist even after HR function has been restored through resistance mechanisms. In contrast, RAD51 foci formation is a functional biomarker that measures the real-time capacity of a cell to perform the critical step in homologous recombination (HR) where RAD51 protein assembles on single-stranded DNA at sites of damage. This provides a direct readout of current HR proficiency, which can change due to reversion mutations or other adaptive resistance mechanisms [97] [42] [98].
How does the MOB2-RAD50 complex relate to RAD51 function in the HR pathway?
Research indicates that hMOB2 promotes homologous recombination by stabilizing RAD51 on resected chromatin at DNA damage sites. hMOB2 deficiency impairs RAD51 stabilization and sensitizes cancer cells to PARP inhibitors, suggesting it functions as a regulator of RAD51-dependent HR [19]. The MRN complex (MRE11-RAD50-NBS1) acts earlier in the HR pathway as a sensor of double-strand breaks and initiates end resection, creating the single-stranded DNA substrate upon which RAD51 filaments form [97]. Therefore, optimal MOB2-RAD50 complex formation may be crucial for efficient RAD51 recruitment and foci formation, making it an important factor in RAD51 biomarker assays.
Implementation & Protocols
What are the key methodological approaches for assessing RAD51 foci formation?
Table 1: Primary Methodologies for RAD51 Foci Detection
| Method | Principle | Sample Requirement | Key Output | Advantages |
|---|---|---|---|---|
| RAD51-FFPE Test [98] | Detects endogenous RAD51 foci in formalin-fixed paraffin-embedded tissue using immunofluorescence | Diagnostic FFPE tumor blocks | Percentage of RAD51-positive geminin-positive cells | Clinically applicable, uses routine pathology specimens |
| RECAP Test [98] | Measures RAD51 foci formation after ex vivo irradiation of fresh tumor tissue | Fresh tumor specimens | RECAP score (% RAD51+/GMN+ cells) | Gold standard for functional HR status |
| RAD51 Immunofluorescence with Cell Cycle Markers [42] | Co-staining for RAD51 and geminin to restrict analysis to S/G2 phase cells | Fresh frozen or FFPE tissue | RAD51 foci count per nucleus in proliferating cells | Controls for cell cycle effects on RAD51 expression |
What is the detailed protocol for the RAD51-FFPE test?
Workflow Overview:
Step-by-Step Protocol:
- Sectioning: Cut 4μm sections from FFPE tumor blocks and mount on charged slides.
- Deparaffinization and Antigen Retrieval:
- Deparaffinize in xylene (2 × 5 minutes)
- Rehydrate through graded ethanol series (100%, 96%, 70%)
- Perform heat-induced epitope retrieval in 10mM Tris/1mM EDTA buffer (pH 9.0) using a microwave (12 minutes at 95°C)
- Blocking: Block endogenous peroxidase with 0.3% H₂O₂ and incubate with wash buffer containing 1% BSA for 15 minutes.
- Primary Antibody Incubation: Simultaneously incubate with:
- Mouse anti-γH2AX (1:1000, MilliporeSigma #05-636)
- Rabbit anti-Geminin (1:500, ProteinTech #10802-1-AP)
- Goat anti-RAD51 (1:100, GeneTex #GTX70230)
- Incubate overnight at 4°C in a humidified chamber
- Secondary Antibody Detection: Incubate with species-appropriate fluorescently-labeled secondary antibodies (Alexa Fluor conjugates recommended) for 1 hour at room temperature.
- Mounting: Mount with antifade medium containing DAPI for nuclear counterstaining.
- Imaging: Acquire z-stack images using a confocal microscope (63× oil objective recommended).
- Quantification: Score a minimum of 40 geminin-positive nuclei per sample. A cell is considered RAD51-positive if it contains ≥2 distinct RAD51 foci. Calculate the percentage of RAD51-positive cells among geminin-positive cells [98].
How is the RAD51-FFPE test calibrated and validated?
Table 2: RAD51-FFPE Test Validation Parameters
| Parameter | Optimal Value | Validation Method | Clinical Correlation |
|---|---|---|---|
| RAD51 Foci Cut-off | ≥2 foci/nucleus | Receiver operating characteristic (ROC) analysis against RECAP test | 90% sensitivity for BRCA-deficient tumors |
| HRD Threshold | ≤15% RAD51-positive cells | Comparison with RECAP scores on matched specimens | 87% sensitivity for RECAP-HRD tumors |
| Quality Control | Sufficient endogenous DNA damage (γH2AX staining) | γH2AX/Geminin co-staining | Ensures valid assay conditions |
| Sample Adequacy | ≥40 geminin-positive tumor cells | Microscopic evaluation | Provides statistical power for analysis |
Troubleshooting Guide
What are common challenges in RAD51 foci quantification and their solutions?
Table 3: Troubleshooting RAD51 Biomarker Assays
| Problem | Potential Causes | Solutions | Validation Approach |
|---|---|---|---|
| High Background/Non-specific Staining | Incomplete blocking, antibody concentration too high, insufficient washing | Optimize blocking serum concentration, titrate antibodies, increase wash stringency | Include no-primary-antibody control |
| Weak or No RAD51 Staining | Improper antigen retrieval, antibody degradation, insufficient endogenous damage | Optimize antigen retrieval pH/time, validate antibodies, confirm γH2AX positivity | Use positive control tissue (e.g., untreated breast cancer) |
| Low Geminin-Positive Cells | Low proliferation index, poor tissue quality, suboptimal geminin staining | Extend counting to more fields, ensure tissue viability >70%, optimize geminin antibody | Correlate with Ki67 staining if available |
| Variable Foci Counts Between Observers | Subjective foci identification, different focal planes | Implement automated image analysis, establish standardized counting criteria, use z-stack projections | Calculate inter-observer concordance (kappa statistic) |
| Discordance with Genomic HRD Tests | Temporal differences (historical scars vs. current function), restored HR capacity | Interpret as potentially true biological difference; investigate reversion mutations | Perform BRCA1/2 sequencing to identify reversions |
How can RAD51 assay variability be minimized?
Standardize Sample Processing:
- Use consistent fixation times (≤24 hours for optimal antigen preservation)
- Employ validated lot-controlled antibody batches
- Include reference control samples in each staining run
Implement Robust Quantification Methods:
- Use threshold-based automated image analysis when possible
- Establish internal scoring guidelines with example images
- Train multiple observers using standardized training sets
Control for Assay Performance:
- Include known HR-proficient and HR-deficient controls
- Verify sufficient endogenous DNA damage via γH2AX staining
- Ensure adequate tumor cellularity (>30%) and proliferation
Research Reagent Solutions
What are the essential reagents for RAD51 complex formation assays?
Table 4: Key Research Reagents for RAD51 Biomarker Studies
| Reagent | Function | Example Products | Application Notes |
|---|---|---|---|
| Anti-RAD51 Antibody | Detect RAD51 protein and foci formation | GeneTex #GTX70230; Abcam ab133534; MilliporeSigma 07-1780 | Validate for immunofluorescence; species compatibility |
| Cell Cycle Marker Antibodies | Identify S/G2 phase cells for normalized scoring | Geminin (ProteinTech 10802-1-AP); Ki67 (DAKO M7240) | Critical for normalizing to proliferating cell population |
| DNA Damage Marker Antibodies | Confirm presence of endogenous DNA damage | γH2AX (MilliporeSigma 05-636); 53BP1 (Novus Biologicals NB100-304) | Quality control for assay validity |
| Fluorescent Secondary Antibodies | Detect primary antibodies with high sensitivity | Alexa Fluor conjugates (Invitrogen); Cy3/Cy5 conjugates (Jackson ImmunoResearch) | Minimize cross-species reactivity |
| Mounting Media with DAPI | Nuclear counterstain and antifade protection | Vectashield with DAPI; ProLong Gold Antifade | Ensure photostability for imaging |
| Optical Imaging System | High-resolution foci visualization | Confocal microscope (63× oil objective) | Z-stack capability essential for accurate foci counting |
Advanced Applications & Integration
How can RAD51 testing complement next-generation sequencing in clinical research?
In metastatic prostate cancer research, RAD51 immunofluorescence identified HRR deficiency with 21% of evaluable samples showing RAD51-low scores, demonstrating high sensitivity and specificity for detecting tumors with BRCA1/2 alterations. Patients with RAD51-low scores experienced significantly longer progression-free survival on PARP inhibitors or platinum chemotherapy. This functional assay is particularly valuable when tissue availability is limited for comprehensive NGS or when discordance is suspected between genetic markers and treatment response [99].
What emerging biomarkers show promise for enhancing HRD assessment?
Long Non-coding RNAs: A 2025 study identified 29 lncRNAs that stratify high-grade serous ovarian tumors by HRD status, with ENSG00000272172.1 showing significant upregulation in HRD-positive tumors and detectability in plasma, suggesting potential as minimally invasive biomarkers [100].
Integrated Multi-omics Approaches: Advanced frameworks combine:
- Genomic assays (Myriad myChoice CDx, FoundationOne CDx)
- Functional assays (RAD51 foci)
- Epigenetic analysis (BRCA1/RAD51C methylation) This integrated approach captures the full HRD spectrum, including non-BRCA defects [97].
What is the mechanistic basis for RAD51 filament formation and its regulation?
The "Sort, Stack & Extend" (SSE) mechanism describes how mediator proteins coordinate Rad51 filament assembly:
- Sorting: Rad52 uses its disordered C-terminus to sort polydisperse Rad51 into discrete monomers
- Stacking: The Rad52-Rad51 complex preferentially binds near ssDNA-dsDNA junctions on RPA-coated DNA
- Extending: Rad55-Rad57 paralogs promote further Rad51 recruitment and filament extension [101] [20]
This mechanistic understanding is crucial for interpreting abnormal RAD51 foci patterns in functional assays and provides insights into potential points of assay failure or biological dysfunction.
MOB2 Expression and Survival Data: A Clinical Correlation Table
The correlation between MOB2 expression and patient survival is cancer-type specific. The table below summarizes key clinical data from public datasets.
Table 1: Correlation of MOB2 Expression with Patient Survival Outcomes
| Cancer Type | Expression in Tumor vs. Normal | Prognostic Value | Associated Signaling Pathways | Data Source |
|---|---|---|---|---|
| Glioblastoma (GBM) | Significantly downregulated at mRNA and protein levels [102]. | Low expression correlates with poor overall survival (p=0.00999) [102]. | FAK/Akt pathway inhibition; cAMP/PKA signaling [102]. | TCGA; Patient specimens [102]. |
| Glioma | Downregulated in high-grade vs. low-grade gliomas [102]. | Confirmed as a prognostic marker (p<0.001); unfavorable with low expression [103]. | Not specified in source. | Human Protein Atlas (TCGA) [103]. |
| Renal Cancer (KIRC) | Information not specified in sources. | Validated prognostic marker (p<0.001); favorable with high expression [103]. | Not specified in source. | Human Protein Atlas (TCGA) [103]. |
| Ovarian Carcinoma | Loss of heterozygosity (LOH) in >50% of cases [102] [2]. | Reduced expression correlates with increased overall survival [19]. | Homologous Recombination (HR) DNA repair [19]. | TCGA [102] [19] [2]. |
Core Experimental Protocols for MOB2 Research
Protocol: Measuring MOB2 Expression and Its Functional Impact on Migration/Invasion
This protocol is adapted from studies investigating MOB2 as a tumor suppressor in glioblastoma [102].
Key Reagents:
- Cell Lines: GBM cell lines with varying endogenous MOB2 levels (e.g., LN-229, T98G for high; SF-539, SF-767 for low).
- Plasmids: pCDH-MOB2 (for overexpression) and shRNA lentiviral constructs (for knockdown).
- Assay Kits: BrdU assay (proliferation), Transwell chambers with/without Matrigel (migration/invasion), colony formation assay.
Methodology:
- Generate Stable Cell Lines:
- Create MOB2-knockdown cells (e.g., LN-229-shMOB2) using lentiviral shRNA.
- Create MOB2-overexpressing cells (e.g., SF-767-pCDH-MOB2) using lentiviral expression vectors.
- Validate modulation efficiency via immunoblotting [102].
- Perform Functional Assays:
- Proliferation: Seed cells in 96-well plates and measure proliferation rates over 72 hours using a BrdU assay [102].
- Migration: Seed serum-starved cells into the upper chamber of a Transwell insert. Place complete growth medium in the lower chamber as a chemoattractant. After 24-48 hours, fix, stain, and count cells that migrated to the lower side of the membrane [102].
- Invasion: Perform the same steps as the migration assay, but pre-coat the Transwell membrane with Matrigel to simulate the extracellular matrix [102].
- Clonogenic Growth: Seed a low number of cells (e.g., 3,000 per dish) and allow them to grow for 7-14 days. Fix, stain, and count the resulting colonies [102].
- In Vivo Validation (CAM Assay):
- Implant stable GBM cells onto the chorioallantoic membrane of chick embryos.
- After several days, analyze tumors for invasion into the surrounding host tissue and quantify Ki67 positivity as a marker of proliferation [102].
Figure 1: Experimental workflow for analyzing MOB2's role in cancer cell phenotypes.
Protocol: Investigating MOB2-RAD50 Complex in DNA Damage Response (DDR)
This protocol is based on research identifying MOB2's role in homologous recombination [19] [2] [104].
Key Reagents:
- siRNA/shRNA: Targeting MOB2.
- Antibodies: Anti-RAD51, anti-γH2AX, anti-phospho-RAD51 (Thr309), anti-RAD50.
- Chemicals: PARP inhibitors (e.g., Olaparib), ionizing radiation (IR), mitomycin C (MMC).
Methodology:
- Induce DNA Damage and Deplete MOB2:
- Assess HR Repair Efficiency:
- Analyze Protein Interactions and Chromatin Recruitment:
- Co-Immunoprecipitation (Co-IP): Lyse cells and perform Co-IP using an anti-MOB2 antibody. Immunoblot for RAD50 to confirm interaction [2].
- Chromatin Fractionation: Separate chromatin-bound proteins from cytosolic and nucleoplasmic proteins after DNA damage. Immunoblot chromatin fractions for RAD50, MRE11, NBS1, and phosphorylated ATM to assess recruitment [2].
- Evaluate Cell Survival:
- Perform clonogenic survival assays after MOB2 knockdown and treatment with PARP inhibitors or other DSB-inducing agents [19].
The Scientist's Toolkit: Key Research Reagent Solutions
Table 2: Essential Reagents for MOB2-RAD50 Complex and Functional Studies
| Reagent / Assay | Specific Example / Catalog Number | Critical Function in Experiment |
|---|---|---|
| MOB2 Antibodies | HPA046313 (for IHC) [103] | Detecting endogenous MOB2 protein expression and localization in tissues and cells. |
| DDR Antibodies | Anti-RAD51, Anti-γH2AX, Anti-RAD50 | Visualizing DNA damage foci (γH2AX), HR repair (RAD51), and complex formation. |
| Expression Vectors | pCDH-MOB2 (with V5-tag) [102] | For stable overexpression of MOB2 in cell lines with low endogenous expression. |
| Knockdown Tools | Lentiviral shRNA constructs [102] | For stable knockdown of MOB2 to study loss-of-function phenotypes. |
| DNA Damage Inducers | Ionizing Radiation, Mitomycin C (MMC), PARP inhibitors (Olaparib) [19] | Inducing DSBs and replication stress to activate the DDR and test repair proficiency. |
| HR Repair Reporter | DR-GFP plasmid [104] | Quantifying the efficiency of homologous recombination repair in living cells. |
Troubleshooting Guide & FAQs
FAQ 1: We found low MOB2 expression in our patient-derived GBM samples. How can we experimentally validate if this loss is functionally driving the cancer's aggressiveness?
Answer: Follow a two-pronged experimental approach:
- Gain-of-function: Stably overexpress MOB2 in a GBM cell line with low endogenous levels (e.g., SF-767). Subsequently, perform the functional assays outlined in Protocol 2.1. You should observe a significant suppression of clonogenic growth, migration, and invasion in vitro, and reduced tumor invasion in the CAM model [102].
- Loss-of-function: Knock down MOB2 in a cell line with higher expression (e.g., LN-229). This should reciprocally enhance the malignant phenotypes, confirming MOB2's role as a tumor suppressor [102].
FAQ 2: Our Co-IP experiments show a weak interaction between MOB2 and RAD50. What critical controls and complementary experiments should we include to confirm this biologically relevant complex?
Answer:
- Critical Controls: Always include a non-specific IgG antibody for your IP to identify non-specific binding. Use a cell line where MOB2 is knocked down as a negative control for the interaction.
- Complementary Assays:
- Chromatin Fractionation: This is a powerful method to demonstrate functional interaction. After inducing DNA damage, check if MOB2 depletion impairs the recruitment of RAD50 and other MRN complex components to the chromatin fraction [2].
- Proximity Ligation Assay (PLA): Use PLA to visualize and quantify the endogenous MOB2-RAD50 complex in situ within the nucleus, especially at sites of DNA damage.
FAQ 3: Our data suggests MOB2 deficiency impairs HR. How can we translate this finding into a potential therapeutic strategy, and what patient data should we correlate with?
Answer: A deficient HR pathway is a key vulnerability that can be targeted with PARP inhibitors (a concept known as synthetic lethality).
- Therapeutic Testing: Treat your MOB2-deficient cell models with FDA-approved PARP inhibitors (e.g., Olaparib). MOB2-deficient cells should show heightened sensitivity, characterized by a significant reduction in clonogenic survival compared to MOB2-proficient cells [19].
- Patient Data Correlation: Investigate publicly available datasets (e.g., TCGA). Analyze whether low MOB2 mRNA expression in cancers like ovarian or lung carcinoma correlates with better overall survival in patients treated with PARP inhibitors. This would support the use of MOB2 as a potential predictive biomarker for patient stratification [19].
Figure 2: MOB2's role in the DNA Damage Response (DDR) pathway. MOB2 interacts with the MRN complex to promote ATM activation and stabilize RAD51, facilitating Homologous Recombination (HR). Its deficiency leads to HR defect and PARP inhibitor sensitivity.
Conclusion
Mastering the optimization of MOB2-RAD50 complex formation assays is more than a technical exercise; it is a gateway to understanding a critical node in the DNA damage repair network. As the research summarized here confirms, the MOB2-RAD50 interaction is a linchpin for efficient homologous recombination, with direct implications for cancer cell viability and response to DNA-damaging agents like PARP inhibitors. The robust methodologies and validation frameworks outlined provide a foundation for reliably quantifying this interaction. Future research must leverage these optimized assays to explore the complex's full potential as a predictive biomarker for patient stratification and as a novel therapeutic target itself. By disrupting the MOB2-RAD50 axis, we may unlock new combination therapies to overcome treatment resistance in cancers reliant on proficient DNA repair, ultimately translating these bench-side assays into bedside clinical benefits.
References
- 1. MOB (Mps one Binder) Proteins in the Hippo Pathway and ... [https://www.mdpi.com/2073-4409/8/6/569]
- 2. Regulation of DNA damage responses and cell cycle ... [https://pmc.ncbi.nlm.nih.gov/articles/PMC4276419/]
- 3. Bone Marrow Failure and Immunodeficiency Associated with Human... [https://pubmed.ncbi.nlm.nih.gov/37794136/]
- 4. MOB2 suppresses GBM cell migration and invasion via ... [https://www.nature.com/articles/s41419-020-2381-8]
- 5. MRE11- RAD -NBS1 50 alterations and DNA damage... complex [https://molecular-cancer.biomedcentral.com/articles/10.1186/s12943-019-1100-5]
- 6. DNA Repair Mechanisms, Protein Interactions and ... [https://pmc.ncbi.nlm.nih.gov/articles/PMC9656488/]
- 7. hMOB2 deficiency impairs homologous recombination ... [https://pmc.ncbi.nlm.nih.gov/articles/PMC8514680/]
- 8. Post-transcriptional regulation of MRE11 expression in... | Oncotarget [https://www.oncotarget.com/article/1627/text/]
- 9. Cryo-EM structure of the Mre11-Rad50-Nbs1 complex ... [https://www.sciencedirect.com/science/article/pii/S1097276522011388]
- 10. RAD50, an SMC family member with multiple roles in DNA ... [https://pmc.ncbi.nlm.nih.gov/articles/PMC4494100/]
- 11. WDFY2 promotes MRN complex required for homologous... formation [https://pubmed.ncbi.nlm.nih.gov/41196680/]
- 12. Dynamic Properties of the DNA Damage Response Mre11 ... [https://www.mdpi.com/1422-0067/24/15/12377]
- 13. Regulation of DNA damage responses and cell cycle ... [https://www.sciencedirect.com/science/article/abs/pii/S0898656814003702]
- 14. Regulation of DNA damage responses and cell cycle progression by... [https://pubmed.ncbi.nlm.nih.gov/25460043/]
- 15. Tips for Screening with Yeast Two Hybrid Systems [https://blog.addgene.org/tips-for-screening-with-yeast-two-hybrid-systems]
- 16. The Possible Crosstalk of MOB2 With NDR1/2 Kinases in Cell ... [https://pmc.ncbi.nlm.nih.gov/articles/PMC5321467/]
- 17. Activation of ATM-dependent DNA Damage Signal ... [https://pmc.ncbi.nlm.nih.gov/articles/PMC2739324/]
- 18. The DNA damage sensor ATM kinase interacts with the p53 ... [https://molecular-cancer.biomedcentral.com/articles/10.1186/s12943-024-01933-z]
- 19. hMOB2 deficiency impairs homologous recombination- ... [https://www.sciencedirect.com/science/article/pii/S0898656821001959]
- 20. Mechanism of Rad51 filament formation by Rad52 and ... [https://pmc.ncbi.nlm.nih.gov/articles/PMC12280074/]
- 21. Meiotic Knockdown and Complementation Reveals Essential ... [https://pubmed.ncbi.nlm.nih.gov/28178517/]
- 22. Noncanonical Roles of RAD51 [https://www.mdpi.com/2073-4409/12/8/1169]
- 23. hMOB2 deficiency impairs homologous recombination- ... [https://pubmed.ncbi.nlm.nih.gov/34363951/]
- 24. Mapping the MOB proteins' proximity network reveals a ... [https://www.sciencedirect.com/science/article/pii/S0021925823021518]
- 25. Immunoprecipitation Troubleshooting Guide [https://www.cellsignal.com/learn-and-support/troubleshooting/ip-troubleshooting-guide?srsltid=AfmBOorj3705isWhUIFGFzMSFuZJYfsqTJo19Sa7D28WletDKHTL856Z]
- 26. Co-immunoprecipitation (Co-IP) Troubleshooting [https://www.antibodies.com/applications/co-immunoprecipitation/co-ip-troubleshooting]
- 27. Co-immunoprecipitation troubleshooting, tips and tricks [https://www.ptglab.com/news/blog/co-immunoprecipitation-troubleshooting-tips-and-tricks/?srsltid=AfmBOopPYknTkyK90bfRs2hAkS2rndeTrTLofY6qhqSvJfrd8FzeUOhB]
- 28. Troubleshooting CO-IP Assays: Common Problems and ... [https://www.kmdbioscience.com/article/co-ip-assays-common-problems-and-solutions.html]
- 29. Co-immunoprecipitation (Co-IP): The Complete Guide [https://www.antibodies.com/applications/co-immunoprecipitation]
- 30. Immunoprecipitation Experimental Design Tips [https://www.cellsignal.com/applications/immunoprecipitation/ip-experimental-design-tips?srsltid=AfmBOoopG_nO8OrvUZ9pwa-gFxd08wW7b9GEJJHKpCrmnS2GvUacG734]
- 31. Co-Immunoprecipitation (Co-IP) [https://www.thermofisher.com/us/en/home/life-science/protein-biology/protein-biology-learning-center/protein-biology-resource-library/pierce-protein-methods/co-immunoprecipitation-co-ip.html]
- 32. Meet the neighbors: Mapping local protein interactomes by ... [https://pmc.ncbi.nlm.nih.gov/articles/PMC5053326/]
- 33. An AP-MS- and BioID-compatible MAC-tag enables ... [https://www.nature.com/articles/s41467-018-03523-2]
- 34. 2C-BioID: An Advanced Two Component BioID System for ... [https://pmc.ncbi.nlm.nih.gov/articles/PMC6263017/]
- 35. 4.3. Proximity-Dependent Biotin Identification (BioID) Assay [https://bio-protocol.org/exchange/minidetail?id=7130245&type=30]
- 36. Chromatin Immunoprecipitation Troubleshooting Guide [https://www.cellsignal.com/learn-and-support/troubleshooting/chip-troubleshooting-guide?srsltid=AfmBOopzzZun56nDrLIqlcJk3p6aoKBIS2OHobrAQlK6pvODn2OlY9_9]
- 37. Chromatin Immunoprecipitation Troubleshooting: ChIP Help [https://www.novusbio.com/support/support-by-application/chromatin-immunoprecipitation/troubleshooting.html?srsltid=AfmBOorGURAOZxXapY_LUkt2yOcioQilt3TasmTTMGOgD-_RhItk4wXs]
- 38. ChIP-Seq Kit Troubleshooting Guide | Boster Bio [https://www.bosterbio.com/protocol-and-troubleshooting/chromatin-immunoprecipitation-chip-troubleshooting-guide?srsltid=AfmBOoqpjgckN_czb_rWKL48SzinJ03VgeyBVhC7hzJIxHo3muFNaZqv]
- 39. Stable maintenance of the Mre11-Rad50-Nbs1 complex is ... [https://pubmed.ncbi.nlm.nih.gov/34473993/]
- 40. Interplay and Dynamics of Chromatin Architecture ... [https://pmc.ncbi.nlm.nih.gov/articles/PMC11940107/]
- 41. Chromatin compartmentalization regulates the response to ... [https://www.nature.com/articles/s41586-023-06635-y]
- 42. RAD51 foci as a functional biomarker of homologous ... [https://pmc.ncbi.nlm.nih.gov/articles/PMC5961353/]
- 43. An ex vivo assay of XRT-induced Rad51 foci formation ... [https://pmc.ncbi.nlm.nih.gov/articles/PMC4221419/]
- 44. Immunofluorescence staining for RAD51 foci [https://bio-protocol.org/exchange/minidetail?id=3287382&type=30]
- 45. Troubleshooting Flow Cytometry Issues [https://www.bosterbio.com/protocol-and-troubleshooting/flow-cytometry-troubleshooting?srsltid=AfmBOopJ0quef2Nn9Wayvr_jLHfNk-agBLAmhdvtsUME1JOnx4r39L2Z]
- 46. Immunofluorescence Imaging of DNA Damage Response ... [https://pmc.ncbi.nlm.nih.gov/articles/PMC3687552/]
- 47. A Beginner's Guide to a Publication Quality Image ... [https://www.nsh.org/blogs/ashley-stewart/2024/05/02/a-beginners-guide-to-a-publication-quality-image]
- 48. How to make scientific figures accessible to readers with ... [https://www.ascb.org/diversity-equity-and-inclusion/how-to-make-scientific-figures-accessible-to-readers-with-color-blindness/]
- 49. Simultaneous Targeting of PARP1 and RAD52 Triggers ... [https://pmc.ncbi.nlm.nih.gov/articles/PMC6082171/]
- 50. PARP Inhibitors: Clinical Relevance, Mechanisms of Action ... [https://pmc.ncbi.nlm.nih.gov/articles/PMC7509090/]
- 51. Unmatched Cell Line Collections Are Not Optimal for ... [https://pmc.ncbi.nlm.nih.gov/articles/PMC12451393/]
- 52. Targeting DNA damage repair mechanism by using ... [https://www.sciencedirect.com/science/article/pii/S2590006424002679]
- 53. Targeting DNA damage repair mechanism by using RAD -silencing... 50 [https://pmc.ncbi.nlm.nih.gov/articles/PMC11364914/]
- 54. Engineering siRNA therapeutics: challenges and strategies | Journal of... [https://jnanobiotechnology.biomedcentral.com/articles/10.1186/s12951-023-02147-z]
- 55. Small interfering RNAs (siRNAs) in cancer therapy: a nano-based approa [https://www.dovepress.com/small-interfering-rnas-sirnas-in-cancer-therapy-a-nano-based-approach-peer-reviewed-fulltext-article-IJN]
- 56. Comprehensive Guide to Cell Lysis and Protein Extraction ... [https://www.creative-proteomics.com/resource/comprehensive-guide-cell-lysis-protein-extraction.htm]
- 57. Introduction to cell lysis for cellular analysis [https://www.abcam.com/en-us/knowledge-center/cell-biology/cell-lysis]
- 58. Rapid Online Buffer Exchange for Screening of Proteins ... [https://pmc.ncbi.nlm.nih.gov/articles/PMC7203678/]
- 59. Mre11-Rad50 oligomerization promotes DNA double- ... [https://pmc.ncbi.nlm.nih.gov/articles/PMC9061753/]
- 60. Comprehensive structural and functional analyses of ... [https://www.frontiersin.org/journals/bioinformatics/articles/10.3389/fbinf.2025.1535482/full]
- 61. Protocol to isolate RBP-mRNA complexes using RNA-CLIP ... [https://pmc.ncbi.nlm.nih.gov/articles/PMC10225919/]
- 62. Validation of Antibodies for Flow Cytometry [https://fluorofinder.com/antibody-validation/]
- 63. & ELISA Kits, HCCA2 Proteins MOB 2 Antibodies [https://www.bosterbio.com/bosterbio-gene-info-cards/MOB2]
- 64. Phospho- Rad (Ser635) 50 | Cell Signaling Technology Antibody [https://www.cellsignal.com/products/primary-antibodies/phospho-rad50-ser635-antibody/14223]
- 65. Immunoprecipitation Troubleshooting Guide [https://www.cellsignal.com/learn-and-support/troubleshooting/ip-troubleshooting-guide?srsltid=AfmBOorgdoJAWoz-PuH6Xbh7MUL5YZFBF8kSL8nUxtBVWYMyO91apX4b]
- 66. Anti- RAD | Invitrogen 50 Antibodies [https://www.thermofisher.com/antibody/primary/target/rad50]
- 67. ELISA vs Western Blot: When to Use Each Immunoassay ... [https://www.thermofisher.com/blog/life-in-the-lab/western-blot-or-elisa/]
- 68. The regulation of DNA damage signalling and repair by MOB2 - UCL Discovery [https://discovery.ucl.ac.uk/id/eprint/1528649/]
- 69. Challenges In Studying Transient Protein-protein Interactions [https://depixus.com/challenges-in-studying-transient-protein-protein-interactions-for-drug-development-and-how-to-overcome-them/]
- 70. Transient Protein-Protein Interactions: Structural, ... [https://www.sciencedirect.com/science/article/pii/S0969212610003035]
- 71. Tools used to study how protein complexes are assembled in ... [https://pmc.ncbi.nlm.nih.gov/articles/PMC3225741/]
- 72. A method to trap transient and weak interacting protein ... [https://pmc.ncbi.nlm.nih.gov/articles/PMC5424782/]
- 73. Protein-Protein Interactions Support—Troubleshooting [https://www.thermofisher.com/cl/en/home/technical-resources/technical-reference-library/protein-assays-analysis-support-center/protein-protein-interactions-support/protein-protein-interactions-support-troubleshooting.html]
- 74. 2024 Guide to Quantitative Western Blot Publication [https://www.thermofisher.com/blog/life-in-the-lab/2023-guide-to-quantitative-western-blot-publication/]
- 75. Protocol for chromatin immunoprecipitation of ... [https://pmc.ncbi.nlm.nih.gov/articles/PMC11952799/]
- 76. Comprehensive structural and functional analyses of ... [https://pmc.ncbi.nlm.nih.gov/articles/PMC11979129/]
- 77. NF-κB-Chromatin Interactions Drive Diverse Phenotypes ... [https://pmc.ncbi.nlm.nih.gov/articles/PMC5812697/]
- 78. Normalization (statistics) [https://en.wikipedia.org/wiki/Normalization_(statistics)]
- 79. Rigor and Reproducibility in Experimental Design [https://smcclatchy.github.io/exp-design/03-common-flaws/]
- 80. Critical review and advices on spectral-based ... [https://www.sciencedirect.com/science/article/abs/pii/S0584854719302794]
- 81. Evaluation of normalization methods for predicting ... [https://www.frontiersin.org/journals/genetics/articles/10.3389/fgene.2024.1369628/full]
- 82. A systematic evaluation of normalization methods in ... [https://pubmed.ncbi.nlm.nih.gov/27694351/]
- 83. Making the Best of the Loose Ends: Mre11/Rad50 complexes ... [https://pmc.ncbi.nlm.nih.gov/articles/PMC3004398/]
- 84. Irregular Protein Expression After CRISPR Edits [https://www.synthego.com/blog/crispr-irregular-protein-expression/]
- 85. Optimization of gene knockout approaches and sgRNA ... [https://www.nature.com/articles/s41598-025-24184-4]
- 86. RAD50 missense variants differentially affect the DNA ... [https://pubmed.ncbi.nlm.nih.gov/41031707/]
- 87. Mapping the MOB proteins' proximity network reveals a ... [https://pmc.ncbi.nlm.nih.gov/articles/PMC10480535/]
- 88. - Co (Co-IP) | Thermo Fisher Scientific - RU Immunoprecipitation [https://www.thermofisher.com/ru/ru/home/life-science/protein-biology/protein-biology-learning-center/protein-biology-resource-library/pierce-protein-methods/co-immunoprecipitation-co-ip.html]
- 89. Proximity labeling for investigating protein- ... [https://pmc.ncbi.nlm.nih.gov/articles/PMC10782847/]
- 90. BioID-MS Service [https://www.creative-proteomics.com/services/bioid-ms-service.htm]
- 91. Proximity-dependent Biotin Identification (BioID) Service [https://www.profacgen.com/proximity-dependent-biotin-identification-bioid-service.htm]
- 92. Drug Discovery Assays Support—Troubleshooting [https://www.thermofisher.com/us/en/home/technical-resources/technical-reference-library/drug-discovery-development-support-center/drug-discovery-assays-support/drug-discovery-assays-support-troubleshooting.html]
- 93. Proximity-dependent Biotin Identification (BioID) Service [https://www.iaanalysis.com/proximity-dependent-biotin-identification-bioid-platform.html]
- 94. Regulation of Protein Interactions by Mps One Binder ... [https://www.sciencedirect.com/science/article/pii/S1535947620323732]
- 95. Two NDR kinase–MOB complexes function as distinct ... [https://pmc.ncbi.nlm.nih.gov/articles/PMC4617822/]
- 96. TIE-UP-SIN: a novel method for enhanced identification of ... [https://www.frontiersin.org/journals/microbiology/articles/10.3389/fmicb.2025.1657647/full]
- 97. Homologous Recombination Deficiency in Ovarian and Breast ... [https://pmc.ncbi.nlm.nih.gov/articles/PMC12384633/]
- 98. The RAD51-FFPE Test; Calibration of a Functional ... [https://www.mdpi.com/2072-6694/13/12/2994]
- 99. RAD51 biomarker could complement next-generation ... [https://sciencesources.eurekalert.org/news-releases/1072740]
- 100. Long non-coding RNAs as a biomarker for homologous ... [https://www.nature.com/articles/s42003-025-08836-9]
- 101. Mechanism of Rad51 filament formation by Rad52 and Rad55 ... [https://pubmed.ncbi.nlm.nih.gov/40691144/]
- 102. MOB2 suppresses GBM cell migration and invasion via ... [https://pmc.ncbi.nlm.nih.gov/articles/PMC7156523/]
- 103. Expression of MOB2 in cancer - Summary [https://www.proteinatlas.org/ENSG00000182208-MOB2/cancer]
- 104. The regulation of DNA damage signalling and repair ... [https://discovery.ucl.ac.uk/1528649/]