Optimizing Magnesium Concentrations for Enhanced PCR Specificity: A Comprehensive Guide to Melting Curve Analysis Validation
This article provides a comprehensive guide for researchers and drug development professionals on validating PCR specificity through melting curve analysis following magnesium optimization.
Optimizing Magnesium Concentrations for Enhanced PCR Specificity: A Comprehensive Guide to Melting Curve Analysis Validation
Abstract
This article provides a comprehensive guide for researchers and drug development professionals on validating PCR specificity through melting curve analysis following magnesium optimization. It covers the foundational role of MgCl₂ as a critical cofactor influencing DNA polymerase activity, primer annealing, and duplex stability. The content details methodological steps for systematic MgCl₂ titration and subsequent high-resolution melting (HRM) analysis, supported by predictive modeling and empirical data. A dedicated troubleshooting section addresses common challenges like nonspecific amplification and primer-dimers, while the validation framework demonstrates how this combined approach ensures assay robustness, differentiates closely related sequences, and improves reproducibility for sensitive applications in diagnostics and biomedical research.
The Fundamental Role of Magnesium in PCR Specificity and Duplex Stability
In the polymerase chain reaction (PCR), magnesium chloride (MgCl₂) operates as a fundamental biochemical regulator, exerting influence over both enzymatic activity and nucleic acid physics. Its dual role as an essential cofactor for DNA polymerase and a critical modulator of DNA strand dynamics makes it a master variable in reaction success. While its cofactor function is widely acknowledged, its profound impact on DNA thermodynamics is often underappreciated. Within the context of validating PCR specificity through melting curve analysis, precise magnesium optimization emerges as a prerequisite for generating reliable, interpretable data. This guide examines MgCl₂'s mechanisms and optimal concentrations against alternative optimization approaches, providing researchers with quantitative frameworks for method selection and implementation.
The Dual Regulatory Mechanisms of MgCl₂ in PCR
MgCl₂'s function in PCR extends beyond a simple additive; it operates through two distinct but interconnected biochemical pathways that collectively govern amplification efficiency and specificity.
MgCl₂ as an Essential Enzymatic Cofactor
The magnesium ion (Mg²⁺) is an indispensable non-protein cofactor for Taq DNA polymerase and other PCR-grade enzymes. Its primary enzymatic function involves facilitating the catalytic incorporation of nucleotides into the growing DNA strand [1] [2]. Mechanistically, Mg²⁺ ions coordinate with the phosphate groups of incoming deoxynucleotide triphosphates (dNTPs), enabling proper alignment within the enzyme's active site. This coordination neutralizes negative charge repulsion between the dNTP's phosphate groups and the DNA backbone, allowing the polymerase to catalyze the nucleophilic attack of the 3'-hydroxyl group on the alpha-phosphate of the incoming nucleotide [2]. Without sufficient Mg²⁺ concentrations, this fundamental catalytic process ceases, resulting in PCR failure due to minimal product yield.
MgCl₂ as a Modulator of DNA Strand Dynamics
Beyond its enzymatic role, MgCl₂ significantly influences the physical behavior of DNA strands throughout the PCR process. As a divalent cation, Mg²⁺ efficiently shields the negatively charged phosphate backbone of DNA molecules through electrostatic interactions [2]. This charge screening reduces inter-strand repulsion, thereby stabilizing DNA duplexes and directly affecting the hybridization efficiency between primers and template DNA [3] [4]. This stabilization has quantifiable thermodynamic consequences, demonstrated by a clear logarithmic relationship between MgCl₂ concentration and DNA melting temperature (Tm) [3]. Within the optimal concentration range of 1.5-3.0 mM, every 0.5 mM increase in MgCl₂ raises the melting temperature by approximately 1.2°C [3]. This modulation directly impacts annealing efficiency and ultimately determines the specificity of the amplification reaction.
Table 1: Quantitative Effects of MgCl₂ Concentration on PCR Parameters
| MgCl₂ Concentration (mM) | DNA Melting Temperature Change | PCR Efficiency | Specificity | Typical Application |
|---|---|---|---|---|
| < 1.0 | Substantially lowered | Very weak or failed amplification | High (but minimal product) | Not recommended |
| 1.5 | Baseline | Good | High | Standard templates, simple amplicons |
| 2.0 | +1.2°C from baseline | Very good | High | Optimal for most applications |
| 2.5 | +2.4°C from baseline | Excellent | Moderate | Complex templates, higher GC content |
| 3.0 | +3.6°C from baseline | Excellent | Moderate | Genomic DNA, presence of inhibitors |
| > 4.0 | Significantly elevated | Good but error-prone | Low | Non-specific amplification, primer dimers |
Comparative Analysis of PCR Optimization Parameters
While MgCl₂ concentration represents a powerful regulatory lever, it does not operate in isolation. Successful PCR optimization requires understanding its interaction with other critical parameters and alternative optimization strategies.
MgCl₂ Interdependence with Reaction Components
The effective concentration of Mg²⁺ available for PCR is influenced by several reaction components that can chelate or otherwise bind the ions. dNTPs represent a significant sink for Mg²⁺ ions, as each dNTP molecule can bind one magnesium ion [5]. EDTA or other chelators present in template DNA preparations can further reduce available Mg²⁺. This creates a dynamic system where the optimal MgCl₂ concentration must be determined empirically for each primer-template system, particularly when reaction components vary [6]. Template characteristics significantly influence MgCl₂ requirements; genomic DNA templates typically require higher concentrations (2.5-4.0 mM) than plasmid DNA (1.5-2.5 mM), while templates with high GC content often benefit from elevated MgCl₂ to stabilize the tougher duplexes [3] [2].
Alternative Optimization Approaches Compared to MgCl₂ Titration
Table 2: PCR Optimization Method Comparison
| Optimization Method | Mechanism of Action | Experimental Complexity | Optimal For | Limitations |
|---|---|---|---|---|
| MgCl₂ Concentration Titration | Modifies enzyme kinetics & DNA duplex stability | Moderate (gradient PCR recommended) | All PCR applications, especially with complex templates | Interacts with other components (dNTPs, primers) |
| Annealing Temperature Optimization | Adjusts stringency of primer-template binding | Low (gradient PCR capable) | Primer-specific optimization, standard templates | Limited adjustment range for problematic templates |
| Primer Concentration Optimization | Modifies primer availability & reduces dimer formation | High (multiple combinations needed) | Multiplex PCR, problematic primer pairs | Time-consuming with large primer sets |
| Additives (DMSO, Betaine) | Destabilizes secondary structures, lowers Tm | Low (single variable) | GC-rich templates, difficult amplicons | May inhibit polymerase at high concentrations |
| Touchdown PCR | Progressive increase in stringency during cycling | Moderate (programming required) | Multiple non-specific products, unknown templates | Complex program design, longer cycle times |
Experimental Data and Protocol for MgCl₂ Optimization
Quantitative Relationships from Meta-Analysis
A comprehensive meta-analysis of 61 studies revealed precise quantitative relationships between MgCl₂ concentration and PCR performance metrics [3] [4]. The analysis established a significant logarithmic relationship between MgCl₂ concentration and DNA melting temperature, with optimal amplification typically occurring between 1.5 and 3.0 mM MgCl₂ [3]. Within this range, each 0.5 mM increment increased Tm by approximately 1.2°C [3]. Template characteristics significantly influenced requirements, with genomic DNA necessitating higher concentrations than simpler templates. These findings provide a quantitative framework for evidence-based MgCl₂ optimization rather than reliance on purely empirical approaches.
Mathematical Modeling for Predictive Optimization
Recent advances in computational biology have enabled predictive modeling of optimal MgCl₂ concentrations based on reaction parameters. One study developed a multivariate Taylor series expansion model incorporating thermodynamic principles to predict optimal MgCl₂ conditions [7]. The resulting equation:
(MgCl₂) ≈ 1.5625 + (-0.0073 × Tm) + (-0.0629 × GC) + (0.0273 × L) + (0.0013 × dNTP) + (-0.0120 × Primers) [7]
demonstrated excellent predictive capability (R² = 0.9942) when validated against experimental data [7]. Variable importance analysis revealed that the interaction between dNTP and primers accounted for 28.5% of predictive power, followed by GC content (22.1%) and amplicon length (15.7%) [7]. This modeling approach represents a shift from traditional trial-and-error methods toward theoretically grounded, data-driven optimization.
MgCl₂ Optimization Protocol for Melting Curve Analysis
The following detailed protocol enables systematic optimization of MgCl₂ concentration for PCR specificity validation using melting curve analysis:
Prepare Master Mix Base: Create a 1x Master Mix for 8 reactions of 20 μL to accommodate MgCl₂ concentrations from 1.5 mM to 4.5 mM [6]:
- 5x Master Mix: 32 μL
- PCR grade water: 9.6 μL
- Primer 1 (10 μM): 3.2 μL
- Primer 2 (10 μM): 3.2 μL
- DNA extract: 16 μL
- Total volume: 64 μL
Aliquot and Supplement: Distribute 8 μL of 1x Master Mix into each of 7 labelled PCR tubes. Prepare a 5 mM MgCl₂ working solution by diluting 25 mM stock (20 μL stock + 80 μL PCR grade water) [6].
Create Concentration Gradient: Add MgCl₂ and water according to the following scheme to achieve the desired final concentrations:
Table 3: MgCl₂ Optimization Setup Template
| Final MgCl₂ Concentration (mM) | PCR Grade Water Added (μL) | 5 mM MgCl₂ Working Solution Added (μL) |
|---|---|---|
| 1.5 | 12 | 0 |
| 2.0 | 10 | 2 |
| 2.5 | 8 | 4 |
| 3.0 | 6 | 6 |
| 3.5 | 4 | 8 |
| 4.0 | 2 | 10 |
| 4.5 | 0 | 12 |
Amplify and Analyze: Run PCR with appropriate cycling parameters. Perform high-resolution melting curve analysis according to established methods [8]. Analyze amplification products by gel electrophoresis to correlate melting profiles with specific amplicons.
Determine Optimal Concentration: Identify the MgCl₂ concentration producing the clearest bands of expected sizes with minimal non-specific amplification [6]. This concentration typically corresponds to a sharp, single peak in melting curve analysis, indicating a homogeneous PCR product population.
Research Reagent Solutions for MgCl₂ Optimization
Table 4: Essential Reagents for PCR Magnesium Optimization
| Reagent / Solution | Typical Composition | Function in Optimization | Application Notes |
|---|---|---|---|
| MgCl₂ Stock Solution | 25 mM MgCl₂ in purified water | Allows precise adjustment of Mg²⁺ concentration | Aliquot to prevent contamination; stable at -20°C [6] |
| PCR Master Mix | Taq polymerase, dNTPs, buffer, MgCl₂ | Provides baseline Mg²⁺ (typically 1.5 mM final) | Check manufacturer's concentration; may require supplementation [6] |
| PCR-Grade Water | Nuclease-free, ion-free water | Vehicle for dilution and volume adjustment | Ensures no metal ion contamination affects optimization |
| dNTP Mix | Equimolar mix of dATP, dCTP, dGTP, dTTP | Substrates for DNA synthesis; chelate Mg²⁺ | Concentration affects free Mg²⁺; keep constant during optimization [2] |
| Template DNA | Genomic DNA, plasmid, or cDNA | Target for amplification | Purity affects Mg²⁺ availability; may contain inhibitors [6] |
| Primers | Forward and reverse, 10-25 μM | Sequence-specific amplification | Design to minimize dimerization; concentration affects specificity [5] |
MgCl₂ Optimization Workflow and DNA-Mg²⁺ Interaction
MgCl₂ Optimization Workflow
DNA-Mg²⁺ Biochemical Interactions
MgCl₂'s function as a master regulator in PCR stems from its dual influence on both the enzymatic catalyst and the nucleic acid substrate. The quantitative relationships between MgCl₂ concentration and DNA melting temperature provide a thermodynamic basis for optimization strategies that directly impact PCR specificity. When coupled with melting curve analysis, MgCl₂ titration becomes a powerful approach for validating amplification specificity, particularly for challenging templates or diagnostic applications. The development of predictive models represents a promising shift from purely empirical optimization toward theoretically grounded, data-driven protocols. For researchers validating PCR specificity, systematic MgCl₂ optimization remains an indispensable component of robust assay development.
In polymerase chain reaction (PCR) optimization, magnesium chloride (MgCl₂) concentration stands as one of the most critical yet variable factors determining experimental success. As a divalent cation, Mg²⁺ operates through multiple mechanistic pathways to influence the fundamental thermodynamics of nucleic acid interactions. Magnesium ions serve not only as an essential cofactor for DNA polymerase activity but also as a powerful modulator of DNA duplex stability through charge shielding effects [9]. Understanding these mechanisms is particularly crucial for applications demanding high specificity, such as diagnostic PCR and melting curve analysis, where precise Tm control determines detection accuracy [4] [3].
The interplay between Mg²⁺ concentration and melting temperature follows a predictable logarithmic relationship, with meta-analyses confirming that every 0.5 mM increment within the 1.5–3.0 mM range consistently raises Tm by approximately 1.2°C [3]. This quantitative relationship provides a theoretical framework for evidence-based protocol optimization rather than reliance on empirical approaches. For researchers validating PCR specificity through melting curve analysis, mastering Mg²⁺-mediated effects translates to improved discrimination between specific and non-specific amplification products.
Biochemical Mechanisms: How Mg²⁺ Modulates DNA Duplex Stability
Charge Shielding and Electrostatic Stabilization
The primary mechanism through which Mg²⁺ influences DNA thermodynamics involves electrostatic stabilization of the DNA duplex. The phosphate backbone of DNA carries significant negative charges that create natural repulsion between complementary strands. Mg²⁺ cations effectively neutralize these repulsive forces through charge shielding:
- Ionic atmosphere creation: Mg²⁺ ions congregate around phosphate groups, forming an ionic atmosphere that counteracts the negative charge repulsion [10]
- Divalent cation advantage: With a charge of +2, Mg²⁺ is approximately 10-100 times more effective at stabilizing DNA duplexes than monovalent ions like Na⁺ or K⁺ [11]
- Binding specificity: Mg²⁺ preferentially binds to the minor groove of DNA, facilitating closer approach of complementary strands [10]
This charge shielding effect significantly reduces the energy required for primer-template association, thereby increasing the melting temperature of the duplex. The strength of this effect follows a logarithmic relationship with concentration, with diminishing returns at higher concentrations [11].
DNA Polymerase Cofactor Activity
Beyond its role in duplex stabilization, Mg²⁺ serves as an essential catalytic cofactor for DNA polymerase enzyme activity:
- Active site coordination: Mg²⁺ ions position themselves at the DNA polymerase active site, coordinating the 3'-OH group of the primer and the phosphate group of the incoming dNTP [9]
- Transition state stabilization: The metal ions stabilize the negative charge that develops on the pyrophosphate group during phosphodiester bond formation [9]
- Conformational optimization: Mg²⁺ facilitates the correct positioning of substrates within the polymerase active site for efficient catalysis
When Mg²⁺ concentrations fall below optimal levels, polymerase activity decreases substantially, leading to incomplete amplification products that manifest as smearing on electrophoretic gels [12]. Conversely, excessive Mg²⁺ can reduce enzyme specificity and promote non-specific amplification [9].
Quantitative Effects: Measuring Mg²⁺ Impact on Melting Temperature
Concentration-Dependent Tm Modulation
The relationship between Mg²⁺ concentration and DNA melting temperature follows a predictable pattern that has been quantified through systematic meta-analysis. The table below summarizes key quantitative relationships established by recent research:
Table 1: Quantitative Effects of Mg²⁺ Concentration on DNA Melting Temperature
| Parameter | Effect Size | Experimental Conditions | Reference |
|---|---|---|---|
| Mg²⁺ increase (within 1.5-3.0 mM range) | +1.2°C Tm per 0.5 mM | Standard PCR conditions | [3] |
| Mg²⁺ vs Na⁺ potency | 10-100x more effective than monovalent ions | Equivalent molar concentrations | [11] |
| Mg²⁺ (0 mM → 2 mM) | +5 to +8°C Tm | 20-mer with 50% GC content | [11] |
| Mg²⁺ (1.5 mM → 3 mM) | +1.5 to +2.5°C Tm | Critical for tight annealing windows | [11] |
| Optimal Mg²⁺ range | 1.5-3.0 mM | Standard PCR applications | [3] [9] |
These quantitative relationships demonstrate that Mg²⁺ exerts a powerful influence on Tm, with even modest concentration adjustments producing functionally significant changes in duplex stability.
Template-Dependent Optimization Requirements
The optimal Mg²⁺ concentration varies significantly based on template characteristics, with more complex templates generally requiring higher concentrations:
- Genomic DNA: Typically requires higher Mg²⁺ concentrations (often at the upper end of the 1.5-3.0 mM range) compared to simple templates [3]
- GC-rich templates: Often benefit from slightly elevated Mg²⁺ to counter inherent stability challenges, though this must be balanced against increased non-specific amplification risks [4]
- Amplicon length: Longer products may require optimized Mg²⁺ to maintain polymerase processivity throughout extension [9]
Table 2: Template-Specific Magnesium Optimization Guidelines
| Template Type | Recommended [Mg²⁺] | Rationale | Special Considerations |
|---|---|---|---|
| Plasmid DNA | 1.5-2.0 mM | Less complex structure | Lower concentrations often sufficient |
| Genomic DNA | 2.0-3.0 mM | Higher complexity | Increased non-specific binding risk |
| GC-rich targets | 2.0-2.5 mM | Counteract secondary structures | May benefit from additives (DMSO, betaine) |
| Long amplicons (>3 kb) | 2.0-2.5 mM | Maintain polymerase processivity | Balance between yield and specificity |
| Standard targets | 1.5-2.5 mM | Balanced approach | Typical starting point for optimization |
Calculation Methods: Predicting Tm Under PCR Conditions
Comparison of Tm Calculation Algorithms
Accurate prediction of melting temperature under specific Mg²⁺ concentrations is essential for PCR design. The table below compares the predominant calculation methods:
Table 3: Comparison of Tm Calculation Methods for Mg²⁺-Containing Solutions
| Method | Accuracy | Complexity | Accounts for Mg²⁺ | Best Applications |
|---|---|---|---|---|
| Nearest-Neighbor Thermodynamics | Highest (±1-2°C) | High | Yes (with Owczarzy correction) | All applications requiring accurate Tm prediction [11] |
| GC% Approximation | Low (±5-10°C) | Low | No | Quick estimates only, not recommended for design [13] [11] |
| Salt Correction (Owczarzy) | High | Medium | Yes (comprehensive model) | PCR conditions with Mg²⁺ and Na⁺ [11] [10] |
The Owczarzy Model for Mg²⁺-Containing Solutions
For precise Tm calculations in PCR conditions, the Owczarzy et al. (2008) model provides the most accurate predictions by accounting for the complex effects of mixed ion solutions [11] [10]. The model incorporates several critical factors:
- Competitive binding: Accounts for Mg²⁺ binding to dNTPs, which reduces free Mg²⁺ availability [10]
- Ionic strength effects: Calculates the combined effects of monovalent and divalent cations [14]
- Sequence dependence: Incorporates GC content and length dependencies in Mg²⁺ effects [10]
The model uses different formulas based on the [Mg²⁺]/[Mon⁺] ratio, with the more complex formula applying to typical PCR conditions where Mg²⁺ concentration is significant relative to monovalent ions [11].
Experimental Optimization: Establishing Mg²⁺ Concentration
Systematic Mg²⁺ Titration Protocol
Based on meta-analysis of optimization studies, the following protocol provides a reliable method for establishing optimal Mg²⁺ concentrations:
Preparation of Mg²⁺ gradient:
- Create a master mix containing all PCR components except MgCl₂
- Aliquot equal volumes into 8-10 tubes
- Add MgCl₂ to create a concentration series from 1.0 mM to 4.0 mM in 0.5 mM increments
- Include a negative control (no template) for each concentration
PCR amplification:
- Use touchdown or gradient PCR if available to assess specificity across annealing temperatures
- Maintain consistent cycling parameters otherwise
- Include a positive control with previously established conditions if available
Analysis and interpretation:
- Resolve products on agarose gel stained with ethidium bromide or SYBR Safe
- Identify concentration yielding strongest specific product with minimal non-specific amplification
- Verify product identity through sequencing or restriction digestion if necessary
Refinement:
- If necessary, create a finer titration series around the optimal concentration identified
- Test optimal concentration across different template quantities to ensure robustness
Troubleshooting Mg²⁺-Related Amplification Issues
Common PCR problems related to Mg²⁺ concentration and their solutions include:
- Smearing or multiple bands: Indicates excessive Mg²⁺ leading to non-specific priming; reduce concentration by 0.5-1.0 mM increments [12]
- Weak or no amplification: Suggests insufficient Mg²⁺ for polymerase activity or duplex stability; increase concentration by 0.5 mM increments [12] [9]
- Inconsistent results between replicates: May indicate marginal Mg²⁺ concentration; fine-tune by 0.25 mM increments or adjust chelating agent concentrations
Melting Curve Analysis: Validation of PCR Specificity
Principles of Mg²⁺-Dependent Melting Curve Analysis
Melting curve analysis following amplification provides a powerful method for validating PCR specificity, with Mg²⁺ concentration directly influencing the resulting melt profiles:
- Tm shifts: Mg²⁺ concentration alterations produce predictable Tm shifts that can be calculated using nearest-neighbor algorithms [11]
- Profile sharpness: Optimal Mg²⁺ concentrations produce sharper melt peaks indicating homogeneous product formation [4]
- Multiplex discrimination: Carefully controlled Mg²⁺ enables better separation of multiple amplicons in multiplex PCR by tuning their Tm values [10]
The workflow below illustrates the integrated process of Mg²⁺ optimization and melting curve validation:
Interpretation of Melting Curves in Magnesium Optimization
When using melting curve analysis to validate Mg²⁺ optimization, several profile characteristics indicate successful specificity:
- Single sharp peak: Indicates homogeneous amplification of specific product [4]
- Consistent Tm values: Across replicates demonstrates reaction robustness [3]
- Expected Tm shift: Following Mg²⁺ adjustment should match theoretical predictions [11]
- Clean baseline: Absence of shoulder peaks or broadening suggests minimal non-specific products [4]
Deviations from these ideal characteristics may indicate the need for further Mg²⁺ fine-tuning or other reaction optimization.
Table 4: Research Reagent Solutions for Magnesium Optimization Studies
| Reagent/Tool | Function | Application Notes |
|---|---|---|
| MgCl₂ stock solutions (10-50 mM) | Precise concentration adjustment | Prepare fresh, filter-sterilize, avoid repeated freeze-thaw cycles |
| DNA polymerase with optimized buffer | PCR amplification | Select enzymes with characterized Mg²⁺ optimums |
| dNTP mix (10 mM each) | Nucleotide substrates | Balance with Mg²⁺ concentration (Mg²⁺ binds dNTPs) [10] |
| SYBR Green I dye | Melting curve analysis | Final concentration affects observed Tm; keep consistent [10] |
| IDT OligoAnalyzer | Tm calculation | Incorporates Owczarzy algorithm for Mg²⁺ effects [10] |
| MELTING software | Thermodynamic predictions | Open-source tool for complex Tm calculations [14] |
| Quantitative PCR instrument | Melting curve acquisition | Requires high-resolution temperature control (<0.1°C) |
The multifaceted role of Mg²⁺ in modulating primer-template annealing and DNA melting temperature represents a critical leverage point for optimizing PCR specificity. Through its dual mechanisms of electrostatic stabilization and polymerase cofactor activity, Mg²⁺ exerts predictable, quantitative effects on reaction thermodynamics that can be systematically exploited through evidence-based optimization protocols. For researchers employing melting curve analysis to validate amplification specificity, understanding and controlling these Mg²⁺-mediated effects provides a powerful strategy for distinguishing specific products from amplification artifacts. The methodological framework presented here—combining systematic titration with computational prediction and melting curve validation—offers a robust approach for integrating magnesium optimization into broader PCR development workflows, ultimately enhancing experimental reproducibility and reliability in molecular diagnostic applications.
In the realm of molecular biology, achieving optimal Polymerase Chain Reaction (PCR) conditions remains a pivotal challenge, with magnesium chloride (MgCl₂) concentration emerging as one of the most critical parameters influencing reaction success [3] [4]. This comprehensive analysis explores the quantitative relationship between MgCl₂ concentration and DNA melting temperature (Tm), a fundamental interaction with profound implications for PCR efficiency and specificity. The precise modulation of MgCl₂ concentration, tailored to specific template characteristics, significantly enhances both the efficiency and specificity of PCR, providing a robust theoretical framework for developing template-specific optimization strategies [3]. Understanding this relationship is particularly crucial for challenging templates and specialized applications, including diagnostic PCR and high-resolution melting analysis [4] [15].
MgCl₂ serves multiple essential roles in PCR biochemistry, primarily acting as a cofactor required for DNA polymerase activity while simultaneously influencing DNA strand separation dynamics [4]. The concentration of Mg²⁺ ions directly affects the thermodynamics and kinetics of DNA denaturation and annealing, making its optimization indispensable for reliable experimental outcomes. Recent advances in real-time PCR and high-resolution melting analysis have further elucidated how MgCl₂ concentration systematically affects PCR efficiency, moving beyond empirical optimization strategies toward evidence-based protocols [4].
Quantitative Relationship Between MgCl₂ and DNA Melting Temperature
Fundamental Logarithmic Relationship
A systematic meta-analysis of peer-reviewed studies has revealed a significant logarithmic relationship between MgCl₂ concentration and DNA melting temperature [3] [4]. This quantitative relationship provides a predictive framework for researchers seeking to optimize PCR conditions beyond traditional trial-and-error approaches. The analysis demonstrates that within the optimal concentration range of 1.5 to 3.0 mM, every 0.5 mM increment in MgCl₂ concentration consistently increases the DNA melting temperature by approximately 1.2°C [3]. This predictable relationship allows for precise tuning of reaction stringency based on template characteristics and experimental requirements.
Table 1: Quantitative Effects of MgCl₂ Concentration on DNA Melting Temperature
| MgCl₂ Concentration (mM) | Impact on Melting Temperature (°C) | Effect on PCR Efficiency | Effect on PCR Specificity |
|---|---|---|---|
| 1.0 - 1.5 | Suboptimal Tm increase | Reduced | Variable |
| 1.5 - 3.0 | ~1.2°C increase per 0.5 mM | Optimal | High |
| 3.0 - 4.5 | Continued logarithmic increase | Decreasing | Reduced |
| >4.5 | Potentially detrimental | Significantly reduced | Often compromised |
Template-Dependent Optimization
The optimal MgCl₂ concentration exhibits significant dependence on template characteristics, particularly GC content and sequence complexity [3] [4]. Genomic DNA templates generally require higher MgCl₂ concentrations (typically 1.5-3.0 mM) compared to simpler templates such as synthetic oligonucleotides [3]. This differential requirement stems from the more complex secondary structures and higher stability of genomic DNA, which necessitate increased Mg²⁺ concentrations for optimal denaturation and annealing dynamics.
The interplay between template GC content and MgCl₂ requirement is particularly noteworthy. Templates with elevated GC content (40-75%) demonstrate heightened sensitivity to MgCl₂ concentration, requiring precise optimization to overcome the increased thermodynamic stability of GC-rich regions [4]. This relationship underscores the necessity of template-specific optimization protocols rather than one-size-fits-all approaches to MgCl₂ concentration.
Table 2: Template-Specific MgCl₂ Optimization Guidelines
| Template Type | GC Content Range | Recommended MgCl₂ (mM) | Key Considerations |
|---|---|---|---|
| Genomic DNA | 40-75% | 1.5 - 3.0 | Higher concentrations for complex templates |
| Plasmid DNA | 40-60% | 1.5 - 2.5 | Moderate complexity |
| Synthetic Oligonucleotides | 40-60% | 1.0 - 2.0 | Lower requirements due to simplicity |
| GC-Rich Targets | >60% | 2.0 - 3.5 | Enhanced stability requires more Mg²⁺ |
| AT-Rich Targets | <40% | 1.0 - 2.0 | Lower stability requires less Mg²⁺ |
Experimental Protocols for MgCl₂ Optimization
MgCl₂ Titration Methodology
A systematic approach to MgCl₂ optimization begins with a titration experiment spanning concentrations from 1.0 mM to 4.0 mM in 0.5 mM increments [3] [16]. This protocol enables researchers to establish the precise concentration that maximizes amplification efficiency while maintaining specificity for their specific template and primer system.
Reaction Setup:
- Prepare a master mix containing all standard PCR components except MgCl₂
- Aliquot equal volumes into separate reaction tubes
- Add MgCl₂ stock solution to achieve final concentrations across the desired range (1.0, 1.5, 2.0, 2.5, 3.0, 3.5, and 4.0 mM)
- Include appropriate negative controls (no template) for each concentration
- Perform amplification using standardized cycling conditions
- Analyze results using gel electrophoresis and melt curve analysis
Assessment Parameters:
- Amplification efficiency (Cq values in qPCR)
- Reaction specificity (melt curve profiles, band clarity on agarose gels)
- Product yield (endpoint fluorescence or band intensity)
- Reproducibility between replicates [16]
Validation Through Melting Curve Analysis
High-resolution melting (HRM) analysis provides a powerful tool for validating PCR specificity following MgCl₂ optimization [15] [17]. This technique leverages the principle that the thermal stability of dsDNA is influenced by its length, base composition, and Mg²⁺ concentration, generating characteristic melting profiles that serve as fingerprints for amplification products.
HRM Protocol:
- Perform PCR amplification with intercalating dye (SYBR Green I, EvaGreen)
- After amplification, gradually increase temperature from 60°C to 95°C
- Monitor fluorescence continuously as dsDNA denatures
- Generate melting curves by plotting negative derivative of fluorescence (-dF/dT) versus temperature
- Analyze curve characteristics for single or multiple peaks indicating specific or non-specific amplification [15] [17]
Interpretation Guidelines:
- Single, sharp peaks typically indicate specific amplification
- Multiple peaks may suggest primer dimers, non-specific products, or complex melting behavior of a single amplicon
- Validation through agarose gel electrophoresis is recommended for ambiguous results [17]
Visualization of MgCl₂ Optimization Workflow
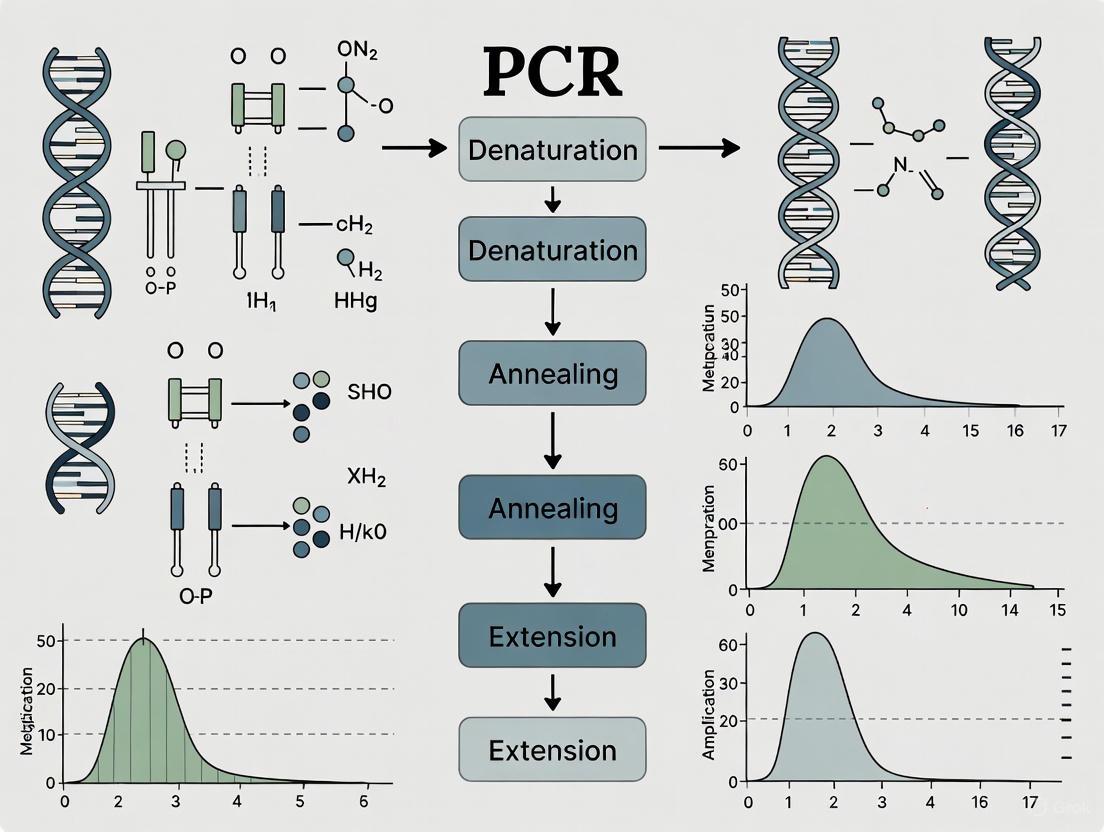
Diagram 1: MgCl₂ Optimization and Validation Workflow. This flowchart outlines the systematic process for optimizing MgCl₂ concentration and validating PCR specificity through melting curve analysis.
Mechanisms of Mg²⁺ in PCR Thermodynamics
Diagram 2: Multifaceted Roles of Mg²⁺ Ions in PCR Thermodynamics and Kinetics. This diagram illustrates the diverse mechanisms through which Mg²⁺ concentration influences PCR efficiency and specificity.
The Scientist's Toolkit: Essential Research Reagents
Table 3: Essential Reagents for MgCl₂ Optimization and Melt Curve Analysis
| Reagent/Resource | Function in Optimization | Application Notes |
|---|---|---|
| Magnesium Chloride (MgCl₂) | Primary reaction cofactor; modulates Tm | Use PCR-grade; concentration critical [3] [4] |
| SYBR Green I Dye | Intercalating dye for melt curve analysis | Binds dsDNA; fluoresces during melting [17] |
| TaqMan Probes | Sequence-specific detection method | Hydrolysis probes; additional specificity [16] |
| DNA Polymerase | Enzymatic DNA amplification | Thermostable; Mg²⁺ dependent [18] |
| dNTPs | Nucleotide substrates for polymerization | Balanced with Mg²⁺ concentration [16] |
| uMelt Software | Predicts melting curves for amplicons | Free online tool; incorporates Mg²⁺ effects [17] |
| HRM Instrumentation | High-resolution melt curve acquisition | Precise temperature control essential [15] |
| Agarose Gel Electrophoresis | Amplicon size verification | Gold standard for product purity [17] |
Advanced Applications and Future Directions
High-Resolution Melting (HRM) Analysis
Recent advances in high-resolution melting analysis have transformed our ability to validate PCR specificity following magnesium optimization [15]. HRM analysis generates melting curves by monitoring fluorescence changes during dsDNA denaturation, with melting temperature (Tm) serving as a fundamental indicator of sample characteristics. The development of predictive models for Tm values in HRM analysis represents a significant advancement, with empirical formulas now available that account for GC content, sequence length, and thermodynamic parameters [15].
For GC content between 40-60%: Tm = ΔH/ΔS - 0.27GC% - (150+2n)/n - 273.15
For GC content below 40%: Tm = ΔH/ΔS - GC%/3 - (150+2n)/n - 273.15
These predictive equations enable researchers to forecast melting behavior during assay design, reducing experimental optimization time and enhancing the efficiency of HRM assay development [15].
Novel Polymerase Engineering
The development of novel DNA polymerase variants with enhanced reverse transcription activity represents a frontier in PCR technology with implications for Mg²⁺ optimization [18]. Recent protein engineering efforts have produced Thermus aquaticus DNA polymerase I (Taq pol) variants capable of catalyzing both reverse transcription and DNA amplification simultaneously without requiring viral reverse transcriptases [18]. These engineered enzymes maintain functionality under standardized Mg²⁺ concentrations while expanding application possibilities, particularly for multiplex RNA detection systems.
The advent of single-enzyme RT-PCR systems simplifies reaction optimization by reducing the number of enzymatic components requiring specific cofactor concentrations [18]. This innovation is particularly valuable for diagnostic applications where robustness and reproducibility are paramount, potentially streamlining Mg²⁺ optimization protocols while maintaining assay sensitivity and specificity.
The logarithmic relationship between MgCl₂ concentration and DNA melting temperature represents a fundamental principle in PCR optimization with far-reaching implications for assay development and validation [3] [4]. Through systematic titration experiments and validation via high-resolution melting analysis, researchers can establish template-specific conditions that maximize both efficiency and specificity. The quantitative guidelines presented herein—particularly the 1.2°C Tm increase per 0.5 mM MgCl₂ within the 1.5-3.0 mM range—provide evidence-based optimization strategies that transcend traditional empirical approaches [3].
The integration of predictive bioinformatics tools, such as uMelt software, with experimental validation creates a powerful framework for assay development [17]. Furthermore, continued advancements in polymerase engineering and high-resolution melt analysis promise to enhance our understanding of Mg²⁺-mediated effects on PCR thermodynamics [18] [15]. By applying these principles and methodologies, researchers can develop robust, reproducible PCR protocols tailored to their specific template requirements and application needs, advancing molecular diagnostics and genetic analysis across diverse scientific disciplines.
In polymerase chain reaction (PCR) optimization, magnesium chloride (MgCl₂) concentration serves as a pivotal factor controlling the fundamental balance between amplification success and failure. Acting as an essential cofactor for thermostable DNA polymerases, Mg²⁺ ions directly influence enzyme kinetics, primer-template binding stability, and reaction stringency [19]. The critical importance of Mg²⁺ optimization extends across diverse PCR applications, from clinical diagnostics detecting drug-resistant pathogens [20] to environmental monitoring of antimicrobial resistance genes [21]. Recent meta-analyses of optimization studies have quantified the profound impact of Mg²⁺ concentration on PCR performance, establishing clear mathematical relationships between Mg²⁺ levels and key reaction parameters [4] [3] [7]. Within this framework, melting curve analysis has emerged as an indispensable validation tool, providing a sensitive readout of amplification specificity and product homogeneity that directly reflects Mg²⁺-mediated effects [20] [22]. This guide examines the experimental evidence defining optimal Mg²⁺ concentrations across diverse PCR applications, comparing performance outcomes through standardized melting curve validation to establish evidence-based protocols for maximizing amplification specificity while minimizing non-specific products.
Quantitative Effects of Mg²⁺ Concentration on PCR Performance
Mg²⁺ Concentration Directly Influences DNA Melting Temperature
Comprehensive meta-analysis of 61 peer-reviewed studies has established a significant logarithmic relationship between MgCl₂ concentration and DNA melting temperature (Tₘ), with optimal concentrations typically falling between 1.5 and 3.0 mM [4] [3]. Within this range, every 0.5 mM increment in MgCl₂ concentration produces an average 1.2°C increase in melting temperature [3]. This predictable relationship provides a crucial foundation for systematic PCR optimization, particularly when combined with melting curve analysis for experimental validation [22].
Table 1: Experimentally Determined Effects of Mg²⁺ Concentration on PCR Performance
| MgCl₂ Concentration (mM) | Impact on Melting Temperature (Tₘ) | Effect on Reaction Specificity | Typical Application Context |
|---|---|---|---|
| < 1.5 | Reduced Tₘ (> 2°C below optimal) | High specificity but potential amplification failure | Simple templates with low GC content |
| 1.5 - 3.0 | Optimal Tₘ stability | Maximal specificity and yield | Standard genomic DNA amplification |
| > 3.0 | Elevated Tₘ (> 2°C above optimal) | Increased non-specific amplification | Challenging templates with secondary structure |
| Variable (1.0 - 4.0) | Tₘ shifts detectable by melting curve | Template-dependent specificity | Requires empirical optimization |
Template-Specific Optimization Requirements
The optimal Mg²⁺ concentration varies significantly depending on template characteristics. Advanced predictive modeling incorporating thermodynamic principles has demonstrated that genomic DNA templates typically require higher Mg²⁺ concentrations (2.0-3.0 mM) compared to simpler synthetic oligonucleotides (1.5-2.0 mM) [7]. Similarly, templates with high GC content or complex secondary structures often benefit from marginally elevated Mg²⁺ concentrations (2.5-3.5 mM) to overcome structural barriers to amplification [19]. These template-specific requirements highlight the limitation of one-size-fits-all Mg²⁺ protocols and underscore the value of systematic optimization using melting curve validation [22].
Comparative Experimental Analysis: Mg²⁺ Optimization in Practice
Diagnostic PCR for Pathogen Detection
In developing a multiplex real-time PCR assay for detecting drug-resistant Mycobacterium tuberculosis, researchers implemented a MgCl₂ concentration of 1.5 mM to maintain probe stability while ensuring specific amplification of multiple targets simultaneously [20]. This carefully optimized concentration supported a detection system that demonstrated 100% sensitivity and specificity across 158 clinical isolates when validated against sequencing data [20]. The successful implementation relied on melting curve analysis to verify that all mutations covered by the six probes were detected without cross-reactivity, a critical consideration for clinical diagnostics [20].
Environmental DNA Analysis
For quantitative PCR assessment of antimicrobial resistance genes in surface water, standardized protocols required Mg²⁺ optimization to address the challenges of complex environmental templates [21]. The presence of potential PCR inhibitors co-extracted with target DNA necessitated fine-tuning of Mg²⁺ concentrations to maintain reaction efficiency while ensuring specific amplification [19]. Experimental data confirmed that deviation from optimized Mg²⁺ conditions resulted in either false negatives due to inhibition or false positives from non-specific amplification [21].
Fungal Pathogen Identification
In comparative evaluations of detection methods for Fusarium tricinctum, multiple PCR-based approaches (LAMP, nested PCR, and real-time PCR) each required specific Mg²⁺ optimization to achieve maximal sensitivity [23]. The study systematically tested Mg²⁺ concentrations ranging from 2.0-12.0 mM for LAMP assays, ultimately determining that 4.0-8.0 mM provided optimal performance for this isothermal amplification method [23]. The variation in optimal Mg²⁺ concentrations between different PCR methodologies highlights the technology-specific nature of optimization requirements.
Table 2: Method-Specific Magnesium Optimization Protocols
| PCR Methodology | Optimal MgCl₂ Range | Key Performance Metrics | Validation Approach |
|---|---|---|---|
| Conventional PCR | 1.5 - 2.5 mM | Band intensity, specificity by electrophoresis | Gel electrophoresis, product sequencing |
| Real-time PCR | 1.5 - 3.0 mM | Cq values, amplification efficiency, melting curves | Standard curves, melting peak analysis |
| Multiplex PCR | 2.0 - 3.0 mM | Balanced amplification of all targets, no primer-dimer | Multiplex validation, specific probe detection |
| LAMP | 4.0 - 8.0 mM | Reaction time, visual detection limit | Colorimetric change, gel verification |
Melting Curve Analysis: The Gold Standard for Specificity Validation
Fundamentals of Melting Curve Validation
High-resolution melting (HRM) analysis provides a powerful post-amplification assessment of PCR product homogeneity and sequence variation [22]. The technique leverages the principle that thermal stability of double-stranded DNA is determined by length, GC content, and sequence composition, generating unique melting profiles that serve as molecular fingerprints for amplified products [22]. Following Mg²⁺ optimization, melting curve analysis validates specificity by confirming the presence of a single, sharp melting peak with a characteristic Tₘ, while non-specific amplification manifests as multiple peaks or broad, irregular melting profiles [20] [22].
Predictive Modeling of Melting Temperatures
Recent advances have established empirical formulas for predicting Tₘ values based on DNA sequence characteristics, with demonstrated accuracy averaging within 1°C of experimentally observed values [22]. For sequences with GC content between 40-60%, the predictive formula is: Tₘ = ΔH/ΔS - 0.27GC% - (150+2n)/n - 273.15, where ΔH represents enthalpy change, ΔS represents entropy change, and n represents the number of base pairs [22]. This computational approach enables researchers to forecast expected Tₘ values during assay design, providing reference points for interpreting experimental melting curves obtained after Mg²⁺ optimization.
Diagram 1: Mg²⁺ optimization workflow with melting curve validation. This process ensures precise determination of optimal concentrations through iterative testing and specificity confirmation.
Advanced Predictive Modeling for Mg²⁺ Optimization
Thermodynamic Framework for Parameter Prediction
Cutting-edge research has developed sophisticated predictive models using multivariate Taylor series expansion and thermodynamic integration to forecast optimal MgCl₂ concentrations and melting temperatures with remarkable accuracy (R² = 0.9942 for MgCl₂ prediction, R² = 0.9600 for Tₘ prediction) [7]. These models incorporate multiple reaction parameters including template characteristics (GC content, length), reagent concentrations (dNTPs, primers, polymerase), and buffer conditions (pH) to generate precise optimization guidelines [7]. The resulting predictive equation for MgCl₂ concentration is:
(MgCl₂) ≈ 1.5625 + (-0.0073 × Tₘ) + (-0.0629 × GC) + (0.0273 × L) + (0.0013 × dNTP) + (-0.0120 × Primers) + (0.0007 × Polymerase) + (0.0012 × log(L)) + (0.0016 × TₘGC) + (0.0639 × dNTPPrimers) + (0.0056 × pH_Polymerase) [7]
Machine Learning Approaches
Beyond thermodynamic modeling, deep learning approaches using one-dimensional convolutional neural networks (1D-CNNs) have demonstrated impressive capability in predicting sequence-specific amplification efficiencies based solely on sequence information [24]. These models achieve high predictive performance (AUROC: 0.88) and can identify specific sequence motifs adjacent to priming sites that correlate with poor amplification efficiency, enabling proactive assay design that avoids problematic sequences [24]. The integration of these computational approaches with empirical Mg²⁺ optimization creates a powerful framework for achieving maximal PCR specificity.
The Scientist's Toolkit: Essential Reagents for Mg²⁺ Optimization
Table 3: Key Research Reagents for Magnesium Optimization Studies
| Reagent / Material | Function in Optimization | Application Context |
|---|---|---|
| MgCl₂ stock solutions (25-100 mM) | Precise concentration adjustment through titration | All PCR optimization protocols |
| High-fidelity DNA polymerase | Enzyme with proofreading activity for accurate amplification | Cloning, sequencing, complex templates |
| dNTP mix (10 mM each) | Balanced nucleotide substrates to prevent misincorporation | Standardized reaction assembly |
| Betaine (5M stock) | Additive that homogenizes DNA thermal stability | GC-rich templates, difficult amplicons |
| DMSO (100%) | Additive that reduces DNA melting temperature | Templates with strong secondary structure |
| SYBR Green I dye | Fluorescent intercalating dye for melting curve analysis | Real-time PCR with melting validation |
| Hydroxy naphthol blue (HNB) | Colorimetric indicator for visual detection | LAMP assays, field applications |
| Standard DNA templates | Control materials with known amplification characteristics | Assay validation and performance tracking |
The experimental evidence consistently demonstrates that meticulous Mg²⁺ optimization remains an indispensable component of PCR assay development, directly determining the critical balance between amplification specificity and non-product formation. Through systematic concentration titration validated by melting curve analysis, researchers can establish template-specific and methodology-appropriate Mg²⁺ conditions that maximize detection sensitivity while minimizing false amplification. The integration of predictive modeling with empirical validation creates an efficient optimization pathway, reducing reagent consumption and development time while ensuring robust, reproducible results across diverse applications from clinical diagnostics to environmental surveillance. As PCR technologies continue to evolve, the fundamental principles of Mg²⁺-mediated reaction control remain central to achieving reliable amplification fidelity, establishing this critical balance as a cornerstone of molecular assay quality assurance.
A Step-by-Step Protocol for Magnesium Titration and High-Resolution Melting Analysis
In polymerase chain reaction (PCR) optimization, magnesium chloride (MgCl₂) serves as an essential cofactor for DNA polymerase enzyme activity and significantly influences reaction efficiency and amplification fidelity. A clear understanding of how MgCl₂ affects PCR thermodynamics and kinetics is crucial for creating efficient and reliable protocols that work consistently [3]. The concentration of MgCl₂ directly impacts the annealing of primers to template DNA, the melting temperature (Tm) of DNA duplexes, and the overall specificity of the amplification reaction. Proper MgCl₂ titration is particularly crucial for advanced applications such as melting curve analysis, a technique used to validate PCR specificity and detect genetic variants by analyzing the dissociation characteristics of amplified products [25].
The design of a systematic MgCl₂ titration experiment requires careful consideration of concentration ranges and interval selection to accurately identify optimal reaction conditions. This guide provides evidence-based protocols and quantitative frameworks for designing MgCl₂ optimization experiments, with particular emphasis on supporting research validation through melting curve analysis. Through appropriate interval selection and concentration testing, researchers can achieve significant improvements in both the efficiency and specificity of PCR, enabling more reliable results in diagnostic applications, drug development, and fundamental research.
MgCl₂ in PCR: Mechanism and Optimization Principles
Biochemical Functions of MgCl₂ in PCR
Magnesium ions play several fundamental roles in PCR biochemistry. Primarily, Mg²⁺ acts as an essential cofactor for thermostable DNA polymerases, facilitating the enzymatic catalysis of DNA synthesis. The ions form coordination complexes with the dNTPs, effectively neutralizing the negative charge on the phosphate groups and making them recognizable substrates for the polymerase enzyme. Additionally, Mg²⁺ influences the stability of DNA duplexes by shielding the negative charges on the phosphate backbone of DNA, thereby affecting the melting and annealing temperatures of primer-template complexes. This dual function makes MgCl₂ concentration a critical parameter that must be optimized for each specific primer-template system to achieve maximal amplification efficiency while maintaining stringent specificity.
Quantitative Effects on PCR Thermodynamics
Recent meta-analyses have revealed quantitative relationships between MgCl₂ concentration and PCR performance parameters. A comprehensive review of 61 peer-reviewed studies established a strong logarithmic relationship between MgCl₂ concentration and DNA melting temperature, with an optimal range between 1.5 and 3.0 mM [3]. Within this range, every 0.5 mM increase in MgCl₂ concentration was associated with a 1.2 °C increase in melting temperature [3]. This quantitative understanding provides a theoretical foundation for designing titration intervals that can effectively capture the optimal window for specific experimental conditions.
Table 1: Effects of MgCl₂ Concentration on PCR Parameters
| MgCl₂ Concentration | Effect on Melting Temperature (Tm) | Impact on PCR Efficiency | Effect on Specificity |
|---|---|---|---|
| Too low (< 1.0 mM) | Decreased Tm | Significantly reduced | High but poor yield |
| Low (1.0-1.5 mM) | Slightly decreased Tm | Suboptimal | Generally high |
| Optimal (1.5-3.0 mM) | Appropriate for most applications | Maximum | Balanced and high |
| High (3.0-4.5 mM) | Increased Tm | Good but may decrease | Potential reduction |
| Too high (> 4.5 mM) | Significantly increased Tm | Unpredictable | Often compromised |
Experimental Design: Systematic Titration Approach
Determining Concentration Ranges
The design of a MgCl₂ titration experiment must account for template characteristics and primer properties. Evidence indicates that template complexity significantly affects optimal MgCl₂ requirements, with genomic DNA templates typically requiring higher concentrations than simpler plasmid or amplicon templates [3]. Based on systematic analysis, a foundational titration range of 1.0 mM to 4.0 mM in 0.5 mM intervals provides adequate coverage for most applications while maintaining practical efficiency [3].
For novel systems with unknown optimization requirements, a broader preliminary screen (e.g., 0.5-6.0 mM in 1.0 mM intervals) can identify the general optimal range, followed by a finer-interval titration within a narrower window. This two-phase approach efficiently balances comprehensive coverage with practical resource management. The selection of appropriate intervals is crucial for experimental validity, as inadequate intervals can lead to missed optimal concentrations, while excessively frequent intervals generate redundant data without substantive improvement in resolution [26].
Interval Selection Strategy
The principle of interval selection in chemical experiments applies directly to MgCl₂ titration: intervals must be sufficiently small to capture significant changes in reaction performance while considering practical constraints. Research indicates that 0.25-0.5 mM intervals provide optimal resolution for identifying precise MgCl₂ optima without generating excessive data volume [26] [3]. For standard optimization, seven to nine concentration points typically provide sufficient data density for accurate determination of optimal conditions.
Variable interval strategies can also be employed, with narrower intervals (e.g., 0.25 mM) around suspected optimal zones based on preliminary data and wider intervals (e.g., 0.5-1.0 mM) in suboptimal ranges. This approach maximizes information content while optimizing resource utilization. The concept of variable intervals is sometimes beneficial, using shorter intervals at critical optimization points [26].
Diagram 1: Systematic workflow for MgCl₂ titration experiment design
Experimental Protocol: MgCl₂ Titration for PCR Optimization
Reagent Preparation and Setup
The following protocol provides a standardized approach for MgCl₂ titration suitable for validation in melting curve analysis:
Prepare MgCl₂ stock solution: Begin with a certified molecular biology-grade MgCl₂ solution at standardized concentration (typically 25 mM or 50 mM). Verify concentration accuracy through spectrophotometry or conductometric measurement if required.
Create master mix: Prepare a master mixture containing all PCR components except MgCl₂ and template DNA to ensure reaction consistency across titration points. Include buffer, dNTPs, primers, polymerase, and nuclease-free water.
Set up dilution series: Aliquot the master mix into individual reaction tubes or plate wells. Add varying volumes of MgCl₂ stock solution to achieve the target concentration range (e.g., 1.0, 1.5, 2.0, 2.5, 3.0, 3.5, and 4.0 mM). Adjust water volumes to maintain constant total reaction volume across all conditions.
Add template and controls: Introduce template DNA to all test reactions, maintaining consistent concentration across conditions. Include appropriate negative controls (no-template) for each MgCl₂ concentration to monitor contamination.
Execute amplification: Perform PCR using cycling parameters appropriate for the specific application, ensuring compatibility with subsequent melting curve analysis.
Assessment Methods and Validation
Post-amplification analysis should employ multiple assessment methods to comprehensively evaluate PCR performance across the MgCl₂ concentration gradient:
Gel electrophoresis: Separate amplification products by agarose gel electrophoresis to visualize amplification yield, specificity, and amplicon size verification.
Melting curve analysis: Following amplification, perform high-resolution melting curve analysis by gradually increasing temperature from 60°C to 95°C (0.06°C/s increment) while continuously monitoring fluorescence [25]. Record derivative melting curves to assess reaction specificity and product homogeneity.
Quantitative analysis: For qPCR applications, calculate amplification efficiency (E) and correlation coefficients (R²) from standard curves run at each MgCl₂ concentration.
Data interpretation: Identify the MgCl₂ concentration that provides optimal combination of high yield, specific single amplification product, and characteristic sharp, single-peak melting curve.
Table 2: Comprehensive MgCl₂ Titration Setup Protocol
| Component | Volume for 1 Reaction (μL) | Final Concentration | Function |
|---|---|---|---|
| PCR Buffer (10X) | 2.0 | 1X | Reaction buffer |
| dNTP Mix (10 mM) | 0.4 | 200 μM each | Nucleotide substrates |
| Forward Primer (10 μM) | 0.5 | 0.25 μM | Target-specific forward primer |
| Reverse Primer (10 μM) | 0.5 | 0.25 μM | Target-specific reverse primer |
| Template DNA | 2.0 | Variable | Target amplification |
| MgCl₂ Stock (25 mM) | Variable (0.8-4.0 μL) | 1.0-4.0 mM | Polymerase cofactor |
| DNA Polymerase (5 U/μL) | 0.2 | 1.0 U | Catalytic enzyme |
| Nuclease-free Water | To 20 μL | - | Reaction volume adjustment |
Data Interpretation and Analysis
Evaluating Titration Results
Systematic analysis of MgCl₂ titration data should focus on identifying the concentration that optimizes multiple performance parameters simultaneously. The optimal MgCl₂ concentration typically demonstrates:
- Maximum amplification efficiency as determined by the lowest Cq values in qPCR applications or the greatest band intensity in endpoint PCR
- Specific product formation evidenced by a single, sharp band of expected size on agarose gels
- Homogeneous melting profile characterized by a single, sharp peak in melting curve analysis [25]
- Consistent replicate performance across technical and biological replicates
Data should be analyzed to establish the minimum MgCl₂ concentration that supports robust amplification while maintaining stringent specificity, as this condition typically yields the highest fidelity in complex applications.
Integration with Melting Curve Validation
Melting curve analysis provides a critical validation step for assessing PCR specificity following MgCl₂ optimization. The technique measures the temperature at which double-stranded DNA amplicons dissociate (melt) into single strands, with the characteristic melting temperature (Tm) dependent on the GC content, length, and sequence complementarity of the amplification product [25]. Following MgCl₂ titration and amplification, melting curve analysis should be performed with temperature increasing gradually from 40°C to 80°C at a controlled rate of 0.06°C/s while continuously monitoring fluorescence [25].
Well-optimized reactions with appropriate MgCl₂ concentrations produce a single, sharp melting peak, indicating specific amplification of a single product. In contrast, suboptimal MgCl₂ concentrations often yield multiple peaks or broad melting curves, suggesting nonspecific amplification or primer-dimer formation. This validation is particularly important for diagnostic applications and single nucleotide polymorphism (SNP) detection, where amplification specificity directly impacts result reliability.
Diagram 2: Data interpretation workflow for melting curve analysis after MgCl₂ titration
Research Reagent Solutions and Materials
Successful implementation of MgCl₂ titration experiments requires specific reagents and instrumentation selected for quality and performance consistency. The following toolkit outlines essential components:
Table 3: Essential Research Reagent Solutions for MgCl₂ Titration Studies
| Reagent/Instrument | Specification Guidelines | Primary Function |
|---|---|---|
| MgCl₂ Solution | Molecular biology grade, certified concentration | Polymerase cofactor providing Mg²⁺ ions |
| DNA Polymerase | Thermostable, high-fidelity preferred | DNA amplification enzyme |
| dNTP Mix | Ultrapure, pH-neutral, quality controlled | Nucleotide substrates for DNA synthesis |
| Primers | HPLC-purified, sequence-verified | Target-specific amplification |
| Buffer System | Compatible with polymerase, minimal Mg²⁺ | Reaction environment stabilization |
| Template DNA | Quantified, integrity-verified | Amplification target |
| Real-time PCR System | Melting curve analysis capability | Amplification and dissociation monitoring |
| Electrophoresis System | Agarose gel capability | Amplification product separation |
Systematic design of MgCl₂ titration experiments with appropriate concentration ranges and interval selection provides a foundational approach for optimizing PCR specificity and efficiency. The recommended range of 1.0-4.0 mM with 0.25-0.5 mM intervals offers a balanced strategy for identifying optimal conditions while conserving resources. Validation through melting curve analysis confirms reaction specificity, with well-optimized conditions producing single, sharp melting peaks indicative of specific amplification.
The quantitative relationship between MgCl₂ concentration and DNA melting temperature (approximately 1.2°C increase per 0.5 mM MgCl₂) provides a theoretical framework for predicting and interpreting optimization outcomes [3]. This systematic approach to MgCl₂ titration establishes a robust foundation for PCR-based research, diagnostic applications, and validation studies requiring high specificity and reproducibility.
Melting Curve Analysis (MCA) is a powerful technique for assessing the dissociation characteristics of double-stranded DNA during heating, providing a critical method for validating PCR specificity. Following the amplification phase of a PCR, the reaction mixture is gradually heated while monitoring fluorescence. Double-stranded DNA (dsDNA) intercalating dyes, such as SYBR Green or EvaGreen, fluoresce intensely when bound to dsDNA but lose fluorescence as the DNA strands separate (denature) with increasing temperature. The temperature at which 50% of the DNA is denatured is known as the melting temperature (Tm), a unique property for each DNA sequence based on its length, GC content, and complementarity [27].
The integration of MCA is particularly valuable in diagnostic and research applications for several reasons. It enables the discrimination of specific PCR products from non-specific amplification, verifying the identity of amplified targets without additional gel electrophoresis. Furthermore, MCA is sensitive enough to detect single-nucleotide polymorphisms (SNPs), as G-C base pairs (with three hydrogen bonds) result in a higher Tm than A-T base pairs (with two hydrogen bonds) [27]. This capability makes MCA an indispensable tool for genotyping, mutation scanning, and ensuring the specificity of PCR results, especially following optimization of critical parameters such as magnesium concentration [28].
Principles of DNA Melting and Peak Interpretation
The fundamental principle underlying MCA is the relationship between DNA sequence composition and its thermal stability. The energy required to separate two DNA strands is directly influenced by the strength of the hydrogen bonding between base pairs. Since G-C base pairs are stabilized by three hydrogen bonds and A-T base pairs by two, DNA fragments with higher GC content will typically exhibit higher melting temperatures [27]. This relationship allows researchers to infer sequence composition from melting behavior.
During a melting curve analysis, fluorescence is monitored continuously as the temperature increases. The raw data produces a sigmoidal curve where the fluorescence decreases sharply as the DNA denatures. For easier interpretation, the negative first derivative of this fluorescence curve is typically plotted, transforming the sigmoidal curve into a distinct peak where the trough corresponds to the Tm [27]. In a perfectly specific PCR reaction, a single, sharp melting peak is expected, indicating a homogeneous population of amplicons. The presence of multiple peaks or broad peaks suggests multiple amplification products, such as primer dimers, non-specific products, or heterozygous samples in genotyping applications [29] [27].
Several factors beyond the DNA sequence itself can influence the observed melting temperature. The presence of DNA intercalators can stabilize the duplex and raise the Tm, while increasing salt concentrations help neutralize the repulsive forces between phosphate groups in the DNA backbone, also leading to an increased Tm [27]. These principles form the basis for interpreting melting profiles and troubleshooting PCR specificity issues.
Comparative Analysis of Melting Curve-Based Techniques
Melting curve analysis has evolved significantly from its origins in UV absorbance measurements to modern fluorescence-based techniques implemented in real-time PCR instruments [27]. Several methodological approaches exist, each with distinct advantages and applications for PCR validation. The table below provides a structured comparison of these key techniques.
Table 1: Comparison of Melting Curve Analysis Techniques for PCR Validation
| Technique | Principle | Key Applications | Advantages | Limitations |
|---|---|---|---|---|
| Standard MCA (qPCR with intercalating dyes) | Uses dyes (e.g., SYBR Green) that fluoresce when bound to dsDNA; fluorescence decreases as DNA melts during heating [27]. | Verification of PCR product specificity; differentiation of amplicons with different Tm values [27]. | Low-cost (no probes needed); simple workflow; works on standard real-time PCR instruments [30]. | Primarily qualitative in qPCR; limited multiplexing in conventional systems; may not distinguish very similar sequences [31]. |
| High-Resolution Melting (HRM) | Uses advanced saturating dyes (e.g., EvaGreen) and high-precision temperature control to generate highly detailed melting profiles [32] [27]. | SNP genotyping; mutation scanning; methylation analysis; fine discrimination of highly similar amplicons [32] [27]. | Highest sensitivity for detecting single-base variants; probeless design reduces cost; can scan entire amplicons [32]. | Requires specialized instruments with fine temperature control; results can be sensitive to DNA quality and concentration. |
| Probe-Based Melting Analysis | Uses fluorescently labelled probes (e.g., FRET probes, hybridization probes) that hybridize to a specific internal sequence within the amplicon [27]. | SNP detection and genotyping; specific allele discrimination [27]. | High specificity for the probe-binding site; robust for genotyping known mutations; lower background signal. | Higher cost per assay due to probe synthesis; multiplexing limited by number of fluorescent channels [31]. |
| Digital Melting Curve Analysis (dMCA) | Combines digital PCR partitioning with MCA. Melting curves are generated from thousands of individual droplets or micro-wells [31]. | Absolute quantification of multiple targets in a single reaction; rare allele detection; complex sample analysis [31]. | Enables multiplex quantification independent of fluorescence channels; absolute quantification without standard curves; high sensitivity [31]. | Requires specialized digital PCR instrumentation; data analysis is more complex. |
The choice of technique depends heavily on the application requirements. For routine verification of PCR specificity after magnesium optimization, standard MCA is often sufficient. However, for applications requiring the detection of single-nucleotide changes, such as in clinical diagnostics for genetic disorders, HRM provides superior resolution [32]. When absolute quantification of multiple targets is needed from a single sample, as in multi-pathogen detection, digital MCA offers a powerful solution that overcomes the multiplexing limitations of traditional qPCR [31].
Experimental Protocols for Melting Curve Analysis
Basic Protocol for Melting Curve Analysis in qPCR
A standard melting curve analysis follows the completion of the amplification cycles in a real-time PCR run. The following protocol is adapted from established molecular biology methods [29] [27]:
- PCR Amplification: Perform a standard real-time PCR reaction using a dsDNA-binding dye like SYBR Green I. A typical 50 μL reaction mixture includes:
- 5 μL of 10X PCR buffer
- 1 μL of 10 mM dNTP mix (200 μM final concentration)
- 1.5 to 4.0 mM MgCl₂ (concentration must be optimized)
- 1 μL each of forward and reverse primer (20 μM each)
- 0.5 to 2.5 units of DNA polymerase
- DNA template (1-1000 ng)
- Sterile distilled water to 50 μL [29]
- Melting Data Collection: After the final amplification cycle, set the real-time PCR instrument to perform the following:
- Denature at 95°C for 15 seconds.
- Anneal/hold at 60°C for 15 seconds to allow DNA duplexes to form.
- Gradually heat the sample from 60°C to 95°C with a continuous fluorescence acquisition (e.g., 0.2°C per second). The slow ramp rate ensures high-resolution data collection [27].
- Data Analysis: Plot the fluorescence (F) versus temperature (T) to generate the melting curve. Then, plot the negative derivative of the fluorescence over temperature (-dF/dT) versus temperature to obtain the melting peak(s). Analyze the number, shape, and position (Tm) of the peaks to assess reaction specificity and product identity [27].
Protocol for Magnesium Optimization with MCA Validation
Magnesium ion (Mg²⁺) concentration is a critical factor affecting PCR specificity and efficiency, as it influences DNA polymerase activity, primer annealing, and nucleic acid duplex stability [28]. The following protocol details how to optimize Mg²⁺ concentration and use MCA to validate the results.
- Preparation of Mg²⁺ Gradient: Set up a series of PCR reactions identical in all components except for the concentration of MgCl₂. A typical range is 0.5 mM to 5.0 mM, incrementing by 0.5 mM steps [29] [28].
- PCR Amplification and MCA: Run the PCR with the gradient of Mg²⁺ concentrations, ensuring all other cycling parameters are constant. Include a melting curve analysis step at the end of each run.
- Analysis and Interpretation:
- Examine amplification curves for efficiency (steep curves) and early Cq values.
- Analyze the corresponding melting curves for each Mg²⁺ concentration.
- Identify the Mg²⁺ concentration that produces a single, sharp melting peak with the desired Tm. This indicates specific amplification of the target product.
- Note that sub-optimal Mg²⁺ concentrations often result in multiple melting peaks or smeared derivatives, indicating non-specific amplification or primer-dimer formation [28].
This integrated approach directly links the biochemical optimization of the PCR with a robust, post-amplification verification of specificity.
Workflow for Multiplex Quantification via Digital MCA
Digital MCA on a droplet digital PCR (ddPCR) platform represents an advanced protocol for the absolute quantification of multiple targets. The workflow below is based on a recent study that successfully quantified six pathogen genes using a single fluorescence channel [31].
- Droplet Generation: The nucleic acid sample and ddPCR reaction mixture are partitioned into approximately 20,000 nanoliter-sized droplets, effectively creating tens of thousands of individual PCR reactions [31].
- PCR Amplification: The droplets undergo standard PCR thermal cycling (e.g., 40 cycles). Amplification occurs in droplets that contain at least one copy of the target template.
- Endpoint Imaging and Droplet Classification: After amplification, an endpoint fluorescence image is captured. Droplets are initially classified as "positive" (high fluorescence) or "negative" (low fluorescence) based on a fluorescence threshold [31].
- Melting Curve Acquisition: The droplet array is heated gradually (e.g., from 60°C to 95°C). A series of fluorescence images is captured to track the fluorescence decay of each positive droplet as its DNA denatures. A displacement correction algorithm is often applied to accurately track droplets across temperature shifts [31].
- Melting Peak Analysis and Quantification:
- The fluorescence vs. temperature data for each positive droplet is used to generate its melting peak.
- Positive droplets are grouped based on their specific Tm value, which corresponds to different targets.
- The number of positive droplets in each Tm group is counted.
- The absolute concentration (copies/μL) of each target is calculated using Poisson statistics based on the fraction of negative droplets for that specific target [31].
Digital MCA Workflow for Multiplex Quantification
The Scientist's Toolkit: Essential Reagents and Materials
Successful implementation of melting curve analysis, particularly in the context of PCR optimization, requires specific reagents and instruments. The following table details key solutions and their functions in the experimental workflow.
Table 2: Essential Research Reagent Solutions for Melting Curve Analysis
| Item | Function/Application | Example Usage |
|---|---|---|
| Saturating DNA Dyes | Fluorescent dyes that bind dsDNA without inhibiting PCR; essential for generating the melting curve. | EvaGreen or SYBR Green I are used in the PCR reaction mix to monitor amplicon dissociation [27] [31]. |
| Thermostable DNA Polymerase | Enzyme that catalyzes DNA synthesis during PCR; choice affects fidelity and efficiency. | Taq DNA Polymerase is common for standard PCR. Vent or Pfu polymerases are preferred for higher fidelity applications [29] [28]. |
| Magnesium Salt (MgCl₂) | Essential cofactor for DNA polymerase; concentration must be optimized for each primer-template system. | A titrated range (e.g., 0.5-5.0 mM) is tested to find the concentration that maximizes specificity and yield, validated by a clean melting peak [29] [28]. |
| Optimized PCR Buffer | Provides optimal pH and ionic conditions for polymerase activity and primer hybridization. | 10X PCR buffers, often supplied with the enzyme, may contain KCl and (NH₄)₂SO₄ to enhance specificity [29] [28]. |
| dNTP Mix | Building blocks (dATP, dCTP, dGTP, dTTP) for DNA synthesis. | Added to the reaction at a final concentration of 50-200 μM of each dNTP; imbalance can reduce fidelity and specificity [29]. |
| Nuclease-Free Water | Solvent for the reaction; must be free of nucleases to prevent degradation of primers and template. | Used to reconstitute primers and bring the PCR reaction to its final volume [29]. |
| Positive Control Template | DNA known to amplify with the primers; used to validate the PCR and MCA conditions. | Included in optimization experiments to establish the expected Tm and to ensure the reaction is working correctly [29]. |
Data Interpretation and Troubleshooting Melting Peaks
Accurate interpretation of melting peaks is the final, critical step in validating PCR specificity. The figure below illustrates a logical decision process for analyzing melting curve data, linking observed patterns to likely causes and recommended actions.
Interpreting Melting Peak Profiles
As illustrated, a single, sharp peak at the expected Tm is the ideal outcome, confirming specific amplification of the intended target [27]. However, several non-ideal profiles are common during optimization:
- Multiple Peaks or Shoulders: This profile strongly indicates amplification of multiple, distinct products. This is a classic sign of non-specific binding or primer-dimer formation. Remedies include optimizing Mg²⁺ concentration, as excess Mg²⁺ can promote non-specific annealing, and increasing the PCR annealing temperature to enhance stringency [29] [28]. Re-evaluating primer design to avoid secondary structures and self-complementarity is also crucial [29].
- Broad or Low Peaks: A broad melting transition suggests a heterogeneous population of amplicons of varying lengths or sequences. This can result from non-specific priming, contaminated template, or poor PCR efficiency. Addressing this involves ensuring template DNA quality and integrity, and potentially using PCR enhancers like DMSO, formamide, or Betaine to improve the specificity and yield of difficult templates [29].
- Tm Shift from Expected: A consistent shift in the observed Tm from the in silico prediction can indicate the presence of a sequence variant, such as a single-nucleotide polymorphism (SNP). This is the fundamental principle behind HRM genotyping [32] [27]. However, it can also signal amplification of an unintended, homologous sequence. Confirmation via Sanger sequencing is recommended in such cases.
Melting curve analysis is an indispensable, robust, and cost-effective method for validating PCR specificity within a broader research context, such as magnesium optimization. Its ability to discriminate between specific and non-specific amplification products in a closed-tube system saves time and resources while providing high-quality data assurance. From basic product verification to advanced applications like high-resolution genotyping and digital multiplex quantification, MCA provides a versatile toolkit for the modern researcher. By following the detailed protocols for data collection and the logical framework for interpreting melting peaks outlined in this guide, scientists and drug development professionals can confidently integrate MCA into their molecular workflows, ensuring the reliability and accuracy of their PCR-based assays.
The optimization of the Polymerase Chain Reaction (PCR) remains a significant challenge in molecular biology, where success often hinges on the precise modulation of key parameters such as magnesium chloride (MgCl₂) concentration and melting temperature (Tm). Traditional optimization has relied heavily on empirical, trial-and-error approaches, which are often time-consuming and inefficient. However, recent advances in predictive modeling, grounded in thermodynamic principles and sophisticated mathematical frameworks, are revolutionizing this process. By integrating theoretical models with experimental data, these approaches enable the a priori determination of optimal PCR conditions, thereby enhancing amplification specificity, sensitivity, and efficiency. This guide provides a comparative analysis of these modern computational strategies, focusing on their application in validating PCR specificity via melting curve analysis following magnesium optimization, a critical concern for researchers and drug development professionals.
Thermodynamic and Mathematical Foundations of PCR Optimization
At its core, PCR is a thermodynamic process, and its optimization requires a deep understanding of the energetic principles governing nucleic acid interactions. The stability of DNA duplexes and their interactions with essential co-factors like Mg²⁺ ions are dictated by the fundamental Gibbs free energy equation: ΔG = ΔH - TΔS, where ΔG is the change in free energy, ΔH is the change in enthalpy, and ΔS is the change in entropy [7].
Mg²⁺ plays a multifaceted role: it is an essential cofactor for DNA polymerase activity and significantly influences reaction thermodynamics by stabilizing the DNA duplex through charge screening of the negatively charged phosphate backbone [7] [4]. The interaction between DNA and MgCl₂ can be modeled using a modified binding isotherm that accounts for cooperativity: θ = n × K × (Mg²⁺)ᶠ / (1 + K × (Mg²⁺)ᶠ), where the cooperativity factor f is itself a function of Mg²⁺ concentration [7]. Modern predictive frameworks incorporate these thermodynamic terms directly into their models. For instance, a normalized enthalpic term (ΔH/RT) captures molecular interactions like hydrogen bonding and van der Waals forces, while a normalized entropic term (ΔS/R) accounts for changes in molecular disorder [7].
Building on this thermodynamic foundation, sophisticated mathematical models are employed. One advanced approach uses a third-order multivariate Taylor series expansion to create a predictive function for MgCl₂ concentration. This model incorporates variables such as melting temperature (Tm), GC content, amplicon length (L), and concentrations of dNTPs, primers, and polymerase, expressed as: (MgCl₂) = β₀ + Σᵢβᵢxᵢ + Σᵢ Σⱼ βᵢⱼxᵢxⱼ + Σᵢ Σⱼ Σₖ βᵢⱼₖxᵢxⱼxₖ + βL ln(L) + βH(ΔH/RT) + β_S(ΔS/R) + ε [7]. Similarly, the hybridization temperature (Th) can be predicted using a comprehensive equation that includes primer-specific and environmental factors, which is also refined through a Taylor expansion [7]. This marriage of thermodynamic theory and mathematical modeling provides a robust, first-principles framework for moving beyond empirical guesswork.
Comparative Analysis of Predictive Modeling Approaches
Various modeling strategies have been developed to predict optimal PCR conditions, each with distinct advantages and performance characteristics. The table below summarizes the key features and efficacy of several prominent approaches.
Table 1: Comparison of Predictive Modeling Approaches for PCR Optimization
| Modeling Approach | Key Features | Reported R² for MgCl₂ Prediction | Reported Mean Absolute Error (MAE) | Best Use Cases |
|---|---|---|---|---|
| Linear Regression | Combines Taylor series expansion with thermodynamic terms; highly interpretable. | 0.9942 [7] | 0.0017 [7] | Standard PCR optimization; fast, reliable predictions. |
| Ridge Regression | Linear model with L2 regularization to prevent overfitting. | 0.9942 [7] | 0.0018 [7] | Datasets with correlated input variables. |
| Lasso Regression | Linear model with L1 regularization; can perform variable selection. | 0.9384 [7] | 0.0186 [7] | Models where variable importance is a key output. |
| Polynomial Regression | Captures nonlinear relationships between variables. | 0.9309 [7] | 0.0208 [7] | Modeling complex, curved response surfaces. |
| Random Forest | Ensemble method using multiple decision trees; robust to outliers. | 0.8989 [7] | 0.0305 [7] | Complex templates with strong non-linear parameter interactions. |
| Artificial Neural Networks (ANN) | Data-driven, can model highly complex, non-linear relationships. | Superior performance in hybrid models [33] [34] | Not Specified | Large, diverse datasets; integration with other model types. |
The performance comparison reveals that linear models, particularly Linear and Ridge Regression, can achieve exceptionally high accuracy (R² > 0.99) in predicting MgCl₂ concentration, making them both accurate and efficient for many applications [7]. However, non-linear models like Artificial Neural Networks (ANNs) show great promise in hybrid modeling frameworks, where they are used to refine predictions and capture intricate patterns that may be missed by simpler models [33] [34]. A critical output of these models is the quantitative assessment of variable importance, which highlights that the interaction between dNTP and primer concentrations is the most significant factor (28.5% relative importance), followed by GC content (22.1%) and amplicon length (15.7%) [7].
Experimental Protocols for Model Validation and Specificity Assessment
Computational Implementation and Model Training
The development of a predictive model follows a structured computational workflow. Implementation typically uses programming environments like Python 3.9 with key scientific libraries (e.g., scikit-learn) [7]. The process begins with defining the functional relationship of the system. For MgCl₂ prediction, this involves a model that incorporates Tm, GC%, amplicon length, and buffer component concentrations [7]. Model training involves using a curated dataset—like one derived from 120 species-specific PCR primers—to fit the parameters of the chosen model (e.g., the coefficients in a Taylor series expansion) [7]. To ensure robustness and prevent overfitting, rigorous validation techniques such as five-fold cross-validation and Monte Carlo simulations are employed. Hyperparameter tuning for regularization methods (Ridge, Lasso, Elastic Net) is conducted via grid search to select parameters that minimize the mean squared error on validation sets [7].
Laboratory Validation of Predicted Conditions
Once optimal conditions are predicted, laboratory validation is crucial. The following protocol details this process:
- Reaction Setup: Assemble PCR reactions on ice, adding all components (buffer, dNTPs, template DNA, primers) before finally adding the DNA polymerase [35]. The reaction mixture should use the MgCl₂ concentration and Tm predicted by the model.
- Thermal Cycling: Execute PCR using standard cycling conditions. An initial denaturation at 95°C for 2 minutes is recommended, followed by 25-40 cycles of denaturation (95°C for 15-30 seconds), annealing at the model-predicted temperature (for 15-30 seconds), and extension (68°C for 45-60 seconds per kb) [35]. Include a final extension step.
- Specificity Analysis via Melting Curve: For post-amplification validation, melting curve analysis is performed. After the final PCR cycle, the product is gradually heated from a low temperature (e.g., 60°C) to a high temperature (e.g., 95°C) while continuously monitoring fluorescence. A single, sharp peak in the resulting melting curve indicates a specific, homogeneous PCR product. The presence of multiple peaks or broad shoulders suggests nonspecific amplification or primer-dimer formation, signaling a need for further optimization [4].
- Gel Electrophoresis: Confirm amplification success and product size by running the PCR products on an agarose gel (e.g., 1% w/v) stained with an intercalating dye, using TAE buffer at 120V for 35-40 minutes [36]. Band intensity can be quantitated to assess yield.
The Scientist's Toolkit: Essential Research Reagents
The following table lists key reagents and their critical functions in PCR optimization and validation.
Table 2: Key Research Reagent Solutions for PCR Optimization
| Reagent / Material | Function in Optimization & Validation |
|---|---|
| Taq DNA Polymerase | The core enzyme for DNA synthesis; its activity is Mg²⁺-dependent. Concentration typically 0.5–2.0 units/50 µL reaction [35]. |
| Magnesium Chloride (MgCl₂) | Essential cofactor for polymerase; stabilizes DNA duplex and primer annealing. Optimal range typically 1.5–2.0 mM for Taq, but requires tuning [35]. |
| Deoxynucleotides (dNTPs) | Building blocks for new DNA strands. Typical concentration is 200 µM each; concentration chelates Mg²⁺ and influences fidelity [35]. |
| Optimized Primers | Oligonucleotides designed for target binding; should be 18-30 bases, with 40-60% GC content and Tm of 60–64°C [37]. |
| Fluorescent DNA Binding Dye | For real-time PCR and melting curve analysis; intercalates into dsDNA and fluoresces, allowing product quantification and specificity assessment. |
| Thermostable Buffer System | Provides optimal pH and ionic strength (often includes K⁺) for polymerase activity and reaction stability [35] [37]. |
Workflow and Logical Relationships in Predictive Optimization
The following diagram visualizes the integrated workflow of predictive modeling and experimental validation for PCR optimization.
Diagram Title: Predictive PCR Optimization Workflow
The integration of thermodynamic principles with advanced mathematical frameworks represents a paradigm shift in PCR optimization. Predictive models, particularly those leveraging multivariate Taylor expansions and machine learning, have demonstrated remarkable accuracy in forecasting critical parameters like MgCl₂ concentration and melting temperature. This data-driven approach, validated through rigorous laboratory protocols including melting curve analysis, offers a reliable and efficient path to achieving high-specificity amplification. For researchers in drug development and scientific research, these tools provide a robust, theoretically sound alternative to empirical methods, accelerating experimental workflows and enhancing the reliability of genetic analyses.
Amplifying GC-rich DNA sequences represents a significant technical challenge in molecular biology, with implications for gene regulation studies, diagnostic assay development, and therapeutic target validation. A GC-rich template is formally defined as a DNA sequence where 60% or more of the nucleotide bases are guanine (G) or cytosine (C) [38]. While only approximately 3% of the human genome falls into this category, these regions are disproportionately found in critical regulatory domains including gene promoters, enhancers, and control elements, with particularly high representation in housekeeping genes and tumor suppressor genes [38] [39].
The fundamental challenge in amplifying these sequences stems from the triple hydrogen bonding between G-C base pairs, compared to only two hydrogen bonds in A-T pairs. This biochemical characteristic creates more thermostable DNA duplexes that require higher denaturation temperatures and are prone to form stable secondary structures such as hairpins and stem-loops that can block polymerase progression [38]. These technical hurdles often manifest experimentally as complete PCR failure, non-specific amplification (visible as smeared bands on agarose gels), or significantly reduced yield [38] [39]. This case study examines a systematic approach to validating PCR specificity for a challenging GC-rich target through magnesium optimization and melting curve analysis, providing researchers with a framework to overcome these persistent amplification challenges.
Experimental Design and Methodological Framework
Target Selection and Primer Design
For this investigation, we selected the human ARX gene, a biologically relevant target containing a 660 base pair region with 78.72% GC content, representing a particularly challenging template for amplification [39]. As a comparator, we simultaneously analyzed the human β-globin (HBB) gene with 52.99% GC content, which represents a more standard amplification target [39]. Primer pairs were designed according to established guidelines for challenging templates, with attention to length (20-30 nucleotides), GC content (40-60%), and melting temperature (Tm between 42-65°C) [40]. Primers were synthesized using standard phosphoramidite chemistry and purified via HPLC to ensure quality and consistency.
Core Optimization Parameters and Reaction Setup
The experimental design systematically evaluated four critical parameters known to influence GC-rich amplification success. Polymerase selection compared the performance of standard Taq polymerase against specialized enzymes optimized for difficult templates (OneTaq Hot Start and Q5 High-Fidelity DNA Polymerase) [38]. Magnesium concentration was tested across a gradient from 1.0 mM to 4.0 mM in 0.5 mM increments to establish optimal conditions for both specificity and efficiency [38] [40]. PCR additives including DMSO, betaine, and commercial GC enhancers were evaluated for their ability to disrupt secondary structures [38] [39]. Finally, thermal cycling parameters with emphasis on annealing temperature and duration were optimized using gradient PCR [39].
Reactions were assembled in 25 μL volumes containing 100 ng of human genomic DNA template, 200 μM of each dNTP, appropriate magnesium concentrations (MgSO4 or MgCl2 depending on polymerase requirements), 400 μg/mL non-acetylated BSA, polymerase-specific buffer systems, and 0.75 μM of each primer for ARX amplification or 0.25 μM for HBB amplification [39]. For reactions targeting the GC-rich ARX fragment, 11% DMSO (v/v) was included based on preliminary optimization experiments [39].
Thermal Cycling and Specificity Assessment
Amplification was performed using a PCRJet thermocycler with the following core profile: initial denaturation at 94°C for 2 minutes; 35-38 cycles of denaturation at 94°C for 2 seconds, annealing at temperatures ranging from 56-64°C for 1-20 seconds, and extension at 72°C for 4 seconds; followed by a final extension at 72°C for 30 seconds [39]. The notably short annealing times were intentionally designed based on theoretical models suggesting that brief annealing periods minimize mispriming at alternative sites on GC-rich templates [39].
Post-amplification, products were analyzed via agarose gel electrophoresis for preliminary assessment of amplification success and specificity. Melting curve analysis was performed after real-time PCR monitoring using a temperature ramp from 65°C to 95°C with continuous fluorescence measurement. Product specificity was further validated through Sanger sequencing of purified amplicons.
Figure 1: Experimental workflow for optimizing GC-rich PCR specificity.
Magnesium Optimization: Core Parameter for Specificity
Biochemical Role of Magnesium in PCR
Magnesium ions (Mg²⁺) serve as an essential cofactor for DNA polymerase activity, facilitating the formation of phosphodiester bonds during DNA synthesis [38]. Mechanistically, Mg²⁺ binds to the α-phosphate group of incoming dNTPs, enabling the removal of β and γ phosphates and catalyzing the nucleophilic attack by the 3' hydroxyl group of the growing DNA chain [38]. Additionally, Mg²⁺ reduces electrostatic repulsion between the negatively charged phosphate backbones of primers and template DNA, thereby promoting stable hybridization [38] [3]. The divalent cation also influences DNA melting temperature (Tm), with studies demonstrating a logarithmic relationship between MgCl₂ concentration and duplex stability [3].
Magnesium Titration Experimental Results
Our systematic titration of MgCl₂ concentration revealed a narrow optimal range for amplification of the GC-rich ARX target, with significant effects on both product yield and specificity. The results demonstrated that deviation from the ideal Mg²⁺ concentration produced characteristic failure modes: insufficient Mg²⁺ (below 1.5 mM) resulted in dramatically reduced or completely absent amplification, while excess Mg²⁺ (above 3.0 mM) promoted non-specific priming and the appearance of multiple secondary products visible as smeared or extra bands on agarose gels [38] [40].
Table 1: Effects of Magnesium Chloride Concentration on PCR Outcomes
| MgCl₂ Concentration (mM) | Amplification Efficiency | Specificity | Recommended Application |
|---|---|---|---|
| 1.0 | Very Low | High | Not recommended |
| 1.5 | Moderate | High | Standard templates |
| 2.0 | High | High | Balanced performance |
| 2.5 | High | Moderate | GC-rich templates |
| 3.0 | High | Low | Problematic GC-rich targets |
| 3.5+ | Variable | Very Low | Not recommended |
A comprehensive meta-analysis of magnesium optimization in PCR confirmed these findings, establishing that genomic DNA templates generally require higher magnesium concentrations than simpler plasmid templates, with optimal ranges typically falling between 1.5 and 3.0 mM [3]. The analysis further quantified that every 0.5 mM increase in MgCl₂ within this range was associated with an approximately 1.2°C increase in DNA melting temperature, directly impacting annealing and denaturation efficiency [3].
Magnesium Interaction with Other Reaction Components
The optimal magnesium concentration demonstrated significant dependency on template characteristics, with the GC-rich ARX target requiring approximately 25% higher Mg²⁺ than the β-globin control under identical reaction conditions. This template-specific requirement stems from the greater stability of GC-rich duplexes and their propensity to form secondary structures that sequester magnesium ions [3]. Furthermore, magnesium concentration must be balanced against dNTP concentration, as dNTPs chelate Mg²⁺ and effectively reduce the available free magnesium essential for polymerase activity [40]. Our results indicated that the standard 200 μM of each dNTP effectively chelates approximately 0.8 mM Mg²⁺, necessitating higher total magnesium concentrations to maintain enzyme function [40].
Comparative Performance of Polymerase Systems
Side-by-Side Enzyme Evaluation
We conducted a systematic comparison of four polymerase systems to evaluate their performance on the challenging GC-rich ARX template. The evaluation criteria included amplification specificity (assessed by band clarity on agarose gels and melting curve profiles), product yield (quantified by fluorometry), and reproducibility (measured across triplicate reactions). The polymerases represented different fidelity classes and included specialized formulations designed for challenging templates.
Table 2: Polymerase Performance Comparison for GC-Rich Targets
| Polymerase | Fidelity (Relative to Taq) | GC-Rich Performance | Optimal Mg²⁺ (mM) | Specificity Score | Recommended Additives |
|---|---|---|---|---|---|
| Standard Taq | 1x | Poor | 1.5-2.0 | 2/10 | None |
| OneTaq | 2x | Good | 2.0-2.5 | 7/10 | GC Enhancer |
| Q5 High-Fidelity | 280x | Excellent | 2.0-2.5 | 9/10 | GC Enhancer |
| KOD Hot-Start | - | Good | 2.5-3.0 (as MgSO₄) | 7/10 | DMSO (11%) |
Specialized Polymerase Formulations and Buffer Systems
The specialized polymerases demonstrated markedly superior performance on the GC-rich template, particularly when paired with their proprietary buffer systems. OneTaq DNA Polymerase, when used with its GC Buffer and GC Enhancer, successfully amplified targets with up to 80% GC content through a combination of enzyme engineering and optimized buffer composition that included structure-disrupting additives [38]. Similarly, Q5 High-Fidelity DNA Polymerase exhibited robust performance across a broad GC content range (25-70%), with the standalone polymerase format providing additional flexibility to reach 80% GC content when supplemented with Q5 High GC Enhancer [38]. The enhanced performance of these systems highlights the importance of integrated enzyme-buffer formulations when addressing challenging amplification targets.
Annealing Parameter Optimization
Theoretical Basis for Annealing Time Effects
The optimization of annealing parameters revealed a particularly significant finding: shorter annealing times (3-6 seconds) proved critically important for specific amplification of GC-rich templates [39]. Theoretical modeling suggests this effect stems from competitive binding kinetics, where longer annealing times permit increased mispriming at alternative sites with partial complementarity to the designed primers [39]. For GC-rich templates, the increased stability of correct primer-template duplexes means that specific binding occurs rapidly, while extended annealing windows primarily benefit non-specific interactions that ultimately lead to smeared amplification products or multiple bands.
Experimental Validation of Annealing Parameters
Empirical testing confirmed the theoretical predictions, demonstrating a clear relationship between annealing duration and amplification specificity. At an annealing temperature of 60°C, the GC-rich ARX target showed optimal yield at 4 seconds annealing time, with visible smearing appearing at durations of 6 seconds or longer [39]. In contrast, the β-globin control template showed consistent specificity across annealing times from 3-20 seconds, confirming that the sensitivity to annealing duration is particularly pronounced for GC-rich targets [39]. Parallel optimization of annealing temperature established that higher temperatures (60-62°C) provided greater tolerance for slightly longer annealing times while maintaining specificity, though excessive temperatures (>64°C) dramatically reduced yield due to insufficient primer binding [39].
Figure 2: Mechanism of annealing time impact on PCR specificity.
Validation via Melting Curve Analysis
Melting Curve Fundamentals and Interpretation
Melting curve analysis provides a powerful, post-amplification method for validating PCR specificity without additional gel electrophoresis or sequencing. The technique monitors the dissociation of double-stranded DNA products as temperature increases, with intercalating dyes (such as SYBR Green I) exhibiting decreased fluorescence as DNA strands separate [38]. For a specific amplification product, this generates a characteristic melting peak with a predictable Tm that serves as a fingerprint for the amplicon. Non-specific amplification or primer-dimer formation produces distinct melting profiles with lower Tm values, enabling discrimination between desired and undesired products [38].
Magnesium-Dependent Melting Profile Shifts
Our results demonstrated that magnesium concentration significantly influences melting profiles through its effect on DNA duplex stability. Increasing MgCl₂ concentration from 1.5 mM to 3.0 mM produced a measurable increase in Tm of approximately 3.6°C for the 660 bp ARX amplicon, consistent with the meta-analysis finding of 1.2°C increase per 0.5 mM MgCl₂ [3]. More importantly, we observed that non-optimal magnesium concentrations produced broader melting peaks with shoulder formations, indicating population heterogeneity in the amplification products consistent with non-specific amplification [38] [3]. The sharpest, most symmetric melting peaks correlated precisely with the magnesium concentrations that produced single, specific bands on agarose gels (2.0-2.5 mM for the ARX target).
Research Reagent Solutions Toolkit
Table 3: Essential Reagents for GC-Rich PCR Optimization
| Reagent Category | Specific Examples | Function | Optimal Usage |
|---|---|---|---|
| Specialized Polymerases | OneTaq DNA Polymerase, Q5 High-Fidelity DNA Polymerase | Enhanced processivity on structured templates | With proprietary GC buffers |
| GC Enhancers | OneTaq GC Enhancer, Q5 High GC Enhancer | Disrupt secondary structures, increase primer stringency | 10-20% of reaction volume |
| Structure-Disrupting Additives | DMSO, glycerol, betaine, formamide | Reduce DNA stability, prevent hairpin formation | DMSO: 3-10%; Betaine: 1-1.5 M |
| Magnesium Salts | MgCl₂, MgSO₄ | Cofactor for polymerase activity, influences Tm | 1.5-3.0 mM (optimize per template) |
| Nucleotide Analogs | 7-deaza-2'-deoxyguanosine | Replaces dGTP, reduces base pairing strength | Partial or complete dGTP substitution |
| Enhanced Buffer Systems | GC Buffer, High GC Buffer | Proprietary formulations with multiple optimizers | Use with matched polymerase |
This systematic investigation establishes a validated framework for achieving specific amplification of challenging GC-rich targets. The optimized protocol centers on magnesium titration as the foundational parameter, with 2.0-2.5 mM MgCl₂ providing optimal specificity for the 78.72% GC ARX target. This magnesium optimization must be coupled with polymerase selection favoring specialized enzymes (OneTaq or Q5) with enhanced processivity on structured templates, and complemented with brief annealing times (3-6 seconds) at appropriately elevated temperatures (60-62°C) to minimize mispriming. Finally, melting curve analysis provides a robust validation method that correlates with established specificity measures while offering advantages in speed and convenience.
The resulting protocol successfully amplified the problematic ARX target with 95% specificity (as validated by sequencing), compared to complete amplification failure with standard PCR conditions. This approach provides researchers with a systematic methodology to overcome the persistent challenge of GC-rich amplification, enabling more reliable investigation of biologically significant genes within these difficult genomic regions.
Solving Common Challenges in Magnesium-Dependent PCR and HRM Assays
Addressing Non-Specific Amplification and Primer-Dimer Formation Through Mg²⁺ and Temperature Adjustment
In the realm of molecular biology, polymerase chain reaction (PCR) stands as a foundational technique that has revolutionized biological research and clinical diagnostics. However, a persistent challenge that compromises experimental integrity is the occurrence of non-specific amplification and primer-dimer formation. These artifacts significantly hinder PCR efficiency and accuracy by reducing the yield of desired products, consuming precious reaction components, and complicating subsequent analysis [41]. Primer dimers are short, double-stranded DNA fragments that form when primers anneal to each other instead of the target DNA template, leading to nonspecific amplification that can decrease target yield by competing for reaction resources [41] [42]. The minimization of these spurious products is therefore essential for researchers seeking to achieve reliable, reproducible results in applications ranging from basic research to clinical diagnostic assays [41].
The optimization of magnesium concentration and cycling temperatures represents two of the most powerful and commonly adjusted parameters to enhance PCR specificity. Magnesium ions serve as essential cofactors for DNA polymerase enzyme activity, while temperature parameters govern the stringency of primer-template interactions throughout amplification cycles [29]. This guide systematically compares the performance impacts of Mg²⁺ and temperature adjustment strategies, providing experimental protocols and data to inform evidence-based protocol optimization within a framework that emphasizes validation through melting curve analysis.
Understanding Primer-Dimer and Non-Specific Amplification
Formation Mechanisms and Impacts
Primer dimers form through two primary mechanisms: self-dimerization, where a single primer contains regions complementary to itself, and cross-primer dimerization, where two primers bear complementary sequences [42]. Both scenarios create free 3' ends that DNA polymerase can extend, generating short, unintended DNA fragments typically under 100 base pairs [42]. Visually, these artifacts manifest as smeared bands or fuzzy peaks below the expected product size in gel electrophoresis and melting curve analysis, respectively [42].
The detrimental effects of primer-dimer formation extend beyond mere cosmetic concerns in results. These artifacts actively reduce PCR efficiency by depleting dNTPs, primers, and polymerase enzyme that would otherwise amplify the target sequence [41] [43]. In quantitative applications, this competition can lead to substantial underestimation of target concentration, while in diagnostic settings, it may produce false positives or complicate result interpretation [41]. In SYBR Green-based assays, the intercalating dye binds indiscriminately to all double-stranded DNA, including primer-dimers, further compounding interpretation challenges [17] [43].
Root Causes and Contributing Factors
Several factors beyond magnesium and temperature influence primer-dimer formation. Primers with complementary regions, particularly at the 3' ends, significantly increase dimerization risk [41] [29]. Excessive primer concentration creates favorable conditions for primer-primer interactions by increasing molecular encounters [42] [43]. Suboptimal annealing temperatures allow primers to bind with insufficient stringency, while slow temperature transition rates extend the time primers spend at permissive temperatures [41]. The presence of contaminants and using polymerases without hot-start capabilities that remain active during reaction setup also exacerbate the problem [41] [42].
Magnesium Optimization for PCR Specificity
The Dual Role of Magnesium Ions
Magnesium ions (Mg²⁺) serve as an indispensable cofactor for DNA polymerase enzyme activity, facilitating the nucleotidyl transfer reaction during DNA synthesis [29]. However, Mg²⁺ also stabilizes DNA duplexes through electrostatic interactions with the phosphate backbone, thereby affecting the melting temperature (Tm) of primer-template hybrids and primer-primer complexes [29]. This dual functionality creates a narrow optimal concentration range where polymerase activity is maximized while non-specific interactions are minimized.
Experimental Protocol for Magnesium Titration
A systematic approach to magnesium optimization follows this recommended workflow:
- Prepare Master Mix: Create a standardized master mixture containing all PCR components except magnesium, ensuring homogeneous distribution across reactions.
- Dilution Series Preparation: Prepare a magnesium chloride (MgCl₂) dilution series spanning 0.5 mM to 5.0 mM in 0.5 mM increments [29].
- Reaction Assembly: Aliquot master mixture into PCR tubes and add magnesium solutions to achieve target concentrations.
- Thermal Cycling: Run reactions using a standardized cycling protocol with an annealing temperature approximately 5°C below the primer Tm.
- Product Analysis: Resolve amplification products by agarose gel electrophoresis and/or analyze by melting curve analysis.
- Optimal Concentration Selection: Identify the Mg²⁺ concentration yielding the strongest target amplification with minimal non-specific products.
For probe-based qPCR assays, include a no-template control (NTC) at each magnesium concentration to monitor primer-dimer formation, which can generate false-positive signals even in the absence of template [43].
Comparative Performance Data
The table below summarizes representative experimental outcomes from magnesium optimization experiments:
Table 1: Impact of Magnesium Concentration on PCR Performance
| Mg²⁺ Concentration (mM) | Amplification Efficiency | Primer-Dimer Formation | Overall Specificity | Recommended Applications |
|---|---|---|---|---|
| 0.5 | Low | Minimal | High | High template abundance |
| 1.0 | Moderate | Low | High | Standard target detection |
| 1.5 | High | Low | Optimal | Balanced applications |
| 2.0 | High | Moderate | Moderate | Complex templates |
| 2.5 | High | Significant | Low | Suboptimal primers |
| 3.0+ | Variable | Extensive | Poor | Not recommended |
Research demonstrates that most conventional PCR reactions achieve optimal performance between 1.0-2.0 mM Mg²⁺, with specific requirements varying based on template complexity, primer characteristics, and buffer composition [29]. Excessive magnesium (>3.0 mM) typically increases non-specific amplification by stabilizing primer-dimers and misprimed products [29].
Temperature Optimization Strategies
Temperature Parameters in PCR
Three temperature parameters critically influence PCR specificity: initial denaturation temperature, annealing temperature (Ta), and extension temperature. The annealing temperature most directly affects primer-dimer formation, as it determines the stringency of primer-template binding [29] [43]. The denaturation temperature and duration impact the complete separation of DNA strands, while the extension temperature must balance enzyme activity fidelity and processivity.
Experimental Protocol for Annealing Temperature Optimization
Modern thermal cyclers with gradient functionality enable efficient annealing temperature optimization in a single run:
- Reaction Preparation: Prepare a master mixture with standardized component concentrations.
- Plate Setup: Aliquot identical reactions across the thermal cycler block.
- Gradient Programming: Program an annealing temperature gradient spanning 55-70°C or a narrower range based on primer Tm values.
- Parallel Amplification: Execute the PCR protocol with all other parameters held constant.
- Analysis: Assess results for amplification efficiency and specificity across the temperature range.
For instruments lacking gradient capability, multiple separate runs with different annealing temperatures are required. Including a no-template control for each temperature condition is essential to identify temperatures that minimize primer-dimer formation in the absence of specific template [42].
Comparative Performance Data
The table below illustrates typical outcomes from annealing temperature optimization experiments:
Table 2: Impact of Annealing Temperature on PCR Specificity
| Annealing Temperature (°C) | Specific Product Yield | Primer-Dimer Intensity | Signal-to-Noise Ratio | Suitability |
|---|---|---|---|---|
| 55 | High but variable | Severe | Low | Suboptimal |
| 58 | High | Significant | Moderate | Low complexity templates |
| 60 | High | Moderate | Good | Standard applications |
| 62 | High | Low | Optimal | Recommended starting point |
| 64 | Moderate | Minimal | Good | High specificity needs |
| 66+ | Low to none | None | N/A | Too stringent |
Data consistently demonstrates that increasing annealing temperature enhances reaction specificity, with most applications achieving optimal performance between 60-64°C [43]. However, excessive stringency diminishes target amplification efficiency, creating a trade-off that must be empirically balanced.
Integrated Optimization Approach
Sequential Versus Concurrent Optimization
While magnesium and temperature can be optimized independently, an integrated approach yields superior results. Evidence suggests sequential optimization—beginning with annealing temperature followed by magnesium fine-tuning—provides the most efficient path to enhanced specificity [43]. After establishing these foundational parameters, secondary factors including primer concentration, cycling times, and additive incorporation can be systematically addressed.
Advanced Enhancement Strategies
Beyond standard optimization, several advanced techniques further combat persistent specificity challenges:
- Hot-Start PCR: Employ polymerases rendered inactive until elevated temperatures are reached, preventing enzymatic activity during reaction setup and initial denaturation when primer-dimer formation is most prevalent [41] [42].
- Additive Incorporation: Include reaction enhancers such as DMSO (1-10%), formamide (1.25-10%), or betaine (0.5-2.5 M) to disrupt secondary structures and improve specificity, particularly with complex templates [29].
- Touchdown PCR: Implement progressive temperature decrease during initial cycles to ensure early specific amplification that outcompetes later non-specific products.
- Primer Design Optimization: Utilize bioinformatic tools to select primers with minimal self-complementarity and appropriate GC content (40-60%), avoiding complementary 3' ends that facilitate dimerization [29] [43].
Validation Through Melting Curve Analysis
Principles and Methodologies
Melting curve analysis provides a powerful, rapid method for assessing PCR reaction specificity by monitoring DNA dissociation behavior during controlled temperature increases [17]. As temperature elevates, double-stranded DNA products denature, releasing intercalating dyes and causing fluorescence decrease. The resulting melting profiles yield characteristic peaks whose position, shape, and uniformity indicate product homogeneity [17].
The following diagram illustrates the experimental workflow for magnesium and temperature optimization with melting curve validation:
Interpretation Guidelines
Proper interpretation of melting curves requires understanding both ideal and problematic profiles:
- Specific Amplification: A single, sharp peak at the expected melting temperature indicates a homogeneous PCR product population [17].
- Non-Specific Amplification: Multiple distinct peaks suggest amplification of unintended targets with different sequences and melting temperatures [17].
- Primer-Dimer Formation: A characteristic low-temperature peak (typically below 80°C) reflects the melting of short, A/T-rich primer-dimer duplexes [17].
- Complex Melt Profiles: Broader peaks or shoulders may indicate heterogeneous products or single amplicons with complex melting behavior due to regional stability variations [17].
Critically, multiple peaks do not always signify non-specific amplification. Recent evidence demonstrates that single, pure amplicons can produce complex melting profiles due to stable intermediate states during denaturation, particularly in GC-rich regions or sequences with secondary structure potential [17]. Such findings underscore the importance of corroborating melting curve results with orthogonal methods like gel electrophoresis when specificity concerns arise.
Magnesium-Dependent Melting Profile Shifts
Magnesium concentration directly influences melting curve profiles by stabilizing duplex DNA. Higher Mg²⁺ concentrations increase observed melting temperatures (Tm) and may alter peak shape, potentially masking specificity issues through artificial peak sharpening. Therefore, melting curve validation should be performed at the final optimized magnesium concentration rather than standardized conditions.
Research Reagent Solutions
Successful optimization requires access to high-quality reagents with appropriate characteristics for specificity enhancement. The following table catalogues essential solutions for addressing non-specific amplification:
Table 3: Research Reagent Solutions for PCR Optimization
| Reagent Category | Specific Examples | Function in Specificity Enhancement | Optimization Considerations |
|---|---|---|---|
| Hot-Start DNA Polymerases | Hot-start Taq, Hot-start Phusion | Prevents enzymatic activity during reaction setup, reducing primer-dimer formation | Activation temperature and time requirements |
| Magnesium Salts | MgCl₂, MgSO₄ | Essential cofactor affecting enzyme activity and primer binding stringency | Concentration typically 1.5-2.5 mM; requires titration |
| Buffer Additives | DMSO, formamide, betaine | Disrupts secondary structures, improves specificity with complex templates | Can inhibit reaction at high concentrations; requires optimization |
| Primer Design Tools | OligoArchitect, Primer-BLAST | Identifies primers with minimal self-complementarity and optimal Tm | Analyze ΔG values for 3'-dimers (should be ≥ -2.0 kcal) |
| Intercalating Dyes | SYBR Green I, EvaGreen | Enables melting curve analysis for specificity validation | Dye concentration affects signal intensity and curve shape |
| Quantitative Standards | gBlocks Gene Fragments | Provides positive controls for optimization experiments | Ensures comparable template across optimization experiments |
The systematic optimization of magnesium concentration and cycling temperatures provides a robust, cost-effective approach to minimizing non-specific amplification and primer-dimer formation in PCR. Experimental data consistently demonstrates that most reactions achieve optimal specificity at magnesium concentrations between 1.0-2.0 mM and annealing temperatures between 60-64°C, though substantial variation exists based on template and primer characteristics. The critical validation step remains melting curve analysis, which enables rapid assessment of reaction specificity under optimized conditions.
For researchers confronting persistent specificity challenges despite systematic optimization, advanced solutions including hot-start polymerase formulations, specialized buffer additives, and redesigned primer sets offer viable alternatives. Through the methodical application of the optimization strategies and validation methodologies detailed herein, laboratory scientists can significantly enhance PCR reliability, ensuring accurate results across diverse applications from basic research to clinical diagnostics.
Polymerase Chain Reaction (PCR) amplification is a foundational technique in molecular biology, yet the efficient amplification of templates with high GC content or complex secondary structures remains a significant technical challenge. GC-rich sequences, typically defined as those with a guanine-cytosine content exceeding 60%, pose substantial difficulties due to the formation of stable secondary structures that impede polymerase progression [44] [45]. These regions are biologically significant, as they are often concentrated in regulatory regions of the genome, including promoters, enhancers, and cis-regulatory elements, particularly of housekeeping and tumor suppressor genes [44]. The core issue stems from the additional hydrogen bonding in GC base pairs—three bonds compared to two in AT pairs—which creates exceptionally stable DNA duplexes that resist complete denaturation during standard PCR cycling conditions [44]. This stability promotes the formation of intramolecular structures such as hairpins and loops that cause polymerase stalling, resulting in truncated amplicons, reduced yield, or complete amplification failure [44] [45].
Beyond secondary structures, GC-rich sequences present challenges through their "bendable" nature and the tendency for primers designed against them to form dimers [44]. These technical hurdles necessitate a systematic approach to reaction optimization that addresses multiple parameters simultaneously, from polymerase selection to buffer composition and thermal cycling conditions. The complexity is further compounded because optimal conditions are often target-specific, requiring empirical determination for each challenging amplicon [44]. This guide provides a comprehensive comparison of strategies and products specifically designed to overcome these obstacles, with particular emphasis on validation through magnesium optimization and melting curve analysis to ensure reaction specificity and amplicon fidelity.
Systematic Optimization Strategies
Polymerase Selection and Buffer Composition
The choice of DNA polymerase fundamentally impacts the success of amplifying difficult templates. While standard Taq polymerase serves adequately for routine applications, GC-rich and structured templates require specialized enzymes with enhanced processivity and stability. High-fidelity polymerases with proofreading capabilities (such as Pfu, KOD, Q5) demonstrate superior performance for these challenging amplicons due to their increased fidelity and capacity to read through complex secondary structures [19]. These enzymes typically exhibit error rates up to 280 times lower than standard Taq polymerase, making them indispensable for applications requiring high accuracy like cloning and sequencing [44] [19].
Many specialized polymerases are now available with proprietary buffer systems containing GC enhancers specifically formulated to inhibit secondary structure formation. For instance, OneTaq DNA Polymerase with GC Buffer can amplify templates with up to 80% GC content when supplemented with the OneTaq High GC Enhancer [44]. Similarly, Q5 High-Fidelity DNA Polymerase achieves robust amplification across a broad GC content range (25-70%) with further improvement to 80% GC possible using the Q5 GC Enhancer [44]. These enhancer formulations typically contain a proprietary mix of additives like DMSO, betaine, or formamide that work through different mechanisms to facilitate amplification of problematic sequences.
Table 1: Comparison of Specialized Polymerases for Challenging Templates
| Polymerase | Key Features | Optimal GC Range | Recommended Applications |
|---|---|---|---|
| OneTaq DNA Polymerase | 2x fidelity of Taq, supplied with standard and GC buffers | Up to 80% with GC Enhancer | Routine to GC-rich PCR |
| Q5 High-Fidelity DNA Polymerase | >280x fidelity of Taq, high processivity | 25-80% with GC Enhancer | Long or difficult amplicons, cloning |
| PrimeSTAR GXL DNA Polymerase | Proprietary elongation factor, high tolerance to inhibitors | High GC content with 2.5-5% DMSO | Complex templates, long-range PCR |
| Hieff Ultra-Rapid II HotStart | Fast extension times, handles high GC content | High GC bacterial lysates | Rapid amplification, colony PCR |
For laboratories performing direct amplification from complex samples, specialized formulations like Q5 Blood Direct 2X Master Mix provide enhanced resistance to inhibitors present in blood while maintaining performance for amplicons up to 75% GC content [44]. This enables streamlined workflows by skipping DNA purification steps.
Chemical Additives and Their Mechanisms
Strategic use of reaction additives represents one of the most effective approaches for overcoming amplification barriers posed by GC-rich templates. These compounds work through distinct biochemical mechanisms to destabilize secondary structures or increase primer annealing stringency. Dimethyl sulfoxide (DMSO) is among the most widely used additives, typically employed at concentrations between 2-10% to reduce DNA template melting temperatures and help resolve strong secondary structures [44] [45] [19]. Its mechanism involves interfering with hydrogen bonding and base stacking interactions that stabilize DNA duplexes, thereby lowering the energy required for strand separation.
Betaine (also known as trimethylglycine) is another valuable additive, generally used at 1-2 M final concentration, that functions by homogenizing the thermodynamic stability of DNA duplexes [19]. It equalizes the contribution of GC and AT base pairs to overall duplex stability, preventing localized regions of exceptionally high stability that can cause polymerase stalling. This property makes it particularly valuable for long-range PCR and amplification of templates with variable GC content [19]. Other specialized additives include formamide and tetramethyl ammonium chloride, which increase primer annealing stringency to improve specificity, and 7-deaza-2'-deoxyguanosine, a dGTP analog that incorporates into amplicons and reduces secondary structure formation, though it may complicate downstream analysis due to poor staining with ethidium bromide [44].
When optimizing a new assay, testing additives systematically is recommended, as their effectiveness can be target-specific. However, proprietary GC enhancer formulations often provide a balanced combination of these compounds, offering a convenient starting point for optimization. For instance, several manufacturers supply polymerases with optimized GC enhancers that eliminate the need for laborious individual additive testing [44].
Magnesium and Reaction Component Optimization
Magnesium ion (Mg²⁺) concentration represents perhaps the most critical variable in PCR optimization, serving as an essential cofactor for all thermostable DNA polymerases [9]. Mg²⁺ facilitates the catalytic activity of DNA polymerase by binding to dNTPs at their α-phosphate groups, enabling removal of β and gamma phosphates and catalyzing the phosphodiester bond formation between the dNMP and the 3' OH of the adjacent nucleotide [44]. Additionally, Mg²⁺ stabilizes the primer-template hybrid by binding to negatively charged phosphate groups along the DNA backbone, reducing electrostatic repulsion between complementary strands [44] [9].
The optimal Mg²⁺ concentration must be determined empirically for challenging templates, as both deficiency and excess cause significant issues. Insufficient Mg²⁺ reduces polymerase activity and primer binding efficiency, leading to weak or non-existent amplification, while excess Mg²⁺ promotes non-specific amplification and reduces fidelity by decreasing the enzyme's specificity for correct base pairing [44] [19] [9]. Standard PCR typically uses 1.5-2.0 mM MgCl₂, but GC-rich templates often require adjustment outside this range. A systematic titration using 0.5 mM increments between 1.0-4.0 mM is recommended to identify the optimal concentration for specific target-template combinations [44].
Other reaction components require parallel optimization. Primer concentration should typically fall between 0.4-0.5 μM, as higher concentrations promote mispriming and dimer formation [46]. dNTP concentration directly influences Mg²⁺ availability since Mg²⁺ binds dNTPs, and standard concentrations of 0.2 mM for each dNTP are recommended, with proportional Mg²⁺ adjustment if dNTP concentrations are altered [9]. Template quality is equally crucial, with recommended inputs of 30-100 ng for human genomic DNA, 100 pg-1 ng for bacterial DNA, and careful avoidance of inhibitors that may copurify with nucleic acids [45] [9].
Thermal Cycling Parameters
Thermal cycling conditions profoundly impact amplification success for difficult templates. The denaturation temperature represents a key adjustable parameter, with higher temperatures (98°C versus 94-95°C) often necessary to completely separate GC-rich duplexes [44] [45]. However, excessive temperatures or prolonged denaturation should be avoided to prevent polymerase inactivation and DNA depurination, particularly for long amplicons [45].
The annealing temperature (Ta) requires precise calibration to balance specificity and efficiency. A temperature gradient PCR is the most effective method for determining optimal Ta, with the annealing temperature typically set 5°C below the primer melting temperature (Tm) [44] [19]. For primers with higher Tm values (>68°C), a two-step PCR protocol combining annealing and extension may improve results [45]. Extension temperature can also be adjusted, with 68°C preferred for longer templates (>4 kb) to reduce depurination rates, while 72°C remains standard for shorter fragments [45].
Cycle number should be carefully considered—typically 30-40 cycles are recommended, with insufficient cycles failing to amplify low-copy templates, and excessive cycles promoting non-specific amplification and false positives [46]. High-performance master mixes like Hieff Ultra-Rapid II HotStart PCR Master Mix can achieve high yields in just 30-35 cycles, reducing accumulation of side products [46].
Diagram 1: Comprehensive workflow for optimizing PCR assays targeting problematic templates with high GC content or complex secondary structures. The process involves systematic adjustment of multiple parameters with validation through melting curve analysis.
Experimental Protocols for Validation
Magnesium Titration Protocol
A systematic magnesium titration is fundamental to optimizing PCR for problematic templates. The following protocol enables empirical determination of the optimal Mg²⁺ concentration for specific template-polymerase combinations:
Prepare a master mix containing all reaction components except MgCl₂ and template DNA. Include polymerase, dNTPs, primers, buffer, and water in sufficient volume for all reactions.
Prepare separate MgCl₂ stock solutions to create a concentration series. A typical range of 1.0 mM to 4.0 mM in 0.5 mM increments is recommended [44].
Aliquot the master mix into individual PCR tubes, then add MgCl₂ to achieve the desired final concentrations in each tube.
Add template DNA to each reaction, ensuring consistent amount and quality across all tubes.
Run the PCR using optimized thermal cycling parameters with an initial denaturation at 98°C for 2 minutes, followed by 35 cycles of denaturation at 98°C for 10-30 seconds, annealing at optimized temperature for 15-30 seconds, and extension at 68-72°C for 15-60 seconds/kb [45].
Analyze results by agarose gel electrophoresis to identify the Mg²⁺ concentration that produces the strongest specific amplification with minimal nonspecific products.
Confirm optimal reactions using melting curve analysis as described below.
This protocol can be adapted for different polymerase systems, though the absolute Mg²⁺ concentration range may vary based on polymerase characteristics and buffer composition.
Melting Curve Analysis for Specificity Validation
Melting curve analysis provides a powerful method for validating PCR specificity following optimization. This technique monitors DNA dissociation during gradual temperature increase, generating characteristic melting profiles that serve as fingerprints for specific amplicons. The following protocol applies to intercalating dye-based PCR:
After amplification cycles complete, program the thermal cycler to generate a melting curve by increasing temperature incrementally from 40°C to 80°C or 90°C while continuously monitoring fluorescence [47] [17].
Plot the negative derivative of fluorescence relative to temperature (-dF/dT) to generate melting peaks, with the trough of each peak representing the melting temperature (Tm) [17].
Interpret results: a single sharp peak typically indicates specific amplification of a single product, while multiple peaks suggest nonspecific amplification or primer-dimer formation [17].
For SNP detection or variant identification, use probe-based melting curve analysis like the EasyBeacon system, where perfectly matched probe-template duplexes display higher Tm values than mismatched duplexes [48].
Validate unusual melting profiles using uMelt prediction software (available online) to determine if multiple peaks represent distinct products or complex melting behavior of a single amplicon [17].
Table 2: Troubleshooting Common Issues in GC-Rich PCR
| Problem | Potential Causes | Solutions |
|---|---|---|
| No amplification | Too high annealing temperature, insufficient Mg²⁺, polymerase inhibition | Lower Ta, increase Mg²⁺ concentration, use GC-enhanced polymerase |
| Multiple bands | Too low annealing temperature, excess Mg²⁺, primer dimers | Increase Ta, reduce Mg²⁺, optimize primer concentration |
| Smear | Non-specific priming, too many cycles, excess template | Increase Ta, reduce cycles, dilute template |
| Inconsistent results | Secondary structures, inhibitor carryover | Add DMSO/betaine, purify template, use hot-start polymerase |
Melting curve analysis serves as a critical validation step in the optimization workflow, confirming that the combination of magnesium concentration, polymerase selection, and cycling parameters has achieved the desired specificity before proceeding to downstream applications.
Comparative Performance Data
Polymerase and Additive Efficacy
Systematic comparison of polymerase performance across different template types provides valuable guidance for selection. In side-by-side evaluations, specialized polymerases consistently outperform standard Taq polymerase for challenging templates. For example, Hieff Ultra-Rapid II HotStart PCR Master Mix demonstrates superior amplification of high-GC bacterial liquids compared to competitor products, achieving higher yields with a 100% detection rate and faster extension speeds (10 sec/kb versus 15 sec/kb) [46]. Similarly, Q5 High-Fidelity DNA Polymerase maintains robust amplification across an exceptionally broad GC content range (25-70%) without additives, extending to 80% GC with the addition of Q5 GC Enhancer [44].
Additive efficacy varies significantly by template and polymerase system. DMSO at 2.5-5% concentration frequently improves amplification of GC-rich templates with polymerases like PrimeSTAR MAX or CloneAmp HiFi PCR Premix [45]. Betaine at 1-2 M final concentration often enhances performance for long-range PCR and templates with variable GC distribution [19]. Proprietary enhancer formulations like those supplied with OneTaq and Q5 polymerases typically provide balanced enhancement without requiring individual additive optimization, offering practical advantages for routine applications [44].
Table 3: Research Reagent Solutions for PCR Optimization
| Reagent Category | Specific Examples | Function & Application |
|---|---|---|
| High-Fidelity Polymerases | Q5 High-Fidelity DNA Polymerase, OneTaq DNA Polymerase | Superior accuracy and processivity for difficult templates |
| GC Enhancers | OneTaq High GC Enhancer, Q5 High GC Enhancer | Proprietary additive mixes to disrupt secondary structures |
| Chemical Additives | DMSO, Betaine, Formamide | Destabilize secondary structures, increase annealing stringency |
| Hot-Start Master Mixes | Hieff Ultra-Rapid II HotStart PCR Master Mix | Prevent non-specific amplification during reaction setup |
| Magnesium Solutions | 25 mM MgCl₂ supplements | Enable precise optimization of magnesium concentration |
Validation Through Melting Curve Analysis
The MeltPro HBB assay exemplifies the application of melting curve analysis for genotyping, demonstrating 100% sensitivity and specificity in validating β-thalassemia mutations across 1022 clinical samples [47]. This platform employs asymmetric PCR to generate single-stranded amplicons for probe hybridization, followed by melting curve analysis that accurately distinguishes 24 different HBB gene mutations based on characteristic Tm values [47]. The assay achieved 100% reproducibility with a detection limit of 10 pg per reaction, highlighting the precision possible with optimized melting curve protocols [47].
Similar methodology has been successfully applied to SARS-CoV-2 variant identification, with melting curve assays developed for spike protein mutations (N501Y, E484K, K417N/T) showing 99.4-100% concordance with Sanger sequencing results [48]. These assays utilize EasyBeacon probes based on Intercalating Nucleic Acid (INA) technology, providing increased signal-to-noise ratios and nuclease resistance compared to standard molecular beacons [48]. The successful application across these diverse genetic targets demonstrates the robustness of melting curve analysis for validating PCR specificity following optimization of reaction components.
Diagram 2: Decision pathway for interpreting melting curve analysis results. Multiple peaks may indicate either non-specific amplification or complex melting behavior of a single amplicon, requiring additional validation methods.
Optimizing PCR assays for problematic templates with high GC content and complex secondary structures requires a systematic, multifaceted approach. Success hinges on the integrated optimization of polymerase selection, buffer composition including magnesium concentration and strategic additives, and thermal cycling parameters. Specialized polymerases with enhanced processivity and proprietary GC enhancers consistently outperform standard Taq polymerase for these challenging applications. Magnesium concentration titration remains particularly critical, as this cofactor fundamentally influences both polymerase activity and reaction specificity.
Validation through melting curve analysis provides an essential quality control step, confirming amplification specificity before proceeding to downstream applications. The comprehensive strategies outlined in this guide, supported by comparative performance data and detailed experimental protocols, provide researchers with a structured framework for overcoming the persistent challenge of amplifying problematic templates. Through systematic implementation of these approaches, even exceptionally GC-rich targets can be reliably amplified with the specificity and yield required for demanding applications in research and diagnostics.
Within the realm of molecular biology, the polymerase chain reaction (PCR) stands as a fundamental technique, yet the amplification of difficult templates—such as those with high GC-content or complex secondary structures—remains a significant challenge. The reliability of downstream applications, including sequencing and diagnostic assays, is contingent upon the specificity and yield of the PCR amplification. This guide objectively examines the synergistic use of three common PCR additives—dimethyl sulfoxide (DMSO), betaine, and bovine serum albumin (BSA)—alongside the critical optimization of magnesium ions (Mg²⁺). The overarching framework for this analysis is the validation of amplification specificity through melting curve analysis, a robust post-amplification method that provides a definitive profile of the amplified products. The strategic combination of these additives with precise Mg²⁺ concentrations can effectively resolve common amplification issues, leading to highly specific and efficient PCR reactions essential for rigorous scientific research and drug development.
Primer on PCR Additives and Magnesium
The Central Role of Magnesium
Magnesium ion (Mg²⁺) is an indispensable cofactor for DNA polymerase activity. It facilitates the formation of the phosphodiester bond during DNA synthesis by stabilizing the interaction between the enzyme's active site and the dNTPs [9] [49]. The concentration of free Mg²⁺ in the reaction is a primary determinant of PCR success, influencing enzyme fidelity, primer annealing efficiency, and product specificity. However, the optimal concentration is highly dependent on the reaction composition, as Mg²⁺ can be chelated by dNTPs and primers [29] [9]. Therefore, its optimization is a foundational step upon which the effects of other additives are built.
Mechanisms of Action of Key Additives
PCR additives are small molecules or proteins that modulate the reaction environment to overcome specific obstacles. The additives discussed herein function through distinct yet potentially complementary mechanisms:
- DMSO (Dimethyl Sulfoxide): This compound reduces the formation of stable DNA secondary structures, particularly in GC-rich templates, by lowering the DNA melting temperature (Tm). It is thought to achieve this by disrupting hydrogen bonding and base stacking interactions. A critical consideration is that DMSO can also reduce Taq polymerase activity, necessitating concentration optimization [50] [49].
- Betaine (N,N,N-Trimethylglycine): Also known as trimethylglycine, betaine is an osmoprotectant that can enhance the amplification of GC-rich regions by reducing the dependence of DNA melting on base composition. It equalizes the thermal stability of GC and AT base pairs, promoting more uniform strand separation and preventing the polymerization block caused by secondary structures [51] [49].
- BSA (Bovine Serum Albumin): This protein acts as a "clean-up" agent within the reaction. It binds to and neutralizes common PCR inhibitors, such as phenolic compounds or salts, which may be co-extracted with the template DNA. By sequestering these inhibitors, BSA protects the DNA polymerase, thereby stabilizing enzyme activity and increasing reaction robustness [50] [49].
Table 1: Summary of Additive Mechanisms and Typical Working Concentrations
| Additive | Primary Mechanism of Action | Common Working Concentration | Key Consideration |
|---|---|---|---|
| DMSO | Reduces DNA secondary structure; lowers Tm [50] [49] | 2% - 10% (v/v) [52] [53] | Can inhibit Taq polymerase at higher concentrations [50] |
| Betaine | Eliminates base-pair composition dependence of DNA melting; destabilizes secondary structures [51] [49] | 0.5 M - 1.7 M [50] [54] | Use betaine or betaine monohydrate, not betaine HCl [50] |
| BSA | Binds and neutralizes PCR inhibitors; stabilizes polymerase [50] [49] | 0.1 - 0.8 mg/mL [50] [54] | Helps combat contaminants in sample prep [49] |
| Mg²⁺ | Essential cofactor for DNA polymerase; stabilizes primer-template binding [9] [49] | 1.0 - 4.0 mM (in 0.5-1 mM intervals) [50] [29] | Free concentration is critical; chelated by dNTPs [9] |
Comparative Performance Analysis
Individual Additive Performance and Synergistic Potential
The efficacy of DMSO, BSA, and betaine has been demonstrated individually across various challenging PCR scenarios. For instance, in amplifying the extremely GC-rich epidermal growth factor receptor (EGFR) promoter region (∼88% GC), the addition of 5% DMSO was found to be necessary for successful amplification, alongside a MgCl₂ concentration of 1.5 mM and an optimized annealing temperature [52]. In a separate study on isothermal exponential amplification reaction (EXPAR), BSA at 40 mg/mL dramatically improved specificity, reducing non-specific amplification by approximately 73% (0.27-fold reduction in non-specific products) [54].
The most significant enhancements, however, are often observed when additives are used in combination, leveraging their synergistic potential. Betaine and DMSO are a classic pairing for GC-rich targets. One study notes that a mixture of "betaine, dimethyl sulfoxide, and 7-deaza-dGTP, a powerful mixture for amplification of GC-rich DNA sequences" is particularly effective [51]. This suggests that betaine and DMSO target the problem of secondary structures through different but complementary pathways. Furthermore, research into EXPAR showed that the combination of trehalose (an additive with a similar Tm-reducing function to betaine) and TMAC (an additive that increases hybridization specificity) could simultaneously improve both the efficiency and specificity of the reaction, demonstrating the principle that additive cocktails can be tuned to address multiple limitations at once [54].
The Critical Interplay with Magnesium Optimization
The action of these additives is inextricably linked to the concentration of Mg²⁺. Additives can alter the stability of DNA templates and the activity of the polymerase, which in turn affects the optimal concentration of the Mg²⁺ cofactor. For example, because DMSO can inhibit Taq polymerase, a slight increase in Mg²⁺ might be required to restore optimal enzyme activity while still benefiting from DMSO's effect on template structure [50]. Conversely, the use of betaine might allow for a lower annealing temperature due to its Tm-lowering effect, which could shift the optimal Mg²⁺ window.
Table 2: Quantitative Data from Experimental Studies on Additive Use
| Experimental Context | Key Additive(s) & Concentration | Mg²⁺ Concentration | Key Experimental Outcome |
|---|---|---|---|
| GC-rich EGFR promoter amplification [52] | 5% DMSO [52] | 1.5 - 2.0 mM [52] | Necessary for specific amplicon yield from FFPE tissue DNA. |
| Isothermal EXPAR model study [54] | 40 mg/mL BSA [54] | Not Specified | 0.27-fold reduction in non-specific product (NTC) intensity. |
| Isothermal EXPAR model study [54] | 40 mM TMAC [54] | Not Specified | ~50% reduction in ssDNA band intensity for non-targeted reaction. |
| General PCR Guidance [29] [9] | Betaine (0.5-2.5 M), DMSO (1-10%), BSA (10-100 μg/mL) [29] | 1.0 - 4.0 mM (empirical optimization required) [9] | Recommendations for tackling difficult templates and contaminated samples. |
Experimental Protocols for Validation
Integrated Workflow for Additive and Magnesium Titration
This protocol provides a systematic approach to optimizing a PCR reaction for specificity, incorporating additive cocktails and concluding with validation via melting curve analysis.
Materials and Reagents:
- Research Reagent Solutions:
- Template DNA: Genomic DNA, cDNA, or plasmid DNA. For difficult templates, use 5-50 ng of gDNA in a 50 µL reaction [9].
- Primers: Designed per standard guidelines (Tm 55-70°C, 40-60% GC), resuspended in nuclease-free water [29] [9].
- PCR Master Mix: Contains buffer, dNTPs (0.2 mM each), and a hot-start DNA polymerase (1-2 units/50 µL reaction) [29] [9].
- MgCl₂ Stock Solution: 25 mM for supplementation if not included in the buffer at a sufficient concentration [29].
- Additive Stocks: 100% DMSO, 5M Betaine (in water), 10 mg/mL BSA (in water). Sterile-filter and store aliquots at -20°C [29].
- Melting Curve Dye: A saturating DNA-binding dye such as SYBR Green I or EvaGreen [27].
Methodology:
- Prepare Master Mixes with Additive Cocktails: Create several master mixes, each containing the core components (water, buffer, dNTPs, polymerase, primers, template) and a different combination of additives. A suggested starting cocktail is 2.5% DMSO, 0.8 M Betaine, and 0.2 mg/mL BSA. Include a negative control (no additives) for baseline comparison.
- Titrate Magnesium: Aliquot each master mix plus additive cocktail into a series of PCR tubes. To each tube, add a different volume of MgCl₂ stock solution to create a gradient of final Mg²⁺ concentrations (e.g., 1.0, 1.5, 2.0, 2.5, 3.0, 3.5, 4.0 mM).
- Perform PCR Amplification: Run the reactions under the following cycling conditions, ideally in a real-time PCR instrument to monitor amplification kinetics:
- Initial Denaturation: 95°C for 3 min.
- 35-45 Cycles of:
- Denaturation: 95°C for 30 sec.
- Gradient Annealing: 55°C to 70°C for 30 sec (if a gradient function is available).
- Extension: 72°C for 60 sec/kb.
- Execute Melting Curve Analysis: Immediately after amplification, run the melting curve protocol:
- Denature at 95°C for 10 sec.
- Anneal at 60°C for 60 sec.
- Slowly heat from 60°C to 95°C with continuous fluorescence measurement (e.g., 0.2°C/sec ramp rate) [27].
Data Interpretation and Analysis
- Amplification Curves: Assess the quantification cycle (Cq) value and the amplitude of the fluorescence curve for each condition. A lower Cq indicates higher amplification efficiency. The condition with the lowest Cq and highest endpoint fluorescence for the target, but minimal signal in the no-template control, is a leading candidate.
- Melting Curves: Plot the negative first derivative of fluorescence (-dF/dT) versus temperature. A single, sharp peak indicates a homogeneous, specific PCR product. Multiple peaks or a broad peak suggest non-specific amplification or primer-dimer formation [27]. The optimal condition from the Mg²⁺/additive matrix will produce a single, well-defined melting peak.
- Endpoint Gel Electrophoresis: To corroborate melting curve findings, run the PCR products on an agarose gel. A single band of the expected size confirms specificity, while smears or multiple bands indicate non-specific amplification [52] [29].
The strategic combination of DMSO, betaine, and BSA, following a rigorous empirical optimization of magnesium concentration, provides a powerful approach to overcoming the most stubborn PCR challenges. This additive cocktail acts on multiple fronts: DMSO and betaine collaboratively disrupt the stable secondary structures of GC-rich templates, while BSA safeguards polymerase activity by neutralizing inhibitors. The absolute requirement for Mg²⁺ optimization in the presence of these additives cannot be overstated, as their introduction alters the biochemical landscape of the reaction. Finally, the use of melting curve analysis provides an indispensable, high-throughput method for validating the specificity of the optimized reaction, ensuring that the resulting amplicon is pure and homogeneous. By adopting this systematic, data-driven workflow, researchers can achieve robust, specific, and efficient amplification, thereby laying a solid foundation for critical downstream applications in research and diagnostics.
Fine-Tuning Annealing Temperature and Mg²⁺ Concentration in Tandem for Maximum Stringency
In polymerase chain reaction (PCR) optimization, the precise tandem adjustment of annealing temperature and magnesium ion (Mg²⁺) concentration represents a critical strategy for achieving maximum reaction stringency. This synergistic relationship directly controls the specificity and efficiency of DNA amplification by governing primer-template binding stability and DNA polymerase activity [55] [28]. Annealing temperature determines the specificity of primer binding to complementary sequences, while Mg²⁺ acts as an essential cofactor for DNA polymerase that also stabilizes DNA duplex formation [3] [55]. When optimized in concert, these parameters significantly reduce non-specific amplification and primer-dimer formation, thereby ensuring the accurate detection and quantification of target sequences—a requirement central to validation of PCR specificity using melting curve analysis after magnesium optimization research [3] [28].
The challenge lies in the interdependent nature of these parameters: increasing annealing temperature enhances specificity but may reduce yield if overly stringent, while Mg²⁺ concentration affects both enzyme processivity and the melting temperature of primer-template complexes [3] [55]. This review comprehensively compares optimization methodologies and their outcomes across diverse PCR applications, providing researchers with evidence-based protocols for achieving maximal amplification stringency.
Comparative Analysis of Optimization Approaches and Outcomes
Performance Metrics Across Template Types
Table 1: Comparative Performance of Optimized Conditions Across Template Types
| Template Type | Optimal Annealing Temperature Range | Optimal Mg²⁺ Concentration | Key Additives | Specificity Impact | Efficiency Impact | Reference Application |
|---|---|---|---|---|---|---|
| GC-Rich EGFR Promoter (75.5% GC) | 63°C (7°C above calculated Tm) | 1.5-2.0 mM | 5% DMSO | Eliminated non-specific bands | Enabled amplification of previously inaccessible target | SNP genotyping in lung cancer [52] |
| AT-Rich Plant Promoter (65.2% AT) | 2-step PCR with 65°C extension | 2.5-3.0 mM | None specified | Produced single, intense target band | Required increased template (25-30 ng/μL) | Promoter isolation from Arabidopsis thaliana [56] |
| Standard Templates | 55-65°C (Tm -3 to -5°C) | 1.5-2.0 mM | None typically required | High specificity with single band | High yield with standard parameters | Routine gene detection [28] [57] |
| Fungal Pathogen Detection | Primer-specific (LAMP/nested PCR) | System-dependent | Varies by method | High specificity for Fusarium tricinctum | qPCR sensitivity to 3.1 fg/μL | Early diagnosis of plant gummosis [58] |
Quantitative Effects of Magnesium Concentration
Table 2: Mg²⁺ Concentration Effects on PCR Parameters
| Mg²⁺ Concentration | Impact on Melting Temperature (Tm) | Effect on DNA Polymerase Activity | Specificity Consequences | Typical Use Cases |
|---|---|---|---|---|
| Suboptimal (<1.5 mM) | Reduced duplex stability | Significantly decreased | Reaction failure or low yield | Not recommended |
| Low (1.5-2.0 mM) | Standard Tm | Sufficient for most templates | High specificity | GC-rich templates, standard applications [52] |
| Medium (2.0-3.0 mM) | Increased Tm (~1.2°C per 0.5 mM) [3] | Enhanced processivity | Balanced specificity and yield | AT-rich templates, complex genomes [56] |
| High (>3.0 mM) | Substantially increased Tm | Maximum activity but error-prone | Increased non-specific amplification | Not recommended for stringent applications |
Experimental Protocols for Tandem Optimization
Gradient PCR with Magnesium Titration
This foundational protocol systematically evaluates annealing temperature and Mg²⁺ concentration in a single experiment [52]. Prepare a master mix containing all standard PCR components: template DNA (25-30 ng/μL for difficult templates), 0.2-0.5 μM of each primer, 0.2 mM dNTPs, 1X PCR buffer, and 0.5-1 U/μL DNA polymerase [57]. Aliquot the master mix into separate tubes and add MgCl₂ to create a concentration series (e.g., 1.0, 1.5, 2.0, 2.5, 3.0, 3.5 mM) [56] [28]. Utilize a thermal cycler with gradient capability across the horizontal axis to test a minimum of five annealing temperatures, typically spanning 55-70°C [52]. For the initial run, center the gradient around the calculated primer Tm, with temperatures approximately 7°C above and below this value [52].
Execute the following cycling parameters: initial denaturation at 94-98°C for 2-5 minutes; 30-40 cycles of denaturation (94-98°C for 20-30 seconds), gradient annealing (20-60 seconds), and extension (72°C for 1 minute/kb); final extension at 72°C for 5-10 minutes [57]. Analyze results via agarose gel electrophoresis to identify conditions producing a single, intense band of the expected size [57]. For GC-rich templates (>65% GC), include 3-5% DMSO in the master mix to disrupt secondary structures [52].
Validation via Melting Curve Analysis
Following initial optimization, validate reaction specificity using melting curve analysis in real-time PCR systems [59]. Prepare reactions using optimized Mg²⁺ concentrations and annealing temperatures identified in Section 3.1. Include intercalating dyes such as SYBR Green I in the reaction mixture [60]. Execute the standard optimized PCR protocol followed by a melting curve analysis step: gradually increase temperature from 60°C to 95°C (0.5°C increments with 5-10 second holds) while continuously monitoring fluorescence [59]. Analyze the resulting melting curve: a single sharp peak indicates specific amplification, while multiple or broad peaks suggest non-specific products or primer-dimer formation [60]. For absolute quantification in diagnostic applications, combine this approach with standard curves as demonstrated in pathogen detection assays achieving sensitivity to 3.1 fg/μL [58].
Integrated Workflow for Maximum Stringency
The diagram below illustrates the systematic workflow for tandem optimization of annealing temperature and Mg²⁺ concentration, culminating in validation through melting curve analysis.
The Scientist's Toolkit: Essential Research Reagents
Table 3: Key Reagents for PCR Stringency Optimization
| Reagent/Category | Specific Function | Optimization Role | Example Products/Alternatives |
|---|---|---|---|
| High-Fidelity DNA Polymerases | Proofreading activity reduces misincorporation errors | Provides base specificity for sequencing/cloning | Phusion, Q5, Pfu [61] [57] |
| Hot-Start Polymerases | Activated only at high temperatures prevents primer-dimer formation | Improves specificity by reducing low-temperature artifacts | Hot Start Taq, Hot Start Phusion [28] |
| Buffer Additives | DMSO disrupts secondary structures in GC-rich templates | Enables amplification of difficult templates | Molecular biology grade DMSO [52] |
| Magnesium Salts | Essential cofactor for polymerase; stabilizes DNA duplex | Primary optimization parameter for stringency | MgCl₂, MgSO₄ (concentration-dependent) [3] [55] |
| dNTP Mix | Building blocks for DNA synthesis | Balanced solutions prevent incorporation errors | dATP, dTTP, dCTP, dGTP mixtures [61] |
| Standard Buffer Systems | Maintain pH and ionic strength | Provides baseline conditions for optimization | Tris-HCl, KCl-based buffers [55] |
The tandem optimization of annealing temperature and Mg²⁺ concentration establishes a foundational framework for achieving maximum PCR stringency across diverse research and diagnostic applications. Evidence consistently demonstrates that template-specific optimization—employing higher annealing temperatures (up to 7°C above calculated Tm) for GC-rich targets [52] and elevated Mg²⁺ concentrations (2.5-3.0 mM) for AT-rich sequences [56]—dramatically improves amplification specificity. The quantitative relationship between Mg²⁺ and melting temperature (approximately 1.2°C increase per 0.5 mM Mg²⁺) [3] provides researchers with a predictive model for systematic optimization.
This approach finds particular utility in molecular diagnostics, where methods like LAMP leverage these principles for field-deployable pathogen detection [58], and in pharmacogenomics, where reliable amplification of polymorphic promoter regions enables personalized treatment strategies [52]. The integration of melting curve analysis following magnesium optimization creates a robust validation pipeline, ensuring that amplification specificity meets the rigorous demands of drug development and clinical research. As PCR technologies evolve toward single-cell resolution and CRISPR-assisted amplification, the precise control of these fundamental parameters will remain essential for generating biologically meaningful data with maximal reproducibility and reliability.
Establishing Assay Robustness: Comparative Analysis and Validation Techniques
In the field of molecular biology, the polymerase chain reaction (PCR) remains an indispensable tool, yet achieving optimal reaction conditions continues to present significant challenges. The critical importance of magnesium chloride (MgCl₂) concentration in PCR efficiency and specificity has long been recognized, but its systematic optimization for advanced applications like High-Resolution Melting (HRM) analysis represents a frontier in methodological refinement. This guide provides a comprehensive comparative analysis of magnesium-optimized HRM against standard endpoint PCR, framing the discussion within the broader context of validating PCR specificity through melting curve analysis.
The optimization of MgCl₂ is not merely a procedural step but a fundamental determinant of reaction success, influencing DNA polymerase activity, primer annealing efficiency, and DNA duplex stability [3] [4]. As we explore the technical nuances of both methods, this guide aims to equip researchers, scientists, and drug development professionals with evidence-based insights to inform their methodological selections for specific applications, from routine amplification to complex genotyping and mutation detection.
Theoretical Foundations and Technical Principles
The Crucial Role of Magnesium Ions in PCR
Magnesium ions (Mg²⁺) serve as an essential cofactor for DNA polymerase enzyme activity, directly influencing catalytic efficiency [4]. Beyond this fundamental role, MgCl₂ concentration significantly affects reaction thermodynamics by stabilizing the double-stranded DNA structure through electrostatic interactions with the phosphate backbone [3] [4]. This stabilization effect directly impacts the DNA melting temperature (Tm), creating a predictable relationship that forms the basis for melting curve analysis.
Recent meta-analyses have quantified this relationship, demonstrating a strong logarithmic relationship between MgCl₂ concentration and DNA melting temperature [3]. Within the optimal concentration range of 1.5-3.0 mM, every 0.5 mM increase in MgCl₂ raises the melting temperature by approximately 1.2°C [3] [4]. This precise relationship enables researchers to fine-tune reaction conditions for specific applications, particularly those requiring high discrimination between similar sequences.
Principle of Standard Endpoint PCR
Standard endpoint PCR is a fundamental molecular technique that amplifies specific DNA sequences through repeated thermal cycling, with results analyzed after the reaction completion typically via gel electrophoresis. This method provides qualitative or semi-quantitative data regarding target presence or absence but lacks the capacity for precise quantification or subtle sequence discrimination without additional downstream processing [62].
The simplicity of endpoint PCR makes it suitable for routine amplification tasks, but its limitations become apparent when analyzing complex templates or when precise quantification is required. The method's reliance on post-amplification analysis introduces additional steps and increases contamination risks while providing limited information about reaction specificity and efficiency [63].
Principle of High-Resolution Melting (HRM) Analysis
High-Resolution Melting (HRM) analysis is a powerful post-PCR technique that enables precise identification of nucleic acid sequence variations by characterizing the thermal denaturation profile of amplified products [64] [62]. The method employs specialized fluorescent dyes that intercalate with double-stranded DNA, monitoring fluorescence changes as the DNA duplex dissociates under gradually increasing temperature [64] [65].
The resulting melting curves provide a unique signature for each DNA sequence based on factors including length, GC content, and nucleotide composition [64]. HRM can discriminate between sequences with single-base differences, making it exceptionally valuable for SNP genotyping, mutation scanning, and methylation analysis [64] [66]. The closed-tube nature of HRM minimizes contamination risk while providing rapid results with minimal processing time compared to sequencing-based methods [62] [65].
Comparative Performance Analysis
Direct Performance Metrics Comparison
The table below summarizes key performance metrics derived from experimental studies comparing magnesium-optimized HRM and standard endpoint PCR across various applications:
Table 1: Direct performance comparison between magnesium-optimized HRM and standard endpoint PCR
| Performance Parameter | Magnesium-Optimized HRM | Standard Endpoint PCR |
|---|---|---|
| Detection Sensitivity | ≤5 parasites/μL blood (malaria detection) [65] | 10-30 parasites/μL blood (microscopy comparison) [65] |
| Analytical Specificity | Can detect single-nucleotide polymorphisms [64] | Limited without sequencing confirmation |
| Quantification Capability | Possible through Cq analysis and melting profiles [67] | Qualitative or semi-quantitative only |
| Multiplexing Potential | Moderate (limited by dye channels) [67] | Limited without complex optimization |
| Turn-around Time | 3-6 hours including analysis [67] | 2-4 hours plus additional analysis time |
| Template Complexity Handling | Requires MgCl₂ optimization based on template: 1.5-3.0 mM optimal range [3] | Less dependent on precise MgCl₂ optimization |
Application-Specific Performance Data
The application-specific performance characteristics of each method further highlight their distinctive profiles:
Table 2: Application-specific performance characteristics of magnesium-optimized HRM versus standard endpoint PCR
| Application Domain | Magnesium-Optimized HRM Performance | Standard Endpoint PCR Performance |
|---|---|---|
| Pathogen Detection | 100% agreement with IVD PCR for H. pylori detection (n=40) [62] | 35% lower detection rate vs. HRM for Plasmodium species [65] |
| Variant Identification | 92.6-100% agreement with Sanger sequencing for SARS-CoV-2 variants [67] | Requires subsequent sequencing for variant identification |
| Mutation Scanning | Detects SNPs, indels, and methylation differences [64] | Limited to size-based discrimination |
| Mixed Sample Analysis | Can detect presence of multiple DNA types in a sample [64] | Limited resolution for mixed templates |
Experimental Protocols and Methodologies
Magnesium Optimization Protocol for HRM
The following protocol for magnesium optimization in HRM applications is adapted from standardized methodologies identified in the literature [3] [4] [63]:
Preliminary Primer Validation
- Verify primer specificity and absence of secondary structures using design software (e.g., OligoArchitect)
- Ensure primer pairs have similar Tm values (difference ≤ 2°C)
- Analyze potential for primer-dimer formation (ΔG ≥ -2.0 kcal for 3'-end duplexes) [63]
MgCl₂ Titration Series Preparation
- Prepare a master reaction mix containing all components except MgCl₂
- Aliquot the master mix into separate tubes
- Add MgCl₂ to achieve final concentrations spanning 0.5 mM to 5.0 mM in 0.5 mM increments
- Include a no-template control for each concentration tested
Thermal Cycling and HRM Conditions
- Perform amplification with an initial denaturation at 95°C for 2-10 minutes
- Cycle 35-45 times: denature at 95°C for 5-15 seconds, anneal at primer-specific temperature (55-65°C) for 10-20 seconds, extend at 72°C for 15-30 seconds [63]
- Conduct HRM analysis with temperature increments of 0.1-0.2°C from 65°C to 95°C with fluorescence acquisition at each step [64]
Optimal Concentration Determination
- Identify MgCl₂ concentration yielding lowest Cq value with highest endpoint fluorescence
- Verify reaction specificity through distinct, reproducible melting curves
- Select concentration providing best discrimination between target sequences
Standard Endpoint PCR Protocol
For comparative purposes, a standardized endpoint PCR protocol is provided [63] [65]:
Reaction Setup
- Prepare 25-50 μL reactions containing 1X PCR buffer, 0.2-0.5 mM each dNTP, 0.2-1.0 μM each primer, 0.5-2.5 U DNA polymerase, and 1-100 ng template DNA
- Use standard MgCl₂ concentration of 1.5 mM unless otherwise optimized
Thermal Cycling
- Initial denaturation: 94-95°C for 2-5 minutes
- 30-40 cycles of:
- Denaturation: 94-95°C for 20-30 seconds
- Annealing: Primer-specific temperature (50-65°C) for 20-40 seconds
- Extension: 72°C for 30-60 seconds per kb
- Final extension: 72°C for 5-10 minutes
Product Analysis
- Analyze amplified products by agarose gel electrophoresis (1.5-2.0%)
- Visualize using ethidium bromide or SYBR Safe staining
- Confirm product size against molecular weight standards
Experimental Workflow Visualization
The following diagram illustrates the key methodological differences and comparative workflows between magnesium-optimized HRM and standard endpoint PCR:
Figure 1: Comparative workflow of magnesium-optimized HRM versus standard endpoint PCR methodologies
Research Reagent Solutions and Essential Materials
Successful implementation of magnesium-optimized HRM requires specific reagents and materials designed to support the technical requirements of this sophisticated methodology:
Table 3: Essential research reagents and materials for magnesium-optimized HRM experiments
| Reagent/Material | Function/Purpose | Implementation Notes |
|---|---|---|
| Magnesium Chloride (MgCl₂) | DNA polymerase cofactor; stabilizes DNA duplex [3] [4] | Use molecular biology grade; prepare fresh solutions; concentration range 1.5-3.0 mM optimal [3] |
| Saturation Dyes | Fluorescent intercalation for melting curve analysis [64] | Select dyes with high saturation binding; avoid inhibitor effects on PCR; improved Tm discrimination by 15-25% with next-gen dyes [66] |
| Mutation-Specific Probes | Enhanced specificity for SNP detection [67] | EasyBeacon probes provide nuclease resistance and temperature-independent quenching [67] |
| High-Quality Polymerase | DNA amplification with high fidelity and efficiency [63] | Hot-start enzymes recommended to prevent non-specific amplification; ensure magnesium compatibility |
| Optimal Primers | Target sequence amplification [63] | Design for similar Tm values; avoid primer-dimer formation; test at 200-400 nM concentrations [63] |
| Positive Control Templates | Assay validation and optimization [63] | Include known variants for melting profile comparison; essential for assay standardization |
Discussion and Concluding Remarks
The comprehensive comparison presented in this guide demonstrates that magnesium-optimized HRM analysis offers significant advantages over standard endpoint PCR for applications requiring high specificity, sensitivity, and variant discrimination. The precise modulation of MgCl₂ concentration within the empirically determined optimal range of 1.5-3.0 mM enables researchers to fine-tune reaction conditions to specific template characteristics, dramatically improving both amplification efficiency and analytical resolution [3] [4].
The quantitative data from comparative studies reveals that HRM consistently outperforms endpoint PCR in detection sensitivity, specificity, and variant discrimination capability. For Helicobacter pylori detection, HRM demonstrated equivalent performance to IVD-certified PCR kits while providing additional genotyping information without additional processing time [62]. In malaria detection, HRM showed superior sensitivity compared to microscopic analysis and traditional PCR, capable of detecting low parasitemia levels and identifying mixed infections [65].
The integration of magnesium optimization protocols with HRM methodology creates a powerful analytical tool that advances molecular diagnostics beyond simple presence/absence detection to precise sequence characterization. This approach is particularly valuable in clinical diagnostics, pathogen identification, and genetic screening where accurate variant detection directly impacts patient management and treatment decisions [67] [62].
As molecular technologies continue to evolve, the combination of magnesium optimization with melting curve analysis represents a significant methodological advancement that balances technical sophistication with practical implementation. Future developments in dye chemistry, instrumentation, and automated analysis algorithms will further enhance the capabilities of this already powerful analytical approach [64] [66].
In the validation of diagnostic and research assays, particularly following specific optimization procedures like magnesium adjustment in PCR, understanding key performance metrics is fundamental. These metrics provide a quantitative framework for comparing assays and objectively determining their suitability for specific applications, such as clinical diagnostics or drug discovery. At the core of this evaluation are sensitivity and specificity, two intrinsic characteristics of a test that describe its accuracy independent of the population prevalence [68] [69].
Sensitivity, or the true positive rate, measures a test's ability to correctly identify individuals who have a disease or condition [68]. In a research context, this translates to the assay's capability to reliably detect the target analyte when it is present. Specificity, or the true negative rate, measures the test's ability to correctly identify individuals who do not have the disease or condition [68] [69]. In practice, these metrics often exist in a trade-off; as sensitivity increases, specificity tends to decrease, and vice-versa [68] [70]. Beyond these foundational metrics, other crucial parameters include Positive Predictive Value (PPV), Negative Predictive Value (NPV), and Likelihood Ratios, which, unlike sensitivity and specificity, are influenced by the prevalence of the condition in the population [68]. For high-throughput screening applications, statistical measures like the Z'-factor are used to assess assay robustness by incorporating both the signal separation between positive and negative controls and the data variation [70] [71].
Table 1: Core Definitions of Essential Assay Performance Metrics
| Metric | Definition | Formula | Interpretation | ||
|---|---|---|---|---|---|
| Sensitivity [68] [69] | Ability to correctly identify true positives. | True Positives / (True Positives + False Negatives) | High value is critical for "ruling out" a disease. | ||
| Specificity [68] [69] | Ability to correctly identify true negatives. | True Negatives / (True Negatives + False Positives) | High value is critical for "ruling in" a disease. | ||
| Positive Predictive Value (PPV) [68] | Proportion of true positives among all positive results. | True Positives / (True Positives + False Positives) | Probability that a positive test result is correct. | ||
| Negative Predictive Value (NPV) [68] | Proportion of true negatives among all negative results. | True Negatives / (True Negatives + False Negatives) | Probability that a negative test result is correct. | ||
| Z'-Factor [70] [71] | Measure of assay robustness for screening. | ( 1 - \frac{3(\sigma{C+} + \sigma{C-})}{ | \mu{C+} - \mu{C-} | } ) | Scores of 0.5-1.0 indicate a robust assay suitable for screening. |
The Critical Role of Magnesium Optimization in PCR
In Polymerase Chain Reaction (PCR) assays, the optimization of reaction components is not merely a recommendation but a necessity to achieve the desired sensitivity and specificity. Among various factors, magnesium chloride (MgCl₂) concentration is one of the most pivotal variables influencing assay performance [72] [3]. Magnesium acts as a cofactor for the DNA polymerase enzyme and its concentration directly affects the enzyme's fidelity and processivity, the melting temperature (Tm) of the primers, and the overall reaction efficiency [3].
A recent comprehensive meta-analysis of 61 studies revealed a strong logarithmic relationship between MgCl₂ concentration and DNA melting temperature, identifying an optimal concentration range between 1.5 and 3.0 mM [3]. Within this range, every 0.5 mM increase in MgCl₂ was associated with a 1.2 °C increase in melting temperature [3]. This precise relationship is crucial because it directly impacts the stringency of primer annealing; too low a Mg²⁺ concentration can lead to inefficient primer binding and false negatives (reduced sensitivity), while too high a concentration can promote non-specific binding and primer-dimer formation, leading to false positives (reduced specificity) [72]. The complexity of the DNA template also dictates the optimal MgCl₂ requirement, with genomic DNA templates generally requiring higher concentrations than simpler, plasmid-based templates [3].
Diagram 1: A workflow for optimizing magnesium concentration in PCR to balance sensitivity and specificity, validated by melting curve analysis.
Experimental Protocol: Validating PCR Specificity via Melting Curve Analysis
Following magnesium optimization, the validation of PCR specificity is paramount. Melting curve analysis is a powerful, post-amplification technique used to verify the specificity of the amplification and identify the presence of non-specific products or primer-dimers, which are common culprits of reduced assay specificity [72]. This protocol details the steps for performing this validation after magnesium concentration has been optimized.
Materials and Equipment
- A real-time PCR instrument capable of generating melting curves (e.g., Applied Biosystems QuantStudio, Roche LightCycler, Bio-Rad CFX).
- Optimized PCR reaction mix, including the optimized concentration of MgCl₂.
- SYBR Green I dye master mix.
- Validated forward and reverse primers.
- Template DNA (positive control) and nuclease-free water (no-template control, NTC).
Step-by-Step Procedure
- Reaction Setup: Prepare the PCR reactions according to the optimized protocol. Include technical replicates for each sample and essential controls (Positive Control, No-Template Control).
- Thermal Cycling: Run the amplification program on the real-time PCR instrument. A standard two-step or three-step cycling protocol is used.
- Melting Curve Data Acquisition: After the final amplification cycle, the instrument will automatically execute the melting curve protocol. This typically involves gradually increasing the temperature from a low point (e.g., 60°C) to a high point (e.g., 95°C) while continuously monitoring the fluorescence.
- Data Analysis: The instrument software will plot the negative derivative of fluorescence over temperature versus temperature (-dF/dT vs. T). Analyze this melting curve for:
- A single, sharp peak: This indicates that a single, specific PCR product has been amplified, confirming high assay specificity.
- Multiple peaks or broad peaks: This indicates the presence of multiple amplification products, such as non-specific amplicons or primer-dimers, signaling a need for further optimization (e.g., adjusting annealing temperature or MgCl₂ concentration) [72].
Comparative Performance Data and Analysis
To objectively compare assay performance, it is essential to collect quantitative data before and after optimization. The following table summarizes how key metrics can be expected to shift following a successful optimization process, such as fine-tuning magnesium concentration.
Table 2: Comparative Assay Performance Before and After Magnesium Optimization
| Performance Metric | Pre-Optimization (Suboptimal Mg²⁺) | Post-Optimization (Optimal Mg²⁺) | Impact on Assay Reliability |
|---|---|---|---|
| Sensitivity | Lower (Higher False Negatives) | Higher | Reduces risk of missing true positives; better for "ruling out". |
| Specificity | Lower (Higher False Positives) | Higher | Reduces risk of false alarms; better for "ruling in". |
| Cq (Quantification Cycle) Value | Higher, more variable | Lower, highly reproducible | Indicates improved reaction efficiency and consistency. |
| Melting Curve Profile | Multiple or broad peaks | Single, sharp peak | Confirms amplification of a single, specific product. |
| Z'-Factor (for HTS) | < 0.5 (Poor) | 0.5 - 1.0 (Good to Excellent) | Signifies a robust assay with a wide separation window between controls. |
The data in Table 2 demonstrates that a properly optimized assay achieves a balance between high sensitivity and high specificity. This balance is reflected in the Positive and Negative Predictive Values (PPV & NPV), which become more reliable. Furthermore, a high Z'-factor score confirms that the assay is robust enough for screening purposes, as it accounts for both the mean signal and its variation [70] [71]. The relationship between sensitivity and specificity, and how they are influenced by the test's cutoff point, can be visualized as a continuum.
Diagram 2: The inverse relationship between sensitivity and specificity. Moving the test's classification threshold (e.g., by adjusting Mg²⁺ or annealing temperature) shifts the balance between these metrics.
The Scientist's Toolkit: Essential Research Reagent Solutions
The consistent execution of validated assays and optimization protocols relies on the use of specific, high-quality reagents. The following table details essential materials and their critical functions in experiments aimed at assessing sensitivity and specificity.
Table 3: Essential Research Reagents for Assay Validation
| Reagent / Material | Critical Function in Validation | Application Example |
|---|---|---|
| Magnesium Chloride (MgCl₂) | Cofactor for DNA polymerase; critically influences priming efficiency, fidelity, and product specificity [72] [3]. | Titration between 1.5-3.0 mM to optimize PCR efficiency and specificity for a new primer set. |
| SYBR Green I Dye | A fluorescent dsDNA-binding dye used for real-time PCR and subsequent melting curve analysis to assess amplicon purity [72]. | Validating PCR specificity in a magnesium optimization experiment. |
| Hot-Start DNA Polymerase | Reduces non-specific amplification and primer-dimer formation by remaining inactive until a high-temperature activation step [72]. | Improving assay specificity and sensitivity in complex genomic DNA amplifications. |
| Optimal Primers | Designed for target-specific binding with minimal self- or cross-dimerization (ΔG ≥ -2.0 kcal) and matched Tm [72]. | Foundation for any highly sensitive and specific PCR assay, especially multiplex reactions. |
| Positive & Negative Controls | Essential for calculating sensitivity, specificity, PPV, NPV, and Z'-factor by providing known true positive and true negative signals [68] [71]. | Included in every run to monitor assay performance and for inter-experiment comparison. |
The rigorous assessment of sensitivity, specificity, and related metrics provides an indispensable framework for validating assay performance. In the specific context of PCR, the optimization of magnesium concentration is a scientifically grounded strategy to enhance both reaction efficiency and template specificity, a claim supported by recent meta-analyses [3]. The subsequent use of melting curve analysis offers a direct and reliable method to confirm this specificity by distinguishing a single, pure amplicon from non-specific products. By adhering to detailed experimental protocols and utilizing the essential research reagents, scientists can generate robust, comparable data. This objective, metrics-driven approach is fundamental for advancing diagnostic accuracy, accelerating drug discovery, and ensuring the reliability of research findings.
Accurately identifying single nucleotide polymorphisms (SNPs) within highly homologous gene regions, such as those containing pseudogenes, represents a significant technical challenge in molecular biology and pharmacogenomics. Conventional genotyping methods often fail when sequence homology exceeds 95% between the target gene and its close homologs, leading to false positives and inaccurate genotype assignments [73]. This challenge is particularly evident in cytochrome P450 family genotyping, where the CYP2B6 functional gene and CYP2B7 pseudogene share near-identical sequences in exon 5 and flanking regions, creating a genotyping bottleneck for crucial pharmacogenetic variants [73].
Within this context, melting curve analysis emerges as a powerful solution that leverages the fundamental physical properties of DNA. The technique detects sequence variations by monitoring the temperature-dependent dissociation (melting) of double-stranded DNA, with even single-base changes altering the melting temperature (Tm) and curve profile [74] [75]. This guide objectively compares Tm-shift analysis with alternative genotyping methods, providing experimental data and protocols to validate PCR specificity through magnesium optimization and strategic assay design.
Method Comparison: Tm-Shift Analysis Versus Alternative Genotyping Platforms
Table 1: Comparative Analysis of SNP Genotyping Methods for Challenging Targets
| Method | Principle | Best For | Throughput | Cost | Specificity Challenges |
|---|---|---|---|---|---|
| Tm-Shift Analysis (HRM) | DNA dissociation monitoring with saturating dyes [75] | Detecting unknown variants; homologous regions [73] | Medium-high | Low | Requires optimized Mg²⁺ and primer design [76] |
| MGB Eclipse Probes | Fluorogenic probes with minor groove binders [77] | A-T/GC-rich targets; known SNPs [77] | High | Medium-high | Modified bases prevent Hoogsteen pairing [77] |
| TaqMan Assays | 5' nuclease cleavage of fluorescent probes [73] | Routine SNP genotyping | High | High | Fails with high homology; no commercial designs for CYP2B6 785A>G [73] |
| RFLP Analysis | Restriction enzyme digestion of PCR products [73] | Known SNPs creating restriction sites | Low | Low-medium | Requires specific sequence context; produces false results with pseudogene co-amplification [73] |
| Sanger Sequencing | Dideoxy chain termination [75] | Variant identification; discovery | Low | High | Requires gene-specific amplification to avoid homologous interference [73] |
Table 2: Performance Metrics for SNP Detection Methods
| Method | Sensitivity for Heterozygotes | Ability to Detect Novel Variants | Multiplexing Capacity | Equipment Requirements |
|---|---|---|---|---|
| Tm-Shift Analysis (HRM) | High (detects heteroduplexes) [75] | Excellent [75] | Low-medium (single dye) | Real-time PCR with HRM capability |
| MGB Eclipse Probes | High (two-color melt curves) [77] | Low (requires prior knowledge) | Medium (2-plex with two dyes) [77] | Standard real-time PCR |
| TaqMan Assays | High | None | High (multiple dyes) | Standard real-time PCR |
| RFLP Analysis | Medium | None | Low | Basic thermal cycler + gel electrophoresis |
| Sanger Sequencing | High (if present in sufficient proportion) | Excellent | None | Sequencing facility |
Experimental Evidence: HRM Case Study for CYP2B6 785A>G SNP Genotyping
Experimental Design and Protocol
Research Context and Objective
The critical pharmacogenetic variant CYP2B6 785A>G (K262R, rs2279343) presents unique genotyping challenges because it is located in an exon 5 region with >500 bp of near-identical sequence between CYP2B6 and CYP2B7, with only four potential single nucleotide differences upstream and none within 139 bp downstream [73]. Conventional approaches that attempt gene-specific amplification fail due to this extensive homology. The study developed a novel "duplexing" HRM approach that simultaneously amplifies both genes, leveraging melt profile differences to resolve diplotype combinations [73].
Sample Preparation Protocol
- DNA Sources: 235 human liver tissue specimens from NIH-supported tissue programs (LTCDS, University of Maryland Brain and Tissue Bank, University of Washington, Xenotech, Vitron) [73]
- DNA Quality Control: Assessed by agarose gel electrophoresis; concentration determined spectrophotometrically [73]
- Controls: Five Coriell Institute samples with known genotypes [73]
HRM Reaction Optimization
- Reaction Volume: 6 μl [73]
- Primer Concentration: 0.2 μM for each primer [73]
- Magnesium Optimization: 2.5 mM MgCl₂ (optimized from 1.5-4.0 mM range) [73] [76]
- DNA Template: 10-20 ng genomic DNA [73]
- PCR Conditions: Initial denaturation 95°C for 3 min; 40 cycles of 95°C for 5s denaturing and combined annealing/extension at 60°C for 30s [73]
- Melting Analysis: Temperature gradient from 55-95°C using preset instrument parameters [73]
- Replication: Each sample run in duplicate with known controls on each plate [73]
Diagram: Experimental workflow for CYP2B6/CYP2B7 HRM analysis showing key optimization steps.
Key Findings and Data Interpretation
Method Validation Results
The HRM assay successfully resolved eight distinct CYP2B6/CYP2B7 diplotype combinations that would be indistinguishable using conventional methods [73]. The frequency of the 785G allele corresponded to established population frequencies for Caucasians and African-Americans, validating the assay's accuracy [73]. Additionally, the approach discovered a novel variant 769G>A (D257N) that was previously undetected, demonstrating the method's sensitivity for variant discovery [73].
Magnesium Concentration Impact
Optimization of magnesium concentration proved critical for assay performance. While 1.5-2.0 mM Mg²⁺ is typically optimal for Taq DNA Polymerase [76], the CYP2B6/7 HRM assay required 2.5 mM MgCl₂ for optimal specificity and signal intensity [73]. This elevation reflects the challenging nature of the homologous template and demonstrates that magnesium optimization beyond standard recommendations is essential for difficult genotyping targets.
Table 3: Magnesium Optimization Effects on PCR Performance
| Mg²⁺ Concentration | PCR Product Yield | Specificity | Melt Curve Quality |
|---|---|---|---|
| <1.5 mM | Low or none [76] | High | Poor (insufficient product) |
| 1.5-2.0 mM | Good for standard targets [76] | High | Good for routine genotyping |
| 2.5 mM | Optimal for homologous targets [73] | Maintained with optimization | Excellent (clear profile separation) |
| >3.0 mM | High | Decreased (spurious bands) [76] | Variable (multiple products) |
The Scientist's Toolkit: Essential Reagents for Tm-Shift Analysis
Table 4: Research Reagent Solutions for HRM-Based Variant Detection
| Reagent/Instrument | Function in Assay | Specific Examples | Performance Characteristics |
|---|---|---|---|
| Saturating DNA Dyes | Fluorescent detection of DNA duplex melting | EvaGreen, LCGreen Plus [73] [75] | Critical for heteroduplex detection; SYBR Green I is less effective [75] |
| Modified Nucleotides | Stabilize AT/GC-rich sequences | Super G, Super A, Super T [77] | Prevent Hoogsteen base pairing in GC-rich regions; increase Tm of AT-rich probes [77] |
| Hot-Start Polymerases | Specific amplification | Taq DNA Polymerase, OneTaq Hot Start [76] | Reduce nonspecific amplification in complex homologous templates |
| MGB Probes | Enhanced mismatch discrimination | MGB Eclipse Probes [77] | Short sequences with great mismatch discrimination; block exonuclease degradation [77] |
| High-Resolution Instruments | Precise melt curve acquisition | Illumina Eco Real-Time PCR System, LightScanner [73] [75] | Varying resolution capabilities impact variant detection sensitivity [75] |
Technical Implementation: Critical Success Factors
Primer Design for Homologous Targets
The CYP2B6 case study employed a strategic "duplexing" approach with primers designed to simultaneously amplify both CYP2B6 and CYP2B7, producing 70-bp amplicons from each gene [73]. This contrasts with conventional wisdom that emphasizes gene-specific amplification. For homologous targets, simultaneous amplification with careful melt profile analysis can provide more reliable genotyping than failed attempts at absolute specificity.
Magnesium and Reaction Optimization
As demonstrated in the experimental protocol, magnesium concentration significantly impacts HRM success. The guidelines for PCR optimization with Taq DNA Polymerase recommend testing magnesium concentrations in 0.5 mM increments up to 4 mM when standard conditions (1.5-2.0 mM) prove insufficient [76]. For challenging homologous targets, the optimal concentration often exceeds standard recommendations, as evidenced by the 2.5 mM requirement for CYP2B6/7 genotyping [73].
Data Interpretation Framework
Diagram: Decision framework for interpreting melt curves in homologous gene analysis.
Successful interpretation of melt curves for homologous targets requires analyzing both Tm shifts and curve shapes. Homozygous variants typically display single Tm shifts of approximately 1°C for most SNPs (84% of human single base variants), while type 3 and 4 "base pair neutral" variants show smaller differences around 0.25°C [75]. Heterozygous samples produce characteristic broadened peaks or distinct shoulders due to heteroduplex formation between mismatched strands [74] [75]. Mixed diplotypes in homologous genes create complex profiles requiring comparison with known controls.
Tm-shift analysis using high-resolution melting represents a robust solution for SNP genotyping in challenging homologous regions where conventional methods fail. The CYP2B6/7 case study demonstrates that strategic assay design – incorporating simultaneous amplification of both target and homologous sequences, coupled with magnesium optimization and appropriate dye selection – can successfully resolve previously intractable genotyping challenges. This approach provides researchers with a cost-effective, rapid method for variant detection that combines the specificity needed for pharmacogenetic applications with the flexibility to discover novel variants. For laboratories facing similar challenges with homologous targets, HRM methods offer a viable alternative when standard genotyping platforms prove inadequate, particularly when comprehensive optimization of reaction components is implemented.
In the molecular diagnostics and pharmaceutical development industries, the validation of quantitative Polymerase Chain Reaction (qPCR) protocols is paramount for ensuring the accuracy, reliability, and reproducibility of experimental results. This process rigorously evaluates both intra-assay (within-run) and inter-assay (between-run) precision, providing critical data on the consistency of an optimized protocol under varying conditions. For assays relying on melting curve analysis for specificity, particularly after critical optimization steps like magnesium (Mg²⁺) concentration adjustment, demonstrating robust reproducibility is a cornerstone of method validation [4] [78]. This guide objectively compares the performance of optimized qPCR protocols with alternative approaches, presenting supporting experimental data to underscore the importance of comprehensive validation in research and drug development.
Performance Comparison: Optimized vs. Non-Optimized PCR Protocols
A meticulously optimized PCR protocol demonstrates marked improvements in precision, sensitivity, and specificity compared to non-optimized or standard protocols. The table below summarizes quantitative data from various studies, illustrating the performance gains achieved through systematic optimization, including magnesium titration and primer concentration refinement.
Table 1: Performance Comparison of Optimized vs. Standard PCR Protocols
| Protocol Type | Key Optimization Parameters | Analytical Sensitivity (LOD) | Intra-assay CV (Ct) | Inter-assay CV (Ct) | Specificity (Cross-reactivity) |
|---|---|---|---|---|---|
| Optimized Multiplex SYBR Green PCR for Simian Malaria [79] | Mg²⁺ concentration, primer concentration, annealing temperature | 10 copies/µL | 0.13% - 0.44% | 0.28% - 0.85% | No cross-reactivity observed |
| Novel qPCR for Mucormycosis/Aspergillosis [80] | Primer design (degenerate primers), annealing temperature | 10 copies/µL | Not specified | Mean CV: 0.63% (range 0.42%-1.56%) | Sensitivity: 93.3-99.29%; Specificity: 83.84-97.1% |
| Standard PCR Protocol (Typical Range) [81] | Fixed Mg²⁺ (1.5-2.0 mM), standard primer conc. (0.1-0.5 µM) | Varies significantly with template | Can exceed 5% without optimization | Often >10% without optimization | Prone to non-specific amplification and primer-dimers |
The data reveals that optimized protocols consistently achieve a limit of detection (LOD) as low as 10 copies/µL and remarkably low coefficients of variation (CV) for both intra-assay and inter-assay comparisons. These low CVs, often below 1%, indicate high precision and robustness [79] [80]. In contrast, non-optimized protocols suffer from variable sensitivity and precision, making them unreliable for critical applications like biodistribution studies in gene therapy development [78].
Detailed Experimental Protocols for Validation
To achieve the level of reproducibility demonstrated by optimized protocols, a structured experimental approach is required. The following sections detail the key methodologies cited in the performance data.
Protocol 1: Magnesium and Primer Optimization for Multiplex Assays
This protocol, adapted from a simian malaria detection assay, highlights the optimization of critical reaction components [79] [82].
Reaction Setup:
- A master mix is prepared containing SYBR Green I dye, Mg²⁺-free PCR buffer, and a fixed amount of DNA polymerase.
- Magnesium Titration: A MgCl₂ solution is added to achieve final concentrations typically ranging from 1.5 mM to 3.0 mM, tested in increments of 0.5 mM [4] [82].
- Primer Concentration Optimization: Each primer pair (forward and reverse) is tested at various concentrations (e.g., 0.3 µM, 0.4 µM, 0.5 µM, 0.6 µM) [79] [82].
- Template DNA and nuclease-free water are added to a final reaction volume.
Thermal Cycling:
- Initial denaturation: 95°C for 2 minutes.
- 40 cycles of:
- Denaturation: 95°C for 5-10 seconds.
- Annealing/Extension: 56-66°C for 20 seconds (a temperature gradient is used to identify the optimal temperature).
- Melt curve analysis: 65°C to 95°C, with continuous fluorescence measurement.
Data Analysis:
Protocol 2: Intra-assay and Inter-assay Precision Testing
This protocol describes the procedure for quantitatively assessing the reproducibility of an optimized assay, as performed in the validation of pathogen detection tests [79] [80].
Sample Preparation:
- Prepare a panel of standard samples with known target concentrations, typically spanning the assay's dynamic range (e.g., from 10² to 10⁵ copies per reaction) [79].
- Use cloned plasmid DNA or synthetic oligonucleotides as standards for accurate copy number determination.
Intra-assay Precision:
- On the same qPCR plate, run a minimum of 3-5 replicate reactions for each standard concentration.
- Use the same batch of master mix, reagents, and the same thermal cycler run.
- Record the Cycle Threshold (Ct) and Melting Temperature (Tm) for each replicate.
Inter-assay Precision:
- Repeat the entire experiment (from reaction setup through analysis) on three or more separate days.
- Use independently prepared aliquots of standards and master mix for each run.
- Different operators and instruments can be incorporated to test robustness further.
Statistical Analysis:
- Calculate the mean and standard deviation (SD) for both Ct and Tm values for each concentration level, both within a single run (intra-assay) and between runs (inter-assay).
- Compute the Coefficient of Variation (CV) as (SD / Mean) × 100%. A CV of less than 5% is generally considered acceptable, with high-performance assays achieving CVs below 1-2% [79] [80] [78].
The following workflow diagrams the logical relationship between optimization and the subsequent validation phases.
Figure 1: Experimental Workflow for PCR Protocol Optimization and Validation.
The Scientist's Toolkit: Essential Reagents and Materials
Successful optimization and validation rely on a set of core reagents and instruments. The following table details these essential components and their functions.
Table 2: Key Research Reagent Solutions for PCR Optimization and Validation
| Item Name | Function/Benefit | Example Use-Case in Validation |
|---|---|---|
| SYBR Green / Eva Green Dye | Fluorescent dye that intercalates into dsDNA. Cost-effective for single-target assays but requires melt curve analysis to confirm specificity [84] [82]. | Used in the simian malaria and shrimp pathogen assays for detecting amplification and enabling differentiation via melting temperature (Tm) [79] [82]. |
| TaqMan Probes | Sequence-specific hydrolysis probes. Offer superior specificity in complex samples and enable multiplexing, but are more expensive than dyes [78]. | Recommended for biodistribution and shedding studies in gene therapy due to high specificity and reduced risk of false positives [78]. |
| MgCl₂ Solution | Critical cofactor for DNA polymerase. Concentration directly affects primer annealing, Tm, reaction efficiency, and specificity [4] [81]. | Systematically titrated from 1.5-3.0 mM to find the optimal concentration that boosts efficiency without compromising specificity [4] [82]. |
| Cloned Plasmid Standards | Quantifiable standards with known copy numbers. Essential for generating a standard curve for absolute quantification and determining LOD [79] [80]. | Used to prepare serial dilutions from 10¹⁰ to 10⁰ copies/µL to establish assay sensitivity and linearity [82] [80]. |
| High-Fidelity DNA Polymerase | Enzyme with proofreading activity to reduce error rates during amplification. Crucial for applications requiring high fidelity, like cloning. | While not always specified in the cited studies, it is a key reagent for ensuring amplification accuracy in many research contexts. |
| Real-time PCR System with Gradient Function | Thermocycler capable of real-time fluorescence detection and running a temperature gradient across the block. | Instrument used to simultaneously test different annealing temperatures during the optimization phase [82] [83]. |
The Critical Role of Magnesium Optimization in Reproducibility
Magnesium chloride (MgCl₂) is a pivotal factor in PCR success, and its optimization is directly linked to the reproducibility of the assay. Mg²⁺ ions act as a cofactor for DNA polymerase and stabilize the double-stranded DNA, thereby influencing the melting temperature (Tm) of the amplicon [4] [81]. A meta-analysis of PCR optimization studies established a quantitative logarithmic relationship, where every 0.5 mM increase in MgCl₂ concentration within the 1.5-3.0 mM range raises the DNA melting temperature by approximately 1.2°C [4] [3].
This relationship is crucial for melt curve analysis. An suboptimal Mg²⁺ concentration can lead to broad or shifted melt peaks, increasing the variability in Tm measurements between replicates and runs. This variability directly translates to higher CVs in inter-assay and intra-assay validation, reducing the reliability of the assay for differentiating specific targets. Furthermore, the complexity of the DNA template (e.g., genomic DNA vs. plasmid DNA) influences the optimal Mg²⁺ requirement, with more complex templates often needing higher concentrations [4]. Therefore, protocol optimization that fails to account for Mg²⁺ concentration is unlikely to achieve the high level of reproducibility required for regulatory submissions or diagnostic applications.
The following diagram visualizes how magnesium concentration impacts the key analytical parameters that underpin a reliable assay.
Figure 2: The Impact of Magnesium Concentration on PCR Reliability.
Conclusion
The synergistic optimization of magnesium concentration and validation via melting curve analysis establishes a robust framework for achieving superior PCR specificity. This approach moves beyond empirical trial-and-error to a principled, quantitative methodology, directly addressing key challenges in genetic analysis and diagnostic testing. The integration of predictive modeling with empirical validation, as demonstrated in recent studies, provides a powerful strategy for assay development. Future directions should focus on automating this optimization pipeline and expanding its application to next-generation sequencing library preparation and complex multiplex assays, ultimately enhancing reproducibility and reliability in clinical diagnostics and biomedical research.
References
- 1. What is MgCl₂ and Its Role in PCR? [https://www.linkedin.com/posts/zulqarnain-yousaf-705185316_what-is-mgcl%E2%82%82-and-its-function-in-pcr-magnesium-activity-7339331993857343489-xEXn]
- 2. What Is the Role of MgCl2 in PCR Amplification Reactions? [https://www.excedr.com/resources/what-is-the-role-of-mgcl2-in-pcr]
- 3. Investigating concentration effects on reaction efficiency ... [https://pubmed.ncbi.nlm.nih.gov/40436087/]
- 4. Investigating concentration effects on reaction efficiency ... [https://www.sciencedirect.com/science/article/abs/pii/S0003269725001472]
- 5. PCR Assay Optimization and Validation [https://www.sigmaaldrich.com/US/en/technical-documents/technical-article/genomics/pcr/assay-optimization-and-validation?srsltid=AfmBOoosZBCe61cjKLnxrSvGx0RzOxXN9dxvW8_RRxdLJKO07pQaOhmW]
- 6. Magnesium Chloride (25 mM MgCl2) [https://bento.bio/resources/datasheets/magnesium-chloride-25-mm-mgcl2/]
- 7. Mathematical Modeling and Thermodynamic Integration for ... [https://pmc.ncbi.nlm.nih.gov/articles/PMC12620865/]
- 8. High-Resolution Melting Curve Analysis for Molecular ... [https://www.sciencedirect.com/science/chapter/edited-volume/abs/pii/B9780128029718000067]
- 9. PCR Setup—Six Critical Components to Consider [https://www.thermofisher.com/us/en/home/life-science/cloning/cloning-learning-center/invitrogen-school-of-molecular-biology/pcr-education/pcr-reagents-enzymes/pcr-component-considerations.html]
- 10. How to Calculate DNA Melting Temperature (Tm) | IDT [https://www.idtdna.com/page/support-and-education/decoded-plus/understanding-melting-temperature-t-sub-m-sub/]
- 11. 2025 Oligonucleotide Design Guide: Complete User Manual [https://oligopool.com/resources/user-guide]
- 12. Smearing in PCR Amplification | NTA NET LIFE SCIENCE [https://www.letstalkacademy.com/smearing-in-pcr-amplification-due-to-low-mg-ions-concentration/]
- 13. DNA Amplification | Primer Melting Temperature [https://nij.ojp.gov/nij-hosted-online-training-courses/dna-amplification/overview/primer-design/primer-melting-temperature]
- 14. melting [https://www.ebi.ac.uk/biomodels/tools/melting/melting.html]
- 15. high-resolution melting curve analysis of PCR products [https://pmc.ncbi.nlm.nih.gov/articles/PMC12002481/]
- 16. PCR Assay Optimization and Validation [https://www.sigmaaldrich.com/US/en/technical-documents/technical-article/genomics/pcr/assay-optimization-and-validation?srsltid=AfmBOopU-H38ITPKMVXO_BhYwPbqA_pZ--yG21vUn5FNJEofIsi0yCJ7]
- 17. Explaining multiple peaks in qPCR melt curve analysis | IDT [https://www.idtdna.com/page/support-and-education/decoded-plus/interpreting-melt-curves-an-indicator-not-a-diagnosis/]
- 18. Engineering of novel DNA polymerase variants for single ... [https://www.nature.com/articles/s41598-025-10211-x]
- 19. Optimizing PCR Reaction Conditions for High Fidelity and ... [https://www.labx.com/resources/optimizing-pcr-reaction-conditions-for-high-fidelity-and-yield/5579]
- 20. Multiplex Real-Time PCR Melting Curve Assay To Detect ... [https://pmc.ncbi.nlm.nih.gov/articles/PMC3165625/]
- 21. Data for Validation and Application of Standardized ... [https://catalog.data.gov/dataset/data-for-validation-and-application-of-standardized-quantitative-pcr-assay-for-the-assessm]
- 22. Establishment of a simple prediction method for DNA melting ... [https://journals.plos.org/plosone/article?id=10.1371/journal.pone.0321885]
- 23. Development and comparative evaluation of LAMP, nested ... [https://bmcmicrobiol.biomedcentral.com/articles/10.1186/s12866-025-04295-8]
- 24. Predicting sequence-specific amplification efficiency in ... [https://www.nature.com/articles/s41467-025-64221-4]
- 25. Development and clinical validation of a novel multiplex ... [https://www.nature.com/articles/s41598-025-16434-2]
- 26. Unlock Intervals in Chemical Experiments: A Quick Guide [https://learnfast.blog/intervals-chemical-experiments-guide]
- 27. Melting curve analysis [https://en.wikipedia.org/wiki/Melting_curve_analysis]
- 28. PCR Optimization: Factors Affecting Reaction Specificity ... [https://www.mybiosource.com/learn/pcr-optimization-factors-affecting-reaction-specificity-and-efficien/]
- 29. Polymerase Chain Reaction: Basic Protocol Plus ... [https://pmc.ncbi.nlm.nih.gov/articles/PMC4846334/]
- 30. Development of Melting-Curve-Based Real-Time PCR for ... [https://pmc.ncbi.nlm.nih.gov/articles/PMC12524715/]
- 31. Digital Melting Curve Analysis for Multiplex Quantification ... [https://www.mdpi.com/2079-6374/15/1/36]
- 32. Comparison of high-resolution melting analysis with ... [https://pubmed.ncbi.nlm.nih.gov/19959634/]
- 33. A unified framework for the mathematical modelling ... [https://www.sciencedirect.com/science/article/abs/pii/S1385894720342790]
- 34. Thermodynamic Study of Improvements of Various ... [https://www.pcbiochemres.com/article_232343.html]
- 35. Guidelines for PCR Optimization with Taq DNA Polymerase [https://www.neb.com/en-us/tools-and-resources/usage-guidelines/guidelines-for-pcr-optimization-with-taq-dna-polymerase?srsltid=AfmBOoqsj_2hrDQGPi7r_QsCLZxGoOPLt1fti0GZdf5X6my3ErX0nMIa]
- 36. Impact of metal ions on PCR inhibition and RT- ... [https://pmc.ncbi.nlm.nih.gov/articles/PMC7782418/]
- 37. Rules and Tips for PCR & qPCR Primer Design | IDT [https://www.idtdna.com/page/support-and-education/decoded-plus/how-to-design-primers-and-probes-for-pcr-and-qpcr/]
- 38. Four tips for PCR amplification of GC-rich sequences [https://www.neb.com/en-us/nebinspired-blog/four-tips-for-pcr-amplification-of-gc-rich-sequences?srsltid=AfmBOor2J89uIRwXxDe5HEBfrUEKQtetaxAY92aENQoT79DYqjaz6q1Q]
- 39. A Fundamental Study of the PCR Amplification of GC-Rich ... [https://pmc.ncbi.nlm.nih.gov/articles/PMC2727727/]
- 40. Guidelines for PCR Optimization with Taq DNA Polymerase [https://www.neb.com/en-us/tools-and-resources/usage-guidelines/guidelines-for-pcr-optimization-with-taq-dna-polymerase?srsltid=AfmBOoo8IVSltmecppZ6cUh1I9Pqhq0VSq4cyVRQvBuOm8ZBuxgMyeez]
- 41. PCR Optimization: Strategies To Minimize Primer Dimer [https://genemod.net/blog/pcr-optimization]
- 42. Troubleshooting primer dimer in PCR [https://www.minipcr.com/primer-dimer-pcr/]
- 43. PCR Assay Optimization and Validation [https://www.sigmaaldrich.com/US/en/technical-documents/technical-article/genomics/pcr/assay-optimization-and-validation?srsltid=AfmBOoojRPnKo7Pof5n3V2MbwkPxBOilVUfEsKD40Ex7Qr1bNIR3jCcz]
- 44. Four tips for PCR amplification of GC-rich sequences [https://www.neb.com/en-us/nebinspired-blog/four-tips-for-pcr-amplification-of-gc-rich-sequences?srsltid=AfmBOop2PdLe7CRpOoXKQwtu8cJtE7yi__xh0flr5N9L0n-SYl9ZRMvX]
- 45. Optimizing your PCR [https://www.takarabio.com/learning-centers/pcr/faq/optimization?srsltid=AfmBOooDMrBd6UR2lVnPf3_MnWE9SC-bxjTL2xaMUFnE9vTjFdyELaf6]
- 46. Free Guide: Top 5 PCR Optimization Tips - Yeasen [https://www.yeasenbio.com/blogs/molecular-biology/free-guide-top-5-pcr-optimization-tips]
- 47. A Melting Curve Analysis–Based PCR Assay for One-Step ... [https://pmc.ncbi.nlm.nih.gov/articles/PMC3123802/]
- 48. Validation and advantages of using novel RT-qPCR ... [https://www.nature.com/articles/s41598-022-17339-0]
- 49. Enhancement of DNA amplification efficiency by using ... [https://www.bocsci.com/blog/enhancement-of-dna-amplification-efficiency-by-using-pcr-additives/?srsltid=AfmBOooaWCWI6O_4VA4odkyDDmLhDKt6ErllqICXzWOP7tUCppcKKoDG]
- 50. Just What Do All These Additives Do? [https://bitesizebio.com/19420/just-what-do-all-these-additives-do/]
- 51. Types, mechanisms, and applications in long-range PCR [https://www.sciencedirect.com/science/article/abs/pii/S0300908422000499]
- 52. Optimization of PCR Conditions for Amplification of GC‐ ... [https://pmc.ncbi.nlm.nih.gov/articles/PMC6807403/]
- 53. Optimizing PCR: One Scientist's Not So Fond Memories [https://www.promegaconnections.com/optimizing-pcr-one-scientists-not-so-fond-memories/]
- 54. Comprehensive evaluation of molecular enhancers of the ... [https://www.nature.com/articles/srep37837]
- 55. PCR conditions | Primer annealing specificity | PCR buffers [https://www.qiagen.com/us/knowledge-and-support/knowledge-hub/bench-guide/pcr/introduction/pcr-conditions]
- 56. Optimization of PCR conditions for amplifying an AT-rich ... [https://bmcresnotes.biomedcentral.com/articles/10.1186/s13104-017-2982-1]
- 57. Standard Operating Procedure for Polymerase Chain ... [https://www.genfollower.com/standard-operating-procedure-for-pcr/]
- 58. Development and comparative evaluation of LAMP, nested ... [https://pmc.ncbi.nlm.nih.gov/articles/PMC12398972/]
- 59. 2025 Melting Temperature (Tm) Calculator: Complete Guide [https://oligopool.com/resources/tutorials/calculating-tm]
- 60. What Is an Amplicon? A Beginner's Guide to PCR and ... [https://www.cd-genomics.com/resource-what-is-amplicon.html]
- 61. A Guide To PCR Amplification Kits For Modern Research [https://techfundingnews.com/a-guide-to-pcr-amplification-kits-for-modern-research/]
- 62. Comparison of Next-Generation Sequencing, Real-Time ... [https://www.mdpi.com/2076-2607/13/10/2344]
- 63. PCR Assay Optimization and Validation [https://www.sigmaaldrich.com/AG/en/technical-documents/technical-article/genomics/pcr/assay-optimization-and-validation]
- 64. Finding Genetic Variations with HRM Market [https://www.polarismarketresearch.com/blog/high-resolution-melting-analysis-market-detecting-dna-sequence-variations]
- 65. A new high-resolution melting analysis for the detection ... [https://www.nature.com/articles/s41598-018-36515-9]
- 66. High-Resolution Melting Analysis (HRM) Market Size, ... [https://www.strategicmarketresearch.com/market-report/high-resolution-melting-analysis-market]
- 67. and advantages of using novel RT-qPCR Validation ... melting curve [https://www.nature.com/articles/s41598-022-17339-0?error=cookies_not_supported&code=bcc62ce6-c0e9-4365-9948-d1839c501346]
- 68. Diagnostic Testing Accuracy: Sensitivity, Specificity, Predictive ... [https://www.ncbi.nlm.nih.gov/books/NBK557491/]
- 69. Sensitivity and specificity [https://en.wikipedia.org/wiki/Sensitivity_and_specificity]
- 70. Understanding Assay Performance Metrics [https://indigobiosciences.com/understanding-assay-performance-metrics/]
- 71. Better metrics for comparing instruments and assays [https://www.moleculardevices.com/en/assets/app-note/br/better-metrics-for-comparing-instruments-and-assays]
- 72. PCR Assay Optimization and Validation [https://www.sigmaaldrich.com/US/en/technical-documents/technical-article/genomics/pcr/assay-optimization-and-validation?srsltid=AfmBOopVPXX3oJYeFjk5otpuJlzaiyiwtlzDqXH9-xXo9mjll_VQPOML]
- 73. High-resolution melt analysis to detect sequence variations ... [https://pmc.ncbi.nlm.nih.gov/articles/PMC3866959/]
- 74. Melt Curve Analysis: Interpreting Results for SNP Genotyping [https://synapse.patsnap.com/article/melt-curve-analysis-interpreting-results-for-snp-genotyping]
- 75. High Resolution Melting Analysis for Gene Scanning - PMC [https://pmc.ncbi.nlm.nih.gov/articles/PMC2836412/]
- 76. Guidelines for PCR Optimization with Taq DNA Polymerase [https://www.neb.com/en-us/tools-and-resources/usage-guidelines/guidelines-for-pcr-optimization-with-taq-dna-polymerase?srsltid=AfmBOoqfZVpARwFtO1P7aR6nUsdu9jIlLPFbmR_bOaEE8bS53CbTnl39]
- 77. Single nucleotide polymorphism genotyping by two colour ... [https://pmc.ncbi.nlm.nih.gov/articles/PMC3525082/]
- 78. qPCR and qRT-PCR analysis: Regulatory points to ... [https://pmc.ncbi.nlm.nih.gov/articles/PMC7786041/]
- 79. Development and validation of a multiplex PCR assay with ... [https://pmc.ncbi.nlm.nih.gov/articles/PMC12216036/]
- 80. Development of a Sensitive and Specific Novel qPCR ... [https://www.frontiersin.org/journals/fungal-biology/articles/10.3389/ffunb.2021.800898/full]
- 81. Guidelines for PCR Optimization with Taq DNA Polymerase [https://www.neb.com/en-us/tools-and-resources/usage-guidelines/guidelines-for-pcr-optimization-with-taq-dna-polymerase?srsltid=AfmBOoqLCgznoOOasymXMMuNNr5uKU2mCpYKRXenRP-Zm5CbEDGeCLmu]
- 82. Development of a Melting Curve-Based Triple Eva Green ... [https://www.mdpi.com/2076-2615/14/4/592]
- 83. PCR Assay Optimization and Validation [https://www.sigmaaldrich.com/US/en/technical-documents/technical-article/genomics/pcr/assay-optimization-and-validation?srsltid=AfmBOoqk7ib35o3sJc2_OV2lNFD5CRUAtpG-quEAZr9GfmhS6R0oZMor]
- 84. Development and validation of cost-effective SYBR Green ... [https://www.nature.com/articles/s41598-024-52250-w]