Native vs. Denaturing Gels: The Definitive Guide for Biomedical Researchers
This comprehensive guide provides researchers, scientists, and drug development professionals with a strategic framework for selecting between native and denaturing gel electrophoresis methods.
Native vs. Denaturing Gels: The Definitive Guide for Biomedical Researchers
Abstract
This comprehensive guide provides researchers, scientists, and drug development professionals with a strategic framework for selecting between native and denaturing gel electrophoresis methods. Covering foundational principles, methodological protocols, and troubleshooting strategies, the article details how to preserve protein complexes and activity with native gels or separate by molecular weight using denaturing SDS-PAGE. It includes comparative validation approaches and optimization techniques for diverse applications from enzyme isolation to western blotting and protein sequencing, enabling informed experimental design in biomedical research.
Understanding the Core Principles: How Native and Denaturing Gels Work
Native gel electrophoresis represents a critical methodology in biochemical analysis that enables the separation of biomolecules in their folded, functional states. Unlike denaturing techniques that dismantle higher-order structures, native gels preserve the intricate quaternary structures, enzymatic activities, and binding capabilities of proteins and nucleic acids. This technical guide examines the fundamental principles, methodological considerations, and practical applications of native gel electrophoresis within the broader context of choosing between denaturing and non-denaturing approaches. By providing detailed protocols, quantitative comparisons, and advanced applications, this review serves as an essential resource for researchers and drug development professionals seeking to maintain biomolecular integrity throughout analytical procedures.
Native polyacrylamide gel electrophoresis (PAGE) operates on the fundamental principle of separating biomolecules according to their intrinsic charge, size, and three-dimensional shape under non-denaturing conditions. The technique employs mild buffer systems that preserve the native conformation of proteins and nucleic acids, maintaining their biological activity and subunit interactions [1]. This stands in direct contrast to denaturing methods such as SDS-PAGE, which uses sodium dodecyl sulfate to unfold proteins into linear chains, and urea-based gels that disrupt hydrogen bonding in nucleic acids [2]. The preservation of structure in native gels introduces additional separation parameters including molecular compactness, oligomeric state, and surface charge distribution, making it possible to study functional biomolecular complexes that would be disrupted in denaturing systems.
The strategic value of native gels lies in their ability to provide information about biological systems that is irrecoverable from denaturing analyses. While denaturing gels excel at determining molecular weights and establishing sample purity, native gels reveal hierarchical states, binding interactions, and enzymatic capabilities [2]. For drug development professionals, this capability is particularly valuable when characterizing therapeutic proteins, protein complexes, and protein-drug interactions where maintenance of tertiary and quaternary structure is essential for biological function. The choice between these complementary techniques must therefore be guided by the specific biological questions being addressed rather than procedural convenience alone.
Fundamental Principles and Mechanisms
Theoretical Basis of Separation
In native PAGE, the electrophoretic mobility of a biomolecule is determined by a complex interplay of its net charge, hydrodynamic size, and molecular shape. Unlike denaturing systems where the charge-to-mass ratio is uniformized by denaturants, native systems maintain the intrinsic charge characteristics of each molecule [1]. Electrophoretic migration occurs because most proteins carry a net negative charge in alkaline running buffers, causing them to migrate toward the anode. The frictional force of the gel matrix creates a sieving effect that regulates molecular movement according to size and three-dimensional configuration [1]. This dual dependence on charge and size parameters means that a small protein with low charge density might migrate similarly to a larger protein with high charge density, necessitating careful interpretation of results.
The preservation of native structure enables the study of biologically critical assemblies that would be disrupted under denaturing conditions. Multimeric proteins maintain their subunit interactions, membrane proteins retain their lipid associations, and nucleic acid secondary structures remain intact [2] [1]. This structural preservation comes with increased complexity in result interpretation, as migration distance cannot be directly correlated to molecular weight through simple calibration curves as in denaturing systems. Instead, researchers must account for charge variations across different biomolecules and recognize that conformational changes induced by ligand binding or post-translational modifications will alter electrophoretic mobility independently of mass changes.
Comparative Analysis: Native vs. Denaturing Gels
The strategic selection between native and denaturing electrophoretic methods depends fundamentally on the analytical objectives. Each approach offers distinct advantages and limitations that must be weighed according to experimental goals.
Table 1: Comparative Applications of Native Versus Denaturing Gels
| Application Scenario | Native Gel | Denaturing Gel |
|---|---|---|
| Structural Investigation | Preserves secondary/tertiary/quaternary structure | Disrupts non-covalent interactions; analyzes primary structure |
| Functional Analysis | Maintains enzymatic activity; studies protein function | Not applicable (proteins denatured) |
| Binding Studies | Identifies protein-protein/ligand interactions | Disrupts non-covalent binding interactions |
| Complex Assembly | Resolves multimers and quaternary structures | Separates individual subunits |
| Purity Assessment | Limited by structural heterogeneity | Excellent for establishing sample purity |
| Molecular Weight Determination | Indirect (influenced by charge/shape) | Direct determination possible |
| Downstream Applications | Activity assays; structural biology | Sequencing; Western blotting |
The decision framework for method selection extends beyond these application-based considerations to include practical experimental factors. Native gels are generally simpler and cheaper to run, making them preferable for initial characterization when structural preservation is paramount [2]. Denaturing gels provide more straightforward interpretation for molecular weight determination and are essential techniques when establishing sample purity or preparing for protein sequencing [2]. For many research workflows, a complementary approach utilizing both methods provides the most comprehensive biomolecular characterization.
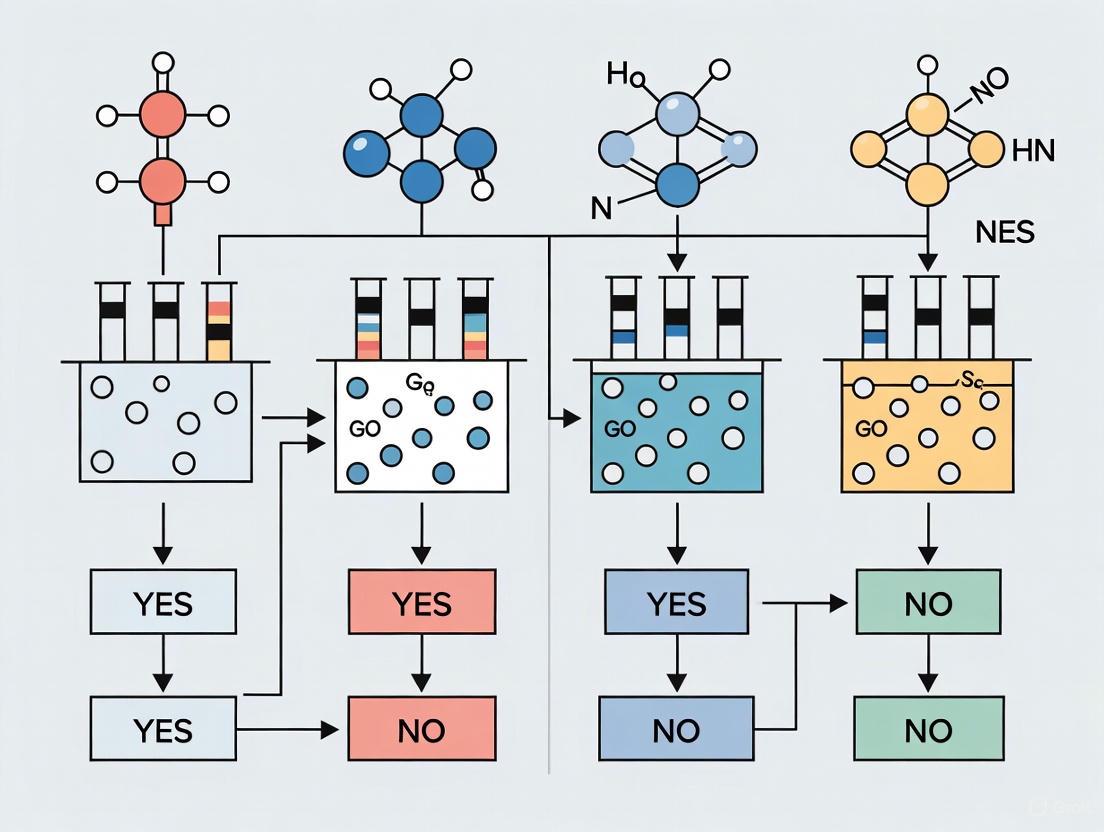
Diagram 1: Decision framework for gel type selection
Technical Methodologies and Experimental Design
Native Gel Chemistry Systems
Three primary gel chemistry systems have been developed for native PAGE, each optimized for specific protein characteristics and analytical requirements. The operating pH range represents a critical differentiating factor, as it determines the net charge of proteins during separation and must be compatible with protein stability.
Table 2: Native PAGE Gel Chemistry Systems and Specifications
| Parameter | Tris-Glycine System | Tris-Acetate System | NativePAGE Bis-Tris System |
|---|---|---|---|
| Operating pH Range | 8.3–9.5 | 7.2–8.5 | ~7.5 |
| Molecular Weight Range | 20–500 kDa | >150 kDa | Broad range with charge shifting |
| Key Features | Traditional Laemmli system | Enhanced resolution for larger proteins | Charge shifting with Coomassie G-250; detergent compatible |
| Optimal Applications | Maintaining native charge; smaller proteins | Maintaining native charge; larger proteins | Membrane proteins; hydrophobic proteins; molecular weight-based separation regardless of pI |
| Recommended Buffer | Tris-Glycine Native Running Buffer | Tris-Glycine Native Running Buffer | NativePAGE Running Buffer with Cathode Buffer Additive |
| Unique Characteristics | - | - | Converts basic proteins to net negative charge via Coomassie G-250 binding |
The Tris-Glycine system operates at a higher alkaline pH (8.3–9.5), making it suitable for proteins that maintain stability and negative charge in this environment [1]. The Tris-Acetate system functions at a more neutral pH range (7.2–8.5), providing better resolution for larger molecular weight proteins [1]. Most innovatively, the NativePAGE Bis-Tris system incorporates Coomassie G-250 dye in the cathode buffer, which binds nonspecifically to hydrophobic protein regions and confers a negative charge regardless of intrinsic protein pI [1]. This charge-shifting approach enables the separation of basic proteins that would otherwise migrate toward the cathode or remain stationary in conventional native systems.
Detailed Experimental Protocol
The following protocol outlines the standard procedure for native PAGE using the Tris-Glycine system, with modifications noted for alternative chemistries:
Gel Preparation:
- Gel Concentration Selection: Choose appropriate acrylamide concentration based on target protein size. For Tris-Glycine systems, available percentages include 6%, 8%, 10%, 12%, 14%, 16%, and gradient gels (4-12%, 4-20%, 8-16%, 10-20%) [1].
- Gel Casting: Combine acrylamide/bis-acrylamide mixture at 37:1 ratio with Tris-Glycine buffer (25 mM Tris, 200 mM glycine, pH 8.3-9.5). Initiate polymerization with 0.1% (w/v) ammonium persulfate and 0.4 μl/ml TEMED [3].
- Gel Storage: Prepared gels can be stored at 2-8°C for up to 12 months when properly sealed to prevent dehydration [1].
Sample Preparation:
- Buffer Conditions: Dilute protein samples in Tris-Glycine Native Sample Buffer. Maintain physiological salt concentrations (<150 mM) to minimize disturbances during electrophoresis.
- Detergent Considerations: For membrane proteins, include non-ionic detergents (e.g., digitonin, dodecyl maltoside) at concentrations above their critical micelle concentrations to maintain solubility without denaturing proteins.
- Loading Requirements: For mini-gels (8 cm × 8 cm), load up to 60 μL per well using gel-loading tips to ensure proper deposition in well bottoms [1].
Electrophoretic Run:
- Buffer Assembly: Fill electrophoresis chamber with Tris-Glycine Native Running Buffer. For NativePAGE Bis-Tris systems, add Cathode Buffer Additive containing Coomassie G-250 to the cathode chamber [1].
- Run Conditions: Apply constant voltage of 5-15 V/cm. Lower voltages (5 V/cm) minimize Joule heating and improve band resolution, while higher voltages reduce run time [3].
- Temperature Control: Maintain temperature at 4-10°C throughout the run using a circulating cooler or by performing electrophoresis in a cold room to preserve protein stability.
Post-Electrophoresis Analysis:
- Protein Detection: Visualize proteins using Coomassie Brilliant Blue, silver stain, or specific activity stains for enzymes. For NativePAGE Bis-Tris systems, the Coomassie G-250 provides initial visualization during separation.
- Western Blotting: Transfer proteins to PVDF membranes using Tris-Glycine Transfer Buffer. Note that nitrocellulose is incompatible with NativePAGE Bis-Tris systems due to tight binding of Coomassie G-250 dye [1].
- Activity Assays: For functional studies, incubate gels in appropriate substrate solutions to detect enzymatic activity directly within the gel matrix.
Advanced Applications and Innovations
Single-Molecule Studies in Native Gels
The integration of native gel electrophoresis with single-molecule fluorescence spectroscopy has created powerful methodologies for studying biomolecular dynamics and interactions. The gel matrix serves dual purposes: purifying biomolecular complexes of interest from free components and aggregates, while simultaneously slowing translational diffusion to enable extended observation of conformational dynamics [3]. This approach, exemplified by in-gel alternating-laser excitation (ALEX) spectroscopy, allows researchers to monitor real-time FRET fluctuations within DNA hairpins and protein-nucleic acid complexes under native conditions [3].
The methodological implementation involves embedding pre-formed biomolecular complexes within non-denaturing polyacrylamide gels (typically 6% acrylamide) and performing single-molecule observations using confocal microscopy or total internal reflection fluorescence [3]. The gel matrix creates a biologically friendly environment that avoids surface immobilization artifacts while providing sufficient molecular immobilization to resolve millisecond-timescale conformational transitions [3]. This technique has been successfully applied to study RNA polymerase open complexes, DNA structural transitions, and protein folding pathways, demonstrating broad utility for investigating dynamic biomolecular processes under near-physiological conditions.
Advanced Detection Methodologies
Recent innovations in detection technologies have significantly enhanced the sensitivity and specificity of native gel analyses. The development of in-gel fluorescence detection using Connectase-mediated fluorophore labeling represents a particularly advanced methodology that surpasses traditional Western blotting in sensitivity and quantitative accuracy [4]. This approach utilizes a highly specific protein ligase from methanogenic archaea that recognizes a defined 12-amino acid sequence (CnTag) and transfers a fluorophore to tagged proteins within the gel matrix [4].
The standard protocol involves:
- Conjugate Formation: Incubate equimolar concentrations (5 μM) of Connectase and fluorescent peptide substrate for 1 minute to form the fluorophore-Connectase conjugate (N-Cnt) [4].
- Labeling Reaction: Mix 6.67 nM of the N-Cnt reagent with the protein sample and incubate for ≥5 minutes for qualitative analysis or 30 minutes for quantitative studies [4].
- Separation and Detection: Separate samples on native polyacrylamide gels and analyze using a fluorescence imager or scanner [4].
This method demonstrates remarkable sensitivity, detecting approximately 0.1 fmol (3 pg of a 30 kDa protein) of target protein—approximately three orders of magnitude more sensitive than conventional Western blotting [4]. Additionally, it provides superior quantitative accuracy with a linear signal-to-substrate relationship and minimal background interference, making it particularly valuable for precise quantification of recombinant proteins in complex mixtures.
Diagram 2: Advanced in-gel fluorescence detection workflow
Research Reagent Solutions
The successful implementation of native gel electrophoresis requires specific reagent systems optimized for maintaining biomolecular structure and function throughout the separation process.
Table 3: Essential Research Reagents for Native Gel Electrophoresis
| Reagent | Composition/Type | Function | Application Notes |
|---|---|---|---|
| NativePAGE Bis-Tris Gels | 3-12% or 4-16% polyacrylamide with Bis-Tris buffer | High-resolution separation of native proteins | Provides near-neutral pH (7.5); compatible with Coomassie G-250 charge shifting |
| Tris-Glycine Native Running Buffer | 25 mM Tris, 200 mM glycine, pH 8.3-9.5 | Creates alkaline electrophoresis environment | Suitable for proteins stable at high pH; traditional Laemmli system |
| Coomassie G-250 Dye | Triphenylmethane compound | Binds hydrophobic protein regions; confers negative charge | Enables separation of basic proteins; included in cathode buffer |
| NativePAGE Sample Buffer | Non-denaturing buffer with G-250 additive | Maintains native protein structure during preparation | Contains non-ionic detergents for membrane proteins |
| PVDF Membrane | Polyvinylidene fluoride | Western blot transfer surface | Required for NativePAGE systems; nitrocellulose incompatible |
| Connectase Enzyme | Archaeal protein ligase | Mediates specific fluorophore transfer to CnTagged proteins | Enables ultra-sensitive in-gel fluorescence detection |
Native gel electrophoresis remains an indispensable tool in the biomolecular analysis toolkit, providing unique capabilities for studying proteins and nucleic acids in their functional states. The technique's ability to preserve higher-order structures, maintain biological activity, and resolve complex assemblies makes it particularly valuable for characterizing therapeutic proteins, investigating protein-protein interactions, and analyzing macromolecular complexes in drug development pipelines. While method selection must be guided by specific research objectives, with denaturing methods preferred for molecular weight determination and purity assessment, native methods offer irreplaceable insights into biomolecular function that cannot be obtained through denaturing approaches.
Recent methodological advancements, including single-molecule spectroscopy in gel matrices and Connectase-mediated fluorescence detection, have significantly expanded the analytical power of native electrophoresis. These innovations offer enhanced sensitivity, quantitative accuracy, and dynamic information that complement traditional native gel applications. As biomolecular therapeutics continue to increase in complexity and structural sensitivity, the preservation of native structure during analytical characterization becomes increasingly critical, ensuring native gel electrophoresis will remain an essential methodology for researchers and drug development professionals seeking to understand biomolecular function in addition to composition.
Gel electrophoresis stands as a cornerstone technique in molecular biology and biochemistry for separating biomolecules based on their physical properties. Within this methodology, denaturing gels represent a specialized approach that fundamentally alters the native structure of proteins and nucleic acids to create linear chains that separate strictly by molecular weight. This technical guide explores the core principles, mechanisms, and applications of denaturing gel electrophoresis, positioning it within the critical context of choosing appropriate separation techniques for research and drug development. By systematically comparing denaturing versus native conditions and providing detailed experimental protocols, this whitepaper serves as an essential resource for scientists requiring precise biomolecular separation and analysis.
Gel electrophoresis operates on the fundamental principle that charged molecules migrate through a porous gel matrix under the influence of an electric field. The rate of migration depends on several factors including the molecule's charge, size, and shape, as well as the resistance of the medium [5]. In protein electrophoresis, molecules exhibit varying charges depending on pH conditions, migrating toward oppositely charged electrodes except at their isoelectric point (pI) where their net charge is zero [5]. The gel matrix, typically composed of agarose or polyacrylamide, creates a molecular sieve that retards larger molecules while allowing smaller ones to migrate more rapidly.
The evolution of polyacrylamide gel electrophoresis (PAGE) revolutionized biomolecular separation by providing a chemically inert and stable matrix with tunable pore sizes [5]. The gel forms through chemical copolymerization of acrylamide monomers with an N-N'-methylene bisacrylamide cross-linker, with the pore size determined by the relative concentrations of acrylamide (%T) and bisacrylamide crosslinker (%C) [5]. This customizable matrix enables researchers to optimize separation conditions for specific molecular weight ranges, making PAGE an indispensable tool in modern biological research.
Core Principles of Denaturing Gels
Fundamental Mechanism
Denaturing gels operate on the principle of completely disrupting the native secondary, tertiary, and quaternary structures of biomolecules, transforming them into linear chains whose migration depends primarily on molecular weight rather than complex structural features. For proteins, this structural unfolding is typically achieved using sodium dodecyl sulfate (SDS), an anionic detergent that binds to hydrophobic regions of proteins at a relatively constant ratio of approximately 1.4g SDS per 1g of protein [5]. This SDS coating confers a uniform negative charge density along the protein backbone, effectively masking the protein's intrinsic charge and creating a migration rate dependent almost exclusively on molecular size [2] [6].
For nucleic acids, denaturation is commonly accomplished using urea, which disrupts hydrogen bonding between base pairs, or alternative denaturants such as DMSO and glyoxal for RNA [2]. These agents unfold secondary structures like hairpins and stem-loops, ensuring that nucleic acids migrate as single-stranded molecules whose mobility correlates directly with chain length rather than structural complexity [2]. The result in both cases is a separation based primarily on molecular mass, with smaller molecules migrating faster through the gel matrix than larger ones [2] [6].
Comparison with Native Gel Electrophoresis
The critical distinction between denaturing and native (non-denaturing) gel electrophoresis lies in their treatment of biomolecular structure and the consequent separation parameters, as summarized in Table 1.
Table 1: Key Differences Between Denaturing and Native Gel Electrophoresis
| Parameter | Denaturing Gels | Native Gels |
|---|---|---|
| Biomolecule Structure | Unfolded into linear chains; secondary, tertiary, and quaternary structures disrupted [2] [6] | Native structure preserved; all levels of structure maintained [2] [6] |
| Separation Basis | Primarily molecular mass (length for nucleic acids) [2] [6] | Molecular mass, intrinsic charge, overall bulk, and cross-sectional area [2] [6] |
| Common Denaturants | SDS (proteins), urea, DMSO, glyoxal (nucleic acids) [2] | No denaturants used |
| Typical Applications | Western blotting, protein sequencing, purity assessment, molecular weight determination [2] | Enzyme activity assays, binding studies, quaternary structure analysis, complex isolation [2] |
| Information Obtained | Primary structure analysis, molecular weight estimation [6] | Analysis of all four levels of biomolecular structure [6] |
This fundamental difference in separation principle means that denaturing gels provide information primarily about the primary structure and molecular weight, while native gels allow researchers to probe complex structural features and functional states of biomolecules [6].
Experimental Methodology for Denaturing Gel Electrophoresis
SDS-PAGE Protocol for Proteins
The following protocol provides a detailed methodology for SDS-PAGE analysis of proteins, adapted from established laboratory practices [7].
Sample Preparation
Protein samples must be properly prepared to ensure complete denaturation and accurate separation:
Denaturation Buffer: Combine the protein sample with Tris-Glycine SDS Sample Buffer (2X) to achieve a final 1X concentration [7]. For reduced samples, add reducing agent (DTT or β-mercaptoethanol) to a final concentration of 1X immediately prior to electrophoresis to disrupt disulfide bonds [7] [5].
Heat Denaturation: Heat samples at 85°C for 2-5 minutes to complete the denaturation process [7]. Avoid heating at 100°C as this can promote proteolysis [7].
Loading Preparation: Adjust final volume with deionized water to achieve desired concentration. Typical loading volumes range from 10-20μL per well [7].
Note: For non-denaturing electrophoresis, use Tris-Glycine Native Sample Buffer instead and do not heat the samples [7].
Gel Preparation and Electrophoresis
Pre-cast gels offer convenience and consistency, while hand-cast gels provide customization options:
Gel Selection: Choose appropriate polyacrylamide percentage based on target protein size range. Lower percentages (8-10%) better resolve higher molecular weight proteins, while higher percentages (12-15%) optimize separation of smaller proteins.
Assembly: Remove gel cassette from packaging, rinse with deionized water, and remove tape from the bottom. Gently pull the comb from the cassette in one smooth motion and rinse wells with running buffer [7].
Buffer System: Prepare 1X Tris-Glycine SDS Running Buffer from 10X stock according to manufacturer recommendations [7]. The discontinuous buffer system utilizes Tris-glycine at pH 8.3 with SDS for optimal separation [7].
Loading and Separation: Load prepared samples and molecular weight markers into wells. Run gels at constant voltage (typically 125V for mini-gels) until the dye front reaches the bottom of the gel [7].
The workflow for denaturing gel electrophoresis can be visualized as follows:
Research Reagent Solutions
Successful denaturing gel electrophoresis requires specific reagents, each serving distinct functions in the separation process as detailed in Table 2.
Table 2: Essential Reagents for Denaturing Gel Electrophoresis
| Reagent | Function | Application Notes |
|---|---|---|
| SDS (Sodium Dodecyl Sulfate) | Anionic detergent that denatures proteins and confers uniform negative charge [5] | Critical for protein unfolding; typically used at 1-2% concentration |
| Urea | Denaturant that disrupts hydrogen bonding in nucleic acids [2] [6] | Used at high concentrations (6-8M) for complete denaturation of DNA/RNA |
| DTT or β-mercaptoethanol | Reducing agents that break disulfide bonds in proteins [7] [5] | Essential for analyzing reduced proteins; prevents reformation of disulfide bridges |
| Acrylamide/Bis-acrylamide | Forms cross-linked polymer matrix for molecular sieving [5] | Concentration ratio determines gel pore size and separation range |
| Tris-Glycine Buffer | Discontinuous buffer system for optimal protein separation [7] | Creates stacking effect for sharp band formation; pH ~8.3-8.8 |
| APS and TEMED | Catalyst system for polyacrylamide polymerization [5] | Initiates and accelerates gel formation; TEMED is toxic - handle with care |
Applications in Research and Drug Development
Analytical Applications
Denaturing gels serve as fundamental tools across diverse research applications:
Molecular Weight Determination: By comparing migration distances against standard markers of known molecular weight, researchers can accurately estimate the size of unknown proteins or nucleic acids [2]. The logarithmic relationship between molecular weight and migration distance enables precise sizing across broad molecular weight ranges.
Purity Assessment and Quality Control: Denaturing gels provide critical quality control for samples prepared for downstream applications like next-generation sequencing (NGS), where DNA fragment size distribution directly impacts sequencing success [8]. Broad or unexpected bands indicate sample contamination or degradation.
Western Blotting: As a prerequisite for immunoblotting, SDS-PAGE separates complex protein mixtures before transfer to membranes for specific antibody detection [2]. This application is fundamental to protein expression analysis in both basic research and biopharmaceutical development.
Protein Sequencing Preparation: Isolated protein bands from denaturing gels can be excised for subsequent proteolytic digestion and mass spectrometric analysis, enabling protein identification and characterization [2].
Specialized Research Applications
Beyond routine analysis, denaturing gels enable sophisticated experimental approaches:
Quantitative Interaction Analysis: Modified electrophoresis approaches using programmable DNA nanoswitches enable quantitative kinetic and thermodynamic characterization of molecular interactions, including complex multi-component systems [9]. This innovative application extends traditional gel electrophoresis from analytical separation to precise biomolecular interaction analysis.
Fragment Size Selection for NGS: Denaturing gels facilitate precise size selection of DNA fragments for NGS library preparation, a critical step in optimizing sequencing coverage and reducing bias [8]. Specialized software tools have been developed to analyze quasi-continuous fragment-size distributions from gel images, providing cost-effective quality control [8].
The relationship between gel type and application can be visualized as follows:
Decision Framework: Denaturing vs. Native Gels
Selection Criteria
Choosing between denaturing and native gel electrophoresis requires careful consideration of experimental objectives and biomolecule properties:
Structural Integrity Requirements: Native gels are imperative when preserving biological activity is essential, such as for enzyme function assays or studying protein-protein interactions [2]. Conversely, denaturing gels are appropriate when molecular weight determination or primary structure analysis is the primary goal.
Complexity of the System: For heterogeneous samples with multiple interacting components, native gels can resolve complex quaternary structures and binding states that would be disrupted under denaturing conditions [2] [6]. Denaturing gels simplify complex mixtures into constituent polypeptides or nucleic acid strands.
Downstream Applications: Consider subsequent analytical steps—native gels allow for functional analysis after separation, while denaturing gels are compatible with techniques like Western blotting and protein sequencing that require denatured samples [2].
Practical Considerations
Beyond theoretical considerations, practical factors influence gel selection:
Simplicity and Cost: Native gels are generally simpler and cheaper to run since they require fewer additives and specialized reagents [2]. This makes them attractive for initial characterization studies or high-throughput screening applications.
Resolution Requirements: Denaturing gels typically provide superior resolution for complex protein mixtures due to the uniform charge-to-mass ratio and elimination of structural heterogeneity [5]. The stacking effect in discontinuous buffer systems further enhances resolution by concentrating samples into sharp bands before entry into the separating gel [5].
Compatibility with Molecular Standards: Denaturing gels enable accurate molecular weight determination using standardized protein or nucleic acid ladders, while migration in native gels depends on multiple factors beyond size alone [2] [6].
Denaturing gel electrophoresis represents a powerful and versatile methodology for biomolecular separation that has maintained its fundamental importance amid rapidly evolving technological landscapes. By systematically unfolding complex tertiary structures into linear chains, denaturing gels reduce separation parameters primarily to molecular weight, enabling precise sizing, purity assessment, and preparation for downstream analytical techniques. The strategic decision between denaturing and native approaches depends critically on experimental objectives, with denaturing conditions optimal for molecular weight determination, Western blotting, and sequencing applications, while native conditions preserve structural integrity and biological function.
As research advances toward increasingly complex biomolecular systems, both denaturing and native gel electrophoresis continue to evolve, finding new applications in quantitative interaction analysis, nanotechnology, and quality control for next-generation sequencing. The enduring utility of these complementary techniques underscores their foundational role in the molecular life sciences and drug development pipelines, providing accessible, cost-effective, and information-rich separation platforms for researchers worldwide.
This technical guide explores the fundamental separation mechanisms in gel electrophoresis, focusing on the distinct principles of non-denaturing (native) and denaturing gel systems. For researchers and drug development professionals, the choice between these systems is critical, as it determines whether biomolecules are separated based on their native conformation (mass, charge, and shape) or their linear length (mass alone). This document provides a comparative analysis of these mechanisms, supported by structured data tables, experimental protocols, and visual workflows to inform experimental design in biomedical research.
Gel electrophoresis is a foundational technique in molecular biology and biochemistry for separating macromolecules such as proteins, DNA, and RNA. The core principle involves applying an electric field to move charged molecules through a porous gel matrix [10] [11]. The gel acts as a sieve, retarding the movement of molecules based on their physical properties [11]. The specific conditions under which electrophoresis is performed—particularly whether the gel environment is native or denaturing—dictate which physical properties of the molecule govern its mobility, thereby defining the analytical outcome [6] [2].
In a non-denaturing (native) gel, the separation mechanism is threefold, incorporating the mass, intrinsic charge, and shape of the biomolecule [6] [12]. This approach preserves the molecule's secondary, tertiary, and quaternary structures, allowing for the analysis of functional, folded states [6]. Conversely, in a denaturing gel, the separation mechanism is simplified to mass (or length) alone [2]. Denaturing conditions disrupt all higher-order structure, unfolding the molecule into a linear chain and standardizing its charge-to-mass ratio [6] [12]. This guide delves into the technical nuances of these two separation modes, providing a framework for researchers to make an informed choice based on their analytical goals.
Non-Denaturing Gels: Separation by Mass, Charge, and Shape
Core Separation Mechanism
Non-denaturing, or native, gel electrophoresis operates under conditions that meticulously preserve the natural structure of the biomolecule throughout the separation process. The gel matrix and running buffer lack chemical denaturants, allowing proteins to maintain their folded conformation and nucleic acids to retain their secondary structure, such as hairpins or double-stranded forms [2] [13]. Consequently, a molecule's electrophoretic mobility depends on a combination of its size (mass), its intrinsic net charge at the buffer pH, and its three-dimensional shape and cross-sectional area [6]. The net charge dictates the strength of the electrostatic pull from the electric field, while the mass and shape together determine the frictional drag experienced as the molecule navigates the gel's pores [12]. A smaller, more highly charged, and more compact molecule will migrate faster than a larger, less charged, or more extended one.
Key Applications in Research
The primary advantage of native gels is their ability to provide information about a biomolecule's state in its native environment. Key applications include:
- Analysis of Quaternary Structure and Complexes: Native PAGE is indispensable for studying protein-protein interactions and determining the stoichiometry of multi-subunit complexes [12]. Subunit interactions are retained, allowing researchers to analyze the native aggregation state [12].
- Functional Enzyme Isolation: Since the technique preserves the folded structure, many enzymes remain catalytically active after separation. This enables functional assays, zymography, and the isolation of active enzymes and isozymes [12].
- Study of DNA/RNA Secondary Structure: For nucleic acids, native gels can distinguish between linear, circular, and supercoiled conformations of the same molecule, as each has a different shape and thus migrates at a different rate [2].
- Protein-Ligand and Protein-Nucleic Acid Binding Studies: The mobility shift observed when a ligand binds to a protein or protein to DNA can be used to analyze binding interactions without disrupting the complex.
Denaturing Gels: Separation by Mass Alone
Core Separation Mechanism
Denaturing gel electrophoresis is designed to dismantle the native structure of biomolecules, simplifying the separation to a single parameter: mass or linear length. For proteins, this is most commonly achieved through Sodium Dodecyl Sulfate Polyacrylamide Gel Electrophoresis (SDS-PAGE) [12]. The sample is heated in a buffer containing SDS (an anionic detergent) and a reducing agent (like DTT or β-mercaptoethanol) [12]. SDS binds uniformly to the protein backbone, conferring a constant negative charge that masks the protein's intrinsic charge [12]. Meanwhile, the reducing agent breaks disulfide bonds, dismantling tertiary and quaternary structures [12]. The result is a solution of polypeptide chains that are linear, rod-like, and possess a uniform charge-to-mass ratio [12]. Under these conditions, electrophoretic mobility is determined solely by molecular weight, with smaller polypeptides migrating faster than larger ones [12].
For nucleic acids, denaturation is typically accomplished using urea [6] [2] or a combination of DMSO and glyoxal [2]. These agents break the hydrogen bonds that form secondary structures, forcing DNA or RNA into single-stranded, random coil conformations. Like SDS-treated proteins, these denatured nucleic acids have a charge-to-mass ratio determined solely by their sugar-phosphate backbone, allowing separation based strictly on the number of nucleotides (length) [6] [13].
Key Applications in Research
The power of denaturing gels lies in their simplicity and precision for specific analytical tasks:
- Molecular Weight Determination: SDS-PAGE is the standard method for estimating the molecular weight of unknown proteins by comparing their migration to a ladder of proteins with known masses [12].
- Assessing Purity and Integrity: Denaturing gels are ideal for establishing the purity of a protein sample or checking the integrity of nucleic acid extracts (e.g., RNA integrity), as they separate molecules based solely on size and can reveal contaminants or degradation products [2] [12].
- Preparative Steps for Downstream Analysis: Techniques like Western blotting, protein sequencing, and mass spectrometry often require proteins to be denatured, making SDS-PAGE an essential first step [2] [12].
- High-Resolution Nucleic Acid Separation: Denaturing polyacrylamide gels can achieve single-base-pair resolution, making them crucial for sequencing and analyzing small nucleic acid fragments [14].
Comparative Analysis and Selection Guidelines
Direct Mechanism Comparison
The table below provides a direct comparison of the separation characteristics of native and denaturing gel systems.
Table 1: Comparative Analysis of Native vs. Denaturing Gel Separation Mechanisms
| Feature | Non-Denaturing (Native) Gels | Denaturing Gels |
|---|---|---|
| Separation Basis | Mass, intrinsic charge, and shape/cross-sectional area [6] | Molecular mass (or length) alone [6] [2] |
| Structural Analysis | Primary, secondary, tertiary, and quaternary structure [6] | Primary structure only [6] |
| Biomolecule State | Folded, in native conformation [2] [12] | Unfolded, linearized chains [6] [2] |
| Charge Profile | Native charge at buffer pH [12] | Masked by SDS (proteins) or uniform backbone (nucleic acids) [12] |
| Key Reagents | Non-denaturing, non-reducing buffers [12] | SDS, urea, DTT, β-mercaptoethanol [6] [12] |
| Functional Activity | Often preserved post-separation [12] | Destroyed [12] |
Gel Selection Guidelines for Experimental Goals
Choosing the correct gel type is paramount to experimental success. The following decision workflow and table outline the optimal choice based on common research objectives.
Figure 1: A decision workflow to guide researchers in selecting between native and denaturing gel systems based on their primary experimental objective.
Table 2: Experimental Goals and Recommended Gel Types
| Experimental Goal | Recommended Gel Type | Rationale |
|---|---|---|
| Determine protein aggregation state or quaternary structure [12] | Native | Preserves subunit interactions and complex size/shape. |
| Isolate an enzyme for functional activity assays [12] | Native | Maintains folded, active conformation. |
| Study protein-DNA/RNA binding interactions [2] | Native | Binding events alter the mass/charge/shape complex, shifting mobility. |
| Estimate protein molecular weight [12] | Denaturing (SDS-PAGE) | Mobility depends solely on polypeptide chain length. |
| Establish protein sample purity or nucleic acid integrity [2] [12] | Denaturing | Separates contaminants and degradation products by size. |
| Prepare samples for Western blotting or protein sequencing [12] | Denaturing | Downstream techniques often require denatured, linearized proteins. |
| Separate nucleic acids with single-base resolution [14] | Denaturing | Eliminates conformational heterogeneity, separating by length only. |
Practical Implementation: Gel Types and Specifications
Polyacrylamide Gel Formulations
Polyacrylamide gels, formed from the chemical polymerization of acrylamide and bis-acrylamide, offer highly tunable pore sizes and superior resolution [14]. The gel percentage (%T) must be matched to the size of the target analyte.
Table 3: Recommended Polyacrylamide Gel Percentages for Optimal Separation
| Gel Type | % Acrylamide | Optimal Separation Range | Typical Application |
|---|---|---|---|
| Non-Denaturing | 3.5% | 100 - 1,000 bp [14] | Large dsDNA fragments |
| 5.0% | 80 - 500 bp [14] | Medium dsDNA fragments | |
| 8.0% | 60 - 400 bp [14] | Small dsDNA fragments | |
| 12.0% | 50 - 200 bp [14] | Very small dsDNA fragments | |
| Denaturing | 5.0% | 70 - 400 bases [14] | Medium ssDNA/RNA |
| 8.0% | 30 - 200 bases [14] | Small ssDNA/RNA | |
| 12.0% | 20 - 100 bases [14] | Oligonucleotides | |
| 15.0% | 10 - 50 bases [14] | Short oligonucleotides |
Safety Note: Unpolymerized acrylamide is a potent neurotoxin. Handling of powdered acrylamide requires appropriate personal protective equipment (PPE) including gloves and a mask. Using pre-made acrylamide solutions or pre-cast gels is highly recommended to minimize exposure risk [13].
Agarose Gel Formulations
Agarose, a polysaccharide derived from seaweed, forms gels via thermal setting and is generally non-toxic and easy to handle [14] [11]. It is ideal for separating larger nucleic acids.
Table 4: Recommended Agarose Gel Percentages for DNA Separation
| % Agarose | Optimal Separation Range (bp) |
|---|---|
| 0.5% | 2,000 - 50,000 [14] |
| 0.7% | 800 - 12,000 [14] |
| 1.0% | 500 - 10,000 [14] |
| 1.2% | 400 - 7,000 [14] |
| 1.5% | 200 - 3,000 [14] |
| 2.0% | 100 - 2,000 [14] |
| 3.0% | 25 - 1,000 [14] |
The Scientist's Toolkit: Essential Reagents and Materials
Successful gel electrophoresis relies on a suite of specific reagents, each serving a critical function in the preparation, separation, and visualization of samples.
Table 5: Essential Research Reagent Solutions for Gel Electrophoresis
| Reagent/Material | Function | Key Considerations |
|---|---|---|
| Acrylamide/Bis-acrylamide | Forms the cross-linked polymer matrix for PAGE [14]. | Neurotoxic in monomeric form; use pre-made solutions for safety [13]. |
| Agarose | Forms the thermo-reversible hydrogel matrix for agarose gels [14]. | Low melting point (LMP) agarose allows gentle extraction of intact nucleic acids [14]. |
| Ammonium Persulfate (APS) | Initiator for acrylamide polymerization [14]. | Use fresh aliquots stored at -20°C for efficient and complete polymerization [13]. |
| TEMED | Catalyst for acrylamide polymerization [14]. | Works with APS to accelerate the radical polymerization reaction. |
| SDS (Sodium Dodecyl Sulfate) | Anionic detergent that denatures proteins and confers uniform negative charge [12]. | Critical for SDS-PAGE; disrupts hydrophobic interactions and masks native charge. |
| Urea | Denaturing agent that disrupts hydrogen bonds in nucleic acids and proteins [6] [2]. | Used in denaturing PAGE to keep nucleic acids single-stranded. |
| DTT/β-Mercaptoethanol | Reducing agents that break disulfide bonds in proteins [12]. | Essential for complete denaturation and linearization of proteins in SDS-PAGE. |
| TAE/TBE Buffer | Running buffer that carries current and maintains stable pH [13]. | TBE provides sharper bands for small DNA fragments; TAE is better for DNA recovery from gels [13]. |
| Ethidium Bromide/SYBR Safe | Fluorescent dyes that intercalate between DNA bases for visualization [13]. | Ethidium bromide is mutagenic; safer alternatives like SYBR Safe are recommended [13]. |
| Tracking Dye | Contains colored markers (e.g., bromophenol blue) to monitor run progress [13]. | Migrates at a known rate, providing an estimate of when to stop the run. |
The strategic decision to use a native or denaturing gel system is foundational to the successful separation and analysis of biomolecules. Native gels, which separate based on mass, charge, and shape, are the unequivocal choice for experiments focused on the functional, folded state of a molecule, including its enzymatic activity, quaternary structure, and interaction with other molecules. In contrast, denaturing gels, which separate based on mass alone, provide a simplified and highly effective means to determine molecular weight, assess purity, and prepare samples for downstream analytical techniques. By understanding these core separation mechanisms and applying the guidelines and data provided in this document, researchers can rationally select the optimal electrophoretic method to advance their scientific inquiries and drug development processes.
In the field of biomolecular research, gel electrophoresis stands as a fundamental technique for separating and analyzing proteins and nucleic acids. The critical choice between denaturing and non-denaturing (native) gel systems fundamentally shapes experimental outcomes and data interpretation. This technical guide provides an in-depth examination of the three primary chemical agents—sodium dodecyl sulfate (SDS), reducing agents, and urea—that enable denaturing electrophoresis. Within the context of a broader research framework on choosing appropriate gel systems, understanding the specific mechanisms and applications of these chemicals is paramount for designing rigorous experiments, particularly in drug development where characterizing therapeutic molecules like proteins and oligonucleotides requires precise conditions [15]. This whitepaper delineates their distinct molecular mechanisms, experimental protocols, and appropriate applications to equip researchers with the knowledge necessary to select optimal conditions for their specific experimental goals, whether for protein analysis, nucleic acid separation, or quality control of biopharmaceuticals.
Fundamental Concepts: Denaturing vs. Non-Denaturing Gels
The core distinction in gel electrophoresis lies in whether the native structure of the biomolecule is preserved during analysis. Denaturing gels are run under conditions that disrupt the natural secondary, tertiary, and quaternary structures of proteins or the secondary structure of nucleic acids. These conditions unfold the molecules into linear chains, meaning their migration through the gel matrix depends primarily on their molecular mass and, with modifications like SDS-coating, can be made dependent on molecular mass alone [2] [6]. In contrast, non-denaturing gels (native gels) maintain the molecule's structure as it exists in its native state. Separation in native gels depends not only on molecular mass and intrinsic charge but also on the overall bulk, shape, and cross-sectional area of the macromolecule [2] [6]. This allows for the analysis of all four levels of biomolecular structure and is crucial for studying functional complexes, enzymatic activity, and binding interactions [6].
The decision to use one system over the other is driven by the experimental objective. Table 1 outlines the primary applications for each gel type.
Table 1: Guidelines for Selecting Gel Conditions Based on Experimental Goals
| Application | Recommended Gel Type |
|---|---|
| Isolating Enzymes or Studying Binding in Proteins [2] | Non-Denaturing Gel |
| Determining Protein Hierarchical State (e.g., circular vs. linear DNA) [2] | Non-Denaturing Gel |
| Teasing Apart Macromolecular Complexes with Quaternary Structure [2] | Non-Denaturing Gel |
| Western Blotting [2] | Denaturing Gel |
| Establishing Sample Purity Based on Molecular Weight [2] | Denaturing Gel |
| Protein Sequencing [2] | Denaturing Gel |
| Separating Molecules Based Solely on Mass [2] | Denaturing Gel |
The following workflow diagram illustrates the critical decision points when choosing between denaturing and non-denaturing gel systems for an experiment.
Detailed Analysis of Denaturing Agents
Sodium Dodecyl Sulfate (SDS)
Sodium Dodecyl Sulfate (SDS) is an ionic detergent and is the cornerstone of SDS-PAGE, the most common method for denaturing protein electrophoresis. Its mechanism of action is two-fold. First, SDS binds to the hydrophobic regions of proteins, effectively masking their intrinsic charge. SDS molecules bind to proteins in a constant mass ratio of approximately 1.4 μg SDS per 1.0 μg protein, conferring a uniform negative charge per unit mass [16]. Second, it disrupts nearly all non-covalent interactions—specifically hydrogen bonds and hydrophobic interactions—causing the protein to unfold into a linear chain [17]. It is critical to note that SDS does not break covalent disulfide bonds [17]. The result is that proteins separated on an SDS-polyacrylamide gel migrate based almost exclusively on their molecular weight, allowing for accurate size determination [2].
Reducing Agents
Reducing agents are specifically designed to break disulfide bonds (-S-S-), which are covalent bonds that stabilize the three-dimensional structure of many proteins [17] [18]. The reduction of these bonds is often necessary to fully unfold proteins that contain them. Commonly used reducing agents include:
- Dithiothreitol (DTT) and β-mercaptoethanol (BME): These thiol-based reducing agents work by undergoing thiol-disulfide exchange reactions, reducing protein disulfide bonds to free thiol groups [18].
- Tris(2-carboxyethyl)phosphine (TCEP): A potent, odor-free, and more stable alternative to DTT and BME. A key advantage of TCEP is that it is thiol-free, which prevents its reoxidation and makes it suitable for reactions where thiols might interfere [18].
In a typical denaturing SDS-PAGE protocol, SDS and a reducing agent like DTT are used in concert. The SDS denatures the non-covalent structure, while the reducing agent cleaves the disulfide bonds, resulting in a fully unfolded, linear polypeptide chain.
Urea
Urea is a potent protein denaturant that operates through a different mechanism. It acts primarily by disrupting hydrogen bonds and, to a lesser extent, hydrophobic interactions [17]. Urea is a polar molecule that integrates into the water structure and forms hydrogen bonds with the peptide backbone and polar side chains, effectively competing with the intramolecular hydrogen bonds that stabilize the protein's native structure [17]. This leads to the unfolding of the protein molecule. Urea is commonly used at high concentrations (e.g., 6-8 M) in gel electrophoresis to denature proteins, and it is also frequently employed for nucleic acid denaturation [2] [16]. A critical consideration when using urea is the potential for carbamylation, where isocyanic acid (a decomposition product in equilibrium with urea solutions) can modify lysine residues and protein N-termini. This can be mitigated by using fresh urea solutions, adding scavengers, or using urea for the shortest time possible [16].
Table 2 provides a comparative summary of the mechanisms, strengths, and limitations of these key denaturing agents.
Table 2: Comparative Analysis of Key Denaturing Agents
| Agent | Primary Mechanism of Action | Key Interactions Disrupted | Advantages | Limitations & Considerations |
|---|---|---|---|---|
| SDS | Binds protein backbone; confers negative charge. | Hydrophobic interactions, Hydrogen bonds [17]. | Uniform charge-to-mass ratio; ideal for molecular weight determination [2]. | Does not break disulfide bonds [17]; can interfere with enzyme function. |
| Reducing Agents (DTT, TCEP) | Thiol-disulfide exchange (DTT) or direct reduction (TCEP). | Covalent Disulfide bonds [18]. | TCEP is odor-free, more stable, and thiol-free [18]. | DTT/BME can oxidize over time; necessary for complete unfolding of disulfide-linked proteins. |
| Urea | Forms H-bonds with protein backbone; disrupts water structure. | Hydrogen bonds, Hydrophobic interactions [17]. | Effective for proteins and nucleic acids; useful for solubilizing hydrophobic proteins [16]. | Forms cyanate ions that can cause protein carbamylation; solution stability is time-sensitive [16]. |
Experimental Protocols and Methodologies
Standard SDS-PAGE Protocol for Denaturing Protein Electrophoresis
The following protocol is adapted for pre-cast Tris-Glycine gels using a standard mini-gel system [7].
- Gel Preparation: Remove a pre-cast Tris-Glycine gel from refrigeration and bring to room temperature. Rinse the gel cassette with deionized water, peel the tape from the bottom, and gently remove the comb in one smooth motion. Rinse the sample wells with 1X SDS Running Buffer [7].
- Sample Preparation:
- Mix the protein sample with an equal volume of 2X Tris-Glycine SDS Sample Buffer to achieve a 1X final concentration.
- For reduced samples, add a reducing agent (e.g., DTT or TCEP) to a final concentration of 1X immediately before heating [7].
- Heat the samples at 85°C for 2 minutes to denature the proteins. Do not heat samples for native electrophoresis. Centrifuge briefly to bring down condensation [7].
- Electrophoresis Setup: Place the gel cassette in the electrophoresis chamber. Fill the inner (upper) and outer (lower) chambers with 1X Tris-Glycine SDS Running Buffer. Load the prepared samples and an appropriate protein molecular weight marker into the wells [7].
- Electrophoretic Run: Run the gel at a constant voltage of 125 V for approximately 90 minutes, or until the bromophenol blue tracking dye front reaches the bottom of the gel. The current should start at 30-40 mA per gel and end at 8-12 mA [7].
- Post-Run Analysis: After electrophoresis, carefully open the cassette using a gel knife. The gel can then be processed for staining (e.g., Coomassie Blue or silver stain) or transferred to a membrane for western blotting [7].
Critical Considerations for Sample Integrity
Sample preparation is a critical step where artifacts can be introduced. Key pitfalls and their solutions include:
- Protease Activity: Proteases in the sample can remain active in SDS sample buffer at room temperature. To prevent protein degradation, heat samples immediately after adding them to the sample buffer. A control experiment can involve comparing a sample heated immediately versus one left at room temperature for 2-4 hours before heating [16].
- Asp-Pro Bond Cleavage: Heating proteins at 100°C for extended periods can cleave acid-labile Asp-Pro bonds. Heating at 75°C for 5 minutes is often sufficient for denaturation while avoiding this specific cleavage [16].
- Keratin Contamination: Contamination from skin and hair (keratin) is a common artifact, visible in sensitive stains. Always wear gloves, and use aliquoted, stored sample buffer to minimize contamination. Running a sample buffer-only control can help identify this issue [16].
- Insufficient SDS Ratio: An inadequate sample buffer-to-protein ratio can lead to incomplete denaturation and skewed results. A ratio of 3:1 (SDS to protein) is recommended to ensure an excess of SDS [16].
The Scientist's Toolkit: Essential Reagents for Denaturing Electrophoresis
Table 3: Key Research Reagent Solutions for Denaturing Gel Electrophoresis
| Reagent | Function | Key Characteristics |
|---|---|---|
| SDS (Sodium Dodecyl Sulfate) | Ionic detergent that denatures proteins and confers a uniform negative charge. | Essential for SDS-PAGE; disrupts hydrophobic interactions and H-bonds [17]. |
| TCEP (Tris(2-carboxyethyl)phosphine) | Reduces disulfide bonds. | Thiol-free, odor-free, and more stable than DTT; ideal for stable reduction [18]. |
| DTT (Dithiothreitol) | Reduces disulfide bonds. | Common thiol-based reducing agent; requires fresh preparation or aliquoting [18]. |
| Urea | Denatures proteins and nucleic acids by disrupting hydrogen bonds. | Used at high concentrations (e.g., 8 M); effective for solubilizing hydrophobic proteins [16] [18]. |
| Tris-Glycine SDS Sample Buffer | Ready-to-use buffer for denaturing protein samples. | Contains SDS, buffer, and tracking dye; simplifies sample preparation [7]. |
| Acrylamide/Bis-Acrylamide | Forms the cross-linked matrix of polyacrylamide gels. | Pore size is determined by the total concentration (%T); a neurotoxin in its monomeric form [14]. |
| Agarose | Polysaccharide polymer used for nucleic acid gel matrices. | Separates larger DNA/RNA fragments (0.1-25 kb); pore size controlled by gel percentage [14]. |
The strategic selection of denaturing agents—SDS, reducing agents, and urea—is a foundational decision that directly determines the success of gel electrophoresis experiments. SDS provides uniform charge and disrupts non-covalent interactions, reducing agents specifically target stable disulfide bridges, and urea effectively dismantles hydrogen bonding networks. Their combined and individual use allows researchers to tailor the level of denaturation to their specific needs, from determining simple molecular weight to analyzing complex structural forms. By understanding their distinct mechanisms, adhering to robust protocols that guard against common artifacts, and selecting the appropriate reagents from the available toolkit, scientists and drug development professionals can generate reliable, reproducible, and interpretable data, thereby advancing research and therapeutic development.
Practical Applications: Choosing the Right Gel for Your Experimental Goals
Native gel electrophoresis serves as a critical tool for researchers studying proteins in their biologically active states. Unlike denaturing techniques that dismantle protein structure, native methods preserve macromolecular complexes, enzymatic activity, and higher-order assemblies, providing unique insights into protein function that would otherwise be lost. This technical guide examines the core applications, methodological considerations, and practical protocols for implementing native gel electrophoresis in research and drug development. Within the broader context of choosing between denaturing and non-denaturing gel systems, we demonstrate how native gels enable the characterization of enzymatically active complexes, analysis of protein-protein interactions, and identification of aggregation states relevant to disease pathology and therapeutic development.
Native gel electrophoresis represents a family of techniques that separate proteins based on their intrinsic charge, size, and shape under non-denaturing conditions, preserving their tertiary and quaternary structures [19]. The fundamental principle distinguishing native from denaturing electrophoresis lies in the absence of sodium dodecyl sulfate (SDS) and reducing agents that would otherwise dismantle non-covalent interactions and disulfide bonds [19]. This preservation is crucial for investigating biologically relevant protein states, as most proteins function as part of larger complexes rather than as isolated polypeptides [20].
The separation mechanism in native gels depends on both the protein's net charge at the running pH and its ability to migrate through the gel matrix via molecular sieving [19]. Unlike SDS-PAGE, where migration correlates primarily with polypeptide molecular weight, native separation reflects the combined effects of charge, size, and shape of the intact macromolecular assembly [19]. This complexity enables researchers to probe protein function, interaction networks, and assembly pathways that remain inaccessible to denaturing methods.
Core Applications of Native Gels
Analysis of Enzyme Complexes and Activity
Native gel electrophoresis uniquely enables the study of enzymatically active complexes directly within the gel matrix. This application is particularly valuable for investigating mitochondrial oxidative phosphorylation (OXPHOS) complexes, which consist of five multimeric enzyme complexes embedded in mitochondrial cristae membranes [21] [22]. Blue-native polyacrylamide gel electrophoresis (BN-PAGE) and clear-native PAGE (CN-PAGE) have become indispensable techniques for resolving these hydrophobic enzyme systems while maintaining their catalytic function [21] [23] [22].
After electrophoretic separation, specific in-gel activity staining protocols allow direct visualization of functional complexes. For example, Complex I (NADH:ubiquinone oxidoreductase) activity can be detected using NADH and nitroblue tetrazolium, while Complex IV (cytochrome c oxidase) activity is visualized via cytochrome c oxidation coupled to diaminobenzidine staining [21] [22]. A key advantage of CN-PAGE over BN-PAGE for these applications is the absence of residual Coomassie blue dye, which can interfere with activity staining results [21] [22]. These approaches have proven instrumental for identifying pathological mechanisms in patients with monogenetic OXPHOS disorders and for studying assembly pathways of respiratory chain complexes [22].
Table 1: Enzyme Complexes Amenable to Native Gel Analysis
| Enzyme Complex | Detection Method | Key Applications | Limitations |
|---|---|---|---|
| Complex I (NADH dehydrogenase) | NADH/NBT reduction assay | Assembly analysis, mitochondrial disorders | Requires specific staining conditions |
| Complex II (Succinate dehydrogenase) | Succinate/PMS/NBT assay | Metabolic capacity assessment | May detect partial assemblies |
| Complex IV (Cytochrome c oxidase) | Cytochrome c/DAB oxidation | Respiratory chain function | Comparative insensitivity in-gel [22] |
| Complex V (ATP synthase) | ATP-dependent lead phosphate precipitation | Energy transduction studies | Enhancement step improves sensitivity [22] |
| Halide Methyltransferase | Alkyltransferase activity assay | Enzyme engineering, substrate preference | Requires specific substrates [24] |
| Phytase | Phosphate release assays | pH activity profiling, engineering | Neutral pH activity detection [24] |
Characterization of Protein Complexes and Supercomplexes
Beyond individual enzymes, native gels excel at resolving higher-order assemblies including respiratory supercomplexes (respirasomes) consisting of Complexes I, III, and IV [21] [22]. The choice of detergent during sample preparation determines whether individual complexes or supercomplexes are preserved. While n-dodecyl-β-d-maltoside (DDM) solubilizes membranes while maintaining individual OXPHOS complexes, the milder detergent digitonin preserves supercomplex interactions [21] [22]. This capability has revolutionized our understanding of mitochondrial organization, revealing how respiratory complexes form functional units within cristae membranes rather than existing as isolated entities.
The two-dimensional BN/SDS-PAGE technique further extends these analyses by combining native separation in the first dimension with denaturing separation in the second dimension [21] [22] [20]. This approach reveals the subunit composition of each complex, identifies assembly intermediates, and detects pathological alterations in protein complex biosynthesis. Such detailed characterization is invaluable for drug development targeting multi-protein complexes, as it enables researchers to monitor how therapeutic interventions affect complex assembly, stability, and composition.
Investigation of Protein Aggregation States
Native gels provide critical insights into protein aggregation phenomena relevant to numerous diseases. Unlike denaturing gels that would dissociate non-covalent aggregates, native systems preserve these higher-order assemblies, allowing researchers to distinguish oligomers, aggregates, and functional complexes [25]. For example, native Tris-glycine polyacrylamide gels with 4.5% stacking and 7.5% separation gels have been used to detect BiP oligomers in mammalian cell lysates, revealing chaperone assembly states critical for protein folding homeostasis [25].
These applications extend to neurodegenerative diseases characterized by protein aggregation, where native gels can help identify early oligomeric species potentially more toxic than larger fibrillar aggregates. The technique also supports biopharmaceutical development by characterizing therapeutic protein products, detecting unwanted aggregates that could affect efficacy or immunogenicity, and ensuring product quality throughout development and manufacturing.
Methodological Approaches and Experimental Design
Native Gel Systems: BN-PAGE, CN-PAGE, and Native-PAGE
Several specialized native gel systems have been developed to address different research questions:
Blue-Native PAGE (BN-PAGE) utilizes the anionic dye Coomassie blue G-250, which binds to hydrophobic protein surfaces and imposes a negative charge shift [21] [22] [20]. This charge shift forces even basic proteins to migrate toward the anode at pH 7.0 while preventing aggregation of hydrophobic proteins during electrophoresis [21] [22]. First described by Schägger and Von Jagow in 1991, BN-PAGE has become the gold standard for analyzing mitochondrial membrane protein complexes [21] [22] [20]. The protocol typically involves solubilizing membrane proteins with mild nonionic detergents like n-dodecyl-β-d-maltoside in the presence of 6-aminocaproic acid, which provides a zero net charge at pH 7.0 and supports extraction without affecting electrophoresis [21] [22].
Clear-Native PAGE (CN-PAGE) replaces Coomassie blue with mixtures of anionic and neutral detergents in the cathode buffer to induce the necessary charge shift [21] [22]. These mixed micelles enhance protein solubility and electrophoretic migration similar to Coomassie blue, but avoid blue dye interference during downstream in-gel enzyme activity staining [21] [22]. CN-PAGE typically offers higher resolution than BN-PAGE but may not be suitable for all protein complexes.
Standard Native-PAGE systems, such as Tris-glycine native gels, maintain proteins in their native state without additional charge-shifting agents [25]. These systems are simpler to implement but may have limitations with very hydrophobic or basic proteins. The separation depends on the intrinsic charge of the proteins at the running pH, which must be carefully considered during experimental design.
Table 2: Comparison of Native Gel Electrophoresis Techniques
| Parameter | BN-PAGE | CN-PAGE | Standard Native-PAGE |
|---|---|---|---|
| Charge modifier | Coomassie blue G-250 | Mixed detergent micelles | None |
| Resolution | High | Higher | Moderate |
| Compatibility with activity staining | Limited due to dye interference | High | High |
| Best for | Membrane protein complexes, initial characterization | High-resolution separation, activity assays | Soluble complexes, simple applications |
| Typical gel composition | 3-12% or 4-16% linear gradient | 3-12% or 4-16% linear gradient | Variable (e.g., 7.5% separation gel) |
| Sample buffers | 50 mM Bis-Tris, 0.75 M 6-aminocaproic acid, pH 7.0 [20] | Detergent-based cathode buffers | Tris-glycine, pH ~8.8 [25] |
Gel Matrix Selection: Polyacrylamide vs. Polysaccharide
The choice of gel matrix significantly impacts separation performance and application suitability:
Polyacrylamide gels offer smaller pore sizes (e.g., 70-130 nm for 3.5-10.5% gels) and are ideal for separating most protein complexes [19]. The cross-linked structure formed by polyacrylamide chains and bis-acrylamide creates a molecular sieving environment that separates complexes based on size and shape [19]. Linear gradient gels (e.g., 3-12% or 4-16%) provide superior resolution across a broad molecular weight range compared to single-percentage gels [21] [23].
Agarose gels, composed of polysaccharide chains that form α-helical bundles creating a network structure, have larger pore sizes (0.05-0.1 μm) [19]. These are particularly suitable for very large complexes, aggregates, or nucleic acid-protein interactions. Agarose offers advantages for native separation of large macromolecular assemblies that would be excluded from polyacrylamide matrices.
Critical Experimental Parameters
Successful native gel electrophoresis requires careful optimization of several parameters:
Detergent selection dictates which complexes remain intact. Mild nonionic detergents like digitonin preserve weak interactions and supercomplexes, while slightly harsher detergents like DDM maintain individual complexes but may disrupt superassemblies [21] [22].
Buffer composition must maintain appropriate pH and ionic strength to preserve native structures while supporting electrophoretic separation. Bis-Tris-based buffers at pH 7.0 are commonly used in BN-PAGE and CN-PAGE, while Tris-glycine at higher pH (~8.8) works for standard native-PAGE [20] [25]. The zwitterionic salt 6-aminocaproic acid is often included to support solubilization without interfering with electrophoresis [21] [22].
Sample preparation techniques vary by starting material. For mitochondrial studies, isolated mitochondria are typically solubilized in 0.75 M 6-aminocaproic acid, 50 mM Bis-Tris (pH 7.0) with added detergent (1-2% DDM for individual complexes or 2-4% digitonin for supercomplexes) [20]. After 30-minute incubation on ice, insoluble material is removed by centrifugation at 72,000 × g before adding Coomassie blue dye (for BN-PAGE) or loading directly (for CN-PAGE).
Experimental Workflows and Visualization
Standard BN-PAGE Protocol
The following workflow outlines a typical BN-PAGE procedure for analyzing mitochondrial complexes:
Downstream Applications and Two-Dimensional Analysis
Following native separation, multiple downstream applications enable comprehensive characterization:
In-gel activity staining utilizes specific substrates and colorimetric reactions to detect functional complexes directly within the gel matrix. For example, Complex V activity can be enhanced through a simple modification that markedly improves sensitivity [22].
Western blot analysis after native transfer to PVDF membranes enables specific detection of complex components using antibodies. Fully submerged electroblotting systems at 150 mA for 1.5 hours using Tris-glycine transfer buffer with 10% methanol are recommended [20].
Two-dimensional BN/SDS-PAGE provides the most comprehensive analysis by combining native separation in the first dimension with denaturing separation in the second dimension. After BN-PAGE, individual lanes are excised, soaked in SDS denaturing buffer, and placed on top of SDS-PAGE gels for orthogonal separation [20]. This reveals subunit composition, identifies assembly intermediates, and detects pathological alterations in complex biosynthesis.
Essential Reagents and Materials
Table 3: Research Reagent Solutions for Native Gel Electrophoresis
| Reagent/Material | Function | Example Specifications |
|---|---|---|
| n-dodecyl-β-D-maltoside (DDM) | Mild nonionic detergent for solubilizing membrane complexes | 10% solution in water [20] |
| Digitonin | Very mild detergent for preserving supercomplexes | 5% (w/v) solution [23] |
| 6-Aminocaproic acid | Zwitterionic salt supporting solubilization | 0.75 M in 50 mM Bis-Tris, pH 7.0 [20] |
| Coomassie blue G-250 | Charge-shift dye for BN-PAGE | 5% solution in 0.5 M aminocaproic acid [20] |
| Bis-Tris | Buffer component for native conditions | 50 mM anode buffer, 15 mM cathode buffer [20] |
| Protease inhibitors | Prevent protein degradation during processing | 1 mM PMSF, 1 μg/mL leupeptin, 1 μg/mL pepstatin [20] |
| Linear gradient gels | Separation matrix for broad size range | 3-12% or 4-16% acrylamide [21] [23] |
| PVDF membrane | Transfer matrix for western blotting | 0.2 μm pore size [20] |
Native gel electrophoresis provides an indispensable toolkit for researchers investigating protein function in biologically relevant contexts. By preserving enzymatic activity, maintaining protein-protein interactions, and revealing aggregation states, these techniques offer insights fundamentally inaccessible to denaturing methods. Within the broader decision framework for choosing electrophoretic methods, native gels occupy the essential niche of functional proteomics—answering questions not just about what proteins are present, but how they assemble, interact, and function within the cell.
The continuing development of more sensitive detection methods, improved separation matrices, and enhanced compatibility with downstream analytical techniques ensures that native gel electrophoresis will remain a cornerstone technique for researchers and drug development professionals seeking to understand and manipulate complex biological systems at the molecular level.
In molecular biology and biochemistry, the choice between denaturing and non-denaturing (native) gel electrophoresis is fundamental and directly dictates the type of information an experiment can yield. Denaturing gel electrophoresis is a technique designed to disrupt the native structure of biomolecules—such as proteins and nucleic acids—unfolding them into linear chains. This process ensures that separation occurs primarily based on molecular weight, as the intrinsic charge and complex three-dimensional shape of the molecule are eliminated as factors [2] [6]. This stands in stark contrast to native gel electrophoresis, where the biomolecule's structure, charge, and cross-sectional area all influence its migration, providing information on the molecule's natural, folded state [2] [6].
The core thesis of this guide is that denaturing gels are the indispensable tool for experiments where the analytical goal requires the disruption of higher-order structure to assess linear length, molecular weight, or the composition of a complex protein mixture. The three primary applications that fulfill this criterion are accurate molecular weight determination, western blotting, and the assessment of protein sample purity. This technical guide will delve into the specific protocols and rationale for employing denaturing gels in these key research contexts, providing a clear framework for scientists and drug development professionals to inform their experimental design.
Key Applications and Experimental Protocols
Molecular Weight Determination
Principle and Rationale: For accurate molecular weight determination, denaturing gel electrophoresis is the method of choice. The foundation of this application is the complete denaturation of the protein sample, typically using Sodium Dodecyl Sulfate (SDS), in a technique known as SDS-Polyacrylamide Gel Electrophoresis (SDS-PAGE). SDS is an anionic detergent that binds to hydrophobic regions of proteins, coating them in a uniform negative charge. This action overwhelms the protein's intrinsic charge and, with the aid of heat and a reducing agent like Dithiothreitol (DTT) or 2-mercaptoethanol to break disulfide bonds, forces the protein to unfold into a linear polypeptide chain [26] [27]. Consequently, the charge-to-mass ratio becomes nearly identical for all proteins, and their migration through the polyacrylamide gel matrix depends almost exclusively on their molecular weight [2] [6]. Smaller proteins migrate faster and farther than larger ones, allowing for size-based separation [27].
Detailed Protocol:
- Sample Preparation: Protein samples are mixed with an SDS-containing loading buffer that includes a reducing agent (DTT or 2-mercaptoethanol) and glycerol for density. The mixture is then heated at 95-100°C for 5-10 minutes to ensure complete denaturation [26] [27].
- Gel Selection and Loading: A polyacrylamide gel is used, consisting of a stacking gel (pH ~6.8, lower acrylamide concentration) and a separating/resolving gel (pH ~8.8, higher acrylamide concentration). The percentage of acrylamide in the separating gel should be chosen based on the target protein's size (e.g., 8% for large proteins >150 kDa, 10-15% for proteins 10-150 kDa, and up to 20% for very small proteins) [27]. A molecular weight ladder (protein standard) containing proteins of known sizes must be loaded alongside the samples [27].
- Electrophoresis: The gel is immersed in a running buffer and an electric current is applied. The stacking gel allows the proteins to concentrate into sharp bands before entering the separating gel, where they are resolved by size. The gel is run until the dye front (bromophenol blue) approaches the bottom [26] [27].
- Visualization and Analysis: After electrophoresis, the gel is stained with a protein-specific stain (e.g., Coomassie Brilliant Blue, silver stain, or "fast stain" alternatives) to reveal the protein bands [28]. The distance migrated by the protein of interest is compared to the logarithmic plot of the molecular weight standard's migration to determine its apparent molecular weight.
Figure 1: SDS-PAGE workflow for determining protein molecular weight.
Western Blotting
Principle and Rationale: Western blotting is a quintessential application for denaturing gels, as it relies on the separation of proteins by size to identify a specific protein within a complex mixture using antibodies. The denaturing SDS-PAGE step is critical for this process for two main reasons. First, it linearizes the proteins, ensuring that antibodies can access epitopes that might otherwise be buried within the protein's native structure. Second, it normalizes the charge of all proteins, guaranteeing that separation is by molecular weight, which allows the researcher to verify the size of the immunoreactive band—a key control for specificity [26] [27]. A band appearing at the expected molecular weight strengthens the conclusion that the correct protein is being detected.
Detailed Protocol:
- Protein Separation via SDS-PAGE: The first step is identical to the molecular weight determination protocol. The protein sample is denatured and separated by SDS-PAGE as described above [26] [27].
- Electrotransfer: Following electrophoresis, the separated proteins are transferred from the gel onto a solid support membrane, typically Polyvinylidene Fluoride (PVDF) or nitrocellulose. This transfer is achieved by applying an electric field perpendicular to the gel and membrane, which drives the proteins out of the gel and onto the membrane. The membrane is placed between the gel and the positive electrode to facilitate the migration of the negatively charged proteins [26].
- Blocking and Antibody Incubation: The membrane is incubated in a blocking solution (e.g., 5% non-fat dry milk or BSA in TBST) to prevent non-specific binding of antibodies. The membrane is then probed with a primary antibody specific to the target protein, often incubated overnight at 4°C. After washing, a secondary antibody conjugated to an enzyme (e.g., Horseradish Peroxidase - HRP) or fluorophore and directed against the primary antibody is applied [26] [27].
- Detection: For enzyme-conjugated antibodies, the membrane is incubated with a chemiluminescent (ECL) substrate. The enzyme catalyzes a reaction that produces light, which is captured on X-ray film or by a digital imaging system. Fluorescently labeled antibodies can be detected directly with a compatible imager [26] [27].
Purity Assessment
Principle and Rationale: Denaturing gel electrophoresis (SDS-PAGE) is the most common analytical method for assessing the purity of a protein sample during and after purification [28]. By denaturing the sample, the technique disrupts all non-covalent interactions between different proteins or protein subunits. This ensures that any contaminating proteins will be separated from the protein of interest based on their individual molecular weights. A pure protein preparation will show a single, predominant band on a denaturing gel, while a contaminated sample will reveal additional bands of varying sizes and intensities [28]. This provides a gross quantitative assessment of impurities, as the thickness or intensity of a band corresponds to the amount of protein present [26].
Detailed Protocol: The protocol for purity assessment mirrors that of molecular weight determination.
- Sample Preparation and Denaturation: The protein sample, typically obtained from a purification step (e.g., chromatography), is denatured in SDS-sample buffer with a reducing agent and heat [28].
- Gel Electrophoresis: A relatively large amount of protein (e.g., 1-10 μg) is loaded onto an SDS-PAGE gel to enable the visualization of low-abundance impurities. The gel is run alongside a molecular weight marker.
- Staining and Analysis: The gel is stained with a sensitive protein stain. The resulting banding pattern is analyzed. A single, clean band at the expected molecular weight indicates high purity. Multiple bands suggest the presence of contaminants, protein degradation products, or alternatively folded or modified forms of the protein, which may exhibit different migration properties even under denaturing conditions [28].
The Scientist's Toolkit: Essential Reagents for Denaturing Gels
Table 1: Key reagents for denaturing gel electrophoresis and their functions.
| Reagent | Function | Key Considerations |
|---|---|---|
| SDS (Sodium Dodecyl Sulfate) | Denatures proteins by binding to hydrophobic regions; confers uniform negative charge. | Critical for linearizing proteins and separating by molecular weight alone [26] [27]. |
| Reducing Agents (DTT, β-mercaptoethanol) | Breaks disulfide bonds between cysteine residues, further unfolding proteins. | Essential for analyzing oligomeric proteins or those with complex tertiary structure [26] [27]. |
| Polyacrylamide Gel | Acts as a molecular sieve; separates proteins based on size. | Gel pore size (determined by % acrylamide) must be matched to target protein size [27]. |
| Molecular Weight Ladder | Provides a standard curve of proteins of known sizes for molecular weight estimation. | Essential for interpreting SDS-PAGE results for both size and purity [27]. |
| PVDF/Nitrocellulose Membrane | Solid support for immobilizing proteins after SDS-PAGE for Western blotting. | PVDF typically requires pre-wetting in methanol [26]. |
| Primary and Secondary Antibodies | Enable specific detection of the target protein in Western blotting. | Secondary antibody is conjugated to an enzyme (HRP) or fluorophore for detection [26] [27]. |
Decision Framework: Denaturing vs. Non-Denaturing Gels
The choice between denaturing and native gels is dictated by the experimental objective. The following table and diagram provide a clear framework for this decision.
Table 2: Comparison of denaturing vs. non-denaturing gel applications.
| Application | Denaturing Gel | Non-Denaturing (Native) Gel |
|---|---|---|
| Molecular Weight Determination | Yes (primary method) | No (migration depends on size, shape, and charge) |
| Western Blotting | Yes (standard method) | Rarely (can be used for detecting native epitopes) |
| Purity Assessment | Yes (standard method) | Yes (but reveals different information) |
| Protein-Protein / Protein-Ligand Interactions | No (disrupts interactions) | Yes (primary application) [2] |
| Enzymatic Activity Assays | No (denatures enzyme) | Yes (preserves native function) [2] |
| Analysis of Quaternary Structure | No (dissociates subunits) | Yes (maintains oligomeric state) [2] |
Figure 2: A decision guide for choosing between denaturing and non-denaturing gels.
Gel electrophoresis is a foundational technique in molecular biology and biochemistry, enabling the separation of macromolecules based on size, charge, and shape. The critical initial choice between denaturing and non-denaturing (native) gel systems fundamentally dictates the type of information obtained from an experiment [2] [12]. This choice hinges on whether the analyst wishes to preserve the native, functional state of the biomolecule or completely unfold it to analyze its primary structure and molecular weight.
In denaturing gel electrophoresis, powerful detergents and heating disrupt the native structure of proteins or nucleic acids. For proteins, sodium dodecyl sulfate (SDS) binds and linearizes the polypeptide chain, conferring a uniform negative charge and rendering separation dependent solely on molecular mass [2] [12]. For RNA, denaturants like formaldehyde or urea prevent the formation of secondary structures, allowing for accurate assessment of integrity and size [29]. In contrast, non-denaturing gel electrophoresis maintains the biomolecule's higher-order structure—its secondary, tertiary, and quaternary conformations [6]. Separation depends on a complex interplay of the molecule's intrinsic charge, size, and shape, preserving enzymatic activity and protein-protein interactions [12]. The decision tree below outlines the primary factors guiding the selection of an appropriate method.
Comparative Sample Preparation Protocols
The preparation of your sample is the most critical step in determining the success of your electrophoresis. The buffers and treatments used decisively dictate whether the native structure is preserved or completely unraveled. The following protocols detail the specific reagents and procedures for denaturing and non-denaturing protein sample preparation.
Denaturing (SDS-PAGE) Sample Preparation
Denaturing gel electrophoresis for proteins, commonly known as SDS-PAGE, aims to completely disrupt the protein's higher-order structure. The protocol relies on the synergistic action of a strong anionic detergent (SDS), a reducing agent, and heat to unfold the protein into a linear chain [7] [12].
Detailed Step-by-Step Protocol:
Mix Sample with Buffer: Combine your protein sample with an equal volume of 2X Tris-Glycine SDS Sample Buffer [7]. The final 1X buffer typically contains:
- SDS: Unfolds the protein and confers a uniform negative charge.
- Glycerol: Adds density to the solution for easy gel loading.
- Bromophenol Blue: A tracking dye to monitor electrophoresis progress.
- Tris-HCl: Provides a buffering environment.
Add Reducing Agent: To the mixture, add a reducing agent (e.g., Dithiothreitol (DTT) or β-mercaptoethanol) to a final concentration of 50 mM or 2.5%, respectively [7]. This step is critical for breaking disulfide bonds that stabilize tertiary and quaternary structures.
Heat Denaturation: Cap the tubes and heat the samples at 85°C for 2-5 minutes [7]. This heat treatment completes the denaturation process, ensuring all proteins are linearized. Avoid heating at 100°C as it can promote proteolysis [7].
Brief Centrifugation: After heating, briefly centrifuge the samples to collect all condensation from the tube walls before loading onto the gel.
- Important Note: For optimal results, do not run reduced and non-reduced samples in adjacent lanes on the same gel, as the reducing agent can carry over and affect neighboring samples [7].
Non-Denaturing (Native) Sample Preparation
Non-denaturing gel electrophoresis seeks to maintain the protein's native conformation, activity, and interactions. The sample preparation is deliberately gentle, omitting detergents and reducing agents, and avoiding heat [7] [12].
Detailed Step-by-Step Protocol:
Mix Sample with Buffer: Dilute your protein sample with an equal volume of 2X Tris-Glycine Native Sample Buffer [7]. This buffer is similar to the denaturing buffer but crucially contains no SDS or reducing agents. It typically consists of glycerol, a tracking dye, and a non-denaturing buffer like Tris-Glycine.
No Heating: Do not heat the samples [7]. Heating is a primary denaturation step and must be avoided to preserve the protein's native state. Keep the samples on ice or at 4°C until ready to load.
Brief Centrifugation: Centrifuge the samples briefly to ensure no air bubbles are present and the entire sample is at the bottom of the tube.
Load onto Gel: Load the samples directly onto the pre-cast native gel. The running buffer should also be free of SDS or other denaturants [7].
Table 1: Direct Comparison of Sample Preparation Components
| Component / Step | Denaturing (SDS-PAGE) Protocol | Non-Denaturing (Native) Protocol |
|---|---|---|
| Sample Buffer | Tris-Glycine SDS Sample Buffer [7] | Tris-Glycine Native Sample Buffer [7] |
| Detergent (SDS) | Present (linearizes proteins, imparts charge) [12] | Absent [12] |
| Reducing Agent (DTT/β-ME) | Required (breaks disulfide bonds) [7] | Absent (preserves disulfide bonds) [12] |
| Heat Treatment | Yes (85°C for 2-5 minutes) [7] | No (samples kept cool) [7] |
| Separation Basis | Molecular mass only [2] [12] | Size, shape, and intrinsic charge [2] [6] |
| Protein State | Unfolded, linearized, inactive [12] | Native, folded, potentially active [12] |
The Scientist's Toolkit: Essential Reagent Solutions
Successful gel electrophoresis relies on a set of key reagents, each performing a specific function in the process. The table below catalogs these essential materials.
Table 2: Key Research Reagent Solutions and Their Functions
| Reagent / Material | Function in Electrophoresis |
|---|---|
| SDS (Sodium Dodecyl Sulfate) | Anionic detergent that denatures proteins and confers a uniform negative charge, allowing separation by mass alone [12]. |
| DTT (Dithiothreitol) | Reducing agent that breaks disulfide bonds within and between protein subunits [7]. |
| Tris-Glycine Buffer | A discontinuous buffer system that creates a sharp stacking front for high-resolution protein separation [7]. |
| Agarose | A polysaccharide polymer from seaweed used to create gels with large pores for separating nucleic acids (50 bp to 25 kb) [14] [30]. |
| Polyacrylamide | A synthetic polymer that forms a tight, tunable mesh for high-resolution separation of proteins and small nucleic acids (<1 kb) [14] [30]. |
| Bis-Acrylamide | Cross-linking agent that, when polymerized with acrylamide, creates the porous gel matrix [14]. |
| Ethidium Bromide / GelRed | Nucleic acid intercalating dyes that fluoresce under UV light, enabling visualization of DNA/RNA bands in a gel [31] [32]. |
| Coomassie Blue | A dye that binds to proteins through ionic and Van der Waals interactions, staining them blue for visualization [33]. |
| Ammonium Persulfate (APS) & TEMED | Catalysts for the chemical polymerization reaction of acrylamide and bis-acrylamide into a polyacrylamide gel [14]. |
Application Scenarios and Decision Framework
The choice between denaturing and native methods is not arbitrary but is dictated by the specific biological question. Each method provides distinct information and is suited for different downstream applications.
Table 3: Guidance on Selecting the Appropriate Gel Method
| Application Goal | Recommended Method | Rationale |
|---|---|---|
| Determine protein molecular weight | Denaturing (SDS-PAGE) | SDS coating gives all proteins the same charge-to-mass ratio, so migration depends solely on size [12]. |
| Establish sample purity/integrity | Denaturing (SDS-PAGE) | Reveals the number of constituent polypeptide chains and potential degradation [2] [12]. |
| Prepare for Western Blotting | Denaturing (SDS-PAGE) | Antibodies for immunodetection often recognize linear epitopes that are exposed upon denaturation [2]. |
| Isolate an enzymatically active protein | Non-Denaturing (Native) | The gentle procedure preserves the protein's three-dimensional structure, which is essential for activity [2] [12]. |
| Study protein complexes & quaternary structure | Non-Denaturing (Native) | Maintains non-covalent interactions between protein subunits, allowing intact complexes to be analyzed [2] [12]. |
| Analyze protein oligomerization state | Non-Denaturing (Native) | Separation depends on the overall size and shape of the native protein or aggregate [12]. |
Concluding Remarks
The decision to use a denaturing or non-denaturing gel is a fundamental one that shapes the entire experimental workflow, from sample preparation to data interpretation. Denaturing SDS-PAGE is the unrivaled method for determining molecular weight, assessing purity, and preparing samples for techniques like western blotting, as it simplifies protein separation to a function of mass alone [12]. Conversely, non-denaturing PAGE is indispensable for experiments where biological function and higher-order structure are the subjects of interest, such as enzyme activity assays or the study of protein-protein interactions [2] [12].
By following the detailed protocols for sample preparation outlined in this guide and applying the strategic framework for method selection, researchers can ensure they choose the correct path for their specific research objectives, thereby guaranteeing robust, reliable, and meaningful results.
Gel electrophoresis remains a cornerstone technique in molecular biology and biochemistry laboratories worldwide, serving as an indispensable tool for the separation and analysis of charged molecules such as nucleic acids and proteins [30]. The fundamental principle of this technique relies on the differential migration of molecules through a porous gel matrix under the influence of an electric field, effectively separating them based on size, charge, and conformation. The fidelity and reproducibility of any electrophoretic experiment hinge critically on the appropriate selection of the gel matrix, a decision that directly impacts resolution, accuracy, and experimental efficiency [30].
Within the context of a broader thesis on choosing between denaturing and non-denaturing gels, understanding the intrinsic properties of the two primary gel matrices—agarose and polyacrylamide—becomes paramount. These matrices possess distinct physical and chemical characteristics that dictate their suitability for specific macromolecules and experimental objectives. Denaturing conditions, which disrupt the native structure of biomolecules, are frequently employed to ensure separation based solely on size, whereas non-denaturing conditions preserve biological activity and higher-order structures, enabling the study of molecular interactions and conformational states [34] [35]. This guide provides a detailed technical comparison of agarose and polyacrylamide gels, framing their selection within the critical context of resolution needs and experimental goals, to empower researchers, scientists, and drug development professionals in optimizing their electrophoretic workflows.
Fundamental Properties of Agarose and Polyacrylamide Gels
Agarose Gel Composition and Characteristics
Agarose is a natural polysaccharide polymer extracted from seaweed genera such as Gelidium and Gracilaria, consisting of repeated agarobiose (L- and D-galactose) subunits [36]. The gel matrix is formed through a physical process involving non-covalent association of linear polysaccharide chains. When heated and subsequently cooled, these chains form a three-dimensional lattice characterized by a relatively large and non-uniform pore size [30]. The pore size, while not precisely controllable, can be influenced by adjusting the agarose concentration, typically ranging from 0.5% to 3% [37]. Lower concentrations produce larger pores suitable for separating very large molecules, while higher concentrations yield smaller pores that provide better resolution for smaller macromolecules [30] [36].
One of the most significant advantages of agarose gels is their ease of preparation and non-toxic nature. Preparation simply involves dissolving the agarose powder in a boiling buffer, followed by pouring the molten solution into a mold and allowing it to cool and solidify [30] [36]. This process does not involve hazardous chemicals, making agarose gels safer and more convenient for standard laboratory workflows. The sieving action of an agarose gel is based on the movement of molecules through large, interconnected channels formed by the random bundling of agarose polymers [36].
Polyacrylamide Gel Composition and Characteristics
In contrast, polyacrylamide is a synthetic polymer formed through a chemical polymerization reaction between acrylamide monomers and a cross-linking agent, typically N,N'-methylenebisacrylamide (bis-acrylamide) [30]. In this process, acrylamide monomers form long chains, while bis-acrylamide connects these chains to create a stable, covalently linked network with a tight, highly-ordered three-dimensional mesh [30]. The key advantage of polyacrylamide gels lies in the precise control over their pore size, which can be finely tuned by adjusting the total monomer concentration (%T) and the cross-linker ratio (%C) [30]. A higher %T results in a denser matrix with smaller pores, offering superior resolution for smaller molecules.
A critical consideration when working with polyacrylamide gels is the handling of the unpolymerized acrylamide monomer, which is a potent neurotoxin [30]. Proper safety precautions, including the use of gloves, lab coats, and appropriate personal protective equipment, are absolutely essential during gel preparation. However, once polymerized, the polyacrylamide gel is stable and generally considered safe to handle [30]. The polymerization reaction requires a catalyst, such as ammonium persulfate (APS) and tetramethylethylenediamine (TEMED), making the preparation process more complex than that of agarose gels [30].
Comparative Analysis: Separation Principles and Applications
The distinct structural properties of agarose and polyacrylamide matrices directly determine the types of macromolecules they can effectively separate and their respective applications in molecular analysis.
Separation of Nucleic Acids
Agarose gels are the matrix of choice for separating large nucleic acid fragments. They are optimally suited for DNA fragments ranging from approximately 100 base pairs (bp) to 25 kilobase pairs (kb) and beyond [36] [38]. DNA molecules, with their uniform mass-to-charge ratio, migrate through the agarose matrix at a rate inversely proportional to the logarithm of their molecular weight, with smaller fragments moving faster than larger ones [36]. The leading model for this movement is "biased reptation," whereby the leading edge of the DNA molecule moves forward and pulls the rest of the molecule along [36]. The concentration of agarose is critical for achieving optimal separation: a 0.8% gel is commonly used for large DNA fragments (5-10 kb), while a 2% gel provides better resolution for smaller fragments (0.1-1 kb) [30]. For separating DNA fragments larger than 25 kb, specialized techniques like pulsed-field gel electrophoresis (PFGE) are employed, which involve periodically changing the direction of the electric field [36].
Polyacrylamide gels, with their smaller, uniform pores, provide much higher resolution for separating small nucleic acid fragments, typically those less than 1,000 bp [39] [38]. They are capable of resolving fragments that differ by as little as a single base pair, making them indispensable for applications such as DNA sequencing, analysis of oligonucleotides, and checking the efficiency of blunt-end ligation of linkers [30] [39].
Separation of Proteins and RNA
Polyacrylamide gels are the standard matrix for protein separation due to the tight, uniform pores that provide the high resolution necessary to separate proteins, which are generally much smaller than most DNA molecules [30]. The most common form is sodium dodecyl sulfate-polyacrylamide gel electrophoresis (SDS-PAGE), where the detergent SDS denatures proteins and imparts a uniform negative charge, ensuring separation based almost exclusively on molecular mass [30]. For applications requiring the study of proteins in their native, folded state, non-denaturing or native PAGE is used instead [30]. The high resolution of polyacrylamide gels allows for the separation of proteins differing in molecular weight by just a few thousand Daltons [30].
The electrophoresis of RNA can be performed on either matrix, depending on the experimental goal. Denaturing agarose gels are recommended for assessing RNA integrity and yield, as they prevent RNA secondary structure from affecting migration [35]. Intact eukaryotic total RNA on a denaturing gel shows sharp 28S and 18S rRNA bands, with the 28S band approximately twice as intense as the 18S band—a key indicator of RNA integrity [35]. Native agarose gels may be sufficient for a quick quality check, but RNA secondary structure causes it to not migrate strictly according to its true size, resulting in less sharp bands [40] [35]. For RNA fragments smaller than approximately 600 nucleotides, denaturing polyacrylamide gels are more appropriate [40].
Table 1: Direct Comparison of Agarose and Polyacrylamide Gel Properties
| Feature | Agarose Gel | Polyacrylamide Gel |
|---|---|---|
| Chemical Nature | Polysaccharide from seaweed [30] | Synthetic polymer [30] |
| Polymerization | Physical cooling and setting [30] | Chemical polymerization (requires catalyst) [30] |
| Pore Size | Large, non-uniform [30] | Small, uniform, and tunable [30] |
| Typical Gel Concentration | 0.5% - 3% [37] | 4% - 20% [37] |
| Optimal Separation Range | DNA: 100 bp to 25 kb [36] | Proteins: 1 - 500 kDa; small DNA/RNA (< 1 kb) [30] [39] |
| Resolution | Lower (for larger molecules) [30] | Higher (can distinguish single base pair differences) [30] [38] |
| Toxicity | Non-toxic [30] | Neurotoxic monomer (acrylamide) [30] |
| Primary Applications | Nucleic acid electrophoresis (DNA, RNA) [30] | Protein electrophoresis (SDS-PAGE, Native PAGE), small nucleic acids [30] |
| Typical Setup | Horizontal [37] | Vertical [37] |
Experimental Protocols for Key Applications
Standard Agarose Gel Electrophoresis for DNA
This protocol is adapted from established methods for the separation of DNA fragments [36].
Materials:
- Agarose powder (standard)
- Electrophoresis buffer (TAE or TBE)
- Erlenmeyer flask
- Microwave or hot plate
- Gel casting tray and comb
- Power supply
- DNA stain (e.g., Ethidium Bromide, SYBR Safe)
- Gel documentation system
Methodology:
- Gel Preparation: Weigh the appropriate mass of agarose into a flask. For a standard gel, use 0.8% to 2.0% (w/v) in 1X running buffer (e.g., TAE or TBE). The buffer volume should not exceed one-third of the flask's capacity [36].
- Melting: Heat the mixture in a microwave oven at 30-second intervals, swirling intermittently until the agarose is completely dissolved [36].
- Staining: Allow the solution to cool slightly (to about 60°C), then add a nucleic acid stain. Ethidium bromide can be added to a final concentration of 0.5 µg/mL. (Note: EtBr is a suspected carcinogen; handle with gloves and dispose of properly. Consider safer alternatives like SYBR Safe) [36].
- Casting: Pour the molten agarose into a casting tray with a well-forming comb in place. Allow the gel to solidify completely at room temperature [36].
- Loading: Once solidified, remove the comb and place the gel in the electrophoresis chamber. Submerge the gel in the same 1X running buffer used to prepare the gel. Mix DNA samples with 6X loading dye (containing density agents like glycerol and tracking dyes) and pipette into the wells. Include an appropriate DNA size marker [36].
- Electrophoresis: Attach the leads to the power supply (cathode/black at the wells, anode/red at the opposite end). Run the gel at 1-5 V/cm of gel length until the dye front has migrated sufficiently [36].
- Visualization: Turn off the power, remove the gel from the chamber, and visualize the DNA bands using a UV transilluminator and gel documentation system [36].
Denaturing Agarose Gel Electrophoresis for RNA
This protocol, adapted from Thermo Fisher Scientific, is critical for assessing RNA integrity and is a key step in Northern blotting [35].
Materials:
- Agarose powder
- 10X MOPS running buffer
- 37% Formaldehyde (handle in a fume hood)
- Denaturing loading dye (e.g., Formaldehyde Load Dye)
- RNA molecular weight markers
Methodology:
- Gel Preparation: Dissolve 1 g of agarose in 72 mL of RNase-free water by heating. Cool the solution to 60°C. Add 10 mL of 10X MOPS running buffer and 18 mL of 37% formaldehyde. WARNING: Formaldehyde is toxic; perform this step in a chemical fume hood [35].
- Casting: Pour the gel immediately and allow it to solidify.
- Sample Preparation: To 1-3 µg of RNA, add 0.5-3 volumes of Formaldehyde Load Dye. For complete denaturation (e.g., for Northern blotting), use 3 volumes of dye. Heat denature the samples at 65-70°C for 5-15 minutes [35].
- Electrophoresis: Load the samples onto the gel and run at 5-6 V/cm until the bromophenol blue tracking dye has migrated an adequate distance [35].
- Visualization and Interpretation: Visualize the gel on a UV transilluminator. Intact total RNA from a eukaryotic source will display sharp 28S and 18S rRNA bands, with the 28S band approximately twice as intense as the 18S band. Degraded RNA will appear as a smear or will lack these distinct bands [35].
Table 2: Research Reagent Solutions for Gel Electrophoresis
| Reagent Category | Specific Examples | Function and Application |
|---|---|---|
| Buffers | TAE (Tris-Acetate-EDTA), TBE (Tris-Borate-EDTA), MOPS [36] [35] | Conduct current and maintain stable pH during electrophoresis. TAE is common for DNA; MOPS is used for denaturing RNA gels. |
| Stains for Nucleic Acids | Ethidium Bromide, SYBR Safe, SYBR Gold, GelRed [36] [37] | Intercalate with DNA/RNA to allow visualization under UV light. SYBR dyes are safer but more expensive alternatives to EtBr. |
| Stains for Proteins | Coomassie Blue, Silver Stain [37] | Bind to proteins to enable visualization. Silver stain offers higher sensitivity than Coomassie Blue. |
| Loading Dyes | Bromophenol Blue, Xylene Cyanol [36] [35] | Add density to samples for well loading and provide visual tracking of migration progress during the run. |
| Denaturing Agents | Formaldehyde, Glyoxal, SDS (Sodium Dodecyl Sulfate) [30] [35] | Disrupt secondary structure in RNA and proteins to ensure separation based on size, not conformation. |
| Gel Matrix Materials | Agarose (Standard, Low Melt), Acrylamide/Bis-Acrylamide [30] [36] | Form the porous sieving matrix. Low melt agarose is used for fragment recovery. Acrylamide requires neurotoxic monomer handling. |
Advanced Technical Considerations
The Ferguson Plot: A Fundamental Difference in Size Determination
The Ferguson plot, which is the logarithm of electrophoretic mobility versus gel concentration, is a method used to estimate the molecular size of native proteins and nucleic acids. Recent research highlights a fundamental behavioral difference between agarose and polyacrylamide gels in this context [41].
Studies have shown that in agarose gel electrophoresis, the slopes of Ferguson plots are dependent on the molecular weight of the protein or protein complex. This dependency makes agarose gels suitable for molecular size estimation under native conditions using this method. In contrast, polyacrylamide gels (both native-PAGE and SDS-PAGE) exhibit Ferguson plot slopes that are largely independent of molecular size under the same experimental conditions, suggesting they may not be reliable for this specific analytical approach [41]. This divergence points to a complex interplay between protein properties and the gel matrix, indicating that the choice of gel can influence not just separation but also the fundamental data interpretation for size determination.
Safety and Workflow Efficiency
The choice between gel matrices extends beyond technical performance to encompass critical safety and logistical considerations. While polyacrylamide gels offer superior resolution for small molecules, their preparation involves handling the neurotoxic acrylamide monomer, requiring laboratories to implement stringent safety protocols and personal protective equipment (PPE) [30]. The simplicity and non-toxic nature of preparing agarose gels make them a safer and more convenient option for standard nucleic acid work, particularly in educational settings or clinical diagnostics labs where high-throughput and safety are priorities [30] [38].
Furthermore, the evolution of pre-cast gels for both agarose and polyacrylamide systems has significantly improved workflow efficiency, reducing preparation time and enhancing reproducibility while minimizing exposure to hazardous chemicals [37].
Integrated Decision Framework
The following workflow synthesizes the key criteria for selecting the appropriate gel matrix, integrating molecule type, size, and required resolution.
Diagram Title: Gel Matrix Selection Workflow
The selection between agarose and polyacrylamide gels is a foundational decision that directly impacts the success of electrophoretic separation in research and diagnostics. Agarose gels, with their large pores and ease of use, are the workhorse for analyzing large nucleic acids, providing robust performance for fragments from 100 bp to 25 kb. Polyacrylamide gels, characterized by their small, tunable pores and high resolution, are indispensable for separating proteins and small nucleic acids, capable of distinguishing molecules differing by a single base pair or a few thousand Daltons.
This selection must be framed within the experimental context, including the choice between denaturing and non-denaturing conditions, which dictates whether molecular size or native structure is the parameter of interest. As electrophoretic technology evolves with trends toward miniaturization, automation, and enhanced safety profiles, the fundamental principles governing gel matrix selection remain critical. By meticulously considering the size of the target molecules, the required resolution, and the associated safety and workflow considerations, researchers and drug development professionals can make an informed choice that ensures the integrity of their results and streamlines their molecular analysis workflows.
Gel electrophoresis is a cornerstone technique in molecular biology for separating and analyzing nucleic acids. The running buffer used provides the ions necessary to conduct electricity, maintains a stable pH to preserve the charge of the nucleic acids, and prevents degradation by inhibiting nucleases. The choice of buffer system—primarily Tris-Acetate-EDTA (TAE), Tris-Borate-EDTA (TBE), or Sodium Borate (SB)—fundamentally impacts resolution, run time, and downstream applications. This guide provides an in-depth technical comparison of these buffer systems, framed within the critical context of choosing between denaturing and non-denaturing gel conditions for research and drug development.
The core function of any electrophoresis buffer is to ensure that electric current flows through the gel, allowing negatively charged nucleic acids to migrate toward the positive electrode [42]. The buffer maintains the pH within a specific range (typically 8.0-8.5) to keep the sugar-phosphate backbone of DNA and RNA fully ionized and negatively charged [42]. Furthermore, the EDTA (Ethylenediaminetetraacetic acid) present in TAE and TBE chelates divalent cations, thereby inactivating metal-dependent nucleases that would otherwise degrade the samples [42]. The choice between native (non-denaturing) and denaturing gels dictates whether the biomolecules are separated in their natural, folded state or as unstructured linear chains, a decision that directly influences the optimal buffer selection [2].
Composition and Properties of Key Buffers
A clear understanding of the chemical composition and inherent properties of each buffer is a prerequisite for making an informed selection.
TAE (Tris-Acetate-EDTA) buffer consists of Tris base, acetic acid, and EDTA. A standard 1x working solution contains approximately 40 mM Tris, 20 mM acetate, and 1 mM EDTA, with a pH around 8.3 [43] [44]. Its primary advantage is compatibility with downstream enzymatic applications like cloning, as it lacks borate, which can inhibit enzymes such as ligase [42] [45]. However, TAE has a lower buffering capacity compared to TBE, meaning its pH can shift during extended electrophoresis, potentially exhausting the buffer [46] [47].
TBE (Tris-Borate-EDTA) buffer is composed of Tris base, boric acid, and EDTA. A 1x solution typically contains 100 mM Tris, 90 mM boric acid, and 1 mM EDTA [48]. The borate gives TBE a high buffering capacity, making it ideal for long runs or high-voltage electrophoresis where pH stability is crucial [42] [47]. This comes with a trade-off: the borate ions can form complexes with DNA, complicating recovery from gels and potentially inhibiting certain enzymes [42].
SB (Sodium Borate) buffer is a simpler, more recent alternative. It is composed solely of sodium borate, with a 1x solution having a pH of about 8.5 [47]. Its key feature is very low conductivity, which allows for the application of high voltages, significantly reducing run times. However, it may require optimization for different applications and is less universally established than TAE or TBE [47].
Table 1: Composition and Key Characteristics of Common Electrophoresis Buffers
| Buffer | Full Name & Key Components (1x) | pH | Buffering Capacity | Relative Conductivity |
|---|---|---|---|---|
| TAE | Tris-Acetate-EDTA~40 mM Tris, ~20 mM Acetate, ~1 mM EDTA [44] | ~8.3 [45] | Low [46] [47] | Higher [47] |
| TBE | Tris-Borate-EDTA~100 mM Tris, ~90 mM Boric Acid, ~1 mM EDTA [48] | ~8.3 [48] | High [42] [47] | Lower [47] |
| SB | Sodium BorateSodium Borate [47] | ~8.5 [47] | Information Missing | Very Low [47] |
Buffer Selection for Specific Applications
Choosing the correct buffer is critical for experimental success. The decision hinges on the size of the nucleic acids being separated, the required resolution, and the intended downstream processing.
Separation of DNA Fragments by Size
- For large DNA fragments (>1-2 kb): TAE buffer is superior. It provides better separation and is the buffer of choice for long nucleic acids, especially those longer than 1500 bp [42] [45]. This makes it ideal for applications like checking genomic DNA integrity or analyzing large PCR products.
- For small DNA fragments (<1-2 kb): TBE buffer is recommended. It provides sharper bands and higher resolution for smaller fragments, making it indispensable for analyzing products like small PCR amplicons or restriction digests [42].
- For very fast runs: SB buffer allows for extremely rapid separation due to its low conductivity, enabling the use of high voltages without excessive heat generation [47].
Downstream Applications
- Cloning and enzymatic work (e.g., ligation): TAE is strongly preferred. The borate in TBE is a known inhibitor of many enzymes, including ligase, and can interfere with subsequent reactions [42] [45].
- DNA extraction and recovery from gels: TAE is the buffer of choice because it allows for higher recovery of nucleic acids from agarose gels compared to TBE [45].
- Automated DNA sequencing and high-resolution analysis: TBE is routinely used, particularly for DNA automated sequencing gels and in polyacrylamide gel electrophoresis (PAGE) [46] [48].
Native vs. Denaturing Gel Electrophoresis
The choice between native and denaturing conditions is a fundamental experimental design parameter that intersects with buffer selection [2].
- Native (Non-denaturing) Gels: These separate nucleic acids or proteins based on their native charge, size, and shape, preserving higher-order structures and complexes [2]. They are simpler and cheaper to run and are used to study protein binding, isolate enzymes, and determine the hierarchical state (e.g., circular vs. linear DNA) [2]. Both TAE and TBE can be used for non-denaturing nucleic acid gels [48]. TAE, for instance, is used for native RNA analysis [45].
- Denaturing Gels: These use agents like urea (for DNA/RNA) or SDS (for proteins) to unfold molecules into linear chains, separating them based primarily on molecular mass alone [2]. They are essential for techniques like western blotting, protein sequencing, and establishing sample purity [2]. TBE is explicitly compatible with denaturing conditions, such as polyacrylamide gels containing 7 M urea [46] [48]. TAE can also be used in denaturing gels, for example, with formamide-denatured RNA [45].
Table 2: Application-Based Guide for Buffer Selection
| Application Goal | Recommended Buffer | Technical Rationale |
|---|---|---|
| Large DNA Fragments (>2 kb) & Cloning | TAE | Better separation of large molecules; no borate to inhibit downstream enzymes [42] [45]. |
| High Resolution of Small DNA (<2 kb) | TBE | Sharper bands and superior resolution for small fragments [42]. |
| DNA Recovery / Extraction from Gel | TAE | Higher yield of nucleic acids compared to TBE-based recovery [45]. |
| Fast Electrophoresis Runs | SB | Low conductivity permits high voltage, drastically reducing run time [47]. |
| Polyacrylamide Gels (PAGE) / Sequencing | TBE | Standard for DNA sequencing gels; works with denaturing and non-denaturing PAGE [46] [48]. |
| Long Duration Electrophoresis | TBE | High buffering capacity maintains stable pH over long periods [42] [47]. |
Experimental Protocols and Practical Workflows
Standard Protocol for Agarose Gel Electrophoresis with TAE or TBE
This is a generalized workflow for nucleic acid separation, adaptable based on the specific buffer chosen.
- Gel Preparation: For a 1% agarose gel, mix 1 g of agarose with 100 mL of 1x TAE or TBE buffer [43]. Heat the mixture in a microwave until the agarose is completely dissolved. Allow the solution to cool to approximately 60°C before pouring it into a casting tray with a well-forming comb. Let it solidify completely [43].
- Sample and Ladder Preparation: Mix the DNA or RNA sample with a 6x loading dye containing a dense agent like glycerol or Ficoll and tracking dyes (e.g., bromophenol blue) [43]. For RNA or to resolve secondary structures in DNA, a denaturing step (e.g., heating at 70°C for 10 minutes followed by rapid cooling on ice) may be included prior to loading [43].
- Electrophoretic Run: Place the solidified gel in an electrophoresis tank filled with the same 1x buffer used to cast the gel (e.g., 1x TAE). Load the prepared samples and a DNA ladder of appropriate size range into the wells. Apply a constant voltage of 3-5 V/cm (distance between electrodes) for maximum resolution [48] [43]. Higher voltages can be used with SB buffer or for faster runs [47].
- Visualization and Analysis: After the run, stain the gel with an intercalating dye such as ethidium bromide or a safer alternative. Visualize the separated nucleic acid bands under a UV transilluminator and document the image [43].
Specialized Protocol: Non-Denaturing RNA Gel Electrophoresis with Bleach
This protocol is used to assess the quality of RNA, such as after in vitro transcription, by adding bleach directly to the gel to prevent RNA degradation without the need for a special RNase-free environment [43].
- Materials: Agarose, 50x TAE stock solution, household bleach without additives (e.g., surfactants, detergents), 6x DNA loading dye, RNA samples, DNA ladder [43].
- Gel Preparation (1% Agarose, 100 mL): Add 1 g agarose to 99 mL of 1x TAE buffer. Add 1 mL of germicidal bleach (e.g., ChloroxPro, 8.25% sodium hypochlorite) and mix. Dissolve the agarose by microwaving. Cool the solution to ~60°C, then pour the gel and allow it to solidify [43]. Safety Note: Bleach is toxic and corrosive; wear appropriate PPE.
- Sample Preparation and Running: Mix the RNA sample with loading dye and denature at 70°C for 10 minutes to reduce secondary structures. Cool immediately on ice. Load the gel and run at 3-5 V/cm in a tank filled with standard 1x TAE buffer. The bleach in the gel matrix itself protects the RNA from nucleases during the run [43].
The Scientist's Toolkit: Essential Reagents and Materials
Table 3: Key Research Reagent Solutions for Electrophoresis
| Reagent / Material | Function | Example & Notes |
|---|---|---|
| TAE Buffer (50x Stock) | Running buffer for large DNA fragments and cloning applications. | Pre-weighed powder pouches (e.g., from Aniara) for easy preparation [45]. 1x working solution: 40 mM Tris-acetate, 1 mM EDTA [44]. |
| TBE Buffer (10x Stock) | Running buffer for high-resolution separation of small DNA fragments and sequencing. | Ready-to-use solution (e.g., from MP Bio). 1x working solution: ~100 mM Tris, 90 mM Boric Acid, 1 mM EDTA [48]. |
| Agarose | Polysaccharide polymer that forms a porous gel matrix for sieving nucleic acids. | Electrophoresis-grade (e.g., Invitrogen UltraPure). Concentration (0.5-5%) determines resolution and size range [14]. |
| Polyacrylamide | Synthetic polymer gel matrix for high-resolution separation of small nucleic acids. | Used for fragments <1 kb; can provide single-nucleotide resolution. Neurotoxic in its monomeric form; handle with care [14]. |
| DNA Loading Dye | Contains a dense agent and tracking dyes for sample loading and visual monitoring of run progress. | Typically contains glycerol/Ficoll, Tris, EDTA, and dyes like bromophenol blue (e.g., Thermo Scientific TriTrack) [43]. |
| DNA Ladder | A mixture of DNA fragments of known sizes for estimating the size of unknown samples. | Available in various size ranges (e.g., 100 bp ladder, 1 kb ladder) [43] [49]. |
| Ethidium Bromide | Fluorescent dye that intercalates with nucleic acids for visualization under UV light. | A suspected carcinogen; handle with gloves and dispose of as hazardous waste [43]. Safer alternatives are available. |
Decision Workflow for Electrophoresis Buffer Selection
The following diagram outlines a systematic decision-making process for selecting the appropriate electrophoresis buffer based on key experimental parameters.
Diagram 1: Electrophoresis Buffer Selection Workflow
Selecting the optimal electrophoresis buffer is a critical step that directly influences the success of nucleic acid analysis. There is no universal "best" buffer; the choice is dictated by experimental goals. TAE buffer excels with large DNA fragments and is mandatory for downstream cloning. TBE buffer provides superior resolution for small fragments and is the workhorse for sequencing and high-resolution PAGE. SB buffer offers a high-speed alternative for rapid results. By integrating this knowledge of buffer properties with the requirements of native versus denaturing systems, researchers can strategically design their electrophoresis protocols to achieve precise, reliable, and efficient separations, thereby accelerating progress in research and drug development.
Optimizing Results: Troubleshooting Common Issues and Enhancing Resolution
Gel electrophoresis is a cornerstone technique in molecular biology and biochemistry, indispensable for the separation and analysis of proteins and nucleic acids. Its reliability, however, hinges on the appropriate selection of gel conditions and meticulous execution of the protocol. A critical initial decision researchers face is choosing between denaturing and non-denaturing (native) gel systems, a choice that fundamentally shapes the experimental outcome by determining what properties of the macromolecule are leveraged for separation [2] [50]. This decision is not merely academic; it directly influences the prevalence and nature of analytical artifacts such as smearing, poor resolution, and aberrant migration.
Within the context of drug development and biomedical research, where conclusions drawn from gel data can inform downstream experiments and diagnostic decisions, the ability to troubleshoot these artifacts is paramount. This guide provides an in-depth technical examination of the causes and solutions for these common issues, framed within the critical initial choice of gel system. We integrate structured data from the scientific literature, detailed protocols, and visual workflows to equip researchers with the knowledge to produce reliable, interpretable electrophoretic data.
Fundamental Principles: Native Versus Denaturing Gels
The choice between a native and a denaturing gel system dictates the physical properties of the molecule that will be probed during separation, thereby directly influencing the potential for specific artifacts.
Denaturing Gel Electrophoresis
Denaturing gels are designed to dismantle the higher-order structure of proteins and nucleic acids, creating a linear chain of amino acids or nucleotides. For proteins, this is typically achieved using Sodium Dodecyl Sulfate-Polyacrylamide Gel Electrophoresis (SDS-PAGE). The process involves mixing the sample with a loading buffer containing the anionic detergent SDS and a reducing agent (like DTT or β-mercaptoethanol), followed by heating [50] [12]. SDS binds to the protein backbone, conferring a uniform negative charge, while the reducing agent breaks disulfide bonds. The result is that all proteins adopt a similar charge-to-mass ratio and a rod-like shape, meaning separation occurs almost exclusively based on molecular mass [2] [12]. Smaller proteins migrate faster through the gel matrix than larger ones. Denaturing gels are the standard for determining molecular weight, assessing sample purity, and for techniques like western blotting [2] [50].
For nucleic acids, denaturation is often accomplished with urea, which disrupts hydrogen bonding, preventing the formation of secondary structures in RNA or single-stranded DNA [2]. This is crucial for obtaining accurate size and quantification data for RNA.
Native (Non-Denaturing) Gel Electrophoresis
In stark contrast, native gels aim to preserve the biomolecule's secondary, tertiary, and quaternary structures. Samples are prepared without SDS, reducing agents, or heat [50] [12]. Consequently, separation depends on a combination of the molecule's intrinsic net charge, size, and shape [2]. A protein's migration is influenced by its overall three-dimensional bulk and its charge at the gel's pH. This makes native gels ideal for studying functional states, such as protein-protein interactions, enzyme activity (which is often retained after electrophoresis), and the aggregation state of complexes [2] [12]. However, this complexity also introduces more variables that can lead to artifacts if not carefully controlled.
The following diagram illustrates the decision-making workflow for selecting the appropriate gel type based on research objectives.
Comparative Analysis of Gel Types
The table below summarizes the key characteristics, applications, and inherent advantages of each gel system.
Table 1: Comparative Analysis of Native and Denaturing Gel Electrophoresis Systems
| Feature | Native Gel | Denaturing Gel |
|---|---|---|
| Sample Preparation | No SDS, no reducing agent, no heat [50] | SDS, reducing agent (DTT/β-Me), and heat [50] |
| Separation Basis | Size, charge, and shape (overall bulk) [2] | Molecular mass (size) only [2] [12] |
| Protein Structure | Native state preserved; activity often retained [12] | Primary structure only; complex structure destroyed [12] |
| Key Applications | - Studying protein complexes & quaternary structure [2] [50]- Isolating active enzymes [2]- Determining aggregation state [50] | - Molecular weight estimation [50] [12]- Western blotting [2] [50]- Establishing sample purity [2] |
Troubleshooting Common Electrophoresis Artifacts
Even with a correct initial gel choice, artifacts can arise from issues in sample preparation, gel running conditions, or visualization. The following section provides a systematic guide to diagnosing and resolving the most common problems.
Smearing and Band Diffusion
Smearing appears as a diffuse, fuzzy trail of material down the lane, rather than as sharp, distinct bands. It indicates a heterogeneous population of molecules within a sample that should be uniform.
Table 2: Troubleshooting Guide for Smearing in Gel Electrophoresis
| Category | Root Cause | Recommended Solution |
|---|---|---|
| Sample Integrity | Degradation by nucleases/proteases: Contaminated reagents or poor technique breaks molecules into fragments of various sizes [51] [52]. | Use sterile reagents and nuclease-free labware. Wear gloves, work on ice, and use designated areas for sensitive samples [51]. |
| Overloading: Excess sample (e.g., >0.2 μg DNA/mm well width) overwhelms the gel matrix, causing trailing [51]. | Load an appropriate amount of sample. Use deep, narrow wells for concentration [51]. | |
| High Salt Concentration: Creates a local high-conductivity zone, distorting the electric field and migration [51] [52]. | Dilute, desalt, or precipitate and resuspend the sample in nuclease-free water [51]. | |
| Gel Preparation & Run | Incorrect Gel Type: Using a native gel for single-stranded nucleic acids (e.g., RNA) allows secondary structure formation [51]. | For RNA or ssDNA, use a denaturing gel (e.g., with urea) [51]. |
| Excessive Voltage: Generates "Joule heating," which can denature samples and cause band diffusion [52]. | Run the gel at a lower voltage for a longer duration [52]. | |
| Thick Gels (>5 mm): Promote diffusion of bands during the run [51]. | Cast horizontal agarose gels with a thickness of 3-4 mm [51]. |
Poor Band Resolution
Poor resolution is characterized by bands that are too close together, densely stacked, or poorly distinguished, making it difficult to differentiate molecules of similar size.
Table 3: Troubleshooting Guide for Poor Band Resolution
| Category | Root Cause | Recommended Solution |
|---|---|---|
| Gel Matrix | Suboptimal Gel Percentage: Pores that are too large won't resolve small fragments; pores that are too small will not resolve large fragments properly [51] [52]. | Use a higher % gel for smaller molecules and a lower % gel for larger molecules. For nucleic acids <1,000 bp, use polyacrylamide [51]. |
| Poorly Formed Wells: Damaged or connected wells cause samples to leak and mix [51]. | Use a clean comb, avoid pushing it to the bottom, and remove it carefully after solidification [51]. | |
| Sample & Run | Overloading: Bands become thick and merge, obscuring individual species [52]. | Load a smaller amount of sample. |
| Incorrect Run Time: Too short a run doesn't allow separation; too long causes bands to diffuse [51] [52]. | Optimize run time and voltage. Running at a lower voltage for longer often improves resolution [52]. | |
| Incompatible Buffer: Using an incorrect or depleted running buffer alters pH and ion concentration, compromising separation [51]. | Always use fresh, correctly prepared running buffer [51]. |
Aberrant Migration (Distorted Bands)
Aberrant migration includes "smiling" (bands curve upwards at the edges) or "frowning" (bands curve downwards) effects, as well as overall inconsistent migration between lanes.
- Uneven Heat Distribution ("Smiling/Frowning"): This is the most common cause. The center of the gel becomes hotter than the edges, causing samples in the middle to migrate faster. This Joule heating effect is exacerbated by high voltage or high-resistance buffers [52].
- Solutions:
- Reduce the voltage to minimize heat generation.
- Use a constant current power supply for more uniform temperature.
- Ensure fresh buffer is used and the buffer level is consistent across the tank [52].
- Sample-Specific Issues: High salt concentration in a single sample can create a local region of high conductivity, distorting that specific lane [52]. Desalting the sample is the recommended fix.
- Gel Tank Setup: An improperly seated gel, crooked electrodes, or uneven buffer levels can create a non-uniform electric field, leading to distorted migration across the entire gel [52].
Faint or Absent Bands
The complete absence of bands or very faint signals can be a critical failure point.
- Sample Issues: The sample may have been degraded during preparation, or the starting concentration may be too low for detection [51] [52]. Re-check sample preparation protocols and consider increasing the amount of starting material.
- Electrophoresis Setup Errors: The power supply may not be on, electrodes may be reversed, or a short circuit may prevent current from flowing through the gel [51] [52]. Always verify all connections and settings. A reversed electrode will cause DNA to migrate into the buffer instead of through the gel [51].
- Staining Problems: The staining agent may have been prepared incorrectly, the staining duration was too short, or the stain has degraded [51]. Prepare fresh staining solutions and optimize staining time. For thick or high-percentage gels, allow more time for the stain to penetrate [51].
Advanced Applications and Uncertainty Considerations
Specialized Electrophoresis Techniques
Beyond standard gels, advanced techniques offer solutions for specific challenges. Denaturing Gradient Gel Electrophoresis (DGGE) and Temporal Temperature Gradient Gel Electrophoresis (TTGE) are powerful PCR-based methods used in microbial ecology and diagnostics to separate DNA fragments of the same length based on their sequence-dependent melting properties [53]. These techniques can simultaneously identify multiple species in a community, such as different Candida species in clinical samples, and are capable of detecting minor populations [53]. Studies have shown that TTGE can be a preferable alternative to DGGE due to easier performance and lower costs while providing equivalent discriminatory results [53].
Uncertainty in Quantitative Gel Electrophoresis
For quantitative applications, understanding the limitations and uncertainties of gel electrophoresis is critical. A 2023 study highlights that the uncertainty of quantitative gel electrophoresis is influenced by a large number of factors, including gel concentration, nucleic acid conformation, voltage applied, and the presence of intercalating dyes like ethidium bromide [54]. The mathematical processing of electrophoresis images also introduces a methodological error that is often not accounted for [54]. The study proposes frameworks for estimating this uncertainty, especially in cases where a large number of replicate measurements for statistical analysis are not feasible [54]. This is a significant consideration in drug development, where the reliability of quantitative data directly impacts decision-making.
The Scientist's Toolkit: Essential Reagents and Materials
Successful electrophoresis relies on a suite of carefully selected reagents. The following table details key materials and their functions.
Table 4: Essential Research Reagents for Gel Electrophoresis
| Reagent/Material | Function | Key Considerations |
|---|---|---|
| SDS (Sodium Dodecyl Sulfate) | Anionic detergent that denatures proteins and confers a uniform negative charge [50] [12]. | Essential for SDS-PAGE. Must be used with a reducing agent for complete denaturation. |
| DTT or β-Mercaptoethanol | Reducing agents that break disulfide bonds in proteins [50]. | Critical for linearizing proteins. DTT is often preferred as it is less volatile and pungent. |
| Urea | A denaturant that disrupts hydrogen bonding, used to denature nucleic acids (e.g., RNA) [2]. | Prevents secondary structure formation in RNA, ensuring separation by length. |
| Polyacrylamide/Agarose | Polymers that form the porous gel matrix for sieving molecules based on size [51]. | Choice depends on application: Agarose for larger nucleic acids; Polyacrylamide for proteins and small nucleic acids. |
| TAE or TBE Buffer | Common running buffers that provide the ions necessary to carry current and maintain stable pH [53]. | Must be fresh and correctly prepared. TBE is generally preferred for sharper resolution of small DNA fragments. |
| Ethidium Bromide/Safe Dyes | Fluorescent dyes that intercalate with nucleic acids for visualization under UV light [54]. | Handle with care (mutagen). Alternative "safe" dyes are less hazardous but may have different sensitivity [51]. |
| GC-Clamp | A 30-40 bp GC-rich sequence attached to a primer for DGGE/TTGE, which creates a high-melting domain [53]. | Prevents complete melting of DNA fragments during DGGE/TTGE, improving separation based on sequence [53]. |
Producing publication-quality gel data requires a strategic approach that begins with the fundamental choice between native and denaturing systems and is followed by scrupulous attention to technical detail. The native gel, by preserving macromolecular structure, is a powerful tool for functional studies but is susceptible to artifacts from the complex interplay of charge, size, and shape. The denaturing gel, by simplifying separation to a function of mass, provides a robust platform for analytical quantification and sizing but at the cost of structural information. As explored, artifacts like smearing, poor resolution, and aberrant migration have definitive, addressable causes rooted in sample integrity, gel chemistry, and running conditions. By leveraging the troubleshooting frameworks, standardized protocols, and reagent knowledge outlined in this guide, researchers and drug development professionals can systematically diagnose and resolve these issues, thereby enhancing the accuracy, reproducibility, and reliability of their electrophoretic analyses.
Optimizing Gel Percentage for Target Molecule Size Ranges
Gel electrophoresis is a foundational technique in molecular biology and biochemistry, enabling the separation of macromolecules such as nucleic acids and proteins based on their physical properties. The separation occurs as molecules migrate through a porous gel matrix under the influence of an electric field. The selection of an appropriate gel concentration is critical for achieving optimal resolution, as the gel's pore size acts as a molecular sieve that differentially retards the movement of molecules based on their size [13].
The two primary supporting media used in electrophoresis are agarose and polyacrylamide, each with distinct properties and applications. Agarose, a polysaccharide derived from seaweed, forms gels with relatively large pores, making it ideal for separating large DNA fragments. Polyacrylamide, a synthetic polymer composed of acrylamide and bisacrylamide cross-links, creates much smaller and more uniform pores, providing superior resolution for smaller molecules like proteins and short nucleic acids [13] [55]. The concentration of these gels determines the effective separation range, with higher percentages creating smaller pores that better resolve smaller molecules [56].
The choice between denaturing and non-denaturing (native) gel conditions represents another critical decision point in experimental design. Denaturing gels incorporate agents such as sodium dodecyl sulfate (SDS) for proteins or urea for nucleic acids to disrupt secondary and tertiary structures, ensuring separation based primarily on molecular weight rather than inherent charge or shape [13] [55]. In contrast, native gels preserve the natural conformation and biological activity of molecules, allowing separation based on both size and charge, which is essential for studying functional complexes [57].
Agarose Gel Electrophoresis for Nucleic Acids
Agarose Gel Characteristics and Applications
Agarose gel electrophoresis serves as the standard method for separating and analyzing DNA and RNA fragments. This technique is particularly valued for its simplicity, cost-effectiveness, and broad separation range. Agarose gels are formed by dissolving agarose powder in boiling buffer and allowing it to cool and solidify, creating a three-dimensional network with pores that act as a molecular sieve [58]. The porosity of agarose gels can be easily adjusted by varying the agarose concentration, allowing researchers to target specific size ranges of nucleic acids for optimal resolution.
Ordinary agarose gels can effectively separate DNA fragments ranging from approximately 200 base pairs to 50 kilobases, making them suitable for a wide variety of applications from routine analysis to specialized techniques [58]. The separation mechanism relies on the negative charge of nucleic acids' phosphate backbone, which causes them to migrate toward the positive electrode when current is applied. Smaller fragments move more quickly through the gel matrix, while larger fragments are retarded, resulting in separation by size [58].
Optimizing Agarose Concentration for DNA Separation
Selecting the appropriate agarose concentration is paramount for achieving optimal resolution of DNA fragments. The relationship between agarose percentage and effective separation range follows a predictable pattern, with lower percentages resolving larger fragments and higher percentages providing better separation of smaller fragments.
Table 1: Optimal Agarose Gel Concentrations for DNA Separation
| % Agarose | Size Range for Optimum Resolution (bp) |
|---|---|
| 0.5 | 1,000–30,000 |
| 0.7 | 800–12,000 |
| 1.0 | 500–10,000 |
| 1.2 | 400–700 |
| 1.5 | 200–500 |
Source: Adapted from [13]
For most routine applications involving DNA fragments between 500 bp and 10 kb, a 1.0% agarose gel provides excellent separation [58]. Large DNA fragments (>10 kb) are best resolved in low-percentage gels (0.5-0.7%), while small fragments (<500 bp) require higher percentages (1.2-1.5%) for adequate resolution [13]. When analyzing complex samples with a broad size range of fragments, researchers may opt for pulsed-field gel electrophoresis, which uses alternating electric fields to separate very large DNA molecules up to several megabases in size.
Buffer Systems for Agarose Gel Electrophoresis
The choice of running buffer significantly impacts the resolution and efficiency of agarose gel electrophoresis. The two most common buffer systems are Tris-Acetate-EDTA (TAE) and Tris-Borate-EDTA (TBE), each with distinct advantages and limitations.
TAE buffer consists of Tris base, acetic acid, and EDTA and offers the advantage of being preparable as a 50X stock solution. It is particularly suitable for separating larger DNA fragments and is preferred for preparative gels because it minimizes interference with downstream enzymatic reactions such as ligation. However, TAE has lower buffering capacity, which can lead to smeared bands, especially when using small DNA fragments or running gels at higher voltages [13].
TBE buffer, composed of Tris base, boric acid, and EDTA, provides superior buffering capacity and generally yields sharper bands, particularly with smaller DNA fragments. This makes it ideal for analytical applications requiring high resolution. The borate in TBE can inhibit some enzymes, including T4 DNA ligase, potentially complicating downstream processing of extracted DNA [13].
Advanced Agarose Gel Techniques
Beyond standard agarose gel electrophoresis, several specialized techniques address specific research needs. For separating very large DNA molecules (>20 kb), pulsed-field gel electrophoresis (PFGE) uses alternating electric fields at different angles to achieve separation that would be impossible with conventional continuous-field electrophoresis. This technique is particularly valuable in genomic analysis, epidemiology, and typing of large DNA fragments.
For applications requiring DNA extraction and subsequent manipulation, low-melting-point agarose provides a specialized matrix that melts at lower temperatures (typically 65°C compared to 90°C for standard agarose), minimizing damage to DNA during recovery. This feature is particularly useful for techniques such as ligation or transformation where DNA integrity is critical.
Polyacrylamide Gel Electrophoresis for Proteins and Nucleic Acids
Polyacrylamide Gel Fundamentals
Polyacrylamide gel electrophoresis (PAGE) offers superior resolution for separating proteins and small nucleic acids due to its smaller, more uniform pore structure compared to agarose. The gel matrix forms through a chemical polymerization reaction between acrylamide monomers and bisacrylamide cross-linkers, catalyzed by ammonium persulfate (APS) and tetramethylethylenediamine (TEMED) [55]. The resulting mesh-like network creates pores that sieve molecules based on size, with the pore dimensions determined by both the total acrylamide concentration (%T) and the cross-linking ratio (%C) [56].
Polyacrylamide gels provide several advantages over agarose, including higher resolution, greater mechanical strength, and compatibility with denaturing agents. These characteristics make PAGE the method of choice for separating proteins and small nucleic acid fragments that would migrate too quickly to be resolved in agarose gels. The versatility of PAGE systems allows researchers to perform separations under either denaturing or non-denaturing conditions, depending on their experimental objectives [55].
Polyacrylamide Gel Optimization for Protein Separation
Protein separation via PAGE requires careful optimization of gel composition to match the molecular weights of target proteins. The relationship between protein size and optimal acrylamide percentage follows an inverse pattern, with larger proteins requiring lower percentages and smaller proteins needing higher percentages for effective resolution.
Table 2: Optimal Polyacrylamide Gel Concentrations for Protein Separation
| Protein Size (kDa) | Gel Acrylamide (%) |
|---|---|
| 4–40 | 20 |
| 12–45 | 15 |
| 10–70 | 12.5 |
| 15–100 | 10 |
| 25–200 | 8 |
| >200 | 4–6 |
Source: Adapted from [56] [59]
For most routine protein separations in the 10-70 kDa range, a 12.5% gel provides excellent resolution [56]. Very large proteins (>200 kDa) require low-percentage gels (4-6%) to allow sufficient migration, while small peptides and proteins (<15 kDa) are best resolved in high-percentage gels (15-20%) [59]. When analyzing samples containing proteins with diverse molecular weights, gradient gels with continuously increasing acrylamide concentration (e.g., 4-20%) offer broader separation range and sharper bands than single-percentage gels [56].
Polyacrylamide Gel Optimization for Nucleic Acid Separation
While less common than for proteins, polyacrylamide gels provide exceptional resolution for short nucleic acid fragments, typically in the range of 1-1000 base pairs. The optimal acrylamide concentration depends on the size of the nucleic acids being separated, with different percentages required for denaturing versus non-denaturing conditions.
Table 3: Optimal Polyacrylamide Gel Concentrations for Nucleic Acid Separation
| % Acrylamide | Size Range for Optimum Resolution (bp) |
|---|---|
| 3.5 | 1,000–2,000 |
| 5.0 | 80–500 |
| 8.0 | 60–400 |
| 12.0 | 25–150 |
| 15.0 | 25–150 |
| 20.0 | 6–100 |
Source: Adapted from [13]
For separating very short oligonucleotides (<100 bp) such as those used in sequencing applications, high-percentage denaturing polyacrylamide gels (12-20%) containing urea provide single-base resolution [13]. Non-denaturing polyacrylamide gels are ideal for studying nucleic acid structure, protein-nucleic acid interactions, and preparative isolation of specific fragments, as they preserve secondary structure and biological activity [57].
SDS-PAGE: Denaturing Protein Electrophoresis
Sodium dodecyl sulfate-polyacrylamide gel electrophoresis (SDS-PAGE) represents the most widely used denaturing electrophoretic technique for protein analysis. The method employs the anionic detergent SDS, which binds to proteins at a relatively constant ratio (approximately 1.4 g SDS per gram of protein), conferring a uniform negative charge density that overwhelms the proteins' intrinsic charge [55]. Sample preparation for SDS-PAGE includes heating in the presence of SDS and reducing agents (such as β-mercaptoethanol or dithiothreitol) to break disulfide bonds and complete the denaturation process [60].
The Laemmli buffer system, the most common implementation of SDS-PAGE, utilizes a discontinuous configuration with two distinct gel layers: a stacking gel and a resolving gel [55]. The stacking gel (typically 4-5% acrylamide) operates at pH 6.8 and serves to concentrate all protein samples into a sharp band before they enter the resolving gel. The resolving gel (typically 7-20% acrylamide, depending on target protein size) operates at pH 8.8 and performs the actual separation based on molecular weight [55]. This discontinuous system produces much sharper bands than continuous buffer systems, significantly enhancing resolution.
Native PAGE: Non-Denaturing Protein Electrophoresis
Native PAGE preserves protein structure and function by omitting denaturing agents from both the sample buffer and the gel system. This technique separates proteins based on a combination of size, charge, and shape, allowing researchers to study proteins in their biologically active conformations [55]. Native electrophoresis is particularly valuable for analyzing protein complexes, oligomeric states, and enzymes whose activity must be maintained for functional assays [57].
The migration pattern in native gels depends on both the intrinsic charge of the protein at the running pH and its hydrodynamic size. Proteins with greater negative charge density migrate faster toward the anode, while larger proteins experience greater retardation from the gel matrix. This multidimensional separation can provide information about protein-protein interactions, post-translational modifications, and conformational changes that would be obscured in denaturing conditions [55].
Specialized variants of native PAGE include blue native (BN-PAGE) and clear native (CN-PAGE) electrophoresis, which are particularly useful for separating membrane protein complexes and oxidative phosphorylation complexes while maintaining their structural integrity [57]. These techniques have enabled important advances in understanding complex biological systems, such as mitochondrial function and metabolic disorders [57].
Experimental Design and Protocol Development
Gel Selection Workflow
Selecting the appropriate electrophoretic method requires systematic consideration of multiple experimental factors. The following diagram illustrates the decision-making process for choosing between agarose and polyacrylamide gels and determining optimal conditions:
Step-by-Step Protocol for SDS-PAGE
The following protocol provides a standardized method for performing SDS-PAGE analysis of protein samples:
Gel Preparation:
- Assemble clean glass plates with spacers (typically 1.0-1.5 mm thick) in a casting frame.
- Prepare the resolving gel solution according to Table 2, based on target protein size. For a standard 12% resolving gel, mix 3.0 mL of 40% acrylamide/bis solution, 2.5 mL of 1.5 M Tris-HCl (pH 8.8), 0.1 mL of 10% SDS, 4.3 mL of distilled water, 0.1 mL of 10% ammonium persulfate (APS), and 0.01 mL of TEMED.
- Pour the resolving gel between the glass plates, leaving space for the stacking gel. Carefully overlay with isopropanol or water to create a flat interface.
- After polymerization (approximately 30 minutes), pour off the overlay and prepare the stacking gel (typically 5% acrylamide). Mix 0.5 mL of 40% acrylamide/bis solution, 0.75 mL of 0.5 M Tris-HCl (pH 6.8), 0.03 mL of 10% SDS, 1.7 mL of distilled water, 0.03 mL of 10% APS, and 0.003 mL of TEMED.
- Pour the stacking gel and immediately insert a clean comb, avoiding air bubbles. Allow to polymerize for 20-30 minutes.
Sample Preparation:
- Mix protein samples with 2X or 5X SDS sample buffer (typically containing Tris-HCl, glycerol, SDS, bromophenol blue, and β-mercaptoethanol or DTT).
- Denature samples by heating at 95°C for 5 minutes, then briefly centrifuge to collect condensation [60].
- Determine protein concentration using an appropriate assay (Bradford, BCA, etc.) to ensure equal loading across lanes.
Electrophoresis:
- Install the polymerized gel in the electrophoresis chamber and fill with running buffer (25 mM Tris, 192 mM glycine, 0.1% SDS, pH 8.3).
- Carefully load samples (typically 10-50 μg total protein for cell lysates or 10-100 ng for purified proteins) and molecular weight markers into wells [59].
- Connect to power supply and run at constant voltage (100-150 V for mini-gels) until the dye front reaches the bottom of the gel (approximately 1-2 hours) [59].
- Proceed immediately to downstream applications such as staining, western blotting, or further analysis.
Step-by-Step Protocol for Agarose Gel Electrophoresis
Gel Preparation:
- Select appropriate agarose percentage based on DNA fragment size (refer to Table 1).
- Mix agarose powder with 1X TAE or TBE buffer in a flask. For a 1% gel, use 1 g agarose per 100 mL buffer.
- Heat in microwave with occasional swirling until completely dissolved.
- Cool to approximately 60°C, then add nucleic acid stain if desired (e.g., ethidium bromide or safer alternatives like SYBR Safe or GelRed).
- Pour gel into casting tray with comb and allow to solidify completely (20-30 minutes).
Sample Preparation and Electrophoresis:
- Mix DNA samples with 6X loading dye (containing glycerol, tracking dyes, and sometimes EDTA).
- Place solidified gel in electrophoresis chamber and cover with running buffer (1X TAE or TBE).
- Carefully load samples and appropriate DNA size markers into wells.
- Run at constant voltage (typically 80-120 V for horizontal gels) until adequate separation is achieved [61].
- Visualize using UV transillumination or appropriate imaging system.
Research Reagent Solutions
Successful electrophoresis requires specific reagents optimized for each application. The following table outlines essential components and their functions:
Table 4: Essential Electrophoresis Reagents and Their Functions
| Reagent Category | Specific Examples | Function |
|---|---|---|
| Gel Matrix Components | Acrylamide, Bis-acrylamide, Agarose | Form porous gel matrix for molecular sieving |
| Polymerization Initiators | Ammonium persulfate (APS), TEMED | Catalyze acrylamide polymerization reaction |
| Denaturing Agents | SDS, Urea, β-mercaptoethanol, DTT | Disrupt protein structure and eliminate charge differences |
| Buffer Systems | TAE, TBE, Tris-glycine, Bis-Tris | Maintain pH and provide ions for conductivity |
| Tracking Dyes | Bromophenol blue, Xylene cyanol | Monitor migration progress and front position |
| Molecular Weight Standards | Protein ladders, DNA markers | Estimate size of unknown samples |
| Staining Agents | Coomassie Blue, Silver stain, SYBR Safe, Ethidium bromide | Visualize separated molecules |
Troubleshooting Common Electrophoresis Problems
Even with careful optimization, electrophoresis experiments can encounter technical challenges. Recognizing common artifacts and understanding their causes enables efficient troubleshooting and improves experimental outcomes.
Smiling or Frowning Bands: Uneven band migration across the gel, where bands in center lanes migrate faster ("smiling") or slower ("frowning") than outer lanes, typically results from uneven heat distribution. This Joule heating effect is more pronounced at higher voltages and can be minimized by reducing voltage, using a cooling system, or ensuring adequate buffer circulation [52].
Band Smearing: Diffuse, poorly resolved bands can stem from multiple causes, including sample degradation, excessive loading, incorrect gel concentration, or improper running conditions. Nucleic acid smearing often indicates nuclease contamination or degradation, while protein smearing may suggest incomplete denaturation or protease activity [52]. Solutions include using fresh reagents, optimizing loading amounts, verifying gel percentage suitability, and ensuring proper sample preparation.
Poor Resolution: Inadequate separation between adjacent bands frequently results from suboptimal gel concentration, excessive voltage, or incorrect run time. The gel concentration represents the most critical factor for resolution and should be carefully matched to the target size range [52]. Running gels at lower voltages for longer durations typically improves separation, particularly for molecules with small size differences.
No Bands or Faint Bands: Complete absence of signal or unexpectedly weak bands may indicate problems with sample integrity, loading errors, staining issues, or electrophoresis setup failures. Initial troubleshooting should include verification of sample concentration and quality, confirmation of proper power supply operation, and checking staining protocols [52]. Including appropriate positive controls and molecular weight markers helps distinguish between sample-related and technique-related problems.
Advanced Applications and Future Directions
The fundamental principles of gel electrophoresis continue to support innovative applications across biological research. Advanced electrophoretic techniques enable sophisticated analyses that build upon the basic optimization strategies discussed in this guide.
Two-Dimensional Gel Electrophoresis (2D-PAGE) combines isoelectric focusing (IEF) in the first dimension with SDS-PAGE in the second dimension to separate proteins based on both charge and molecular weight. This powerful technique can resolve thousands of protein spots from complex mixtures, making it invaluable for proteomic studies, biomarker discovery, and analysis of post-translational modifications.
In-Gel Activity Assays represent a specialized application of native PAGE that enables researchers to directly visualize enzyme activity after electrophoretic separation. This approach has been successfully applied to various enzyme classes, including dehydrogenases, phosphatases, and kinases [57]. For example, a recent adaptation for medium-chain acyl-CoA dehydrogenase (MCAD) used a colorimetric assay coupled with clear native PAGE to distinguish active tetramers from inactive forms in deficiency disorders, providing insights into structure-function relationships that would be obscured in conventional assays [57].
Capillary Electrophoresis has emerged as a high-throughput, automated alternative to traditional slab gel electrophoresis, particularly in clinical and analytical settings. This technique separates molecules in narrow capillaries filled with separation matrix, offering advantages in speed, resolution, and quantitative capabilities. Several automated western blotting systems now employ capillary electrophoresis, integrating separation, immobilization, and detection in streamlined workflows [59].
The ongoing development of specialized gel matrices, fluorescent labeling strategies, and detection systems continues to expand the applications and sensitivity of electrophoretic methods. As research questions grow more complex, the fundamental principles of gel percentage optimization remain essential for designing effective separation strategies across diverse biological disciplines.
Managing Heat Generation and Buffer Capacity for Consistent Results
In molecular biology, achieving consistent results in gel electrophoresis is fundamentally linked to managing two critical parameters: heat generation and buffer capacity. The electrophoresis process inherently produces heat due to electrical resistance, and this heat can cause numerous problems including band smearing, distorted migration, and even gel melting [62]. Furthermore, the buffer system's capacity to maintain a stable pH diminishes as it heats up and undergoes electrolysis, directly impacting separation reproducibility and the validity of downstream analyses [63]. This technical guide provides an in-depth examination of these challenges, offering detailed methodologies and optimized protocols to ensure reliable and reproducible results, with a specific focus on the context of choosing between denaturing and non-denaturing gels.
The principles of heat management and buffer chemistry apply across different electrophoretic techniques, but their specific implications can vary significantly between denaturing and native systems. This guide will therefore frame these core technical considerations within the strategic choice of gel type, providing a comprehensive resource for researchers, scientists, and drug development professionals.
Core Principles: Heat Generation and Buffer Chemistry
The Source and Impact of Joule Heating
During electrophoresis, the passage of an electric current through the buffer solution meets resistance, which converts electrical energy into thermal energy, a phenomenon known as Joule heating. The amount of heat generated is proportional to the square of the current (I) and the electrical resistance (R), according to the power equation (P = I²R) [63]. This heat is not uniformly distributed, often creating a temperature gradient that is highest in the center of the gel. The consequences for separation quality are severe:
- Band Smearing and Distortion: Excessive heat causes localized convection currents within the gel matrix, disrupting the orderly migration of molecules and leading to blurred or smeared bands [62].
- Altered Migration Rates: Biochemical reaction rates and macromolecule mobility are temperature-dependent. Uncontrolled heating accelerates migration unpredictably and can compromise resolution, particularly critical when determining molecular weights [63].
- Gel Degradation: In severe cases, especially with agarose gels, excess heat can physically melt the gel, ruining the experiment [62].
- Protein Denaturation in Native Gels: For non-denaturing protein electrophoresis, even moderate heat can disrupt the delicate tertiary and quaternary structures that the technique aims to preserve, leading to loss of enzyme activity or dissociation of complexes [2].
The Role and Depletion of Buffer Capacity
The buffer system in gel electrophoresis serves a dual purpose: it carries the current and establishes a stable pH environment essential for controlling the charge of the molecules being separated. Buffer capacity is a measure of a buffer's ability to maintain its pH upon the addition of acid or base. During a run, electrolysis at the electrodes produces H⁺ ions at the anode and OH⁻ ions at the cathode. A buffer with high capacity can effectively neutralize these ions, preventing significant pH shifts [63].
When the buffer capacity is exhausted, several problems arise:
- pH Shift: A change in the operational pH can alter the charge of proteins or nucleic acids, leading to aberrant migration patterns and poor separation.
- Reduced Buffer Conductivity: pH changes affect the ionic strength and conductivity of the buffer, which in turn alters the current and heat generation during the run, creating a vicious cycle.
- Irreproducible Results: Inconsistent buffer conditions are a primary source of poor inter-experimental reproducibility [63].
Table 1: Common Electrophoresis Buffers and Their Properties
| Buffer Type | Typical Use | pH Range | Key Characteristics | Considerations for Heat/Buffer Capacity |
|---|---|---|---|---|
| TAE (Tris-Acetate-EDTA) | DNA Agarose Gels | ~8.3 | Lower buffering capacity; preferred for longer DNA fragments. | More prone to pH shift and voltage drop during long runs; better for lower voltage applications [62]. |
| TBE (Tris-Borate-EDTA) | DNA/RNA Agarose & PAGE | ~8.3 | Higher buffering capacity; ideal for smaller fragments. | More stable pH for longer runs and higher voltages; but borate can interact with some sugars [62]. |
| Tris-Glycine-SDS | Denaturing SDS-PAGE | Stacking: ~6.8, Separating: ~8.8 (Laemmli system) | Discontinuous buffer system for sharp band stacking. | Running buffer pH is 8.3; system is sensitive to temperature and ion composition; high current can generate significant heat [7]. |
Experimental Protocols for Optimization
Protocol 1: Monitoring and Controlling Heat Generation
Objective: To execute an electrophoresis run while actively monitoring and mitigating the effects of Joule heating, ensuring optimal separation and band sharpness.
Materials:
- Pre-cast or laboratory-poured gel (Agarose or Polyacrylamide)
- Freshly prepared 1X running buffer (TAE, TBE, or Tris-Glycine-SDS as required)
- Power supply
- Cooling system (e.g., recirculating chiller, cooling plate, or cold room)
- Optional: Thermometer or thermal probe
Methodology:
- Initial Setup and Pre-cooling: Place the gel apparatus in a cold room (4°C) or connect it to a recirculating chiller if available. If using a pre-cast gel, ensure it is equilibrated to the recommended temperature before use [7].
- Buffer Management: Fill the upper and lower buffer chambers with a sufficient volume of fresh, pre-chilled 1X running buffer. Adequate buffer volume acts as a heat sink. Reusing buffer is not recommended for critical experiments as its ionic composition changes with use [64].
- Voltage Staging:
- Start at Low Voltage: Begin the run at a lower constant voltage (e.g., 80 V for SDS-PAGE). This allows samples to enter the gel matrix slowly and evenly, forming sharp bands before significant heat builds up [64] [7].
- Increase Voltage: Once the dye front has entered the separating gel completely, the voltage can be increased to the desired separation voltage (e.g., 120-125 V for many pre-cast SDS-PAGE gels) [64] [7].
- Monitoring: If possible, monitor the buffer temperature during the run. If the apparatus becomes warm to the touch, the voltage is likely too high. For systems without active cooling, reduce the voltage and extend the run time.
- Optimal Run Time: Terminate the run when the tracking dye (e.g., bromophenol blue) reaches the bottom of the gel. Over-running can cause bands to migrate off the gel and increases total heat exposure [64].
Troubleshooting:
- Problem: Smiling bands (bands curve upward at the edges). Solution: This indicates a temperature gradient, with the center of the gel being hotter than the edges. Improve cooling, reduce voltage, or ensure the gel apparatus is fully submerged in buffer.
- Problem: Band smearing throughout the gel. Solution: Reduce voltage to decrease heating; check for overloading of samples; verify sample integrity [62].
Protocol 2: Assessing and Maintaining Buffer Capacity
Objective: To evaluate the effective buffer capacity and ensure it remains sufficient for the duration of the electrophoresis run, thereby guaranteeing a stable pH environment.
Materials:
- Running buffer concentrate (e.g., 10X TAE or TBE)
- pH meter and standard solutions
- Deionized water
- Gel apparatus and power supply
Methodology:
- Fresh Buffer Preparation: Always prepare 1X working buffer from a high-quality concentrate using deionized water just before the run. Do not use buffers stored for extended periods [62] [64].
- Pre-Run pH Measurement: Measure and record the pH of the freshly prepared 1X running buffer. It should match the expected value (e.g., ~8.3 for TAE/TBE).
- Electrophoresis Execution: Run the gel according to the optimized protocol from Section 3.1.
- Post-Run pH Assessment: After the run is complete, carefully measure the pH of the buffer from both the anode and cathode chambers. A significant shift (e.g., >0.5 pH units) indicates that the buffer capacity was insufficient for the chosen running conditions.
- Corrective Actions: If a pH shift is observed, consider the following for the next experiment:
- Use a higher-capacity buffer (e.g., TBE instead of TAE for DNA gels).
- Increase the volume of running buffer.
- Prepare a fresh batch of buffer for every run, especially for longer or higher-voltage protocols.
- Do not reuse buffer for experiments requiring high reproducibility [64].
Diagram 1: Optimized voltage and temperature control workflow for consistent gel results.
The Scientist's Toolkit: Essential Reagents and Materials
Table 2: Key Research Reagent Solutions for Gel Electrophoresis
| Item | Function/Description | Considerations for Consistency |
|---|---|---|
| Pre-cast Gels | Commercially prepared gels (e.g., Novex Tris-Glycine) with standardized composition and well-defined shelf life. | Eliminates variability in gel pouring and polymerization; ensures consistent pore size and buffer conditions. Store at +4°C and use before expiration [7]. |
| High-Purity Buffer Concentrates | Pre-mixed, standardized running buffer concentrates (e.g., 10X Tris-Glycine-SDS). | Reduces batch-to-batch variation in pH and ionic strength. Dilute with high-quality water just before use for optimal performance and buffer capacity [7]. |
| Standardized Loading Dyes & Markers | Solutions containing tracking dyes (e.g., bromophenol blue) and molecular weight standards. | Provides visual control of run progress and allows for accurate size determination. Consistent use ensures reliable inter-experiment comparison [64]. |
| Liquid Reducing Agents | Stabilized reagents like DTT (e.g., NuPAGE Reducing Agent). | Prevents reoxidation of samples; more consistent than solid reagents that can degrade upon air exposure. Add immediately before loading the gel [7]. |
| Alternative Nucleic Acid Stains | Fluorescent dyes like SYBR Green or GelRed. | Safer alternatives to ethidium bromide with comparable or superior sensitivity, reducing hazardous waste [62]. |
Denaturing vs. Non-Denaturing Gels: A Contextual Framework
The choice between denaturing and non-denaturing gels is a critical strategic decision that directly influences how heat and buffer management must be approached.
Denaturing Gels (SDS-PAGE, Urea-PAGE): These gels incorporate agents like Sodium Dodecyl Sulfate (SDS) or urea that disrupt the native structure of proteins or nucleic acids. SDS coats proteins with a uniform negative charge, making separation dependent almost entirely on molecular weight [2]. In this context, the primary role of careful heat management is to prevent artifactual band distortion and smearing that would compromise molecular weight determination. Overheating can still degrade the denaturing agents and cause breakdown, but the sample is already linearized.
Non-Denaturing (Native) Gels: These gels preserve the higher-order structure, activity, and interaction complexes of the molecules. Separation depends on a complex interplay of size, charge, and shape [2]. Here, temperature control is absolutely paramount. Even moderate heat can denature proteins, dissociate complexes, or alter conformation, leading to incorrect interpretation of biological state and function. The buffer system is also more sensitive, as its pH and composition directly govern the intrinsic charge of the molecule without the masking effect of SDS.
Table 3: Comparative Analysis: Denaturing vs. Non-Denaturing Gels
| Parameter | Denaturing Gels | Non-Denaturing Gels |
|---|---|---|
| Sample State | Linearized and coated with denaturant (SDS/urea). | Native, folded structure is maintained. |
| Basis of Separation | Primarily molecular mass. | Size, charge, and 3D shape. |
| Sensitivity to Heat | High (to prevent band distortion and gel artifacts). | Extremely High (to prevent unfolding and loss of function). |
| Buffer System | Often discontinuous (e.g., Tris-Glycine-SDS); critical for stacking. | Simpler, continuous systems common; pH is crucial for native charge. |
| Typical Applications | Molecular weight determination, protein purity checks, Western blotting. | Enzyme activity assays, study of protein complexes/oligomeric state, DNA conformation analysis [2]. |
| Recommended Voltage | Often staged (e.g., 80V followed by 120-150V) [64] [7]. | Generally lower constant voltage (e.g., 100-125V) to minimize heat [7]. |
| Sample Preparation | Heated with SDS and reducing agent (for proteins) [7]. | Not heated; prepared in non-denaturing buffer [7] [2]. |
Diagram 2: A decision framework for selecting between denaturing and non-denaturing gels.
Mastering the management of heat generation and buffer capacity is non-negotiable for obtaining consistent, reliable, and interpretable results in gel electrophoresis. The strategies outlined—employing staged voltage, active cooling, using fresh high-capacity buffers, and selecting standardized reagents—form a robust foundation for experimental reproducibility. Ultimately, these technical considerations must be intelligently applied within the overarching strategic framework of your experimental goal, which dictates the critical choice between denaturing and non-denaturing systems. By integrating these principles, researchers can transform gel electrophoresis from a potential source of variability into a pillar of reproducible science.
The choice between denaturing and native gel electrophoresis is a fundamental decision that directly dictates how a sample must be prepared. This process can either preserve a biomolecule's native structure and function or dismantle it to analyze its core components. Denaturing gels unravel proteins and nucleic acids into their primary structures, separating them based primarily on molecular mass [2] [65]. In contrast, native gels maintain the intricate three-dimensional structure, quaternary interactions, and biological activity of the molecule, separating based on a combination of size, charge, and shape [2] [65].
The integrity of this entire analytical process hinges on sample preparation. Seemingly minor missteps in reagent selection, heating, or buffer formulation can introduce artifacts, compromise resolution, and lead to erroneous conclusions. This guide details the core pitfalls associated with reduction, heating, and buffer compatibility, providing structured protocols to ensure the fidelity of your electrophoretic results within the broader context of your research aims.
The Reduction Pitfall: Managing Disulfide Bonds
The use of reducing agents is a critical step in denaturing electrophoresis, but its misapplication is a common source of error. Reduction is essential for breaking disulfide bonds that hold protein subunits together, ensuring complete denaturation into individual polypeptides.
Common Reducing Agents and Protocols
Table 1: Common Reducing Agents for Denaturing Gel Electrophoresis
| Reducing Agent | Final Working Concentration | Key Properties | Stability and Handling |
|---|---|---|---|
| Dithiothreitol (DTT) | 50 mM [66] | Strong reducing agent; used to break protein disulfide bonds [65]. | Reoxidizes in storage; add to sample just before use (within 1 hour) [66]. |
| β-mercaptoethanol (BME) | 2.5% [66] | Reduces disulfide bonds; common in SDS boiling buffers [67]. | Volatile and pungent; less stable than DTT [66]. |
| Tris(2-carboxyethyl)phosphine (TCEP) | 50 mM [66] | Strong, odorless, and more stable than DTT; effective at a wider pH range. | More stable in solution; preferable for storing samples. |
Pitfalls and Experimental Protocol
A major pitfall is the re-oxidation of samples during storage, which leads to inconsistent results and the appearance of higher-order bands [66]. Furthermore, running reduced and non-reduced samples on the same gel risks cross-contamination if they are in adjacent lanes, as the reducing agent can diffuse and partially reduce the non-reduced sample [66].
Detailed Protocol for Sample Reduction (for SDS-PAGE):
- Prepare Sample Buffer: Use a buffer containing SDS (e.g., 5% SDS) and your chosen reducing agent at the specified final concentration [67].
- Mix Sample: Combine the protein sample with the prepared SDS-reduction buffer.
- Heat Denature: Heat the mixture at 85°C for 2–5 minutes [66]. This combination of heat, SDS, and reducing agent ensures complete denaturation and reduction.
- Immediate Use: Load the reduced sample onto the gel immediately. Avoid storing reduced samples, even frozen [66].
- Gel Loading Caution: If you must run both reduced and non-reduced samples on the same gel, do not load them in adjacent lanes. Leave at least one empty lane between them to prevent diffusion of the reducing agent [66].
The Heating Pitfall: Controlling Denaturation
Heating is a powerful tool for denaturing samples, but its application must be tailored to the chosen electrophoresis method. Incorrect heating can degrade samples or disrupt the native structures you intend to study.
Heating Conditions for Different Gel Types
Table 2: Guidelines for Heating Samples in Gel Electrophoresis
| Gel Type | Recommended Heating | Purpose | Key Risks of Improper Use |
|---|---|---|---|
| Denaturing Gels (SDS-PAGE) | 85°C for 2–5 minutes [66] | To denature proteins, break secondary structures, and ensure uniform SDS binding for separation by mass [65]. | Proteolysis can occur at 100°C [66]. |
| Non-denaturing (Native) Gels | Do not heat [66] | To preserve the native, functional state of the protein, including higher-order structure and enzymatic activity [65]. | Heat causes irreversible denaturation, aggregation, and loss of function [66]. |
Experimental Protocol for Heat Denaturation
The following workflow outlines the critical decision points for applying heat during sample preparation, ensuring compatibility with your ultimate analytical goal.
For Denaturing SDS-PAGE:
- Prepare your sample in an appropriate SDS-containing sample buffer with a reducing agent [65].
- Cap the tube tightly to prevent evaporation.
- Place the sample in a heat block or water bath set to 85°C for 2 to 5 minutes [66].
- Briefly centrifuge the tube to collect any condensation before loading onto the gel.
For Native (Non-denaturing) PAGE:
- Prepare your sample in a non-denaturing buffer compatible with the running system (e.g., without SDS or urea).
- Keep the sample on ice or at 4°C throughout preparation to maintain stability.
- Load the sample onto the gel without any heating step [66].
The Buffer Compatibility Pitfall: Maintaining Solubility and Charge
The composition of your sample buffer must be compatible with both your sample and the gel system. Incompatibilities can lead to precipitation, aggregation, or aberrant migration.
Buffer Composition for Different Techniques
- Denaturing Gels (SDS-PAGE): The sample buffer typically contains SDS (e.g., 1-5%) to denature proteins and confer a uniform negative charge, and glycerol (e.g., 5-10%) to increase density for gel loading [65] [67]. A common base buffer is Tris-HCl at pH 6.8 [67].
- Native Gels: Buffers avoid denaturants. They often use mild non-ionic detergents (e.g., IGEPAL CA-630) to maintain solubility without disrupting structure and glycerol for density [67]. The pH and ionic strength are carefully controlled to preserve protein charge and activity [65].
- Urea-Based Buffers: For techniques like IEF or 2D-PAGE, high concentrations of urea (9.5 M) are used as a denaturant. These buffers also contain non-ionic detergents and carrier ampholytes [67].
Pitfalls and Protocols
Key pitfalls include high salt concentrations, which increase conductivity and cause irregular migration and band smiling [66], and the presence of contaminants like genomic DNA, which increases viscosity [66] [67].
Protocol for Buffer Exchange and Cleanup:
- Dilution: For moderately high salt, a simple dilution with a low-ionic-strength buffer or water may suffice.
- Dialysis: For high salt or to change buffer compositions (e.g., removing guanidine-HCl), use dialysis against a large volume of compatible buffer [66].
- Precipitation and Resuspension: Precipitate proteins using TCA/acetone or other methods, then resuspend the pellet in the correct sample buffer [66].
- Nuclease Treatment: For viscous cell lysates, shear genomic DNA by sonication or pass through a narrow-gauge needle. Alternatively, treat with DNase/RNase (before adding SDS) or use OmniCleave Endonuclease, which is active in the presence of SDS [66] [67].
The Scientist's Toolkit: Essential Reagents
Table 3: Key Reagents for Sample Preparation in Gel Electrophoresis
| Reagent | Function | Example Use |
|---|---|---|
| Sodium Dodecyl Sulfate (SDS) | Ionic detergent that denatures proteins and confers uniform negative charge [65]. | Denaturing gel electrophoresis (SDS-PAGE) [2]. |
| Urea | Denaturant that disrupts hydrogen bonds without adding significant charge [2]. | Sample buffer for RNA gels or 2D-PAGE to maintain denatured state [68] [67]. |
| Dithiothreitol (DTT) | Reducing agent that breaks disulfide bonds [65]. | Denaturing gel electrophoresis for complete protein unfolding [66]. |
| IGEPAL CA-630 | Non-ionic detergent that solubilizes proteins without denaturation [67]. | Native gel sample buffers and lysis buffers for functional studies [67]. |
| Protease Inhibitors | Cocktail of compounds that inhibit proteolytic enzymes [67]. | Added to lysis and sample buffers to prevent protein degradation during preparation [67]. |
| OmniCleave Endonuclease | Enzyme that degrades DNA and RNA in the presence of SDS [67]. | Reduces sample viscosity in SDS-containing buffers prior to SDS-PAGE [67]. |
Navigating the pitfalls of sample preparation is not merely a technical exercise; it is a fundamental aspect of experimental design. The choices surrounding reduction, heating, and buffer compatibility directly determine the success of your electrophoresis and the validity of your conclusions. By aligning your sample preparation protocol with the strategic choice between denaturing and native gel systems—using reduction and heat to deconstruct or avoiding them to preserve—you ensure that the data you generate accurately reflects the biological reality you seek to understand. Adhering to the detailed protocols and guidelines provided here will empower researchers to achieve reproducible, high-quality results, advancing discovery in drug development and basic research.
The choice between denaturing and non-denaturing (native) gel electrophoresis is a critical branch point in experimental design, with profound implications for the success of downstream applications. This decision extends beyond the separation process itself to encompass the recovery of molecules from the gel matrix and their subsequent functionality. While denaturing gels provide superior resolution based primarily on molecular weight, they do so at the cost of structural integrity. Conversely, native gels preserve the intricate architecture and biological activity of macromolecules but present unique challenges for extraction and analysis [2] [12]. This technical guide examines the recovery considerations for molecules separated under both conditions, providing a framework for researchers to select the optimal electrophoretic strategy for their specific downstream applications in drug development and basic research.
Fundamental Differences Between Denaturing and Native Gel Systems
Denaturing Gel Electrophoresis
Denaturing gel electrophoresis employs chemical and thermal treatments to disrupt the native structure of biological molecules. For proteins, sodium dodecyl sulfate (SDS) binds in a constant ratio to confer a uniform negative charge, while reducing agents like dithiothreitol (DTT) or beta-mercaptoethanol break disulfide linkages [12] [50]. Heating samples to 70-100°C further ensures complete denaturation [65]. The result is a mixture of linear polypeptides whose migration depends almost exclusively on molecular weight, with smaller proteins migrating faster through the gel matrix [50].
For nucleic acids, denaturation is achieved using reagents such as urea, formaldehyde, DMSO, or glyoxal [2] [68]. These compounds disrupt hydrogen bonding, forcing RNA and DNA into single-stranded conformations that separate according to chain length rather than secondary structure.
Native Gel Electrophoresis
Non-denaturing gel electrophoresis preserves the higher-order structure and biological activity of macromolecules by omitting denaturants from sample buffers and running gels [2] [65]. Protein separation depends on a combination of intrinsic charge, molecular size, and three-dimensional shape [12] [65]. This technique maintains subunit interactions in multimeric proteins, allowing researchers to analyze quaternary structure and isolate functional complexes [65]. Similarly, native gels for nucleic acids preserve secondary structures like stem-loops and G-quadruplexes, enabling the study of conformational variants [2].
Table 1: Key Characteristics of Denaturing and Native Gel Electrophoresis
| Parameter | Denaturing Gels | Native Gels |
|---|---|---|
| Sample Treatment | Heated with SDS and reducing agents (proteins) or urea/formaldehyde (nucleic acids) [12] [50] | No heating; no denaturing agents [50] |
| Separation Basis | Primarily molecular weight [65] | Size, charge, and shape of native structure [65] |
| Structural Preservation | Destroys higher-order structure; produces linear molecules [12] | Preserves secondary, tertiary, and quaternary structure [65] |
| Biological Activity | Typically lost [12] | Often retained (e.g., enzymatic activity) [65] |
| Common Applications | Molecular weight determination, Western blotting, protein sequencing, assessing sample purity [2] [50] | Analysis of protein complexes, enzyme isolation, study of binding interactions, determination of aggregation state [2] [12] |
Recovery Methods and Considerations
General Recovery Techniques
Following electrophoresis, multiple techniques exist for extracting molecules from gel matrices. The choice of method depends on the gel composition (agarose vs. polyacrylamide), the size of the target molecule, and whether biological activity must be preserved.
Passive Diffusion involves crushing the gel slice and incubating it in an appropriate buffer to allow molecules to diffuse into the surrounding solution. This simple approach is particularly suitable for native gels where maintaining activity is paramount, though recovery yields can be variable and the process time-consuming [65].
Electro-elution uses an electric field to drive molecules out of the gel slice into a small volume of buffer contained within a specialized device. This method typically offers higher recovery yields and concentration than passive methods and is applicable to both denaturing and native systems [65].
Crush and Soak methods physically disrupt the gel matrix before incubation in buffer, increasing surface area to improve extraction efficiency. This technique works well for both agarose and polyacrylamide gels but may risk damage to fragile complexes from native separations.
Recovery Considerations for Denaturing Gels
Molecules recovered from denaturing gels are typically linearized and lack functional higher-order structure. While this makes them unsuitable for activity assays, the denatured state can be advantageous for certain applications. For example, proteins extracted from SDS-PAGE gels are ideal for proteomic analyses like in-gel digestion followed by mass spectrometry, where linear peptides are required for sequencing [65]. Similarly, RNA recovered from denaturing gels is suitable for techniques that require complete denaturation, such as Northern blotting [68].
A significant consideration when working with denaturing gels is the need to remove or neutralize denaturing agents before downstream applications. SDS must often be eliminated from protein samples through precipitation or chromatography techniques before attempting refolding or functional analysis.
Recovery Considerations for Native Gels
The primary advantage of native gel electrophoresis is the preservation of biological function, making proper recovery techniques essential for maintaining this functionality. To conserve the structural integrity of extracted molecules, several precautions are necessary throughout the recovery process [65].
Maintaining cool temperatures during and after electrophoresis minimizes thermal denaturation. Avoiding pH extremes prevents irreversible damage to proteins and nucleic acids. Using compatible buffers that preserve physiological conditions helps maintain activity. Including stabilizers such as glycerol, substrates, or cofactors in recovery buffers can enhance the stability of specific macromolecules.
For proteins, native recovery enables the isolation of active enzymes and intact protein complexes for functional studies, binding assays, or structural biology applications [12] [65]. For nucleic acids, native conditions preserve alternative conformations that may have biological significance, allowing researchers to study structure-function relationships.
Table 2: Recovery Considerations for Different Downstream Applications
| Downstream Application | Recommended Gel Type | Recovery Considerations | Key Advantages |
|---|---|---|---|
| Western Blotting | Denaturing (SDS-PAGE) [2] [50] | Electrotransfer directly from gel to membrane; no elution needed | Linearized proteins enhance antibody accessibility [50] |
| Protein Sequencing | Denaturing (SDS-PAGE) [2] [12] | In-gel digestion or electro-elution followed by protease treatment | Reduced structure improves protease accessibility [12] |
| Enzyme Activity Assays | Native [2] [65] | Passive diffusion or electro-elution in compatible buffers | Preserves catalytic function [65] |
| Analysis of Protein Complexes | Native [12] [50] | Mild elution conditions to maintain subunit interactions | Retains quaternary structure [12] |
| Northern Blotting | Denaturing (for RNA) [68] | Direct transfer or elution followed by precipitation | Linearized RNA improves hybridization efficiency [68] |
| Structural Studies | Native [65] | Electro-elution with structural stabilizers | Maintains native conformation |
Experimental Protocols
RNA Quality Assessment Using Native Gel Electrophoresis
The integrity of RNA samples is crucial for downstream applications like Northern hybridization, S1 nuclease mapping, and RT-PCR. A simplified native gel electrophoresis method using TBE- or TAE-based agarose gels provides a rapid assessment while minimizing exposure to hazardous chemicals like formaldehyde [68].
Protocol Steps:
- Prepare a 1.2% agarose gel in 1× TBE or TAE buffer.
- Mix RNA samples with native loading buffer (without denaturants).
- Load samples and run gel at 5-8 V/cm for 30-45 minutes.
- Stain with ethidium bromide or SYBR Safe and visualize under UV light.
Expected Results: Intact RNA displays sharp ribosomal bands (28S and 18S for eukaryotic RNA), with the 28S band approximately twice as intense as the 18S band. Degraded RNA appears as a smear, while DNA contamination is visible as discrete higher molecular weight bands [68]. This native approach reportedly produces better band intensity and integrity compared to denatured gel electrophoresis [69].
Protein Complex Isolation Using Native PAGE
Native polyacrylamide gel electrophoresis enables the separation and isolation of functional protein complexes while preserving their structural integrity and biological activity [12] [65].
Protocol Steps:
- Prepare polyacrylamide gel without SDS or reducing agents.
- Prepare protein samples in non-denaturing buffer (e.g., 50 mM Tris-Cl, pH 7.5).
- Do not heat samples before loading.
- Run electrophoresis at 4°C to minimize denaturation.
- For recovery, excise target band and use electro-elution or passive diffusion.
Recovery Buffer Composition: 50 mM Tris-HCl (pH 7.5), 150 mM NaCl, 1 mM DTT (if needed for stability), 10% glycerol (for protein stabilization). For enzymatic studies, include specific cofactors or substrates.
Downstream Applications: Isolated complexes can be used for enzymatic assays, protein-protein interaction studies, structural analysis, or further purification steps [65].
The Scientist's Toolkit: Essential Research Reagents
Table 3: Key Reagents for Gel-Based Separation and Recovery
| Reagent/Material | Function | Application Notes |
|---|---|---|
| SDS (Sodium Dodecyl Sulfate) | Anionic detergent that denatures proteins and confers uniform charge [12] [50] | Essential for SDS-PAGE; must be removed for refolding studies |
| DTT or β-Mercaptoethanol | Reducing agents that break disulfide bonds [12] [50] | Critical for complete denaturation; omit in native protocols |
| Urea/Formaldehyde | Denaturants for nucleic acids [2] [68] | Disrupt hydrogen bonding; hazardous alternatives available [68] |
| Acrylamide/Bis-acrylamide | Forms cross-linked polymer network for gel matrix [65] | Pore size varies with concentration; affects separation range |
| TEMED/Ammonium Persulfate | Catalyzes acrylamide polymerization [65] | Fresh APS solution recommended for consistent results |
| Glyoxal/DMSO | Alternative RNA denaturants [2] | Less hazardous than formaldehyde [68] |
| Protease Inhibitors | Prevent protein degradation during recovery [65] | Crucial for native gel recovery to maintain integrity |
| RNase Inhibitors | Prevent RNA degradation [68] | Essential for working with RNA in both native and denaturing gels |
Decision Framework and Workflow Integration
Selecting the appropriate electrophoretic method requires careful consideration of downstream objectives. The following decision framework visualizes the key factors in choosing between denaturing and native gel systems for optimal recovery and application success.
Diagram 1: Decision Framework for Gel Electrophoresis and Recovery Strategy
Beyond the initial choice between denaturing and native conditions, successful integration of electrophoresis with downstream applications requires consideration of several additional factors. For structural biology applications such as X-ray crystallography or cryo-EM, native gel separation followed by gentle electro-elution provides samples with preserved quaternary structure [65]. For proteomic analyses, denaturing gel separation coupled with in-gel digestion enables comprehensive protein identification, though recent advances in native mass spectrometry are creating new opportunities for analysis of intact complexes [65] [70].
The volume and concentration requirements of downstream applications must also guide recovery method selection. Electro-elution typically yields more concentrated samples than passive diffusion, making it preferable for techniques requiring substantial material. When scaling up preparative separations, continuous-elution systems like the Prep Cell offer advantages for collecting large quantities of purified proteins while maintaining biological activity [70].
The choice between denaturing and native gel electrophoresis fundamentally shapes the recovery strategy and downstream application potential of separated molecules. Denaturing conditions offer simplicity and molecular weight-based resolution at the expense of structural integrity, making them ideal for analytical techniques like western blotting and protein sequencing. Native electrophoresis preserves biological function and complex architecture, enabling the isolation of active enzymes and intact macromolecular assemblies. By carefully matching the electrophoretic method to downstream requirements and implementing appropriate recovery techniques, researchers can maximize the value of gel-based separations in both basic research and drug development pipelines.
Validation Strategies: Confirming Results and Comparing Method Efficacy
In molecular biology research, the strategic selection and cross-validation of electrophoretic methods are critical for generating robust, reproducible data. This technical guide provides researchers and drug development professionals with a structured framework for choosing between denaturing and non-denaturing gel electrophoresis techniques. We present a comprehensive comparison of system fundamentals, separation characteristics, and appropriate applications, supported by detailed methodologies and decision-making algorithms. By implementing the cross-validation approaches outlined herein, scientists can optimize experimental design for characterizing macromolecular structure, function, and interactions, ultimately enhancing research reliability in pharmaceutical development and basic science.
Gel electrophoresis serves as a cornerstone analytical technique in molecular biology laboratories worldwide, enabling separation of macromolecules based on their physical properties. The fundamental principle involves migrating charged molecules through a porous gel matrix under the influence of an electric field. The critical distinction in approach lies in choosing whether to maintain the native conformation of the molecule or to denature it into linear chains, a decision that profoundly impacts the type of information obtained from the experiment.
Denaturing gels disrupt the natural structure of proteins or nucleic acids using chemical agents such as sodium dodecyl sulfate (SDS) for proteins or urea for DNA/RNA, effectively unfolding them into linear chains [2] [6]. This process masks intrinsic charge and eliminates the influence of molecular shape, rendering separation dependent primarily on molecular weight [71]. In contrast, native gels (non-denaturing gels) preserve the higher-order structure of macromolecules, enabling separation based on a combination of charge, size, and shape [6] [71]. This preservation of native conformation allows researchers to study functional states, enzymatic activity, and molecular interactions that would be disrupted under denaturing conditions [50].
The cross-validation of results using multiple electrophoretic methods provides a powerful approach to verify experimental findings and gain comprehensive understanding of macromolecular properties. For researchers in drug development, where characterization of therapeutic proteins and nucleic acids is paramount, selecting the appropriate electrophoresis technique can significantly impact assay outcomes and subsequent development decisions.
Core Principles and Separation Characteristics
Denaturing Electrophoresis Systems
Denaturing gel electrophoresis employs chemical treatments to unfold macromolecules into linear chains, effectively eliminating the influence of higher-order structure on migration. For protein analysis, SDS-PAGE (sodium dodecyl sulfate polyacrylamide gel electrophoresis) represents the most widely used denaturing technique [71]. The process involves heating proteins in a buffer containing SDS and a reducing agent (DTT or β-mercaptoethanol), which cooperatively disrupts secondary and tertiary structure while conferring a uniform negative charge density along the polypeptide backbone [50]. This treatment transforms proteins into rod-like structures whose electrophoretic mobility correlates linearly with the logarithm of their molecular mass [71].
For nucleic acids, denaturing conditions typically employ urea or formamide to disrupt hydrogen bonding between bases, preventing formation of secondary structures [2] [14]. This is particularly important for RNA analysis and applications requiring precise size determination of nucleic acid fragments. Denaturing polyacrylamide gels can achieve single-base resolution for fragments smaller than 100 bases, making them indispensable for sequencing applications and RNase protection assays [14].
The primary advantage of denaturing systems lies in their simplified separation mechanism, where mobility depends almost exclusively on molecular mass rather than complex structural features [2]. This enables accurate molecular weight estimation and assessment of sample purity without confounding variables related to macromolecular shape or intrinsic charge variations.
Native Electrophoresis Systems
Non-denaturing gel electrophoresis preserves the native conformation and biological activity of macromolecules throughout the separation process. For proteins, this maintains enzymatic function, ligand binding capabilities, and protein-protein interactions that would be disrupted under denaturing conditions [50]. Separation in native gels depends on both the intrinsic charge of the molecule at the running pH and the molecular size and shape [6] [71]. This multi-parameter separation mechanism can provide information about the oligomeric state and structural integrity of macromolecular complexes.
Several specialized native gel systems have been developed for particular applications. Blue Native PAGE (BN-PAGE) uses Coomassie brilliant blue dye to confer charge to protein complexes, enabling separation of intact membrane protein complexes and supra-molecular structures [71]. Clear Native PAGE (CN-PAGE) represents a milder alternative that relies solely on the intrinsic charge of proteins without introducing charged dye molecules, making it suitable for FRET analyses and preserving labile supramolecular assemblies [71]. Preparative Native PAGE allows isolation of folded protein complexes in physiological buffers for subsequent functional analyses or metal cofactor identification [71].
For nucleic acids, non-denaturing gels preserve secondary structures such as hairpins, cruciforms, and G-quadruplexes that influence biological function [72]. This enables study of structural polymorphisms and their impact on protein-DNA interactions relevant to transcriptional regulation and drug targeting.
Table 1: Comparative Analysis of Denaturing vs. Native Gel Electrophoresis
| Parameter | Denaturing Gels | Native Gels |
|---|---|---|
| Structure Preservation | Unfolds macromolecules into linear chains | Preserves secondary, tertiary, and quaternary structure |
| Separation Basis | Molecular mass/weight primarily | Size, shape, and intrinsic charge |
| Protein Conditions | SDS, reducing agents, heat | No SDS, no reducing agents, no heat |
| Nucleic Acid Conditions | Urea, formamide, DMSO/glyoxal | Standard buffers without denaturants |
| Molecular Weight Determination | Accurate estimation possible | Not reliable due to shape/charge influence |
| Biological Activity | Lost during separation | Often retained after separation |
| Key Applications | Molecular weight estimation, purity assessment, Western blotting | Enzyme activity assays, protein complexes, oligomeric state |
Methodological Guide for Technique Selection
Experimental Objectives and Decision Framework
Selecting the appropriate electrophoresis method requires careful consideration of experimental goals and the specific biological questions being addressed. The following decision framework provides a systematic approach to technique selection based on research objectives:
Molecular Weight Determination: For accurate molecular weight estimation of protein subunits or nucleic acid fragments, denaturing gels are unequivocally recommended [2] [71]. The linear relationship between log molecular weight and mobility in SDS-PAGE enables precise size determination when appropriate standards are used.
Purity Assessment and Western Blotting: When evaluating sample homogeneity or preparing for immunoblotting, denaturing conditions are preferred as they provide the highest resolution for detecting contaminants and minimize antibody cross-reactivity with conformational epitopes [2] [50].
Enzymatic Activity Studies: For experiments requiring preservation of biological function, such as enzyme activity assays or characterization of catalytic complexes, native gels are essential as they maintain protein folding and active site integrity [2] [50].
Protein Complex and Oligomeric State Analysis: When investigating quaternary structure, protein-protein interactions, or supramolecular assemblies, native electrophoresis (particularly BN-PAGE) provides the necessary preservation of non-covalent interactions [71] [50].
Nucleic Acid Structure-Function Relationships: For studying DNA or RNA secondary structures, DNA-protein interactions, or topological variants, non-denaturing gels preserve the relevant structural features that influence electrophoretic mobility [72].
The following workflow diagram illustrates the decision process for selecting appropriate electrophoresis methods based on experimental goals:
Gel Matrix and Buffer Selection Guidelines
The choice of gel matrix and running buffer significantly impacts separation efficiency and resolution. The following guidelines inform appropriate selection based on sample characteristics:
Agarose vs. Polyacrylamide: Agarose gels, with larger pore sizes, are ideal for separating nucleic fragments in the range of 50 bp to 50,000 bp, while polyacrylamide gels provide superior resolution for smaller molecules (5-3,000 bp) and can achieve single-nucleotide resolution [14]. For proteins, polyacrylamide is the standard matrix, with concentration optimized for the target size range.
Gel Concentration Optimization: The percentage of agarose or polyacrylamide determines pore size and must be matched to the size range of target molecules. The tables below provide recommended percentages for efficient separation:
Table 2: Agarose Gel Percentage Recommendations for DNA Separation
| Agarose Percentage | Separation Range (bp) |
|---|---|
| 0.5% | 2,000 - 50,000 |
| 0.7% | 800 - 12,000 |
| 1.0% | 400 - 8,000 |
| 1.2% | 300 - 7,000 |
| 1.5% | 200 - 3,000 |
| 2.0% | 100 - 2,000 |
| 3.0% | 25 - 1,000 |
| 4.0% | 10 - 500 |
Table 3: Polyacrylamide Gel Percentage Recommendations
| Polyacrylamide Percentage | Denaturing Gels (bases) | Non-denaturing Gels (bp) |
|---|---|---|
| 4.0% | 100 - 500 | - |
| 5.0% | 70 - 400 | 80 - 500 |
| 6.0% | 40 - 300 | - |
| 8.0% | 30 - 200 | 60 - 400 |
| 10.0% | 20 - 100 | - |
| 12.0% | - | 50 - 200 |
| 15.0% | 10 - 50 | 25 - 150 |
| 20.0% | 5 - 30 | 5 - 100 |
- Buffer System Considerations: Discontinuous buffer systems (e.g., Tris-glycine) enhance band sharpness through ion stacking [71]. For protein work, lower pH buffer systems (e.g., bis-tris) minimize cysteine disulfide formation and improve gel stability [71]. For nucleic acids, TBE (Tris-borate-EDTA) offers better resolution for smaller fragments compared to TAE (Tris-acetate-EDTA) [73].
Cross-Validation Experimental Protocols
Denaturing SDS-PAGE for Protein Analysis
Protocol Objective: To separate protein mixtures based on molecular weight for size estimation, purity assessment, or subsequent Western blotting.
Materials and Reagents:
- SDS-PAGE gel (appropriate percentage for target protein size)
- SDS running buffer (25 mM Tris, 192 mM glycine, 0.1% SDS, pH 8.3)
- 2× SDS sample buffer (125 mM Tris-HCl, pH 6.8, 4% SDS, 20% glycerol, 0.02% bromophenol blue)
- Reducing agent (100 mM DTT or 5% β-mercaptoethanol)
- Protein molecular weight standards
- Heating block (95-100°C)
Methodology:
- Prepare protein samples by mixing with equal volume of 2× SDS sample buffer containing fresh reducing agent.
- Denature samples by heating at 95-100°C for 5-10 minutes [50].
- Briefly centrifuge samples to collect condensation and load into gel wells alongside pre-stained molecular weight standards.
- Run electrophoresis at constant voltage (typically 100-150V) until dye front approaches bottom of gel.
- Process gel for staining (Coomassie, silver, or fluorescent stains) or transfer to membrane for immunoblotting.
Critical Steps for Reproducibility:
- Maintain consistent sample preparation conditions (heating time, reduction efficiency) [28].
- Ensure fresh electrophoresis buffer to maintain proper pH and conductivity.
- Include appropriate controls and molecular weight standards in each run.
- For quantitative comparisons, load samples within linear detection range of staining method.
Blue Native PAGE for Protein Complex Analysis
Protocol Objective: To separate intact protein complexes under non-denaturing conditions for studying oligomeric states, protein-protein interactions, and complexome profiling.
Materials and Reagents:
- Native PAGE gel (4-16% gradient recommended)
- Anode buffer (50 mM Bis-Tris, pH 7.0)
- Cathode buffer (50 mM Tricine, 15 mM Bis-Tris, 0.02% Coomassie G-250, pH 7.0)
- Sample buffer (50 mM NaCl, 50 mM Imidazole/HCl, 2 mM 6-aminohexanoic acid, 1 mM EDTA, pH 7.0)
- Digitonin or dodecyl maltoside for membrane protein solubilization
- Native protein molecular weight standards
Methodology:
- Solubilize protein complexes using mild non-ionic detergents (digitonin for mild extraction or dodecyl maltoside for complete solubilization) [71].
- Prepare samples in native sample buffer without heating or reduction.
- Add Coomassie G-250 to samples (0.25-0.5% final concentration) to impart charge for electrophoresis.
- Load samples onto gradient gel and run at constant voltage (typically 25-100V) with cathode buffer containing Coomassie dye.
- Electrophoresis should be performed at 4°C to maintain complex stability during extended run times.
- Process gel for in-gel activity assays or transfer to membrane for immunodetection.
Critical Steps for Reproducibility:
- Optimize detergent-to-protein ratio for complete but gentle complex solubilization.
- Maintain low temperature throughout electrophoresis to preserve complex integrity.
- Use mild Coomassie concentration to prevent complex dissociation while ensuring sufficient charge shift.
- Include appropriate native molecular weight standards for size estimation.
Nucleic Acid Conformation Analysis
Protocol Objective: To separate nucleic acids based on structural conformation for studying DNA topology, RNA folding, or protein-nucleic acid interactions.
Materials and Reagents:
- Non-denaturing agarose or polyacrylamide gel (percentage matched to fragment size)
- TBE or TAE running buffer
- DNA/RNA molecular weight standards
- 6× native loading dye (30% glycerol, 0.25% bromophenol blue)
- Ethidium bromide or SYBR-safe nucleic acid stain
Methodology:
- Prepare nucleic acid samples in appropriate buffer without denaturants.
- Mix samples with native loading dye (avoiding heating unless specifically required).
- Load samples onto non-denaturing gel alongside appropriate size standards.
- Run electrophoresis at low voltage (4-6V/cm for agarose) to minimize heating effects.
- Maintain constant temperature during run to ensure consistent structural conformations.
- Stain gel with intercalating dye and visualize under UV illumination.
Critical Steps for Reproducibility:
- Control buffer composition and ionic strength to maintain consistent structural states.
- Avoid excessive voltage that generates heat and causes conformational changes.
- Include controls of known conformation for comparison.
- For topological variants, include appropriate markers (supercoiled, linear, relaxed circular).
Research Reagent Solutions
Successful electrophoresis experiments require high-quality reagents with appropriate specifications. The following table details essential materials and their functions:
Table 4: Essential Reagents for Electrophoresis Experiments
| Reagent/Category | Function/Purpose | Key Considerations |
|---|---|---|
| Acrylamide/Bis-acrylamide | Forms polyacrylamide gel matrix | Neurotoxic; molecular biology grade recommended; %T and %C determine pore size [72] |
| Agarose | Forms agarose gel matrix | Electroendosmosis (EEO) affects resolution; genetic quality for nucleic acids; clarity for visualization [72] |
| SDS (Sodium Dodecyl Sulfate) | Denatures proteins, confers negative charge | High purity critical for consistent binding; anionic detergent [71] |
| DTT/β-Mercaptoethanol | Reduces disulfide bonds in proteins | Fresh preparation needed; DTT preferred for stronger reducing power [28] |
| Urea | Denatures nucleic acids by disrupting H-bonds | Deionized form prevents degradation; concentration typically 7-8M [2] [14] |
| TEMED/Ammonium Persulfate | Catalyzes acrylamide polymerization | TEMED oxidizes easily; APS solution should be fresh [72] |
| Coomassie Dyes | Protein staining; charge conferral in BN-PAGE | Can dissociate complexes at high concentrations [71] |
| Tracking Dyes | Visualize migration progress | Bromophenol blue common; anionic small molecules [71] |
Data Interpretation and Cross-Validation Strategies
Analyzing Electrophoretic Patterns
Interpreting gel electrophoresis results requires understanding the distinctive patterns associated with different separation mechanisms:
Denaturing Gels: Expect single, tight bands corresponding to polypeptide chains or linear nucleic acids. Multiple bands may indicate proteolytic degradation, alternative splicing products, or incomplete denaturation. Smearing suggests sample degradation, overloading, or improper denaturation [28].
Native Gels: Band patterns reflect both size and shape heterogeneity. Multiple bands may represent different oligomeric states or conformational variants rather than different proteins. Broader bands are common due to shape heterogeneity [71].
Shift Assays: In native gels, mobility shifts following treatment (e.g., with crosslinkers or binding partners) indicate interactions or conformational changes. For example, protein-DNA interactions can be detected through reduced mobility (band shift) in non-denaturing gels [72].
Cross-Validation Approaches
Implementing cross-validation strategies strengthens experimental conclusions and controls for technique-specific artifacts:
Orthogonal Method Verification: Confirm denaturing gel results with complementary techniques such as mass spectrometry for molecular weight verification or chromatography for purity assessment. Validate native gel findings with analytical ultracentrifugation or light scattering for size/hydrodynamic radius.
Two-Dimensional Electrophoresis: Combine separation dimensions (e.g., BN-PAGE followed by SDS-PAGE) to resolve complex mixtures. This approach identifies protein components within complexes while maintaining their association state information [71].
Comparative Mobility Analysis: Run identical samples under both denaturing and native conditions to distinguish size-based migration from shape/charge effects. Significant differences in relative mobility indicate substantial tertiary structure influence.
Reference Standard Inclusion: Always include appropriate molecular weight standards matched to gel conditions. For native gels, use proteins of known oligomeric state rather than denatured standards.
The relationship between experimental objectives and appropriate cross-validation strategies is illustrated below:
Strategic selection and cross-validation of electrophoresis methods significantly enhance experimental robustness in molecular biology research and drug development. Denaturing techniques provide simplified separation based primarily on molecular weight, while native methods preserve structural features and biological activities that define macromolecular function. The comprehensive framework presented herein enables researchers to match appropriate electrophoretic approaches to specific experimental questions, implement validated protocols, and interpret results within the context of each technique's capabilities and limitations.
By adopting the cross-validation strategies outlined in this guide, scientists can generate more reliable data, avoid technique-specific artifacts, and obtain complementary information that provides deeper insight into macromolecular properties. As electrophoretic methods continue to evolve alongside advancements in separation science and detection technologies, the fundamental principles of appropriate technique selection and experimental validation will remain essential for rigorous scientific investigation.
Gel electrophoresis serves as a fundamental analytical tool in molecular biology and proteomics, yet accurate interpretation of migration patterns requires a sophisticated understanding of multiple influencing factors. This technical guide examines the principles governing macromolecular migration in both denaturing and non-denaturing gel systems, providing researchers with a comprehensive framework for analyzing electrophoresis results. Within the broader context of selecting appropriate electrophoretic conditions, we detail how gel composition, buffer systems, macromolecular conformation, and staining methodologies collectively influence separation efficiency and analytical outcomes. Through systematic comparison of migration characteristics under varying conditions and implementation of optimized protocols, researchers can significantly enhance the reliability of molecular weight determinations, purity assessments, and structural analyses critical to drug development and basic research.
Gel electrophoresis separates macromolecules based on their differential migration through a porous matrix under the influence of an electric field. The fundamental principle governing this separation relies on the fact that negatively charged molecules migrate toward the positive electrode (anode), with their velocity inversely correlated to molecular size in most systems [36] [74]. The porous gel matrix acts as a molecular sieve, restricting larger molecules more significantly than smaller ones, thereby enabling size-based separation [75]. This migration occurs through a process described as "biased reptation," where the leading edge of the DNA molecule moves forward and pulls the remainder of the molecule through the gel matrix [36].
The electrophoretic mobility of molecules depends on multiple factors beyond size alone, including intrinsic charge, molecular conformation, gel composition, and buffer conditions [2] [36]. In routine practice, distance migrated is inversely proportional to the logarithm of the molecular weight, establishing a semi-logarithmic relationship that enables size estimation using appropriate standards [36]. Understanding these core principles provides the essential foundation for accurate interpretation of gel electrophoresis results across various applications, from simple DNA fragment separation to complex protein profiling.
Fundamental Differences Between Denaturing and Non-Denaturing Gels
The choice between denaturing and non-denaturing (native) gel systems represents a critical methodological decision that profoundly impacts experimental outcomes and interpretive approaches. These systems differ fundamentally in their treatment of macromolecular structure, subsequently influencing separation mechanisms and analytical applications.
Denaturing gels disrupt the native structure of biological macromolecules using agents such as urea for DNA/RNA or SDS for proteins [2]. This process creates linearized molecules whose migration depends primarily on molecular mass and intrinsic charge, with SDS-PAGE specifically conferring a uniform negative charge-to-mass ratio that eliminates charge-based separation [2]. The elimination of secondary and tertiary structure simplifies migration behavior, making denaturing systems particularly valuable for precise molecular weight determination and assessing sample purity [2].
In contrast, non-denaturing gels preserve the intrinsic structure and biological activity of macromolecules during separation [2]. Migration in these systems depends not only on molecular mass but also on the overall bulk, cross-sectional area, and native charge of the molecule [2]. This preservation enables the study of protein complexes, enzymatic activity, and quaternary structures in their functional states, making native gels essential for investigating binding interactions and structural heterogeneity [2].
Table 1: Applications of Denaturing Versus Non-Denaturing Gel Systems
| Application | Denaturing Gels | Non-Denaturing Gels |
|---|---|---|
| Molecular Weight Determination | Ideal due to direct mass-mobility relationship | Less accurate due to structural influences |
| Purity Assessment | Excellent for detecting contaminants | Limited by complex migration patterns |
| Structural Studies | Eliminates structure | Preserves native conformation |
| Enzyme Activity | Destroys activity | Maintains activity for functional assays |
| Binding Interactions | Disrupts complexes | Maintains protein-protein/DNA interactions |
| Cost and Complexity | Higher due to denaturants | Simpler and more cost-effective |
The selection between these systems should align with experimental objectives: denaturing gels for precise size-based separation and purity analysis, versus non-denaturing gels for functional studies and structural investigations [2]. This strategic decision establishes the foundation for appropriate experimental design and accurate result interpretation.
DNA Migration Patterns and Interpretation
Factors Influencing DNA Migration
DNA migration through agarose gels is influenced by multiple interconnected factors that collectively determine separation efficiency and resolution. Gel concentration significantly affects pore size, with lower percentage gels (0.5-0.7%) optimal for larger DNA fragments (1,000-30,000 bp), while higher percentages (1.5-4.0%) better resolve smaller fragments (10-3,000 bp) [76]. The applied voltage also critically impacts resolution, with lower voltages (1-5 V/cm) providing superior separation for larger fragments, while higher voltages can generate excessive heat that distorts band morphology and compromises resolution [36].
The conformation of DNA molecules profoundly affects their electrophoretic mobility, with supercoiled covalently closed circular (CCC) DNA migrating faster than linear forms of identical molecular weight due to its compact structure [75]. Buffer composition influences ionic strength and conductivity, with TAE (Tris-acetate-EDTA) and TBE (Tris-borate-EDTA) representing the most common systems, each with distinct advantages for specific applications [36]. Additionally, the presence of intercalating dyes such as ethidium bromide can reduce DNA mobility by approximately 15% due to altered charge and stiffness [36].
Interpretation of Common DNA Band Patterns
Accurate interpretation of DNA gel electrophoresis requires recognizing characteristic band patterns associated with different molecular forms and potential artifacts.
Table 2: Common DNA Forms and Their Migration Characteristics
| DNA Form | Structural Features | Migration Characteristics |
|---|---|---|
| Supercoiled CCC Monomer | Compact, twisted structure | Fastest migration; most compact form |
| Linear Monomer | Double-strand breaks at both ends | Intermediate migration; cleaved by restriction enzymes |
| Open Circular (OC) Monomer | Single-strand break; relaxed | Slower migration than supercoiled and linear forms |
| OC Dimer/Concatemer | Oligomeric forms | Slowest migration; approximately double monomer size |
Undigested plasmid DNA typically displays two distinct bands: a prominent lower band representing the supercoiled covalently closed circular (CCC) form, and a fainter upper band corresponding to the open circular (OC) form resulting from single-strand nicks [75]. Complete restriction digestion produces a single band of linearized plasmid that migrates between the supercoiled and open circular forms [75]. Incompletely digested plasmids may exhibit multiple bands representing various partial digestion products, while genomic DNA typically appears as a high molecular weight smear near the well due to its substantial size and heterogeneity [75].
PCR products generally manifest as discrete, well-defined bands corresponding to the amplified target sequence, though secondary bands may indicate non-specific amplification or primer dimer formation [77]. Primer dimers, resulting from primer self-annealing, appear as fast-migrating bands near the gel front [75]. Systematic analysis of these band patterns within the context of experimental parameters enables accurate assessment of DNA quality, quantity, and structural characteristics.
Protein Electrophoresis Under Denaturing and Native Conditions
Two-Dimensional Polyacrylamide Gel Electrophoresis (2D-PAGE)
Two-dimensional polyacrylamide gel electrophoresis (2D-PAGE) represents a powerful proteomic tool that separates proteins based on two distinct properties: isoelectric point in the first dimension and molecular weight in the second dimension [78]. This technique enables the resolution of hundreds to thousands of protein spots from complex biological samples, facilitating comprehensive proteome analysis, post-translational modification detection, and differential expression profiling [78]. The high resolution achieved through orthogonal separation principles makes 2D-PAGE particularly valuable for detecting subtle protein modifications and isoforms that would co-migrate in one-dimensional systems.
Quantitative analysis of 2D-PAGE gel images presents significant computational challenges due to spot pattern complexity and gel-to-gel variations [78]. Advanced software tools like MatGel implement image processing algorithms including TopHat filtering and watershed segmentation to automate spot detection and quantification [78]. These computational approaches transform analog gel images into quantitative data representing protein abundance and distribution, enabling robust statistical comparisons across experimental conditions.
Specialized Techniques: DGGE and TTGE
Denaturing gradient gel electrophoresis (DGGE) and temporal temperature gradient gel electrophoresis (TTGE) represent specialized approaches that separate DNA fragments of identical length based on sequence-dependent melting properties [53]. In DGGE, separation occurs in a polyacrylamide gel containing a linear gradient of chemical denaturants (urea and formamide), while TTGE employs a temperature gradient during electrophoresis [53]. Both techniques exploit the principle that DNA duplexes begin melting from discrete domains with lower thermodynamic stability, with partially melted molecules exhibiting markedly reduced electrophoretic mobility [53].
These techniques have proven particularly valuable for microbial community analysis and species identification, as demonstrated in studies discriminating five different Candida species using the NL1-GC/LS2 primer set targeting the D1 region of the 26-28S rRNA gene [53]. Although both DGGE and TTGE generate comparable separation patterns, TTGE offers practical advantages through easier performance and lower operational costs [53]. The application of these techniques enables researchers to detect sequence variations without sequencing, making them valuable tools for population studies and diagnostic applications.
Essential Methodologies and Protocols
Agarose Gel Electrophoresis Protocol
The following protocol outlines standardized methodology for agarose gel electrophoresis of DNA samples, incorporating critical steps for optimal resolution and accurate interpretation:
Gel Preparation: Prepare an agarose solution at an appropriate concentration (0.5%-3.0%) in running buffer (TAE or TBE) [36]. Heat the mixture until the agarose is completely dissolved, then cool to approximately 65°C before adding ethidium bromide to a final concentration of 0.5 μg/ml [36]. Pour the molten agarose into a casting tray with well comb and allow to solidify completely.
Sample Preparation: Mix DNA samples with 6X loading dye containing 0.25% bromophenol blue, 0.25% xylene cyanol, and 30% glycerol [36]. The dye facilitates tracking migration progress and increases sample density for proper well loading.
Electrophoresis Conditions: Place the solidified gel in an electrophoresis chamber filled with running buffer to cover the gel surface [36]. Load DNA samples and appropriate molecular weight standards into wells. Apply voltage of 1-5 V/cm between electrodes [36]. Run until the tracking dyes have migrated an appropriate distance through the gel.
Visualization and Documentation: Following electrophoresis, visualize DNA bands under UV light using a gel documentation system [36]. Capture digital images for permanent recording and analysis, adjusting contrast and color balance as needed for optimal clarity [77].
Troubleshooting Common Electrophoresis Issues
Systematic evaluation of gel quality and electrophoresis conditions is essential for reliable result interpretation. Common issues include:
Smearing: Caused by DNA overloading, excessive voltage, gel melting, or insufficient buffer [77]. Remedy by reducing DNA load, lowering voltage, increasing gel concentration, or ensuring adequate buffer volume.
Atypical Band Spreading: May result from improper gel polymerization, non-uniform buffer distribution, or excessive heating during electrophoresis [77].
Crooked Lane Migration: Often caused by uneven gel setting, electrode misalignment, or buffer imbalance [77]. Ensure level casting surface and properly positioned electrodes.
Faint or Absent Bands: May indicate insufficient DNA loading, degraded samples, inactive staining, or incomplete electrophoresis [77]. Verify DNA quantity and quality, stain activity, and running time.
Methodical troubleshooting based on these common patterns enables researchers to identify and rectify technical issues, ensuring generation of reliable, interpretable results.
Table 3: Research Reagent Solutions for Gel Electrophoresis
| Reagent | Composition/Type | Function in Electrophoresis |
|---|---|---|
| Agarose | Polysaccharide from seaweed | Gel matrix for DNA separation |
| Polyacrylamide | Acrylamide-bisacrylamide | Gel matrix for protein/small DNA fragments |
| TAE Buffer | Tris-acetate-EDTA | Running buffer for DNA electrophoresis |
| TBE Buffer | Tris-borate-EDTA | Running buffer for high-resolution DNA separation |
| Ethidium Bromide | Phenanthridine intercalator | DNA staining by intercalation |
| SYBR Safe | Cyanide dye alternative | Less toxic DNA staining option |
| Loading Dye | Bromophenol blue/xylene cyanol/glycerol | Tracking migration and increasing density |
| SDS | Sodium dodecyl sulfate | Protein denaturation and charge uniformity |
| Urea | Carbamide denaturant | Nucleic acid denaturation |
Quantitative Analysis and Data Interpretation
Molecular Weight Determination and Standard Curves
Accurate size determination of separated molecules requires appropriate molecular weight standards and proper curve fitting methodologies. DNA ladders containing fragments of known size enable construction of semi-logarithmic standard curves plotting migration distance against logarithm of molecular weight [77]. These reference curves then facilitate size estimation of unknown samples based on their relative migration positions [77]. For optimal accuracy, standards should be run in both the first and last lanes of each gel to detect and account for any migration irregularities across the gel width [77].
In protein electrophoresis, molecular weight determination under denaturing conditions relies on the linear relationship between log molecular weight and relative mobility established by protein standards [2]. This relationship enables precise molecular weight estimation, though accuracy depends on complete denaturation and uniform charge-to-mass ratios achieved through SDS binding [2]. For native protein electrophoresis, molecular weight estimation is less precise due to structural influences on mobility, though comparison with native protein standards can provide approximate size information.
Advanced Computational Analysis
Modern electrophoresis analysis increasingly incorporates sophisticated computational approaches for quantitative data extraction, particularly in complex applications like 2D-PAGE [78]. The MatGel program exemplifies this trend, implementing automated image alignment, spot detection, and intensity quantification through watershed segmentation algorithms [78]. This computational approach minimizes human error and enables high-throughput analysis of multiple gel images simultaneously, significantly enhancing reproducibility and statistical power in proteomic studies [78].
For routine one-dimensional analyses, basic image processing software enables background subtraction, band intensity quantification, and molecular weight estimation through comparison with co-electrophoresed standards [77]. These quantitative approaches transform electrophoretic separations from qualitative assessments to robust analytical measurements, supporting detailed comparative studies and rigorous statistical analysis essential for publication-quality research and drug development applications.
Interpretation of gel electrophoresis migration patterns requires integrated consideration of multiple experimental parameters, including gel type, buffer conditions, macromolecular conformation, and detection methodology. Understanding the fundamental differences between denaturing and non-denaturing systems enables appropriate experimental design and accurate data interpretation across diverse applications. Through systematic implementation of optimized protocols, methodological troubleshooting, and quantitative analysis approaches, researchers can extract maximum information from electrophoretic separations. This comprehensive understanding of migration patterns enhances research reliability across molecular biology, proteomics, and drug development, ensuring appropriate conclusions from this foundational analytical technique.
Molecular Weight Markers and Standards for Both Systems
Molecular weight markers, also referred to as standards or ladders, are indispensable tools in gel electrophoresis workflows for researchers, scientists, and drug development professionals. These standards contain biomolecules of known molecular weight and, in some cases, known concentration, allowing for the estimation of both the size and quantity of unknown samples run in adjacent lanes on a gel [79]. The critical choice between denaturing and non-denaturing gel systems directly dictates the appropriate molecular weight marker, as the underlying separation principles are fundamentally different. Denaturing gel systems, such as SDS-PAGE for proteins or gels containing urea for nucleic acids, disrupt the native structure of the molecules, resulting in separation based primarily on molecular mass or length [2] [50]. In contrast, non-denaturing (or native) gel systems preserve the higher-order structure, activity, and interactions of the biomolecules, causing separation to depend on a combination of mass, charge, and shape [6] [12]. This guide provides an in-depth technical examination of the markers and standards available for both systems, enabling informed selection and application in research and development.
Molecular Weight Markers for Denaturing Systems
Principles and Applications
In denaturing gel electrophoresis, the three-dimensional structure of proteins and nucleic acids is unfolded into linear chains. For proteins, this is typically achieved using the detergent sodium dodecyl sulfate (SDS) and a reducing agent like dithiothreitol (DTT) or beta-mercaptoethanol, which break disulfide bonds [50] [12]. The SDS coats the proteins, conferring a uniform negative charge. This means that during SDS-PAGE, the protein's intrinsic charge is negated, and separation occurs almost exclusively based on polypeptide chain length, allowing for accurate molecular weight estimation [12]. Denaturing conditions are essential for applications such as estimating protein molecular weight, establishing sample purity, western blotting, and preparing for protein sequencing [2] [50].
Types of Protein Markers for Denaturing Gels
A wide variety of protein markers are commercially available, formulated for different needs and detection methods. The table below summarizes the key types and their characteristics.
Table 1: Types of Protein Molecular Weight Markers for Denaturing Gels
| Marker Type | Key Characteristics | Common Applications | Examples |
|---|---|---|---|
| Unstained | High accuracy for size determination; requires post-electrophoresis staining (e.g., Coomassie, silver) for visualization [80]. | Accurate molecular weight determination; calibration of pre-stained markers [80]. | mPAGE Unstained Protein Standards (10-200 kDa) [80]. |
| Pre-stained | Proteins are covalently linked to dyes, allowing real-time visualization during electrophoresis; useful for monitoring transfer efficiency in western blotting [80] [81]. | Tracking electrophoresis progress; optimizing western blot transfer [80]. | mPAGE Colorful Protein Standards (10-203 kDa); Spectra Multicolor Ladders (10-260 kDa) [80] [81]. |
| Multicolored | A type of pre-stained marker where different proteins are conjugated to distinct chromophores, yielding a colored ladder [81]. | Same as pre-stained, with easier band identification during and after the run. | PageRuler (3 colors, 10-250 kDa) [81]. |
| Specialized | Includes biotinylated markers (detectable with streptavidin-HRP) [80] and markers for specific mass ranges (e.g., ultra-low range) [80]. | Western blotting standards; analysis of low molecular weight proteins. | Pierce Biotinylated MW Marker (20-120 kDa); Ultra-Low Range Marker (1-26 kDa) [80]. |
Molecular Weight Markers for Non-Denaturing Systems
Principles and Applications
Non-denaturing (native) gel electrophoresis is performed without SDS or reducing agents, and samples are not heated prior to loading [7] [50]. This preserves the protein's secondary, tertiary, and quaternary structures, its native charge, and often its enzymatic activity [6] [12]. Consequently, separation depends on the protein's size, shape, and intrinsic charge [2] [12]. The overall bulk or cross-sectional area of the macromolecule is a major factor in its migration through the gel matrix [2]. Native gels are the system of choice for studying protein-protein interactions, determining the aggregation state of a protein, isolating enzymes for activity assays, and analyzing protein complexes in their intact, functional form [50] [12].
Markers for Native Gels
The requirement to maintain native conformation poses a unique challenge for molecular weight markers in non-denaturing systems.
- Specialized Native Markers: Unlike denaturing gels where markers provide a direct readout of polypeptide chain mass, markers for native gels must themselves be native, folded proteins. Suppliers offer non-denaturing protein markers composed of stable proteins with known molecular weights and migration properties under native conditions [80]. These are essential for providing a size reference, though the estimate remains approximate due to the influence of charge and shape.
- Limitations on Molecular Weight Estimation: It is critical to note that because migration depends on both mass and charge, a standard curve from native markers does not allow for precise molecular weight determination of an unknown protein as it does in SDS-PAGE [12]. The primary function of the marker is to provide a rough size estimate and to monitor the progress of the electrophoretic run.
A Guide to Selecting the Appropriate Marker
Choosing the correct molecular weight marker is pivotal for experimental success. The following workflow diagram outlines the key decision points based on the gel system and experimental goal.
Key Selection Criteria
- Gel System Compatibility: The single most important factor is matching the marker to the gel system. Using an SDS-based pre-stained marker in a native gel will not provide a valid size reference and may contaminate the system.
- Experimental Objectives: The choice between unstained, pre-stained, and specialized markers hinges on the downstream application, as detailed in the workflow above.
- Size Range: Select a marker whose range of protein sizes brackets the expected molecular weight of your target protein(s) for accurate interpolation [81].
- Detection Method: Consider how you will visualize the results. Unstained markers are ideal for general protein staining, while fluorescent or biotinylated markers are designed for specific detection modalities like western blotting [80].
Essential Reagents and Experimental Protocol
Research Reagent Solutions
The following table catalogs essential materials required for executing both denaturing and non-denaturing protein gel electrophoresis.
Table 2: Key Reagents for Protein Gel Electrophoresis
| Reagent / Material | Function | Denaturing System | Non-Denaturing System |
|---|---|---|---|
| Gel Matrix | Sieving matrix for separation. | Polyacrylamide gel [30]. | Polyacrylamide gel [30]. |
| Sample Buffer | Prepares sample for loading. | Tris-Glycine SDS Sample Buffer (contains SDS) [7]. | Tris-Glycine Native Sample Buffer (SDS-free) [7]. |
| Reducing Agent | Breaks disulfide bonds. | DTT or β-mercaptoethanol [7] [50]. | Not used. |
| Running Buffer | Conducts current, defines pH. | Tris-Glycine SDS Running Buffer [7]. | Tris-Glycine Native Running Buffer [7]. |
| Molecular Weight Marker | Size and progress standard. | SDS-compatible (e.g., unstained, pre-stained) [80]. | Native, SDS-free marker [80]. |
Detailed Protocol for SDS-PAGE and Native PAGE
The protocol below, adapted from standard procedures for pre-cast gels, highlights the critical differences between denaturing and non-denaturing workflows [7].
1. Sample Preparation:
- For Denaturing SDS-PAGE: Mix protein sample with Tris-Glycine SDS Sample Buffer (2X). For reduced samples, add a reducing agent (e.g., DTT) to a final concentration of 1X. Heat the mixture at 85°C for 2-5 minutes to denature the proteins [7].
- For Non-Denaturing PAGE: Mix protein sample with Tris-Glycine Native Sample Buffer (2X). Do not add SDS or a reducing agent. Do not heat the sample [7].
2. Gel Preparation:
- Use a pre-cast polyacrylamide gel appropriate for your target protein's size.
- Rinse the wells with the corresponding 1X running buffer immediately before loading.
3. Loading and Electrophoresis:
- Load the prepared samples and the appropriate molecular weight marker into separate wells.
- Fill the upper and lower buffer chambers with the correct 1X running buffer (SDS or Native).
- Connect the power supply and run the gels. A typical condition for a mini-gel is 125 V constant voltage.
4. Post-Electrophoresis Analysis:
- After the run, carefully open the cassette and process the gel for the intended application:
- Staining: Use Coomassie, silver stain, or other methods to visualize protein bands.
- Western Blotting: Transfer proteins from the gel to a membrane for immunodetection.
- Activity Assay: For native gels, the gel can be used directly in enzymatic activity assays.
The judicious selection of molecular weight markers and standards is a fundamental aspect of experimental design in gel electrophoresis. The choice is irrevocably linked to the selection of the gel system itself—denaturing or non-denaturing—each of which provides distinct and complementary information about the target biomolecule. Denaturing systems and their corresponding markers are unparalleled for determining polypeptide molecular mass, assessing purity, and preparing for western blotting. Non-denaturing systems and specialized native markers are indispensable for probing functional aspects of proteins, such as complex formation, quaternary structure, and enzymatic activity. By understanding the principles, available tools, and methodologies outlined in this guide, researchers and drug development professionals can strategically employ these techniques to advance their scientific objectives, ensuring robust, reliable, and interpretable results.
The characterization of biomolecules, particularly proteins, requires a sophisticated selection of analytical techniques to elucidate both structural and functional properties. The choice of initial separation method—specifically, between denaturing and non-denaturing gel electrophoresis—profoundly influences the applicability and success of subsequent analytical stages, including mass spectrometry (MS), chromatography, and spectroscopic validation. This guide provides an in-depth technical framework for selecting the appropriate electrophoretic method based on research objectives and details how downstream analytical techniques are deployed to generate a comprehensive biomolecular profile. Within drug development and basic research, the integration of these methods is paramount for understanding protein function, purity, stability, and interaction, forming the bedrock of rational therapeutic design.
The decision to use a denaturing or non-denaturing gel is foundational, as it determines the type of information that can be extracted. Non-denaturing (native) gels preserve the protein's higher-order structure, including secondary, tertiary, and quaternary configurations, allowing for the analysis of functional states, protein complexes, and enzymatic activity [2]. In contrast, denaturing gels, such as SDS-PAGE, disrupt non-covalent interactions and, with reducing agents, break disulfide bonds, effectively unfolding the protein into a linear chain whose migration is primarily dependent on molecular mass [2] [82]. This initial separation strategy dictates which complementary techniques will be most informative for further analysis.
Core Principles: Denaturing vs. Non-Denaturing Gels
Fundamental Mechanisms and Applications
The operational differences between these two electrophoretic methods stem from the sample preparation and gel chemistry. As detailed in Table 1, the key distinctions lie in the use of denaturants and the resulting state of the protein.
Table 1: Comparative Analysis of Denaturing and Non-Denaturing Gel Electrophoresis
| Parameter | Denaturing Gels (e.g., SDS-PAGE) | Non-Denaturing Gels (Native-PAGE) |
|---|---|---|
| Key Reagents | SDS, DTT (or β-mercaptoethanol), urea [2] [82] | Non-denaturing buffers (e.g., Tris-Glycine), no SDS [82] |
| Protein State | Denatured; unfolded linear chains [2] [82] | Native; folded, active structures preserved [2] [82] |
| Charge Properties | Negative charge from SDS overwhelms protein's intrinsic charge [82] | Migration depends on protein's intrinsic charge [2] [82] |
| Separation Basis | Primarily molecular mass [2] | Molecular mass, overall bulk/shape, and intrinsic charge [2] [82] |
| Key Applications | - Molecular weight determination- Establishing sample purity- Western blot preparation- Protein sequencing [2] | - Enzyme activity assays- Analysis of protein complexes & quaternary structure- Studying protein-protein interactions- Isozyme analysis [2] [82] |
In denaturing gels, SDS (sodium dodecyl sulfate) acts as a detergent that breaks hydrogen bonds and unfolds the protein, while uniformly coating the polypeptide with negative charges. DTT (dithiothreitol) acts as a reducing agent to break disulfide bonds between cysteine residues, ensuring complete unfolding [82]. This process standardizes the charge-to-mass ratio, allowing separation based almost exclusively on molecular weight.
In native gels, the absence of these denaturants means a protein's migration depends on its native charge, size, and shape. For basic proteins (positively charged at neutral pH), the electrophoresis setup may even require reversing the cathode and anode to facilitate proper migration toward the negative electrode [82]. A critical technical consideration for Native-PAGE is temperature control; high voltages can generate heat and denature proteins, so often requires an ice bath or cooling apparatus to maintain protein activity during the run [82].
Strategic Selection Guide
The choice between these methods is dictated by the primary research question, as their outputs are complementary.
- Use a Non-Denaturing Gel When:
- The goal is to isolate functional enzymes or other proteins whose activity must be preserved post-separation [2].
- You need to determine the oligomeric state or hierarchical structure (e.g., monomer vs. multimer) of a protein [2].
- You are studying protein-protein or protein-ligand binding interactions [2].
- Use a Denaturing Gel When:
- The primary objective is to determine the molecular weight of the polypeptide chain or establish the purity of a protein sample [2].
- You are preparing samples for downstream techniques like western blotting or protein sequencing [2].
- You need to separate individual protein subunits that are part of a larger complex.
The following workflow diagram illustrates the decision-making process for selecting the appropriate gel method and connecting it to subsequent analytical techniques.
Downstream Analytical Methodologies
Mass Spectrometry (MS) Workflows
Mass spectrometry is a cornerstone technique for protein identification and characterization, and its application is directly influenced by the upstream gel electrophoresis method.
3.1.1 Post-Denaturing Gel MS Analysis: Proteins separated by SDS-PAGE are typically identified through a bottom-up proteomics approach. The process involves excising the protein band from the gel, followed by in-gel digestion with a protease like trypsin. The resulting peptides are then extracted and analyzed by Liquid Chromatography-Tandem Mass Spectrometry (LC-MS/MS). In this workflow, the LC component separates the complex peptide mixture, which is then introduced into the mass spectrometer. The MS first measures the mass-to-charge ratio (m/z) of intact peptide ions (MS1), then selects specific precursors for fragmentation to generate MS/MS spectra. These spectra provide sequence information that is used to identify the original protein by searching against protein databases [83]. Modern LC-MS systems incorporate workflow intelligence to automate and improve data quality. For example, intelligent reflex workflows can automatically reinject samples if carryover is detected or if an analyte concentration is above the calibration range, ensuring reliable quantitative results [84].
3.1.2 Post-Native Gel MS Analysis: For proteins separated via Native-PAGE, Intact Protein Mass Spectrometry is often the method of choice. This approach, frequently using electrospray ionization (ESI) sources which gently produce gas-phase ions from delicate macromolecules, allows for the direct measurement of the mass of the entire, folded protein complex [83]. This is powerful for determining the stoichiometry of protein complexes, identifying post-translational modifications present on the native structure, and studying protein-ligand interactions without disrupting the non-covalent bonds that hold the complex together.
Liquid Chromatography (LC) Techniques
Chromatography provides a high-resolution complement to gel-based separations, often in a more quantitative and automatable format.
- Reversed-Phase Chromatography (RPC): This is the most common LC mode coupled with MS, especially following proteolytic digestion. It separates peptides based on hydrophobicity. While excellent for peptides and denatured proteins, its use of organic solvents and acidic conditions makes it unsuitable for native protein complexes.
- Size Exclusion Chromatography (SEC): This technique separates proteins based on their hydrodynamic volume (size and shape). It is inherently a non-denaturing method and is ideal for following up on Native-PAGE results. SEC can be used to determine the native molecular weight, assess the homogeneity of a protein preparation, and isolate specific oligomeric states. It can be coupled with multi-angle light scattering (MALS) for absolute molecular weight determination.
- Ion Exchange Chromatography (IEX): IEX separates proteins based on their intrinsic charge, which aligns closely with the separation principle of Native-PAGE. It is highly effective for separating protein isoforms or charge variants while maintaining the protein in a native, active state.
Spectroscopic Validation Methods
Spectroscopy provides biophysical validation of protein structure and stability, offering insights that are orthogonal to separation-based techniques.
- Circular Dichroism (CD) Spectroscopy: CD is used to quantify the secondary structure (alpha-helix, beta-sheet) of proteins in solution. It is an essential tool for validating that a protein purified under non-denaturing conditions has maintained its correct fold. It can also be used in stability studies to monitor unfolding as a function of temperature or denaturant.
- UV-Vis Spectroscopy: While simple, UV-Vis is crucial for quantifying protein concentration (via absorbance at 280 nm) and for detecting the presence of cofactors or ligands that have characteristic chromophores. This is vital for functional studies on active proteins isolated via native methods.
Method Validation in LC-MS
The implementation of robust LC-MS methods, particularly for quantitative analysis in regulated environments like drug development, requires rigorous validation. This process ensures that the method is fit for purpose and generates reliable, reproducible data. Key performance characteristics must be evaluated [83].
Table 2: Key Validation Parameters for Quantitative LC-MS Methods
| Validation Parameter | Description & Significance | Common LC-MS Specific Challenges |
|---|---|---|
| Selectivity/Specificity | Ability to accurately measure the analyte in the presence of matrix components [83]. | - Ion suppression/enhancement from co-eluting compounds in the ESI source [83]. |
| Limit of Detection (LoD) | The lowest concentration at which the analyte can be detected [83]. | Signal-to-noise ratio can be affected by chemical background noise [83]. |
| Limit of Quantification (LoQ) | The lowest concentration that can be quantified with acceptable precision and accuracy [83]. | Requires sufficient signal intensity and stability above the LoD [83]. |
| Linearity | The ability of the method to elicit results proportional to analyte concentration [83]. | Can be compromised by detector saturation or matrix effects at high concentrations [83]. |
| Precision | The closeness of agreement between independent results (repeatability, intermediate precision) [83]. | Affected by instrument stability, sample preparation, and ionization efficiency [83]. |
| Trueness/Accuracy | The closeness of agreement between the average value and a true or accepted reference value [83]. | Best assessed using certified reference materials (CRMs) or spike-recovery experiments [83]. |
| Robustness | A measure of the method's reliability during normal, deliberate variations in method parameters [83]. | Sensitive to changes in mobile phase pH, flow rate, and ion source parameters [83]. |
A critical LC-MS-specific validation challenge is the matrix effect, where co-eluting compounds from the sample matrix can alter the ionization efficiency of the target analyte, leading to either suppression or enhancement of the signal [83]. This effect must be carefully investigated and mitigated, often through improved chromatographic separation, sample clean-up, or the use of stable isotope-labeled internal standards.
Experimental Protocols
Detailed Protocol: Native-PAGE for Protein Complex Analysis
This protocol is adapted for separating and analyzing functional protein complexes [82].
Sample Preparation:
- Lyse cells or tissues using a gentle method such as ultrasonication in a non-denaturing buffer (e.g., without SDS or reducing agents).
- Centrifuge the lysate at high speed (e.g., 12,000-16,000 x g) for 15-30 minutes at 4°C to remove insoluble debris. The supernatant contains the soluble native proteins.
- Mix the sample with a 5X Non-Denaturing Loading Buffer. Critical: Do not heat the sample.
Gel Casting and Electrophoresis:
- Prepare a non-denaturing polyacrylamide gel. A common gradient is 4-16% acrylamide, but the percentage should be optimized for the target protein's size.
- The gel and running buffer (e.g., Tris-Glycine) must not contain any denaturants.
- Load the samples and run the electrophoresis under constant voltage (e.g., 100-150 V). Important: Place the electrophoresis tank in an ice bath or use a cooling unit to prevent heat-induced denaturation. For basic proteins, reverse the polarity of the electrodes.
Post-Electrophoresis Analysis:
- In-Gel Activity Staining: If the target is an enzyme, the gel can be incubated with a specific substrate to visualize active bands based on enzymatic reaction.
- Protein Staining: For general protein visualization, use Coomassie Brilliant Blue or silver staining kits according to the manufacturer's protocol [82].
- Electroelution for Recovery: To recover the active protein, excise the band of interest, place it in a dialysis bag with an appropriate buffer, and perform electroelution in a standard tank at low temperature for 2-3 hours [82].
Detailed Protocol: LC-MS Method Development and Optimization
This protocol outlines the steps for developing a robust LC-MS method for peptide analysis post-digestion [84].
Method Scouting:
- Use a standardized mixture of your target analytes to scout for optimal chromatographic conditions (column chemistry, mobile phase pH, gradient profile).
MS Parameter Optimization:
- Utilize intelligent software tools (e.g., MassHunter Optimizer) for automated end-to-end method development [84].
- The optimization workflow typically involves two phases:
Method Validation:
- Following optimization, perform a validation study assessing the parameters listed in Table 2 (Selectivity, LoD, LoQ, Linearity, Precision, Accuracy, Robustness) [83].
- Specifically test for matrix effects by comparing the analyte response in a pure solution to the response when spiked into the biological matrix.
The Scientist's Toolkit: Essential Reagents and Materials
Table 3: Key Research Reagent Solutions for Integrated Biomolecular Analysis
| Item Category | Specific Example(s) | Function & Application |
|---|---|---|
| Gel Electrophoresis | - Non-Denaturing Protein Loading Buffer (5X) [82]- 30% Acrylamide/Bis-Acrylamide (29:1) [82]- Tris-Glycine Electrophoresis Buffer (10X) [82] | - Prepares native protein samples for loading without denaturation.- Forms the polyacrylamide matrix for size-based separation.- Provides the ionic environment for native protein electrophoresis. |
| Protein Staining | - Coomassie Brilliant Blue Staining Kit [82]- Silver Staining Kit [82] | - Detects protein bands in gels with moderate sensitivity.- Provides high-sensitivity detection of protein bands, useful for low-abundance targets. |
| Mass Spectrometry | - Trypsin (Sequencing Grade)- Stable Isotope-Labeled Internal Standards (SIL IS) | - Proteolytic enzyme for in-gel digestion, generating peptides for LC-MS/MS.- Corrects for sample loss and matrix effects in quantitative LC-MS. |
| Chromatography | - C18 Reversed-Phase LC Columns- Size Exclusion Chromatography (SEC) Columns | - High-resolution separation of peptides for MS analysis.- Separation of native protein complexes by hydrodynamic size. |
| Sample Integrity | - Broad-Spectrum Protease Inhibitor Cocktail [82]- Phosphatase Inhibitor Mixture [82] | - Prevents proteolytic degradation of protein samples during extraction and analysis.- Preserves the phosphorylation state of proteins in functional studies. |
Gel electrophoresis stands as a foundational analytical technique in biochemistry and molecular biology, with ever-expanding applications in pharmaceutical research and development. This technique's ability to separate complex mixtures of proteins, nucleic acids, and other biomolecules based on physical properties like size and charge makes it indispensable for characterizing drug targets, validating therapeutic candidates, and ensuring product quality. Within the context of a broader thesis on choosing between denaturing and non-denaturing gels, this guide examines specific, successful applications of both methodologies in the drug development pipeline. The strategic selection of gel type—whether denaturing conditions that unfold biomolecules to analyze primary structure or native conditions that preserve higher-order structure and interactions—directly impacts the quality and interpretability of data critical for decision-making in pharmaceutical sciences. From initial target identification through pre-clinical testing and clinical biomarker validation, gel electrophoresis provides a versatile, accessible, and powerful means to interrogate biological systems and therapeutic interventions at the molecular level. This document presents detailed case studies and protocols that exemplify how both denaturing and native gel electrophoresis have been successfully employed to overcome specific challenges in bringing new therapeutics to market.
Core Principles: Denaturing vs. Non-Denaturing Gels
The fundamental choice between denaturing and non-denaturing gel electrophoresis dictates the type of information that can be obtained from an experiment. This choice is guided by the experimental objective: whether the goal is to analyze the primary structure and molecular weight of a biomolecule or to probe its native conformation, functional activity, and interaction networks.
Denaturing Gels disrupt the native structure of proteins or nucleic acids, unfolding them into linear chains. For proteins, this is typically achieved with Sodium Dodecyl Sulfate (SDS), an anionic detergent that coats the polypeptide backbone, imparting a uniform negative charge and masking the protein's intrinsic charge [85]. Reducing agents like β-mercaptoethanol or dithiothreitol (DTT) are often added to break disulfide bonds. For nucleic acids, denaturation is commonly accomplished with urea or formamide, which disrupts hydrogen bonding between bases [2] [6]. In these gels, separation depends primarily on molecular mass (for SDS-PAGE) or linear length (for nucleic acids), as the charge-to-mass ratio is made nearly uniform for all molecules. This allows for accurate molecular weight determination, purity assessment, and analysis of primary structure [2] [85].
Non-Denaturing (Native) Gels are run under conditions that preserve the native, folded structure of the analyte. No denaturing agents are used. Consequently, a biomolecule's migration depends on a combination of its intrinsic charge, size, and shape (three-dimensional conformation) [2] [6]. This enables the analysis of all levels of biomolecular structure, including secondary, tertiary, and quaternary structures for proteins, and the secondary structure for nucleic acids. Native gels are therefore ideal for studying protein-protein interactions, enzyme activity, and protein complexes in their functional state [2].
Table 1: Comparative Overview of Denaturing vs. Non-Denaturing Gels
| Feature | Denaturing Gels | Non-Denaturing Gels |
|---|---|---|
| Analytical Focus | Purity, molecular weight, primary structure [2] [85] | Native conformation, oligomeric state, functional activity, protein-protein/nucleic-acid interactions [2] [6] |
| Key Reagents | SDS (for proteins); Urea (for DNA/RNA) [2] [85] | No denaturants; may use mild detergents like Triton X-100 or digitonin [2] |
| Separation Basis | Molecular mass/size almost exclusively [85] | Combined effect of size, shape, and intrinsic charge [2] [6] |
| Typical Applications in Drug Discovery | Western blotting, protein sequencing, establishing sample purity [2] [86] | Isolating active enzymes, studying protein binding, determining hierarchical state (e.g., circular vs. linear DNA) [2] |
| Pros | High resolution for mass-based separation; simple data interpretation; highly reproducible [85] | Preserves biological function and interactions; can measure activity in-gel [2] |
| Cons | Destroys native structure and function | Complex migration patterns; more challenging to interpret precisely [2] |
Case Study 1: Analysis of a Biologic Drug using Denaturing SDS-PAGE
Background and Objective
The characterization of a monoclonal antibody (mAb) therapeutic requires rigorous analysis of its purity and structural integrity. Even minor degradation, such as fragmentation or incomplete reduction, can impact efficacy and safety. This case study outlines the use of denaturing SDS-PAGE, specifically under reducing and non-reducing conditions, to assess the purity and subunit structure of a candidate mAb during downstream process development.
Experimental Protocol
1. Sample Preparation:
- Reducing Condition: The mAb sample is diluted in a sample buffer containing SDS, glycerol, Tris-HCl, and a tracking dye. A reducing agent, DTT (or β-mercaptoethanol), is added to a final concentration of 50-100 mM. The mixture is heated at 95°C for 5-10 minutes to ensure complete denaturation and reduction of inter-chain disulfide bonds [85].
- Non-Reducing Condition: The sample is prepared identically but without any reducing agent. This preserves the disulfide bonds that hold the antibody chains together.
2. Gel Casting and Electrophoresis:
- A discontinuous polyacrylamide gel system is used. A stacking gel (typically 4-5% acrylamide) is poured on top of a resolving gel (recommended 8% or 10% acrylamide for analyzing mAbs) [85].
- The prepared samples and a pre-stained protein ladder are loaded into the wells.
- Electrophoresis is performed at a constant voltage of 100-150 V until the dye front reaches the bottom of the gel (approximately 40-60 minutes) [85].
3. Post-Electrophoresis Analysis:
- The gel is carefully removed from the cassette and stained with Coomassie Brilliant Blue or a more sensitive fluorescent stain to visualize the protein bands [85].
- The gel is imaged using a documentation system, and band intensities can be quantified via densitometry to determine the relative abundance of different species (e.g., intact antibody vs. fragments) [85].
Results and Interpretation
Under reducing conditions, the mAb is separated into its constituent polypeptide chains: a heavy chain (~50 kDa) and a light chain (~25 kDa). The presence of a single, sharp band for each indicates high purity, while additional bands suggest proteolytic degradation or other impurities.
Under non-reducing conditions, the intact mAb (approximately 150 kDa) is the predominant species. The presence of lower molecular weight bands indicates fragments (e.g., half-antibodies) resulting from incomplete assembly or disulfide bond scrambling. This simple yet powerful comparative analysis provides critical quality control data, ensuring the drug substance meets predefined specifications for identity and purity before advancing to more complex analytical stages.
Case Study 2: Studying a Protein-Protein Interaction with Native PAGE
Background and Objective
Understanding the interaction between a drug target protein and its native binding partner is crucial for validating the target and for screening potential inhibitors. This case study demonstrates the application of non-denaturing Polyacrylamide Gel Electrophoresis (Native PAGE) to study the formation of a protein complex between a kinase and its regulatory subunit.
Experimental Protocol
1. Sample Preparation:
- The individual proteins (Kinase and Regulatory Subunit) are prepared in a non-denaturing buffer without SDS or reducing agents.
- An in vitro binding reaction is set up by incubating the two proteins together at a specific molar ratio in a suitable binding buffer for 30-60 minutes on ice.
2. Native Gel Electrophoresis:
- A polyacrylamide gel (e.g., 6-8%) is cast and run without SDS in both the gel and the running buffer. The running buffer typically has a neutral or slightly basic pH to maintain protein stability.
- The samples (individual proteins and the mixture) are loaded, and electrophoresis is performed at a constant voltage (e.g., 100 V) at 4°C to prevent complex dissociation due to heat.
3. In-Gel Activity Assay:
- Since the proteins are in their native state, their activity can be assessed directly in the gel. Following electrophoresis, the gel is incubated with a specific substrate and reagents for the kinase. A colorimetric or fluorescent precipitate forms at the location of active kinase, allowing for visualization.
Results and Interpretation
In the Native PAGE gel, the kinase-regulatory subunit complex, being larger and having a different net charge/shape than the individual proteins, will migrate to a distinct position. The in-gel activity stain will reveal bands corresponding to the active kinase. A supershifted band (slower migration) in the mixture lane, which retains kinase activity, provides direct evidence of a functional complex formation. The absence of this band in the presence of a candidate inhibitory drug would indicate successful disruption of the protein-protein interaction, thereby validating the compound's mechanism of action.
The Scientist's Toolkit: Essential Reagents and Materials
Successful execution of electrophoretic protocols relies on a suite of specialized reagents and equipment. The following table details key solutions and materials essential for the experiments described in the case studies.
Table 2: Research Reagent Solutions for Gel Electrophoresis
| Item | Function/Description |
|---|---|
| Acrylamide/Bis-Acrylamide | Co-monomers that polymerize to form the cross-linked polyacrylamide gel matrix, acting as a molecular sieve. The ratio and total concentration (%T) dictate pore size [14] [30]. |
| Agarose | A polysaccharide derived from seaweed used to create gels with larger pores, ideal for separating nucleic acids from 100 bp to 25 kb [14] [30]. |
| Sodium Dodecyl Sulfate (SDS) | Anionic detergent that denatures proteins and confers a uniform negative charge, allowing separation by mass alone in SDS-PAGE [85]. |
| TEMED & Ammonium Persulfate (APS) | Catalyzer (TEMED) and initiator (APS) for the free-radical polymerization of acrylamide monomers into a gel [14]. |
| Coomassie Brilliant Blue | A dye that binds non-specifically to proteins, allowing visualization of separated bands after electrophoresis [85]. |
| Molecular Weight Ladder | A mixture of proteins or nucleic acids of known sizes, run alongside samples to estimate the molecular weight of unknown analytes [14]. |
| DTT or β-Mercaptoethanol | Reducing agents that break disulfide bonds in proteins, ensuring complete unfolding in denaturing SDS-PAGE [85]. |
| Tris-Glycine Buffer | A common discontinuous buffer system for PAGE, where the stacking gel concentrates samples into sharp bands before entering the resolving gel [85]. |
Decision Framework and Workflow for Gel Selection
Choosing the correct gel type and conditions is a critical first step in experimental design. The following workflow diagram outlines the logical decision process for selecting between denaturing and non-denaturing gels based on the research question, and it connects this choice to downstream analytical techniques commonly used in drug development.
The case studies presented herein underscore the indispensable and complementary roles of both denaturing and non-denaturing gel electrophoresis in the multifaceted process of drug development. The strategic selection between these techniques, guided by a clear understanding of their principles and a structured decision framework, empowers researchers to extract precise and actionable information. From ensuring the structural integrity of a complex biologic via SDS-PAGE to validating a novel drug target by probing functional protein interactions with Native PAGE, these methods provide a robust, accessible, and powerful foundation for molecular analysis. As the pharmaceutical industry continues to advance towards more targeted therapies and personalized medicine, the precise characterization of biomolecules offered by these electrophoretic techniques will remain a cornerstone of rigorous and successful clinical research.
Conclusion
Selecting between native and denaturing gel electrophoresis is a fundamental strategic decision that directly impacts experimental outcomes in biomedical research. Native gels excel at preserving biological function and analyzing macromolecular complexes, while denaturing gels provide precise molecular weight determination and are essential for techniques like western blotting. Understanding the core principles, applications, and optimization strategies for each method enables researchers to make informed choices that align with their experimental objectives. As protein therapeutics and complex biomolecular analyses continue to advance in drug development, mastering these complementary techniques becomes increasingly crucial for characterizing novel compounds and validating biological targets, ultimately accelerating translation from basic research to clinical applications.
References
- 1. Native PAGE Gels | Thermo Fisher Scientific - US [https://www.thermofisher.com/us/en/home/life-science/protein-biology/protein-gel-electrophoresis/protein-gels/specialized-protein-gels/nativepage-bis-tris-gels.html]
- 2. Native Versus Denaturing Gels [https://bitesizebio.com/27332/native-versus-denaturing-gels/]
- 3. Probing Biomolecular Structures and Dynamics of Single ... [https://pmc.ncbi.nlm.nih.gov/articles/PMC2799195/]
- 4. Specific, sensitive and quantitative protein detection by in- ... [https://www.nature.com/articles/s41467-023-38147-8]
- 5. SDS-PAGE Analysis of proteins: Principles, methodology ... [https://deepscienceresearch.com/dsr/catalog/book/107/chapter/407]
- 6. What is the difference between denaturing and non- ... [https://www.aatbio.com/resources/faq-frequently-asked-questions/What-is-the-difference-between-denaturing-and-non-denaturing-native-gels]
- 7. One-Dimensional SDS and Non-Denaturing Gel ... [https://www.thermofisher.com/us/en/home/references/protocols/proteins-expression-isolation-and-analysis/sds-page-protocol/one-dimensional-sds-and-non-denaturing-gel-electrophoresis.html]
- 8. a gel electrophoresis analysis tool and applications [https://pmc.ncbi.nlm.nih.gov/articles/PMC6895257/]
- 9. DNA Nanoswitches: A quantitative platform for gel-based ... [https://pmc.ncbi.nlm.nih.gov/articles/PMC4336243/]
- 10. Electrophoresis - StatPearls - NCBI Bookshelf - NIH [https://www.ncbi.nlm.nih.gov/books/NBK585057/]
- 11. How Does Gel Electrophoresis Work? [https://www.hinotek.com/how-does-gel-electrophoresis-work/]
- 12. Should I Use A Native Or Denaturing Gel? [https://info.gbiosciences.com/blog/should-i-use-a-native-or-denaturing-gel]
- 13. Running agarose and polyacrylamide gels [https://eu.idtdna.com/page/support-and-education/decoded-plus/running-agarose-and-polyacrylamide-gels/]
- 14. Steps in Nucleic Acid Gel Electrophoresis [https://www.thermofisher.com/us/en/home/life-science/cloning/cloning-learning-center/invitrogen-school-of-molecular-biology/na-electrophoresis-education/na-electrophoresis-workflow.html]
- 15. Temperature-controlled transition between non-denaturing ... [https://www.sciencedirect.com/science/article/pii/S002196732500740X]
- 16. Common artifacts and mistakes made in electrophoresis [https://pmc.ncbi.nlm.nih.gov/articles/PMC7295095/]
- 17. Effect of Sodium Sulfite, Sodium Dodecyl Sulfate, and Urea ... [https://pmc.ncbi.nlm.nih.gov/articles/PMC5241285/]
- 18. Protein Denaturing and Reducing Agents [https://www.thermofisher.com/us/en/home/life-science/protein-biology/protein-labeling-crosslinking/protein-modification/reducing-agents-protein-disulfides.html]
- 19. Polysaccharide as a Separation Medium for Gel ... [https://www.mdpi.com/2673-4176/5/3/24]
- 20. Blue native electrophoresis protocol [https://www.abcam.com/en-us/technical-resources/protocols/blue-native-electrophoresis]
- 21. and clear-native polyacrylamide gel electrophoresis protocols ... [https://journals.plos.org/plosone/article?id=10.1371/journal.pone.0332065]
- 22. Validation of blue- and clear-native polyacrylamide gel ... [https://pmc.ncbi.nlm.nih.gov/articles/PMC12445495/]
- 23. and clear-native polyacrylamide gel electrophoresis and in ... [https://www.protocols.io/view/characterisation-of-mitochondrial-oxidative-phosph-d7qa9mse.html]
- 24. A generalized platform for artificial intelligence-powered ... [https://www.nature.com/articles/s41467-025-61209-y]
- 25. Native polyacrylamide gel electrophoresis (native-PAGE) [https://bio-protocol.org/exchange/minidetail?id=8698058&type=30]
- 26. Western Blot: Technique, Theory, and Trouble Shooting [https://pmc.ncbi.nlm.nih.gov/articles/PMC3456489/]
- 27. Western blot protocol [https://www.abcam.com/en-us/technical-resources/protocols/western-blot]
- 28. Denaturing Gel Electrophoresis - an overview [https://www.sciencedirect.com/topics/chemistry/denaturing-gel-electrophoresis]
- 29. Bleach Gel: A Simple Agarose Gel for Analyzing RNA Quality [https://pmc.ncbi.nlm.nih.gov/articles/PMC3699176/]
- 30. Choosing Between Agarose and Polyacrylamide Gels [https://www.labx.com/resources/choosing-between-agarose-and-polyacrylamide-gels-a-comparative-guide/5537]
- 31. Yield Gel via Quantitative Gel Electrophoresis [https://pubmed.ncbi.nlm.nih.gov/37439980/]
- 32. Protocols Agarose Gel Electrophoresis [https://www.addgene.org/protocols/gel-electrophoresis/]
- 33. Utilization of gel electrophoreses for the quantitative ... [https://www.sciencedirect.com/science/article/pii/S1319016416300767]
- 34. Electrophoresis of Chromatin on Nondenaturing Agarose ... [https://www.sciencedirect.com/science/article/pii/S0021925818901687]
- 35. Agarose Gel Electrophoresis of RNA [https://www.thermofisher.com/us/en/home/references/protocols/nucleic-acid-purification-and-analysis/rna-protocol/agarose-gel-electrophoresis-of-rna.html]
- 36. Agarose Gel Electrophoresis for the Separation of DNA ... [https://pmc.ncbi.nlm.nih.gov/articles/PMC4846332/]
- 37. Why Gel Electrophoresis Still Matters in 2025? [https://eureka.patsnap.com/blog/what-is-gel-electrophoresis-used-for/]
- 38. Gel Electrophoresis 101: How to Choose Between Agarose ... [https://synapse.patsnap.com/article/gel-electrophoresis-101-how-to-choose-between-agarose-and-polyacrylamide]
- 39. Electrophoresis of DNA in nondenaturing polyacrylamide ... [https://pubmed.ncbi.nlm.nih.gov/21424628/]
- 40. Nondenaturing agarose gel electrophoresis of RNA [https://pubmed.ncbi.nlm.nih.gov/20516183/]
- 41. Different behavior of Ferguson plot between agarose and ... [https://www.sciencedirect.com/science/article/abs/pii/S0301462224000292]
- 42. Choosing Between TAE buffer and TBE Buffer for Agarose ... [https://www.goldbio.com/blogs/articles/choosing-between-tae-and-tbe-buffer-agarose-gel-electrophoresis?srsltid=AfmBOoplxK25cx8zdMKHumF8LY8l5MsHMHhGj3shzz9lwbV_-pVl3Q1Q]
- 43. RNA agarose gel electrophoresis with bleach gels [https://www.protocols.io/view/rna-agarose-gel-electrophoresis-with-bleach-gels-g3fzbyjp7.html]
- 44. TAE (Tris/Acetate/EDTA) Buffer, 10X [https://mclab.com/mc/tae-tris-acetate-edta-buffer-10x/]
- 45. Tris-Acetate-EDTA (TAE) 50x Powder (pH 8.3) (1 L) (5 ... [https://www.aniara.com/PROD/a12-9144-5.html]
- 46. TAE and TBE Running Buffers Recipe & Video [https://www.sigmaaldrich.com/US/en/technical-documents/protocol/protein-biology/gel-electrophoresis/tae-and-tbe-running-buffers-recipe?srsltid=AfmBOoq0amFbcERBFDYu2XV6k3MC8GjQUQY0wFSRnV7WQK4UjH7CsrBu]
- 47. Comparing gel electrophoresis buffers [https://www.minipcr.com/comparing-buffers/]
- 48. Tris-Borate-Edta Buffer [https://www.mpbio.com/au/tbe-buffer?srsltid=AfmBOoprC3evYQXvZTYn8YtCN-h4Y34kBkL4u7s0UdxXoVfGY1hhPnGB]
- 49. Comparison of Four Electrophoresis Buffer for Good ... [https://biomedres.us/fulltexts/BJSTR.MS.ID.007829.php]
- 50. Native or Denaturing Gel - Which Is For You? [https://advansta.com/not-all-gels-are-created-equal-native-or-denaturing-which-is-for-you/]
- 51. Nucleic Acid Gel Electrophoresis Troubleshooting [https://www.thermofisher.com/us/en/home/life-science/cloning/cloning-learning-center/invitrogen-school-of-molecular-biology/na-electrophoresis-education/na-electrophoresis-troubleshooting.html]
- 52. Troubleshooting Common Electrophoresis Problems and ... [https://www.labx.com/resources/troubleshooting-common-electrophoresis-problems-and-artifacts/5539]
- 53. Comparative Analysis of Denaturing Gradient Gel ... [https://pmc.ncbi.nlm.nih.gov/articles/PMC4639945/]
- 54. Uncertainty Estimation for Quantitative Agarose Gel ... [https://pmc.ncbi.nlm.nih.gov/articles/PMC9966319/]
- 55. Polyacrylamide Gel Electrophoresis, How It Works, ... [https://www.technologynetworks.com/analysis/articles/polyacrylamide-gel-electrophoresis-how-it-works-technique-variants-and-its-applications-359100]
- 56. Electrophoresis in western blot [https://www.abcam.com/en-us/technical-resources/guides/western-blot-guide/electrophoresis]
- 57. High-resolution native electrophoresis in-gel activity assay ... [https://www.nature.com/articles/s41598-025-24684-3]
- 58. Agarose Gel Electrophoresis - an overview [https://www.sciencedirect.com/topics/biochemistry-genetics-and-molecular-biology/agarose-gel-electrophoresis]
- 59. Western Blot SDS-PAGE [https://www.novusbio.com/support/support-by-application/western-blot-sds-page?srsltid=AfmBOooTdTp49wmf76sWfPfmxelP3ZSgHIa12PhB3aHsm_SyIBShaG7F]
- 60. Tips for Optimal SDS-PAGE Separation [https://www.rockland.com/resources/tips-for-optimal-sds-page-separation/?srsltid=AfmBOoo6WkqUzfLntnB2Zma7BGWO-vUgHircHp_lWd1-AYZbzI7YR9xD]
- 61. Mastering Gel Electrophoresis: 10 Tips and Tricks for ... [https://americanlaboratorytrading.com/mastering-gel-electrophoresis-10-tips-and-tricks-for-successful-results/?srsltid=AfmBOoqH1et2N92vb0sw2HsddFASw_wNZ0hfrEI1IZU9k4BhO2Gp1fqo]
- 62. Mastering Gel Electrophoresis: 10 Tips and Tricks for ... [https://americanlaboratorytrading.com/mastering-gel-electrophoresis-10-tips-and-tricks-for-successful-results/?srsltid=AfmBOoqL738hmfLrbRkzhsqIgCH_dSYiuy55H5ZGWv3kIsM94v-auhCY]
- 63. How to Ensure Consistent Results in Gel Electrophoresis? [https://eureka.patsnap.com/report-how-to-ensure-consistent-results-in-gel-electrophoresis]
- 64. Optimizing Gel Electrophoresis: Best Practices for Sample ... [https://www.gelepchina.com/news/optimizing-gel-electrophoresis-best-practices-for-sample-volume-voltage-and-timing/]
- 65. Overview of Protein Electrophoresis [https://www.thermofisher.com/us/en/home/life-science/protein-biology/protein-biology-learning-center/protein-biology-resource-library/pierce-protein-methods/overview-electrophoresis.html]
- 66. Gel Electrophoresis Sample Preparation [https://www.thermofisher.com/us/en/home/references/protein-analysis-guide/protein-separation/gel-electrophoresis-sample-preparation.html]
- 67. 2D Gel Electrophoresis Sample Preparation [https://kendricklabs.com/sample-preparation/]
- 68. A Simplified Electrophoresis Method for Analyses of High ... [https://www.sciencedirect.com/science/article/pii/S1016847823109630]
- 69. [PDF] Comparison of denaturing and non ... [https://www.semanticscholar.org/paper/Comparison-of-denaturing-and-non-denaturing-gel-for-Lodhi-Lodhi/5281b97276ce0b5733dc94ee19ef1a46c6dd0c5f]
- 70. Separation, purification and enrichment [https://www.proteome-factory.com/index.php/en/proteomics-services/separation-purification-enrichment]
- 71. Gel electrophoresis of proteins [https://en.wikipedia.org/wiki/Gel_electrophoresis_of_proteins]
- 72. Five Considerations for the Nucleic Acid Gel ... [https://www.thermofisher.com/us/en/home/life-science/cloning/cloning-learning-center/invitrogen-school-of-molecular-biology/na-electrophoresis-education/na-electrophoresis-considerations.html]
- 73. Choosing the right agarose percentage for gel ... [https://www.minipcr.com/choosing-the-right-agarose-percentage/]
- 74. DNA migration in gel electrophoresis [https://scienceprimer.com/dna-migration-gel-electrophoresis]
- 75. How to Interpret DNA Gel Electrophoresis Results [https://www.goldbio.com/blogs/articles/interpreting-gel-electrophoresis-results?srsltid=AfmBOopqDARfBi--iIcMecS84p2Q8HsfKfHsaxK1gNiSwf1MRTFccSEE]
- 76. Gel Electrophoresis Tables [https://www.thermofisher.com/us/en/home/references/ambion-tech-support/rna-electrophoresis-markers/general-articles/gel-electrophoresis-tables.html]
- 77. Interpreting Electrophoresis Gels [https://bento.bio/resources/bento-lab-advice/interpreting-electrophoresis-gels-with-bento-lab/]
- 78. MatGel: A MATLAB program for quantitative analysis of 2D ... [https://pmc.ncbi.nlm.nih.gov/articles/PMC9703371/]
- 79. Molecular Weight Markers | DNA Ladders [https://www.promega.com/products/cloning-and-dna-markers/dna-ladder-rna-ladder/]
- 80. Protein Markers [https://www.sigmaaldrich.com/US/en/products/protein-biology/protein-electrophoresis-and-western-blotting/protein-markers?srsltid=AfmBOoruzwmQvhww-fh6gSDZoX09E_-mAm0BL-eFsptLCZRWuVaVzOVv]
- 81. Protein Molecular Weight Markers [https://www.fishersci.ca/ca/en/browse/90164024/protein-molecular-weight-markers]
- 82. One article explains Native-PAGE [https://www.absin.net/article-1491.html]
- 83. Tutorial review on validation of liquid chromatography ... [https://www.sciencedirect.com/science/article/abs/pii/S0003267015001956]
- 84. Mass spectrometry workflow intelligence, peak finding [https://www.agilent.com/en/product/liquid-chromatography-mass-spectrometry-lc-ms/workflow-intelligence?srsltid=AfmBOopyZOBhwLb_yRes0K96zNEr3l_QGOplKnd1-BRq9vSBcVyz-Po9]
- 85. SDS-PAGE guide: Sample preparation to analysis [https://www.abcam.com/en-us/knowledge-center/western-blot/sds-page-guide]
- 86. Gel Electrophoresis Applications in Drug Discovery [https://eureka.patsnap.com/report-gel-electrophoresis-applications-in-drug-discovery]