Native PAGE in Protein Interaction Studies: From Fundamental Principles to Cutting-Edge Applications in Biomedicine
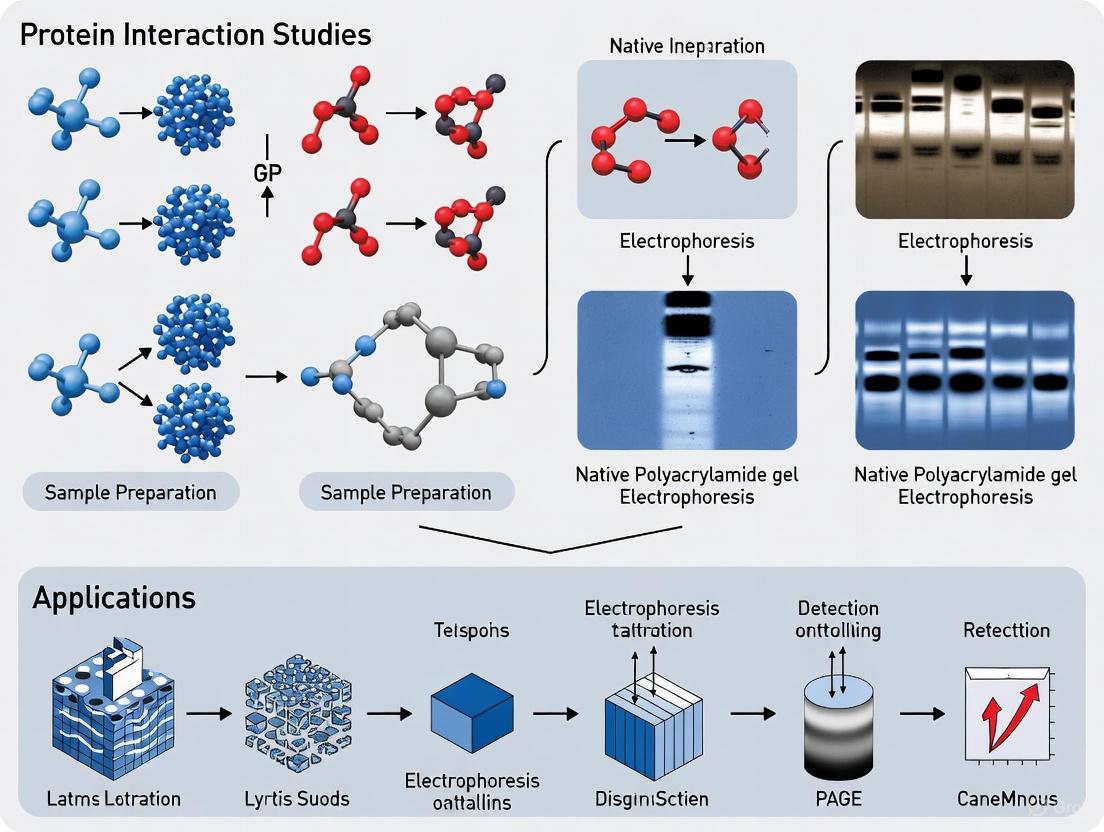
This comprehensive review explores the versatile applications of Native Polyacrylamide Gel Electrophoresis (PAGE) in studying protein-protein interactions, with particular emphasis on Blue-Native PAGE.
Native PAGE in Protein Interaction Studies: From Fundamental Principles to Cutting-Edge Applications in Biomedicine
Abstract
This comprehensive review explores the versatile applications of Native Polyacrylamide Gel Electrophoresis (PAGE) in studying protein-protein interactions, with particular emphasis on Blue-Native PAGE. Tailored for researchers, scientists, and drug development professionals, the article covers fundamental principles, advanced methodological applications across various biological systems, troubleshooting strategies for complex samples, and integrative approaches combining Native PAGE with modern proteomic technologies. By preserving native protein structures and complexes, Native PAGE provides unique insights into interactome dynamics, oligomeric states, and protein complex assembly—critical information for understanding disease mechanisms and developing targeted therapeutics. The content synthesizes both established protocols and emerging innovations, offering a practical guide for implementing these techniques in basic research and translational medicine contexts.
Understanding Native PAGE: Fundamental Principles and Advantages for Protein Interaction Studies
Native Polyacrylamide Gel Electrophoresis (Native PAGE) is a fundamental technique in protein science that enables the separation of proteins under non-denaturing conditions. Unlike its counterpart, SDS-PAGE, which denatures proteins with sodium dodecyl sulfate, Native PAGE preserves protein structure, biological activity, and protein-protein interactions throughout the electrophoretic process. This preservation is paramount when studying functional protein complexes, enzyme activity, and protein interactions within the broader context of cellular processes. As research into protein interactomes—the comprehensive networks of protein interactions—advances with techniques like mass spectrometry and computational predictions [1] [2], Native PAGE remains a critical orthogonal method for validating interactions in a near-native state. This article details the core principles, protocols, and applications of Native PAGE, providing researchers and drug development professionals with a robust framework for its implementation.
Core Principles and Advantages
The fundamental principle of Native PAGE is the separation of proteins based on their intrinsic charge, size, and shape within a porous polyacrylamide gel matrix under the influence of an electric field. The integrity of the protein's secondary, tertiary, and quaternary structures is maintained because no denaturing agents are used.
Key Differentiators from SDS-PAGE
The following table contrasts the core characteristics of Native PAGE with the denaturing SDS-PAGE method:
| Parameter | Native PAGE | SDS-PAGE |
|---|---|---|
| Protein State | Native, folded; structure and activity preserved [3]. | Denatured, unfolded; structure and activity lost. |
| Separation Basis | Combined effect of intrinsic charge, size, and shape. | Primarily molecular weight (due to SDS coating). |
| Sample Buffer | Non-denaturing, may lack SDS and reducing agents. | Contains SDS and often DTT/β-mercaptoethanol. |
| Key Application | Studying oligomeric state, protein complexes, and functional activity. | Determining molecular weight and protein purity. |
| Protein Detection | Can use activity stains (zymography) for enzymes. | Typically uses general protein stains (e.g., Coomassie). |
Advantages in Protein Interaction Studies
The primary advantage of Native PAGE is its ability to preserve macromolecular complexes. This makes it indispensable for:
- Verifying Protein-Protein Interactions (PPIs): Native PAGE can resolve stable protein complexes from individual subunits, providing direct biochemical evidence for interactions suggested by high-throughput methods like affinity purification-mass spectrometry (AP-MS) [1] or yeast two-hybrid screens.
- Analyzing Oligomeric States: The technique can reveal whether a protein exists as a monomer, dimer, or higher-order oligomer under specific conditions, as the migration pattern depends on the complex's overall size and shape.
- Functional Assays: Since enzymatic activity is preserved, proteins can be detected post-electrophoresis using activity-specific stains, allowing researchers to link a specific band on a gel to a functional protein complex.
Experimental Protocol: A Step-by-Step Guide
This protocol provides a detailed methodology for running a Native PAGE experiment to analyze a protein complex.
Materials and Reagents
The table below lists the essential "Research Reagent Solutions" required for a successful Native PAGE experiment.
| Reagent / Material | Function / Explanation |
|---|---|
| Acrylamide/Bis-Acrylamide Solution (e.g., 30-40%) | Forms the cross-linked polyacrylamide gel matrix that acts as a molecular sieve for protein separation [3]. |
| Non-Denaturing Lysis Buffer (e.g., NP-40 or Triton X-100) | Extracts proteins from cells or tissues while maintaining protein-protein interactions and native conformation [3]. |
| Native Sample Buffer | A non-reducing, SDS-free buffer that prepares the protein sample for loading without denaturation. Typically contains glycerol and a tracking dye. |
| Tris-Glycine-Native Running Buffer (e.g., 10X) | Provides the conductive medium and pH environment (typically ~pH 8.3-8.8) for electrophoresis without denaturing proteins [3]. |
| Protein Standard (Native Marker) | A mixture of colored native proteins of known molecular weight and charge used to monitor electrophoresis progress and for rough size estimation. |
| Coomassie Blue Stain / Reversible Stain (Ponceau S) | For general protein detection. Ponceau S offers a reversible, non-fixing stain for quick verification of transfer or protein bands [3]. |
Workflow Diagram
The following diagram illustrates the logical workflow of a Native PAGE experiment, from sample preparation to analysis.
Step-by-Step Methodology
Step 1: Sample Preparation
- Lysis: Gently lyse cells or tissues using a non-denaturing lysis buffer (e.g., NP-40-based) to preserve protein complexes [3].
- Clarification: Centrifuge the lysate at high speed (e.g., 14,000 x g for 15 minutes) to remove insoluble debris. Transfer the supernatant (soluble protein fraction) to a new tube [3].
- Quantification: Measure protein concentration using an appropriate assay (e.g., Bradford or BCA). Note: The BCA assay is recommended for higher sensitivity, especially with low detergent concentrations [3].
- Preparation: Mix the recommended amount of protein (e.g., 10-50 μg) with native sample buffer. Crucially, do not boil the samples. Incubate on ice or at room temperature to maintain native structure.
Step 2: Gel Preparation
- Casting: Prepare a discontinuous gel system consisting of a resolving (separating) gel and a stacking gel. The table below provides a basic recipe for a 1-gel system.
- Polymerization: Add catalysts 10% APS and TEMED last, only when ready to pour the gel, as polymerization begins immediately [3].
| Component | Resolving Gel (10%) | Stacking Gel |
|---|---|---|
| Acrylamide (40%) | 1.25 mL | 0.25 mL |
| Separating Buffer (4X) | 1.25 mL | -- |
| Stacking Buffer (4X) | -- | 0.625 mL |
| Deionized Water | 2.5 mL | 1.625 mL |
| 10% APS | 50 μL | 25 μL |
| TEMED | 5 μL | 2.5 μL |
| Total Volume | 5 mL | 2.5 mL |
Step 3: Electrophoresis
- Loading: Carefully load equal amounts of protein across wells. Include a native molecular weight marker in one lane. Avoid touching the bottom of the wells with the pipette tip to prevent distorted bands [3].
- Running Conditions: Run the gel at a constant voltage (e.g., 100-150 V) in a tank filled with native running buffer. Maintain cool conditions by using an ice pack or running in a cold room to prevent overheating and protein denaturation [3].
Step 4: Post-Electrophoresis Analysis
- Direct Staining: For total protein visualization, stain the gel with Coomassie Blue or a reversible stain like Ponceau S.
- In-Gel Activity Assay (Zymography): For enzymes, incubate the gel in a specific substrate solution to detect a band of activity.
- Western Blotting: For specific identification, proteins can be transferred to a membrane (e.g., PVDF or nitrocellulose). Note: For a standard Western blot, Ponceau staining is not recommended if using fluorescent detection methods, as it can cause high background [3].
Data Interpretation and Applications
Troubleshooting Common Issues
| Issue | Potential Cause | Solution |
|---|---|---|
| Smearing | Protein aggregation or degradation; overloading. | Optimize lysis conditions; reduce loading amount; ensure samples are kept cold. |
| Poor Resolution | Incorrect gel percentage; incorrect pH of buffers. | Adjust acrylamide concentration for target protein size; verify buffer pH. |
| No or Faint Bands | Insufficient protein loaded; protein did not enter gel. | Increase loading amount; check sample buffer composition (ensure no precipitation). |
Application in Broader Research Context
Native PAGE serves as a critical validation tool within the modern interactome research pipeline. While cutting-edge computational models like PaRPI (for RNA-protein interactions) [4] and deep learning frameworks for PPI prediction [2] can process vast datasets, they require experimental validation. Similarly, high-throughput MS-based techniques like AP-MS and cross-linking MS (XL-MS) [1] [5] provide large-scale interaction maps but are conducted in non-native contexts. Native PAGE provides a direct, biochemical confirmation of predicted or identified interactions under conditions that maintain the native cellular environment of the complex, bridging the gap between in silico predictions and in vivo functionality. This is especially valuable in drug development, where understanding the functional oligomeric state of a target protein is crucial for therapeutic design.
Within the framework of a broader thesis on the applications of native polyacrylamide gel electrophoresis (PAGE) in protein interaction studies, this document delineates the core mechanisms, advantages, and specific protocols for two pivotal techniques: Blue-Native PAGE (BN-PAGE) and Clear-Native PAGE (CN-PAGE). The study of protein-protein interactions (PPIs) is fundamental to proteomics, as most cellular processes are executed by dynamic networks of protein complexes rather than by individual proteins [6]. While classical methods like yeast two-hybrid and co-immunoprecipitation have contributed significantly to the field, proteomics-based methods such as native electrophoresis offer distinct advantages for analyzing intact complexes [6].
BN-PAGE, pioneered by Hermann Schägger in the 1990s, has become an indispensable tool for resolving native protein complexes, especially those involved in oxidative phosphorylation (OXPHOS) [7] [8]. Its variant, CN-PAGE, was developed to circumvent certain limitations of the former. This application note provides a comparative analysis of these two techniques, summarizing their principles in an accessible format, detailing standardized protocols, and illustrating their application in the analysis of mitochondrial protein complexes, thereby providing a robust resource for researchers and drug development professionals.
Principles and Mechanisms
Fundamental Concepts of Native Electrophoresis
Both BN-PAGE and CN-PAGE are one-dimensional native electrophoresis techniques used for the separation of individual proteins, protein complexes, and supercomplexes under mild, non-denaturing conditions [9]. This allows for the identification of stable and labile protein-protein interactions, the determination of native masses and oligomeric states, and the subsequent analysis of enzymatic activities [9] [10]. The primary distinction between the two techniques lies in the method by which a negative charge is imposed upon the proteins to facilitate their migration toward the anode during electrophoresis.
The Mechanism of Blue-Native PAGE (BN-PAGE)
In BN-PAGE, the anionic dye Coomassie Blue G-250 is used to confer a uniform negative charge to the solubilized protein complexes. This dye binds non-stoichiometrically to the hydrophobic surfaces of proteins [11]. The binding imposes a charge shift on the proteins, which forces even basic proteins with hydrophobic domains to migrate towards the anode at a neutral pH of 7.0 [7] [8]. A key secondary function of the bound dye is that the induced negative surface charge helps to prevent the aggregation of hydrophobic membrane proteins, thereby keeping them soluble during electrophoresis in the absence of detergent [7]. The dye is present both in the sample buffer and the cathode buffer during the run, giving the gel its characteristic blue color [12].
The Mechanism of Clear-Native PAGE (CN-PAGE)
CN-PAGE, a related variant, omits the Coomassie dye from the sample and instead uses mixtures of anionic and neutral detergents in the cathode buffer to impose the necessary charge shift for electrophoretic migration [7] [8]. Similar to Coomassie Blue G-250, the mixed micelles formed by these detergents induce a negative charge on membrane proteins to enhance their solubility and migration [7]. As the name implies, the gels remain clear during and after the electrophoresis process.
Comparative Advantages and Limitations
The choice between BN-PAGE and CN-PAGE is application-dependent, as each technique offers distinct advantages and suffers from specific limitations. A summary of these characteristics is provided in Table 1.
Table 1: Comparative Advantages and Limitations of BN-PAGE and CN-PAGE
| Feature | Blue-Native PAGE (BN-PAGE) | Clear-Native PAGE (CN-PAGE) |
|---|---|---|
| Charging Agent | Coomassie Blue G-250 dye [7] [12] | Anionic/neutral detergent mixtures [7] |
| Typical Resolution | Higher resolution [13] | Lower resolution [13] |
| Mass Estimation | More reliable for native mass and oligomeric state [13] | Less reliable; depends on protein charge and gel pore size [13] |
| Mildness | Standard mildness | Milder; can retain labile supramolecular assemblies [13] |
| Dye Interference | Coomassie dye can interfere with downstream activity assays or FRET analyses [13] [7] | No dye interference; superior for in-gel activity staining and FRET [13] [7] |
| Key Application | Standard analysis of OXPHOS complexes and supercomplexes [7] [8] | Analysis of catalytically active complexes and labile assemblies [13] |
The following diagram illustrates the fundamental procedural differences between the two methods, from sample preparation to separation.
Essential Reagents and Materials
The successful execution of BN-PAGE and CN-PAGE relies on a specific set of reagents. The following table details the key research reagent solutions and their functions.
Table 2: Key Research Reagent Solutions for Native PAGE
| Reagent | Function | Key Considerations |
|---|---|---|
| Coomassie Blue G-250 | Imposes negative charge on proteins in BN-PAGE; prevents aggregation [7] [12]. | Can interfere with downstream activity assays and FRET [13]. |
| Detergents (for Solubilization) | Solubilizes membrane protein complexes without disrupting protein-protein interactions [12] [11]. | Choice is critical: - n-Dodecyl-β-d-maltoside (DDM): Common for individual complexes [7] [8].- Digitonin: Milder; preserves supercomplexes [7] [12]. |
| 6-Aminocaproic Acid | Zwitterionic salt; supports solubilization and acts as a protease inhibitor without affecting electrophoresis at pH 7.0 [7] [8]. | Provides a zero net charge at neutral pH [7]. |
| Cathode Buffer Detergents (CN-PAGE) | Replaces Coomassie dye; anionic/neutral detergent mixtures induce charge shift and enable migration [7]. | Avoids dye-related interference in downstream applications [7]. |
| Acrylamide Gradient Gels | Separates protein complexes by size; typical gradients are 3-12% or 4-16% [7] [12]. | Maximizes resolution of complexes ranging from ~100 kDa to 10 MDa [14]. |
Detailed Experimental Protocols
Protocol 1: BN-PAGE for OXPHOS Complexes
This protocol, adapted from Aref et al. (2025) and Schägger's foundational work, is optimized for the analysis of mitochondrial oxidative phosphorylation complexes [7] [8] [10].
Sample Preparation (for mitochondrial membranes):
- Harvesting and Homogenization: Wash cell pellets (e.g., from two 10-cm plates of cultured fibroblasts) with phosphate-buffered saline (PBS). Pellet cells by centrifugation and store at -80°C if not used immediately [7].
- Solubilization: Resuspend the cell or mitochondrial pellet in solubilization buffer (e.g., 1M 6-aminocaproic acid, 50 mM Bis-Tris/HCl, pH 7.0). Add a mild, non-ionic detergent. For individual OXPHOS complexes, use n-dodecyl-β-d-maltoside (DDM) at a final concentration of 1-2% or a detergent-to-protein ratio of 2-4 g/g [7] [11]. For respiratory supercomplexes, use the milder detergent digitonin (typically 2-4 g digitonin per g protein) [7] [12].
- Incubation and Clarification: Incubate the sample on ice for 5-30 minutes. Subsequently, centrifuge at 20,000 × g for 15-30 minutes at 4°C to remove insoluble material [7] [8].
- Dye Addition: Prior to loading, add Coomassie Blue G-250 dye to the supernatant to a final concentration of 0.25-0.5% [7] [8].
Gel Electrophoresis:
- Gel Casting: Manually cast a native linear gradient polyacrylamide gel (e.g., 3-12% or 4-16%) using a gradient maker and peristaltic pump. The gel and cathode buffer should be based on Bis-Tris or imidazole, pH 7.0 [7] [8]. Precast gels are also commercially available.
- Loading and Running: Load the prepared samples onto the gel. Add Coomassie Blue G-250 (e.g., 0.02%) to the cathode buffer (colored blue). Run the electrophoresis at 4°C, starting with a low voltage (e.g., 50 V) until the sample has entered the gel, then increase to 100-150 V until the dye front reaches the bottom of the gel [7] [8].
Protocol 2: CN-PAGE for In-Gel Activity Assays
CN-PAGE is the method of choice when the goal is to detect catalytic activity directly within the gel, as it avoids interference from the Coomassie dye [13] [7].
Sample Preparation: The initial steps for solubilization are identical to the BN-PAGE protocol (steps 1-3 above). However, the critical difference is that Coomassie Blue G-250 is omitted from the sample [13] [7].
Gel Electrophoresis:
- The same gradient gels used for BN-PAGE can be employed.
- The key modification is in the cathode buffer. Instead of Coomassie dye, the cathode buffer contains a mixture of anionic and neutral detergents (e.g., 0.02% sodium deoxycholate and 0.02% dodecylmatloside) to provide the charge shift for migration [7].
- The electrophoresis run conditions are similar to BN-PAGE, but the gel remains clear throughout the process.
In-Gel Activity Staining: Following electrophoresis, the gel can be incubated in specific assay buffers to visualize enzymatic activity [7] [8]:
- Complex I (NADH dehydrogenase): Stained by NADH reduction of nitrotetrazolium blue.
- Complex II (Succinate dehydrogenase): Stained by phenazine methosulfate-mediated reduction of nitrotetrazolium blue in the presence of succinate.
- Complex IV (Cytochrome c oxidase): Stained by the oxidation of cytochrome c, detected as a loss of brown color.
- Complex V (ATP synthase): Stained by an ATP-hydrolysis-linked lead precipitation method, with sensitivity that can be markedly improved by an enhancement step [7].
The following diagram illustrates the critical decision points in selecting and executing the appropriate native PAGE protocol for a given research goal.
Applications in Protein Interaction Studies
The application of BN-PAGE and CN-PAGE extends far beyond simple protein separation, playing a transformative role in modern protein interaction research.
Analysis of Respiratory Chain Supercomplexes: The use of different detergents has fundamentally changed models of the respiratory chain. While DDM solubilization revealed individual OXPHOS complexes, supporting a "liquid state model," the use of the milder digitonin in BN/CN-PAGE allowed the identification of stable respirasomes (supercomplexes of I, III, and IV), supporting a "solid-state model" of organization within the mitochondrial membrane [7] [12]. CN-PAGE, being even milder, can retain labile supramolecular assemblies that might dissociate under standard BN-PAGE conditions [13].
Clinical Diagnostics and Disease Research: BN-PAGE is instrumental in diagnosing mitochondrial encephalomyopathies and other metabolic diseases caused by OXPHOS dysfunction [9] [8]. It allows researchers to investigate pathologic mechanisms, including assembly pathways of the complexes and the disruptive effects of mutations, in patient-derived samples like fibroblasts and muscle biopsies [7] [8].
Comprehensive Proteomic and Structural Studies: Two-dimensional electrophoresis, combining BN-PAGE in the first dimension with SDS-PAGE in the second, creates a powerful tool for resolving the constituent subunits of a complex [7] [10]. This 2D system, combined with western blot analysis or mass spectrometry, enables the detailed characterization of complex composition and the identification of novel protein-protein interactions within a proteome [7] [12] [15]. Furthermore, protein complexes isolated by BN-PAGE can be used for advanced structural studies, such as 2D crystallization and electron microscopy [10].
In the study of biomolecular interactions, the preservation of a protein's native structure is not merely an option but a fundamental requirement for obtaining biologically relevant data. Native conditions, which maintain the protein's tertiary and quaternary structure, along with its associated cofactors and binding partners, stand in stark contrast to denaturing methods that dismantle these intricate assemblies. Techniques like Native Polyacrylamide Gel Electrophoresis (Native PAGE) and Blue Native PAGE (BN-PAGE) are cornerstone methodologies that leverage non-denaturing conditions to separate intact protein complexes based on their charge, size, and shape [16] [17]. This capability is indispensable for probing the functional interactome—the dynamic network of protein-protein, protein-DNA, and protein-ligand interactions that underpin all cellular processes. The choice between native and denaturing methods thus fundamentally shapes the biological questions a researcher can answer, directing the inquiry either towards the deconstructed properties of polypeptide chains or the functional dynamics of macromolecular machines.
Key Differences Between Native and Denaturing Methods
The distinction between native and denaturing methods extends beyond a simple checklist of buffer components; it represents a fundamental philosophical divide in experimental approach. Denaturing methods, such as SDS-PAGE, employ agents like Sodium Dodecyl Sulfate (SDS) and urea to unfold proteins into random coils, effectively masking their intrinsic charge and rendering all proteins with a uniform negative charge-to-mass ratio. Separation occurs almost exclusively by molecular weight. In contrast, native methods use mild, non-ionic detergents and avoid heating or strong denaturants to preserve the protein's native conformation. This allows separation based on a combination of the protein's inherent charge, molecular size, and three-dimensional shape [18] [16].
Table 1: Core Differences Between Native and Denaturing Electrophoresis Methods.
| Feature | Native Conditions | Denaturing Conditions |
|---|---|---|
| Protein Structure | Native, folded; Quaternary structures preserved | Unfolded, random coil; Subunits dissociated |
| Key Reagents | Mild detergents (e.g., Lauryl Maltose Neopentyl Glycol), Coomassie G-250, Bis-Tris buffers | SDS, Urea, β-Mercaptoethanol, Dithiothreitol |
| Basis of Separation | Charge, size, and native shape | Primarily molecular mass |
| Information Obtained | Oligomeric state, protein-protein interactions, functional activity | Subunit molecular weight, purity, polypeptide composition |
| Typical Applications | Studying complexes, enzyme activity assays, interaction mapping | Estimating molecular weight, proteomics, Western blotting |
The implications of these differences are profound. For instance, a researcher studying the oligomeric state of a enzyme would find native PAGE indispensable, as it can resolve active tetramers from inactive monomers. In a denaturing gel, however, both forms would migrate identically as dissociated subunits. Similarly, techniques like Electrophoretic Mobility Shift Assay (EMSA) rely on native conditions to detect the formation of protein-DNA complexes, as the interaction would be obliterated by SDS [19]. The strategic choice of method is therefore the first and most critical step in designing an interaction study.
Experimental Protocols for Native Interaction Analysis
Blue Native PAGE (BN-PAGE) for Complexome Profiling
BN-PAGE is a powerful protocol specifically designed for the analysis of mitochondrial complexes and other multisubunit enzymes [16]. The method utilizes Coomassie Blue G-250, which binds to proteins imparting a negative charge, allowing them to migrate in an electric field without disrupting non-covalent interactions.
Protocol Steps:
- Sample Preparation: Isolate mitochondria or membrane fractions. Solubilize 0.4 mg of sedimented mitochondria in 40 µL of Buffer A (0.75 M 6-aminocaproic acid, 50 mM Bis-Tris/HCl, pH 7.0) containing protease inhibitors (e.g., 1 mM PMSF). Add 7.5 µL of 10% n-dodecyl-β-D-maltopyranoside and incubate on ice for 30 minutes. Centrifuge at 72,000 x g for 30 minutes and collect the supernatant [16].
- Dye Addition: Add 2.5 µL of a 5% Coomassie blue G solution to the supernatant [16].
- Gel Electrophoresis (First Dimension): Cast a native gradient gel (e.g., 6–13% acrylamide). Load 5–20 µL of the prepared sample and run the gel at 150 V for approximately 2 hours using anode (50 mM Bis-Tris, pH 7.0) and cathode (50 mM Tricine, 15 mM Bis-Tris, 0.02% Coomassie blue G, pH 7.0) buffers until the blue dye front has almost run off the gel [16].
- Second Dimension (Optional): For subunit analysis, excise a lane from the first-dimension gel, soak it in SDS-PAGE denaturing buffer, and place it on top of an SDS-PAGE gel (e.g., 10-20% acrylamide). This 2D separation resolves the individual subunits of each complex [16].
- Detection: Electroblot the proteins to a PVDF membrane using a fully submerged system (e.g., 150 mA for 1.5 h) and perform immunodetection with specific antibodies [16].
Native PAGE for GPCR-G Protein Coupling
This protocol exemplifies a specialized application of native PAGE for studying the interactions of G protein-coupled receptors (GPCRs), a major class of drug targets, with their signaling partners [17].
Protocol Steps:
- Receptor Preparation: Transiently express an EGFP-tagged GPCR (e.g., the calcitonin receptor-like receptor) in HEK293S GnT1– cells. Prepare crude membranes from the cells.
- Solubilization and Complex Formation: Solubilize the membranes with a detergent such as Lauryl Maltose Neopentyl Glycol (LMNG) supplemented with Cholesteryl Hemisuccinate (CHS). Incubate the solubilized receptor with a surrogate "mini-G" protein and the desired agonist.
- High-Resolution Clear Native Electrophoresis (hrCNE): Load the samples onto a native polyacrylamide gel. The hrCNE conditions preserve the detergent-solubilized GPCR-mini-G complexes.
- Visualization and Quantification: Visualize the complexes directly in the gel using in-gel fluorescence imaging (detecting the EGFP tag). A mobility shift indicates successful complex formation. This assay can be used in a quantitative format to determine the apparent affinity of agonists for the receptor-G protein complex [17].
The Scientist's Toolkit: Essential Reagents for Native PAGE
Successful execution of native PAGE experiments relies on a carefully selected set of reagents, each serving a specific function to maintain complex integrity.
Table 2: Key Research Reagent Solutions for Native PAGE.
| Reagent | Function | Example & Notes |
|---|---|---|
| Mild Detergents | Solubilize membrane proteins while preserving native interactions | n-Dodecyl-β-D-maltopyranoside [16], Lauryl Maltose Neopentyl Glycol (LMNG) [17]; Critical for extracting complexes from membranes. |
| Charge-Confering Dye | Impart uniform negative charge for electrophoretic mobility | Coomassie Blue G-250; Used in BN-PAGE, binds hydrophobically without denaturing [16]. |
| Protease Inhibitors | Prevent proteolytic degradation during sample preparation | PMSF, Leupeptin, Pepstatin A; Essential for preserving intact protein complexes [16] [17]. |
| Specialized Buffers | Maintain optimal pH and ionic strength | Bis-Tris/Tricine-based systems [16], 6-aminocaproic acid; Provide buffering capacity without interfering with separation. |
| "Mini-G" Proteins | Stabilize GPCRs in an active state for interaction studies | Engineered Gα subunits; Tool for studying GPCR-G protein coupling in detergent [17]. |
| Membrane Cholesterol Mimetic | Stabilizes native conformation of membrane proteins | Cholesteryl Hemisuccinate (CHS); Often added with detergent for solubilizing GPCRs and other membrane proteins [17]. |
Visualizing Experimental Workflows
The following diagrams illustrate the logical flow of two key native PAGE protocols, highlighting their application for different biological questions.
Diagram 1: GPCR-mini-G Protein Coupling Assay.
Diagram 2: BN-PAGE for Protein Complexes.
Application Notes: From Detection to Discovery
The true power of native methods is realized in their diverse applications, which range from confirming simple interactions to mapping complex cellular networks.
- Detecting Unstable Complexes: A significant advantage of native EMSA is its ability to identify not only stable DNA-protein complexes but also unstable complexes that undergo dissociation during electrophoresis. The gel matrix provides a "caging" effect that can stabilize transient interactions, allowing their detection and subsequent identification [19].
- Mapping DNA-Protein Interactions on Long Fragments: A combination of native and denaturing PAGE can be used to localize protein binding regions within long fragments of genomic DNA (up to 10 kb). After an initial EMSA step under native conditions to select bound fragments, the shifted DNA is eluted and analyzed on a denaturing gel. This allows precise identification of protein-binding regions within the larger DNA sequence [19].
- Integration with Mass Spectrometry: The field of interactome studies has been revolutionized by the integration of native methods with mass spectrometry (MS). Native MS allows for the determination of the mass of intact biomolecular assemblies, providing precise information on stoichiometry, topology, and interaction dynamics without disrupting non-covalent bonds [20]. Furthermore, co-fractionation MS (CF-MS) involves separating native protein complexes via chromatography or electrophoresis followed by MS-based identification, enabling large-scale mapping of protein interaction networks [5].
- A Tool for Drug Development: The native PAGE assay for GPCR-mini-G protein coupling provides a relatively simple, cost-effective, and quantitative method to characterize agonist-dependent receptor coupling. This allows for the determination of apparent binding affinities and can serve as a measure of agonist efficacy, making it highly valuable for screening and characterizing potential therapeutics targeting GPCRs [17].
The methodological divide between native and denaturing conditions defines two parallel paths in biological research. While denaturing methods provide essential information on protein composition and primary structure, they inevitably erase the higher-order functional information encoded in a protein's quaternary structure and interaction network. Native methods, with their careful preservation of the protein's native state, unlock this dimension of biological understanding. From the detailed characterization of a single drug target like a GPCR to the large-scale mapping of mitochondrial complexomes and interactomes, techniques like Native PAGE and BN-PAGE provide the critical lens through which we can observe the dynamic macromolecular machines that perform the work of the cell. As mass spectrometry and other analytical technologies continue to advance in sensitivity and compatibility with native preparations, the application of native condition methodologies is poised to become even more central to our quest to understand and manipulate cellular function.
Historical Development and Evolution of Native Electrophoresis Techniques
Within the broader context of research on protein-protein interactions (PPIs), the ability to study proteins in their native, functionally active state is paramount. Native polyacrylamide gel electrophoresis (Native-PAGE) is a foundational technique that enables this by preserving protein complexes, quaternary structures, and biological activity during separation. Unlike denaturing methods such as SDS-PAGE, Native-PAGE does not use harsh detergents, allowing proteins to migrate based on a combination of their intrinsic charge, size, and shape [21] [22]. This Application Note details the historical evolution, current methodologies, and practical protocols for Native-PAGE, framing it as an essential tool in the modern protein interaction studies research toolkit.
Historical Development
The genesis of electrophoresis dates back to the early 19th century, with the first observation of the electrokinetic phenomenon by Russian professors Peter Ivanovich Strakhov and Ferdinand Frederic Reuß at Moscow University in 1807 [23]. However, the modern era of protein electrophoresis began with the pioneering work of Arne Tiselius, who developed the moving-boundary electrophoresis apparatus in the 1930s [23] [24]. His work, for which he received the Nobel Prize in Chemistry in 1948, demonstrated that charged particles could be separated using an electrical field [23] [21].
A critical evolution occurred in the late 1940s and 1950s with the shift from Tiselius's free-flowing method to zone electrophoresis, which used solid supporting media like filter paper or gels to separate compounds into discrete bands [23]. The subsequent introduction of starch gel by Oliver Smithies in 1955, and later polyacrylamide gel, revolutionized the field by enabling high-resolution separation of complex protein mixtures [23]. Polyacrylamide gel, formed by polymerizing acrylamide and bis-acrylamide, was particularly transformative because its pore size could be precisely controlled, allowing for excellent resolution based on molecular sieving and minimal interaction with the matrix [21].
While early gel electrophoresis was inherently "native," the later development of SDS-PAGE provided a powerful tool for molecular weight determination under denaturing conditions, thereby highlighting the unique value of Native-PAGE for studying intact protein complexes [22]. The development of techniques like Blue Native (BN)-PAGE in the 1990s further cemented the role of native electrophoresis in biochemistry, allowing for the isolation of membrane protein complexes in enzymatically active form [24].
Table 1: Key Milestones in the Development of Native Electrophoresis
| Year | Development | Key Innovator(s) | Significance |
|---|---|---|---|
| 1807 | First observation of electrokinetics | Strakhov & Reuß | Established the fundamental principle [23] |
| 1937 | Moving-boundary electrophoresis apparatus | Arne Tiselius | Enabled first electrophoretic analysis of colloidal mixtures; Nobel Prize-winning work [23] [24] |
| 1950s | Zone electrophoresis | Multiple | Use of supporting gels (paper, starch) to create discrete separation zones [23] |
| 1955 | Starch gel electrophoresis | Oliver Smithies | Allowed efficient separation of complex protein mixtures [23] |
| 1959 | Polyacrylamide gel electrophoresis (PAGE) | Raymond & Weintraub | Introduced controllable polyacrylamide matrix for superior resolution [23] |
| 1991 | Blue Native (BN)-PAGE | Schägger & von Jagow | Enabled isolation of active membrane protein complexes [24] |
Principles and Applications in Protein Interaction Studies
The core principle of Native-PAGE is the migration of charged molecules through an inert gel matrix under the influence of an electric field. A critical distinction from SDS-PAGE is that the native protein's intrinsic net charge and three-dimensional conformation dictate its mobility [21]. Proteins with a greater negative charge migrate faster toward the anode, while larger, more complex structures experience more resistance moving through the gel pores.
This makes Native-PAGE exceptionally powerful for studying protein interactions because it can directly probe quaternary structure. A classic application is distinguishing between monomeric and multimeric states of a protein. For instance, a protein that runs as a 60 kDa band on a non-reducing SDS-PAGE but migrates at 120 kDa on Native-PAGE can be reasonably inferred to be a non-covalent dimer of 60 kDa subunits [22]. The SDS treatment disrupts the non-covalent bonds holding the dimer together, revealing the monomeric weight, while Native-PAGE preserves the intact dimer, whose migration reflects its larger native size [22].
Beyond analyzing static complexes, Native-PAGE is integrated into advanced, high-throughput workflows for monitoring dynamic changes in protein complexes. For example, the recently developed FLiP-MS (serial Ultrafiltration combined with Limited Proteolysis-coupled Mass Spectrometry) uses native size-separation fractions, analyzed via Native-PAGE and other techniques, to generate a library of peptide markers that report on changes in PPIs [25]. This library can then be used to profile protein complex dynamics proteome-wide in response to cellular perturbations, providing both global and molecular views of a system under study [25].
Table 2: Comparison of Electrophoresis Techniques for Protein Analysis
| Parameter | Native-PAGE | SDS-PAGE | Isoelectric Focusing (IEF) |
|---|---|---|---|
| Principle of Separation | Native charge, size, and shape | Molecular weight only | Isoelectric point (pI) |
| Protein State | Native, functional, complexes intact | Denatured, linearized | Denatured, focused by pI |
| Information Obtained | Oligomeric state, protein interactions | Subunit molecular weight | Protein charge identity |
| Common Applications | Studying quaternary structure, enzyme activity assays | Purity check, Western blotting | First dimension in 2D-PAGE |
Detailed Experimental Protocols
Protocol 1: Standard Native-PAGE for Oligomeric State Analysis
This protocol is designed to determine the native molecular size and oligomeric state of a protein sample, as exemplified in [22].
Materials (The Scientist's Toolkit):
- Research Reagent Solutions:
- Acrylamide/Bis-acrylamide Solution (30-40%): Forms the cross-linked polyacrylamide gel matrix. The ratio and concentration determine the gel pore size [21].
- Non-Denaturing Buffer (e.g., Tris-Glycine, pH 8.3-8.8): Carries the current and maintains a pH that preserves protein native charge and structure. Avoids SDS or reducing agents [21].
- Ammonium Persulfate (APS) and TEMED: Catalysts for the polymerization of the polyacrylamide gel [21].
- Native Gel Staining Solution (e.g., Coomassie Brilliant Blue): For visualizing protein bands after electrophoresis.
- High-Molecular-Weight Native Protein Standards: A mix of colored proteins of known native molecular weights for calibration.
Methodology:
- Gel Casting: Prepare a resolving gel (e.g., 4-12% gradient gel) by mixing acrylamide/bis-acrylamide, non-denaturing Tris-HCl buffer (pH ~8.8), and water. Initiate polymerization by adding APS and TEMED. Pour the gel and overlay with isopropanol. Once set, prepare a stacking gel (lower percentage acrylamide in Tris-HCl, pH ~6.8) and insert a well comb.
- Sample Preparation: Mix the protein sample with a native loading dye (containing glycerol for density and a tracking dye, but no SDS or reducing agents). Do not boil the sample.
- Electrophoresis: Load the prepared samples and native molecular weight markers into the wells. Run the gel in a non-denaturing running buffer (e.g., Tris-Glycine, pH ~8.3) at a constant voltage (e.g., 100-150 V) at 4°C to minimize heat-induced denaturation or complex dissociation. Stop the run when the tracking dye front reaches the bottom of the gel.
- Visualization and Analysis: Carefully remove the gel from the plates and stain with Coomassie Blue or a compatible stain. Destain as needed. Compare the migration distance (Rf) of the protein of interest to the calibration curve generated from the native standards to estimate its apparent native molecular weight.
The following workflow diagram illustrates the logical process and key decision points in this protocol:
Protocol 2: Integration with Structural Proteomics (FLiP-MS Workflow)
This advanced protocol, adapted from [25], uses native electrophoresis as an analytical step within a comprehensive workflow for profiling protein complex dynamics.
Materials (The Scientist's Toolkit):
- Research Reagent Solutions:
- Lysis Buffer (Native Conditions): Contains mild detergents and protease inhibitors to maintain protein interactions.
- RNase A: For destabilizing RNA-dependent protein complexes during fractionation.
- Serial Ultrafiltration Filters (e.g., 100, 50, 30, 10 kDa MWCO): For size-based fractionation of native protein complexes from cell lysate.
- Limited Proteolysis (LiP) Buffer and Protease (e.g., Proteinase K): For probing differential protease susceptibility of protein states.
Methodology:
- Native Lysate Preparation: Lyse cells under native conditions. Treat lysate with RNase to destabilize RNA-dependent complexes.
- Serial Ultrafiltration: Pass the lysate sequentially through ultrafiltration filters with decreasing molecular weight cut-offs (e.g., 100 kDa, 50 kDa, 30 kDa, 10 kDa). This generates fractions enriched in different assembly states of proteins, from large complexes to monomers.
- Fraction Analysis (via Native-PAGE): Analyze each fraction using Native-PAGE to confirm the size separation and enrichment of different molecular weight forms, as performed in [25].
- Limited Proteolysis-Mass Spectrometry (LiP-MS): Subject each fraction to limited proteolysis with a non-specific protease. The differential protease accessibility of a protein in its complex-bound versus monomeric state generates unique peptide patterns.
- Marker Library Creation and Application: Identify and compile the peptides that show differential protease susceptibility between fractions into a "PPI marker library." This library can then be used to interrogate LiP-MS data from perturbed cellular systems to pinpoint specific PPI changes on a global scale.
The FLiP-MS workflow for system-wide protein interaction profiling is illustrated below:
Advanced Data Interpretation
Interpreting Native-PAGE results requires careful consideration. A key application is deducing quaternary structure, as shown in the example where a protein migrates at 60 kDa on non-reducing SDS-PAGE but at 120 kDa on Native-PAGE, indicating a non-covalent dimer [22]. It is crucial to remember that migration is influenced by both size and charge. A protein with a high negative charge may migrate faster than a larger, more neutral protein. Therefore, using appropriate native molecular weight markers is essential for accurate size estimation.
Native-PAGE is also a vital quality control step in complex workflows. In the FLiP-MS protocol, Native-PAGE visually confirms the successful size-based fractionation of the proteome by serial ultrafiltration, validating that different fractions are uniquely enriched for proteins and assemblies of progressively decreasing molecular weight [25].
Concluding Remarks and Future Perspectives
Native electrophoresis has evolved dramatically from Tiselius's moving-boundary apparatus to a sophisticated family of techniques integral to modern structural and systems biology. Its unique power lies in its ability to probe the native state of proteins and their complexes, a capability that denaturing methods fundamentally lack. As demonstrated by its role in cutting-edge methodologies like FLiP-MS, Native-PAGE remains a critical tool for validating and analyzing protein interactions.
The future of Native-PAGE lies in its continued integration with other technologies, particularly mass spectrometry and computational modeling. The development of more sensitive in-gel detection methods and the standardization of protocols will further enhance its reproducibility and quantitative power. For researchers focused on protein-protein interactions, from initial characterization to system-wide dynamic studies, Native-PAGE is not a historical relic but an indispensable component of the contemporary analytical arsenal.
This application note details the unique molecular mechanism by which Coomassie Blue G-250 facilitates the electrophoretic separation of proteins by imparting a negative charge without disrupting their native, three-dimensional structure. Within the context of Blue Native-PAGE (BN-PAGE), this property is indispensable for studying protein-protein interactions, oligomeric states, and the assembly of macromolecular complexes. We provide a foundational protocol for BN-PAGE, a curated toolkit of essential reagents, and data demonstrating its application in evaluating protein complex monodispersity for crystallization trials.
In standard SDS-PAGE, the denaturing detergent sodium dodecyl sulfate (SDS) unravels proteins and confers a uniform negative charge, enabling separation primarily by molecular weight. This process, however, destroys native structure and protein-protein interactions. Blue Native-PAGE (BN-PAGE) presents a powerful alternative by leveraging the specific properties of Coomassie Blue G-250 to analyze protein complexes in their native state [16] [12].
The technique, pioneered by Schägger and von Jagow, is particularly vital for investigating the oxidative phosphorylation (OXPHOS) system and other multisubunit assemblies [16] [7]. The core innovation lies in the dye's ability to provide the necessary charge for electrophoresis while preserving complex integrity, a feat that allows researchers to determine the size, abundance, and subunit composition of native complexes, and even detect assembly intermediates [16].
Molecular Mechanism: A Non-Denaturing Charge Shift
The unique functionality of Coomassie Blue G-250 stems from its chemical properties and its specific mode of interaction with proteins.
Chemical Properties and Ionic States
Coomassie Brilliant Blue G-250 is a triphenylmethane dye that exists in different ionic forms depending on the pH [26]:
- Below pH 0.3: It exists as a double cation (red).
- At pH 1.3: It is neutral (green).
- Above pH 1.3: It forms a monoanion (blue).
The BN-PAGE procedure is conducted at a near-neutral pH (∼7.0-7.5), ensuring the dye is in its blue anionic form [16] [27].
Mechanism of Protein Binding and Charge Conferral
The binding of Coomassie G-250 to proteins is a non-covalent, colloidal process that does not disrupt the protein's folded structure. The mechanism involves two primary interactions [26] [27]:
- Ionic Interactions: The dye's sulfonic acid groups interact with positively charged residues on the protein surface, primarily the primary amines of arginine, lysine, and histidine.
- Hydrophobic Interactions: The dye's aromatic structure engages in van der Waals forces with hydrophobic patches on the protein surface.
The binding is stoichiometric, meaning the amount of dye bound is proportional to the protein's surface area and, consequently, its mass [16]. This binding imparts a uniform negative charge density to the protein complex, allowing it to migrate toward the anode during electrophoresis. This mechanism overcomes two major hurdles of native electrophoresis [27]:
- It ensures that even basic proteins (with high pI), which would normally carry a positive net charge at neutral pH, gain a negative charge and migrate unidirectionally.
- It solubilizes membrane proteins and prevents aggregation by coating their exposed hydrophobic surfaces, converting them into charged, soluble entities.
Table 1: Comparison of Charge-Shift Mechanisms in SDS-PAGE vs. BN-PAGE.
| Feature | SDS-PAGE | BN-PAGE (with Coomassie G-250) |
|---|---|---|
| Charge Agent | Sodium Dodecyl Sulfate (SDS) | Coomassie Brilliant Blue G-250 |
| Protein State | Denatured; primary structure | Native; intact 2°, 3°, 4° structure |
| Binding | Strong, uniform denaturation | Mild, surface binding |
| Primary Interaction | Hydrophobic, with polypeptide backbone | Ionic (basic residues) & Hydrophobic |
| Charge Imparted | Strong negative charge | Proportional negative charge (to mass) |
| Separation Basis | Polypeptide chain length (mass) | Size, charge & shape of native complex |
The following diagram illustrates the fundamental difference in how SDS and Coomassie Blue interact with proteins to facilitate electrophoresis.
Research Reagent Solutions: Essential Materials for BN-PAGE
A successful BN-PAGE experiment requires specific reagents tailored to maintain protein complexes in their native state.
Table 2: Essential Reagents for a BN-PAGE Workflow.
| Reagent/Category | Specific Examples | Function & Importance |
|---|---|---|
| Mild Detergents | n-Dodecyl-β-D-maltoside (DDM), Digitonin, Triton X-100 [16] [12] | Solubilizes membrane proteins and lipid bilayers without disrupting protein-protein interactions. Digitonin is preferred for preserving supercomplexes [12]. |
| Charge-Shift Dye | Coomassie Brilliant Blue G-250 [16] [27] | Imparts negative charge for electrophoresis, prevents aggregation of hydrophobic proteins, and maintains solubility. |
| Solubilization Buffer | 0.75 M 6-Aminocaproic acid, 50 mM Bis-Tris, pH 7.0 [16] | Provides a low-ionic-strength, near-physiological pH environment to stabilize complexes during extraction. |
| Protease Inhibitors | PMSF, Leupeptin, Pepstatin [16] | Prevents proteolytic degradation of protein complexes during the isolation and solubilization process. |
| Gel System | Linear gradient gels (e.g., 4-16%, 3-12% acrylamide) [16] [27] | Resolves a wide range of protein complex sizes. A gradient is highly recommended over a single percentage gel. |
| Cathode Buffer | With 0.02% Coomassie G-250 (initial phase) [16] [28] | Provides a continuous supply of dye during electrophoresis to ensure consistent charge-shift. |
| Blotting Membrane | PVDF [16] [27] | Nitrocellulose is not recommended as it binds Coomassie dye too tightly, interfering with transfer and detection. |
Core BN-PAGE Protocol for Analysis of Mitochondrial Complexes
The following is an abridged protocol for analyzing mitochondrial protein complexes, adapted from Schägger and von Jagow [16].
Stage 1: Sample Preparation
- Solubilization: Resuspend 0.4 mg of sedimented mitochondria in 40 µL of Buffer A (0.75 M 6-aminocaproic acid, 50 mM Bis-Tris/HCl, pH 7.0) containing protease inhibitors (e.g., 1 mM PMSF).
- Detergent Extraction: Add 7.5 µL of 10% n-dodecyl-β-D-maltoside (DDM). Mix and incubate for 30 minutes on ice.
- Clarification: Centrifuge at 72,000 x g for 30 minutes at 4°C to pellet insoluble material.
- Dye Addition: Collect the supernatant and add 2.5 µL of a 5% Coomassie Blue G-250 solution in 0.5 M aminocaproic acid.
Stage 2: Native Gel Electrophoresis (First Dimension)
- Gel Casting: Prepare a native linear gradient gel (e.g., 4-16% or 3-12% acrylamide) in a Bis-Tris/aminocaproic acid system. A stacking gel is used without a comb.
- Buffer Setup: Fill the anode chamber with anode buffer (50 mM Bis-Tris, pH 7.0). Add the cathode buffer with 0.02% Coomassie G-250 to the upper chamber.
- Loading and Run: Load 5–20 µL of prepared sample into the wells. Run the gel at a constant voltage (e.g., 100-150 V) at 4°C. To reduce dye interference in downstream steps, the cathode buffer can be replaced with a colorless cathode buffer once the sample has entered the stacking gel [28].
- Completion: Stop the run when the blue dye front has almost reached the bottom of the gel.
Stage 3: Downstream Applications
The first-dimension BN-PAGE gel can be used for several analyses:
- Immunodetection: Proteins can be transferred to a PVDF membrane for western blotting with specific antibodies [16].
- In-Gel Activity Staining: The separated OXPHOS complexes often remain enzymatically active and can be visualized by specific activity stains [7].
- Second Dimension (SDS-PAGE): For subunit analysis, excise a lane from the BN-PAGE gel, soak it in SDS-PAGE denaturing buffer, and place it horizontally on top of an SDS-PAGE gel. This resolves the individual subunits of each native complex [16].
Application in Protein Interaction Studies: Evaluating Complex Monodispersity for Crystallography
A critical application of BN-PAGE in drug development and structural biology is the evaluation of membrane protein sample quality for crystallization. There is a strong correlation between a protein's monodispersity (existing in a single, well-defined oligomeric state) and its propensity to form crystals [29].
Experimental Workflow and Data Interpretation
In this application, the purified membrane protein of interest is solubilized in different mild detergents and analyzed by BN-PAGE. The resulting gel profile serves as a direct indicator of the sample's aggregation state in solution [29].
Table 3: Interpreting BN-PAGE Results for Crystallization Screening.
| BN-PAGE Banding Pattern | Interpretation | Crystallization Propensity |
|---|---|---|
| Single, Sharp Band | Monodisperse sample; protein exists primarily as a single, homogeneous oligomer. | High |
| Multiple Discrete Bands | Polydisperse sample; presence of different oligomeric states or stable assembly intermediates. | Low to Moderate |
| Diffuse Smearing | Heterogeneous or aggregated sample; significant polydispersity and instability. | Very Low |
The following diagram outlines the logical workflow for using BN-PAGE in this capacity.
Key Experimental Findings
Research has demonstrated that BN-PAGE is more informative for assessing the aggregation states of membrane proteins than other techniques like dynamic light scattering (DLS) or size exclusion chromatography (SEC), which can be complicated by interference from detergent micelles [29]. A strong correlation exists between the monodispersity observed on BN-PAGE gels and the successful crystallization of various membrane proteins, and the oligomeric states resolved by BN-PAGE often correspond directly to those found in the final crystalline lattice [29].
The molecular basis of Coomassie Blue G-250's function—its ability to bind protein surfaces via non-denaturing ionic and hydrophobic interactions—makes it the cornerstone of the BN-PAGE technique. This unique charge-shift mechanism enables the high-resolution separation of intact protein complexes by their native size and shape. As a robust and informative tool, BN-PAGE is indispensable for modern research into protein-protein interactions, complexome profiling, and the preparation of high-quality samples for structural biology and drug discovery.
Practical Applications: Implementing Native PAGE for Protein Complex Analysis in Biomedical Research
The success of native polyacrylamide gel electrophoresis (Native PAGE) in protein interaction studies fundamentally depends on the initial solubilization and stabilization of protein complexes. This step is particularly critical for membrane proteins, which require extraction from their native lipid environment into a stable, water-soluble form without disrupting their native structure or interactions [30] [11]. For soluble complexes, the challenge lies in maintaining non-covalent interactions during preparation. The selection of an appropriate solubilization strategy directly determines the accuracy and reliability of downstream Native PAGE analysis, influencing the biological relevance of the findings. This document outlines current, evidence-based protocols for solubilizing both membrane and soluble protein complexes, providing a standardized framework for researchers in structural biology and drug development.
Solubilization Techniques for Membrane Proteins
Membrane proteins pose a unique challenge due to their extensive hydrophobic surfaces that are normally embedded in the lipid bilayer. Effective solubilization involves disrupting the membrane while preserving the protein's functional conformation and its interactions with essential lipids and partner proteins [30] [31].
Conventional Detergent-Based Solubilization
Detergents are amphipathic molecules that solubilize membrane proteins by incorporating them into micellar structures, burying hydrophobic regions inside while exposing hydrophilic surfaces to the aqueous environment [31]. A general screening protocol is essential for identifying the optimal detergent for a specific membrane protein.
Table 1: Common Detergent Classes for Membrane Protein Solubilization [30] [11] [31]
| Detergent Class | Examples | CMC Range (%) | Key Characteristics | Considerations for Native PAGE |
|---|---|---|---|---|
| Non-ionic | DDM, Triton X-100, Digitonin | 0.0087 (DDM) - 0.015 | Mild, generally preserve protein-protein interactions; low charge minimizes complex disruption. | Often the first choice for native complex isolation; Digitonin is noted for preserving labile complexes. |
| Zwitterionic | CHAPS, Fos-Choline-12 | 0.4 (CHAPS) - 0.3-0.6 (FC-12) | Charge neutrality helps maintain solubility without strong ionic interference. | Useful for proteins sensitive to non-ionic detergents; compatible with many functional assays. |
| Anionic | SDS, LDAO | 0.023 (SDS) - 0.1-0.2 | Powerful solubilization strength. | Typically too denaturing for native complex studies; can be considered for initial extraction before exchange. |
| Cationic | CTAB, DTAB | ~0.9 (CTAB) | Strong solubilizers. | Can denature proteins and are rarely used for native state preservation. |
Table 2: Preliminary Solubilization Screening Results for a Histidine-Tagged E. coli Membrane Protein (EM29) [31]
| Detergent Tested | Solubilization Yield (Qualitative) | Suitability Conclusion |
|---|---|---|
| FOS-Choline-12 (FC12) | Weak Band | Less Suitable |
| n-Undecyl-β-D-Maltopyranoside (UDM) | Strong Band | Suitable |
| n-Dodecyl-β-D-Maltopyranoside (DDM) | Strong Band | Suitable |
| Octyl Glucoside (OG) | Strong Band | Suitable |
| Triton X-100 | Weak Band | Less Suitable |
| Lauryl Dimethylamine-N-Oxide (LDAO) | Weak Band | Less Suitable |
Protocol 1: General Detergent Screening for Membrane Proteins [31]
- Buffer Preparation: Prepare a standard buffer such as PBS (10 mM phosphate, 2.7 mM KCl, 137 mM NaCl, pH 7.4) or Tris buffer (20 mM, pH 7.4). Consider adding protease inhibitors and a reducing agent like DTT (0.5-1 mM) as needed.
- Solubilization Mixture: In a 1 mL total volume, combine the membrane preparation (typical protein concentration of 1-10 mg/mL) with the test detergent at a final concentration of 1-2% (w/v). A detergent-to-protein ratio (w/w) of 1:1 to 10:1 should be evaluated.
- Incubation: Incubate the mixture with gentle mixing (e.g., end-over-end rotation) for 1-2 hours at 4°C. The optimal temperature and duration may vary.
- Clarification: Centrifuge the solubilisate at 100,000 × g at 4°C for 45 minutes to pellet non-solubilized material and cellular debris.
- Analysis: Assay the supernatant (solubilized fraction) for the presence and activity of the target protein. Methods include:
- SDS-PAGE & Western Blot: For detection and preliminary yield assessment.
- Affinity Purification & Gel Filtration: Rapidly assesses yield and, under native conditions, homogeneity.
- Activity Assays: The most critical indicator of successful native structure preservation.
Advanced Detergent-Free Solubilization Strategies
Recent innovations aim to circumvent the potential destabilizing effects of detergents by using alternative amphipathic systems that maintain a more native-like lipid environment.
A. Styrene-Maleic Acid (SMA) Copolymer and Derivatives SMA and related copolymers like DIBMA can directly solubilize membrane proteins by incorporating a segment of the native lipid bilayer along with the protein, forming SMA Lipid Particles (SMALPs) [30]. This "detergent-free" technique stabilizes proteins in their native conformation and is particularly valuable for cryo-EM characterization [30].
B. Designer Solubilizing Proteins (WRAPs) This deep learning-based approach designs Water-soluble RFdiffused Amphipathic Proteins (WRAPs) that genetically fuse to the target membrane protein. The WRAP domain features a polar exterior for solubility and a non-polar interior complementary to the target's hydrophobic surface, effectively shielding it [32]. This method has successfully solubilized beta-barrel OMPs and multi-pass helical proteins like GlpG with enhanced stability and retained enzymatic function [32].
C. Engineered Membrane Scaffold Peptides (DeFrND) The DeFrND technology employs engineered Apolipoprotein-A1 mimetic peptides, potentiated with fatty acid modifications, to directly extract membrane proteins from native cell membranes into nanodiscs without prior detergent solubilization [33]. This method preserves functional integrity, as demonstrated by the coupled ATPase activity of the extracted MalFGK2 transporter, which is often lost in detergent [33].
Solubilization and Stabilization of Soluble Complexes
For soluble protein complexes, the goal of solubilization is not extraction from a membrane but the maintenance of non-covalent protein-protein interactions (PPIs) in solution during lysis and preparation.
Buffers and Additives for Complex Stability
The composition of the lysis and solubilization buffer is critical. Harsh ionic detergents like SDS must be avoided. Instead, buffers should contain:
- Mild Non-Ionic or Zwitterionic Detergents (e.g., Digitonin, DDM): Used at low concentrations (e.g., 0.1-0.5%) to solubilize membranes without disrupting protein complexes [11].
- Stabilizing Salts and Osmolytes: Salts like NaCl (e.g., 150 mM) and osmolytes like glycerol (5-10%) can help maintain the native state.
- Protease and Phosphatase Inhibitors: Essential to prevent proteolytic degradation and preserve post-translational modifications that often regulate PPIs.
Systematic Analysis of Complex Dynamics with FLiP-MS
The FLiP-MS (serial Ultrafiltration combined with Limited Proteolysis-coupled Mass Spectrometry) workflow represents a major advance for systematically probing protein complex dynamics [25]. It generates a library of peptide markers that report on changes in protease accessibility between complex-bound and monomeric forms of proteins, often mapping to protein-binding interfaces [25]. This library can then be used to interpret LiP-MS data from perturbed systems, specifically highlighting changes in PPIs with peptide-level resolution, providing a powerful tool for interactome-wide studies ahead of techniques like Native PAGE [25].
Integrated Workflow for Native PAGE Sample Preparation
The following diagram and workflow integrate the techniques described above into a coherent strategy for preparing samples for Native PAGE analysis.
Diagram 1: Integrated sample preparation workflow for Native PAGE, showing parallel paths for membrane protein solubilization and soluble complex stabilization.
Workflow Description:
- Sample Preparation: Begin with a cell lysate. For membrane proteins, a membrane fraction is often isolated.
- Solubilization Method Selection:
- For Membrane Proteins, choose between:
- Detergent-Based Path: Perform a general detergent screen (Protocol 1) and optimize conditions (e.g., pH, salt, incubation time).
- Detergent-Free Path: Evaluate advanced methods like SMA copolymers, computationally designed WRAPs, or DeFrND peptides for a more native environment.
- For Soluble Complexes, use mild non-ionic detergents and consider applying the FLiP-MS workflow to profile complex dynamics systematically.
- For Membrane Proteins, choose between:
- Clarification: Remove non-solubilized material and cellular debris via ultracentrifugation.
- Target Complex Analysis: The clarified supernatant, containing solubilized and stabilized proteins or complexes, is now ready for Native PAGE and subsequent analysis (e.g., in-gel activity assays, Western blotting, or complexomic profiling).
The Scientist's Toolkit: Essential Research Reagents
Table 3: Key Reagent Solutions for Solubilization and Stabilization Studies
| Reagent / Solution | Function / Application | Example Uses |
|---|---|---|
| n-Dodecyl-β-D-Maltoside (DDM) | Non-ionic detergent for mild solubilization of membrane protein complexes. | First-choice detergent for initial screens; often preserves activity for Native PAGE [11] [31]. |
| Digitonin | Non-ionic, plant-derived detergent known for preserving native protein-protein interactions. | Ideal for solubilizing labile multi-subunit complexes for native analyses [11]. |
| Styrene-Maleic Acid (SMA) Copolymer | Amphipathic polymer for detergent-free extraction of membrane proteins with a native lipid annulus. | Formation of SMALPs for cryo-EM or functional studies where a native lipid environment is critical [30]. |
| Membrane Scaffold Peptides (DeFrND) | Engineered peptides for direct extraction of proteins into nanodiscs from native membranes. | Studying detergent-sensitive membrane proteins and complexes with preserved function and native lipids [33]. |
| WRAPs (Computationally Designed) | Genetically encoded solubilizing domains designed for specific membrane protein targets. | Creating hyperstable, soluble versions of specific membrane proteins for structural or therapeutic development [32]. |
| FLiP-MS Marker Library | A resource of peptide markers that report on changes in protein complex assembly state. | Systematically probing global interactome dynamics in response to cellular perturbations [25]. |
Within the context of a broader thesis on applications of native PAGE in protein interaction studies, the critical role of detergent selection cannot be overstated. The fundamental goal of native polyacrylamide gel electrophoresis (PAGE) is to separate protein complexes by molecular weight while preserving their native structure and enzymatic activity [14]. For membrane proteins, which are embedded in lipid bilayers, achieving this requires the use of mild detergents to solubilize them without disrupting essential protein-protein interactions [34]. The choice of detergent directly influences which protein complexes remain intact, which dissociate into subcomplexes, and whether higher-order supercomplexes can be observed, thereby shaping the biological conclusions drawn from the experiment [34].
This application note focuses on three widely used detergents—dodecylmaltoside, digitonin, and Triton X-100—providing a structured guide for researchers to select the optimal detergent based on their experimental goals. Proper detergent selection is paramount for successful outcomes in techniques like Blue Native-PAGE (BN-PAGE) and Clear Native Electrophoresis (CNE), which are cornerstone methods for investigating respiratory chains, GPCR signaling, and other vital membrane protein complexes in drug development research [34] [35] [17].
Detergent Properties and Selection Criteria
Key Characteristics and Mechanisms of Action
Detergents used for native protein analysis are mild, non-ionic agents that function by disrupting lipid-lipid and lipid-protein interactions while ideally leaving protein-protein interactions undisturbed [34]. Their effectiveness hinges on the delicate balance between efficient solubilization of the membrane and preservation of the native protein complex.
- Dodecylmaltoside (DDM): A maltoside-based detergent with a relatively large polar headgroup, offering a good balance between efficient solubilization and gentle treatment of protein complexes. It is a well-defined, homogeneous synthetic detergent [34] [35].
- Digitonin: A natural plant-derived glycoside known for its exceptionally mild properties. It is a complex mixture purified from natural sources, which can lead to batch-to-batch variability [34]. Its mildness is key to preserving weak protein-protein interactions and supercomplexes.
- Triton X-100: A synthetic detergent with a smaller hydrophilic headgroup compared to DDM. It is considered slightly harsher but is effective for solubilizing a wide range of membrane proteins [34] [35].
The working principle of BN-PAGE relies on these detergents for solubilization, while the anionic dye Coomassie Blue G250 provides the negative charge required for electrophoretic migration. This combination avoids the denaturing conditions of SDS-PAGE, allowing complexes to remain intact and active [34] [14].
Comparative Analysis and Selection Guide
The table below summarizes the fundamental properties of these detergents to guide initial selection.
Table 1: Fundamental Properties of Key Detergents for Native PAGE
| Property | Dodecylmaltoside (DDM) | Digitonin | Triton X-100 |
|---|---|---|---|
| Chemical Class | Non-ionic maltoside | Non-ionic glycoside | Non-ionic polyoxyethylene ether |
| Aggregation Number | ~78 [36] | ~60 [36] | ~100 [36] |
| Critical Micelle Concentration (CMC) | ~0.17 mM [36] | ~0.2 mM [36] | ~0.3 mM [36] |
| Micelle Molecular Weight (kDa) | ~50 [36] | ~70 [36] | ~90 [36] |
| Key Characteristic | Well-defined, synthetic; general-purpose mild detergent | Very mild; preserves weak interactions and supercomplexes | Moderately harsh; cost-effective for robust complexes |
The choice of detergent profoundly impacts the experimental outcome, as different detergents can stabilize distinct organizational states of protein complexes. A classic example comes from mitochondrial research:
- When dodecylmaltoside or Triton X-100 is used, individual respiratory complexes (I, II, III, IV, and V) are typically observed. This supported the "liquid state model" where complexes diffuse freely in the membrane [34].
- When the milder digitonin is employed, defined associations of these complexes, known as supercomplexes or "respirasomes," are revealed. This discovery supported an alternative "solid state model" of the respiratory chain [34].
Therefore, digitonin is the detergent of choice for investigating higher-order assemblies, while DDM is excellent for analyzing individual, stable complexes.
Table 2: Functional Application Guide for Protein Complex Analysis
| Target Complex Type | Recommended Detergent | Typical Working Concentration | Expected Outcome & Notes |
|---|---|---|---|
| Individual Stable Complexes (e.g., Complex V) | Dodecylmaltoside (DDM) | 1.0 - 1.5% [34] | Yields well-resolved individual complexes; ideal for initial characterization and activity assays. |
| Labile Supercomplexes (e.g., Respirasomes) | Digitonin | 1.5 - 5.0 g/g protein [34] | Preserves weak interactions between complexes; essential for studying supercomplex formation and function. |
| Robust Monomeric Complexes | Triton X-100 | 0.1 - 0.5% [34] | Effective solubilization at low cost; may dissociate some weaker oligomeric states. |
| GPCR-G Protein Coupling | Lauryl Maltose Neopentyl Glycol (LMNG) / DDM | e.g., 0.01% LMNG [17] | Newer detergents like LMNG offer enhanced stability for dynamic complexes like GPCR-G protein assemblies. |
Experimental Protocols for Complex Analysis
Protocol 1: Analysis of Mitochondrial Respiratory Supercomplexes Using BN-PAGE
This protocol is adapted from methodologies used to demonstrate the differential effects of detergents on respiratory supercomplexes [34].
Research Reagent Solutions
- Solubilization Buffer: 50 mM NaCl, 50 mM Imidazole/HCl, 2 mM 6-aminohexanoic acid, 1 mM EDTA, pH 7.0. Store at 4°C.
- Digitonin Stock: 5% (w/v) in solubilization buffer. Gently heat and vortex to dissolve. Store at -20°C.
- DDM Stock: 2% (w/v) dodecylmaltoside in water. Store at -20°C.
- Cathode Buffer: 50 mM Tricine, 15 mM Bis-Tris, 0.02% Coomassie G-250 (pH ~7.0 at 4°C). Prepare fresh.
- Anode Buffer: 50 mM Bis-Tris/HCl, pH 7.0.
- Gradient Gel: A pre-cast or hand-cast 4-16% polyacrylamide gradient gel is optimal for separating complexes ranging from 100 kDa to several MDa.
Procedure
- Isolate Mitochondria: Prepare mitochondrial fractions from plant or mammalian tissue using standard differential centrifugation.
- Protein Quantification: Determine the protein concentration of the mitochondrial suspension using a compatible assay (e.g., BCA assay).
- Solubilization:
- Clarification: Centrifuge the solubilized mixture at 100,000 x g for 30 minutes at 4°C to remove insoluble material.
- Load Sample: Carefully mix the supernatant with a 50% glycerol solution (to a final concentration of 5-10%) and load it onto the gradient gel.
- Electrophoresis: Run the gel with blue cathode buffer at 4°C. Start at 100 V for about 30 minutes, then continue at 15-20 mA until the dye front reaches the bottom of the gel.
- Analysis: Complexes can be visualized by Coomassie staining, immunoblotting, or subjected to in-gel activity assays [35].
Protocol 2: Assessing GPCR-Mini-G Protein Coupling via hrCNE
This protocol leverages high-resolution Clear Native Electrophoresis (hrCNE) to study detergent-stable GPCR complexes, a key application in drug development [17].
Research Reagent Solutions
- Membrane Preparation Buffer: 20 mM HEPES, pH 7.5, 150 mM NaCl, 1 mM CaCl₂, 1 mM MgCl₂. Supplement with protease inhibitors before use.
- Solubilization Buffer: Membrane preparation buffer supplemented with 0.01% Lauryl Maltose Neopentyl Glycol (LMNG) and 0.001% Cholesteryl Hemisuccinate (CHS). Keep on ice.
- hrCNE Anode Buffer: 50 mM Tricine, 15 mM Bis-Tris, pH 7.0 (at 4°C).
- hrCNE Cathode Buffer: 50 mM Tricine, 15 mM Bis-Tris, 0.05% sodium deoxycholate, pH 7.0 (at 4°C). Note: The lack of Coomassie is key for hrCNE.
- 4x Native Sample Buffer: 200 mM Tris-HCl (pH 7.5), 40% glycerol, 4 mM MgCl₂, 4 mM TCEP. Store at -20°C.
- Purified Mini-G Protein: Express and purify mini-G protein(s) of interest (e.g., mini-Gs) as described in literature [17].
Procedure
- Prepare Membranes: Harvest HEK293S GnT1- cells expressing the EGFP-tagged GPCR of interest. Prepare crude membranes by Dounce homogenization and differential centrifugation [17].
- Solubilize Receptor: Resuspend membranes in solubilization buffer to a final protein concentration of 1-2 mg/mL. Incubate with gentle agitation for 2 hours at 4°C.
- Form Receptor-Mini-G Complex: Clarify the solubilized lysate by centrifugation (21,000 x g, 30 min, 4°C). Incubate the supernatant with a saturating concentration of purified mini-G protein and the desired agonist/antagonist for 1 hour on ice.
- Prepare for Electrophoresis: Mix the sample with ¼ volume of 4x Native Sample Buffer.
- Load and Run: Load the sample onto a 4-16% BN-PAGE gel (run under CNE conditions, i.e., without Coomassie in the cathode buffer). Run at 100 V for 1 hour, then increase to 200 V for another 2-3 hours at 4°C, protected from light.
- Visualize Complex: Directly image the gel using a fluorescence scanner (e.g., Typhoon Imager) with settings for EGFP detection (excitation: 488 nm, emission: 520 nm BP 40). The formation of a GPCR-mini-G complex will be indicated by a distinct, agonist-dependent mobility shift to a higher molecular weight [17].
Visualization of Experimental Workflows
Detergent Selection and Experimental Workflow
Diagram 1: Detergent selection workflow for complex analysis.
BN-PAGE Process from Sample to Analysis
Diagram 2: BN-PAGE process from sample to analysis.
The strategic selection of dodecylmaltoside, digitonin, or Triton X-100 is a decisive factor in the successful analysis of protein complexes using native PAGE. Dodecylmaltoside serves as an excellent general-purpose detergent for stable individual complexes, while digitonin is indispensable for revealing the architecture of labile supercomplexes. Triton X-100 provides a cost-effective option for robust complexes where preservation of the finest interactions is less critical. As the field advances, novel detergents and detergent-free systems like native nanodiscs continue to expand the toolkit available to researchers [33] [37]. By following the guidelines, protocols, and visual workflows provided in this application note, scientists and drug development professionals can make informed decisions to optimally design experiments that accurately capture the native state of their protein complexes of interest.
The oxidative phosphorylation (OXPHOS) system, located in the inner mitochondrial membrane, is fundamental to cellular energy production. For decades, the structural organization of its constituent complexes—Complex I (CI), Complex II (CII), Complex III (CIII), Complex IV (CIV), and Complex V (CV)—was a matter of fierce scientific debate [38]. Two principal models were historically hypothesized: the "fluid state" model, which proposed that individual OXPHOS complexes diffuse freely and electrons are transferred through random collisions, and the "solid state" model, which suggested that complexes are organized into stable, higher-order assemblies called supercomplexes (SCs) or respirasomes [38]. It is now widely accepted that a hybrid "plasticity" model best reflects reality, wherein both isolated complexes and supercomplexes coexist in a dynamic equilibrium [38].
The discovery and characterization of these supercomplexes have been inextricably linked to the development and application of Blue Native Polyacrylamide Gel Electrophoresis (BN-PAGE). This technique has proven indispensable for separating intact membrane protein complexes, allowing researchers to visualize the stoichiometry and composition of respiratory superstructures that are crucial for understanding mitochondrial function in health and disease [38] [12].
BN-PAGE: Principles and Advantages for Supercomplex Analysis
BN-PAGE is a powerful electrophoretic technique that separates protein complexes under native conditions, preserving their structural integrity and enzymatic activities. Its working principle differs fundamentally from denaturing SDS-PAGE.
- Solubilization: Mild non-ionic detergents—such as n-dodecyl-β-D-maltoside (DDM), Triton X-100, or digitonin—are used to gently solubilize mitochondrial membranes without disrupting critical protein-protein interactions within complexes [12]. The choice of detergent is critical; digitonin, for instance, has been pivotal in revealing supercomplexes that are dissociated by harsher detergents like DDM [12].
- Electrophoretic Separation: Instead of SDS, the anionic dye Coomassie Blue G-250 is used. It binds non-covalently to the surface of protein complexes, imparting a uniform negative charge that allows them to migrate toward the anode during electrophoresis. The dye also reduces protein aggregation by masking hydrophobic surfaces, converting membrane proteins into water-soluble forms without the need for denaturing detergents in the gel itself [38] [16]. Separation occurs on a polyacrylamide gradient gel (e.g., 3-13% or 4-16%), where complexes are resolved primarily according to their size and molecular mass [12] [16].
The major advantage of BN-PAGE in studying respiratory supercomplexes is its ability to provide a high-resolution snapshot of the native "complexome"—the entire inventory of multi-protein complexes in a sample [39]. Following BN-PAGE, a second dimension run by denaturing SDS-PAGE can be performed to resolve the individual protein subunits that constitute each supercomplex, enabling detailed compositional analysis [16].
A Standardized Protocol for Analyzing Respiratory Supercomplexes by BN-PAGE
The following protocol outlines the key steps for analyzing mitochondrial respiratory supercomplexes from mouse tissues, a common model system. This procedure is adapted from established methodologies [38] [16].
Stage 1: Mitochondria Isolation and Solubilization
Mitochondria Isolation:
- Sacrifice a mouse according to approved ethical guidelines and promptly excise the tissue (e.g., ~30 mg of liver).
- Rinse the tissue in ice-cold isolation buffer (IB: e.g., 250 mM sucrose, 10 mM HEPES, 1 mM EGTA, pH 7.4) supplemented with protease inhibitors.
- Homogenize the tissue in IB using a Potter-Elvehjem glass homogenizer (e.g., 20 strokes at 1500 rpm). Keep the homogenizer probe submerged to avoid foaming.
- Centrifuge the homogenate at 600 × g for 10 minutes at 4°C to pellet cell debris and nuclei.
- Transfer the supernatant to a new tube and centrifuge at a high speed (e.g., 7,000 × g for 10 minutes) to pellet the mitochondrial fraction.
- Resuspend the mitochondrial pellet in a suitable buffer for solubilization [38].
Solubilization of Supercomplexes:
- Resuspend the mitochondrial pellet (e.g., 0.4 mg of protein) in 40 µL of solubilization buffer (e.g., 0.75 M 6-aminocaproic acid, 50 mM Bis-Tris, pH 7.0).
- Add an appropriate volume of detergent. For supercomplex analysis, 1% (w/v) digitonin is often preferred. Add 7.5 µL of a 10% digitonin stock solution.
- Mix gently and incubate on ice for 30 minutes to allow for complete solubilization.
- Centrifuge at high speed (e.g., 72,000 × g for 30 minutes at 4°C) to remove insoluble material.
- Collect the supernatant, which contains the solubilized protein complexes, and discard the pellet [16].
- Add Coomassie Blue G-250 dye (e.g., 2.5 µL of a 5% solution) to the supernatant to impart charge for electrophoresis [16].
Stage 2: First Dimension BN-PAGE
- Gel Preparation: Cast a native polyacrylamide gradient gel. A linear gradient from 4% to 16% acrylamide is commonly used to resolve a wide range of complex sizes, from large supercomplexes to individual complexes.
- Loading and Electrophoresis: Load the solubilized and dyed samples (5-20 µL) into the wells. Run the gel using pre-cooled anode (e.g., 50 mM Bis-Tris, pH 7.0) and cathode (e.g., 50 mM Tricine, 15 mM Bis-Tris, 0.02% Coomassie Blue G, pH 7.0) buffers. Electrophoresis is typically performed at constant voltage (e.g., 150 V) for approximately 2 hours or until the dye front has migrated off the gel [16].
- Visualization: After electrophoresis, supercomplexes and individual complexes can be visualized as discrete blue bands in the gel. Further analysis can include in-gel activity assays to confirm the identity and functionality of specific complexes [38].
Stage 3: Second Dimension SDS-PAGE (Optional)
For subunit analysis, the lanes from the first-dimension BN-PAGE gel can be excised, soaked in SDS-PAGE denaturing buffer, and placed horizontally on top of an SDS-polyacrylamide gel. Electrophoresis in the second dimension separates the complexes into their constituent polypeptides, creating a 2D map where spots correspond to individual subunits of the supercomplexes [16].
Downstream Applications
The resolved complexes can be analyzed by:
- Western Blotting: For immunodetection of specific proteins using antibodies.
- Mass Spectrometry (MS): For comprehensive identification of all protein components within a band, an approach central to complexome profiling [39].
- In-Gel Activity Staining: To confirm the enzymatic activity of specific complexes like Complex I or IV [38].
The following diagram illustrates the complete experimental workflow from tissue to analysis.
Key Research Findings Enabled by BN-PAGE
BN-PAGE has been instrumental in uncovering fundamental aspects of respiratory supercomplex biology.
- Genetic Regulation of Assembly: Research using different mouse inbred strains revealed that the protein Cox7a2l (SCAFI) plays a primary role in supercomplex formation. C57BL/6 mice, which carry a mutated Cox7a2l, lack specific supercomplexes containing multiple copies of CIV (e.g., I+III₂+IV₂ and I+III₂+IV₃) that are present in strains like DBA, CBA, and 129 [38]. This finding has critical implications for model selection in metabolic studies.
- Structural and Functional Advantages: The organization into supercomplexes is proposed to offer several advantages, including enhanced electron transport efficiency through substrate channeling, prevention of complex destabilization and degradation, and reduction of electron or proton leakages [38].
- Implications in Human Disease: Defects in the assembly of OXPHOS complexes cause severe encephalomyopathies and neurodegenerative disorders. BN-PAGE analysis supports the hypothesis that pathogenic mutations in one complex often lead to pleiotropic deficiencies in others due to their structural interdependence within supercomplexes. For instance, mutations in CIII subunits can lead to secondary deficiencies in CI and CIV [38].
Table 1: Common Mitochondrial Supercomplexes Resolved by BN-PAGE
| Supercomplex Stoichiometry | Approximate Mass (MDa) | Key Features and Functional Role |
|---|---|---|
| I₁ + III₂ | ~1.7 | A common respirasome core structure; facilitates electron transfer from NADH to cytochrome c. |
| I₁ + III₂ + IV₁ | ~2.0 | A major respirasome form; proposed to channel electrons from NADH directly to oxygen. |
| I₁ + III₂ + IV₂ | ~2.3 | Contains multiple CIV units; formation depends on a functional Cox7a2l protein in specific tissues [38]. |
| III₂ + IV₁ | ~0.55 | Involved in electron transfer from ubiquinol to oxygen; absent in Cox7a2l negative strains [38]. |
Table 2: Essential Reagents for BN-PAGE Analysis of Supercomplexes
| Reagent / Material | Function / Role in Protocol |
|---|---|
| Digitonin | Mild, non-ionic detergent optimal for preserving supercomplex interactions during solubilization [12]. |
| n-Dodecyl-β-D-Maltoside (DDM) | Alternative mild detergent; can resolve individual complexes but may dissociate some supercomplexes [12]. |
| Coomassie Blue G-250 | Anionic dye that binds protein complexes, providing negative charge for electrophoresis and reducing aggregation [38] [16]. |
| 6-Aminocaproic Acid | A low-ionic-strength compound used in buffers to support solubilization and improve complex stability [16]. |
| Bis-Tris | Buffering agent used in gel and electrophoresis buffers at neutral pH (pH 7.0) to maintain native conditions [16]. |
| Protease Inhibitor Cocktail | Essential to prevent proteolytic degradation of complexes during the isolation and solubilization procedures [38]. |
Advanced Applications: Integration with Complexome Profiling
While BN-PAGE is a powerful standalone technique, its integration with modern proteomics has given rise to complexome profiling, a high-throughput method for systematically characterizing all multi-protein complexes in a sample [39]. This approach involves:
- Separating protein complexes via BN-PAGE (or alternative methods like density gradient centrifugation).
- Slicing the entire separation lane into consecutive fractions.
- Digesting the proteins in each fraction with trypsin.
- Identifying and quantifying the peptides using tandem mass spectrometry (MS/MS).
Computational clustering of the resulting data produces a comprehensive map of the inventory, abundance, and arrangement of protein complexes [39]. Quantitative methods like SILAC (Stable Isotope Labelling with Amino acids in Cell culture) can be incorporated to compare complexome profiles between different biological states, such as healthy versus diseased tissues [40]. Specialized software tools, including the ComPrAn R package, have been developed to facilitate the analysis and visualization of these complex datasets [40].
BN-PAGE remains a cornerstone technique in mitochondrial research, having fundamentally shaped our understanding of the structural and functional organization of the respiratory chain. Its ability to resolve native supercomplexes provides critical insights that are lost in denaturing analyses. As the field advances, the integration of BN-PAGE with cutting-edge quantitative proteomics through complexome profiling promises to further unravel the dynamic nature of mitochondrial complexomes, offering new perspectives on their role in cellular physiology and the pathogenesis of human disease.
Two-dimensional (2D) Native/SDS-Polyacrylamide Gel Electrophoresis represents a powerful technique for the comprehensive analysis of protein complexes in their native state, followed by high-resolution separation of their individual subunits. This approach combines the native mass and structural separation of complexes in the first dimension with the denaturing separation of constituent proteins by molecular weight in the second dimension. The method is particularly valuable for studying protein-protein interactions, complex stoichiometry, and compositional changes under different biological conditions. By preserving native interactions while providing detailed subunit information, this technology enables researchers to investigate the structural organization of protein assemblies and monitor dynamic changes in complex composition that are crucial for understanding cellular function and facilitating drug development.
The fundamental advantage of this technique lies in its ability to separate protein complexes based on both their native mass/charge properties and their subunit molecular weights, providing a two-dimensional map of protein interactions. When coupled with mass spectrometry, this approach enables system-wide annotation of protein complexes and can reveal isoform-specific interactions and post-translational modifications that selectively associate with distinct subsets of protein complexes [41]. For drug development professionals, this method offers critical insights into how therapeutic compounds might affect protein complex formation and stability.
Theoretical Foundation and Principles
Native PAGE Fundamentals
Native PAGE separates proteins under non-denaturing conditions, maintaining their secondary structure, native charge density, and functional properties [42] [43]. Unlike denaturing SDS-PAGE, Native PAGE uses a non-reducing, non-denaturing sample buffer that preserves protein-protein interactions, enzymatic activity, and bound cofactors such as metal ions [43]. The separation mechanism relies on the movement of polypeptides through a discontinuous chloride and glycine ion front system, sorting proteins by their charge-to-mass ratio rather than molecular weight alone [42].
The fundamental principle involves the formation of moving boundaries that stack and then separate polypeptides, with most proteins migrating toward the negative electrode due to their acidic or slightly basic isoelectric points (pI ~3-8) [42]. For proteins with pI greater than 8-9, the anode and cathode orientation must be reversed [42]. This preservation of native state enables researchers to visualize multiple bands representing different oligomeric states or polymerized forms of the same protein, providing crucial information about protein complex organization.
SDS-PAGE Separation Principles
The second dimension employs classic SDS-PAGE, which denatures protein complexes into their constituent subunits using sodium dodecyl sulfate and heat [43]. This denaturation imparts a uniform negative charge to all proteins proportional to their molecular mass, enabling separation primarily by size as they migrate through the porous acrylamide gel matrix [43]. The combination of these two techniques creates an orthogonal separation system that first resolves intact complexes, then separates their components by molecular weight.
Figure 1: Two-Dimensional Native/SDS-PAGE Workflow. This diagram illustrates the sequential separation process, beginning with native complex separation followed by denaturing subunit analysis.
Experimental Design and Protocols
Sample Preparation for Native PAGE
Proper sample preparation is critical for maintaining native protein interactions throughout the first dimension separation. Proteins should be extracted in a detergent-free buffer at 4°C to preserve complex integrity [44]. The extraction buffer typically includes glycerol to stabilize proteins and may contain Benzonase nuclease to digest nucleic acids that could interfere with separation [43]. Protease inhibitors such as PMSF (500 μM) should be added to prevent protein degradation during extraction [43].
For the first dimension Native PAGE, samples are mixed with a non-reducing native sample buffer containing 62.5 mM Tris-HCl (pH 6.8), 25% glycerol, and 0.1% Bromophenol Blue tracking dye [42]. Crucially, samples must not be heated before loading, as heat denaturation would disrupt protein complexes [42]. This preservation of native structure enables the separation of functional protein assemblies that retain enzymatic activity and bound cofactors.
First Dimension: Native PAGE Protocol
The first dimension separation utilizes a discontinuous native PAGE system with stacking and separating gels [42]:
Separating Gel Preparation: Prepare appropriate acrylamide concentration (6-15%) based on expected complex sizes [42]. For a 10ml 8% separating gel, combine 2.6ml acrylamide/bis-acrylamide (30%/0.8% w/v), 7.29ml 0.375M Tris-HCl (pH 8.8), 100μl 10% ammonium persulfate (added immediately before use), and 10μl TEMED (added last). Pour between glass plates and overlay with water or isopropanol. Allow 20-30 minutes for complete polymerization [42].
Stacking Gel Preparation: While the separating gel polymerizes, prepare stacking gel solution. For 5ml stacking gel, combine 4.275ml 0.375M Tris-HCl (pH 8.8), 0.67ml acrylamide/bis-acrylamide (30%/0.8% w/v), 50μl 10% ammonium persulfate, and 5μl TEMED. After removing the overlay from the polymerized separating gel, pour the stacking gel and insert the comb. Allow 20-30 minutes for polymerization [42].
Electrophoresis Conditions: Prepare running buffer (25 mM Tris, 192 mM glycine, pH approximately 8.3) [42]. Load samples mixed with native sample buffer without heating. Run the gel at constant voltage, keeping the system on ice or at 4°C to prevent protein degradation. Avoid high voltage settings that could generate excessive heat [42].
Second Dimension: SDS-PAGE Protocol
After completing the first dimension separation, the entire Native PAGE gel lane is excised and equilibrated in SDS-containing buffer before transfer to the second dimension:
Equilibration Procedure: Incubate the excised Native PAGE gel lane in SDS sample buffer (e.g., 106 mM Tris HCl, 141 mM Tris Base, 2% LDS, 10% glycerol, pH 8.5) for 30 minutes [43]. For complete denaturation, heating at 70°C for 10 minutes may be employed [43].
Gel Orientation and Embedding: Place the equilibrated gel strip horizontally on the stacking gel of an SDS-PAGE gel. Secure with agarose solution (0.5-1% in SDS running buffer) to prevent movement during electrophoresis.
Electrophoresis Conditions: Run the second dimension using standard SDS-PAGE conditions with MOPS or Tris-Glycine running buffer containing 0.1% SDS [43]. Continue electrophoresis until the dye front reaches the bottom of the gel.
For studies requiring retention of metal ions or enzymatic activity, modified NSDS-PAGE conditions with reduced SDS (0.0375% in running buffer) and omission of EDTA can be employed [43]. This modification has been shown to increase Zn²⁺ retention from 26% to 98% while maintaining activity for seven of nine model enzymes [43].
Protein Visualization and Analysis
Following two-dimensional separation, proteins can be visualized using various staining methods:
Coomassie Blue Staining: Standard Coomassie-blue protocol provides detection of abundant proteins and complexes [42].
Immunoblotting: Transfer to membranes for western blotting with specific antibodies enables targeted detection of proteins of interest [42].
Activity Staining: For enzymes that retain activity under modified native conditions, in-gel activity assays can be performed [43].
Mass Spectrometry Compatibility: Staining methods compatible with subsequent LC-MS/MS analysis (e.g., Coomassie, silver stain) should be used for proteomic applications [45] [44].
Data Analysis and Computational Processing
The complex data generated from 2D Native/SDS-PAGE experiments requires sophisticated computational processing to extract meaningful biological information. Migration profiles for each protein across the molecular weight gradient must be reconstructed by combining data from neighboring fractions excised from the gel [44]. Statistical software such as R is commonly used for subsequent data analysis, including peak identification and deconvolution.
The core data processing pipeline includes several critical steps:
Peak Identification: Local maxima along the molecular weight gradient for each protein are identified using functions like
turnpointsin the pastecs R package [44]. These maxima are filtered to remove those below 20% of the highest relative abundance along the protein profile [44].Profile Deconvolution: Protein chromatograms are deconvoluted into distinct peaks representing independent homo- or heteromeric states of protein oligomerization [44]. This step is essential for identifying proteins that participate in multiple complexes.
Complex Identification: Putative interaction partners are identified by calculating the Euclidean distance between protein profile pairs, with acceptable threshold values based on a cut-off optimized by receiver-operator characteristic (ROC) curve analysis [44].
Figure 2: Data Analysis Pipeline for 2D Native/SDS-PAGE. This workflow illustrates the computational processing from raw image analysis to complex identification and comparative analysis.
Research Reagent Solutions and Materials
Table 1: Essential Research Reagents for Native/SDS-PAGE Analysis
| Reagent/Category | Specific Examples | Function and Application Notes |
|---|---|---|
| Separation Matrices | Acrylamide/Bis-acrylamide (30%/0.8% w/v) | Form porous gel matrix for size-based separation; concentration determines resolution range [42] |
| Buffer Systems | Tris-HCl, Tris-Glycine, BisTris | Maintain pH and ionic conditions; discontinuous systems enable stacking and separation [42] [43] |
| Catalysts | Ammonium Persulfate (AP), TEMED | Initiate and accelerate acrylamide polymerization [42] |
| Tracking Dyes | Bromophenol Blue, Coomassie G-250, Phenol Red | Visualize electrophoresis progress; some provide charge shift for improved resolution [42] [43] |
| Detergents | SDS, LDS | Denature proteins for second dimension; impart uniform charge [43] |
| Stabilizers | Glycerol | Increase sample density and stabilize protein complexes during electrophoresis [42] [43] |
| Protease Inhibitors | PMSF (500 μM) | Prevent protein degradation during extraction and separation [43] |
| Nucleases | Benzonase | Digest nucleic acids that could interfere with protein separation [43] |
Applications and Research Findings
Key Research Applications
The 2D Native/SDS-PAGE approach has enabled significant advances in multiple research areas:
Complexome Analysis: Comprehensive study of protein complex abundance and composition under different biological conditions. Research in Arabidopsis thaliana demonstrated the ability to identify 2338 proteins at end of day and 2469 proteins at end of night, with an 88.3% overlap between conditions [44].
Blood Coagulation Studies: Comparative analysis of human plasma and serum proteins revealed significant differences in 33 proteins related to blood coagulation, complement activation, and wound healing processes [45].
Metalloprotein Characterization: Modified NSDS-PAGE conditions enable retention of metal ions in metalloproteins, with Zn²⁺ retention increasing from 26% to 98% compared to standard SDS-PAGE [43].
Diurnal Regulation Studies: Investigation of protein complex changes between end of day and end of night in plants revealed reorganization of metabolic complexes in response to energy availability [44].
Quantitative Performance Data
Table 2: Performance Metrics of Native PAGE Methodologies in Proteomic Studies
| Performance Parameter | Native PAGE with LC-MS/MS [45] | CN-PAGE Complexome Analysis [44] | SEC/MS Complex Analysis [41] |
|---|---|---|---|
| Total Proteins Identified | 315 proteins | 2,338 (ED) - 2,469 (EN) proteins | >8,000 proteins (>50% of predicted U2OS proteome) |
| Technical Reproducibility | Satisfactory reproducibility of assignment and quantitation | Pearson correlation >0.9 between biological replicates | High degree of reproducibility in fractionation |
| Quantitative Capability | Detected 33 significantly different proteins (fold difference >2 or <0.5, p<0.05) | CV analysis showed low sample-to-sample variation | Statistical evaluation across three biological replicates |
| Coverage Efficiency | Each protein assigned in 1-28 squares (gel slices) | 88.3% overlap between ED and EN conditions | Mean peptide sequence coverage of 27% per protein |
| Special Features | Native MS-electropherograms for structure/interaction analysis | Identification of proteins in oligomeric assemblies (89% larger than monomeric mass) | Identification of 71,500+ peptides and 1,600+ phosphosites |
Technical Considerations and Optimization
Methodological Variations
Several variations of the native PAGE approach have been developed to address specific research needs:
Clear Native PAGE (CN-PAGE): Utilizes Coomassie dye in the cathode buffer rather than the sample buffer, potentially reducing the risk of protein denaturation while maintaining complex integrity [44].
Blue Native PAGE (BN-PAGE): Employs Coomassie G-250 to impart negative charge to protein complexes, enabling separation based on native mass. This method retains functional properties but offers lower resolution compared to denaturing methods [43].
Native SDS-PAGE (NSDS-PAGE): Reduces SDS concentration (0.0375% in running buffer) and eliminates EDTA and heating steps, preserving metal ions and enzymatic activity while maintaining high resolution [43].
Troubleshooting and Optimization Strategies
Successful implementation of 2D Native/SDS-PAGE requires attention to several critical factors:
Complex Stability: Maintain samples at 4°C throughout extraction and electrophoresis to preserve labile protein interactions [44]. Detergent-free conditions are essential for maintaining complex integrity in the first dimension [44].
Gel-to-Gel Reproducibility: Process samples from different biological replicates and conditions in parallel on the same gel to minimize technical variation [44]. This approach is particularly important for comparative analyses.
Horizontal Carryover: Implement control experiments to assess potential horizontal carryover between gel lanes. One study demonstrated minimal carryover with only 20 proteins identified in blank gel fractions adjacent to sample lanes [44].
Mass Spectrometry Compatibility: Use modified in-gel digestion methods such as HiT-Gel for high-throughput processing of numerous gel fractions while minimizing contamination and technical variation [44].
Two-dimensional Native/SDS-PAGE electrophoresis represents a robust methodology for comprehensive protein complex analysis that balances the need for native state preservation with high-resolution subunit separation. The technique provides quantitative information on protein complex abundance and composition that is essential for understanding how metabolic pathways are regulated through the formation and rearrangement of protein assemblies. When integrated with mass spectrometry and sophisticated computational analysis, this approach enables system-wide annotation of protein complexes and reveals dynamic changes in response to biological stimuli.
For drug development professionals, this technology offers powerful insights into how therapeutic compounds affect protein interaction networks, potentially identifying novel targets or mechanisms of action. The continued refinement of native electrophoresis methods, including the development of NSDS-PAGE that preserves metal binding and enzymatic activity, expands the applications of this technique to functional studies of metalloproteins and enzymes. As part of a broader thesis on protein interaction studies, 2D Native/SDS-PAGE provides a critical tool for bridging the gap between protein identity and functional organization within the cellular environment.
Protein-protein interactions (PPIs) form the basis of most cellular processes, with proteins operating not in isolation but as part of stable complexes and dynamic assemblies. Understanding this intricate interactome has been a longstanding challenge in molecular systems biology. Traditional methods like affinity purification mass spectrometry (AP-MS) identify interaction partners but struggle to resolve complex isoforms and subassemblies present concurrently in a sample. Within the context of native polyacrylamide gel electrophoresis (PAGE) research, two advanced methodologies—Deep Interactome Profiling by Mass Spectrometry (DIP-MS) and Functional Linkage Profiling by Mass Spectrometry (FLiP-MS)—represent significant technological leaps. DIP-MS combines affinity purification with blue-native PAGE separation and deep-learning-based signal processing to resolve complex isoforms sharing the same bait protein in a single experiment [46] [47]. This integration allows researchers to move beyond binary interaction networks and study the actual functional units of the cell—the protein complexes themselves—at unprecedented resolution and depth [48].
The importance of these methods is underscored by the limitations of existing approaches. While AP-MS has been the method of choice for analyzing protein complexes, it requires multiple time- and resource-intensive reciprocal experiments to computationally infer complexes from binary interaction data [46]. Similarly, co-fractionation methods like size-exclusion chromatography (SEC-MS) lack the sensitivity to detect low-abundance complexes and face challenges in resolving different complex instances containing the same core subunits [46] [49]. DIP-MS addresses these limitations through its integrated workflow, enabling the study of proteome modularity across a wide dynamic range, from small subcomplexes to large superassemblies [46] [48].
Deep Interactome Profiling by Mass Spectrometry (DIP-MS)
DIP-MS is a novel integrated computational and wet-lab method that identifies distinct protein complexes from an affinity purification sample at high sensitivity [47]. This is accomplished through the integration of four key components: (1) targeted affinity enrichment, (2) blue native-PAGE separation, (3) quantitative high-throughput data-independent acquisition mass spectrometry (DIA-MS), and (4) deep-learning-based signal processing [46] [47]. The method leverages miniaturized sample preparation in a filter plate format that requires ten times less material than traditional chromatography-based separation while achieving high reproducibility [46]. The DIA-MS scheme enables an increased throughput of up to 60 samples per day, making large-scale studies feasible [46].
A critical innovation in DIP-MS is PPIprophet, a data-driven neural network-based protein complex deconvolution system trained on more than 1.5 million binary interactions from 32 cofractionation datasets [46]. This deep learning framework enables prediction of PPIs, identification of multiple instances of protein complexes, and robust deconvolution of complex profiling data into functional modules [46]. PPIprophet performs false discovery rate control using data-generated decoy PPIs and generates a weighted network used for further protein complex identification [46]. It can operate in either a hypothesis testing mode, where the PPI network is deconvolved into complexes by superimposition of available complex knowledge, or in an entirely data-driven mode using Markov clustering [46].
Functional Linkage Profiling by Mass Spectrometry (FLiP-MS)
While the search results provide extensive information on DIP-MS, details about FLiP-MS are not covered in the available literature. FLiP-MS likely represents another advanced mass spectrometry-based approach for interactome profiling, potentially building upon proximity-dependent labeling methods similar to Drug-ID, which applies proximity biotinylation to identify drug-protein interactions inside living cells [50]. However, without specific technical details in the searched literature, the exact methodology, applications, and advantages of FLiP-MS cannot be definitively characterized in this protocol.
Detailed Experimental Protocols
DIP-MS Step-by-Step Workflow
The DIP-MS experimental workflow consists of four main stages, optimized for high reproducibility and throughput [46]:
Stage 1: Affinity Purification of Complexes
- Prepare cellular lysate under native conditions using mild solubilization buffers to preserve protein complexes
- Perform affinity purification using specific antibodies against the endogenous bait protein or tagged version
- Use CRISPR-Cas9-mediated endogenous tagging when possible to maintain native expression levels and avoid overexpression artifacts [1]
- Include appropriate controls to distinguish specific interactions from non-specific binders
Stage 2: Blue Native-PAGE Separation
- Subject affinity-purified complexes to BN-PAGE separation using mini-gel systems
- Run gels under native, non-denaturing conditions to maintain complex integrity
- Cut the gel into approximately 70 slices of 1mm width using precision gel cutters
- Transfer gel slices to 96-well filter plates for parallel processing [46]
Stage 3: High-Throughput Sample Processing
- Process gel slices using filter-aided in-gel digestion protocol in the 96-well plate format
- Perform protein reduction, alkylation, and enzymatic digestion (typically with trypsin) directly in the filter plates
- Elute peptides using optimized buffers for maximum recovery
- The miniaturized format requires 10 times less material than traditional chromatography-based separations [46]
Stage 4: DIA-MS Analysis and Data Processing
- Analyze proteolyzed peptides from each fraction using quantitative DIA-MS coupled with short liquid chromatography gradients [46]
- Use high-resolution mass spectrometers for fragment ion spectra acquisition
- Employ short LC gradients (15-30 minutes) to achieve a throughput of up to 60 samples per day [46]
- Process raw data using spectral library-based or library-free DIA analysis tools
The following diagram illustrates the integrated DIP-MS workflow:
Critical Steps and Optimization
Affinity Purification Optimization:
- Test multiple lysis buffers to balance complex preservation and extraction efficiency
- Optimize wash stringency to reduce non-specific binding while retaining genuine interactions
- Use crosslinking for transient interactions if necessary, though this may alter complex mobility
BN-PAGE Separation Parameters:
- Optimize gel percentage based on expected complex sizes (typically 4-16% gradient gels)
- Use native molecular weight markers for accurate size estimation
- Maintain low temperatures during electrophoresis to prevent complex dissociation
MS Acquisition Settings:
- Implement DIA methods with variable window sizes for optimal peptide coverage
- Balance acquisition speed and resolution for high-throughput analysis
- Include quality control samples to monitor instrument performance
Key Research Reagents and Materials
Successful implementation of DIP-MS requires carefully selected reagents and materials optimized for native complex analysis. The following table details essential components for establishing the DIP-MS workflow:
Table 1: Essential Research Reagents for DIP-MS Implementation
| Reagent/Material | Function | Application Notes |
|---|---|---|
| BN-PAGE Gel System | Native separation of protein complexes by size | Use 4-16% gradient gels; compatible with mini-gel formats for high-throughput processing [46] |
| Affinity Matrix | Bait-specific complex enrichment | Antibodies against endogenous proteins or tags; CRISPR-Cas9 endogenous tagging preferred [1] |
| 96-Well Filter Plates | Miniaturized sample processing | Enable parallel processing of 70+ BN-PAGE slices; reduce material requirement 10-fold [46] |
| DIA-MS Compatible MS Instrument | High-throughput peptide analysis | High-resolution mass spectrometer capable of data-independent acquisition; short LC gradients (15-30 min) [46] |
| PPIprophet Software | Deep-learning-based complex deconvolution | Neural network trained on >1.5M PPIs; performs FDR control and complex identification [46] [48] |
Additional specialized reagents include native lysis buffers (without denaturants), coomassie G-250 for BN-PAGE cathode buffer, enzymatic digestion reagents optimized for filter-plate protocols, and DIA-MS calibration standards. The availability of PPIprophet as freely available software through GitHub significantly lowers the computational barrier for implementation [48].
Performance Benchmarking and Applications
Comparative Performance of DIP-MS
When benchmarked against established methods, DIP-MS demonstrates superior performance in multiple metrics. In a study using PFDN2 as bait protein, DIP-MS identified 353 interaction partners—187 more than both SEC-MS and AP-MS—while recovering approximately 30% of known interactors from public databases [46]. The method achieved higher recall rates while maintaining comparable precision to AP-MS, suggesting that DIP-MS generates much larger and denser interaction networks without compromising data quality [46].
The enhanced performance stems from several factors: the initial bait-enrichment step increases sensitivity for low-abundance complexes, the BN-PAGE separation provides superior resolution of complex isoforms, and the deep-learning analysis enables accurate deconvolution of overlapping assemblies [46]. DIP-MS also covers an expanded dynamic range of roughly 4.4 logs in signal intensities compared to 3.8 logs for SEC-MS, enabling detection of low-abundance complex components [46].
Table 2: Performance Comparison of Interactome Profiling Methods
| Parameter | DIP-MS | AP-MS | SEC-MS |
|---|---|---|---|
| Interactors Identified | 353 (PFDN2 bait) [46] | 166 (PFDN2 bait) [46] | 166 (PFDN2 bait) [46] |
| Complex Resolution | Multiple isoforms in single experiment [46] [48] | Requires reciprocal experiments [46] | Limited by column resolution [46] |
| Sample Throughput | Up to 60 samples/day [46] | Moderate | Low to moderate |
| Dynamic Range | ~4.4 logs [46] | Variable | ~3.8 logs [46] |
| Low Abundance Detection | Excellent (bait enrichment) [46] | Good | Limited |
| Stoichiometry Information | Yes [51] | Limited | Limited |
Key Research Applications
The DIP-MS method has enabled several significant research applications:
Deconvolution of Complex Families: When applied to the human prefoldin family, DIP-MS resolved distinct holo- and subcomplex variants, complex-complex interactions, and complex isoforms with new subunits that were experimentally validated [46] [47]. The method identified a previously unknown PFD homolog containing PDRG1 and established POLR2E as a core subunit of the PFDL complex [51].
Identification of Supercomplexes: DIP-MS demonstrated sensitivity in detecting very large assemblies, including the CCT/TRiC-PFD supercomplex and the PAQosome—a 1.2 MDa supercomplex involved in assembling multiple protein complexes [47] [48]. This capability enables researchers to study hierarchical organization of the proteome beyond individual complexes.
Stoichiometry and Substrate Analysis: The method quantified stoichiometry of prefoldin complexes and suggested the existence of stable subassemblies [46]. It also identified potential folding substrates for complex-complex interactions, providing functional insights beyond structural characterization [47].
Data Analysis and Computational Integration
PPIprophet Computational Framework
The PPIprophet software represents a critical innovation in DIP-MS data analysis, specifically developed to extract four types of information from DIP-MS data: (1) protein-protein interactions, (2) identification of bait-protein complexes, (3) subunit stoichiometry and approximate molecular weight of separated complexes, and (4) prey-prey interactions typically invisible to AP-MS [46]. The framework employs a deep neural network model trained on more than 1.5 million PPIs extracted from databases containing data from different types of cofractionation measurements [46].
PPIprophet implements several advanced features for robust complex identification:
- FDR Control: Uses data-generated decoy PPIs to control false discovery rates
- Interaction Metric: Employs a W score (adapted from CompPASS) that uses specificity and selectivity to filter copurifying proteins [46]
- Complex Deconvolution: Identifies multiple assemblies from protein profiles showing multiple peaks
- Network Analysis: Generates weighted interaction networks for complex inference
Benchmarking against other cofractionation tools (PCprophet, EPIC, PrinCE) demonstrated PPIprophet's superior performance for analyzing DIP-MS datasets [46]. The software is freely available via GitHub, making it accessible to the research community [48].
Data Interpretation Guidelines
Successful interpretation of DIP-MS data requires attention to several key aspects:
Complex Confidence Assessment:
- Consider both interaction scores from PPIprophet and co-elution profile quality
- Evaluate consistency across biological replicates
- Compare with existing complex knowledge from databases like CORUM and hu.MAP
Stoichiometry Estimation:
- Use relative signal intensities across fractions to infer subunit stoichiometry
- Consider protein-specific detection efficiency variations
- Validate unexpected stoichiometries with orthogonal methods
Functional Annotation:
- Integrate complex data with functional annotations from Gene Ontology
- Consider temporal and spatial context for complex formation
- Link complex variants to specific cellular states or conditions
Concluding Remarks
DIP-MS represents a significant advancement in interactome profiling by enabling single-experiment mapping of protein interaction networks with high resolution and sensitivity. The method consolidates years of interactome studies into a streamlined workflow and opens new possibilities for dynamic, condition-specific complex analysis [51]. The integration of native separation, DIA-MS, and machine learning makes DIP-MS particularly valuable for studying proteostasis, signaling pathways, and disease-associated assemblies [51].
As part of multi-omics strategies, DIP-MS provides foundational insight into proteome architecture, complementing genomic, transcriptomic, and metabolomic data. The method's ability to resolve complex isoforms and subassemblies positions it as a powerful tool for linking specific proteome organizational states to phenotypic outcomes in healthy and diseased conditions [47]. With the ongoing development of computational tools like PPIprophet and advances in mass spectrometry technology, DIP-MS promises to continue driving innovations in our understanding of cellular organization and function.
Protein-protein interactions (PPIs) represent a cornerstone of cellular signaling and regulatory processes, governing everything from metabolic pathways to gene expression. The dysregulation of these interactions is implicated in numerous diseases, making them attractive therapeutic targets. Molecular glues and PPI stabilizers are emerging as transformative therapeutic agents that function by enhancing or stabilizing native protein-protein interactions. Unlike traditional PPI inhibitors that disrupt interactions, these compounds bind cooperatively to PPI interfaces, effectively "gluing" proteins together to enhance complex formation and duration [52] [53].
The discovery and development of PPI stabilizers present unique challenges compared to traditional drug discovery. PPI interfaces often lack deep, well-defined binding pockets, instead featuring relatively flat and extensive contact surfaces. These interfaces are characterized by "hot spots"—specific residue clusters that contribute disproportionately to binding energy [54]. Molecular glues typically function by binding to these composite interfaces, engaging with both protein partners simultaneously to enhance affinity through cooperative binding [55] [53]. This mechanism is particularly valuable for targeting intrinsically disordered domains and transient interactions that were once considered "undruggable" [53].
Table 1: Key Characteristics of PPI-Targeting Therapeutic Approaches
| Feature | Traditional PPI Inhibitors | PPI Stabilizers/Molecular Glues |
|---|---|---|
| Mechanism | Disrupts protein complex formation | Enhances or stabilizes existing protein complexes |
| Binding Site | Often targets single protein at interface | Binds composite interface of both proteins |
| Chemical Properties | Follows Lipinski's Rule of 5 | Often follows "Rule of 4" (MW >400, logP >4, >4 rings, >4 H-bond acceptors) |
| Therapeutic Effect | Inhibition of pathway | Stabilization of natural regulatory complexes |
| Development Challenge | Identifying inhibitors for flat surfaces | Identifying cooperative binders for specific complexes |
Experimental Strategies for Studying PPI Stabilizers
Mass Spectrometry-Based Approaches
Mass spectrometry has revolutionized interactome studies by enabling comprehensive mapping of protein interactions under near-physiological conditions. Several advanced MS techniques have been developed specifically for studying PPIs and their modulation:
Affinity Purification-Mass Spectrometry (AP-MS) enables the isolation of protein complexes using specific affinity tags, followed by identification of interaction partners via liquid chromatography-mass spectrometry (LC-MS/MS). A critical design consideration is whether to use antibodies against endogenous proteins or tagged proteins for affinity purification. While antibodies study proteins in their native state, tagged approaches allow more standardized purification, with CRISPR-Cas9-mediated endogenous tagging maintaining native expression levels despite being technically challenging [1].
Intact Mass Spectrometry (MS) provides a direct method for studying molecular glue mechanisms by detecting and quantifying the formation of protein complexes and the binding of stabilizers. This technique allows researchers to monitor the percentage of protein-conjugate formation and assess how this changes in the presence of binding partners, providing crucial data on binding cooperativity [55] [53].
Cross-linking Mass Spectrometry (XL-MS) stabilizes transient interactions through chemical cross-linkers, providing distance restraints that offer structural insights into interaction domains. This approach is particularly valuable for understanding how molecular glues influence complex formation and stability [1].
Table 2: Mass Spectrometry Techniques for PPI Stabilizer Research
| Technique | Key Application | Advantages | Limitations |
|---|---|---|---|
| AP-MS | Identification of protein complexes under near-physiological conditions | Can study endogenous complexes; high specificity | Requires appropriate controls to distinguish true interactors |
| Intact MS | Direct detection of protein-stabilizer complexes | Quantifies binding cooperativity; monitors complex formation in real-time | Limited to smaller complexes; may miss transient interactions |
| XL-MS | Structural studies of stabilized complexes | Provides distance restraints; captures transient interactions | Cross-linkers may alter native complex conformation |
| PL-MS (Proximity Labeling-MS) | Studying interactions in native cellular contexts | Captures transient interactions; works in live cells | Requires genetic engineering; may label non-specific neighbors |
Native Electrophoresis Techniques
Blue Native Polyacrylamide Gel Electrophoresis (BN-PAGE) represents a cornerstone technique for analyzing protein complexes in their native state, making it particularly valuable for studying the effects of molecular glues on complex formation and stability. This technique preserves protein complexes during separation by using non-denaturing conditions and Coomassie Blue G dye, which imparts negative charge proportional to protein mass without disrupting native structures [16].
BN-PAGE enables researchers to determine the size, relative abundance, and subunit composition of mitochondrial and other protein complexes. Additionally, it can detect assembly intermediates, providing insight into the stepwise assembly of these structures and how molecular glues might influence these processes. The method typically employs a two-dimensional gel system, starting with native electrophoresis followed by SDS-PAGE for further resolution of individual subunits [16].
BN-PAGE Protocol for Analysis of Protein Complexes
Stage 1: Sample Preparation
- Isolate mitochondria from cells or tissues (recommended for stronger signals)
- Resuspend 0.4 mg of sedimented mitochondria in 40 μL buffer containing 0.75 M aminocaproic acid and 50 mM Bis-Tris (pH 7.0)
- Add 7.5 μL of 10% n-dodecyl-β-D-maltopyranoside detergent
- Incubate for 30 minutes on ice
- Centrifuge at 72,000 × g for 30 minutes (bench-top microcentrifuge at maximum speed ~16,000 × g may suffice)
- Collect supernatant and discard pellet
- Add 2.5 μL of 5% Coomassie Blue G solution in 0.5 M aminocaproic acid to supernatant
- Add protease inhibitors (1 mM PMSF, 1 μg/mL leupeptin, 1 μg/mL pepstatin) [16]
Stage 2: Native Gel Electrophoresis (First Dimension)
- Prepare linear gradient acrylamide gels (6-13%) for optimal separation
- Use stacking gel composition: 0.7 mL 30% acrylamide, 1.6 mL ddH₂O, 0.25 mL 1 M Bis-Tris (pH 7.0), 2.5 mL 1 M aminocaproic acid (pH 7.0), 40 μL 10% APS, 10 μL TEMED
- Load 5-20 μL samples into wells
- Run electrophoresis at 150 V for approximately 2 hours or until dye front approaches bottom
- Use appropriate cathode (50 mM Tricine, 15 mM Bis-Tris, 0.02% Coomassie Blue G, pH 7.0) and anode (50 mM Bis-Tris, pH 7.0) buffers [16]
Stage 3: Second Dimension Electrophoresis (Optional)
- Cut each gel lane from first dimension and soak in SDS denaturing buffer
- Place lanes horizontally on SDS-PAGE 10-20% acrylamide gels
- Perform standard denaturing electrophoresis for subunit analysis [16]
Stage 4: Electroblotting and Immunodetection
- Soak gel in transfer buffer for 30 minutes before transfer
- Use PVDF membrane (preferred over nitrocellulose)
- Perform electroblotting at 150 mA for 1.5 hours using Tris/Glycine transfer buffer
- Proceed with standard immunodetection protocols [16]
Biophysical and Binding Assays
Fluorescence Anisotropy (FA) provides quantitative data on binding affinity and kinetics between protein partners, allowing researchers to measure how molecular glues influence these parameters. This technique is particularly valuable for determining half-maximal effective concentration (EC₅₀) values of stabilizers, as demonstrated in studies of 14-3-3/ERα complex stabilizers where an EC₅₀ of 0.9 ± 0.11 μM was reported for a promising covalent fragment [55].
NanoBRET Assays enable the measurement of cellular PPIs in live cells, providing a platform for validating compounds in physiologically relevant environments. These proximity-based assays have been specifically adapted for evaluating 14-3-3σ molecular glues, allowing researchers to bridge the gap between in vitro biophysical characterization and cellular activity [53].
Case Study: 14-3-3 Protein Stabilizers
The 14-3-3 protein family represents an ideal model system for studying molecular glues, as these regulatory proteins recognize specific phospho-serine/threonine motifs on disordered domains of hundreds of client proteins. Depending on the phospho-site, 14-3-3 binding can either activate or inhibit signaling pathways, making them valuable therapeutic targets [53].
Disulfide-Tethering Fragment Screening
A systematic approach to identifying 14-3-3 molecular glues employed disulfide-tethering technology, which involved targeting engineered cysteines on 14-3-3 or native cysteines (e.g., C38 on 14-3-3σ) with a library of approximately 1600 disulfide-containing fragments. This approach screened five different clients (ERα, C-RAF, FOXO1, USP8, and SOS1) representing varying sequences, binding modes, and physiological roles [53].
Critical findings from this approach revealed that the positioning of the covalent tether is crucial for eliciting stabilization. Fragments tethered to position C42 of 14-3-3σ showed significant stabilizing activity, while those tethered to C45, despite binding tightly, lacked stabilizing activity toward the motif. This highlights that strong binding alone does not necessarily translate to PPI stabilizing activity—the precise molecular orientation is essential for cooperative binding [55].
Structure-Based Optimization
Starting from initial fragments that stabilized two 14-3-3 clients (ERα and C-RAF), researchers developed cell-active molecular glues selective for ERα. Structure-guided design was employed to optimize ligand-protein interactions at the composite PPI surface, leveraging X-ray cocrystal structures that revealed a "molecular glue" mode of action where fragments engaged subpockets at the composite PPI interface [53].
For the 14-3-3/C-RAF complex, a fragment-merging approach was used to selectively stabilize the inhibited state of C-RAF. This strategy exploited the natural regulatory mechanism where 14-3-3 binding to the inhibitory phospho-S259 site prevents C-RAF dimerization and activation, offering an alternative approach to block the MAPK pathway [53].
Diagram 1: Fragment-Based Discovery Workflow for 14-3-3 Molecular Glues
The growing importance of PPI stabilizers in drug discovery has driven the development of specialized computational tools and datasets to support these efforts.
PPI-Surfer and Surface-Based Comparison
PPI-Surfer represents a novel computational method for comparing and quantifying similarity of local surface regions of protein-protein interactions. This alignment-free approach represents PPI surfaces with overlapping surface patches, each described with three-dimensional Zernike descriptors (3DZD) that capture both 3D shape and physicochemical properties of protein surfaces [56].
This method enables researchers to identify similar potential drug binding regions that don't share sequence or structure similarity, facilitating the repurposing of known PPI modulators for new targets. The approach is particularly valuable for characterizing PPI binding sites, which tend to be larger, flatter, and more hydrophobic than traditional drug-binding sites [56].
Comprehensive PPI Datasets
Recent efforts have produced comprehensive datasets of pocket-centric structural data related to PPIs and PPI-related ligand binding sites. One such resource includes high-quality structural information on more than 23,000 pockets, 3,700 proteins across more than 500 organisms, and nearly 3,500 ligands [57].
This dataset classifies ligand-binding pockets into three main types based on their relationship with PPI interfaces:
- Orthosteric competitive (PLOC): Direct competition between ligand and protein partner's epitope
- Orthosteric non-competitive (PLONC): Ligands within orthosteric pockets that don't directly compete with epitope
- Allosteric (PLA): Pockets near but not overlapping with orthosteric sites that induce allosteric effects [57]
Such classifications are crucial for understanding functional implications of ligand binding and for training machine learning models to design focused chemical libraries targeting specific types of PPI modulation.
The Scientist's Toolkit: Essential Research Reagents
Table 3: Key Research Reagents for Studying PPI Stabilizers
| Reagent/Category | Specific Examples | Function/Application |
|---|---|---|
| Affinity Purification Matrices | Anti-tag antibodies, Anti-endogenous protein antibodies | Isolation of protein complexes for AP-MS studies |
| Cross-linking Reagents | DSSO, DSBU, formaldehyde | Stabilization of transient interactions for XL-MS |
| Proximity Labeling Enzymes | BioID, TurboID, APEX | In vivo labeling of interacting proteins for PL-MS |
| Detergents for Native Conditions | n-dodecyl-β-D-maltopyranoside | Solubilization of membrane protein complexes for BN-PAGE |
| BN-PAGE Reagents | Coomassie Blue G, 6-aminocaproic acid, Bis-Tris | Native electrophoresis of protein complexes |
| Fragment Libraries | Disulfide-containing fragments (~1600 compounds) | Screening for molecular glue candidates via disulfide tethering |
| Cysteine Mutants | 14-3-3σ(C42), 14-3-3σ(C45) | Engineering specific tethering sites for fragment screening |
| Biophysical Assay Components | Fluorescein-labeled peptides, recombinant proteins | Fluorescence anisotropy binding studies |
Diagram 2: Integrated Experimental Approaches for PPI Stabilizer Research
The study of molecular glues and PPI stabilizers represents a frontier in drug discovery that moves beyond traditional inhibition strategies. Through integrated approaches combining advanced mass spectrometry techniques, native electrophoresis methods, sophisticated biophysical assays, and computational tools, researchers are developing systematic platforms for identifying and optimizing these complex therapeutic agents. The successful application of these strategies to 14-3-3 protein complexes provides a roadmap for extending these approaches to other therapeutically relevant PPI networks, offering new opportunities for targeting previously intractable pathways in human disease.
The analysis of native protein complexes is fundamental to advancing molecular clinical diagnostics. Many disease states, including neurodegenerative disorders and cancers, are characterized by specific alterations in protein-protein interactions (PPIs) and the formation of aberrant macromolecular complexes [58] [2]. Native polyacrylamide gel electrophoresis (Native PAGE) serves as a critical biophysical tool that enables the separation and analysis of these protein complexes under non-denaturing conditions, thereby preserving their native stoichiometry, conformation, and interaction states. This preservation is paramount for obtaining biologically relevant diagnostic information that reflects the true pathological state within cells and tissues.
The clinical relevance of this approach is powerfully illustrated in neurodegenerative diseases. For instance, clusterin (apolipoprotein J), a conserved extracellular chaperone, demonstrates significant functional alterations in late-onset Alzheimer's disease [58]. Structural analyses reveal that clusterin utilizes flexible hydrophobic tails to suppress the aggregation of amyloid-β, tau, and α-synuclein—proteins centrally implicated in Alzheimer's and Parkinson's pathologies [58]. Furthermore, its involvement in facilitating the clearance of misfolded proteins via receptor-mediated endocytosis and lysosomal degradation underscores how disruptions in native complex dynamics can directly contribute to disease pathogenesis [58]. Detecting such alterations provides a window into underlying disease mechanisms and creates opportunities for diagnostic and therapeutic intervention.
Key Methodologies and Experimental Protocols
Core Protocol: Native PAGE for Protein Complex Separation
Principle: This protocol separates protein complexes based on their charge-to-mass ratio and native size under non-denaturing conditions (without SDS or reducing agents), preserving protein-protein interactions and complex integrity.
Reagents and Solutions:
- Native PAGE Gel: 4-20% gradient polyacrylamide gel (commercially available or cast in-house) without SDS.
- Anode Buffer (Lower Chamber): 25 mM Tris, 192 mM glycine, pH ~8.3.
- Cathode Buffer (Upper Chamber): 25 mM Tris, 192 mM glycine, pH ~8.3. Note: For basic proteins, the buffer systems may be reversed.
- Native Sample Buffer: 50 mM Tris-HCl (pH 7.5), 10% glycerol, 0.01% Bromophenol Blue. Avoid SDS and β-mercaptoethanol.
- Protein Molecular Weight Standards: Native protein markers (e.g., Thyroglobulin ~669 kDa, Apoferritin ~443 kDa, Amylase ~200 kDa).
- Cell Lysis Buffer (for native extraction): 50 mM Tris-HCl (pH 7.5), 150 mM NaCl, 1% Nonidet P-40 (or native-grade detergent), 1x protease inhibitor cocktail, 1 mM PMSF. Keep samples at 4°C throughout.
Procedure:
- Sample Preparation: Lyse cells or tissues using the native lysis buffer. Perform lysis for 30 minutes on ice with gentle vortexing every 10 minutes. Clarify the lysate by centrifugation at 14,000 x g for 15 minutes at 4°C. Determine protein concentration using a compatible assay (e.g., Bradford).
- Gel Setup: Assemble the native PAGE gel apparatus. Add the anode buffer to the lower chamber and the cathode buffer to the upper chamber, ensuring no bubbles are trapped in the gel cassette.
- Sample Loading: Mix the clarified protein lysate (20-50 µg) with an equal volume of 2x Native Sample Buffer. Load the mixture into the wells. Include native molecular weight standards in a separate well.
- Electrophoresis: Run the gel at a constant voltage of 100-150 V. Maintain the system at 4°C using a cold room or cooling unit. Stop the run when the dye front migrates to the bottom of the gel (~1-2 hours).
- Post-Electrophoresis Analysis:
- Western Blotting: For specific detection, transfer proteins from the native gel to a PVDF membrane using a wet transfer system at 100 V for 1 hour at 4°C. Proceed with standard immunoblotting.
- In-Gel Staining: Fix the gel in 40% methanol, 10% acetic acid for 30 minutes. Stain with Coomassie Brilliant Blue or a compatible fluorescent protein stain to visualize total protein complexes.
- Densitometric Analysis: Use imaging software to quantify the band intensities and shifts in complex size. Compare between control and disease samples to identify alterations.
Supplemental Protocol: Molecular Trap Assay for Disrupting Specific Interactions
Principle: This technique utilizes inducible, high-affinity peptide ligands ("traps") to selectively sequester target proteins within a complex, validating their functional roles. This method is adapted from studies on dynein motor complexes [59].
Reagents:
- FKBP-trap Construct: Plasmid encoding FKBP fused to a low-affinity peptide targeting your protein of interest (e.g., the LC8 binding region of dynein intermediate chain: REIVTYTKETQTP) [59].
- Dimerizer Drug: AP20187 (or analogous compound), reconstituted in ethanol or DMSO per manufacturer's instructions.
- Appropriate Cell Culture Reagents for your model system.
- Lysis Buffer (as in Core Protocol 2.1).
Procedure:
- Transfection: Transiently transfect cells with the FKBP-trap construct using a standard method (e.g., lipofection).
- Induction of Dimerization: 24-48 hours post-transfection, treat cells with the dimerizer drug AP20187 (e.g., 10-100 nM final concentration) for a defined period (minutes to hours) to induce trap dimerization and high-affinity target binding. Include a vehicle-only control.
- Functional Assay & Analysis: Harvest cells and analyze the functional consequence (e.g., organelle distribution via immunocytochemistry) [59]. In parallel, lyse the cells and perform Native PAGE (as per Core Protocol 2.1) to biochemically assess the disruption of the target native complex.
Quantitative Data and Research Reagents
Table 1: Quantitative Profile of Clusterin, a Key Chaperone in Neurodegenerative Disease
| Parameter | Value / Description | Clinical/Experimental Relevance |
|---|---|---|
| Molecular Weight | ~90 kDa (monomer at pH 5); ~220 kDa (dimer at pH 6.5-8.5) [58] | Diagnostic shifts in oligomerization state can indicate pathological conditions. |
| Protein Domains | Three-domain architecture: coiled-coil (CC), disulfide bridge (DD), C-terminal α/β roll (AB) [58] | Mutations in these domains can disrupt function and are linked to disease risk. |
| Key Functional Regions | Two disordered hydrophobic tails (β-tail: residues 199-227; α-tail: residues 228-244) [58] | Mediate chaperone function (suppress Aβ, tau, α-synuclein aggregation) and receptor binding. |
| Genetic Link to AD | Specific CLU gene alleles are significant risk factors for late-onset Alzheimer's disease [58] | Direct genetic evidence supporting its role as a diagnostic and therapeutic target. |
Table 2: Research Reagent Solutions for Native Complex Analysis
| Reagent / Resource | Function / Application | Example & Notes |
|---|---|---|
| Membrane-Active Polymers (MAPs) | Spatially resolved extraction of membrane proteins into native nanodiscs, preserving local lipid environment [60]. | Library of polymers (e.g., SMA variants); used in high-throughput solubilization assays [60]. |
| Inducible Dimerization Traps | Rapid, specific sequestration of cellular targets to study function of protein complexes in vivo [59]. | FKBP-fusion proteins with target peptides; dimerized by AP20187 [59]. |
| Public PPI Databases | Source of known and predicted interactions for target selection and data validation [2]. | STRING, BioGRID, IntAct, DIP, MINT [2]. |
| Deep Learning Prediction Tools | Computational prediction of PPIs and interaction sites from sequence and structural data [2]. | Graph Neural Networks (GNNs), Graph Attention Networks (GAT), multi-modal models [2]. |
| Hydrogen-Deuterium Exchange MS (H/DX-MS) | Maps protein regions with flexible/disordered structures and ligand binding interfaces under native conditions [58]. | Validates structural models and identifies dynamic regions critical for function [58]. |
Visualizing Workflows and Pathways
Native PAGE Analysis Workflow
Clusterin Chaperone Function in Aggregation Clearance
Data Integration for Diagnostic Profiling
Optimizing Native PAGE: Troubleshooting Common Challenges and Enhancing Resolution
Within the framework of investigating protein interactions via native polyacrylamide gel electrophoresis (PAGE), the choice of detergent is a critical experimental variable. Membrane protein complexes are inherently unstable outside their native lipid bilayers, and conventional detergents, while effective at solubilization, often disrupt native protein-protein and protein-lipid interactions [61] [62]. This creates a fundamental challenge: achieving efficient extraction from the membrane while simultaneously preserving the integrity of labile complexes for downstream analysis. This application note outlines a rational strategy and detailed protocols for detergent optimization, leveraging recent advances in amphiphile chemistry to balance these competing demands, specifically for native PAGE-based research.
Scientific Rationale and Detergent Design Principles
The core challenge lies in the dynamic and often disruptive nature of traditional detergent micelles. While they shield hydrophobic protein surfaces, their compact, highly curved structure can destabilize membrane protein complexes and strip away essential lipids [61] [63]. The overarching goal of novel detergent design is to create a more membrane-like environment that strengthens hydrophobic protein-detergent interactions while minimizing protein denaturation.
Key physical properties to consider include:
- Hydrophilic-Lipophilic Balance (HLB): Typically optimal between 11 and 14 for membrane protein stabilization. A lower HLB indicates greater hydrophobicity and potentially stronger interaction with membrane protein surfaces [62] [63].
- Micelle Size and Alkyl Chain Density: Denser micelle interiors, achieved through branched hydrophobic chains or multiple alkyl tails, reduce water penetration and enhance protein stability by mimicking the tight packing of a lipid bilayer [62] [63].
- Charge-Reducing Properties: For techniques like native mass spectrometry (MS) often coupled with native PAGE, specialized detergents incorporating moieties like spermine can reduce Coulombic unfolding during analysis, thereby preserving non-covalent complexes [37].
Table 1: Key Properties of Advanced Detergents for Complex Preservation
| Detergent Category | Example Compounds | Key Structural Feature | Primary Advantage | Reported Performance |
|---|---|---|---|---|
| Tandem Malonate-Derived Glucosides (TMGs) | TMG-P10,8 | Three alkyl chains; central chain shorter by two carbons | High alkyl chain density; superior extraction & long-term stability | More effective at stabilizing a GPCR (β2AR) than DDM and TMG-A13 [63] |
| Hetero-Bicephalic Detergents | ST-Mal-SPM, ST-E4-SPM | Two distinct headgroups: Maltose/TEG + Spermine | Potent charge reduction; preserves labile interactions in Native MS | Reduced Zavg of TRAAK from 18.2 (in DM) to 13.7; preserved GPCR-nanobody complex [37] |
| Pendant-Bearing Amphiphiles | Pendant-GNG, Pendant-MPG | Hydrophobic or hydrophilic groups at linker region | Tunable micelle properties; reduces water penetration | Enhanced stability of diverse MPs compared to conventional detergents [62] |
| Branched-Chain Maltosides | Mal-101, Mal-111 | Short alkyl pendants near headgroup | Optimized hydrophilic-lipophilic balance; reduces aggregation | Improved stability for several model membrane proteins [62] |
Research Reagent Solutions
The following toolkit lists essential reagents for detergent optimization in the study of membrane protein complexes.
Table 2: Essential Research Reagent Toolkit
| Reagent / Material | Function / Application | Key Considerations |
|---|---|---|
| DDM (n-Dodecyl-β-D-Maltoside) | Benchmark conventional detergent for solubilization and stability. | High CMC; good for initial extraction but offers moderate stability. |
| LMNG (Lauryl Maltose Neopentyl Glycol) | Gold-standard for stabilizing complex structures (e.g., for Cryo-EM). | Low CMC; excellent stability but can be difficult to remove. |
| Charge-Reducing Detergents (e.g., ST-Mal-SPM) | Native MS analysis of membrane proteins and their complexes. | Introduces spermine moiety to lower charge states and prevent overactivation [37]. |
| Tandem Malonate Glucosides (e.g., TMG-P10,8) | High-efficacy extraction and long-term stabilization of challenging targets like GPCRs. | Features three alkyl chains for increased hydrophobic density [63]. |
| Ammonium Acetate (200 mM, pH 8.0) | Buffer for native MS sample preparation and buffer exchange. | Provides volatile salts compatible with mass spectrometry. |
| Peptidisc Peptides (e.g., 18A & derivatives) | Detergent-free reconstitution of membrane proteins into nanodiscs for analysis. | Useful for studying proteins that are highly sensitive to all detergents [61] [33]. |
| Size Exclusion Chromatography (SEC) Columns | Purification and analysis of monodisperse protein-detergent complexes (PDCs). | Critical for assessing the homogeneity and oligomeric state of complexes post-solubilization. |
Experimental Protocols for Detergent Evaluation
Protocol 1: Systematic Screening of Detergents for Solubilization and Complex Preservation
This protocol provides a framework for evaluating novel detergents against established benchmarks.
Materials:
- Membrane preparation (e.g., isolated cell membranes containing the target protein).
- Detergent stock solutions (e.g., 10% w/v DDM, 1% w/v LMNG, 1% w/v TMG-P10,8, ST-Mal-SPM).
- Native PAGE gel (e.g., 4-16% Bis-Tris gradient gel).
- Solubilization buffer (e.g., 50 mM HEPES pH 7.4, 150 mM NaCl, 10% Glycerol, protease inhibitors).
Procedure:
- Solubilization Setup: Aliquot identical amounts of membrane preparation (e.g., 1 mg total protein) into separate microcentrifuge tubes.
- Detergent Addition: Add each test detergent to a final concentration of 1-2% (w/v). Include a no-detergent control. Gently mix and incubate for 2-3 hours at 4°C with end-over-end rotation.
- Insoluble Material Removal: Centrifuge the solubilization mixtures at 100,000 × g for 30 minutes at 4°C.
- Supernatant Analysis: Carefully collect the supernatant, which contains the solubilized protein-detergent complexes (PDCs).
- Native PAGE Analysis: Load equal volumes of each supernatant onto a native PAGE gel. Run the gel according to standard protocols (e.g., 150 V for 1-2 hours at 4°C).
- Data Interpretation:
- Solubilization Efficiency: Compare the band intensity of the target protein complex across lanes. A brighter band indicates higher solubilization yield.
- Complex Integrity: Assess the migration and sharpness of the band. A single, well-defined band at the expected molecular weight suggests the complex is intact. Smearing or multiple lower-molecular-weight bands may indicate dissociation or aggregation [33] [63].
Protocol 2: Evaluating Long-Term Stability of Solubilized Complexes
This protocol assesses the efficacy of a detergent in maintaining the native state of a solubilized complex over time, a critical factor for lengthy purification and analysis procedures.
Materials:
- Pre-solubilized protein complex in the test detergent (from Protocol 1, Step 4).
- Temperature-controlled incubator or thermal cycler.
Procedure:
- Aliquot and Incubate: Divide the solubilized protein sample into multiple aliquots.
- Stress Conditions: Incubate the aliquots under different stress conditions:
- Thermal Stability: Incubate one set of aliquots at 4°C and another at a relevant elevated temperature (e.g., 20°C or 30°C) for defined periods (e.g., 0, 24, 48, 72 hours).
- Time Course: Simply store the main sample at 4°C and analyze it at regular intervals over 1-2 weeks.
- Stability Assessment: At each time point, analyze an aliquot by:
- Native PAGE: To check for complex dissociation or aggregation.
- Size Exclusion Chromatography (SEC): To quantitatively monitor the shift from a monodisperse peak (stable complex) to higher-order aggregates (void volume peak) or dissociated species [63]. A detergent like TMG-P10,8 has been shown to confer significantly better long-term stability compared to DDM for several membrane proteins [63].
Data Interpretation and Workflow
The following diagram illustrates the logical workflow for detergent screening and optimization, from initial solubilization to data-driven decision-making.
Detergent Screening Workflow
Advanced Applications and Case Studies
The rational design of detergents enables specialized applications beyond basic solubilization. For instance, hetero-bicephalic detergents like ST-Mal-SPM and ST-E4-SPM represent a significant innovation for hybrid methodologies. These detergents feature a spermine moiety, a potent charge-reducing group, alongside a traditional solubilizing headgroup (maltoside or tetraethylene glycol) [37]. In practice, these detergents can be introduced as additives to protein samples already solubilized in conventional detergents like DM or DDM. Upon introduction and activation in the mass spectrometer, they significantly reduce the average charge state (Zavg) of membrane protein ions without disrupting the non-covalent interactions. This was demonstrated for the TRAAK channel and a GPCR-nanobody complex, where the interaction was maintained during analysis—a feat difficult to achieve with standard detergents [37]. This approach showcases a powerful strategy for integrating native PAGE separation with subsequent native MS characterization.
For proteins that are exceptionally detergent-sensitive, alternative membrane mimetics such as Peptidiscs and other nanodisc technologies offer a detergent-free pathway. The "DeFrND" (Detergent-Free reconstitution into Native nanodiscs) method, for example, uses engineered membrane-scaffolding peptides to directly extract membrane proteins and their surrounding lipid environment from cell membranes into nanodiscs [33]. The workflow for this method is distinct from traditional detergent-based approaches, as outlined below.
Detergent-Free Reconstitution Workflow
In the study of protein-protein interactions (PPIs), maintaining the native conformation of protein complexes is paramount, and native polyacrylamide gel electrophoresis (Native-PAGE) serves as a cornerstone technique for this purpose [64]. Unlike denaturing methods, Native-PAGE separates proteins based on their intrinsic net charge, size, and three-dimensional shape, allowing for the analysis of functional, multimeric complexes and the retention of enzymatic activity [64]. However, a common challenge in this technique is achieving sufficient resolution, particularly when a single sample contains protein complexes with a broad range of molecular weights. This application note details the use of gradient gels and optimized electrophoresis conditions to overcome these resolution issues within the context of protein interaction studies.
Core Principles and the Case for Gradient Gels
The Mechanism of Gradient Gels
Linear gradient gels are crafted to have a continuous change in acrylamide concentration, typically from a low percentage at the top to a high percentage at the bottom. This creates a corresponding pore size gradient [64].
- Sieving Effect: The pore size in a polyacrylamide gel is inversely related to its percentage concentration [64]. As proteins migrate, they encounter progressively smaller pores.
- Optimized Migration: Large proteins migrate freely through the large pores at the top of the gel but are slowed down as they reach pores closer to their own size. Smaller proteins, unaffected by the large pores, continue to migrate until they too are sieved by the smaller pores at the bottom. This results in a focusing effect, sharpening bands and improving resolution across a wide mass range [64].
- Self-Stacking: The gradient itself can perform the function of a stacking gel, concentrating the sample into a tight band before effective separation begins, which is why a stacking gel is not necessary when using a gradient gel [64].
Comparative Advantage over Single-Percentage Gels
Single-percentage gels are optimal for resolving proteins within a narrow size range. In contrast, gradient gels offer a versatile solution for complex samples, such as cell lysates or native protein complexes, where the size of the interacting species is heterogeneous or unknown. The use of a gradient gel, such as a 4–20% or 6–13% linear acrylamide gradient, enables the resolution of both large and small protein complexes on the same gel, providing a comprehensive view of the interaction landscape [64] [16].
Table 1: Comparison of Gel Types for Native-PAGE
| Gel Type | Acrylamide Concentration | Best For | Limitations |
|---|---|---|---|
| Single-Percentage | Fixed (e.g., 8%) | Proteins/complexes of similar size | Limited resolution for heterogeneous samples |
| Gradient | Linear (e.g., 4-20%) | Complex mixtures with a broad size range | More complex to cast manually |
| Blue Native (BN-PAGE) | Linear (e.g., 6-13%) [16] | Resolving intact mitochondrial & multiprotein complexes | Requires specific buffers & Coomassie dye |
Detailed Experimental Protocols
Protocol 1: Casting a Linear Gradient Gel for Native-PAGE
This protocol outlines the manual pouring of a 6-13% gradient gel using a two-chamber gradient former, suitable for a mini-gel format (e.g., BioRad Mini-PROTEAN II) [16].
Research Reagent Solutions
Table 2: Key Reagents for Native Gradient Gels
| Reagent | Function | Example/Note |
|---|---|---|
| Acrylamide/Bis Solution | Forms the cross-linked polymer matrix | A 30% stock, 37.5:1 ratio is standard [16] |
| Bis-Tris (1M, pH 7.0) | Buffering agent for native conditions | Maintains stable pH during electrophoresis [16] |
| 6-Aminocaproic Acid (1M, pH 7.0) | Provides ionic strength & minimizes protein aggregation | Critical for maintaining native states in BN-PAGE [16] |
| Ammonium Persulfate (APS) | Polymerizing agent | Typically used as a 10% solution [16] |
| TEMED | Polymerization catalyst | Accelerates the formation of free radicals by APS [64] |
Procedure:
- Prepare Gel Solutions: In two separate beakers, prepare the low- and high-concentration solutions as detailed below. Do not add TEMED until immediately before pouring.
- Low-% Solution (6%): 7.6 mL 30% Acrylamide, 9 mL ddH₂O, 19 mL 1M 6-aminocaproic acid (pH 7.0), 1.9 mL 1M Bis-Tris (pH 7.0), 200 µL 10% APS, 20 µL TEMED. Total volume ~38 mL [16].
- High-% Solution (13%): 14 mL 30% Acrylamide, 0.2 mL ddH₂O, 16 mL 1M 6-aminocaproic acid (pH 7.0), 1.6 mL 1M Bis-Tris (pH 7.0), 200 µL 10% APS, 20 µL TEMED. Total volume ~32 mL [16].
- Set Up Gradient Former: Connect the gradient former to a peristaltic pump leading to the gel cassette. Ensure the outlet tube reaches the bottom of the cassette.
- Pour the Gradient: Add the low-% solution to the "reservoir" chamber (connected to the outlet) and the high-% solution to the "mixing" chamber. Start the magnetic stirrer in the mixing chamber and begin pumping. The gradient will form as the high-% solution is gradually mixed into and displaces the low-% solution flowing into the cassette.
- Overlay and Polymerize: Carefully overlay the gel solution with a 50% isopropanol solution to ensure a flat, even top. Allow the gel to polymerize completely (approximately 30 minutes).
- Prepare and Pour Stacking Gel: After polymerization, rinse off the isopropanol. Pour a native stacking gel (e.g., 4% acrylamide in 1M 6-aminocaproic acid, 0.25M Bis-Tris, pH 7.0, with APS and TEMED) and insert a well comb [16].
Protocol 2: Blue Native PAGE (BN-PAGE) for Protein Complex Analysis
BN-PAGE is a specialized form of native electrophoresis ideal for studying mitochondrial complexes and other multisubunit enzymes [16]. The workflow involves several key stages, as illustrated below.
Key Steps and Conditions:
Sample Preparation:
- Isolate mitochondria from cells (e.g., Saccharomyces cerevisiae) [16].
- Solubilize 0.4 mg of mitochondria in 40 µL of buffer containing 0.75 M 6-aminocaproic acid and 50 mM Bis-Tris, pH 7.0.
- Add 7.5 µL of 10% n-dodecyl-β-D-maltopyranoside (lauryl maltoside), mix, and incubate on ice for 30 minutes [16].
- Centrifuge at high speed (e.g., 72,000 x g for 30 min) to remove insoluble material.
- Collect the supernatant and add Coomassie blue G dye (e.g., 2.5 µL of a 5% solution) [16].
First Dimension (BN-PAGE):
- Use a pre-cast or hand-cast linear gradient gel (e.g., 6-13%) [16].
- Load 5-20 µL of the prepared sample per well.
- Run the gel using anode and cathode buffers specified in the protocol [16]. Typical conditions are 150 V for approximately 2 hours, or until the dye front has almost migrated off the gel [16].
Second Dimension (SDS-PAGE, Optional):
- For subunit analysis, excise a lane from the first-dimension BN-PAGE gel.
- Soak the gel strip in SDS-PAGE denaturing buffer containing dithiothreitol (DTT) to denature proteins.
- Place the strip horizontally on top of an SDS-PAGE gel (e.g., 10-20% gradient) and run to separate the individual subunits of each complex resolved in the first dimension [16].
Data Presentation and Performance
The effectiveness of gradient gels in resolving complex protein mixtures is demonstrated by the data below. A 4-20% gradient gel can clearly resolve a protein ladder, purified proteins, and complex biological samples like E. coli lysate into sharp, distinct bands [64].
Table 3: Exemplary Electrophoresis Conditions and Outcomes
| Gel Type | Sample Type | Electrophoresis Conditions | Key Outcome / Resolution |
|---|---|---|---|
| 4-20% Gradient Tris-Glycine [64] | Protein ladder, BSA, hIgG, E. coli lysate | Mini Gel Tank; SimplyBlue SafeStain | Sharp, straight bands from ~10 kDa to >200 kDa [64] |
| 6-13% BN-PAGE Gradient [16] | Solubilized mitochondrial complexes | 150 V for ~2 hours; First dimension | Separation of intact OXPHOS complexes & assembly intermediates [16] |
| SDS-PAGE 10-20% (2nd dimension) [16] | BN-PAGE gel strip | Standard SDS-PAGE conditions | Resolution of individual subunits from native complexes [16] |
Integration with Broader Research Goals
Optimized native PAGE is a critical first step in a multi-technique workflow for studying PPIs. The high-resolution separation achieved with gradient gels provides a solid foundation for downstream analyses:
- Western Blotting: Confirming the identity of specific proteins within a complex using antibodies [64] [16].
- Mass Spectrometry: Excising protein bands from the gel for identification by mass spectrometry, which is fundamental in proteomics [64]. This is complemented by advanced techniques like cross-linking mass spectrometry (XL-MS), which provides low-resolution structural information on PPIs in their native environment [65].
- Activity Staining: As native conditions preserve enzymatic function, the gel can be assayed directly for activity to link a specific complex to a biological function [64].
In conclusion, the strategic application of gradient gels and optimized electrophoresis conditions directly addresses resolution challenges in native PAGE. This enables researchers to obtain high-quality, interpretable data on protein interactions, feeding directly into downstream structural and functional analyses central to modern biochemical and drug discovery research.
Within the framework of protein interaction studies, native polyacrylamide gel electrophoresis (native PAGE) serves as a pivotal technique for the analysis of native protein complexes under non-denaturing conditions. This methodology provides profound insights into the composition, stoichiometry, and assembly of macromolecular complexes, which are fundamental to understanding cellular function [66]. However, the practical application of native PAGE is frequently challenged by technical artifacts such as streaking, smearing, and complex dissociation, which can obscure results and lead to erroneous interpretations. This application note delineates detailed protocols for the validation of blue- and clear-native PAGE, specifically optimized for the characterization of mitochondrial oxidative phosphorylation (OXPHOS) complexes, and provides a systematic approach for identifying, troubleshooting, and mitigating these common artifacts. The mitochondrial OXPHOS system, comprising five protein-lipid complexes, is an exemplary model for studying complex interactions, and its analysis has been instrumental in elucidating pathologic mechanisms in monogenetic metabolic disorders [66].
Background and Significance
Protein-protein interactions (PPIs) form the backbone of nearly all essential biological processes, and the ability to study these interactions is crucial in both basic research and drug discovery. The human PPI interactome is estimated to encompass approximately 650,000 interactions, presenting a vast landscape for therapeutic intervention [56]. While small molecule protein-protein interaction inhibitors (SMPPIIs) have emerged as a promising class of therapeutics, they present unique challenges as PPI interfaces tend to be larger, flatter, and more hydrophobic than traditional drug-binding sites [56]. Native electrophoresis techniques, particularly BN-PAGE and CN-PAGE, have become indispensable tools for gaining insights into the structure-function relationships of such complexes, enabling the study of assembly pathways and the composition of higher-order supercomplexes [66].
Quantitative Analysis of Common Artifacts
The following table summarizes the primary artifacts encountered in native PAGE, their common causes, and quantitative impact on data interpretation.
Table 1: Common Artifacts in Native PAGE and Their Characteristics
| Artifact Type | Primary Causes | Impact on Data Quality | Corrective Strategies |
|---|---|---|---|
| Streaking | Incomplete solubilization, insufficient Coomassie G-250, protein aggregation [66] | Reduces resolution; obscures distinct protein bands | Optimize detergent-to-protein ratio; ensure homogeneous sample preparation [66] |
| Smearing | Protein degradation, overloading, improper gel polymerization [66] | Prevents precise molecular weight determination; hinders complex identification | Use fresh protease inhibitors; validate gel casting protocol; optimize sample load [66] |
| Complex Dissociation | Overly harsh solubilization, incorrect detergent choice, prolonged electrophoresis [66] | Leads to loss of native complexes; generates false-negative results | Use mild detergents (e.g., DDM); shorten run time; use CN-PAGE for fragile complexes [66] |
| Loss of Enzyme Activity | Denaturation during extraction or electrophoresis | Renders in-gel activity assays ineffective | Shorten sample extraction; use pre-cooled buffers; employ activity staining enhancements [66] |
| In-Gel Activity Staining Insensitivity | Limited substrate penetration, enzyme instability | Weak or absent signal for specific complexes (e.g., Complex IV) [66] | Apply simple enhancement steps (e.g., for Complex V); consider alternative assays [66] |
Detailed Experimental Protocols
Validated BN-PAGE/CN-PAGE Protocol for OXPHOS Complexes
This step-by-step protocol, validated for the analysis of mitochondrial complexes, is designed to minimize artifacts and yield robust, semi-quantitative results [66].
I. Sample Preparation (Shortened Extraction Procedure)
- Isolate mitochondria from target tissues or cell lines using standard differential centrifugation.
- Solubilize mitochondrial membranes using a mild, non-ionic detergent. Digitonin (0.5-2%) or n-Dodecyl-β-D-maltoside (DDM) is recommended for preserving supercomplexes.
- Critical Step: Optimize the detergent-to-protein ratio (e.g., 2-4 g detergent/g protein) to prevent both incomplete solubilization (causing streaking) and over-solubilization (causing dissociation) [66].
- Clarify the solubilized extract by ultracentrifugation (e.g., 100,000 × g for 15-30 minutes at 4°C) to remove insoluble material.
- Add Coomassie G-250 dye to the supernatant to a final concentration of 0.25-0.5%. The dye confers a negative charge and improves protein solubility, reducing aggregation and streaking [66].
II. Manual Casting of Native Mini-Gels
- Prepare a gradient gel (e.g., 3-12% or 4-16% acrylamide) to resolve a broad range of molecular weights.
- Example Setup: Use a gradient mixer to pour a linear gradient from a high-percentage solution (12% acrylamide, 0.5% bisacrylamide) to a low-percentage solution (3% acrylamide, 0.5% bisacrylamide).
- Allow the gel to polymerize completely before proceeding. Inconsistent polymerization is a primary cause of smearing.
III. Electrophoresis and Downstream Analysis
- Load samples and run electrophoresis under cold conditions (typically 4°C) to maintain complex stability.
- For BN-PAGE, the cathode buffer should contain the blue dye Coomassie G-250 (0.02%). For CN-PAGE, which is milder and preferable for fragile complexes or in-gel activity assays, use cathode buffer without dye or with a minimal charge-shift compound [66].
- Perform downstream applications:
- Western Blotting: Transfer proteins to a membrane and probe with antibodies against specific complex subunits.
- In-Gel Enzyme Activity Staining:
- Complex I (NADH dehydrogenase): Incubate gel in a solution containing NADH and nitrotetrazolium blue.
- Complex IV (Cytochrome c oxidase): Incubate gel in a solution containing cytochrome c and DAB.
- Complex V (ATP synthase): The protocol includes a simple enhancement step that markedly improves sensitivity [66].
- Two-Dimensional BN/SDS-PAGE: Excise a lane from the native gel, equilibrate in SDS buffer, and place on a denaturing SDS-PAGE gel to separate individual subunits.
Workflow for Artifact Troubleshooting
The following diagram outlines a logical pathway for diagnosing and addressing the common artifacts discussed in this note.
Diagram 1: A logical workflow for troubleshooting common native PAGE artifacts.
The Scientist's Toolkit: Key Research Reagent Solutions
The following table details essential materials and their specific functions in successful native PAGE experiments, as derived from the validated protocol [66].
Table 2: Essential Research Reagents for Native PAGE of Protein Complexes
| Reagent/Material | Function and Role in Mitigating Artifacts | Application Notes |
|---|---|---|
| Coomassie G-250 Dye | Imparts negative charge to proteins; enhances solubility to prevent aggregation and streaking [66]. | Used in sample buffer and BN-PAGE cathode buffer. Critical for proper complex migration. |
| Mild Detergents (Digitonin, DDM) | Solubilizes lipid membranes while preserving labile protein-protein interactions [66]. | Digitonin is preferred for supercomplex analysis. Concentration must be optimized for each sample. |
| Protease Inhibitor Cocktails | Prevents protein degradation by endogenous proteases, thereby reducing smearing [66]. | Must be added fresh to all solubilization and extraction buffers. |
| Acrylamide/Bis-Acrylamide Stocks | Forms the porous matrix of the separation gel. | A gradient gel (e.g., 3-12%) is recommended for resolving complexes of varying sizes. |
| In-Gel Activity Assay Reagents | Enable functional characterization of specific complexes (e.g., Complex I, IV, V) after electrophoresis [66]. | Includes substrates like NADH, cytochrome c, and ATP. Enhancement steps can improve sensitivity. |
Integrated Analysis Workflow from Experiment to Insight
The comprehensive process, from sample preparation to data analysis, is visualized below, integrating both experimental and computational steps that are foundational to modern protein interaction studies [56] [5] [2].
Diagram 2: Integrated workflow for native PAGE-based protein complex analysis.
In the study of protein-protein interactions (PPIs), particularly within the framework of native polyacrylamide gel electrophoresis (PAGE) research, the selection of antibodies that recognize their targets in a native, properly folded state is paramount. Antibodies are extraordinary tools across all fields of biology, especially in neuroscience for imaging, detection, and quantification studies [67]. Most conventional antibodies bind to unstructured or linear epitopes, which may be inaccessible in properly folded, functional proteins. In contrast, conformation-specific antibodies bind to three-dimensional (3D) epitopes, recognizing the native conformations of the target antigen as they naturally occur in biological systems [67] [68].
The native form of a protein represents its correctly folded and post-translationally modified state, which is essential for its biological activity [68]. For techniques like native PAGE, which separates intact protein complexes under non-denaturing conditions to study their assembly, interactions, and functional states [7], the use of antibodies targeting native epitopes becomes a critical prerequisite for valid results. These antibodies have proven highly useful as crystallization chaperones in X-ray crystallography and as fiducial markers in cryo-electron microscopy (cryo-EM) [67]. Because conformation-specific antibodies recognize 3D shapes of the antigen, they often exhibit exquisite specificity and are particularly valuable in immunofluorescence studies and isolation of antigens from native tissues [67].
Table 1: Comparison of Antibody Types for Protein Recognition
| Feature | Linear Epitope Antibodies | Conformation-Specific Antibodies |
|---|---|---|
| Epitope Recognized | Unstructured, linear sequences | 3D structural elements from folded proteins |
| Specificity | May recognize denatured protein | Recognizes native conformation only |
| Applications | Western blot, denatured samples | Native PAGE, live-cell imaging, functional studies |
| Dependency on Protein Folding | Low | High |
| Use in Structural Biology | Limited | Crystallography, cryo-EM chaperones |
Key Principles of Conformation-Specific Antibody Development
Strategic Antigen Design and Presentation
The development of conformation-specific antibodies requires careful antigen preparation to preserve native protein structures. A robust method for generating high-affinity, conformation-specific antibodies targeting diverse synaptic membrane receptors involves using proteoliposome (PL)-based immunization [67]. This approach presents the target protein within a lipid bilayer environment that closely mimics its native membrane context, preserving its natural tertiary and quaternary structure and exposing the correct extracellular epitopes for immune recognition.
This methodology is particularly valuable for challenging membrane protein targets such as ionotropic glutamate receptors (iGluRs) and their auxiliary subunits [67]. By maintaining proteins in a native-like environment throughout the immunization process, researchers can bias the immune response toward generating antibodies that recognize functionally relevant conformations rather than denatured linear sequences. The PL-based method has demonstrated success in producing high-quality monoclonal antibodies (mAbs) for structural, biochemical, and imaging studies within a four-month timeframe [67].
Advanced Screening Methodologies
Identifying antibodies that recognize native epitopes requires sophisticated screening approaches beyond standard techniques. Fluorescence-detection size-exclusion chromatography (FSEC) and conformation-sensitive enzyme-linked immunosorbent assays (ELISAs) are essential tools for tracking immune responses and identifying clones with desired conformational specificity [67].
These techniques allow researchers to discriminate between antibodies that recognize:
- Linear epitopes (accessible even in denatured proteins)
- Conformational epitopes (dependent on proper protein folding)
For PPI studies specifically, Fluorescence Resonance Energy Transfer (FRET) has emerged as a powerful technique for investigating interactions in real time under physiological conditions [69]. FRET functions as a "molecular ruler" that can detect direct molecular interactions with nanometer-scale precision (1-10 nanometer range), making it ideal for confirming whether antibodies bind to properly folded protein complexes [69].
Experimental Protocols for Characterization and Validation
Protocol 1: Conformation-Specific Antibody Validation via ELISA
This protocol provides a method for detecting conformational antibodies using ELISA, adapted from established procedures for characterizing antibodies against integral membrane proteins [67].
Materials:
- Purified native antigen in proteoliposomes or nanodiscs
- Control denatured antigen (heat or chemically denatured)
- Test antibodies (conformation-specific candidates)
- Control antibodies (linear epitope-specific)
- Standard ELISA reagents: plates, blocking buffer, wash buffer, detection reagents
Procedure:
- Plate Coating: Coat adjacent ELISA plates with either native or denatured antigen (100 µL/well, 1-5 µg/mL in PBS). Incubate overnight at 4°C.
- Blocking: Block plates with 200 µL/well of blocking buffer (PBS with 3-5% BSA or non-fat dry milk) for 2 hours at room temperature.
- Primary Antibody Incubation: Add serial dilutions of test and control antibodies to both native and denatured antigen plates. Incubate for 2 hours at room temperature.
- Washing: Wash plates 3-5 times with wash buffer (PBS with 0.05% Tween-20).
- Secondary Antibody Incubation: Add appropriate enzyme-conjugated secondary antibody. Incubate for 1 hour at room temperature.
- Detection: Develop with appropriate substrate and measure absorbance.
- Interpretation: Conformation-specific antibodies show significantly higher signal (typically >5-fold) against native versus denatured antigen, while linear epitope antibodies recognize both forms equally.
Protocol 2: Native PAGE and Western Blot Analysis for Complex Assembly
This protocol validates antibody performance in detecting native protein complexes, adapted from established native PAGE methods for studying oxidative phosphorylation (OXPHOS) complexes [7].
Materials:
- BN-PAGE Buffer System: Cathode buffer (50 mM Tricine, 15 mM Bis-Tris, 0.02% Coomassie G-250, pH 7.0), anode buffer (50 mM Bis-Tris, pH 7.0)
- Sample Buffer: 50 mM NaCl, 50 mM Imidazole/HCl, 2 mM 6-aminohexanoic acid, 1 mM EDTA, pH 7.0
- Membrane Solubilization Buffer: 1% n-dodecyl-β-D-maltoside (for individual complexes) or 1-4% digitonin (for supercomplexes) in sample buffer
- Gel System: 3-12% or 4-16% linear gradient polyacrylamide gels
Procedure:
- Sample Preparation: Solubilize membrane fractions (0.5-2 mg/mL protein) in solubilization buffer for 30 minutes on ice. Centrifuge at 20,000 × g for 30 minutes at 4°C to remove insoluble material.
- Sample Loading: Mix supernatant with 10× loading buffer (5% Coomassie G-250 in 1 M 6-aminohexanoic acid). Load 10-50 µg protein per lane.
- Electrophoresis: Run at 100 V for 30 minutes with cathode buffer containing 0.02% Coomassie G-250, then continue at 200-250 V for 2-3 hours at 4°C.
- Western Transfer: Transfer proteins to PVDF membrane using standard wet transfer systems.
- Immunodetection: Block membrane with 5% BSA in TBST. Incubate with primary antibody (1-5 µg/mL) overnight at 4°C. Detect with appropriate HRP-conjugated secondary antibody and chemiluminescence.
- Interpretation: Conformation-specific antibodies should detect properly assembled complexes at expected molecular weights, while failing to recognize denatured samples run on SDS-PAGE.
Diagram 1: Conformation-specific antibody characterization workflow.
The Scientist's Toolkit: Essential Research Reagent Solutions
Table 2: Key Research Reagents for Native Epitope Studies
| Reagent Category | Specific Examples | Function in Native Epitope Research |
|---|---|---|
| Membrane Active Polymers | Styrene-maleic acid (SMA) copolymers, diisobutylene-maleic acid (DIBMA) | Extract membrane proteins directly into native nanodiscs preserving local lipid environment [60] |
| Detergents for Native Solubilization | n-Dodecyl-β-D-maltoside, Digitonin | Mild solubilization of membrane proteins while preserving complex integrity [7] |
| Native Gel Electrophoresis Systems | BN-PAGE, CN-PAGE | Separate intact protein complexes under non-denaturing conditions [7] |
| FRET-Compatible Fluorophores | CFP/YFP, GFP/RFP pairs, Lanthanide chelates | Enable real-time PPI monitoring in live cells with nanometer precision [69] |
| Proteoliposome Components | Synthetic lipids, purified membrane proteins | Present antigens in native-like lipid environment for immunization [67] |
Technical Considerations and Advanced Applications
Special Challenges for Membrane Protein Targets
Membrane proteins present particular challenges for native antibody development as they require maintenance of their lipid environment for proper structure and function. The local membrane environment profoundly influences every aspect of membrane protein biology, yet traditional detergents often strip away this crucial context [60]. Recent advances in membrane-active polymers enable the extraction of membrane proteins directly from cellular membranes into native nanodiscs that maintain the local membrane context [60]. This technological advancement provides superior antigen presentation for both immunization and characterization.
High-throughput platforms now exist that quantify extraction efficiency for thousands of mammalian membrane proteins, providing optimized conditions for each target [60]. These resources empower researchers to efficiently capture membrane 'nano-scoops' containing target proteins and interface with structural, functional, and bioanalytical approaches.
Quantitative Assessment of Binding Kinetics
For therapeutic antibody development, precise quantification of binding kinetics is essential. Bio-Layer Interferometry (BLI) systems like the Octet platform provide robust methods for measuring ionotropic glutamate receptor binding kinetics [67]. These systems enable real-time monitoring of antibody-antigen interactions without fluidics, providing data on association and dissociation rates that can correlate with functional activity.
Additionally, single-molecule FRET (smFRET) provides extremely high spatial and temporal resolution at the individual molecule level, making it ideal for studying molecular mechanisms, conformational changes, and PPI kinetics in real time [69]. This technique has revealed structural transitions occurring on timescales from subseconds to minutes, comparable to physiological binding events.
Diagram 2: Conformation-specific mAb development workflow for membrane proteins.
The selection of appropriate antibodies for native epitope recognition requires a multifaceted approach combining rigorous validation techniques with sophisticated antigen preparation methods. As research increasingly focuses on the dynamic interactions within complex cellular environments, particularly studied through techniques like native PAGE, the demand for high-quality conformation-specific antibodies will continue to grow. By implementing the protocols and considerations outlined in this application note, researchers can significantly enhance the reliability and biological relevance of their findings in protein interaction studies.
The field is rapidly advancing with new technologies such as proteome-wide extraction databases [60], advanced FRET methodologies [69], and computational prediction tools [70] that collectively empower researchers to develop and characterize antibodies with unprecedented precision for native protein targets. These tools, combined with the systematic approaches described herein, provide a robust foundation for investigating protein interactions in their physiologically relevant contexts.
Buffer Systems and pH Optimization for Different Protein Classes
Within the broader context of native PAGE applications in protein interaction studies, the selection of an appropriate buffer system is a critical foundational step. Unlike denaturing electrophoresis, native polyacrylamide gel electrophoresis (PAGE) maintains proteins in their folded, functional state, preserving protein complexes, biological activity, and native conformation [71]. This technique separates proteins based on a combination of their intrinsic charge, size, and three-dimensional shape, making the buffer chemistry and pH paramount for successful separation and meaningful interpretation of protein interaction data [27].
The charge of a protein in solution is determined by its isoelectric point (pI) and the pH of the surrounding buffer. Consequently, there is no universal buffer system ideal for all native proteins [27]. Optimizing the buffer system for specific protein classes—whether acidic, basic, or membrane-associated—is essential for achieving high-resolution separation, maintaining complex stability, and obtaining reliable results in downstream analyses such as activity assays or western blotting. This application note provides a detailed guide for researchers and drug development professionals to select and optimize native PAGE buffer systems for different protein classes.
Key Buffer Systems for Native PAGE
The choice of buffer system directly dictates the pH environment during electrophoresis, which in turn determines the net charge and migration direction of the protein of interest. Table 1 summarizes the three primary gel chemistry systems available for native PAGE separation, their operating parameters, and their recommended applications.
Table 1: Key Native PAGE Buffer Systems and Their Applications
| Gel System | Operating pH Range | Key Features | Ideal Use Cases |
|---|---|---|---|
| Tris-Glycine [27] | 8.3 - 9.5 [27] | Traditional Laemmle system; proteins retain their native net charge [27]. | Separating smaller molecular weight proteins (20–500 kDa); studying acidic proteins (which carry a net negative charge and migrate toward the anode) [72] [27]. |
| Tris-Acetate [27] | 7.2 - 8.5 [27] | Provides better resolution for larger molecular weight proteins (>150 kDa) [27]. | Analyzing large protein complexes and membrane proteins while maintaining native charge [27]. |
| Bis-Tris (with Coomassie G-250) [27] | ~7.5 [27] | Uses Coomassie G-250 dye to impart a uniform negative charge; compatible with detergents; based on Blue Native (BN)-PAGE [27]. | Analyzing basic proteins, membrane proteins, hydrophobic proteins, or when separation by molecular weight is desired regardless of native pI [27]. |
For acidic proteins, which typically have a pI below 7, high pH buffer systems like Tris-Glycine (pH 8.8) are standard. In this alkaline environment, acidic proteins become negatively charged and migrate towards the anode [72]. Conversely, the electrophoresis of basic proteins (pI > 7) is usually carried out in a slightly acidic environment, which may require the researcher to invert the cathode and anode during electrophoresis to ensure proper migration [72]. The NativePAGE Bis-Tris system elegantly overcomes this complication by using Coomassie G-250 dye, which binds to proteins and confers a net negative charge even to basic proteins, allowing all proteins to migrate uniformly toward the anode without the need for electrode inversion [27].
Detailed Experimental Protocols
Protocol 1: Tris-Glycine Native PAGE for Acidic Proteins
This protocol is adapted for separating acidic proteins using a discontinuous Tris-Glycine system [72].
Research Reagent Solutions:
- 40% Acr-Bis Solution (Acr:Bis=19:1): Dissolve 380 g acrylamide and 20 g N,N'-methylene bisacrylamide in 600 mL distilled water. Heat to 37°C to dissolve, then adjust final volume to 1 L. Filter through a 0.45 μm filter and store in a brown bottle at 4°C. Caution: Acrylamide monomer is a neurotoxin; use appropriate personal protective equipment. The polymerized gel is non-toxic [72].
- 4× Separating Gel Buffer (1.5 mol/L Tris-HCl, pH 8.8): Dissolve 18.2 g Tris base in 80 mL water. Adjust to pH 8.8 with concentrated HCl. Add water to a final volume of 100 mL. Store at 4°C [72].
- 4× Stacking Gel Buffer (0.5 mol/L Tris-HCl, pH 6.8): Dissolve 6 g Tris base in 80 mL water. Adjust to pH 6.8 with concentrated HCl. Add water to a final volume of 100 mL. Store at 4°C [72].
- 10× Electrophoresis Buffer (pH 8.8 Tris-Gly): Dissolve 30.3 g Tris base and 144 g glycine in water. Adjust to a final volume of 1 L. Store at 4°C [72].
- 10% Ammonium Persulfate (APS): Dissolve 100 mg APS in 1 mL sterile water. Prepare fresh.
- N,N,N',N'-Tetramethylethylenediamine (TEMED): Store at 4°C.
- 2× Sample Loading Buffer: 1.25 mL 0.5 mol/L Tris-HCl (pH 6.8), 3.0 mL glycerol, 0.2 mL 0.5% bromophenol blue, 5.5 mL double distilled water. Store at -20°C [72].
Methodology:
- Gel Casting: Assemble glass plates according to electrophoresis manufacturer's instructions.
- Prepare Separating Gel (17%, 10 mL): Combine 4.25 mL 40% Acr-Bis, 2.5 mL 4× Separating Gel Buffer, and 3.2 mL deionized water. Mix gently. Immediately before pouring, add 35 μL of 10% APS and 15 μL TEMED. Mix and pour the gel to about ¾ the height of the short plate. Carefully overlay with 1 mL of isopropanol or water to seal the surface and ensure a flat interface.
- Polymerization: Allow the gel to polymerize for approximately 30 minutes at room temperature. A distinct interface will form between the gel and the overlay. Pour off the overlay, rinse with distilled water, and remove excess water with filter paper.
- Prepare Stacking Gel (4%, 5 mL): Combine 0.5 mL 40% Acr-Bis, 1.25 mL 4× Stacking Gel Buffer, and 3.2 mL deionized water. Mix gently. Add 35 μL of 10% APS and 15 μL TEMED. Pour the stacking gel mixture immediately and insert a clean comb without introducing air bubbles.
- Polymerization: Allow the stacking gel to polymerize for 30 minutes. Carefully remove the comb.
- Sample Preparation: Dilute 10 μL of protein sample with 5 μL of 3× sample loading buffer. Mix thoroughly. Avoid using denaturing agents like SDS or reducing agents like β-mercaptoethanol.
- Electrophoresis: Dilute the 10× electrophoresis buffer to 1× with deionized water. Fill the upper and lower chambers of the electrophoresis tank. Load the prepared samples into the wells. Run the gel at a constant 100 V until the dye front enters the separating gel, then increase to 160 V constant voltage until the dye front reaches about 1 cm from the bottom of the gel (approximately 80 minutes total) [72]. To prevent heat-induced denaturation, perform electrophoresis in a cold room or with the tank placed on ice [72].
Protocol 2: NativePAGE Bis-Tris for Basic and Membrane Proteins
This protocol utilizes the NativePAGE Bis-Tris system, which is ideal for basic proteins, membrane proteins, and for estimating native molecular weight [27].
Research Reagent Solutions:
- NativePAGE Sample Buffer: A proprietary buffer containing non-ionic detergent to maintain protein solubility.
- NativePAGE 5% G-250 Sample Additive: Contains Coomassie G-250 dye which binds to proteins.
- NativePAGE Running Buffer: The anode buffer.
- NativePAGE Cathode Buffer Additive: Added to the Running Buffer to create the cathode buffer.
- NativePAGE Bis-Tris Gels (e.g., 3-12% or 4-16% gradient): Pre-cast gels are recommended for consistency.
Methodology:
- Sample Preparation: Incubate the protein sample with NativePAGE Sample Buffer and NativePAGE 5% G-250 Sample Additive as per manufacturer's instructions. The G-250 additive is critical for imparting charge to basic proteins and preventing aggregation of hydrophobic proteins [27].
- Buffer Preparation: Prepare the anode buffer by diluting the NativePAGE Running Buffer. Prepare the dark blue cathode buffer by adding the NativePAGE Cathode Buffer Additive to the diluted Running Buffer.
- Electrophoresis: Load the prepared samples onto the NativePAGE Bis-Tris gel. Run the gel at a constant voltage as recommended (e.g., 100 V for ~1 hour) until the samples have entered the stacking gel. Replace the dark blue cathode buffer with a light-colored or colorless cathode buffer (prepared with a reduced amount of additive) to limit dye interference in downstream applications. Continue electrophoresis until the dye front has migrated to the bottom of the gel.
- Downstream Processing (Western Blotting): For western blotting, PVDF membrane is mandatory. Nitrocellulose is not compatible as it binds the Coomassie G-250 dye irreversibly [27]. Transfer should be performed using recommended buffers, such as NuPAGE Transfer Buffer, which may contain a low concentration of SDS (e.g., 0.05%) to aid transfer of hydrophobic proteins [27] [28].
The following workflow diagram summarizes the key decision points and experimental steps for a native PAGE experiment focused on protein interaction studies.
Advanced Application: Native PAGE for GPCR-G Protein Interactions
Native PAGE is a powerful tool for studying challenging membrane protein complexes, such as those involving G protein-coupled receptors (GPCRs). A peer-reviewed protocol demonstrates its use in characterizing agonist-dependent coupling between detergent-solubilized GPCRs and engineered "mini-G" proteins [17].
This assay utilizes high resolution clear native electrophoresis (hrCNE), a specific type of native-PAGE compatible with fluorescently-labeled proteins. The workflow involves solubilizing GPCR-expressing cells or membrane preparations with a mild detergent (e.g., Lauryl Maltose Neopentyl Glycol, LMNG) in the presence of cholesteryl hemisuccinate (CHS) to maintain protein stability [17]. The solubilized receptor is then incubated with purified mini-G protein in the presence or absence of an agonist. When analyzed by native PAGE, the formation of a stable GPCR-mini-G complex results in a distinct mobility shift, which can be visualized via in-gel fluorescence if the receptor is tagged (e.g., with EGFP) [17].
Key Reagents for GPCR Native PAGE Assay [17]:
- Detergent: LMNG, crucial for solubilizing membrane proteins while maintaining complex integrity.
- Stabilizing Lipid: CHS, often used with membrane proteins to enhance stability and functionality.
- Mini-G Proteins: Purified, minimal G protein alpha subunits that trap the GPCR in an active state.
- Agonists: Ligands to stimulate receptor activation and complex formation.
- Protease Inhibitors: To prevent protein degradation during sample preparation.
This application highlights the technique's versatility in providing a relatively simple, cost-effective method to visualize and biochemically characterize protein interactions that are otherwise difficult to study, offering quantitative data on agonist affinity and efficacy [17].
Troubleshooting and Data Interpretation
A critical aspect of native PAGE is the accurate interpretation of results, which differ significantly from SDS-PAGE. In SDS-PAGE, proteins are denatured and coated with SDS, so migration is primarily based on the polypeptide chain's molecular weight. In native PAGE, migration is influenced by the protein's native mass, its net charge at the running pH, and its shape [71] [22].
A classic example is a protein that migrates at 60 kDa on a non-reducing SDS-PAGE but at 120 kDa on a native PAGE. This discrepancy strongly suggests that the protein exists as a dimer of 60 kDa subunits that are not linked by disulfide bonds in its native state. The non-covalent interactions maintaining the dimer are disrupted by SDS in the denaturing gel but preserved in the native gel, leading to the different apparent molecular weights [22].
When troubleshooting, consider the following:
- Poor Resolution: Optimize the acrylamide concentration gradient for the size range of your target protein/complex. Ensure the gel has polymerized correctly.
- Smearing or Artifacts: The sample may be overloaded, or the protein may be aggregating. Titrate detergent concentrations (e.g., in the sample buffer) to improve solubility without denaturing the complex. Run the gel at 4°C to minimize heat-induced aggregation [72].
- Unexpected Mobility: Remember that mobility is a function of charge, size, and shape. A highly charged protein may migrate faster than a larger, less charged complex. The Bis-Tris system with G-250 can help standardize separation by mass [27].
The strategic optimization of buffer systems and pH is fundamental to the successful application of native PAGE in protein interaction research. The choice between Tris-Glycine, Tris-Acetate, and Bis-Tris systems must be guided by the isoelectric point and nature (e.g., soluble, membrane) of the target protein class. As demonstrated in advanced applications like GPCR studies, a well-optimized native PAGE protocol provides a powerful, versatile, and accessible method for probing protein complexes, conformational states, and functional interactions under conditions that closely mimic the native cellular environment. This makes it an indispensable tool in the pipeline of biochemical analysis and drug development.
The analysis of protein complexes is fundamental to understanding cellular machinery, yet the study of low-abundance complexes remains a significant challenge in proteomics. These rare assemblies, often key regulators of critical pathways, are masked by abundant proteins in most biological samples. Within the broader context of native PAGE research, this article details the advanced pre-fractionation and enrichment strategies essential for their detection and characterization. We provide a consolidated guide of modern techniques, complete with structured data and detailed protocols, to empower researchers in uncovering the hidden interactome.
A variety of techniques are employed to reduce sample complexity and enhance the detection of low-abundance protein complexes. The table below summarizes the core principles, advantages, and limitations of major methodologies.
Table 1: Comparison of Key Techniques for Enriching Low-Abundance Protein Complexes
| Method | Principle | Advantages | Drawbacks | Best Suited For |
|---|---|---|---|---|
| Combinatorial Peptide Ligand Libraries (CPLL) | Equalizes protein dynamic range by saturating binding sites for high-abundance proteins (HAPs) while concentrating low-abundance proteins (LAPs) [73]. | Concentrates LAPs; Reduces HAP mask; No sample type restrictions [73]. | Requires large sample volumes; Can be expensive; Typically single-use [73]. | Broad discovery from biological fluids (e.g., serum, plasma). |
| Immunoaffinity Depletion/Enrichment | Uses antibodies to remove highly abundant proteins or to pull down a target protein and its interactors [73] [46]. | High specificity; Easy handling; Compatible with small samples [73]. | Restricted to known targets; High cost; Risk of co-depletion; Can dilute sample [73]. | Targeted studies with a specific bait protein. |
| Blue-Native PAGE (BN-PAGE) | Separates intact protein complexes by size under native conditions using Coomassie dye for charge [34]. | Preserves native interactions and activity; Resolves hydrophobic complexes; Can be combined with MS [34]. | Limited sensitivity for very low-abundance complexes without pre-fractionation [34]. | Analysis of native complex size, stoichiometry, and integrity. |
| Size-Exclusion Chromatography (SEC) | Separates proteins and complexes in solution based on their hydrodynamic volume (size/shape) [74]. | High binding capacity; Mild, solution-based conditions; Can be hyphenated with MS (SEC-MS) [74]. | Fraction overlapping; Can cause significant sample dilution [73] [74]. | System-wide profiling of complex distributions. |
| Co-fractionation MS (CF-MS) | Separates protein complexes via a native method (e.g., SEC or BN-PAGE) and profiles co-eluting/co-migrating proteins with MS to infer interactions [5] [46]. | Can discover novel complexes and interactions in an untargeted manner [5]. | Computational inference required; Can miss low-abundance components [46]. | System-wide interaction network mapping. |
The following workflow diagram illustrates how these techniques can be integrated into a cohesive strategy for analyzing low-abundance complexes.
Integrated Strategies and Advanced Workflows
No single technique is sufficient for deep interactome mining. Modern research relies on integrated workflows that combine the strengths of multiple methods to achieve unprecedented sensitivity and resolution.
DIP-MS (Deep Interactome Profiling by MS): This powerful workflow combines affinity purification (AP) to enrich for a target bait's interactome with BN-PAGE to resolve different complex isoforms, followed by quantitative Data-Independent Acquisition (DIA) MS and deep-learning-based signal processing. This integration allows for the resolution of distinct holo- and subcomplex variants, complex-complex interactions, and isoforms with new subunits in a single experiment [46]. The initial AP step overcomes the sensitivity limitations of traditional co-fractionation methods, pulling low-abundance complexes above the detection threshold, while the subsequent BN-PAGE separation deconvolves the mixed interactions [46].
SEC-MS for Isoform-Resolved Complexes: Combining native size-exclusion chromatography with high-throughput proteomics characterizes soluble protein complexes while revealing how specific protein isoforms and post-translational modifications (PTMs) selectively associate with distinct complexes. This approach has been used to annotate over 8,000 proteins from human cells and identify complexes where specific isoforms, like those in the MRFAP1-MORF4L1 network, form distinct assemblies [74].
BN-PAGE-LC-MS/MS for Membrane Complexes: For notoriously difficult membrane proteins, BN-PAGE is coupled directly with LC-MS/MS. This gel-based strategy effectively characterizes the modular components of multiprotein complexes in membrane fractions, successfully identifying integral membrane proteins with multiple transmembrane helices that are often under-represented by traditional 2D-PAGE [75].
Detailed Experimental Protocol: DIP-MS
The following protocol for DIP-MS is adapted from the method that significantly outperforms traditional AP-MS and SEC-MS in recall and precision for identifying protein interactions [46].
Materials and Reagents
- Cell Line: Adherent or suspension cells expressing the protein of interest (either endogenously or with a tag).
- Lysis Buffer: 50 mM Tris-HCl (pH 7.4), 150 mM NaCl, 10% glycerol, 1% Nonidet P-40 (or a mild detergent like n-Dodecyl-β-D-maltoside for membrane proteins), supplemented with complete protease inhibitor cocktail [74].
- Affinity Matrix: Beads compatible with your purification (e.g., GFP-Trap agarose for GFP-tagged baits, antibody-coupled beads for endogenous pull-downs).
- BN-PAGE Materials:
- Anode Buffer: 50 mM Bis-Tris, pH 7.0 @ 4°C.
- Cathode Buffer: 50 mM Tricine, 15 mM Bis-Tris, 0.05% (w/v) Coomassie G-250, pH 7.0 @ 4°C.
- Gel: 3-12% or 4-16% gradient polyacrylamide bis-tris native gel.
- NativeMark Unstained Protein Standard.
- Digestion Reagents: Trypsin/Lys-C mix, ammonium bicarbonate, dithiothreitol (DTT), iodoacetamide (IAA), formic acid.
- LC-MS/MS System: Nano-flow liquid chromatography system coupled to a high-resolution tandem mass spectrometer.
Step-by-Step Procedure
Affinity Purification: a. Harvest cells and lyse in a suitable volume of ice-cold lysis buffer (e.g., 1 mL per 10^7 cells). b. Clarify the lysate by centrifugation at 17,000 × g for 15 minutes at 4°C. c. Incubate the supernatant with the pre-washed affinity beads for 1-2 hours at 4°C with gentle agitation. d. Wash the beads 3-5 times with a large volume of lysis buffer (without inhibitors) to remove non-specifically bound proteins [46] [74].
Elution and BN-PAGE Separation: a. Elute the protein complexes from the beads using a low-pH buffer (e.g., 0.1 M glycine, pH 2.5) or by competitive elution. Immediately neutralize the eluate. b. Load the eluted complexes onto a pre-run BN-PAGE gel. c. Run the gel with dark blue cathode buffer at the start. Once the dye front has migrated one-third into the gel, replace the cathode buffer with a light blue or colorless version (without Coomassie) to improve MS compatibility. Run at 4°C until the dye front reaches the bottom [34].
Gel Fractionation and Digestion: a. Carefully excise the entire lane and slice it into ~70 sequential fractions of 1 mm width. b. Destain the gel slices, reduce proteins with DTT, and alkylate with IAA. c. Perform in-gel digestion with trypsin overnight at 37°C [46].
Mass Spectrometry Analysis: a. Extract peptides from the gel slices and desalt using StageTips or μ-Elation plates. b. Analyze peptides from each fraction using a DIA (Data-Independent Acquisition) method on a coupled LC-MS/MS system. A short LC gradient is feasible due to the prior fractionation, enabling high throughput [46].
Data Analysis
Process the raw DIA-MS data using specialized software (e.g., Spectronaut, DIA-NN) against a relevant protein sequence database. The resulting peptide quantitation data across all fractions generates co-elution profiles for each identified protein. Use a dedicated tool like PPIprophet to analyze these profiles [46].
- PPIprophet: A deep-learning-based software trained on over 1.5 million binary interactions. It takes the co-elution matrices, infers protein electrophoretic elution patterns, predicts protein-protein interactions (PPIs) with high confidence, and deconvolves the data into distinct protein complexes. It can operate in a hypothesis-driven or entirely data-driven mode to identify multiple complex isoforms sharing the same bait protein [46].
The Scientist's Toolkit: Essential Research Reagents
Successful analysis of low-abundance complexes depends on critical reagents. The table below lists key solutions and their specific functions in the described workflows.
Table 2: Key Research Reagent Solutions for Protein Complex Studies
| Reagent / Solution | Function / Application | Example Usage & Notes |
|---|---|---|
| Combinatorial Peptide Ligand Libraries (CPLL) | Equalizes protein concentration dynamic range in complex samples by selective affinity capture [73]. | Pre-fractionation of serum/plasma; Identifies early-stage biomarkers and host cell protein contaminants [73]. |
| Mild Non-Ionic Detergents | Solubilizes membrane protein complexes while preserving native protein-protein interactions [34]. | n-Dodecyl-β-D-Maltoside (DDM): General use. Digitonin: Preserves weak supercomplexes (e.g., in mitochondria) [34]. Triton X-100: Broad application [34]. |
| Coomassie G-250 Dye | Imparts negative charge to protein complexes under native conditions for BN-PAGE separation [34]. | Added to the cathode buffer and sample; binds non-specifically to protein surfaces without denaturation [34]. |
| Affinity Purification Beads | Enriches specific protein complexes from a crude lysate via a tagged or endogenous bait protein [46] [74]. | GFP-Trap, FLAG-M2, Streptavidin beads; choice depends on the tag used. Critical for DIP-MS and AP-MS workflows [46]. |
| Volatile MS-Compatible Buffers | Maintains protein stability during analysis without suppressing ionization or causing adducts in MS [76] [77]. | Ammonium Acetate (commonly 50-200 mM) is the gold standard for native MS; replaces non-volatile salts like Tris or PBS [76]. |
| Crosslinkers | Stabilizes transient or weak protein interactions temporarily during purification and separation [5]. | Used at low concentrations to "freeze" endogenous complexes prior to lysis, though not featured in core protocols above. |
Visualization of Integrated DIP-MS Workflow
The DIP-MS workflow, which effectively deconvolves complex isoforms, can be visualized as follows.
Concluding Remarks
The systematic analysis of low-abundance protein complexes is no longer an insurmountable challenge. As detailed in these application notes, the strategic combination of enrichment techniques like CPLL and immunoaffinity purification with high-resolution native separations (BN-PAGE, SEC) and state-of-the-art mass spectrometry creates a powerful pipeline. Protocols such as DIP-MS, supported by sophisticated computational tools like PPIprophet, are setting a new standard for sensitivity and resolution in interactome studies. By applying these detailed protocols and leveraging the summarized data on reagents and methods, researchers can now probe deeper into the proteome, illuminating the critical, yet rare, protein complexes that govern fundamental biology and disease.
Within the broader context of native polyacrylamide gel electrophoresis (PAGE) methodologies for protein interaction studies, Clear Native-PAGE (CN-PAGE) represents a specialized technique uniquely suited for investigating labile protein complexes. Unlike its more common counterpart, Blue Native-PAGE (BN-PAGE), CN-PAGE eliminates the potential disruptive effects of Coomassie dye on delicate protein-protein interfaces [7]. This technical distinction is crucial for researchers studying weak, transient interactions that govern essential cellular processes but may dissociate under standard electrophoretic conditions.
The fundamental difference between these techniques lies in their charge-shift mechanisms. BN-PAGE utilizes the anionic dye Coomassie blue G-250, which binds to hydrophobic protein surfaces and imposes a uniform negative charge shift [7]. While effective for stabilizing many membrane protein complexes, this dye binding can potentially disrupt subtle electrostatic interactions critical for maintaining weak complexes. In contrast, CN-PAGE replaces the Coomassie dye with mixtures of anionic and neutral detergents in the cathode buffer [7]. These mixed micelles induce a sufficient charge shift to drive electrophoretic migration while minimizing direct interference with protein interfaces, thereby preserving native conformational states and interaction networks that might be compromised in BN-PAGE.
Technical Comparison: CN-PAGE Versus BN-PAGE
Table 1: Comparative Analysis of CN-PAGE and BN-PAGE Methodologies
| Parameter | CN-PAGE | BN-PAGE |
|---|---|---|
| Charge-shift mechanism | Mixed anionic/neutral detergent micelles | Coomassie blue G-250 dye binding |
| Impact on protein interactions | Minimal disruption; preserves weak interactions | Potential disruption of dye-sensitive interfaces |
| Visualization limitations | No residual dye interference | Coomassie dye interferes with downstream applications |
| Optimal application scope | Labile complexes, weak/transient interactions, enzyme activity studies | Stable membrane complexes, supercomplex resolution |
| Compatibility with in-gel activity assays | Excellent (no dye interference) | Limited for some enzymes |
| Sample preparation | Similar membrane solubilization with mild detergents | Identical initial steps with Coomassie addition |
The decision framework for selecting between these techniques hinges primarily on the nature of the protein interactions under investigation and the intended downstream applications. CN-PAGE is distinctly superior for studies targeting weak, transient protein-protein interactions that might be disrupted by Coomassie binding [7]. Additionally, CN-PAGE is the mandatory choice when planning in-gel enzyme activity staining for complexes such as Complexes I, II, IV, and V of the mitochondrial oxidative phosphorylation system, as it eliminates the problem of residual blue dye interference that plagues BN-PAGE applications [7]. The CN-PAGE protocol is particularly valuable when working with rare patient samples or limited biological material, as it incorporates a simplified extraction procedure that minimizes sample loss while maximizing preservation of native interactions [7].
Conversely, BN-PAGE remains the preferred methodology for analyzing robust membrane protein complexes and respiratory chain supercomplexes, particularly when using digitonin for membrane solubilization [7]. The Coomassie dye in BN-PAGE provides enhanced protein solubility and migration consistency for these stable assemblies. Furthermore, BN-PAGE typically offers superior resolution for comprehensive complexome profiling approaches, making it ideal for initial surveys of protein assembly states.
CN-PAGE Experimental Protocol for Preserving Weak Interactions
Sample Preparation and Membrane Solubilization
The critical first step in CN-PAGE analysis involves gentle membrane protein extraction that maintains the integrity of native complexes while effectively solubilizing membrane domains. The recommended protocol utilizes mild, nonionic detergents to achieve this balance [7]:
Cell Lysis and Mitochondrial Isolation: Suspend cell pellets or tissue samples in ice-cold mitochondrial isolation buffer (e.g., 250 mM sucrose, 10 mM Tris-HCl, pH 7.4) with protease inhibitors. For cultured cells, dislodge by trypsinization, wash with culture medium and phosphate-buffered saline, and pellet by centrifugation [7].
Detergent Solubilization: Solubilize membrane proteins using n-dodecyl-β-d-maltoside (DDM) at optimized concentrations (typically 1-2 g/g protein) in extraction buffer containing 50 mM NaCl, 50 mM imidazole/HCl, 2 mM 6-aminohexanoic acid, 1 mM EDTA, pH 7.0 [7]. For studying supercomplexes, digitonin (4-8 g/g protein) may be substituted to preserve higher-order assemblies.
Clarification: Remove insoluble material by centrifugation at 100,000 × g for 15 minutes at 4°C. Retain the supernatant containing solubilized protein complexes.
Protein Quantification: Determine protein concentration using compatible methods (e.g., BCA assay). Note that bis-tris-based buffers interfere with some protein assays; imidazole-based alternatives are recommended when quantification is problematic [7].
CN-PAGE Electrophoresis Procedure
The electrophoresis phase requires specific modifications to standard native PAGE protocols to maintain the CN-PAGE advantage:
Gel Preparation: Prepare linear gradient polyacrylamide gels (typically 4-16% or 3-12%) using a gradient maker. The manual casting procedure for native mini-gels uses the Mini-Protean Tetra Vertical Electrophoresis Cell system connected to a four-way peristaltic pump [7]. Commercial precast native gradient gels (e.g., Thermo Fisher Scientific NativePAGE Bis-Tris system) can be adapted for CN-PAGE with appropriate buffers.
Sample Loading: Mix solubilized protein samples (50-100 μg) with CN-PAGE sample buffer (50 mM NaCl, 10% glycerol, 0.001% Ponceau S). Unlike BN-PAGE, no Coomassie dye is added to the samples.
Electrophoresis Conditions:
- Anode Buffer: 50 mM bis-tris, pH 7.0
- Cathode Buffer: 50 mM tricine, 15 mM bis-tris, 0.05% sodium deoxycholate, 0.01% DDM, pH 7.0 [7]
- Run at 100 V constant voltage for approximately 2 hours at 4°C until the dye front reaches the bottom
Post-Electrophoresis Processing: Following separation, complexes can be subjected to various downstream applications including western blot analysis, in-gel activity staining, or second-dimension denaturing electrophoresis.
Table 2: Troubleshooting Guide for CN-PAGE Analysis
| Problem | Potential Cause | Solution |
|---|---|---|
| Poor resolution | Inadequate detergent optimization | Titrate DDM:protein ratio (0.5-4 g/g) |
| Smearing | Protein aggregation | Increase detergent concentration; include 6-aminocaproic acid |
| Incomplete migration | Insitive charge shift | Optimize anionic detergent mix in cathode buffer |
| Loss of activity | Complex dissociation | Use gentler detergents (digitonin); reduce electrophoresis time |
Downstream Applications and Validation Methods
The true value of CN-PAGE emerges in its compatibility with sensitive downstream applications that would be compromised by Coomassie dye interference:
In-Gel Enzyme Activity Staining:
- Complex I (NADH dehydrogenase): Incubate gels in 2 mM Tris-HCl, pH 7.4, containing 0.1 mg/ml NADH and 2.5 mg/ml nitrotetrazolium blue
- Complex IV (Cytochrome c oxidase): Stain with 0.1% 3,3'-diaminobenzidine, 0.1% cytochrome c, and 0.02% catalase in 50 mM phosphate buffer, pH 7.4
- Complex V enhancement: Implement the simple enhancement step described in the protocol to markedly improve sensitivity [7]
Two-Dimensional Electrophoresis: For comprehensive analysis, excise lanes from CN-PAGE gels and incubate in SDS sample buffer before separation in the second dimension by denaturing SDS-PAGE. This approach maps constituent subunits of native complexes [7].
Western Blot Analysis: Transfer proteins from CN-PAGE gels to PVDF membranes using semi-dry or wet transfer systems. The absence of Coomassie dye improves transfer efficiency and antigen recognition.
Validation with Complementary Techniques: Confirm CN-PAGE findings using orthogonal methods such as limited proteolysis-coupled mass spectrometry (LiP-MS), which can probe protease susceptibility changes between complex-bound and monomeric forms of proteins [25]. The recent FLiP-MS workflow combines serial ultrafiltration with LiP-MS to identify peptide markers reporting on PPI alterations, providing validation at the structural level [25].
Table 3: Essential Research Reagents for CN-PAGE Applications
| Reagent/Category | Specific Examples | Function and Application Notes |
|---|---|---|
| Mild Detergents | n-dodecyl-β-d-maltoside (DDM), digitonin | Membrane protein solubilization while preserving native complexes |
| Charge-shift Agents | Sodium deoxycholate, DDM mixtures | Replace Coomassie dye in cathode buffer to drive electrophoretic migration |
| Protease Inhibitors | PMSF, complete protease inhibitor cocktails | Prevent protein degradation during extraction |
| Stabilizing Compounds | 6-aminocaproic acid, glycerol | Enhance complex stability and improve resolution |
| Electrophoresis Buffers | Bis-tris, imidazole-based systems | Maintain optimal pH without interference |
| Activity Stain Components | NADH, nitrotetrazolium blue, cytochrome c | Enable in-gel visualization of enzyme function |
Concluding Perspectives
CN-PAGE represents a specialized but invaluable tool in the structural biologist's arsenal, particularly when investigating delicate protein interaction networks that might be disrupted by the standard BN-PAGE methodology. The elimination of Coomassie dye binding through its replacement with mixed detergent micelles makes CN-PAGE uniquely suited for studies of weak, transient protein-protein interactions and for applications requiring subsequent enzyme activity assays [7].
As protein interaction research evolves toward increasingly dynamic systems, including biomolecular condensates and transient signaling complexes, the gentle separation principles of CN-PAGE will likely find expanded applications. When integrated with cutting-edge structural proteomics approaches like FLiP-MS [25] and computational prediction tools, CN-PAGE provides an experimental bridge between traditional electrophoresis and modern interactome mapping, offering both global and molecular views of protein complex dynamics in response to cellular perturbations.
Beyond Native PAGE: Validation Strategies and Integration with Complementary Technologies
Within the framework of protein interaction studies, native polyacrylamide gel electrophoresis (Native-PAGE) serves as a critical foundational technique for the separation and initial analysis of protein complexes under non-denaturing conditions [12] [18] [78]. Unlike denaturing methods, Native-PAGE preserves protein-protein interactions, allowing for the examination of intact complexes, their native molecular weights, and oligomeric states [78]. This capability makes it an indispensable first step in the analytical pipeline for studying protein interactomes.
However, a comprehensive understanding of protein networking requires more than the separation of complexes; it demands the precise identification of interacting partners and the mapping of interaction sites. This is where orthogonal methods such as cross-linking mass spectrometry (XL-MS), affinity purification mass spectrometry (AP-MS), and the Yeast Two-Hybrid (Y2H) system prove invaluable. When used in conjunction with Native-PAGE, these techniques enable a multi-faceted validation strategy. Native-PAGE can provide the initial separation of complexes, which can then be characterized in detail using XL-MS for proximal residue mapping, AP-MS for definitive partner identification, and Y2H for binary interaction confirmation [12] [79] [80]. This integrated approach leverages the unique strengths of each method to build a robust and validated protein-protein interaction (PPI) network, which is crucial for advancing our understanding of cellular functions and for informing drug discovery efforts, particularly in the challenging field of targeting PPIs with small molecules [81].
Orthogonal Methods for PPI Cross-Validation
Cross-Linking Mass Spectrometry (XL-MS)
Principle and Workflow
Cross-linking mass spectrometry (XL-MS) is a powerful technique for capturing and identifying transient or stable protein-protein interactions and for determining the spatial organization of protein complexes. The method involves treating a protein sample with chemical cross-linkers that covalently link amino acid residues in close spatial proximity [82]. The cross-linked complex is then digested with a protease (e.g., trypsin), and the resulting peptide mixture is analyzed by liquid chromatography-tandem mass spectrometry (LC-MS/MS). The identification of cross-linked peptides provides information on residue pairs that are physically close, offering constraints for modeling the three-dimensional structure of the complex [83] [82].
A key challenge in proteome-wide XL-MS studies is the thorough validation of novel interactions, as conventional false discovery rate (FDR) calculations can be susceptible to error propagation. It has been demonstrated that validating cross-links against known 3D structures of abundant complexes, like the ribosome or proteasome, can drastically underestimate the true error rate in large-scale datasets. This is because false positive cross-links are much less likely to map correctly to a reference structure by random chance compared to true positives [83].
To address this, a comprehensive set of four data-quality metrics is recommended for a more accurate assessment:
- Fraction of structure-corroborating identifications (FSI): An improved structure-based metric that uses all interprotein cross-links with at least one peptide mapped to a reference structure as the denominator [83].
- Fraction of mis-identifications (FMI): Uses a proteome from an unrelated organism as an internal negative control in the search database to independently assess the underlying error rate [83].
- Fraction of interprotein cross-links from known interactions (FKI): Leverages prior knowledge of experimentally detected protein interactions to provide a comparative quality estimate [83].
- Fraction of validated novel interactions using orthogonal assays: Essential for confirming a representative set of novel interactions using methods like Y2H or protein complementation assays (PCA) to ensure data quality and reproducibility [83].
Protocol: XL-MS for Protein Complex Analysis
Materials:
- Protein sample: Purified protein or complex.
- Cross-linker: e.g., DSSO (cleavable), DSS (non-cleavable). Select based on spacer arm length, solubility, and cleavability [82].
- Quenching reagent: e.g., Ammonium bicarbonate or Tris-HCl buffer.
- Digestion enzyme: Sequencing-grade modified trypsin or chymotrypsin.
- LC-MS/MS system: High-resolution mass spectrometer capable of MS/MS fragmentation.
Procedure:
- Cross-linking: Incubate the protein sample with the cross-linker at an optimal molar ratio and temperature. Reaction conditions (buffer, pH, time) must be optimized for the specific cross-linker and protein system [82].
- Quenching: Terminate the cross-linking reaction by adding a quenching reagent (e.g., Tris-HCl to a final concentration of 20-50 mM) and incubate for a further period.
- Digestion: Denature the cross-linked sample, reduce and alkylate cysteine residues, and digest with trypsin (or another suitable protease) overnight at 37°C [82].
- LC-MS/MS Analysis: Desalt and concentrate the digested peptides. Separate the peptides using reverse-phase liquid chromatography and analyze them with a high-resolution tandem mass spectrometer.
- Data Analysis: Search the acquired MS/MS spectra against a protein sequence database using specialized XL-MS software (e.g., XlinkX, MaXLinker, PPIAT) to identify cross-linked peptides [83] [82]. Apply the four quality metrics (FSI, FMI, FKI, orthogonal validation) for rigorous error assessment [83].
Affinity Purification Mass Spectrometry (AP-MS)
Principle and Workflow
Affinity purification mass spectrometry (AP-MS) is designed to identify direct and indirect protein interaction partners of a target protein (the "bait") from a complex biological mixture. The bait protein is typically fused to an epitope tag (e.g., FLAG, Strep, GFP) and expressed in a relevant cell line. The bait and its associated proteins ("prey") are then purified under native conditions using an affinity resin specific to the tag. The co-purified proteins are subsequently identified by MS, revealing the composition of the protein complex [79].
Critical considerations for a successful AP-MS experiment include:
- Bait Selection and Controls: Include a positive control bait with known interactors and a negative control (e.g., GFP) to identify non-specific binders. The set of baits should be selected to maximize the likelihood of identifying unique interactions [79].
- Cell Lines and Expression: The choice of cell line should balance optimal bait expression with biological relevance. Stable cell lines with inducible expression are preferred over transient transfection to approximate endogenous expression levels and reduce artifacts [79].
- Affinity Tags: Common tags include FLAG, Strep, and tandem tags like 2×Strep-3×FLAG. The choice of tag influences the background protein profile and the conditions required for binding and elution [79].
After MS data collection, the raw data must be processed to distinguish specific interactors from non-specific background. This involves pre-processing (filtering against contaminant lists like the CRAPome and normalization) and scoring using methods such as the MiST (Mass spectrometry interaction statistics) algorithm, which integrates metrics like spectral abundance, peptide count, and reproducibility to assign a confidence score to each potential interaction [79].
Protocol: AP-MS for Interactome Mapping
Materials:
- Cell line: Suitable for the bait protein and biological question.
- Expression vector: For expressing the epitope-tagged bait protein.
- Lysis buffer: Mild, non-denaturing buffer (e.g., with NP-40 or Triton X-100) supplemented with protease and phosphatase inhibitors.
- Affinity resin: Anti-FLAG M2 agarose, Strep-Tactin resin, etc.
- Elution buffer: Specific to the tag (e.g., 3×FLAG peptide for FLAG-tag, desthiobiotin for Strep-tag).
- LC-MS/MS system.
Procedure:
- Cell Lysis and Preparation: Express the tagged bait protein in the chosen cell line. Harvest cells and lyse them in a mild, non-denaturing lysis buffer to preserve protein interactions. Clarify the lysate by centrifugation [79].
- Affinity Purification: Incubate the clarified lysate with the appropriate affinity resin. Wash the resin extensively with lysis buffer to remove non-specifically bound proteins.
- Elution: Elute the bait-prey complex using a competitive agent specific to the tag (e.g., peptide, desthiobiotin) or under mild denaturing conditions.
- Digestion and LC-MS/MS: Denature and digest the eluted proteins with trypsin. Analyze the resulting peptides by LC-MS/MS.
- Data Analysis: Identify proteins from MS/MS data. Pre-process the data by filtering against a contaminant repository (e.g., CRAPome) and normalize using spectral counts (e.g., normalized spectral abundance factor, NSAF). Score interactions using a method like MiST to generate high-confidence interaction networks [79].
Yeast Two-Hybrid (Y2H)
Principle and Workflow
The Yeast Two-Hybrid (Y2H) system is a genetic method for detecting binary protein-protein interactions in vivo. It is based on the modular nature of eukaryotic transcription factors, such as Gal4, which consist of a DNA-binding domain (BD) and a transcription activation domain (AD). A "bait" protein is fused to the BD, and a "prey" protein (or a library of preys) is fused to the AD. If the bait and prey interact, the BD and AD are brought into proximity, reconstituting a functional transcription factor that drives the expression of reporter genes (e.g., HIS3, ADE2, LacZ). The growth of yeast on selective media or a colorimetric assay indicates a positive interaction [84] [80].
Y2H is particularly powerful for high-throughput screening to map large interactomes. A high-throughput mating protocol allows for the systematic cross-testing of many bait and prey combinations in an arrayed format. This method is efficient and can be automated, enabling extensive and multiple rounds of screening to achieve high coverage of potential PPIs [80].
Post-screening analysis is crucial. Interactions identified repeatedly in multiple screens are considered high-confidence, while preys that interact with many unrelated baits ("sticky" preys) are likely false positives and should be excluded [80].
Protocol: High-Throughput Yeast Two-Hybrid
Materials:
- Yeast strains: e.g., AH109 (MATa) and Y187 (MATα), which are auxotrophic for different amino acids and contain reporter genes.
- Vectors: Gal4 BD vector (e.g., pGBKT7) and AD vector (e.g., pGADT7).
- Media: YPDA, synthetic dropout (SD) media lacking specific amino acids (e.g., -Leu, -Trp, -Leu/-Trp/-His/-Ade).
- X-β-Gal: For β-galactosidase filter assay.
Procedure:
- Clone Bait and Prey: Clone the gene of interest into the BD vector (bait) and the potential interacting partner(s) or a cDNA library into the AD vector (prey) [84].
- Yeast Transformation: Co-transform the bait and prey plasmids into the respective yeast mating strains (e.g., bait in MATα, prey in MATa) or transform individually and mate the strains [84] [80]. For high-throughput screening, a mating protocol is preferred. Mix MATa and MATα strains on rich medium (YPDA) to allow mating and formation of diploid yeast cells [80].
- Selection: Plate the diploid yeast cells on selective media that lacks leucine and tryptophan (SD -Leu/-Trp) to select for yeast containing both bait and prey plasmids.
- Interaction Screening: Transfer the grown colonies to higher stringency selective media (e.g., SD -Leu/-Trp/-His/-Ade) to test for the expression of reporter genes. Perform a β-galactosidase assay using X-β-Gal to confirm interactions via a colorimetric readout (blue colonies) [84].
- Data Analysis: Count bait and prey frequencies to identify specific versus "sticky" interactors. Interactions confirmed by multiple reporter genes and in replicate screens are considered high-confidence [80].
Integrated Cross-Validation Strategy
The true power of these orthogonal methods is realized when they are integrated into a cross-validation strategy. The workflow often begins with a Native-PAGE separation to confirm the presence and integrity of native complexes [12] [18]. Following this, AP-MS can be employed to identify all components of the complex. To distinguish direct from indirect interactors, Y2H can test for binary interactions between the bait and individual prey proteins identified by AP-MS. Finally, XL-MS can be applied to the purified complex to map the specific residues involved in the interactions, providing spatial constraints. This multi-layered approach, framed by the initial Native-PAGE analysis, significantly enhances the reliability of the resulting interactome data.
Table 1: Summary of Orthogonal PPI Method Characteristics
| Method | Principle | Key Strength | Key Limitation | Primary Readout |
|---|---|---|---|---|
| XL-MS | Chemical cross-linking of proximal residues followed by MS identification. | Provides spatial proximity and distance constraints; can capture transient interactions. | Complexity in data analysis; may miss interactions in flexible regions. | Identifies cross-linked residue pairs. |
| AP-MS | Affinity purification of a bait protein with its interactors, followed by MS identification. | Identifies co-complex associations under near-physiological conditions. | Cannot distinguish direct from indirect interactions; potential for false positives from contaminants. | List of co-purifying "prey" proteins. |
| Yeast Two-Hybrid | Reconstitution of a transcription factor via bait-prey interaction in yeast nuclei. | High-throughput screening for direct, binary interactions. | False positives from auto-activating baits; interactions occur in non-native environment. | Activation of reporter genes (growth/color). |
Table 2: Quality Control Metrics for XL-MS Data Validation [83]
| Metric | Description | Purpose |
|---|---|---|
| FSI (Fraction of Structure-corroborating Identifications) | Percentage of cross-links where at least one peptide maps to a reference structure and satisfies distance constraint. | Improved structure-based validation that better captures dataset quality. |
| FMI (Fraction of Mis-identifications) | Error rate estimated by including a proteome from an unrelated organism as a decoy in the search. | Provides an orthogonal, absolute estimate of the false discovery rate. |
| FKI (Fraction from Known Interactions) | Percentage of interprotein cross-links supported by prior interaction data. | Uses existing biological knowledge to comparatively assess data quality. |
| Orthogonal Validation | Experimental confirmation of a subset of novel interactions using a non-MS method (e.g., PCA, Y2H). | Essential for confirming the biological reproducibility of novel findings. |
The Scientist's Toolkit: Research Reagent Solutions
Table 3: Essential Reagents for Protein-Protein Interaction Studies
| Reagent / Tool | Function in PPI Analysis | Examples / Notes |
|---|---|---|
| Cross-linkers | Covalently link spatially close amino acid residues to "freeze" interactions. | DSSO (cleavable), DSS (non-cleavable). Selection depends on spacer arm length and reactivity [83] [82]. |
| Affinity Tags | Enable specific purification of the bait protein and its associated complexes. | FLAG, Strep, GFP, TAP-tags. Choice affects background and elution conditions [79]. |
| Yeast Two-Hybrid System | Genetically test for direct binary interactions in a cellular context. | GAL4-BD and AD vectors, AH109/Y187 yeast strains. Requires cloning into specialized vectors [84] [80]. |
| Databases & Software | Predict interactions, analyze MS data, and calculate theoretical masses for targeted MS. | STRING (interaction prediction), XlinkX/MaXLinker (XL-MS analysis), PPIAT (theoretical mass calculation) [83] [82]. |
| Native Lysis Buffer | Extract proteins from cells while preserving non-covalent protein complexes. | Typically contains mild non-ionic detergents (e.g., NP-40), salts, and protease inhibitors [78]. |
Workflow and Data Integration Diagrams
Integrated PPI Validation Workflow
Integrated PPI Validation Workflow
XL-MS Quality Assessment Metrics
XL-MS Quality Assessment Process
The study of protein-protein interactions (PPIs) is fundamental to understanding cellular function, with protein complexes existing as dynamic populations of stable and transient assemblies [85]. Within this field, Blue Native Polyacrylamide Gel Electrophoresis (BN-PAGE) has emerged as a critical tool for separating intact protein complexes under native conditions, preserving their non-covalent interactions and providing information on stoichiometry, molecular weight, and relative abundance [85]. However, BN-PAGE alone provides limited structural detail. This application note details integrated methodologies for correlating BN-PAGE data with high-resolution structural techniques—crystallography and cryo-electron microscopy (cryo-EM)—to achieve comprehensive structural validation of protein assemblies. This correlation is particularly valuable for assessing complex heterogeneity, validating transient interactions identified by methods like affinity purification mass spectrometry (AP-MS) [85], and providing structural context for proteins characterized by native top-down mass spectrometry (nTDMS) [86].
Comparative Analysis of Structural Techniques
The integration of BN-PAGE, crystallography, and cryo-EM creates a powerful synergistic workflow. BN-PAGE rapidly profiles complex integrity and homogeneity, cryo-EM visualizes architecture and heterogeneity, and crystallography provides atomic-resolution detail. The table below summarizes their key characteristics for correlation workflows.
Table 1: Key Techniques for Structural Validation of Protein Complexes
| Technique | Key Principle | Typical Resolution | Sample Throughput | Key Correlation Parameter |
|---|---|---|---|---|
| BN-PAGE | Separation by charge and size under native conditions | Molecular weight estimate (kDa) | High | Apparent molecular weight; complex integrity |
| X-ray Crystallography | X-ray diffraction from protein crystals | Atomic (1–3 Å) | Low | Unit cell dimensions; crystal packing contacts |
| Cryo-EM (SPA) | Single-particle analysis from vitrified samples [87] | Near-atomic to atomic (1.5–4 Å) [87] | Medium | 2D class averages and 3D reconstruction map features |
| Cryo-EM (Helical Recon.) | Helical reconstruction for filamentous structures [87] | Near-atomic to atomic (2–4 Å) [87] | Medium | Helical symmetry parameters; fibril polymorphism [87] |
Integrated Experimental Protocol
This protocol outlines the steps from initial sample preparation to final data correlation for validating the structure of a hypothetical heteromeric protein complex.
Stage 1: BN-PAGE Analysis and Complex Characterization
Objective: To isolate the native complex and determine its apparent molecular weight and purity.
Procedure:
- Sample Preparation: Prepare protein complex via recombinant expression or native isolation. For affinity-based purification, Tandem Affinity Purification (TAP)-tag systems can be employed to minimize contaminants [85]. Keep all buffers free of denaturants and detergents that disrupt native interactions.
- BN-PAGE Electrophoresis:
- Prepare a 4–16% gradient polyacrylamide gel.
- Mix 10–20 µg of protein sample with native sample buffer containing Coomassie G-250.
- Run electrophoresis at 4°C with cathode buffer (blue) and anode buffer (clear). Start at 100 V for 30 minutes, then continue at 250 V until the dye front reaches the bottom.
- Post-Electrophoresis Analysis:
- In-Gel Visualization: Destain the gel to visualize protein complexes as blue bands.
- Molecular Weight Estimation: Compare migration distance with native protein standards.
- Band Excision: Excise the band of interest gently for downstream processing.
Critical Considerations:
- Include controls (e.g., bait protein expressed alone) to distinguish specific interactors from non-specific contaminants, a common challenge in AP-MS [85].
- For subsequent mass spectrometry analysis, the excised band can be subjected to in-gel digestion and LC-MS/MS to identify complex components [85].
Stage 2: Sample Preparation for High-Resolution Structural Analysis
Objective: To generate high-quality samples from BN-PAGE for crystallography or cryo-EM.
Procedure: A. For Crystallography:
- Complex Elution: Electro-elute the excised BN-PAGE band into a low-salt buffer.
- Concentration and Purity Assessment: Concentrate the eluted complex to 5–15 mg/mL. Analyze purity and monodispersity via analytical size-exclusion chromatography (SEC) and dynamic light scattering (DLS).
- Crystallization Screening: Use robotic screening to set up sparse matrix crystallization trials. Optimize hits using microseeding from BN-PAGE purified material.
B. For Cryo-EM:
- Buffer Exchange: Use centrifugal filters to exchange the eluted complex into a cryo-EM-friendly buffer (e.g., ammonium acetate) [86].
- Grid Preparation: Apply 3–4 µL of sample at ~0.5–2 mg/mL to a freshly plasma-cleaned cryo-EM grid. Blot and plunge-freeze in liquid ethane [87].
- Screening: Assess grid quality for ice thickness, particle distribution, and concentration.
Stage 3: Data Collection, Processing, and Correlation
Objective: To solve the structure and directly correlate features with BN-PAGE data.
Procedure: A. Crystallography:
- Collect a complete X-ray diffraction dataset at a synchrotron beamline.
- Solve the structure by molecular replacement or experimental phasing.
- Correlation Analysis:
- Compare the oligomeric state in the crystal asymmetric unit with the BN-PAGE molecular weight estimate.
- Analyze crystal packing interfaces to assess if they represent biologically relevant PPIs or crystallization artifacts.
B. Cryo-EM Single-Particle Analysis:
- Collect a dataset of thousands of micrographs using a cryo-electron microscope equipped with a direct electron detector [87].
- Process data through standard SPA workflow: particle picking, 2D classification, ab initio reconstruction, and high-resolution refinement [87].
- Correlation Analysis:
- Measure the dimensions of the 3D reconstruction and compare with the BN-PAGE molecular weight.
- Correlate the presence of distinct conformational states from 3D variability analysis with banding patterns or smearing on the BN-PAGE gel.
This workflow integrates data from BN-PAGE, Cryo-EM, and Crystallography to validate protein complex structures.
The Scientist's Toolkit: Essential Research Reagents and Materials
Successful correlation experiments depend on high-quality reagents and materials. The following table details key solutions used in the featured workflows.
Table 2: Essential Research Reagent Solutions for Structural Correlation Studies
| Reagent/Material | Function/Application | Example Specifications |
|---|---|---|
| Tandem Affinity Purification (TAP) Tag | Two-step purification under native conditions for isolating protein complexes with high specificity prior to BN-PAGE [85]. | Typically comprises Protein A and Calmodulin-Binding Peptide (CBP); elution via TEV protease cleavage and EGTA [85]. |
| Cross-linking Reagents | Stabilize transient or weak protein-protein interactions (PPIs) prior to or after BN-PAGE, capturing dynamic complex assemblies [85]. | Membrane-permeable, amine-reactive cross-linkers (e.g., DSS, BS3); concentration and time must be optimized to minimize non-specific cross-linking. |
| Native Sample Buffer & Coomassie Dye | Provides negative charge for electrophoretic mobility while preserving native protein structure and activity during BN-PAGE. | Contains 50 mM NaCl, 10% Glycerol, and 0.001% Coomassie G-250; critical for complex stability and separation resolution. |
| Native Markers | Enable estimation of apparent molecular weight of protein complexes separated by BN-PAGE. | Commercially available kits covering a range of 20 kDa to 1,200 kDa; essential for initial complex characterization. |
| Ammonium Acetate Solution | A volatile salt buffer used for final buffer exchange in native MS and cryo-EM sample preparation, preserving non-covalent interactions [86]. | High-purity, MS-grade; typically used at concentrations between 50-500 mM for electrospray compatibility and forming thin ice in cryo-EM [86]. |
| Cryo-EM Grids | Support the vitrified sample layer for imaging in the cryo-electron microscope. | UltrAuFoil or Quantifoil grids with 1.2/1.3 or 2.0 µm holes; require plasma cleaning for optimal hydrophilicity and particle distribution [87]. |
The logic of data correlation between low and high-resolution techniques.
Application in Neuropathological Amyloid Studies
The correlation of BN-PAGE with cryo-EM is exceptionally powerful for studying polymorphic amyloid fibrils implicated in neurodegenerative diseases like Alzheimer's and Parkinson's [87]. BN-PAGE can separate different fibril polymorphs based on their molecular weight and architecture. Subsequent cryo-EM helical reconstruction of the excised bands allows for the determination of atomic-level structures, directly linking a specific band pattern to a distinct fibril fold [87]. This workflow helps address critical questions about whether brain-extracted fibrils are biased towards certain polymorphs and if in vitro amplification methods yield structures identical to native seeds [87]. Furthermore, for complexes like endogenous nucleosomes, which are multiproteoform complexes with diverse post-translational modifications, nTDMS after native separation can correlate modifications with specific complexes, a level of detail lost in denatured workflows [86].
Within the broader context of protein interaction studies, native polyacrylamide gel electrophoresis (PAGE) presents a unique capability to study functional protein complexes in their biologically active states. Unlike denaturing electrophoresis, which separates protein subunits based on molecular weight, native PAGE maintains protein-protein interactions, oligomeric structures, and crucially, enzymatic activity. This technical note details how coupling native gels with activity staining and enzymatic tests enables researchers to move beyond simple separation to gain direct functional insights into enzyme kinetics, complex formation, and ligand interactions under near-physiological conditions. These approaches are particularly valuable for characterizing therapeutic targets such as mitochondrial oxidative phosphorylation complexes [88] and G protein-coupled receptors (GPCRs) [17], where functional data are essential for drug development.
Core Principles and Methodologies
Fundamental Separation Techniques
Several native electrophoretic techniques form the foundation for functional assays, each with distinct advantages for specific applications:
- Blue Native PAGE (BN-PAGE): Utilizes Coomassie Blue G-250 dye, which binds hydrophobic protein surfaces, conferring negative charge for improved migration while maintaining solubility of membrane proteins. The dye can sometimes interfere with enzymatic activity, requiring optimization [88] [89].
- Clear Native PAGE (CN-PAGE): Substitutes Coomassie Blue with mixtures of anionic and neutral detergents to impose negative charge, resulting in clearer gels that may be more compatible with certain enzymatic assays [88] [89].
- High-Resolution Clear Native Electrophoresis (hrCNE): An advanced CN-PAGE method compatible with fluorescently-labeled proteins, enabling visualization of complexes without interference from dye molecules [17].
Activity Staining Methodologies
Activity staining methodologies enable direct functional assessment within the gel matrix through various detection strategies:
- Precipitate-Based Detection: Relies on enzymatic conversion of substrates into insoluble, colored precipitates that deposit at the site of activity. For example, Complex IV (cytochrome c oxidase) activity can be visualized through diaminobenzidine polymerization, while Complex V (ATP synthase) activity can be detected via lead or calcium phosphate formation from released phosphate [88].
- Fluorogenic Substrate Detection: Employs non-fluorescent substrates that yield fluorescent products upon enzymatic cleavage. 4-Methylumbelliferyl-β-D-glucuronic acid (MUG) produces blue fluorescence upon cleavage by β-glucuronidase, while Resorufin-β-D-glucuronic acid (RUG) yields bright pink fluorescence [90].
- Chromogenic Substrate Detection: Uses colorless substrates that generate colored products. X-Gal (5-Bromo-4-chloro-3-indoxyl-β-D-galactopyranoside) produces a blue-green color when cleaved by β-galactosidase, with various alternatives producing distinct colors including magenta, salmon, and crimson [90].
- Direct Fluorescence Detection: Leverages intrinsic fluorescent protein tags or specialized labeling systems such as His-tag detection with multivalent NTA probes (HisQuick-PAGE), enabling visualization without substrate conversion [91] [92].
Table 1: Comparison of Major Native Electrophoresis Techniques for Functional Assays
| Technique | Charge Provider | Key Advantages | Limitations | Compatible Detection Methods |
|---|---|---|---|---|
| BN-PAGE | Coomassie Blue G-250 | Excellent resolution of membrane protein complexes; reduces aggregation | Dye may interfere with some enzymatic activities | Precipitate-based, chromogenic, fluorescent substrates |
| CN-PAGE | Anionic/neutral detergents | No dye interference; compatible with more enzymatic assays | Potentially lower resolution for some complexes | Fluorescent substrates, direct fluorescence, some chromogenic |
| hrCNE | Detergent mixtures | High resolution; compatible with fluorescent proteins | Requires optimization for different complexes | Direct fluorescence, in-gel fluorescence imaging |
Experimental Applications and Protocols
Continuous Kinetic Monitoring of Mitochondrial Complexes
The ability to monitor enzymatic activity continuously within native gels provides significant advantages over traditional endpoint measurements, particularly for characterizing complex kinetic behaviors [88].
Protocol: Continuous In-Gel Activity Monitoring
Materials and Reagents:
- Custom reaction chamber with media recirculation and filtering system
- Time-lapse high-resolution digital imaging system
- NativePAGE Novex 4-16% Bis-Tris Gels or equivalent
- Complex IV assay reagents: cytochrome c, 3,3'-diaminobenzidine
- Complex V assay reagents: ATP disodium salt, Pb(NO₃)₂, MgSO₄
Procedure:
- Sample Preparation: Prepare heart tissue homogenates or mitochondrial suspensions in sucrose-based buffer (0.28M sucrose, 10mM HEPES, 1mM EDTA, 1mM EGTA, pH 7.1) with protease inhibitors.
- Native Electrophoresis: Separate 5-20 μg of protein using BN-PAGE or CN-PAGE according to established protocols [88].
- Assay Setup: Secure the gel in the custom reaction chamber with continuous media recirculation and filtering to remove turbidity.
- Enzymatic Reaction:
- For Complex IV: Incubate with 1 mM diaminobenzidine and 0.1 mM cytochrome c in appropriate buffer.
- For Complex V: Incubate with 5 mM ATP and 2 mM Pb(NO₃)₂ in reaction buffer.
- Image Acquisition: Continuously collect high-resolution images (every 1-5 minutes) using time-lapse photography throughout the reaction period (typically 1-3 hours).
- Data Analysis: Process images using background correction routines to generate kinetic traces of in-gel activities. Analyze linear and lag phases for kinetic parameter calculation.
Applications: This system has revealed complex kinetic behaviors, including a short initial linear phase for Complex IV where catalytic rates can be calculated, and a significant lag phase followed by two linear phases for Complex V activity [88].
Figure 1: Workflow for continuous kinetic monitoring of enzymatic activity in native gels
HisQuick-PAGE for Rapid Fluorescent Detection
The HisQuick-PAGE method provides a rapid, sensitive alternative to immunoblotting for detection of His-tagged proteins in both SDS-PAGE and native PAGE formats [92].
Protocol: HisQuick-PAGE for Native Protein Complexes
Materials and Reagents:
- trisNTA-Alexa647 or hexaNTA-Alexa647 probes
- Appropriate expression system for His-tagged proteins (E. coli, yeast, insect, or human cells)
- Native PAGE components: acrylamide/bis-acrylamide, appropriate detergents (e.g., DDM, LMNG)
- Fluorescence imaging system compatible with Alexa647
Procedure:
- Protein Preparation: Express His₆-, His₁₀-, or His₁₂-tagged proteins in chosen expression system. For membrane proteins, solubilize with appropriate detergents (e.g., DDM).
- Labeling: Incubate protein samples with 450 nM hexaNTA-Alexa647 or trisNTA-Alexa647 for 15-30 minutes at room temperature.
- Native Electrophoresis: Perform CN-PAGE or BN-PAGE under non-reducing conditions without boiling samples.
- Direct Visualization: Immediately image gels using fluorescence detection without additional washing or staining steps.
- Detection Optimization:
- For SDS-PAGE: Use hexaNTA probes for His₁₀/His₁₂-tags (detection limit: ~10 ng or 230 fmol).
- For Native PAGE: Use trisNTA or hexaNTA probes for His₆-His₁₂-tags with broader detection range.
Applications: This method enables background-free detection of diverse targets including soluble proteins, membrane protein complexes (e.g., ABC transporters), and macromolecular assemblies (e.g., ribonucleoprotein particles) with sensitivity surpassing conventional immunoblotting in some applications [92].
Table 2: Detection Limits and Applications of HisQuick-PAGE
| Application Context | Recommended Probe | Detection Limit | Key Advantages | Compatible Tags |
|---|---|---|---|---|
| SDS-PAGE | hexaNTA-Alexa647 | 10 ng (230 fmol) | Works under reducing conditions; high specificity | His₁₀, His₁₂ |
| Native PAGE (soluble proteins) | trisNTA-Alexa647 or hexaNTA-Alexa647 | ~10-50 ng | Broader tag compatibility; minimal complex disruption | His₆-His₁₂ |
| Membrane protein complexes | hexaNTA-Alexa647 | ~10-100 ng | Compatible with detergents; works in lipid nanodiscs | His₆-His₁₂ |
| Macromolecular assemblies | hexaNTA-Alexa647 | Varies by complex size | Minimal background in high MW range | His₆-His₁₂ |
GPCR-G Protein Coupling Assays
Native PAGE provides a valuable method for studying agonist-dependent coupling of GPCRs to G proteins, a critical interaction for drug development targeting this major receptor family [17].
Protocol: GPCR-mini-G Protein Coupling Assay
Materials and Reagents:
- HEK293S GnT1⁻ cell line for receptor expression
- EGFP-tagged GPCR construct
- Purified mini-G proteins (specific to Gα family)
- Detergents: Lauryl Maltose Neopentyl Glycol (LMNG) with Cholesteryl Hemisuccinate (CHS)
- hrCNE electrophoresis system
- Agonist peptides of interest
Procedure:
- Receptor Preparation: Express EGFP-tagged GPCR in HEK293S GnT1⁻ cells. Prepare either crude membrane fractions or solubilize adherent cells directly with LMNG/CHS detergent mix.
- Complex Formation: Incubate solubilized receptor with purified mini-G protein and appropriate agonist concentrations (typically 0.1 nM - 10 μM) for 30-60 minutes on ice.
- hrCNE Electrophoresis: Perform high-resolution clear native electrophoresis using pre-cast or hand-cast gradient gels.
- In-Gel Fluorescence Imaging: Visualize receptor-mini-G complexes directly using EGFP fluorescence.
- Quantitative Analysis:
- Format A: Vary agonist concentration with constant mini-G to determine apparent agonist affinity.
- Format B: Vary mini-G concentration with saturating agonist to determine apparent mini-G affinity and measure partial agonist efficacy.
Applications: This method enables characterization of agonist-dependent GPCR-G protein interactions without receptor purification, providing quantitative binding parameters for drug screening and mechanistic studies [17].
Figure 2: Workflow for analyzing GPCR-mini-G protein coupling using native PAGE
The Scientist's Toolkit: Essential Research Reagents
Table 3: Key Research Reagent Solutions for Functional Native PAGE Assays
| Reagent Category | Specific Examples | Function and Application | Technical Notes |
|---|---|---|---|
| Native Gel Systems | NativePAGE Novex Bis-Tris Gels; hrCNE systems | Provide optimal separation conditions for protein complexes under native conditions | Gradient gels (4-16%) often improve resolution of complex mixtures |
| Charge Providers | Coomassie Blue G-250; Anionic detergents | Confer negative charge for electrophoretic separation | Choice affects compatibility with downstream activity assays |
| Detection Probes | hexaNTA-/trisNTA-Alexa647; Fluorescent substrates (MUG, RUG) | Enable specific, sensitive detection of tagged proteins or enzymatic activities | hexaNTA offers superior kinetics (koff ≈ 10⁻⁶ s⁻¹) vs. monoNTA (koff ≈ 1 s⁻¹) |
| Enzyme Substrates | Diaminobenzidine (Complex IV); ATP + Pb(NO₃)₂ (Complex V); X-Gal, ONPG (β-galactosidase) | Convert enzymatic activity into detectable signals (precipitates, color, fluorescence) | Substrate choice depends on detection method and enzyme specificity |
| Membrane Protein Stabilizers | LMNG/CHS; DDM; Lipid nanodiscs | Maintain native conformation of membrane proteins during separation | Critical for studying membrane protein complexes like GPCRs and transporters |
| Specialized Equipment | Custom reaction chambers with recirculation; Fluorescence imaging systems | Enable continuous kinetic monitoring and sensitive detection | Filtering systems remove turbidity for continuous imaging |
The integration of native gel electrophoresis with functional activity assays represents a powerful approach for studying protein complexes in biomedical research and drug development. The methodologies detailed herein—from continuous kinetic monitoring of mitochondrial complexes to specialized applications for GPCR signaling and His-tagged protein detection—provide researchers with versatile tools to bridge the gap between protein separation and functional characterization. As fluorescent detection methods continue to advance and specialized reagents become more widely available, these functional native gel approaches will undoubtedly expand their impact in characterizing therapeutic targets and understanding fundamental cellular mechanisms. The techniques outlined offer the unique advantage of providing functional data from microgram amounts of protein while maintaining aspects of native structure and activity that are often lost in traditional denaturing approaches.
Protein-protein interactions (PPIs) are fundamental to virtually all cellular processes, ranging from signal transduction and gene regulation to metabolic control [93]. The study of these interactions provides critical insights into the molecular machinery that governs cellular life. Traditional methods for investigating PPIs, such as yeast two-hybrid (Y2H) and co-immunoprecipitation (Co-IP), have provided valuable data but face limitations in capturing weak, transient, or context-dependent interactions within native cellular environments [93] [94].
Within this landscape, two powerful emerging techniques have revolutionized our capacity to study PPIs under physiological conditions: Tripartite Split-GFP and Proximity Labeling (PL). Tripartite Split-GFP is a sophisticated protein-fragment complementation assay (PCA) that visualizes binary and ternary protein complexes with high spatial resolution directly in living cells [95] [96]. In parallel, Proximity Labeling employs engineered enzymes to covalently tag nearby proteins with biotin, enabling subsequent enrichment and mass spectrometry-based identification of interaction partners within a defined radius [93] [94].
This article provides a comparative analysis of these two techniques, framing them within the context of a broader research thesis focused on the applications of Native Polyacrylamide Gel Electrophoresis (Native PAGE) in protein interaction studies. Native PAGE serves as a complementary and validating tool, offering insights into protein complex stoichiometry, native molecular weight, and assembly states without denaturing conditions.
Technical Principles and Mechanisms
Tripartite Split-GFP
The Tripartite Split-GFP system is an advanced evolution of the bimolecular fluorescence complementation (BiFC) concept. It relies on splitting a fluorescent protein—typically a superfolder GFP (sfGFP) variant or a related fluorogen-activating protein like FAST—into three non-fluorescent fragments [95] [96].
- Fragment Composition: The system comprises the β1-9 barrel (approximately 200 amino acids), the β10 strand (20 amino acids), and the β11 strand (21 amino acids) of an evolved GFP variant [95].
- Mechanism of Action: Fluorescence is restored only when all three fragments are brought into close proximity. This is typically achieved by fusing the small β10 and β11 tags to two potential interacting proteins, while the larger β1-9 barrel is expressed separately in the cytosol. The physical interaction between the two tagged proteins facilitates the capture and reconstitution of the GFP β-barrel, leading to fluorophore maturation and a fluorescent signal [95]. This system has been shown to function as a "molecular ruler," with signal strength reflecting the distance between subunits in a protein complex [95].
The following diagram illustrates the workflow for detecting ternary protein complexes using this system:
Proximity Labeling
Proximity Labeling takes a different, enzyme-based approach to map protein interactions and micro-environments in living cells.
- Core Mechanism: An engineered promiscuous enzyme, fused to a protein of interest (the "bait"), catalyzes the covalent tagging of nearby proteins (the "prey") with a biotin molecule [93] [94].
- Activation and Labeling: Upon addition of a substrate (e.g., biotin for ligase-based systems, or biotin-phenol and H₂O₂ for peroxidase-based systems), the enzyme generates a highly reactive, short-lived intermediate. This intermediate diffuses and covalently attaches to lysine (for biotin ligases) or tyrosine (for peroxidases) residues on proximal proteins [93].
- Identification: The biotinylated proteins are then isolated using streptavidin-coated beads and identified via liquid chromatography tandem mass spectrometry (LC-MS/MS) [93].
The workflow for a typical Proximity Labeling experiment is shown below:
Comparative Analysis of Key Parameters
The following tables summarize the quantitative data and key characteristics of Tripartite Split-GFP and leading Proximity Labeling technologies.
Table 1: Performance and Operational Characteristics
| Parameter | Tripartite Split-GFP | BioID | TurboID | APEX/APEX2 |
|---|---|---|---|---|
| Labeling Radius | Direct contact (<10 nm) [95] | ~10-20 nm [93] | ~10 nm [93] | ~20 nm [93] |
| Temporal Resolution | Minutes to hours (maturation) [97] | ~18-24 hours [93] | ≥10 minutes [93] | ~1 minute [93] |
| Signal/Readout | Fluorescence microscopy | Biotinylation + MS | Biotinylation + MS | Biotinylation + MS |
| Spatial Resolution | High (subcellular) [95] | Medium | Medium | Medium |
| Ability to Capture Transient Interactions | Limited (irreversible) | Good | Excellent [93] | Excellent [93] |
Table 2: Experimental Considerations and Applications
| Aspect | Tripartite Split-GFP | Proximity Labeling (e.g., TurboID) |
|---|---|---|
| Primary Application | Visualizing binary/ternary complexes in live cells [95] [96] | Unbiased mapping of protein micro-environments [93] |
| Throughput | Low to medium (hypothesis-driven) | High (discovery-driven) [25] |
| Key Advantage | Minimal tag size; spatial precision as "molecular ruler" [95] | High temporal resolution; works in diverse organisms [93] |
| Main Limitation | Irreversibility can mask dynamics; false positives from self-assembly | Proximal vs. direct interactions cannot be distinguished [93] |
| Compatibility with Native PAGE | Excellent (fluorescence readout complements complex size analysis) | Good (biotinylation can be validated via Western blot) |
Detailed Experimental Protocols
Protocol for Tripartite Split-GFP Interaction assay
This protocol is adapted from studies investigating septin-septin interactions in yeast and ternary complex formation in mammalian cells [95] [96].
Reagents and Materials:
- Expression vectors for: GFP β1-9 barrel, Protein A-β10 fusion, Protein B-β11 fusion.
- Appropriate cell line (e.g., HEK293T, yeast).
- Transfection reagents.
- Fluorescence microscope or flow cytometer.
- Lysis Buffer: 50 mM Tris-HCl (pH 7.5), 150 mM NaCl, 0.5% NP-40, protease inhibitor cocktail.
- Materials for Native PAGE.
Procedure:
- Construct Generation: Clone the genes of interest (Proteins A and B) into vectors allowing fusion at their C-termini with the 20-amino acid β10 strand and the 21-amino acid β11 strand, respectively. Use flexible linkers (e.g., GGS repeats) between the protein and the tag.
- Cell Transfection/Transformation: Co-transfect the cells with three plasmids:
- Plasmid encoding the Protein A-β10 fusion.
- Plasmid encoding the Protein B-β11 fusion.
- Plasmid encoding the GFP β1-9 barrel.
- Include controls lacking one of the three components.
- Expression and Incubation: Allow protein expression and complex formation for 4-24 hours. The timing depends on the maturation rate of the specific split-GFP variant used.
- Detection and Analysis (≥4 hours post-transfection):
- Live-Cell Imaging: Visualize fluorescence using a standard GFP filter set. The fluorescence signal at the bud neck in yeast demonstrated successful detection of septin interactions [95].
- Flow Cytometry: Quantify the fluorescence intensity of the cell population.
- Validation with Native PAGE: Harvest cells and lyse in a mild, non-denaturing lysis buffer. Resolve the lysate on a Native PAGE gel. The fluorescent complex can be visualized directly by in-gel fluorescence imaging, confirming its native molecular weight and assembly state.
Protocol for Proximity Labeling with TurboID
This protocol is based on the application of TurboID in plant and mammalian systems [93] [94].
Reagents and Materials:
- Expression vector for bait protein fused to TurboID.
- Control: TurboID alone.
- Biotin (prepare a stock solution in DMSO or PBS).
- Quenching Buffer: 1M Tris-HCl (pH 7.5).
- Lysis Buffer: RIPA buffer or similar, supplemented with protease inhibitors.
- Strepavidin-coated magnetic beads.
- Laemmli SDS-sample buffer.
Procedure:
- Construct Generation: Fuse the gene for TurboID to the N- or C-terminus of your bait protein using standard molecular biology techniques.
- Expression: Introduce the construct into your biological system (e.g., stable cell line, transient transfection, model organism).
- Biotin Labeling:
- Add biotin to the culture medium to a final concentration of 50-500 µM.
- Incubate for a defined period (e.g., 10-30 minutes) to allow labeling. Note: The short labeling time of TurboID is crucial for capturing dynamic interactions.
- Aspirate the medium and wash cells quickly with PBS containing biotin to remove excess substrate.
- Quenching and Cell Lysis:
- Lyse cells in RIPA buffer.
- Incubate the lysate at 65°C for 15 minutes to quench the labeling reaction and denature proteins.
- Enrichment and Analysis:
- Clarify the lysate by centrifugation.
- Incubate the supernatant with streptavidin-coated magnetic beads for 1-2 hours at room temperature.
- Wash the beads stringently to remove non-specifically bound proteins.
- Elute bound proteins by boiling in SDS-PAGE sample buffer containing excess biotin or DTT.
- Downstream Analysis:
- Mass Spectrometry: Identify the eluted proteins by LC-MS/MS.
- Western Blotting: Validate specific preys by immunoblotting.
- Compatibility with Native PAGE: To validate the integrity of complexes identified by PL, the bait protein complex can be isolated under native conditions (e.g., using co-IP) and analyzed via Native PAGE, followed by Western blotting for the bait and candidate prey proteins.
The Scientist's Toolkit: Essential Research Reagents
Table 3: Key Reagent Solutions for Tripartite Split-GFP and Proximity Labeling
| Reagent / Solution | Function / Application | Example / Note |
|---|---|---|
| Split-GFP Fragments | Core components for complementation assay. | GFP β1-9, β10 (20 aa), β11 (21 aa) fragments [95]. |
| pFAST System | Chemogenetic alternative for dynamic, reversible ternary complex imaging. | Binds fluorogenic chromophores (e.g., HMBR); allows real-time tracking [96]. |
| TurboID / miniTurboID | Engineered biotin ligases for rapid proximity labeling. | High catalytic efficiency; effective labeling at 25°C, ideal for plant and sensitive systems [93] [94]. |
| APEX2 | Engineered peroxidase for ultra-fast proximity labeling. | ~1 minute labeling time; requires H₂O₂ substrate [93]. |
| Biotin | Essential substrate for biotin ligase-based PL. | Must be used in excess for BioID/TurboID. |
| Biotin-Phenol & H₂O₂ | Essential substrates for peroxidase-based PL (APEX2). | H₂O₂ can cause cellular oxidative stress [93]. |
| Streptavidin Beads | Critical for affinity purification of biotinylated proteins post-PL. | Magnetic beads allow for easy handling and stringent washing. |
| Fluorogens (e.g., HMBR) | Synthetic chromophores for pFAST and split-FAST systems. | Non-fluorescent until bound by the reassembled FAST protein [96]. |
Integration with Native PAGE in Protein Interaction Studies
Native PAGE serves as a powerful orthogonal method to validate and complement findings from both Tripartite Split-GFP and Proximity Labeling.
- Validating Split-GFP Complexes: The fluorescent signal from a Tripartite Split-GFP assay indicates a successful interaction. This can be followed by Native PAGE analysis of the native cell lysate. The in-gel fluorescence confirms the presence of a properly assembled, native complex and provides information about its stoichiometry and size by comparing its migration to native molecular weight standards [95].
- Characterizing Proximity Labeling Hits: While PL identifies candidate interactors, it does not confirm if they form a stable complex. Candidate proteins identified by PL (e.g., via TurboID) can be co-expressed and the complex immunoprecipitated under non-denaturing conditions. Subsequent analysis by Native PAGE and Western blotting (probing for different subunits of the complex) can confirm direct interaction and reveal the complex's assembly state and composition [25].
The synergy between these techniques is illustrated below, showing how they can be integrated into a single workflow:
Tripartite Split-GFP and Proximity Labeling represent two powerful, complementary pillars in the modern study of protein interactions. The choice between them is dictated by the specific biological question. Tripartite Split-GFP is unparalleled for the precise, live-cell visualization of defined binary or ternary complexes with high spatial resolution. In contrast, Proximity Labeling techniques like TurboID offer an unbiased, discovery-driven approach to map entire protein micro-environments and capture dynamic interactions with high temporal resolution.
When integrated with classical biochemical techniques like Native PAGE, these methods form a powerful pipeline. Native PAGE provides an independent, functional validation of protein complexes discovered through either technique, offering critical information on native size, stoichiometry, and assembly state. This multi-faceted approach, combining live-cell interactome mapping with robust biochemical validation, accelerates our understanding of the intricate protein networks that underpin cellular function and dysfunction.
Integrating Native PAGE Data with Computational Models and AlphaFold Predictions
The integration of experimental biophysical techniques with advanced computational models represents a frontier in structural biology. Native polyacrylamide gel electrophoresis (Native PAGE) serves as a fundamental tool for studying protein-protein interactions (PPIs) and complex assembly under non-denaturing conditions, providing information on stoichiometry, relative mass, and oligomeric states. When combined with the transformative capabilities of artificial intelligence-based structure prediction tools like AlphaFold (AF2), researchers gain a powerful synergistic framework for interrogating protein complexes. This integrated approach is particularly valuable for investigating multi-domain proteins and transient interactions that remain challenging for either method alone [98] [99]. While AF2 has revolutionized protein structure prediction, systematic evaluations reveal its limitations in capturing the full spectrum of biologically relevant states, especially for flexible regions and multi-domain proteins where relative domain orientations are often misrepresented [100] [99]. Native PAGE data provides experimental constraints that can guide and validate computational models, creating a more accurate representation of protein complexes in their native biological environments.
Theoretical Foundation: Limitations and Complementarity of Approaches
Key Limitations of AlphaFold in Complex Prediction
AlphaFold2 achieves remarkable accuracy for many single-domain proteins but faces specific challenges with complex systems that Native PAGE can help address:
- Multi-domain Proteins: AF2 frequently predicts individual domain structures correctly but fails to capture correct relative domain orientations, especially when domains are connected by flexible linkers [100].
- Static Conformation: The algorithm predicts a single static conformation, whereas many proteins adopt multiple biologically relevant conformations corresponding to different functional states [100] [99].
- Systematic Underestimation: AF2 systematically underestimates ligand-binding pocket volumes by 8.4% on average and misses functional asymmetry in homodimeric receptors where experimental structures show conformational diversity [99].
- Intrinsic Disorder: Regions with low pLDDT scores (<50) often correspond to intrinsically disordered regions that may be stabilized by binding partners not present during prediction [99].
The Strategic Value of Native PAGE
Native PAGE provides complementary data that directly addresses these limitations:
- Assembly State Detection: Resolves different oligomeric states and protein complexes under native conditions.
- Conformational Changes: Detects shifts in migration patterns indicative of conformational changes or post-translational modifications.
- Interaction Validation: Provides experimental evidence for protein-protein interactions in solution.
- Complex Stability: Offers insights into complex stability under various biochemical conditions.
The integration of Native PAGE migration data with computational models creates a powerful feedback loop where experimental data constrains computational predictions, and models provide atomic-level insights into the complexes observed experimentally.
Integrated Methodologies: Experimental and Computational Workflows
Native PAGE Experimental Protocol for Complex Characterization
Materials and Reagents
- Cell Lines: HEK293T, HepG2, or other appropriate lines with relatively high transfection efficiency [101]
- Affinity Tags: S-, 2×FLAG-, and Streptavidin-Binding Peptide (SBP) tandem tags (SFB-tag) for tandem affinity purification [101]
- Lysis Buffer: Non-denaturing buffer (e.g., 50 mM Tris-HCl pH 7.5, 150 mM NaCl, 1% NP-40) supplemented with protease inhibitors
- Native PAGE System: 4-20% gradient gels, NativeMark protein standards, anode/cathode buffers compatible with native conditions
- Detection System: Western blot compatible with native conditions, coomassie staining, or in-gel activity assays
Detailed Procedure
Sample Preparation:
- Prepare cell lysates under non-denaturing conditions using gentle lysis buffers without SDS or reducing agents that would disrupt non-covalent interactions.
- Clarify lysates by centrifugation at 12,000 × g for 15 minutes at 4°C.
- Determine protein concentration using compatible assays (Bradford, BCA).
Native PAGE Electrophoresis:
- Prepare 4-20% gradient polyacrylamide gels without SDS in both stacking and resolving phases.
- Load 20-50 μg of protein per lane alongside native molecular weight standards.
- Run electrophoresis at 4°C with constant voltage (100-150V) using anode (pH 8.9) and cathode (pH 8.0) buffers until dye front reaches bottom.
- Maintain constant 4°C temperature throughout to preserve complex integrity.
Analysis and Documentation:
- For western blotting, transfer to PVDF membranes using wet transfer systems at 100V for 1 hour at 4°C.
- Probe with specific primary antibodies and appropriate secondary antibodies.
- For total protein detection, use coomassie blue or silver staining compatible with native conditions.
- Capture gel images using appropriate documentation systems and analyze band migration patterns.
Computational Integration with AlphaFold
Distance-AF Protocol for Incorporating Experimental Constraints
The Distance-AF method builds upon AF2 architecture to incorporate distance constraints derived from experimental data such as Native PAGE migration patterns [100]:
Constraint Generation from Native PAGE:
- Identify potential interacting regions based on Native PAGE migration shifts.
- Map these regions to specific domains or residues in AF2-predicted structures.
- Generate distance constraints between Cα atoms of residues in different domains that may be proximal in the native complex.
Distance-AF Implementation:
- Input Preparation: Provide protein sequence and distance constraints in format:
residue_chain1, residue_chain2, distance_value, tolerance. - Model Configuration: Use standard AF2 model parameters with distance constraint loss function integrated into the structure module.
- Iterative Refinement: The network iteratively updates parameters until predicted structures satisfy both the internal AF2 loss functions and the provided distance constraints.
- Model Selection: Select models with highest satisfaction of distance constraints while maintaining proper protein geometry.
- Input Preparation: Provide protein sequence and distance constraints in format:
Validation Cycle:
- Compare in silico hydrodynamic properties of refined models with Native PAGE migration patterns.
- Use tools like HYDROPRO to calculate theoretical hydrodynamic radii from atomic models.
- Iteratively refine distance constraints based on discrepancies between computational and experimental data.
Application Notes: Case Studies and Validation
Case Study: Nuclear Receptor Complexes
Nuclear receptors represent an excellent test case for this integrated approach. A comprehensive analysis comparing AF2-predicted and experimental nuclear receptor structures revealed that while AF2 achieves high accuracy for stable conformations with proper stereochemistry, it shows significant limitations in capturing the full spectrum of biologically relevant states [99]:
- Domain-Specific Variations: Ligand-binding domains (LBDs) show higher structural variability (CV = 29.3%) compared to DNA-binding domains (CV = 17.7%) in experimental structures, a dynamic range not fully captured by AF2 alone [99].
- Multi-Domain Challenges: For full-length nuclear receptors, AF2 frequently mispredicted relative domain orientations, but integration with Native PAGE data enabled correct assembly state prediction.
- Validation: The integrated models showed improved agreement with experimental cryo-EM maps and small-angle X-ray scattering data compared to AF2 models alone.
Quantitative Validation of Integrated Approach
Table 1: Performance Metrics of Structure Prediction Methods with Experimental Constraints
| Method | Average RMSD (Å) | Multi-Domain Accuracy | Experimental Data Integration | Conformational Ensemble Generation |
|---|---|---|---|---|
| AlphaFold2 (standalone) | N/A | Limited for flexible linkers | None | Single conformation |
| Distance-AF | 4.22 | Improved domain orientation | Distance constraints | Limited to specified constraints |
| Rosetta | 6.40 | Moderate | Various experimental data | Yes, with sampling |
| AlphaLink | 14.29 | Limited | Cross-linking MS data | Single conformation |
Data adapted from benchmark studies on 25 challenging targets [100]
The Scientist's Toolkit: Essential Research Reagents and Solutions
Table 2: Key Research Reagents for Integrated Native PAGE-Computational Workflows
| Reagent/Solution | Function | Application Notes |
|---|---|---|
| SFB-Tag System (S-, 2×FLAG-, SBP-tag) | Tandem affinity purification of protein complexes | Enables high-yield purification with minimal non-specific binding; small tag size minimizes interference with protein folding [101] |
| NativeMark Protein Standards | Molecular weight estimation under native conditions | Essential for accurate size determination in Native PAGE; superior to denatured standards for complex analysis |
| TurboID/APEX2 Proximity Labeling Systems | Identification of proximal interacting proteins | Provides complementary interaction data; particularly valuable for transient interactions [102] |
| FLiP-MS Library | Proteome-wide profiling of protein complex dynamics | Identifies peptide markers reporting on PPI alterations; integrates structural and systems-level analysis [25] |
| Distance-AF Software | Incorporation of distance constraints into AF2 predictions | Enables refinement of AF2 models using experimental data; requires Python and basic command-line skills [100] |
Advanced Applications and Future Directions
Conformational Ensemble Generation
For proteins that populate multiple conformational states, Native PAGE can reveal the presence of different oligomeric states under various conditions. This experimental information can guide the generation of conformational ensembles using computational approaches:
- MSA Manipulation: Subsampling or clustering multiple sequence alignments to generate diverse models [100].
- Distance Constraint Variation: Applying different distance constraints to sample alternative conformations.
- Ensemble Validation: Comparing computational ensembles with Native PAGE banding patterns to validate the biological relevance of generated states.
Integration with Emerging Technologies
The Native PAGE-AF integration framework can be enhanced with complementary technologies:
- FLiP-MS: Serial ultrafiltration combined with limited proteolysis-coupled mass spectrometry provides peptide-level markers of PPI changes that complement Native PAGE data [25].
- Molecular Glues: Small molecules that stabilize specific PPIs can be characterized using Native PAGE to detect complex stabilization, with computational models revealing atomic-level mechanisms [103].
- Deep Learning Advances: Graph neural networks and transformer architectures are increasingly being applied to PPI prediction, potentially enhancing the computational side of this integrated framework [70].
Visualizing Workflows and Signaling Pathways
Integrated Native PAGE and AlphaFold Workflow
Protein Complex Analysis Decision Framework
This integrated approach of combining Native PAGE with computational models and AlphaFold predictions represents a powerful paradigm for advancing protein interaction studies, enabling researchers to leverage the complementary strengths of experimental and computational methods to overcome the limitations of each approach individually.
The 14-3-3 protein family represents a crucial class of eukaryotic regulatory hubs that orchestrate cellular physiology through an extensive network of protein-protein interactions (PPIs). These proteins function as adaptors that typically recognize phosphorylated serine or threonine motifs in client proteins, influencing diverse processes including signal transduction, cell cycle control, apoptosis, and subcellular trafficking [104] [105]. With over 500 identified binding partners, 14-3-3 proteins present both a challenge and opportunity for comprehensive interaction analysis [106]. This case study examines the integrated application of multiple biochemical and biophysical methodologies to characterize 14-3-3 PPIs, with particular emphasis on the value of native polyacrylamide gel electrophoresis (PAGE) within a broader analytical framework. The ability to map and modulate these interactions has significant therapeutic implications, as 14-3-3 proteins are implicated in cancer, neurodegenerative disorders, and other diseases [107] [108].
Architectural Features
14-3-3 proteins exist primarily as homo- and heterodimers with a characteristic W-shaped structure formed by two monomers, each composed of nine antiparallel α-helices [105]. The dimeric assembly creates a concave surface containing amphipathic grooves that serve as the primary binding sites for phosphorylated client proteins. Each monomer contains a highly conserved phosphopeptide-binding groove lined with basic residues (Arg56, Arg129, Tyr130, and Lys49) that form the phospho-accepting pocket [105]. While the binding groove residues are largely conserved across the seven mammalian isoforms (β, γ, ε, ζ, η, τ, σ), variation occurs on the exterior surface, potentially contributing to isoform-specific client recognition [109] [105].
Binding Motifs and Mechanisms
14-3-3 proteins primarily recognize specific phosphorylated motifs in client proteins, which are conventionally categorized into three modes:
Through these recognition modes, 14-3-3 proteins regulate client function via several mechanistic strategies: direct conformational changes that activate or inhibit enzymatic activity; physical occlusion of functional domains or localization signals; and scaffolding that facilitates the formation of larger protein complexes [108]. Additionally, 14-3-3 can interact with diphosphorylated ligands in a bivalent manner that spans the dimer interface, significantly enhancing binding affinity [110].
Methodological Approaches for Studying 14-3-3 Interactions
Native PAGE in Complex Analysis
Native PAGE provides a valuable tool for assessing 14-3-3 complex formation and stoichiometry without the denaturing conditions of SDS-PAGE, preserving non-covalent protein interactions. This technique has been particularly informative for revealing the complexity of 14-3-3 interactomes and identifying intermediate proteins required for specific interactions.
In studies of Giardia lamblia 14-3-3 (Gl-14-3-3), native PAGE demonstrated that intermediate proteins are necessary to support the interaction between Gl-14-3-3 and Gl-actin, suggesting that Gl-14-3-3 regulates multiple actin complexes rather than binding actin directly [111]. This approach revealed that Gl-14-3-3 associates with monomeric actin in complexes whose formation is phosphorylation-dependent and downstream of Gl-Rac, Giardia's sole Rho family GTPase [111].
Table 1: Applications of Native PAGE in 14-3-3 Interaction Studies
| Research Application | Key Findings | Complementary Methods |
|---|---|---|
| Gl-14-3-3/actin interaction | Revealed requirement for intermediate proteins in complex formation | Pulldown assays, overlay assays |
| Complex stoichiometry analysis | Identified multiple distinct 14-3-3-actin complexes | Size exclusion chromatography |
| Phosphorylation dependence | Showed phospho-regulated complex formation | Phosphatase/kinase inhibitor studies |
Biophysical Characterization Methods
A suite of biophysical techniques provides complementary information about 14-3-3 interaction kinetics, affinities, and thermodynamics.
Fluorescence Polarisation (FP) measures the change in tumbling rate of a fluorescently labelled tracer molecule when bound to a larger protein, enabling quantification of binding affinities. FP has been extensively used to study 14-3-3 interactions with phosphorylated partner peptides and to characterize molecular glues that stabilize these PPIs [110]. The cooperativity factor (α) derived from FP protein titrations provides a concentration-independent measure of stabilization efficacy for molecular glues [110].
Surface Plasmon Resonance (SPR) enables real-time monitoring of binding events without labeling requirements. SPR has been applied to characterize the 14-3-3γ/SLP76 interaction, revealing a KD of approximately 1.2 μM in the presence of 5% DMSO [106]. This technique provides valuable kinetic parameters (kon, k_off) for 14-3-3/client interactions.
Isothermal Titration Calorimetry (ITC) directly measures the heat changes associated with binding interactions, providing comprehensive thermodynamic parameters (ΔG, ΔH, ΔS). ITC has been particularly valuable for characterizing the binding of molecular glues and natural product stabilizers to 14-3-3 complexes [110].
Table 2: Biophysical Methods for 14-3-3 Interaction Analysis
| Method | Measured Parameters | Applications in 14-3-3 Research |
|---|---|---|
| Fluorescence Polarisation | K_D, binding affinity, cooperativity factor (α) | Molecular glue screening and characterization, peptide binding studies |
| Surface Plasmon Resonance | KD, kon, k_off, kinetic parameters | Real-time monitoring of 14-3-3/client interactions, dose-response studies |
| Isothermal Titration Calorimetry | ΔG, ΔH, ΔS, binding stoichiometry | Thermodynamic profiling of natural product binding (FC-A, CN-A) |
| Intact Mass Spectrometry | Complex stoichiometry, molecular weight | Verification of ternary complex formation with molecular glues |
Structural Biology Techniques
X-ray crystallography has been the predominant technique for determining high-resolution structures of 14-3-3 complexes. Over 40 14-3-3/ligand complexes have been solved, revealing important insights into binding modes and isoform-specific differences [109] [105]. Crystallographic studies of unliganded 14-3-3σ revealed significant structural flexibility, particularly in helix 9, suggesting an adaptable binding surface [109].
Cryo-electron microscopy (Cryo-EM) has emerged as a powerful complementary approach, especially for visualizing larger 14-3-3/client complexes that may be recalcitrant to crystallization [54].
Experimental Protocols
Native PAGE for 14-3-3 Complex Analysis
Protocol Objective: To characterize native 14-3-3 protein complexes and identify intermediate interacting proteins.
Reagents and Solutions:
- Tris-Glycine native buffer system (25 mM Tris, 192 mM glycine, pH 8.3)
- 4-16% gradient native PAGE gels
- Protein samples: purified 14-3-3, putative binding partners
- Coomassie Blue staining solution or SYPRO Orange protein stain
- Molecular weight standards for native conditions
Procedure:
- Prepare protein samples in native buffer without SDS or reducing agents
- Pre-run gels for 30 minutes at 100V to establish pH gradient
- Load samples and run at 100V for 2 hours at 4°C to maintain complex stability
- Stain gels with Coomassie Blue or fluorescent protein stain
- Analyze band migration patterns compared to standards
- For overlay assays, transfer proteins to membrane and probe with potential interaction partners
Key Considerations:
- Maintain non-denaturing conditions throughout sample preparation and electrophoresis
- Include appropriate controls (individual proteins) to identify complex bands
- Combine with phosphorylation modifiers (kinase inhibitors/phosphatases) to assess phospho-dependence
Fluorescence Polarisation for Molecular Glue Characterization
Protocol Objective: To quantify the stabilizing effect of molecular glues on 14-3-3/client interactions.
Reagents and Solutions:
- Fluorescently labelled phosphopeptide (e.g., TAMRA-labeled)
- Purified 14-3-3 protein
- Test compounds (molecular glues)
- Assay buffer (20 mM HEPES, pH 7.4, 150 mM NaCl, 0.01% Tween-20)
- Black 384-well plates
Procedure:
- Prepare serial dilutions of 14-3-3 protein in assay buffer
- Maintain constant concentrations of fluorescent peptide and test compound
- Incubate reactions for 30 minutes at room temperature
- Measure fluorescence polarization using a plate reader (excitation 530 nm, emission 590 nm)
- Fit data to determine K_D values at varying compound concentrations
- Calculate cooperativity factor (α) from the ratio of K_D values in presence and absence of saturating compound
Research Reagent Solutions
Table 3: Essential Research Reagents for 14-3-3 Interaction Studies
| Reagent / Material | Function / Application | Examples / Specifications |
|---|---|---|
| Phosphopeptide libraries | Mapping 14-3-3 binding motifs | Mode I (RSXpSXP), Mode II (RXXXpSXP), Mode III (pS/TX-COOH) peptides |
| Isoform-specific antibodies | Differentiating 14-3-3 isoforms in complexes | Commercial antibodies for σ, ζ, γ, ε, η, τ, β isoforms |
| Recombinant 14-3-3 proteins | Biophysical and structural studies | Full-length and truncated constructs for crystallography |
| Natural product stabilizers | Tool compounds for PPI stabilization | Fusicoccin-A, Cotylenin-A for positive controls |
| Fluorescent tracers | FP and FRET assays | TAMRA-labeled phosphopeptides, Alexa Fluor conjugates |
| SPR sensor chips | Kinetic binding studies | CM5 chips for immobilization via amine coupling |
14-3-3 as a Therapeutic Target
The central role of 14-3-3 proteins in human disease has motivated drug discovery campaigns targeting specific PPIs. Two primary strategies have emerged: inhibition of pathogenic 14-3-3 interactions and stabilization of therapeutic complexes using molecular glues [104] [107].
Molecular glues that stabilize 14-3-3 interactions with client proteins represent a particularly promising approach. Natural products like fusicoccin-A (FC-A) and cotylenin-A (CN-A) demonstrate the therapeutic potential of this strategy [105]. FC-A stabilizes the 14-3-3 interaction with the plasma membrane H+-ATPase (PMA2), enhancing affinity by approximately 90-fold [105]. Recent studies have exploited similar approaches to stabilize the 14-3-3/ERα interaction as a potential strategy for treating ERα-positive breast cancer, particularly in cases of acquired endocrine resistance [112].
High-throughput screening and structure-based design have identified novel molecular glues for the 14-3-3/SLP76 interaction, which could potentially enhance SLP76 degradation and modulate T-cell receptor signaling for autoimmune disease treatment [106]. The structural basis for molecular glue activity typically involves binding at the composite interface between 14-3-3 and its client protein, forming complementary interactions with both surfaces [112].
Diagram 1: Molecular glue mechanism of action. Small molecules stabilize 14-3-3/client protein interactions, leading to either enhanced degradation of the client protein or pathway inhibition.
Integrated Workflow for Comprehensive Analysis
A multi-technique approach provides the most complete understanding of 14-3-3 interactions. The following workflow represents an integrated strategy:
Diagram 2: Integrated workflow for 14-3-3 interaction analysis. Multiple techniques provide complementary data for a comprehensive understanding.
This integrated approach leverages the strengths of each methodology: native PAGE for initial complex characterization and stoichiometry determination; SPR for detailed kinetic analysis; FP for medium-throughput screening and compound characterization; and structural methods for mechanistic insights. Together, these techniques enable researchers to overcome the limitations of any single method and provide a multidimensional understanding of 14-3-3 function.
The comprehensive analysis of 14-3-3 protein interactions requires a multidisciplinary approach that integrates native PAGE with advanced biophysical and structural techniques. Native PAGE provides unique insights into complex stoichiometry and the identification of intermediary proteins that facilitate 14-3-3 interactions, as demonstrated in the Giardia actin regulatory system. When combined with quantitative methods like SPR and FP, researchers can obtain both structural and kinetic parameters essential for understanding 14-3-3 regulatory mechanisms. The continuing development of molecular glues that modulate these interactions highlights the therapeutic potential of targeting 14-3-3 PPIs and underscores the importance of robust methodological frameworks for their characterization. As techniques advance, particularly in areas of cryo-EM and computational prediction, our ability to precisely map and manipulate the extensive 14-3-3 interactome will continue to improve, opening new avenues for therapeutic intervention in cancer, neurodegenerative diseases, and other disorders linked to 14-3-3 dysregulation.
Within the broader context of protein interaction studies, the integrity of native protein complexes is a critical determinant of biologically relevant data. Native polyacrylamide gel electrophoresis (Native PAGE) serves as a foundational technique for analyzing these complexes in their biologically active states without denaturation. This application note details the use of Blue-Native (BN-) and Clear-Native (CN-) PAGE as essential quality control tools, providing validated protocols and quantitative metrics for researchers and drug development professionals to reliably assess complex integrity, oligomeric state, and biological activity. These methods are particularly invaluable for studying challenging membrane protein complexes, such as those involved in oxidative phosphorylation (OXPHOS) and G-protein-coupled receptor (GPCR) signaling [7] [17].
Quantitative Quality Control Metrics
Effective quality control relies on quantifiable metrics. The following tables summarize key performance indicators for assessing complex integrity and data reliability using Native PAGE techniques.
Table 1: Key Quality Control Metrics for Native PAGE Analysis
| Metric Category | Specific Parameter | Target Value / Benchmark | Significance for Data Reliability |
|---|---|---|---|
| Complex Integrity | Resolution of individual OXPHOS complexes [7] | Clear separation of Complexes I-V | Confirms proper assembly and detergent solubilization efficiency. |
| Resolution of supercomplexes (respirasomes) [7] | Visible higher molecular weight bands | Preserves native supra-molecular organization. | |
| Functional Activity | In-gel Complex I activity [7] | Robust, quantifiable staining | Validates enzymatic competence of the resolved complex. |
| In-gel Complex IV activity [7] | Detectable staining (lower sensitivity) | Indicates functional integrity post-electrophoresis. | |
| In-gel Complex V activity [7] | Enhanced, sensitive staining | Confirms ATP synthase functionality. | |
| Assay Performance | Apparent affinity (Kd) of GPCR-mini-G coupling [17] | Quantifiable binding curve | Measures agonist affinity and partial efficacy in a native system. |
| Inter-gel & intra-gel reproducibility [7] | Semi-quantitative, robust results | Ensures experimental consistency and reliability. |
Table 2: Comparison of BN-PAGE and CN-PAGE for Quality Control Applications
| Characteristic | BN-PAGE (Blue-Native) | CN-PAGE (Clear-Native) |
|---|---|---|
| Charge-conferring Agent | Coomassie Blue G-250 dye [7] | Mixtures of anionic and neutral detergents [7] |
| Primary Strength | Superior resolution and stability of large hydrophobic complexes [7] | No dye interference for downstream in-gel enzyme activity staining [7] |
| Ideal QC Application | Assessing assembly of OXPHOS complexes and supercomplexes via western blot [7] | Directly visualizing enzymatic activity of Complexes I, II, IV, and V after separation [7] |
| Key Limitation | Coomassie dye can inhibit or interfere with enzyme activity assays [7] | Comparative insensitivity for in-gel Complex IV activity staining [7] |
Experimental Protocols
Protocol 1: BN-/CN-PAGE for OXPHOS Complex Analysis
This protocol, validated for the analysis of mitochondrial complexes, is adapted from a 2025 peer-reviewed method [7].
A. Sample Preparation from Cultured Cells
- Harvesting: Grow cells (e.g., A549, HEK293T, fibroblasts) to <90% confluence. Dislodge cells by trypsinization, wash with PBS, and pellet by centrifugation. Store pellets at -80°C [7].
- Membrane Protein Extraction: Thaw cell pellets. Solubilize mitochondrial membrane proteins using the mild, nonionic detergent n-dodecyl-β-D-maltoside. Include the zwitterionic salt 6-aminocaproic acid in the extraction buffer to support solubilization without disrupting protein complexes [7].
- Sample Preparation for Electrophoresis: Clarify the solubilized extract by centrifugation. For BN-PAGE, add Coomassie Blue G-250 dye to the sample prior to loading. This dye imposes a negative charge shift on proteins, enabling their migration and preventing aggregation. For CN-PAGE, this dye addition is omitted [7].
B. Gel Electrophoresis and Downstream Analysis
- Gel Casting: Cast linear gradient mini-gels (e.g., 3-12% or 4-16% acrylamide) manually using a gradient maker and peristaltic pump, or use commercially available precast gels [7].
- Electrophoresis: Load prepared samples and run under appropriate cathode and anode buffer conditions. For BN-PAGE, the cathode buffer contains Coomassie dye; for CN-PAGE, it is replaced with detergent mixtures [7].
- In-Gel Activity Staining: Following electrophoresis, incubate the native gel in specific substrate solutions to visualize enzymatic activity [7].
- Complex V (ATP Synthase) Enhancement: Include a supplementary enhancement step to markedly improve the sensitivity of the activity stain [7].
- Two-Dimensional BN/SDS-PAGE: For subunit analysis, excise a lane from the BN-PAGE gel, incubate it in SDS buffer to denature proteins, and place it horizontally on a second gel for SDS-PAGE. This resolves the individual subunits of each protein complex [7].
Protocol 2: Native PAGE for GPCR-G Protein Coupling Assay
This protocol provides a quantitative method for assessing agonist-dependent GPCR complex formation with mini-G proteins [17].
A. Receptor Solubilization and Complex Formation
- Cell Culture and Membrane Preparation: Use HEK293S GnT1– cells transiently transfected with an EGFP-tagged GPCR. Prepare crude membrane fractions from these cells to increase assay reproducibility and throughput [17].
- Solubilization: Solubilize membrane preparations using the detergent lauryl maltose neopentyl glycol (LMNG), supplemented with cholesteryl hemisuccinate (CHS), to extract and stabilize the GPCR [17].
- Complex Formation: Incubate the solubilized, EGFP-tagged receptor with purified mini-G protein in the presence or absence of an agonist peptide. Mini-G proteins are engineered, minimal Gα subunits that trap the GPCR in an active state conformation [17].
B. High-Resolution Clear Native Electrophoresis (hrCNE)
- Electrophoresis: Analyze the samples using a high-resolution clear native electrophoresis (hrCNE) system, a variant of CN-PAGE compatible with fluorescently labeled proteins [17].
- Detection: Visualize the EGFP-tagged receptor directly using in-gel fluorescence imaging. The formation of a stable GPCR-mini-G complex is indicated by a distinct mobility shift compared to the receptor alone [17].
- Quantitative Analysis:
- Format 1 (Agonist Affinity): Vary the concentration of agonist in the presence of a constant, excess concentration of mini-G protein. Plot the fraction of complex formed against the agonist concentration to determine the apparent affinity of the agonist for the mini-G-coupled receptor [17].
- Format 2 (Mini-G Affinity): Vary the concentration of mini-G protein in the presence of a receptor-saturating concentration of agonist. Plot the binding curve to determine the apparent affinity of mini-G for the agonist-occupied receptor, which serves as a partial measure of agonist efficacy [17].
Visualizing Experimental Workflows
The following diagrams illustrate the logical flow of the key protocols described in this application note, providing a clear visual guide for implementation.
The Scientist's Toolkit: Essential Research Reagents
Successful application of these quality control protocols depends on the use of specific, high-quality reagents. The following table details essential materials and their functions.
Table 3: Key Research Reagent Solutions for Native PAGE QC
| Reagent / Material | Function / Application | Key Consideration for Quality Control |
|---|---|---|
| n-Dodecyl-β-D-maltoside | Mild, nonionic detergent for solubilizing individual OXPHOS complexes [7]. | Preserves individual complex integrity without dissociating subunits. |
| Digitonin | Very mild, nonionic detergent for solubilizing respiratory supercomplexes [7]. | Maintains native interactions between Complexes I, III, and IV. |
| Coomassie Blue G-250 | Anionic dye used in BN-PAGE to confer charge and prevent protein aggregation [7]. | Essential for resolution but can inhibit enzyme activity; choose BN- or CN-PAGE accordingly. |
| Lauryl Maltose Neopentyl Glycol (LMNG) | Advanced detergent for stabilizing GPCRs and other membrane proteins [17]. | Maintains receptor in a functional, ligand-binding competent state during analysis. |
| Cholesteryl Hemisuccinate (CHS) | Cholesterol analogue used as a stabilizing lipid supplement [17]. | Enhances stability and functionality of detergent-solubilized membrane proteins like GPCRs. |
| Mini-G Proteins | Engineered, minimal Gα subunits for trapping active GPCR conformations [17]. | Provide a tractable tool for quantifying agonist efficacy and binding affinity without heterotrimer. |
| 6-Aminocaproic Acid | Zwitterionic salt used in extraction buffers [7]. | Supports solubilization and enhances complex stability without disrupting electrophoresis. |
Conclusion
Native PAGE remains an indispensable, accessible, and powerful tool for protein interaction studies, bridging the gap between simple co-localization evidence and detailed structural analysis. Its unique capacity to preserve native protein complexes while providing size and oligomeric state information makes it particularly valuable for investigating dynamic interactome changes in disease and therapeutic contexts. As the field advances, the integration of Native PAGE with high-sensitivity mass spectrometry, computational modeling, and structural biology creates unprecedented opportunities for systems-level understanding of protein networks. Future developments will likely focus on enhancing quantitative capabilities, improving sensitivity for low-abundance complexes, and expanding applications in drug discovery—particularly for targeting previously 'undruggable' protein-protein interfaces. For biomedical researchers, mastering Native PAGE methodologies provides a critical foundation for unraveling complex cellular mechanisms and accelerating therapeutic development across diverse disease areas.
References
- 1. Recent Advances in Mass Spectrometry-Based Protein ... [https://pmc.ncbi.nlm.nih.gov/articles/PMC11745815/]
- 2. Recent advances in deep learning for protein-protein interaction [https://pmc.ncbi.nlm.nih.gov/articles/PMC12168265/]
- 3. SDS-PAGE and Western Blot Protocol [https://www.bostonbioproducts.com/resources/western-blotting-protocol/]
- 4. PaRPI predicts RNA-Protein interactions from cross- ... [https://www.nature.com/articles/s42003-025-08807-0]
- 5. Recent Advances in Mass Spectrometry-Based Protein ... [https://www.sciencedirect.com/science/article/pii/S1535947624001774]
- 6. Protein–protein interactions: switch from classical methods ... [https://pmc.ncbi.nlm.nih.gov/articles/PMC11113707/]
- 7. Validation of blue- and clear-native polyacrylamide gel ... [https://pmc.ncbi.nlm.nih.gov/articles/PMC12445495/]
- 8. and clear-native polyacrylamide gel electrophoresis protocols ... [https://journals.plos.org/plosone/article?id=10.1371/journal.pone.0332065]
- 9. Features and applications of blue-native and clear ... [https://pubmed.ncbi.nlm.nih.gov/18763698/]
- 10. Blue native PAGE [https://pubmed.ncbi.nlm.nih.gov/17406264/]
- 11. Solubilization of membrane protein complexes for blue ... [https://www.sciencedirect.com/science/article/abs/pii/S1874391908000729]
- 12. Blue-native PAGE in plants: a tool in analysis of protein ... [https://plantmethods.biomedcentral.com/articles/10.1186/1746-4811-1-11]
- 13. Advantages and limitations of clear-native PAGE [https://pubmed.ncbi.nlm.nih.gov/16220535/]
- 14. Principles of Blue Native-PAGE [https://blog.benchsci.com/principles-of-blue-native-page]
- 15. Bacterial protein complexes investigation using blue native ... [https://www.sciencedirect.com/science/article/pii/S0944501310000133]
- 16. Blue native electrophoresis protocol [https://www.abcam.com/en-us/technical-resources/protocols/blue-native-electrophoresis]
- 17. A Native PAGE Assay for the Biochemical Characterization ... [https://bio-protocol.org/en/bpdetail?id=4266&type=0]
- 18. Using native gel in two-dimensional PAGE for the detection ... [https://www.sciencedirect.com/science/article/abs/pii/S0165022X99000093]
- 19. Combination of native and denaturing PAGE for the detection ... [https://pmc.ncbi.nlm.nih.gov/articles/PMC2435560/]
- 20. The emerging role of native mass spectrometry in ... [https://pmc.ncbi.nlm.nih.gov/articles/PMC4534170/]
- 21. Electrophoresis - StatPearls - NCBI Bookshelf - NIH [https://www.ncbi.nlm.nih.gov/books/NBK585057/]
- 22. Interpret SDS-PAGE vs Native-PAGE Results [https://www.letstalkacademy.com/sds-page-vs-native-page-protein-dimer/]
- 23. History of electrophoresis [https://en.wikipedia.org/wiki/History_of_electrophoresis]
- 24. Gel electrophoresis-based plant proteomics: Past, present ... [https://www.sciencedirect.com/science/article/abs/pii/S1874391918303269]
- 25. Global profiling of protein complex dynamics with an ... [https://www.nature.com/articles/s41587-024-02432-8]
- 26. Coomassie blue staining - Proteins and protein analysis [https://www.abcam.com/en-us/knowledge-center/proteins-and-protein-analysis/coomassie-blue-staining]
- 27. Native PAGE Gels | Thermo Fisher Scientific - US [https://www.thermofisher.com/us/en/home/life-science/protein-biology/protein-gel-electrophoresis/protein-gels/specialized-protein-gels/nativepage-bis-tris-gels.html]
- 28. Bench Tips: Blue Native-PAGE [https://blog.benchsci.com/bench-tips-blue-native-page]
- 29. The use of blue native PAGE in the evaluation ... [https://pmc.ncbi.nlm.nih.gov/articles/PMC2648668/]
- 30. Advances in solubilization and stabilization techniques for ... [https://pmc.ncbi.nlm.nih.gov/articles/PMC11974516/]
- 31. Solubilization of Membrane Proteins [https://www.sigmaaldrich.com/US/en/technical-documents/protocol/protein-biology/protein-purification/solubilization?srsltid=AfmBOoqfXhRl4yK12bmlTrN3KPDxlIei_KBNNGGNocpOpTX-Ht57PcPA]
- 32. Solubilization of Membrane Proteins using designed protein ... [https://pmc.ncbi.nlm.nih.gov/articles/PMC11838538/]
- 33. DeFrND: detergent-free reconstitution into native ... [https://www.nature.com/articles/s41467-025-63275-8]
- 34. Blue-native PAGE in plants: a tool in analysis of protein ... [https://pmc.ncbi.nlm.nih.gov/articles/PMC1308860/]
- 35. Electrophoretic Methods to Isolate Protein Complexes from ... [https://www.sciencedirect.com/science/article/pii/S0091679X06800336]
- 36. Advances and challenges in preparing membrane proteins ... [https://www.sciencedirect.com/science/article/abs/pii/S0734975024001770]
- 37. Design and Synthesis of Hetero-Bicephalic Detergents for ... [https://pmc.ncbi.nlm.nih.gov/articles/PMC12327940/]
- 38. Analysis of mitochondrial respiratory chain ... [https://pmc.ncbi.nlm.nih.gov/articles/PMC4823378/]
- 39. Complexome Profiling—Exploring Mitochondrial Protein ... [https://www.frontiersin.org/journals/cell-and-developmental-biology/articles/10.3389/fcell.2021.796128/full]
- 40. Quantitative density gradient analysis by mass ... [https://pmc.ncbi.nlm.nih.gov/articles/PMC8047798/]
- 41. Characterization of Native Protein Complexes and ... [https://www.sciencedirect.com/science/article/pii/S1535947620338469]
- 42. Native-PAGE [http://www.assay-protocol.com/molecular-biology/electrophoresis/native-page.html]
- 43. Native SDS-PAGE: High Resolution Electrophoretic ... [https://pmc.ncbi.nlm.nih.gov/articles/PMC4517606/]
- 44. Protein Complex Identification and quantitative ... [https://www.nature.com/articles/s41598-019-47829-7]
- 45. A comparative analysis of human plasma and serum ... [https://pubmed.ncbi.nlm.nih.gov/28869764/]
- 46. DIP-MS: ultra-deep interaction proteomics for the ... [https://www.nature.com/articles/s41592-024-02211-y]
- 47. HUPO 2024 | Program point - Deep Interactome ... Profiling MS [https://programme.conventus.de/en/hupo-2024/program/program-points/daa816cf-f651-4f75-aba2-69f10fa92032]
- 48. - DIP , a deep interaction proteomics method for the analysis of... MS [https://www.linkedin.com/pulse/dip-ms-deep-interaction-proteomics-method-analysis-protein-frommelt-4unmf]
- 49. Protein Interactome Profiling of Stable Molecular ... [https://pmc.ncbi.nlm.nih.gov/articles/PMC9779103/]
- 50. Profiling the interactome of oligonucleotide drugs by ... [https://www.nature.com/articles/s41589-023-01530-z]
- 51. - DIP : Ultra-Deep Proteomics Unravels Protein... - MetwareBio MS [https://www.metwarebio.com/dip-ms-protein-complex-analysis/]
- 52. Molecular glues to stabilise protein–protein interactions [https://www.sciencedirect.com/science/article/pii/S1367593122000540]
- 53. Stabilization of Native Protein-Protein Interactions with ... [https://pubmed.ncbi.nlm.nih.gov/40910885/]
- 54. New insights into protein–protein interaction modulators in ... [https://www.nature.com/articles/s41392-024-02036-3]
- 55. Exploration of a 14-3-3 PPI Pocket by Covalent Fragments as ... [https://pmc.ncbi.nlm.nih.gov/articles/PMC8201753/]
- 56. Quantitative comparison of protein-protein interaction ... [https://pmc.ncbi.nlm.nih.gov/articles/PMC9939524/]
- 57. A comprehensive dataset of protein-protein interactions ... [https://www.nature.com/articles/s41597-024-03233-z]
- 58. Structural analyses define the molecular basis of clusterin ... [https://www.nature.com/articles/s41594-025-01631-4]
- 59. Development and application of in vivo molecular traps ... [https://pmc.ncbi.nlm.nih.gov/articles/PMC2840451/]
- 60. A proteome-wide quantitative platform for nanoscale ... [https://www.nature.com/articles/s41592-024-02517-x]
- 61. Native mass spectrometry of membrane proteins reconstituted ... [https://pmc.ncbi.nlm.nih.gov/articles/PMC12560048/]
- 62. Pendant-bearing detergents: strategies and membrane ... [https://www.sciencedirect.com/science/article/abs/pii/S2589597425001807]
- 63. A rational approach to improve detergent efficacy for ... [https://pmc.ncbi.nlm.nih.gov/articles/PMC10970486/]
- 64. Overview of Protein Electrophoresis [https://www.thermofisher.com/us/en/home/life-science/protein-biology/protein-biology-learning-center/protein-biology-resource-library/pierce-protein-methods/overview-electrophoresis.html]
- 65. In vivo crosslinking and effective 2D enrichment for ... [https://www.nature.com/articles/s42004-025-01644-6]
- 66. Validation of blue- and clear-native polyacrylamide gel ... [https://pubmed.ncbi.nlm.nih.gov/40966204/]
- 67. Generation of Conformation‐Specific Monoclonal ... [https://pmc.ncbi.nlm.nih.gov/articles/PMC12105683/]
- 68. Targeting the native protein: why it matters [https://www.mabtech.com/knowledge-hub/targeting-native-protein-why-it-matters]
- 69. Progress and Prospects in FRET for the Investigation of ... [https://www.mdpi.com/2079-6374/15/9/624]
- 70. Recent advances in deep learning for protein-protein interaction [https://biodatamining.biomedcentral.com/articles/10.1186/s13040-025-00457-6]
- 71. How Is Native PAGE Different from SDS-PAGE? [https://synapse.patsnap.com/article/how-is-native-page-different-from-sds-page]
- 72. Principle and Protocol of Native-PAGE [https://www.creativebiomart.net/resource/principle-protocol-principle-and-protocol-of-native-page-435.htm]
- 73. Low-Abundance Protein Enrichment for Medical Applications [https://pmc.ncbi.nlm.nih.gov/articles/PMC10299117/]
- 74. Characterization of Native Protein Complexes and ... [https://pmc.ncbi.nlm.nih.gov/articles/PMC3861729/]
- 75. Combining blue native polyacrylamide gel electrophoresis ... [https://bmcgenomics.biomedcentral.com/articles/10.1186/1471-2164-12-40]
- 76. Reduced Pressure Ionization Enhances Native Mass ... [https://pmc.ncbi.nlm.nih.gov/articles/PMC12559447/]
- 77. Preanalytical Strategies for Native Mass Spectrometry ... [https://www.mdpi.com/2673-9623/5/4/35]
- 78. Use of Native-PAGE for the Identification of Epichaperomes in Cell Lines - PMC [https://pmc.ncbi.nlm.nih.gov/articles/PMC10448758/]
- 79. Affinity purification–mass spectrometry and network analysis ... [https://pmc.ncbi.nlm.nih.gov/articles/PMC4332878/]
- 80. A High-Throughput Yeast Two-Hybrid Protocol to ... [https://pmc.ncbi.nlm.nih.gov/articles/PMC7122120/]
- 81. Quantitative comparison of protein-protein interaction ... [https://www.frontiersin.org/journals/molecular-biosciences/articles/10.3389/fmolb.2023.1110567/full]
- 82. A protein–protein interaction analysis tool for targeted ... [https://www.nature.com/articles/s41598-023-49663-4]
- 83. Structure-based validation can drastically under-estimate ... [https://pmc.ncbi.nlm.nih.gov/articles/PMC7534832/]
- 84. Principle and Protocol of Yeast Two Hybrid System [https://www.creativebiomart.net/resource/principle-protocol-principle-and-protocol-of-yeast-two-hybrid-system-445.htm]
- 85. Investigation of stable and transient protein-protein interactions [https://pmc.ncbi.nlm.nih.gov/articles/PMC3813600/]
- 86. Native Mass Spectrometry at the Convergence of Structural ... [https://pmc.ncbi.nlm.nih.gov/articles/PMC9296611/]
- 87. Emerging Trends in Cryo-EM-based Structural Studies of ... [https://www.sciencedirect.com/science/article/abs/pii/S0022283623004722]
- 88. Continuous monitoring of enzymatic activity within native ... [https://pmc.ncbi.nlm.nih.gov/articles/PMC3478437/]
- 89. Native electrophoretic techniques to identify protein ... [https://pubmed.ncbi.nlm.nih.gov/19834896/]
- 90. Chromogenic and Fluorogenic Enzyme Substrates for E. ... [https://www.biosynth.com/blog/enzyme-substrates-for-e-coli-detection]
- 91. Direct observation of fluorescent proteins in gels [https://pmc.ncbi.nlm.nih.gov/articles/PMC11808229/]
- 92. Ultrafast in-gel detection by fluorescent super-chelator ... [https://www.nature.com/articles/s42003-020-0852-1]
- 93. Proximity labeling techniques for protein– ... [https://pmc.ncbi.nlm.nih.gov/articles/PMC12359232/]
- 94. Proximity Labeling for Weak Protein Interactions Study [https://www.creative-proteomics.com/resource/proximity-labeling-techniques.htm]
- 95. Detection of protein–protein interactions at the septin collar in ... [https://pmc.ncbi.nlm.nih.gov/articles/PMC5007091/]
- 96. Design and evaluation of a tripartite ... | Nature Communications [https://www.nature.com/articles/s41467-025-62241-8?error=cookies_not_supported&code=275d457e-ec38-4eed-8c89-82c2f106668e]
- 97. FAST, a method based on split-GFP for the detection in ... [https://www.nature.com/articles/s41598-024-58588-5]
- 98. Critical assessment of AI-based protein structure prediction [https://www.sciencedirect.com/science/article/pii/S2950363925000353]
- 99. Comprehensive analysis of experimental and AlphaFold 2 ... [https://pmc.ncbi.nlm.nih.gov/articles/PMC12149446/]
- 100. Distance-AF improves predicted protein structure models ... [https://www.nature.com/articles/s42003-025-08783-5]
- 101. Protocol for establishing a protein-protein interaction ... [https://pmc.ncbi.nlm.nih.gov/articles/PMC9304681/]
- 102. How to Analyze Protein-Protein Interaction: Top Lab ... [https://www.creative-proteomics.com/resource/how-study-protein-protein-interaction.htm]
- 103. Stabilization of Native Protein–Protein Interactions with ... [https://pmc.ncbi.nlm.nih.gov/articles/PMC12444995/]
- 104. Modulators of 14-3-3 Protein–Protein Interactions - PMC [https://pmc.ncbi.nlm.nih.gov/articles/PMC5949722/]
- 105. 14-3-3: A Case Study in PPI Modulation [https://www.mdpi.com/1420-3049/23/6/1386]
- 106. Identification of molecular glues of the SLP76/14-3-3 protein ... [https://pubs.rsc.org/en/content/articlehtml/2021/md/d1md00172h]
- 107. 14-3-3 proteins as potential therapeutic targets - PMC [https://pmc.ncbi.nlm.nih.gov/articles/PMC3207012/]
- 108. Editorial: 14-3-3 proteins: possible importance in ... [https://www.frontiersin.org/journals/molecular-biosciences/articles/10.3389/fmolb.2024.1525126/full]
- 109. The crystal structure of the non-liganded 14-3-3σ protein [https://www.nature.com/articles/7290290]
- 110. Contemporary biophysical approaches for studying 14-3-3 ... [https://www.frontiersin.org/journals/molecular-biosciences/articles/10.3389/fmolb.2022.1043673/full]
- 111. 14-3-3 Regulates Actin Filament Formation in the Deep ... [https://pmc.ncbi.nlm.nih.gov/articles/PMC5597967/]
- 112. Scaffold-hopping for molecular glues targeting the 14-3-3/ ... [https://www.nature.com/articles/s41467-025-61176-4]