IEF-IPG vs. SDS-PAGE: A Comprehensive Guide to Protein Fractionation Efficiency for Proteomics and Drug Development
This article provides a detailed comparative analysis of two foundational protein separation techniques: Isoelectric Focusing with Immobilized pH Gradients (IEF-IPG) and Sodium Dodecyl Sulfate–Polyacrylamide Gel Electrophoresis (SDS-PAGE).
IEF-IPG vs. SDS-PAGE: A Comprehensive Guide to Protein Fractionation Efficiency for Proteomics and Drug Development
Abstract
This article provides a detailed comparative analysis of two foundational protein separation techniques: Isoelectric Focusing with Immobilized pH Gradients (IEF-IPG) and Sodium Dodecyl Sulfate–Polyacrylamide Gel Electrophoresis (SDS-PAGE). Tailored for researchers, scientists, and drug development professionals, it explores the core principles governing each method—separation by isoelectric point versus molecular weight. The scope extends from foundational theories and standard methodologies to advanced troubleshooting, protocol optimization, and rigorous validation strategies. By synthesizing current research and practical applications, this guide serves as a critical resource for selecting the appropriate fractionation technique to enhance resolution, yield, and reproducibility in proteomic analysis and biopharmaceutical development.
Core Principles of Protein Separation: Understanding IEF-IPG and SDS-PAGE Fundamentals
In proteomic research, the efficient fractionation of complex protein mixtures is an indispensable step prior to mass spectrometry analysis, significantly enhancing detection sensitivity and dynamic range. Two foundational techniques form the cornerstone of protein separation in laboratories worldwide: isoelectric focusing with immobilized pH gradients (IEF-IPG), which separates proteins based on their intrinsic isoelectric point (pI), and sodium dodecyl sulfate-polyacrylamide gel electrophoresis (SDS-PAGE), which separates proteins according to their molecular weight. These methods leverage fundamentally different physicochemical properties of proteins, making them suitable for distinct applications and providing complementary information in comprehensive proteomic profiling.
The isoelectric point (pI) represents the specific pH at which a protein carries no net electrical charge, a fundamental property determined by the ionization states of amino acid side chains and terminal groups. In practice, proteins exhibit an extraordinary diversity in their pI values, with plant proteomes alone demonstrating a range from approximately 2.0 to 14.0, creating a strong basis for effective separation [1]. Conversely, molecular weight separation depends on the hydrodynamic volume of proteins when denatured with SDS, which masks intrinsic charge differences and creates a uniform charge-to-mass ratio. When combined as two-dimensional gel electrophoresis (2-DE), these orthogonal separation principles enable the high-resolution analysis of thousands of protein species simultaneously, providing a powerful tool for detecting post-translational modifications, splice variants, and proteolytic cleavages that alter protein charge, mass, or both [2].
Performance Comparison: IEF-IPG vs. SDS-PAGE
Direct comparative studies reveal that both IEF-IPG and SDS-PAGE provide complementary protein identification results, but they differ significantly in their performance metrics and specific advantages. Research evaluating complex mixtures, including protein standards and mitochondrial extracts from rat liver, demonstrates that while both techniques yield substantial proteome coverage, they excel in different aspects of separation efficiency [3].
Table 1: Comparative Performance of Gel-Based Fractionation Techniques
| Performance Metric | 1-D SDS-PAGE | Preparative SDS-PAGE | IEF-IPG | 2-D PAGE |
|---|---|---|---|---|
| Protein Identifications | High | Moderate | Highest | Moderate |
| Peptides per Protein | Moderate | Lower | Highest | Variable |
| Resolution Basis | Molecular weight | Molecular weight | Isoelectric point | Both pI and MW |
| Reproducibility | High | High | High (acidic proteins) | Moderate |
| Basic Protein Recovery | Good | Good | Limited [4] | Good with NEPHGE |
| Sample Capacity | Moderate | High | Moderate | Lower |
The data indicates that IEF-IPG fractionation results in the highest average number of detected peptides per protein, which is particularly beneficial for quantitative and structural characterization of proteins in large-scale biomedical applications [3]. However, a critical limitation of conventional IPG-based IEF emerges in the analysis of basic proteins (pI > 7.0), where protein loss and poor reproducibility present significant challenges. Comparative studies with non-equilibrium pH gradient electrophoresis (NEPHGE), an alternative carrier ampholyte-based technique, demonstrate that NEPHGE-based methods provide superior performance for basic proteins, with approximately half of detected basic protein spots being unreproducible by IPG-based 2DE [4].
For SDS-PAGE, the resolution is highly dependent on gel composition, buffer systems, and sample preparation techniques. The development of specialized variants such as Tricine-SDS-PAGE for proteins below 30 kDa and reducing versus non-reducing conditions further expands its utility for different protein classes [5]. The primary advantage of SDS-PAGE remains its robust separation based on molecular weight, providing reliable estimates of protein size and purity across diverse sample types, from simple protein standards to complex biological mixtures [3] [5].
Experimental Protocols and Methodologies
IEF-IPG Standard Protocol
The IEF-IPG methodology has been extensively refined since its introduction, with modern protocols offering significantly improved reproducibility over traditional carrier ampholyte-based systems [2]. A standard protocol for IEF-IPG separation involves several critical steps:
Sample Preparation: Proteins must be extracted and dissolved in a suitable IEF buffer containing high concentrations of chaotropes (7M urea, 2M thiourea), zwitterionic detergents (4% CHAPS), reducing agents (50mM DTT), and carrier ampholytes. For optimal focusing, samples should be desalted and have conductivity adjusted to ≤300µS/cm using centrifugal ultrafiltration devices [3]. Precipitation methods are often employed to remove interfering contaminants and salts that can compromise IEF separation quality [2].
IPG Strip Rehydration: Commercial dried IPG strips of appropriate pH range (e.g., pH 3-10, 4-7, or 5-8) are rehydrated with rehydration buffer containing urea, thiourea, CHAPS, DTT, and carrier ampholytes. Sample can be incorporated during rehydration or loaded via specialized cups after rehydration. The rehydration process typically requires 6-12 hours to ensure uniform distribution of proteins throughout the gel matrix [2].
Isoelectric Focusing: The rehydrated IPG strips are subjected to high voltage electrophoresis using a programmed voltage gradient. A typical protocol for 7-cm strips might include stepwise increases from 150V to 4,000V, with focusing complete after reaching approximately 20,000Vh. Maintaining appropriate temperature (20°C) and current limits is essential for reproducible results. The focusing process generally requires 4-6 hours for mini-gel formats but can extend to 24-36 hours for longer preparative strips [3] [6].
Strip Equilibration: Following IEF, IPG strips must be equilibrated in SDS-containing buffer (typically with urea, glycerol, SDS, and DTT) to denature proteins and prepare them for second-dimension SDS-PAGE separation [4].
SDS-PAGE Standard Protocol
The SDS-PAGE technique, originally described by Laemmli, remains one of the most widely used methods in protein analysis with well-standardized protocols [5]:
Sample Preparation: Protein samples are diluted in sample buffer containing SDS (2%), glycerol (10%), Tris-HCl (63mM, pH 6.8), bromophenol blue, and reducing agents (50mM DTT or 2-mercaptoethanol). The mixture is heated at 95-100°C for 5-10 minutes to ensure complete denaturation and SDS binding. For non-reducing SDS-PAGE, reducing agents are omitted from the buffer [3] [5].
Gel Preparation: Discontinuous polyacrylamide gels are cast with a stacking gel (typically 4-5% acrylamide) at pH 6.8 and a resolving gel (8-16% acrylamide gradient or fixed percentage) at pH 8.8. The choice of acrylamide concentration depends on the molecular weight range of target proteins, with higher percentages providing better resolution for lower molecular weight proteins [3] [5].
Electrophoresis: Prepared samples are loaded into wells and subjected to constant current or voltage. Typical conditions for mini-gel systems range from 100-200V for 45-90 minutes, using Tris-glycine-SDS running buffer (25mM Tris, 192mM glycine, 0.1% SDS, pH 8.3). The run is complete when the dye front reaches the bottom of the gel [5].
Detection: Separated proteins are visualized using staining methods compatible with downstream mass spectrometry analysis. Coomassie Brilliant Blue provides detection in the nanogram range with excellent MS compatibility, while silver staining offers higher sensitivity (low nanogram range) but can be problematic for subsequent protein identification [7].
Table 2: Optimal Conditions for High-Resolution Separations
| Parameter | IEF-IPG | SDS-PAGE |
|---|---|---|
| Sample Load | 50-100μg (analytical) [4] | 100-130μg (17cm gel) [7] |
| Separation Time | 4-24 hours [6] | 1-2 hours (mini-gel) |
| Critical Additives | Urea/thiourea, CHAPS, carrier ampholytes, DTT | SDS, glycerol, reducing agents, Tris buffer |
| Optimal pH/Range | Narrow range (e.g., pH 5-8) for higher resolution [7] | Gradient gels (e.g., 8-16%) for broad MW range |
| Staining Methods | Compatible with MS-friendly stains after 2nd dimension | CBB R-250/G-250, silver nitrate, fluorescent dyes |
Workflow Integration and Visual Guide
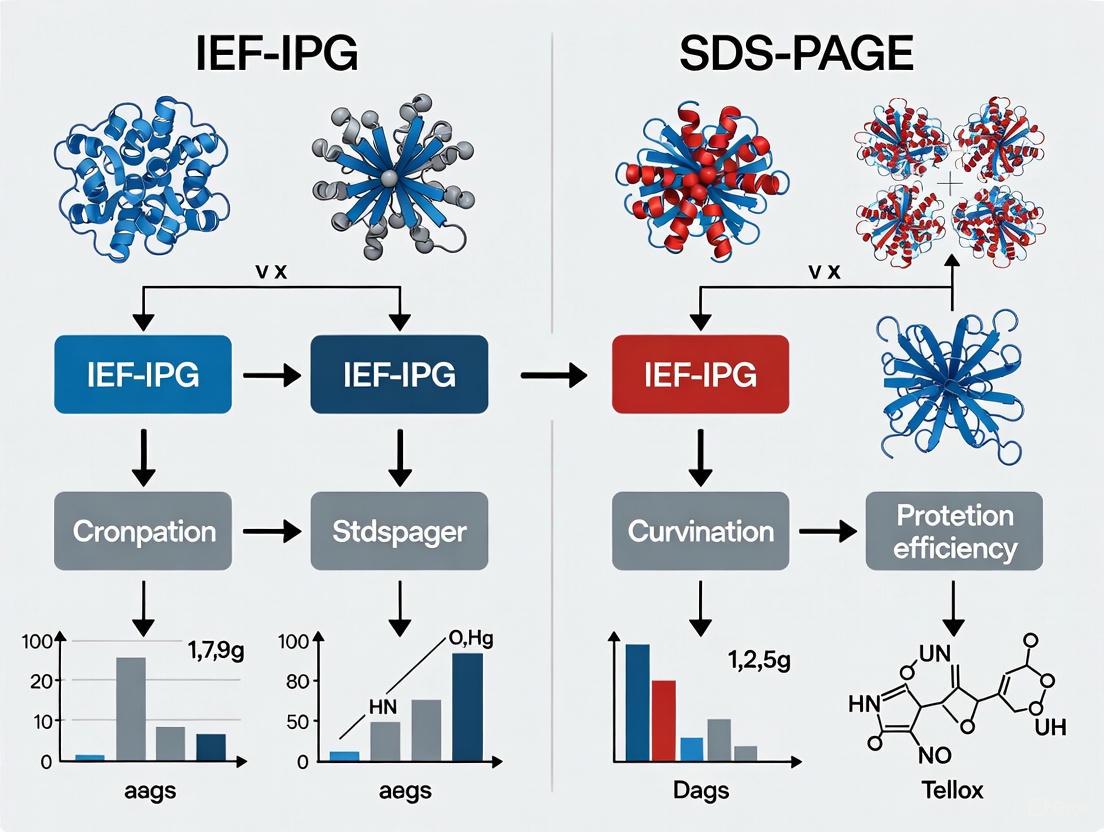
The strategic integration of IEF-IPG and SDS-PAGE as orthogonal separation techniques creates the powerful analytical platform of two-dimensional gel electrophoresis (2-DE). This workflow enables researchers to separate complex protein mixtures based on two independent physicochemical parameters, providing exceptional resolution for comprehensive proteome analysis. The following diagram illustrates the sequential relationship and complementary nature of these techniques within a standard proteomics workflow:
This integrated approach is particularly powerful for visualizing protein isoforms resulting from charged post-translational modifications such as phosphorylation, which alter pI, or proteolytic cleavages that change molecular weight [2]. The high resolution achieved through this orthogonal separation enables detection of thousands of individual protein species from complex biological samples like whole cell lysates or enriched subcellular fractions.
Research Reagent Solutions Guide
Successful implementation of IEF-IPG and SDS-PAGE methodologies requires specific reagents optimized for each technique. The following table details essential solutions and their functions in protein separation workflows:
Table 3: Essential Research Reagents for Protein Separation Techniques
| Reagent Category | Specific Examples | Function & Importance | Primary Application |
|---|---|---|---|
| Chaotropic Agents | Urea (7M), Thiourea (2M) | Protein denaturation, solubilization | IEF-IPG Sample Preparation |
| Detergents | CHAPS (4%), SDS (1-2%) | Solubilization, charge masking | IEF-IPG (CHAPS), SDS-PAGE (SDS) |
| Reducing Agents | DTT (50mM), 2-Mercaptoethanol | Disulfide bond reduction | Both Techniques |
| Carrier Ampholytes | Pharmalyte, Bio-Lyte | pH gradient formation | IEF-IPG |
| Immobilized pH Gradients | IPG Strips (various ranges) | Stable pH gradient for IEF | IEF-IPG |
| Acrylamide Solutions | Bis-acrylamide (29:1, 37.5:1) | Gel matrix formation | SDS-PAGE |
| Buffers | Tris-glycine, Tris-HCl | pH maintenance during electrophoresis | Both Techniques |
| Staining Reagents | Coomassie G-250, Silver nitrate | Protein visualization post-separation | Both Techniques |
Application Contexts and Strategic Selection
The choice between IEF-IPG and SDS-PAGE separation principles depends heavily on the specific research objectives, sample characteristics, and downstream analytical requirements. Each technique offers distinct advantages for particular applications in proteomic research and biomarker discovery.
For proteomic profiling where comprehensive characterization including post-translational modifications is desired, IEF-IPG provides superior performance due to its exceptional ability to separate charge variants. This capability makes it invaluable for detecting biologically significant protein modifications such as phosphorylation, acetylation, and deamidation that alter protein pI without necessarily changing molecular weight [2]. Furthermore, in direct comparisons of fractionation techniques, IEF-IPG demonstrated the highest number of protein identifications and the greatest average number of detected peptides per protein, crucial metrics for successful mass spectrometry-based identification [3].
For quality control, purity assessment, and molecular weight determination, SDS-PAGE remains the gold standard due to its robustness, simplicity, and wide dynamic range. Its applications extend across diverse fields including food science for allergen detection and species identification, biotechnology for recombinant protein characterization, and clinical research for biomarker verification [5]. The technique's compatibility with a broad spectrum of protein concentrations and molecular weights (from <10 kDa to >500 kDa) makes it exceptionally versatile for routine laboratory applications.
For the most comprehensive protein analysis, particularly when studying complex biological systems where both inherent protein properties and post-translational states are biologically significant, the orthogonal combination of both techniques in 2-DE provides unparalleled resolution. This approach enables researchers to simultaneously monitor changes in protein abundance, modifications, and processing across thousands of protein species, making it particularly valuable for differential expression profiling in disease states, developmental processes, and cellular responses to environmental stimuli [2] [7].
IEF-IPG and SDS-PAGE represent complementary pillars of protein separation science, each leveraging distinct physicochemical properties to address specific research needs. IEF-IPG excels in separating proteins based on subtle charge differences arising from sequence variations or post-translational modifications, while SDS-PAGE provides robust size-based separation ideal for molecular weight determination and purity assessment. The strategic integration of these orthogonal techniques creates a powerful platform for comprehensive proteome analysis, enabling researchers to decipher complex protein mixtures with high resolution and reproducibility. As proteomic technologies continue to evolve, these foundational separation principles remain essential tools for advancing our understanding of protein function in health and disease.
In the field of proteomics, the separation and analysis of complex protein mixtures remains a fundamental challenge. Among the various techniques developed, Isoelectric Focusing with Immobilized pH Gradients (IEF-IPG) has emerged as a powerful tool for high-resolution protein separation based on isoelectric point (pI). This technique has revolutionized the first dimension of two-dimensional gel electrophoresis (2-DE) and become indispensable for researchers studying protein post-translational modifications, splice variants, and differential expression profiles [2]. The global proteomics market, currently valued at approximately $25 billion and projected to grow at a CAGR of 12-15%, highlights the increasing importance of efficient protein separation technologies like IEF-IPG in driving advancements in personalized medicine, drug discovery, and biomarker identification [8].
The historical development of IEF-IPG represents a significant advancement over earlier carrier ampholyte-based systems. While the initial concept of separating proteins in a pH gradient built by a mixture of amphoteric buffers was developed by Vesterberg and Svensson in 1966, the methodology was transformed by the introduction of IPG technology by Bjellqvist et al. in 1982 [2]. This innovation overcame critical limitations of carrier ampholyte systems, including gradient drift, mechanical instability, and technical variation between laboratories. Modern IEF-IPG has established itself as a cornerstone technique that provides the foundation for sophisticated proteomic analyses, particularly when combined with downstream separation methods like SDS-PAGE for comprehensive protein characterization.
This technical guide provides a comprehensive comparison between IEF-IPG and Gradient SDS-PAGE, focusing on their separation mechanisms, performance characteristics, and applications in protein fractionation efficiency research. By examining experimental data, methodological considerations, and practical implementations, we aim to equip researchers with the information necessary to select the optimal separation strategy for their specific proteomic challenges.
Fundamental Principles: IEF-IPG vs. SDS-PAGE Separation Mechanisms
The Science Behind IEF-IPG Separation
Isoelectric Focusing with Immobilized pH Gradients operates on the principle of separating proteins according to their isoelectric point (pI), which is the specific pH at which a protein carries no net electrical charge. In IEF-IPG, the pH gradient is chemically fixed within the polyacrylamide gel matrix through the copolymerization of acidic and basic buffering acrylamide derivatives with the polyacrylamide backbone [2]. This creates a stable, reproducible gradient that remains fixed throughout the separation process, unlike the dynamic gradients formed by carrier ampholytes in traditional IEF.
When an electric field is applied to the IEF-IPG system, proteins embedded in the matrix migrate according to their charge. Proteins located in a region where the pH is below their pI become positively charged and migrate toward the cathode. Conversely, proteins in areas where the pH is above their pI acquire a negative charge and move toward the anode [2]. This migration continues until each protein reaches the position in the pH gradient corresponding to its pI, where it becomes neutrally charged and ceases to move. The result is a focusing effect where proteins become highly concentrated at their isoelectric points, enabling the separation of proteins differing by as little as 0.01 pH units under optimal conditions [2].
The IPG technology offers several critical advantages over carrier ampholyte-based systems. The immobilized gradient eliminates cathodal drift, a phenomenon where the pH gradient becomes unstable with extended running time. Additionally, IPG strips provide enhanced mechanical stability, higher reproducibility, and the ability to load larger protein quantities [2]. Modern IPG strips are commercially available in various lengths (7-24 cm) and pH ranges (broad range pH 3-11, medium ranges like pH 4-7, and narrow ranges such as pH 4-5), allowing researchers to select the optimal format for their specific experimental needs [2].
The Science Behind SDS-PAGE Separation
Sodium Dodecyl Sulfate-Polyacrylamide Gel Electrophoresis (SDS-PAGE) employs a fundamentally different separation mechanism based primarily on protein molecular weight. The technique relies on the anionic detergent SDS, which binds to proteins in a consistent ratio of approximately 1.4g SDS per 1g of protein [9] [10]. This SDS binding serves two critical functions: it denatures proteins, disrupting secondary and tertiary structures while linearizing the polypeptide chains, and it imparts a uniform negative charge density along the protein backbone [11]. The result is the effective elimination of inherent charge differences between proteins, ensuring that migration through the polyacrylamide gel matrix depends solely on molecular size rather than charge or shape [10].
The polyacrylamide gel acts as a molecular sieve with pore sizes determined by the concentration of acrylamide and bis-acrylamide cross-linker. Lower percentage gels (e.g., 8%) with larger pores facilitate the separation of high molecular weight proteins, while higher percentage gels (e.g., 15%) with smaller pores provide better resolution for lower molecular weight proteins [9]. Gradient SDS-PAGE gels, which incorporate varying acrylamide concentrations throughout the gel, allow simultaneous resolution of proteins across a broad molecular weight range [8]. During electrophoresis, smaller proteins migrate more rapidly through the gel matrix, while larger proteins experience greater resistance and migrate more slowly, resulting in separation by apparent molecular weight [11].
Most SDS-PAGE systems utilize a discontinuous buffer system with two distinct gel regions: a stacking gel with larger pores and lower pH where proteins become concentrated into sharp bands, and a resolving gel with smaller pores and higher pH where actual separation occurs [9]. This configuration enables the formation of well-defined protein bands, enhancing resolution and detection sensitivity. The entire process is typically completed within 1-2 hours, making it significantly faster than IEF-IPG separations [11].
Comparative Performance Analysis: Experimental Data and Metrics
Separation Efficiency and Protein Identification Rates
Direct comparative studies reveal distinct performance characteristics for IEF-IPG and SDS-PAGE in proteomic applications. A comprehensive evaluation of gel-based protein separation techniques demonstrated that both 1-D SDS-PAGE and IEF-IPG yielded the highest number of protein identifications, though all techniques provided complementary results [3]. This suggests that the optimal choice depends on the specific experimental goals and sample characteristics rather than a universal superiority of either technique.
The same study highlighted that IEF-IPG consistently demonstrated the highest average number of detected peptides per protein, a significant advantage for protein characterization and identification [3]. This enhanced peptide detection improves sequence coverage and confidence in protein identifications, particularly when combined with mass spectrometric analysis. The focusing effect in IEF-IPG concentrates proteins at their pI, potentially improving the detection of lower abundance species compared to the band-broadening that can occur in SDS-PAGE separations.
For complex samples such as mitochondrial extracts, the orthogonal separation principles of IEF-IPG and SDS-PAGE make them particularly powerful when combined in two-dimensional electrophoresis [3]. In such configurations, IEF-IPG serves as the first dimension separation based on pI, followed by SDS-PAGE in the second dimension based on molecular weight. This combination can resolve thousands of individual protein species from complex mixtures, making it invaluable for global proteome analyses [2].
Quantitative Performance Comparison Table
Table 1: Direct performance comparison between IEF-IPG and SDS-PAGE separation techniques
| Performance Metric | IEF-IPG | SDS-PAGE | Experimental Context |
|---|---|---|---|
| Separation Principle | Isoelectric point (pI) | Molecular weight (MW) | Fundamental separation mechanism [3] [2] |
| Theoretical Resolution | Can separate proteins differing by 0.01 pH units | Limited resolution for minimal MW differences | Optimal conditions [8] |
| Protein Identifications | High | High | Complex protein mixture analysis [3] |
| Peptides per Protein | Highest average count | Lower average count | nanoLC-ESI-MS/MS analysis [3] |
| Effective MW Range | Limited for extreme MW proteins | 5-200 kDa (standard); 700-4200 kDa (agarose) | Standard operating conditions [9] |
| Effective pI Range | Limited for extreme pI proteins | Not applicable | Standard operating conditions [3] |
| Sample Load Capacity | 200-500 μg (standard 2D gels); improved with preparative IEF | Varies with gel format; generally high | Typical loading capacity [6] |
| Run Time | 24-36 hours (traditional IEF) | 1-2 hours | Standard protocols [6] [11] |
| Reproducibility | High with IPG strips | Moderate to high | Technical variation assessment [2] [8] |
Applications and Limitations Comparison Table
Table 2: Application-specific strengths and limitations of IEF-IPG and SDS-PAGE
| Characteristic | IEF-IPG | SDS-PAGE |
|---|---|---|
| Optimal Applications | Detection of PTMs, splice variants, protein isoforms, charge-based heterogeneity | Molecular weight determination, purity assessment, Western blot analysis, expression quantification |
| Key Advantages | High resolution for charge variants, concentration effect improves detection, stable pH gradient | Rapid separation, simple protocol, compatible with downstream immunodetection, cost-effective |
| Technical Limitations | Requires sample desalting, limited for extreme pI/MW proteins, longer run times | Poor resolution for similar MW proteins, cannot detect charge variants, protein denaturation |
| Handling Considerations | Specialized equipment and training, sensitive to salt interference | Accessible to most laboratories, minimal special training required |
| Detection Compatibility | Compatible with MS, specific staining; antibody probing challenging | Excellent compatibility with Western blotting, mass spectrometry after extraction |
Methodological Guide: Experimental Protocols and Workflows
Standard IEF-IPG Experimental Protocol
The successful implementation of IEF-IPG requires careful attention to sample preparation, gel rehydration, and focusing conditions. The following protocol outlines the key steps for denaturing IEF-IPG based on established methodologies [2]:
Sample Preparation:
- Protein extracts should be solubilized in a suitable IEF-compatible buffer containing high concentrations of chaotropes (7M urea, 2M thiourea), zwitterionic detergents (4% CHAPS), reducing agents (50mM DTT), and carrier ampholytes [3] [2].
- Critical step: Remove non-protein ions through precipitation or desalting procedures to maintain high electrical resistance, enabling high voltage focusing (8000-10,000 V) with minimal current [2].
- For mitochondrial or tissue extracts, include protease and phosphatase inhibitors to prevent protein degradation or modifications during processing [3].
- Adjust sample conductivity to ≤300 μS/cm through centrifugal ultrafiltration or dilution to ensure optimal focusing [3].
IPG Strip Rehydration:
- Commercially available dried IPG strips are rehydrated in a solution containing 8M urea, 2% CHAPS, 50mM DTT, and 0.5-2% carrier ampholytes [2].
- Active rehydration (applying low voltage during rehydration) can improve protein entry into the gel matrix and enhance separation reproducibility.
- Rehydration typically requires 6-12 hours to ensure complete and even swelling of the gel matrix.
Isoelectric Focusing:
- Focus IPG strips using a programmed voltage gradient, typically starting at low voltages (200-500 V) and gradually increasing to high voltages (8000 V) over several hours [2].
- Total volt-hour products typically range from 20,000 to 80,000 Vhr depending on strip length and pH gradient.
- Maintain precise temperature control (typically 20°C) throughout focusing to ensure reproducible pI separations.
- Following IEF, strips can be equilibrated in SDS-containing buffer for second dimension SDS-PAGE or processed for alternative downstream analyses.
Standard SDS-PAGE Experimental Protocol
SDS-PAGE provides a more straightforward and rapid separation workflow suitable for routine protein analysis [9] [11]:
Sample Preparation:
- Dilute protein samples in Laemmli buffer containing 2% SDS, 10% glycerol, 5% β-mercaptoethanol or DTT, and 0.0025% bromophenol blue in 63mM Tris HCl, pH 6.8 [3] [11].
- Heat samples at 95-100°C for 5-10 minutes to ensure complete denaturation and reduction of disulfide bonds [11].
- Keep salt concentrations below 500 mM to prevent smearing and band distortion during electrophoresis [9].
Gel Preparation and Electrophoresis:
- Prepare discontinuous gels consisting of a stacking gel (pH 6.8, 4-5% acrylamide) and a resolving gel (pH 8.8, 8-16% acrylamide depending on target protein sizes) [9] [11].
- Load prepared samples and molecular weight markers into wells and run at constant voltage (100-200 V) using Tris-glycine-SDS running buffer until the dye front reaches the gel bottom [11].
- For gradient SDS-PAGE, prepare gels with increasing acrylamide concentrations (e.g., 8-16%) to resolve proteins across a broad molecular weight range [8].
- Following electrophoresis, proteins can be visualized directly by staining or transferred to membranes for Western blotting [11].
Advanced Applications and Synergistic Implementations
Two-Dimensional Gel Electrophoresis: Combining Both Techniques
The most powerful application of IEF-IPG and SDS-PAGE lies in their sequential combination in two-dimensional gel electrophoresis (2-DE), which provides unparalleled resolution for complex protein mixtures [2]. In this orthogonal separation system, proteins are first resolved according to their pI using IEF-IPG in the first dimension, followed by molecular weight separation using SDS-PAGE in the second dimension [2]. The result is a two-dimensional protein map where individual proteins appear as discrete spots distributed across the gel surface rather than overlapping bands in a single dimension.
Modern 2-DE methodology has been significantly enhanced through several key technological developments. The implementation of IPG strips has dramatically improved reproducibility compared to carrier ampholyte-based tube gels, enabling more reliable cross-experiment and cross-laboratory comparisons [2]. The development of difference gel electrophoresis (DIGE) technology, which allows multiplexing of multiple samples labeled with different fluorescent cyanine dyes on the same 2-DE gel, has further enhanced the quantitative capabilities of this platform by minimizing gel-to-gel variation [2].
The primary strength of 2-DE lies in its ability to visualize protein isoforms and post-translational modifications that alter either charge (pI) or molecular weight. Phosphorylation, acetylation, glycosylation, and other modifications frequently produce characteristic shifts in protein position that can be detected through 2-DE analysis [2]. Similarly, splice variants and proteolytic processing events that modify both mass and charge can be readily identified through their distinct migration patterns. These capabilities make 2-DE particularly valuable for differential expression profiling in biomedical research, where comprehensive protein pattern changes between control and experimental samples can be systematically analyzed.
Microfluidic and Preparative Applications
Recent technological advancements have led to the development of innovative platforms that address certain limitations of traditional gel-based IEF-IPG. Microfluidic free-flow IEF (FF-IEF) devices represent one such advancement, enabling continuous protein separation in liquid phase without a solid gel matrix [6]. These systems utilize a thin separation channel between two closely spaced plates, with sample continuously flowing in a laminar fashion while an electric field is applied perpendicular to the flow direction. Proteins become focused at their pI positions and are simultaneously carried toward different outlet ports by the continuous flow [6].
Microfluidic FF-IEF systems offer several distinct advantages over conventional IEF-IPG, including higher throughput, reduced analysis time (residence time of ~12 minutes compared to 24-36 hours for traditional IEF), compatibility with a wide dynamic range of protein concentrations (μg/mL to mg/mL), and improved recovery of high molecular weight proteins [6]. Additionally, these systems facilitate direct integration with downstream analytical techniques, potentially enabling fully automated proteomic analysis platforms. The continuous-flow nature of these devices makes them particularly suitable for preparative applications where specific protein fractions need to be isolated for further characterization.
Another innovative approach is the OFFGEL fractionation system, which combines the high resolution of IPG-based separation with the convenience of liquid phase recovery. In this system, an IPG strip is positioned with a series of liquid-filled wells above it, allowing focused proteins to diffuse from the gel into the solution for recovery [3]. This technology effectively bridges the gap between gel-based and solution-based separation methods, providing fractions that are immediately compatible with downstream mass spectrometric analysis without additional processing steps.
Essential Research Tools and Reagents
Critical Reagents and Equipment for IEF-IPG and SDS-PAGE
Successful implementation of protein separation techniques requires specific reagents and equipment optimized for each methodology. The following table outlines essential components for both IEF-IPG and SDS-PAGE workflows:
Table 3: Essential research reagents and equipment for IEF-IPG and SDS-PAGE methodologies
| Category | Specific Reagents/Equipment | Function and Importance |
|---|---|---|
| IEF-IPG Specific | IPG strips (various pH ranges, lengths) | Provides immobilized pH gradient for first-dimension separation [2] |
| Carrier ampholytes | Enhances protein solubility and maintains pH gradient during focusing [2] | |
| Chaotropic agents (urea, thiourea) | Denatures proteins and improves solubility during IEF [3] [2] | |
| Zwitterionic detergents (CHAPS) | Solubilizes proteins without interfering with charge-based separation [3] | |
| Programmable IEF power supply | Provides precise voltage ramping for optimal protein focusing [2] | |
| SDS-PAGE Specific | Acrylamide/bis-acrylamide | Forms controllable pore size gel matrix for molecular sieving [9] [11] |
| SDS (sodium dodecyl sulfate) | Denatures proteins and confers uniform charge-to-mass ratio [10] [11] | |
| Reducing agents (DTT, β-mercaptoethanol) | Breaks disulfide bonds for complete protein unfolding [11] | |
| Tris-glycine-SDS buffer | Maintains appropriate pH and conductivity during electrophoresis [9] | |
| Vertical electrophoresis system | Provides chamber for gel electrophoresis with appropriate safety features [11] | |
| Shared Components | Protein molecular weight markers | Enables estimation of protein size (SDS-PAGE) and pI calibration (IEF) [9] |
| Staining reagents (Coomassie, silver, fluorescent dyes) | Visualizes separated proteins with varying sensitivity levels [11] | |
| Protein precipitation reagents (TCA/acetone) | Concentrates and cleans protein samples before separation [2] | |
| Protease and phosphatase inhibitors | Prevents protein degradation and preserves modification states [9] |
The comparative analysis of IEF-IPG and SDS-PAGE reveals that each technique offers distinct advantages and limitations for protein fractionation. IEF-IPG provides superior resolution for charge-based separations, making it ideal for detecting post-translational modifications, protein isoforms, and charge variants. Its exceptional focusing capability and high peptide detection rates enhance sensitivity for downstream mass spectrometric analysis. Conversely, SDS-PAGE offers rapid, straightforward molecular weight-based separation that is easily accessible to most laboratories and highly compatible with immunodetection methods like Western blotting.
The most powerful proteomic approaches frequently combine these orthogonal separation principles, either sequentially in 2-DE or through liquid-based fractionation techniques. For researchers studying complex biological systems where both protein expression levels and modification states are important, the complementary nature of IEF-IPG and SDS-PAGE makes them invaluable tools in the proteomics workflow. As technological advancements continue to address current limitations in resolution, reproducibility, and throughput, both techniques will remain fundamental components of the protein separation toolkit, each contributing unique capabilities to comprehensive proteome characterization.
In the landscape of proteomic research, protein fractionation techniques serve as fundamental pillars for analyzing complex biological samples. Among these, Sodium Dodecyl Sulfate Polyacrylamide Gel Electrophoresis (SDS-PAGE) stands as one of the most widely utilized methods for separating proteins by molecular weight. This technique operates alongside other powerful separation methods like Isoelectric Focusing using Immobilized pH Gradients (IEF-IPG), which separates proteins based on their isoelectric point (pI). The choice between these orthogonal techniques—mass-based separation with SDS-PAGE versus charge-based separation with IEF-IPG—significantly impacts protein identification efficiency, resolution, and dynamic range in proteomic profiling [3] [12].
This guide provides an objective comparison of SDS-PAGE and IEF-IPG for protein fractionation efficiency, presenting supporting experimental data to help researchers and drug development professionals select the optimal approach for their specific applications. We delve into the fundamental principles of SDS-PAGE, examine comparative performance metrics, and provide detailed methodologies to inform experimental design in both academic and industrial settings.
Fundamental Principles of SDS-PAGE
SDS-PAGE separates proteins primarily by their molecular weight through a sophisticated interplay of chemical denaturation and molecular sieving effects. The process relies on three key components working in concert: complete protein denaturation, uniform SDS binding, and size-based separation through a polyacrylamide gel matrix.
The ionic detergent sodium dodecyl sulfate (SDS) plays the central role in this technique. When protein samples are heated to 70-100°C in the presence of excess SDS and a reducing agent (such as DTT or β-mercaptoethanol), several transformative processes occur: disulfide bonds are reduced, tertiary and secondary structures are unfolded, and the polypeptide chains bind SDS in a constant weight ratio of approximately 1.4 g SDS per 1 g of polypeptide [13]. This SDS-binding masks the proteins' intrinsic charges, resulting in complexes that carry essentially identical negative charge densities. Consequently, when an electric field is applied, all proteins migrate toward the anode with mobility determined principally by polypeptide size rather than native charge or shape [13].
The polyacrylamide gel matrix creates a molecular sieve that regulates protein movement. The cross-linked polymer network presents frictional resistance that affects smaller proteins less than larger ones. The pore size of this network is controlled by the polyacrylamide percentage—lower percentages (e.g., 7-10%) create larger pores suitable for resolving high molecular weight proteins, while higher percentages (e.g., 12-20%) create smaller pores optimal for separating lower molecular weight proteins [13]. Gradient gels, which increase in polyacrylamide concentration from top to bottom, broaden the effective separation range by creating progressively smaller pores along the migration path.
SDS-PAGE Workflow: From Native Protein to Size-Based Separation
Comparative Analysis: SDS-PAGE Versus IEF-IPG
Performance Metrics and Experimental Data
Direct comparison of SDS-PAGE and IEF-IPG reveals distinct advantages and limitations for each technique. A comprehensive study evaluating common gel-based protein separation techniques found that while both methods provide complementary protein identification results, IEF-IPG demonstrated the highest average number of detected peptides per protein—a valuable feature for quantitative and structural characterization [3]. However, 1-D SDS-PAGE and IEF-IPG together yielded the highest total number of protein identifications, suggesting their orthogonal application maximizes profiling sensitivity without significant decrease in throughput [3].
Table 1: Comparative Performance of Gel-Based Protein Fractionation Techniques
| Performance Metric | SDS-PAGE | IEF-IPG | 2-D PAGE (IEF-IPG + SDS-PAGE) | Experimental Context |
|---|---|---|---|---|
| Protein Identifications | High | High | Complementary results | Mitochondrial extracts from rat liver, nanoLC-ESI-MS/MS analysis [3] |
| Average Peptides per Protein | Lower than IEF-IPG | Highest | Intermediate | Analysis of protein standards and mitochondrial extracts [3] |
| Resolution Basis | Molecular weight | Isoelectric point (pI) | Orthogonal (pI then MW) | Fundamental technique principle [12] [13] |
| Reproducibility | High | Moderate (IPG strips provide good reproducibility) | Gel-to-gel variability concerns | Commercial IPG strips improve reproducibility [3] [12] |
| Handling of Basic Proteins (pI >7) | Effective | Problematic (protein loss, poor reproducibility) | Poor for basic proteins in IPG-based 2DE | Broad range (pH 3-10) gradient comparison [4] |
| Handling of Acidic Proteins | Effective | Excellent | Good for acidic proteins | Narrow range (pH 4-7) IPG preferred for acidic proteins [4] |
| Protein Loading Capacity | High | Lower than SDS-PAGE | Higher in NEPHGE-based 2DE for basic proteins | Coomassie staining, 50-100 μg total protein load [4] |
Technical Challenges and Limitations
Each fractionation technique presents unique technical challenges that impact their application in proteomic studies. SDS-PAGE excels at separating proteins by size but provides no direct information about protein charge variants or post-translational modifications that alter pI without significantly affecting molecular weight [12].
IEF-IPG techniques face challenges with cathodic drift—the migration of focused proteins toward the cathode during separation—though this has been significantly addressed in modern systems. Recent microfluidic IEF research demonstrates that IPG-IEF reduces cathodic drift velocity approximately 24-fold compared to carrier ampholyte-based IEF (2.5 μm/min versus 60.1 μm/min), with mixed-bed IEF (combining IPG and CA technologies) achieving a 43-fold reduction (1.4 μm/min) [14].
For basic proteins (pI >7), IPG-based methods demonstrate notable limitations. A direct comparison of IPG and non-equilibrium pH gradient electrophoresis (NEPHGE) techniques found that IPG-based 2DE showed significantly higher protein loss, particularly for basic proteins, with approximately half of detected basic protein spots being irreproducible in IPG-based methods [4]. In contrast, NEPHGE-based methods demonstrated excellent reproducibility in the basic gel zone while maintaining good performance for acidic proteins [4].
Table 2: Technical Challenges and Modern Solutions
| Challenge | Impact on SDS-PAGE | Impact on IEF-IPG | Modern Solutions |
|---|---|---|---|
| Cathodic Drift | Not applicable | Significant issue in conventional IEF | IPG technology reduces drift 24-fold; mixed-bed IEF reduces 43-fold [14] |
| Basic Protein Separation | Effective | Problematic; poor reproducibility and protein loss | NEPHGE-based methods preferred for basic proteins [4] |
| Hydrophobic Proteins | Generally effective with adequate denaturation | Tendency to precipitate at pI | Optimization of detergents and solubilization protocols [3] |
| Extreme pI/MW Proteins | Limited resolution for very large/small proteins | Limited resolution at pH extremes | Narrow-range gradients improve resolution for specific pI windows [12] |
| Throughput and Automation | High throughput possible | Moderate throughput | Automated systems available for both techniques [3] [12] |
| Sample Loss | Moderate | Higher in IPG-based methods | Gel-free fractionation methods show improved recovery [3] |
Experimental Protocols and Methodologies
Detailed SDS-PAGE Protocol
The following protocol for denaturing SDS-PAGE has been adapted from established methodologies used in comparative studies [3] [13]:
Sample Preparation:
- Protein Extraction and Solubilization: Homogenize samples in appropriate lysis buffer (e.g., 63 mM Tris HCl, 10% glycerol, 2% SDS, pH 6.8). For complex tissues, use mechanical disruption combined with detergent-based extraction.
- Reduction and Alkylation: Add 5 mM tributyl phosphine (TBP) or 50 mM DTT and incubate at 37°C for 60-90 minutes to reduce disulfide bonds. Subsequently, alkylate with 10 mM acrylamide or 50 mM iodoacetamide for 30-60 minutes in the dark. Quench the alkylation reaction with excess DTT [3].
- Denaturation: Heat samples at 70-100°C for 5-10 minutes in sample buffer containing 2% SDS and 50 mM DTT to ensure complete denaturation and SDS binding [13].
- Centrifugation: Clarify samples by centrifugation at 10,000-15,000 × g for 10 minutes to remove insoluble debris.
Gel Preparation:
- Resolving Gel: Prepare an appropriate acrylamide percentage (typically 8-16% depending on target protein size range) in Tris-HCl buffer (pH 8.7) containing 0.1% SDS. For a 10% gel, mix 7.5 mL of 40% acrylamide solution, 3.9 mL of 1% bisacrylamide, 7.5 mL of 1.5 M Tris-HCl (pH 8.7), water to 30 mL, 0.3 mL of 10% APS, 0.3 mL of 10% SDS, and 0.03 mL TEMED [13]. Pour between plates and overlay with water-saturated isobutanol or water.
- Stacking Gel: After resolving gel polymerization, prepare stacking gel (4-5% acrylamide in Tris-HCl, pH 6.8) and pour over the resolving gel. Insert well comb immediately.
Electrophoresis:
- Assembly: Mount gel cassette in electrophoresis chamber and fill with running buffer (25 mM Tris, 192 mM glycine, 0.1% SDS, pH 8.3).
- Loading: Load 10-50 μg of protein per lane alongside appropriate molecular weight markers.
- Separation: Apply constant voltage (100-150 V for mini-gels) until dye front reaches the bottom of the gel (typically 60-90 minutes).
Post-Electrophoresis Analysis:
- Protein Detection: Stain with Coomassie Blue, silver stain, or fluorescent dyes according to sensitivity requirements.
- Protein Recovery: For mass spectrometry analysis, excise protein bands, destain, and subject to in-gel digestion with trypsin or other proteases [3].
- Western Blotting: For immunodetection, transfer proteins to PVDF or nitrocellulose membranes for antibody probing.
Critical Operational Parameters for Optimal SDS-PAGE
Several operational parameters significantly impact SDS-PAGE separation quality and reproducibility:
Temperature Control: Elevated temperatures during electrophoresis can cause band smiling effects and altered migration patterns. Maintaining consistent temperature (15-25°C) throughout the run improves band straightness and reproducibility [15].
Gel Concentration: The acrylamide percentage must be optimized for the target protein size range. Ferguson plot analysis demonstrates linear behavior in propidium iodide-containing SDS-CGE systems, indicating predictable sieving behavior with increasing dextran concentrations [15]. Lower percentage gels (8-10%) resolve high molecular weight proteins (50-200 kDa), while higher percentages (12-20%) better resolve lower molecular weight proteins (5-50 kDa).
Electric Field Strength: Increased electric field strength elevates electrophoretic mobilities but decreases resolution above optimal levels. Research shows resolution between consecutively migrating SDS-protein complexes decreases above 500 V/cm, likely due to conformation changes in SDS-protein-propidium adducts [15].
Essential Research Reagent Solutions
Table 3: Key Reagents for SDS-PAGE and IEF-IPG Fractionation
| Reagent/Category | Specific Examples | Function and Importance | Technical Considerations |
|---|---|---|---|
| Denaturing Agents | SDS, urea, thiourea | Disrupt protein structure and solubilize proteins | SDS provides uniform charge; urea/thiourea enhance solubilization of membrane proteins [3] |
| Reducing Agents | DTT, TBP, β-mercaptoethanol | Break disulfide bonds for complete unfolding | TBP (5 mM) more effective for stubborn disulfide bonds; DTT (50 mM) common for standard reduction [3] |
| Alkylating Agents | Acrylamide, iodoacetamide | Prevent reformation of disulfide bonds | Acrylamide (10 mM) alkylation followed by DTT quenching; iodoacetamide must be protected from light [3] |
| Buffers and Ampholytes | Tris-HCl, carrier ampholytes, Immobilines | Maintain pH and establish gradients | IPG technology uses covalently incorporated Immobilines for stable pH gradients [14] [12] |
| Gel Matrix Components | Acrylamide, bis-acrylamide, APS, TEMED | Form porous polyacrylamide network | Acrylamide:bis ratio affects pore size; APS/TEMED concentration controls polymerization rate [13] |
| Staining Dyes | Coomassie Blue, silver nitrate, propidium iodide | Visualize separated proteins | Propidium iodide enables fluorescent detection in SDS-CGE; Coomassie for general protein detection [15] [4] |
| Molecular Weight Markers | Prestained/unstained protein ladders | Size calibration and migration monitoring | Essential for mass determination; prestained markers allow visual tracking during electrophoresis [13] |
Application Workflows and Decision Framework
The choice between SDS-PAGE and IEF-IPG depends on specific research objectives, sample characteristics, and downstream applications. The following workflow diagram illustrates a decision framework for selecting the appropriate separation strategy:
Decision Framework for Protein Separation Strategies
SDS-PAGE remains a cornerstone technique in protein research, offering robust, reproducible separation based on molecular weight with relatively simple implementation. Its effectiveness stems from the fundamental principles of complete protein denaturation, uniform SDS binding, and molecular sieving through a tunable polyacrylamide matrix. When compared with IEF-IPG, each technique demonstrates distinct strengths—SDS-PAGE excels at molecular weight determination and handling basic proteins, while IEF-IPG provides superior resolution based on isoelectric point and higher peptides-per-protein ratios for mass spectrometry applications.
The most powerful proteomic approaches often combine these orthogonal techniques, either sequentially in two-dimensional electrophoresis or through parallel fractionation strategies. As evidenced by comparative studies, the combination of 1-D SDS-PAGE and IEF-IPG delivers enhanced profiling sensitivity without significant throughput compromise [3]. Understanding the principles, capabilities, and limitations of each method enables researchers to make informed decisions that optimize protein fractionation efficiency for their specific research goals in drug development and basic science applications.
Two-dimensional gel electrophoresis (2DE) remains one of the highest resolution techniques for the simultaneous analysis of thousands of intact proteins from complex biological samples [2]. The exceptional resolving power of 2DE stems from its combination of two orthogonal separation techniques: isoelectric focusing (IEF) and sodium dodecyl sulfate-polyacrylamide gel electrophoresis (SDS-PAGE). These methods separate proteins based on independent physicochemical properties—first by isoelectric point (pI) using IEF, then by molecular weight using SDS-PAGE—creating a two-dimensional map where each spot ideally represents a unique protein species [2]. This platform has proven particularly powerful for visualizing protein isoforms resulting from charged post-translational modifications, splice variants, and proteolytic cleavages that alter both molecular weight and isoelectric point [2].
The modern 2DE workflow has been significantly enhanced through the introduction of immobilized pH gradients (IPG) for the first dimension separation [2]. Unlike carrier ampholyte-based systems that formed pH gradients through the application of an electric field to amphoteric buffers, IPG technology incorporates the pH gradient directly into the polyacrylamide matrix during gel fabrication [4] [2]. This fundamental advancement has overcome several limitations of earlier 2DE methods, including gradient drift (particularly in the cathodal region), mechanical instability, and technical variation between runs and laboratories [2]. The IPG strip technology has greatly facilitated methodology and dramatically increased reproducibility both within a laboratory and across different research groups, establishing itself as the current method of choice for IEF in 2DE experiments [4] [2].
This comparison guide objectively evaluates the performance of IEF-IPG and SDS-PAGE as individual techniques and demonstrates how their synergistic combination in 2DE achieves maximum resolution for comprehensive proteomic analysis. We present experimental data comparing their efficiencies, detailed methodologies for implementation, and practical guidance for researchers seeking to optimize protein separation in drug development and basic research applications.
Performance Comparison: IEF-IPG vs. SDS-PAGE
Technical Principles and Separation Mechanisms
IEF-IPG separates proteins based exclusively on their isoelectric point—the pH at which a protein carries no net electrical charge [2]. In this technique, proteins are applied to a polyacrylamide gel containing an immobilized pH gradient and an electric field is applied. Proteins that are in a pH region below their pI become positively charged and migrate toward the cathode, while proteins in a pH region above their pI become negatively charged and migrate toward the anode [2]. As proteins approach their isoelectric point, their net charge decreases and migration slows, eventually focusing into sharp, concentrated bands at their respective pI values [2]. This focusing effect enables IEF to resolve proteins differing by as little as 0.01 pH units under optimal conditions [8]. Modern IPG strips are available in various lengths (7-24 cm) and pH ranges (broad range pH 3-11 to narrow range such as pH 4-5), allowing researchers to select optimal conditions for their protein groups of interest [2].
SDS-PAGE, in contrast, separates proteins primarily by molecular weight following their complete denaturation with sodium dodecyl sulfate [5]. The SDS detergent binds to proteins in a relatively constant ratio (approximately 1.4 g SDS per 1 g protein), imparting a uniform negative charge density that masks the proteins' intrinsic charge [5]. When an electric field is applied, the SDS-protein complexes migrate through the polyacrylamide gel matrix toward the anode, with smaller proteins moving more rapidly through the pores than larger ones [5]. The relationship between migration distance and molecular weight is logarithmic, enabling molecular weight estimation through comparison with protein standards [5]. Variations include reducing SDS-PAGE (using reducing agents like DTT or 2-mercaptoethanol to break disulfide bonds) and non-reducing SDS-PAGE (preserving quaternary structures), as well as gradient gels that provide better separation across wider molecular weight ranges [5] [8].
Comparative Performance Metrics
Experimental comparisons between these techniques reveal distinct performance characteristics and complementary strengths. A comprehensive study evaluating common gel-based protein separation techniques found that while 1-D SDS-PAGE and IEF-IPG both yielded high numbers of protein identifications, they provided complementary results in nanoLC-ESI-MS/MS analysis of protein standards and mitochondrial extracts [3]. The IEF-IPG technique demonstrated particular advantage in the average number of detected peptides per protein, which can significantly benefit quantitative and structural characterization of proteins in large-scale biomedical applications [3].
Table 1: Performance Comparison of IEF-IPG and SDS-PAGE Techniques
| Performance Metric | IEF-IPG | SDS-PAGE | Combined 2DE |
|---|---|---|---|
| Separation Basis | Isoelectric point (pI) | Molecular weight | pI and molecular weight |
| Theoretical Resolution | Can separate proteins differing by 0.01 pH units [8] | Limited for proteins with minimal molecular weight differences [8] | High resolution for complex mixtures |
| Reproducibility | High with commercial IPG strips [2] | Good with standardized protocols [5] | High with optimized protocols |
| Protein Capacity | ~50 μg to 5 mg depending on system [16] | Varies with gel format | Typically 200-500 μg per 2D gel [6] |
| Handling of Basic Proteins (pI >7) | Challenging; cathodal drift in some systems [4] | No limitation based on pI | Limited in basic range with standard IPG |
| Handling of High MW Proteins | Limited by gel pore size | Excellent, especially with gradient gels | Comprehensive coverage |
| Detection Sensitivity | High due to focusing effect [2] | Standard | Enhanced for low-abundance proteins |
When comparing IPG-based and non-equilibrium pH gradient electrophoresis (NEPHGE)-based 2DE techniques, research has demonstrated that IPG-based methods show higher protein loss, especially for basic (pI > 7) proteins [4]. Overall spot reproducibility was slightly better in NEPHGE-based methods, with a marked difference when evaluating basic and acidic protein spots [4]. Using Coomassie staining, approximately half of detected basic protein spots were not reproducible by IPG-based 2DE, whereas NEPHGE-based methods showed excellent reproducibility in the basic gel zone [4]. This highlights a significant limitation of standard IPG techniques for analyzing basic proteins, though narrow-range IPG strips can provide excellent resolution for acidic proteins [4].
Table 2: Limitations and Advantages of Each Technique
| Aspect | IEF-IPG | SDS-PAGE |
|---|---|---|
| Key Advantages | High resolution based on charge; Focusing effect concentrates proteins; Excellent for detecting PTMs that alter charge; High reproducibility with commercial strips [2] | Excellent molecular weight estimation; Robust and established protocol; Handles a wide MW range; Compatible with downstream applications like Western blotting [5] |
| Inherent Limitations | Poor performance for extreme pI proteins; Sample preparation critical; Requires careful destaining for MS analysis [3] [4] | No pI information; Limited resolution for similar MW proteins; Protein charge differences masked [8] |
| Technical Challenges | Cathodal drift in basic regions; Protein precipitation at pI; Ampholyte interference with MS [4] [16] | Protein aggregation; Incomplete denaturation; Gel-to-gel variability [5] |
| Optimal Application Range | Acidic to neutral proteins (pH 4-7); Detection of charge modifications; High-resolution fractionation [4] | Molecular weight determination; Purity assessment; Quantitative analysis of specific protein groups [5] |
Experimental Protocols for 2DE Implementation
Sample Preparation and Prefractionation
Proper sample preparation is critical for successful 2DE separations. Protein samples must be solubilized in buffers that maintain proteins in a denatured, reduced, and disaggregated state while compatible with IEF. A typical IEF sample buffer contains 7M urea, 2M thiourea, 4% CHAPS, a reducing agent (such as DTT or tributylphosphine), and carrier ampholytes [3] [17]. The use of thiourea in addition to urea has been shown to improve solubility of membrane proteins [17]. Protease inhibitors should be included to prevent protein degradation during sample processing [17]. Non-protein ionic contaminants must be minimized through precipitation or desalting steps as they interfere with IEF by reducing resolution and increasing focusing time [2].
For complex samples, prefractionation techniques can significantly enhance detection of low-abundance proteins. Methods include subcellular fractionation, chromatography-based separations, or solution-phase IEF using instruments such as the Agilent OFFGEL Fractionator or Bio-Rad Rotofor system [16]. The OFFGEL fractionator uses a novel approach where proteins are focused in an IPG strip sealed against a multichambered frame containing sample and focusing solutions; during separation, sample species migrate through the IPG gel and become focused according to their pI, then diffuse into adjacent wells for recovery [16]. This technique reduces the risk of protein precipitation during focusing and allows recovery of proteins in solution for downstream analysis [16].
First Dimension: IEF-IPG Protocol
The following protocol is optimized for analytical-scale 2DE using 18-24 cm IPG strips:
IPG Strip Rehydration: Commercially available dried IPG strips are rehydrated in a solution containing 7M urea, 2M thiourea, 2% CHAPS, 0.5% carrier ampholytes, 10-20 mM DTT, and a trace of bromophenol blue [3] [17]. Rehydration is typically performed for 10-12 hours at room temperature to ensure complete hydration of the gel matrix.
Sample Loading: Protein sample (typically 50-500 μg depending on strip length and detection method) is applied either during rehydration (rehydration loading) or via specialized cups after rehydration (cup loading). For basic pH gradients, cup loading at the anode may improve performance [2].
Isoelectric Focusing: IPG strips are placed in a focusing tray and electrodes positioned. Focusing is performed with a stepwise voltage program under controlled temperature (typically 20°C). A representative protocol for 18-cm pH 4-7 IPG strips includes: 1 hour at 500 V (step-and-hold), 1 hour at 1000 V (gradient), and 6-8 hours at 8000 V (gradient) until 40-60 kVh is reached [2]. The specific conditions must be optimized for different sample types and pH ranges.
Strip Storage: After IEF, strips can be stored at -80°C or processed immediately for the second dimension. Equilibration is performed before SDS-PAGE to facilitate protein transfer from the first to second dimension.
Second Dimension: SDS-PAGE Protocol
The focused IPG strip is equilibrated and applied to an SDS-PAGE gel for separation by molecular weight:
IPG Strip Equilibration: The focused IPG strip is equilibrated for 15-20 minutes in a buffer containing 6M urea, 2% SDS, 50 mM Tris-HCl (pH 8.8), 30% glycerol, and a reducing agent (e.g., 1% DTT) [17]. A second equilibration step with 2.5% iodoacetamide instead of DTT is performed to alkylate free thiols and prevent protein reoxidation during electrophoresis.
Gel Preparation: SDS-PAGE gels are typically cast with an acrylamide concentration gradient (e.g., 8-16% or 10-14% T) to optimize resolution across a wide molecular weight range [17]. For large-format 2DE, gels of 20×24 cm or larger provide superior resolution [17]. The use of low-fluorescence glass plates is recommended for subsequent fluorescent detection.
Transfer and Electrophoresis: The equilibrated IPG strip is placed on top of the SDS-PAGE gel and sealed with agarose overlay solution. Electrophoresis is performed at constant current or power with cooling to maintain temperature at 10-15°C. Running conditions for large-format gels might be 5 mA/gel for 1 hour followed by 15-20 mA/gel for 5-6 hours until the dye front reaches the bottom [17].
Protein Detection: Following electrophoresis, proteins are visualized using staining methods compatible with downstream mass spectrometry analysis. Common options include Coomassie Brilliant Blue, silver staining, SYPRO Ruby, or Deep Purple fluorescent stain [4]. The choice of stain involves trade-offs between sensitivity, dynamic range, and MS-compatibility.
Diagram 1: Comprehensive 2DE Workflow Integrating IEF-IPG and SDS-PAGE
Enhancing Resolution Through Synergistic Combination
Orthogonal Separation Mechanism
The exceptional resolution power of 2DE stems from the orthogonal separation principles of IEF-IPG and SDS-PAGE. While IEF-IPG separates proteins based on their intrinsic charge properties (isoelectric point), SDS-PAGE separates based primarily on molecular size. This orthogonal approach means that proteins with similar pI values but different molecular weights are resolved in the second dimension, while proteins with similar molecular weights but different pI values are separated in the first dimension [2]. The result is a two-dimensional protein map where thousands of distinct protein species can be resolved in a single analysis, far exceeding the capacity of either technique alone.
This orthogonality is particularly valuable for detecting post-translational modifications (PTMs) that alter protein charge states. Phosphorylation, for example, adds negative charge to proteins, causing horizontal strings of spots in the 2DE gel corresponding to different phosphorylation states of the same protein [2]. Similarly, other charged modifications such as sulfation or acetylation create characteristic spot patterns that can be identified and quantified. These PTM-induced charge alterations would be completely missed in conventional SDS-PAGE analysis alone, highlighting the unique value of the 2DE platform for comprehensive protein characterization.
Technical Optimization for Maximum Resolution
Several technical optimizations can enhance the synergy between IEF-IPG and SDS-PAGE:
pH Gradient Selection: Choosing appropriate IPG strip pH ranges significantly impacts resolution. Broad-range gradients (pH 3-10) provide an overview of the entire proteome, while narrow-range gradients (e.g., pH 4-7 or pH 5-6) dramatically improve resolution in regions of interest and enable detection of 2-3 times more protein spots in the selected area [2]. For basic proteins, specialized protocols including the use of hydroxyethyldisulfide (HED) can improve focusing in alkaline regions [2].
Gel Format and Size: Increasing separation distances in both dimensions improves resolution. Large-format gels (e.g., 24×20 cm) can resolve up to 5000 protein spots from complex samples like whole cell lysates, compared to 1000-1500 spots typically resolved in standard 12×14 cm gels [17]. The development of specialized gel tanks that accommodate full 40 cm tube gels for the first dimension and large-format SDS-PAGE gels for the second dimension has enabled higher resolution while avoiding the need to cut NEPHGE gels in half [17].
Sample Loading and Detection Compatibility: Optimizing protein load amounts for the specific detection method is crucial. Silver staining may require 50-100 μg total protein, while fluorescent stains like SYPRO Ruby work best with 200-500 μg loads. For preparative 2DE where spot excision and protein identification by mass spectrometry is planned, higher loads (1-2 mg) may be necessary, requiring careful optimization to maintain resolution while ensuring sufficient protein for downstream analysis [16].
Diagram 2: Orthogonal Separation Principle in 2DE
Research Toolkit: Essential Materials and Reagents
Successful implementation of high-resolution 2DE requires specific reagents and instrumentation optimized for protein separation. The following table details essential components for establishing a robust 2DE workflow:
Table 3: Essential Research Reagents and Equipment for 2DE
| Category | Specific Product/System | Key Features and Applications |
|---|---|---|
| IPG Strips | Immobiline DryStrips (GE Healthcare) | Precast IPG strips available in various lengths (7-24 cm) and pH ranges (broad pH 3-10 to narrow pH 4-5); Provide excellent reproducibility [2] |
| IEF Systems | Agilent 3100 OFFGEL Fractionator | Fractionates peptides or proteins in solution using IPG technology; Enables high-resolution prefractionation [18] [16] |
| IEF Systems | Bio-Rad Rotofor System | Liquid-phase IEF in a cylindrical focusing chamber; Suitable for preparative-scale fractionation [16] |
| IEF Systems | Invitrogen ZOOM IEF Fractionator | Uses ZOOM disks with covalently attached buffers of defined pH; Fractionates under denaturing conditions [16] |
| SDS-PAGE Systems | Large-format gel tanks (e.g., Bio-Rad, GE Healthcare) | Accommodates large gels (up to 40×30 cm) for high-resolution second dimension separation [17] |
| Chaotropes | Urea and Thiourea | Disrupt hydrogen bonding to solubilize proteins; Typically used as 7M urea + 2M thiourea mixtures [3] [17] |
| Detergents | CHAPS | Zwitterionic detergent effective at solubilizing membrane proteins without interfering with IEF [3] [17] |
| Reducing Agents | DTT, TBP, or DTT substitutes | Break disulfide bonds to ensure complete protein denaturation; Critical for accurate separation [3] [17] |
| Carrier Ampholytes | Various commercial blends (e.g., Servalyte, Pharmalyte) | Generate and stabilize pH gradients during IEF; Added to sample and rehydration solutions [17] [2] |
| Staining Reagents | SYPRO Ruby, Deep Purple, Coomassie | Detect proteins with varying sensitivity and MS-compatibility; Enable spot visualization and quantification [4] |
The synergistic combination of IEF-IPG and SDS-PAGE in two-dimensional gel electrophoresis represents a powerful platform for comprehensive protein separation that continues to offer unique advantages in proteomic research. While each technique has distinct strengths and limitations—with IEF-IPG excelling in charge-based separation and SDS-PAGE providing robust size-based resolution—their orthogonal combination enables resolution of thousands of protein species in a single analysis.
The strategic selection of IPG strip pH ranges, gel formats, and detection methods allows researchers to tailor 2DE workflows to specific biological questions. For drug development professionals, this technology provides a robust method for monitoring protein expression changes, detecting post-translational modifications, and validating therapeutic protein products. Despite the emergence of gel-free proteomic methods, 2DE remains uniquely capable of visualizing intact protein species and their modified forms, offering insights that complement bottom-up proteomic approaches.
As proteomic research continues to evolve toward analyzing increasingly complex samples and detecting subtle protein modifications, the synergy between IEF-IPG and SDS-PAGE in optimized 2DE workflows will remain an essential tool for researchers demanding maximum resolution in protein separation.
Practical Protocols: Implementing IEF-IPG and SDS-PAGE in Modern Proteomics Workflows
Within proteomic research, the efficient fractionation of complex protein samples is a critical step preceding mass spectrometry analysis, directly influencing profiling sensitivity and dynamic range. This guide details a standard protocol for isoelectric focusing using immobilized pH gradient (IEF-IPG) strips, a high-resolution gel-based technique that separates proteins based on their isoelectric point (pI). When framed within the broader methodology debate of IEF-IPG vs. SDS-PAGE for protein fractionation efficiency, a comparative study reveals that while 1-D SDS-PAGE and IEF-IPG both yield the highest number of protein identifications, the IEF-IPG technique specifically results in the highest average number of detected peptides per protein, a key metric for sensitive protein quantification and characterization [3]. This performance makes IEF-IPG an indispensable tool, either as a standalone fractionation method or as the first dimension in two-dimensional polyacrylamide gel electrophoresis (2D-PAGE), for researchers and drug development professionals seeking to deepen proteomic coverage.
Experimental Comparison: IEF-IPG vs. Alternative Fractionation Techniques
A direct comparison of common gel-based protein separation techniques demonstrates that each method offers complementary advantages. The following table summarizes key performance metrics from a controlled study using a mixture of protein standards and mitochondrial extracts [3].
Table 1: Comparative Performance of Gel-Based Protein Fractionation Techniques
| Fractionation Technique | Principle of Separation | Relative Number of Protein Identifications | Key Performance Characteristics |
|---|---|---|---|
| IEF-IPG | Isoelectric point (pI) | High | Highest average number of detected peptides per protein; excellent for quantitative and structural characterization. |
| 1-D SDS-PAGE | Molecular weight (MW) | High | Robust, common technique; effective for complex mixtures. |
| Preparative 1-D SDS-PAGE | Molecular weight (MW) | Moderate | Preparative scale; useful for larger sample loads. |
| 2-D PAGE | pI followed by MW | Lower | High resolution of individual protein species; lower total identifications but provides additional molecular data. |
Furthermore, when comparing first-dimension separation methods for 2D-PAGE, IEF-IPG shows distinct behavior compared to liquid-phase off-gel fractionation, particularly for challenging samples like membrane proteins.
Table 2: IEF-IPG vs. Off-Gel Fractionation for 2D-PAGE
| Parameter | IEF-IPG (IPG/SDS-PAGE) | Off-Gel Fractionation |
|---|---|---|
| Separation Medium | Immobilized pH gradient in a gel strip [19] | Liquid solution over an IPG gel strip [20] |
| Protein Recovery | In-gel, requires extraction | In liquid phase, direct recovery [20] |
| Resolution in Alkaline pH Range | Standard | Higher, improved resolution for alkaline proteins [20] |
| Identification of Transmembrane Proteins | Standard | ~10.3% higher identification rate [20] |
| Typical Runtime for First Dimension | Several hours (e.g., 6.5-26,000 Vh) [19] | Can be longer, up to 24 hours [20] |
Standard Step-by-Step IEF-IPG Protocol
Materials and Reagent Solutions
Table 3: Essential Research Reagent Solutions for IEF-IPG
| Item | Function & Key Characteristics |
|---|---|
| Commercial IPG Strips | Immobilized pH gradient gel strips for first-dimension separation; available in various pH ranges (e.g., 3-10, 4-7) [21]. |
| Sample Solubilization Buffer | Solubilizes proteins and prevents aggregation; typically contains chaotropes (7-8 M Urea, 2 M Thiourea) and zwitterionic detergents (2-4% CHAPS) [19]. |
| Reducing Agent | Breaks disulfide bonds; Dithiothreitol (DTT) is commonly used [21]. |
| Carrier Ampholytes | Small, soluble molecules that establish and stabilize the pH gradient in the IPG strip, aiding protein solubility [21]. |
| Rehydration Buffer | Solution used to passively rehydrate the dry IPG strip, often containing urea, CHAPS, carrier ampholytes, and DTT [19]. |
| Anode & Cathode Electrode Buffers | Low-conductivity solutions that complete the electrical circuit; specific compositions depend on IPG strip pH range [21]. |
| Equilibration Buffer | Prepares focused proteins for second-dimension SDS-PAGE; contains Tris-HCl, urea, glycerol, SDS, and DTT [19]. |
Detailed Protocol
The workflow for a standard IEF-IPG experiment, from sample preparation to the final focused strip ready for the second dimension, is outlined below.
Step 1: Protein Extraction and Solubilization
- Suspend the protein pellet in a solubilization buffer. A recommended and validated formulation is 7 M urea, 2 M thiourea, 4% (w/v) CHAPS, and 0.6% (w/v) carrier ampholytes [19].
- Briefly sonicate the sample and clarify by centrifugation (e.g., 5 min at 14,000 × g) to remove insoluble debris [19].
Step 2: Reduction and Alkylation
- Reduce the protein sample with a reagent such as 5 mM Tributylphosphine (TBP) or DTT at 37°C for 90 minutes [3].
- Alkylate the reduced cysteine residues by adding 10 mM acrylamide and incubating in the dark. Quench the reaction with an excess of DTT (e.g., 50 mM) [3]. Alternatively, alkylation can be performed after IEF focusing, during the strip equilibration step prior to SDS-PAGE [21].
Step 3: IPG Strip Rehydration
- Load the prepared protein sample (typically 200 µl for an 11 cm strip) by passive overnight rehydration onto a dry commercial IPG strip [19]. Ensure the sample is evenly distributed along the strip channel and that no air bubbles are trapped.
Step 4: Isoelectric Focusing Run
- Place the rehydrated IPG strip into the focusing instrument. For systems like the PROTEAN i12, an independent voltage and current control for each strip allows for optimized conditions [19].
- Apply a stepwise increasing voltage protocol to properly establish the pH gradient and drive proteins to their pI. An example protocol for an 11 cm IPG strip is:
- Step 1: 100 V for 1 hour (helps set up the pH gradient)
- Step 2: 200 V for 1 hour (drives proteins toward their pI)
- Step 3: 500 V for 30 minutes ("fine-focuses" or sharpens the protein bands) [21]
- The total focus time can be extended with a rapid protocol (e.g., 8,000 V, 50 µA, 26,000 Vh followed by a hold at 750 V) [19]. Using chilled running buffers is recommended to prevent overheating and gel damage [21].
Step 5: Strip Equilibration
- Following IEF, equilibrate the IPG strip to prepare it for the second-dimension SDS-PAGE. This involves incubating the strip in a buffer containing Tris-HCl, urea, glycerol, SDS, and a reducing agent like DTT [19]. This step denatures the proteins and introduces SDS for the subsequent molecular weight-based separation.
Discussion and Technical Considerations
Optimization of IEF Conditions
The quality of an IEF-IPG separation is highly dependent on sample composition and focusing parameters. Systematic optimization using a system that allows for independent control of individual strips has demonstrated that:
- The use of a urea-thiourea mixture (7 M urea, 2 M thiourea) over urea alone results in a higher spot count, particularly for high molecular weight and alkaline proteins [19].
- The detergent CHAPS (4%) provides sharper, more distinct spots compared to alternatives like C7BzO [19].
- Increasing the carrier ampholyte concentration from 0.2% to 0.6% improves spot sharpness and resolution [19].
Addressing Common Challenges
- Protein Solubility: For very hydrophobic proteins, such as membrane proteins, standard solubilization buffers may be insufficient. The addition of specific detergents in products like ZOOM 2D Protein Solubilizers can enhance solubilization [21].
- Cathodic Drift: In conventional IEF systems, the pH gradient at the basic end can degrade over time, limiting the resolution of proteins with a pI above ~8.5. This is due to the hydrolysis of acrylamide, which creates acidic groups that titrate the basic end of the gradient [21].
- Sample Load and Low-Abundance Proteins: Standard IEF-IPG gels typically handle 200-500 µg of protein, making the detection of low-abundance proteins difficult. Preparative-scale and emerging microfluidic free-flow IEF (FF-IEF) techniques are being developed to address this, allowing for higher sample loads and improved analysis of scarce proteins [6].
Sodium dodecyl sulfate-polyacrylamide gel electrophoresis (SDS-PAGE) is a foundational technique in molecular biology and biochemistry for separating proteins based on their molecular weight. Within the context of protein fractionation efficiency research, SDS-PAGE represents a powerful, denaturing one-dimensional separation method that is often compared with, and complemented by, orthogonal techniques such as isoelectric focusing with immobilized pH gradients (IEF-IPG). This guide provides a detailed standard protocol for denaturing SDS-PAGE and objectively compares its performance with IEF-IPG and other separation methodologies, supported by experimental data on their respective efficiencies in proteomic analysis.
The fundamental principle of SDS-PAGE relies on the anionic detergent SDS, which denatures proteins and confers a uniform negative charge density. This results in separation based almost entirely on polypeptide chain length during electrophoresis through a polyacrylamide gel matrix [22] [13]. While IEF-IPG separates proteins according to their isoelectric point (pI), SDS-PAGE provides orthogonal separation by molecular weight, making these techniques highly complementary rather than directly competitive [3] [2].
Detailed SDS-PAGE Protocol
Reagents and Equipment
Research Reagent Solutions
- Acrylamide/Bis-acrylamide (30%/0.8% w/v): Forms the cross-linked polyacrylamide gel matrix that acts as a molecular sieve. The ratio and concentration determine pore size [23] [13].
- SDS (Sodium Dodecyl Sulfate): Anionic detergent that denatures proteins and imparts a uniform negative charge, masking the protein's intrinsic charge [22] [24].
- Tris-HCl Buffers: Used at different pH values for resolving gel (pH 8.8) and stacking gel (pH 6.8) to establish the discontinuous buffer system essential for effective protein stacking and separation [23].
- Ammonium Persulfate (APS) and TEMED: Polymerization catalysts that initiate and accelerate the cross-linking of acrylamide monomers to form the gel matrix [23] [13].
- Sample Buffer (with reducing agent): Typically contains SDS, glycerol, a tracking dye (bromophenol blue), and a reducing agent like β-mercaptoethanol or DTT to break disulfide bonds [22] [23].
- Running Buffer (Tris-Glycine-SDS): Conducts current and maintains pH during electrophoresis while providing SDS to maintain protein denaturation [22] [23].
- Protein Molecular Weight Markers: A mixture of proteins of known molecular weights run alongside samples to enable estimation of protein sizes in experimental samples [22] [13].
Gel Preparation
The polyacrylamide gel consists of two distinct layers: a resolving (separating) gel where size-based separation occurs, and a stacking gel that concentrates all protein samples into a sharp starting band.
Resolving Gel Preparation:
- Choose an appropriate acrylamide percentage based on your target protein's molecular weight (see Table 1 for guidance) [23].
- Combine components in the order listed for the chosen percentage, adding TEMED last as it initiates polymerization immediately [23].
- Pipette the solution between assembled glass plates, leaving space for the stacking gel.
- Carefully overlay with water or isopropanol to create a flat interface and exclude oxygen, which inhibits polymerization.
- Allow to polymerize completely (20-30 minutes) [23].
Stacking Gel Preparation:
- Pour off the overlay liquid from the polymerized resolving gel.
- Prepare and pipette the stacking gel solution on top of the resolving gel.
- Immediately insert a clean comb without trapping air bubbles.
- Allow to polymerize for 20-30 minutes [23].
Table 1: Acrylamide Concentration Guide for Optimal Separation [23]
| Acrylamide Percentage | Effective Separation Range (Molecular Weight) |
|---|---|
| 7% | 50 kDa - 500 kDa |
| 10% | 20 kDa - 300 kDa |
| 12% | 10 kDa - 200 kDa |
| 15% | 3 kDa - 100 kDa |
Sample Preparation
- Dilution and Denaturation: Mix protein samples with an equal volume of 2X sample buffer. For pre-prepared lysates already in sample buffer, add β-mercaptoethanol to a final concentration of 0.55M (e.g., 1 µL BME per 25 µL lysate) [22].
- Heat Denaturation: Place samples in a heating block or water bath at 95°C for 5 minutes to ensure complete denaturation [22].
- Clarification: Centrifuge heated samples at high speed in a microcentrifuge for 3 minutes to pellet any insoluble debris [22].
Electrophoresis Procedure
- Assembly: Place the polymerized gel in a clean plastic electrophoresis chamber and attach to the corresponding gel holder [22].
- Buffer Addition: Fill the inner chamber (between gels) and the outer chamber with 1X SDS-PAGE running buffer [22].
- Sample Loading: Load clarified samples (typically 5-35 µL per lane) into wells using a microsyringe. Include appropriate molecular weight markers in at least one lane [22].
- Electrophoresis Run: Connect the chamber to a power supply and run at a constant voltage of 120-150 V. The run typically takes 45-90 minutes, ceasing when the dye front reaches the bottom of the gel [22] [23].
- Post-Electrophoresis Analysis: Following separation, proteins can be visualized through staining (e.g., Coomassie Brilliant Blue, silver stain), or the gel can be used for western blotting or further proteomic analysis [22] [13].
SDS-PAGE Experimental Workflow
Comparative Performance Data
Quantitative Comparison of Fractionation Techniques
Research directly comparing gel-based protein separation techniques has revealed distinct performance characteristics. A study evaluating 1-D SDS-PAGE, preparative 1-D SDS-PAGE, IEF-IPG, and 2-D PAGE found that while all techniques provided complementary identification results, 1-D SDS-PAGE and IEF-IPG yielded the highest number of protein identifications in nanoLC-ESI-MS/MS analysis of mitochondrial extracts [3]. The IEF-IPG technique additionally resulted in the highest average number of detected peptides per protein, which can be beneficial for quantitative and structural characterization [3].
Table 2: Performance Comparison of Gel-Based Protein Fractionation Techniques [3]
| Fractionation Technique | Separation Principle | Key Performance Characteristic | Limitations |
|---|---|---|---|
| 1-D SDS-PAGE | Molecular weight | High number of protein identifications; excellent resolution by size | Protein denaturation; limited to one separation parameter |
| IEF-IPG | Isoelectric point (pI) | Highest peptides per protein; superior charge-based resolution | Poor resolution for extreme pI proteins; requires destaining |
| 2-D PAGE | pI (1st dimension), MW (2nd dimension) | Unparalleled resolution of complex mixtures; detects protein isoforms | Technically challenging; low throughput; poor reproducibility |
Advantages and Limitations of SDS-PAGE
Key Advantages:
- High Resolution: Capable of distinguishing proteins with small molecular weight differences (as little as 2-5%) [24] [25].
- Excellent Reproducibility: Highly standardized procedures ensure consistent results across experiments [24].
- Broad Applicability: Effective for various protein types including soluble, membrane, and nuclear proteins [25].
- High Sensitivity: Can detect nanogram quantities of protein when combined with sensitive staining methods like silver stain or Coomassie Brilliant Blue [24] [25].
- Cost-Effectiveness: Requires relatively simple equipment and reagents compared to many advanced separation techniques [25].
Notable Limitations:
- Protein Denaturation: SDS treatment destroys native protein structure, precluding functional studies or analysis of non-covalently bound cofactors [24] [26].
- Limited Separation Parameters: Cannot distinguish proteins with identical molecular weights but different structures or functions [24].
- Quantitation Challenges: Staining intensity varies between proteins, making precise quantification difficult without specialized standards [25].
- Extreme MW Limitations: Less effective for separating very high or very low molecular weight proteins without protocol modifications [24].
Advanced Applications and Methodological Evolution
Complementary Nature of IEF-IPG and SDS-PAGE
The combination of IEF-IPG and SDS-PAGE forms the basis of two-dimensional gel electrophoresis (2D-PAGE), which provides the highest resolution of all separation techniques for intact proteins in a single analytical run [2]. In 2D-PAGE, proteins are first separated according to their native isoelectric point using IEF-IPG, followed by molecular weight separation using SDS-PAGE in the second dimension [2] [13]. This orthogonal approach can resolve thousands of protein species, making it invaluable for detecting protein isoforms resulting from post-translational modifications, splice variants, and proteolytic cleavages [2].
Technical Variations and Innovations
Native SDS-PAGE (NSDS-PAGE)
A significant methodological innovation addresses the denaturing limitation of traditional SDS-PAGE. Native SDS-PAGE (NSDS-PAGE) modifies standard conditions by removing SDS and EDTA from the sample buffer, omitting the heating step, and reducing SDS concentration in the running buffer. This approach retains enzymatic activity in seven of nine model enzymes tested, while standard SDS-PAGE denatured all nine. Notably, Zn²⁺ retention in proteomic samples increased from 26% to 98% when shifting from standard to NSDS-PAGE conditions [26].
Capillary Electrophoresis (CE-SDS)
Technological evolution has led to the development of capillary electrophoresis SDS (CE-SDS), which automates the separation process in narrow-bore capillaries. CE-SDS provides higher resolution, superior reproducibility, and quantitative precision compared to traditional slab gel SDS-PAGE while eliminating manual steps like gel casting and staining. This method is increasingly adopted in biopharmaceutical development for analytical characterization of therapeutic proteins [27].
SDS-PAGE remains an indispensable tool for molecular weight-based protein separation, offering high resolution, reproducibility, and sensitivity. When evaluated within the broader context of protein fractionation efficiency research, it demonstrates complementary performance with IEF-IPG, with the highest profiling sensitivity achieved through their orthogonal combination in 2D-PAGE or sequential fractionation approaches [3]. While emerging technologies like CE-SDS and modified native techniques address certain limitations, standard denaturing SDS-PAGE continues to serve as a fundamental methodology in proteomic research, quality control, and biopharmaceutical development.
The field of proteomics relies heavily on advanced separation techniques to unravel the complexity of biological samples. For decades, traditional gel-based methods such as two-dimensional polyacrylamide gel electrophoresis (2D-PAGE) have served as the cornerstone of protein separation, combining isoelectric focusing (IEF) with molecular weight separation via SDS-PAGE [28] [29]. While these techniques have proven invaluable, they face significant limitations including poor reproducibility, limited dynamic range, and challenges in recovering proteins for downstream analysis [3] [28]. The burgeoning demand for higher throughput, improved quantification, and better integration with mass spectrometry has driven the development of innovative liquid-phase and microfluidic approaches that overcome these constraints. This guide provides an objective comparison of these emerging techniques, focusing on their performance relative to traditional methods within the context of IEF-IPG versus SDS-PAGE for protein fractionation efficiency.
The fundamental shift from gel-based to liquid-phase systems represents a paradigm change in protein separation technology. Where traditional IEF in immobilized pH gradients (IPG) occurs within a polyacrylamide gel matrix, liquid-phase techniques perform separations in solution, enabling better recovery and automation [3]. Meanwhile, microfluidic implementations miniaturize these processes onto chip-based platforms, dramatically reducing analysis time and sample volume requirements [30]. Understanding the capabilities and limitations of these approaches is essential for researchers seeking to optimize their proteomic workflows for drug development and basic research applications.
Technical Comparison of Protein Separation Techniques
Fundamental Separation Principles
Traditional Gel-Based Techniques:
- IEF-IPG (Isoelectric Focusing in Immobilized pH Gradients): Separates proteins based on their isoelectric point (pI) using a stable pH gradient covalently incorporated into a gel strip [3]. Proteins migrate until they reach their pI and become neutral [29].
- SDS-PAGE (Sodium Dodecyl Sulphate Polyacrylamide Gel Electrophoresis): Separates proteins by molecular weight under denaturing conditions [3]. The SDS coating imparts a uniform negative charge, allowing separation based primarily on size [30].
- 2D-PAGE: Combines IEF-IPG (first dimension) with SDS-PAGE (second dimension) to separate proteins based on both pI and molecular weight [3] [28].
Liquid-Phase and Microfluidic Techniques:
- OFFGEL Electrophoresis: Utilizes IPG strips to create a pH gradient in solution, allowing proteins to focus according to their pI while remaining in solution for easy recovery [3].
- Free-Flow IEF (FF-IEF): Continuously separates proteins in a liquid stream flowing perpendicular to an electric field, enabling continuous fraction collection [3].
- Microfluidic IEF: Miniaturizes IEF onto chip-based devices with microchannels, integrating sample preparation, separation, and sometimes detection on a single platform [30].
Performance Metrics Comparison
Table 1: Comparative performance of protein separation techniques
| Technique | Separation Basis | Resolution | Sample Recovery | Throughput | Automation Potential |
|---|---|---|---|---|---|
| IEF-IPG | pI | High | Moderate | Low | Low |
| SDS-PAGE | Molecular Weight | Moderate | Low | Low | Low |
| 2D-PAGE | pI & MW | Very High | Low | Very Low | Very Low |
| OFFGEL IEF | pI | High | High | Medium | High |
| Free-Flow IEF | pI | Medium | High | High | High |
| Microfluidic IEF | pI | Medium-High | High | Very High | Very High |
Table 2: Analytical capabilities and practical considerations
| Technique | Analysis Time | Sample Volume | Detection Sensitivity | MS Compatibility | Hands-on Time |
|---|---|---|---|---|---|
| IEF-IPG | 4-24 hours [29] | 10-100 µL | Moderate | Moderate | High |
| SDS-PAGE | 1-4 hours [30] | 5-50 µL | Moderate | Moderate | High |
| 2D-PAGE | 24-48 hours | 10-100 µL | Moderate | Moderate | Very High |
| OFFGEL IEF | 3-24 hours | 5-50 µL | High | High | Medium |
| Free-Flow IEF | Minutes-hours | µL-mL range | High | High | Low |
| Microfluidic IEF | 1-30 minutes [30] | <1 µL | High | High | Low |
Experimental Data and Performance Benchmarks
Protein Identification Efficiency
Comparative studies have quantified the performance differences between traditional and emerging separation techniques. In a systematic evaluation of gel-based protein separation techniques for mass spectrometry-based proteomic profiling, IEF-IPG demonstrated superior performance in several key metrics compared to SDS-PAGE and 2D-PAGE approaches [3]. The research found that while 1D SDS-PAGE and IEF-IPG both yielded the highest number of protein identifications, IEF-IPG generated the highest average number of detected peptides per protein [3]. This enhanced peptide coverage is particularly valuable for quantitative and structural characterization of proteins in various large-scale biomedical applications.
The study utilized a mixture of protein standards and mitochondrial extracts isolated from rat liver, followed by nanoLC-ESI-MS/MS analysis [3]. The results demonstrated that all techniques provided complementary protein identification results, suggesting that orthogonal separation approaches can maximize proteome coverage. Specifically, the combination of orthogonal 1D SDS-PAGE and IEF-IPG showed potential for improved sensitivity of profiling without significant decrease in throughput [3]. This finding highlights the continued value of IEF-based separation while pointing toward the potential benefits of liquid-phase implementations.
Separation Efficiency and Time Analysis
Microfluidic IEF systems demonstrate remarkable improvements in analysis speed compared to traditional methods. While conventional SDS-PAGE requires 30-240 minutes for separation alone, plus additional hours for staining and destaining, microfluidic implementations can complete entire analyses in 1-3 minutes [30]. This dramatic reduction in analysis time enables rapid experimental iteration and high-throughput screening applications that are impractical with traditional gel-based methods.
The miniaturization inherent in microfluidic systems also drastically reduces sample and reagent requirements. Whereas traditional techniques require relatively large volumes of buffers and solvents, microfluidic IEF typically needs less than 0.5 mL total volume per chip, including sample (generally maximum 10 μL) and reagents [30]. This reduction in consumables not only lowers costs but also minimizes waste generation and environmental impact.
Diagram 1: IEF Technique Workflow Comparison
Detailed Experimental Protocols
OFFGEL IEF Fractionation Methodology
Sample Preparation:
- Protein extracts should be cleaned up and concentrated using 10 kDa molecular weight cut-off (MWCO) filters [3]. For mitochondrial extracts or similar complex samples, homogenize and lyse in IEF buffer (7M urea, 2M thiourea, 4% CHAPS) [3].
- Reduce and alkylate proteins with 5 mM TBP (tributylphosphine) and 10 mM acrylamide in 25 mM ammonium bicarbonate, pH 8.0 at 37°C for 90 minutes [3].
- Quench the alkylation reaction by adding 50 mM DTT (dithiothreitol) [3].
- Adjust sample conductivity to ≤300 μS/cm through several steps of centrifugal ultrafiltration with IEF buffer using 10 kDa MWCO filters at 9,000 RCF [3].
OFFGEL Fractionation:
- Dilute the prepared sample in OFFGEL stock solution appropriate for the desired pH range.
- Load sample into the OFFGEL fractionator wells according to manufacturer's instructions.
- Perform focusing at 20°C with maximum current of 50 μA and power of 200 mW until 50 kVh is reached (typically 12-24 hours).
- Recover fractions from each well and acidify for storage or proceed directly to MS analysis.
Microfluidic IEF Protocol
Chip Preparation:
- Prime microfluidic channels with gel-dye mixture under pressure, which serves as both sieving matrix and staining solution [30].
- Load destaining solutions into appropriate reservoirs.
- Pipette marker solution onto designated chip wells for migration reference.
Sample Processing:
- Denature samples at high temperature in SDS-containing buffer to coat proteins with negative charge [30].
- Aspirate samples through capillary sipper by vacuum into microfluidic channels.
- Dilute samples with marker solution for reference during migration time determination and relative concentration calculation.
Separation and Detection:
- Apply voltage to initiate electrophoretic separation (typically 1-3 minutes) [30].
- Perform destaining electrokinetically using SDS-free ions flowing into separation channel.
- Detect separated protein bands downstream via laser-induced fluorescence [30].
Applications in Proteomic Research and Drug Development
Biomarker Discovery and Validation
The enhanced resolution and recovery offered by liquid-phase IEF techniques make them particularly valuable for biomarker discovery pipelines in pharmaceutical development. OFFGEL electrophoresis enables efficient fractionation of complex biological fluids like serum, urine, or cerebrospinal fluid prior to mass spectrometry analysis. The high peptide-to-protein ratios achieved with IEF-IPG (as demonstrated in comparative studies) facilitate more confident protein identifications and improved quantification of low-abundance regulatory proteins that may serve as disease biomarkers or therapeutic targets [3].
In cancer proteomics, the ability to resolve post-translationally modified protein isoforms using OFFGEL IEF provides insights into disease mechanisms and potential intervention points. The compatibility of liquid-phase fractions with multiple downstream analytical platforms allows researchers to integrate protein separation with various detection methods, creating robust workflows for verifying candidate biomarkers across sample cohorts.
Quality Control in Biopharmaceutical Production
Microfluidic IEF systems offer rapid analysis of protein therapeutic products, making them ideal for quality control applications in biomanufacturing. The capability to complete analyses in minutes instead of hours enables real-time monitoring of production processes and faster release testing [30]. The minimal sample requirements are particularly advantageous when characterizing precious products available only in limited quantities during early development stages.
The implementation of microfluidic protein analysis in food science for detecting allergens and assessing protein quality [30] demonstrates applications directly transferable to biopharmaceutical contexts. Similar approaches can monitor product consistency, detect degradation variants, and identify contaminants in recombinant protein therapeutics, vaccines, and other biologic products throughout their development and manufacturing lifecycle.
The Scientist's Toolkit: Essential Research Reagents and Materials
Table 3: Key reagents and materials for liquid-phase and microfluidic IEF
| Item | Function | Application Notes |
|---|---|---|
| IPG Strips | Establish stable pH gradient | Available in various pH ranges (narrow/broad) for different resolutions [3] |
| IEF Buffer (7M urea, 2M thiourea, 4% CHAPS) | Protein solubilization | Maintains protein solubility during IEF; chaotropic agents denature proteins [3] |
| Reducing Agent (TBP or DTT) | Break protein disulfide bonds | Essential for complete denaturation; TBP preferred for IEF compatibility [3] |
| Alkylating Agent (Acrylamide) | Cysteine modification | Prevents reformation of disulfide bonds after reduction [3] |
| SDS Solution | Protein denaturation & charge uniformity | Coats proteins with negative charge for separation [30] |
| Microfluidic Chips | Miniaturized separation platform | Integrated channels and wells; some specialized for specific applications [30] |
| Sieving Polymers | Molecular separation matrix | Replaces traditional polyacrylamide gels in microfluidic systems [30] |
| Fluorescent Dyes | Protein detection | Binds SDS-protein complexes; fluorescent in hydrophobic environments [30] |
Diagram 2: IEF Technique Selection Guide
The comparative analysis of liquid-phase and microfluidic IEF techniques against traditional gel-based methods reveals a complex landscape where each approach offers distinct advantages. OFFGEL IEF provides superior recovery and resolution for in-depth proteomic characterization, while microfluidic implementations excel in applications requiring rapid analysis and minimal sample consumption [3] [30]. Free-flow IEF offers unique capabilities for continuous processing and preparative-scale separations.
For researchers framing their work within the IEF-IPG versus SDS-PAGE efficiency debate, the evidence suggests that IEF-based separation fundamentally enables higher peptide coverage per protein, which translates to more confident identifications and better characterization of post-translational modifications [3]. The migration toward liquid-phase and microfluidic implementations of IEF addresses key limitations of traditional gel-based IEF while preserving these fundamental advantages.
Selection of the optimal technique should be guided by specific research objectives, sample characteristics, and practical constraints. For discovery-phase proteomics with abundant sample material, OFFGEL IEF may provide the ideal balance of resolution and recovery. For quality control applications or sample-limited studies, microfluidic approaches offer compelling advantages. As these technologies continue to mature, their integration into streamlined workflows will undoubtedly enhance proteomic research and accelerate therapeutic development.
The deep analysis of proteins—encompassing the comprehensive characterization of proteoforms, post-translational modifications (PTMs), and the discovery of disease biomarkers—is a cornerstone of modern biological research and therapeutic development [31]. The term "proteoform" describes all the different molecular forms in which the protein product of a single gene can be found, including those arising from genetic variation, alternative splicing, and PTMs [31]. The human proteome is estimated to encompass over 1 million proteins, vastly exceeding the 20,000-25,000 protein-encoding genes, primarily due to PTMs and alternative splicing [32]. This complexity presents a significant analytical challenge, making protein fractionation an indispensable first step to reduce sample complexity and enable the identification of low-abundance species [3].
Within this field, a central methodological consideration is the choice of fractionation technique. Isoelectric focusing using immobilized pH gradients (IEF-IPG) and sodium dodecyl sulfate-polyacrylamide gel electrophoresis (SDS-PAGE) represent two orthogonal approaches based on different physicochemical properties. This guide objectively compares the performance of these two techniques within the critical application areas of proteoform resolution, PTM analysis, and biomarker discovery, providing researchers with the experimental data and protocols necessary to inform their methodological selections.
Fundamental Techniques: IEF-IPG vs. SDS-PAGE
The resolving power of IEF-IPG and SDS-PAGE stems from their separation principles. IEF-IPG separates proteins based on their isoelectric point (pI), the pH at which a protein carries no net electrical charge. Proteins are focused into sharp bands within a stable, immobilized pH gradient until they reach their specific pI [3] [16]. In contrast, SDS-PAGE separates proteins primarily by their molecular weight (MW). The anionic detergent SDS coats proteins, giving them a uniform negative charge-to-mass ratio, causing them to migrate through a polyacrylamide gel matrix at rates inversely proportional to their logarithm of molecular weight [3]. This fundamental difference dictates their performance in resolving complex protein mixtures and their respective suitability for different downstream applications.
The following workflow diagrams illustrate the standard experimental procedures for GeLC-MS/MS (incorporating SDS-PAGE) and a typical IEF-IPG fractionation, highlighting key differences in sample handling and fraction collection.
Comparative Performance Analysis
A direct comparison of IEF-IPG and SDS-PAGE reveals distinct and complementary strengths. A study evaluating common gel-based protein separation techniques for nanoLC-ESI-MS/MS analysis found that while all provided complementary identifications, 1-D SDS-PAGE and IEF-IPG yielded the highest number of protein identifications [3]. The same study highlighted that the IEF-IPG technique resulted in the highest average number of detected peptides per protein, a key factor for achieving high sequence coverage which is essential for confident protein characterization and PTM localization [3].
Quantitative Performance Metrics
The table below summarizes key performance metrics from comparative studies, providing a data-driven basis for technique selection.
Table 1: Comparative Performance of IEF-IPG and SDS-PAGE in Proteomic Analyses
| Performance Metric | IEF-IPG | SDS-PAGE (GeLC-MS/MS) | Experimental Context |
|---|---|---|---|
| Protein Identifications | Highest (with 1-D SDS-PAGE) [3] | Highest (with IEF-IPG) [3] | Analysis of mitochondrial extracts from rat liver [3] |
| Peptides per Protein | Highest average number [3] | Lower than IEF-IPG [3] | Analysis of mitochondrial extracts from rat liver [3] |
| Separation Principle | Isoelectric point (pI) [3] [16] | Molecular Weight (MW) [3] | Fundamental technique principle |
| Typical Recovery Format | In-solution (e.g., OFFGEL) [18] [16] | In-gel (requires extraction) [3] | Common workflow practice |
| Compatibility with Hydrophobic Proteins | Challenging [3] | Standard | Handling of proteins with extreme properties [3] |
| Relative Sample Loss | Lower (in-solution recovery) [3] | Higher (in-gel digestion & extraction) [3] | Sample loss at each fractionation stage [3] |
Application Spotlights
Proteoform Resolution
The ability to distinguish proteoforms is critical because different proteoforms derived from a single protein can have distinct, even opposing, biological activities [33]. For example, in a comparison of metastatic and non-metastatic colorectal cancer cell lines, different proteoforms of the same protein were found to have opposing abundance changes, a phenomenon completely obscured by measuring overall protein-level abundance [33]. Similarly, in drug response studies, specific proteoforms of a protein can interact with a therapeutic agent while others do not, highlighting the necessity of proteoform-resolved data for understanding drug mechanisms [33].
In this context, IEF-IPG holds a distinct advantage due to its ability to separate protein species based on subtle charge differences introduced by PTMs. Phosphorylation, deamidation, and other common modifications alter a protein's pI, allowing IEF-IPG to resolve modified and unmodified proteoforms. Top-down nanoproteomics strategies, which analyze intact proteins, often couple with IEF-IPG prefractionation to manage sample complexity and enable comprehensive proteoform mapping of low-abundance proteins directly from serum [34].
Post-Translational Modification (PTM) Analysis
PTMs such as phosphorylation, glycosylation, and ubiquitination are fundamental regulators of protein function, and their analysis is a key application for protein fractionation techniques [35] [32]. Mass spectrometry is the premier tool for PTM analysis, but the low stoichiometry of many modifications necessitates enrichment or fractionation prior to MS analysis [35]. The choice of fractionation method significantly impacts PTM detection yields.
IEF-IPG is particularly powerful for PTM analysis because many PTMs alter the protein's isoelectric point. For instance, the addition of a phosphoryl group significantly shifts a protein's pI, allowing IEF to resolve phosphorylated proteoforms. The high average number of peptides detected per protein with IEF-IPG, as noted in the comparative study, directly translates to improved sequence coverage and higher confidence in PTM site localization [3] [35]. Furthermore, peptide-based IEF, such as OFFGEL electrophoresis, can be used after digestion to fractionate peptides, effectively reducing sample complexity and increasing the dynamic range for detecting low-abundance modified peptides [18].
Biomarker Discovery
The discovery of clinically viable biomarkers requires the sensitive and reproducible detection of proteins across a wide dynamic range, often directly from complex biofluids like blood or serum [31] [34]. The blood proteome presents an exceptional challenge, with a dynamic range of over 10¹², requiring high-resolution fractionation to detect low-abundance candidate biomarkers [34].
Both IEF-IPG and SDS-PAGE are used in biomarker discovery pipelines. The complementary identification results they provide suggest that an orthogonal combination of both techniques can yield the highest profiling sensitivity and dynamic range [3]. For instance, IEF-IPG can be used to deplete highly abundant proteins like albumin, while subsequent SDS-PAGE can further fractionate the sample by size. This orthogonal approach was shown to be beneficial for the analysis of cardiac troponin I (cTnI), a low-abundance cardiac biomarker existing in myriad modified proteoforms, where a combination of strategies was needed for its comprehensive analysis [34].
Detailed Experimental Protocols
To ensure reproducibility and provide a clear basis for comparison, detailed methodologies for key experiments are provided below.
Protocol: IEF-IPG Fractionation using an OFFGEL System
This protocol is adapted from the use of the Agilent OFFGEL Fractionator for protein-level fractionation [16].
- IPG Strip Rehydration: Place the IPG strip (e.g., pH 3-10) into the tray trough. Rehydrate the strip for 15 minutes with a solution containing 7M urea, 2M thiourea, a reducing agent (e.g., DTT), glycerol, and carrier ampholytes.
- Sample Preparation: Dilute the protein sample (50 µg to 5 mg total load) 1:5 with the rehydration solution. The salt concentration should not exceed 10 mM. Centrifugal ultrafiltration with 10 kDa MWCO filters can be used for buffer exchange and desalting [3].
- Sample Loading: Add 150 µL of the prepared sample to each well of the frame.
- Isoelectric Focusing: Place wetted electrode contact pads at each end of the strip, cover with mineral oil to prevent evaporation, and begin focusing. Typical focusing methods employ a stepwise or gradient voltage, reaching a maximum of 4000-8000 V, over 12-24 hours. The platform should be Peltier-cooled to manage Joule heating.
- Fraction Recovery: Upon completion, the focused protein fractions are recovered from each well by pipette for downstream analysis, such as in-solution tryptic digestion and LC-MS/MS.
Protocol: GeLC-MS/MS using 1-D SDS-PAGE
This protocol describes the standard GeLC-MS/MS workflow for protein fractionation [3].
- Sample Preparation: Dilute the protein sample in SDS-PAGE sample buffer (e.g., 63 mM Tris HCl, 2% SDS, 10% glycerol, 0.0025% bromophenol blue, pH 6.8) supplemented with 50 mM DTT or other reducing agent.
- Gel Electrophoresis: Load the sample onto a criterion SDS-PAGE gel (e.g., 8-16% gradient) and run at constant voltage until the dye front approaches the bottom.
- In-Gel Digestion:
- Staining & Destaining: After electrophoresis, stain the gel with a compatible stain (e.g., Coomassie, SYPRO Ruby) to visualize protein bands. Destain as required.
- Band Excision: Manually excise the entire protein lane into multiple fractions (bands) based on molecular weight.
- Digestion: For each gel band, dice into small pieces, destain, reduce with DTT, alkylate with iodoacetamide, and digest with trypsin (typically 12-16 hours at 37°C).
- Peptide Extraction: Extract peptides from the gel pieces using a series of washes with acetonitrile and an aqueous buffer (e.g., 50 mM ammonium bicarbonate). Pool and dry the extracts.
- LC-MS/MS Analysis: Reconstitute the peptide digests from each gel fraction and analyze sequentially by nanoLC-ESI-MS/MS.
The Scientist's Toolkit: Essential Research Reagents
Successful execution of these fractionation techniques requires a set of key reagents and instruments. The following table details essential items for the workflows described in this guide.
Table 2: Key Research Reagent Solutions for Protein Fractionation
| Item | Function/Description | Example Application |
|---|---|---|
| IPG Strips | Immobilized pH Gradient strips create a stable pH gradient for IEF. Available in various pH ranges (broad e.g., 3-10, narrow e.g., 4-7) and lengths. | Core separation medium for IEF-IPG fractionation [3] [16]. |
| Carrier Ampholytes | Small, soluble molecules that form and stabilize the pH gradient in solution during IEF. | Added to sample and rehydration solutions for OFFGEL and Rotofor IEF [16]. |
| Urea & Thiourea | Chaotropic agents used in denaturing lysis and rehydration buffers to solubilize proteins and prevent aggregation. | Standard components of IEF sample buffers (e.g., 7 M urea, 2 M thiourea) [3] [16]. |
| CHAPS | A zwitterionic detergent used for protein solubilization, particularly of membrane proteins. | Common component of IEF-compatible lysis buffers (e.g., 4% CHAPS) [3]. |
| Trypsin (Protease) | Enzyme that cleaves peptide chains at the carboxyl side of lysine and arginine residues for bottom-up proteomics. | In-solution or in-gel digestion of protein fractions prior to LC-MS/MS [3] [35]. |
| Criterion SDS-PAGE Gels | Pre-cast polyacrylamide gels for molecular weight-based separation of proteins. | Protein fractionation in the GeLC-MS/MS workflow [3]. |
| Polyvinyl Alcohol (PVA) | A dynamic coating used in microfluidic devices to suppress electroosmotic flow and minimize peak broadening. | Used in microfluidic free-flow IEF devices to improve resolution [6]. |
Integrated Workflow and Pathway Diagram
The following diagram synthesizes the core concepts discussed in this guide, illustrating how IEF-IPG and SDS-PAGE serve as complementary, orthogonal techniques that feed into major application pipelines in modern proteomics.
The comparative analysis presented in this guide demonstrates that both IEF-IPG and SDS-PAGE are powerful yet distinct tools for protein fractionation. The choice between them is not a matter of which is universally superior, but which is most fit-for-purpose based on the specific research goals.
IEF-IPG fractionation excels in applications requiring high resolution based on isoelectric point, making it the preferred initial choice for in-depth PTM analysis and proteoform resolution, where subtle charge differences are paramount. Its in-solution recovery format and high peptide-to-protein yield are significant advantages. Conversely, SDS-PAGE (GeLC-MS/MS) provides robust fractionation by molecular weight and is highly effective for general proteomic profiling and handling hydrophobic proteins.
Critically, the data shows that these techniques are highly orthogonal and complementary [3]. For the most challenging analytical problems, such as mapping the entire proteoform landscape of a low-abundance biomarker in serum, a sequential or combined use of IEF-IPG and SDS-PAGE may unlock the highest sensitivity and coverage, paving the way for discoveries in basic biology and clinical translation.
Solving Common Challenges: Optimization Strategies for Enhanced Fractionation Efficiency
The efficacy of any protein separation technique is fundamentally constrained by the initial steps of sample preparation. For research focused on protein fractionation efficiency, the choice between isoelectric focusing with immobilized pH gradients (IEF-IPG) and sodium dodecyl sulfate–polyacrylamide gel electrophoresis (SDS-PAGE) dictates specific and often divergent sample preparation requirements. Both techniques aim to resolve complex protein mixtures, but they operate on distinct separation principles: IEF-IPG separates proteins based on their isoelectric point (pI) in a native or semi-native state, while SDS-PAGE separates denatured proteins primarily by molecular weight. The integrity of this initial separation has direct implications for downstream analyses, including mass spectrometry identification, protein quantification, and functional assays. Sample preparation must therefore navigate critical challenges including maintaining protein solubility, ensuring complete reduction and alkylation, and removing interfering compounds—all while preserving the analytical goals of the research. Failure to optimize these parameters systematically introduces artifacts, reduces resolution, and compromises reproducibility, ultimately undermining the comparative assessment of fractionation efficiency. This guide objectively compares the sample preparation protocols essential for IEF-IPG and SDS-PAGE, providing researchers with the experimental data and methodologies needed to make informed decisions for their protein fractionation workflows.
Core Separation Principles and Technical Specifications
Understanding the fundamental mechanisms of IEF-IPG and SDS-PAGE is essential for appreciating their contrasting sample preparation demands. The following table summarizes their core operational principles and technical characteristics.
Table 1: Fundamental Principles of IEF-IPG and SDS-PAGE
| Feature | IEF-IPG (Isoelectric Focusing) | SDS-PAGE (Denaturing Gel Electrophoresis) |
|---|---|---|
| Primary Separation Principle | Isoelectric point (pI) | Molecular weight (apparent) |
| Basis of Separation | Net protein charge | Protein-SDS complex size/charge |
| Typical pH Gradient | Immobilized linear/non-linear gradients (e.g., pH 3-10, 4-7, 5-8) [12] | Single, discontinuous pH (e.g., Tris-based buffers) |
| Protein State | Native or semi-native; aims to preserve charge | Denatured and reduced; charge masked by SDS |
| Key Resolving Power | High resolution for charge variants (e.g., PTMs like phosphorylation) [2] | High resolution by size; poor for charge variants |
| Common Format | IPG strips (7-24 cm length) [2] | Polyacrylamide slab gels |
| Primary Application | First dimension in 2D-PAGE; analysis of charge heterogeneity | Second dimension in 2D-PAGE; molecular weight estimation |
The relationship between these techniques is epitomized in two-dimensional gel electrophoresis (2-DE), where IEF-IPG serves as the first dimension and SDS-PAGE as the second. The success of this powerful combination is entirely dependent on sample preparation that is compatible with both separation mechanisms [2] [36].
Diagram 1: The central role of sample preparation in determining downstream analytical success in protein fractionation.
Comparative Performance Data and Technical Challenges
The performance of IEF-IPG and SDS-PAGE is highly dependent on the quality of sample preparation. The table below summarizes key performance metrics and the specific challenges associated with each technique.
Table 2: Performance Comparison and Technical Challenges
| Performance Metric | IEF-IPG | SDS-PAGE |
|---|---|---|
| Typical Protein Load Capacity | 200-500 µg (for analytical 2D gels) [6] | 1-50 µg (for Western blot) [37] |
| Resolution Capability | Can separate isoforms with pI differences of ~0.01 pH units [2] | Can separate proteins with MW differences of ~2-5% |
| Reproducibility | High with commercial IPG strips [2] | High with standardized protocols |
| Compatibility with Hydrophobic Proteins | Low; prone to precipitation at pI [12] | High due to denaturation by SDS |
| Detection of Low-Abundance Proteins | Challenging; requires high loads and fractionation [36] [6] | Moderate; improved with sensitive stains |
| Primary Technical Challenge | Protein precipitation during IEF; cathodic drift (in carrier ampholyte systems) [12] | Incomplete denaturation; protein aggregation |
| Key Interfering Substances | High salts, ionic detergents, nucleic acids [2] [38] | Incompatible detergents (e.g., NP-40, Triton) [37] |
A significant challenge specific to IEF-IPG is the precipitation of proteins at their isoelectric point, particularly for hydrophobic or membrane proteins [12]. This issue is less pronounced in SDS-PAGE due to the uniform negative charge conferred by SDS binding. However, SDS-PAGE faces its own limitations, primarily the destruction of native protein structure and function, which prevents subsequent analyses of enzymatic activity or protein-protein interactions [26].
Detailed Experimental Protocols for Optimal Preparation
Protocol for IEF-IPG Compatible Samples
This protocol is optimized for soluble proteins from tissues, adapted from successful applications in chicken bursa of Fabricius and lupine roots [38] [39].
Reagents Required:
- Lysis Buffer: 7 M Urea, 2 M Thiourea, 2% (w/v) CHAPS, 50 mM DTT, 0.2% Bio-Lyte 3/10 carrier ampholytes [39]
- Protease Inhibitors: 1 mM PMSF (phenylmethylsulfonyl fluoride) [38] [39]
- Nuclease Cocktail: 20 U/mL DNase I, 0.25 mg/mL RNase A [39]
- Precipitation Solution: 10% TCA in acetone with 0.07% β-mercaptoethanol [38]
- Rehydration Buffer: 8 M Urea, 2% CHAPS, 15 mM DTT, 0.5% carrier ampholytes [2]
Step-by-Step Procedure:
- Homogenization: Grind 100 mg of frozen tissue in liquid nitrogen to a fine powder using a pre-chilled mortar and pestle.
- Protein Extraction: Transfer powder to a microcentrifuge tube containing 1 mL of Lysis Buffer with protease inhibitors. Vortex vigorously for 1 minute, then sonicate on ice with three 10-second pulses at 30% amplitude, with 30-second cooling intervals between pulses [39].
- Contaminant Removal: Centrifuge at 15,000 × g for 20 minutes at 4°C. Transfer the supernatant to a new tube. For tissues high in phenolics or carbohydrates, perform TCA/acetone precipitation: add 4 volumes of cold precipitation solution to the supernatant, incubate at -20°C for 1 hour, then centrifuge at 15,000 × g for 15 minutes [38].
- Protein Pellet Washing: Wash the pellet twice with cold acetone containing 0.07% β-mercaptoethanol, then air-dry for 5-10 minutes [38].
- Solubilization: Resuspend the dried pellet in appropriate Rehydration Buffer. For difficult proteins, extend solubilization with gentle rocking for 2 hours at room temperature.
- Clean-up and Quantification: Perform a final centrifugation at 15,000 × g for 10 minutes to remove any insoluble material. Quantify protein using a compatible assay (e.g., 2D-Quant Kit) and proceed with IEF [39].
Protocol for SDS-PAGE Compatible Samples
This protocol covers both standard denaturing conditions and native SDS-PAGE (NSDS-PAGE) for functional studies [37] [26].
Reagents Required:
- Denaturing Lysis Buffer: RIPA buffer (150 mM NaCl, 1% NP-40, 0.5% sodium deoxycholate, 0.1% SDS, 50 mM Tris, pH 8.0) with protease inhibitors [37]
- NSDS-PAGE Buffer: 100 mM Tris HCl, 150 mM Tris base, 10% glycerol, 0.0185% Coomassie G-250, 0.00625% Phenol Red, pH 8.5 [26]
- 4X LDS Sample Buffer: 106 mM Tris HCl, 141 mM Tris Base, 2% LDS, 10% glycerol, 0.51 mM EDTA, 0.22 mM SERVA Blue G-250, 0.175 mM Phenol Red [26]
- Running Buffer: 50 mM MOPS, 50 mM Tris Base, 0.0375% SDS, pH 7.7 (for NSDS-PAGE) [26]
Step-by-Step Procedure:
- Cell Lysis: For cultured cells, aspirate media and wash with cold PBS. Add 100-200 µL of Denaturing Lysis Buffer per 10⁶ cells. Incubate on ice for 15 minutes with occasional vortexing [37].
- Clarification: Centrifuge at 12,000 × g for 15 minutes at 4°C. Transfer supernatant to a new tube.
- Sample Buffer Preparation: Mix protein extract with 4X LDS Sample Buffer to achieve 1X final concentration.
- Denaturation (Standard SDS-PAGE only): Heat samples at 70°C for 10 minutes [26].
- Native Conditions (NSDS-PAGE): For native SDS-PAGE, omit EDTA from buffers and do not heat samples. Use NSDS-PAGE Buffer and Running Buffer to preserve metal cofactors and enzymatic activity [26].
- Quantification: Use a BCA or Bradford assay compatible with detergents. Load equal protein amounts (typically 1-50 µg) into gel wells [37].
Diagram 2: Divergent sample preparation workflows for IEF-IPG and SDS-PAGE, highlighting critical differences in buffer composition, processing steps, and desired outcomes.
The Scientist's Toolkit: Essential Reagent Solutions
Successful sample preparation requires carefully selected reagents designed to address specific challenges in protein fractionation. The following table catalogues essential research reagents and their functions in managing solubility, reduction, alkylation, and interfering compounds.
Table 3: Essential Research Reagent Solutions for Protein Sample Preparation
| Reagent Category | Specific Examples | Primary Function | Compatibility Notes |
|---|---|---|---|
| Chaotropic Agents | Urea (7-9 M), Thiourea (2 M) [39] | Disrupt hydrogen bonds; denature proteins; increase solubility | Essential for IEF-IPG; may be omitted for native SDS-PAGE |
| Detergents | CHAPS (2-4%), SDS (0.1-2%) [37] [39] | Solubilize hydrophobic proteins; disrupt lipid membranes | CHAPS for IEF-IPG; SDS for SDS-PAGE (incompatible with IEF) |
| Reducing Agents | DTT (50-100 mM), β-mercaptoethanol (0.07-0.1%) [38] [39] | Break disulfide bonds; unfold protein structure | Critical for both techniques; DTT preferred for IEF-IPG |
| Alkylating Agents | Iodoacetamide (50-100 mM) | Modify cysteine residues; prevent reformation of disulfides | Applied after reduction; typically before SDS-PAGE dimension |
| Protease Inhibitors | PMSF (1 mM), commercial cocktails [38] | Inhibit endogenous proteases; prevent protein degradation | Essential for both techniques; added fresh to lysis buffers |
| Nucleases | DNase I (20 U/mL), RNase A (0.25 mg/mL) [39] | Degrade nucleic acids; reduce sample viscosity | Critical for tissues high in DNA/RNA; prevents streaking in IEF |
| Carrier Ampholytes | Bio-Lyte (0.2-0.5%), Zoom carrier ampholytes [6] [39] | Enhance protein solubility; help form pH gradient | Specific to IEF-IPG; not required for SDS-PAGE |
| Precipitation Reagents | TCA/acetone, methanol/chloroform [38] | Concentrate proteins; remove contaminants | Useful for dirty samples; may cause protein loss |
Troubleshooting Common Preparation Artifacts
Even with optimized protocols, researchers may encounter technical artifacts that compromise fractionation quality. The table below outlines common issues, their probable causes, and evidence-based solutions.
Table 4: Troubleshooting Guide for Sample Preparation Artifacts
| Observed Artifact | Probable Cause | Recommended Solution | Supporting Evidence |
|---|---|---|---|
| Horizontal Streaking in IEF | Incomplete solubilization, protein aggregation, salt contamination | Increase thiourea concentration to 2 M; implement TCA/acetone precipitation; extend solubilization time [39] | Optimization with urea/thiourea combinations resolved streaking in chicken tissue samples [39] |
| Vertical Streaking in SDS-PAGE | Insufficient reduction, protein precipitation, particulate matter | Increase DTT concentration; filter samples post-lysis; ensure complete denaturation [37] | Standard protocols specify heating with LDS buffer and reducing agents [26] |
| Low Protein Yield | Protease activity, inefficient lysis, protein loss during precipitation | Add fresh protease inhibitors; optimize homogenization method; avoid over-drying precipitation pellets [38] | PMSF and cysteine protease inhibitors critical for legume roots with symbiotic bacteria [38] |
| Inconsistent Focusing | Oxidation of reducing agents, outdated ampholytes, carbohydrate contamination | Prepare fresh DTT solutions; use new ampholytes; implement TCA precipitation to remove carbohydrates [38] [39] | Fresh DTT at 50 mM provided superior results in optimized protocols [39] |
| Poor MS Identification | Polymer contamination, detergent interference, alkylation issues | Use MS-compatible stains; wash gels thoroughly; ensure complete alkylation before digestion [36] | Comprehensive Top-Down analysis requires minimal contaminants for successful protein identification [36] |
The critical comparison of sample preparation requirements for IEF-IPG and SDS-PAGE reveals fundamental trade-offs between preserving native protein characteristics for charge-based separation and achieving complete denaturation for size-based analysis. IEF-IPG demands meticulous attention to maintaining protein solubility and charge states through specialized chaotropic cocktails and detergent systems, while SDS-PAGE prioritizes complete disruption of native structure through harsh detergents and heat denaturation. The selection between these pathways must be guided by the ultimate analytical goals: IEF-IPG is indispensable for detecting charge-based modifications and proteoforms, whereas SDS-PAGE provides reliable molecular weight estimation and compatibility with immunoblotting. For comprehensive proteoform analysis, the sequential application of both techniques in 2D-PAGE remains powerful, though this approach multiplies the sample preparation challenges. By implementing the optimized protocols, reagent selections, and troubleshooting strategies outlined in this guide, researchers can navigate these critical preparation steps with greater confidence, ultimately enhancing the reliability and reproducibility of their protein fractionation efficiency research.
Optimizing pH Range Selection and Gel Porosity for Target Proteins
In proteomics, the efficacy of downstream analysis is profoundly influenced by the initial fractionation steps. Two dominant gel-based techniques, isoelectric focusing with immobilized pH gradients (IEF-IPG) and sodium dodecyl sulfate–polyacrylamide gel electrophoresis (SDS-PAGE), offer orthogonal separation principles. IEF-IPG separates proteins based on their isoelectric point (pI), while SDS-PAGE resolves them by molecular weight (MW) [3] [40]. The selection between these methods, and the subsequent optimization of parameters such as pH range and gel porosity, is critical for maximizing resolution, recovery, and the depth of proteomic coverage. This guide provides a comparative analysis of IEF-IPG and SDS-PAGE to inform method selection for target-specific protein fractionation.
Core Separation Principles and Comparative Workflow
The fundamental difference between these techniques lies in the physicochemical properties exploited for separation. The following diagram illustrates the distinct pathways for each method.
IEF-IPG relies on the creation of a stable, immobilized pH gradient within a gel matrix. When an electric field is applied, proteins migrate until they reach the region where the pH equals their pI, resulting in a net charge of zero and cessation of migration [41]. The key parameters for optimization are the pH gradient range and the gel composition which affects the stability of the gradient and protein mobility.
SDS-PAGE, in contrast, is a discontinuous system. Proteins are uniformly coated with the anionic detergent SDS, giving them a similar charge-to-mass ratio. Separation occurs as these linearized proteins are sieved through a polyacrylamide gel matrix, with smaller proteins migrating faster [42] [40]. The primary parameter for optimization here is the gel porosity, controlled by the percentage of acrylamide-bisacrylamide.
Direct Performance Comparison and Experimental Data
A comparative study of gel-based fractionation techniques for proteomic analysis revealed that while all methods provide complementary identifications, their performance metrics differ significantly [3]. The table below summarizes key quantitative findings from this research.
Table 1: Comparative Performance of Gel-Based Protein Fractionation Techniques
| Fractionation Technique | Separation Principle | Key Performance Metric | Reported Findings |
|---|---|---|---|
| IEF-IPG | Isoelectric point (pI) | Highest average number of detected peptides per protein [3] | Excellent for quantitative and structural characterization; provides high profiling sensitivity [3]. |
| 1-D SDS-PAGE | Molecular weight (MW) | High number of protein identifications [3] | Effective for complex samples; high profiling sensitivity and dynamic range [3]. |
| 2-D PAGE | Orthogonal (pI then MW) | Protein identification complementarity [3] | Recovery highly dependent on total gel matrix volume; useful but with potential for sample loss [3]. |
This data demonstrates that IEF-IPG and 1-D SDS-PAGE are the top performers in terms of identification depth and peptide detection, making them preferred for sensitive profiling. The combination of these two orthogonal techniques is particularly powerful for comprehensive proteome coverage [3].
Optimizing Key Parameters for Target Proteins
IEF-IPG: pH Gradient Selection and Stability
The choice of pH gradient is the most critical factor in IEF-IPG. The optimal range is dictated by the pI of the target proteins.
- Broad-Range Gradients (e.g., pH 3-10): Best for initial, exploratory separations of complex samples with unknown composition [43].
- Narrow-Range and Linear Gradients (e.g., pH 4-7, 5-6): Provide superior resolution for proteins with similar pI values and are essential for detecting minor charge variants like proteoforms and post-translational modifications (PTMs) [41] [14].
A major technical challenge in IEF is cathodic drift, the gradual movement of the pH gradient towards the cathode, which leads to loss of resolution and protein loss. The use of IPG gels, where the buffering compounds are covalently immobilized, has been a key advancement. Recent microfluidic studies show that IPG-IEF can reduce cathodic drift velocity by 24-fold compared to carrier ampholyte-based IEF, and a hybrid mixed-bed IEF can reduce it by 43-fold, ensuring exceptional gradient stability [14].
Table 2: IEF-IPG Optimization Guide
| Parameter | Optimization Goal | Recommendation |
|---|---|---|
| pH Gradient | Match target protein pI | Use narrow-range IPG strips for high resolution of specific proteins. |
| Sample Prep | Maintain solubility at pI | Use non-ionic detergents; keep SDS <0.25% [43]. |
| Salt Concentration | Prevent streaking/artifacts | Desalt to <10 mM; use low-voltage pre-focusing for salty samples [43]. |
| Focusing Time | Steady-state focusing | Avoid underfocusing (causes smearing) and overfocusing (>100,000 Vh can cause smearing) [43]. |
SDS-PAGE: Gel Porosity and Molecular Weight Resolution
In SDS-PAGE, gel porosity, determined by the total acrylamide percentage (%T), dictates the effective separation range. The relationship between acrylamide percentage and protein resolution is inverse.
- Low-Percentage Gels (e.g., 8-10%): Feature larger pores, ideal for the effective separation of high molecular weight proteins.
- High-Percentage Gels (e.g., 12-15%): Feature smaller pores, which provide better resolution and separation for low molecular weight proteins [42] [40].
For samples with a very broad MW distribution, gradient gels (e.g., 4-12% or 5-20%) are recommended as they provide a wide, continuous separation range and sharper bands [40]. The discontinuous buffer system, utilizing a stacking gel (pH 6.8) and a resolving gel (pH 8.8), is crucial for concentrating samples into sharp bands before entering the resolving gel, thereby enhancing resolution [42] [40].
Table 3: SDS-PAGE Gel Porosity Selection Guide
| Acrylamide Percentage | Effective Separation Range | Typical Application |
|---|---|---|
| 6-8% | 50 - 200 kDa | Very high MW proteins (e.g., myosin, titin). |
| 10% | 20 - 100 kDa | Standard separation for complex lysates. |
| 12% | 12 - 60 kDa | Common for many enzymes and signaling proteins. |
| 15% | 5 - 45 kDa | Low MW proteins and peptides. |
Detailed Experimental Protocols for Comparison
To ensure reproducible results, standardized protocols are essential. The following workflows are compiled from the cited experimental sections.
Sample Preparation:
- Solubilize and denature proteins in IEF buffer (e.g., 7 M urea, 2 M thiourea, 4% CHAPS).
- Reduce and alkylate using 5 mM tributylphosphine (TBP) and 10 mM acrylamide at 37°C for 90 minutes.
- Quench the reaction with 50 mM DTT.
- Desalt and adjust conductivity to ≤300 µS/cm using centrifugal ultrafiltration (10 kDa MWCO filters).
Isoelectric Focusing:
- Load the cleaned-up sample onto IPG strips (e.g., pH 3-10, 4-7, etc.).
- Focus using a stepwise voltage protocol:
- Low Voltage Step: 100-150 V for 2 hours to allow salt ions to migrate out.
- Gradient to High Voltage: Gradually increase to a high focusing voltage (e.g., 5000-8000 V) for several hours to achieve a total of 20,000-80,000 Vhr, depending on strip length and pH gradient.
- Process strips for downstream LC-MS/MS analysis, typically by equilibrating and embedding them on a second-dimension SDS-PAGE gel or performing in-gel digestion directly from IPG strip slices.
Gel Electrophoresis:
- Prepare sample in Laemmli buffer (e.g., 63 mM Tris-HCl, pH 6.8, 10% glycerol, 2% SDS, 0.0025% bromophenol blue) supplemented with 50 mM DTT.
- Load onto a pre-cast or hand-cast SDS-PAGE gel (e.g., Criterion 8-16% gradient gel).
- Run electrophoresis at constant voltage (e.g., 100-200 V) until the dye front reaches the bottom.
- Stain the gel with a compatible stain (e.g., Coomassie, SYPRO Ruby) to visualize protein bands.
In-Gel Digestion and Extraction:
- Excise the entire protein lane into 10-20 uniform slices or bands corresponding to specific MW regions.
- Destain, reduce, and alkylate proteins within the gel pieces.
- Digest proteins using a sequence-grade protease (e.g., trypsin) overnight at 37°C.
- Extract peptides from the gel matrix using acetonitrile and formic acid, then dry down for LC-MS/MS analysis.
The Scientist's Toolkit: Essential Research Reagents
Table 4: Key Reagent Solutions for IEF-IPG and SDS-PAGE
| Reagent / Kit | Function / Application | Key Characteristics |
|---|---|---|
| Immobiline Reagents | Forms stable, covalently bound pH gradients in IPG strips [41]. | Pre-cast, various pH ranges; superior stability vs. carrier ampholytes. |
| Novex IEF Gels | Pre-cast gels for analytical IEF [43]. | pH 3-10 gradient; 1.0 mm thickness; 10-well format. |
| Carrier Ampholytes | Small, soluble amphoteric molecules that form the pH gradient in non-IPG IEF [14]. | Can cause cathodic drift; may interact with proteins. |
| Laemmli Sample Buffer | Standard buffer for SDS-PAGE sample prep [42] [40]. | Contains SDS, glycerol, bromophenol blue, and Tris-HCl at pH 6.8. |
| CHAPS Detergent | Non-ionic/zwitterionic detergent for IEF sample solubilization [3]. | Maintains protein solubility without interfering with charge-based separation. |
| Tributylphosphine (TBP) | Reducing agent for disulfide bonds [3]. | Effective alternative to DTT or β-mercaptoethanol. |
IEF-IPG and SDS-PAGE are both powerful but distinct protein fractionation techniques. The choice for a specific application should be guided by the primary goal: IEF-IPG is superior for resolving protein isoforms and charge-based heterogeneity, while SDS-PAGE is the method of choice for size-based separation and assessing purity or molecular weight. The experimental data confirms that they provide complementary information, and their orthogonal combination significantly enhances proteomic profiling sensitivity and coverage. By systematically optimizing pH gradients for IEF-IPG and gel porosity for SDS-PAGE, researchers can tailor these fundamental techniques to their specific target proteins, thereby maximizing the value of downstream analytical investments.
In the realm of proteomics, gel-based separation techniques remain indispensable tools for analyzing complex protein mixtures. Among these, isoelectric focusing with immobilized pH gradients (IEF-IPG) and sodium dodecyl sulfate-polyacrylamide gel electrophoresis (SDS-PAGE) represent two fundamental approaches with distinct separation principles. IEF-IPG separates proteins based on their isoelectric points (pI) in a stable pH gradient, while SDS-PAGE resolves proteins primarily by molecular weight [2] [44]. Despite their widespread adoption in research and drug development, both techniques are susceptible to characteristic artifacts that can compromise data interpretation and experimental outcomes. Streaking in IEF-IPG and smearing in SDS-PAGE represent significant challenges that researchers must overcome to ensure reliable protein separation and accurate analysis.
The persistence of these artifacts underscores the need for systematic troubleshooting approaches tailored to each separation methodology. Streaking artifacts in IEF-IPG manifest as horizontal bands or vertical smears across the pH gradient, often indicating issues with protein solubility, sample preparation, or gradient stability [45]. Conversely, smearing in SDS-PAGE appears as diffuse, poorly resolved bands that hinder accurate molecular weight determination and quantitative analysis [46]. Understanding the underlying mechanisms of these artifacts is crucial for developing effective prevention and correction strategies. This guide provides a comprehensive comparison of these common artifacts, offering researchers practical solutions to optimize their protein fractionation workflows and enhance the reliability of their proteomic analyses.
Understanding Streaking in IEF-IPG
Mechanisms and Causes of IEF-IPG Streaking
Streaking in IEF-IPG gels represents a significant challenge that can dramatically reduce resolution and compromise experimental results. This artifact typically manifests as horizontal protein spreading across the pH gradient instead of tight, focused bands. The primary mechanism underlying streaking involves protein precipitation at their isoelectric points, where proteins carry no net charge and thus have minimal solubility [45]. When proteins precipitate during the focusing process, they cease migrating and form extended streaks along the separation path rather than discrete bands.
Several technical factors contribute to streaking artifacts in IEF-IPG. Sample-related issues constitute a major category, including excessive salt concentrations that disrupt the pH gradient and increase conductivity, leading to inadequate focusing [45] [2]. The presence of contaminants such as lipids, nucleic acids, or particulate matter can also cause streaking by interfering with protein migration. Inadequate sample preparation represents another common cause, particularly insufficient concentration of chaotropic agents like urea and thiourea, which are essential for maintaining protein solubility during IEF [2]. Incomplete reduction of disulfide bonds or insufficient alkylation can lead to protein aggregation, while the absence of appropriate detergents like CHAPS fails to prevent hydrophobic interactions between proteins. Gradient instability issues, notably cathodic drift, can cause progressive deterioration of the pH gradient over time [14]. This phenomenon results from the electromigration of buffering components toward the cathode, leading to compression of the basic region of the gradient and consequent streaking of high pI proteins.
Experimental Protocols to Address IEF-IPG Streaking
Implementing robust sample preparation protocols is essential for minimizing streaking in IEF-IPG. For complex protein samples such as mitochondrial extracts or whole cell lysates, researchers should employ a standardized cleanup procedure involving precipitation and resuspension in appropriate IEF-compatible buffers [3]. A recommended protocol involves precipitating proteins using methanol/chloroform or acetone, followed by resuspension in a freshly prepared lysis buffer containing 7M urea, 2M thiourea, 4% CHAPS, 50mM DTT, and 1% carrier ampholytes [3] [2]. This approach effectively removes interfering contaminants while maintaining protein solubility.
Proper reduction and alkylation are critical steps for preventing streaking caused by protein aggregation. Researchers should reduce proteins with 5mM tributyl phosphine (TBP) or 50mM dithiothreitol (DTT) at 37°C for 90 minutes, followed by alkylation with 10mM acrylamide for 60 minutes at room temperature [3]. The alkylation reaction should be quenched with excess DTT (50mM final concentration) to prevent over-alkylation. Sample loading optimization is equally important; researchers should ensure salt concentrations are below 50mM by performing centrifugal ultrafiltration with 10kDa molecular weight cut-off filters at 9,000 RCF [3]. Conductivity should be measured and maintained at ≤300μS/cm before IEF to prevent gradient disturbances.
For addressing cathodic drift and gradient instability, researchers can implement mixed-bed IEF methodologies that combine immobilized pH gradients with carrier ampholytes. This approach has demonstrated a 43-fold reduction in cathodic drift velocity (1.4 μm/min versus 60.1 μm/min in CA-IEF alone) [14]. The protocol involves copolymerizing acrylamide with Immobilines to create a stable pH gradient, then adding 0.5-2% carrier ampholytes to the sample and rehydration solution. This hybrid technique maintains the stability of IPGs while leveraging the enhanced conductivity provided by carrier ampholytes for improved protein migration and focusing.
Quantitative Comparison of IEF-IPG Performance
The effectiveness of IEF-IPG as a fractionation technique has been systematically evaluated in comparative studies. When assessing mitochondrial extracts from rat liver, IEF-IPG demonstrated superior performance in peptide detection compared to other gel-based methods [3]. The table below summarizes key performance metrics:
Table 1: Performance Metrics of IEF-IPG in Proteomic Analysis
| Performance Metric | Result | Experimental Context |
|---|---|---|
| Average Peptides per Protein | Highest among techniques | Mitochondrial extracts analysis [3] |
| Protein Identifications | High number (second to 1-D SDS-PAGE) | Comparison of gel-based fractionation techniques [3] |
| Cathodic Drift Velocity (Traditional CA-IEF) | 60.1 μm/min | Microfluidic IEF measurements [14] |
| Cathodic Drift Velocity (IPG-IEF) | 2.5 μm/min (24-fold reduction) | Microfluidic IEF measurements [14] |
| Cathodic Drift Velocity (Mixed-Bed IEF) | 1.4 μm/min (43-fold reduction) | Microfluidic IEF measurements [14] |
The data demonstrate that while IEF-IPG provides excellent resolution and peptide detection capability, proper optimization is essential to minimize artifacts like streaking. The implementation of advanced IEF methodologies such as mixed-bed IEF can significantly improve gradient stability, which directly impacts streaking artifacts and overall separation quality.
Understanding Smearing in SDS-PAGE
Mechanisms and Causes of SDS-PAGE Smearing
Smearing in SDS-PAGE represents a common artifact characterized by diffuse, poorly resolved protein bands that lack sharpness and definition. This phenomenon fundamentally differs from streaking in IEF-IPG, both in appearance and underlying mechanisms. SDS-PAGE smearing typically manifests as vertical spreading of protein bands, often appearing as broad, indistinct zones of protein migration rather than discrete bands [46]. The primary mechanism involves incomplete or inconsistent denaturation of proteins, which results in heterogeneous protein-SDS complexes with varying charge-to-mass ratios and electrophoretic mobilities.
Several technical factors contribute to smearing artifacts in SDS-PAGE. Improper electrophoresis conditions represent a major category, with excessive voltage generating excessive heat that causes localized overheating and protein denaturation heterogeneity [46]. Inconsistent temperature distribution across the gel creates regions with different migration rates, leading to band distortion and smearing. Gel composition issues also contribute significantly to smearing, particularly uneven polymerization creating regions with different pore sizes that distort protein migration [46]. Incorrect acrylamide concentration relative to target protein size ranges can cause poor size-based separation, while improper buffer pH or ionic strength fails to maintain optimal charge and separation conditions. Sample-related problems constitute another common cause, including insufficient concentration of SDS in the sample buffer (typically <1%), which results in incomplete protein denaturation and charge masking [47]. Inadequate reduction of disulfide bonds with agents like beta-mercaptoethanol or DTT leads to persistent protein structures with anomalous migration, while protein overloading exceeds the gel's separation capacity, causing band broadening and smearing.
Experimental Protocols to Address SDS-PAGE Smearing
Implementing optimized electrophoresis conditions is crucial for minimizing smearing artifacts. Researchers should run gels at 10-15 Volts/cm gel length, which typically translates to 150V for standard mini-gel systems [46]. For high molecular weight proteins (>100 kDa), lower voltages (100-120V) with extended run times improve resolution by preventing heat-induced artifacts. Temperature control represents another critical factor; gels should be run in a cold room (4°C) or with external cooling systems using circulating chilled water to maintain consistent temperature [46]. These measures prevent the "smiling effect" (curved bands) and minimize diffusion-related smearing.
Proper gel preparation and formulation are essential for achieving sharp, well-resolved bands. Researchers should employ freshly prepared acrylamide solutions with consistent concentrations tailored to their target protein size range: 8% for proteins 50-200 kDa, 10% for 20-100 kDa, and 12-15% for proteins <50 kDa [46]. Polymerization should be optimized using high-quality ammonium persulfate (APS) and tetramethylethylenediamine (TEMED) to ensure complete and uniform gel formation. The discontinuous buffer system, utilizing Tris-HCl at pH 6.8 for the stacking gel and pH 8.8 for the resolving gel, must be precisely formulated to establish proper ion fronts for protein stacking and separation [47].
Sample preparation optimization represents perhaps the most critical factor in preventing SDS-PAGE smearing. Researchers should ensure sample buffer contains 2% SDS, 50-100mM DTT or 5% beta-mercaptoethanol, 10% glycerol, and 0.0025% bromophenol blue in 63mM Tris-HCl [3] [47]. Protein denaturation should be performed at 95°C for 5-10 minutes, followed by brief centrifugation to remove insoluble material. To prevent the "edge effect" and distorted peripheral bands, researchers should load protein standards or control samples in outer wells rather than leaving them empty [46]. Additionally, samples should be loaded immediately after denaturation to prevent reformation of secondary structures and ensure consistent migration.
Quantitative Comparison of SDS-PAGE Performance
SDS-PAGE remains one of the most widely used protein separation techniques due to its reliability and straightforward implementation. When evaluated alongside other fractionation techniques for proteomic analysis, SDS-PAGE demonstrates particular strengths in certain applications. The table below summarizes key performance metrics for SDS-PAGE:
Table 2: Performance Metrics of SDS-PAGE in Proteomic Analysis
| Performance Metric | Result | Experimental Context |
|---|---|---|
| Protein Identifications | Highest number among techniques | Mitochondrial extracts analysis [3] |
| Optimal Voltage Range | 10-15 V/cm | Standard SDS-PAGE protocol [46] |
| Resolution Improvement | Lower acrylamide % for high MW proteins | Troubleshooting smearing issues [46] |
| Run Time Optimization | Until dye front reaches bottom (∼1-1.5h at 150V) | Standard mini-gel protocol [46] |
| Dynamic Range | Complementary to IEF-IPG for comprehensive coverage | Comparison of fractionation techniques [3] |
The data indicate that SDS-PAGE provides excellent protein identification capabilities, particularly when optimized to minimize smearing artifacts. The technique's robustness and high throughput make it particularly valuable for initial protein separation and molecular weight estimation, especially when used in combination with IEF-IPG for comprehensive proteomic analysis.
Comparative Analysis: IEF-IPG vs. SDS-PAGE for Protein Fractionation
Technical Comparison and Complementary Applications
IEF-IPG and SDS-PAGE represent orthogonal approaches to protein separation, each with distinct advantages and limitations in proteomic fractionation. Understanding their complementary nature is essential for designing effective experimental workflows. IEF-IPG separates proteins based on isoelectric point, providing exceptional resolution for detecting charge variants, post-translational modifications, and protein isoforms that differ by as little as 0.01 pH units [2] [44]. This technique excels in resolving proteins with similar molecular weights but different charge characteristics. In contrast, SDS-PAGE separates proteins primarily by molecular weight, offering robust performance for molecular weight estimation, purity assessment, and initial fractionation of complex samples [44].
The combination of these techniques in two-dimensional gel electrophoresis (2-DE) leverages their complementary strengths, enabling simultaneous separation based on both charge and size [2]. This powerful approach can resolve thousands of protein species from complex biological samples, making it invaluable for comprehensive proteomic analyses. However, this combination also introduces challenges related to technical complexity, reproducibility, and potential artifacts from both separation dimensions. Research demonstrates that while 1-D SDS-PAGE and IEF-IPG individually yield the highest number of protein identifications, all techniques provide complementary results that enhance overall proteome coverage [3].
Table 3: Direct Comparison of IEF-IPG and SDS-PAGE Characteristics
| Parameter | IEF-IPG | SDS-PAGE |
|---|---|---|
| Separation Principle | Isoelectric point | Molecular weight |
| Resolution Capability | Can separate proteins differing by 0.01 pI units [45] | Limited for proteins with similar molecular weights [44] |
| Typical Artifacts | Streaking, cathodic drift [45] [14] | Smearing, band distortion [46] |
| Sample Denaturation | Can be non-denaturing or denaturing [44] | Always denaturing [47] [44] |
| Information Obtained | Isoelectric point, charge variants [2] | Molecular weight estimate [44] |
| Optimal For | PTM analysis, isoform separation [2] | Molecular weight determination, purity check [44] |
| Throughput | Moderate to low [44] | High [44] |
| Equipment Cost | High [44] | Low to moderate [44] |
| Compatibility with MS | High (with appropriate processing) [3] | High (with in-gel digestion) [3] |
Research Reagent Solutions for Optimal Separations
Successful implementation of both IEF-IPG and SDS-PAGE methodologies requires specific reagents optimized for each technique. The following table details essential research reagent solutions for both separation methods:
Table 4: Essential Research Reagents for IEF-IPG and SDS-PAGE
| Reagent Category | Specific Reagents | Function | Application |
|---|---|---|---|
| Chaotropic Agents | Urea (7M), Thiourea (2M) | Disrupt hydrogen bonds, maintain protein solubility [3] [2] | IEF-IPG |
| Detergents | CHAPS (4%), SDS (1-2%) | Solubilize hydrophobic proteins, provide uniform charge [3] [47] | IEF-IPG, SDS-PAGE |
| Reducing Agents | DTT (50mM), TBP (5mM), Beta-mercaptoethanol | Reduce disulfide bonds [3] [47] | IEF-IPG, SDS-PAGE |
| Alkylating Agents | Acrylamide (10mM), Iodoacetamide | Alkylate thiol groups to prevent reformation [3] | IEF-IPG, SDS-PAGE |
| Buffers | Tris-HCl, Carrier ampholytes | Maintain pH, establish gradients [47] [2] | IEF-IPG, SDS-PAGE |
| Gel Matrix | Immobilines, Acrylamide/Bis-acrylamide | Create separation matrix with specific pores [2] | IEF-IPG, SDS-PAGE |
| Polymerization | APS, TEMED | Catalyze acrylamide polymerization [47] | IEF-IPG, SDS-PAGE |
The systematic comparison of IEF-IPG and SDS-PAGE reveals both techniques as powerful yet complementary tools for protein fractionation in proteomic research and drug development. While each method exhibits characteristic artifacts—streaking in IEF-IPG and smearing in SDS-PAGE—targeted troubleshooting approaches can effectively mitigate these issues. The implementation of optimized protocols, including proper sample preparation, controlled electrophoresis conditions, and appropriate reagent selection, significantly enhances separation quality and reliability. For comprehensive proteomic analyses, researchers should consider the orthogonal separation principles of these techniques, either sequentially in 2-DE workflows or as complementary fractionation approaches. As proteomics continues to advance toward higher sensitivity and throughput, mastering these fundamental separation methods remains essential for generating robust, reproducible data in biological and pharmaceutical research.
Maximizing Recovery and Resolution for Hydrophobic and Low-Abundance Proteins
The efficacy of mass spectrometry (MS)-based proteomic profiling is heavily reliant on upstream fractionation techniques to manage the high complexity and vast dynamic range of protein concentrations in biological samples [3]. Due to limitations in the peak capacity of conventional nanoflow reversed-phase liquid chromatography and the co-elution of analytes competing for charges during ionization, effective fractionation strategies are indispensable for enhancing sensitivity [3]. This is particularly true for hydrophobic and low-abundance proteins, which are often critical drug targets but are notoriously difficult to capture and analyze. Fractionation can be performed at the peptide or protein level, with studies demonstrating that fractionation at the protein level can yield higher profiling sensitivity and be more effective for certain applications [3]. The dilemma, however, is that each fractionation stage introduces a risk of sample loss, which is particularly deleterious for samples of limited availability or for low-abundance analytes [3]. This guide objectively compares the performance of two dominant gel-based protein fractionation techniques—Isoelectric Focusing using Immobilized pH Gradients (IEF-IPG) and SDS-PAGE—in the context of recovery and resolution, providing a structured framework for selecting the optimal strategy for challenging protein classes.
Basis of Separation
The two techniques separate proteins based on distinct physicochemical principles, which directly influences their performance for different protein types.
- IEF-IPG (Isoelectric Focusing with Immobilized pH Gradient): This technique separates proteins based on their isoelectric point (pI), the pH at which a protein carries no net charge [48] [2]. Proteins are electrophoresed through a stable, covalently immobilized pH gradient. They migrate until they reach a point in the gradient where the pH equals their pI, at which point they become neutral and stop migrating, thus "focusing" into sharp bands [2]. The IPG strip technology offers high reproducibility and stability over extended run times [2].
- SDS-PAGE (Sodium Dodecyl Sulfate-Polyacrylamide Gel Electrophoresis): This technique separates proteins primarily based on their molecular weight (MW) [48]. Proteins are denatured and linearized by the anionic detergent SDS, which binds in a uniform mass-to-charge ratio. An electric field then causes these negatively charged protein-SDS complexes to migrate through a polyacrylamide gel matrix, with smaller proteins migrating faster than larger ones [48].
Standard Experimental Workflows
The following diagrams illustrate the core procedural workflows for each fractionation method, leading to mass spectrometric analysis.
Diagram 1: IEF-IPG and SDS-PAGE workflow.
Diagram 2: Gel-based MS analysis workflow.
Comparative Performance Analysis
Direct comparative studies provide quantitative data on the performance of these techniques. A key study evaluating common gel-based separation techniques using a mixture of protein standards and mitochondrial extracts revealed significant differences.
Table 1: Performance Comparison of Gel-Based Fractionation Techniques [3]
| Performance Metric | 1-D SDS-PAGE (GeLC-MS/MS) | IEF-IPG | Preparative 1-D SDS-PAGE | 2-D PAGE |
|---|---|---|---|---|
| Total Protein Identifications | High | Highest | Moderate | Lower |
| Average Peptides per Protein | Moderate | Highest | N/A | N/A |
| Reproducibility | Good | High (due to IPG stability) [2] | Moderate | Lower (gel-to-gel variation) [48] |
| Handling & Throughput | Simple, common protocol | Requires specific equipment (IPGphor) | Simple | Labour-intensive |
| Recovery of Hydrophobic Proteins | Challenging (in-gel digestion) | Challenging (in-gel digestion) | Challenging (in-gel digestion) | Challenging |
| Suitability for Low-Abundance Proteins | Moderate (can load high protein amounts) | High (focusing effect concentrates proteins) [2] | High (preparative scale) | Low (limited dynamic range) [48] |
Table 2: Analysis of Basic and Acidic Protein Recovery [49]
| Protein Type | IEF-IPG (Broad Range pH 3-10) | NEPHGE-based 2DE (Carrier Ampholytes) |
|---|---|---|
| Basic Proteins (pI >7) | Low reproducibility (~44%); high protein loss; unreliable for highly basic proteins. | Excellent reproducibility (~87%); effective for highly basic proteins. |
| Acidic Proteins (pI <7) | Good reproducibility (~82%); a method of choice for narrow-range pH 4-7 strips. | Good reproducibility (~72%); fails to detect some highly acidic proteins. |
| Overall Protein Capacity | Standard load (50-200 µg) | Higher protein capacity with good spot quality. |
Orthogonal and Alternative Fractionation Strategies
Given the complementary strengths of IEF-IPG and SDS-PAGE, a combination of these orthogonal techniques can significantly improve profiling sensitivity without a major decrease in throughput [3]. Furthermore, several gel-free or liquid-phase techniques have been developed to address the limitations of gel-based methods.
- Liquid-Phase IEF Techniques: Methods like Offgel Electrophoresis (OGE) and Free-Flow IEF (FF-IEF) perform IEF in a liquid phase, improving sample recovery, especially for low-abundance proteins, and are easier to automate [50] [6]. OGE uses an IPG strip to create a pH gradient in solution, allowing for the recovery of focused proteins or peptides from a liquid phase, thereby improving recovery for downstream MS analysis [50]. Microfluidic FF-IEF devices allow for continuous separation and show promise in retaining high molecular weight proteins and providing higher yield over a broad pI range with reduced experimental time [6].
- Paper-Based IEF (PIEF): A simpler alternative to OGE, PIEF uses a strip of filter paper placed over an IPG strip to fractionate peptides. A comparative study found that PIEF and OGE identified a similar number of proteins (1174 vs 1080), but a large proportion (499 and 415, respectively) were unique to each method, demonstrating their complementary nature and the potential for expanded proteomic coverage when used in tandem [51].
- Multidimensional Chromatography (MudPIT): This gel-free approach couples two or more liquid chromatography phases (e.g., strong cation exchange followed by reversed-phase) directly with mass spectrometry, offering high resolution and automation for complex peptide mixtures [3].
The Scientist's Toolkit: Essential Research Reagents
Successful fractionation requires careful sample preparation using specific reagents to maintain protein solubility and integrity.
Table 3: Key Reagents for Protein Fractionation Protocols [3] [48]
| Reagent Category | Example Reagents | Function in Protocol |
|---|---|---|
| Chaotropes | Urea, Thiourea | Disrupt hydrogen bonds to denature proteins and maintain solubility. |
| Detergents | CHAPS, Triton X-100, Sulfobetaines | Disrupt hydrophobic interactions; must be IEF-compatible (non-ionic/zwitterionic). |
| Reducing Agents | Dithiothreitol (DTT), Tributyl phosphine (TBP) | Break disulfide bonds to fully denature proteins. |
| Alkylating Agents | Iodoacetamide, Acrylamide | Cap cysteine residues to prevent reformation of disulfide bonds. |
| Carrier Ampholytes | Pharmalyte, Servalyte | Assist in forming a smooth pH gradient in IEF and improve protein solubility. |
| Buffers | Tris-HCl, Ammonium Bicarbonate | Maintain stable pH during various steps of the protocol. |
The choice between IEF-IPG and SDS-PAGE for fractionation efficiency is not a matter of one being universally superior, but rather of selecting the right tool for the specific research question and sample type.
- For maximizing the number of identifications and peptide coverage per protein, IEF-IPG is the leading technique, as it provides the highest number of identifications and the highest average number of detected peptides per protein, which is beneficial for quantitative and structural characterization [3].
- For the analysis of basic proteins (pI >7), broad-range IEF-IPG strips show poor performance. For these targets, NEPHGE-based methods or liquid-phase IEF techniques like OGE are strongly recommended [49].
- For the analysis of acidic proteins or when high reproducibility is critical, narrow-range IEF-IPG is the method of choice, leveraging the stability of the immobilized gradient [49] [2].
- For a comprehensive proteomic profile, an orthogonal combination of IEF-IPG and SDS-PAGE is highly effective, as they provide complementary identification results and together can uncover a significantly larger proportion of the proteome [3].
- To maximize recovery for low-abundance proteins and minimize sample loss, liquid-phase fractionation techniques like OGE, FF-IEF, or MudPIT should be considered, as they generally offer improved sample recovery compared to gel-based methods that require extraction from a matrix [3] [50] [6].
Ultimately, the strategic integration of these complementary fractionation approaches provides the most powerful pathway to overcoming the analytical challenges posed by hydrophobic and low-abundance proteins in drug development and biomedical research.
Head-to-Head Analysis: Validating the Efficiency and Application Scope of IEF-IPG vs. SDS-PAGE
Within proteomics, effective protein fractionation is indispensable for reducing sample complexity and enhancing detection sensitivity in mass spectrometry (MS) analysis [3]. Two predominant gel-based techniques are Isoelectric Focusing using Immobilized pH Gradients (IEF-IPG) and Sodium Dodecyl Sulfate-Polyacrylamide Gel Electrophoresis (SDS-PAGE). This guide provides a direct objective comparison of these methods, focusing on the critical metrics of resolution, reproducibility, throughput, and protein loading capacity. The selection between IEF-IPG, which separates proteins based on isoelectric point (pI), and SDS-PAGE, which separates based on molecular weight (MW), has profound implications for experimental design and outcomes in biomedical research and drug development [3] [12].
SDS-PAGE
SDS-PAGE is a fundamental analytical method for protein characterization. The technique relies on the binding of SDS detergent to proteins, which confers a uniform negative charge. Consequently, separation occurs primarily based on molecular weight as proteins migrate through a polyacrylamide gel matrix under an electric field [5]. The Laemmli system is the standard protocol, which can be run under reducing or non-reducing conditions to break or preserve disulfide bonds, respectively [5].
IEF-IPG
IEF-IPG separates proteins based on their intrinsic isoelectric point (pI). Proteins are applied to a gel strip containing a covalently immobilized pH gradient and migrate under an electric field until they reach the pH region where their net charge is zero [3] [52]. The use of immobilized gradients, rather than carrier ampholytes, has significantly improved the technique's reproducibility and stability [52] [4].
Orthogonal Combination in 2D-PAGE
The two techniques are often combined orthogonally in two-dimensional gel electrophoresis (2D-PAGE), where IEF-IPG constitutes the first dimension and SDS-PAGE the second. This combination allows for the simultaneous separation of thousands of proteins based on both pI and MW [52] [12]. A comparison of broad-range (pH 3-10) gradient-based 2DE methods suggests that NEPHGE-based method is preferable over IPG for the analysis of basic proteins, while narrow-range (pH 4-7) IPG technique is a method of choice for acidic proteins [4].
Experimental Protocols for Direct Comparison
Sample Preparation for Comparative Analysis
For a standardized comparison, complex samples such as mitochondrial extracts or whole cell lysates should be used. Proteins must be denatured, reduced, and alkylated. A common lysis buffer contains 7M urea, 2M thiourea, and 4% CHAPS. Sample conductivity should be adjusted to ≤300 µS/cm using centrifugal ultrafiltration (e.g., 10 kDa MWCO filters) to ensure effective focusing [3].
SDS-PAGE Protocol (GeLC-MS/MS)
- Gel Casting: Prepare a polyacrylamide gel with an appropriate gradient (e.g., 8-16%) for molecular weight separation [3].
- Sample Loading: Dilute samples in SDS-PAGE sample buffer (e.g., 63 mM Tris-HCl, 2% SDS, 10% glycerol, 0.0025% bromophenol blue) supplemented with 50 mM DTT [3].
- Electrophoresis: Run at constant voltage until the dye front migrates to the bottom.
- In-Gel Processing: Stain the gel, excise the entire lane, and slice into uniform fractions. Destain, reduce with DTT, alkylate with iodoacetamide, and digest proteins in-gel with trypsin [3] [5].
- Peptide Extraction: Extract peptides from gel pieces, dry down, and reconstitute for LC-MS/MS analysis.
IEF-IPG Protocol
- IPG Strip Rehydration: Apply samples to IPG strips via active or passive rehydration. A typical rehydration solution contains 7M urea, 2M thiourea, 4% CHAPS, and a reducing agent [52] [4].
- Isoelectric Focusing: Perform focusing using a programmed voltage gradient. A typical protocol involves stepwise increases from 100 V to 8000 V over several hours [52].
- Post-Focusing Processing: For 2D-PAGE, equilibrate strips in SDS-containing buffer before transferring to the second dimension. For fractionation alone, proteins can be extracted directly from the IPG strip [52].
Direct Performance Comparison
Quantitative Metrics Table
Table 1: Direct comparison of performance metrics between IEF-IPG and SDS-PAGE for protein fractionation.
| Metric | IEF-IPG | SDS-PAGE (1-D GeLC-MS/MS) | Experimental Context |
|---|---|---|---|
| Protein Identifications | Highest number of identifications, complementary to SDS-PAGE [3] | High number of identifications, complementary to IEF-IPG [3] | Analysis of mitochondrial extracts from rat liver [3] |
| Peptides per Protein | Highest average number detected [3] | Lower average number compared to IEF-IPG [3] | Analysis of mitochondrial extracts from rat liver [3] |
| Reproducibility | High with commercial IPG strips [52]; Poor for basic proteins (pI >7) [4] | Good reproducibility with standardized protocols [5] | Broad-range (pH 3-10) 2DE comparison [4] |
| Protein Loading Capacity | Standard: ~50 μg; High: 50 μg to 5 mg (preparative) [3] [16] | Varies with gel thickness and format; typically 200-500 μg for analytical 2D gels [6] | Various commercial systems [16] [6] |
| Effective pH/MW Range | Effective for acidic proteins; challenges with basic proteins (>pI 7) and hydrophobic proteins [3] [4] | Effective for proteins 10-300 kDa; challenges with extreme MW proteins [3] [5] | Proteomic profiling of complex mixtures [3] |
| Sample Loss | Higher protein loss during procedure, especially for basic proteins [4] | Moderate sample loss during in-gel processing [3] | Comparison of 2DE methods with Coomassie staining [4] |
| Throughput | Moderate (focusing typically 12-24 hours) [16] | Relatively fast (separation in 1-2 hours) [5] | Standard laboratory protocols [5] [16] |
Resolution and Dynamic Range
IEF-IPG demonstrates superior resolution for separating protein isoforms and variants that differ minimally in charge, providing the highest average number of detected peptides per protein, which is beneficial for quantitative and structural characterization [3]. However, SDS-PAGE excels at resolving proteins by molecular weight and is more effective for proteins with extreme pI values or hydrophobicity that challenge IEF-IPG [3] [4]. Both techniques provide complementary protein identification results, with the combination of orthogonal IEF-IPG and SDS-PAGE yielding the highest profiling sensitivity [3].
Reproducibility and Handling
The reproducibility of IPG-based IEF is high for commercial strips in the acidic range, but significantly decreases for basic proteins (pI >7), where approximately half of basic protein spots may not be reproducible [4]. SDS-PAGE offers good reproducibility with standardized protocols and is generally simpler to perform [5]. Handling of IPG strips is safer and easier compared to the more fragile tube gels used in some IEF formats, which require considerable skill to avoid breakage [4].
Throughput and Capacity
Throughput for IEF-IPG is moderate, with typical focusing times ranging from 12-24 hours [16], while SDS-PAGE can be completed in 1-2 hours [5]. Protein loading capacity for IEF-IPG varies significantly with format, ranging from ~50 μg for analytical scales to 5 mg for preparative applications [3] [16]. Standard analytical 2D gels using SDS-PAGE typically accommodate 200-500 μg of protein [6].
The Scientist's Toolkit: Essential Research Reagents
Table 2: Essential reagents and materials for IEF-IPG and SDS-PAGE fractionation techniques.
| Category | Specific Reagent/Equipment | Function in Experiment | Application |
|---|---|---|---|
| Denaturants | Urea, Thiourea | Unfold proteins, improve solubility | IEF-IPG, Sample Preparation |
| Detergents | CHAPS, Triton X-100 | Solubilize hydrophobic proteins | IEF-IPG, Sample Preparation |
| Reducing Agents | DTT, Dithiothreitol | Break disulfide bonds | Sample Preparation for both |
| Alkylating Agents | Acrylamide, Iodoacetamide | Cysteine alkylation to prevent reformation | Sample Preparation for both |
| Separation Media | IPG Strips (various pH ranges) | Create stable pH gradient for IEF | IEF-IPG |
| Polyacrylamide Gels (various %) | Create molecular sieving matrix | SDS-PAGE | |
| Buffers & Ampholytes | Carrier Ampholytes | Generate pH gradient in solution IEF | IEF (non-IPG) |
| SDS-PAGE Running Buffer | Conduct current, maintain pH | SDS-PAGE | |
| Equipment | IEF Apparatus (e.g., Protean i12) | Housing for IPG strips, temperature control | IEF-IPG |
| Vertical Gel Electrophoresis Unit | Housing for polyacrylamide gels | SDS-PAGE | |
| Staining & Visualization | Coomassie Brilliant Blue, Silver Stain | Detect proteins post-separation | Both (downstream analysis) |
The choice between IEF-IPG and SDS-PAGE for protein fractionation involves significant trade-offs. IEF-IPG offers superior resolution for charge-based separations and higher peptides-per-protein counts, which is valuable for protein characterization, but struggles with basic proteins and exhibits higher sample loss [3] [4]. SDS-PAGE provides robust, rapid molecular weight-based separation with generally good reproducibility but less effectiveness for proteins of similar size [3] [5].
For comprehensive proteomic profiling, the orthogonal combination of both techniques in 2D-PAGE or sequential fractionation strategies provides the most powerful approach, significantly enhancing detection sensitivity and dynamic range [3]. Researchers should select the method based on their specific protein targets: IEF-IPG for acidic protein analysis or high-resolution charge-based separation, and SDS-PAGE for rapid molecular weight assessment or when working with basic proteins. Consideration of project goals, sample limitations, and available technical expertise is essential for optimizing fractionation strategies in drug development and biomedical research.
The separation and analysis of protein isoforms and complexes represent a significant challenge in proteomics, requiring techniques with high resolution and precision [2]. Protein isoforms, which arise from alternative splicing or post-translational modifications (PTMs), often exhibit subtle differences in charge with minimal changes in molecular weight [2]. Similarly, protein complexes maintain specific quaternary structures that can be disrupted by harsh denaturing conditions [13]. This case study objectively compares the performance of two fundamental protein fractionation techniques—isoelectric focusing using immobilized pH gradients (IEF-IPG) and sodium dodecyl sulfate-polyacrylamide gel electrophoresis (SDS-PAGE)—within the broader context of protein fractionation efficiency research.
We frame this comparison around experimental data from direct methodological comparisons and real-world applications in proteomic profiling. The evaluation focuses on key performance metrics including resolution for charge-based separations, capacity for detecting low-abundance species, reproducibility, and applicability for analyzing complex biological samples. This analysis provides researchers, scientists, and drug development professionals with evidence-based guidance for selecting appropriate separation techniques for specific protein characterization challenges.
Theoretical Foundations and Separation Principles
Isoelectric Focusing with Immobilized pH Gradients (IEF-IPG)
IEF-IPG separates proteins based on their isoelectric point (pI), the specific pH at which a protein carries no net electrical charge [2]. The technique employs a polyacrylamide gel matrix containing covalently immobilized buffering groups that create a stable pH gradient when an electric field is applied [2] [52]. Proteins introduced into this system migrate until they reach the position in the gradient where the pH equals their pI, at which point they become focused into sharp, concentrated bands [2]. This focusing effect provides IEF-IPG with exceptional resolution for separating proteins with minimal pI differences (as small as 0.01 pH units) [2].
The IPG technology represents a significant advancement over carrier ampholyte-based systems by preventing gradient drift during extended focusing times, thereby improving reproducibility across experiments [2] [52]. Commercially available IPG strips come in various lengths (7-24 cm) and pH ranges (broad range pH 3-10 or narrow ranges such as pH 4-7) [52] [4], allowing researchers to select optimal conditions for specific protein populations of interest.
SDS-Polyacrylamide Gel Electrophoresis (SDS-PAGE)
SDS-PAGE separates proteins primarily by molecular weight through a sieving mechanism [13]. The anionic detergent SDS denatures proteins and binds to polypeptide backbones at a constant ratio (approximately 1.4 g SDS per 1 g protein), imparting a uniform negative charge density that masks proteins' intrinsic charges [13]. When an electric field is applied, SDS-protein complexes migrate through the polyacrylamide gel matrix toward the anode at rates inversely proportional to the logarithm of their molecular masses [13].
The pore size of the polyacrylamide gel, determined by the concentration of acrylamide and bisacrylamide, governs the separation range [13]. Lower percentage gels (e.g., 8-10%) resolve higher molecular weight proteins, while higher percentage gels (e.g., 12-15%) provide better separation of smaller proteins [13]. Gradient gels, which increase in acrylamide concentration from top to bottom, extend the effective separation range for complex mixtures [13].
Experimental Comparison: Methodologies and Workflows
Direct Comparative Experimental Design
A comprehensive comparison study evaluated common gel-based protein separation techniques, including 1-D SDS-PAGE, preparative 1-D SDS-PAGE, IEF-IPG, and 2-D PAGE, for proteomic profiling using nanoLC-ESI-MS/MS analysis [3]. The experimental design utilized both a standardized protein mixture (42 different proteins from four series of standards mixed in ratios covering two orders of magnitude) and mitochondrial extracts isolated from rat liver, with approximately 144 μg of total protein used per fractionation technique [3].
Sample preparation followed standardized protocols for both techniques. For IEF-IPG, samples were homogenized and lysed in IEF buffer (7M urea, 2M thiourea, 4% CHAPS), followed by reduction and alkylation with 5 mM TBP and 10 mM acrylamide [3]. For SDS-PAGE techniques, samples were diluted in SDS sample buffer (63 mM Tris HCl, 10% glycerol, 2% SDS, 0.0025% bromophenol blue, pH 6.8) supplemented with 50 mM DTT [3].
Table 1: Key Experimental Parameters for IEF-IPG and SDS-PAGE Techniques
| Parameter | IEF-IPG | 1-D SDS-PAGE |
|---|---|---|
| Separation Principle | Isoelectric point | Molecular weight |
| Sample Buffer | 7M urea, 2M thiourea, 4% CHAPS | 63 mM Tris HCl, 10% glycerol, 2% SDS |
| Reducing Agent | 5 mM TBP | 50 mM DTT |
| Alkylation | 10 mM acrylamide | Not specified |
| Separation Matrix | IPG strips (various pH ranges) | Polyacrylamide gels (various %) |
| Typical Sample Load | ~144 μg total protein | ~144 μg total protein |
| Detection Method | nanoLC-ESI-MS/MS | nanoLC-ESI-MS/MS |
Workflow Visualization
The following workflow diagrams illustrate the key procedural steps for both IEF-IPG and SDS-PAGE techniques, highlighting their distinct approaches to protein separation.
IEF-IPG Workflow
SDS-PAGE Workflow
Performance Comparison Results
Quantitative Assessment of Separation Efficiency
The direct comparison of gel-based separation techniques revealed distinct performance characteristics for IEF-IPG and 1-D SDS-PAGE [3]. While both techniques provided complementary protein identification results, IEF-IPG demonstrated superior performance in specific metrics critical for protein isoform characterization.
Table 2: Quantitative Performance Comparison of IEF-IPG vs. 1-D SDS-PAGE
| Performance Metric | IEF-IPG | 1-D SDS-PAGE | Experimental Context |
|---|---|---|---|
| Number of Protein Identifications | High | Highest | Analysis of mitochondrial extracts from rat liver [3] |
| Average Peptides per Protein | Highest | Lower | IEF-IPG resulted in highest average number of detected peptides per protein [3] |
| Reproducibility for Acidic Proteins | Good | N/A | Similar reproducibility for acidic proteins compared to NEPHGE-based methods [4] |
| Reproducibility for Basic Proteins (pI>7) | Poor | N/A | ~50% of basic protein spots not reproducible with IPG-based method [4] |
| Protein Loss During Procedure | Higher | Lower | IPG-based method showed higher protein loss, especially for basic proteins [4] |
| Dynamic Range | High | High | Both techniques provided high dynamic range in proteomic profiling [3] |
Technical Advantages and Limitations
The experimental comparison revealed several technical distinctions between IEF-IPG and SDS-PAGE that impact their utility for specific applications:
IEF-IPG Advantages: The technique demonstrated the highest average number of detected peptides per protein, which is particularly beneficial for quantitative and structural characterization of proteins in large-scale biomedical applications [3]. The focusing effect concentrates proteins at their pI, enhancing detection sensitivity [2]. The availability of narrow-range IPG strips enables high-resolution separation of proteins with minimal pI differences [52].
IEF-IPG Limitations: A significant limitation observed was poor performance for basic proteins (pI > 7), with approximately 50% of basic protein spots showing irreproducible results in broad-range IPG separations [4]. Protein loss during the procedure was higher compared to other techniques, particularly for basic proteins [4]. The requirement for specialized equipment and careful control of sample ionic strength presents additional practical challenges [3].
SDS-PAGE Advantages: The technique yielded the highest number of protein identifications in the comparative study [3]. It provides robust performance across a wide molecular weight range, particularly when using gradient gels [13]. The simplicity of the protocol and widespread familiarity among researchers make it accessible for routine applications [13].
SDS-PAGE Limitations: Separation is primarily by molecular weight, offering limited resolution for proteins with similar masses but different charges or isoforms [13]. The denaturing conditions disrupt non-covalent protein complexes, making it unsuitable for analyzing native protein interactions [13]. The limited resolution for complex mixtures often requires additional fractionation steps, such as gel slicing into multiple bands for downstream analysis [3].
Applications for Protein Isoforms and Complexes Analysis
Protein Isoform Separation
Protein isoforms generated through post-translational modifications or alternative splicing typically exhibit charge differences with minimal molecular weight variations. IEF-IPG provides superior resolution for such separations, as demonstrated in analyses of protein standards and mitochondrial extracts where it achieved the highest number of detected peptides per protein [3]. This high peptide coverage is essential for comprehensive characterization of isoforms and detection of PTMs.
In studies of cytosolic unfolded protein response in Saccharomyces cerevisiae, NEPHGE-based IEF (a variant of IEF) successfully identified the highly basic protein Sis1p, whereas IPG-based methods provided unreliable results for basic proteins [4]. This highlights the critical importance of selecting appropriate pH ranges and IEF formats for specific protein populations.
Protein Complex Analysis
While both IEF-IPG and SDS-PAGE are denaturing techniques, their different separation principles offer complementary information about protein complexes. SDS-PAGE under denaturing conditions reveals subunit composition when combined with crosslinking strategies [52]. Native PAGE, a non-denaturing variant of gel electrophoresis, preserves protein complexes and separates based on both size and charge, enabling analysis of quaternary structure and functional activity [13].
For comprehensive characterization of protein complexes, orthogonal approaches combining size-based and charge-based separations often provide the most complete information. The comparative study demonstrated that IEF-IPG and 1-D SDS-PAGE provide complementary protein identification results, suggesting their combined use improves profiling sensitivity without significant decrease in throughput [3].
Research Reagent Solutions
Table 3: Essential Research Reagents for IEF-IPG and SDS-PAGE Techniques
| Reagent Category | Specific Examples | Function and Application |
|---|---|---|
| IPG Strips | Commercially available IPG strips (various pH ranges and lengths) | Provide immobilized pH gradients for first dimension IEF separation [52] |
| Chaotropic Agents | Urea (7M), Thiourea (2M) | Denature proteins while maintaining solubility for IEF separations [3] |
| Detergents | CHAPS (4%), Triton X-100, SDS (2%) | Solubilize proteins and prevent aggregation during separation [3] [52] |
| Reducing Agents | Tributylphosphine (TBP), Dithiothreitol (DTT) | Reduce disulfide bonds to ensure complete denaturation [3] |
| Alkylating Agents | Acrylamide | Alkylate cysteine residues to prevent reformation of disulfide bonds [3] |
| Carrier Ampholytes | IPG Buffer, Ampholines | Establish and stabilize pH gradients in IEF [2] |
| Gel Matrix Components | Acrylamide, Bis-acrylamide, APS, TEMED | Form polyacrylamide gel matrix for molecular sieving [13] |
| Buffer Systems | Tris-HCl, Tris-Glycine | Maintain appropriate pH and conductivity during electrophoresis [52] [13] |
This comparative case study demonstrates that both IEF-IPG and SDS-PAGE offer distinct advantages for protein separation with complementary capabilities. IEF-IPG provides superior resolution for charge-based separations, making it particularly valuable for analyzing protein isoforms and post-translationally modified proteins with minimal molecular weight differences. SDS-PAGE offers robust, high-capacity separation by molecular weight with exceptional reproducibility.
The experimental data reveal that IEF-IPG achieves higher peptide coverage per protein, which benefits protein characterization, while 1-D SDS-PAGE yields slightly higher total protein identifications in complex mixtures [3]. However, IPG-based techniques show limitations for basic proteins, where alternative IEF formats may be preferable [4].
For comprehensive analysis of protein isoforms and complexes, researchers should consider orthogonal approaches that leverage the strengths of both techniques. The combination of IEF-IPG and SDS-PAGE in two-dimensional electrophoresis remains a powerful tool for proteomic analysis, though each technique also provides substantial value when used independently for specific applications. Selection between these methods should be guided by the particular protein properties of interest, required resolution, and downstream analytical needs.
In mass spectrometry (MS)-based proteomic profiling, the initial protein fractionation step is critical for reducing sample complexity and enhancing the sensitivity of downstream analysis. The choice between gel-based separation techniques, primarily isoelectric focusing with immobilized pH gradients (IEF-IPG) and sodium dodecyl sulfate-polyacrylamide gel electrophoresis (SDS-PAGE), significantly influences protein recovery, resolution, and ultimately, protein identification rates. This guide provides an objective comparison of these techniques, focusing on their fractionation efficiency and compatibility with MS validation, supported by experimental data to inform method selection for proteomic research and drug development.
Quantitative Comparison of Fractionation Techniques
A direct comparative study evaluated common gel-based protein separation techniques for their performance in nanoLC-ESI-MS/MS analysis using a mixture of protein standards and mitochondrial extracts from rat liver. The results, summarized in Table 1, demonstrate that while all techniques provide complementary identifications, their performance metrics differ notably [3] [53].
Table 1: Performance Metrics of Gel-Based Fractionation Techniques in Proteomic Profiling
| Fractionation Technique | Relative Number of Protein Identifications | Average Number of Peptides per Protein | Key Advantages | Key Limitations |
|---|---|---|---|---|
| 1-D SDS-PAGE | Highest | Moderate | High protein load capacity, effective for complex samples [3] | Separation primarily by molecular weight only [3] |
| Preparative 1-D SDS-PAGE | Moderate | Moderate | Preparative-scale separation [3] | Lower protein recovery due to increased gel volume [3] |
| IEF-IPG | Highest | Highest | Superior peptide detection per protein, sharp focusing by pI [3] | Challenges with very basic proteins (pI > 8.5) [3] [4] [21] |
| 2-D PAGE | Lower | Lower | Orthogonal separation (pI & MW), high resolution for specific spots [3] [13] | High protein loss, low throughput, poor recovery of hydrophobic proteins [3] |
The data indicates that 1-D SDS-PAGE and IEF-IPG yielded the highest number of protein identifications. However, the IEF-IPG technique resulted in the highest average number of detected peptides per protein, which is a critical factor for achieving high sequence coverage and confidence in protein identification [3]. The combination of these orthogonal techniques has been demonstrated to improve profiling sensitivity without a significant decrease in throughput [3].
Detailed Experimental Protocols
To ensure reproducibility and provide a clear framework for the comparative data, this section outlines the key methodologies from the cited studies.
Sample Preparation Protocol
The foundational steps for sample preparation were consistent across the evaluated techniques [3]:
- Homogenization and Lysis: Samples (protein standard mixtures or mitochondrial extracts) were homogenized and lysed in IEF buffer (7M urea, 2M thiourea, 4% CHAPS).
- Reduction and Alkylation: Supernatants were reduced with 5 mM Tributylphosphine (TBP) and alkylated with 10 mM acrylamide in 25 mM ammonium bicarbonate (pH 8.0) at 37°C for 90 minutes. The reaction was quenched with 50 mM DTT.
- Clean-up and Concentration: The resulting protein extracts were cleaned and concentrated using 10 kDa molecular weight cut-off (MWCO) centrifugal filters. The conductivity was adjusted to ≤ 300 µS/cm for IEF-compatibility.
Gel-Based Fractionation Protocols
1-D SDS-PAGE and Preparative 1-D SDS-PAGE
- Procedure: Samples were diluted in a sample buffer (63 mM Tris HCl, 10% glycerol, 2% SDS, 0.0025% bromophenol blue, pH 6.8) supplemented with 50 mM DTT. They were then loaded onto Criterion 8–16% polyacrylamide gels for separation [3].
- Difference: In the standard GeLC-MS/MS approach, the entire gel lane is sliced into multiple fractions post-electrophoresis, each of which is subjected to in-gel digestion. The "preparative" version involves a larger scale separation, often with increased gel thickness, which can lead to lower protein recovery due to the larger total gel volume [3].
IEF with Immobilized pH Gradients (IEF-IPG)
- Procedure: Protein samples were focused based on their isoelectric point using IPG strips. For optimal results, the IEF running conditions were carefully controlled. A typical protocol for a mini-gel system involves [54] [21]:
- Rehydration: IPG strips are rehydrated with the protein sample in a dedicated buffer overnight.
- Isoelectric Focusing: The IEF is performed using a stepwise voltage protocol:
- 100 V for 1 hour
- 200 V for 1 hour
- 500 V for 30 minutes
- Equilibration: Post-IEF, strips are equilibrated in buffers containing reductants (e.g., DTT) and alkylating agents to prepare proteins for the second dimension or subsequent in-gel digestion.
Mass Spectrometry Analysis
Following fractionation, all gel fractions (bands from SDS-PAGE or slices from IPG strips) were processed as follows [3]:
- In-Gel Digestion: Each gel piece was subjected to in-gel enzymatic digestion using a proteolytic enzyme such as trypsin.
- Peptide Extraction: The resulting peptides were extracted from the gel matrix.
- nanoLC-ESI-MS/MS Analysis: The peptide mixtures were analyzed by nanoflow liquid chromatography coupled to electrospray ionization tandem mass spectrometry (nanoLC-ESI-MS/MS).
Workflow and Logical Pathway
The following diagram illustrates the logical workflow for comparing IEF-IPG and SDS-PAGE fractionation techniques and their impact on downstream protein identification via mass spectrometry.
The Scientist's Toolkit: Essential Research Reagents
Successful execution of these fractionation and analysis protocols requires specific reagents and instruments. Table 2 lists key solutions and their functions critical for IEF-IPG and SDS-PAGE workflows.
Table 2: Key Reagent Solutions for Protein Fractionation Workflows
| Reagent / Solution | Function / Purpose |
|---|---|
| IEF Buffer (e.g., 7M Urea, 2M Thiourea, 4% CHAPS) | Denaturing solubilization buffer for proteins, preserving their charge for IEF [3]. |
| ZOOM 2D Protein Solubilizer | Proprietary solution to enhance solubilization of complex proteins, including hydrophobic and membrane proteins [21]. |
| Reducing Agent (e.g., DTT, TBP) | Breaks disulfide bonds to fully denature proteins [3] [21]. |
| Alkylating Agent (e.g., Acrylamide, Iodoacetamide) | Modifies cysteine residues to prevent reformation of disulfide bonds [3] [21]. |
| Carrier Ampholytes | Soluble molecules that establish and stabilize a linear pH gradient in IEF [21]. |
| IPG Strips | Pre-cast gels with an immobilized pH gradient for the first dimension of 2DE or IEF fractionation [54] [13]. |
| Mass Spectrometry-Compatible Stain (e.g., Coomassie) | Allows visualization of protein bands/spots without interfering with subsequent MS analysis [54]. |
| Volatile Salt (e.g., Ammonium Bicarbonate) | MS-compatible buffer for digestion and extraction; breaks down into gaseous products [54]. |
| Proteolytic Enzyme (e.g., Trypsin) | Enzyme that cleaves proteins into peptides suitable for LC-MS/MS analysis [3]. |
The comparative data clearly shows that the choice between IEF-IPG and SDS-PAGE involves a trade-off. 1-D SDS-PAGE offers robust, high-capacity fractionation that is excellent for deconvoluting complex samples and achieves high protein identification counts [3]. In contrast, IEF-IPG provides superior resolution based on isoelectric point and generates more peptide data per protein, which is advantageous for protein characterization, including post-translational modification analysis [3].
However, it is crucial to consider the limitations of each technique. The recovery of proteins and peptides from the gel matrix is a critical factor, with higher losses associated with increased gel volume, as seen in preparative PAGE and 2-D PAGE [3]. Furthermore, the performance of IEF-IPG can be suboptimal for very basic proteins (pI > 8.5) due to issues like cathodic drift, whereas SDS-PAGE does not separate proteins by their inherent charge [4] [21].
For researchers aiming to maximize proteome coverage, an orthogonal strategy that combines 1-D SDS-PAGE and IEF-IPG fractionation is highly effective, as the techniques provide complementary protein identification results [3]. The selection of a fractionation method should be guided by the specific research goals, sample type, and the balance desired between throughput, sensitivity, and the depth of protein characterization.
Protein fractionation is a critical step in proteomic analysis, with isoelectric focusing using immobilized pH gradients (IEF-IPG) and sodium dodecyl sulfate-polyacrylamide gel electrophoresis (SDS-PAGE) emerging as two fundamental techniques. While both methods serve to reduce sample complexity and enhance detection sensitivity in mass spectrometry-based proteomics, they operate on distinct separation principles and offer complementary advantages [3]. This guide provides an objective comparison of IEF-IPG versus SDS-PAGE for protein fractionation efficiency, supported by experimental data and structured within a decision framework to help researchers select the optimal technique for their specific research goals.
Technical Principles and Separation Mechanisms
Isoelectric Focusing with Immobilized pH Gradients (IEF-IPG)
IEF-IPG separates proteins based on their isoelectric point (pI) - the pH at which a protein carries no net electrical charge. The technique utilizes a pH gradient covalently immobilized within a polyacrylamide gel matrix through buffering compounds called Immobilines [55]. When an electric field is applied, proteins migrate through this stable pH gradient until they reach the region where the pH matches their pI, resulting in focused, sharp bands [14]. Key advantages of IPG technology include exceptional resolution (capable of separating proteins differing by only 0.01 pH units), elimination of gradient drift common in carrier ampholyte-based systems, and high reproducibility due to the covalently immobilized gradient [14] [55].
SDS-Polyacrylamide Gel Electrophoresis (SDS-PAGE)
SDS-PAGE separates proteins primarily by molecular weight (MW). Proteins are denatured with the anionic detergent SDS, which imparts a uniform negative charge proportional to their mass [24]. When subjected to an electric field within a porous polyacrylamide gel matrix, proteins migrate at rates inversely correlated with their molecular size, with smaller proteins moving faster through the gel matrix [26]. The technique provides high resolution separation based on molecular weight, excellent reproducibility, and simplified sample preparation through protein denaturation [24]. Recent modifications have led to Native SDS-PAGE (NSDS-PAGE), which maintains protein function while preserving high resolution separation [26].
The following diagram illustrates the fundamental separation principles of each technique:
Performance Comparison and Experimental Data
Quantitative Comparison of Separation Efficiency
Direct comparison of IEF-IPG and SDS-PAGE reveals distinct performance characteristics that make each technique suitable for different applications. The following table summarizes key performance metrics based on experimental data:
Table 1: Performance Comparison of IEF-IPG vs. SDS-PAGE for Protein Fractionation
| Performance Metric | IEF-IPG | SDS-PAGE | Experimental Context |
|---|---|---|---|
| Separation Principle | Isoelectric point (pI) | Molecular weight (MW) | Fundamental technique principle [3] [24] |
| Identification Numbers | High (comparable to 1-D SDS-PAGE) | High (comparable to IEF-IPG) | Mitochondrial extracts from rat liver [3] |
| Peptides per Protein | Highest average detected | Lower than IEF-IPG | Protein standards mixture analysis [3] |
| Protein Recovery | Moderate, sample loss concerns | Moderate, sample loss concerns | Complex sample analysis [3] |
| Resolution Capability | ≤0.01 pI units | MW-based, limited for similar sizes | Theoretical and practical limits [8] [12] |
| Native State Preservation | Possible with optimization | No (denaturing), unless using NSDS-PAGE | Functional protein studies [26] |
| Reproducibility | High with IPG strips | High with standardized protocols | Inter-laboratory comparisons [24] [4] |
| Basic Protein Performance | Limited for pI >7 [4] | Consistent across pI range | Broad pH range analysis [4] |
| Throughput | Moderate to high | High | Typical laboratory workflow [3] |
Complementary Nature of Techniques
Experimental evidence demonstrates that IEF-IPG and SDS-PAGE provide complementary protein identification results rather than being mutually exclusive. A comparative study of gel-based separation techniques found that while both methods yielded high identification numbers, they often identified different subsets of proteins from complex samples [3]. This complementary relationship is exploited in two-dimensional electrophoresis (2-DE), where IEF-IPG is used in the first dimension and SDS-PAGE in the second, enabling separation based on both pI and molecular weight [8] [4].
The IEF-IPG technique demonstrated the highest average number of detected peptides per protein, which is particularly beneficial for quantitative and structural characterization of proteins in large-scale biomedical applications [3]. However, SDS-PAGE showed more consistent performance across extreme pI ranges, while IPG-based methods exhibited limitations for basic proteins (pI >7) [4].
Detailed Experimental Protocols
IEF-IPG Standard Protocol
Sample Preparation:
- Protein extracts should be solubilized in IEF buffer (7M urea, 2M thiourea, 4% CHAPS) [3]
- Reduce and alkylate proteins with 5 mM TBP and 10 mM acrylamide in 25 mM ammonium bicarbonate (pH 8.0) at 37°C for 90 minutes [3]
- Quench alkylation reaction with 50 mM DTT [3]
- Adjust sample conductivity to ≤300 μS/cm using centrifugal ultrafiltration with 10 kDa MWCO filters [3]
First Dimension IEF-IPG:
- Use commercial IPG strips with pH range appropriate to target proteins (narrow range for higher resolution) [12]
- Active rehydration: Apply voltage (30-50 V) for 10-12 hours during rehydration [4]
- Focusing conditions: Gradually increase voltage to 8000 V for a total of 30,000-40,000 Vh [4]
- Temperature: Maintain at 20°C throughout focusing [4]
Strip Equilibration:
- Equilibrate focused IPG strips in SDS-containing buffer (6 M urea, 30% glycerol, 2% SDS, 50 mM Tris-HCl, pH 8.8) [4]
- Include 1% DTT in first equilibration step (10-15 minutes) [4]
- Include 2.5% iodoacetamide in second equilibration step (10-15 minutes) for alkylation [4]
SDS-PAGE Standard Protocol
Sample Preparation:
- Dilute protein samples in SDS-PAGE sample buffer (63 mM Tris HCl, 10% glycerol, 2% SDS, 0.0025% bromophenol blue, pH 6.8) [3]
- Supplement with 50 mM DTT as reducing agent [3]
- For denaturing conditions: Heat samples at 70°C for 10 minutes [26]
- For native conditions (NSDS-PAGE): Omit heating step and reduce SDS concentration [26]
Gel Electrophoresis:
- Use pre-cast or hand-cast polyacrylamide gels with appropriate percentage (8-16% for broad MW range) [3]
- Running buffer: 50 mM MOPS, 50 mM Tris Base, 0.1% SDS, 1 mM EDTA, pH 7.7 (standard SDS-PAGE) [26]
- For NSDS-PAGE: Reduce SDS to 0.0375% and omit EDTA from running buffer [26]
- Running conditions: Constant voltage of 200 V for approximately 45 minutes until dye front reaches gel bottom [26]
Protein Visualization:
- Fix proteins in gel using 40% ethanol/10% acetic acid for 30 minutes [4]
- Stain with Coomassie Brilliant Blue, Sypro Ruby, or silver stain depending on sensitivity requirements [4]
- Destain as needed and image using appropriate scanning systems [4]
The following workflow diagram illustrates the key procedural differences between the two techniques:
Research Reagent Solutions
Successful implementation of IEF-IPG and SDS-PAGE techniques requires specific reagents and materials. The following table outlines essential solutions and their functions:
Table 2: Essential Research Reagents for Protein Fractionation Techniques
| Reagent/Material | Function | Application |
|---|---|---|
| Immobiline Buffers | Create immobilized pH gradient in polyacrylamide gel | IEF-IPG [55] |
| Carrier Ampholytes | Generate pH gradient in solution-based IEF | Conventional IEF [55] |
| SDS (Sodium Dodecyl Sulfate) | Denature proteins and impart uniform charge | SDS-PAGE [24] |
| CHAPS Detergent | Solubilize proteins without interfering with IEF | IEF-IPG sample buffer [3] |
| Urea/Thiourea | Protein denaturants for improved solubility | IEF-IPG sample buffer [3] |
| DTT (Dithiothreitol) | Reduce disulfide bonds in proteins | Sample preparation for both techniques [3] |
| Iodoacetamide | Alkylate cysteine residues to prevent reformation | Sample preparation for both techniques [4] |
| Acrylamide/Bis-acrylamide | Form porous gel matrix for separation | Gel formation for both techniques [3] |
| Coomassie Stains | Visualize proteins in gels after separation | Detection for both techniques [4] |
Decision Framework for Technique Selection
Selecting between IEF-IPG and SDS-PAGE requires careful consideration of research goals, sample characteristics, and analytical requirements. The following decision framework provides guidance for selecting the optimal technique:
Application-Specific Recommendations
Choose IEF-IPG when:
- Separation based on isoelectric point is critical for your research question
- Analyzing post-translational modifications that alter charge characteristics (e.g., phosphorylation, deamidation) [14]
- High resolution separation of protein isoforms with minimal pI differences is required
- Studying acidic to moderately basic proteins (pI 3-7) where IPG technology performs optimally [4]
Choose SDS-PAGE when:
- Molecular weight determination or separation by size is the primary objective
- Analyzing basic proteins (pI >7) where standard IPG methods show limitations [4]
- Routine analysis requiring standardized, reproducible protocols across multiple laboratories
- Sample contains hydrophobic or membrane proteins that may precipitate at their pI
Consider Native SDS-PAGE when:
- Preserving protein function (enzymatic activity, metal binding) is essential [26]
- Maintaining protein-protein interactions or complex integrity is important
- Subsequent functional assays require proteins in native conformation [26]
Employ Two-Dimensional Electrophoresis when:
- Comprehensive proteome analysis with maximum resolution is required [8]
- Analyzing extremely complex samples with wide dynamic range [4]
- Characterizing both pI and MW simultaneously for protein identification
Emerging Trends and Advanced Applications
Microfluidic and Miniaturized Systems
Recent advancements in microfluidic IEF-IPG devices have addressed the challenge of cathodic drift, with IPG-based microsystems demonstrating a 24-fold reduction in cathodic drift velocity compared to carrier ampholyte-based systems [14]. Mixed-bed IEF approaches combining IPG gels with carrier ampholytes show even greater stability with 43-fold reduction in cathodic drift, enabling high-resolution separations in microfluidic formats [14]. These miniaturized systems require smaller sample volumes (approaching single-cell analysis) while improving separation speed and compatibility with downstream mass spectrometry analysis [14] [8].
Complementary Gel-Free Approaches
OFFGEL electrophoresis represents a hybrid technique that combines the high resolution of IPG with solution-phase protein recovery, eliminating the need for protein extraction from gel matrices [50]. This technology enables efficient fractionation of proteins and peptides according to pI while maintaining the sample in solution, improving compatibility with downstream LC-MS/MS analysis [50]. Studies demonstrate that OFFGEL electrophoresis provides complementary results to gel-based approaches, often identifying different protein subsets and improving overall proteome coverage [50] [56].
IEF-IPG and SDS-PAGE represent complementary rather than competing techniques for protein fractionation in proteomic research. IEF-IPG excels in high-resolution pI-based separation, particularly for acidic to neutral proteins and characterization of charge variants, while SDS-PAGE provides robust molecular weight-based separation with consistent performance across diverse protein types. The decision framework presented here enables researchers to select the optimal technique based on their specific research goals, sample characteristics, and analytical requirements. For comprehensive proteome analysis, combining both techniques in two-dimensional electrophoresis remains the gold standard, leveraging the complementary strengths of each separation principle to achieve maximum resolution and proteome coverage.
Conclusion
IEF-IPG and SDS-PAGE are not competing but fundamentally complementary technologies that form the bedrock of high-resolution protein analysis. IEF-IPG excels in resolving proteoforms based on subtle charge differences, making it indispensable for studying post-translational modifications. In contrast, SDS-PAGE provides robust, high-resolution separation by molecular weight, ideal for assessing purity and expression. The choice between them—or the decision to use them sequentially in 2DE—depends entirely on the research question. Future directions point toward increased automation, integration with microfluidics for faster analysis and higher sensitivity, and deeper coupling with downstream mass spectrometry. For biomedical and clinical research, mastering these techniques is crucial for advancing biomarker discovery, characterizing biopharmaceuticals, and unraveling complex proteomic signatures of disease.
References
- 1. The molecular mass and isoelectric point of plant proteomes [https://bmcgenomics.biomedcentral.com/articles/10.1186/s12864-019-5983-8]
- 2. Chapter 30 Isoelectric Focusing and Two-Dimensional Gel ... [https://www.sciencedirect.com/science/article/abs/pii/S0076687909630305]
- 3. Comparison of in-gel protein separation techniques ... [https://pmc.ncbi.nlm.nih.gov/articles/PMC4234072/]
- 4. Comparison of first dimension IPG and NEPHGE techniques ... [https://proteomesci.biomedcentral.com/articles/10.1186/1477-5956-11-36]
- 5. Deciphering food proteins: The applications of SDS-PAGE ... [https://www.sciencedirect.com/science/article/abs/pii/S2212429225003025]
- 6. Microfluidic Preparative Free-Flow Isoelectric Focusing [https://pmc.ncbi.nlm.nih.gov/articles/PMC2826279/]
- 7. Evaluation of Protocols Used in 2-D Electrophoresis for ... [https://pmc.ncbi.nlm.nih.gov/articles/PMC5054159/]
- 8. Comparing Isoelectric Focusing with Gradient SDS-PAGE ... [https://eureka.patsnap.com/report-comparing-isoelectric-focusing-with-gradient-sds-page-efficiency]
- 9. Western blotting guide: Part 2, Protein separation by SDS- ... [https://www.jacksonimmuno.com/secondary-antibody-resource/technical-tips/western-blotting-guide-part-2/]
- 10. 通过SDS-PAGE测定分子量 [https://cj.sina.cn/articles/view/7822579954/1d24318f200101b5wo?froms=ggmp&vt=4]
- 11. How to Master SDS-PAGE Gel & Western Blot: 5 Proven ... [https://www.neobiotechnologies.com/resources/sds-page-gel-western-blot/?srsltid=AfmBOoova5IeR3Z-k3R3rO3j2afRb1aDAs_qYpGbA_vZ45f11gfW4vwJ]
- 12. Comparing Isoelectric Focusing vs Gel Electrophoresis for ... [https://eureka.patsnap.com/report-comparing-isoelectric-focusing-vs-gel-electrophoresis-for-ph-range]
- 13. Overview of Protein Electrophoresis [https://www.thermofisher.com/us/en/home/life-science/protein-biology/protein-biology-learning-center/protein-biology-resource-library/pierce-protein-methods/overview-electrophoresis.html]
- 14. Reducing Cathodic Drift during Isoelectric Focusing Using ... [https://pmc.ncbi.nlm.nih.gov/articles/PMC11140684/]
- 15. Effect of the operational parameters on the electromigration ... [https://www.sciencedirect.com/science/article/pii/S0039914025000876]
- 16. Isoelectric Prefractionation for Proteomics [https://www.chromatographyonline.com/view/isoelectric-prefractionation-proteomics]
- 17. Optimization of Large Gel 2D Electrophoresis for Proteomic ... [https://pmc.ncbi.nlm.nih.gov/articles/PMC3822429/]
- 18. Efficient Fractionation and Improved Protein Identification ... [https://www.sciencedirect.com/science/article/pii/S1535947620307441]
- 19. PROTEAN® i12™ IEF System: Independent Voltage and ... [https://www.bioradiations.com/protean-i12-ief-system-independent-voltage-and-current-control-enables-optimization-of-first-dimension-ief-conditions/]
- 20. IPG-strips versus off-gel fractionation [https://www.sciencedirect.com/science/article/abs/pii/S1874391912001108]
- 21. Protein Gel 2D Electrophoresis Support—Getting Started [https://www.thermofisher.com/us/en/home/technical-resources/technical-reference-library/protein-electrophoresis-western-blotting-support-center/protein-gel-2d-electrophoresis-support/protein-gel-2d-electrophoresis-support-getting-started.html]
- 22. SDS-PAGE Protocol [https://www.rockland.com/resources/sds-page-protocol/?srsltid=AfmBOopkapKVPuShYn4pqzBjmgLsL5QYZUu4ua_1LLv_sJVyxn5QGlTx]
- 23. SDS-PAGE [http://www.assay-protocol.com/molecular-biology/electrophoresis/denaturing-page.html]
- 24. Advantages and Disadvantages of SDS-PAGE Based ... [https://www.mtoz-biolabs.com/advantages-and-disadvantages-of-sds-page-based-protein-separation.html]
- 25. Advantages and Disadvantages of SDS-PAGE for Protein ... [https://www.mtoz-biolabs.com/advantages-and-disadvantages-of-sds-page-for-protein-separation.html]
- 26. Native SDS-PAGE: High Resolution Electrophoretic ... [https://pmc.ncbi.nlm.nih.gov/articles/PMC4517606/]
- 27. The Evolution of SDS-Based Protein Separation [https://www.bio-techne.com/resources/blogs/advantages-of-ce-sds]
- 28. Application of Separation technologies to Proteomics ... [https://www.sciencedirect.com/science/article/abs/pii/S0065323303010222]
- 29. Comparing Two-Dimensional Electrophoresis vs Isoelectric ... [https://eureka.patsnap.com/report-comparing-two-dimensional-electrophoresis-vs-isoelectric-focusing]
- 30. Protein Analysis-on-Chip Systems in Foodomics [https://www.mdpi.com/2072-6643/4/10/1475]
- 31. Proteoforms and their expanding role in laboratory medicine [https://pmc.ncbi.nlm.nih.gov/articles/PMC8672040/]
- 32. Overview of Post-Translational Modifications (PTMs) [https://www.thermofisher.com/us/en/home/life-science/protein-biology/protein-biology-learning-center/protein-biology-resource-library/pierce-protein-methods/overview-post-translational-modification.html]
- 33. Proteoforms, metastasis, and cancer therapy responses [https://www.nautilus.bio/blog/proteoforms-metastasis-and-cancer-therapy-responses-applications-of-proteomics-in-cancer/]
- 34. Nanoproteomics enables proteoform-resolved analysis of ... [https://www.nature.com/articles/s41467-020-17643-1]
- 35. Current Methods of Post-Translational Modification Analysis ... [https://pmc.ncbi.nlm.nih.gov/articles/PMC8072572/]
- 36. A Comprehensive Guide for Performing Sample Preparation ... [https://pmc.ncbi.nlm.nih.gov/articles/PMC5489772/]
- 37. 5 Steps to Fundamental Protein Preparation [https://www.thermofisher.com/us/en/home/life-science/protein-biology/protein-purification-isolation/5-steps-fundamental-protein-preparation.html]
- 38. High-Efficiency Protein Extraction From Lupine Roots [https://pmc.ncbi.nlm.nih.gov/articles/PMC12514137/]
- 39. Optimized sample preparation for two-dimensional gel ... [https://proteomesci.biomedcentral.com/articles/10.1186/1477-5956-7-38]
- 40. SDS-PAGE [https://en.wikipedia.org/wiki/SDS-PAGE]
- 41. Optimize Isoelectric Focusing Parameters for Protein Purification [https://eureka.patsnap.com/report-optimize-isoelectric-focusing-parameters-for-protein-purification]
- 42. SDS-PAGE: The science behind all those bubbles [https://www.antibodiesinc.com/pages/sds-page-demystified?srsltid=AfmBOooWTlyL0nwz0PMKFkHynFOOTMg5Mj55oJSjEuKtTWdA_kG_9Yqs]
- 43. Novex™ pH 3-10 IEF Protein Gels, 1.0 mm, 10-well, 5 ... [https://www.thermofisher.com/order/catalog/product/EC6655BOX/faqs]
- 44. Advantages and Disadvantages of 1D SDS-PAGE and IEF [https://www.mtoz-biolabs.com/advantages-and-disadvantages-of-1d-sds-page-and-ief.html]
- 45. How to Identify and Correct Isoelectric Focusing Gel ... [https://eureka.patsnap.com/report-how-to-identify-and-correct-isoelectric-focusing-gel-anomalies]
- 46. Troubleshooting SDS-PAGE Gel Running Issues [https://www.goldbio.com/blogs/articles/troubleshooting-sds-page-gel-running-issues?srsltid=AfmBOooYsrqsQuJxfCgqIKgudYvyArEgslWF4OaXrW4KgnLP39nKBKwU]
- 47. SDS-PAGE: The science behind all those bubbles [https://www.antibodiesinc.com/pages/sds-page-demystified?srsltid=AfmBOooo0A3t44jXuYrpOV7pRFutDPUNFaVfQXHvibclYM4WrpHJqcm9]
- 48. Proteomics/ Protein Separations- Electrophoresis/Two Dimensional... [https://en.wikibooks.org/wiki/Proteomics/Protein_Separations-_Electrophoresis/Two_Dimensional_Polyacrylamide_gel_Electrophoresis(2D-PAGE)]
- 49. Comparison of first dimension IPG and NEPHGE techniques ... [https://pmc.ncbi.nlm.nih.gov/articles/PMC3729415/]
- 50. A review on preparative and semi-preparative offgel ... [https://www.sciencedirect.com/science/article/abs/pii/S0003267014005078]
- 51. Immobilized pH gradient-driven paper-based IEF : a new method for... [https://clinicalproteomicsjournal.biomedcentral.com/articles/10.1186/1559-0275-8-10]
- 52. UNIT 10.4 Comparing Complex Protein Samples Using Two ... [https://pmc.ncbi.nlm.nih.gov/articles/PMC6579672/]
- 53. Comparison of in-gel protein separation techniques ... [https://pubmed.ncbi.nlm.nih.gov/22899259/]
- 54. protein separation | Proteomics and Mass Spectrometry ... [https://sites.psu.edu/msproteomics/tag/protein-separation/]
- 55. Isoelectric Focusing - an overview [https://www.sciencedirect.com/topics/engineering/isoelectric-focusing]
- 56. Comparison of peptide and protein fractionation methods ... [https://www.sciencedirect.com/science/article/pii/S2212968513000068]