Ensuring Reproducible Protein Analysis: A Strategic Comparison of SDS-PAGE and Modern Capillary Methods
This article provides a comprehensive framework for scientists and drug development professionals seeking to achieve reproducible protein analysis across different methodologies.
Ensuring Reproducible Protein Analysis: A Strategic Comparison of SDS-PAGE and Modern Capillary Methods
Abstract
This article provides a comprehensive framework for scientists and drug development professionals seeking to achieve reproducible protein analysis across different methodologies. It explores the fundamental principles of traditional SDS-PAGE, highlights common sources of variability, and systematically compares its performance against advanced alternatives like CE-SDS. By integrating foundational knowledge with practical troubleshooting guides and validation strategies, this resource empowers researchers to make informed methodological choices, optimize analytical workflows, and ensure data integrity in critical applications from biopharmaceutical development to clinical diagnostics.
SDS-PAGE Fundamentals: Understanding the Bedrock of Protein Separation
The separation of proteins by molecular weight is a cornerstone technique in molecular biology and biopharmaceutical development. For decades, sodium dodecyl sulfate-polyacrylamide gel electrophoresis (SDS-PAGE) has been the fundamental method for achieving this, providing a reliable means to analyze protein mixtures, assess purity, and determine molecular mass [1] [2]. The technique's unparalleled success hinges on two core principles: the uniform denaturation of proteins by the ionic detergent SDS, and the molecular sieving effect of the polyacrylamide gel matrix. Together, these processes negate the inherent variations in protein charge and shape, ensuring that separation occurs almost exclusively on the basis of size [3] [4].
This article explores these core principles in detail and frames them within a modern context of assaying reproducibility. While SDS-PAGE remains a gold standard, its manual nature introduces variability. The evolution towards automated capillary electrophoresis SDS (CE-SDS) represents a significant advancement for applications requiring high quantitative precision and reproducibility, such as biopharmaceutical quality control [1]. We will dissect the established methodology of SDS-PAGE, examine its limitations concerning reproducibility, and objectively compare its performance with the emerging capabilities of CE-SDS.
The Mechanism of SDS Denaturation
Role of Sodium Dodecyl Sulfate (SDS)
Sodium dodecyl sulfate (SDS) is an anionic detergent that plays the critical role of a universal charge-masking agent. When a protein sample is heated to 95°C in the presence of excess SDS and a reducing agent, two transformative events occur [4] [5]. First, the reducing agent (e.g., β-mercaptoethanol or dithiothreitol) cleaves disulfide bonds, dissociating multi-subunit proteins into their individual polypeptide chains [2] [4]. Second, SDS molecules bind to the now-linearized polypeptide chains via robust hydrophobic interactions [4].
The binding of SDS is highly systematic and consistent. Approximately 1.4 grams of SDS bind per 1 gram of protein, which translates to roughly one SDS molecule for every two amino acid residues [4]. This uniform coating accomplishes two key objectives:
- Charge Masking: The intrinsic positive and negative charges of the amino acid side chains become negligible compared to the overwhelming negative charge conferred by the sulfate groups of the bound SDS molecules. This gives all protein-SDS complexes a uniform negative charge-to-mass ratio [3] [5].
- Conformational Unfolding: By disrupting hydrophobic interactions and hydrogen bonds, SDS forces proteins into extended, rod-like shapes, effectively eliminating the influence of a protein's native three-dimensional structure on its migration [6].
This process ensures that the only meaningful difference between protein-SDS complexes as they enter the gel is their polypeptide chain length, which correlates directly with molecular weight [3].
The Molecular Sieving Effect of the Gel Matrix
Polyacrylamide as a Molecular Sieve
The polyacrylamide gel serves as a porous matrix that physically retards the movement of proteins based on their size. The gel is formed through the polymerization of acrylamide and a cross-linking agent, most commonly N,N'-methylenebisacrylamide (Bis) [2] [4]. The polymerization reaction, catalyzed by ammonium persulfate (APS) and TEMED, creates a three-dimensional network with pores of defined sizes [2] [3].
The pore size of the gel is inversely related to the percentage of polyacrylamide. For instance, a 7% gel has larger pores than a 12% gel. This allows for the selection of an appropriate gel concentration to optimize the separation of a target protein size range:
- Low-percentage gels (e.g., 8-10%) are ideal for resolving high molecular weight proteins.
- High-percentage gels (e.g., 12-15%) provide better separation for low molecular weight proteins [3].
- Gradient gels, which have a continuously increasing acrylamide concentration from top to bottom, offer a broad separation range and can resolve proteins with very subtle molecular weight differences [2] [4].
The Discontinuous Buffer System
A key feature of traditional SDS-PAGE that enhances resolution is the use of a discontinuous buffer system involving two distinct gel layers and different buffer ions [4]. This system consists of:
- Stacking Gel: A large-pore gel at a neutral pH (∼pH 6.8). In this region, the glycine ions from the running buffer have a low net charge and low mobility. This creates a zone where protein-SDS complexes stack into extremely sharp, concentrated bands before entering the separating gel [2] [4].
- Separating Gel: A small-pore gel at a basic pH (∼pH 8.8). Upon reaching this interface, the glycine ions become fully deprotonated, gain a strong negative charge, and overtake the proteins. The protein-SDS complexes then enter the separating gel where the sieving effect takes over, and separation based on molecular weight occurs [2] [4].
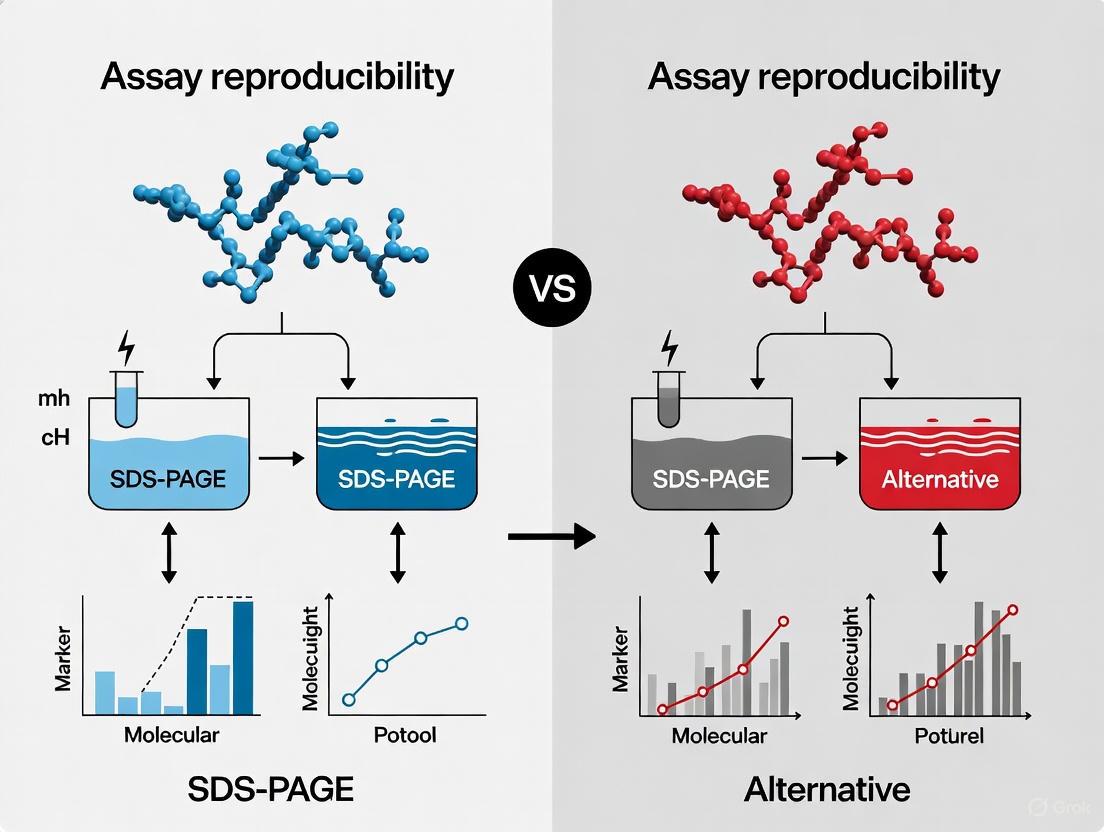
The following diagram illustrates the logical workflow and core principles of the SDS-PAGE separation process:
Comparative Performance: SDS-PAGE vs. CE-SDS
While SDS-PAGE is a powerful and ubiquitous technique, its manual nature can lead to variability in gel polymerization, sample loading, and staining, which impacts reproducibility [1]. Capillary Electrophoresis with SDS (CE-SDS) has emerged as an automated, high-performance alternative that leverages the same core principles of SDS denaturation and molecular sieving but in a capillary format filled with a replaceable polymer matrix [7] [1].
The table below summarizes a quantitative comparison of key performance metrics between the two techniques, highlighting differences critical for reproducible assaying.
Table 1: Quantitative Comparison of SDS-PAGE and CE-SDS Performance
| Performance Metric | SDS-PAGE | CE-SDS | Experimental Support |
|---|---|---|---|
| Molecular Weight Resolution | Can resolve proteins differing by ~10% in MW [4]. | Can resolve proteins differing by as little as 4% in molecular weight [7]. | Separation of protein standards across a 14,000 to 205,000 Da range [7]. |
| Reproducibility | Subject to gel-to-gel variability; manual processing introduces user-dependent factors [1]. | Superior reproducibility; automated separation and detection minimize variability [1]. | Consistent migration times and peak areas in repeated runs; used in biopharmaceutical QC [1]. |
| Quantitative Capability | Semi-quantitative via band intensity; subjective and prone to saturation [1]. | Linear quantitative response; peak area at 215 nm is proportional to protein mass [7] [1]. | Integrated peak areas show linear proportionality to the mass of protein injected [7]. |
| Sample Throughput | Lower throughput; run times of 60-90 minutes, plus staining/destaining [1]. | Higher throughput; results in as little as 5.5 minutes per sample for 96 samples [1]. | Direct data from commercial systems (e.g., Maurice Turbo CE-SDS Cartridge) [1]. |
| Detection Sensitivity | Good sensitivity with Coomassie; higher with silver stain, but non-linear. | High sensitivity with on-capillary UV detection. | Demonstrated detection of minor protein species in biotherapeutic analysis [1]. |
Experimental Protocols for Key Applications
Standard SDS-PAGE Protocol for Molecular Weight Determination
This is a detailed methodology for a standard SDS-PAGE experiment, as derived from multiple sources [3] [4] [5].
Gel Preparation:
- Resolving Gel: Mix acrylamide/bis-acrylamide solution, Tris-HCl buffer (pH 8.8), SDS, and water. Initiate polymerization by adding ammonium persulfate (APS) and TEMED. Pour between glass plates and overlay with a solvent like isopropanol to ensure a flat surface.
- Stacking Gel: After the resolving gel polymerizes, prepare a low-concentration acrylamide mix with Tris-HCl (pH 6.8), APS, and TEMED. Pour on top of the resolving gel and insert a sample comb.
Sample Preparation:
- Dilute protein samples in an SDS-containing sample buffer (typically containing Tris, glycerol, SDS, and a tracking dye like bromophenol blue).
- Add a reducing agent (e.g., 5% β-mercaptoethanol or 100mM DTT).
- Heat the samples at 95°C for 5 minutes (or 70°C for 10 minutes) to ensure complete denaturation [4].
Electrophoresis:
- Load denatured samples and a molecular weight marker into the wells.
- Submerge the gel in an electrophoresis tank filled with Tris-glycine-SDS running buffer.
- Apply a constant voltage of ~100-150 V for a mini-gel until the dye front reaches the bottom.
Visualization and Analysis:
- Stain the gel with Coomassie Brilliant Blue or silver stain to visualize protein bands.
- Plot the log(MW) of the standard proteins against their migration distance (Rf) to create a standard curve.
- Use the standard curve to estimate the molecular weight of unknown sample proteins.
CE-SDS Protocol for Quantitative Analysis
The protocol for CE-SDS, while based on the same principles, involves a different setup [7] [1].
- Instrument Setup: A CE-SDS instrument uses a narrow-bore silica capillary filled with a replaceable sieving matrix (e.g., a dextran or polyethylene oxide solution) instead of a cross-linked gel.
- Sample Preparation: Similar to SDS-PAGE, proteins are denatured and complexed with SDS in the presence of a reducing agent for reduced analysis or without for non-reduced analysis.
- Analysis:
- The sample is injected into the capillary electrokinetically or by pressure.
- An electric field is applied, and proteins migrate through the polymer matrix towards the anode.
- As proteins pass a UV (215 nm) or laser-induced fluorescence (LIF) detector near the capillary outlet, they are detected as peaks in an electropherogram.
- Data Output: The result is an electropherogram where migration time correlates with molecular size, and peak area is quantitatively proportional to protein mass [7] [1].
Essential Research Reagent Solutions
The following table details the key reagents and materials required to perform SDS-PAGE, along with their critical functions in the separation process.
Table 2: Key Reagents for SDS-PAGE-Based Protein Separation
| Reagent/Material | Function in the Experiment |
|---|---|
| Sodium Dodecyl Sulfate (SDS) | Anionic detergent that denatures proteins and confers a uniform negative charge, masking intrinsic charge differences [2] [4]. |
| Acrylamide / Bis-acrylamide | Monomer and cross-linker that polymerize to form the porous polyacrylamide gel matrix, which acts as a molecular sieve [3] [4]. |
| Ammonium Persulfate (APS) & TEMED | Catalyst (APS) and stabilizer (TEMED) for the free-radical polymerization reaction that forms the polyacrylamide gel [2] [4]. |
| Tris-HCl Buffers | Used at different pHs (6.8 for stacking, 8.8 for separating) to create the discontinuous buffer system essential for band sharpening and resolution [4]. |
| Reducing Agents (DTT, β-ME) | Cleave disulfide bonds in proteins, ensuring complete dissociation into individual subunits for accurate molecular weight analysis [2] [4]. |
| Protein Molecular Weight Marker | A mixture of proteins of known molecular weights run alongside samples to allow estimation of unknown protein sizes [3] [5]. |
| Coomassie Brilliant Blue Stain | A dye that binds proteins nonspecifically, allowing visualization of separated bands after electrophoresis [4]. |
The core principles of SDS-PAGE—SDS denaturation and molecular sieving—provide a robust foundation for protein separation by size. The technique's simplicity and effectiveness have cemented its status as a laboratory staple for initial protein characterization. However, when the research objective shifts towards high-precision quantitative analysis and highly reproducible assaying, as required in biopharmaceutical development and rigorous comparative studies, the limitations of traditional SDS-PAGE become apparent.
The evolution towards CE-SDS demonstrates that while the underlying chemical principles remain sound, the platform for their implementation can be optimized. CE-SDS maintains the core dependency on SDS denaturation and a sieving matrix but transposes it into an automated, capillary-based format. This transition yields superior resolution, quantitation, and reproducibility, directly addressing the need for highly reliable data in the context of assaying reproducibility between different methods and laboratories [7] [1]. Therefore, the choice between these techniques is not about which method is universally "better," but about selecting the right tool based on the required balance between traditional accessibility and modern quantitative rigor.
The Laemmli system, more commonly known as SDS-PAGE, represents a cornerstone technique in modern biochemistry and molecular biology. Developed by Ulrich K. Laemmli in 1970, this method revolutionized protein analysis by enabling high-resolution separation of polypeptides based on molecular weight [8] [9]. The original technique has undergone significant evolution, beginning with tube gels and progressing to the modern slab gel format, while new automated alternatives continue to emerge. This guide objectively compares the performance of classical Laemmli SDS-PAGE with contemporary separation technologies within the critical context of assaying reproducibility, a fundamental concern for researchers, scientists, and drug development professionals.
Historical Development: From Tube to Slab Gels
Ulrich Laemmli developed his discontinuous electrophoretic system while working as a postdoctoral fellow with Aaron Klug at the Medical Research Council's Laboratory of Molecular Biology in Cambridge, UK [8] [9]. His motivation was to analyze the structural proteins of the capsid of phage T4, which required resolving dozens of proteins that could not be dissociated under native conditions [8].
The Tube Gel Origins
Laemmli's original experiments utilized glass tube gels, where polyacrylamide was polymerized inside individual glass cylinders [9] [4]. The process was laborious and technically demanding:
- Gel casting involved preparing buffer and gel solutions, pouring them into tubes, and spraying SDS aerosols to create flat menisci [8].
- Sample processing required running samples, then cracking open the glass tubes with a hammer, slicing the gel lengthwise, and drying prior to staining [9].
- Safety concerns included regular exposure to acrylamide (a neurotoxin) through skin contact and inhalation of SDS aerosols [8].
Laemmli's key innovation was adapting the discontinuous (stacking) buffer system, originally described by Ornstein and Davis [9], to work with SDS-denatured proteins. This created the stacking effect where proteins concentrate into narrow bands before entering the separating gel, leading to dramatically improved resolution [8] [9].
Transition to Slab Gel Format
The evolution from tube gels to slab gels represented a major advancement for experimental reproducibility and throughput. As noted in historical accounts, "Some years later William Studier and Pat O'Farrell described slab gels, much more efficient for multiple sample than individual tube gels" [9]. This transition offered significant advantages:
- Multiple sample comparison: Enabled direct parallel analysis of multiple samples under identical conditions
- Improved reproducibility: Reduced gel-to-gel variability compared to individual tube gels
- Standardization: Facilitated protocol standardization across laboratories
- Western blotting: Enabled subsequent protein transfer for immunodetection
The slab gel format rapidly spread throughout the molecular biology community and has remained the primary configuration for SDS-PAGE for decades [9].
Core Principles of the Laemmli System
The Laemmli buffer system creates the physicochemical conditions necessary for high-quality protein separation through a specific blend of five critical components [10]:
Key Components and Their Functions
| Component | Function | Mechanism |
|---|---|---|
| SDS (Sodium Dodecyl Sulfate) | Denatures proteins and imparts negative charge | Binds to proteins (~1.4g SDS/g protein), masking intrinsic charge and creating uniform charge-to-mass ratio [10] [4] |
| Reducing Agent (β-mercaptoethanol or DTT) | Breaks disulfide bonds | Reduces covalent bonds through thiol group exchange, ensuring complete polypeptide separation [10] |
| Glycerol | Increases density for gel loading | Provides density (1.26 g/cm³) to help samples sink into wells [10] |
| Tris-HCl Buffer | Maintains stable pH environment | pH 6.8 matches stacking gel pH and is close to glycine's pI for optimal stacking [10] |
| Tracking Dye (Bromophenol Blue) | Visualizes migration progress | Small anionic dye migrates ahead of proteins, marking buffer front [10] [4] |
Discontinuous Buffer System
The Laemmli method employs a discontinuous buffer system with two distinct gel regions and pH environments [4]:
- Stacking Gel (pH ~6.8): Low-concentration polyacrylamide (4-6%) where proteins concentrate into sharp bands between chloride (leading) and glycine (trailing) ions
- Separating/Resolving Gel (pH ~8.8): Higher-concentration polyacrylamide (8-15%) where actual size-based separation occurs as glycine becomes fully deprotonated and migrates faster
This discontinuity creates a stacking effect that produces sharply defined protein bands, significantly enhancing resolution compared to continuous systems [4].
Experimental Protocols and Methodologies
Traditional Laemmli SDS-PAGE Protocol
- Mix protein sample with Laemmli sample buffer (typically 1:5 dilution for 1X final concentration)
- Heat denature at 95°C for 5 minutes or 70°C for 10 minutes
- Centrifuge briefly to collect condensed sample
Gel Preparation [4]:
- Cast resolving gel first (appropriate acrylamide percentage for target protein size)
- Overlay with water-saturated alcohol to create flat interface
- After polymerization, pour stacking gel and insert sample comb
- Polymerize completely (typically 15-30 minutes)
Electrophoresis [4]:
- Assemble gel in electrophoresis apparatus with running buffer
- Load samples and molecular weight markers
- Run at constant voltage (typically 100-200V) until dye front approaches bottom
- Typically requires 45-90 minutes depending on gel size and voltage
Detection [4]:
- Stain with Coomassie Blue, silver stain, or fluorescent dyes
- Destain if necessary
- Image and analyze band patterns
Modern Automated Alternative (Microfluidic)
The LabChip 90 System represents an automated microfluidic approach with this workflow [11]:
- Sample Aspiration: Automatically aspirates ~170 nL of sample directly from 96-well plates
- On-chip Dilution: Dilutes sample 1:1 with marker solution for internal standardization
- Electrophoretic Injection: Injects 20 pL sample plug into separation channel
- Separation and Detection: Separates proteins in polymer sieving matrix with laser-induced fluorescence detection
- Data Output: Generates electropherograms with automated sizing and quantitation
Comparative Performance Analysis
Quantitative Comparison of Separation Technologies
Table 1: Performance metrics of protein electrophoresis methods
| Parameter | Traditional Laemmli SDS-PAGE | Microfluidic Capillary Gel Electrophoresis | Agarose Gel Electrophoresis (Proteins) |
|---|---|---|---|
| Sample Throughput | 10-20 samples/gel, ~3-6 hours total [11] | 96 samples in ~1 hour [11] | Low (similar to SDS-PAGE) |
| Sample Volume | 5-50 μL | ~170 nL [11] | 5-50 μL |
| Resolution | High (discontinuous system) [12] | Comparable or superior to 4-20% gradient gels [11] | Lower [12] |
| Molecular Weight Range | 5-250 kDa [4] | 14-200 kDa (demonstrated) [11] | Broader but with lower resolution |
| Reproducibility | Moderate (gel-to-gel variability) | High (automated internal standardization) [11] | Moderate |
| Detection Sensitivity | ~10-100 ng (Coomassie) [4] | Similar or better with fluorescence [11] | Varies with stain |
| Data Output | Band patterns on gel | Digital electropherograms with automated analysis [11] | Band patterns on gel |
| Labor Intensity | High (manual multiple steps) | Low (automated from sample to data) [11] | High |
Table 2: Reproducibility assessment in method comparison
| Aspect | Traditional SDS-PAGE | Automated Alternatives |
|---|---|---|
| Inter-gel Variability | Higher due to manual gel casting and staining | Minimal with standardized cartridges [11] |
| Quantitative Accuracy | Semi-quantitative (densitometry) | Good (internal standards) [11] |
| Operator Dependence | Significant (experience affects results) | Minimal after setup [11] |
| Standardization Potential | Moderate between labs | High with identical instruments [11] |
| Documentation | Manual imaging and analysis | Automated digital record [11] |
Applications and Limitations in Reproducibility Research
Traditional Laemmli SDS-PAGE Strengths [13] [4]:
- Proven track record with extensive literature comparability
- Compatible with downstream applications (Western blotting, mass spectrometry)
- Lower initial equipment costs
- Flexible protocol modifications for specific needs
Documented Limitations in Reproducibility:
- Gel-to-gel variability in polymerization and staining [11]
- Manual processing introduces operator-dependent variables
- Semi-quantitative nature limits precise comparison between experiments
- Time-consuming steps increase procedural variability
Microfluidic/Capillary Electrophoresis Advantages [11] [14]:
- Automated processes reduce operator-induced variability
- Internal standardization with markers improves quantitative reproducibility
- Reduced manual intervention decreases error sources
- Digital output eliminates staining and imaging variables
Documented Limitations [14]:
- Reproducibility issues still reported in some capillary systems
- Serial analysis prevents direct lane-to-lane visual comparison
- Limited compatibility with 2D separation approaches
- Higher initial equipment costs and proprietary reagents
The Scientist's Toolkit: Essential Reagent Solutions
Table 3: Key research reagents for protein electrophoresis
| Reagent | Function | Specific Examples |
|---|---|---|
| Laemmli Sample Buffer | Protein denaturation and loading | 375 mM Tris-HCl (pH 6.8), 9% SDS, 50% glycerol, 9% β-mercaptoethanol, 0.03% bromophenol blue [15] |
| Polyacrylamide Matrix | Size-based separation matrix | Varying concentrations (8-15%) for different separation ranges [4] |
| Running Buffer | Conduct current and maintain pH | Tris-glycine-SDS buffer (25 mM Tris, 192 mM glycine, 0.1% SDS, pH 8.3) [4] |
| Molecular Weight Markers | Size calibration and quantification | Pre-stained or unstained protein ladders of known molecular weights [4] |
| Staining Reagents | Protein visualization | Coomassie Brilliant Blue, silver stain, SYPRO Ruby, fluorescent tags [4] |
| Destaining Solutions | Background reduction | Methanol-acetic acid solutions for Coomassie, various solvents for other stains [4] |
| Microfluidic Reagents | Automated system operation | Proprietary polymer matrices, fluorescent dyes, alignment markers [11] |
Evolution and Workflow Diagram
Evolution of Protein Electrophoresis Technology
The Laemmli system has demonstrated remarkable longevity and utility since its development in 1970, evolving from cumbersome tube gels to standardized slab gel configurations. While traditional SDS-PAGE remains a vital tool in research and diagnostic laboratories, evidence indicates that assaying reproducibility faces challenges due to methodological variability and operator dependence.
Contemporary automated alternatives, particularly microfluidic capillary electrophoresis systems, offer enhanced reproducibility through standardization, automation, and digital quantification. However, these technologies present their own limitations regarding flexibility and compatibility with established downstream applications.
For drug development professionals and researchers prioritizing reproducible quantitative analysis, automated systems present compelling advantages. For applications requiring methodological flexibility and established compatibility with subsequent protein characterization methods, optimized slab gel SDS-PAGE remains a valid choice. The selection between traditional and modern implementations of protein electrophoresis should be guided by specific research priorities, with reproducibility requirements weighing significantly in this methodological consideration.
The analysis of protein quaternary structure and disulfide bonds is a cornerstone of molecular biology, critical for understanding protein function, stability, and interactions. Sodium dodecyl sulfate-polyacrylamide gel electrophoresis (SDS-PAGE) serves as a fundamental tool for this purpose, with the choice between reducing and non-reducing conditions profoundly impacting analytical outcomes. Under reducing conditions, disulfide bonds are cleaved, disrupting quaternary structures and non-covalent interactions to reveal subunit composition. Conversely, non-reducing conditions preserve these covalent linkages, enabling analysis of native oligomeric states and disulfide-mediated complexes [16].
This distinction carries significant implications for assay reproducibility when comparing SDS-PAGE with alternative analytical methods. Many established techniques like Western blotting and quantitative real-time PCR generate measurements on relative scales, requiring careful alignment to enable comparability across different experimental setups [17]. Understanding how SDS-PAGE conditions influence protein separation is therefore essential for accurate data interpretation and methodological cross-validation in pharmaceutical development and basic research.
Fundamental Principles of Protein Separation
Mechanism of SDS-PAGE
SDS-PAGE separates protein molecules primarily by their molecular weight as they migrate through a polyacrylamide gel matrix under an electric field. The technique employs sodium dodecyl sulfate (SDS), an amphipathic detergent that denatures proteins by binding to hydrophobic regions in a constant ratio of approximately 1.4g SDS per 1g of protein. This SDS coating confers a uniform negative charge to all proteins, effectively masking their intrinsic charge properties. Consequently, separation occurs almost exclusively based on polypeptide chain length rather than native charge characteristics [16].
The polyacrylamide gel acts as a molecular sieve, with smaller proteins migrating faster through the pore network while larger proteins experience greater resistance and move more slowly. This size-dependent separation allows researchers to estimate molecular weights by comparing protein migration distances to standard markers of known mass [16].
Key Differences Between Reducing and Non-Reducing Conditions
The critical distinction between reducing and non-reducing SDS-PAGE lies in the treatment of disulfide bonds, which fundamentally alters the structural information obtained.
Table 1: Comparison of SDS-PAGE Conditions
| Parameter | Reducing Conditions | Non-Reducing Conditions |
|---|---|---|
| Disulfide Bond Integrity | Broken by reducing agents (e.g., β-mercaptoethanol, DTT) | Preserved intact |
| Quaternary Structure | Disassembled into subunits | Maintained for disulfide-linked complexes |
| Protein Mobility | Based on subunit molecular weight | Based on intact complex molecular weight |
| Information Obtained | Subunit composition and molecular weight | Oligomeric state and disulfide connectivity |
| Common Applications | Estimating subunit size, purity analysis | Detecting disulfide-linked complexes, native structure analysis |
Under non-reducing conditions, proteins maintain their disulfide bond networks, meaning that complexes connected by covalent linkages remain intact throughout the separation process. This allows researchers to visualize oligomeric states and identify proteins that form disulfide-stabilized multimers. In contrast, reducing conditions incorporate agents like β-mercaptoethanol or dithiothreitol (DTT) that break disulfide bonds, reducing them to free thiol groups. This treatment dissociates protein complexes into their constituent polypeptide chains, revealing information about subunit composition [16].
The following diagram illustrates the differential treatment of protein structure under these conditions:
Experimental Comparison and Data Analysis
Direct Comparative Studies
Several investigations have directly compared protein analysis under reducing versus non-reducing conditions to elucidate their respective advantages and limitations. In one study examining horseradish peroxidase (HRP) conjugates with bovine serum albumin (BSA) or human α1-proteinase inhibitor (α1-PI), non-reducing SDS-PAGE revealed hybrid species with molecular weights of approximately 110,000 and 130,000 Da, consistent with 1:1 conjugation stoichiometry. These complexes dissociated into their constituent subunits (BSA: 66,000 Da; HRP: 40,000 Da) when analyzed under reducing conditions, confirming their disulfide-dependent nature [18].
The same study highlighted important methodological considerations when comparing SDS-PAGE with alternative techniques like size exclusion chromatography (SEC). The basic conjugate units observed in non-reducing SDS-PAGE tended to form dimeric or higher-order aggregates under gel chromatographic conditions, underscoring how analytical environment influences protein behavior and apparent composition. This has significant implications for assay reproducibility across platforms [18].
Quantitative Comparison of Separation Outcomes
Table 2: Experimental Results from Protein Conjugation Analysis
| Analysis Condition | Observed Molecular Weight Species | Structural Interpretation | Methodological Considerations |
|---|---|---|---|
| Non-Reducing SDS-PAGE | 130,000 Da; 110,000 Da; >130,000 Da | 1:1 HRP:BSA conjugates; Higher-order polymers | Preserves disulfide-linked structures |
| Reducing SDS-PAGE | 66,000 Da (BSA); 40,000 Da (HRP) | Subunits of conjugates | Reveals individual components |
| Size Exclusion Chromatography | Higher molecular weight aggregates | Dimeric/multimeric structures | Solution behavior differs from electrophoretic conditions |
Research has demonstrated that the recovery of proteins and resulting proteolytic digests for downstream analysis is highly dependent on the total volume of the gel matrix and the electrophoretic conditions employed [19]. Non-reducing conditions typically yield better preservation of native disulfide linkages, which is crucial for subsequent mass spectrometric analysis of disulfide bond connectivity. However, this may come at the cost of reduced resolution for individual subunits in complex protein mixtures.
Methodological Protocols
Standard SDS-PAGE Protocol Under Reducing Conditions
Sample Preparation:
- Prepare protein samples at appropriate concentration (typically 1-10 µg/µL)
- Mix sample with reducing SDS-PAGE sample buffer (63 mM Tris-HCl, pH 6.8, 10% glycerol, 2% SDS, 0.0025% bromophenol blue)
- Add reducing agent (100 mM β-mercaptoethanol or 50 mM dithiothreitol)
- Heat denature at 95-100°C for 5-10 minutes to ensure complete denaturation and reduction [19] [16]
Gel Electrophoresis:
- Load prepared samples onto polyacrylamide gel (typically 8-16% gradient for broad molecular weight separation)
- Conduct electrophoresis at constant voltage (100-150V) until dye front reaches bottom of gel
- Visualize proteins with Coomassie Blue, silver stain, or transfer to membrane for immuno-detection [19]
Standard SDS-PAGE Protocol Under Non-Reducing Conditions
Sample Preparation:
- Prepare protein samples at appropriate concentration
- Mix with non-reducing SDS-PAGE sample buffer (identical composition but omitting reducing agents)
- Optional: mild heating (37°C for 30 minutes) to facilitate SDS binding without disrupting disulfide bonds
- Avoid boiling unless necessary, as excessive heat may promote disulfide scrambling [20] [16]
Gel Electrophoresis:
- Load samples onto polyacrylamide gel alongside reduced samples and molecular weight standards
- Conduct electrophoresis under standard conditions
- For disulfide bond analysis, parallel runs under reducing and non-reducing conditions are essential for comparative interpretation [20]
Specialized Techniques for Disulfide Bond Analysis
Non-Reducing Digestion for Mass Spectrometry:
- Perform enzymatic digestion under non-reducing conditions to preserve disulfide linkages
- Use proteases like trypsin, Glu-C, or Asp-N in appropriate buffers without DTT or β-mercaptoethanol
- Analyze resulting peptides by LC-MS/MS to identify disulfide-linked peptides through molecular weight shifts and fragmentation patterns [20]
Ellman's Assay for Free Thiol Quantification:
- Prepare native protein sample in appropriate buffer (pH 7.5-8.0)
- React with Ellman's reagent (DTNB) and measure absorbance at 412 nm
- Compare with fully reduced sample to calculate disulfide bond content based on free thiol concentration [20]
The experimental workflow for comprehensive disulfide bond analysis typically integrates multiple approaches:
Research Reagent Solutions
Successful implementation of reducing and non-reducing SDS-PAGE requires specific reagents optimized for protein separation and analysis. The following table details essential materials and their functions in experimental workflows.
Table 3: Essential Research Reagents for Protein Analysis Under Reducing and Non-Reducing Conditions
| Reagent/Category | Specific Examples | Function in Experimental Workflow |
|---|---|---|
| Reducing Agents | β-mercaptoethanol, DTT, TCEP | Break disulfide bonds to separate protein subunits |
| Detergents | Sodium dodecyl sulfate (SDS) | Denature proteins and confer uniform charge |
| Separation Matrices | Polyacrylamide gels (4-16%) | Molecular sieving based on protein size |
| Protein Stains | Coomassie Blue, Silver Stain, SYPRO Ruby | Visualize separated protein bands |
| Molecular Standards | Prestained & unstained protein ladders | Molecular weight calibration |
| Antibodies for Detection | Primary and HRP-conjugated secondary antibodies | Specific protein detection in Western blotting |
| Disulfide Stabilizers | N-ethylmaleimide (NEM), iodoacetamide | Alkylating agents to prevent disulfide scrambling |
For specialized applications like disulfide bond mapping, additional reagents are required. Alkylating agents such as iodoacetamide (IAM) are used to cap free thiol groups after reduction, preventing reoxidation and disulfide scrambling [20]. Specialized proteases including trypsin, Glu-C, and Asp-N are employed in bottom-up mass spectrometry approaches to generate peptide fragments while preserving disulfide linkages [20]. For quantitative assessment of disulfide content, Ellman's reagent (DTNB) provides a spectrophotometric method for determining free thiol concentration, enabling calculation of disulfide bond stoichiometry [20].
Reproducibility Considerations in Comparative Methodologies
Technical Challenges in SDS-PAGE Reproducibility
Assay reproducibility between SDS-PAGE and alternative methods faces several technical challenges. According to industry reports, approximately 41% of researchers experience Western blot failures at least 25% of the time, highlighting the significant reproducibility issues in protein analysis techniques [21]. Common problems include inconsistent band detection, uneven background, and lane-to-lane variations, which can be exacerbated by differences between reducing and non-reducing conditions.
The inherent limitations of SDS-PAGE as a relative quantification method further complicate reproducibility. Western blotting and similar techniques generate measurements on relative scales affected by systematic technical variations such as development time, sample loading, gel thickness, or antibody efficiency [17]. These scaling effects necessitate careful experimental design with overlapping conditions between different experiments to enable proper data alignment and comparability [17].
Methodological Alignment Strategies
To enhance reproducibility when comparing reducing and non-reducing SDS-PAGE with alternative methods, researchers can employ several alignment strategies:
Normalization Approaches:
- Use appropriate loading controls (housekeeping proteins like actin or GAPDH) validated for stability under specific experimental conditions
- Implement total protein normalization by staining total protein content before antibody probing
- Include internal standards that consistently express across all samples [22]
Experimental Design Considerations:
- Incorporate both technical and biological replicates to distinguish processing variations from true biological differences
- Ensure consistent sample preparation, especially in denaturation and reduction steps
- Control for variables like electrophoresis timing, transfer efficiency, and antibody incubation conditions [22] [21]
Computational approaches like the blotIt method have been developed to estimate scaling factors and align measurement data that obeys different scaling factors, thereby improving comparability across experimental repeats and methodological platforms [17].
The choice between reducing and non-reducing SDS-PAGE conditions fundamentally shapes the analytical information obtained about protein quaternary structure and disulfide bonds. Reducing conditions provide crucial insights into subunit composition by dismantling disulfide-linked complexes, while non-reducing conditions preserve native covalent structures, enabling analysis of oligomeric states and disulfide connectivity. The experimental data clearly demonstrates that these approaches yield complementary rather than redundant information, making parallel analysis under both conditions essential for comprehensive protein characterization.
For the research community focused on assay reproducibility, understanding how SDS-PAGE conditions influence protein separation is critical for methodological cross-validation. The technical challenges inherent in both approaches—particularly issues of normalization, scaling, and alignment with alternative methods—require careful experimental design and appropriate data processing strategies. By implementing the detailed protocols, reagent solutions, and reproducibility considerations outlined in this guide, researchers can enhance the reliability and interpretability of their protein structural analyses, ultimately advancing both basic research and biopharmaceutical development.
Sodium dodecyl sulfate-polyacrylamide gel electrophoresis (SDS-PAGE) remains a cornerstone technique in molecular biology labs for protein separation based on molecular weight. Its ubiquity is rooted in its ability to efficiently denature and separate proteins, providing critical insights for research, diagnostics, and pharmaceutical development [23] [14]. However, beneath its widespread use lies a significant challenge: inherent variability that can compromise the reproducibility and accuracy of experimental results. This variability poses a substantial obstacle in fields requiring precise protein characterization, such as biopharmaceutical development, where decisions hinge on reliable analytical data [24]. Within a broader thesis on assaying reproducibility, this guide objectively compares SDS-PAGE performance with emerging alternatives, leveraging experimental data to delineate the critical factors influencing reliability and precision in protein analysis.
The Fundamental Reproducibility Challenge in SDS-PAGE
The reproducibility issues in SDS-PAGE are well-documented. One study argues that "electrophoresis is poorly reproducible and the MWs obtained are often inaccurate," which negatively impacts the reliability of Western blot data and leads to "a considerable waste of reagents and labour" worldwide [25]. This problem stems from multiple technical sources of variability inherent to the technique itself.
The core principle of SDS-PAGE involves proteins binding SDS detergent in a constant ratio, becoming negatively charged and denatured, then separated through a polyacrylamide gel matrix under an electric field based primarily on polypeptide molecular mass [24]. While theoretically straightforward, this process introduces several variables affecting consistency:
- Gel Matrix Variability: Differences in polyacrylamide concentration, polymerization efficiency, and batch-to-batch reagent variations create inconsistencies in pore size and separation characteristics [19].
- Migration Pattern Inconsistencies: Without standardized reference data, comparing results across laboratories and studies becomes challenging [25].
- Staining and Detection Limitations: Techniques like Coomassie Blue staining have limited sensitivity and exhibit variability in band intensity quantification [19] [24].
- Manual Processing Steps: Multiple hands-on procedures introduce operator-dependent variability, unlike more automated systems [14] [24].
Table 1: Primary Sources of Variability in SDS-PAGE Experiments
| Variability Category | Specific Factors | Impact on Results |
|---|---|---|
| Gel Matrix | Polyacrylamide concentration, cross-linking efficiency, buffer composition | Alters migration rates, resolution, and band sharpness |
| Sample Preparation | Heating time, reduction/alkylation efficiency, SDS-protein ratio | Affects denaturation uniformity and charge-to-mass ratio |
| Electrophoresis Conditions | Voltage fluctuations, temperature, buffer ion depletion | Changes migration patterns and band distortion |
| Detection & Analysis | Staining variability, background noise, imaging parameters | Impacts quantification accuracy and sensitivity |
Quantitative Comparison: SDS-PAGE vs. CE-SDS
Capillary Electrophoresis with SDS (CE-SDS) has emerged as a competitive alternative, particularly for applications requiring high precision, such as antibody purity analysis in biopharmaceutical development. A direct comparative study analyzing normal and heat-stressed IgG samples reveals significant performance differences [24].
Experimental Protocol for Comparison
SDS-PAGE Methodology:
- System: Invitrogen NuPAGE Mini-Gel electrophoresis system
- Gel: 4–12% Bis-Tris gel
- Staining: GelCode Blue stain
- Sample Preparation: Antibody samples diluted to 0.2 mg/mL with water, then to 0.15 mg/mL with 4× LDS sample buffer
- Analysis: Gel imaging and quantification using Alpha View integration software [24]
CE-SDS Methodology:
- System: PA 800 plus capillary electrophoresis system (Beckman Coulter)
- Capillary: Bare, fused-silica
- Sample Preparation: Antibody samples diluted to 1.0 mg/mL with SDS sample buffer, non-reduced samples heated at 70°C for 3 minutes
- Injection: 5 kV for 20 seconds
- Separation: Electric field of 500 V/cm for 35 minutes
- Detection: UV detection at 220 nm
- Analysis: Quantitation using Beckman Coulter 32 Karat software [24]
Table 2: Performance Comparison Between SDS-PAGE and CE-SDS for Antibody Analysis
| Performance Metric | SDS-PAGE | CE-SDS |
|---|---|---|
| Analysis Time | ~60-90 minutes (plus staining/destaining) | ~35 minutes (no staining required) |
| Resolution | Moderate; overlapping bands possible | High; clear separation of fragments |
| Signal-to-Noise Ratio | Lower; impurities difficult to quantify | Higher; impurities easily detected and quantified |
| Detection of Nonglycosylated IgG | Not resolved | Clearly detected and quantified |
| Quantitation Reproducibility | Moderate due to staining and imaging variability | High; four consecutive analyses showed good reproducibility |
| Degree of Automation | Low; multiple manual steps | High; automated from injection to detection |
The experimental results demonstrated CE-SDS's superior capability in detecting critical quality attributes, notably nonglycosylated IgG—a species that SDS-PAGE could not resolve [24]. This is functionally significant because glycosylation status affects antibody efficacy and safety. The signal-to-noise ratio for impurities in heat-stressed IgG was "much lower" in SDS-PAGE scans compared to CE-SDS electropherograms, making autointegration of impurity bands difficult with the gel-based method [24].
Critical Factors Affecting SDS-PAGE Reproducibility and Accuracy
Molecular Weight Determination Inaccuracy
A fundamental limitation of SDS-PAGE is its unreliable molecular weight (MW) estimation. Research creating a database of electrophoretic migration patterns for approximately 10,000 human proteins revealed consistent discrepancies between observed migration and theoretical molecular weights [25]. This inaccuracy stems from several factors:
- Post-Translational Modifications: Phosphorylation, glycosylation, and other modifications alter mass-to-charge ratio without proportionally affecting migration [25].
- Protein Structural Properties: Transmembrane domains and unusual amino acid compositions can cause anomalous migration [25].
- Gel Calibration Issues: Commercial MW standards may not adequately represent sample proteins, leading to extrapolation errors.
The development of standardized databases with accurate migration patterns for human proteins represents a promising approach to mitigating this issue, providing reference MWs measured by SDS-PAGE coupled with mass spectrometry validation [25].
Technical and Operator-Dependent Variability
The manual nature of SDS-PAGE introduces multiple potential error sources:
- Gel Polymerization Inconsistencies: Variations in acrylamide concentration, cross-linking efficiency, and catalyst activity create batch-to-batch matrix differences [19].
- Electrophoresis Condition Fluctuations: Voltage, temperature, and buffer ion depletion affect separation reproducibility [19] [25].
- Sample Preparation Variables: Incomplete reduction, alkylation, or SDS binding produces heterogeneous protein populations and smeared bands [24].
- Detection Limitations: Staining variability, non-linear signal response, and background noise compromise quantification accuracy [24].
SDS-PAGE Reproducibility Factors
Methodological Limitations for Specific Applications
SDS-PAGE demonstrates particular shortcomings in specialized applications:
- Antibody Characterization: Inability to resolve nonglycosylated IgG from glycosylated forms limits utility for biopharmaceutical quality control [24].
- Membrane Protein Analysis: Poor recovery of hydrophobic proteins due to precipitation and inadequate solubilization [19].
- Low Abundance Proteins: Limited dynamic range and detection sensitivity without specialized staining techniques [19].
- High-Throughput Settings: Manual processing and gel-to-gel variability make SDS-PAGE unsuitable for rapid, reproducible screening [23] [24].
Emerging Alternatives and Their Performance Characteristics
Capillary Gel Electrophoresis (CGE)
Also termed CE-SDS, this technique separates proteins in capillaries filled with sieving matrix using high voltage [14]. Key advantages include:
- Rapid Analysis: 10-100 times faster completion than slab gel electrophoresis [14].
- Automated Operation: Minimal supervision required after sample loading [14] [24].
- Superior Quantification: Direct UV detection provides digital data with high signal-to-noise ratio [24].
- Small Sample Requirements: Suitable for limited sample volumes [14].
However, CGE suffers from its own reproducibility challenges and inability to conveniently compare multiple samples side-by-side as with gel lanes [14]. The technique also requires specialized instrumentation and may struggle with protein complexes that traditional 2D gels separate effectively [14].
Microchip Capillary Gel Electrophoresis
An advancing technology showing promise for high-speed protein analysis, microchip CGE offers further miniaturization and potential for integrated multi-parameter analysis [14]. While not yet widely adopted, this approach may address throughput limitations of conventional CE-SDS while maintaining quantitative advantages over SDS-PAGE.
The Scientist's Toolkit: Essential Reagents and Materials
Table 3: Key Research Reagent Solutions for SDS-PAGE and CE-SDS
| Reagent/Material | Function | Application Notes |
|---|---|---|
| Polyacrylamide Bis-Tris Gels | Provides sieving matrix for protein separation | 4-12% gradient gels common; choice affects resolution range [24] |
| SDS (Sodium Dodecyl Sulfate) | Denatures proteins and confers negative charge | Critical for uniform charge-to-mass ratio; purity affects consistency [24] |
| Tris-Based Electrophoresis Buffers | Maintains pH and conductivity during separation | Tris-glycine most common; composition affects resolution [26] |
| Molecular Weight Markers | Enables size estimation and migration calibration | Prestained and unstained varieties available [19] [25] |
| Reducing Agents (DTT, β-ME) | Breaks disulfide bonds for complete denaturation | Essential for accurate subunit MW determination [24] |
| Coomassie Blue/Silver Stain | Visualizes separated protein bands | Different sensitivity levels; Coomassie most common [24] |
| Replaceable Sieving Polymers | Separation matrix for CE-SDS | Cross-linked polyacrylamide, dextran, or PEG-based formulations [14] |
SDS-PAGE remains a valuable technique for protein separation, particularly for educational purposes, initial protein characterization, and laboratories with budget constraints. However, its inherent variability in molecular weight determination, quantification accuracy, and inter-experiment reproducibility presents significant limitations for applications requiring precise, reliable data. CE-SDS emerges as a superior alternative for quantitative applications, especially in biopharmaceutical development where detection of critical quality attributes like glycosylation status is essential. While SDS-PAGE will maintain a place in the molecular biology laboratory, the evolution toward automated, quantitative capillary-based systems addresses many reproducibility challenges, aligning protein analysis with the rigorous demands of modern biomedical research and drug development.
Methodological Spectrum: From Traditional SDS-PAGE to Automated Capillary Systems
Sodium dodecyl sulfate-polyacrylamide gel electrophoresis (SDS-PAGE) remains a cornerstone technique in biochemical research for separating proteins based on their molecular weight. First developed in the 1970s by Ulrich Laemmli, this method provides a robust system for protein analysis that has become essential for various applications including protein purity assessment, molecular weight estimation, and sample preparation for downstream techniques like western blotting [27]. The reproducibility of SDS-PAGE makes it particularly valuable for comparative studies in drug development and basic research, where consistent protein separation is critical for reliable data interpretation.
The fundamental principle of SDS-PAGE involves using an anionic detergent (SDS) to denature proteins and impart a uniform negative charge, allowing separation based primarily on molecular size rather than inherent charge or shape when subjected to an electric field in a polyacrylamide gel matrix [28] [29]. This review examines the core protocols of SDS-PAGE with particular emphasis on how methodological variations in sample preparation, gel casting, and staining impact experimental reproducibility and comparability with alternative electrophoretic methods.
Core SDS-PAGE Methodology
Sample Preparation Protocol
Proper sample preparation is critical for achieving reproducible protein separation. The standard protocol involves several key steps to ensure complete protein denaturation and uniform charge distribution:
Protein Extraction: Cells or tissues are lysed using an appropriate buffer such as RIPA or NP-40, followed by centrifugation to remove insoluble debris [30]. The protein concentration of the supernatant should be quantified using assays like Bradford or BCA, with the BCA assay recommended for samples containing <5% detergent due to its higher sensitivity [30].
Denaturation and Reduction: Proteins are mixed with Laemmli sample buffer containing SDS and reducing agents. A typical loading buffer contains Tris-HCl, SDS, glycerol, bromophenol blue, and a reducing agent—either beta-mercaptoethanol (BME) or dithiothreitol (DTT) [31] [30]. The SDS concentration should be sufficient to bind to proteins at approximately 1.4 grams of SDS per gram of protein, which linearizes the proteins by disrupting hydrogen bonds and hydrophobic interactions [29].
Heat Treatment: Samples are heated at 95°C for 5-10 minutes to complete the denaturation process by breaking hydrogen bonds and ensuring full interaction with SDS [30] [32]. This step is crucial for destroying higher-order protein structures.
Centrifugation: Brief centrifugation at 12,000×g for 30 seconds removes any insoluble material that might cause smearing during electrophoresis [32].
Table 1: Standard SDS-PAGE Sample Buffer Composition
| Component | Concentration | Function |
|---|---|---|
| Tris-HCl | 62.5 mM (pH 6.8) | Maintains pH |
| SDS | 2% (w/v) | Denatures proteins, provides uniform charge |
| Glycerol | 10% (v/v) | Increases density for loading |
| Bromophenol Blue | 0.01% (w/v) | Visualizes migration |
| BME or DTT | 5% (v/v) | Reduces disulfide bonds |
Gel Casting and Composition
The polyacrylamide gel serves as a molecular sieve with customizable pore sizes controlled by acrylamide concentration. The standard discontinuous gel system consists of two distinct layers:
Resolving Gel Preparation: The separating gel typically contains higher acrylamide concentrations (7.5-20%) with a pH of approximately 8.8. The gel solution is prepared by mixing acrylamide/bis-acrylamide (typically in a 29:1 to 37.5:1 ratio), Tris-HCl buffer (pH 8.8), SDS, and polymerization initiators (ammonium persulfate and TEMED) [29] [30]. The solution is poured between glass plates and overlayered with water or isopropanol to create a flat surface and prevent oxygen inhibition of polymerization [28].
Stacking Gel Preparation: Once the resolving gel has polymerized, a stacking gel with lower acrylamide concentration (4-5%) and pH 6.8 is poured on top. A comb is inserted to create sample wells [28] [31]. The stacking gel utilizes the discontinuous buffer system to concentrate proteins into sharp bands before they enter the resolving gel, significantly improving resolution.
The polymerization reaction is catalyzed by ammonium persulfate (APS) and TEMED, which generate free radicals to initiate the cross-linking of acrylamide and bis-acrylamide monomers [28] [31]. The gel must polymerize completely (typically 30-60 minutes) before use to ensure consistent pore size and electrophoretic properties.
Table 2: Gel Compositions for Different Protein Size Ranges
| Protein Size Range | Acrylamide Percentage | Separation Characteristics |
|---|---|---|
| 5-50 kDa | 12-20% | Optimal for small proteins |
| 15-100 kDa | 10-12% | Standard range for most applications |
| 25-200 kDa | 8-10% | Better for larger proteins |
Figure 1: SDS-PAGE Experimental Workflow from Sample Preparation to Visualization
Electrophoresis Conditions
The electrophoresis process requires optimization of voltage and time for reproducible results:
Buffer System: The standard running buffer contains Tris, glycine, and SDS at pH 8.3. The glycine in the running buffer plays a critical role in the stacking process. At pH 8.3, glycine exists as glycinate anions, but when it enters the stacking gel at pH 6.8, it becomes predominantly zwitterionic with reduced mobility, creating a voltage gradient that stacks proteins into sharp bands [31].
Running Parameters: Gels are typically run at constant voltage, starting at 90V until the dye front enters the resolving gel, then increasing to 150V until the dye front reaches the bottom [32]. Running at higher voltages (100-200V) reduces time but may generate more heat, potentially affecting band resolution [27].
Molecular Weight Standards: Pre-stained or unstained protein ladders with known molecular weights are run alongside samples to enable molecular weight estimation and track electrophoresis progress [29].
Protein Visualization Techniques
After electrophoresis, proteins must be visualized using staining methods with varying sensitivities and compatibilities:
Coomassie Staining: Coomassie Brilliant Blue R-250 is the most common protein stain, detecting approximately 50 ng of protein per band [33]. The protocol involves incubating the gel in staining solution (0.05% Coomassie in 40% ethanol and 10% acetic acid) for 30 minutes to 2 hours, followed by destaining in 40% ethanol/10% acetic acid until background is clear [33]. Coomassie staining is quantitative and compatible with downstream applications like mass spectrometry [27].
Silver Staining: This more sensitive method detects 2-5 ng of protein per band but is less quantitative and may not stain all proteins equally [33]. Silver staining depends on the reaction of silver with sulfhydryl or carboxyl moieties in proteins, and the stained proteins become oxidized and unsuitable for further applications like sequencing [33].
Fluorescent Stains: Dyes like SYPRO Ruby offer broad dynamic range and high sensitivity ideal for proteomics applications while maintaining compatibility with mass spectrometry [27].
Table 3: Comparison of Protein Staining Methods
| Parameter | Coomassie Staining | Silver Staining | Fluorescent Stains |
|---|---|---|---|
| Sensitivity | ~50 ng/band | 2-5 ng/band | 1-10 ng/band |
| Quantitation | Good | Poor | Excellent |
| Cost | Low | Moderate | High |
| Downstream Applications | Compatible with MS | Not compatible | Compatible with MS |
| Reproducibility | High | Variable | High |
Comparative Method Analysis: SDS-PAGE vs. Alternative Techniques
Native SDS-PAGE (NSDS-PAGE)
A significant modification to standard SDS-PAGE, known as Native SDS-PAGE (NSDS-PAGE), has been developed to preserve certain functional properties while maintaining high resolution. This method eliminates the heating step, removes EDTA from sample buffers, and reduces SDS concentration in the running buffer from 0.1% to 0.0375% [34].
Experimental data demonstrates that this modified approach dramatically increases the retention of bound metal ions in metalloproteins from 26% in standard SDS-PAGE to 98% in NSDS-PAGE [34]. Furthermore, activity assays show that seven of nine model enzymes, including four zinc-containing proteins, retained activity after NSDS-PAGE separation, whereas all were denatured during standard SDS-PAGE [34]. This preservation of native characteristics comes with minimal impact on separation resolution, making NSDS-PAGE a valuable alternative when protein function must be maintained post-electrophoresis.
Blue Native PAGE (BN-PAGE)
Blue Native PAGE represents a fundamentally different approach that separates proteins in their native state without denaturation. This technique uses Coomassie G-250 to impart charge to native protein complexes, allowing separation based on both size and shape [34]. While BN-PAGE successfully preserves enzymatic activity and protein-protein interactions, it offers lower resolution compared to SDS-PAGE and can complicate molecular weight determination due to the influence of protein shape on migration [34].
The technique is particularly valuable for studying protein complexes and membrane proteins, but the discontinuous buffer system (different cathode and anode buffers) makes it more complex to perform than SDS-PAGE [34].
Table 4: Quantitative Comparison of Electrophoretic Methods
| Performance Metric | Standard SDS-PAGE | NSDS-PAGE | BN-PAGE |
|---|---|---|---|
| Resolution | High | High | Moderate |
| Metal Retention | 26% | 98% | >95% |
| Enzyme Activity Retention | 0/9 model enzymes | 7/9 model enzymes | 9/9 model enzymes |
| Molecular Weight Determination | Accurate | Accurate | Less accurate |
| Protein Complex Integrity | Disrupted | Partially maintained | Maintained |
| Typical Run Time | 45-60 minutes | 30-45 minutes | 90-95 minutes |
Figure 2: Decision Framework for Electrophoresis Method Selection Based on Research Goals
Essential Reagents for Reproducible SDS-PAGE
Table 5: Key Research Reagent Solutions for SDS-PAGE Experiments
| Reagent Category | Specific Examples | Function in Protocol | Critical Parameters |
|---|---|---|---|
| Denaturing Agents | SDS (Sodium Dodecyl Sulfate) | Linearizes proteins, imparts uniform charge | Purity, concentration (1.4g SDS/g protein ratio) |
| Reducing Agents | DTT (Dithiothreitol), BME (Beta-mercaptoethanol) | Breaks disulfide bonds | Freshness, concentration (typically 5% in sample buffer) |
| Gel Matrix Components | Acrylamide, Bis-acrylamide | Forms porous polyacrylamide gel | Ratio (29:1 to 37.5:1), percentage (4-20%) |
| Polymerization Initiators | APS (Ammonium Persulfate), TEMED | Catalyzes acrylamide polymerization | Freshness of APS solution, proper TEMED concentration |
| Buffers | Tris-HCl, Tris-Glycine, MOPS | Maintains pH, provides conducting medium | pH accuracy (6.8 for stacking, 8.8 for resolving) |
| Tracking Dyes | Bromophenol Blue | Visualizes migration front | Concentration, compatibility with detection method |
| Staining Reagents | Coomassie R-250, Silver nitrate, SYPRO Ruby | Visualizes separated proteins | Sensitivity, quantitation capability, MS compatibility |
The reproducibility of SDS-PAGE makes it an invaluable tool for comparative protein studies, but researchers must carefully consider methodological choices based on their specific applications. Standard SDS-PAGE provides the highest resolution for molecular weight determination and purity assessment, while NSDS-PAGE offers a compelling compromise when some native protein characteristics must be preserved. BN-PAGE serves specialized applications requiring complete maintenance of protein complexes and interactions.
For optimal reproducibility, researchers should standardize sample preparation protocols, particularly heating duration and reducing agent concentrations, carefully select acrylamide percentages appropriate for their target protein sizes, and establish consistent staining and destaining procedures. The quantitative comparisons provided in this review offer guidance for selecting the most appropriate electrophoretic method based on specific research requirements in drug development and protein analysis.
In the field of biopharmaceuticals, the analysis of protein purity is a critical component of quality control (QC), impacting everything from clone selection and process development to final product release [35]. For years, sodium dodecyl sulfate-polyacrylamide gel electrophoresis (SDS-PAGE) has been an essential tool for this purpose. However, the technological evolution towards capillary electrophoresis SDS (CE-SDS) represents a significant shift, offering a automated, quantitative approach that is increasingly becoming the industry standard [24] [35]. This transition is central to a broader thesis on assaying reproducibility, as the superior precision and automation of CE-SDS directly address key limitations of traditional slab gel methods.
SDS-PAGE, while foundational, is a labor-intensive technique prone to limitations that affect its reproducibility and quantitative accuracy. The process is lengthy, often requiring at least a day to run, stain, and destain a gel, and involves large volumes of toxic reagents [35]. Its staining reaction can be protein-dependent and display poor linearity, rendering the technique, at best, semi-quantitative [35]. Furthermore, gel-to-gel reproducibility can be problematic, even with commercial precast gels [35].
CE-SDS was developed to overcome these challenges. It employs the same principles of SDS denaturation and size-based separation but uses a gel-filled capillary instead of a slab gel [36]. This fundamental change in format enables full automation, from capillary conditioning and sample injection to separation and data reporting [35]. The technique uses a replaceable polymer sieving solution, which eliminates the lifetime problems associated with gel-filled capillaries and permits highly reproducible separations [35]. This guide provides a objective, data-driven comparison of these two techniques, focusing on their performance in protein purity analysis.
Performance Comparison: CE-SDS vs. SDS-PAGE
Direct comparisons using standardized samples reveal distinct differences in the capabilities of CE-SDS and SDS-PAGE. The following sections summarize key performance metrics.
Quantitative and Resolution Capabilities
A direct analysis of a human IgG antibody, both in its native and heat-stressed state, highlights fundamental differences. CE-SDS electropherograms provide high-resolution separation, allowing for easy identification and quantitation of degradation species due to a high signal-to-noise ratio [24]. In contrast, SDS-PAGE analysis of the same heat-stressed sample showed smearing patterns at higher concentrations (500-2,000 ng/µL), making accurate quality or sizing analysis difficult [36]. Furthermore, CE-SDS can readily detect critical species like nonglycosylated IgG, which SDS-PAGE cannot resolve—a significant advantage since glycosylation is crucial to IgG function [24].
Table 1: Comparative Analysis of a Heat-Stressed IgG Sample by SDS-PAGE and CE-SDS
| Feature | SDS-PAGE | CE-SDS |
|---|---|---|
| Major Band/Peak | 150 kDa | Intact IgG |
| Detected Impurities | Bands at 300, 130, 90, and 25 kDa | Peaks for Light Chain (LC), two Heavy Chains (2H), 2H1L, and nonglycosylated IgG |
| Signal-to-Noise Ratio | Much lower, difficult autointegration | High, allowing for easy quantitation |
| Resolution of Key Species | Could not detect nonglycosylated IgG | Easily detects and quantifies nonglycosylated IgG |
Analytical Performance: Accuracy, Precision, and Sensitivity
Systematic studies using model proteins demonstrate superior analytical performance for CE-SDS. In one study, Bovine Serum Albumin (BSA, 66 kDa) and Carbonic Anhydrase (CAII, 29 kDa) were analyzed across a dilution series on both systems [36].
Table 2: Sizing Accuracy and Precision for BSA and CAII
| Protein & Known Size | Method | Average Observed Size (kDa) | Average Error (%) | Average Precision (%CV) |
|---|---|---|---|---|
| BSA (66 kDa) | CE-SDS | 69.2 | 4.81 | 1.53 |
| SDS-PAGE | 59.2 | 10.25 | 13.71 | |
| CAII (29 kDa) | CE-SDS | 28.0 | 3.55 | Information missing |
| SDS-PAGE | 23.4 | 19.43 | Information missing |
The data shows that CE-SDS provides significantly greater accuracy and precision. Notably, the accuracy of SDS-PAGE was found to be concentration-dependent, with percent error improving as the concentration decreased. In contrast, the percent error for CE-SDS remained consistent across the dilution series, indicating a more robust method [36]. The precision of CE-SDS, as measured by %CV, is also far superior, demonstrating minimal run-to-run variation compared to the high inconsistency of SDS-PAGE between gels [36].
Regarding sensitivity, CE-SDS with UV detection is comparable to SDS-PAGE with Coomassie staining. However, the sensitivity of CE-SDS can be enhanced to rival silver-stained SDS-PAGE by using laser-induced fluorescence (LIF) detection. For example, derivatizing monoclonal antibodies with a fluorescent dye allowed for the detection of minor impurities such as proteolytic fragments and aggregates without altering separation selectivity [35].
Experimental Protocols and Applications
Standard CE-SDS Workflow for Monoclonal Antibody Analysis
The typical workflow for CE-SDS analysis of a monoclonal antibody involves sample preparation, instrumental separation, and data analysis.
Sample Preparation: The antibody sample is diluted to a target concentration of 1.0 mg/mL with an SDS sample buffer [24]. For analysis under non-reducing conditions (nrCE-SDS), the sample is alkylated with an agent like iodoacetamide (IAM) to prevent disulfide bond scrambling and reduce thermally induced fragmentation [37] [38]. The mixture is then heated at 70 °C for several minutes to denature the proteins [24]. For reduced CE-SDS (rCE-SDS), the alkylation step is omitted, and a reducing agent like β-mercaptoethanol (BME) is added to break disulfide bonds, separating the antibody into its light and heavy chains [37] [38].
Instrumental Separation: The prepared sample is pressure- or electrokinetically injected into a bare fused-silica capillary filled with a SDS gel buffer (a replaceable polymer sieving matrix) [24] [35]. An electric field (e.g., 500 V/cm) is applied, causing the negatively charged SDS-protein complexes to migrate through the capillary. Separation is based on hydrodynamic size, with smaller complexes migrating faster than larger ones [38] [35]. UV absorbance detection at 220 nm is commonly used as the complexes pass a detector near the capillary's end [24].
Data Analysis: Software, such as Beckman Coulter 32 Karat or Agilent ProSize, generates an electropherogram—a plot of migration time versus UV absorbance [24] [36]. Peaks are identified and quantified based on migration time relative to an internal standard or a protein ladder, providing a quantitative profile of the intact antibody and its impurities (fragments and aggregates) [36].
Application in Forced Degradation and Biosimilarity Studies
Forced degradation studies are critical for identifying potential degradation pathways of biopharmaceuticals. A 2025 study applied a validated CE-SDS method to compare the degradation profiles of a biosimilar anti-VEGF monoclonal antibody and its originator counterparts under thermal stress (37 °C and 50 °C for up to 14 days) [37].
Experimental Methodology:
- Stressing: Biosimilar and originator mAbs were incubated at 37 °C and 50 °C for 3, 7, and 14 days [37].
- Analysis: Stressed samples were analyzed using validated non-reduced and reduced CE-SDS methods. Orthogonal techniques like size-exclusion ultra-performance liquid chromatography (SE-UPLC) and LC-MS/MS were also used for comprehensive characterization [37].
- Key Metrics: The methods monitored a time- and temperature-dependent increase in low-molecular-weight (LMW) fragments and a decrease in the intact antibody. SE-UPLC showed enhanced aggregation, and LC-MS/MS identified specific modifications like asparagine deamidation [37].
Findings: The study concluded that the degradation profiles of the biosimilar and originator mAbs were highly comparable under thermal stress, with no significant qualitative differences detected. This demonstrates the utility of CE-SDS in providing a comprehensive comparability assessment as part of a multi-tiered analytical characterization strategy [37].
Application in Monitoring Hinge Fragmentation
Hinge region fragmentation is a critical quality attribute for IgG1 monoclonal antibodies. While often monitored by size-exclusion chromatography (SEC), CE-SDS serves as an excellent orthogonal or surrogate method [39].
Experimental Methodology:
- Stressing: Monoclonal antibodies were subjected to low pH stress to generate elevated levels of hinge fragments (Fc-Fab, Fab, Fc) [39].
- Analysis: The stressed samples were analyzed by both SEC and CE-SDS (non-reduced and reduced). SEC fractions were collected and analyzed by LC-MS to confirm the identity of the fragments [39].
- Correlation: By co-mixing enriched SEC fractions with the original sample, researchers correlated fragment peaks in the CE-SDS electropherogram with specific hinge fragments identified by MS [39].
Findings: The study found a strong correlation between the fragment levels quantified by SEC and those quantified by CE-SDS. It was demonstrated that CE-SDS can be confidently employed to monitor hinge region fragments, especially in cases where SEC resolution between the monomer and fragments like Fc-Fab is inadequate [39].
The Scientist's Toolkit: Key Research Reagent Solutions
The following table details essential materials and reagents required for performing CE-SDS analysis as described in the cited studies.
Table 3: Key Reagents and Materials for CE-SDS Analysis
| Item | Function / Description | Example from Literature |
|---|---|---|
| Capillary Electrophoresis System | Instrument for automated separation and detection. | PA 800 plus system (Beckman Coulter); Maurice (ProteinSimple); Agilent ProteoAnalyzer [24] [36] [40]. |
| Bare Fused-Silica Capillary | The separation channel. Typically 30.2 cm length, 50 µm inner diameter. | Pre-assembled cartridges from SCIEX [38]. |
| SDS Sample Buffer | Denatures and charges proteins with SDS for separation. | Low pH phosphate SDS sample buffer (e.g., 40 mM phosphate, pH 6.5, 1% SDS) [38]. |
| Sieving Gel Buffer | Replaceable polymer matrix that provides size-based separation. | SDS-MW Gel Buffer (pH 8, 0.2% SDS) [38] [35]. |
| Alkylating Agent | Used in nrCE-SDS to alkylate free cysteines, preventing disulfide scrambling. | Iodoacetamide (IAM) [37] [38]. |
| Reducing Agent | Used in rCE-SDS to break disulfide bonds, separating heavy and light chains. | β-mercaptoethanol (BME) or 2-mercaptoethanol [37] [38]. |
| Internal Standard | A known protein used for alignment and accurate sizing. | 10 kDa internal standard [38]. |
| Wash Solutions | For capillary conditioning between runs (removes residual polymer and contaminants). | Acidic wash (0.1 N HCl) and Basic wash (0.1 N NaOH) [38]. |
The collective experimental data from recent studies solidly positions CE-SDS as a superior technology to SDS-PAGE for quantitative protein purity analysis in a biopharmaceutical context. The key advantages of automation, superior resolution and sensitivity for key impurities like nonglycosylated IgG, and significantly enhanced quantitative accuracy and precision make CE-SDS an indispensable tool for modern laboratories. Its successful application in critical, real-world scenarios—from benchmarking biosimilarity under forced degradation to monitoring specific degradation pathways like hinge fragmentation—underscores its reliability and robustness. For scientists and drug development professionals focused on enhancing assay reproducibility and gaining deeper insights into product quality, the transition from SDS-PAGE to CE-SDS is not just a technological upgrade, but a strategic imperative.
Protein analysis is a cornerstone of modern biosciences, supporting advancements in drug development, food safety, and clinical diagnostics. For decades, Sodium Dodecyl Sulfate-Polyacrylamide Gel Electrophoresis (SDS-PAGE) has served as the fundamental technique for protein separation by molecular weight. However, the evolving complexity of analytical demands across different sectors has highlighted critical limitations in traditional methods, particularly concerning experimental reproducibility, quantitative precision, and analytical throughput. This comparison guide examines the performance of SDS-PAGE against emerging alternative methodologies within three distinct application landscapes—biotherapeutic characterization, food protein profiling, and clinical diagnostics. Through systematic evaluation of experimental data, we provide a framework for researchers to select optimal analytical strategies that ensure data integrity across diverse experimental contexts.
Table 1: Core Analytical Challenges Across Application Landscapes
| Application Landscape | Primary Analytical Requirements | Key Reproducibility Challenges |
|---|---|---|
| Biotherapeutic Characterization | High resolution, aggregation detection, conformational stability assessment | Gel-to-gel variability, subjective band intensity interpretation, limited quantitative accuracy |
| Food Protein Profiling | Matrix complexity handling, process impact assessment, adulteration detection | Variable staining efficiency, manual band pattern analysis, limited comparability across laboratories |
| Clinical Diagnostics | High sensitivity, quantitative precision, standardization for regulatory compliance | Manual processing errors, inter-operator variability, limited throughput for large sample volumes |
Fundamental Principles of SDS-PAGE
SDS-PAGE separates proteins based on molecular weight through a polyacrylamide gel matrix under an electric field. The technique employs sodium dodecyl sulfate (SDS) to denature proteins and confer a uniform negative charge, while reducing agents like β-mercaptoethanol break disulfide bonds. Smaller proteins migrate faster through the gel sieve, resulting in band patterns that indicate molecular size after staining [41] [42]. Despite its widespread adoption, the method involves multiple manual steps including gel casting, sample loading, separation, staining, and destaining, each introducing potential variability [1].
Emerging Capillary Electrophoresis Technologies
Capillary Electrophoresis with SDS (CE-SDS) has emerged as a high-performance alternative, automating the separation process within narrow-bore capillaries. Proteins migrate through a polymer sieving matrix with on-column detection generating electropherograms for quantitative analysis [1] [14]. This technology offers significant advantages in automation, reproducibility, and quantitative precision by eliminating manual gel handling and subjective band interpretation [1].
Supplemental Analytical Techniques
Other orthogonal methods complement these approaches:
- Native Electrophoresis: Preserves protein structure and function during separation, enabling in-gel activity assays as demonstrated in studies of medium-chain acyl-CoA dehydrogenase deficiency [43].
- Sandwich ELISA: Provides highly specific antigen detection through dual-antibody recognition, offering exceptional sensitivity for clinical diagnostics [44].
- Biophysical Characterization Tools: Including nanoDSF, DLS, and SEC, which provide comprehensive assessment of protein stability and aggregation propensity [45].
Application Landscape 1: Biotherapeutic Characterization
Performance Requirements for Biopharmaceutical Development
The biotherapeutic sector demands exceptionally rigorous protein characterization to ensure product safety and efficacy. Critical quality attributes include purity, aggregation propensity, conformational stability, and accurate molecular weight determination [45]. Even minor variations in these parameters can significantly impact therapeutic performance and immunogenicity risk profiles.
Comparative Experimental Data: SDS-PAGE vs. CE-SDS
A systematic evaluation of analytical methods for characterizing engineered antibody constructs reveals distinct performance differences:
Table 2: Performance Comparison for Biotherapeutic Analysis
| Performance Parameter | SDS-PAGE | CE-SDS |
|---|---|---|
| Quantitative Accuracy | Moderate (subjective band intensity) | High (direct UV detection) |
| Reproducibility (CV%) | 10-15% | 1-2% |
| Sample Throughput | Low (manual processing) | High (automated) |
| Hands-on Time | High (3-4 hours) | Low (minutes) |
| Resolution | Moderate | High |
| Data Output | Bands (qualitative) | Peaks (quantitative) |
| Aggregation Detection | Limited | Superior |
Experimental data demonstrates that CE-SDS delivers results with 1-2% coefficient of variation compared to 10-15% for SDS-PAGE, representing a substantial improvement in analytical reproducibility [1]. Furthermore, CE-SDS requires only minutes of hands-on time versus hours for SDS-PAGE, significantly enhancing operational efficiency [14].
Case Study: Characterization of Engineered Antibody Constructs
Research comparing full-length IgG with various engineered fragments (scFv, bi-scFv) demonstrated that integrating orthogonal analytical methods is essential for comprehensive characterization [45]. While SDS-PAGE provided basic molecular weight confirmation, it showed limited sensitivity in detecting early aggregation states in engineered scFv fragments. In contrast, CE-SDS consistently identified low-abundance aggregates, while nanoDSF and DLS provided complementary data on thermal stability and hydrodynamic size that were inaccessible via traditional SDS-PAGE [45].
Application Landscape 2: Food Protein Profiling
Analytical Requirements for Food Science Applications
Food protein analysis encompasses diverse challenges including process impact assessment, supply chain verification, adulteration detection, and allergen monitoring [41]. The complex matrices of food systems—containing carbohydrates, lipids, and other interfering compounds—demand robust extraction and separation methods that maintain analytical reproducibility across varied sample types.
Method Performance in Complex Food Matrices
Recent studies highlight the critical importance of efficient protein extraction, with optimized methods achieving 80% efficiency across diverse food matrices [46]. This extraction efficiency directly correlates with identification reproducibility, particularly for allergen detection where incomplete protein recovery generates false-negative results. SDS-PAGE has demonstrated utility in assessing molecular weight distribution changes resulting from processing techniques like enzymatic hydrolysis and thermal treatment [41].
Comparative Data: Food Protein Analysis
Table 3: Food Protein Profiling Method Comparison
| Analysis Type | SDS-PAGE Application | Limitations | Complementary Methods |
|---|---|---|---|
| Process Impact | Visualizes MW distribution changes from hydrolysis/heat | Limited quantification of specific proteins | HPLC-MS for precise quantification |
| Supply Chain Verification | Band pattern comparison between suppliers | Subjective pattern matching | CE-SDS for objective comparison |
| Adulteration Detection | Banding pattern anomalies vs reference | Limited sensitivity for minor components | PCR for species-specific detection |
| Allergen Monitoring | Detection of allergenic protein bands | Poor low-abundance sensitivity | ELISA for specific, sensitive allergen detection |
| Stability Studies | Protein degradation monitoring | Cannot distinguish specific degradation products | Peptide mapping via LC-MS/MS |
Experimental protocols for food protein analysis typically involve:
- Protein Extraction: Using optimized buffer systems to achieve 80% efficiency across matrices [46]
- Sample Denaturation: Boiling in SDS-containing buffer with or without reducing agents [41]
- Separation: Using standardized gradient gels (e.g., 4-12% Bis-Tris) [41]
- Detection: Coomassie Blue or silver staining with densitometry analysis [41]
While SDS-PAGE provides valuable qualitative information, its limitations in quantification and reproducibility have driven adoption of CE-SDS for standardized quality control in food protein analysis [41].
Application Landscape 3: Clinical Diagnostics
Diagnostic Requirements and Method Selection
Clinical diagnostics demands exceptional analytical sensitivity, specificity, and reproducibility to support patient management decisions. Techniques must demonstrate robust performance across diverse biological samples while maintaining compliance with regulatory standards. The choice between SDS-PAGE, CE-SDS, and immunoassay methods depends on required detection limits, sample volume, and necessary throughput [43] [44].
Case Study: Merbecovirus Detection via Sandwich ELISA
Recent research on merbecovirus detection illustrates the evolution toward highly specific diagnostic methods. A sandwich ELISA targeting the nucleocapsid protein achieved exceptional detection limits below 7.81 ng/mL for multiple merbecoviruses, with 1.25 ng/mL sensitivity for VsCoV-1 [44]. This assay demonstrated high specificity with no cross-reactivity to non-merbecoviruses, highlighting the advantages of immunoassays for pathogen detection where SDS-PAGE lacks sufficient sensitivity and specificity.
Case Study: MCAD Deficiency Analysis via Native Electrophoresis
Research on medium-chain acyl-CoA dehydrogenase (MCAD) deficiency demonstrates how native electrophoresis with in-gel activity staining provides unique insights into protein function. This method enabled quantification of active tetramers separately from impaired forms, revealing how pathogenic variants affect MCAD structure and function [43]. The approach showed linear correlation between protein amount and enzymatic activity, detecting activity with less than 1 μg of protein [43].
Essential Research Reagents and Materials
Successful protein analysis requires carefully selected reagents and materials optimized for specific applications:
Table 4: Essential Research Reagent Solutions
| Reagent/Material | Function | Application Notes |
|---|---|---|
| Pre-cast Gels (4-12% Bis-Tris) | Consistent pore size for separation | Reduce gel-to-gel variability; improve reproducibility [47] |
| SDS Sample Buffer (with LDS) | Protein denaturation and charging | Standardized formulation ensures uniform charge-to-mass ratio [45] |
| Reducing Agents (DTT, β-mercaptoethanol) | Disulfide bond reduction | Critical for accurate MW determination of multimeric proteins [45] |
| CE-SDS Cartridges (Replaceable polymer) | Capillary sieving matrix | Enable automated, high-resolution separation [1] |
| Protein Extraction Buffers | Efficient recovery from complex matrices | Optimized for 80% efficiency across diverse samples [46] |
| Cross-reactive Antibodies | Antigen detection in immunoassays | Enable broad-spectrum pathogen detection [44] |
| Activity Staining Reagents (NBT, substrates) | In-gel functional assessment | Preserve enzyme activity during separation [43] |
The comparative data presented in this guide demonstrates that method selection must align with specific application requirements and reproducibility thresholds. While SDS-PAGE remains valuable for initial screening and educational applications, advanced methodologies like CE-SDS, sandwich ELISA, and native electrophoresis offer superior reproducibility, sensitivity, and quantitative precision for critical applications in biotherapeutic development, food safety, and clinical diagnostics.
The integration of orthogonal analytical approaches provides the most robust strategy for comprehensive protein characterization, particularly for complex samples where no single method captures all relevant attributes. As protein analysis continues to evolve toward automated, quantitative platforms, researchers must balance traditional methodologies with emerging technologies to ensure data integrity across diverse application landscapes.
Monoclonal antibody (mAb) purity analysis is a critical requirement in biopharmaceutical development and quality control, directly impacting product safety and efficacy. The selection of an appropriate analytical technique is paramount for successful development, influencing decisions during protein purification, formulation, and stability evaluation [24]. This case study provides a direct comparative assessment of two established electrophoretic techniques—Sodium Dodecyl Sulfate-Polyacrylamide Gel Electrophoresis (SDS-PAGE) and Capillary Electrophoresis-Sodium Dodecyl Sulfate (CE-SDS)—for analyzing mAb purity and degradation profiles. Framed within broader research on assay reproducibility, this analysis examines the technical capabilities, data quality, and practical implementation of both methods, supported by experimental data from controlled stability studies.
Principles of SDS-PAGE and CE-SDS
SDS-PAGE Methodology
SDS-PAGE separates polypeptide chains based on their relative molecular mass through a polyacrylamide gel matrix. The technique employs SDS, an anionic detergent that denatures proteins by disrupting noncovalent bonds and coats them with consistent negative charge. With an SDS–protein constant-weight binding ratio of approximately 1:1.4, intrinsic polypeptide charge becomes negligible, allowing separation based primarily on molecular size [24]. Traditional SDS-PAGE involves manual processes including gel preparation, sample loading, electrophoresis, staining, destaining, and densitometry analysis, which can introduce variability [48].
CE-SDS Methodology
CE-SDS represents an automated, quantitative evolution of traditional gel electrophoresis. In this technique, antibody samples mixed with SDS-gel buffer are electrophoresed through a polymer-filled capillary. Samples are injected into capillary inlets using high voltage, with protein migration occurring in an anodic direction through a separation matrix. Quantitative detection occurs near the capillary's distal end using UV absorbance, eliminating the need for staining or destaining procedures [24]. The method leverages the same SDS-protein binding principle but offers superior automation and quantification capabilities [48].
Experimental Design and Methodologies
Sample Preparation and Stress Conditions
To directly compare both techniques, researchers analyzed identical samples of human IgG antibody in both normal and heat-stressed states. Stress conditions involved incubation at 45°C for 14 days to accelerate degradation [24]. Additional studies have employed thermal stress at 37°C and 50°C for periods ranging from 3 to 14 days to evaluate time- and temperature-dependent degradation, including fragmentation and aggregation profiles [37].
For SDS-PAGE analysis, samples were typically diluted to 0.2 mg/mL with water and further diluted with 4× LDS sample buffer. For CE-SDS, antibody samples were diluted to 1.0 mg/mL with SDS sample buffer, with nonreduced samples heated at 70°C for three minutes before injection [24].
Electrophoresis Conditions
SDS-PAGE Protocol: Experiments utilized commercial electrophoresis systems (e.g., Invitrogen NuPAGE Mini-Gel system) with 4–12% Bis-Tris gels and GelCode Blue stain. Gel preparation, sample loading, and analysis followed manufacturers' procedures, with gel imaging performed using quantification software (e.g., Alpha View) to determine percent area for each band and molecular weight assessment [24].
CE-SDS Protocol: Analyses employed capillary electrophoresis systems (e.g., Beckman Coulter PA 800 plus) with bare, fused-silica capillaries. Sample injection typically occurred at 5 kV for 20 seconds, with protein separation in an electric field of 500 V/cm for 35 minutes. UV detection at 220 nm recorded protein passing through the capillary, with specialized software (e.g., Beckman Coulter 32 Karat) determining sample quantitations and migration times [24].
Addressing Analytical Artifacts
A critical methodological consideration for both techniques, particularly under non-reducing conditions, is the potential for disulfide bond scrambling catalyzed by free sulfhydryl groups, which can generate fragmentation artifacts. Studies have systematically compared alkylating agents like iodoacetamide (IAM) and N-ethylmaleimide (NEM) to inhibit these artifacts. Research demonstrates that NEM exhibits superior fragmentation inhibition activity, with 5 mM NEM achieving equivalent inhibition to 40 mM IAM under identical conditions. Furthermore, NEM retains activity after prolonged sample heating, whereas IAM loses most efficacy, establishing NEM as the preferable alkylating agent for both SDS-PAGE and CE-SDS applications [49].
Comparative Experimental Data
Resolution and Detection Sensitivity
Direct comparison experiments reveal significant differences in resolution and detection sensitivity between the two techniques. In analyses of normal IgG samples, both methods detected a single major band at 150 kDa and a minor band at 130 kDa. However, for heat-stressed IgG samples, CE-SDS demonstrated superior resolution, easily identifying and quantifying multiple degradation species including bands at 300, 130, 90, and 25 kDa [24].
Table 1: Comparison of Detected Degradation Products in Heat-Stressed IgG
| Molecular Weight | SDS-PAGE Detection | CE-SDS Detection | Potential Identity |
|---|---|---|---|
| 300 kDa | Detected | Detected | Aggregates |
| 150 kDa | Major band | Major peak | Intact IgG |
| 130 kDa | Minor band | Resolved peak | Fragments |
| 90 kDa | Detected | Resolved peak | Heavy chain pairs |
| 25 kDa | Detected | Resolved peak | Light chains |
A critical advantage of CE-SDS is its ability to detect nonglycosylated IgG, which SDS-PAGE fails to resolve. This capability is functionally significant because glycosylation patterns directly impact IgG effector functions [24].
Quantitative Performance and Reproducibility
CE-SDS provides significantly superior quantitative capabilities and reproducibility compared to SDS-PAGE. The signal-to-noise ratios for impurities in heat-stressed IgG are substantially lower in SDS-PAGE scans than corresponding CE-SDS electropherograms, complicating autointegration for impurity bands [24].
Table 2: Method Performance Comparison
| Parameter | SDS-PAGE | CE-SDS |
|---|---|---|
| Automation | Manual process | Highly automated |
| Reproducibility | Variable | High (RSD < 2.5%) |
| Run Time | Several hours | 5.5-35 minutes |
| Throughput | Lower | Higher |
| Quantification | Semi-quantitative | Fully quantitative |
| Data Interpretation | Staining/densitometry | Direct UV detection |
Validation studies following ICH Q2(R2) guidelines demonstrate that CE-SDS methods exhibit excellent precision, with repeatability RSD values of 2.0% for intact IgG and 1.8% for total LMW species under non-reducing conditions, and 2.4% for both light and heavy chains under reducing conditions [37].
Advanced Applications and Orthogonal Analyses
Monitoring Hinge Region Fragmentation
Hinge region fragmentation represents a critical degradation pathway for IgG1 monoclonal antibodies, potentially impacting safety and efficacy. Studies have established strong correlation between SEC and CE-SDS for monitoring hinge fragments, with CE-SDS providing complementary characterization [39]. While SEC separates based on hydrodynamic radius, CE-SDS separates based on molecular weight after SDS denaturation, effectively dissociating non-covalently associated species. This makes CE-SDS particularly valuable for analyzing antibody-derived compounds like antibody-drug conjugates where SEC may exhibit suboptimal resolution [39].
Structural Identification with Mass Spectrometry
Advanced workflows coupling reversed-phase HPLC with top-down tandem mass spectrometry have enabled precise identification of low- and high-molecular-weight species detected in CE-SDS electropherograms. One comprehensive study identified 58 unique fragments from an IgG1 mAb, ranging from 10 kDa single chain fragments to 130 kDa triple chain fragments, including variants with post-translational modifications [50]. This approach allows exact clipping site identification, providing mechanistic insights into degradation pathways that inform process controls.
The following workflow illustrates this integrated approach for comprehensive mAb fragment characterization:
Practical Implementation and Regulatory Considerations
The Scientist's Toolkit: Essential Research Reagents
Successful implementation of either methodology requires specific reagents to ensure accurate and reproducible results:
Table 3: Essential Research Reagents for mAb Purity Analysis
| Reagent | Function | Method |
|---|---|---|
| SDS Sample Buffer | Denatures proteins and imparts negative charge for separation | SDS-PAGE & CE-SDS |
| Alkylating Agents (NEM) | Inhibits disulfide bond scrambling artifacts; 5mM concentration recommended | Non-reduced NR |
| Separation Matrix | Polyacrylamide gel or polymer sieving matrix for size-based separation | SDS-PAGE & CE-SDS |
| Molecular Weight Markers | Enables apparent molecular weight determination | SDS-PAGE & CE-SDS |
| Staining Reagents | Visualize protein bands in gels (e.g., GelCode Blue) | SDS-PAGE |
Regulatory Alignment
CE-SDS is recognized by regulatory authorities as a standard method for biopharmaceutical analysis. The United States Pharmacopeia (USP) General Chapter <129> provides specific guidelines for therapeutic monoclonal antibody analysis using CE-SDS, establishing it as a validated approach for quality control [48]. Method validation following ICH guidelines demonstrates that CE-SDS meets rigorous standards for specificity, linearity, accuracy, precision, and robustness, supporting its implementation in regulated environments [37].
This comparative case study demonstrates that CE-SDS technology provides superior resolution, quantification, and reproducibility for mAb purity analysis compared to traditional SDS-PAGE. The automated, quantitative nature of CE-SDS, combined with its ability to detect critical quality attributes like nonglycosylated IgG and resolve complex degradation profiles, positions it as an essential tool for modern biopharmaceutical development. While SDS-PAGE remains valuable for initial screening due to its simplicity and low cost, CE-SDS offers compelling advantages for stability studies, quality control, and regulatory submissions where precise quantification and high reproducibility are paramount. The integration of CE-SDS with orthogonal techniques like mass spectrometry further enhances its utility for comprehensive mAb characterization, supporting the development of safe and effective biotherapeutic products.
Troubleshooting Analytical Variability: Optimizing Reproducibility Across Platforms
Table of Contents
- Introduction
- Troubleshooting Common SDS-PAGE Pitfalls
- Quantitative Comparison: SDS-PAGE vs. CE-SDS
- Detailed Experimental Protocols
- Method Workflows and Relationships
- The Scientist's Toolkit
Assaying reproducibility is a cornerstone of reliable protein analysis in biopharmaceutical development and basic research. For decades, sodium dodecyl sulfate-polyacrylamide gel electrophoresis (SDS-PAGE) has been the established technique for separating proteins by molecular weight, yet it is prone to analytical pitfalls that can compromise data integrity and reproducibility [51] [1]. This guide objectively compares the performance of traditional SDS-PAGE with the advanced alternative of capillary electrophoresis SDS (CE-SDS), framing the discussion within the critical context of assay reproducibility. We will address common issues like smiling bands, high background, and unusual banding patterns, providing troubleshooting protocols and supporting experimental data to empower researchers in making informed methodological choices.
Troubleshooting Common SDS-PAGE Pitfalls
Even experienced researchers encounter artifacts in SDS-PAGE. The table below summarizes common issues, their causes, and solutions to improve reproducibility.
Table 1: Troubleshooting Common SDS-PAGE Issues
| Issue Observed | Primary Cause | Troubleshooting Solution | Impact on Reproducibility |
|---|---|---|---|
| Smiling Bands (bands curve upward at edges) [52] [27] [53] | Excessive heat generation during electrophoresis, causing uneven gel expansion [52]. | Run the gel at a lower voltage for a longer time; use a cold room or cooling apparatus [52] [27]. | High; causes inconsistent migration, affecting molecular weight estimation and band quantification. |
| Smeared Bands [52] [53] | - Incomplete protein denaturation/aggregation [53].- Running gel at too high a voltage [52].- Sample contaminated with high salt or protein [54] [53]. | - Add fresh reducing agent (DTT/β-mercaptoethanol) and boil samples properly [53].- Use standard voltage (e.g., 150V); avoid excessive voltage [52].- Desalt or purify samples; keep salt concentrations low [53]. | Severe; poor resolution prevents accurate analysis of protein purity and identity. |
| High Background Staining [54] | - Insufficient destaining of the gel.- Low sensitivity of stain. | - Destain the gel for a longer duration with multiple changes of destain solution [54].- Choose a stain with higher sensitivity or faster penetration properties [54]. | Moderate; obscures low-abundance bands and complicates accurate quantitation. |
| Unusual Banding Patterns (e.g., multiple bands, unexpected weights) [53] | - Protein degradation by proteases [53].- Protein modifications (e.g., dephosphorylation, oxidation) [53]. | - Use protease inhibitors during sample preparation [53].- Include phosphatase inhibitors and fresh reducing agents in buffers [53]. | Severe; leads to incorrect interpretation of protein structure and sample integrity. |
| Faint or No Bands [54] [53] | - Low protein concentration [53].- Sample degradation [54].- Gel over-run (proteins migrated off the gel) [52] [54]. | - Determine protein concentration before loading (Bradford, BCA assay) [53].- Follow good lab practices to prevent nuclease/protease contamination [54].- Stop electrophoresis when the dye front reaches the bottom of the gel [52]. | Critical; leads to complete data loss and failed experiments. |
| Edge Effect (distorted bands in periphery lanes) [52] | Empty wells on the left or right periphery of the gel. | Load all wells with sample, protein ladder, or a dummy protein sample (e.g., BSA) to ensure even current distribution [52]. | Moderate; reduces the number of usable lanes and introduces lane-to-lane variability. |
Quantitative Comparison: SDS-PAGE vs. CE-SDS
The limitations of SDS-PAGE have spurred the development of more reproducible quantitative techniques. Capillary Electrophoresis with SDS (CE-SDS) has emerged as a superior alternative for specific applications, particularly in biopharmaceutical quality control. The following table summarizes a direct comparative analysis of the two methods.
Table 2: Performance Comparison of SDS-PAGE and CE-SDS for Antibody Purity Analysis [24] [1]
| Performance Metric | SDS-PAGE | CE-SDS |
|---|---|---|
| Resolution | Lower resolution; bands can be diffuse [24]. | Higher resolution; produces sharp, well-defined peaks [24] [1]. |
| Quantitation | Semi-quantitative; relies on band intensity measurement from stained gels, which can be subjective [1]. | Fully quantitative; uses integrated UV detection for accurate and reproducible peak integration [24] [1]. |
| Reproducibility | Subject to gel-to-gel variability due to manual casting, staining, and destaining [1]. | High reproducibility; automated separation minimizes user-to-user and run-to-run variability [1]. |
| Throughput | Lower throughput; run times ~45-90 minutes, plus several hours for staining/destaining [34] [32]. | Higher throughput; automated analysis with run times as low as 5.5 minutes per sample [1]. |
| Sample Detection | Difficulty detecting low-abundance impurities and specific variants like nonglycosylated IgG due to low signal-to-noise ratio [24]. | Easily detects low-abundance impurities and can resolve nonglycosylated IgG from glycosylated forms [24]. |
| Automation | Mostly manual process (casting, loading, staining) [1]. | Fully automated (capillary filling, sample injection, separation, detection) [1]. |
| Data Output | Gel image with bands [24]. | Electropherogram with quantitated peaks; software can also generate virtual gel images for comparison [24] [1]. |
| Hazardous Waste | Generates toxic acrylamide and chemical waste from staining/destaining [1]. | Minimal waste; eliminates need for acrylamide gels and staining reagents [1]. |
Supporting Experimental Data: A direct comparison using the same heat-stressed IgG sample revealed a significantly higher signal-to-noise ratio in CE-SDS analysis compared to SDS-PAGE [24]. This allowed for easy quantitation of degradation species (fragments at 300, 130, 90, and 25 kDa) that were difficult to auto-integrate from the scanned SDS-PAGE gel [24]. Furthermore, CE-SDS successfully detected nonglycosylated IgG, a critical quality attribute that was not resolved by SDS-PAGE [24].
Detailed Experimental Protocols
This protocol is fundamental for protein separation under denaturing conditions.
Gel Casting:
- Resolving Gel: Assemble glass plates. Mix components for the resolving gel (e.g., 30% acrylamide, Tris-HCl pH 8.8, 10% SDS, 10% ammonium persulfate, TEMED). Pour the mixture, leaving space for the stacking gel. Overlay with water-saturated butanol or deionized water to ensure a flat surface and prevent air inhibition. Allow to polymerize for ~30 minutes.
- Stacking Gel: After polymerization, pour off the water. Mix and pour the stacking gel solution (e.g., acrylamide, Tris-HCl pH 6.8, SDS, ammonium persulfate, TEMED). Insert a comb and allow to polymerize for at least one hour.
Sample Preparation:
- Mix protein sample with an appropriate volume of SDS-PAGE loading buffer (containing SDS and a reducing agent like DTT or β-mercaptoethanol).
- Denature the samples by heating at 95-100°C for 5-10 minutes [53].
- Centrifuge briefly to collect condensation.
Electrophoresis:
- Assemble the gel in the electrophoresis chamber filled with running buffer (e.g., Tris-Glycine-SDS).
- Load samples and a molecular weight marker into the wells.
- Apply a constant voltage: 80-100V through the stacking gel, then 120-150V through the resolving gel until the dye front reaches the bottom.
Protein Visualization:
This modified protocol allows for high-resolution separation while preserving metal cofactors and some enzymatic activities, addressing a key limitation of standard SDS-PAGE.
Buffer Preparation:
- Sample Buffer: 100 mM Tris HCl, 150 mM Tris base, 10% (v/v) glycerol, 0.0185% (w/v) Coomassie G-250, 0.00625% (w/v) Phenol Red, pH 8.5. Note: No SDS, EDTA, or reducing agents are used [34].
- Running Buffer: 50 mM MOPS, 50 mM Tris Base, 0.0375% SDS, pH 7.7. Note: The SDS concentration is reduced, and EDTA is omitted compared to standard buffers [34].
Sample Preparation:
- Mix the protein sample with the NSDS sample buffer. Do not boil the samples [34].
Electrophoresis:
- Pre-run a pre-cast Bis-Tris gel in ddH₂O for 30 minutes at 200V to remove storage buffer.
- Replace the water in the apparatus with the NSDS running buffer.
- Load the samples and run at 200V for the required time (e.g., 30-45 minutes) [34].
Analysis:
- Proteins can be visualized with standard stains. Retention of metal ions can be confirmed using techniques like laser ablation-inductively coupled plasma-mass spectrometry (LA-ICP-MS) or functional enzymatic assays [34].
Experimental Data: When applied to the Zn²⁺ proteome of pig kidney cells, this NSDS-PAGE method increased Zn²⁺ retention from 26% (standard SDS-PAGE) to 98%. Furthermore, seven out of nine model enzymes, including four Zn²⁺ proteins, retained their activity after separation [34].
Method Workflows and Relationships
The following diagram illustrates the procedural steps and decision points involved in the SDS-PAGE and CE-SDS workflows, highlighting key differences that impact reproducibility.
The Scientist's Toolkit
Successful and reproducible protein electrophoresis relies on key reagents and materials. The table below details essential components for SDS-PAGE experiments.
Table 3: Essential Research Reagents and Materials for SDS-PAGE
| Item | Function / Role in the Experiment |
|---|---|
| SDS (Sodium Dodecyl Sulfate) | An ionic detergent that denatures proteins, masks their native charge, and confers a uniform negative charge proportional to mass, enabling separation by size [27]. |
| Acrylamide/Bis-acrylamide | Monomer and cross-linker that polymerize to form a porous gel matrix, which acts as a molecular sieve to separate proteins [53]. |
| TEMED & Ammonium Persulfate | Catalysts (TEMED) and initiators (APS) for the free-radical polymerization of acrylamide to form polyacrylamide gels [32]. |
| Tris-based Buffers | Provide the appropriate pH environment for gel polymerization (Tris-HCl) and electrophoresis (Tris-Glycine running buffer) to ensure proper protein charge and migration [32] [53]. |
| Reducing Agents (DTT, β-Mercaptoethanol) | Break disulfide bonds within and between protein subunits, ensuring complete unfolding and denaturation for accurate molecular weight determination [51]. |
| Coomassie Brilliant Blue | A dye that binds non-specifically to proteins, allowing visualization of separated bands after staining and destaining the gel [32]. |
| Protein Molecular Weight Marker | A mixture of proteins of known sizes run alongside samples to calibrate the gel and estimate the molecular weight of unknown proteins [53]. |
| Protease & Phosphatase Inhibitors | Added to sample preparation buffers to prevent protein degradation or undesired post-translational modifications during processing, preserving sample integrity [53]. |
The integrity of biological samples during preparation is the foundational step that dictates the success and reproducibility of downstream analyses. In the context of protein research, assaying reproducibility across different methodological platforms—such as SDS-PAGE versus alternative separation techniques—is particularly sensitive to pre-analytical variables. The controlled use of protease inhibitors and reducing agents during cell lysis and protein extraction is critical for preserving the native state, composition, and post-translational modifications of protein samples. Failure to adequately inhibit endogenous proteases or control the redox environment can lead to irreproducible results, artifactual bands on gels, and misleading conclusions in interactome studies. This guide objectively compares the performance impact of these crucial reagents within the broader thesis of achieving methodological reproducibility.
Fundamental Principles of Sample Protection
The Problem of Proteolytic Activity During Lysis
Cell lysis disrupts cellular compartmentalization, liberating a multitude of native proteases that are normally carefully regulated. These proteases—including serine, cysteine, aspartic, and metalloproteases—become free to degrade proteins in the lysate, potentially targeting the very proteins of interest for degradation. This uncontrolled proteolysis can lead to truncated proteins, loss of post-translational modifications, and the generation of artifactual fragments that compromise downstream analyses [55]. The presence of such fragments can be particularly problematic in SDS-PAGE, manifesting as extra or smeared bands, and in mass spectrometry, complicating protein identification and quantitation.
Classification and Mechanisms of Common Reagents
Protective reagents used in sample preparation can be broadly categorized based on their mechanism of action and target specificity.
Table 1: Common Protease Inhibitors and Their Characteristics
| Inhibitor | Primary Target | Mechanism | Stock Concentration | Working Concentration | Stability in Aqueous Solution |
|---|---|---|---|---|---|
| AEBSF | Serine Proteases | Irreversible | 100 mM | 0.2–1.0 mM | Stable for 3 months at -20°C |
| Aprotinin | Serine Proteases | Reversible | 10 mg/mL | 100–200 nM | Dissociates at extreme pH |
| E-64 | Cysteine Proteases | Irreversible | 1 mM | 1–20 µM | Stable for 6 months at -20°C |
| EDTA | Metalloproteases | Reversible (Chelator) | 0.5 M (pH 8) | 2–10 mM | Stable for 1 year at 20°C |
| Pepstatin A | Aspartic Proteases | Reversible | 1 mM | 1–20 µM | Low water solubility; use DMSO |
| PMSF | Serine Proteases | Reversible | 1 M | 0.1–1.0 mM | Unstable in water; neurotoxic |
Reducing agents, such as β-mercaptoethanol (BME) and dithiothreitol (DTT), function by breaking disulfide bonds between cysteine residues. This reduction is crucial for denaturing proteins for SDS-PAGE but must be carefully controlled in native PAGE applications where maintaining tertiary and quaternary structure is essential [56] [57]. The effect of these agents on protease inhibitor activity varies; while they are generally compatible with most inhibitors, high concentrations of reducing agents can potentially interfere with the activity of certain cysteine protease inhibitors.
Comparative Method Performance in Proteomics
The choice of separation methodology, coupled with sample preparation integrity, significantly impacts the depth of proteomic analysis. A direct comparison between SDS-PAGE and Strong Cation Exchange (SCX) chromatography for analyzing affinity-purified protein complexes revealed striking differences in performance.
Table 2: Method Comparison for Protein Complex Analysis
| Method | Separation Principle | Pre-Fractionation Level | Proteins Identified (Bmi-1 Complex) | Proteins Identified (GATA3 Complex) | Key Advantage | Key Limitation |
|---|---|---|---|---|---|---|
| SDS-PAGE | Molecular Weight | Protein | ~3-fold fewer | ~3-fold fewer | Visual assessment of protein size and purity | Lower coverage, especially for low-abundance proteins |
| SCX | Charge | Peptide | ~3-fold more | ~3-fold more | Significantly increased protein coverage, particularly for low-abundance targets | Requires desalting before MS analysis |
The data demonstrates that SCX separation consistently identified approximately three times more proteins compared to SDS-PAGE, with this effect being especially pronounced for the Bmi-1 complex where the target protein was expressed at low levels [58]. This highlights how the combination of sample preparation method (peptide versus protein-level fractionation) and separation technology directly influences the comprehensiveness and potential reproducibility of interactome studies.
Experimental Protocols for Method Comparison
Protocol 1: Affinity Purification with Comprehensive Protease Inhibition
This protocol is adapted from methodologies used to study nuclear protein complexes [58].
- Cell Lysis: Harvest transfected HEK293T cells expressing FLAG-tagged protein of interest. Lyse cells on ice for 30 minutes using 1 mL per 100 mm dish of lysis buffer (50 mM Tris pH 7.4, 150 mM NaCl, 0.5 mM EDTA, 0.1% NP-40) supplemented with a commercial protease inhibitor cocktail (typically containing AEBSF, Aprotinin, Bestatin, E-64, Leupeptin, and Pepstatin A).
- Clarification: Centrifuge lysates at 14,000 rpm for 10 minutes at 4°C to remove insoluble debris.
- Affinity Isolation: Incubate supernatant with 40 µL of anti-FLAG M2 agarose for 2 hours at 4°C with gentle agitation.
- Washing: Wash resin three times with wash buffer (50 mM Tris pH 7.4, 150 mM NaCl) to remove non-specifically bound proteins.
- Elution: Elute bound proteins with 100 µL of elution buffer (6.25 mM NH₄HCO₃ pH 8.4) containing 150 µg/mL 3x-FLAG peptide. Perform two elutions and pool.
- Sample Division: Divide eluate into aliquots for downstream separation by SDS-PAGE or SCX.
Protocol 2: FRET-Based Protease Activity Assay
This protocol, used for screening viral protease inhibitors [59] [60], exemplifies the critical need for controlled conditions when assaying protease activity.
- Recombinant Protease Production: Express and purify viral proteases (e.g., SARS-CoV-2 PLpro or TBEV NS3pro) in E. coli to homogeneity.
- Substrate Design: Design FRET substrates with eGFP (donor) and mCherry (acceptor) fluorescent proteins separated by the protease's specific cleavage sequence.
- Assay Optimization: In a 96- or 384-well plate, mix the FRET substrate with the protease in reaction buffer. The reaction progress is monitored in real-time by measuring the loss of FRET signal as the substrate is cleaved.
- Inhibitor Screening: Test potential inhibitors by adding them to the reaction mixture and measuring the reduction in protease activity compared to controls.
- Validation: Confirm hits using orthogonal assays, such as live virus infection models [61].
The following workflow diagram illustrates the logical relationship between sample preparation choices and their impact on downstream analytical outcomes:
Research Reagent Solutions Toolkit
Table 3: Essential Materials for Sample Integrity and Protease Analysis
| Reagent / Resource | Function in Research | Application Context |
|---|---|---|
| Protease Inhibitor Cocktail (e.g., AEBSF, Aprotinin, E-64, etc.) | Broad-spectrum inhibition of serine, cysteine, calpain-like, and aspartic proteases during cell lysis | Standard protein extraction and purification [62] [55] |
| Phosphatase Inhibitor Cocktail | Preserves phosphorylation states by inhibiting serine, threonine, and tyrosine phosphatases | Phosphoproteomics and signaling studies [62] |
| Dithiothreitol (DTT) or β-Mercaptoethanol | Reduces disulfide bonds; denatures protein structure | SDS-PAGE sample preparation; controlling redox environment [56] |
| EDTA | Chelates divalent cations; inhibits metalloproteases | Standard lysis buffers; incompatible with IMAC purification [55] |
| FRET Substrates (e.g., 2-Abz/Tyr(3-NO₂)) | Sensitive detection of protease activity through fluorescence change | High-throughput inhibitor screening [59] [60] |
| CM-Cellulose Cation Exchanger | Separation of peptides based on charge | SCX chromatography for proteomic fractionation [58] |
| FLAG Affinity Resin | Immunoaffinity purification of tagged protein complexes | Interactome studies before SDS-PAGE or SCX analysis [58] |
The integrity of sample preparation, maintained through the judicious application of protease inhibitors and reducing agents, is not merely a preliminary consideration but a deterministic factor in the reproducibility of protein analysis across different methodological platforms. As demonstrated, the choice between SDS-PAGE and alternative methods like SCX chromatography entails significant trade-offs in protein coverage, particularly for low-abundance targets. Researchers must align their sample protection strategies with their analytical endpoints—whether for molecular weight determination, functional complex analysis, or comprehensive proteome coverage. A deliberate and informed approach to sample integrity provides the foundation for reliable, reproducible research outcomes in protein science and drug development.
In protein research and biopharmaceutical development, the journey from gel to data is fraught with potential pitfalls. The ubiquitous techniques of SDS-PAGE and Western blotting are fundamental to protein analysis, yet they present significant challenges in reproducibility and signal detection that can compromise experimental outcomes. Issues ranging from complete absence of bands to excessive background signal plague laboratories, consuming valuable time and resources while generating inconsistent data. Within the broader context of assaying reproducibility between SDS-PAGE and emerging alternatives, this guide objectively compares traditional methods with innovative technological solutions, providing researchers with evidence-based strategies to overcome common transfer and detection problems. As we explore both fundamental troubleshooting and advanced alternatives, the focus remains on achieving reliable, reproducible protein analysis across diverse applications from basic research to drug development.
Understanding Fundamental Principles: Why Transfer and Detection Issues Occur
To effectively troubleshoot protein transfer and detection problems, one must first understand the underlying principles of protein separation and transfer. In SDS-PAGE, proteins are denatured and coated with the anionic detergent sodium dodecyl sulfate (SDS), which confers a uniform negative charge relative to their molecular weight [27] [3]. When an electric field is applied, these SDS-protein complexes migrate through a polyacrylamide gel matrix, separating primarily by molecular size as smaller proteins move faster through the porous network [3]. For subsequent detection via Western blotting, separated proteins must be transferred from the gel onto a solid membrane support, typically nitrocellulose or PVDF, where they become accessible for antibody probing [63].
This transfer process represents a critical vulnerability where numerous issues can arise. The efficiency of electrophoretic transfer depends on multiple factors including buffer composition, field strength, transfer time, and membrane properties. Towbin's transfer buffer (TTB), containing Tris, glycine, methanol, and SDS, is commonly used, with methanol playing a crucial role in removing SDS from proteins, facilitating their binding to the membrane, and preventing gel swelling during transfer [63]. However, the reuse of this buffer—a common laboratory practice aimed at reducing toxic waste—has been shown to diminish transfer efficiency, particularly for high molecular weight proteins [63] [64]. Understanding these fundamental mechanisms provides the foundation for implementing effective solutions to common transfer and detection problems.
Experimental Protocols: Standardized Methods for Comparison
Traditional SDS-PAGE and Western Blotting Protocol
The standard SDS-PAGE protocol begins with sample preparation using Laemmli buffer containing SDS and reducing agents like DTT or β-mercaptoethanol to denature proteins and break disulfide bonds [63] [27]. Samples are typically heated at 70-100°C for 5-10 minutes to ensure complete denaturation before loading onto polyacrylamide gels [65] [3]. Electrophoresis is then performed using Tris-glycine or MOPS-based running buffers with SDS at constant voltage (100-150V) for 40-60 minutes or until the dye front reaches the gel bottom [27].
For protein transfer, the gel is assembled with the membrane in a cassette and submerged in TTB [63]. Electrotransfer is typically conducted at constant current (100-400mA) for 1-2 hours or at lower currents overnight [65]. Following transfer, membranes are blocked with protein-based solutions (e.g., 5% non-fat dry milk or BSA) to prevent nonspecific antibody binding [63]. Immunodetection then proceeds with sequential incubations of primary and secondary antibodies, followed by chemiluminescent or fluorescent detection [63].
Alternative CE-SDS Methodology
Capillary electrophoresis with SDS (CE-SDS) represents an automated alternative to traditional slab gel electrophoresis [14] [11] [1]. In this method, protein samples are introduced into capillaries filled with a sieving matrix under applied voltage [14]. The system automatically performs all steps including staining, destaining, separation, and detection using laser-induced fluorescence (LIF) [11]. The Maurice CE-SDS system (Bio-Techne), for instance, offers two cartridge options: the Turbo CE-SDS Cartridge for high-throughput needs (5.5 minutes per sample for 96 samples) and the CE-SDS PLUS Cartridge for superior resolution (25 minutes per sample for 48 samples) [1]. This method eliminates numerous manual steps associated with traditional SDS-PAGE, reducing potential sources of variability.
Comparative Performance Data: SDS-PAGE vs. CE-SDS
Quantitative Analysis of Key Performance Metrics
Table 1: Direct comparison of SDS-PAGE and CE-SDS performance characteristics
| Performance Metric | Traditional SDS-PAGE | CE-SDS (Capillary Electrophoresis) | Data Source |
|---|---|---|---|
| Analysis Time | 3-6 hours for separation and detection | ~1 hour for 96 samples (LabChip 90 System) | [11] |
| Hands-on Time | Significant (gel casting, sample loading, transfer, staining) | Minimal after sample loading | [14] [1] |
| Reproducibility | Subject to gel-to-gel variability and user technique | High (CV < 2-10% for migration time) | [11] [1] |
| Detection Sensitivity | Varies with stain: Coomassie (~100 ng), silver (~1 ng) | Comparable or superior to SDS-PAGE | [11] [1] |
| Sample Throughput | Limited by gel format (typically 1-30 samples per gel) | High (48-96 samples per run) | [11] [1] |
| Quantitative Capability | Semi-quantitative (densitometry) | Highly quantitative (peak integration) | [1] |
| Buffer Consumption | High volume (50-1000 mL per run) | Minimal (nL volumes) | [14] [1] |
| Toxic Waste Generation | Significant (acrylamide, methanol) | Reduced (no gel casting, minimal reagents) | [63] [1] |
Experimental Evidence: Resolution and Reproducibility
Comparative studies demonstrate distinct performance advantages for capillary-based systems. In one direct comparison, traditional SDS-PAGE analysis of crude cell lysates showed a single protein band at 48 kDa, while the LabChip 90 System revealed two closely spaced bands at the expected size, indicating superior resolution [11]. This enhanced separation capability is particularly valuable for analyzing complex biopharmaceuticals like antibodies, where CE-SDS successfully resolves heavy and light chains under reduced conditions and detects minute quantities of aggregates or fragments under non-reduced conditions [1].
Reproducibility data further highlights the advantages of automated systems. The LabChip 90 System incorporates internal markers and standard ladders that enable automated normalization, ensuring excellent data reproducibility with minimal run-to-run variation [11]. This contrasts with traditional SDS-PAGE, where results are dependent on user technique through staining, destaining, and imaging steps, introducing significant variability [11] [63].
Troubleshooting Guide: From No Bands to Excessive Signal
Problem: Complete Absence of Bands
When no protein bands are detected after transfer and development, systematic investigation should address each step of the process:
- Sample Preparation Issues: Incomplete protein denaturation can prevent proper separation. Ensure samples contain sufficient SDS and reducing agent (DTT), and verify heating at 98°C for 5 minutes to achieve complete denaturation [65]. After boiling, immediately place samples on ice to prevent gradual cooling and protein renaturation [65].
- Transfer Buffer Problems: Reused TTB shows diminished signal for proteins across different molecular weights [63]. Methanol evaporation from TTB reduces transfer efficiency, as methanol is essential for SDS removal from proteins and their subsequent binding to membranes [64]. Always use fresh TTB for critical experiments.
- Electrophoresis Parameters: Gel temperature affects protein migration patterns. Running gels at lower voltages for longer times can prevent overheating and improve transfer [65]. Using cooling systems like compatible ice packs in the buffer chamber helps maintain optimal temperature [65].
Problem: Faint or Weak Bands
Weak signal intensity despite successful transfer typically stems from these common issues:
- Insufficient Protein Loading: Loading too little protein results in faint or undetectable bands [65]. Validate each protein-antibody pair to determine optimal loading amounts, using the minimum protein quantity required for downstream detection [65].
- Transfer Efficiency Degradation: Successive reuse of TTB progressively diminishes detection signals, particularly for high molecular weight proteins like CFTR (∼170 kDa) [63]. Buffer recycling causes protein modification, methanol evaporation, and reduced buffering capacity, compromising transfer of high molecular weight proteins [64].
- Antibody Incubation Problems: Ensure appropriate antibody concentrations and sufficient incubation times. Check antibody expiration dates and storage conditions.
Problem: Excessive Background Signal
High background noise obscures specific signals and can originate from multiple sources:
- Blocking Inefficiency: Incomplete or improper blocking allows nonspecific antibody binding. Optimize blocking conditions using 5% non-fat dry milk or BSA with adequate incubation time [63].
- Membrane Contamination: Reused transfer buffer accumulates proteins that blow through the membrane, particularly low molecular weight species, causing background binding in subsequent transfers [64]. These free proteins bind nonspecifically to subsequent membranes, increasing background noise [64].
- Antibody Specificity Issues: Titrate antibodies to find optimal concentrations that minimize nonspecific binding. Include thorough wash steps between antibody incubations.
Problem: Distorted or Irregular Bands
Band pattern abnormalities compromise interpretation and quantification:
- Protein Aggregation: Loading excess protein causes aggregation during electrophoresis, preventing proper separation and resulting in clustered bands that cannot be individually defined [65]. This excess can also bleed into neighboring lanes, compromising lane distinctions [65].
- Gel Polymerization Defects: Incomplete polymerization caused by expired reagents or incorrect TEMED concentrations creates irregular pore structures [65]. Ensure gels polymerize completely before use, or consider premade gels to avoid polymerization issues [65].
- Buffer Composition Errors: Overused or improperly formulated buffers hinder protein separation [65]. Prepare fresh buffers before each run whenever possible [65].
The Scientist's Toolkit: Essential Research Reagents and Solutions
Table 2: Key reagents and materials for protein separation, transfer, and detection
| Reagent/Material | Function/Purpose | Considerations for Reproducibility |
|---|---|---|
| SDS (Sodium Dodecyl Sulfate) | Denatures proteins and confers uniform charge | Critical concentration required for complete denaturation; fresh preparation recommended |
| DTT or β-Mercaptoethanol | Reduces disulfide bonds | Concentration and freshness affect complete unfolding of proteins |
| Polyacrylamide Gels | Sieving matrix for size-based separation | Pore size must match protein size range; polymerization completeness essential |
| Towbin's Transfer Buffer (TTB) | Medium for electrophoretic transfer | Methanol content critical; reuse diminishes performance, especially for high MW proteins [63] [64] |
| Nitrocellulose/PVDF Membranes | Solid support for transferred proteins | Pore size must match protein size; proper activation required for PVDF |
| Blocking Agents (Milk, BSA) | Prevent nonspecific antibody binding | Concentration and incubation time affect signal-to-noise ratio |
| Primary and Secondary Antibodies | Target-specific detection | Specificity and titer determine sensitivity and background |
| Acrylamide | Gel matrix component | Neurotoxin in monomer form; premade gels reduce exposure [1] |
| Coomassie/Silver Stains | Protein visualization | Sensitivity varies; silver staining may cause protein cross-linking [66] |
| Microfluidic Chips (CE-SDS) | Automated separation and detection | Replaceable polymers; instrument-specific requirements [14] [11] |
Workflow Visualization: Traditional vs. Alternative Methods
The following workflow diagrams illustrate the procedural differences between traditional SDS-PAGE and modern CE-SDS approaches, highlighting steps where variability and technical issues commonly arise.
Workflow Comparison: Traditional SDS-PAGE vs. CE-SDS
The evolution of protein separation technologies from traditional SDS-PAGE to automated capillary electrophoresis represents significant progress in addressing persistent challenges with transfer and detection issues. While SDS-PAGE remains a valuable technique in many research contexts, its limitations in reproducibility, quantitative accuracy, and technical variability are well-documented. CE-SDS methodologies offer compelling advantages for applications requiring high throughput, precise quantification, and minimal inter-experimental variability, particularly in regulated environments like biopharmaceutical development.
For researchers committed to traditional SDS-PAGE, rigorous attention to buffer freshness, sample preparation, and transfer conditions can substantially improve results. However, when reproducibility is paramount for comparative analyses or quality control, transitioning to capillary-based systems provides a technologically advanced solution to the enduring problems of no bands, excessive background, and signal variability. As the field continues to evolve, the integration of these automated platforms with complementary analytical techniques will further enhance our ability to generate reliable, reproducible protein data across diverse research and development applications.
In life science research, the ability to reproduce experimental results is a fundamental pillar of scientific integrity. Recent studies, including a survey by Nature, reveal that in biology alone, over 70% of researchers struggle to reproduce other scientists' findings, and approximately 60% cannot reproduce their own results [67]. This reproducibility crisis wastes an estimated $28 billion annually on non-reproducible preclinical research and erodes trust in scientific findings [67]. For researchers, scientists, and drug development professionals, variability in protein analysis methods like SDS-PAGE presents significant challenges for data comparability and decision-making.
Assay reproducibility encompasses several facets: direct replication (reproducing results using the same experimental design), analytic replication (reanalyzing original data), and systemic replication (reproducing findings under different conditions) [67]. Technical variability in protein separation and detection contributes significantly to reproducibility failures, particularly for methods relying on manual processing [67]. This guide objectively compares traditional SDS-PAGE with emerging capillary electrophoresis SDS (CE-SDS) methods, providing experimental data and standardized protocols to minimize inter-lab and intra-lab variability in protein analysis.
Understanding the Methods: SDS-PAGE and CE-SDS Fundamentals
Sodium Dodecyl Sulfate-Polyacrylamide Gel Electrophoresis (SDS-PAGE)
SDS-PAGE is a foundational technique for separating proteins by molecular weight. The method utilizes SDS, an anionic detergent that denatures proteins by breaking non-covalent bonds and coats them with a uniform negative charge. This charge proportionality allows proteins to migrate through a polyacrylamide gel matrix under an electric field, with smaller proteins moving faster than larger ones [27]. The key steps include sample preparation with SDS and reducing agents, gel electrophoresis, post-separation staining, and destaining before imaging and analysis [27].
Despite its widespread use, traditional SDS-PAGE faces reproducibility challenges due to multiple manual steps, including gel casting, sample loading, staining, destaining, and imaging. Variability in any of these steps, combined with differences in gel composition, running conditions, and imaging techniques, contributes significantly to inter-lab and intra-lab variability [27] [67].
Capillary Electrophoresis with SDS (CE-SDS)
CE-SDS is an automated, quantitative approach that adapts the principles of SDS-PAGE to a capillary format. In CE-SDS, proteins are similarly denatured with SDS and injected into a capillary filled with a sieving polymer matrix. Application of high voltage separates proteins based on size, with detection occurring via UV absorbance or laser-induced fluorescence near the capillary outlet [11] [24]. This method eliminates multiple manual steps, integrating separation, detection, and data analysis into an automated platform.
The microfluidic CE-SDS platform performs sequential functions: sample aspiration, electrophoretic loading, sample plug injection, separation in a sieving matrix, destaining via electrokinetic focusing, and laser-induced fluorescence detection [11]. Automated normalization using internal markers and standard ladders enhances sizing and concentration reproducibility across samples [11].
Comparative Workflow Diagrams
The following workflow diagrams illustrate the procedural differences between SDS-PAGE and CE-SDS methods, highlighting sources of variability and opportunities for standardization.
Figure 1: Comparative workflows of SDS-PAGE and CE-SDS methods. SDS-PAGE contains multiple manual steps (red) that introduce variability, while CE-SDS automates key processes (green) to enhance reproducibility [27] [11] [24].
Experimental Comparison: Quantitative Performance Data
Experimental Design for Method Comparison
To objectively compare SDS-PAGE and CE-SDS performance, we examine experimental data evaluating both normal and heat-stressed IgG antibody samples [24]. The experimental protocols were as follows:
SDS-PAGE Protocol: Researchers used an Invitrogen NuPAGE Mini-Gel electrophoresis system with 4-12% Bis-Tris gels and GelCode Blue stain. Antibody samples were diluted to 0.2 mg/mL with water and further diluted to 0.15 mg/mL with 4× LDS sample buffer. Gel preparation, sample loading, and analysis followed the manufacturer's procedure. Gel imaging and band quantification used Alpha View integration software [24].
CE-SDS Protocol: Analysis used a PA 800 plus capillary electrophoresis system with sample preparation and operation following manufacturer specifications. Antibody samples were diluted to 1.0 mg/mL with SDS sample buffer, with nonreduced samples heated at 70°C for three minutes before injection into a bare, fused-silica capillary at 5 kV for 20 seconds. Separation occurred in an electric field of 500 V/cm for 35 minutes. UV detection at 220 nm recorded protein amounts, with Beckman Coulter 32 Karat software handling quantitations [24].
Comparative Performance Metrics
Table 1: Direct comparison of SDS-PAGE and CE-SDS performance characteristics [11] [24]
| Performance Parameter | SDS-PAGE | CE-SDS |
|---|---|---|
| Sample Throughput | 3-6 hours for 10-12 samples | 96 samples in approximately 1 hour |
| Detection Resolution | Single band at 150 kDa for normal IgG | Detection of nonglycosylated IgG variants |
| Signal-to-Noise Ratio | Lower, with difficulty in autointegration | Significantly higher, enabling precise quantitation |
| Reproducibility (CV%) | Higher variability due to manual steps | Excellent reproducibility across consecutive runs |
| Quantitation Capability | Semi-quantitative via densitometry | Fully quantitative with automated peak analysis |
| Data Output | Band patterns requiring interpretation | Digital electropherograms with precise migration times |
| Detection Method | Post-staining with Coomassie or silver | Real-time UV or laser-induced fluorescence |
Impurity Detection and Resolution
A critical comparison area involves the ability to detect and quantify protein impurities and variants. In analysis of IgG samples:
SDS-PAGE showed a single major band at 150 kDa and a minor band at 130 kDa for normal IgG samples. Heat-stressed IgG samples revealed a major band at 150 kDa and four minor bands at 300, 130, 90, and 25 kDa [24].
CE-SDS provided superior resolution, easily detecting nonglycosylated IgG that was not resolved by SDS-PAGE. The method identified specific impurities including light chain (LC), two heavy chains (2H), and combinations thereof (2H1L) [24].
This distinction is particularly significant for antibody analysis, as glycosylation status profoundly affects biological function and therapeutic efficacy. The inability of SDS-PAGE to reliably detect nonglycosylated variants represents a substantial limitation for biopharmaceutical applications where product characterization is critical [24].
Standardization Strategies for Improved Reproducibility
Method-Specific Optimization Approaches
SDS-PAGE Standardization requires rigorous protocol control to minimize variability sources. Recommended practices include using standardized commercial gel systems rather than laboratory-cast gels, implementing consistent sample preparation protocols with validated protein quantification, controlling staining and destaining times precisely, and utilizing calibrated imaging systems with standardized analysis software [27] [67]. For molecular weight determination, running reference standards on every gel is essential, with gradient gels (e.g., 4-20%) providing superior resolution across broad molecular weight ranges [27].
CE-SDS Standardization benefits from inherent automation but still requires protocol optimization. Key factors include capillary lot consistency, regular maintenance to prevent capillary blockage, standardized sample preparation protocols, and consistent buffer preparation. The implementation of internal standards in every sample enables normalization of migration times and concentration calculations, significantly improving inter-assay reproducibility [11] [24].
Cross-Method Standardization Principles
Several overarching principles support reproducibility across both methodologies:
Sample Preparation Consistency: Uniform procedures for protein extraction, quantification, denaturation, and reduction are fundamental. Use of reducing agents like DTT or β-mercaptoethanol must be standardized, as their concentration and incubation time significantly impact protein migration [27] [24].
Reference Materials: Implementation of authenticated, traceable reference materials for both system suitability testing and quantitative analysis. Low-passage cell lines and characterized protein controls minimize biological variability sources [67].
Data Analysis Protocols: Standardized approaches for peak or band identification, baseline correction, and integration parameters. For CE-SDS, consistent setting of integration parameters and peak identification thresholds ensures comparable results across instruments and operators [24].
Essential Research Reagents and Materials
Table 2: Key research reagents and materials for reproducible protein analysis
| Reagent/Material | Function | Standardization Consideration |
|---|---|---|
| Acrylamide/Bis-acrylamide | Gel matrix formation | Use consistent crosslinking ratios; commercial premixed solutions recommended |
| SDS (Sodium Dodecyl Sulfate) | Protein denaturation and charge uniformity | Maintain consistent purity and concentration; avoid precipitation |
| Reducing Agents (DTT, β-mercaptoethanol) | Disulfide bond reduction | Standardize concentration, incubation time, and temperature |
| Protein Molecular Weight Markers | Size calibration and normalization | Use broad-range validated standards on every run |
| Capillary/Separation Matrix | CE-SDS separation medium | Consistent polymer lots and capillary coatings |
| Staining Dyes (Coomassie, Silver, Fluorescent) | Protein detection | Standardized staining protocols with controlled timing |
| Buffer Components (Tris, Glycine, MOPS) | Electrophoresis buffer systems | Precise pH adjustment and conductivity monitoring |
The comparative data clearly demonstrates that CE-SDS technology provides superior reproducibility, resolution, and throughput compared to traditional SDS-PAGE for protein analysis, particularly in regulated environments like biopharmaceutical development [24]. The automated nature of CE-SDS significantly reduces manual intervention points that introduce variability, while the integrated detection and analysis systems generate inherently quantitative digital data less susceptible to interpretation differences.
However, SDS-PAGE remains a valuable technique for applications requiring protein recovery for downstream analysis, educational settings, and laboratories with budget constraints. The visual nature of gel results also provides intuitive protein separation assessment that some researchers find advantageous for initial method development.
For laboratories prioritizing data reproducibility and comparability—especially in quality control environments, multi-site studies, or longitudinal research projects—CE-SDS represents a methodologically superior choice. The transition to capillary electrophoresis platforms standardizes protein analysis with minimal inter-operator and inter-laboratory variability, addressing a critical need in the ongoing effort to enhance scientific reproducibility.
As the life sciences continue to confront challenges with research reproducibility, adoption of automated, standardized protein analysis methods like CE-SDS represents a substantive step toward more reliable, comparable scientific data across the research community.
Validation and Comparative Analysis: Quantifying Method Performance and Data Correlation
In the fields of molecular biology, biopharmaceutical development, and clinical diagnostics, the accurate analysis of protein purity, size, and composition is a cornerstone of research and quality control. For decades, sodium dodecyl sulfate-polyacrylamide gel electrophoresis (SDS-PAGE) has been the ubiquitous method for protein separation, providing a simple and reliable means to separate proteins by molecular weight. However, the evolution of analytical technologies has introduced more advanced techniques, notably capillary electrophoresis SDS (CE-SDS), which offer automation and enhanced performance. This guide provides a direct, data-driven comparison of these methods, focusing on the critical performance metrics of resolution, sensitivity, and reproducibility. The ability to generate reliable, quantifiable, and reproducible data is fundamental to accelerating drug development and ensuring the safety and efficacy of biotherapeutics. This objective comparison, framed within the broader context of assaying reproducibility, is designed to equip scientists with the evidence needed to select the most appropriate analytical method for their specific application.
Experimental Protocols for Direct Comparison
To ensure a fair and accurate performance assessment, the following section outlines the standard experimental protocols for both SDS-PAGE and CE-SDS, as utilized in the comparative studies cited.
SDS-PAGE Protocol
The traditional SDS-PAGE method follows a well-established, multi-step manual procedure [24] [68]:
- Gel Preparation: Polyacrylamide gels are cast between glass plates, comprising a stacking gel (pH ~6.8) and a separating gel (pH ~8.8). The process involves mixing acrylamide, bisacrylamide, buffer, and catalysts (APS and TEMED) to initiate polymerization [4].
- Sample Preparation: Protein samples (e.g., a human IgG antibody) are diluted to a concentration of 0.2 mg/mL with water and then mixed with a loading buffer containing SDS and a reducing agent (e.g., DTT or β-mercaptoethanol) to denature the proteins and break disulfide bonds. The sample is subsequently heated to 70-95°C for 5-10 minutes [24] [68].
- Electrophoresis: Denatured samples are loaded into the gel wells alongside a molecular weight marker. A voltage of 100-200 V is applied, causing proteins to migrate through the gel matrix toward the anode in a running buffer, typically Tris-glycine-SDS [4] [68].
- Post-Electrophoresis Processing: After separation, proteins are fixed within the gel and then stained (e.g., with Coomassie Blue or a fluorescent dye) to be visualized. Destaining steps are often required to reduce background signal before imaging [1] [4].
- Data Analysis: The stained gel is imaged, and band intensities are quantified using densitometry software (e.g., Alpha View software). The quantification relies on the subjective assessment of band intensity and is subject to gel-to-gel variability [24].
CE-SDS Protocol
The CE-SDS method is characterized by a more streamlined and automated workflow [1] [24]:
- Instrument Setup: A CE system equipped with a UV detector and a bare fused-silica capillary is used. The capillary is filled with a replaceable SDS-gel polymer matrix.
- Sample Preparation: Protein samples are diluted with an SDS-containing buffer (e.g., to 1.0 mg/mL). For non-reduced analysis, samples may be heated at 70°C for a short period (e.g., 3 minutes) before injection [24].
- Electrophoresis and Detection: Samples are injected into the capillary inlet electrokinetically (e.g., at 5 kV for 20 seconds). Separation occurs under an applied electric field (e.g., 500 V/cm). As proteins migrate through the capillary, they pass a UV detection window where they are quantified in real-time at 220 nm, generating an electropherogram [24].
- Data Analysis: The software automatically integrates the peak areas in the electropherogram, providing direct quantitative data on protein species without the need for staining, destaining, or imaging [1] [24].
The following workflow diagrams illustrate the key procedural differences between these two methods.
Key Performance Metrics: A Quantitative Comparison
Direct comparative studies using standardized samples, such as monoclonal antibodies in normal and heat-stressed states, reveal significant differences in the performance of SDS-PAGE and CE-SDS.
Resolution and Sensitivity
Resolution determines the ability to distinguish between closely related protein species, such as fragments or glycosylated variants, while sensitivity defines the ability to detect low-abundance impurities.
A pivotal study comparing the analysis of a heat-stressed IgG antibody sample demonstrated CE-SDS's superior resolution. While SDS-PAGE showed a major band at 150 kDa and minor bands for impurities, CE-SDS provided high-resolution separation that allowed for easy quantitation of degradation species, including nonglycosylated IgG, which was not resolved by SDS-PAGE [24]. This is a critical advantage because glycosylation significantly impacts the biological function and stability of therapeutic antibodies. Furthermore, the signal-to-noise ratio for impurities from the heat-stressed IgG was "much lower" in the SDS-PAGE scan compared to the corresponding peaks in the CE-SDS electropherogram, indicating higher sensitivity for CE-SDS [24]. Another study concluded that CE-SDS-based methods are similar to SDS-PAGE for quality control parameters like purity but offer the advantages of automation and quantitative precision [69].
Reproducibility and Quantitative Precision
Reproducibility is fundamental for quality control and regulatory filings, ensuring consistent results across different runs, instruments, and laboratories.
CE-SDS demonstrates excellent reproducibility due to its high level of automation, which minimizes user intervention and variability. Consecutive analyses of a degraded IgG sample showed "good overall reproducibility across the various fragments" [24]. The automated separation and integrated detection of CE-SDS provide "accurate, reproducible peak integration," in contrast to the "subjective band intensity assessments" of SDS-PAGE [1]. SDS-PAGE is subject to gel-to-gel variability and inconsistencies in staining and destaining, which directly impact the precision of quantitative results [1]. The manual nature of these steps introduces a significant source of error that is largely eliminated in the CE-SDS workflow.
Throughput and Operational Efficiency
For modern laboratories, particularly in biopharmaceutical development, analytical throughput and efficiency are crucial.
CE-SDS offers a clear advantage in throughput. Instruments can analyze multiple samples in a fraction of the time required for SDS-PAGE [1]. For instance, specific commercial cartridges can provide results in as little as 5.5 minutes per sample for a 96-sample plate, compared to the several hours typically needed for SDS-PAGE, which includes lengthy gel casting, electrophoresis, and post-staining procedures [1]. The automation of CE-SDS also drastically reduces hands-on time, freeing up skilled personnel for other tasks [1].
The table below provides a consolidated summary of these key performance metrics based on comparative experimental data.
| Performance Metric | SDS-PAGE | CE-SDS | Experimental Context & Notes |
|---|---|---|---|
| Resolution | Moderate | High | CE-SDS resolved nonglycosylated IgG, which was not detected by SDS-PAGE [24]. |
| Sensitivity (S/N Ratio) | Lower | Higher | Signal-to-noise ratios for impurities were "much lower" in SDS-PAGE scans [24]. |
| Reproducibility | Moderate (gel-to-gel variability) | High (automated separation) | CE-SDS showed "good overall reproducibility" across consecutive runs [24]. |
| Quantitative Precision | Lower (subjective band assessment) | Higher (automated peak integration) | CE-SDS provides "accurate, reproducible peak integration" [1]. |
| Analysis Time | Several hours (including staining) | ~25-35 minutes (no staining) | CE-SDS enables "analysis of multiple samples in a fraction of the time" [1]. |
| Impurity Detection | Detects major fragments | Detects minor and specific variants (e.g., nonglycosylated) | CE-SDS assigned peaks to specific species (LC, 2H, 2H1L) [24]. |
The Scientist's Toolkit: Essential Research Reagent Solutions
The execution of these analytical methods requires specific reagents and instruments. The following table details key materials and their functions as derived from the experimental protocols.
| Item | Function in Experiment | Specific Example |
|---|---|---|
| SDS (Sodium Dodecyl Sulfate) | Denatures proteins and confers a uniform negative charge, enabling separation by size. | Component of sample and running buffers [4]. |
| Polyacrylamide Gel | Acts as a molecular sieve; its porous matrix separates proteins based on molecular weight. | Pre-cast NuPAGE Bis-Tris gels [68]. |
| DTT (Dithiothreitol) | Reducing agent that breaks disulfide bonds in proteins for "reduced" analysis. | 10-100 mM in sample buffer for reduction [68]. |
| Capillary & Separation Matrix | The platform for CE-SDS separation; the replaceable polymer matrix acts as a sieving medium. | Bare fused-silica capillary filled with SDS-gel buffer [24]. |
| UV Detector | Enables real-time, on-capillary detection and quantification of proteins in CE-SDS. | UV absorbance detection at 220 nm [24]. |
| Molecular Weight Marker | Provides size standards for estimating the molecular weight of unknown proteins. | SeeBlue Plus2 pre-stained standard (SDS-PAGE) [68]. |
The direct performance comparison clearly demonstrates that CE-SDS outperforms traditional SDS-PAGE in the critical metrics of resolution, sensitivity, reproducibility, and throughput. While SDS-PAGE remains a valuable, low-cost educational and research tool, the demands of modern biopharmaceutical development for highly accurate, quantitative, and reproducible data make CE-SDS the superior technology for applications such as product release testing and regulatory filings [1] [24]. Its ability to automatically detect and quantify critical quality attributes, like nonglycosylated antibodies, with high precision positions CE-SDS as the modern successor to SDS-PAGE for analytical development and quality control in the biopharmaceutical industry. As companies strive to reduce their environmental footprint, the significant reduction in toxic waste (e.g., acrylamide, staining reagents) offered by CE-SDS further aligns with broader sustainability initiatives [1]. The evolution from gels to capillaries represents a significant technological advancement, empowering researchers and industry professionals to deliver life-saving therapies to patients with greater speed and confidence.
In the development of biopharmaceuticals, from recombinant vaccines to therapeutic antibodies, accurately assessing protein purity is not just a regulatory requirement—it is a fundamental determinant of product safety, efficacy, and quality. The quantitative analysis of protein samples allows scientists to monitor process improvements, ensure lot-to-lot consistency, and make critical decisions during accelerated development timelines. For decades, sodium dodecyl sulfate-polyacrylamide gel electrophoresis (SDS-PAGE) combined with densitometry has served as the foundational technique for size-based separation and semi-quantitative analysis. However, the emergence of capillary electrophoresis with SDS (CE-SDS) coupled with direct UV detection presents a modern, automated alternative. This guide objectively compares the quantitative capabilities of these two methods, providing experimental data and methodologies to inform researchers and development professionals in their analytical choices. The comparison is framed within the broader thesis of assaying reproducibility, examining how methodological evolution from gel-based to capillary-based systems impacts the reliability and precision of purity measurements in biopharmaceutical development.
Fundamental Principles and Technological Evolution
SDS-PAGE with Densitometry: A Traditional Workhorse
SDS-PAGE separates proteins based on their molecular weight by imposing a negative charge on denatured proteins proportional to their mass, allowing size-based migration through a polyacrylamide gel matrix under an electric field [53] [24]. The polyacrylamide gel's density creates a molecular sieve, where smaller proteins migrate faster and farther than larger ones. For quantitative analysis via densitometry, proteins are typically visualized using staining dyes such as Coomassie Blue or Silver Stain. The stained gel is then imaged, and the intensity of protein bands is analyzed to generate a semi-quantitative assessment of protein abundance based on the assumption that stain intensity is proportional to protein mass [70].
This multi-step process is labor-intensive and introduces several variables affecting quantitation. The staining itself is non-linear and can plateau at higher protein concentrations, while destaining can lead to band diffusion and reduced resolution. The subsequent imaging and densitometric analysis introduce additional subjectivity and variability [1].
CE-SDS with Direct UV Detection: An Automated Alternative
CE-SDS represents a technological evolution that maintains the fundamental SDS-based separation principle but transitions it from a slab gel to a capillary format. In this system, samples are injected into a capillary filled with a replaceable SDS-gel buffer and separated via electrophoresis. The key differentiator for quantification is the online direct UV detection at 220 nm near the distal end of the capillary, which measures the absorbance of peptide bonds as proteins pass by the detector [24].
This approach eliminates the staining, destaining, and imaging steps required for densitometry. The detection occurs in real-time as separation proceeds, generating an electropherogram where peak areas correspond directly to protein abundance. The automation of sample handling, separation, and detection significantly reduces manual intervention and associated variability [1] [24].
Visualizing the Methodological Divide
The core difference in how these techniques generate quantitative data is summarized in the workflow below:
Head-to-Head Quantitative Performance Comparison
Resolution, Sensitivity, and Reproducibility
A direct comparison using the same IgG samples, both in a normal and a heat-stressed state, reveals significant differences in analytical performance between the two techniques [24].
table: Quantitative Performance Comparison of Densitometry and Direct UV Detection
| Performance Metric | SDS-PAGE with Densitometry | CE-SDS with Direct UV Detection |
|---|---|---|
| Resolution | Moderate; heat-stressed IgG shows multiple faint, poorly resolved bands [24] | High; clear separation and identification of fragments (LC, 2H, 2H1L, nonglycosylated IgG) [24] |
| Signal-to-Noise Ratio | Lower; difficult autointegration for impurity bands in stressed samples [24] | Significantly higher; enables easy identification and quantitation of minor impurities [24] |
| Reproducibility | Subject to gel-to-gel variability and manual processing errors [1] | Excellent; four consecutive analyses of degraded IgG show good overall reproducibility [24] |
| Detection of Nonglycosylated IgG | Not resolved [24] | Easily detected and quantified [24] |
| Quantitative Linearity | Limited by staining saturation and destaining effects [70] | Inherently linear due to direct UV absorbance of peptide bonds [24] |
Key Experimental Data and Findings
The experimental data from this comparison is particularly revealing. In the analysis of heat-stressed IgG, CE-SDS was able to resolve and quantify specific degradation products, including nonglycosylated IgG, which is critically important for function yet was not detectable by SDS-PAGE [24]. The signal-to-noise advantage of direct UV detection is stark, transforming faint, unquantifiable bands on a gel into clear, integratable peaks on an electropherogram. This capability directly enhances the reliability of purity assessments, especially for detecting low-abundance impurities.
The reproducibility of CE-SDS, with low percent relative standard deviation (%RSD) across replicate runs, underscores its suitability for quality control (QC) environments where interlab and intralab comparability are essential for regulatory filings [24]. In contrast, the manual processes of SDS-PAGE, including gel casting, staining, and destaining, introduce inherent variability that challenges reproducibility.
Detailed Experimental Protocols
Protocol for SDS-PAGE with Densitometric Quantitation
Materials:
- Invitrogen NuPAGE Mini-Gel electrophoresis system with 4–12% Bis-Tris gel [24]
- GelCode Blue stain [24]
- Alpha View integration software or equivalent densitometry system [24]
Methodology:
- Sample Preparation: Dilute the protein sample (e.g., human IgG) to 0.2 mg/mL with water. Further dilute with 4X LDS sample buffer to a final concentration of 0.15 mg/mL [24].
- Electrophoresis: Load the prepared samples and molecular weight markers onto the gel. Conduct gel preparation, sample loading, and electrophoresis according to the manufacturer's recommended procedures [24].
- Staining and Destaining: After separation, carefully remove the gel and submerge it in GelCode Blue stain. Agitate until bands are visible. Subsequently, destain with water to remove background stain, a process that can take several hours [24].
- Imaging and Densitometry: Capture a high-resolution image of the destained gel. Use analysis software (e.g., Alpha View) to define lanes and bands, and quantify the percent area of each band based on pixel intensity [24].
Protocol for CE-SDS with Direct UV Detection
Materials:
- PA 800 plus capillary electrophoresis system (Beckman Coulter) or equivalent [24]
- Bare, fused-silica capillary [24]
- SDS sample buffer [24]
Methodology:
- Sample Preparation: Dilute the antibody sample to 1.0 mg/mL with SDS sample buffer. For non-reduced samples, heat at 70 °C for three minutes to denature [24].
- Capillary Injection and Separation: Inject the prepared sample into the capillary inlet hydrodynamically or by applying voltage (e.g., 5 kV for 20 seconds). Separate proteins by applying an electric field (e.g., 500 V/cm for 35 minutes) [24].
- Online Detection: As separated proteins pass a window near the capillary outlet, measure their UV absorbance at 220 nm in real-time. The system software records the signal, generating an electropherogram [24].
- Data Analysis: Using the system software (e.g., Beckman Coulter 32 Karat), identify peaks based on known standards and perform automated or manual integration to determine the peak area percentage for each species [24].
The Scientist's Toolkit: Essential Research Reagents and Materials
The successful implementation of either analytical method requires specific reagents and instrumentation. The following table details key solutions for both workflows.
table: Research Reagent Solutions for Purity Assessment
| Item | Function / Application | Example Use Case |
|---|---|---|
| Maurice CE-SDS Cartridges (Turbo & PLUS) | High-throughput or high-resolution CE-SDS separation for various biotherapeutics [1] | Analytical development and QC release of mAbs, bispecifics, ADCs, and vaccines [1] |
| BioResolve Reversed-Phase RP Column | UPLC column with polyphenyl stationary phase for high-resolution protein separation as an orthogonal method [71] | Purity evaluation of SARS-CoV-2 spike antigen and host cell proteins [71] |
| Simple Wes (microCapillary Electrophoresis) | Automated microfluidic western blot for protein identification and molecular weight determination [71] | Orthogonal identification of antigen and truncates in RP-HPLC fractions [71] |
| NuPAGE Bis-Tris Precast Gels | Stable, high-resolution gels for SDS-PAGE over a broad molecular weight range [24] | Separation of reduced and non-reduced antibody samples for purity analysis [24] |
| GelCode Blue Stain | A safe, ready-to-use Coomassie-based stain for visualizing protein bands in gels [24] | Total protein detection post-SDS-PAGE for densitometric analysis of IgG purity [24] |
Orthogonal Methods and Advanced Applications
The Power of Orthogonal Characterization
The most robust purity assessments often employ orthogonal methods. A notable example from vaccine development involves using a suite of techniques—RP-HPLC, Simple Wes, and LC/MS/MS—to characterize a recombinant SARS-CoV-2 spike antigen rapidly [71]. In this workflow, RP-HolesterolPLC provided a purity value, while fractions were collected for orthogonal identification. Simple Wes confirmed antigen identity and detected truncates, while LC/MS/MS identified host cell proteins [71]. This multi-faceted approach provided a comprehensive purity and identity profile that no single method could deliver, enabling rapid decision-making for a Phase 3 clinical trial.
Advanced Detection: Intrinsic Fluorescence Imaging
An emerging technology that bridges the gap between traditional staining and direct UV detection is PAGE with online Intrinsic Fluorescence Imaging (PAGE-IFI). This method detects the natural fluorescence of tryptophan and tyrosine residues in proteins under deep-UV light, making it a label-free and stain-free technique [72]. When applied to slab gels, it allows for real-time monitoring of separation and immediate detection after the run, avoiding the band broadening associated with offline staining. This method has demonstrated a limit of detection (LOD) for BSA of 20 ng, which is 5-fold lower than CBB staining, and a wide dynamic range for quantification [72]. The relationship of this advanced method to the core techniques is shown below.
The quantitative comparison between densitometry after SDS-PAGE and direct UV detection in CE-SDS reveals a clear trajectory in analytical science toward automation, precision, and reproducibility. While SDS-PAGE with densitometry remains a valuable and accessible tool for initial purity checks, its semi-quantitative nature, lower throughput, and susceptibility to variability limit its application in critical quality control and accelerated development environments.
CE-SDS with direct UV detection offers superior resolution, a higher signal-to-noise ratio, excellent reproducibility, and fully quantitative data, making it the technologically advanced choice for pivotal development stages and QC release testing. Its ability to detect critical quality attributes like nonglycosylated IgG, which can be missed by SDS-PAGE, is a significant functional advantage [24]. The choice between these methods should be guided by the specific requirements of the development phase, balancing the need for speed, cost, and accessibility against the imperative for precise, reproducible, and regulatory-ready data. The integration of orthogonal methods and emerging technologies like intrinsic fluorescence imaging will continue to enhance the accuracy and depth of protein purity assessment, ultimately supporting the development of safer and more effective biopharmaceuticals.
In the development and quality control (QC) of biopharmaceuticals, particularly monoclonal antibodies (MAbs), the ability to detect critical quality attributes (CQAs) such as protein fragments and nonglycosylated variants is paramount [24] [73]. Glycosylation, a common post-translational modification, significantly influences the stability, immunogenicity, and effector functions of therapeutic antibodies [73]. Similarly, the presence of protein fragments can indicate degradation or inefficiencies in the manufacturing process. While SDS-PAGE has been a foundational technique in protein analysis, its resolving power for detecting these critical species in comparison to modern automated alternatives must be objectively evaluated. This guide frames this comparison within a broader thesis on assaying reproducibility, examining how different methods perform under standardized conditions to provide scientists and drug development professionals with actionable data for their analytical workflows.
Methodological Comparison: SDS-PAGE vs. CE-SDS and Microfluidic Systems
Key Techniques and Workflows
The fundamental difference between the methods lies in their operational workflow: traditional SDS-PAGE is a manual, gel-based process, while CE-SDS and microfluidic systems are automated, capillary-based techniques.
SDS-PAGE separates proteins based on their molecular weight after they have been denatured and coated with the anionic detergent SDS [24]. The process requires significant manual intervention for gel preparation, running, staining, destaining, and imaging, which introduces opportunities for variability. In contrast, Capillary Electrophoresis SDS (CE-SDS) automates this separation within a capillary filled with a replaceable SDS-gel buffer [24]. Proteins are detected in real-time as they migrate past a UV or fluorescence detector. Similarly, microfluidic platforms like the LabChip system perform a microfluidic version of SDS-PAGE, integrating staining, destaining, separation, and detection into a single, automated process with sippers that directly aspirate samples from 96-well plates [11].
Comparative Experimental Data and Performance
Direct, side-by-side comparison of these technologies using standardized samples reveals significant differences in their ability to resolve critical species, which is crucial for assaying reproducibility.
Table 1: Comparative Performance in Detecting Critical Species
| Analytical Feature | SDS-PAGE | CE-SDS | Microfluidic Systems (e.g., LabChip) |
|---|---|---|---|
| Detection of Nonglycosylated IgG | Not resolved effectively [24] | Easily detected and quantified [24] | Data not specifically provided for nonglycosylated IgG, but high resolution demonstrated [11] |
| Resolution of Protein Fragments | Can detect major fragments but with lower resolution and signal-to-noise [24] | High-resolution separation allowing easy quantitation of degradation species (e.g., LC, 2H, 2H1L) [24] | Better resolution than SDS-PAGE; can resolve two close bands where SDS-PAGE shows one [11] |
| Signal-to-Noise Ratio | Lower, making autointegration of impurity bands difficult [24] | Significantly higher, facilitating reliable peak identification and integration [24] | High, due to laser-induced fluorescence and on-chip destaining [11] |
| Assay Reproducibility | Subject to user variability in staining, destaining, and imaging [11] | High reproducibility across consecutive runs [24] | High reproducibility via automated normalization with internal markers and standard ladders [11] |
A direct comparison of a normal and a heat-stressed IgG sample clearly illustrates this performance gap. While SDS-PAGE showed a major band at 150 kDa and minor bands for the degraded sample, CE-SDS electropherograms provided high-resolution separation, allowing for easy quantitation of specific degradation species like light chains (LC), two heavy chains (2H), and a combination of two heavy and one light chain (2H1L) [24]. Critically, CE-SDS could detect nonglycosylated IgG, a species that was not resolved by SDS-PAGE [24]. This is a significant advantage because glycosylation is crucial to IgG function, and its absence must be monitored.
Quantitative Analysis of Throughput and Efficiency
Beyond resolving power, the practical aspects of throughput, time, and data handling significantly impact reproducibility and efficiency in a drug development setting.
Table 2: Workflow and Throughput Comparison
| Parameter | SDS-PAGE | CE-SDS | Microfluidic Systems |
|---|---|---|---|
| Hands-on Time | High (manual process) | Low (automated) | Low (fully automated) |
| Total Assay Time | 3–6 hours [11] | ~35 minutes separation time [24] | ~1 hour for a 96-well plate [11] |
| Data Analysis | Manual or semi-automated densitometry | Automated peak assignment and quantitation | Automated sizing and relative concentration |
| Sample Throughput | Low to medium (10-15 samples per gel) [74] | Medium | High (96 samples in ~1 hour) [11] |
| Hazardous Waste | Significant (polyacrylamide gels, solvents) | Low | Low |
The microfluidic system demonstrates particularly high throughput, analyzing 96 samples in approximately 1 hour, a process that would be prohibitively time-consuming with traditional SDS-PAGE [11]. This system also uses an internal marker and standard ladder for automated normalization, which minimizes user-induced variability and enhances the precision of sizing and relative concentration data [11].
Detailed Experimental Protocols
This protocol is used for quantifying fragments and nonglycosylated IgG in antibody samples.
- Sample Preparation: Dilute the antibody sample to 1.0 mg/mL with SDS sample buffer. For nonreduced analysis, heat the samples at 70 °C for three minutes.
- Instrumentation: A PA 800 plus capillary electrophoresis system or equivalent.
- Capillary: Bare, fused-silica capillary.
- Injection: Electrokinetic injection at 5 kV for 20 seconds.
- Separation: Apply an electric field of 500 V/cm for 35 minutes. The capillary is filled with a replaceable SDS-gel buffer.
- Detection: UV detection at 220 nm records the amount of protein passing through the detection window.
- Data Analysis: Software (e.g., Beckman Coulter 32 Karat) determines sample quantitations and migration times. Peaks are assigned based on an IgG standard, identifying fragments (LC, 2H) and nonglycosylated IgG.
This protocol is suitable for high-throughput monitoring of protein expression and purity, including fragment analysis.
- Sample Preparation: Proteins are denatured and coated with SDS, similar to traditional SDS-PAGE.
- Instrumentation: LabChip 90 system or equivalent.
- Sample Loading: The system automatically aspirates ~170 nL of sample from a 96-well plate through a capillary sipper.
- On-Chip Processing: The sample is mixed 1:1 with an internal marker. A 20-pL sample plug is electrophoretically injected into the separation channel, which is filled with a polymer sieving matrix.
- Staining & Destaining: Proteins are stained with a fluorescent dye contained in the gel matrix. A unique on-chip destaining step uses electrokinetic flow of SDS-free ions to dilute and break up dye-SDS micelles, drastically reducing background fluorescence.
- Detection: Separated protein bands are detected using laser-induced fluorescence (LIF).
- Data Analysis: Integrated software reports migration time, peak height, peak area, size (based on a ladder standard), relative concentration, and purity for each sample every 30 seconds.
Essential Research Reagent Solutions
The following reagents and tools are critical for executing the described experiments and ensuring data reproducibility.
Table 3: Key Research Reagent Solutions
| Item | Function in the Workflow | Example or Note |
|---|---|---|
| SDS Sample Buffer | Denatures proteins and confers a uniform negative charge for separation. | Often contains LDS (Lithium Dodecyl Sulfate) and a reducing agent like DTT [24]. |
| Replaceable Sieving Matrix | Acts as the separation medium within the capillary or microfluidic chip. | A linear polymer solution代替传统的聚丙烯酰胺凝胶 [24] [11]. |
| Internal Fluorescent Marker | Normalizes migration time and determines relative concentration; critical for reproducibility. | Used in microfluidic systems to calibrate each run [11]. |
| Protein Ladder Standards | Calibrates the system for accurate molecular weight determination. | Essential for both CE-SDS and microfluidic systems to assign sizes to unknown peaks [24] [11]. |
| Glycan-Binding Reagents (Lectins/Antibodies) | Detect specific glycosylation features; used in orthogonal methods like GlycoSense. | Enable detection of glycofeatures like terminal sialic acid or galactose without glycan release [73]. |
The experimental data compellingly demonstrates that while SDS-PAGE remains a useful tool for basic protein analysis, its resolving power for detecting critical species like nonglycosylated IgG and low-abundance protein fragments is substantially outperformed by automated alternatives such as CE-SDS and microfluidic systems. The superior signal-to-noise ratio, quantitative accuracy, and high degree of automation of these modern techniques directly enhance assaying reproducibility—a core requirement in robust biopharmaceutical development. For researchers and QC professionals, transitioning to these advanced methods provides a more reliable, efficient, and informative pathway for ensuring the safety, efficacy, and consistent quality of therapeutic proteins.
In the quality control (QC) of biopharmaceuticals, demonstrating the purity and accurately determining the apparent molecular mass of protein-based therapeutics are critical steps required by regulatory authorities. Sodium dodecyl sulfate–polyacrylamide gel electrophoresis (SDS-PAGE) has been a foundational technique in this field for decades. However, the technological landscape is evolving, with capillary electrophoresis SDS (CE-SDS) and automated systems such as Simple Western emerging as prominent alternatives. The selection of an appropriate method has direct implications for the reliability, reproducibility, and regulatory compliance of the biopharmaceutical development and manufacturing process. This guide objectively compares SDS-PAGE with these alternative methods, focusing on performance data, experimental protocols, and their alignment with modern regulatory frameworks that emphasize an analytical method lifecycle and fit-for-purpose validation [75].
Performance Comparison: Precision, Reproducibility, and Molecular Mass Analysis
A direct comparative study of CE-SDS (using Maurice and Wes systems), microchip gel electrophoresis (LabChip GXII), and traditional SDS-PAGE provides critical quantitative data for informed decision-making [40].
Table 1: Comparison of Key Performance Metrics for Electrophoresis Methods
| Metric | SDS-PAGE | CE-SDS (Maurice) | Simple Western (Wes) | Microchip GXII |
|---|---|---|---|---|
| Precision | Similar to CE-SDS | Similar to SDS-PAGE | Similar to SDS-PAGE | Similar to SDS-PAGE |
| Repeatability | Similar to CE-SDS | Similar to SDS-PAGE | Similar to SDS-PAGE | Similar to SDS-PAGE |
| Mr Analysis of Glycoproteins | Variable, method-dependent deviations from reference values | Variable, method-dependent deviations from reference values | Variable, method-dependent deviations from reference values | Variable, method-dependent deviations from reference values |
| Throughput | Lower (manual) | Higher (automated) | Higher (automated) | Higher (automated) |
| Data Output | Qualitative/Semi-quantitative | Quantitative | Quantitative | Quantitative |
Overall, the study concluded that CE-SDS-based methods are similar to SDS-PAGE with respect to precision and repeatability when testing standard model proteins [40]. The critical differentiator emerges when analyzing complex, glycosylated proteins, a common feature of biopharmaceuticals. Here, the apparent molecular mass (Mr) determination can show high deviations both among the different methods and compared to reference values. This highlights that method suitability cannot be assessed solely on ideal model proteins and must be confirmed with the specific product attributes, such as glycosylation [40].
Another study comparing SDS-PAGE and size-exclusion chromatography (SEC) for analyzing protein conjugation reactions found that neither method alone provides sufficient structural information. The basic conjugate units observed in SDS-PAGE tended to form higher-order aggregates under SEC conditions, underscoring the importance of orthogonal methods for a comprehensive understanding of product composition [18].
Experimental Protocols and Workflows
Understanding the fundamental workflow of these techniques and their integration into the analytical lifecycle is key to evaluating their suitability.
Core Experimental Workflow for Gel-Based Analyses
The following diagram illustrates the generalized workflow for sample preparation and separation, which is common to both SDS-PAGE and CE-SDS before the detection stage.
Key Method-Specific Protocols
SDS-PAGE Protocol:
- Sample Preparation: Protein samples are denatured and reduced by heating in a buffer containing SDS and a reducing agent (e.g., β-mercaptoethanol or dithiothreitol). SDS binds to the protein, imparting a uniform negative charge [40].
- Electrophoresis: The prepared samples are loaded into wells on a polyacrylamide gel. An electric field is applied, causing the proteins to migrate through the gel matrix. Smaller proteins migrate faster, while larger proteins are retarded [40].
- Detection & Analysis: After separation, proteins are stained (e.g., with Coomassie Blue or silver stain). The gel is imaged, and the molecular mass is estimated by comparing migration distance to a protein ladder. Data analysis is typically semi-quantitative.
CE-SDS Protocol (as used in Maurice/Simple Western):
- Sample Preparation: Similar to SDS-PAGE, samples are denatured and reduced using SDS and a reducing agent [40].
- Capillary Separation: The sample is injected into a capillary filled with a sieving polymer matrix. Under the influence of a high-voltage electric field, proteins are separated by size.
- On-capillary Detection: As proteins pass a detector (typically UV or laser-induced fluorescence), they are quantified in real-time. This provides a quantitative electropherogram, eliminating the need for manual staining and destaining [40].
The Analytical Method Lifecycle in Practice
Regulatory guidance advocates for an analytical lifecycle management approach, which consists of three main stages: method design, method qualification, and continued procedure performance verification [75]. The following diagram illustrates this continuous process and its key components.
This lifecycle begins with establishing an Analytical Target Profile (ATP) to define the method's goals and acceptance criteria. Method development and validation then follow, proving the method is "fit-for-purpose." After implementation, methods must be maintained through a formal Analytical Method Maintenance (AMM) program, which includes periodic performance reviews and monitoring via control charts to ensure ongoing compliance and suitability [76].
Regulatory Frameworks and Industry Best Practices
The validation and use of QC methods are governed by stringent regulatory expectations.
- Fit-for-Purpose Validation: The extent of validation changes with product development stage. Early-stage validation can be simple, evolving into a full validation according to ICH Q2(R1) guidelines for commercial products [75]. For monoclonal antibodies, a generic validation approach using representative material can be applied to speed up new product testing [75].
- Method Transfer: When a method is moved between testing sites, a transfer is required to confirm performance. Approaches include a full side-by-side comparative test, covalidation (where multiple sites participate in the validation), or a simpler compendial verification for pharmacopeial methods [75].
- Spiking Studies for Accuracy: For impurity assays like SEC, validation requires spiking studies to demonstrate accuracy and recovery. Industry best practices involve generating stable, representative impurities through controlled methods like oxidation or reduction to simulate aggregates or low-molecular-weight species [75].
Essential Research Reagent Solutions
The following table details key reagents and materials critical for performing these electrophoresis-based analyses.
Table 2: Key Reagents and Materials for Electrophoresis Methods
| Reagent/Material | Function | Example in Protocol |
|---|---|---|
| SDS (Sodium Dodecyl Sulfate) | Denatures proteins and confers a uniform negative charge, enabling separation by size rather than charge. | Sample preparation buffer for both SDS-PAGE and CE-SDS [40]. |
| Reducing Agent (e.g., DTT, β-Mercaptoethanol) | Breaks disulfide bonds within and between protein chains, ensuring complete unfolding and accurate size analysis. | Added to sample buffer before heating for reduction [40]. |
| Protein Molecular Weight Ladder | A set of pre-stained or native proteins of known molecular weights used to calibrate the gel/capillary and estimate the size of unknown proteins. | Loaded alongside samples in SDS-PAGE; used for system suitability in CE-SDS. |
| Sieving Matrix (Gel or Polymer) | The porous medium through which proteins are separated. It acts as a molecular sieve. | Polyacrylamide gel for SDS-PAGE; polymer solution for CE-SDS capillaries [40]. |
| Reference Standards & Assay Controls | Well-characterized materials used to qualify the assay system, monitor performance over time, and demonstrate precision and accuracy. | Critical for method validation, transfer, and ongoing monitoring via control charts in an AMM program [76]. |
The choice between SDS-PAGE, CE-SDS, and other automated systems for biopharmaceutical quality control is multifaceted. While SDS-PAGE remains a reliable and widely understood technique, CE-SDS and automated platforms offer advantages in quantitative data output, automation, and throughput, showing comparable precision and repeatability [40]. The critical consideration is that method performance must be evaluated in the context of the specific product, particularly for complex molecules like glycoproteins, where apparent mass shifts can occur [40]. From a regulatory perspective, the selection, validation, and ongoing maintenance of any method should be managed within a structured analytical lifecycle approach [75] [76]. This ensures the method remains fit-for-purpose, compliant, and capable of reliably measuring the critical quality attributes of a biopharmaceutical throughout its commercial life.
Conclusion
The pursuit of reproducible protein analysis requires a nuanced understanding of both traditional and emerging technologies. While SDS-PAGE remains a fundamental, versatile tool, its manual nature introduces variability that can challenge reproducibility. CE-SDS emerges as a superior alternative for quantitative applications requiring high precision, offering automation, superior resolution, and excellent reproducibility, particularly for biotherapeutic analysis. The choice between methods should be guided by application needs: SDS-PAGE for broad, qualitative profiling and educational purposes, and CE-SDS for rigorous quality control and quantitative purity assessment. Future directions will likely see increased adoption of automated capillary systems, integration with data analytics, and development of standardized cross-method validation protocols to further enhance reliability in biomedical research and drug development.
References
- 1. The Evolution of SDS-Based Protein Separation [https://www.bio-techne.com/resources/blogs/advantages-of-ce-sds]
- 2. SDS-PAGE: A Cornerstone of Protein Analysis in Modern ... [https://www.metwarebio.com/sds-page-protein-analysis/]
- 3. Overview of Protein Electrophoresis [https://www.thermofisher.com/us/en/home/life-science/protein-biology/protein-biology-learning-center/protein-biology-resource-library/pierce-protein-methods/overview-electrophoresis.html]
- 4. SDS-PAGE [https://en.wikipedia.org/wiki/SDS-PAGE]
- 5. Analysis of Protein Molecular Weight by SDS-PAGE [https://www.mtoz-biolabs.com/analysis-of-protein-molecular-weight-by-sds-page.html]
- 6. How SDS-PAGE Separates Proteins [https://azurebiosystems.com/blog/how-sds-page-separates-proteins/]
- 7. Size-Dependent Separation of Proteins Denatured in SDS ... [https://www.sciencedirect.com/science/article/abs/pii/S0003269783713199]
- 8. Using T4 genetics and Laemmli's development of high ... [https://pmc.ncbi.nlm.nih.gov/articles/PMC9576892/]
- 9. Ulrich Laemmli's Development of SDS Polyacrylamide Gel ... [https://fnl.mit.edu/ulrich-laemmlis-development-of-sds-polyacrylamide-gel-electrophoresis/]
- 10. Buffer: The 5 Critical Components Laemmli [https://bitesizebio.com/44540/laemmli-buffer-what-is-it-for-anyway/]
- 11. An Automated Alternative to SDS-PAGE for Protein Analysis [https://www.americanlaboratory.com/913-Technical-Articles/30740-An-Automated-Alternative-to-SDS-PAGE-for-Protein-Analysis/]
- 12. What are the differences between gel electrophoresis and ... [https://www.aatbio.com/resources/faq-frequently-asked-questions/what-are-the-differences-between-gel-electrophoresis-and-sds-page]
- 13. Mastering Electrophoresis: Techniques, Equipment, and ... [https://www.labx.com/resources/mastering-electrophoresis-techniques-equipment-and-applications-in-dna-rna-and-protei/5535]
- 14. Capillary Gel Electrophoresis: An Alternative to SDS-PAGE? [https://bitesizebio.com/24080/capillary-gel-electrophoresis-an-alternative-to-sds-page/]
- 15. Thermo Scientific Chemicals Laemmli sample... | Fisher Scientific SDS [https://www.fishersci.ie/shop/products/laemmli-sds-sample-buffer-reducing-6x-2/15493939]
- 16. Gel Electrophoresis, PAGE, SDS- PAGE – MCAT... | MedSchoolCoach [https://www.medschoolcoach.com/gel-electrophoresis-page-sds-page-mcat-biochemistry/]
- 17. BlotIt—Optimal alignment of Western blot and qPCR ... [https://pmc.ncbi.nlm.nih.gov/articles/PMC9365137/]
- 18. A comparison between SDS-PAGE and size exclusion ... [https://www.sciencedirect.com/science/article/abs/pii/S0165022X02000702]
- 19. Comparison of in-gel protein separation techniques ... [https://pmc.ncbi.nlm.nih.gov/articles/PMC4234072/]
- 20. How to Analyze Protein - Creative Proteomics Disulfide Bonds [https://www.creative-proteomics.com/ptms-proteomics/resource-how-analyze-protein-disulfide-bonds.htm]
- 21. What's Your Western Blot Success Rate? [https://www.bosterbio.com/blog/post/whats-your-western-blot-success-rate?srsltid=AfmBOor6YwwWBjTrlZPpEMU9lW73W17yR6cifO7Sg4l3LJqws2BHn5tI]
- 22. Guide to western blot quantification [https://www.abcam.com/en-us/knowledge-center/western-blot/western-blot-quantification]
- 23. With an anticipated CAGR of 6.2%, the SDS-PAGE ... [https://www.linkedin.com/pulse/anticipated-cagr-62-sds-page-electrophoresis-market-xpopf]
- 24. Comparing SDS-PAGE and CE-SDS for Antibody Purity ... [https://www.bioprocessintl.com/qa-qc/comparing-sds-page-and-ce-sds-for-antibody-purity-analysis]
- 25. A Database of Accurate Electrophoretic Migration Patterns ... [https://www.sciencedirect.com/science/article/pii/S0022283622005605]
- 26. SDS-PAGE Electrophoresis Buffer Insightful Analysis [https://www.archivemarketresearch.com/reports/sds-page-electrophoresis-buffer-639442]
- 27. SDS-PAGE guide: Sample preparation to analysis [https://www.abcam.com/en-us/knowledge-center/western-blot/sds-page-guide]
- 28. Protein Electrophoresis Using SDS-PAGE: A Detailed ... [https://www.goldbio.com/blogs/articles/protein-electrophoresis-sds-page-overview?srsltid=AfmBOooNcAVSHoMbNwQ9MvA3fxI74El9DQ80vG7m0CDu8v-B9IPjJKgA]
- 29. Overview of SDS-PAGE [https://www.creative-proteomics.com/resource/overview-of-sds-page.htm]
- 30. SDS-PAGE and Western Blot Protocol [https://www.bostonbioproducts.com/resources/western-blotting-protocol/]
- 31. SDS-PAGE: The science behind all those bubbles [https://www.antibodiesinc.com/pages/sds-page-demystified?srsltid=AfmBOookrzTje8FhdyfLRxep0eVXV3PIegpr0lZBOndGdnQAKHE8WH-1]
- 32. SDS-PAGE Protocol [https://neutab.creative-biolabs.com/sds-page-analysis.htm]
- 33. Visualization of proteins in SDS PAGE gels [https://www.qiagen.com/us/knowledge-and-support/knowledge-hub/bench-guide/protein/protein-analysis/visualization-of-proteins-in-sds-page-gels]
- 34. Native SDS-PAGE: High Resolution Electrophoretic ... [https://pmc.ncbi.nlm.nih.gov/articles/PMC4517606/]
- 35. Capillary Electrophoresis in the Biopharmaceutical Industry [https://www.chromatographyonline.com/view/capillary-electrophoresis-biopharmaceutical-industry-part-i]
- 36. Explore High-Quality Automated Electrophoresis for Protein A [https://www.technologynetworks.com/biopharma/application-notes/explore-high-quality-automated-electrophoresis-for-protein-analysis-385017]
- 37. Assessing the Comparability of Degradation Profiles ... [https://pmc.ncbi.nlm.nih.gov/articles/PMC12472202/]
- 38. Application of Analytical Quality by Design to the ... [https://www.sciencedirect.com/science/article/abs/pii/S0731708524004266]
- 39. Comparison of SEC and CE-SDS methods for monitoring ... [https://www.sciencedirect.com/science/article/abs/pii/S0731708517306374]
- 40. A comparative study of CE-SDS, SDS-PAGE, and Simple ... [https://pubmed.ncbi.nlm.nih.gov/33956358/]
- 41. SDS-PAGE in Food Science: Elevating Protein Insight and ... [https://www.eurofinsus.com/food-testing/resources/sds-page-in-food-science-elevating-protein-insight-and-product-integrity/]
- 42. What is SDS-PAGE? Uses, How It Works & Top Companies ... [https://www.linkedin.com/pulse/what-sds-page-uses-how-works-top-companies-2025-clearsedge-research-kztwf]
- 43. High-resolution native electrophoresis in-gel activity assay ... [https://www.nature.com/articles/s41598-025-24684-3]
- 44. Establishment of a Sandwich ELISA for Detection of Pan- ... [https://pmc.ncbi.nlm.nih.gov/articles/PMC12196402/]
- 45. Enhancing therapeutic antibody profiling: orthogonal ... [https://pmc.ncbi.nlm.nih.gov/articles/PMC12510943/]
- 46. Efficient protein extraction for assessing food allergy risk in ... [https://www.sciencedirect.com/science/article/pii/S0308814624028711]
- 47. Revolutionary Advances in SDS-PAGE Technology Drive [https://www.openpr.com/news/4047935/revolutionary-advances-in-sds-page-technology-drive]
- 48. Resolve SDS-PAGE Disadvantages with CE-SDS [https://www.bio-techne.com/instruments/ice/advantages-ce-sds-over-sds-page]
- 49. Investigation of monoclonal antibody fragmentation ... [https://www.sciencedirect.com/science/article/abs/pii/S0731708513001842]
- 50. Specific and high-resolution identification of monoclonal ... [https://pmc.ncbi.nlm.nih.gov/articles/PMC6748579/]
- 51. Deciphering food proteins: The applications of SDS-PAGE ... [https://www.sciencedirect.com/science/article/abs/pii/S2212429225003025]
- 52. Troubleshooting SDS-PAGE Gel Running Issues [https://www.goldbio.com/blogs/articles/troubleshooting-sds-page-gel-running-issues?srsltid=AfmBOopsiXJ5gX4vHsQKvfnI_IW2UrsrVovRloRdowXQdOrwR6X_pfpQ]
- 53. Western blotting guide: Part 2, Protein separation by SDS- ... [https://www.jacksonimmuno.com/secondary-antibody-resource/technical-tips/western-blotting-guide-part-2/]
- 54. Nucleic Acid Gel Electrophoresis Troubleshooting [https://www.thermofisher.com/us/en/home/life-science/cloning/cloning-learning-center/invitrogen-school-of-molecular-biology/na-electrophoresis-education/na-electrophoresis-troubleshooting.html]
- 55. Protease Inhibitors 101: Best Practices for Use in the Lab [https://bitesizebio.com/58195/protease-inhibitors-101/]
- 56. Screening, Purification and Characterization of Protease ... [https://pmc.ncbi.nlm.nih.gov/articles/PMC6137568/]
- 57. What's the Difference Between SDS-PAGE and Native ... [https://synapse.patsnap.com/article/whatE28099s-the-difference-between-sds-page-and-native-page]
- 58. Comparison of Strong Cation Exchange and SDS/PAGE ... [https://pmc.ncbi.nlm.nih.gov/articles/PMC3707127/]
- 59. High-Throughput Fluorescent Assay for Inhibitor Screening ... [https://pmc.ncbi.nlm.nih.gov/articles/PMC8270262/]
- 60. Efficiency Improvements and Discovery of New Substrates ... [https://www.sciencedirect.com/science/article/pii/S2472555222067545]
- 61. Identification of SARS-CoV-2 inhibitors targeting Mpro and ... [https://www.nature.com/articles/s42003-022-03090-9]
- 62. 5 Steps to Fundamental Protein Preparation [https://www.thermofisher.com/br/en/home/life-science/protein-biology/protein-purification-isolation/5-steps-fundamental-protein-preparation.html]
- 63. Effects of Reusing Gel Electrophoresis and Electrotransfer ... [https://pmc.ncbi.nlm.nih.gov/articles/PMC4972471/]
- 64. Problems with Multiple Use of Transfer Buffer in Protein ... - PMC [https://pmc.ncbi.nlm.nih.gov/articles/PMC2841995/]
- 65. 6 Best Tips for Troubleshooting Poor Band Separation on ... [https://azurebiosystems.com/blog/6-tips-for-troubleshooting-poor-band-separation-on-sds-page-gels/]
- 66. Use of DNA ladders for reproducible protein fractionation ... [https://pmc.ncbi.nlm.nih.gov/articles/PMC2667379/]
- 67. Improving accuracy and reproducibility in life science ... [https://www.atcc.org/resources/white-papers/improving-accuracy-and-reproducibility-in-life-science-research]
- 68. Quantification of Folded and Misfolded Proinsulin Forms ... [https://pmc.ncbi.nlm.nih.gov/articles/PMC12152102/]
- 69. A comparative study of CE‐SDS, SDS‐PAGE, and Simple ... [https://www.semanticscholar.org/paper/A-comparative-study-of-CE%E2%80%90SDS%2C-SDS%E2%80%90PAGE%2C-and-Simple-Scheller-Krebs/bc62fc900ae320fbfe3813514a5284b5a804f511]
- 70. Quantitation and speciation of residual protein within active ... [https://www.sciencedirect.com/science/article/abs/pii/S0731708521005045]
- 71. Accelerated vaccine process development by orthogonal ... [https://www.nature.com/articles/s41598-025-96642-y]
- 72. Real-time and quantitative protein detection via ... [https://www.sciencedirect.com/science/article/abs/pii/S0003267024000205]
- 73. Simplifying the detection and monitoring of protein ... [https://www.nature.com/articles/s41598-023-27634-z]
- 74. Western blotting vs. ELISA [https://www.abcam.com/en-us/knowledge-center/western-blot/elisa-vs-western-blot]
- 75. Points to Consider in Quality Control Method Validation ... [https://www.bioprocessintl.com/qa-qc/points-to-consider-in-quality-control-method-validation-and-transfer]
- 76. How to Maintain Suitable Analytical Test Methods [https://www.biopharminternational.com/view/how-maintain-suitable-analytical-test-methods-tools-ensuring-validation-continuum]