Denaturing vs. Non-Denaturing Electrophoresis: A Comprehensive Guide for Biomedical Researchers
This article provides a definitive comparison of denaturing and non-denaturing electrophoresis techniques for researchers and drug development professionals.
Denaturing vs. Non-Denaturing Electrophoresis: A Comprehensive Guide for Biomedical Researchers
Abstract
This article provides a definitive comparison of denaturing and non-denaturing electrophoresis techniques for researchers and drug development professionals. It covers foundational principles, from the core objective of denaturing gels that linearize biomolecules for size-based separation to the purpose of native gels that preserve complex structures for functional studies. The content details specific methodologies and applications across genomics and proteomics, including SDS-PAGE, native PAGE, and specialized techniques like DGGE. A dedicated troubleshooting section addresses common artifacts like smearing and poor resolution, offering proven solutions. Finally, the article delivers a critical validation framework, comparing resolution, sensitivity, and cost-effectiveness to guide technique selection for diverse research and diagnostic goals, from protein purity analysis to microbial community profiling.
Core Principles: How Denaturing and Native Gels Work
Gel electrophoresis is a standard laboratory technique used to separate biological macromolecules, such as proteins and nucleic acids, based on their physical properties. The fundamental difference between denaturing and non-denaturing electrophoresis lies in the treatment of the native structure of these molecules. Denaturing electrophoresis employs conditions that disrupt the natural, folded structure of proteins or nucleic acids, unraveling them into linear chains. In contrast, non-denaturing electrophoresis (also called native electrophoresis) maintains the native conformation of the molecule throughout the separation process, preserving all levels of its structural integrity [1].
This distinction is critical for researchers because the choice of method directly determines the type of information that can be obtained from an experiment. While denaturing techniques provide excellent separation based primarily on molecular mass, non-denaturing techniques allow for the analysis of functional, folded complexes, enabling the study of biological activity, protein-protein interactions, and higher-order structures [2] [3]. This guide provides a detailed, objective comparison of these two foundational techniques, equipping scientists with the knowledge to select the appropriate method for their specific research goals in drug development and basic science.
Core Mechanistic Differences
The operational distinction between these two techniques stems from the use of denaturing agents. In denaturing gel electrophoresis, the ionic detergent sodium dodecyl sulfate (SDS) is the primary agent for proteins. SDS denatures proteins by wrapping around the polypeptide backbone, dissolving hydrophobic regions and breaking non-covalent ionic bonds. This process causes the protein to lose its secondary and tertiary structure, forming an unstructured chain. Simultaneously, a reducing agent like β-mercaptoethanol or dithiothreitol (DTT) is added to break disulfide bonds, further linearizing the protein [4]. The resulting SDS-polypeptide complexes have a uniform negative charge, meaning their migration through the gel is dependent almost entirely on molecular mass, with minimal influence from the protein's intrinsic charge or shape [3].
For nucleic acids, denaturation is achieved with different chemicals. Urea (at 6-8 M concentrations) or a mixture of formamide and DMSO is commonly used to denature DNA or RNA. These agents break hydrogen bonds that stabilize secondary structures, ensuring the molecules remain in a single-stranded, linear state during electrophoresis [2] [5]. This allows for the separation of nucleic acids based on their linear length, and the method is sensitive enough to resolve fragments differing by a single nucleotide [5].
Non-denaturing gels deliberately omit these disruptive agents. The sample buffer lacks SDS or urea, and the sample is not heated prior to loading. Consequently, proteins maintain their secondary, tertiary, and even quaternary structures. This means a multimeric protein will migrate as an intact complex rather than dissociating into its subunits [6] [3]. The migration rate in a native gel is therefore a function of the molecule's net charge, size, and three-dimensional shape [3]. A molecule's "size" in this context is not just its mass but its overall bulk or cross-sectional area, which is influenced by its folded conformation [2]. This principle also applies to nucleic acids, where non-denaturing conditions can be used to detect conformational changes caused by single-base substitutions, a technique known as Single-Strand Conformation Polymorphism (SSCP) [7].
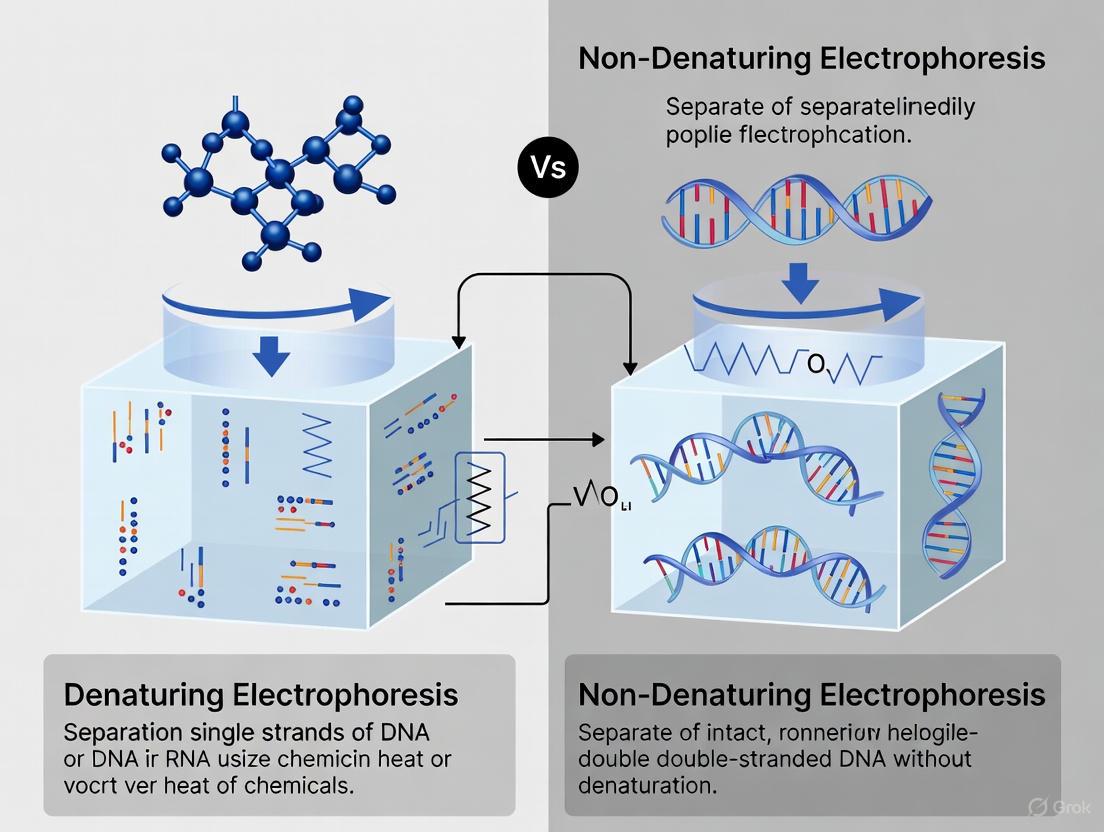
Diagram 1: Fundamental workflow divergence between denaturing and non-denaturing electrophoresis techniques.
Comparative Analysis: Separation Characteristics and Applications
The core mechanistic differences lead to distinct separation profiles and application suitability for each technique. The table below summarizes the key parameters and optimal use cases for denaturing and non-denaturing gel electrophoresis.
Table 1: Direct comparison of denaturing vs. non-denaturing gel electrophoresis
| Parameter | Denaturing Electrophoresis | Non-Denaturing Electrophoresis |
|---|---|---|
| Structure Treatment | Disruption of native structure; unfolding into linear chains [1] [4] | Preservation of native secondary, tertiary, and quaternary structure [1] [3] |
| Key Reagents | SDS (for proteins), Urea (for nucleic acids), reducing agents (DTT/BME) [2] [4] | Native buffers (e.g., Tris-Glycine), no denaturants [6] |
| Separation Basis | Primarily by molecular mass [3] | By net charge, size, and 3D shape [3] |
| Sample Preparation | Heating (70-100°C) in denaturing buffer [6] [4] | No heating; samples prepared in native buffer [6] |
| Key Applications | - Western blotting [2]- Determining protein purity & molecular weight [3] [4]- Protein sequencing preparation [2] | - Studying protein-protein interactions & quaternary structure [2] [3]- Isolating functional enzymes [2]- Analyzing DNA conformation (e.g., SSCP) [7] |
| Biological Activity | Not retained post-separation [3] | Often retained (e.g., enzymatic activity) [3] |
Beyond the applications listed, native gels are indispensable for determining the hierarchical state of biomolecules, such as distinguishing between circular and linear DNA forms or teasing apart the macromolecules that form a quaternary structure [2]. Denaturing gels, with their dependence on mass alone, are the gold standard for establishing sample purity and are a prerequisite for techniques like western blotting and mass spectrometry [2] [4].
Experimental Protocols and Data Interpretation
Denaturing Urea-PAGE for Nucleic Acids
This protocol, adapted from a detailed video article, is used for separating single-stranded DNA or RNA fragments between 2 to 500 bases, with single-nucleotide resolution [5].
Detailed Protocol:
- Gel Preparation: Assemble the gel sandwich according to the manufacturer's instructions. For a 60 ml gel solution, mix 28.8 g of ultrapure urea, 15-22.5 ml of 40% acrylamide (29:1), 6 ml of 10x TBE buffer, 199.2 µL of 30% ammonium persulfate, and 24 µL of TEMED. Adjust the acrylamide percentage based on the fragment size to be resolved (higher percentages for lower molecular weight fragments). Fill to 60 ml with distilled water. Heat the solution briefly to dissolve the urea, then pour it between the glass plates. Insert the comb and allow polymerization for 30-60 minutes [5].
- Pre-run: Dismount the gel and assemble the apparatus. Fill the chambers with 0.5-1x TBE running buffer. Remove the comb and rinse the wells. Prerun the gel for at least 30 minutes at 15-25 W to heat it to an optimal temperature of 45-55°C [5].
- Sample Preparation: Mix the DNA/RNA sample with an equal volume of 2x gel loading mix (containing 90% formamide, 0.5% EDTA, and marker dyes). Heat denature the samples at 70-90°C for a few minutes before loading [5].
- Electrophoresis: After the pre-run, rinse the wells again to remove leached urea. Load the samples and run the gel at constant watts to maintain a temperature of 55°C until the marker dye reaches the bottom [5].
- Post-processing: Fix the gel in a solution of TBE with 5-10% methanol/ethanol before drying or scanning [5].
Technical Tips: For sharper bands, load small volumes (1-5 µL is ideal). Thinner gels (e.g., 0.75 mm) provide better resolution than thicker gels (1.5 mm). To prevent "smiling" (bands curving upward), ensure even heat distribution by attaching a metal plate to the glass plate [5].
Non-Denaturing (Native) PAGE for Proteins
This protocol is based on the use of commercial pre-cast Tris-Glycine gels to separate proteins under native conditions [6] [3].
Detailed Protocol:
- Gel Setup: Remove the pre-cast gel from its pouch and rinse the cassette with deionized water. Gently pull the comb out and rinse the sample wells thoroughly with native 1x running buffer [6].
- Apparatus Assembly: Orient the gel in the mini-cell according to the manufacturer's instructions. Fill the inner and outer chambers with the appropriate Tris-Glycine Native Running Buffer [6].
- Sample Preparation: Dilute the protein sample with an equal volume of 2x Tris-Glycine Native Sample Buffer. Crucially, do not heat the sample [6].
- Electrophoresis: Load the samples and run the gel at 125 V constant voltage. The expected current starts at 6-12 mA per gel and ends at 3-6 mA. Run times can vary from 1 to 12 hours [6].
Data Interpretation: In native-PAGE, the migration of a protein does not directly correlate with its molecular weight. A protein's position is influenced by its intrinsic charge and native shape. A more negatively charged protein will migrate faster, while a bulkier, more globular protein of the same mass and charge will migrate more slowly. This makes native gels ideal for observing protein complexes, as a multimer will run at a higher apparent molecular weight than its individual subunits [3].
Table 2: Essential research reagents for electrophoresis experiments
| Reagent | Function | Denaturing Gels | Non-Denaturing Gels |
|---|---|---|---|
| SDS (Sodium Dodecyl Sulfate) | Denatures proteins; confers uniform negative charge [4] | Essential | Not Used |
| Urea | Denatures DNA/RNA by breaking hydrogen bonds [2] [5] | Essential (for nucleic acids) | Not Used |
| DTT / β-mercaptoethanol | Reducing agent; breaks disulfide bonds [6] [4] | Essential (for proteins) | Not Used |
| TEMED & Ammonium Persulfate | Catalyzes acrylamide polymerization [5] [3] | Used | Used |
| Tris-Glycine Buffer | Common running buffer system for PAGE [6] | SDS-containing version [6] | Native version [6] |
| Tracking Dyes (Bromophenol Blue) | Visualizes migration front during electrophoresis [5] | Used | Used |
Diagram 2: Relationship between sample treatment and the resulting separation principle in gel electrophoresis.
The choice between denaturing and non-denaturing electrophoresis is not a matter of one technique being superior to the other, but rather of selecting the right tool for the specific scientific question. Denaturing electrophoresis is the unequivocal method for determining molecular mass, assessing purity, and preparing samples for sequencing or western blotting, as it simplifies separation to a single parameter. Conversely, non-denaturing electrophoresis is the technique of choice when the goal is to study a biomolecule in its functional, folded state—be it for analyzing enzyme activity, protein-protein interactions, quaternary structure, or nucleic acid conformations.
Understanding the fundamental difference—the deliberate disruption versus the careful preservation of native structure—empowers researchers to design robust experimental workflows. By applying the protocols and considerations outlined in this guide, scientists and drug development professionals can effectively leverage these complementary techniques to advance their research, from basic characterizations to the analysis of complex biological assemblies.
Gel electrophoresis is a foundational technique for separating biomolecules based on their size and charge. A critical distinction in this methodology lies between native gels, which preserve the natural structure of molecules, and denaturing gels, which disrupt this structure to unfold molecules into linear chains [2] [8] [9]. In denaturing gel electrophoresis, the secondary, tertiary, and quaternary structures of proteins and nucleic acids are dismantled, leaving only the primary structure to be analyzed [9]. This unfolding is crucial for applications where the separation must be based purely on molecular weight, rather than being influenced by the molecule's inherent shape or complex charge distribution [2].
This process is achieved by employing chemical denaturants that disrupt the forces maintaining a molecule's three-dimensional conformation. The three most common agents—SDS, urea, and formamide—each employ distinct mechanisms to achieve this unfolding. Sodium dodecyl sulfate (SDS) is primarily used for proteins, while urea and formamide are applied to both proteins and nucleic acids, with urea-polyacrylamide gel electrophoresis (Urea-PAGE) being a standard for separating single-stranded DNA or RNA [5] [8]. By eliminating structural variability, denaturing gels allow for a more precise determination of molecular weight and are essential for techniques like protein sequencing, RNA analysis, and DNA fragment purification [2] [10].
Mechanisms of Action: How Denaturants Unfold Molecules
Denaturing agents work by interfering with the specific intramolecular forces that give a biomolecule its shape. The following diagram illustrates the core mechanisms by which SDS, urea, and formamide disrupt the native structures of proteins and nucleic acids.
SDS (Sodium Dodecyl Sulfate)
SDS is an ionic detergent that is predominantly used for denaturing proteins in SDS-PAGE. Its mechanism is two-fold. First, the SDS molecules bind tightly to the polypeptide backbone of proteins, with approximately one SDS molecule per two amino acids [9]. This extensive binding effectively masks the protein's intrinsic charge, rendering the overall charge of the SDS-protein complex overwhelmingly negative. Second, this negative charge cloud introduces strong electrostatic repulsion within the protein, which, coupled with the reduction of disulfide bonds by agents like beta-mercaptoethanol, causes the protein to unfold into a linear rod-like shape [9]. Consequently, all proteins, regardless of their original charge or shape, migrate through the gel based almost exclusively on their molecular weight [9].
Urea
Urea is a small, neutral molecule that acts as a powerful hydrogen-bond disruptor [5]. At high concentrations (typically 6-8 M), it forms new hydrogen bonds with the polar groups of proteins and the base pairs of nucleic acids, thereby competing with and breaking the intramolecular hydrogen bonds that are critical for maintaining secondary and tertiary structures [5] [8]. For RNA, this is particularly important as it prevents the formation of stable secondary structures (like stem-loops), allowing separation to be based purely on nucleotide length [5]. Urea is a key component in denaturing urea-polyacrylamide gel electrophoresis (Urea-PAGE), which is essential for analyzing or purifying single-stranded DNA or RNA fragments [5].
Formamide
Formamide, like urea, is a polar solvent that destabilizes hydrogen bonding within and between nucleic acid strands [2]. It achieves this by reducing the thermal stability of double-stranded DNA and RNA, thereby promoting the separation of strands. Formamide is frequently included in sample loading buffers for RNA electrophoresis to keep the RNA denatured before and during the run, preventing secondary structure formation that would impede its migration [5]. It is also a common component in denaturing gradient gel electrophoresis (DGGE) formulations, where it works in concert with urea to create a gradient of denaturing conditions [11] [12].
Comparative Analysis of Denaturing Agents
The choice of denaturant is dictated by the analyte and the specific experimental goals. The table below provides a direct comparison of the key properties and applications of SDS, urea, and formamide.
Table 1: Comparative Analysis of Common Denaturing Agents
| Denaturant | Common Usage Concentrations | Primary Mechanism of Action | Key Applications | Compatibility |
|---|---|---|---|---|
| SDS | 0.1% - 2% [9] | Ionic binding & charge masking [9] | SDS-PAGE for protein separation & molecular weight determination [9] | Proteins; incompatible with most native enzyme assays |
| Urea | 6 M - 8 M [5] [8] | Disruption of hydrogen bonds & hydrophobic interactions [5] | Urea-PAGE for ssDNA/RNA separation, protein denaturation [5] [8] | Proteins & nucleic acids (DNA/RNA); used in sequencing |
| Formamide | 50% - 99% (v/v) [5] [13] | Reduction of DNA/RNA thermal stability, disrupts H-bonding [2] | RNA sample loading buffers, Northern blotting, DGGE [5] [10] | Primarily nucleic acids; often used with urea in DGGE [12] |
Denaturing vs. Non-Denaturing Gels: A Critical Choice
The decision to use a denaturing or non-denaturing (native) gel system has profound implications for the experimental outcome, as each method provides different information about the analyte.
Table 2: Denaturing vs. Non-Denaturing Gel Electrophoresis
| Parameter | Denaturing Gels | Non-Denaturing Gels |
|---|---|---|
| Biomolecule Structure | Unfolded, linearized [2] [9] | Native conformation preserved [2] [8] |
| Basis of Separation | Primarily molecular weight/size [2] | Size, shape, intrinsic charge, and quaternary structure [2] |
| Typical Reagents | SDS, Urea, Formamide [5] [9] | No denaturants; may use Coomassie G-250 [8] |
| Key Applications | - Protein molecular weight determination (SDS-PAGE)- DNA/RNA sequencing & Northern blotting- Purification of oligonucleotides [5] [2] [10] | - Analysis of protein complexes & oligomeric state- Enzyme activity assays (zymography)- DNA-protein interactions (EMSA)- Analysis of nucleic acid folding [2] [8] |
Experimental Protocols: Key Methodologies in Practice
Denaturing Urea-Polyacrylamide Gel Electrophoresis (Urea-PAGE)
Urea-PAGE is a gold-standard method for separating single-stranded nucleic acids with single-nucleotide resolution [5]. The following workflow outlines the core steps for preparing and running a denaturing urea gel.
Detailed Protocol [5]:
Gel Preparation: For a standard 60 mL gel solution, combine 28.8 g of ultrapure urea, 15-22.5 mL of 40% acrylamide/bis-acrylamide (29:1) solution (depending on the desired percentage), 6 mL of 10x TBE buffer, and deionized water to volume. Heat the solution gently to dissolve the urea. Immediately before casting, add 199.2 µL of 10% ammonium persulfate (APS) and 24 µL of TEMED to catalyze polymerization. Pour the solution between glass plates and insert a comb.
Gel Pre-run: After polymerization, assemble the gel in the electrophoresis apparatus filled with 0.5x TBE running buffer. Remove the comb and rinse the wells. Prerun the gel for at least 30 minutes at constant watts (e.g., 15-25 W) to heat the gel to an optimal temperature of 45-55°C. This step removes residual urea from the wells and ensures the gel is at the correct denaturing temperature before sample loading.
Sample Preparation: Mix the DNA or RNA sample with an equal volume of 2x gel loading buffer (typically containing 90% formamide, EDTA, and tracking dyes like xylene cyanol and bromophenol blue). Heat the mixture to 70-90°C for a few minutes to denature the nucleic acids, then snap-cool on ice to prevent reformation of secondary structures.
Gel Electrophoresis: After the prerun, thoroughly rinse the wells again to remove leached urea. Load the denatured samples and run the gel at constant power to maintain a temperature of 45-55°C. Monitor the migration of the dye fronts.
Post-Electrophoresis Processing: Once separation is complete, disassemble the apparatus and transfer the gel to a fixation solution (e.g., TBE buffer with 5-10% methanol and ethanol) for 5-10 minutes. The gel can then be stained with a fluorescent dye like ethidium bromide or SYBR Green for visualization under UV light.
SDS-Polyacrylamide Gel Electrophoresis (SDS-PAGE)
SDS-PAGE is the principal method for determining protein molecular weight and analyzing protein purity.
Sample Preparation: Mix the protein sample with an SDS-containing loading buffer (usually containing SDS, glycerol, a tracking dye, and Tris-HCl). For full denaturation, reducing agents like beta-mercaptoethanol or dithiothreitol (DTT) are added to break disulfide bonds. Heat the samples at 95°C for 2-5 minutes to ensure complete denaturation.
Gel Casting: SDS-PAGE is typically performed on a discontinuous gel system consisting of a stacking gel (lower % acrylamide, ~5%) layered on top of a resolving gel (higher % acrylamide, e.g., 8-15%). The resolving gel, which does the actual separation, is cast first. After it polymerizes, the stacking gel, which serves to concentrate all proteins into a sharp band before they enter the resolving gel, is cast on top with the well-forming comb.
Gel Electrophoresis: Load the denatured protein samples and molecular weight markers into the wells. Run the gel at a constant voltage. The migration of proteins is based on their molecular weight, with smaller proteins moving faster through the gel matrix.
Staining and Visualization: After electrophoresis, proteins are visualized by staining with Coomassie Brilliant Blue or silver stain to reveal the band pattern.
Advanced Applications and Techniques
Denaturing gels form the backbone of numerous advanced analytical techniques. Denaturing Gradient Gel Electrophoresis (DGGE) uses a gel with a linear gradient of urea and formamide to separate DNA fragments of the same length based on their sequence-dependent melting properties [11] [12]. This technique is powerful for profiling microbial communities, as it can detect single-base-pair differences, allowing researchers to distinguish different species in a complex sample, such as in environmental monitoring or clinical diagnostics for fungal pathogens like Candida species [12]. Another variant, Temporal Temperature Gradient Gel Electrophoresis (TTGE), uses a uniform denaturant concentration but a steadily increasing temperature to achieve a similar separation, which can be easier to perform [12].
The Scientist's Toolkit: Essential Reagents and Materials
Successful denaturing gel electrophoresis requires precise preparation and high-quality reagents. The following table lists essential materials and their functions.
Table 3: Essential Reagents and Materials for Denaturing Gel Electrophoresis
| Item | Function/Purpose | Key Considerations |
|---|---|---|
| Ultrapure Urea | Primary denaturant in Urea-PAGE; disrupts H-bonds [5] | Use ultrapure grade to avoid cyanate ions which can modify nucleic acids/proteins. |
| 40% Acrylamide/Bis Solution (29:1 or 37.5:1) | Forms the porous gel matrix for separation [5] [8] | Neurotoxin in monomer form; handle with gloves. Ratio of bis-acrylamide crosslinks controls pore size. |
| TEMED & Ammonium Persulfate (APS) | Catalyzer (TEMED) and initiator (APS) for acrylamide polymerization [5] [8] | Polymerization begins immediately after adding; work swiftly. |
| TBE or TAE Buffer (10x Stock) | Running buffer provides ions for conductivity and maintains stable pH [5] [10] | TBE is common for PAGE due to higher buffering capacity. Dilute to 0.5x or 1x for working concentration. |
| Formamide (Deionized) | Denaturing agent in loading buffer; keeps nucleic acids unfolded [5] | Use deionized, high-purity formamide to prevent degradation. |
| SDS (Sodium Dodecyl Sulfate) | Ionic detergent for protein denaturation and charge masking in SDS-PAGE [9] | Use high-purity grade. Forms micelles at high concentrations. |
| Beta-Mercaptoethanol or DTT | Reducing agents that break protein disulfide bonds [9] | Essential for complete unfolding of many proteins in SDS-PAGE. |
| Ultrapure Water (Nuclease-Free) | Solvent for all buffers and gel components [10] | Critical for RNA work to prevent degradation by nucleases. Contaminants can affect migration [10]. |
SDS, urea, and formamide are indispensable tools in the molecular biology laboratory, each providing a reliable mechanism to unfold biomolecules for precise electrophoretic analysis. The choice between them is dictated by the analyte—SDS for proteins, urea and formamide for nucleic acids—and the specific resolution required. While denaturing gels are unparalleled for determining molecular weight and analyzing primary structure, native gels remain essential for studying functional conformations and complexes. Understanding the distinct mechanisms and applications of these denaturants allows researchers to design robust experimental strategies, from basic protein characterization to advanced community profiling in microbiology and clinical diagnostics.
In the realm of biomolecular separation, gel electrophoresis is a foundational technique. However, the choice between denaturing and non-denaturing (native) gel environments fundamentally dictates the type of information a researcher can obtain. Native gel electrophoresis operates under a core principle: to preserve the higher-order structure of proteins and nucleic acids throughout the separation process [2] [1]. Unlike their denaturing counterparts, which unfold biomolecules into linear chains, native gels maintain the intricate three-dimensional shape that is essential for biological activity [14]. This preservation allows researchers to separate molecules based not only on molecular mass and intrinsic charge, but also on cross-sectional area, shape, and conformational state [2] [1]. Consequently, native gels provide a unique window into the functional, folded world of biomolecules, enabling the analysis of quaternary protein structures, nucleic acid folding intermediates, and ligand-binding events in a state that closely mirrors their physiological condition.
Denaturing vs. Native Electrophoresis: A Fundamental Comparison
The key differentiator between denaturing and native electrophoresis lies in the treatment of the sample and the gel running buffer. Denaturing gels use agents like urea, SDS, or DMSO to disrupt hydrogen bonds and van der Waals forces, effectively unraveling proteins and nucleic acids into uniform linear chains [2] [1]. This simplification means separation depends primarily on length or molecular mass, as the intrinsic charge and complex shape are negated [2].
In stark contrast, the native gel environment deliberately avoids these disruptive agents. By doing so, it retains the native conformation of the analyte. This means a protein's quaternary structure (e.g., its multi-subunit assembly) and an RNA's complex secondary and tertiary folds remain intact during electrophoresis [1] [14]. The migration through the gel matrix then becomes a function of the molecule's size, charge, and overall shape [2]. A compact, globular protein will migrate faster than a linear protein of the same mass, and a folded, compact RNA helix will behave differently from an unfolded chain of identical length [14]. This capability makes native gels indispensable for studying biologically relevant structures and interactions.
The table below summarizes the critical differences between these two techniques.
Table 1: Core Differences Between Denaturing and Native Gel Electrophoresis
| Parameter | Denaturing Gels | Native Gels |
|---|---|---|
| Biomolecule Structure | Disrupted; unfolded into linear chains [1] | Preserved in its native, folded state [1] |
| Key Separation Factors | Molecular mass/Length, Mass-to-charge ratio (with SDS) [2] [1] | Molecular mass, Intrinsic charge, Size/Cross-sectional area, Shape [2] [1] |
| Common Denaturing Agents | Urea, SDS, DMSO, Glyoxal [2] | None |
| Information Level | Primary structure [1] | Primary, secondary, tertiary, and quaternary structure [1] |
| Typical Applications | Western blotting, establishing sample purity, protein sequencing [2] | Studying enzyme activity, protein-protein interactions, nucleic acid folding, analyzing quaternary structures [2] [14] |
Key Applications of Native Gels in Research
The unique strengths of native gel electrophoresis make it the method of choice for a wide array of experimental applications, particularly in functional studies.
Probing Nucleic Acid Structure and Folding
Native polyacrylamide gel electrophoresis (PAGE) is a well-established and versatile method for probing RNA conformation and folding pathways [14]. It allows researchers to measure RNA folding equilibria and kinetics under various conditions, directly visualizing and quantifying different conformational states within a population [14]. This is crucial for understanding how RNAs achieve their functional structures. For instance, native PAGE has been used extensively to study the folding of group I ribozymes, resolving compact, native states from misfolded or unfolded intermediates based on their differential migration through the gel matrix [14]. The method is also adept at resolving ligand-induced structural changes and studying non-canonical structures like RNA G-quadruplexes, often using Electrophoretic Mobility Shift Assays (EMSA) to visualize protein-RNA interactions [15].
Analyzing Protein Complexes and Interactions
For proteins, native gels are essential for investigating multi-subunit complexes and protein-nucleic acid interactions. The technique can resolve complexes with different stoichiometries, making it ideal for studying binding events [14]. A powerful demonstration of this involves creating a "chemical zymogen"—a protein (like creatine kinase) whose catalytic activity is reversibly deactivated by conjugating a DNA oligonucleotide via a disulfide linkage to a key cysteine residue in its active site [16]. This conjugate, when analyzed on a non-denaturing gel, shows a different migration pattern and is devoid of activity. Subsequent hybridization with a complementary, thiolated DNA strand triggers a disulfide exchange that liberates the protein, restoring its native structure and catalytic function, all of which can be monitored via native gel analysis [16]. This application perfectly illustrates how native gels can report on functional state and macromolecular interactions.
Table 2: Experimental Applications of Native vs. Denaturing Gels
| Research Goal | Recommended Gel Type | Rationale and Experimental Insight |
|---|---|---|
| RNA Folding Pathway Analysis | Native Gel [14] | Resolves folding intermediates and quantifies conformational heterogeneity; requires careful temperature control [14]. |
| Protein-Nucleic Acid Binding (EMSA) | Native Gel [14] [15] | Shifts in mobility indicate complex formation; different stoichiometries can be distinguished [14]. |
| Enzyme Function Studies | Native Gel [2] | Preserves catalytic activity; used to isolate active enzymes and study ligand binding [2]. |
| Determining Purity & Molecular Weight | Denaturing Gel [2] | Simplifies analysis by removing structural variables, allowing size to be the primary separation factor [2]. |
| Western Blotting | Denaturing Gel [2] | SDS unfolding ensures antibodies recognize linear epitopes, not conformational ones [2]. |
| Genotyping (STR Analysis) | Denaturing Capillary Gel [17] | High-temperature denaturation is mandatory for high-precision sizing, suppressing DNA secondary structure [17]. |
Experimental Protocols: Native Gel Electrophoresis in Action
Protocol 1: Analysis of RNA Folding by Native PAGE
This protocol is adapted from studies on the Tetrahymena group I ribozyme and is applicable to other structured RNAs [14].
- Sample Preparation: The RNA of interest is transcribed and purified. For folding experiments, the RNA is first denatured in a buffer containing EDTA (to chelate divalent cations) at an elevated temperature (e.g., 50°C for 5-10 minutes) to ensure a uniform unfolded starting population.
- Folding Initiation: Folding is initiated by rapidly adding a concentrated MgCl₂ solution (or other cations) to the denatured RNA to achieve the desired final ionic condition. The reaction is incubated at the desired temperature for a specific time.
- Native Gel Casting and Running: A polyacrylamide gel (e.g., 4-8%) is cast without denaturants. Temperature control is critical for resolving RNA conformers; the gel apparatus must be connected to a recirculating water bath to maintain a constant temperature (e.g., 25°C) [14]. The gel is pre-run for at least 30-60 minutes to establish equilibrium.
- Loading and Electrophoresis: The folding reaction is mixed with a native loading dye (e.g., containing 50% glycerol and tracking dyes) and loaded onto the pre-run gel. Electrophoresis is conducted at a constant power/voltage sufficient to resolve conformers (e.g., 15-25 W) for several hours.
- Visualization and Analysis: The gel is stained with an appropriate nucleic acid stain (e.g., SYBR Gold, ethidium bromide). Different RNA conformations (unfolded, intermediate, native) appear as distinct bands. The fraction of RNA in each state can be quantified to determine folding endpoints and kinetics.
Protocol 2: Hybridization-Activated Enzyme Analysis via Native Gels
This protocol leverages native gels to validate the sequence-specific activation of a protein, as demonstrated with creatine kinase (CK) [16].
- Preparation of DNA-Protein Zymogen: A thiolated oligonucleotide is activated with Ellman's reagent and then conjugated to cysteine residues (e.g., Cys-283) of CK via a disulfide bond [16].
- Purification and Inactivation: The CK-DNA conjugate is purified from non-conjugated protein and DNA using spin filtration and nucleic acid purification kits. Non-conjugated protein is permanently inactivated with iodoacetamide.
- Activation by Hybridization: The purified, inactive conjugate is incubated with a thiolated complementary DNA strand. Hybridization brings the thiols into proximity, triggering a disulfide exchange that releases the DNA and restores the active CK homodimer.
- Non-Denaturing Gel Analysis: Samples of the initial conjugate, the activated mixture, and a non-complementary strand control are run on a non-denaturing protein gel. The gel is analyzed for shifts in protein migration that indicate successful reactivation and dimer re-formation [16].
- Activity Validation: Catalytic activity is quantified using a coupled enzymatic assay (e.g., CK-produced ATP driving luciferase luminescence) to confirm functional restoration occurs only with the complementary sequence [16].
The Scientist's Toolkit: Essential Reagents for Native Gel Experiments
Table 3: Key Research Reagent Solutions for Native Gel Electrophoresis
| Reagent / Material | Function and Importance in the Native Environment |
|---|---|
| Polyacrylamide | Forms the sieving matrix; pore size is selected based on the size of the analyte to achieve optimal separation [14]. |
| Tris-Based Buffers (e.g., TBE, TAE) | Maintains a stable pH during electrophoresis, crucial for preserving the charge and stability of native biomolecules [18]. |
| Divalent Cations (e.g., Mg²⁺) | Often included in RNA folding studies to stabilize specific tertiary structures and folding intermediates [14]. |
| Glycerol/Sucrose | Added to samples to increase density for well loading, without disrupting native structures. |
| SYTO 61, Ethidium Bromide | Fluorescent dyes for staining nucleic acids after electrophoresis for visualization [19]. |
| Temperature-Controlled Gel Apparatus | Critical for reproducible results, as temperature fluctuations can alter biomolecule conformation and migration [14]. |
Visualizing Concepts and Workflows
The following diagrams illustrate the core concepts and a key experimental workflow using native gels.
Diagram 1: Conceptual workflow comparing native and denaturing gel processes.
Diagram 2: Workflow for hybridization-activated enzyme analysis.
The choice between native and denaturing gel environments is not merely technical but philosophical, dictating whether a researcher views biomolecules as linear strings of information or as dynamic, folded functional entities. Native gel electrophoresis stands as an indispensable technique when the goal is to understand function, interaction, and structure beyond the primary sequence. Its ability to maintain the delicate folds of proteins and nucleic acids provides insights that are simply inaccessible in a denatured state. As research continues to emphasize the functional complexity of biomolecular systems, from RNA therapeutics to multi-protein machines, the native gel environment will remain a critical tool for probing the intricate and active world of biological macromolecules.
Electrophoresis is a cornerstone laboratory technique in which charged particles, such as proteins or nucleic acids, migrate through a conducting medium under the influence of an electric field. The fundamental principle, demonstrated by Arne Tiselius in 1937, relies on the fact that most biological molecules carry a net charge at any pH other than their isoelectric point, causing them to migrate at a rate proportional to their charge density [20]. The mobility of a molecule through an electric field depends on several key factors: field strength, net charge, molecular size and shape, ionic strength, and properties of the matrix through which the molecule migrates [3]. This guide provides a comprehensive comparison of how these separation factors operate under denaturing versus non-denaturing conditions, enabling researchers to select the optimal approach for their specific experimental needs in drug development and biopharmaceutical characterization.
The supporting matrix, typically polyacrylamide or agarose, serves as a porous medium that behaves like a molecular sieve [20]. Agarose with large pore sizes is suitable for separating nucleic acids and large protein complexes, while polyacrylamide with smaller, controllable pore sizes is ideal for separating most proteins and smaller nucleic acids [3]. The choice between denaturing and non-denaturing conditions fundamentally alters which molecular properties govern separation, making understanding these differences critical for accurate experimental design and data interpretation in therapeutic protein and nucleic acid characterization.
Comparative Analysis of Separation Factors
Table 1: Influence of Molecular Properties on Electrophoretic Migration Under Different Conditions
| Separation Factor | Denaturing Conditions | Non-Denaturing Conditions |
|---|---|---|
| Size | Primary separation factor | Contributes to separation |
| Charge | Minimized as a factor | Primary separation factor |
| Shape | Eliminated as a factor | Significant impact on separation |
| Molecular Mass Determination | Accurate determination possible | Not directly determinable |
| Biological Activity Preservation | Lost | Typically retained |
| Quaternary Structure | Dissociated | Preserved |
| Typical Applications | Molecular weight determination, purity assessment | Enzyme activity studies, protein-protein interactions |
Molecular Size as a Separation Factor
Under denaturing conditions such as SDS-PAGE, molecular size becomes the primary determinant of electrophoretic mobility. The ionic detergent sodium dodecyl sulfate (SDS) denatures proteins and binds to them in a constant weight ratio (approximately 1.4 g SDS per 1 g of polypeptide) [3]. This SDS-polypeptide complex has a consistent negative charge, effectively masking the protein's intrinsic charge. Consequently, proteins migrate through the gel strictly according to polypeptide size with minimal effect from compositional differences [3]. The sieving effect of the gel matrix regulates movement, with smaller proteins migrating more rapidly than larger ones due to reduced frictional forces.
In non-denaturing or native PAGE, size remains a factor but not the dominant one. Proteins are separated according to the net charge, size, and shape of their native structure [3]. The frictional force of the gel matrix creates a sieving effect that regulates movement according to three-dimensional shape and size, with smaller proteins facing less frictional resistance than larger ones [3] [6]. This technique is particularly valuable for studying multimeric proteins since subunit interactions are generally retained, and enzymatic activity is often preserved post-separation [3].
For nucleic acids, similar principles apply. In denaturing conditions, single-stranded DNA or RNA fragments separate primarily by length, while in native conditions, secondary structures and three-dimensional conformation significantly influence migration patterns [19] [13]. Recent studies on RNA electrophoretic behavior have demonstrated that understanding the relationship between pore size of the sieving matrix and the radius of gyration of nucleic acids is essential for predicting migration patterns [19].
Molecular Charge as a Separation Factor
Charge plays fundamentally different roles in denaturing versus non-denaturing electrophoresis. In denaturing SDS-PAGE, the intrinsic charges of polypeptides become insignificant compared to the negative charges provided by the bound SDS detergent, creating essentially identical charge-to-mass ratios across different proteins [3]. This uniformity allows separation based primarily on size rather than charge.
In non-denaturing PAGE, charge becomes a primary separation factor. Most proteins carry a net negative charge in alkaline running buffers and migrate toward the positive anode [3] [6]. The higher the negative charge density (more charges per molecule mass), the faster a protein will migrate. This charge-based separation enables researchers to study proteins in their native state, preserving post-translational modifications that influence net charge.
Isoelectric focusing (IEF) represents the ultimate charge-based separation technique, where proteins migrate through a pH gradient until they reach their isoelectric point (pI) - the pH where their net charge becomes zero [20]. This method provides exceptional resolution for characterizing charge variants of therapeutic proteins, which is crucial for monitoring critical quality attributes of biopharmaceuticals [21]. Recent advancements in imaged capillary IEF (icIEF) have highlighted the importance of accurate calibration methods to obtain reliable pI measurements for monoclonal antibodies and their biosimilars [21].
Molecular Shape as a Separation Factor
Molecular shape influences electrophoretic migration predominantly under non-denaturing conditions. In native PAGE, the three-dimensional structure of proteins significantly affects their mobility through the gel matrix [3]. Globular proteins with compact structures typically migrate more rapidly than fibrous proteins of similar molecular weight due to their ability to navigate the gel pores more efficiently [20].
Under denaturing conditions, shape is largely eliminated as a factor because SDS linearizes proteins into rods of similar shape [3]. The uniform shape of SDS-polypeptide complexes means that molecular conformation contributes minimally to separation differences. This characteristic makes denaturing gels ideal for molecular weight determination while rendering them unsuitable for studying higher-order protein structure.
For nucleic acids, shape plays a particularly important role in non-denaturing conditions. Double-stranded DNA fragments of identical length but different conformations (supercoiled, nicked, or linear) migrate at different rates through agarose gels [2]. Similarly, RNA molecules can form various secondary structures that significantly impact their electrophoretic mobility under native conditions [13]. This property can be exploited to study RNA structural features and protein-nucleic acid interactions.
Experimental Protocols and Methodologies
Denaturing Gel Electrophoresis (SDS-PAGE) Protocol
The most widely used denaturing electrophoresis method is SDS-PAGE, based on the Laemmli system with discontinuous buffer components [6]. The protocol begins with sample preparation: protein samples are mixed with Tris-Glycine SDS Sample Buffer (2X) and heated at 85°C for 2 minutes to ensure complete denaturation [6]. For reduced samples, adding a reducing agent like dithiothreitol (DTT) or β-mercaptoethanol to a final concentration of 1X immediately prior to electrophoresis cleaves disulfide bonds [6].
The gel system consists of two layers: a stacking gel with lower acrylamide concentration (e.g., 4%) and pH (6.8), and a resolving gel with higher acrylamide concentration (typically 8-16%) and pH (8.8) [3]. This discontinuous system concentrates proteins into sharp bands before they enter the resolving region. The running buffer contains Tris, glycine, and SDS at pH 8.3 [6]. Electrophoresis is typically performed at constant voltage (125 V for mini-gels) until the tracking dye reaches the bottom of the gel [6].
Operational parameters significantly impact separation quality. Recent studies on SDS capillary gel electrophoresis have demonstrated that temperature, gel concentration, and electric field strength must be carefully optimized [22]. Increasing temperature generally increases electrophoretic mobility, while higher gel concentrations decrease mobility through greater sieving effects. Electric field strengths above 500 V/cm may reduce resolution due to conformational changes in SDS-protein complexes [22].
Non-Denaturing Gel Electrophoresis Protocol
Native PAGE follows a similar procedure but excludes denaturing agents. Protein samples are prepared in Tris-Glycine Native Sample Buffer without SDS or reducing agents [6]. Critically, samples are not heated before loading to preserve native structure and biological activity [6]. The gel composition may vary but typically uses the same Tris-glycine buffer system without SDS.
Electrophoresis is performed at constant voltage (125 V) but with lower current compared to SDS-PAGE due to the absence of highly charged SDS molecules [6]. Run times are typically longer (1-12 hours) to achieve sufficient separation based on native charge and size [6]. Maintaining cool temperatures during electrophoresis is essential to prevent protein denaturation and proteolysis [3].
The buffer pH is critical in native PAGE as it determines the ionization state of amino acid side chains and thus the net charge on proteins. The Tris-glycine native system operates at pH 8.3, creating negative charges on acidic amino acids while maintaining positive charges on basic residues [6]. This balance allows separation based on intrinsic charge differences rather than size alone.
Diagram 1: Experimental Workflow for Denaturing vs. Non-Denaturing Electrophoresis
Research Reagent Solutions
Table 2: Essential Reagents for Electrophoresis Experiments
| Reagent | Function | Denaturing Conditions | Non-Denaturing Conditions |
|---|---|---|---|
| SDS (Sodium Dodecyl Sulfate) | Denatures proteins and confers uniform charge | Required | Not used |
| DTT or β-mercaptoethanol | Reduces disulfide bonds | Required for reduced samples | Optional |
| Acrylamide/Bis-acrylamide | Forms cross-linked polymer matrix | Used at varying concentrations | Used at varying concentrations |
| Tris-Glycine Buffer | Conducts current and maintains pH | pH 8.3 with SDS | pH 8.3 without SDS |
| Ammonium Persulfate (APS) | Initiates polymerization | Required | Required |
| TEMED | Catalyzes polymerization | Required | Required |
| Propidium Iodide | Fluorescent dye for detection | Compatible [22] | Compatible |
| Coomassie Blue/Silver Stain | Protein visualization | Used after fixation | Used after fixation |
Advanced Techniques and Recent Developments
Two-Dimensional Electrophoresis
Two-dimensional (2D) PAGE combines the separation principles of both charge-based and size-based electrophoresis. The first dimension utilizes isoelectric focusing (IEF) to separate proteins according to their native isoelectric point [3]. In this technique, a pH gradient is established in a tube or strip gel using ampholytes, and proteins migrate until they reach their pI where their net charge becomes zero [20]. The second dimension then separates the same proteins by mass using standard SDS-PAGE at a 90-degree angle to the first separation [3]. This orthogonal approach provides the highest resolution for protein analysis, enabling resolution of thousands of proteins on a single gel - a capability crucial for comprehensive proteomic research [3].
Capillary Electrophoresis Innovations
Capillary electrophoresis (CE) has emerged as a powerful alternative to traditional gel-based methods, particularly for analytical applications in biopharmaceuticals. CE utilizes narrow-bore capillaries filled with separation matrix, allowing application of very high voltages for rapid separation with superior resolution [20]. The technique has been adapted for both size-based (SDS-CGE) and charge-based (ciEF) separations. Recent developments in imaged capillary IEF (icIEF) have addressed previous limitations in charge variant analysis of therapeutic monoclonal antibodies [21]. Studies have demonstrated that refining calibration approaches in icIEF methods allows for more reliable pI measurements, enhancing charge variant profile assessment for biosimilars [21].
Recent research has also explored the effects of operational parameters in SDS capillary gel electrophoresis, revealing that temperature, gel concentration, and electric field strength significantly impact separation of SDS-protein complexes [22]. The presence of fluorescent dyes like propidium iodide in the separation matrix can alter sieving behavior, producing more linear Ferguson plots that suggest more predictable migration patterns [22].
RNA Electrophoresis Advances
With the growing importance of RNA-based therapeutics, specialized electrophoresis methods have been developed for RNA analysis. Unlike DNA, RNA molecules present unique challenges due to their susceptibility to degradation and complex secondary structures. Research comparing denaturing and non-denaturing gel electrophoresis methods for RNA analysis has consistently found that RNA separation on non-denaturing gels often produces better results in terms of intensity and integrity of ribosomal RNA bands [13]. However, denaturing conditions using reagents such as urea, glyoxal, or formaldehyde are essential for accurate size determination of RNA fragments [13].
Recent studies have characterized the electrophoretic behavior of both single-stranded and double-stranded RNA, including chemically modified RNAs used in therapeutic applications like mRNA vaccines [19]. These investigations have revealed that neural network-aided predictions can successfully forecast RNA migration patterns with high accuracy, potentially reducing experimental optimization time [19]. The development of microfluidic electrophoresis platforms has further enhanced RNA analysis, providing unprecedented detail through short runtime, high resolution, and increased sample throughput [19].
The choice between denaturing and non-denaturing electrophoresis methods fundamentally depends on the experimental objectives and the information sought. Denaturing techniques like SDS-PAGE provide unparalleled accuracy for molecular weight determination and purity assessment by eliminating charge and shape as variables, making them ideal for routine protein characterization in biopharmaceutical development. In contrast, non-denaturing methods preserve native structure and biological activity, enabling studies of protein function, protein-protein interactions, and enzymatic activity that would be impossible under denaturing conditions.
Recent technological advances, particularly in capillary electrophoresis and microfluidic platforms, have enhanced both approaches by improving resolution, reducing analysis time, and enabling higher-throughput applications. The growing emphasis on characterization of complex biotherapeutics, including monoclonal antibodies and RNA-based therapeutics, continues to drive methodological refinements that provide more reliable and reproducible separations. By understanding how size, charge, and shape influence migration under different conditions, researchers can select the most appropriate electrophoretic strategy to address their specific research questions in drug development and biopharmaceutical analysis.
Gel electrophoresis stands as a cornerstone technique in molecular biology and biochemistry laboratories worldwide, enabling the separation and analysis of macromolecules such as DNA, RNA, and proteins based on their size, charge, and shape [23]. The fundamental principle involves applying an electric field to a gel matrix through which charged biological molecules migrate, with their movement influenced by the gel's porous structure [24]. The careful selection of the appropriate gel matrix—either agarose or polyacrylamide—represents a critical decision that directly impacts the fidelity, resolution, and reproducibility of experimental results [23]. This choice becomes particularly significant when considered within the broader context of denaturing versus non-denaturing electrophoresis techniques, which determine whether biomolecules are analyzed in their native folded states or unfolded linear forms [2]. Understanding the distinct properties, applications, and limitations of each gel type empowers researchers, scientists, and drug development professionals to optimize their experimental workflows and ensure data integrity across diverse applications from basic research to clinical diagnostics.
The evolution of electrophoresis from Arne Tiselius's early work in the 1930s with liquid media to the sophisticated solid support matrices available today reflects decades of innovation [25] [26]. The introduction of polyacrylamide gels in the 1960s represented a significant advancement, enabling analysis of molecules previously difficult to separate [25]. Contemporary electrophoresis techniques have expanded to include capillary, microchip, and two-dimensional systems, yet slab gel electrophoresis using either agarose or polyacrylamide remains fundamental to countless laboratory procedures [25]. This guide provides a comprehensive comparison of these two essential matrices, examining their composition, separation principles, applications in both denaturing and non-denaturing conditions, and practical implementation protocols to inform evidence-based experimental design.
Agarose Gels: Composition, Properties, and Applications
Fundamental Characteristics of Agarose Gels
Agarose is a natural linear polymer extracted from seaweed that forms a gel matrix through hydrogen bonding when heated in buffer and allowed to cool [27]. This process creates a three-dimensional lattice with relatively large, non-uniform pores, with the exact pore size influenced by adjusting the gel concentration [23]. Lower agarose concentrations (0.2-0.8%) produce larger pores suitable for separating very large molecules, while higher concentrations (2-3%) yield smaller pores better for resolving smaller fragments [23] [27]. The preparation of agarose gels is notably straightforward and safe, involving simply dissolving the agarose powder in boiling buffer, pouring it into a casting tray, and allowing it to solidify at room temperature [23]. Unlike polyacrylamide, agarose is non-toxic and requires no polymerization catalysts, making it accessible for routine laboratory use [27].
The separation mechanism in agarose gel electrophoresis relies on the movement of molecules through large, interconnected channels in the matrix [23]. DNA and RNA molecules, being negatively charged, migrate toward the positive electrode (anode), with smaller fragments navigating the matrix more easily and thus moving faster than larger ones [27]. The inclusion of intercalating dyes such as ethidium bromide allows visualization of nucleic acids under ultraviolet light, with fluorescence intensity proportional to DNA mass [27]. The percentage of agarose used directly correlates with the size range of fragments that can be effectively separated, making concentration selection a critical parameter in experimental design [27].
Applications and Protocols for Agarose Gel Electrophoresis
Agarose gel electrophoresis finds extensive application in the separation of nucleic acids, particularly large DNA fragments ranging from approximately 100 base pairs to over 20 kilobases [28]. Standard protocols involve preparing a 0.8% to 2% agarose solution in either TAE (Tris-acetate-EDTA) or TBE (Tris-borate-EDTA) buffer, with the specific concentration determined by the expected size of DNA fragments [27]. For very large DNA molecules exceeding 20 kilobases, specialized techniques such as pulsed-field gel electrophoresis (PFGE) are employed, which periodically change the direction of the electric field to achieve separation [23]. The table below outlines recommended agarose concentrations for separating different DNA size ranges:
Table 1: Agarose Gel Concentrations for DNA Separation
| Agarose Concentration (%) | Effective Separation Range (bp) | Primary Applications |
|---|---|---|
| 0.3-0.8 | 5,000-50,000+ | Genomic DNA, large restriction fragments |
| 0.8-1.0 | 1,000-20,000 | Standard restriction digests, PCR product analysis |
| 1.2-1.5 | 500-10,000 | Routine DNA separation, plasmid analysis |
| 2.0-3.0 | 100-3,000 | Small PCR products, detailed restriction mapping |
Beyond standard DNA analysis, agarose gels support various molecular biology applications including estimation of DNA fragment sizes, analysis of PCR products for molecular genetic diagnosis or genetic fingerprinting, separation of restricted genomic DNA prior to Southern blotting, separation of RNA prior to Northern analysis, and purification of DNA fragments for cloning [27]. A simplified native gel electrophoresis method using TBE- or TAE-based agarose gels can assess RNA quality while minimizing hazardous chemicals like formaldehyde, enabling researchers to check RNA degradation and genomic DNA contamination rapidly [18]. The key advantages of agarose gels include their ease of preparation, non-denaturing conditions that preserve sample integrity, and ability to recover samples for downstream applications [27].
Polyacrylamide Gels: Composition, Properties, and Applications
Fundamental Characteristics of Polyacrylamide Gels
Polyacrylamide gels are synthetic polymers formed through a chemical polymerization reaction between acrylamide monomers and a cross-linking agent, typically N,N'-methylenebisacrylamide (bis-acrylamide) [23]. This polymerization creates a highly uniform, cross-linked mesh structure with precisely controllable pore sizes, offering superior resolution for separating smaller molecules [23] [28]. The pore size can be finely tuned by adjusting the total monomer concentration (%T) and the cross-linker ratio (%C), with higher %T values producing denser matrices with smaller pores ideal for resolving minimal size differences [23]. This level of control enables polyacrylamide gels to separate molecules differing by as little as a single base pair in nucleic acids or a few thousand Daltons in proteins [23].
A critical consideration when working with polyacrylamide is safety, as the unpolymerized acrylamide monomer is a potent neurotoxin requiring strict safety protocols including gloves, lab coats, and proper ventilation during gel preparation [23] [28]. The polymerization process typically requires catalysts such as ammonium persulfate and tetramethylethylenediamine (TEMED) [26]. Despite these handling requirements, polyacrylamide gels offer exceptional resolution and reproducibility, making them indispensable for applications demanding high separation precision. The final polymerized gel is stable and non-hazardous, though proper disposal procedures should still be followed according to institutional guidelines.
Applications and Protocols for Polyacrylamide Gel Electrophoresis
Polyacrylamide gel electrophoresis (PAGE) serves as the foundation for numerous protein and small nucleic acid analysis techniques. The most common application is sodium dodecyl sulfate-polyacrylamide gel electrophoresis (SDS-PAGE), where the anionic detergent SDS denatures proteins and imparts a uniform negative charge, ensuring separation occurs primarily based on molecular weight rather than native charge or structure [23] [29]. SDS-PAGE begins with sample preparation involving boiling proteins in SDS and reducing agents like β-mercaptoethanol or dithiothreitol (DTT) to break disulfide bonds [29]. The discontinuous buffer system typically employs a stacking gel (pH 6.8) and a resolving gel (pH 8.8) with appropriate acrylamide concentration based on target protein sizes [29]. Electrophoresis runs at constant voltage until the tracking dye reaches the gel bottom, followed by protein visualization using Coomassie Brilliant Blue, silver staining, or specialized stains [29].
Table 2: Polyacrylamide Gel Concentrations for Optimal Separation
| Acrylamide Concentration (%) | Effective Separation Range (Proteins, kDa) | Effective Separation Range (DNA, bp) | Primary Applications |
|---|---|---|---|
| 5-8 | 50-200 | 100-1,000 | Large proteins, protein complexes |
| 10-12 | 20-100 | 50-500 | Standard protein separation, SDS-PAGE |
| 12-15 | 10-50 | 25-300 | Small to medium proteins, high resolution |
| 15-20 | 5-30 | 10-100 | Very small proteins, peptides, oligonucleotides |
Beyond denaturing SDS-PAGE, polyacrylamide gels support native (non-denaturing) PAGE for separating proteins in their folded, functional states, maintaining enzymatic activity and protein-protein interactions [2]. This technique separates proteins based on both charge and size, enabling studies of protein complexes and interactions. Additional specialized applications include Tricine-SDS-PAGE for better resolution of small proteins (<30 kDa), isoelectric focusing for separating proteins based on their isoelectric points, two-dimensional electrophoresis combining isoelectric focusing with SDS-PAGE for comprehensive proteome analysis, and DNA sequencing for resolving single-nucleotide differences in nucleic acid fragments [29] [26]. Recent innovations include dissolvable polyacrylamide gels enabled by specific cross-linkers like BAC (N,N'-bis(acryloyl)cystamine), which facilitate sample recovery for downstream mass spectrometry analysis in proteomic applications [30].
Direct Comparison: Agarose versus Polyacrylamide Gels
Structural and Functional Differences
The structural and functional distinctions between agarose and polyacrylamide gels directly determine their appropriate applications in research and diagnostics. Agarose forms a gel through hydrogen bonding of polysaccharide chains, creating a matrix with large, non-uniform pores ideal for separating macromolecules [23]. In contrast, polyacrylamide creates a covalently cross-linked mesh with small, highly uniform pores that can be precisely controlled for superior resolution of smaller molecules [23]. These fundamental differences in matrix structure translate to distinct separation characteristics, with agarose excelling at resolving larger nucleic acid fragments while polyacrylamide provides finer resolution for proteins and small nucleic acids.
The practical implications of these differences extend to ease of use, safety considerations, and experimental flexibility. Agarose gels require minimal preparation—simply melting and pouring—with non-toxic components that make them suitable for teaching laboratories and routine analyses [27]. Polyacrylamide gels demand more complex preparation involving neurotoxic monomers and polymerization catalysts, necessitating stringent safety precautions but offering enhanced resolution capabilities [23] [28]. Additionally, while both gels allow sample recovery, polyacrylamide presents greater challenges for protein extraction without specialized dissolvable formulations [30].
Table 3: Comprehensive Comparison of Agarose and Polyacrylamide Gels
| Characteristic | Agarose Gel | Polyacrylamide Gel |
|---|---|---|
| Composition | Natural polysaccharide from seaweed [23] | Synthetic polymer of acrylamide and bis-acrylamide [23] |
| Pore Size | Large, non-uniform [23] | Small, uniform, and tunable [23] |
| Typical Molecules Separated | Large DNA/RNA (100 bp to 25 kbp+) [23] | Proteins, small DNA/RNA (<1 kbp) [23] |
| Optimal Separation Range | DNA: 100 bp - 20 kbp+ [27] [28] | Proteins: 5-200 kDa; DNA: 10-1,000 bp [23] |
| Resolution | Lower (for larger molecules) [23] | Higher (can distinguish single base pair differences) [23] [28] |
| Preparation Complexity | Simple (dissolve in buffer, pour, and solidify) [23] | Complex (chemical polymerization with catalysts) [23] |
| Toxicity | Non-toxic [23] | Neurotoxic monomer (acrylamide) [23] [28] |
| Typical Applications | DNA fragment analysis, PCR verification, RNA analysis [27] | SDS-PAGE, protein characterization, DNA sequencing [23] [29] |
| Cost and Equipment | Low cost, basic equipment | Higher cost, specialized equipment possible |
| Sample Recovery | relatively easy | More challenging, requires specific techniques [30] |
Selection Criteria for Specific Applications
Choosing between agarose and polyacrylamide gels requires careful consideration of several experimental factors, with molecule type and size representing the primary determinants [23] [28]. For nucleic acids larger than 100 base pairs, particularly in routine analysis such as PCR product verification, restriction digestion assessment, or plasmid quality control, agarose gels provide sufficient resolution with greater simplicity and lower toxicity [23]. When working with proteins or small nucleic acids (primers, microRNAs, sequencing fragments) requiring high resolution, polyacrylamide gels are essential despite their more complex preparation [23] [29].
The desired resolution level represents another crucial consideration. For applications where rough size estimation suffices, such as checking PCR amplification success or DNA quality assessment, agarose gels offer adequate resolution [23]. However, for tasks requiring discrimination of minimal size differences, including protein purity assessment, identification of post-translational modifications, detection of single nucleotide polymorphisms, or precise molecular weight determination, the superior resolution of polyacrylamide is indispensable [23] [29]. The following decision workflow provides guidance for selecting the appropriate gel matrix based on experimental requirements:
Gel Selection Workflow: A decision pathway for choosing between agarose and polyacrylamide gels based on molecule type and size.
Beyond technical specifications, practical laboratory considerations significantly influence gel selection. While polyacrylamide offers superior resolution, its requirement for toxic chemicals necessitates appropriate safety protocols, specialized training, and proper waste disposal systems [23]. Agarose presents fewer safety concerns but may not provide the necessary resolution for advanced applications. Researchers must also consider downstream applications, as protein identification through Western blotting requires polyacrylamide separation [28], while DNA fragment purification for cloning is more straightforward from agarose gels [27]. Throughput requirements represent another factor, with agarose accommodating more samples per gel in standard setups, though mini-gel systems for polyacrylamide can increase throughput for protein analysis.
Denaturing versus Non-Denaturing Electrophoresis Techniques
Fundamental Principles and Methodological Differences
The distinction between denaturing and non-denaturing electrophoresis techniques represents a critical consideration in experimental design, directly impacting the information obtained about biomolecular structure and function. Denaturing electrophoresis techniques utilize agents such as sodium dodecyl sulfate (SDS) for proteins or urea and formaldehyde for nucleic acids to disrupt non-covalent interactions, unfolding molecules into linear chains with uniform charge-to-mass ratios [29] [2]. This approach ensures separation occurs primarily based on molecular weight rather than native structure or intrinsic charge, enabling accurate size determination and comparison [29]. In SDS-PAGE, the combination of SDS and reducing agents like β-mercaptoethanol or dithiothreitol (DTT) denatures proteins and breaks disulfide bonds, creating uniformly charged linear polypeptides that migrate through polyacrylamide gels according to their molecular weights [29].
In contrast, non-denaturing (native) electrophoresis preserves the higher-order structure of biomolecules, maintaining their biological activity and native conformation throughout separation [2]. For proteins, this means preserving enzymatic activity, protein-protein interactions, and quaternary structures; for nucleic acids, native gels maintain secondary structures like hairpins and cruciforms that influence migration patterns [2]. Native electrophoresis separates molecules based on a combination of size, charge, and shape, providing information about molecular complexes and functional states that is lost under denaturing conditions [2]. The choice between these approaches fundamentally depends on the experimental objectives: denaturing methods provide precise molecular weight estimates and purity assessments, while native methods offer insights into functional states and molecular interactions.
Applications and Practical Implementation
The applications of denaturing and non-denaturing techniques span diverse research areas, each providing unique insights into biomolecular characteristics. Denaturing SDS-PAGE serves as the workhorse for protein analysis, enabling molecular weight determination, purity assessment, and quality control in protein purification [29]. In proteomics, denaturing conditions are essential for peptide mass fingerprinting and Western blotting, where antigen recognition depends on linear epitopes [29]. For nucleic acids, denaturing gels containing urea or formaldehyde eliminate secondary structure effects, ensuring accurate size determination of RNA fragments and single-stranded DNA, which is crucial for techniques like Northern blotting and RNase protection assays [2] [18].
Non-denaturing electrophoresis finds application in studying biological function and molecular interactions. Native PAGE enables the separation of protein complexes, oligomeric structures, and isoforms while maintaining biological activity, facilitating studies of enzyme kinetics, protein-protein interactions, and complex assembly [2]. In nucleic acid research, native gels resolve structural conformations such as supercoiled versus relaxed DNA, DNA-protein complexes, and G-quadruplex structures [2]. The following table outlines key applications and appropriate gel types for each electrophoretic mode:
Table 4: Denaturing vs. Non-Denaturing Electrophoresis Applications
| Electrophoresis Mode | Typical Applications | Recommended Gel Type | Key Reagents |
|---|---|---|---|
| Denaturing | Protein molecular weight determination [29] | Polyacrylamide | SDS, reducing agents (β-mercaptoethanol, DTT) [29] |
| Denaturing | Protein purity assessment [29] | Polyacrylamide | SDS, urea [29] |
| Denaturing | Western blotting [29] | Polyacrylamide | SDS, transfer buffers [29] |
| Denaturing | RNA analysis [18] | Agarose or Polyacrylamide | Formaldehyde, urea [18] |
| Non-Denaturing | Enzyme activity studies [2] | Polyacrylamide | Native buffer systems |
| Non-Denaturing | Protein complex analysis [2] | Polyacrylamide or Agarose | Coomassie Blue, activity stains |
| Non-Denaturing | DNA conformation analysis [2] | Agarose | Ethidium bromide, SYBR Safe |
The practical implementation of these techniques requires careful consideration of buffer systems, staining methods, and interpretation approaches. Denaturing protocols typically include sample preparation steps involving heating in denaturing buffers, while native techniques require gentle handling at lower temperatures to preserve molecular structure [2]. Staining approaches also differ, with denatured proteins typically detected by Coomassie Brilliant Blue or silver staining, while native proteins may be identified through activity stains or immunodetection without transfer [29] [2]. The interpretation of results must account for the separation principles: in denaturing systems, migration distance correlates directly with molecular weight, while in native systems, migration depends on complex factors including size, charge, and shape, requiring appropriate standards and controls [2].
Essential Reagents and Research Solutions
Successful electrophoresis experiments require careful selection and preparation of numerous reagents and materials, each serving specific functions in the separation and detection process. The choice of buffers, stains, and supporting reagents significantly impacts resolution, band sharpness, and detection sensitivity. Understanding the purpose and preparation of these essential components enables researchers to troubleshoot issues, optimize protocols, and adapt standard methods to specific research needs. The following table outlines critical reagents used across agarose and polyacrylamide electrophoresis techniques:
Table 5: Essential Research Reagents for Electrophoresis
| Reagent Category | Specific Examples | Function and Purpose | Composition Notes |
|---|---|---|---|
| Buffers | TAE (Tris-acetate-EDTA), TBE (Tris-borate-EDTA) [27] | Carry electric current, maintain stable pH | 40 mM Tris-acetate, 1 mM EDTA (TAE); 45 mM Tris-borate, 1 mM EDTA (TBE) |
| Stains and Detection | Ethidium bromide, SYBR Safe, Coomassie Blue, Silver stain [27] | Visualize separated molecules | Intercalating dyes for nucleic acids; protein-binding dyes |
| Denaturing Agents | SDS, urea, β-mercaptoethanol, DTT [29] | Unfold molecules, mask native charge | 1-2% SDS for proteins; 4-8M urea for nucleic acids |
| Gel Formation | Agarose, acrylamide, bis-acrylamide [23] | Create separation matrix | Varying percentages for different separation ranges |
| Polymerization Agents | Ammonium persulfate (APS), TEMED [23] | Initiate and catalyze acrylamide polymerization | Typically 0.1% APS, 0.1% TEMED for standard gels |
| Tracking Dyes | Bromophenol blue, xylene cyanol [27] | Monitor electrophoresis progress | Glycerol or sucrose for density |
Beyond these core reagents, specialized applications require additional solutions. For example, immunoelectrophoresis techniques incorporate specific antibodies to detect target proteins following separation [26]. Isoelectric focusing utilizes ampholytes to establish pH gradients for separating proteins based on their isoelectric points [26]. Recent advancements include dissolvable polyacrylamide gels incorporating cross-linkers like BAC (N,N'-bis(acryloyl)cystamine) that enable efficient sample transfer between separation dimensions for comprehensive proteomic analysis [30]. The continuous development of specialized reagents and protocols expands electrophoresis applications across diverse research areas from basic science to clinical diagnostics.
The experimental workflow for standard electrophoresis techniques involves multiple coordinated steps from gel preparation through data interpretation. The following diagram illustrates a generalized protocol for SDS-PAGE, one of the most commonly used electrophoretic techniques:
SDS-PAGE Experimental Workflow: Key steps in performing SDS-Polyacrylamide Gel Electrophoresis for protein analysis.
Successful implementation of electrophoresis protocols requires attention to numerous technical details. Buffer composition and pH critically influence separation quality, with excessive ionic strength generating heat that causes band diffusion, while insufficient ionic strength reduces resolution [26]. Gel polymerization conditions significantly impact pore structure and reproducibility, with oxygen inhibition potentially causing incomplete polymerization in polyacrylamide gels [23]. Sample preparation techniques must be optimized for different starting materials, with specialized protocols required for challenging samples including membrane proteins, low-abundance targets, and tissue extracts [29]. Through careful attention to these methodological details and appropriate selection of reagents, researchers can achieve reliable, reproducible separations tailored to their specific experimental requirements.
The strategic selection between agarose and polyacrylamide gel matrices represents a fundamental decision that significantly influences experimental outcomes in molecular biology, biochemistry, and drug development. Agarose gels, with their large pore sizes and non-toxic composition, provide an ideal matrix for separating nucleic acid fragments ranging from 100 base pairs to over 20 kilobases, making them indispensable for routine DNA analysis, PCR product verification, and RNA assessment [23] [27]. In contrast, polyacrylamide gels offer precisely controllable pore sizes and superior resolution for separating proteins and small nucleic acids, enabling discrimination of molecules differing by minimal mass variations [23] [28]. This resolution advantage comes with increased complexity in preparation and safety considerations due to the neurotoxic nature of unpolymerized acrylamide [23].
The broader context of denaturing versus non-denaturing techniques further expands the application spectrum of both gel types. Denaturing methods using SDS or other denaturants provide accurate molecular weight determination and purity assessment by eliminating structural influences on migration [29] [2]. Non-denaturing techniques preserve biological activity and molecular interactions, offering insights into functional states and complex formation [2]. The continuing evolution of electrophoresis technologies, including dissolvable polyacrylamide formulations [30], microchip-based systems [25], and enhanced detection methodologies, ensures that these foundational techniques will remain essential tools for scientific discovery and diagnostic innovation. By understanding the principles, applications, and practical considerations outlined in this guide, researchers can make informed decisions that optimize their electrophoretic separations for specific research objectives across diverse scientific disciplines.
Practical Protocols and Research Applications
SDS-PAGE for Protein Purity and Molecular Weight Determination
Sodium dodecyl sulfate-polyacrylamide gel electrophoresis (SDS-PAGE) represents a fundamental analytical technique for protein characterization that has maintained enduring relevance in research and development laboratories worldwide [29]. As a denaturing electrophoresis method, SDS-PAGE enables the separation, identification, and characterization of proteins across diverse sample types, from simple purified preparations to complex biological mixtures [29]. The technique's simplicity, reliability, and cost-effectiveness have established it as an indispensable tool for researchers, particularly for assessing protein purity and determining molecular weight—two critical parameters in drug development and biopharmaceutical manufacturing.
Within the broader context of electrophoresis techniques, SDS-PAGE occupies a specific niche as a denaturing separation method that fundamentally differs from native (non-denaturing) approaches. While native PAGE separates proteins based on their intrinsic charge, size, and shape while preserving functional activity, SDS-PAGE deliberately dismantles higher-order structures to focus exclusively on polypeptide chain length [2] [3]. This deliberate simplification enables precise molecular weight estimation and reveals impurities that might otherwise remain hidden in native conformations. For researchers and drug development professionals requiring rigorous protein characterization, understanding the capabilities, limitations, and methodological nuances of SDS-PAGE remains essential for generating reproducible, interpretable data.
Fundamental Principles: How SDS-PAGE Works
Theoretical Basis of Separation
The operational principle of SDS-PAGE hinges on the uniform negative charge imparted to proteins by the anionic detergent sodium dodecyl sulfate (SDS). When protein samples are heated between 70-100°C in the presence of excess SDS and a reducing agent such as β-mercaptoethanol or dithiothreitol (DTT), several transformative events occur simultaneously [3]. The reducing agent cleaves disulfide bonds that stabilize tertiary and quaternary structures, while SDS denatures the protein by wrapping around the polypeptide backbone. This results in complete dissociation of multi-subunit proteins into their individual polypeptide components [31].
Critically, SDS binds to proteins in a constant weight ratio of approximately 1.4 g SDS per 1.0 g of polypeptide, creating a uniform negative charge density along the entire length of each denatured protein [31]. This SDS-protein complex assumes a rod-like shape with charge distribution that overwhelms any inherent charge differences among polypeptides. Consequently, when subjected to an electric field within the polyacrylamide gel matrix, separation occurs almost exclusively according to molecular size rather than native charge or structural features [3]. Smaller polypeptides migrate more rapidly through the porous gel network, while larger polypeptides experience greater frictional resistance and migrate more slowly, resulting in discrete bands that correspond to proteins of specific molecular weights [29].
Comparison with Native PAGE
Understanding SDS-PAGE requires appreciation of its fundamental differences from native electrophoresis techniques, as each approach provides complementary information about protein samples.
Table 1: Key Differences Between SDS-PAGE and Native PAGE
| Parameter | SDS-PAGE (Denaturing) | Native PAGE |
|---|---|---|
| Protein State | Denatured to individual polypeptides | Native conformation preserved |
| Separation Basis | Molecular weight primarily | Charge, size, and shape |
| Sample Preparation | Heating with SDS and reducing agents | Non-denaturing buffers |
| Disulfide Bonds | Reduced (in reducing SDS-PAGE) | Maintained |
| Quaternary Structure | Disrupted | Preserved |
| Biological Activity | Typically lost | Often retained |
| Molecular Weight Determination | Accurate estimation possible | Not reliable |
| Applications | Purity assessment, subunit molecular weight, western blotting | Enzyme activity assays, protein complexes, oligomeric state |
The choice between these techniques depends entirely on the research question. SDS-PAGE excels at determining polypeptide molecular weight and assessing sample purity, while native PAGE provides insights into native protein complexes and functional states [2] [32]. For researchers focused on protein purity and molecular weight determination—particularly in biopharmaceutical development where precise characterization of therapeutic proteins is critical—SDS-PAGE offers distinct advantages in reproducibility and interpretability [31].
Experimental Protocols: Implementing SDS-PAGE Analysis
Standard SDS-PAGE Protocol
Implementing reliable SDS-PAGE requires meticulous attention to several methodological steps, each of which influences the quality and reproducibility of results. The following protocol outlines a standard approach for protein purity assessment and molecular weight determination using a mini-gel format, which enables rapid analysis using small quantities (∼10 μL containing ∼1–10 μg of protein) and can be completed in less than 2 hours [33].
Sample Preparation:
- Protein Extraction: Obtain proteins from biological sources (cells, tissues, or purified preparations) using appropriate lysis buffers. For complex samples like cell lysates, addition of Benzonase is recommended to reduce viscosity, along with protease inhibitors to prevent degradation [33].
- Denaturation and Reduction: Mix protein samples with SDS-PAGE sample buffer (typically containing Tris-HCl, glycerol, SDS, and a tracking dye). For reducing conditions, add 2-mercaptoethanol or DTT to final concentrations of 1-5% [29] [33].
- Heat Denaturation: Heat samples at 70-100°C for 5-10 minutes to ensure complete denaturation and SDS binding [3].
Gel Preparation:
- Gel Selection: Choose appropriate polyacrylamide percentage based on target protein size. Lower percentages (8-10%) resolve higher molecular weight proteins, while higher percentages (12-15%) better resolve smaller proteins [3]. Gradient gels (e.g., 4-12% or 4-20%) provide broad separation ranges and eliminate the need for stacking gels [3].
- Gel Assembly: Mount pre-cast or freshly poured gel in electrophoresis apparatus according to manufacturer instructions. Pre-cast gels such as Novex Tris-Glycine or NuPAGE Bis-Tris gels offer convenience and reproducibility [34] [35].
Electrophoresis:
- Buffer System: Fill inner and outer chambers with SDS-running buffer (typically Tris-Glycine-SDS for traditional systems) [34].
- Sample Loading: Load prepared samples and molecular weight markers into wells. Include appropriate protein ladders (e.g., PageRuler Unstained Protein Ladder, Mark12 Unstained Standard) for molecular weight determination [3].
- Electrophoresis Conditions: Apply constant voltage (typically 120-200 V) until the dye front approaches the gel bottom (approximately 35-60 minutes depending on gel system) [36] [35].
Detection and Analysis:
- Protein Staining: Following electrophoresis, detect proteins using Coomassie Blue, SYPRO Ruby, Silver Stain, or other compatible staining methods [33].
- Imaging and Documentation: Capture gel images using appropriate documentation systems. Commercial systems like the ChemiDoc MP Imaging system provide high-quality digital records [33].
- Band Analysis: Quantify band intensities using analysis software (e.g., ImageLab, Alpha View) to assess relative purity and determine molecular weights by comparing sample migration distances to standard curves generated from molecular weight markers [31].
Critical Factors Affecting Accuracy and Reliability
Several technical factors significantly impact the resolution and accuracy of SDS-PAGE results. The gel composition, including both the acrylamide concentration and the degree of cross-linking, determines the effective pore size and thus the separation range [29]. Buffer system selection influences the operating pH during electrophoresis, with traditional Laemmli Tris-glycine systems operating at approximately pH 9.5, while alternative systems like Bis-Tris gels maintain a near-neutral pH (∼7.0) that minimizes protein degradation and modifications [35]. Most critically, sample preparation must ensure complete protein denaturation and reduction while avoiding artifacts such as protein aggregation or proteolysis [29]. Understanding these variables enables researchers to optimize methodology for specific applications and troubleshoot anomalous results.
Comparative Performance: SDS-PAGE Versus Alternative Technologies
SDS-PAGE Versus CE-SDS for Biopharmaceutical Analysis
While SDS-PAGE remains widely employed for routine protein analysis, capillary electrophoresis SDS (CE-SDS) has emerged as a complementary technology with particular advantages for biopharmaceutical applications. In direct comparisons analyzing monoclonal antibody purity, CE-SDS demonstrates superior resolution and quantitative capabilities compared to traditional SDS-PAGE [31]. One systematic evaluation of normal and heat-stressed IgG samples found that CE-SDS provided significantly higher signal-to-noise ratios and could detect specific variants like nonglycosylated IgG that were not resolved by SDS-PAGE [31]. This detection capability is particularly significant for therapeutic antibody development since glycosylation patterns critically influence biological function and pharmacokinetics.
Table 2: Performance Comparison of SDS-PAGE and CE-SDS for Antibody Purity Analysis
| Performance Characteristic | SDS-PAGE | CE-SDS |
|---|---|---|
| Resolution | Moderate | High |
| Signal-to-Noise Ratio | Lower | Higher |
| Detection of Nonglycosylated IgG | Not resolved | Easily detected |
| Quantitation Capability | Semi-quantitative (requires staining/destaining) | Fully quantitative (UV detection) |
| Automation Potential | Low to moderate | High |
| Sample Throughput | Moderate | High |
| Reproducibility | Moderate (gel-to-gel variability) | High (minimal run-to-run variability) |
| Data Analysis | Manual band quantification | Automated peak integration |
| Protein Recovery | Possible (with extraction) | Not typically recovered |
Despite these advantages, SDS-PAGE maintains relevance due to its accessibility, familiarity, and lower equipment costs. For many research applications where extreme sensitivity and precise quantitation are not required, SDS-PAGE provides sufficient resolution for routine purity assessment and molecular weight verification [31]. The technique also allows for parallel processing of multiple samples and enables downstream applications like western blotting or protein identification through mass spectrometry.
Comparison of Gel Chemistries: Tris-Glycine Versus Bis-Tris Systems
Within SDS-PAGE methodology itself, significant advancements have emerged in gel chemistry formulations that impact performance characteristics. Traditional Tris-glycine gels based on the Laemmli system operate at alkaline pH (approximately 9.5) and remain widely used [29]. However, alternative Bis-Tris gel systems function at near-neutral pH (approximately 7.0), which minimizes protein degradation and modifications during electrophoresis [35]. This pH advantage is particularly valuable when analyzing labile proteins or when protein integrity is crucial for downstream applications.
Table 3: Comparison of SDS-PAGE Gel Chemistries
| Parameter | Tris-Glycine Gels | Bis-Tris Gels |
|---|---|---|
| Operating pH | ~9.5 | ~7.0 |
| Protein Degradation Risk | Higher (especially at high pH) | Reduced |
| Asp-Pro Bond Cleavage | Can occur at low pH during sample prep | Minimized with compatible sample buffers |
| Band Sharpness | Good | Excellent (reduced protein modifications) |
| Run Times | ~60-90 minutes | ~20-35 minutes |
| Shelf Life | Up to 12 months (new formulations) | Up to 16 months at room temperature |
| Sample Buffer Compatibility | Laemmli-style buffers | Specialized LDS sample buffers |
| Separation Range | 8-250 kDa (denaturing) | 1-260 kDa (depending on buffer) |
Experimental comparisons demonstrate that Bis-Tris systems maintain superior sample integrity compared to traditional Tris-glycine gels. In side-by-side evaluations, proteins separated using Tris-glycine systems showed increased degradation artifacts and fuzzy bands, while Bis-Tris gels displayed clean, sharp bands with minimal degradation products [35]. The neutral pH environment of Bis-Tris gels also prevents modifications to cysteine and lysine residues that can occur at alkaline pH, thereby improving transfer efficiency for subsequent western blotting and providing more accurate molecular weight determination [35].
Essential Research Reagents and Materials
Successful implementation of SDS-PAGE requires several key reagents and specialized equipment, each playing a critical role in ensuring reproducible, high-quality results. The following table outlines essential solutions and materials required for standard SDS-PAGE experiments.
Table 4: Essential Research Reagents for SDS-PAGE Experiments
| Reagent/Material | Function | Examples/Alternatives |
|---|---|---|
| SDS (Sodium Dodecyl Sulfate) | Denatures proteins and confers negative charge | Typically included in sample buffers at 1-2% |
| Reducing Agents | Breaks disulfide bonds for complete denaturation | Dithiothreitol (DTT), 2-mercaptoethanol, Tris(2-carboxyethyl)phosphine (TCEP) |
| Acrylamide/Bis-acrylamide | Forms cross-linked gel matrix for separation | 29:1 or 37.5:1 acrylamide:bis-acrylamide ratios |
| Tris Buffers | Maintains pH during electrophoresis | Tris-HCl at various pH values for stacking/resolving gels |
| Ammonium Persulfate (APS) | Initiates acrylamide polymerization | Freshly prepared 10% solution recommended |
| TEMED | Catalyzes acrylamide polymerization | N,N,N',N'-Tetramethylethylenediamine |
| Protein Molecular Weight Markers | Provides reference for molecular weight determination | PageRuler Prestained Protein Ladder, Mark12 Unstained Standard, Precision Plus Protein Standards |
| Staining Reagents | Visualizes separated protein bands | Coomassie Brilliant Blue, SYPRO Ruby, Silver Stain, SimplyBlue SafeStain |
| Electrophoresis Equipment | Provides platform for gel separation | Mini Gel Tank, XCell SureLock Mini-Cell, Criterion Cell |
| Pre-cast Gels | Ready-to-use gels for convenience and reproducibility | Novex Tris-Glycine Gels, NuPAGE Bis-Tris Gels, Bolt Bis-Tris Plus Gels |
Modern advancements in SDS-PAGE reagents and materials have significantly improved experimental convenience and reproducibility. Pre-cast gels with extended shelf lives (up to 16 months for some Bis-Tris formulations) eliminate batch-to-batch variability while specialized sample buffers like NuPAGE LDS Sample Buffer maintain neutral pH during preparation to minimize protein degradation [35]. WedgeWell format wells in pre-cast gels increase sample loading capacity (up to 60 μL for mini gels and 100 μL for midi gels), facilitating detection of low-abundance proteins while reducing sample spill-over and cross-contamination [34] [36]. These technical improvements have made SDS-PAGE more accessible to researchers while enhancing the reliability of results for critical applications like protein purity assessment.
SDS-PAGE remains a foundational technique for protein purity assessment and molecular weight determination despite the emergence of alternative technologies like CE-SDS. Its enduring relevance stems from straightforward implementation, cost-effectiveness, and adaptability to diverse research needs. While CE-SDS offers advantages for specific applications requiring high sensitivity and precise quantitation—particularly in biopharmaceutical development—SDS-PAGE maintains utility for routine analysis, method development, and educational applications [31].
The evolution of SDS-PAGE methodology, including the development of improved gel chemistries like Bis-Tris systems and specialized sample buffers, continues to address historical limitations related to protein degradation and resolution [35]. These advancements, coupled with the technique's fundamental simplicity and robust separation principles, ensure that SDS-PAGE will remain an essential component of the protein researcher's toolkit. For drug development professionals and research scientists, understanding both the capabilities and limitations of SDS-PAGE enables appropriate application selection and optimal experimental design for protein characterization workflows.
Native PAGE for Studying Protein Oligomeric States and Enzyme Activity
Within the suite of electrophoresis techniques available to researchers, the choice between denaturing and non-denaturing methods fundamentally shapes experimental outcomes. Native polyacrylamide gel electrophoresis (Native PAGE) serves as a critical technique for studying proteins in their biologically active conformations, providing distinct advantages for analyzing oligomeric states and enzymatic function. Unlike denaturing methods that dismantle protein structure, Native PAGE maintains proteins in their native, folded state by omitting denaturing agents such as sodium dodecyl sulfate (SDS) [37] [38]. This preservation enables researchers to investigate complex biological attributes—including subunit interactions, quaternary structure, and catalytic activity—that remain inaccessible through denaturing approaches. For researchers and drug development professionals, understanding the capabilities and methodological requirements of Native PAGE is essential for designing experiments targeting functional protein characteristics.
The technique's utility is particularly evident when contrasted with SDS-PAGE, its denaturing counterpart. While SDS-PAGE unravels protein structures into linear chains and masks intrinsic charge, providing separation based primarily on molecular weight, Native PAGE separates proteins based on a combination of size, intrinsic charge, and three-dimensional shape [2] [37] [1]. This multi-parameter separation allows researchers to analyze proteins as functional units, making it indispensable for studying oligomeric complexes and active enzymes—key considerations in both basic research and biopharmaceutical development.
Fundamental Principles: Native vs. Denaturing Electrophoresis
The core distinction between native and denaturing electrophoresis lies in their treatment of protein structure. Denaturing gels, such as those used in SDS-PAGE, employ agents like SDS and reducing agents (DTT or β-mercaptoethanol) to dismantle non-covalent bonds, unfold proteins into linear chains, and impart a uniform negative charge [37] [31]. This process destroys higher-order structure but simplifies separation to molecular weight alone.
In contrast, Native PAGE utilizes non-denaturing conditions without SDS or reducing agents. The buffer composition preserves the protein's native conformation, and samples are not heated before loading [37]. Consequently, separation depends on the protein's inherent charge, molecular size, and shape, including cross-sectional area [2] [1]. This means that identical subunits in different oligomeric states (monomers, dimers, trimers) will migrate as distinct bands, enabling direct analysis of quaternary structure.
Table 1: Core Principles and Applications of Native PAGE vs. SDS-PAGE
| Criteria | Native PAGE | SDS-PAGE |
|---|---|---|
| Gel Type | Non-denaturing [37] | Denaturing [37] |
| Protein State | Native, folded conformation [37] [38] | Denatured, unfolded linear chains [37] [38] |
| Separation Basis | Size, intrinsic charge, and shape [37] [1] | Molecular weight only [2] [37] |
| Key Reagents | No SDS or reducing agents [37] | SDS and reducing agents (DTT/BME) [37] |
| Sample Prep | Not heated [37] | Heated [37] |
| Protein Function | Retained [37] [38] | Lost [37] [38] |
| Primary Applications | Studying oligomeric state, enzyme activity, protein-protein interactions [2] [37] | Determining molecular weight, checking purity, protein expression analysis [37] |
Native PAGE for Determining Protein Oligomeric States
Mechanism of Separation for Oligomeric Complexes
The ability of Native PAGE to resolve oligomeric states stems from its capacity to maintain non-covalent interactions between protein subunits. When a protein complex exists in multiple oligomeric forms—such as monomers, dimers, and tetramers—each form possesses a distinct size-to-charge ratio and cross-sectional area [2] [1]. These physical differences cause each oligomer to migrate through the gel matrix at a unique rate, resulting in discrete bands that can be visualized after electrophoresis [38]. The molecular mass of a protein complex can then be estimated by comparing its migration against native molecular weight standards.
This approach has been successfully used in numerous studies to resolve controversies surrounding protein quaternary structure. For example, research utilizing Native PAGE helped establish that members of the SLC26 and SLC17 families of membrane transporters form specific oligomeric assemblies, a finding crucial for understanding their transport mechanisms [39] [40]. The preservation of weaker interactions during the electrophoresis process makes Native PAGE particularly valuable for detecting transient complexes that might dissociate under harsher purification conditions.
Comparison with Alternative Methods for Oligomeric State Analysis
While Native PAGE provides valuable information about oligomeric states, researchers should consider its strengths and limitations relative to other methodologies:
Table 2: Comparison of Methods for Determining Protein Oligomeric States
| Method | Principle | Key Advantages | Key Limitations |
|---|---|---|---|
| Native PAGE | Electrophoretic mobility under non-denaturing conditions [37] [38] | Simple, accessible equipment; preserves native interactions; can separate multiple oligomeric states simultaneously | May disrupt weak interactions during extraction [39]; limited resolution for similar sizes |
| DCC-SMLM | Dual-color colocalization with super-resolution microscopy [39] [40] | In situ analysis in native membranes; high spatial resolution; works with low fluorescent protein detection efficiency | Requires specialized microscopy equipment and expertise; complex data processing |
| Flow-Induced Dispersion Analysis (FIDA) | Measurement of hydrodynamic radius in solution [41] | Quick, in-solution analysis; high flexibility in pH, concentration, and temperature | Limited throughput; may not resolve complex mixtures |
| Size Exclusion Chromatography | Hydrodynamic volume separation | Quantitative; preparative capability; can estimate molecular mass | Potential for surface interactions; requires calibration standards |
Native PAGE excels in accessibility and simultaneous analysis of multiple complexes but faces the critical limitation of requiring protein extraction from native environments, which can disrupt weaker interactions [39] [40]. This has driven the development of advanced in situ techniques like dual-color colocalization single-molecule localization microscopy (DCC-SMLM), which can determine oligomeric states within intact cellular membranes without potential disruption from isolation procedures [39] [40].
Native PAGE for Enzyme Activity Studies
Preserving Catalytic Function After Electrophoresis
A paramount advantage of Native PAGE is its ability to maintain enzymatic activity throughout the separation process. Because proteins remain folded with their active sites intact, enzymes separated via Native PAGE can be assayed directly for function [37] [38]. This capability enables researchers to directly link specific protein bands observed on gels with catalytic activity, providing powerful insights into enzyme characterization.
The preservation of activity arises from the technique's gentle conditions. Without denaturing detergents or reducing agents that disrupt tertiary and quaternary structure, the delicate architecture of enzyme active sites remains functional [38]. This allows for post-electrophoresis recovery of active proteins for downstream functional assays, a key advantage over SDS-PAGE where proteins are irreversibly denatured [37].
Experimental Approach for Enzyme Activity Detection
Following electrophoresis under native conditions, enzyme activity can be detected through various methods:
- In-gel activity assays: The gel is incubated with specific substrates and detection reagents that produce a visible product at the location of active enzyme bands.
- Zymography: For proteases, gels can be copolymerized with substrate proteins; after electrophoresis, proteolytic activity appears as clear bands against a stained background.
- Electroelution: Active proteins can be extracted from excised gel bands for further kinetic analysis or downstream applications.
When designing enzyme activity studies using Native PAGE, researchers must carefully control critical parameters including pH, ionic strength, and temperature, as these factors significantly impact both electrophoretic separation and enzymatic function [42]. The optimal pH must be determined for each enzyme, as it affects both activity and charge characteristics that influence migration [42]. Temperature control is particularly crucial, as even a one-degree change can cause 4-8% variation in enzyme activity [42].
Experimental Protocol: Native PAGE for Oligomeric State Analysis
Key Reagent Solutions for Native PAGE
Successful Native PAGE experiments require careful preparation of specific reagent solutions:
Table 3: Essential Research Reagent Solutions for Native PAGE
| Reagent Solution | Composition & Function | Key Considerations |
|---|---|---|
| Non-Denaturing Gel Matrix | Polyacrylamide (typically 4-12%) in appropriate buffer [37] | No SDS or other denaturants added; concentration depends on protein size |
| Running Buffer | Tris-glycine or Tris-borate, pH ~8.3-8.8 [37] | Maintains consistent pH without denaturing properties; no SDS |
| Sample Buffer | Glycerol, tracking dye, non-ionic detergent (optional), running buffer [37] | No reducing agents (DTT/BME) or SDS; samples not heated before loading [37] |
| Staining Solution | Coomassie Brilliant Blue, silver stain, or activity-compatible stains | For activity studies, use gentle stains or activity assays directly |
| Blue Native PAGE (BN-PAGE) Additive | Coomassie G-250 dye [37] | Imparts negative charge to proteins while maintaining native state |
Step-by-Step Methodology
The following workflow outlines a standard protocol for analyzing protein oligomeric states using Native PAGE:
Step 1: Sample Preparation Prepare protein samples in a non-denaturing buffer containing glycerol to facilitate loading. Critical note: Avoid all denaturing agents (SDS, urea) and reducing agents (DTT, β-mercaptoethanol). Do not heat samples, as this could disrupt native structure [37].
Step 2: Gel Preparation Cast polyacrylamide gels of appropriate concentration (typically 4-12% gradient gels for resolving complexes of different sizes) using non-denaturing buffers. For enhanced resolution of membrane protein complexes, consider Blue Native PAGE (BN-PAGE) which incorporates Coomassie dye to impart charge without denaturation [37].
Step 3: Electrophoresis Conditions Load samples and run electrophoresis at 4°C to maintain protein stability during separation [37]. Use constant voltage appropriate for the gel system, typically 100-150V. The low temperature helps preserve labile protein interactions and prevents heat-induced aggregation.
Step 4: Detection and Analysis Following electrophoresis, proteins can be visualized using standard staining techniques (Coomassie, silver stain). For oligomeric state determination, compare migration distances against native molecular weight markers. Alternatively, for enzyme activity studies, proceed directly to in-gel activity assays without fixing the gel.
Data Interpretation and Technical Considerations
Quantitative Analysis of Oligomeric States
When using Native PAGE for oligomeric state determination, researchers should employ appropriate native molecular weight markers that cover the expected size range of potential oligomers. The migration distance of unknown proteins is compared to the calibration curve generated from these standards to estimate apparent molecular mass. A single band typically indicates a homogeneous population, while multiple discrete bands suggest different oligomeric states coexisting in the sample.
It is crucial to recognize that migration in Native PAGE depends on both mass and charge, so the estimated molecular mass should be considered apparent rather than absolute. Verification through complementary techniques such as analytical ultracentrifugation or size exclusion chromatography is often warranted for definitive oligomeric state assignment.
Limitations and Methodological Constraints
Despite its utility, Native PAGE presents several important limitations that researchers must consider:
- Extraction artifacts: The requirement for protein extraction from native environments may disrupt weaker interactions, potentially leading to underestimation of oligomeric complexity [39] [40].
- Charge heterogeneity: Proteins with unusual charge characteristics may migrate anomalously, complicating molecular weight estimation.
- Limited resolution: For complexes with similar mass-to-charge ratios, resolution may be insufficient to distinguish different oligomeric states.
- Membrane protein challenges: Integral membrane proteins often require mild detergents for solubilization, which must be carefully selected to maintain native interactions without interfering with electrophoresis.
These constraints highlight the importance of using Native PAGE as part of a comprehensive approach to oligomeric state analysis, complemented by other biophysical and structural techniques where appropriate.
Native PAGE remains an essential tool in the protein scientist's arsenal, offering unique capabilities for analyzing oligomeric states and enzymatic activity that complement denaturing techniques like SDS-PAGE. Its ability to preserve native protein structure and function provides insights into biological mechanisms that would be lost under denaturing conditions. For researchers in both academic and drug development settings, understanding the principles, applications, and methodological requirements of Native PAGE enables informed experimental design and appropriate data interpretation. As the field advances, the integration of Native PAGE with emerging techniques like single-molecule microscopy continues to enhance our understanding of protein quaternary structure and function in health and disease.
Gel electrophoresis serves as a fundamental tool in molecular biology for separating and analyzing nucleic acids based on their physical properties. The critical distinction between denaturing and non-denaturing (native) gel electrophoresis lies in whether the method preserves or disrupts the native structure of the molecules during analysis. Denaturing gels utilize chemical agents to unfold nucleic acids into linear chains, separating molecules primarily by length, while non-denaturing gels maintain the natural higher-order structure, enabling separation based on both molecular mass and three-dimensional conformation [2] [1]. This methodological difference dictates their respective applications in research and diagnostic settings, from routine nucleic acid analysis to sophisticated conformational studies.
The choice between these techniques carries significant implications for experimental outcomes in pharmaceutical development and basic research. Denaturing conditions provide precise sizing information and are essential for procedures requiring linearized nucleic acids, whereas native conditions preserve functional structures necessary for studying biologically active conformations and molecular interactions [2] [43]. As RNA therapeutics advance rapidly in biopharmaceutical development, understanding these electrophoretic approaches becomes increasingly crucial for quality control and characterization of RNA-based vaccines and therapies [19].
Fundamental Principles and Separation Mechanisms
Theoretical Basis for Molecular Separation
The electrophoretic separation of nucleic acids under both denaturing and non-denaturing conditions relies on the negative charge inherent to their phosphate backbones, which causes migration toward the anode when an electric field is applied. The sieving matrix of the gel (agarose or polyacrylamide) creates a porous network that differentially retards molecules based on their physical dimensions. Under denaturing conditions, this separation depends primarily on molecular mass or chain length, as the disruption of secondary structure creates uniformly linear molecules [2] [1]. In contrast, non-denaturing separations incorporate additional factors including molecular shape, cross-sectional area, and higher-order structure, enabling discrimination between different conformational states of nucleic acids with identical lengths [2] [1].
The separation mechanism follows distinct physical models depending on the relationship between nucleic acid size and gel pore size. The Ogston model describes the behavior of molecules whose radius of gyration (Rg) is smaller than the gel pore size, treating them as spherical particles migrating through a sieve [19]. For larger molecules where Rg exceeds the pore size, the Biased Reptation with Fluctuation (BRF) model applies, describing a snake-like movement through the gel matrix where mobility scales inversely with molecular length [19]. The transition between these regimes depends on gel concentration and nucleic acid characteristics, with persistence length varying significantly between single-stranded RNA (≈2 nm), double-stranded RNA (≈64 nm), and DNA molecules [19].
Key Differences in Separation Characteristics
Table 1: Fundamental Differences Between Denaturing and Non-Denaturing Gels
| Parameter | Denaturing Gels | Non-Denaturing Gels |
|---|---|---|
| Structure Preservation | Disrupts secondary and higher-order structures | Maintains native conformation |
| Separation Basis | Primarily molecular mass/length | Mass, charge, shape, and conformational state |
| Analytical Information | Primary structure analysis | Primary, secondary, tertiary, and quaternary structure analysis |
| Typical Denaturants | Urea, SDS (for proteins), formaldehyde, DMSO/glyoxal | No denaturants used |
| Migration Dependence | Linear length and mass-to-charge ratio | Cross-sectional area and intrinsic charge |
| Complexity | More complex preparation | Simpler and cheaper to run |
Denaturing Gel Electrophoresis
Principles and Applications
Denaturing gel electrophoresis operates under conditions that disrupt the natural structure of DNA, RNA, or proteins, unfolding them into linear chains. This structural linearization ensures that separation occurs based primarily on molecular length rather than conformational differences, enabling precise size determination [2] [1]. For nucleic acids, denaturation eliminates mobility anomalies caused by secondary structure, allowing researchers to accurately estimate fragment sizes and assess sample integrity. This approach is particularly valuable for RNA analysis, where extensive intramolecular base pairing can significantly alter electrophoretic mobility under native conditions [43].
The applications of denaturing gels span multiple domains of molecular biology and biotechnology. They are indispensable for techniques including northern blotting, where accurate RNA sizing is mandatory [43]. In DNA analysis, denaturing capillary electrophoresis systems employing polymers like Performance Optimized Polymer 4 (POP-4) with urea denaturants enable high-precision genotyping of short tandem repeats (STRs), achieving standard deviations of 0.04-0.17 nucleotides in fragment sizing [17]. Denaturing gels also play crucial roles in establishing sample purity, preparing samples for protein sequencing, and analyzing samples where secondary structure might interfere with interpretation [2].
Experimental Protocols and Reagent Systems
Table 2: Denaturing Agents and Their Applications in Nucleic Acid Electrophoresis
| Denaturant | Concentrations Used | Nucleic Acid Type | Key Applications | Safety Considerations |
|---|---|---|---|---|
| Urea | 6-8 M | DNA, RNA | DNA sequencing, microsatellite analysis, capillary electrophoresis | Lower toxicity compared to other denaturants |
| Formaldehyde | 2.2 M | RNA | Northern blotting, RNA integrity assessment | Toxic, requires fume hood use |
| Glyoxal/DMSO | Various concentrations | RNA | Formaldehyde-free RNA denaturation | Reduced toxicity alternative to formaldehyde |
| SDS | 0.1-1% | Proteins | SDS-PAGE for protein molecular weight determination | Biohazard requiring proper disposal |
Protocol for Denaturing Agarose Gel Electrophoresis of RNA:
- Gel Preparation: Prepare 1-1.5% agarose in 1X MOPS buffer, heat until completely dissolved, and cool to approximately 60°C. Add formaldehyde to a final concentration of 2.2 M in a fume hood [43].
- Sample Denaturation: Mix RNA samples with denaturation buffer containing formaldehyde, formamide, and MOPS buffer. Heat at 65-70°C for 5-15 minutes, then place on ice [43].
- Loading and Electrophoresis: Add loading dye containing EDTA to chelate divalent cations and tracking dyes. Load samples and run gel at 3-6 V/cm in 1X MOPS running buffer without circulation to maintain denaturing conditions.
- Post-Electrophoresis Analysis: Stain with ethidium bromide, SYBR Green, or other nucleic acid staining dyes and visualize under UV transillumination.
Alternative protocols using glyoxal/DMSO denaturation systems provide safer options by eliminating formaldehyde. The NorthernMax-Gly Kit exemplifies this approach, where RNA samples are denatured in glyoxal/DMSO loading buffer prior to electrophoresis in formaldehyde-free agarose gels [43].
Non-Denaturing Gel Electrophoresis
Principles and Applications
Non-denaturing gel electrophoresis preserves the native structure of nucleic acids during separation, maintaining functionally significant secondary and tertiary conformations. This approach enables researchers to study biologically relevant structures including G-quadruplexes, hairpins, and other functional RNA elements in their native states [2] [43]. The separation mechanism under non-denaturing conditions incorporates molecular shape and three-dimensional architecture in addition to molecular weight, allowing discrimination between conformational isomers that would co-migrate in denaturing systems [1].
The applications of non-denaturing gels include analyzing the hierarchical states of nucleic acids, such as distinguishing between circular, linear, and supercoiled DNA forms [2]. They are particularly valuable for studying RNA structure-function relationships, investigating ribozyme activity, analyzing ribonucleoprotein complexes, and examining nucleic acid-protein interactions [2] [44]. Non-denaturing electrophoresis also provides a simpler and more cost-effective approach for routine quality assessment of nucleic acid samples when structural preservation is desirable [2] [18]. For RNA, non-denaturing conditions are recommended when resolving different conformational states rather than determining precise molecular weights [43].
Experimental Protocols and Methodological Considerations
Protocol for Non-Denaturing Agarose Gel Electrophoresis of RNA:
- Gel Preparation: Prepare 1-2% agarose in 1X TAE or TBE buffer by heating until completely dissolved. Cool to approximately 50-60°C and pour into casting tray without denaturing agents [18] [43].
- Sample Preparation: Mix RNA samples with native loading dye containing glycerol or Ficoll to increase density. Avoid heating samples or use mild heating (37°C) to prevent structural denaturation.
- Electrophoresis Conditions: Run gel at 4-8 V/cm in 1X TAE or TBE buffer at room temperature or at 4°C for temperature-sensitive structures. Lower voltages and temperatures help maintain native structures.
- Staining and Visualization: Stain with ethidium bromide or SYBR Safe according to standard protocols. Note that migration distances may not correlate linearly with molecular weight due to structural influences.
This simplified native gel electrophoresis method using TBE- or TAE-based agarose gels minimizes hazardous chemical use while providing sufficient resolution to assess RNA degradation and genomic DNA contamination [18]. The primary benefit includes enhanced researcher safety and reduced generation of hazardous waste compared to denaturing methods [18].
Comparative Analysis and Technical Considerations
Direct Comparison of Separation Characteristics
Table 3: Performance Comparison of Denaturing vs. Non-Denaturing Gels
| Performance Metric | Denaturing Gels | Non-Denaturing Gels |
|---|---|---|
| Size Resolution | High precision for linear molecules | Reduced precision due to structural influences |
| Structure Preservation | None (complete denaturation) | Maintains native conformation |
| Detection of Conformers | Cannot distinguish structural isoforms | Can resolve different structural states |
| Sample Throughput | Higher in capillary formats | Generally lower throughput |
| Hazardous Waste Generation | Higher (toxic denaturants) | Lower (reduced chemical use) |
| Equipment Requirements | May require specialized equipment (fume hoods) | Standard electrophoresis equipment sufficient |
Decision Framework for Method Selection
The choice between denaturing and non-denaturing electrophoretic methods depends on specific research objectives and sample characteristics. Denaturing gels should be selected when: determining precise nucleic acid length is paramount; analyzing samples with extensive secondary structure that might complicate interpretation; performing techniques like northern blotting that require size-based separation; or establishing sample purity without conformational interference [2] [43]. The presence of denaturants and operation at elevated temperatures (e.g., 60°C in capillary systems) is mandatory for high-precision sizing applications, particularly for microsatellite analysis where standard deviations of ±0.15 nucleotides are required for accurate genotyping [17].
Non-denaturing gels are preferable when: studying functional nucleic acid structures and conformational states; analyzing macromolecular interactions including protein-nucleic acid complexes; maintaining biological activity for downstream applications; or performing rapid quality assessment with minimal processing [2] [44]. Non-denaturing conditions are also recommended for simpler workflows with reduced chemical hazards and lower costs [2] [18]. For RNA analysis specifically, non-denaturing gels preserve structural features that define functional roles in regulatory mechanisms and catalytic activities [43].
Diagram 1: Method selection guide for nucleic acid electrophoresis techniques
Advanced Applications and Research Implications
Specialized Electrophoretic Techniques
Advanced electrophoretic methods have been developed to address specific research challenges in nucleic acid analysis. Denaturing Gradient Gel Electrophoresis (DGGE) and Temporal Temperature Gradient Gel Electrophoresis (TTGE) represent sophisticated approaches that separate DNA fragments based on sequence composition rather than size alone [12]. These techniques employ either a chemical denaturant gradient (DGGE) or a temperature gradient (TTGE) to partially melt DNA molecules at characteristic transition points, with decreased electrophoretic mobility of partially melted duplexes enabling separation of sequences with single-base-pair resolution [12]. Such methods have proven valuable for microbial community analysis and clinical diagnostics, such as discriminating between Candida species in fungal infections [12].
Microfluidic electrophoresis platforms have emerged as powerful tools for analyzing nucleic acids with unprecedented detail, offering short runtime, high resolution, and increased sample throughput [19]. These systems are particularly valuable for characterizing RNA therapeutics, including chemically modified mRNA vaccines and double-stranded RNA molecules. Recent advances incorporate artificial neural networks, particularly physics-informed neural networks (PINNs), to predict electrophoretic mobility with remarkable accuracy (0.77% average error), potentially reducing experimental requirements for method development [19].
Implications for Pharmaceutical Development
The characterization of RNA-based therapeutics represents a growing application area for electrophoretic techniques in biopharmaceutical development. Denaturing methods provide essential quality control for mRNA vaccines by assessing integrity and detecting degradation products, while native approaches help maintain higher-order structures relevant to biological activity [19]. The electrophoretic behavior of pseudouridine-modified RNA—a common modification in therapeutic mRNA—differs from non-modified RNA, necessitating specialized characterization approaches [19]. Similarly, the detection and quantification of double-stranded RNA (dsRNA) impurities in RNA preparations is critical, as dsRNA can trigger unwanted immune responses [19].
The migration patterns of RNA molecules in semi-dilute polymer solutions follow principles governed by the relationship between RNA size and gel pore size. For analysis, the radius of gyration (Rg) of nucleic acids can be approximated by Rg² = pL/3, where p represents persistence length (approximately 2 nm for ssRNA and 64 nm for dsRNA) and L is the polymer fragment length [19]. Understanding these biophysical parameters enables optimized separation conditions for quality control of pharmaceutical RNA products.
Essential Research Reagents and Materials
Table 4: Key Research Reagent Solutions for Nucleic Acid Electrophoresis
| Reagent Category | Specific Examples | Function | Application Context |
|---|---|---|---|
| Denaturing Agents | Urea, formaldehyde, glyoxal, DMSO, SDS | Disrupt hydrogen bonding and secondary structure | Denaturing gel electrophoresis for precise sizing |
| Gel Matrices | Agarose, polyacrylamide, linear polyacrylamide (POP-4) | Molecular sieving matrix for separation | Both denaturing and non-denaturing systems |
| Fluorescent Stains | SYTO 61, ethidium bromide, SYBR Green | Nucleic acid visualization after electrophoresis | Detection in both gel and capillary formats |
| Buffers | TAE, TBE, MOPS | Maintain pH and conductivity during separation | Electrophoresis running buffers |
| Size Standards | DNA/RNA ladders (Millennium Markers) | Molecular weight calibration and size determination | Quantitative analysis in both systems |
| Specialized Kits | NorthernMax kits, DCode mutation detection system | Optimized reagents for specific applications | Standardized protocols for complex techniques |
Denaturing and non-denaturing gel electrophoresis offer complementary approaches for nucleic acid analysis, each with distinct advantages and appropriate application domains. Denaturing methods provide the highest precision for determining molecular size and are essential for applications requiring disruption of secondary structure, while non-denaturing approaches preserve functionally significant conformations and interactions. The selection between these techniques should be guided by specific research objectives, with denaturing conditions preferred for precise sizing and purity assessment, and native conditions chosen for structural and functional studies.
Advances in electrophoretic technologies, including capillary and microfluidic formats, enhanced polymer matrices, and sophisticated detection systems, continue to expand applications in both basic research and pharmaceutical development. The growing importance of RNA-based therapeutics underscores the need for robust analytical methods that can characterize nucleic acid integrity, modifications, and higher-order structure. As electrophoretic techniques evolve with computational predictions and automated platforms, they will remain indispensable tools for elucidating nucleic acid structure-function relationships and ensuring quality control of biopharmaceutical products.
Denaturing Gradient Gel Electrophoresis (DGGE) is a powerful molecular fingerprinting technique that has revolutionized the analysis of microbial communities in complex environmental samples. This PCR-based method separates DNA fragments of identical length based on their sequence-specific denaturation properties, enabling researchers to profile microbial diversity without the need for extensive cloning or cultivation [45] [46]. The fundamental principle underlying DGGE involves applying PCR-amplified DNA fragments to a polyacrylamide gel containing an increasing gradient of chemical denaturants (typically urea and formamide). As DNA molecules migrate through this gradient, they begin to denature or "melt" at sequence-specific points, with each melting event drastically reducing electrophoretic mobility and causing the fragments to stop at distinct positions in the gel [47] [48]. This sophisticated separation mechanism allows DGGE to detect single-nucleotide polymorphisms, making it exceptionally valuable for identifying subtle genetic variations within microbial populations [46] [49].
The application of DGGE in microbial ecology was pioneered by Gerard Muyzer in the 1990s and has since become an established method for analyzing microbial diversity across various ecosystems [45] [48]. Unlike traditional non-denaturing electrophoresis techniques that separate nucleic acids primarily by size, DGGE introduces an additional separation dimension based on sequence composition, thereby providing significantly higher resolution for distinguishing between closely related microbial species [2]. When positioned within the broader context of electrophoresis techniques, DGGE occupies a specialized niche between conventional non-denaturing methods and more recent next-generation sequencing approaches, offering an optimal balance of resolution, throughput, and cost-effectiveness for many experimental scenarios requiring microbial community analysis.
Fundamental Principles and Technical Specifications of DGGE
Core Mechanism and Separation Methodology
The DGGE technique operates on the well-established principle that the melting behavior of double-stranded DNA molecules depends primarily on their nucleotide sequence and composition. DNA fragments rich in GC base pairs exhibit higher melting temperatures compared to AT-rich regions due to the triple hydrogen bonds in GC base pairs versus the double bonds in AT pairs [45]. In standard DGGE implementation, PCR-amplified DNA fragments are loaded onto a polyacrylamide gel containing a linear gradient of denaturants, with 100% denaturant typically defined as 7 M urea and 40% (v/v) formamide [12]. The denaturing gradient is established perpendicular or parallel to the direction of electrophoresis, with the parallel configuration being more common for analyzing multiple samples simultaneously.
As DNA fragments migrate through the gel under the influence of an electric field, they remain fully double-stranded in regions with low denaturant concentrations. However, when fragments reach their specific denaturation concentration, they begin to undergo partial melting, creating branched structures that dramatically reduce their mobility through the polyacrylamide matrix [47] [46]. This sequence-dependent partial denaturation enables separation of DNA fragments based on their melting characteristics rather than merely their size. A critical technical enhancement in DGGE involves attaching a GC-rich sequence (30-40 bp GC-clamp) to one end of the PCR amplicon during amplification, which serves as a high-temperature melting domain that prevents complete strand separation and maintains the DNA fragment within the gel [12] [47]. This GC clamp, typically incorporated at the 5' end of one primer, ensures that the DNA fragment undergoes partial denaturation rather than complete strand separation, thereby enabling the separation of sequences based on their lower-temperature melting domains.
Standard DGGE Protocol and Technical Parameters
A typical DGGE protocol involves several standardized steps, beginning with DNA extraction from environmental samples, followed by PCR amplification of target genes (most commonly the 16S rRNA gene for bacterial community analysis) using primers with an attached GC-clamp, and culminating in electrophoresis under denaturing conditions [12] [47]. The table below outlines key technical parameters for DGGE analysis based on established methodologies:
Table 1: Standard DGGE Technical Parameters and Experimental Conditions
| Parameter | Specification | Application Context |
|---|---|---|
| Gel Composition | 6-8% polyacrylamide (37.5:1 acrylamide:bis-acrylamide) | Standard analysis of 16S rRNA gene fragments [12] [47] |
| Denaturant Gradient | 30-60% (100% = 7 M urea, 40% formamide) | Optimized for specific target sequences; example: 30-45% for Candida species with NL1-GC/LS2 primers [12] |
| Electrophoresis Conditions | 55-130 V for 4.5-16 hours at 56-60°C in 1X TAE buffer | Time and voltage depend on fragment size and gradient steepness [12] |
| Optimal Fragment Size | 200-500 base pairs | Shorter fragments display more predictable melting behavior [47] [46] |
| Detection Method | Ethidium bromide, SYBR Green, or silver staining | Post-electrophoresis staining followed by UV visualization [12] [47] |
The electrophoresis process typically employs the DCode universal mutation detection system (Bio-Rad) or similar specialized equipment capable of maintaining precise temperature control, as DNA melting behavior is highly temperature-dependent [12]. For a standard analysis of bacterial 16S rRNA gene fragments (V3 region), gels are commonly run at 60°C for 16-18 hours at a constant voltage of 55-65 V, though these parameters may be optimized for specific target sequences [12] [47]. Following electrophoresis, gels are stained with fluorescent or colorimetric dyes such as ethidium bromide, SYBR Green, or silver stain to visualize the banding patterns that represent distinct microbial populations in the original sample [12] [47].
DGGE Workflow Visualization
The following diagram illustrates the standard end-to-end workflow for DGGE analysis in microbial shift studies:
Diagram 1: DGGE Workflow for Microbial Analysis
Essential Research Reagents and Materials for DGGE
Successful DGGE analysis requires specific reagents and materials optimized for the technique's unique requirements. The following table catalogizes essential research reagent solutions and their specific functions in the DGGE experimental pipeline:
Table 2: Essential Research Reagent Solutions for DGGE Analysis
| Reagent/Material | Function | Specification Notes |
|---|---|---|
| GC-clamped Primers | PCR amplification of target sequences with attached high-melting domain | 30-40 bp GC-rich sequence attached to 5' end; examples: NL1-GC (for Candida) or 338F-GC for bacterial 16S rRNA [12] [47] |
| Denaturant Solutions | Create chemical gradient for sequence-dependent separation | 100% denaturant = 7 M urea + 40% (v/v) formamide; prepared as low and high concentration stock solutions [12] |
| Polyacrylamide Gel | Matrix for electrophoretic separation | Typically 6-8% concentration with 37.5:1 or 40:1 acrylamide:bis-acrylamide ratio [12] [47] |
| TAE Buffer | Electrophoresis running buffer | 1X Tris-acetate-EDTA concentration; maintains stable pH during extended runs [12] |
| DNA Stain | Visualization of separated DNA fragments | Ethidium bromide, SYBR Green, or silver staining; each with different sensitivity and safety profiles [12] [47] |
| Gel Loading Dye | Facilitates sample loading and tracking | Typically contains glycerol, Ficoll, or similar compound to increase density; may include tracking dyes [12] |
Primer selection represents a particularly critical factor in DGGE success. Research comparing primer sets for Candida species identification demonstrated that the NL1-GC/LS2 primer set targeting the D1 region of the 26-28S rRNA gene yielded superior species-specific amplicons compared to the ITS3-GC/ITS4 primer set targeting the ITS2 region [12]. The GC-clamp must be carefully designed to create the highest possible melting domain, typically achieving a melting temperature above 80°C to prevent complete strand separation of the target fragment [47]. Commercial readymade systems for DGGE are available from suppliers such as Bio-Rad, INGENY, and CBS Scientific, providing standardized equipment and reagents for consistent results [45].
DGGE Experimental Protocol for Microbial Community Analysis
Sample Preparation and DNA Extraction
The initial phase of DGGE analysis involves collecting environmental samples and extracting high-quality DNA that faithfully represents the in-situ microbial community. Sample types successfully analyzed using DGGE include soil, water, manure, sediments, and clinical specimens [12] [47] [50]. For anaerobic digestion studies, samples are typically collected at various time points to track microbial succession, with preservation methods such as immediate freezing at -80°C or preservation in specialized buffers to maintain DNA integrity [47]. DNA extraction should employ protocols that ensure comprehensive lysis of diverse microbial cell types while minimizing shearing and degradation. The phenol-chloroform extraction method has been successfully employed in DGGE studies of Candida species, though numerous commercial kits provide standardized alternatives [12]. The critical consideration at this stage is obtaining DNA that accurately reflects microbial community composition without introducing biases toward particular taxonomic groups.
PCR Amplification with GC-Clamped Primers
Following DNA extraction, target genes are amplified using primers specifically designed for the microbial groups of interest. For general bacterial community analysis, primers targeting hypervariable regions of the 16S rRNA gene (most commonly V3 or V6 regions) provide sufficient sequence variation for effective DGGE separation [47] [51]. A typical 50 μL PCR reaction mixture includes PCR buffer, 1.5-4 mM MgCl₂, 0.2 mM dNTPs, 0.1-0.16 μM of each primer, 1.25-2.5 U of DNA Taq polymerase, and approximately 20 ng of template DNA [12]. The amplification program generally begins with an initial denaturation at 95°C for 4-5 minutes, followed by 30-35 cycles of denaturation (30 seconds at 95°C), primer annealing (45 seconds at 53-58°C, temperature optimized for specific primers), and extension (60 seconds at 72°C), with a final extension at 72°C for 5-7 minutes [12]. PCR products are then verified by standard agarose gel electrophoresis before proceeding to DGGE analysis.
DGGE Electrophoresis and Visualization
The heart of the technique involves the denaturing gradient electrophoresis separation. The polyacrylamide gel is prepared with a denaturant gradient optimized for the specific target amplicons. For bacterial 16S rRNA gene fragments (V3 region), a 30-60% denaturant gradient has been successfully employed, while for fungal community analysis using NL1-GC/LS2 primers, a 30-45% gradient provided optimal separation [12]. The PCR products (typically 20 μL mixed with loading dye) are loaded onto the gel, and electrophoresis is performed at a constant temperature of 56-60°C for 14-18 hours at 55-65 V, depending on the fragment size and gradient range [12]. Following electrophoresis, gels are stained for 30 minutes with ethidium bromide or more sensitive alternatives like SYBR Green, then visualized under UV transillumination. The resulting banding patterns provide a genetic fingerprint of the microbial community, with each prominent band potentially representing a dominant microbial population in the original sample.
DGGE Performance Comparison with Alternative Techniques
Direct Comparison with Related Electrophoresis Methods
DGGE occupies a distinct position in the landscape of electrophoretic techniques, with each method offering particular advantages depending on research objectives. The table below provides a comparative analysis of DGGE against other common separation approaches:
Table 3: Performance Comparison of DGGE with Alternative Electrophoresis Techniques
| Technique | Separation Principle | Resolution | Best Application Context | Limitations |
|---|---|---|---|---|
| DGGE | Sequence-dependent melting in chemical denaturant gradient | Single-nucleotide polymorphism detection under optimal conditions | Microbial community fingerprinting; tracking dominant population shifts [12] [47] [48] | Limited to fragments <500 bp; complex optimization [47] |
| TTGE/TGGE | Sequence-dependent melting in temperature gradient | Similar to DGGE; can resolve single nucleotide changes | Microbial ecology; preferred when temperature control is more reproducible than chemical gradients [12] [45] | Requires precise temperature control equipment |
| Non-denaturing GE | Fragment size and molecular shape | Limited to major size differences; cannot distinguish similar-sized fragments | Analyzing nucleic acid integrity; protein separation in native state [2] | Cannot distinguish sequences of identical length |
| Next Generation Sequencing | High-throughput DNA sequencing | Single-nucleotide resolution with comprehensive coverage | Complete microbial community characterization; rare species detection [51] | Higher cost; complex data analysis; may detect non-viable organisms |
When comparing DGGE with its closest relative, Temperature Gradient Gel Electrophoresis (TGGE)/TTGE, research has demonstrated comparable discriminatory power but identified practical differences. A study evaluating both techniques for Candida species identification found that while both methods successfully distinguished all five tested species using the NL1-GC/LS2 primer set, TTGE was recommended due to "easier performance and lower costs" [12]. The primary distinction lies in the denaturing agent: DGGE uses a chemical gradient (urea and formamide), while TTGE/TGGE employs a temperature gradient, which can be more reproducible and easier to establish than chemical gradients [12] [45].
Comparative Experimental Data: DGGE Versus Alternative Methods
Experimental studies provide quantitative comparisons of DGGE performance relative to other microbial community analysis techniques. A comprehensive evaluation of prokaryotic communities in pristine and oil-contaminated environmental samples compared DGGE with culture-dependent methods and found that while the dilution-plating technique captured only 15 different prokaryotic taxa, DGGE revealed "much more microbial diversity" [50]. However, the study also highlighted limitations of DGGE, noting that "universal bacterial primer pairs ignored Actinobacteria altogether," emphasizing the importance of primer selection and potentially complementary approaches [50].
More recent comparisons with next-generation sequencing (NGS) illuminate DGGE's position in the modern methodological landscape. Research analyzing commercial microbial-based products found that while DGGE identified 20 bacterial genera, NGS detected 114 bacterial families and 134 genera, demonstrating the superior comprehensiveness of the newer approach [51]. However, the same study noted that a "polyphasic approach" combining enrichment techniques with DGGE provided valuable insights, suggesting DGGE retains utility in specific applications [51]. For monitoring microbial community dynamics over time, DGGE offers practical advantages in terms of cost, speed, and technical accessibility, particularly for laboratories focused on tracking dominant population shifts rather than comprehensive diversity cataloging.
Applications in Microbial Shift Analysis: Experimental Evidence
Monitoring Microbial Succession in Anaerobic Digestion
DGGE has proven particularly valuable for tracking microbial community shifts in anaerobic digestion processes, providing insights into population dynamics under varying environmental conditions. A 2024 study investigated microbial shifts during mesophilic and thermophilic anaerobic digestion of dairy manure using DGGE analysis of the V3 region of the 16S rRNA gene [47] [52]. The research revealed dramatic temperature-dependent successional patterns, with Acinetobacter sp. dominating initial communities (Day 0) across all temperature conditions, followed by the emergence of distinct thermophilic specialists at higher temperatures [47]. At day 7, reactors at 44°C and 52°C showed shifts toward Coprothermobacter proteolyticus (97% similarity) and Tepidimicrobium ferriphilum (100% similarity), respectively, while mesophilic conditions (28°C) maintained Acinetobacter dominance [47]. By day 60, further specialization was evident, with Syntrophomonas curvata (91% similarity) dominating at 36°C, while the highest temperature reactor (52°C) maintained Coprothermobacter proteolyticus (99% similarity) [47]. These successional patterns, clearly resolved by DGGE, demonstrated how temperature controls microbial community structure during anaerobic processes with consequential impacts on greenhouse gas emissions.
Clinical and Biotechnological Applications
Beyond environmental applications, DGGE has established utility in clinical diagnostics and biotechnology. A study investigating Candida species identification demonstrated that DGGE successfully discriminated between five clinically relevant species (C. albicans, C. glabrata, C. tropicalis, C. orthopsilosis, and C. parapsilosis) using the NL1-GC/LS2 primer set targeting the D1 region of the 26-28S rRNA gene [12]. This capacity for rapid discrimination of closely related pathogenic species represents a significant advantage over conventional biochemical identification methods, which are time-consuming and may lack specificity [12]. In virology, DGGE has been adapted to differentiate epizootic Infectious Salmon Anemia virus variants, successfully distinguishing single-nucleotide differences in the highly polymorphic region (HPR) of viral segment 6, which is associated with virulence [49]. This application highlights DGGE's sensitivity to minor genetic variations that have significant functional implications.
Technical Considerations and Limitations
Despite its utility, DGGE presents several technical limitations that researchers must consider when selecting analytical methods. The technique is optimally suited for DNA fragments between 200-700 base pairs, with longer fragments exhibiting complex melting behavior that complicates interpretation [45] [46]. DGGE primarily detects dominant populations within microbial communities and may lack sensitivity for rare taxa representing less than 1% of the total community [50] [51]. The requirement for GC-clamped primers introduces potential amplification biases, as not all target sequences amplify with equal efficiency [50]. Additionally, comigration of different sequences to the same position can occur, potentially leading to underestimation of diversity, while multiple bands from a single organism may generate overestimation if heterogeneous rRNA operons are present [50] [48].
Perhaps most significantly, method selection must consider the trade-offs between DGGE and next-generation sequencing. While NGS provides substantially greater resolution and depth, DGGE offers advantages in terms of cost, speed, and technical accessibility for laboratories focused on tracking changes in dominant community members rather than comprehensive diversity assessment [51]. For long-term temporal studies or treatment comparisons requiring analysis of numerous samples, DGGE provides a cost-effective fingerprinting approach that can guide subsequent more detailed analyses. The technique remains particularly valuable when combined with statistical analysis of banding patterns to quantify community similarities and differences across samples [47] [48].
Denaturing Gradient Gel Electrophoresis maintains an important position in the microbial ecologist's toolkit, particularly for studies tracking community shifts under changing environmental conditions or experimental treatments. While next-generation sequencing methods provide unprecedented resolution, DGGE offers practical advantages for rapid assessment of dominant populations, time-series analyses, and initial screening of multiple samples. The technique's capacity to resolve single-nucleotide differences under optimal conditions, combined with its relatively low cost and technical accessibility, ensures its continued relevance in environmental microbiology, clinical diagnostics, and biotechnology. As with any methodological approach, understanding DGGE's limitations—particularly its bias toward dominant populations and fragment size constraints—allows researchers to appropriately apply this technique either as a primary analytical tool or as a component in a complementary, polyphasic approach to microbial community analysis.
This guide provides an objective comparison of denaturing versus non-denaturing electrophoresis techniques, supported by experimental data, to inform their application in critical scientific and industrial fields.
Electrophoresis is a foundational laboratory technique used to separate DNA, RNA, or protein molecules based on their size and electrical charge by moving charged particles through a gel matrix under the influence of an electric field [53]. The choice between denaturing and non-denaturing (native) conditions is a critical methodological decision that directly impacts the type of information obtained. Denaturing gels are run under conditions that disrupt the natural structure of biomolecules, unfolding them into linear chains. In this state, their migration depends primarily on linear length, allowing for analysis focused on the primary structure. In contrast, non-denaturing gels preserve the molecule's native structure, meaning separation is influenced by the cross-sectional area, molecular mass, and intrinsic charge, enabling the analysis of secondary, tertiary, and even quaternary structures [1]. This core difference dictates their suitability for specific applications in drug development, clinical diagnostics, and environmental monitoring.
Technical Comparison and Experimental Data
The operational characteristics and performance of denaturing and non-denaturing electrophoresis vary significantly across different applications. The following sections and tables summarize key experimental findings and quantitative data.
RNA Analysis
In RNA analysis, a comparative study repeatedly found that non-denaturing gel electrophoresis provided superior results in terms of the intensity and integrity of 28S and 18S rRNA bands compared to denatured gel electrophoresis [13]. This suggests that for assessing RNA quality and degradation, native conditions may be more effective.
Table 1: Comparative Performance in RNA Analysis
| Parameter | Denaturing Gel | Non-Denaturing Gel |
|---|---|---|
| Band Intensity | Lower | Higher [13] |
| Band Integrity | Lower | Higher [13] |
| Structure Analyzed | Primary (linear length) | Primary, Secondary, Tertiary [1] |
| Typical Denaturant | Urea, Formaldehyde | Not Applicable [13] [1] |
Microfluidic Capillary Electrophoresis for RNA Therapeutics
Advanced analytical platforms like microfluidic capillary electrophoresis are crucial for characterizing RNA-based therapeutics. Empirical studies on single-stranded (ssRNA) and double-stranded RNA (dsRNA) fragments, including pseudouridine-modified mRNA (as used in COVID-19 vaccines), have provided insights into their electrophoretic behavior. The separation relies on the relationship between the RNA's radius of gyration (Rg) and the pore size of the sieving matrix. The persistence length, a measure of chain stiffness, is a key parameter, with values of approximately 64 nm for dsRNA and 2 nm for ssRNA used to calculate the Rg and predict migration [19].
Table 2: Key Parameters for RNA Mobility Models in Microfluidic CE [19]
| Parameter | dsRNA | ssRNA |
|---|---|---|
| Persistence Length | ~64 nm | ~2 nm |
| Radius of Gyration (Rg) | Rg = (p × L / 3)1/2 | Rg = (p × L / 3)1/2 |
| Separation Regime | Ogston model (Rg < pore size); Biased Reptation with Fluctuation (Rg > pore size) | Ogston model (Rg < pore size); Biased Reptation with Fluctuation (Rg > pore size) |
Physics-informed neural networks (PINNs) have been successfully applied to predict the migration of these RNA molecules with an average error of only 0.77%, opening doors for highly accurate in-silico characterization without extensive lab work [19].
Generalized Technique Comparison
Beyond specific biomolecules, the choice of electrophoresis format also depends on the required throughput, resolution, and application scope.
Table 3: Comparison of Electrophoresis Technique Formats [25]
| Technique | Resolution | Speed | Throughput | Primary Applications |
|---|---|---|---|---|
| Slab Gel | High | Slow | Low | DNA, RNA, protein analysis; research & teaching [25]. |
| Capillary Electrophoresis (CE) | High | Fast | Medium | Nucleic acid sequencing, clinical diagnostics, pharmaceutical QC [54] [25]. |
| Microchip Electrophoresis (MCE) | High | Very Fast | High | High-throughput analysis, point-of-care testing [25]. |
| Isotachophoresis (ITP) | Medium | Fast | Medium | Pre-concentration and separation of ionic analytes [25]. |
Application-Specific Workflows and Protocols
Drug Development Quality Control (QC)
In biopharmaceutical development, electrophoresis is indispensable for analyzing the purity, stability, and integrity of nucleic acid-based therapeutics and protein biologics.
- Workflow for mRNA Vaccine QC: A key application is the quality assessment of mRNA vaccines, which involves analyzing long, nucleoside-modified mRNA and checking for immunogenic double-stranded RNA (dsRNA) by-products.
- Sample Preparation: Dilute the mRNA sample (e.g., pseudouridine-modified) or dsRNA by-product to 5 ng/μL in 1x TE buffer [19].
- Gel Preparation: For microfluidic CE, load a commercial chip with a polymer sieving matrix (e.g., poly(N,N-dimethyl acrylamide - PDMA) and a fluorescent dye (e.g., SYTO 61) [19].
- Instrumental Analysis: Use a system like the LabChip GXII Touch. The script applies specific loading, injecting, and separation voltages. Separation time is adjusted based on gel concentration [19].
- Data Analysis: The software generates electropherograms. Machine learning models, particularly Physics-Informed Neural Networks (PINNs), can predict migration behavior with high accuracy (0.77% error) to aid in identification and quantification [19].
The following diagram illustrates the decision-making pathway for QC analysis:
Clinical Diagnostics
In clinical settings, electrophoresis is used for diagnosing genetic disorders, protein abnormalities, and infectious diseases. A simplified, non-denaturing agarose gel method using TBE or TAE buffer minimizes the use of hazardous chemicals like formaldehyde, enhancing researcher safety and reducing hazardous waste. This method is sufficient for checking RNA degradation and genomic DNA contamination in samples intended for RT-PCR and Northern hybridization [18].
- Protocol for Rapid RNA Integrity Check (Non-denaturing):
- Gel Casting: Prepare a standard 1-1.5% agarose gel in TBE or TAE buffer. No denaturants are added.
- Sample Loading: Mix RNA samples with a native gel loading dye.
- Electrophoresis: Run the gel at 5-10 V/cm for 30-60 minutes.
- Visualization: Stain the gel with an appropriate fluorescent nucleic acid stain (e.g., Ethidium Bromide or safer alternatives) and visualize under UV light. Intact RNA will show sharp, distinct ribosomal RNA bands (28S and 18S for eukaryotic RNA), while degraded RNA will appear as a smear [18].
Environmental Monitoring
Electrophoresis techniques are employed to monitor environmental pollutants and assess the genetic diversity of microbial populations in ecosystems.
- Application Workflow: Slab gel electrophoresis is commonly used to analyze pollutants like heavy metals and pesticides, and to track the genetic variety of microbial communities through DNA or RNA extraction from environmental samples [25]. The process involves collecting samples (e.g., water, soil), extracting nucleic acids, and using electrophoresis (often PCR-coupled) to detect and quantify specific genetic markers or pollutants.
The Scientist's Toolkit: Essential Research Reagents
Successful electrophoresis requires a suite of reliable reagents and materials. The following table details key solutions for standard and advanced applications.
Table 4: Essential Reagents and Materials for Electrophoresis
| Item | Function | Example Application |
|---|---|---|
| SYTO 61 Fluorescent Stain | Binds to nucleic acids for detection in microfluidic systems [19]. | RNA integrity and purity analysis on LabChip GXII [19]. |
| Poly(N,N-dimethyl acrylamide) (PDMA) | A linear polymer used to create a sieving matrix for microfluidic CE [19]. | Separation of ssRNA and dsRNA fragments [19]. |
| Urea | A denaturing agent that disrupts hydrogen bonds, unfolding RNA/DNA [1]. | Denaturing gel electrophoresis for determining RNA molecular weight [13]. |
| ssRNA & dsRNA Ladders | A set of RNA fragments of known sizes for calibrating and interpreting gels/electropherograms [19]. | Sizing and quantification of experimental RNA samples. |
| Pseudouridine-Modified RNA | A chemically modified RNA with enhanced stability and reduced immunogenicity [19]. | Analytical standard for characterizing mRNA therapeutics and vaccines [19]. |
| TBE/TAE Buffer | Provides the conductive medium and maintains stable pH during electrophoresis [18]. | Standard agarose gel electrophoresis for DNA/RNA [18]. |
Market Context and Future Outlook
The global electrophoresis market, valued at USD 2.15-2.47 billion in 2024, is projected to grow at a CAGR of 5.3-5.38% through 2032-2034, indicating the technique's enduring importance [53] [55]. Key trends shaping the field include the domination of capillary electrophoresis (CZE) in nucleic acid analysis due to its high resolution, speed, and automation, and the fastest growth in the Asia-Pacific region, driven by expanding healthcare infrastructure and biotech investment [54] [55].
Future developments are focused on automation, miniaturization, and the integration of AI-driven data analysis to enhance throughput and accuracy [56] [57]. Furthermore, the success of physics-informed neural networks (PINNs) in predicting RNA migration signals a move towards more predictive and computational methods in electrophoretic analysis [19].
Solving Common Problems: Smearing, Distortion, and Poor Resolution
In molecular biology and drug development, gel electrophoresis serves as a fundamental analytical tool for separating and visualizing nucleic acids and proteins. However, the appearance of smeared bands—diffuse, blurry streaks instead of sharp, distinct bands—compromises data interpretation and can significantly hinder research progress. This problem frequently stems from three primary causes: sample degradation, sample overloading, and the critical choice between denaturing and non-denaturing gel systems. Understanding how these factors manifest differently across various electrophoretic techniques is essential for accurate diagnosis and effective troubleshooting. This guide provides a systematic comparison of denaturing versus non-denaturing electrophoresis, offering researchers clear diagnostic pathways and proven experimental protocols to resolve smearing artifacts.
Denaturing vs. Non-Denaturing Gels: A Core Comparison
The choice between denaturing and non-denaturing (native) gel systems represents a fundamental decision that directly impacts separation results and the nature of potential smearing.
- Denaturing Gels utilize chemical agents like urea for nucleic acids or SDS (sodium dodecyl sulfate) for proteins to disrupt the native structure of the molecules [2] [32]. This process linearizes the molecules and confers a uniform charge-to-mass ratio. Consequently, separation occurs primarily based on molecular weight or length, as the intrinsic structure and charge of the molecule are masked [32].
- Non-Denaturing Gels preserve the molecule's native conformation, including secondary structure and multi-subunit complexes [2] [32]. Separation in these systems depends on a combination of factors: molecular size, overall three-dimensional shape (bulk), and intrinsic charge [2] [32]. This makes them ideal for studying functional biomolecules but can lead to different migration patterns and smearing if the system is suboptimal.
Table 1: Core Characteristics of Denaturing and Non-Denaturing Gel Electrophoresis
| Feature | Denaturing Gels | Non-Denaturing Gels |
|---|---|---|
| Separation Basis | Molecular mass/size only [32] | Size, shape, and native charge [2] [32] |
| Sample Treatment | Heated with denaturants (SDS, urea, DTT) [32] | Mixed with non-denaturing buffer [32] |
| Biomolecule Structure | Destroyed; molecules linearized [32] | Preserved; native state maintained [2] [32] |
| Typical Applications | Molecular weight determination, Western blotting, assessing sample purity [2] [32] | Analysis of protein complexes, enzyme activity assays, studying quaternary structure [2] [32] |
| Common Smearing Causes | Incomplete denaturation, degradation in storage | Unstable complexes, aggregation, incorrect buffer pH |
Diagnosing the Cause of Smeared Bands
Effective troubleshooting requires correlating the visual characteristics of the smear with its underlying cause. The following workflow outlines a systematic approach to diagnosis, linking specific band patterns to probable issues in sample integrity, gel preparation, and running conditions.
Quantitative Troubleshooting Guide
The table below expands on the diagnostic workflow, detailing specific solutions for the root causes of smearing.
Table 2: Comprehensive Troubleshooting Guide for Smeared Bands
| Root Cause | Specific Indicators | Recommended Corrective Actions | Supporting Experimental Data |
|---|---|---|---|
| Sample Degradation [58] [59] [60] | Continuous smear from well to dye front; visible in both samples and ladder [59]. | Use nuclease-free tips and tubes; add RNase inhibitors for RNA; store samples properly; use fresh reagents [58]. | Degradation confirmed by smearing in freshly loaded ladder; resolution after using new reagents. |
| Incorrect Gel Type [58] [2] | Fuzzy bands for single-stranded nucleic acids; aberrant migration. | Use denaturing gels (with urea/formaldehyde) for RNA or ssDNA; use native gels for dsDNA [58] [2]. | Study shows DGGE and nDGE successfully detect sequence polymorphism in T-cell receptor genes [61]. |
| Sample Overloading [58] [60] | Intense, warped, or U-shaped bands; trailing smears [58]. | Load 0.1–0.2 μg of DNA per mm of well width [58]; reduce sample volume; use combs with narrow, deep wells [58]. | Overloaded DNA ladders (≥5μL) show thick smears; clear bands at recommended 3μL load [59]. |
| Protein Contamination [58] [59] | Bright, smeared bands with high molecular weight aggregation [59]. | Purify nucleic acids via phenol-chloroform extraction; add proteinase K treatment; use loading dye with SDS [58]. | Protein-contaminated DNA shows aberrant migration; purification restores sharp bands [59]. |
| Incorrect Running Conditions [58] [60] | Band distortion ("smiling"/"frowning"); diffusion smearing across the gel. | Run at 1-5 V/cm [59]; use constant current mode [60]; ensure adequate buffer volume; avoid excessive run times [58]. | High voltage (>10V/cm) causes overheating and smearing; optimal voltage yields sharp bands. |
Experimental Protocols for Smear Prevention
Protocol 1: Denaturing Agarose Gel Electrophoresis for RNA Analysis
This protocol is critical for preventing smearing of RNA samples, which are highly susceptible to degradation and secondary structure formation.
- Step 1: Gel Preparation. Prepare a 1.2% agarose solution in nuclease-free water. Once cooled to approximately 60°C, add denaturing agent (e.g., 2.2 M formaldehyde) and MOPS running buffer. Cast the gel in a fume hood [58].
- Step 2: Sample Denaturation. Mix RNA sample (up to 0.1–0.2 μg per mm of well width) with a denaturing loading dye containing formamide [58]. Heat at 70°C for 5-10 minutes and immediately place on ice to prevent re-folding of secondary structures [58].
- Step 3: Gel Running. Submerge the gel in MOPS running buffer. Load samples and run at 3-5 V/cm for 2-3 hours [59]. Monitor migration to prevent over-running [58].
- Step 4: Staining and Visualization. Stain with an intercalating dye like SYBR Green or ethidium bromide. For thick gels, allow extended staining time for full penetration [58]. Visualize under UV light.
Protocol 2: Non-Denaturing (Native) PAGE for Protein Complexes
This protocol is designed to separate proteins in their native state to study complexes and functionality, requiring careful control of conditions to prevent smearing from aggregation.
- Step 1: Gel Casting. Prepare a non-denaturing polyacrylamide gel (e.g., 8% for high molecular weight complexes). Omit SDS and reducing agents from all solutions. Use a Tris-Glycine buffer at pH 8.8 for the resolving gel [32].
- Step 2: Sample Preparation. Dialyze the protein sample into a low-salt buffer compatible with the gel system (e.g., Tris-HCl). Do not boil the sample. Mix with a native loading dye containing glycerol for even sinking into the well [32].
- Step 3: Electrophoresis. Use Tris-Glycine running buffer in both anode and cathode chambers. Run in a cold room or with a cooling apparatus at a constant current of 15-20 mA to minimize heat-induced aggregation and smearing [60] [32].
- Step 4: Post-Run Analysis. Proteins can be visualized by Coomassie staining or, crucially, can be tested for preserved enzymatic activity using specific activity assays after electrophoresis [32].
Research Reagent Solutions for Optimal Results
The following reagents are essential for implementing the protocols above and preventing common smearing issues.
Table 3: Essential Reagents for Troubleshooting Smeared Bands
| Reagent/Category | Function & Rationale | Specific Product Examples |
|---|---|---|
| Denaturing Agents | Linearizes nucleic acids/proteins; eliminates conformational variability; prevents smearing from secondary structures. | Urea, Formaldehyde (RNA), SDS (proteins), Dithiothreitol (DTT) [58] [32]. |
| Nuclease Inhibitors | Protects nucleic acid samples from degradation by ubiquitous nucleases, preventing a continuous background smear. | DEPC-treated water, RNase inhibitors, DNase inhibitors [58]. |
| Ready-to-Use Ladders | Pre-mixed with appropriate loading dye; eliminates pipetting errors and potential degradation during preparation. | GoldBio DNA Ladders, Invitrogen DNA Ladders [59]. |
| High-Purity Agarose | Provides a consistent gel matrix with defined pore size; free from nucleases and other contaminants. | Molecular biology grade agarose [58]. |
| Appropriate Buffers | Maintains correct pH and ion concentration; ensures stable electric field and proper molecule migration. | TAE, TBE (DNA), MOPS (RNA), Tris-Glycine (Native PAGE) [59] [32]. |
Smeared bands in gel electrophoresis are a solvable problem through methodical diagnosis and precise experimental practice. The core of effective troubleshooting lies in understanding the fundamental distinction between denaturing and non-denaturing systems and selecting the appropriate one for the analytical goal. For researchers in drug development, where sample integrity and result reproducibility are paramount, adhering to the protocols and guidelines summarized here—from rigorous sample handling and correct gel choice to optimization of running conditions—is indispensable. By integrating these strategies, scientists can transform gel electrophoresis from a source of frustration into a reliable, high-resolution tool that drives research forward.
Gel electrophoresis is a foundational technique in molecular biology laboratories for the separation and analysis of biomacromolecules such as DNA, RNA, and proteins based on their size and charge [9]. However, a common challenge that compromises the integrity of results is electrophoretic band distortion, manifesting as "smiling" or "frowning" bands. These artifacts primarily result from uneven heat distribution across the gel matrix during the electrophoresis process, a phenomenon known as Joule heating [62]. This heating occurs when electrical current passes through the conductive buffer solution, generating heat that can lead to temperature gradients, with the center of the gel typically becoming warmer than the edges [63] [62]. These temperature variations cause molecules to migrate at different speeds, resulting in the characteristic curved bands.
Managing Joule heating is particularly critical when comparing denaturing versus non-denaturing (native) electrophoresis techniques, as the inherent properties of these systems dictate different vulnerabilities and required optimization strategies. In denaturing gel electrophoresis, conditions disrupt the natural structure of analytes. DNA and RNA are unfolded using agents such as urea or DMSO, while proteins are denatured with sodium dodecyl sulfate (SDS), which also coats the proteins with a uniform negative charge [2] [1]. Separation depends primarily on the linear length and mass-to-charge ratio of the molecules, analyzing only the primary structure [1]. In contrast, non-denaturing gel electrophoresis preserves the biomolecules' native secondary, tertiary, and quaternary structures [2] [1]. Consequently, separation depends not only on molecular mass and intrinsic charge but also on the overall bulk, shape, and cross-sectional area of the native macromolecule [2]. This fundamental difference influences how heat impacts separation and how buffer conditions must be optimized for each technique.
Comparative Analysis: Denaturing vs. Non-Denaturing Systems and Heat Effects
The following table summarizes the core differences between denaturing and non-denaturing gel systems, providing a foundation for understanding their respective interactions with Joule heating.
Table 1: Core Characteristics of Denaturing vs. Non-Denaturing Gel Electrophoresis
| Feature | Denaturing Gels | Non-Denaturing Gels |
|---|---|---|
| Biomolecule Structure | Disrupted; unfolded into linear chains [2] [1] | Preserved in native state [2] [1] |
| Key Separation Factors | Linear length, mass-to-charge ratio [2] [1] | Molecular mass, intrinsic charge, size, shape, 3D structure [2] [1] |
| Common Denaturing Agents | Urea, SDS, DMSO, glyoxal [2] [1] | Not applicable |
| Typical Applications | Western blotting, establishing sample purity, protein sequencing [2] | Studying protein binding, isolating enzymes, analyzing quaternary structures [2] |
| Impact of Joule Heating | Can cause protein degradation or RNA melting; band distortion affects molecular weight determination [62] | Can cause loss of enzymatic activity; band distortion complicates analysis of native interactions [2] |
The mechanism of band distortion is intrinsically linked to the buffer system and the resulting Joule heating. As the electrical current passes through the buffer, power dissipation leads to a temperature increase described by ( P = I^2R ), where ( P ) is power, ( I ) is current, and ( R ) is resistance [63]. This heat generation is more pronounced in buffers with high ionic strength, which have higher conductivity and thus allow more current to flow for a given voltage [63] [62]. The resulting temperature gradient—warmer in the center and cooler at the edges—alters the fluid viscosity. The warmer, less viscous center allows molecules to migrate faster, causing the characteristic "smile" effect. Conversely, improper cooling can sometimes lead to a "frown," where the edges run faster [62].
The following workflow diagram illustrates the causal relationship between electrophoresis conditions, Joule heating, and the resulting band patterns, alongside the key management strategies.
Beyond simple distortion, excessive heat can degrade sample integrity. In denaturing gels, high temperatures can cause further, uncontrolled degradation of proteins or melt DNA structures [62]. For RNA analysis under denaturing conditions, heat can exacerbate hydrolysis [13]. In non-denaturing gels, the elevated temperature can disrupt weak non-covalent interactions that are essential for maintaining a protein's native conformation and enzymatic activity, potentially leading to loss of function and misleading results [2].
Experimental Data and Protocol Comparison
Empirical studies consistently demonstrate that managing thermal conditions is a decisive factor for successful electrophoresis. The following table synthesizes experimental findings from various studies, highlighting the impact of buffer composition and temperature control on separation quality.
Table 2: Experimental Data on Buffer and Temperature Management
| Gel Type / Application | Key Experimental Variable | Performance Outcome | Reference / Source |
|---|---|---|---|
| RNA Analysis (Non-denaturing Agarose) | TBE/TAE-based native gel vs. denaturing gels (formaldehyde/urea) | Better band intensity and integrity of 28S/18S rRNA; minimized use of hazardous chemicals. | [13] [18] |
| Capillary Zone Electrophoresis | Buffer concentration (5-210 mM sodium phosphate) | High salt concentrations increased analysis time but, with high voltage, provided a "window of enhanced resolution" for difficult separations despite Joule heating. | [63] |
| General Gel Electrophoresis | Use of active cooling systems (e.g., Peltier elements) & buffer circulation | Prevented sample degradation and improved resolution by maintaining consistent temperature, eliminating thermal gradients. | [62] |
| DNA Separation (Agarose) | Buffer type and concentration (e.g., 175 mM borate) | Optimal resolution vs. migration time; concentrations >200 mM caused unstable baseline and irregular peaks due to Joule heating. | [63] |
Detailed Experimental Protocol: Assessing RNA Integrity Using a Non-Denaturing Gel
This protocol, adapted from comparative studies, offers a safer alternative to denaturing methods for checking RNA degradation and genomic DNA contamination, effectively minimizing heat-related degradation risks [13] [18].
1. Gel Preparation:
- Prepare a 1% agarose solution in either 1X TBE or TAE electrophoresis buffer. The use of standard TBE/TAE instead of denaturing agents like formaldehyde makes the procedure safer [18].
- Melt the agarose completely in a microwave and allow it to cool to approximately 50-60°C before casting the gel. Pour it into a casting tray with a well comb and let it solidify completely.
2. Sample Preparation:
- Mix 2-5 µg of total RNA sample with a non-denaturing (native) gel loading dye. The loading dye should not contain denaturants like formamide or SDS [18].
- Do not heat the samples prior to loading. Heating is standard in denaturing protocols but is omitted here to preserve native structure and reduce heat-induced degradation [13].
3. Electrophoresis and Heat Management:
- Place the solidified gel in an electrophoresis chamber filled with the same 1X TBE or TAE buffer used to prepare the gel.
- Load the prepared RNA samples alongside an appropriate RNA molecular weight ladder.
- Run the gel at a constant, low voltage (e.g., 5-8 V/cm of gel length) to minimize Joule heating. For a standard mini-gel, this is typically 80-100 V for 45-60 minutes [18] [62].
- If available, activate the cooling system of the electrophoresis unit or run the gel in a cold room (4°C) to further dissipate heat.
4. Visualization:
- After electrophoresis, stain the gel with an appropriate nucleic acid stain, such as ethidium bromide or a safer alternative, and visualize under UV light.
- Intact, high-quality RNA will show sharp, distinct bands for the 28S and 18S ribosomal RNAs, with the 28S band approximately twice the intensity of the 18S band. Smearing indicates degradation, which can be exacerbated by overheating during the run [13].
The Scientist's Toolkit: Essential Reagents for Heat Management
Successful control of band distortion requires not just technique but also the appropriate selection of reagents and equipment. The following table details key solutions and their specific functions in managing Joule heating and optimizing buffer conditions.
Table 3: Research Reagent Solutions for Managing Joule Heating
| Tool / Reagent | Primary Function | Application Notes |
|---|---|---|
| Low Ionic Strength Buffers | Reduces electrical current and subsequent heat generation (Joule heating) [62]. | A balance must be struck; too low ionic strength can compromise buffering capacity and lead to poor separation. |
| TAE & TBE Buffers | Standard buffers for nucleic acid electrophoresis; TBE has higher buffering capacity. | Suitable for both denaturing and non-denaturing gels; the choice impacts DNA mobility and resolution [9]. |
| Active Cooling Systems | Actively removes heat from the gel apparatus (e.g., via Peltier elements, water jackets) [62]. | Critical for high-voltage or long-duration runs; ensures temperature uniformity, preventing smiling/frowning. |
| Buffer Circulation Systems | Prevents the formation of ion gradients and temperature gradients by homogenizing the buffer [62]. | Enhances heat dissipation from the gel surface, leading to more consistent migration across the gel. |
| Pulsed-Field Power Supplies | Modulates voltage to reduce average current and allow intermittent cooling periods [62]. | Particularly beneficial for separating very large DNA fragments and managing heat in extended runs. |
| Urea (Denaturing Agent) | Denatures nucleic acids into flexible single strands, eliminating secondary structure [2]. | Used in denaturing PAGE; its presence can influence gel conductivity and heat generation. |
| Agarose & Polyacrylamide Gels | Acts as a sieving matrix; choice of type and concentration dictates pore size and heat tolerance. | Polyacrylamide has better heat tolerance; agarose gels are more prone to melting at high temperatures [9] [62]. |
The effective resolution of band distortion in gel electrophoresis hinges on a principled approach to managing Joule heating and buffer conditions. This challenge requires different considerations for denaturing versus non-denaturing techniques. Denaturing systems, focused on mass analysis, are vulnerable to heat-induced sample degradation, while non-denaturing systems risk the loss of native structure and function. The experimental data and protocols presented confirm that a multi-faceted strategy is most effective. This strategy integrates the use of optimized buffer systems with appropriate ionic strength, the application of active cooling and buffer circulation technologies, and the careful regulation of power supply settings. By systematically applying these principles and utilizing the essential tools outlined, researchers can significantly improve the resolution, reproducibility, and reliability of their electrophoretic analyses, thereby advancing their research in drug development and molecular biology with greater confidence and precision.
In the molecular biology laboratory, the clarity of bands on an electrophoretic gel is more than just an aesthetic concern; it is a direct indicator of the quality and reliability of the data. Achieving sharp, well-resolved bands is a fundamental requirement for accurate analysis, whether for validating PCR products, assessing RNA integrity, or purifying DNA fragments. This goal hinges on the precise optimization of three critical, interdependent parameters: gel concentration, applied voltage, and electrophoresis run time. The pursuit of optimal resolution must also be framed within the initial choice between denaturing and non-denaturing (native) gel systems, a decision that dictates the very nature of the separation process [2] [1]. This guide provides a structured, data-driven comparison of these parameters to empower researchers in consistently achieving maximum band sharpness.
Denaturing vs. Non-Denaturing Gels: A Foundational Choice
The selection between denaturing and native gel systems is the first and most critical step in experimental design, as it determines what property of the macromolecule is being separated.
- Non-Denaturing (Native) Gels: These conditions preserve the native structure of the biomolecule. Separation depends on a combination of the molecule's net charge, size, and overall shape (cross-sectional area) [2] [1]. This makes native gels ideal for studying intact complexes, enzymatic activity, and protein-protein interactions [2].
- Denaturing Gels: These conditions disrupt the secondary and higher-order structure of proteins and nucleic acids. For proteins, sodium dodecyl sulfate (SDS) is used, creating a uniform negative charge-to-mass ratio. For nucleic acids, urea or formamide is common. Separation in denaturing gels depends almost exclusively on molecular mass or length, as the molecules are unfolded into linear chains [2] [1]. This is essential for determining the precise size of a polypeptide or nucleic acid fragment and for establishing sample purity [2].
Table 1: Core Differences Between Denaturing and Non-Denaturing Gel Electrophoresis
| Feature | Denaturing Gels | Non-Denaturing Gels |
|---|---|---|
| Biomolecule Structure | Unfolded/Linearized [2] [1] | Native/Intact [2] [1] |
| Separation Basis | Molecular mass/length [2] [1] | Net charge, size, and shape [2] [1] |
| Key Reagents | SDS (proteins), Urea/Formamide (nucleic acids) [1] | Standard buffers without denaturants |
| Primary Applications | Molecular weight determination, purity assessment, Western blot preparation, protein/nucleic acid sequencing [2] | Studying oligomeric state, enzyme activity, protein-protein/nucleic acid interactions [2] |
Optimizing the Triad: Gel Percentage, Voltage, and Run Time
The interplay between gel percentage, voltage, and run time directly controls the sharpness and resolution of bands by managing the sieving effect, migration speed, and diffusion of samples.
Gel Percentage: The Primary Sieve
The gel matrix acts as a molecular sieve. The concentration of agarose or polyacrylamide determines the pore size, which must be matched to the size of the target molecules [64].
- Agarose Gels: Used for separating larger nucleic acid fragments (50 bp to 50,000 bp). Lower percentages (e.g., 0.5-0.8%) resolve larger fragments, while higher percentages (e.g., 2-3%) are for smaller fragments [64].
- Polyacrylamide Gels: Provide finer resolution for smaller molecules (nucleic acids <1,000 bp and proteins). The percentage must be carefully selected for the target size range [64].
Table 2: Optimal Gel Percentage for DNA Separation
| Agarose Gel % | Efficient Separation Range (bp) | Polyacrylamide Gel % (non-denaturing) | Efficient Separation Range (bp) |
|---|---|---|---|
| 0.5% | 2,000 - 50,000 [64] | 3.5% | 100 - 1,000 [64] |
| 1.0% | 400 - 8,000 [64] | 5.0% | 80 - 500 [64] |
| 1.5% | 200 - 3,000 [64] | 8.0% | 60 - 400 [64] |
| 2.0% | 100 - 2,000 [64] | 12.0% | 50 - 200 [64] |
| 3.0% | 25 - 1,000 [64] | 20.0% | 5 - 100 [64] |
Applied Voltage: Balancing Speed and Resolution
The voltage applied creates the electric field that drives molecule migration. Excessive voltage is a common cause of poor band sharpness due to Joule heating [60].
- Low Voltage: Leads to longer run times but minimizes heat generation, reducing band diffusion and "smiling" effects (where bands in the center migrate faster than those on the edges) [65] [60]. This often yields the sharpest bands.
- High Voltage: Speeds up the run but generates significant heat. This can cause band smearing, distortion, and even gel melting, especially if the buffer level is insufficient [65] [58]. For high-resolution work, a lower voltage for a longer duration is recommended [60]. Some protocols use a stepped approach, starting with a lower voltage to allow the samples to stack before increasing it for the separation phase [66].
Run Time: The Critical Duration
The run time must be optimized to allow for sufficient separation without excessive diffusion.
- Too Short: Bands will be poorly resolved and clustered together [58] [60].
- Too Long: Smaller fragments may run off the gel, and all bands will diffuse, becoming fuzzy and less distinct [58] [60]. The run is typically monitored using a tracking dye (e.g., bromophenol blue); when the dye front reaches a predetermined point (e.g., the bottom of the gel), the run should be stopped [66].
The relationship between these three parameters is summarized in the following workflow for systematic optimization:
Advanced Techniques: DGGE and TTGE
For challenging separations, such as fragments of identical size but different sequences, advanced denaturing gel techniques are used.
- Denaturing Gradient Gel Electrophoresis (DGGE): Uses a polyacrylamide gel with an increasing gradient of chemical denaturants (urea and formamide). DNA fragments melt at different points in the gradient, halting their migration and allowing single-base-pair resolution [12].
- Temporal Temperature Gradient Gel Electrophoresis (TTGE): A related method that uses a uniform denaturant concentration but a linearly increasing temperature during the run to achieve similar separation [12]. A comparative study found TTGE to be equally effective but easier to perform and less costly than DGGE for discriminating between different Candida species [12].
The Scientist's Toolkit: Essential Reagents and Materials
Successful electrophoresis relies on a suite of carefully selected reagents and materials.
Table 3: Key Research Reagent Solutions for Gel Electrophoresis
| Reagent/Material | Function & Importance |
|---|---|
| DNA Ladder | Essential for sizing experimental fragments. Should be chromatography-purified for high purity and have bands in the expected size range [65]. |
| Running Buffer (TAE vs. TBE) | Carries current and maintains pH. TBE has higher buffering capacity, is better for long runs and small fragments, but can cause slower migration. TAE is preferred for larger fragments (>1 kb) and is compatible with enzymatic reactions post-electrophoresis [65]. |
| Loading Dye/Buffer | Contains a dense agent (e.g., glycerol) to make the sample sink into the well and tracking dyes to monitor migration progress. The dye's migration size should not mask bands of interest [65] [58]. |
| Fluorescent Stain (e.g., SYBR Safe/Gold, EtBr) | Used to visualize nucleic acids. Sensitivity varies; SYBR Gold is more sensitive than EtBr or SYBR Safe, requiring less DNA (as little as 1 ng per band) for detection [65]. |
| Agarose & Polyacrylamide | The matrix materials for the gel. Agarose is for larger fragments; polyacrylamide provides high resolution for smaller fragments and proteins [64]. |
Achieving maximum band sharpness in gel electrophoresis is not a matter of chance but of systematic optimization within a defined experimental framework. The process begins with the strategic choice between denaturing and non-denaturing systems, dictated by the biological question. From there, the triad of gel percentage, voltage, and run time must be carefully balanced. Using lower percentages for larger molecules and higher percentages for smaller ones, applying lower voltages to minimize heat-induced distortion, and determining the ideal run time to prevent under- or over-migration are all critical steps. By adhering to these data-driven guidelines and understanding the underlying principles, researchers can transform their gels from blurry approximations into sharp, reliable, and publication-quality data.
In the research of denaturing versus non-denaturing electrophoresis techniques, the critical challenge of faint or absent bands consistently presents a significant hurdle to experimental progress and data reliability. This issue cuts across both techniques but manifests from distinct origins. In denaturing gels, where SDS or urea disrupts native structure, separation depends primarily on molecular mass, and band visibility is heavily influenced by complete denaturation and uniform charge-to-mass ratio [2] [1]. In contrast, non-denaturing (native) gels preserve macromolecular structure, and separation depends on charge, size, and conformation; thus, band intensity can be affected by complex folding and protein-protein interactions that influence dye binding [2] [1]. This guide objectively compares the performance of troubleshooting approaches, supported by experimental data, to provide researchers and drug development professionals with a definitive framework for diagnosing and resolving these common artifacts, thereby ensuring the integrity of downstream analyses.
Core Principles: Denaturing vs. Non-Denaturing Systems
The fundamental difference between these electrophoretic techniques dictates their appropriate application and the nature of potential pitfalls.
Denaturing Electrophoresis: This method employs agents like SDS (for proteins) or urea (for nucleic acids) to unfold molecules into linear chains. The primary structure dictates migration, which depends almost exclusively on molecular mass (for SDS-PAGE) or linear length (for nucleic acids) [2] [1]. This uniformity simplifies analysis but introduces specific vulnerabilities, such as incomplete denaturation leading to smearing or aberrant migration.
Non-Denaturing (Native) Electrophoresis: This technique runs macromolecules in their native, folded state. Separation depends on a combination of the molecule's intrinsic charge, molecular mass, and overall shape/conformation [2] [1]. While powerful for studying functional complexes, enzyme activity, and quaternary structure, this method is susceptible to band broadening or faintness caused by conformational heterogeneity or inefficient staining of compact structures.
The following workflow diagram outlines the systematic diagnostic process for faint or absent bands, incorporating checks relevant to both types of gels.
Systematic Troubleshooting of Faint or Absent Bands
Sample Preparation and Concentration Errors
Incorrect sample handling and quantification are primary contributors to faint bands. The optimal amount of nucleic acid or protein to load is highly dependent on the detection method used.
- Nucleic Acid Quantities: For gels stained with Ethidium Bromide or SYBR Safe, a minimum of 20 ng of DNA per band is recommended. When using the more sensitive SYBR Gold stain, as little as 1 ng of DNA per band can be detected [65]. Overloading (e.g., >500 ng for a PCR product) can cause smearing and "smiling" bands, while underloading results in faintness [67].
- Protein Quantities: For Coomassie Blue staining, load 0.5–4.0 µg of a purified protein or 40–60 µg of a crude sample per well, depending on well size and gel thickness [68]. Underloading leads to an inability to detect minor bands, while overloading causes distorted, poorly resolved bands that can affect adjacent lanes [68].
- Sample Degradation: Nucleic acids can be degraded by nucleases if reagents or labware are contaminated, or if good practices (wearing gloves, using nuclease-free zones) are not followed [58]. For proteins, proteases active at room temperature can cause degradation if samples are not heated immediately after adding lysis buffer [68].
- Incorrect Sample Buffer: The loading buffer must contain a high percentage of glycerol to increase the density of the sample, ensuring it sinks to the bottom of the well [65] [69]. Insufficient glycerol causes samples to diffuse into the running buffer. For SDS-PAGE, an excess of SDS (a 3:1 mass ratio of SDS to protein) is required for complete denaturation and charge masking [68].
Staining and Detection Failures
The choice of stain and staining protocol directly impacts sensitivity.
- Stain Sensitivity and Compatibility: Different stains have varying affinities for nucleic acids. For example, single-stranded nucleic acids may require more stain or a longer staining duration for visualization [58]. Stains like GoldView are not ideal for fragments smaller than 500 bp [67].
- Staining Procedure: For in-gel staining, the fluorescent stain must be thoroughly mixed into the agarose solution without bubbles to ensure even distribution [58]. For post-electrophoresis staining, the gel must be fully submerged with gentle shaking for a sufficient duration, especially for thick or high-percentage gels, to allow for proper stain penetration [58]. High staining temperatures can damage some dyes [67].
- Visualization Equipment: If a fluorescent dye is used, the light source must be optimal for exciting that specific dye. An incorrect light source will lead to poor or no detection [58].
Electrophoresis Setup and Execution Errors
The physical setup and electrical parameters of the run are critical for proper migration and band resolution.
- Gel Concentration: Using an incorrect gel percentage for the fragment size range is a common error. Higher percentage gels are needed to resolve smaller fragments [65] [64].
- Running Buffer: The buffer must be freshly prepared and compatible. TAE is recommended for longer fragments (>1 kb) and is compatible with enzymatic reactions, while TBE provides better separation for small DNA fragments and is suitable for long runs due to its higher buffering capacity [65]. The gel must be fully submerged, but excess buffer can decrease DNA mobility and cause band distortion [65].
- Voltage and Run Time: Very high voltage (>150 V for standard mini-gels) can cause band smearing and the "smiling effect" due to uneven heating [67]. A very short run time results in poor separation, while a very long run can cause smaller molecules to run off the gel, leading to faint or absent bands [58] [70].
- Electrical Connections: Reversed electrodes (DNA runs backwards into the well) or loose contacts in the tank will prevent or distort migration [58] [65].
Comparative Experimental Data and Protocols
Quantitative Guidelines for Optimal Results
Table 1: Recommended Agarose Gel Percentages for DNA Separation [64]
| Agarose Percentage (%) | Optimal Separation Range (base pairs) |
|---|---|
| 0.5 | 2,000 – 50,000 |
| 0.7 | 800 – 12,000 |
| 1.0 | 400 – 8,000 |
| 1.2 | 300 – 7,000 |
| 1.5 | 200 – 3,000 |
| 2.0 | 100 – 2,000 |
| 3.0 | 25 – 1,000 |
| 4.0 | 10 – 500 |
Table 2: Detection Limits for Common Nucleic Acid Stains [65]
| Stain Type | Minimum Recommended DNA per Band | Key Characteristics |
|---|---|---|
| Ethidium Bromide | 20 ng | Cost-effective, known mutagen |
| SYBR Safe | 20 ng | Safer alternative to EtBr, similar sensitivity |
| SYBR Gold | 1 ng | Higher sensitivity, more expensive |
Table 3: Recommended Protein Load for Polyacrylamide Gels [68]
| Sample Type | Coomassie Blue Staining | Silver Staining |
|---|---|---|
| Purified Protein | 0.5 – 4.0 µg | ~100x less than Coomassie |
| Crude Cell Extract | 40 – 60 µg | ~100x less than Coomassie |
Detailed Experimental Protocols for Diagnosis
Protocol 1: Diagnosing Protein Degradation via Delayed Heating [68]
- Divide: Add your protein sample to two equal portions of SDS sample buffer.
- Heat Immediately: Mix one portion well and heat it immediately at 95-100°C for 5 minutes.
- Delay Heating: Leave the other portion at room temperature for 2-4 hours, then heat it.
- Analyze: Run both samples on an SDS-PAGE gel side-by-side.
- Interpretation: If the delayed-heat sample shows a smear or additional lower molecular weight bands compared to the immediately heated sample, protease degradation is the likely cause of faint or absent bands in your main experiment.
Protocol 2: Verifying Nucleic Acid Sample Integrity and Load
- Quantify: Accurately measure the concentration of your DNA/RNA sample using a spectrophotometer or fluorometer.
- Prepare Dilution Series: Prepare a series of sample dilutions to load different masses (e.g., 10 ng, 25 ng, 50 ng, 100 ng) alongside an appropriate DNA ladder.
- Run Gel: Perform electrophoresis using a gel percentage optimal for your expected fragment size.
- Interpretation: Observe which load quantity produces clear, sharp bands without smearing. This establishes the optimal loading amount for your system. Faint bands at all quantities suggest degradation or issues with staining/visualization.
The Scientist's Toolkit: Essential Research Reagent Solutions
Table 4: Key Reagents for Troubleshooting Electrophoresis Bands
| Reagent / Material | Primary Function | Troubleshooting Application |
|---|---|---|
| SYBR Gold Nucleic Acid Gel Stain [65] | High-sensitivity fluorescent detection of nucleic acids | Diagnosing faint bands when conventional stains (EtBr) fail; detecting low-abundance samples (<1 ng/band). |
| Ready-to-Use DNA Ladder [70] | Sizing reference for nucleic acid fragments; contains loading dye | Control for gel function; confirms if faint bands are due to sample issues or system-wide failures (e.g., running conditions). |
| Chromatography-Purified DNA Ladder [65] | High-purity sizing reference with sharp, defined bands | Eliminates smearing or extra bands originating from a contaminated or impure ladder. |
| Dithiothreitol (DTT) or β-Mercaptoethanol (BME) [68] | Reducing agents that break disulfide bonds | Prevents protein aggregation in SDS-PAGE sample preparation, reducing smearing and clumping in wells. |
| Benzonase Nuclease [68] | Degrades all forms of DNA and RNA; lacks proteolytic activity | Reduces viscosity in crude cell extracts by shearing nucleic acids, preventing smearing and poor resolution. |
| Low Melting Point (LMP) Agarose [64] | Agarose with low gelling temperature (~25°C) | Enables gentle extraction of large nucleic acid fragments (>10 kb) from gels and is ideal for in-gel enzymatic reactions. |
| TBE (Tris-Borate-EDTA) Running Buffer [65] | High buffering capacity buffer for nucleic acid electrophoresis | Preferred for long runs and better separation of small DNA fragments; reduces buffer exhaustion artifacts. |
| Tris-Acetate-EDTA (TAE) Running Buffer [65] | Standard buffer for nucleic acid electrophoresis | Preferred for resolving longer fragments (>1 kb) and is compatible with downstream enzymatic steps. |
Within the broader research context comparing denaturing and non-denaturing electrophoresis, resolving faint or absent bands is not merely a technical exercise but a fundamental requirement for valid data interpretation. The experimental data and protocols presented here demonstrate that a systematic approach—spanning sample preparation, staining, and setup—is universally critical. However, the specific root cause, whether it's incomplete denaturation masking a target protein band or a dye's inability to penetrate a native complex, is intrinsically linked to the chosen technique. By applying this structured, evidence-based troubleshooting guide, scientists can not only salvage experiments but also deepen their understanding of the underlying principles governing these indispensable separation methods, thereby accelerating discovery and development in biomedical research.
The choice between denaturing and non-denaturing electrophoresis represents a fundamental branching point in experimental design, with profound implications for protein separation, analysis, and subsequent results. This methodological division dictates everything from buffer compatibility to the ultimate biological relevance of the data obtained. Under denaturing conditions, proteins are unfolded into linear polypeptides, allowing separation based primarily on molecular weight. In contrast, non-denaturing (native) conditions preserve protein structure, function, and complex formation, enabling separation by both molecular weight and inherent charge, shape, and size [2]. The reliability and accuracy of electrophoresis results are directly dependent on sample preparation quality, as poorly prepared samples lead to smearing, band degradation, or inconclusive data [71].
Sample integrity forms the foundation of the entire electrophoresis workflow. Key considerations include rigorous contamination control to prevent degradation by nucleases or proteases, accurate concentration and purity assessment to prevent overloading or undetectable results, and appropriate buffer selection to maintain sample integrity and ensure proper migration [71]. The decision between denaturing and native approaches must align with the ultimate experimental goals, whether that involves studying protein complexes, enzyme activity, or obtaining precise molecular weight measurements.
Comparative Analysis: Denaturing vs. Non-Denaturing Techniques
The distinction between denaturing and non-denaturing electrophoresis extends beyond simple buffer composition to encompass different philosophical approaches to protein analysis. The table below summarizes the core characteristics, applications, and requirements of each method.
Table 1: Core Characteristics of Denaturing vs. Non-Denaturing Electrophoresis
| Parameter | Denaturing Electrophoresis (SDS-PAGE) | Non-Denaturing Electrophoresis (Native-PAGE) |
|---|---|---|
| Protein State | Denatured into linear polypeptides [2] | Native conformation preserved [2] |
| Separation Basis | Primarily molecular mass [2] | Mass, charge, size, and shape [2] |
| Key Reagents | SDS, reducing agents (DTT, β-mercaptoethanol) [6] | Native buffer without SDS or reducing agents [6] |
| Sample Heating | Required (85°C for 2 minutes) [6] | Not recommended [6] |
| Primary Applications | Molecular weight determination, western blotting, protein purity assessment [2] | Studying protein complexes, enzyme activity, protein-protein interactions [2] |
| Advantages | Simplifies complex mixtures, consistent migration based on size, high reproducibility | Preserves biological activity, reveals quaternary structure, maintains binding interactions |
The experimental workflow differs significantly between these approaches, particularly in sample preparation. For denaturing SDS-PAGE, samples are combined with SDS sample buffer and typically heated to unfold proteins and coat them with negative charge [71] [6]. For native PAGE, samples are prepared in non-denaturing buffer without heating to preserve native structure and function [6]. A critical technical consideration is that reduced and non-reduced samples should not be run in adjacent lanes on the same gel, as reducing agents can carry over and affect neighboring samples [6].
Buffer Compatibility and Denaturant Selection
The choice of denaturing agents and buffers represents one of the most critical aspects of sample preparation, with significant implications for downstream analysis. Different denaturants offer varying efficiencies and compatibilities with mass spectrometry and electrophoresis.
Chaotropes and Detergents: Efficiency and Trade-offs
Table 2: Comparison of Denaturants for Protein Sample Preparation
| Denaturant | Mechanism | Efficiency | Downstream Compatibility | Key Considerations |
|---|---|---|---|---|
| SDS (Sodium Dodecyl Sulfate) | Ionic detergent that unravels and negatively charges proteins [72] | Excellent; strongest solubilizer, especially for membrane proteins [72] | Poor with LC-MS without removal; interferes with enzymes and ionization [72] | Requires careful cleanup; traces >0.01% impact LC-MS [72] |
| Guanidinium Hydrochloride (GnHCl) | Chaotrope that disrupts hydrogen bonding [72] | Strong denaturant and solubilizer [72] | Compatible with MS analysis after removal [72] | Does not interfere with standard LC-MS methods [6] |
| Urea | Chaotrope that disrupts hydrogen bonding [73] | Moderate denaturant [73] | Requires removal before MS analysis [73] | Can form cyanates that modify proteins [73] |
| Acid-Labile Surfactants (e.g., Rapigest) | MS-compatible detergent cleaved at low pH [73] | Effective for plasma proteome [73] | Excellent; breaks down into non-interfering products [73] | Higher cost can be prohibitive for large studies [73] |
| Trifluoroethanol (TFE) | Volatile solvent that denatures hydrophobic cores [73] | Comparable to SDS for plasma [73] | Excellent; volatile and MS-compatible [73] | 30-50% concentration at elevated temperature effective [73] |
Experimental Data on Denaturant Performance
Comparative studies provide quantitative insights into denaturant performance. In research comparing sample preparation methods for LC-MS analysis of human cells and plasma, the single-pot, solid-phase-enhanced sample preparation (SP3) protocol using either SDS or GnHCl lysis buffers achieved the highest number of quantified proteins in both HeLa cells (5,895-6,131 proteins) and plasma samples compared to in-solution digestion (ISD) with GnHCl (4,851 proteins) [72]. The SP3 method also demonstrated superior digestion efficiency, with peptides containing no missed cleavages averaging 77.5-84.6% for SP3 compared to 38.0% for ISD [72]. Furthermore, the SP3 protocol significantly enhanced membrane proteome coverage, identifying 17% more proteins than the ISD method [72]. These findings underscore the critical importance of matching denaturation strategies with both the sample type and downstream analytical goals.
Sample Preparation Workflows and Protocols
Comprehensive Workflow for Electrophoresis Sample Preparation
The journey from biological sample to loaded gel involves multiple critical steps that must be optimized for either denaturing or non-denaturing conditions. The following diagram illustrates the key decision points and procedures in this process.
Detailed Experimental Protocols
Denaturing SDS-PAGE Sample Preparation
For denaturing gel electrophoresis, the protocol aims to completely unfold proteins and mask their native charge:
- Lysis and Extraction: Lyse cells or tissues using a lysis buffer containing 1-4% SDS for optimal protein extraction, particularly for membrane proteins [72]. Add protease inhibitor cocktail immediately before use to prevent protein degradation [71].
- Quantification: Determine protein concentration using a compatible assay such as BCA or Bradford. The BCA assay is often preferred as it's less susceptible to interference from detergents in the lysis buffer [71].
- Sample Buffer Preparation: Combine protein sample with 2X Tris-Glycine SDS Sample Buffer. For reduced samples, add a reducing agent such as DTT to a final concentration of 1X immediately before electrophoresis [6].
- Denaturation: Heat samples at 85°C for 2-5 minutes to denature proteins [6]. Avoid heating at 100°C as it can promote proteolysis [6].
- Loading: Centrifuge briefly to collect condensation and load appropriate volume onto gel. Avoid loading reduced and non-reduced samples in adjacent lanes to prevent carry-over effects [6].
Non-Denaturing PAGE Sample Preparation
For native gel electrophoresis, the protocol preserves protein structure and function:
- Gentle Lysis: Use mild, non-denaturing detergents such as Triton X-100 for cell lysis, or physical methods that preserve protein complexes [71] [74].
- Quantification: Determine protein concentration using appropriate assay, keeping in mind that non-denaturing conditions may affect standard curve accuracy.
- Sample Buffer Preparation: Combine protein sample with 2X Tris-Glycine Native Sample Buffer, which contains no SDS or reducing agents [6].
- No Heating: Do not heat samples, as heating will denature proteins and defeat the purpose of native electrophoresis [6].
- Loading: Load samples directly onto gel without prior denaturation.
Essential Research Reagent Solutions
Successful electrophoresis requires specific reagents optimized for either denaturing or non-denaturing conditions. The following table catalogues essential materials and their functions in sample preparation.
Table 3: Essential Reagents for Electrophoresis Sample Preparation
| Reagent/Category | Specific Examples | Function | Denaturing/Non-Denaturing |
|---|---|---|---|
| Detergents & Denaturants | SDS, Guanidinium HCl, Urea, Triton X-100 [72] [71] | Solubilize proteins, disrupt non-covalent bonds | Primarily denaturing (except mild detergents) |
| Reducing Agents | DTT, β-mercaptoethanol, TCEP [73] [6] | Break disulfide bonds between cysteine residues | Denaturing only |
| Alkylating Agents | Iodoacetamide, iodoacetic acid [73] [74] | Block free sulfhydryl groups to prevent reformation of disulfides | Primarily denaturing |
| Protease Inhibitors | Commercial cocktails (e.g., AEBSF, leupeptin, pepstatin) [71] | Prevent protein degradation during extraction | Both |
| Buffer Systems | Tris-glycine, Tris-borate-EDTA, HEPES [6] [75] | Maintain pH, provide appropriate ions for conduction | Both |
| Sample Buffers | Tris-Glycine SDS Sample Buffer, Tris-Glycine Native Sample Buffer [6] | Provide appropriate environment for loading | Specific to method |
| Tracking Dyes | Bromophenol blue, xylene cyanol, orange G [6] [75] | Visualize migration progress during electrophoresis | Both |
Troubleshooting Common Sample Preparation Challenges
Even with optimized protocols, sample preparation issues can arise. The table below outlines common problems, their causes, and solutions for both denaturing and non-denaturing electrophoresis.
Table 4: Troubleshooting Guide for Sample Preparation Issues
| Problem | Potential Causes | Solutions | Applicable Methods |
|---|---|---|---|
| Protein Degradation | Insufficient protease inhibition; delay between lysis and processing [71] | Use fresh protease inhibitor cocktail; keep samples on ice; process quickly [71] | Both |
| Poor Band Resolution | Incorrect gel percentage; sample overloading; low buffer ionic strength [71] | Adjust gel percentage; reduce loading amount; use fresh buffer [71] | Both |
| Horizontal Smiling | Uneven heating during electrophoresis | Reduce voltage; use cooling apparatus; ensure buffer circulation | Both |
| Missing Bands | Protein precipitation; incomplete transfer (western); degradation | Centrifuge sample before loading; check transfer efficiency; verify integrity | Both |
| Smeared Bands | Incomplete denaturation (SDS-PAGE); nuclease contamination (DNA) | Ensure adequate heating and SDS; use nuclease-free reagents [71] | Primarily Denaturing |
| Carry-Over Effects | Running reduced and non-reduced samples adjacent [6] | Separate reduced and non-reduced samples on gel [6] | Denaturing |
| Loss of Activity | Denaturation during preparation; harsh lysis conditions | Use gentle detergents; avoid heating; maintain cold temperatures | Non-Denaturing |
The choice between denaturing and non-denaturing electrophoresis represents a fundamental strategic decision that should align with ultimate experimental goals. Denaturing SDS-PAGE provides unparalleled resolution for molecular weight determination, purity assessment, and western blotting by simplifying complex protein mixtures through unfolding. Conversely, non-denaturing electrophoresis preserves biologically relevant protein structures, interactions, and activities, enabling functional studies that would be impossible under denaturing conditions.
Buffer compatibility and denaturation control stand as critical pillars supporting successful electrophoresis outcomes. The selection of appropriate denaturants, reducing agents, and buffer systems must consider both upstream sample characteristics and downstream analytical requirements. As demonstrated by comparative studies, methodological choices significantly impact proteome coverage, digestion efficiency, and membrane protein recovery [72]. By understanding these principles and implementing robust, reproducible sample preparation protocols, researchers can ensure the reliability and biological relevance of their electrophoretic analyses, ultimately advancing both basic research and drug development endeavors.
Technique Selection: A Direct Comparison of Strengths and Limitations
Electrophoresis is a foundational laboratory technique used to separate macromolecules such as DNA, RNA, and proteins based on their size, charge, and shape. The global electrophoresis market, valued at approximately USD 2.15 billion in 2024, is projected to grow at a compound annual growth rate (CAGR) of 5.3% to 5.6%, reaching USD 3.42-5.02 billion by 2032, driven by its indispensable role in molecular biology, genomics, and clinical diagnostics [53] [76]. This technique operates on the principle that charged particles will migrate through a gel matrix under the influence of an electric field, with their mobility influenced by factors including field strength, net charge, molecular size and shape, ionic strength, and the properties of the matrix (e.g., viscosity, pore size) [3]. The two primary categories of electrophoresis—denaturing and non-denaturing (native)—differ fundamentally in their preparation of samples and their resulting analytical capabilities.
In denaturing electrophoresis, agents such as sodium dodecyl sulfate (SDS) for proteins or urea and formamide for nucleic acids disrupt the native structure of the molecules. For proteins, SDS binds in a constant ratio, masking intrinsic charges and unfolding polypeptides into linear chains, allowing separation almost exclusively based on molecular weight [77] [3]. For nucleic acids, denaturants prevent secondary structure formation, ensuring separation is based primarily on fragment length [12] [2]. In contrast, non-denaturing electrophoresis preserves the native conformation, quaternary structure, and biological activity of molecules. Separation depends on a complex combination of the molecule's inherent charge, molecular size, and three-dimensional shape, making it suitable for studying protein complexes, enzyme activity, and protein-protein interactions [2] [3]. The choice between these techniques is therefore dictated by the experimental objective: determining molecular mass and purity requires denaturing conditions, while analyzing native structure and function necessitates non-denaturing conditions.
Performance Comparison Table
The following table provides a direct, quantitative comparison of the key performance characteristics between denaturing and non-denaturing electrophoresis techniques, based on current methodologies and market data.
Table 1: Head-to-Head Performance Comparison of Electrophoresis Techniques
| Characteristic | Denaturing Electrophoresis | Non-Denaturing Electrophoresis |
|---|---|---|
| Resolution | High for separation by molecular weight. Distinguishes small mass differences (1-10% depending on gel percentage and format) [3]. Capillary Electrophoresis (CE) offers very high resolution [25]. | Moderate to High, but dependent on multiple factors. Separates based on combined effects of charge, size, and shape. Can resolve different quaternary structures of the same protein [3]. |
| Sensitivity | High. Can detect proteins/nucleic acids at low concentrations (e.g., nanogram to picogram levels with fluorescent stains). CE-LIF can achieve dsDNA detection limits as low as 0.05 ng/μL [78]. | Generally Lower. Lacks signal enhancement from denaturants. May require more sample or more sensitive detection methods to achieve comparable results [2]. |
| Speed | Fast. Standard SDS-PAGE runs take 20-40 minutes for mini-gels [3]. Capillary and microchip electrophoresis are faster, with some analyses completed in minutes [25] [53]. | Variable, often slower. Migration is influenced by complex native structure, which can lead to longer run times to achieve sufficient separation [2]. |
| Cost | Low to High. Basic slab gel systems: $500–$3,000. High-end automated capillary systems: $25,000–$120,000 [76]. High reagent consumption contributes to recurring costs [53]. | Generally Lower. Simpler and cheaper to run as it avoids costly denaturing agents (e.g., SDS, urea) [2]. Utilizes the same equipment base as denaturing systems. |
Detailed Experimental Protocols
To illustrate the practical application and generate comparable data, specific experimental protocols can be employed. The following methodology, adapted from a study comparing Denaturing Gradient Gel Electrophoresis (DGGE) and Temporal Temperature Gradient Gel Electrophoresis (TTGE) for Candida species identification, provides a robust framework [12].
Protocol: Comparative Analysis of Candida Species Using DGGE and TTGE
This protocol outlines the steps for simultaneous identification of multiple yeast species, demonstrating the setup and execution of both DGGE and TTGE.
1. Sample Preparation and DNA Extraction:
- Strains and Culture: Standard strains of Candida (e.g., C. albicans, C. glabrata, C. tropicalis) are cultured on Potato Dextrose Agar (PDA) for 24 hours at 36°C [12].
- DNA Extraction: Genomic DNA is extracted from the cultured strains using the phenol-chloroform method. The resulting DNA is resuspended in TE buffer or nuclease-free water and quantified [12].
2. PCR Amplification:
- Primer Sets: Two primer sets are used for amplification. The NL1-GC/LS2 set (amplifying the D1 region of the 26-28S rRNA gene, ~250 bp) is found to be superior for species-specific discrimination. A 30-40 bp GC-clamp must be attached to the 5' end of the forward primer to facilitate separation in DGGE/TTGE [12].
- PCR Reaction: A 50 µL reaction mixture is prepared containing PCR buffer, MgCl₂ (1.5-4 mM), dNTPs (0.2 mM), primers (0.1-0.16 mM each), Taq DNA polymerase (1.25-2.5 U), and approximately 20 ng of DNA template [12].
- Cycling Conditions: An initial denaturation at 95°C for 4-5 minutes is followed by 30-35 cycles of denaturation (95°C for 30 s), annealing (53-58°C for 45 s), and extension (72°C for 60 s), with a final extension at 72°C for 5-7 minutes [12].
- Verification: 5 µL of the PCR product is analyzed on a 1% agarose gel to confirm successful amplification and expected amplicon size [12].
3. Gel Electrophoresis Conditions:
- DGGE Analysis: A 30-60% denaturing gradient (100% denaturant is 7 M urea and 40% formamide) is used for the ITS2 region amplicons, while a 30-45% gradient is used for the D1/D2 region amplicons. The gel is run in 1X TAE buffer at a constant voltage (55-130 V) for 4.5-16 hours at a controlled temperature (56-60°C) [12].
- TTGE Analysis: The polyacrylamide gel contains 6-7 M urea. Electrophoresis is performed at a constant voltage (65 V) with a linear temperature gradient over time (e.g., 56-66°C for 14 hours for the ITS2 region). This temperature ramp creates the denaturing conditions needed for separation [12].
- Visualization: After electrophoresis, the gel is stained with ethidium bromide for 30 minutes and visualized under UV transillumination [12].
Key Experimental Insight: The study concluded that while both DGGE and TTGE are capable of detecting Candida species, TTGE is recommended due to easier performance and lower costs, as it eliminates the need to prepare a chemical denaturing gradient [12].
The workflow for this comparative experiment is summarized in the diagram below.
The Scientist's Toolkit: Essential Research Reagent Solutions
Successful electrophoresis requires a suite of specific reagents and materials. The following table details the essential components for performing the experiments described in this guide.
Table 2: Key Research Reagent Solutions for Electrophoresis
| Reagent/Material | Function and Key Characteristics |
|---|---|
| Polyacrylamide Gel | A cross-linked polymer matrix that acts as a molecular sieve. Bis-Tris gels (neutral pH) offer high resolution and are ideal for sensitive detection methods, while Tris-Glycine gels (alkaline pH) are cost-effective for routine protein analysis [77]. |
| SDS (Sodium Dodecyl Sulfate) | An ionic denaturing agent used in SDS-PAGE. It binds to and unfolds proteins, imparting a uniform negative charge and allowing separation based almost solely on polypeptide molecular weight [3]. |
| Urea & Formamide | Denaturing agents used primarily for nucleic acid electrophoresis (e.g., in DGGE). They prevent DNA/RNA secondary structure formation. A "100% denaturant" solution is defined as 7 M urea and 40% (v/v) formamide [12]. |
| SYBR Green I / EvaGreen | Fluorescent nucleic acid stains used for detecting DNA in gels or in capillary electrophoresis with laser-induced fluorescence (CE-LIF). They offer high sensitivity, with detection limits for dsDNA as low as 0.05 ng/μL [78]. |
| GC-Clamp | A 30-40 base pair, guanine-cytosine-rich sequence attached to the 5' end of a PCR primer. It is essential for techniques like DGGE and TTGE, as it creates a high-melting domain that "clamps" the DNA fragment, ensuring partial denaturation occurs in lower-melting domains for effective separation [12]. |
| Molecular Weight Markers (Ladders) | A mixture of proteins or nucleic acids of known sizes run alongside samples. They provide a critical reference for estimating the molecular mass of unknown analytes in the sample [3]. |
The choice between denaturing and non-denaturing electrophoresis is not a matter of one technique being universally superior, but rather of selecting the right tool for the specific scientific question. Denaturing techniques, particularly SDS-PAGE, are the undisputed standard for determining molecular weight and assessing sample purity, offering high resolution, sensitivity, and speed for these applications. Their widespread use in quality control for biopharmaceuticals underscores their reliability [3] [76]. Conversely, non-denaturing techniques are indispensable for functional and structural biology, enabling the study of proteins in their native state, including complex formation, enzymatic activity, and binding interactions [2] [3].
Emerging trends are shaping the future of both approaches. The market is seeing a strong shift toward automation, miniaturization (e.g., capillary and microchip electrophoresis), and the integration of AI for data analysis, which enhances throughput, reproducibility, and data interpretation [25] [76]. Furthermore, the development of low-cost, self-built systems, such as a compact CE-LIF instrument for under $1,100, promises to make advanced electrophoretic analysis more accessible to labs with limited budgets [78]. Ultimately, a researcher's decision will hinge on a careful balance of the required information (mass vs. native structure), available resources, and the desired throughput, with both denaturing and non-denaturing methods remaining cornerstones of modern biological research.
In the realm of protein analysis, the choice between denaturing and non-denaturing electrophoresis techniques represents a fundamental methodological crossroads that directly impacts experimental outcomes. Denaturing gel electrophoresis, specifically sodium dodecyl sulfate-polyacrylamide gel electrophoresis (SDS-PAGE), has established itself as an indispensable tool for specific analytical applications where protein structure must be simplified for accurate interpretation. Within the context of a broader thesis comparing electrophoretic techniques, this guide provides a detailed examination of when and why researchers should select denaturing gels for two critical applications: western blotting and protein sequencing. The validation of these methodologies rests upon their ability to generate reproducible, reliable data by controlling for protein conformation and complexity, thereby enabling precise molecular weight determination and structural analysis [32].
The core distinction between these techniques lies in their treatment of protein structure. Denaturing gels systematically dismantle higher-order protein structures through a combination of chemical detergents and reducing agents, resulting in linearized polypeptides with uniform charge-to-mass ratios [2] [32]. In contrast, non-denaturing (native) gels preserve the protein's tertiary and quaternary structures, maintaining biological activity but introducing multiple variables that complicate analysis for certain applications [79]. This fundamental difference dictates their appropriate implementation in the research pipeline, with denaturing methods providing the necessary standardization for analytical techniques requiring separation based solely on molecular weight [32].
Fundamental Principles: Denaturing Versus Non-Denaturing Gel Electrophoresis
Mechanism of Denaturing Gel Electrophoresis
Denaturing gel electrophoresis operates on the principle of complete protein unfolding to create a direct relationship between electrophoretic mobility and molecular weight. The process employs a three-pronged approach to dismantle protein structure: (1) the strong anionic detergent sodium dodecyl sulfate (SDS) binds to hydrophobic regions of the protein at a consistent ratio of approximately 1.4g SDS per 1g of protein, conferring a uniform negative charge that overwhelms the protein's intrinsic charge; (2) reducing agents such as dithiothreitol (DTT) or β-mercaptoethanol break disulfide bonds that stabilize tertiary and quaternary structures; and (3) heat application (typically 85-100°C) accelerates denaturation and ensures complete linearization [32] [79]. The resultant SDS-polypeptide complexes adopt a rod-like shape with charge densities proportional to their molecular weights, allowing separation based primarily on size rather than charge or conformation [32].
The electrophoretic mobility of proteins in denaturing gels follows a predictable logarithmic relationship with molecular weight, enabling accurate size determination when compared with standardized protein ladders [32]. This linearization and standardization represent the foundational strength of denaturing gels for analytical applications requiring molecular weight specificity, such as western blotting and protein sequencing. The complete denaturation process also exposes epitopes that might otherwise be buried within the protein's native structure, facilitating antibody recognition in subsequent detection phases [80].
Mechanism of Non-Denaturing Gel Electrophoresis
Non-denaturing gel electrophoresis, in contrast, maintains proteins in their biologically active states by omitting SDS, reducing agents, and heat denaturation from the sample preparation process [79]. Separation occurs through a more complex interplay of the protein's intrinsic charge, size, and shape, with migration determined by both the net charge at the running buffer pH and the molecular dimensions of the native structure [2] [32]. This approach preserves enzyme activity, protein-protein interactions, and tertiary/quaternary structures, making it invaluable for functional studies but problematic for precise molecular weight determination [32].
In non-denaturing systems, the gel matrix and buffer conditions must be carefully optimized to maintain protein stability and activity throughout the separation process. The resulting migration pattern reflects a composite of structural properties rather than a single variable, complicating quantitative analysis but providing insights into native state characteristics [79]. This preservation of complexity makes native gels ideal for studying biological interactions but limits their utility for applications requiring standardized linear polypeptides.
Comparative Analysis: Key Technical Differences
Table 1: Fundamental Differences Between Denaturing and Non-Denaturing Gel Electrophoresis
| Parameter | Denaturing Gels (SDS-PAGE) | Non-Denaturing Gels |
|---|---|---|
| Sample Treatment | SDS + reducing agent + heat (85-100°C) | No detergents or reducing agents; no heat |
| Protein Structure | Linearized polypeptides | Native conformation maintained |
| Separation Basis | Molecular weight | Size, shape, and intrinsic charge |
| Charge Properties | Uniform negative charge from SDS | Native charge preserved |
| Biological Activity | Lost during denaturation | Typically preserved |
| Molecular Weight Determination | Accurate estimation possible | Not reliable due to multiple variables |
| Typical Applications | Western blotting, protein sequencing, purity assessment | Enzyme activity assays, protein complex analysis |
Denaturing Gels for Western Blotting: Methodology and Validation
Theoretical Foundation for Denaturing Gels in Western Blots
Western blotting represents a cornerstone protein detection technique that fundamentally relies on the separation specificity afforded by denaturing gel electrophoresis. The denaturing approach provides three critical advantages for immunoblotting applications: (1) it ensures that protein migration correlates directly with molecular weight, enabling accurate identification of target proteins through size comparison with standards; (2) it linearizes proteins to expose epitopes that might be structurally concealed in native conformations, thereby enhancing antibody accessibility; and (3) it normalizes charge characteristics across different protein species, eliminating mobility variations based on isoelectric points that could complicate transfer and detection [81] [80].
The process of protein transfer from gel to membrane, a crucial step in western blotting, benefits significantly from the uniform physical properties of denatured proteins. Linearized polypeptides transfer more efficiently and predictably than complex native structures, particularly in semi-dry and dry blotting systems where transfer efficiency varies with protein conformation [82]. Furthermore, the denatured state presents epitopes as linear amino acid sequences, which aligns with the recognition properties of most antibodies generated for research applications [80]. This epitope accessibility proves particularly important for monoclonal antibodies that often target specific linear sequences rather than conformational epitopes.
Experimental Protocol: Denaturing Western Blot Workflow
The standard protocol for denaturing western blotting follows a meticulous sequence designed to maintain protein denaturation throughout the separation and transfer process:
Protein Extraction and Denaturation: Cells or tissues are lysed in appropriate buffers containing protease inhibitors to prevent degradation. The protein concentration is quantified and normalized across samples to ensure equivalent loading. Samples are then mixed with SDS-PAGE loading buffer (typically containing Tris-HCl, glycerol, SDS, bromophenol blue, and DTT or β-mercaptoethanol) and heated to 85-100°C for 2-5 minutes to complete denaturation [6] [81].
SDS-PAGE Separation: Denatured samples are loaded onto discontinuous polyacrylamide gels consisting of a stacking gel (pH ~6.8, lower acrylamide concentration) and a resolving gel (pH ~8.8, higher acrylamide concentration). Electrophoresis is initiated at low voltage (60-80V) through the stacking gel to concentrate proteins into sharp bands, then increased (100-150V) in the resolving gel to separate by molecular weight [81] [80]. The process continues until the dye front approaches the bottom of the gel, typically 60-90 minutes for mini-gel systems.
Electrophoretic Transfer: Following separation, proteins are transferred to nitrocellulose or PVDF membranes using electroblotting. The gel and membrane are assembled in a transfer sandwich with filter paper and immersed in transfer buffer. For wet transfer systems, assembly is placed in a tank filled with transfer buffer (typically containing Tris, glycine, and methanol) and transferred at constant voltage (100V) for 60-90 minutes or at lower voltages overnight [82] [81]. Semi-dry systems transfer more rapidly (15-60 minutes) but may be less efficient for high molecular weight proteins.
Immunodetection: Transferred membranes are blocked with protein solutions (non-fat milk or BSA) to prevent nonspecific antibody binding. Primary antibodies specific to the target protein are incubated, followed by extensive washing and application of enzyme-conjugated secondary antibodies (typically HRP or AP). After additional washing, detection is performed using chemiluminescent, colorimetric, or fluorescent substrates [81] [80].
Table 2: Western Blot Transfer Method Comparison
| Transfer Method | Time Requirements | Buffer Requirements | Transfer Efficiency | Best Applications |
|---|---|---|---|---|
| Wet Transfer | 30-120 minutes (standard); overnight (high molecular weight) | Large volume (~1000mL) with methanol | Excellent for all protein sizes | High molecular weight proteins; quantitative applications |
| Semi-Dry Transfer | 7-60 minutes | Minimal buffer (~200mL); methanol-free options | Good for proteins <100kDa; decreased efficiency for larger proteins | Rapid screening; multiple transfers |
| Dry Transfer | As few as 3-7 minutes | No buffer required; pre-hydrated stacks | Comparable to wet transfer; rapid | High-throughput applications; minimal setup |
Validation and Troubleshooting for Denaturing Western Blots
Successful implementation of denaturing western blots requires systematic validation to ensure specificity and reproducibility. Key validation steps include:
Antibody Validation: Confirm antibody specificity using positive controls (known expression systems) and negative controls (knockdown/knockout cells or tissues) [80]. Verify that the antibody is validated for denatured protein detection, as some antibodies recognize conformational epitopes not present in linearized proteins.
Transfer Efficiency Assessment: Monitor transfer completeness through reversible protein stains (Ponceau S) or prestained molecular weight markers visible on the membrane after transfer [81]. Incomplete transfer may necessitate protocol modifications such as increased transfer time, methanol concentration adjustment, or alternative membrane materials.
Signal Specificity Controls: Include secondary antibody-only controls to identify nonspecific binding and loading controls (e.g., actin, tubulin, GAPDH) to normalize for protein quantity and transfer variations [80].
Common troubleshooting considerations for denaturing western blots include poor transfer of high molecular weight proteins (>100kDa), which may benefit from extended transfer times or inclusion of SDS in transfer buffers; excessive background signal, which often responds to increased blocking time or alternative blocking agents; and unexpected band sizes, which may indicate protein degradation, alternative splicing, or post-translational modifications [81].
Denaturing Gels for Protein Sequencing: Methodology and Validation
Theoretical Foundation for Denaturing Gels in Protein Sequencing
Protein sequencing methodologies, particularly those involving Edman degradation or mass spectrometric analysis, fundamentally require high-purity protein samples free from contaminants and structural complexities that could interfere with enzymatic or chemical processing. Denaturing gel electrophoresis serves as an essential preparatory step for sequencing applications by providing two critical functions: (1) assessment of sample purity through resolution of individual polypeptide chains, and (2) isolation of target proteins in a form compatible with downstream sequencing techniques [32].
The denaturing process is particularly crucial for mass spectrometric analysis because it ensures complete exposure of protease cleavage sites (typically trypsin) that might otherwise be structurally protected in native conformations [33]. Additionally, the removal of non-covalent interactions prevents protein aggregation and ensures uniform digestion, a prerequisite for reproducible peptide fragment generation. For Edman degradation, which sequentially removes N-terminal amino acids, denatured linear polypeptides present accessible termini without steric hindrance from folding, thereby enhancing reaction efficiency [32].
Experimental Protocol: Protein Sequencing Preparation Workflow
The standard workflow for preparing protein samples for sequencing via denaturing gels involves:
Preparative SDS-PAGE: Protein mixtures are separated using standard denaturing conditions with modifications to accommodate larger sample loads (preparative wells or multiple standard wells). Thicker gels (1.5-2mm) may be employed to increase protein capacity without compromising resolution [33].
Visualization and Excisation: Following electrophoresis, proteins are visualized using non-fixing staining methods compatible with protein sequencing. Zinc-imidazole reverse staining, copper staining, or mild Coomassie protocols preserve protein integrity while allowing band identification [33]. The target band is precisely excised from the gel with minimal excess polyacrylamide.
In-Gel Digestion (Mass Spectrometry): For mass spectrometric sequencing, gel slices are destained, reduced with DTT, alkylated with iodoacetamide, and digested with sequence-grade trypsin or other specific proteases. Peptides are subsequently extracted from the gel matrix using acetonitrile and formic acid solutions for LC-MS/MS analysis [33].
Electroelution (Edman Degradation): For N-terminal sequencing via Edman degradation, proteins may be electroeluted from minced gel pieces into appropriate buffers, then transferred to PVDF membranes for direct sequencing [32].
Purity Assessment: Analytical-scale SDS-PAGE of small aliquots from preparative gels confirms isolation purity before proceeding to sequencing, ensuring the absence of contaminating proteins that could generate ambiguous results [33].
Validation and Quality Control for Sequencing Preparations
Quality control measures for protein sequencing preparations include:
Purity Verification: Multiple staining techniques (Coomassie, silver stain) confirm the absence of contaminating proteins in excised bands. Staining should be performed with minimal fixation to prevent protein modifications that interfere with sequencing [33].
Protease Activity Confirmation: For mass spectrometric approaches, control digests with standard proteins (e.g., BSA) verify protease activity and digestion efficiency under the employed conditions.
Mass Spectrometry Controls: Inclusion of known protein standards processed in parallel monitors sample preparation and instrument performance throughout the sequencing workflow.
Yield Quantification: Protein concentrations are determined after elution from gels to ensure sufficient material for sequencing reactions, typically requiring 1-10μg for Edman degradation and less for sensitive mass spectrometric approaches [33].
Comparative Experimental Data: Performance Metrics
Quantitative Comparison of Electrophoretic Techniques
Table 3: Performance Characteristics of Denaturing vs. Non-Denaturing Gels for Specific Applications
| Performance Metric | Denaturing Gels | Non-Denaturing Gels |
|---|---|---|
| Molecular Weight Determination Accuracy | High (R² >0.95 with standards) | Low to moderate (shape-dependent) |
| Transfer Efficiency in Western Blotting | 80-100% for 14-116kDa proteins [82] | Variable (structure-dependent) |
| Antibody Recognition Efficiency | High for linear epitopes | High for conformational epitopes |
| Protein Recovery for Sequencing | Good with optimized protocols | Variable due to aggregation potential |
| Inter-subunit Interaction Preservation | None (disrupted) | Maintained |
| Enzymatic Activity Preservation | None (destroyed) | Typically maintained |
| Resolution of Complex Mixtures | Excellent based on size | Moderate based on size and charge |
Application-Specific Recommendations
Based on comparative performance data, specific recommendations emerge for method selection:
Western Blotting: Denaturing gels are strongly recommended for most immunoblotting applications due to superior size-based identification, standardized transfer characteristics, and compatibility with most commercially available antibodies [32] [80]. Exceptions include instances where antibodies specifically recognize conformational epitopes absent in denatured proteins.
Protein Sequencing: Denaturing gels represent the method of choice for sequencing preparation, providing essential purity assessment and isolation of individual polypeptide chains free from non-covalent interactions [32]. The denatured state facilitates complete protease digestion for mass spectrometry and accessible N-termini for Edman degradation.
Alternative Applications: Non-denaturing gels remain preferable for enzyme activity assays, protein-protein interaction studies, oligomeric state determination, and investigations where biological function must be preserved post-electrophoresis [2] [79].
Essential Reagents and Research Solutions
Critical Reagents for Denaturing Gel Electrophoresis
Table 4: Essential Research Reagents for Denaturing Gel Experiments
| Reagent | Function | Application Notes |
|---|---|---|
| SDS (Sodium Dodecyl Sulfate) | Anionic detergent that denatures proteins and confers uniform negative charge | Critical for protein unfolding; typically used at 1-2% in buffers [32] |
| DTT (Dithiothreitol) or β-Mercaptoethanol | Reducing agents that break disulfide bonds | Essential for complete unfolding; DTT preferred for stronger reducing power [6] |
| Acrylamide/Bis-acrylamide | Cross-linking agents that form porous gel matrix | Concentration determines pore size and resolution range (typically 8-16%) [81] |
| Tris-Glycine Buffer System | Discontinuous buffer system for protein stacking and separation | Standard pH 8.3-8.8 for optimal separation; alternative buffers available [6] |
| Polyvinylidene Difluoride (PVDF) or Nitrocellulose Membranes | Solid supports for protein transfer in western blotting | PVDF offers higher binding capacity and durability for multiple reprobing [82] [80] |
| TEMED and Ammonium Persulfate (APS) | Gel polymerization catalysts | Fresh APS solutions ensure consistent gel formation [81] |
Denaturing gel electrophoresis represents the unequivocal method of choice for western blotting and protein sequencing applications where molecular weight determination, epitope accessibility, and structural simplification are paramount. The methodological validation presented in this guide demonstrates that the deliberate destruction of higher-order protein structures through SDS, reducing agents, and heat treatment generates the standardized linear polypeptides necessary for accurate size-based separation, efficient transfer, and comprehensive sequencing.
Researchers should implement denaturing protocols when experimental objectives include: (1) specific protein detection via immunoblotting, (2) assessment of protein purity and integrity, (3) molecular weight estimation, (4) preparation for protein sequencing, or (5) analysis of individual polypeptide chains within complex mixtures [32]. In contrast, non-denaturing approaches remain valuable for functional studies requiring preservation of biological activity, protein complex analysis, and investigation of native protein characteristics [2] [79].
The strategic selection between these complementary techniques ultimately depends on the specific research question, with denaturing methods providing analytical standardization and native methods maintaining physiological relevance. Within the broader thesis of electrophoretic technique comparison, denaturing gels establish their indispensable role in the biomolecular research pipeline through their ability to generate reproducible, interpretable data for protein identification and characterization.
In the realm of protein and nucleic acid research, gel electrophoresis stands as a fundamental technique for separating and analyzing macromolecules. Within this toolbox, a critical distinction exists between denaturing and non-denaturing (native) electrophoretic methods, each preserving or disrupting the native structure of analytes with profound implications for functional studies. While denaturing techniques like SDS-PAGE excel at determining molecular weight and establishing sample purity, they achieve this at the cost of destroying higher-order structure and biological activity [2] [32]. Native gel electrophoresis emerges as the indispensable technique for researchers focused on probing binding interactions, isolating functional complexes, and preserving enzymatic activity—applications where maintaining the native conformation is paramount [83] [79].
This guide provides a structured comparison of native and denaturing gel techniques, focusing on their specific applications in validation research. We present objective performance data, detailed methodologies, and practical frameworks to help researchers select the appropriate technique for studies requiring preservation of macromolecular structure and function.
Fundamental Principles: How Native and Denaturing Gels Work
Mechanism of Native Gel Electrophoresis
Native or non-denaturing polyacrylamide gel electrophoresis (PAGE) separates proteins based on a combination of their intrinsic charge, size, and three-dimensional shape under conditions that preserve their native conformation [32] [3]. In this approach, proteins are prepared and run in non-reducing, non-denaturing buffers without sodium dodecyl sulfate (SDS) or other denaturing agents [79]. The gel matrix creates a sieving effect, regulating protein movement according to size and shape, while the inherent net charge of the protein at the running buffer pH determines its direction and rate of migration [3]. Since no denaturants are used, subunit interactions within multimeric proteins are generally retained, providing information about quaternary structure [3]. Many proteins retain enzymatic activity following separation by native PAGE, making this technique ideal for functional studies [32].
Mechanism of Denaturing Gel Electrophoresis
In contrast, denaturing SDS-PAGE employs the anionic detergent SDS along with reducing agents (DTT or β-mercaptoethanol) and heat to completely unfold protein molecules [2] [79]. This process breaks disulfide bonds, disturbs higher-order structure, and confers a uniform negative charge to all proteins [32]. The resulting SDS-polypeptide complexes have essentially identical charge-to-mass ratios and shapes, enabling separation based almost exclusively on molecular mass [3]. Smaller proteins migrate more rapidly through the gel matrix, while larger ones are retarded, allowing for accurate molecular weight estimation [32]. However, this process destroys enzymatic activity, subunit interactions, and functional properties [84].
Table 1: Core Principles and Separation Mechanisms
| Feature | Native PAGE | Denaturing (SDS-)PAGE |
|---|---|---|
| Primary Separation Basis | Net charge, size, and shape [3] | Molecular mass (size) [3] |
| Sample Preparation | Non-denaturing, non-reducing buffer; no heat [79] | SDS, reducing agent (DTT/β-Me), and heat [79] |
| Protein Structure | Native conformation preserved (tertiary, quaternary) [83] | Denatured; complex structure destroyed [83] |
| Biological Activity | Often retained post-separation [3] | Destroyed [84] |
| Key Reagents | Tris-based running buffers (no SDS) [84] | SDS, reducing agents, Tris-based running buffers [84] |
Application Comparison: Binding Studies and Complex Isolation
The fundamental mechanistic differences between native and denaturing gels directly dictate their appropriate applications in research validation, particularly for binding studies and complex isolation.
Applications for Native Gels
Native gels are the technique of choice when the research objective involves maintaining structural integrity or biological function. Key applications include:
- Studying Protein Complexes & Quaternary Structure: Analyzing oligomeric states and subunit interactions, as native conditions preserve non-covalent bonds between subunits [32] [79].
- Enzyme Activity Isolation: Isolating enzymes with retention of catalytic function for downstream activity assays [2] [32].
- Binding Studies: Investigating protein-protein, protein-nucleic acid, or protein-ligand interactions by observing mobility shifts caused by complex formation [85].
- Analyzing Conformational Changes: Resolving different functional conformations of proteins or nucleic acids based on mobility differences [85].
Applications for Denaturing Gels
Denaturing gels are preferred for analytical tasks focused on primary structure and composition:
- Molecular Weight Determination: Estimating polypeptide size by comparing migration to standard markers [32] [79].
- Assessing Sample Purity & Integrity: Checking for protein degradation or contamination in a sample [2] [79].
- Western Blotting: Preparing samples for immunoblotting, where antibody recognition may require linear epitopes [2] [79].
- Separating Protein Complexes into Subunits: Resolving individual components of a complex based on their polypeptide molecular weights [79].
Table 2: Application-Based Selection Guide
| Research Goal | Recommended Technique | Rationale |
|---|---|---|
| Determine Aggregation State / Quaternary Structure | Native PAGE [32] [79] | Preserves non-covalent subunit interactions. |
| Isolate an Active Enzyme | Native PAGE [2] [32] | Maintains correct 3D structure required for activity. |
| Study Protein-Protein/Protein-Ligand Binding | Native PAGE [2] [85] | Mobility shift indicates complex formation; binding pocket remains intact. |
| Determine Polypeptide Molecular Weight | SDS-PAGE [32] [3] | Masks intrinsic charge and shape, making migration dependent on size. |
| Establish Purity of a Sample | SDS-PAGE [2] [79] | Cleaves complexes, revealing individual polypeptide components. |
| Prepare for Western Blotting/Protein Sequencing | SDS-PAGE [2] [79] | Denatures protein for efficient transfer and antibody/detector access. |
Diagram 1: Decision workflow for selecting between native and denaturing gel electrophoresis based on research objectives.
Experimental Data and Performance Comparison
Quantitative Comparison of Separation Performance
Recent methodological advances have sought to improve the resolution of native protein separations, which has traditionally lagged behind denaturing methods. The table below summarizes key performance metrics from published studies.
Table 3: Quantitative Performance Metrics of Gel Electrophoresis Methods
| Method | Separation Resolution | Protein Loading | Analysis Time | Key Advantages | Key Limitations |
|---|---|---|---|---|---|
| Traditional Native PAGE | Lower resolution, often smeared bands [86] | Microgram quantities [3] | 90-95 minutes [84] | Preserves activity and complexes [32] | Poor resolution and detection limits [86] |
| Microfluidic TG-tITP | Two-fold higher resolution than native PAGE [86] | 15,000-fold less than native PAGE [86] | Five-fold faster than native PAGE [86] | Wide mass range (6–464 kDa), high sensitivity [86] | Requires specialized equipment |
| SDS-PAGE | High resolution, sharp bands [86] | Microgram quantities [3] | ~45 minutes [84] | Excellent resolution, simple protocol [32] | Destroys native structure and function [84] |
| NSDS-PAGE | High resolution, comparable to SDS-PAGE [84] | 5-25 μg [84] | ~45 minutes [84] | High resolution with 98% metal retention [84] | Limited commercial availability |
Case Study: Metal Retention and Enzymatic Activity Preservation
A critical comparison of electrophoresis methods for metalloprotein analysis demonstrates the functional consequences of technique selection. In a study examining Zn²⁺-proteins, standard SDS-PAGE retained only 26% of bound Zn²⁺ and destroyed enzymatic activity in all nine model enzymes tested [84]. In contrast, Blue Native (BN)-PAGE preserved activity in all nine enzymes but offered lower separation resolution [84]. A modified method called Native SDS-PAGE (NSDS-PAGE) achieved a compromise, retaining 98% of bound Zn²⁺ and preserving activity in seven of the nine enzymes while maintaining high resolution separation comparable to SDS-PAGE [84].
Experimental Protocols for Binding and Complex Studies
Standard Protocol for Native PAGE of Protein Complexes
Principle: Separates protein complexes under non-denaturing conditions to preserve interactions and activity [32] [83].
Sample Preparation:
- Buffer: Use a non-denaturing sample buffer (e.g., 50 mM BisTris, 50 mM NaCl, 10% glycerol, pH 7.2) [84]. Avoid SDS, urea, DTT, or β-mercaptoethanol.
- Heating: Do not heat the samples [79].
- Loading: Mix protein sample with loading buffer and centrifuge briefly before loading.
Gel Preparation and Electrophoresis:
- Gel Casting: Prepare a polyacrylamide gel (e.g., 4-16% gradient Bis-Tris gel) without adding SDS to the monomer solution [84].
- Running Buffer: Use appropriate native running buffers. For BN-PAGE, this often includes a cathode buffer (50 mM BisTris, 50 mM Tricine, 0.02% Coomassie G-250, pH 6.8) and an anode buffer (50 mM BisTris, 50 mM Tricine, pH 6.8) [84].
- Electrophoresis Conditions: Run at constant voltage (e.g., 150V) at 4°C to minimize denaturation and proteolysis [3]. Run until the dye front reaches the bottom of the gel.
Post-Electrophoresis Analysis:
- Activity Staining: For enzymes, incubate gel in substrate solution to detect activity.
- Detection: Use sensitive stains like Coomassie Blue or silver stain. For fluorescently labeled proteins, image directly.
Diagram 2: Basic workflow for Native PAGE experiments to study protein complexes and binding.
Protocol for Nucleic Acid Binding Studies Using Native PAGE
Principle: Resolves different conformations of nucleic acids and their complexes with proteins or ligands based on stability and shape [85].
Sample Preparation:
- Folding: Incubate RNA/DNA in appropriate buffer with necessary cations (e.g., Mg²⁺ for ribozyme folding) to achieve native conformation.
- Binding: Incubate nucleic acid with protein or ligand of interest to form complexes.
Gel Electrophoresis:
- Gel Matrix: Cast a polyacrylamide gel (concentration depends on nucleic acid size) in a suitable running buffer.
- Pre-Run: Pre-run the gel to reach stable temperature and ion conditions.
- Loading and Run: Load samples without denaturing dyes that disrupt structure. Run at constant power with temperature control (e.g., using a circulating water bath) to maintain stable conditions [85].
Detection:
- Staining: Use nucleic acid stains like ethidium bromide, SYBR Gold, or autoradiography for radiolabeled nucleic acids.
Protocol for Semi-Native PAGE Screening of Protein-Metallocomplex Binding
Principle: A hybrid approach where non-denatured protein samples are loaded on a gel containing SDS, leading to separation based on differences in structural stability and binding [87].
Sample Preparation:
- Incubation: Pre-incubate the native protein with the metallocomplex of interest.
- Buffer: Mix the complex with a standard non-denaturing loading buffer (no reducing agents or heat).
Gel Electrophoresis:
- Gel Matrix: Use a standard SDS-PAGE gel for the separation.
- Running Conditions: Use standard SDS-PAGE running buffer but run the gel at 4°C to slow denaturation.
- Comparison: Run control samples of protein alone and complex alone on the same gel.
Analysis:
- Band Shift: Analyze for band shifts or stabilization of protein against denaturation by SDS as evidence of binding [87].
Research Reagent Solutions
Table 4: Essential Reagents for Native Gel Electrophoresis
| Reagent/Category | Function in Native PAGE | Examples & Notes |
|---|---|---|
| Non-Denaturing Buffers | Maintain pH without disrupting protein structure; crucial for preserving activity. | BisTris, HEPES, Tris-Glycine (without SDS) [84] [3] |
| Polyacrylamide Matrix | Forms the sieving matrix; pore size determines separation range. | 4-16% gradient gels for broad size range [84]; higher % for smaller proteins. |
| Staining Dyes (Coomassie) | Visualize separated proteins; some versions compatible with activity assays. | Coomassie G-250 (in BN-PAGE cathode buffer) [84] |
| Molecular Weight Standards | Provide size estimation under native conditions (note: migration is not based on mass alone). | NativeMark Unstained Protein Standard [84] |
| Temperature Control System | Maintains low temperature during run to prevent denaturation. | Circulating water bath or cold room [3] |
| Activity Stain Components | Directly detect enzymatic function after separation. | Specific substrates for target enzymes (e.g., for phosphatases, dehydrogenases) |
The choice between native and denaturing gel electrophoresis is fundamental to experimental design in biochemistry and molecular biology. For research validation focused on binding studies and complex isolation, native gels provide the indispensable capability of preserving higher-order structure and biological function. While denaturing SDS-PAGE remains the gold standard for determining molecular weight and assessing purity, it achieves this at the cost of destroying the very interactions that define macromolecular function.
Emerging techniques like NSDS-PAGE and microfluidic thermal gel tITP offer promising avenues to bridge the gap between the high resolution of denaturing methods and the functional preservation of native approaches. By selecting the appropriate electrophoretic method based on clear research objectives—using the decision frameworks and comparative data provided in this guide—researchers can ensure their validation strategies effectively address the structural and functional questions central to their scientific inquiry.
Candida species are among the most common causes of fungal infections, leading to a spectrum of life-threatening and non-life-threatening diseases. The accurate identification of Candida species represents an essential prerequisite for improved therapeutic strategies, as significant attributes including drug resistance and virulence differ considerably among species [12] [88]. Conventional identification methods based on phenotypic characteristics are time-consuming, often requiring up to 30 days for definitive biochemical identification, and demonstrate limited sensitivity [12]. Molecular approaches have emerged as viable alternatives for the early diagnosis of invasive candidiasis, offering enhanced speed and reliability.
Among these molecular techniques, PCR-based denaturing gradient gel electrophoresis (DGGE) and temporal temperature gradient gel electrophoresis (TTGE) provide powerful tools for studying the community structure of microorganisms. These methods enable the simultaneous identification of multiple yeast species and yield reliable results rapidly, presenting significant advantages over culture-dependent approaches [12]. This case study conducts a comparative analysis of DGGE and TTGE methodologies for discriminating clinically relevant Candida species, evaluating their performance, experimental requirements, and practical applications within the broader context of denaturing versus non-denaturing electrophoresis techniques.
Theoretical Background: Denaturing vs. Non-Denaturing Electrophoresis
Electrophoresis techniques separate macromolecules based on their physical properties as they migrate through a gel matrix under an electrical current. The fundamental distinction between denaturing and non-denaturing methods lies in the treatment of the sample and the preservation of molecular structure.
Denaturing Electrophoresis
Denaturing gel electrophoresis techniques, including DGGE and TTGE, disrupt the native structure of DNA molecules using chemical agents (urea and formamide) or elevated temperatures. This process separates DNA fragments of identical length but with different base-pair sequences based on their decreased electrophoretic mobility when partially melted under denaturing conditions [12]. In DGGE, separation occurs in a polyacrylamide gel containing a linear gradient of chemical denaturants, while TTGE employs a linear temperature gradient instead [12]. These methods are particularly valuable for detecting sequence variations and identifying different microbial species without the requirement for culturing, thereby avoiding culture bias and the potential loss of minor species [12].
Non-Denaturing Electrophoresis
In contrast, non-denaturing gel electrophoresis preserves the native structure and biological activity of macromolecules. Separation occurs based on a combination of factors including size, shape, and intrinsic charge [32] [2]. While non-denaturing approaches are simpler and more cost-effective to perform, they are generally less effective for discriminating between closely related species based on subtle genetic differences, as they cannot distinguish molecules solely by sequence variation once secondary structure is maintained [61] [2].
Table 1: Core Principles of Denaturing and Non-Denaturing Electrophoresis
| Feature | Denaturing Electrophoresis (DGGE/TTGE) | Non-Denaturing Electrophoresis |
|---|---|---|
| Structural Integrity | Disrupts native structure | Preserves native structure |
| Separation Basis | Sequence-dependent melting behavior | Size, shape, and intrinsic charge |
| Biological Activity | Not preserved | Often preserved |
| Key Applications | Microbial identification, mutation detection | Enzyme isolation, protein complex analysis |
| Relative Complexity | Higher | Lower |
Experimental Design and Methodologies
Candida Strains and DNA Extraction
The comparative analysis evaluated five standard Candida species: C. albicans (CCUG 32723), C. glabrata (CCUG 35267), C. tropicalis (CCUG 34274), C. orthopsilosis (CCUG 20503), and C. parapsilosis (ATTC 22019), alongside clinical isolates obtained from vaginal tracts [12]. All strains were cultured on Potato Dextrose Agar (PDA) medium for 24 hours at 36°C. Genomic DNA was subsequently extracted using the phenol-chloroform method following established protocols for yeast nucleic acid isolation [12] [88].
PCR Amplification Conditions
Two primer sets targeting different genomic regions were evaluated for their discriminatory power:
- ITS3-GC/ITS4: This primer set targets the ITS2 region, generating amplicons of approximately 300-400 base pairs. A 40-base pair GC-clamp was attached to the 5' end of the forward primer to stabilize melting behavior [12].
- NL1-GC/LS2: This primer set targets the D1 domain of the 26-28S rRNA gene, producing shorter amplicons of approximately 250 base pairs. A 30-base pair GC-clamp was attached to the 5' end of the NL1 primer [12].
PCR reactions were performed in a PeqSTAR thermocycler with specific cycling conditions optimized for each primer set. Reaction mixtures included PCR buffer, MgCl₂, dNTPs, primers, Taq DNA polymerase, and approximately 20 ng of template DNA [12].
DGGE and TTGE Conditions
The DCode universal mutation detection system (Bio-Rad) was utilized for both DGGE and TTGE analyses [12].
DGGE was performed using 8% polyacrylamide gels. For ITS3-GC/ITS4 amplicons, a 30-60% denaturing gradient (100% denaturant = 7 M urea + 40% formamide) was applied, and electrophoresis was conducted at 55 V for 16 hours at 56°C. For NL1-GC/LS2 amplicons, a 30-45% denaturing gradient was used, with electrophoresis at 130 V for 4.5 hours at 60°C [12].
TTGE employed 8% polyacrylamide gels with constant voltage (65 V). For the ITS2 region, gels contained 6 M urea and were run with a temperature gradient from 56°C to 66°C over 14 hours 17 minutes. For the D1 region, gels contained 7 M urea with a temperature gradient from 51.5°C to 62.2°C over 10 hours 42 minutes [12].
Following electrophoresis, gels were stained with ethidium bromide and visualized under UV transillumination [12].
Results and Comparative Analysis
Primer Set Performance
The selection of primer sets proved critical for successful species discrimination. The ITS3-GC/ITS4 primer set yielded non-specific PCR products that persisted despite optimization attempts involving cycle number, annealing temperature, primer concentration, and template amount. When these amplicons were subjected to DGGE and TTGE analysis, multiple bands appeared in fingerprints derived from single Candida species, and some species remained indistinguishable [12].
In contrast, the NL1-GC/LS2 primer set generated species-specific amplicons that were well-distinguished in both DGGE and TTGE profiles. All five Candida species were successfully discriminated using this primer set, which targets the D1 domain of the 26-28S rRNA gene [12]. This finding is consistent with subsequent research demonstrating that DGGE with NL1-GC/LS2 primers effectively discriminates various Candida species, including C. intermedia, C. boidinii, C. tropicalis, C. mengyuniae, and C. maltosa, with each species producing a distinct band at a specific position in the DGGE profile [89].
DGGE vs. TTGE Performance Comparison
Both DGGE and TTGE techniques successfully distinguished all five Candida species when using the NL1-GC/LS2 primer set. Comparison of the profiles obtained from NL1-GC/LS2 amplicons revealed identical patterns between the two methods [12] [90].
Table 2: Direct Comparison of DGGE and TTGE Performance Characteristics
| Parameter | DGGE | TTGE |
|---|---|---|
| Separation Principle | Chemical denaturant gradient (urea/formamide) | Temperature gradient |
| Gel Preparation | More complex (requires gradient former) | Simpler (uniform denaturant concentration) |
| Run Time | 4.5-16 hours (target-dependent) | 10-14 hours (target-dependent) |
| Discriminatory Power | High (all 5 species distinguished) | High (all 5 species distinguished) |
| Band Pattern | Identical to TTGE with same primer set | Identical to DGGE with same primer set |
| Operational Complexity | Higher | Lower |
| Cost Considerations | Higher (chemical denaturants) | Lower |
| Recommended Application | Effective but not preferred | Recommended for routine use |
Practical Considerations and Recommendations
Despite demonstrating equivalent discriminatory power for Candida species identification, TTGE is recommended over DGGE for routine applications due to its easier performance and lower operational costs [12] [90]. The simplified gel preparation process without the requirement for chemical gradient formation, combined with reduced reagent expenses, makes TTGE a more practical choice for clinical and research laboratories.
The broader applicability of this DGGE/TTGE approach has been validated across diverse Candida species isolated from natural habitats, confirming that the technique provides rapid discrimination of yeast strains belonging to the same genera [89] [91].
The Scientist's Toolkit: Essential Research Reagents
Successful implementation of DGGE and TTGE for Candida identification requires specific research reagents and laboratory materials. The following table outlines essential components and their functions in the experimental workflow.
Table 3: Essential Research Reagents for DGGE/TTGE Analysis of Candida
| Reagent/Material | Function/Application | Specific Examples |
|---|---|---|
| Culture Medium | Supports Candida growth and proliferation | Potato Dextrose Agar (PDA) [12] |
| DNA Extraction Reagents | Isolate genomic DNA from yeast cells | Phenol-chloroform method [12] |
| PCR Components | Amplify target DNA regions | Taq polymerase, dNTPs, MgCl₂, PCR buffer [12] |
| Specific Primers | Target specific genomic regions for amplification | ITS3-GC/ITS4 (ITS2 region), NL1-GC/LS2 (D1 domain) [12] [89] |
| GC-Clamp | Prevents complete strand separation during electrophoresis | 30-40 bp GC-rich sequence attached to 5' end of primer [12] |
| Gel Matrix Components | Form the separation medium | Acrylamide-bisacrylamide (37.5:1 ratio) [12] |
| Denaturing Agents | Create melting conditions for separation | Urea (6-7 M), formamide (40% v/v) [12] |
| Electrophoresis Buffer | Conduct current and maintain pH | Tris-Acetate-EDTA (TAE) 1X [12] |
| Staining Solution | Visualize separated DNA fragments | Ethidium bromide [12] |
This comparative analysis demonstrates that both DGGE and TTGE represent effective molecular tools for discriminating Candida species, offering significant advantages over conventional identification methods in terms of speed, sensitivity, and the ability to detect multiple species simultaneously. The critical importance of primer selection is highlighted by the superior performance of the NL1-GC/LS2 primer set targeting the D1 domain of the 26-28S rRNA gene compared to the ITS3-GC/ITS4 primer set.
While both DGGE and TTGE generate identical band patterns and exhibit equivalent discriminatory power for Candida species, TTGE emerges as the recommended technique for most applications due to its easier implementation, simplified protocol, and lower operational costs. These findings contribute valuable insights to the broader field of denaturing electrophoresis techniques, illustrating how methodological refinements can enhance practical utility in clinical mycology and pharmaceutical development settings.
Future directions for research include validating these techniques directly on clinical samples without prior cultivation, expanding the range of detectable fungal pathogens, and integrating these approaches with next-generation sequencing technologies for comprehensive microbiome analysis.
Gel electrophoresis remains a cornerstone technique in molecular biology and biotechnology, providing a simple, cost-effective, and rapid method for separating biomolecules such as DNA, RNA, and proteins. The core principle involves applying an electrical current to a gel matrix, causing charged molecules to migrate and separate based on physical properties like size, charge, or shape [32]. For decades, the fundamental methodologies of denaturing gel electrophoresis, which disrupts the native structure of biomolecules to separate them primarily by size, and native gel electrophoresis (non-denaturing), which preserves the higher-order structure and function of molecules, have served as indispensable tools for researchers [2] [32]. However, the traditional workflow of manual gel casting, sample processing, and—most notably—image analysis has remained largely unchanged, creating a significant bottleneck in an era of high-throughput science.
Today, the field is undergoing a profound transformation driven by the converging trends of laboratory automation and artificial intelligence (AI). The electrophoresis devices market, poised to grow from USD 1.5 billion in 2024 to USD 2.9 billion by 2033, is being shaped by advancements in automation, the adoption of high-throughput analysis, and a growing emphasis on precision diagnostics [92]. Simultaneously, AI is beginning to revolutionize data processing aspects that have relied on manual intervention or simplistic algorithms for decades. This article examines the evolving role of both denaturing and non-denaturing electrophoresis techniques within this new technological paradigm, comparing their performance and applications as integrated with automated systems and AI-driven analysis.
Fundamental Techniques: Denaturing vs. Non-Denaturing Electrophoresis
The choice between denaturing and non-denaturing gel electrophoresis is fundamental to experimental design, dictating the type of information obtained about the sample. The table below summarizes the core characteristics and applications of each technique.
Table 1: Core Characteristics and Applications of Denaturing vs. Non-Denaturing Electrophoresis
| Feature | Denaturing Electrophoresis | Non-Denaturing Electrophoresis |
|---|---|---|
| Principle | Separates biomolecules (proteins, nucleic acids) in a unfolded, linear state based primarily on molecular weight [2] [32]. | Separates biomolecules in their native, folded state based on size, shape, and intrinsic charge [2] [32]. |
| Key Reagents | SDS (Sodium Dodecyl Sulfate): Anionic detergent that denatures proteins and confers uniform negative charge [32].Urea/DMSO: Common denaturants for nucleic acids [2].Reducing Agents (DTT/β-mercaptoethanol): Break disulfide bonds in proteins [32]. | Native Buffers: Maintain physiological pH and salt conditions to preserve structure [32].No SDS or Urea. |
| Separation Basis | Molecular weight/mass [32]. | Molecular weight, overall bulk (cross-sectional area), and net charge [2] [32]. |
| Primary Applications | - Estimating molecular weight [32].- Western blotting [2].- Establishing sample purity and integrity [2] [32].- Protein sequencing preparation [2] [32]. | - Analysis of protein complexes and quaternary structure [2] [32].- Studying protein-protein/DNA interactions [2].- Isolating enzymes and isozymes while preserving activity [32].- Determining aggregation state [32]. |
| Key Consideration | Destroys native structure and function; not suitable for studying activity or complexes [32]. | Not suitable for accurate molecular weight determination; migration can be toward either electrode based on net charge [32]. |
The Automated and AI-Powered Electrophoresis Workflow
The integration of automation and AI is creating a new, streamlined workflow for electrophoresis, from sample preparation to data interpretation. The following diagram illustrates this modernized pipeline, highlighting the points where technology enhances traditional methods.
The Scientist's Toolkit: Key Reagent Solutions
The modern electrophoresis laboratory, whether performing denaturing or non-denaturing techniques, relies on a set of essential reagents and tools. The following table details these key components, many of which are now optimized for use with automated systems.
Table 2: Essential Research Reagent Solutions for Modern Electrophoresis
| Reagent/Material | Function | Application Notes |
|---|---|---|
| Precast Gels | Ready-to-use gel cassettes with consistent matrix quality [93]. | Available in various concentrations (e.g., 5%-20% for nucleic acids); crucial for reproducibility and integration with automated systems [93]. |
| Protein Broad Range Kits (e.g., Agilent P240 Kit) | Provide standardized reagents and capillaries for automated protein sizing (10-240 kDa) on systems like the ProteoAnalyzer [94]. | Enable dependable denaturing protein electrophoresis with high reproducibility, ideal for biopharmaceutical analysis [94]. |
| Anionic Detergents (SDS) | Denatures proteins and confers a uniform negative charge, making separation dependent solely on mass [32]. | Core component of SDS-PAGE; requires precise concentration for reliable results. |
| Reducing Agents (DTT, β-mercaptoethanol) | Breaks disulfide bonds in proteins to ensure complete unfolding [32]. | Essential for reduced denaturing protein analysis; must be fresh for efficacy. |
| Nucleic Acid Denaturants (Urea, DMSO, Glyoxal) | Disrupts hydrogen bonding in DNA/RNA to prevent secondary structure formation [2]. | Allows separation of nucleic acids by length rather than conformation. |
| Native Buffers | Maintain a non-denaturing pH and ionic environment to preserve biomolecular structure and activity [32]. | Composition is critical for successful native PAGE; varies by application. |
| AI Analysis Software (e.g., GelGenie) | Open-source application using trained U-Net models to automatically identify bands through pixel segmentation [95]. | Dramatically reduces analysis time from hours to seconds; improves consistency and accuracy over manual methods [95]. |
Experimental Comparison: Protocol and Performance Data
To objectively evaluate the performance of denaturing versus non-denaturing electrophoresis in a modern context, we can analyze experimental data from the literature, focusing on an AI-powered quantification study.
Detailed Experimental Protocol
A 2025 study in Nature Communications established a robust protocol for evaluating gel quantification accuracy using an AI tool called GelGenie [95]. The methodology was as follows:
- Dataset Curation: A diverse set of 30 gel images was generated, featuring standard commercial DNA ladders (from ThermoFisher or New England Biolabs) under both ideal (sharp, distinct bands) and sub-optimal conditions (faint, blurry, overlapping bands) to simulate real-world variability [95].
- Manual Segmentation: All bands in the images were painstakingly manually segmented to create a "ground truth" dataset for training and validation [95].
- Comparative Analysis:
- The AI (GelGenie) method used a U-Net model to perform segmentation, classifying each pixel in the image as either 'band' or 'background' [95].
- The Traditional method involved a standard band search and volume quantification using the widely adopted GelAnalyzer software, which relies on generating 1D intensity profiles from each lane [95].
- Quantitative Evaluation: To simulate a real quantitation scenario, a hold-out test was performed. For each lane, a linear regression was fit between the known mass values and measured volumes of a subset of bands. This model was then used to predict the mass of the held-out bands, and the percentage error was calculated. This process was repeated numerous times to generate robust error statistics [95].
Performance Results and Data Comparison
The core objective of the experiment was to determine the quantitation accuracy of the AI segmentation method compared to the traditional 1D profile method. The results are summarized in the table below.
Table 3: Quantitative Comparison of DNA Mass Estimation Error: AI vs. Traditional Analysis
| Analysis Method | DNA Ladder | Mean Quantitation Error | Key Performance Insight |
|---|---|---|---|
| AI Segmentation (GelGenie) | ThermoFisher | Statistically equivalent to traditional method [95]. | Accuracy matches trusted methods while offering full automation, speed (seconds), and consistency [95]. |
| Traditional (GelAnalyzer w/ Background Correction) | ThermoFisher | Statistically equivalent to AI method [95]. | Can achieve good accuracy but is prone to user bias, manual intervention, and is time-consuming [95]. |
| AI Segmentation (GelGenie) | New England Biolabs (NEB) | Statistically equivalent to traditional method [95]. | Demonstrates robust performance across different product standards and gel conditions [95]. |
| Traditional (GelAnalyzer w/ Background Correction) | New England Biolabs (NEB) | Statistically equivalent to AI method only with background correction [95]. | Highlighted the necessity of additional data processing steps (background correction) to match AI's inherent accuracy [95]. |
A key finding was that the AI-based system generated results that quantitatively matched those originally reported by the authors of the external datasets, validating its robustness and accuracy for diverse laboratory conditions [95]. The high variance in error observed across all methods was attributed to real-world experimental variations like pipetting errors and sample diffusion, rather than systematic flaws in the analysis techniques themselves [95].
The Future Outlook: Integration and Intelligent Analysis
The trajectory of electrophoresis is firmly set toward deeper integration of automation and AI. Market analyses forecast a shift from 2020-2024, which was characterized by automated and high-resolution systems, toward the 2025-2035 period, which will be defined by AI-driven electrophoresis platforms and the integration of nanopore sequencing for enhanced precision and data analysis [96].
A major trend is the move toward miniaturization and portability. The development of "lab-on-a-chip" electrophoresis systems, driven by microfluidic technologies, aims to make electrophoresis-based testing feasible for point-of-care diagnostics, thereby expanding its reach beyond central laboratories [96]. Furthermore, the industry is increasingly focusing on sustainability. The future will see a greater adoption of eco-friendly gel alternatives and biodegradable materials to mitigate the environmental impact of traditional plastic cassettes and chemical waste [96].
Finally, the synergy between automated hardware and intelligent software will continue to tighten. Automated capillary electrophoresis systems, like the Agilent ProteoAnalyzer, are already streamlining protein analysis workflows for characterization in biopharmaceuticals [94]. When the throughput and reproducibility of such automated instruments are combined with the analytical power of AI-based analysis tools like GelGenie, the result is a complete, end-to-end solution that minimizes manual intervention, maximizes reproducibility, and unlocks new levels of efficiency and insight in molecular analysis.
Conclusion
The choice between denaturing and non-denaturing electrophoresis is not a matter of one technique being superior, but of selecting the right tool for the specific biological question. Denaturing techniques are unparalleled for determining molecular weight and establishing sample purity, forming the backbone of proteomic and genomic QC. In contrast, non-denaturing methods provide a unique window into the functional, native state of biomolecules, enabling the study of complexes, interactions, and enzymatic activity. As technological advancements in microfluidics, automation, and AI-driven analysis continue to evolve, both foundational techniques will maintain their critical relevance. Their synergy with modern omics technologies ensures that gel electrophoresis will remain an indispensable, cost-effective, and highly versatile methodology in biomedical research, clinical diagnostics, and therapeutic development for the foreseeable future.
References
- 1. What is the difference between denaturing and non- ... [https://www.aatbio.com/resources/faq-frequently-asked-questions/What-is-the-difference-between-denaturing-and-non-denaturing-native-gels]
- 2. Native Versus Denaturing Gels [https://bitesizebio.com/27332/native-versus-denaturing-gels/]
- 3. Overview of Protein Electrophoresis [https://www.thermofisher.com/us/en/home/life-science/protein-biology/protein-biology-learning-center/protein-biology-resource-library/pierce-protein-methods/overview-electrophoresis.html]
- 4. The Nature of Denaturing (Protein Gels, that is!) [https://bitesizebio.com/20794/the-nature-of-denaturing-protein-gels-that-is/]
- 5. Denaturing Urea Polyacrylamide Gel Electrophoresis ... [https://pmc.ncbi.nlm.nih.gov/articles/PMC3329804/]
- 6. One-Dimensional SDS and Non-Denaturing Gel ... [https://www.thermofisher.com/us/en/home/references/protocols/proteins-expression-isolation-and-analysis/sds-page-protocol/one-dimensional-sds-and-non-denaturing-gel-electrophoresis.html]
- 7. Discrete mobility of single-stranded DNA in non-denaturing ... [https://pmc.ncbi.nlm.nih.gov/articles/PMC102567/]
- 8. Native Polyacrylamide Gel Electrophoresis - an overview | ScienceDirect Topics [https://www.sciencedirect.com/topics/medicine-and-dentistry/native-polyacrylamide-gel-electrophoresis]
- 9. Gel electrophoresis - Wikipedia [https://en.wikipedia.org/wiki/Gel_electrophoresis]
- 10. Water for Nucleic Acid Gel Electrophoresis [https://www.sigmaaldrich.com/US/en/technical-documents/technical-article/genomics/nucleic-acid-gel-electrophoresis/water-nucleic-acid-gel-electrophoresis?srsltid=AfmBOoqZkmC1DILe2_o73sAKgj7SObYAlfjm7oS9ZPM7xbUiAlWNOxkz]
- 11. Application of Denaturing Gradient Gel Electrophoresis ... [https://pmc.ncbi.nlm.nih.gov/articles/PMC92965/]
- 12. Comparative Analysis of Denaturing Gradient Gel ... [https://pmc.ncbi.nlm.nih.gov/articles/PMC4639945/]
- 13. [PDF] Comparison of denaturing and non ... [https://www.semanticscholar.org/paper/Comparison-of-denaturing-and-non-denaturing-gel-for-Lodhi-Lodhi/5281b97276ce0b5733dc94ee19ef1a46c6dd0c5f]
- 14. Analysis of RNA Folding by Native Polyacrylamide Gel ... [https://www.sciencedirect.com/science/chapter/bookseries/abs/pii/S0076687909690091]
- 15. RNA G-quadruplex structure targeting and imaging [https://pmc.ncbi.nlm.nih.gov/articles/PMC12265945/]
- 16. Activation of enzymatic catalysis via nucleic acid ... [https://www.nature.com/articles/s41467-025-64636-z]
- 17. High-Precision Genotyping by Denaturing Capillary ... [https://pmc.ncbi.nlm.nih.gov/articles/PMC310688/]
- 18. A Simplified Electrophoresis Method for Analyses of High ... [https://www.sciencedirect.com/science/article/pii/S1016847823109630]
- 19. Characterizing ssRNA and dsRNA electrophoretic behavior [https://pubs.rsc.org/en/content/articlehtml/2025/an/d5an00381d]
- 20. Electrophoresis [https://pubmed.ncbi.nlm.nih.gov/36251838/]
- 21. A new paradigm for optimized experimental design in cIEF ... [https://www.nature.com/articles/s41598-024-79108-5]
- 22. Effect of the operational parameters on the electromigration ... [https://www.sciencedirect.com/science/article/pii/S0039914025000876]
- 23. Choosing Between Agarose and Polyacrylamide Gels [https://www.labx.com/resources/choosing-between-agarose-and-polyacrylamide-gels-a-comparative-guide/5537]
- 24. Agarose vs Polyacrylamide: A Comparative Analysis [https://www.assaygenie.com/blog/agarose-vs-polyacrylamide?srsltid=AfmBOooUDkLf_DAGIfKmMhFrFy2Zt-tM3M4PmXNC8M1KMB0tekRFKD-z]
- 25. Trends development and applications on electrophoresis ... [https://www.sciencedirect.com/science/article/abs/pii/S0039914025005193]
- 26. Electrophoresis - StatPearls - NCBI Bookshelf - NIH [https://www.ncbi.nlm.nih.gov/books/NBK585057/]
- 27. Agarose Gel Electrophoresis: Principle, Parts, Steps, Uses [https://microbenotes.com/agarose-gel-electrophoresis/]
- 28. Gel Electrophoresis 101: How to Choose Between Agarose ... [https://synapse.patsnap.com/article/gel-electrophoresis-101-how-to-choose-between-agarose-and-polyacrylamide]
- 29. Deciphering food proteins: The applications of SDS-PAGE ... [https://www.sciencedirect.com/science/article/abs/pii/S2212429225003025]
- 30. Dissolvable Polyacrylamide Gel Electrophoresis-Enabled ... [https://pubmed.ncbi.nlm.nih.gov/40879182/]
- 31. Comparing SDS-PAGE and CE-SDS for Antibody Purity ... [https://www.bioprocessintl.com/qa-qc/comparing-sds-page-and-ce-sds-for-antibody-purity-analysis]
- 32. Should I Use A Native Or Denaturing Gel? [https://info.gbiosciences.com/blog/should-i-use-a-native-or-denaturing-gel]
- 33. Denaturing Gel Electrophoresis - an overview [https://www.sciencedirect.com/topics/chemistry/denaturing-gel-electrophoresis]
- 34. Novex Tris-Glycine Gels [https://www.thermofisher.com/us/en/home/life-science/protein-biology/protein-gel-electrophoresis/protein-gels/novex-tris-glycine-gels.html]
- 35. NuPAGE Bis-Tris and Bolt Bis-Tris Plus Gels [https://www.thermofisher.com/us/en/home/life-science/protein-biology/protein-gel-electrophoresis/protein-gels/nupage-bis-tris-gels.html]
- 36. Transition From Old to New Novex Tris-Glycine Gel Format [https://www.thermofisher.com/us/en/home/life-science/protein-biology/protein-gel-electrophoresis/protein-gels/novex-tris-glycine-gels/transition-old-new-novex-tris-glycine-gel-format.html]
- 37. Differences between SDS PAGE and Native PAGE [https://www.geeksforgeeks.org/biology/differences-between-sds-page-and-native-page/]
- 38. How Is Native PAGE Different from SDS-PAGE? [https://synapse.patsnap.com/article/how-is-native-page-different-from-sds-page]
- 39. Determination of oligomeric states of proteins via dual- ... [https://pmc.ncbi.nlm.nih.gov/articles/PMC9584609/]
- 40. Determination of oligomeric states of proteins via dual- ... [https://elifesciences.org/articles/76631]
- 41. How to know the oligomeric state of a protein? [https://www.fidabio.com/blogs/how-to-know-the-oligomeric-state-of-a-biomolecule-or-a-particle]
- 42. Enzyme Assay Analysis: What Are My Method Choices? [https://www.thermofisher.com/blog/analyteguru/enzyme-assay-analysis-what-are-my-method-choices/]
- 43. RNA Electrophoresis | Thermo Fisher Scientific - ES [https://www.thermofisher.com/us/en/home/life-science/dna-rna-purification-analysis/nucleic-acid-gel-electrophoresis/rna-electrophoresis.html]
- 44. Nondenaturing Polyacrylamide Gel Electrophoresis ... [https://www.sciencedirect.com/science/article/abs/pii/B9780121647179500325]
- 45. Temperature gradient gel electrophoresis [https://en.wikipedia.org/wiki/Temperature_gradient_gel_electrophoresis]
- 46. Denaturing gradient gel electrophoresis (DGGE) [https://pubmed.ncbi.nlm.nih.gov/23913290/]
- 47. Denaturing Gradient Gel Electrophoresis Approach for ... [https://pmc.ncbi.nlm.nih.gov/articles/PMC11120850/]
- 48. Application of denaturing gradient gel electrophoresis ... [https://pubmed.ncbi.nlm.nih.gov/9602286/]
- 49. Denaturing Gradient Gel Electrophoresis (DGGE) as a ... [https://journals.plos.org/plosone/article?id=10.1371/journal.pone.0037353]
- 50. Capabilities and limitations of DGGE for the analysis ... [https://pmc.ncbi.nlm.nih.gov/articles/PMC5635167/]
- 51. Evaluation of denaturing gradient gel electrophoresis ... [https://www.sciencedirect.com/science/article/abs/pii/S0167701219300995]
- 52. Denaturing Gradient Gel Electrophoresis Approach for ... [https://www.mdpi.com/2310-2861/10/5/339]
- 53. Electrophoresis Market 2025 Forecast to 2032 [https://www.24chemicalresearch.com/reports/247278/global-electrophoresis-forecast-market]
- 54. Capillary Electrophoresis Market Size, Trends & Forecast, ... [https://www.coherentmarketinsights.com/industry-reports/capillary-electrophoresis-market]
- 55. Electrophoresis Market Size and Forecast 2025 to 2034 [https://www.precedenceresearch.com/electrophoresis-market]
- 56. Electrophoresis Instrumentation Market Environmental ... [https://www.linkedin.com/pulse/electrophoresis-instrumentation-market-environmental-nsgte]
- 57. Top Electrophoresis Technology Companies & How to ... [https://www.linkedin.com/pulse/top-electrophoresis-technology-companies-how-compare-4vzwe/]
- 58. Nucleic Acid Gel Electrophoresis Troubleshooting [https://www.thermofisher.com/us/en/home/life-science/cloning/cloning-learning-center/invitrogen-school-of-molecular-biology/na-electrophoresis-education/na-electrophoresis-troubleshooting.html]
- 59. Troubleshooting DNA Ladders [https://www.goldbio.com/blogs/articles/troubleshooting-dna-ladders?srsltid=AfmBOoo9XXbJMkFoOVuS24jm5fvYhr7Xk6tGg6wbM_yMcR2yrEHPjUV6]
- 60. Troubleshooting Common Electrophoresis Problems and ... [https://www.labx.com/resources/troubleshooting-common-electrophoresis-problems-and-artifacts/5539]
- 61. Denaturing and non-denaturing gel electrophoresis as ... [https://pubmed.ncbi.nlm.nih.gov/7537311/]
- 62. How to Manage Heat Production During Gel ... [https://eureka.patsnap.com/report-how-to-manage-heat-production-during-gel-electrophoresis]
- 63. Salt effects in capillary zone electrophoresis [https://www.sciencedirect.com/science/article/abs/pii/S0021967398001897]
- 64. Steps in Nucleic Acid Gel Electrophoresis [https://www.thermofisher.com/us/en/home/life-science/cloning/cloning-learning-center/invitrogen-school-of-molecular-biology/na-electrophoresis-education/na-electrophoresis-workflow.html]
- 65. Eight Tips to Improve Gel Electrophoresis Results [https://www.thermofisher.com/us/en/home/brands/thermo-scientific/molecular-biology/molecular-biology-learning-center/molecular-biology-resource-library/spotlight-articles/8-DNA-ladder-tips.html]
- 66. Optimizing Gel Electrophoresis: Best Practices for Sample ... [https://www.gelepchina.com/news/optimizing-gel-electrophoresis-best-practices-for-sample-volume-voltage-and-timing/]
- 67. Troubleshooting Nucleic Acid Gel Electrophoresis—Solved in ... [https://www.yeasenbio.com/blogs/molecular-biology/troubleshooting-nucleic-acid-gel-electrophoresis-solved-in-one-go]
- 68. Common artifacts and mistakes made in electrophoresis [https://pmc.ncbi.nlm.nih.gov/articles/PMC7295095/]
- 69. Protocols Agarose Gel Electrophoresis [https://www.addgene.org/protocols/gel-electrophoresis/]
- 70. Troubleshooting DNA Ladders [https://www.goldbio.com/blogs/articles/troubleshooting-dna-ladders?srsltid=AfmBOopEIYeMuRL1YioaR9hs45jm5Z3IHt3v38inn7R22g7INvU7N2_I]
- 71. Preparing High-Quality Samples for Electrophoresis: Best ... [https://www.labx.com/resources/preparing-high-quality-samples-for-electrophoresis-best-practices/5550]
- 72. Comparing Efficiency of Lysis Buffer Solutions and Sample ... [https://www.mdpi.com/1420-3049/27/11/3390]
- 73. Automated proteomic sample preparation [https://pmc.ncbi.nlm.nih.gov/articles/PMC10339360/]
- 74. Protein Sample Preparation for Mass Spectrometry [https://www.thermofisher.com/us/en/home/life-science/protein-biology/protein-biology-learning-center/protein-biology-resource-library/pierce-protein-methods/sample-preparation-mass-spectrometry.html]
- 75. RNA agarose gel electrophoresis with bleach gels [https://www.protocols.io/view/rna-agarose-gel-electrophoresis-with-bleach-gels-g3fzbyjp7.html]
- 76. Electrophoresis Market Trends, Share and Forecast, 2025- ... [https://www.coherentmarketinsights.com/market-insight/electrophoresis-market-2666]
- 77. A Guide to Choosing the Right Gel for Protein Gel ... [https://biobasic-asia.com/choosing-guide-protein-gel/]
- 78. Development of a Low-Cost and Easy-Assembly Capillary ... [https://pmc.ncbi.nlm.nih.gov/articles/PMC11939447/]
- 79. Native or Denaturing Gel - Which Is For You? [https://advansta.com/not-all-gels-are-created-equal-native-or-denaturing-which-is-for-you/]
- 80. Antibodies 101: The Basics of Western Blotting [https://blog.addgene.org/the-basics-of-western-blotting]
- 81. Western Blot: Technique, Theory, and Trouble Shooting [https://pmc.ncbi.nlm.nih.gov/articles/PMC3456489/]
- 82. Western Blot Transfer Methods [https://www.thermofisher.com/us/en/home/life-science/protein-biology/protein-biology-learning-center/protein-biology-resource-library/pierce-protein-methods/western-blot-transfer-methods.html]
- 83. Gel Electrophoresis [https://www.merckmillipore.com/PG/en/applications/protein-biology/gel-electrophoresis]
- 84. Native SDS-PAGE: High Resolution Electrophoretic ... [https://pmc.ncbi.nlm.nih.gov/articles/PMC4517606/]
- 85. Analysis of RNA Folding by Native Polyacrylamide Gel ... [https://pmc.ncbi.nlm.nih.gov/articles/PMC6343852/]
- 86. Controlling the separation of native proteins with ... [https://pmc.ncbi.nlm.nih.gov/articles/PMC10033466/]
- 87. A screening method for binding synthetic metallo ... [https://www.sciencedirect.com/science/article/pii/S0003269722002445]
- 88. Comparative Analysis of Denaturing Gradient Gel ... [https://brieflands.com/journals/jjm/articles/56497]
- 89. Use of PCR-denaturing gradient gel electrophoresis for the ... [https://www.sciencedirect.com/science/article/abs/pii/S0882401018303115]
- 90. Comparative Analysis of Denaturing Gradient Gel ... [https://pubmed.ncbi.nlm.nih.gov/26568801/]
- 91. Use of PCR-denaturing gradient gel electrophoresis ... - AGRIS [https://agris.fao.org/search/en/providers/122535/records/65df8be50f3e94b9e5d9a3cc]
- 92. Gel Electrophoresis Devices Market Key Trends 2025 [https://www.linkedin.com/pulse/gel-electrophoresis-devices-market-key-trends-2025-lahwe/]
- 93. Nucleic Acid Non-Denaturing Precast Gel 2025 to Grow at XX ... [https://www.archivemarketresearch.com/reports/nucleic-acid-non-denaturing-precast-gel-292642]
- 94. Automated CE-SDS Protein Analysis, ProteoAnalyzer [https://www.agilent.com/en/product/automated-electrophoresis/proteoanalyzer-systems?srsltid=AfmBOorGE2GCmIgobo9J6QRuwrBzlmZ43qIyCEGcJHqRdH2wNO21EMkR]
- 95. GelGenie: an AI-powered framework for gel ... [https://www.nature.com/articles/s41467-025-59189-0]
- 96. Electrophoresis Market Size & Industry Demand 2025-2035 [https://www.futuremarketinsights.com/reports/electrophoresis-market]