Deconstructing SDS-PAGE: A Comprehensive Guide to System Components, Roles, and Advanced Applications
This article provides a thorough examination of the Sodium Dodecyl Sulfate-Polyacrylamide Gel Electrophoresis (SDS-PAGE) system, a cornerstone technique in biochemical and biomedical research.
Deconstructing SDS-PAGE: A Comprehensive Guide to System Components, Roles, and Advanced Applications
Abstract
This article provides a thorough examination of the Sodium Dodecyl Sulfate-Polyacrylamide Gel Electrophoresis (SDS-PAGE) system, a cornerstone technique in biochemical and biomedical research. Tailored for researchers, scientists, and drug development professionals, it details the fundamental principles and core components of the SDS-PAGE system, including the roles of SDS, polyacrylamide gel matrices, and discontinuous buffer systems. The scope extends to practical methodological protocols, advanced applications in proteomics and quality control, systematic troubleshooting for common issues, and comparative analysis with alternative techniques like Native PAGE and 2D electrophoresis. By synthesizing foundational knowledge with advanced applications, this guide serves as a critical resource for optimizing experimental design and interpreting protein data in research and development pipelines.
SDS-PAGE Uncovered: Understanding the Core Components and Separation Principles
In the realm of protein biochemistry, the Sodium Dodecyl Sulfate-Polyacrylamide Gel Electrophoresis (SDS-PAGE) technique stands as a cornerstone for analyzing complex protein mixtures. The reliability and widespread adoption of this method hinge on the fundamental roles played by its core components, chief among them being the detergent Sodium Dodecyl Sulfate (SDS). Within the discontinuous electrophoretic system pioneered by Laemmli, SDS performs two non-negotiable functions: it denatures proteins into linear polypeptides and confers upon them a uniform negative charge [1]. This dual action effectively negates the influence of a protein's inherent shape and charge, ensuring that separation through the polyacrylamide gel matrix is governed solely by molecular weight [2] [3]. For researchers and drug development professionals, a deep understanding of this mechanism is not merely academic; it is critical for the accurate interpretation of experimental data, from assessing protein purity and subunit composition to estimating molecular weight for subsequent characterization.
Core Mechanisms of SDS Action
Protein Denaturation and Linearization
The first and most crucial step in SDS-PAGE is the complete denaturation of the native protein structure. Proteins in their functional state possess complex secondary, tertiary, and often quaternary structures, stabilized by a combination of non-covalent interactions and covalent disulfide bonds [2]. SDS acts as a powerful denaturant by systematically disrupting these structural elements.
The denaturation process can be broken down into two key disruptive actions:
- Disruption of Non-Covalent Interactions: SDS, with its hydrophobic tail and anionic sulfate head group, disrupts hydrogen bonds and hydrophobic interactions that maintain the protein's tertiary structure [2] [3]. This interaction causes the protein to unfold, losing its native conformation.
- Cleavage of Disulfide Bonds: For complete linearization, disulfide bridges must be broken. This is achieved by adding reducing agents like β-mercaptoethanol (BME) or dithiothreitol (DTT) to the sample buffer [2] [4]. These compounds reduce the disulfide bonds, allowing the polypeptide chain to become fully extended.
The result of this process is that all proteins, regardless of their original folded shape, are converted into linear polypeptide chains [5]. This linearization is a prerequisite for size-based separation, as it ensures that all molecules assume a similar rod-like shape, approximately 18 Angstroms in width, with a length proportional to their molecular weight [6].
Imparting Uniform Negative Charge
The second essential function of SDS is to mask the protein's intrinsic electrical properties. In their native state, proteins carry a net charge determined by the ionization state of their amino acid side chains, which is highly dependent on the pH of their environment [4]. This inherent charge variability would cause proteins of identical size to migrate at different speeds in an electric field, precluding any reliable estimation of molecular weight.
SDS resolves this issue through its high-affinity, saturating binding to the polypeptide backbone. The key quantitative aspects of this binding are summarized in the table below.
Table 1: Quantitative Aspects of SDS-Protein Binding
| Parameter | Value | Significance |
|---|---|---|
| SDS Binding Ratio | ~1.4 g SDS per 1 g of protein [2] [7] [1] | Ensures complete and uniform coating of the polypeptide chain. |
| Binding Frequency | Approximately one SDS molecule per two amino acid residues [1] | Results in a consistent charge density along the protein's length. |
| Critical Micelle Concentration (CMC) | 7-10 mM [1] | Only SDS monomers (not micelles) bind to and denature proteins [1]. |
This extensive and consistent binding coats the protein in a "sea" of negative charges supplied by the sulfate groups of the SDS molecules [5]. Consequently, the protein's own charge becomes negligible, and all SDS-protein complexes acquire a consistent negative charge-to-mass ratio [2] [6]. This charge uniformity forces the electrophoretic mobility of the proteins to become dependent solely on their molecular size, as the driving force from the electric field is identical for all molecules [6].
Table 2: Summary of SDS Mechanisms in SDS-PAGE
| Core Function | Mechanism of Action | Experimental Outcome |
|---|---|---|
| Protein Denaturation | Disrupts hydrogen bonds, hydrophobic interactions, and ionic bonds that maintain secondary and tertiary structures [2] [3]. | Proteins are linearized, eliminating the influence of molecular shape on migration. |
| Charge Uniformity | Binds uniformly to the polypeptide backbone, imparting a high density of negative charge [2] [4]. | Masks intrinsic protein charge, ensuring migration is based solely on size. |
The SDS-PAGE Experimental Framework
Key Reagents and Their Roles
The successful execution of SDS-PAGE relies on a carefully formulated system of reagents, each playing a specific role in supporting the core functions of SDS.
Table 3: The Researcher's Toolkit: Essential Reagents for SDS-PAGE
| Reagent | Function | Key Details |
|---|---|---|
| SDS (Sodium Dodecyl Sulfate) | Denatures proteins and confers uniform negative charge [2] [4]. | Used in sample buffer and running buffer; binds at ~1.4g/g protein [2]. |
| Reducing Agent (DTT or BME) | Breaks disulfide bonds to fully linearize proteins [2] [4]. | DTT (10-100 mM) or β-mercaptoethanol (5% v/v) are common choices [1]. |
| Polyacrylamide Gel | Acts as a molecular sieve; separates proteins by size [2]. | Polymerized from acrylamide and bisacrylamide; pore size controlled by concentration [2]. |
| Tris-Glycine Buffer | The discontinuous buffer system that enables sharp band formation [5] [6]. | Stacking gel (pH 6.8) and separating gel (pH 8.8) with glycine in running buffer [6]. |
| Tracking Dye (Bromophenol Blue) | Visualizes the progress of electrophoresis [2]. | A small, anionic dye that migrates ahead of the proteins [1]. |
Critical Experimental Protocol for Sample Preparation
To ensure the complete denaturation and charging of proteins by SDS, a specific sample preparation protocol must be rigorously followed. Deviations can lead to artifacts like smearing or aberrant migration.
Sample Buffer Formulation: The protein sample is mixed with a loading buffer (Laemmli buffer) containing the following critical components [5] [8]:
- SDS: Typically at a concentration of 2-4% to ensure a vast excess for complete denaturation and coating [8].
- Reducing Agent: Dithiothreitol (DTT) at 10-100 mM or β-mercaptoethanol at 5% to break disulfide bonds [1].
- Glycerol: (10-20%) to increase the density of the sample for easy loading into wells [2] [8].
- Tris-HCl Buffer: Provides a buffering environment, typically at pH 6.8 [8].
- Bromophenol Blue: A tracking dye to monitor migration [2].
Heat Denaturation: The protein-sample buffer mixture is heated to 95°C for 5 minutes (or 70°C for 10 minutes) [1]. This heating step is critical as it provides the energy required to fully disrupt hydrogen bonds and complete the protein unfolding process, ensuring SDS can access and bind to the entire polypeptide chain [4]. After heating, the sample is cooled and centrifuged briefly before loading onto the gel [8].
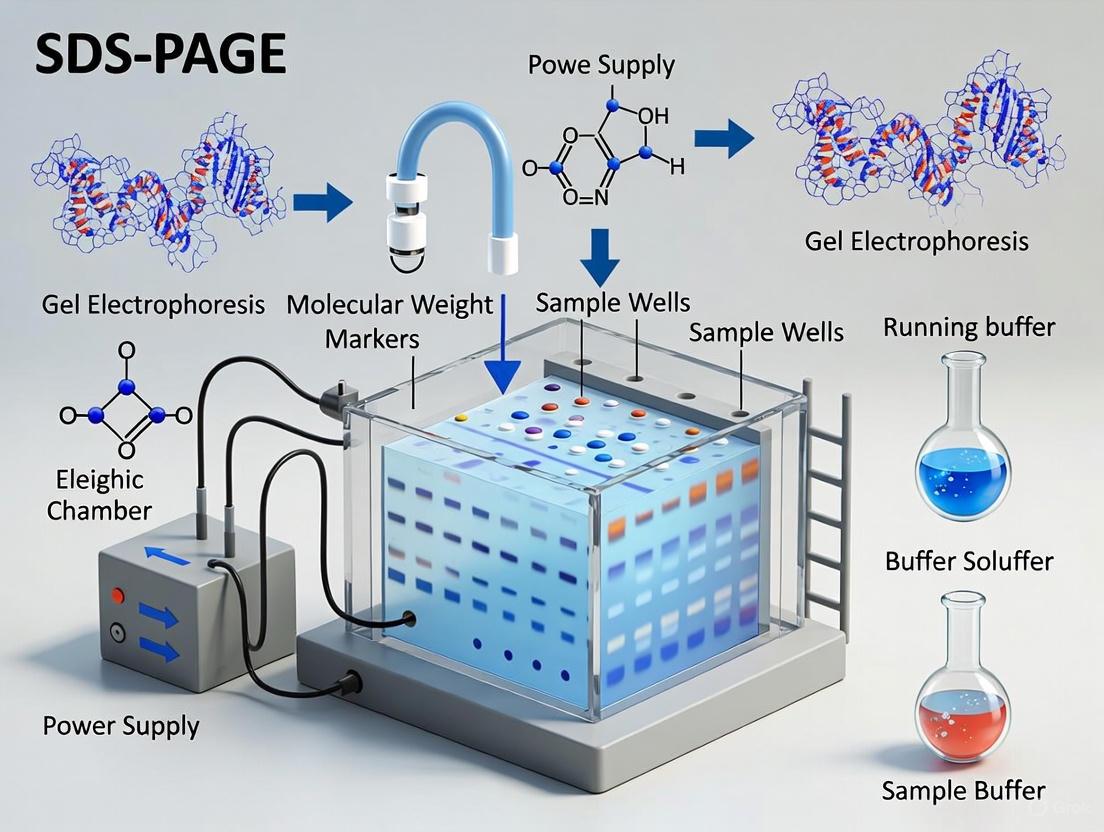
Visualization of the SDS-PAGE Process
The following diagram illustrates the integrated process of protein denaturation, charge masking, and separation within the SDS-PAGE system.
Troubleshooting and Analytical Considerations
While the SDS-PAGE technique is robust, understanding its limitations is vital for accurate data interpretation. A primary consideration is that the binding of SDS is not perfectly identical for all proteins. Highly hydrophobic proteins may bind more SDS, while post-translationally modified proteins, such as glycoproteins, may bind less due to the steric hindrance and altered chemical properties of the modification [5]. This can cause slight deviations in migration, leading to an over- or under-estimation of molecular weight. For this reason, molecular weight estimates from SDS-PAGE are considered approximate, with a typical error of about ±10% [1].
Furthermore, the fundamental mechanism of SDS-PAGE means it is generally unsuitable for analyzing native protein structures or protein complexes, as the denaturing conditions deliberately destroy this information. Exceptions are complexes stabilized by covalent cross-linking or those that are "SDS-resistant," though the latter may be denatured with additional heating [1].
The detergent Sodium Dodecyl Sulfate is the linchpin of the SDS-PAGE technique, fulfilling two essential roles that are foundational to its success. By denaturing proteins into linear chains and endowing them with a uniform negative charge, SDS effectively negates the confounding effects of tertiary structure and intrinsic charge, reducing the complex parameters governing protein mobility to a single variable: molecular weight. This transformative action enables researchers across biochemistry and drug development to separate, visualize, and initially characterize proteins with high resolution and reproducibility. A deep understanding of this mechanism, from the quantitative aspects of SDS binding to the critical steps in sample preparation, is indispensable for troubleshooting experiments and generating reliable, interpretable data that can drive scientific discovery forward.
In the SDS-PAGE system, the polyacrylamide gel matrix serves as the critical molecular sieve that enables high-resolution separation of proteins based almost exclusively on their molecular size. This separation is fundamental to countless applications in biochemical research and drug development, from assessing protein purity and expression to validating therapeutic proteins. The matrix is a porous network formed by the polymerization of acrylamide monomers cross-linked by bisacrylamide, creating a web-like structure through which linearized, negatively charged protein-SDS complexes migrate under an electric field [9] [10]. The pore size of this network, determined by the concentration of acrylamide and the degree of cross-linking, dictates the mobility of proteins, with smaller proteins navigating the pores more easily than larger ones [10]. Thus, a meticulously crafted polyacrylamide gel matrix transforms a simple electric field into a powerful size-based separation tool, forming the core of the SDS-PAGE technique.
Core Principles: The Science of the Molecular Sieve
Composition and Polymerization
The polyacrylamide gel is a biochemical scaffold created through a controlled chemical polymerization process. The gel consists primarily of acrylamide monomers, which form the backbone of the polymer chains, and N,N'-methylenebisacrylamide (bisacrylamide), a cross-linking agent that connects these linear chains into a three-dimensional network [10]. The polymerization reaction is initiated by a free-radical system, typically involving ammonium persulfate (APS) as the initiator and N,N,N',N'-tetramethylethylenediamine (TEMED) as a catalyst [9] [10]. TEMED accelerates the decomposition of APS to produce free radicals, which then initiate the polymerization of acrylamide and bisacrylamide molecules into a stable, cross-linked polyacrylamide matrix [10].
The porosity of the resulting gel is not a fixed property but can be finely tuned by adjusting two key variables: the total concentration of acrylamide and bisacrylamide (%T), and the proportion of bisacrylamide relative to the total acrylamide (%C) [10]. This tunability allows researchers to customize the gel's separation characteristics for specific molecular weight ranges of interest.
The Mechanism of Size-Based Separation
In SDS-PAGE, proteins are denatured and linearized by the anionic detergent sodium dodecyl sulfate (SDS), which coats the polypeptides with a uniform negative charge [9]. This treatment neutralizes the proteins' intrinsic charge and masks their shape differences, ensuring that the primary factor influencing their electrophoretic mobility is their molecular size [10]. When an electric field is applied, these SDS-coated protein complexes are driven through the porous polyacrylamide matrix.
The separation occurs because the gel matrix acts as a molecular sieve [10]. Smaller polypeptide chains can navigate the pores of the gel more readily, allowing them to migrate faster toward the anode. Conversely, larger polypeptides are impeded by the matrix network and migrate more slowly [9] [10]. The outcome is a separation where proteins are arranged in bands according to their molecular weights, with smaller proteins found near the bottom of the gel and larger ones near the top [10].
Optimizing the Molecular Sieve: Gel Composition and Properties
Controlling Pore Size for Target Protein Ranges
The resolution of an SDS-PAGE separation is profoundly influenced by the gel's acrylamide concentration, which directly determines the effective pore size of the matrix. Selecting the appropriate gel concentration is crucial for achieving optimal separation of the target protein size range.
Table 1: Optimal Acrylamide Concentrations for Protein Separation
| Acrylamide Concentration (%) | Effective Separation Range (kDa) | Primary Application |
|---|---|---|
| 6-8% | 50-200 | High molecular weight proteins |
| 10% | 20-100 | Standard protein mixtures |
| 12% | 15-70 | Standard protein mixtures |
| 15% | 10-50 | Low molecular weight proteins |
Polyacrylamide gels are typically used at concentrations between 7% and 15%, with lower percentages (e.g., 7-10%) providing larger pores better suited for separating high molecular weight proteins, and higher percentages (e.g., 12-15%) creating smaller pores that optimize resolution of lower molecular weight proteins [11] [10]. For separating very small polypeptides (<10 kDa), gradient gels or specialized tricine-SDS-PAGE systems may be employed [12].
The Discontinuous Gel System: Stacking and Resolving
A key innovation in modern SDS-PAGE is the use of a discontinuous gel system comprising two distinct layers with different pore sizes and pH values: the stacking gel and the resolving gel [9] [10].
The stacking gel is a low-concentration acrylamide layer (typically ~4%) with a lower pH (6.8) situated above the resolving gel [9] [11]. Its primary function is to concentrate all protein samples into a sharp, unified band before they enter the resolving gel, ensuring that all proteins begin their size-based separation simultaneously from a narrow starting zone [9].
The resolving gel (or separating gel) has a higher acrylamide concentration (ranging from 7% to 15% or higher) and a higher pH (8.8) [9] [10]. This layer is where the actual size-based separation occurs, as proteins encounter the restrictive pore matrix and begin to separate according to their molecular weights [10].
The mechanism behind the stacking effect relies on the unique properties of the glycine ions in the running buffer. At the pH of the stacking gel, glycine exists primarily as zwitterions with minimal net charge, resulting in low mobility. This creates a steep voltage gradient between the highly mobile chloride ions from the Tris-HCl in the gel and the slower glycine zwitterions, effectively compressing the protein samples into a thin band between these two ion fronts [9]. When this stacked protein band reaches the resolving gel at pH 8.8, glycine ions become predominantly negatively charged (glycinate) and gain high mobility, eliminating the voltage gradient and depositing the proteins as a sharp band at the top of the resolving gel where size-based separation begins [9].
Experimental Protocol: Casting and Running Polyacrylamide Gels
Reagent Preparation
Table 2: Essential Reagents for Polyacrylamide Gel Electrophoresis
| Reagent | Function | Typical Composition/Concentration |
|---|---|---|
| Acrylamide/Bis-acrylamide Solution | Forms the porous matrix structure | 30% stock solution (29:1 or 37.5:1 acrylamide:bis ratio) |
| Tris-HCl Buffer | Maintains appropriate pH for polymerization and separation | Stacking gel: 0.5 M, pH 6.8; Resolving gel: 1.5 M, pH 8.8 |
| Ammonium Persulfate (APS) | Free radical initiator for polymerization | 10% (w/v) solution in water (freshly prepared) |
| TEMED | Catalyst that accelerates polymerization | Used as supplied (0.1% of total volume) |
| SDS (Sodium Dodecyl Sulfate) | Anionic detergent that denatures proteins and confers uniform charge | 10-20% (w/v) solution (0.1% in running buffer) |
| Running Buffer | Conducts current and maintains pH during electrophoresis | 25 mM Tris, 192 mM glycine, 0.1% SDS, pH 8.3 |
| Sample Buffer | Denatures proteins and provides tracking dye | 62.5 mM Tris-HCl (pH 6.8), 2% SDS, 10% glycerol, 0.01% bromophenol blue, with or without 5% β-mercaptoethanol |
Step-by-Step Gel Casting Procedure
- Assemble Gel Cassettes: Clean and dry the glass plates and spacers. Assemble the gel cassette according to manufacturer's instructions, ensuring a tight seal to prevent leakage.
- Prepare Resolving Gel Solution: In a clean container, mix the appropriate volumes of acrylamide/bis solution, Tris-HCl buffer (pH 8.8), SDS, and deionized water for the desired gel concentration and volume. Gently swirl to mix.
- Initiate Polymerization: Add ammonium persulfate (APS) and TEMED to the resolving gel solution. Swirl gently to mix. Note: Addition of TEMED will initiate polymerization rapidly; work efficiently after this step.
- Pour Resolving Gel: Immediately pipette the resolving gel solution into the assembled gel cassette, leaving appropriate space for the stacking gel (approximately 2 cm below the top of the plates).
- Overlay with Solvent: Carefully overlay the resolving gel solution with water-saturated isobutanol or deionized water to exclude oxygen and ensure a flat gel interface.
- Polymerize: Allow the resolving gel to polymerize completely (typically 20-30 minutes at room temperature). A distinct refractive interface will be visible when polymerization is complete.
- Prepare and Pour Stacking Gel: After polymerization, pour off the overlay solution. Prepare the stacking gel solution (lower acrylamide concentration, Tris-HCl pH 6.8), add APS and TEMED, and pipette onto the top of the polymerized resolving gel.
- Insert Comb: Immediately insert a clean well-forming comb into the stacking gel solution, avoiding air bubbles.
- Complete Polymerization: Allow the stacking gel to polymerize completely (typically 15-20 minutes). The gel can be used immediately or stored wrapped in moist paper towels and plastic film at 4°C for 1-2 days.
Sample Preparation and Electrophoresis Conditions
- Protein Denaturation: Mix protein samples with 2X Laemmli sample buffer [13] at a 1:1 ratio. The sample buffer typically contains SDS to denature proteins and confer negative charge, glycerol to increase density, a reducing agent (DTT or β-mercaptoethanol) to break disulfide bonds, and a tracking dye (bromophenol blue) [9] [13].
- Heat Denaturation: Heat samples at 95-100°C for 5-10 minutes to ensure complete denaturation [13]. Cool briefly and centrifuge to collect condensation.
- Load Samples: Assemble the gel cassette in the electrophoresis chamber and fill with running buffer. Carefully remove the comb and load protein samples and molecular weight standards into the wells.
- Run Electrophoresis: Connect to power supply and run at constant voltage (80-150 V for mini-gels) until the dye front reaches the bottom of the gel [13]. Higher voltages decrease run time but may reduce resolution.
- Post-Electrophoresis Analysis: Following separation, proteins can be visualized by staining (e.g., Coomassie Blue, silver stain) or transferred to a membrane for western blotting analysis.
Advanced Configurations and Technical Considerations
Gradient Gels and Alternative Formulations
For complex protein mixtures with a broad molecular weight range, polyacrylamide gradient gels offer superior resolution across the entire separation spectrum [11] [10]. These gels have a continuously varying acrylamide concentration, typically increasing from top to bottom (e.g., 5-20% gradient) [10]. As proteins migrate through a gradient gel, they encounter progressively smaller pores, causing each protein to eventually reach a "pore limit" where it can no longer penetrate the matrix effectively [10]. This results in sharper protein bands and enhanced resolution of similarly sized proteins compared to uniform concentration gels [11].
Specialized PAGE variants have also been developed for specific applications. Blue Native (BN)-PAGE preserves protein complexes in their native state for studying protein-protein interactions and functional properties [14]. Tricine-SDS-PAGE provides improved resolution of low molecular weight polypeptides (<10 kDa) that co-migrate in traditional glycine-based systems [12]. Recent developments like Native SDS-PAGE (NSDS-PAGE) modify standard conditions by reducing SDS concentration and eliminating heating steps to retain certain functional properties while maintaining high resolution [14].
Troubleshooting Common Issues
Several factors can affect the performance and resolution of polyacrylamide gel separations:
- Poor Polymerization: Can result from outdated or improperly stored acrylamide, impure reagents, or oxygen inhibition. Always use fresh reagents and high-quality water.
- Smiling Bands (Curved Band Pattern): Often caused by excessive heating during electrophoresis. Reduce voltage or improve heat dissipation by using a cooling apparatus.
- Vertical Streaking: May indicate protein aggregation or precipitation. Ensure complete denaturation of samples and consider increasing SDS concentration or adding urea to the sample buffer.
- Atypical Migration: Highly glycosylated or phosphorylated proteins may bind SDS differently and migrate anomalously [9]. Hydrophobic proteins may also exhibit altered mobility due to differential SDS binding [9].
The Scientist's Toolkit: Essential Reagents and Materials
Table 3: Research Reagent Solutions for Polyacrylamide Gel Electrophoresis
| Reagent/Material | Function | Technical Specifications |
|---|---|---|
| Acrylamide | Monomer for gel matrix formation | Electrophoresis grade, ≥99% purity; 30-40% (w/v) solutions |
| Bis-acrylamide | Cross-linker for pore size control | Typically used at 1-5% cross-linking ratio (C) relative to total acrylamide |
| TEMED | Polymerization catalyst | Free base, stored under nitrogen; catalyzes free radical formation |
| Ammonium Persulfate | Polymerization initiator | Electrophoresis grade; 10% solution in water, prepared fresh |
| Tris Buffer | pH control | Ultrapure, electrophoresis grade; stacking gel: pH 6.8, resolving gel: pH 8.8 |
| SDS | Protein denaturation and charge uniformity | Electrophoresis grade, ≥98% purity; 10-20% stock solutions |
| Glycine | Leading ion in buffer system | Electrophoresis grade; component of running buffer (192 mM) |
| Prestained Protein Standards | Molecular weight calibration | Mixture of recombinant proteins with visible markers across defined size range |
| Coomassie Brilliant Blue | Protein staining | 0.1% in 40% methanol, 10% acetic acid; detects 10-100 ng protein/band |
Sodium dodecyl sulfate-polyacrylamide gel electrophoresis (SDS-PAGE) represents a cornerstone technique in biochemical research and drug development, enabling precise protein separation by molecular weight. The resolution and reproducibility of this method hinge upon the sophisticated operational framework of the discontinuous buffer system. This technical guide delineates the core scientific principles of the stacking and resolving gels, which create a discontinuous environment for optimal protein fractionation. We provide a comprehensive breakdown of the underlying mechanisms, detailed methodologies for gel formulation and electrophoresis, and quantitative data presentation structured for laboratory application. By framing this system within the context of modern proteomic analysis and therapeutic development, this whitepaper serves as an essential resource for researchers requiring an in-depth understanding of this fundamental protein analytical tool.
The discontinuous buffer system, colloquially known as disc electrophoresis, is a type of polyacrylamide gel electrophoresis that produces high resolution and superior band definition for protein separation [15]. Developed by Ornstein and Davis and popularized by Laemmli, this system is renowned for its ability to separate complex protein mixtures with exceptional precision [16] [17]. The system is termed "discontinuous" because it employs differences in gel structure, pH values, and ionic constituents between the various components of the electrophoretic setup [15]. This intentional discontinuity creates a multifaceted separation environment where proteins are first concentrated into extremely narrow zones before being resolved according to their molecular weights.
In standard SDS-PAGE practice, the system comprises two distinct polyacrylamide gel layers—a stacking gel and a resolving (or separating) gel—each with different acrylamide concentrations and pH levels, coupled with an electrode buffer of yet another pH [18] [19] [6]. The strategic implementation of these discontinuities enables all proteins within a sample to simultaneously enter the resolving region as a sharply focused band, irrespective of their initial distribution within the loading well. This initial concentration step is critical for achieving the high-resolution separation that makes SDS-PAGE indispensable in molecular biology, biochemistry, and pharmaceutical development for analyzing protein purity, subunit composition, and molecular weight [7].
Core Principles of the Discontinuous Buffer System
The discontinuous buffer system operates on well-established physicochemical principles that govern the movement of charged molecules through a polyacrylamide matrix under an electric field. The efficacy of this system rests upon three foundational pillars: the uniform charge conferred by SDS on diverse proteins, the molecular sieving effect of the polyacrylamide gel matrix, and the strategic exploitation of pH-dependent ionic mobility within the discontinuous buffer system.
Charge Uniformity through SDS Binding
SDS (sodium dodecyl sulfate), an anionic detergent, serves as the primary denaturing agent in SDS-PAGE. It performs two critical functions: it disrupts the non-covalent bonds—including hydrogen, hydrophobic, and ionic bonds—that maintain secondary and tertiary protein structures, thereby linearizing the polypeptide chains [18]. Furthermore, SDS binds to the denatured proteins with high affinity at an approximately constant ratio of 1.4 g of SDS per 1 g of polypeptide [19] [17]. This uniform coating masks the intrinsic charge differences arising from the variable amino acid compositions of different proteins. Consequently, all SDS-bound proteins acquire a uniform negative charge density, ensuring that their electrophoretic mobility becomes primarily a function of molecular size rather than inherent charge [7] [6]. To complete the denaturation process, reducing agents like β-mercaptoethanol or dithiothreitol (DTT) are incorporated into the sample buffer to cleave disulfide bonds, thereby dissociating protein subunits and ensuring complete linearization [18] [20].
Molecular Sieving via the Polyacrylamide Gel Matrix
The polyacrylamide gel functions as a molecular sieve, imparting size-dependent mobility to the uniformly charged protein-SDS complexes. This porous matrix is formed through the polymerization of acrylamide monomers cross-linked by N,N'-methylenebisacrylamide (Bis) [19] [7]. The polymerization reaction is catalyzed by ammonium persulfate (APS) and accelerated by TEMED (N,N,N',N'-Tetramethylethylenediamine) [19]. The pore size within the gel is inversely related to the total percentage of acrylamide; lower percentages create larger pores facilitating the migration of larger proteins, while higher percentages create smaller pores that better resolve smaller proteins [18] [19]. This sieving effect ensures that smaller protein molecules navigate through the gel matrix more rapidly than larger molecules, resulting in separation strictly according to molecular weight [19] [20].
The Discontinuity: pH and Ionic Mobility
The discontinuous aspect introduces strategic differences in pH and ionic composition between the stacking gel (typically pH 6.8), the resolving gel (typically pH 8.8), and the electrode buffer (typically pH 8.3) [18] [6]. This discontinuity strategically manipulates the charge state and, consequently, the electrophoretic mobility of glycine ions present in the electrode buffer. Glycine, an amino acid, can exist in different charge states depending on the pH: positively charged at low pH, a zwitterion (with both positive and negative charges, resulting in no net charge) around its isoelectric point, and negatively charged (as glycinate) at high pH [18] [6]. The controlled transition of glycine from a slow-moving zwitterion in the stacking gel to a fast-moving anion in the resolving gel is the fundamental mechanism that drives the stacking of proteins into a sharp band before they enter the resolving phase of the electrophoresis [18] [17].
System Components and Their Roles
The discontinuous buffer system integrates several chemically defined components, each fulfilling a specific role in the protein separation process. The precise formulation and interaction of these components are critical for achieving optimal resolution.
The Stacking Gel
The stacking gel, layered on top of the resolving gel, is characterized by a lower percentage of acrylamide (typically 4-5%) and a lower pH (6.8) [18] [19]. Its primary function is not to separate proteins by size but to concentrate all protein molecules from the relatively large volume of the sample well into an extremely narrow, sharp band before they enter the resolving gel. This concentration occurs through a process called isotachophoresis [15]. The low pH environment of the stacking gel is crucial as it ensures that the glycine ions from the cathode buffer (pH 8.3) enter this zone and become predominantly zwitterions, drastically reducing their electrophoretic mobility [18] [6]. This sets up a moving boundary system with chloride ions (from the Tris-HCl in the gel) as highly mobile leading ions and glycine zwitterions as trailing ions, creating a sharp voltage gradient that focuses the proteins, whose mobility is intermediate, into a thin zone between these two fronts [6] [17].
The Resolving Gel
The resolving (or separating) gel constitutes the core separation matrix, featuring a higher percentage of acrylamide (ranging from 8% to 25% depending on the target protein sizes) and a higher pH (8.8) [18] [19]. When the protein stack, sandwiched between the chloride and glycine fronts, reaches the interface of the stacking and resolving gels, the sharp increase in pH to 8.8 causes the glycine zwitterions to deprotonate and become rapidly moving glycinate anions [18]. These anions quickly overtake the protein molecules. Simultaneously, the higher concentration of polyacrylamide presents a denser sieving matrix with smaller pores. The uniform electric field in the resolving gel and the molecular sieving effect then work in concert to separate the now-unstacked proteins based solely on their molecular weight, with smaller proteins migrating faster than larger ones [19] [6].
Electrode Buffer and Key Chemical Reagents
The electrode buffer (or running buffer), typically Tris-Glycine with SDS at pH 8.3, serves to conduct current throughout the system and maintain the pH environment necessary for the discontinuous function [18] [6]. The sample buffer, also known as Laemmli buffer, contains SDS for denaturation and charge masking, a reducing agent (BME or DTT) to break disulfide bonds, glycerol to add density for loading, and a tracking dye like Bromophenol Blue to visualize migration [18] [17].
Table 1: Key Components of the Discontinuous Buffer System and Their Functions
| Component | Typical Composition | Primary Function |
|---|---|---|
| Stacking Gel | Low % acrylamide, Tris-HCl, pH 6.8 [18] [19] | Concentrates protein samples into a sharp band before entry into the resolving gel. |
| Resolving Gel | Higher % acrylamide, Tris-HCl, pH 8.8 [18] [19] | Separates proteins based on their molecular weight via molecular sieving. |
| Electrode Buffer | Tris, Glycine, SDS, pH 8.3 [18] [6] | Conducts current and establishes the ionic environment for glycine's charge transition. |
| Sample Buffer | Tris-HCl, SDS, Glycerol, Reducing Agent, Tracking Dye [18] [17] | Denatures proteins, confers negative charge, provides density for loading, and allows visualization. |
Visualization of the Mechanism
The following diagram illustrates the step-by-step mechanism of the discontinuous buffer system in SDS-PAGE, from the initial application of current to the final separation of proteins in the resolving gel.
Visualization of the Discontinuous Buffer Mechanism in SDS-PAGE
Methodology and Experimental Protocol
This section provides a detailed methodology for preparing and running a discontinuous SDS-PAGE gel, formatted for laboratory application.
Gel Casting Protocol
Part A: Preparing the Resolving Gel
- Formula: For a 10% resolving gel, combine 7.5 mL of 40% acrylamide solution, 3.9 mL of 1% bisacrylamide, 7.5 mL of 1.5 M Tris-HCl (pH 8.8), and water to a final volume of 30 mL. Degas the solution for 5-10 minutes to remove dissolved oxygen, which inhibits polymerization.
- Polymerization Initiation: Immediately before casting, add 0.3 mL of 10% ammonium persulfate (APS) and 0.03 mL of TEMED. Swirl gently to mix without introducing air bubbles.
- Casting: Pour the solution between assembled glass plates, leaving space for the stacking gel. Carefully overlay with ethanol or water-saturated butanol to create a flat, defined interface and exclude oxygen.
- Polymerization: Allow the gel to polymerize completely (typically 20-30 minutes). A distinct schlieren line will appear at the overlay interface upon full polymerization.
Part B: Preparing the Stacking Gel
- Formula: For a 5% stacking gel, combine 1.25 mL of 40% acrylamide, 0.75 mL of 1% bisacrylamide, 2.5 mL of 0.5 M Tris-HCl (pH 6.8), and water to a final volume of 10 mL.
- Casting: After polymerization of the resolving gel, pour off the overlay. Add polymerization initiators (0.1 mL of 10% APS and 0.01 mL TEMED) to the stacking gel solution, pour it on top of the resolving gel, and immediately insert a clean comb.
- Polymerization: Allow the stacking gel to polymerize for 15-20 minutes. The gel can be used immediately or stored at 4°C for later use [19] [20].
Electrophoresis Procedure
- Sample Preparation: Mix protein samples with an equal volume of 2X Laemmli sample buffer. Heat the mixture at 95-100°C for 5 minutes to ensure complete denaturation [20].
- Apparatus Setup: Place the polymerized gel cassette into the electrophoresis chamber. Fill the inner and outer chambers with Tris-Glycine running buffer (pH 8.3) containing 0.1% SDS.
- Loading: Carefully remove the comb. Load prepared protein samples and a molecular weight marker into the respective wells using a microsyringe.
- Electrophoresis: Connect the chamber to a power supply. Run the gel at a constant voltage of 80-100 V during the stacking phase (while the tracking dye is in the stacking gel). Once the dye front enters the resolving gel, increase the voltage to 120-150 V to complete the separation.
- Completion: Terminate the electrophoresis when the bromophenol blue tracking dye reaches the bottom of the gel [19] [6] [17].
Table 2: Optimized Gel Compositions for Different Protein Size Ranges
| Target Protein Size Range | Resolving Gel Acrylamide % | Stacking Gel Acrylamide % | Key Applications |
|---|---|---|---|
| 3 - 100 kDa | 15% | 4-5% | Small peptides, protein fragments [6] |
| 10 - 200 kDa | 12% | 4-5% | Cytokines, most enzymes [6] |
| 20 - 300 kDa | 10% | 4-5% | Medium to large proteins [6] |
| 50 - 500 kDa | 7% | 4-5% | Large protein complexes [6] |
| Broad Range (e.g., 5-250 kDa) | 4-20% Gradient | 4-5% | Complex mixtures with diverse sizes [19] [20] |
The Scientist's Toolkit: Essential Research Reagents
Successful execution of SDS-PAGE requires a suite of specific, high-quality reagents. The following table details the essential materials and their critical functions.
Table 3: Essential Reagents for SDS-PAGE with the Discontinuous Buffer System
| Reagent | Chemical Nature | Primary Function in the Protocol |
|---|---|---|
| Acrylamide/Bis-Acrylamide | Monomer and cross-linker | Forms the polyacrylamide gel matrix; ratio and total concentration determine pore size for molecular sieving [19] [7]. |
| Tris-HCl | Buffer | Buffers the stacking (pH 6.8) and resolving (pH 8.8) gels to establish the critical pH discontinuity [18] [6]. |
| Glycine | Amino acid | Key ion in the electrode buffer; its pH-dependent charge transition (zwitterion to anion) drives the stacking mechanism [18] [15]. |
| SDS (Sodium Dodecyl Sulfate) | Anionic detergent | Denatures proteins and confers a uniform negative charge, negating the effect of intrinsic protein charge [18] [19]. |
| Ammonium Persulfate (APS) | Polymerization initiator | Generates free radicals to initiate the acrylamide polymerization reaction [19]. |
| TEMED | Polymerization catalyst | Catalyzes the polymerization reaction by accelerating the rate of free radical formation from APS [19]. |
| β-Mercaptoethanol (BME) or DTT | Reducing agent | Breaks disulfide bonds between cysteine residues, ensuring complete protein denaturation and subunit dissociation [18] [20]. |
Applications in Research and Drug Development
The discontinuous buffer SDS-PAGE system is a foundational analytical tool that supports critical applications in both basic research and the biopharmaceutical industry.
- Molecular Weight Determination: By comparing the migration distance of an unknown protein to a calibration curve generated by protein standards of known molecular weight, researchers can estimate the size of the protein [19] [7]. This is a fundamental first step in characterizing novel proteins or engineered biologics.
- Purity and Homogeneity Assessment: The presence of a single, sharp band on a Coomassie or silver-stained gel indicates a highly pure protein sample. Conversely, multiple or smeared bands suggest the presence of impurities, degradation products, or isoforms, which is critical for quality control in protein purification processes and therapeutic protein development [7].
- Subunit Composition Analysis: Under reducing conditions, multi-subunit proteins are dissociated into their constituent polypeptides. SDS-PAGE reveals the number and molecular weight of these subunits, providing essential information on protein quaternary structure [7].
- Western Blotting Sample Preparation: SDS-PAGE is the indispensable first separation step in western blotting. The high-resolution separation of proteins by size allows for specific immunodetection of target proteins from complex mixtures like cell lysates or tissue homogenates [20].
- Protein Expression Profiling: Researchers can use SDS-PAGE to visually compare protein expression levels across different samples, such as treated vs. untreated cells or diseased vs. healthy tissues, often as a precursor to more detailed proteomic analysis [7].
The discontinuous buffer system, with its clever exploitation of pH-induced ionic mobility shifts between stacking and resolving gels, remains a masterpiece of practical biochemical engineering. Its ability to concentrate and then separate proteins with high resolution and reproducibility has secured its status as an irreplaceable technique in the modern laboratory. For researchers and drug development professionals, a deep understanding of the science behind this system is not merely academic; it is a practical necessity for troubleshooting experimental anomalies, optimizing separation conditions for specific targets, and correctly interpreting the rich data contained within each gel. As proteomic technologies advance, the principles of discontinuous electrophoresis continue to underpin newer methodologies, ensuring its legacy as a cornerstone of protein analysis.
The Sodium Dodecyl Sulfate-Polyacrylamide Gel Electrophoresis (SDS-PAGE) technique is a cornerstone of modern molecular biology and proteomics, enabling the separation of proteins based on their molecular weight. The reliability of this method hinges on a precisely formulated chemical system, with four components playing particularly critical roles: Tris, Glycine, Ammonium Persulfate (APS), and Tetramethylethylenediamine (TEMED). These chemicals collectively create the discontinuous buffer system that underpins the high-resolution separation achieved in SDS-PAGE. Tris acts as the primary buffering agent, glycine enables the crucial stacking effect through its pH-dependent charge dynamics, while APS and TEMED work in concert to catalyze the formation of the polyacrylamide gel matrix itself. This technical guide provides an in-depth examination of these key chemical players, their specific functions, and their integrated roles within the SDS-PAGE system, offering researchers and drug development professionals a comprehensive resource for both practical application and theoretical understanding of this fundamental technique.
Tris: The Buffering Backbone
Tris (tris(hydroxymethyl)aminomethane) serves as the fundamental buffering agent throughout the SDS-PAGE system, creating the specific pH environments essential for proper protein separation. Its effectiveness stems from its pKa of approximately 8.1, which makes it ideal for maintaining stable pH conditions in the biological pH range between 7 and 9 [21].
Table 1: Tris Buffer Composition in Different SDS-PAGE Components
| Gel Component | Tris Concentration | pH | Primary Function |
|---|---|---|---|
| Stacking Gel | ~0.125 M [22] | 6.8 [21] [1] [6] | Creates acidic environment for protein stacking |
| Resolving Gel | ~0.375 M [22] | 8.8 [21] [1] [6] | Creates basic environment for protein separation |
| Electrode Buffer | ~25 mM [1] | 8.3 [21] [6] | Maintains pH for glycine charge transition |
The discontinuous nature of the Tris buffers—with different pH values in the stacking gel (pH 6.8), resolving gel (pH 8.8), and electrode buffer (pH 8.3)—is fundamental to the SDS-PAGE technique [6]. This pH discontinuity works in concert with glycine to create the stacking effect that concentrates protein samples into sharp bands before they enter the resolving gel. In the sample buffer, Tris-HCl provides chloride ions (Cl⁻) that act as highly mobile "leading ions" during electrophoresis [21]. The careful buffering at different concentrations and pH values establishes the foundation for the entire separation process, making Tris an indispensable component of the SDS-PAGE system.
Glycine: The Charge Transition Regulator
Glycine, an amino acid with the chemical formula NH₂-CH₂-COOH, plays a sophisticated role in the SDS-PAGE buffer system due to its pH-dependent charge states. Its key function revolves around transitioning between different ionic forms to enable the stacking of proteins at the interface between the stacking and resolving gels.
Table 2: Glycine's Charge States and Functions at Different pH Levels
| pH Environment | Predominant Charge State | Electrophoretic Mobility | Primary Function |
|---|---|---|---|
| Stacking Gel (pH 6.8) | Zwitterion (neutral overall) [21] [6] | Low mobility [17] | Acts as "trailing ion" behind proteins |
| Resolving Gel (pH 8.8) | Anion (negatively charged) [21] [1] | High mobility [17] | Becomes "leading ion," depositing proteins |
| Electrode Buffer (pH 8.3) | Predominantly anionic [21] | Moderate mobility | Enters stacking gel and changes state |
The fundamental mechanism of glycine's action involves its transition from the slow-moving zwitterionic form in the stacking gel to the fast-moving anionic form in the resolving gel. At the stacking gel pH of 6.8, which is near glycine's isoelectric point, glycine exists primarily as zwitterions with no net charge, causing them to migrate slowly through the gel [21] [6]. In contrast, chloride ions from Tris-HCl move much more rapidly through the stacking gel, creating a steep voltage gradient between the fast chloride front (leading ions) and the slow glycine front (trailing ions) [21]. Protein molecules, with electrophoretic mobilities intermediate between these two fronts, become compressed into a narrow zone as they migrate through the stacking gel. When this ion front reaches the resolving gel at pH 8.8, glycine molecules lose protons and become predominantly negatively charged glycinate anions, dramatically increasing their mobility and allowing them to overtake the proteins [21] [17]. This deposits the proteins in an extremely narrow band at the top of the resolving gel, ensuring they begin the separation process simultaneously in sharp, well-defined bands.
APS and TEMED: The Polymerization Catalysts
Ammonium Persulfate (APS) and N,N,N',N'-Tetramethylethylenediamine (TEMED) work in concert as an essential catalytic system for polymerizing acrylamide monomers into the polyacrylamide gel matrix that provides the sieving properties necessary for protein separation in SDS-PAGE.
Table 3: APS and TEMED Specifications and Roles in Gel Polymerization
| Parameter | Ammonium Persulfate (APS) | TEMED |
|---|---|---|
| Chemical Formula | (NH₄)₂S₂O₈ [23] | C₆H₁₆N₂ [24] |
| Primary Function | Free radical initiator [23] | Free radical stabilizer/catalyst [24] |
| Mechanism of Action | Decomposes to form sulfate free radicals [23] | Accelerates APS decomposition and stabilizes radicals [23] |
| Storage Conditions | Fresh solution recommended [17] | Store in refrigerator in dark glass bottles [17] |
| Key Characteristics | Purity >99%, Refractive index: 1.417-1.419 [24] | Boiling range: 119-121°C [24] |
The polymerization mechanism begins when APS decomposes in water to produce sulfate free radicals [23]. TEMED then acts as a catalyst that accelerates this decomposition while simultaneously stabilizing the resulting free radicals [23]. These stabilized radicals initiate the polymerization reaction by attacking the double bonds of acrylamide monomers, creating growing polyacrylamide chains. Bisacrylamide, typically added at ratios of 1-5% relative to acrylamide, introduces cross-links between these chains through its two reactive double bonds, forming the three-dimensional gel network [22]. The pore size of this network—and thus the sieving properties of the gel—is determined by both the total acrylamide concentration and the ratio of bisacrylamide to acrylamide, with higher percentages creating smaller pores that provide greater resistance to the movement of larger proteins [21] [22]. This polymerized gel matrix is fundamental to the molecular weight-based separation of proteins in SDS-PAGE, with different acrylamide concentrations optimized for separating proteins of different size ranges.
Integrated Experimental Workflow
The successful execution of SDS-PAGE relies on the coordinated function of all four chemical components throughout a carefully orchestrated workflow. The process begins with gel preparation, where APS and TEMED are added to acrylamide/bisacrylamide solutions in Tris buffer to catalyze polymerization, first for the resolving gel and then for the stacking gel [22]. Meanwhile, protein samples are prepared in Laemmli buffer containing SDS, glycerol, bromophenol blue, and Tris-glycine at pH 6.8, often with the addition of reducing agents like β-mercaptoethanol or DTT to break disulfide bonds [17]. The prepared samples are then heated at 95°C for 5 minutes to ensure complete denaturation before being loaded into the wells of the stacking gel [1].
During electrophoresis, the integrated chemical system springs into action. When voltage is applied, the Tris-glycine electrode buffer (pH 8.3) facilitates current conduction, with glycine molecules entering the stacking gel (pH 6.8) and converting to their zwitterionic form [21] [6]. This establishes the ion fronts that stack proteins into a narrow zone. As this zone reaches the resolving gel (pH 8.8), the increased pH causes glycine to become fully deprotonated and mobile, depositing the proteins at the top of the resolving gel where their size-based separation begins [21] [17]. Throughout this process, SDS maintains proteins in their denatured, negatively charged state, ensuring separation occurs primarily according to molecular weight rather than intrinsic charge or structure [21] [6].
Diagram: Integrated Chemical Workflow in SDS-PAGE showing the two major phases: gel polymerization catalyzed by APS/TEMED, and protein separation driven by Tris-glycine pH dynamics.
The Scientist's Toolkit: Essential Research Reagents
Table 4: Essential Research Reagents for SDS-PAGE
| Reagent | Function | Typical Concentration/Composition |
|---|---|---|
| Acrylamide/Bis-acrylamide | Forms cross-linked polymer gel matrix for molecular sieving | 30-40% stock solution, 1:20 to 1:40 bis:acrylamide ratio [22] |
| Tris-HCl Buffer | Maintains pH in stacking (6.8) and resolving (8.8) gels | 0.5M pH 6.8 (stacking), 1.5M pH 8.8 (resolving) [22] |
| SDS (Sodium Dodecyl Sulfate) | Denatures proteins and confers uniform negative charge | 0.1-1% in buffers and gels [21] [1] |
| Ammonium Persulfate (APS) | Free radical initiator for acrylamide polymerization | 10% solution in water [22] |
| TEMED | Catalyst that accelerates free radical formation | 0.1% of gel volume [22] |
| Glycine | Mobile phase ion for discontinuous buffer system | 25mM in electrode buffer [1] |
| Sample Buffer | Denatures proteins and adds density for loading | Tris-HCl, SDS, glycerol, bromophenol blue, β-mercaptoethanol [21] [17] |
| Molecular Weight Marker | Provides size reference for estimating protein masses | Pre-stained or unstained proteins of known molecular weights [1] |
Advanced Applications and Technical Considerations
While the standard Tris-glycine SDS-PAGE system is effective for separating proteins in the 5-250 kDa range, specialized applications require modifications to the core chemical system. For the separation of low molecular weight proteins and peptides (1-100 kDa), the Tris-tricine SDS-PAGE system developed by Schägger and von Jagow offers superior resolution [25] [1]. This system replaces glycine (pK 9.6) with tricine (pK 8.15) in the electrophoresis buffer, which allows for better resolution of smaller proteins [25]. Tricine gels typically use lower acrylamide concentrations (10-16.5%) and may include additives like urea and glycerol to enhance separation of hydrophobic proteins and prevent peptide loss during staining [25]. The modified buffer system also facilitates easier transfer of hydrophobic proteins during western blotting and improves isolation of membrane protein complexes for mass spectrometric analysis [25].
Several technical considerations are crucial for optimal SDS-PAGE results. Protein loading should be optimized between 0.1-40 μg per well depending on detection method, with overloading leading to distorted bands [17]. The presence of interfering substances like KCl can cause SDS precipitation and should be minimized [17]. Additionally, safety protocols must be strictly followed, particularly with neurotoxic acrylamide monomers, which should never be poured down sinks and must be properly polymerized before disposal [17]. APS solutions should be prepared fresh or from recent stocks as they degrade within weeks, while TEMED should be stored in dark glass bottles under refrigeration to maintain efficacy [17]. Understanding these advanced applications and technical considerations enables researchers to adapt the core SDS-PAGE methodology to specific experimental needs while maintaining the integrity of their results.
The Laemmli buffer system, named after its developer Professor Ulrich K. Laemmli, is a fundamental reagent in molecular biology and biochemistry for preparing protein samples for sodium dodecyl sulfate-polyacrylamide gel electrophoresis (SDS-PAGE) [26] [12]. Introduced in the 1970s, this buffer system creates the essential physicochemical conditions required for high-quality separation of protein analytes based on their molecular weight [26]. The system's brilliance lies in its combination of multiple components that collectively denature proteins, impart uniform charge, and facilitate loading and tracking during electrophoretic separation. The Laemmli method remains the cornerstone technique for protein analysis across diverse fields, from basic research to drug development and food science [12]. Its enduring relevance decades after its development is a testament to its robustness and effectiveness in enabling accurate protein characterization.
Historical Context and Development
The Laemmli buffer system emerged from Professor Ulrich K. Laemmli's work in the 1970s, which refined the SDS-PAGE procedure into the standardized methodology widely used today [26]. This development occurred during ongoing scientific investigations into T4 phage proteins, representing a significant advancement over earlier electrophoretic methods that utilized starch gels [27] [12]. The Laemmli system's innovative approach to protein denaturation and separation fundamentally transformed protein analysis, providing researchers with a reliable method for determining molecular weights, assessing sample purity, and analyzing protein composition [12]. While alternative buffer systems such as the Morris SDS-PAGE sample buffer and phosphate-modified versions have been developed, the Laemmli-based formulation remains the predominant choice in laboratories worldwide [27].
Comprehensive Composition of Laemmli Buffer
Laemmli buffer consists of five critical components that work in concert to prepare protein samples for optimal separation in SDS-PAGE. Each component serves a specific biochemical function that collectively ensures proteins are properly denatured, charged, and visualized during electrophoresis.
Table 1: Core Components of Laemmli Buffer and Their Functions
| Component | Chemical Function | Role in SDS-PAGE |
|---|---|---|
| SDS (Sodium Dodecyl Sulfate) | Anionic surfactant that disrupts non-covalent bonds [26] | Linearizes proteins and imparts uniform negative charge [26] [27] |
| Reducing Agent (β-mercaptoethanol or DTT) | Thiol-containing compound that breaks disulfide bonds [26] | Disrupts covalent tertiary/quaternary structures [26] [28] |
| Glycerol | High-density viscous liquid (density: 1.26 g/cm³) [26] | Increases sample density for well loading [26] [27] |
| Tris Buffer | Buffering agent maintaining pH 6.8 [26] [27] | Stabilizes chemical conditions; enables stacking effect [26] |
| Tracking Dye (Bromophenol Blue) | Colored pH indicator molecule [26] | Visualizes sample loading and migration front [26] [28] |
Quantitative Formulations
Laemmli buffer is typically prepared as concentrated stock solutions (2X, 4X, 5X, or 6X) and diluted to 1X working concentration when mixed with protein samples [27] [28]. This approach conserves reagents and allows flexibility for different experimental needs.
Table 2: Standard Laemmli Buffer Formulations
| Reagent | Molecular Weight | 1X Concentration | 2X Concentration | 4X Concentration | 5X Concentration |
|---|---|---|---|---|---|
| Tris base | 121.14 g/mol | 0.0625 M [27] | 0.125 M [27] | 0.25 M [27] | 0.06 M [29] |
| SDS | 288.37 g/mol | 2% [29] | 4% [27] | 8% [27] | 2% [29] |
| Glycerol | 92.09 g/mol | 10% [27] | 20% [27] | 40% [27] | 10% [29] |
| β-mercaptoethanol | 78.13 g/mol | 5% [27] | 10% [27] | 20% [27] | 5% [29] |
| Bromophenol blue | 691.94 g/mol | 0.01% [29] | 0.02% [27] | 0.04% [27] | 0.01% [29] |
The selection between reducing and non-reducing formulations represents a critical experimental consideration. Reducing buffers include agents like β-mercaptoethanol or DTT and are used when complete protein denaturation and accurate molecular weight determination are desired [28]. Non-reducing formulations preserve disulfide bonds and are appropriate for studying protein complexes, conformational epitopes, or when downstream applications are sensitive to reducing agents [28].
Detailed Mechanistic Actions
Protein Denaturation and Linearization
The fundamental mechanism of Laemmli buffer begins with the comprehensive denaturation of protein structures. SDS, an anionic detergent, plays the primary role in this process by binding to hydrophobic regions of proteins at an approximate ratio of 1.4g SDS per 1g of protein [26]. This binding disrupts hydrogen bonds, van der Waals forces, and other non-covalent interactions that maintain secondary and tertiary structures [26]. The resulting protein-SDS complexes become linearized polypeptides with their intrinsic charge masked by the overwhelming negative charge contributed by SDS molecules.
Disulfide Bond Reduction
While SDS effectively disrupts non-covalent interactions, it cannot break covalent disulfide bonds that stabilize tertiary and quaternary structures [26]. Reducing agents including β-mercaptoethanol (BME) or dithiothreitol (DTT) address this limitation through their thiol groups, which nucleophilically attack sulfur atoms in disulfide linkages [26]. This reduction reaction converts oxidized disulfides to reduced thiol groups,彻底 separating protein subunits and ensuring complete unfolding [26]. The reducing agents themselves become oxidized during this process, necessitating their fresh addition in some protocols to maintain efficacy [27].
Charge Uniformity and Electrophoretic Mobility
SDS binding confers a uniform negative charge density along the entire length of denatured polypeptides, approximately one SDS molecule per two amino acid residues [26]. This charge standardization ensures that electrophoretic migration through the polyacrylamide gel matrix depends solely on molecular size rather than inherent protein charge [27]. Under the influence of an electric field, all protein-SDS complexes migrate toward the anode, with smaller molecules moving faster through the gel pores than larger ones [12].
pH Optimization and Stacking Effect
Tris buffer maintained at pH 6.8 serves multiple critical functions in the Laemmli system. This specific pH matches that of the stacking gel in SDS-PAGE and approaches the isoelectric point of glycine (pI 6.08) present in the running buffer [26]. During electrophoresis, this creates a discontinuous buffer system where chloride ions from Tris-HCl migrate rapidly, glycine ions migrate slowly, and protein-SDS complexes concentrate between these fronts [26]. This "stacking" effect compresses protein samples into sharp bands before they enter the resolving gel, dramatically improving resolution [26]. Additionally, the maintained pH inhibits protease activity and prevents peptide bond hydrolysis that can occur at extreme pH values [27].
Practical Sample Handling
Glycerol and tracking dye address essential practical considerations in SDS-PAGE workflow. Glycerol's high density (1.26 g/cm³) increases the density of the sample mixture, causing it to sink to the bottom of gel wells instead of diffusing into the running buffer [26]. Bromophenol blue provides visual confirmation of successful sample loading and allows monitoring of electrophoretic progression through the gel [26] [28]. The dye front migrates ahead of even the smallest proteins, providing a visual indicator that electrophoresis should be stopped before proteins exit the gel [26].
Diagram 1: Laemmli Buffer Protein Processing Mechanism. This workflow illustrates the sequential mechanism of protein denaturation and preparation for SDS-PAGE using Laemmli buffer.
Practical Protocols and Methodologies
Buffer Preparation Protocol
The preparation of Laemmli buffer requires precision to ensure optimal performance in protein separation. The following protocol details the preparation of 50mL of 2X stock solution [27]:
- Tris Solution Preparation: Dissolve 0.747g of Tris base in approximately 10mL of deionized water using a magnetic stirrer [27].
- pH Adjustment: Carefully adjust the solution to pH 6.8 using concentrated HCl. This step should be performed in a fume hood due to hazardous HCl fumes. Avoid overshooting the target pH [27].
- Glycerol Addition: Add 10mL of glycerol to the Tris solution and mix thoroughly [27].
- SDS and Dye Incorporation: Add 2g of SDS and 100mg of bromophenol blue to the mixture. Stir continuously until complete dissolution is achieved. SDS may require extended stirring to dissolve fully [27].
- Reducing Agent Addition: For reducing buffer formulations, add 5mL of β-mercaptoethanol. This step must be performed in a fume hood due to the reagent's toxicity and irritant properties [27].
- Volume Adjustment and Storage: Bring the final volume to 50mL with deionized water. Aliquot and store at -20°C. For extended storage, the reducing agent can be added immediately before use to maintain efficacy [27].
Sample Preparation and Electrophoresis
Proper sample preparation is critical for successful protein separation. The standard workflow involves [28]:
- Sample Mixing: Combine protein sample with an equal volume of 2X Laemmli buffer (or appropriate volume for other concentrations) to achieve 1X working concentration [28].
- Denaturation: Heat the mixture at 95-100°C for 3-5 minutes to ensure complete denaturation. For non-reducing buffers or delicate samples, moderate heating (70-80°C) may preserve certain structural features [28].
- Centrifugation: Briefly centrifuge samples to collect condensation and ensure uniform sample distribution.
- Gel Loading: Load denatured samples into SDS-PAGE gel wells, utilizing glycerol's density to keep samples positioned correctly [26] [28].
- Electrophoresis: Conduct electrophoresis using Tris-glycine-SDS running buffer at appropriate constant current or voltage until the bromophenol blue tracking dye approaches the gel bottom [26] [30].
Protein Quantification in Laemmli Buffer
Traditional protein assay methods often fail with Laemmli buffer due to interference from SDS and other components. Karlsson et al. developed a specialized turbidimetric method for protein quantification directly in Laemmli buffer [31]:
- Principle: Trichloroacetic acid (TCA) is added to a final concentration of 24%, inducing protein precipitation and turbidity [31].
- Measurement: Turbidity is measured at 570nm using a microplate reader after 10-30 minutes of incubation [31].
- Range: The assay detects bovine serum albumin at concentrations of 15-500μg/mL in Laemmli buffer, corresponding to 2-75μg protein per microtiter plate well [31].
- Limitation: Nonproteinaceous macromolecules in samples may interfere with measurements [31].
Applications in Research and Development
The Laemmli buffer system serves as an essential tool across diverse scientific disciplines, with particular significance in biomedical research and drug development.
Basic Research Applications
In fundamental science, Laemmli buffer enables protein characterization through multiple approaches [12]:
- Molecular Weight Determination: By comparing electrophoretic mobility to standard proteins of known mass [12].
- Purity Assessment: Evaluating sample homogeneity and identifying contaminants [12].
- Complex Analysis: Comparing reducing versus non-reducing conditions to identify disulfide-linked subunits [12].
- Expression Verification: Confirming protein expression in recombinant systems [12].
Pharmaceutical and Diagnostic Applications
The buffer system supports critical applications in drug development and biotechnology [12]:
- Antibody Characterization: Analyzing antibody heavy and light chain composition under reducing conditions [12].
- Quality Control: Monitoring protein integrity during purification processes [12].
- Biomarker Validation: Verifying protein identity in diagnostic applications [12].
- Western Blotting: Preparing samples for immunoblotting-based detection methods [28].
Food Science and Quality Assessment
SDS-PAGE with Laemmli buffer has become standard methodology in food science for [12]:
- Allergen Detection: Identifying and characterizing allergenic proteins in food products [12].
- Species Authentication: Detecting adulteration or species substitution in meat and seafood [12].
- Process Monitoring: Assessing protein modifications during food processing [12].
- Functional Property Analysis: Relating protein composition to functional properties like elasticity, foaming, and gelling [12].
The Researcher's Toolkit
Table 3: Essential Reagents and Materials for SDS-PAGE with Laemmli Buffer
| Reagent/Material | Specification | Research Function |
|---|---|---|
| Laemmli Buffer | 2X, 4X, or 6X; reducing/non-reducing [28] | Protein denaturation and preparation for SDS-PAGE [28] |
| SDS | Electrophoresis purity [28] | Protein denaturation and charge uniformity [26] |
| β-mercaptoethanol or DTT | Molecular biology grade [28] | Disulfide bond reduction in reducing buffers [26] |
| Tris Base/HCl | High purity; pH 6.8 [27] | Buffering capacity and pH maintenance [26] |
| Acrylamide/Bis-acrylamide | 30% solution, 37.5:1 ratio [30] | Gel matrix formation for molecular sieving [30] |
| TEMED | Electrophoresis grade [30] | Polyacrylamide gel polymerization catalyst [30] |
| Ammonium Persulfate | Electrophoresis grade [30] | Polyacrylamide gel polymerization initiator [30] |
| Glycine | Electrophoresis grade [26] | Running buffer component for SDS-PAGE [26] |
| Protein Standards | Pre-stained or unstained [12] | Molecular weight calibration and migration tracking [12] |
Troubleshooting and Technical Considerations
Successful implementation of the Laemmli buffer system requires attention to potential technical challenges:
Table 4: Common Issues and Resolution Strategies
| Problem | Potential Causes | Solutions |
|---|---|---|
| Poor band separation | Incomplete denaturation, incorrect pH, degraded SDS [28] | Use fresh reducing buffer with heating; verify buffer pH [28] |
| Sample smearing | Protein overload, high salt content, sample degradation [28] | Reduce protein load; desalt samples; use fresh reagents [28] |
| Abnormal migration | Improper buffer formulation, oxidized reducing agents [28] | Prepare fresh buffer with active reducing agents [28] |
| Weak signal | Excessive dye, interfering substances, low protein [28] | Reduce interfering components; concentrate sample [28] |
| Protein aggregation | Insufficient reduction or denaturation [28] | Increase reducing agent; ensure complete heating [28] |
Critical Optimization Parameters
Several factors require particular attention for optimal results:
- Reducing Agent Stability: β-mercaptoethanol and DTT degrade over time, especially upon repeated freeze-thaw cycles. Aliquoting and proper storage at -20°C maintains efficacy [27] [28].
- pH Precision: Accurate pH adjustment to 6.8 is crucial for proper stacking and separation. Deviations can cause poor resolution and band distortion [26] [27].
- Sample Composition: High salt concentrations or detergents in protein samples can interfere with SDS binding and migration. Dialysis or desalting may be necessary [28].
- Gel Percentage Selection: Appropriate acrylamide concentration depends on target protein size ranges. Lower percentages (8-10%) resolve higher molecular weight proteins, while higher percentages (15-20%) optimize separation of smaller proteins [30].
The Laemmli buffer system represents a elegantly designed biochemical tool that continues to serve as an indispensable component of protein analysis decades after its development. Its sophisticated combination of denaturants, reducing agents, buffering systems, and practical additives addresses the multifaceted challenges of protein separation by SDS-PAGE. While alternative methodologies continue to emerge, the robustness, reliability, and effectiveness of the Laemmli system ensure its ongoing relevance in research laboratories, pharmaceutical development, and quality control applications. Understanding both the theoretical principles and practical considerations of this fundamental tool empowers researchers to optimize experimental outcomes and advance scientific discovery across diverse fields of inquiry.
Mastering the Protocol: From Sample Preparation to Real-World Applications
Sodium Dodecyl Sulfate-Polyacrylamide Gel Electrophoresis (SDS-PAGE) is a foundational analytical technique in biochemical research and drug development, enabling the separation of complex protein mixtures based on their molecular weight [32] [33]. This high-resolution separation is a critical step in various applications, from assessing protein purity and expression levels to preparing samples for mass spectrometry or western blotting [14]. The technique relies on the principle that proteins treated with the detergent SDS become uniformly negatively charged and linearized, ensuring their migration through a polyacrylamide gel matrix is determined solely by polypeptide chain length rather than intrinsic charge or three-dimensional structure [32] [34]. This guide provides a detailed, step-by-step workflow for the core manual procedures of SDS-PAGE: gel casting, sample loading, and electrophoresis execution, providing researchers with the practical knowledge to obtain reproducible and reliable results.
Core Principles and Components of SDS-PAGE
The Role of Key Chemicals
The effectiveness of SDS-PAGE hinges on the specific functions of several key chemicals that prepare proteins for separation.
- Sodium Dodecyl Sulfate (SDS): This anionic detergent plays a dual role. First, it disrupts hydrogen bonds and non-covalent interactions within protein molecules, effectively unfolding them into linear polypeptide chains [34] [33]. Second, SDS binds to the protein backbone at a constant ratio, conferring a uniform negative charge to all proteins. This gives all proteins a similar charge-to-mass ratio, ensuring that separation during electrophoresis is based primarily on molecular size [32] [33].
- Reducing Agents (BME/DTT): Beta-mercaptoethanol (BME) or dithiothreitol (DTT) are reducing agents that break disulfide bridges between cysteine residues, further facilitating the complete unfolding of proteins into their primary polypeptide structure [33].
- Polyacrylamide Gel: The polyacrylamide gel serves as a molecular sieve. It is formed by the polymerization of acrylamide monomers cross-linked by bis-acrylamide, creating a porous mesh [33]. The pore size, determined by the concentration of acrylamide, dictates the resolution range for different protein sizes [32] [30].
The Discontinuous Gel System
A key feature of standard SDS-PAGE is the use of a discontinuous gel system, which consists of two distinct layers with different chemical and physical properties [34] [33].
- Stacking Gel: The upper layer is a low-percentage (e.g., 4-5%) polyacrylamide gel at a lower pH (6.8). Its primary function is to concentrate all protein samples into a sharp, unified band before they enter the resolving gel. This is achieved through an ion gradient formed between the leading chloride ions (from the gel buffer) and the trailing glycine ions (from the running buffer) at the stacking gel pH, which creates a narrow voltage gradient that herds the proteins into a tight zone [34].
- Resolving Gel: The lower layer is a higher-percentage (e.g., 8-20%) polyacrylamide gel at a higher pH (8.8). This is where the actual separation of proteins by molecular weight occurs. The smaller pore size and changed pH environment cause the glycine ions to become negatively charged and speed ahead, depositing the protein sample at the top of the resolving gel. The proteins then migrate at different speeds based on their size through the denser gel matrix [34] [33].
The following diagram illustrates the workflow and the key ionic events during the electrophoresis process.
Research Reagent Solutions and Materials
Successful execution of SDS-PAGE requires a set of specific reagents and materials, each with a defined function in the process.
Table 1: Essential Reagents and Materials for SDS-PAGE
| Item | Function / Role in the Procedure |
|---|---|
| Acrylamide/Bis-acrylamide | Forms the porous polyacrylamide gel matrix that acts as a molecular sieve for separation [33]. |
| Tris-HCl Buffer | Provides the appropriate pH environment for both gel polymerization and electrophoresis [34]. |
| SDS (Sodium Dodecyl Sulfate) | Denatures proteins and imparts a uniform negative charge, allowing separation by size [32] [34]. |
| Ammonium Persulfate (APS) | Initiator of the free-radical polymerization reaction for gel formation [33]. |
| TEMED | Catalyst that works with APS to accelerate the polymerization of acrylamide [33]. |
| Glycine | Key component of the running buffer; its charge state change in different gel layers enables the stacking effect [34]. |
| Comb | Creates wells in the stacking gel for loading protein samples and molecular weight markers [32]. |
| Sample Buffer (Laemmli Buffer) | Contains SDS, glycerol, tracking dye, and often a reducing agent to denature and prepare the sample for loading [34]. |
| Molecular Weight Marker | A mixture of proteins of known sizes that allows estimation of the molecular weights of unknown proteins [32] [35]. |
Detailed Step-by-Step Protocols
Gel Casting Protocol
Casting a high-quality gel is the first critical step. The following protocol is adapted from common laboratory practices [32] [30].
Table 2: SDS-PAGE Gel Recipe for a Standard Mini-Gel System (15 mL total volume)
| Component | Resolving Gel (e.g., 12%) | Stacking Gel (5%) |
|---|---|---|
| 30% Acrylamide/Bis Mix | 6.0 mL | 1.98 mL |
| 1.5 M Tris-HCl (pH 8.8) | 3.75 mL | - |
| 0.5 M Tris-HCl (pH 6.8) | - | 3.78 mL |
| 10% SDS | 150 µL | 150 µL |
| Deionized H₂O | 5.02 mL | 9.0 mL |
| 10% Ammonium Persulfate (APS) | 75 µL | 75 µL |
| TEMED | 7.5 µL | 15 µL |
Procedure:
- Assemble Casting Apparatus: Thoroughly clean and dry the glass plates and spacers. Assemble the gel cassette according to the manufacturer's instructions, ensuring it is properly sealed to prevent leaks [32] [30].
- Prepare and Pour Resolving Gel: In a beaker or conical flask, mix all components for the resolving gel except APS and TEMED. Once mixed, add APS and TEMED, swirl gently to mix, and immediately pipette the solution into the gel cassette. Leave appropriate space for the stacking gel (e.g., ~2.5 cm from the top) [30].
- Overlay and Polymerize: Carefully overlay the resolving gel with water-saturated isopropanol or n-butanol to exclude oxygen and ensure a flat, uniform gel surface. Allow the gel to polymerize completely for 20-45 minutes. A distinct schlieren line will appear between the gel and the overlay once polymerization is complete [32] [33] [30].
- Prepare and Pour Stacking Gel: Pour off the overlay liquid and rinse the top of the resolving gel with deionized water. Wick away any residual liquid with a lint-free tissue [30]. In a new container, mix the stacking gel components, again adding APS and TEMED last. Pour the stacking gel solution directly onto the resolving gel and immediately insert a clean comb without introducing air bubbles.
- Complete Polymerization: Allow the stacking gel to polymerize for at least 20-30 minutes. Once set, the gel can be used immediately or wrapped in a damp paper towel, sealed in plastic wrap, and stored at 4°C for several days [30].
Sample Preparation Protocol
Proper sample preparation is crucial for clear and accurate results [36].
- Lysate Preparation: Lyse cells or tissues in an appropriate ice-cold lysis buffer (e.g., RIPA buffer) containing protease and phosphatase inhibitors to prevent degradation [35] [36]. Clarify the lysate by centrifugation at 14,000 x g for 15 minutes at 4°C and transfer the supernatant to a new tube [36].
- Protein Quantification: Determine the protein concentration of the supernatant using a protein assay, such as the BCA assay, which is compatible with detergents commonly found in lysis buffers [35] [36].
- Denaturation and Reduction: Mix the protein sample with an equal volume of 2X Laemmli sample buffer. A typical 1X final mixture contains: 50 mM Tris-HCl (pH 6.8), 2% SDS, 10% glycerol, 0.02% bromophenol blue, and often 100 mM DTT or 5% BME as a reducing agent [34] [35] [36].
- Heat Denaturation: Heat the samples at 95-100°C for 3-5 minutes in a heat block to ensure complete denaturation [32] [35]. Note: Some protocols recommend heating at 70°C for 10 minutes to prevent potential proteolysis or protein aggregation [36]. After heating, briefly centrifuge the tubes to collect condensation.
Electrophoresis Execution Protocol
- Set Up Electrophoresis Unit: Remove the comb from the polymerized gel and assemble the gel cassette into the electrophoresis chamber. Fill the inner (upper) and outer (lower) chambers with running buffer (e.g., 25 mM Tris, 192 mM glycine, 0.1% SDS, pH 8.3). Use a syringe to flush out any air bubbles from the wells and from beneath the bottom of the gel [32].
- Load Samples: Using a fine-tip pipette, load equal amounts of protein (e.g., 10-30 µg) or a constant volume of each prepared sample into the wells. Include one well for the molecular weight marker [32] [35].
- Run Electrophoresis: Connect the electrodes to the power supply (cathode, negative electrode, at the top; anode, positive electrode, at the bottom). Apply a constant voltage of 80-100 V initially. Once the samples have condensed and entered the resolving gel (as seen by the dye front becoming sharp and thin), increase the voltage to 110-150 V [35]. Continue the run until the bromophenol blue tracking dye front reaches the bottom of the gel.
- Post-Electrophoresis Analysis: Turn off the power supply, disassemble the apparatus, and carefully pry the glass plates apart. The gel can then be used for downstream applications such as staining with Coomassie Blue for total protein visualization or transferred to a membrane for western blotting [32] [35].
Technical Considerations and Optimization
Choosing the Correct Gel Percentage
The concentration of acrylamide in the resolving gel determines its effective separation range. Optimizing the gel percentage is key to resolving proteins of interest.
Table 3: Guide to Resolving Gel Percentage and Protein Separation Range
| Size of Protein (kDa) | Recommended Acrylamide Percentage |
|---|---|
| 4 - 40 | 20% |
| 12 - 45 | 15% |
| 10 - 70 | 12.5% |
| 15 - 100 | 10% |
| 25 - 200 | 8% |
Troubleshooting Common Issues
- Smiling Bands: This can be caused by excessive heat during the run. Ensure the electrophoresis unit is placed in a cold room or use a cooling unit if running at high voltages for extended periods.
- Diffuse or Smeared Bands: This often results from incomplete denaturation of proteins. Ensure the sample buffer is fresh and the heating step is performed correctly. Overloading the well with too much protein can also cause smearing [36].
- Atypical Migration: If a protein runs at a molecular weight different from expected, consider post-translational modifications (e.g., glycosylation, phosphorylation) that can affect SDS binding and mobility. High hydrophobicity can also lead to altered migration [34].
The manual SDS-PAGE workflow, from the precise casting of the discontinuous polyacrylamide gel to the final execution of electrophoresis, remains a cornerstone technique in molecular biology and biochemistry. A deep understanding of the role of each component—especially SDS in denaturing and charging proteins, and the discontinuous buffer system in sharpening bands—is fundamental to obtaining high-quality, reproducible data. By meticulously following the detailed protocols for gel casting, sample preparation, and electrophoresis execution outlined in this guide, researchers and drug development professionals can reliably separate proteins by molecular weight. This robust separation forms the basis for a wide array of subsequent analytical techniques that drive discovery and innovation in the life sciences.
In the realm of protein research, Sodium Dodecyl Sulfate-Polyacrylamide Gel Electrophoresis (SDS-PAGE) stands as a cornerstone technique for separating complex protein mixtures based on molecular weight. The reliability and resolution of this technique are fundamentally dependent on proper sample preparation, a process that dictates the success of subsequent analysis. Within this framework, reducing agents, denaturation protocols, and buffer compatibility serve as the essential triad that ensures proteins are appropriately linearized, charged, and presented to the gel matrix for accurate separation. The meticulous preparation of protein samples determines whether researchers obtain crisp, interpretable bands or problematic smears and artifacts that compromise data integrity [37] [38]. This technical guide examines the core components of SDS-PAGE sample preparation, providing researchers with detailed methodologies and principles to optimize protein separation for research and drug development applications.
Core Components of SDS-PAGE Sample Buffer
The sample buffer is a precisely formulated mixture of chemical components each serving specific functions in preparing proteins for electrophoretic separation. Understanding the role of each constituent allows researchers to troubleshoot issues and modify protocols for specific protein types.
Denaturing Agents: SDS and Heat
Sodium Dodecyl Sulfate (SDS) is a potent anionic detergent that plays two critical roles in protein denaturation. First, it disrupts hydrogen bonds and hydrophobic interactions that maintain secondary and tertiary protein structure, effectively unfolding polypeptide chains into random conformations. Second, SDS binds to the protein backbone at a relatively constant ratio of approximately 1.4 g SDS per 1.0 g protein, imparting a uniform negative charge density along the unfolded polypeptide [38] [32]. This SDS coating masks the proteins' intrinsic charge, ensuring that migration through the polyacrylamide gel depends primarily on molecular weight rather than charge or shape [37] [39].
Heat treatment, typically at 85-100°C for 2-10 minutes, complements SDS action by increasing molecular motion to overcome energy barriers that stabilize native protein structure [40] [13] [32]. The thermal energy shakes up protein molecules, allowing SDS to penetrate hydrophobic regions and complete the denaturation process. However, excessive heating can cause protein aggregation, necessitating optimization of temperature and duration for different sample types [13].
Reducing Agents: Breaking Disulfide Bonds
Reducing agents are crucial for disrupting covalent disulfide bonds that stabilize tertiary and quaternary protein structures. The following table compares common reducing agents used in SDS-PAGE sample preparation:
Table 1: Comparison of Reducing Agents for SDS-PAGE
| Reducing Agent | Typical Concentration | Mechanism of Action | Advantages | Disadvantages |
|---|---|---|---|---|
| Dithiothreitol (DTT) | 20-100 mM | Reduces disulfide bonds through thiol-disulfide exchange | Less odor; effective denaturation [13] | Requires higher cost; less stable in buffer storage |
| 2-Mercaptoethanol (BME) | 1-5% (v/v) | Reduces disulfide bonds through thiol-disulfide exchange | Low cost; widely available | Strong unpleasant odor; may require boiling for complete reduction [13] |
| Tris(2-carboxyethyl)phosphine (TCEP) | 10-50 mM | Reduces disulfide bonds through phosphine-based mechanism | Odorless; more stable; effective at lower pH | Higher cost; may interfere with some detection methods |
These reducing agents break disulfide linkages by providing an alternative electron exchange pathway, converting cystine residues to cysteine and ensuring complete unfolding of polypeptide chains [13]. Without this reduction step, proteins may maintain higher-order structure through covalent bonds, leading to anomalous migration and inaccurate molecular weight determination.
Supporting Buffer Components
The sample buffer contains several additional components that facilitate the electrophoresis process:
- Tris buffer (typically at pH 6.8) maintains a stable pH environment critical for the stacking process in discontinuous gel electrophoresis [13].
- Glycerol (10-20%) increases the density of the sample solution, ensuring it sinks to the bottom of the sample wells rather than diffusing into the running buffer [40] [13].
- Tracking dyes (bromophenol blue, phenol red, or Coomassie G-250) provide a visible marker to monitor electrophoresis progress as they migrate ahead of the proteins [40].
- EDTA (ethylenediaminetetraacetic acid) chelates divalent cations that could act as cofactors for proteolytic enzymes, thereby protecting samples from degradation [13].
Buffer Systems and Compatibility
The compatibility between sample buffer and gel system determines the efficacy of protein separation. Different gel chemistries require specifically formulated sample buffers to optimize resolution.
Table 2: Sample Buffer Compositions for Different Gel Systems
| Gel System | Sample Buffer Type | Key Components | Sample Preparation Conditions |
|---|---|---|---|
| Tris-Glycine | Tris-Glycine SDS Sample Buffer | Tris HCl (63 mM), Glycerol (10%), SDS (2%), Bromophenol Blue (0.0025%), pH 6.8 [40] | Heat at 85°C for 2-5 minutes [40] |
| Bis-Tris | LDS Sample Buffer | Tris base (141 mM), Tris HCl (106 mM), LDS (2%), EDTA (0.51 mM), SERVA Blue G-250 (0.22 mM), Phenol Red (0.175 mM), pH 8.5 [40] | Heat at 70°C for 10 minutes [40] |
| Tris-Acetate | LDS Sample Buffer | Same as Bis-Tris system above [40] | Heat at 70°C for 10 minutes [40] |
| Tris-Tricine | Tricine SDS Sample Buffer | Tris HCl (450 mM), Glycerol (12%), SDS (4%), Coomassie Blue G (0.00075%), Phenol Red (0.0025%), pH 8.45 [40] | Heat at 85°C for 2-5 minutes [40] |
The choice between lithium dodecyl sulfate (LDS) and SDS represents another important consideration. LDS offers improved solubility in concentrated solutions, enabling the formulation of 4X stock solutions that minimize sample dilution while maintaining denaturing capability [40]. The migration characteristics of tracking dyes also vary between buffer systems; for example, Coomassie G-250 migrates closer to the ion front than bromophenol blue in Bis-Tris systems, preventing small peptides from running off the gel [40].
Experimental Protocols for Sample Preparation
Standard SDS-PAGE Sample Preparation Protocol
The following step-by-step protocol ensures complete denaturation and reduction of protein samples for optimal SDS-PAGE resolution:
Determine protein concentration of samples using an appropriate assay (BCA, Bradford, etc.). Adjust concentrations so that final loaded amount will be 0.5-1.0 μg per expected band for minigel systems [13].
Prepare sample buffer at 2X concentration containing:
- 2% SDS
- 20% glycerol
- 20 mM Tris-Cl, pH 6.8
- 2 mM EDTA
- 160 mM DTT (or 5% 2-mercaptoethanol)
- 0.1 mg/ml bromophenol blue [13]
Mix protein sample with an equal volume of 2X sample buffer. For example, combine 10 μL protein solution (at 2 mg/mL) with 10 μL 2X sample buffer [13].
Denature samples by heating at 85-100°C for 2-10 minutes, depending on protein stability and sample buffer specifications [40] [32]. The optimal temperature and time balance complete denaturation against potential aggregation from excessive heat.
Briefly centrifuge samples (15,000 rpm for 1 minute) to collect condensation and ensure all material is at the bottom of the tube [32].
Load samples immediately onto the polyacrylamide gel or store at -20°C for future use [13].
Specialized Sample Preparation Techniques
Membrane protein enrichment: Membrane proteins often require modified protocols due to their hydrophobic nature. Increasing SDS concentration to 3-5% and extending heating time to 15-20 minutes at 60-70°C can improve solubilization without promoting aggregation [41].
Dilute sample concentration: For samples with low protein concentration, trichloroacetic acid (TCA) precipitation can concentrate proteins while removing interfering substances:
- Add 100 μL of 10% TCA to 100 μL of sample
- Incubate on ice for 20 minutes
- Centrifuge at maximum speed for 15 minutes
- Wash pellet with 100 μL ice-cold ethanol
- Dry pellet and resuspend in 1X SDS-PAGE sample buffer [39]
Activity preservation with NSDS-PAGE: For applications requiring retention of enzymatic activity or metal cofactors, a Native SDS-PAGE (NSDS-PAGE) method can be employed:
- Prepare sample without SDS or reducing agents
- Omit the heating step
- Use running buffer with reduced SDS concentration (0.0375% instead of 0.1%)
- This approach preserves 70-98% of zinc ions in metalloproteins while maintaining high resolution separation [14]
The Scientist's Toolkit: Essential Research Reagents
Table 3: Essential Reagents for SDS-PAGE Sample Preparation
| Reagent | Function | Considerations |
|---|---|---|
| SDS (Sodium Dodecyl Sulfate) | Denatures proteins and confers negative charge | Use high-purity grade; concentration typically 1-4% in sample buffer |
| DTT (Dithiothreitol) | Reduces disulfide bonds | Preferred over 2-mercaptoethanol due to lower odor; prepare fresh stock solutions |
| Tris Buffer | Maintains pH environment | pH critical for discontinuous electrophoresis (typically pH 6.8 for sample buffer) |
| Glycerol | Increases sample density | Ensures samples sink to bottom of wells; typically 10-20% |
| Tracking Dye | Visualizes migration front | Bromophenol blue common, but Coomassie G-250 preferred for Bis-Tris systems |
| EDTA | Chelates divalent cations | Protects against metalloprotease activity; typically 1-2 mM |
| Acrylamide/Bis-acrylamide | Forms gel matrix | Neurotoxic in monomeric form; use with appropriate safety precautions [39] |
| Ammonium Persulfate & TEMED | Gel polymerization catalysts | Prepare ammonium persulfate fresh; TEMED concentration affects polymerization rate [39] |
Troubleshooting Common Sample Preparation Issues
Despite standardized protocols, researchers frequently encounter challenges in sample preparation that affect electrophoretic results:
Protein aggregation: Manifesting as smearing or high molecular weight clusters, aggregation often results from excessive heating or insufficient reducing agent. Remedy by optimizing heating temperature (try 70-85°C instead of 100°C) and ensuring fresh reducing agent is used [13].
Incomplete denaturation: evidenced by multiple bands for a single protein or anomalous migration, may stem from insufficient SDS, inadequate reduction, or improper buffer composition. Solution includes increasing SDS concentration to 2-4%, using fresh DTT (20-100 mM), and verifying buffer pH [38] [13].
Proteolytic degradation: appearing as unexpected low molecular weight bands, can be minimized by working rapidly on ice, including protease inhibitors in initial extraction buffers, and maintaining adequate EDTA (1-2 mM) in sample buffer to chelate metalloprotease cofactors [13].
Salt effects: High salt concentrations in samples can cause band distortion and smiling effects. For salt-containing samples, implement a precipitation step (TCA/acetone) prior to dissolution in sample buffer [39].
Advanced Applications and Future Directions
The principles of SDS-PAGE sample preparation continue to evolve with emerging research needs. The development of Native SDS-PAGE (NSDS-PAGE) represents a significant advancement for metalloprotein research, enabling high-resolution separation while preserving metal binding and enzymatic activity [14]. This technique modifies standard conditions by eliminating SDS and reducing agents from sample buffer, omitting the heating step, and reducing SDS concentration in running buffer to 0.0375%.
For proteomic applications requiring mass spectrometry compatibility, novel SDS removal techniques have been developed, including potassium chloride-mediated precipitation of SDS as potassium dodecyl sulfate (KDS), which removes >99.9% of SDS while maintaining >95% peptide recovery [41]. This advancement enables the powerful protein-solubilizing capacity of SDS to be leveraged for LC-MS/MS proteomics.
The integration of multiplexed fluorescent detection capabilities has influenced sample buffer composition, with commercially available fluorescent-compatible buffers omitting dyes like bromophenol blue that interfere with fluorescent channels [40]. These adaptations demonstrate how sample preparation essentials continue to evolve with technological advancements in protein analysis.
Workflow and Buffer Selection Diagrams
SDS-PAGE Sample Preparation Workflow
Buffer Selection Guide for Different Applications
Proper sample preparation forms the critical foundation for successful SDS-PAGE analysis, with reducing agents, denaturation protocols, and buffer compatibility serving as non-negotiable essentials. The meticulous selection and application of these components directly determine the resolution, accuracy, and reproducibility of protein separation. As electrophoretic techniques continue to evolve alongside analytical demands, the fundamental principles outlined in this guide - complete protein denaturation, thorough disulfide reduction, and appropriate buffer selection - remain paramount. By mastering these sample preparation essentials, researchers ensure their SDS-PAGE work provides reliable, interpretable data that advances scientific understanding and drug development efforts.
Sodium dodecyl sulfate-polyacrylamide gel electrophoresis (SDS-PAGE) serves as a fundamental pillar in protein research, enabling the separation of complex protein mixtures based on their molecular weights. This technique forms an essential component of the western blotting workflow and is indispensable for protein characterization in both basic research and drug development contexts. The polyacrylamide gel matrix acts as a molecular sieve, with its pore size directly determined by the gel concentration, thereby governing the separation efficiency for different protein sizes [42].
The core principle of SDS-PAGE relies on the fact that proteins are denatured and uniformly coated with the anionic detergent SDS, which confers a consistent negative charge-to-mass ratio. This process eliminates the influence of native protein charge and structure, ensuring that migration through the gel matrix depends primarily on molecular size [20]. Within this system, the gel percentage—referring to the total concentration of acrylamide—stands as a critical variable that researchers must optimize to achieve high-resolution separation for their specific protein targets. Proper gel selection ensures that proteins of interest migrate adequately to allow for clear distinction from other proteins in the sample, which is crucial for accurate analysis in downstream applications.
The Polyacrylamide Matrix: Core Component of the SDS-PAGE System
The polyacrylamide gel forms the physical matrix through which proteins migrate during electrophoresis. This network is created through the polymerization of acrylamide monomers cross-linked by N,N'-methylene bisacrylamide (bis) [42]. The resulting gel structure creates a three-dimensional mesh with pores whose sizes are determined by two key factors: the total acrylamide concentration (%T) and the amount of cross-linker (%C) [42].
The polymerization reaction is typically initiated by ammonium persulfate (APS) and catalyzed by TEMED (N,N,N',N'-tetramethylethylenediamine) [43]. These components facilitate the free-radical polymerization that transforms the liquid acrylamide solution into a stable, hydrophilic gel matrix that is transparent, thermostable, and relatively chemically inert [20]. This inertness is crucial as it prevents unwanted interactions with the migrating proteins during electrophoresis.
The pore size of the resulting gel matrix exhibits an inverse relationship with the acrylamide concentration—higher percentages create smaller pores that better resolve low molecular weight proteins, while lower percentages create larger pores that accommodate the migration of high molecular weight proteins [44]. This fundamental relationship forms the basis for selecting appropriate gel percentages for different protein size ranges.
Gel Percentage Selection Guidelines
Selecting the correct acrylamide percentage is paramount for achieving optimal separation of target proteins. The appropriate gel concentration ensures that proteins migrate sufficiently to resolve from nearby bands while remaining within the linear separation range of the gel matrix. The following table provides comprehensive guidelines for selecting gel percentages based on protein molecular weight:
Table 1: Gel Percentage Recommendations for Protein Separation
| Protein Size Range (kDa) | Recommended Gel Percentage (%) | Separation Characteristics |
|---|---|---|
| 4-40 | 20 | Optimal for very low molecular weight proteins and peptides [45] [43] |
| 10-45 | 15 | Ideal for small proteins [45] [42] |
| 10-70 | 12-12.5 | Versatile range for many common proteins [45] [43] |
| 15-100 | 10 | Suitable for medium-sized proteins [45] [42] |
| 25-200 | 7.5-8 | Appropriate for larger proteins [45] [43] |
| >200 | 4-6 | Essential for very high molecular weight proteins [45] [44] |
These recommendations provide a starting point for gel selection, though optimization may be required for specific applications. The relationship between protein size and gel percentage follows a consistent pattern: lower percentage gels with larger pores facilitate better separation of high molecular weight proteins, while higher percentage gels with smaller pores provide superior resolution for low molecular weight proteins [44]. This occurs because larger proteins navigate more easily through gels with larger pore sizes, whereas their migration would be impeded in higher percentage gels with smaller pores [45].
Experimental Protocol for Gel Preparation and Electrophoresis
Resolving Gel Preparation
The following protocol details the preparation of standard SDS-PAGE gels, with formulations adjusted according to the desired acrylamide percentage:
Table 2: Resolving Gel Formulations for Different Percentages
| Component | 20% Gel | 15% Gel | 12% Gel | 10% Gel | 7.5% Gel | 5% Gel |
|---|---|---|---|---|---|---|
| dH₂O | 0.93 mL | 2.34 mL | 3.28 mL | 3.98 mL | 4.78 mL | 5.61 mL |
| 1.5M Tris-HCl (pH 8.8) | 2.5 mL | 2.5 mL | 2.5 mL | 2.5 mL | 2.5 mL | 2.5 mL |
| 10% SDS | 100 µL | 100 µL | 100 µL | 100 µL | 100 µL | 100 µL |
| 30% Acrylamide/Bis (29.2:0.8) | 6.7 mL | 5 mL | 4 mL | 3.3 mL | 2.5 mL | 1.67 mL |
| 10% APS | 50 µL | 50 µL | 50 µL | 50 µL | 50 µL | 50 µL |
| TEMED | 5 µL | 5 µL | 5 µL | 5 µL | 5 µL | 5 µL |
Note: Volumes are for preparing 10 mL of resolving gel. APS and TEMED should be added last to initiate polymerization [43].
Stacking Gel Preparation
All SDS-PAGE systems employ a stacking gel (typically 4-5% acrylamide) layered above the resolving gel. This component uses a different pH (6.8 versus 8.8 for the resolving gel) and serves to concentrate all protein samples into a sharp band before they enter the resolving gel, thereby improving resolution [43]. The standard stacking gel formulation includes 3.05 mL dH₂O, 1.25 mL 0.5M Tris-HCl (pH 6.8), 50 µL 10% SDS, 650 µL 30% Acrylamide/Bis, 25 µL 10% APS, and 10 µL TEMED for a 5 mL total volume [43].
Gel Casting Workflow
SDS-PAGE Gel Casting Workflow
Electrophoresis Conditions
Following gel polymerization and sample loading (typically 10-50 µg of protein from cell lysate or 10-100 ng of purified protein) [45], electrophoresis is performed using 1X running buffer (25 mM Tris base, 192 mM glycine, 0.1% SDS, pH 8.3) [45]. Standard running conditions employ 100-150 volts for 40-60 minutes or until the dye front reaches the bottom of the gel [46]. Maintaining a constant temperature between 10°C-20°C during separation is crucial to prevent "smiling" effects where outer lanes migrate slower than center lanes [46].
Gradient Gels: Enhanced Separation Capability
For samples containing proteins with diverse molecular weights, gradient gels offer significant advantages over fixed-concentration gels. These gels feature a continuous gradient of polyacrylamide concentration, typically from low to high percentage, creating a corresponding pore size gradient that enables optimal separation of a broader range of protein sizes on a single gel [42] [44].
The key advantages of gradient gels include:
- Broad Separation Range: A single 4-20% gradient gel can effectively resolve proteins from 4 kDa to 250 kDa, eliminating the need for multiple gels with different concentrations [44].
- Sharper Bands: As proteins migrate through the gradient, the leading edge encounters smaller pores and slows down before the trailing edge, causing the protein band to sharpen as it progresses [44].
- Improved Resolution of Similar-Sized Proteins: The continuous gradient provides better separation between proteins with minimal molecular weight differences [44].
Table 3: Gradient Gel Selection Guide
| Protein Size Range | Low/High Acrylamide Percentage | Application Context |
|---|---|---|
| 4-250 kDa | 4% / 20% | Discovery work analyzing diverse protein sizes |
| 10-100 kDa | 8% / 15% | Targeted analysis of moderate molecular weight range |
| 50-75 kDa | 10% / 12.5% | High-resolution separation of similarly sized proteins |
Gradient gels can be prepared using a gradient mixer or through manual methods employing serological pipettes with air bubble mixing [44]. While commercially available pre-cast gradient gels offer convenience, manual preparation provides cost-effectiveness and customization options.
The Scientist's Toolkit: Essential Reagents and Materials
Successful SDS-PAGE experimentation requires several key reagents, each serving specific functions within the system:
Table 4: Essential SDS-PAGE Reagents and Their Functions
| Reagent/Material | Function | Key Considerations |
|---|---|---|
| Acrylamide/Bis-acrylamide | Forms the porous gel matrix for molecular sieving | Neurotoxin in monomer form; always wear gloves [42] |
| Tris Buffers | Provides appropriate pH environment for electrophoresis (pH 6.8 for stacking, 8.8 for resolving) | Maintaining proper pH is critical for protein charge and migration |
| SDS (Sodium Dodecyl Sulfate) | Denatures proteins and confers uniform negative charge | Complete denaturation requires heating at 95°C for 5 minutes [46] |
| APS (Ammonium Persulfate) | Initiates polymerization of acrylamide matrix | Fresh solution recommended for consistent polymerization [43] |
| TEMED | Catalyzes the polymerization reaction | Accelerates gel formation; add just before pouring [43] |
| Reducing Agents (DTT, βME) | Breaks disulfide bonds in proteins | Essential for complete denaturation; DTT has less odor but is less stable than βME [46] |
| Molecular Weight Markers | Provides size reference for estimating protein molecular weights | Prestained markers allow visualization during electrophoresis [42] |
| Glycine | Component of running buffer; facilitates protein migration | Combined with Tris and SDS to create discontinuous buffer system [45] |
Troubleshooting and Optimization Strategies
Several common issues may arise during SDS-PAGE that can compromise protein separation:
- "Smiling" Bands: Curved bands where outer lanes migrate slower than center lanes indicate excessive heat generation. Solution: Ensure efficient heat transfer by completely filling the outer chamber with running buffer and maintaining temperature between 10°C-20°C [46] [20].
- Smeared Bands: Poorly defined bands often result from incomplete protein denaturation. Solution: Add fresh reducing agent to sample buffer and boil samples for minimum 5 minutes at 100°C [20].
- Weak/Faint or "Bulging" Bands: Indicates inappropriate protein concentration. Solution: Determine total protein concentration using Bradford, Lowry, or BCA assays before loading [20].
- Multiple Bands: Unexpected bands may indicate protein degradation, oxidation, or dephosphorylation. Solution: Use protease inhibitors, fresh reducing agents, and phosphatase inhibitors in buffers [20].
Optimizing protein loading amounts is crucial for clear results. Generally, load ≤2 µg per well for purified proteins or ≤20 µg for complex mixtures like whole cell lysates when using Coomassie stain. For western blotting, these amounts can be adjusted downward based on detection sensitivity [46].
Selecting the appropriate gel percentage represents a fundamental decision in SDS-PAGE experimental design that directly impacts separation quality and data reliability. The guidelines presented in this technical review provide researchers with a systematic approach to gel selection based on protein molecular weight ranges, while also offering practical methodologies for gel preparation and troubleshooting. Mastery of these core components of the SDS-PAGE system—including the polyacrylamide matrix, buffer systems, and denaturing conditions—enables researchers to consistently generate high-quality protein separations essential for accurate analysis in both basic research and drug development applications. As electrophoresis technology continues to evolve with automated platforms like Simple Western instruments [45], the fundamental principles of gel-based protein separation remain essential knowledge for all researchers working with protein analysis systems.
Sodium Dodecyl Sulfate-Polyacrylamide Gel Electrophoresis (SDS-PAGE) serves as a fundamental analytical technique in biopharmaceutical development, providing critical assessment of protein therapeutic candidates. This method enables researchers to separate complex protein mixtures based on molecular weight, offering invaluable insights into purity, integrity, and structural composition. The denaturing nature of SDS-PAGE provides particularly crucial information for engineered antibody constructs, which frequently display increased aggregation propensity and reduced conformational stability compared to full-length antibodies [47]. Within the rigorous quality control paradigm of therapeutic protein development, SDS-PAGE represents an essential orthogonal method that complements other biophysical characterization techniques such as size exclusion chromatography (SEC), dynamic light scattering (DLS), and mass photometry [47].
The core principle of SDS-PAGE revolves around its ability to impart a uniform negative charge to proteins, effectively negating inherent charge differences and enabling separation primarily based on polypeptide chain length [32]. When proteins are treated with SDS and reducing agents, they unfold into linear chains, allowing them to migrate through a polyacrylamide gel matrix under an electric field where smaller proteins move faster than larger ones due to less resistance from the gel matrix [32] [48]. This process provides researchers with a reliable method to assess molecular weight, identify protein impurities, and evaluate subunit composition—all critical parameters in ensuring the safety and efficacy of biological therapeutics.
Core Principles of SDS-PAGE Technology
Fundamental Separation Mechanisms
The exceptional resolving power of SDS-PAGE stems from its sophisticated discontinuous buffer system that combines distinct gel layers and buffer compositions to achieve high-resolution protein separation. The system comprises two main gel layers: a stacking gel with lower acrylamide concentration (typically 4%) and pH 6.8, and a resolving (separating) gel with higher acrylamide concentration (typically 6-15%) and pH 8.8 [32] [48]. This discontinuity extends to the buffer systems, with the running buffer containing different ions and pH than the gel buffers themselves [48].
The separation mechanism relies on several key processes. SDS, an anionic detergent, binds to protein backbones at a constant molar ratio, disrupting non-covalent bonds and unfolding proteins into linear chains while imparting a uniform negative charge proportional to polypeptide length [32] [48]. The stacking effect occurs through an ionic interface created between fast-moving chloride ions (from Tris-HCl in the gel) and slow-moving glycine zwitterions (from the running buffer), which concentrates protein samples into a narrow zone before they enter the resolving gel [48]. Finally, molecular sieving takes place in the resolving gel, where the polyacrylamide mesh creates pores that differentially retard protein movement based on size [32] [48].
Critical Buffer Components and Their Functions
The effectiveness of SDS-PAGE separation depends on precisely formulated buffer components, each serving specific functions in the electrophoretic process. The sample loading buffer (Laemmli buffer) contains Tris-HCl for pH maintenance, SDS for protein denaturation and charging, glycerol to add density for loading, beta-mercaptoethanol (BME) to break disulfide bonds, and Bromophenol Blue as a migration tracking dye [48]. The running buffer typically consists of Tris as primary buffer, glycine whose charge state enables stacking, and SDS to maintain protein linearity [48]. The gel composition includes acrylamide which polymerizes to form the separating matrix, Tris-HCl for buffering, SDS for protein charge uniformity, and catalysts (ammonium persulfate and TEMED) to initiate acrylamide polymerization [48].
Table 1: Essential Buffer Components in SDS-PAGE and Their Functions
| Component | Location | Primary Function |
|---|---|---|
| SDS (Sodium Dodecyl Sulfate) | Sample buffer, running buffer, gel | Denatures proteins; imparts uniform negative charge |
| Tris-HCl | Sample buffer, stacking gel, resolving gel | Maintains pH at different levels for stacking and separation |
| Glycine | Running buffer | Charge-dependent mobility creates stacking interface |
| Beta-mercaptoethanol (BME) | Sample buffer | Reduces disulfide bonds for complete unfolding |
| Glycerol | Sample buffer | Adds density for sample loading into wells |
| Bromophenol Blue | Sample buffer | Visual tracking of migration front |
| Acrylamide | Gel matrix | Forms porous polymer network for size-based separation |
| Ammonium Persulfate & TEMED | Gel matrix | Catalyzes acrylamide polymerization |
Experimental Protocols for Therapeutic Protein Analysis
Standard SDS-PAGE Protocol for Purity Assessment
The following protocol outlines the standardized procedure for SDS-PAGE analysis of therapeutic protein candidates, adapted from established methodologies [32] [47]:
Gel Preparation: Begin by assembling clean glass plates with spacers. Prepare the resolving gel solution containing appropriate acrylamide concentration (8-12% for most antibodies), Tris-HCl (pH 8.8), SDS, ammonium persulfate, and TEMED. Pour the solution between glass plates, overlay with water or isopropanol to prevent oxygen inhibition of polymerization, and allow complete polymerization (20-30 minutes). After polymerization, remove the overlay liquid and pour the stacking gel solution (4% acrylamide, Tris-HCl pH 6.8, SDS, ammonium persulfate, and TEMED). Immediately insert a comb appropriate for sample number and allow to polymerize [32].
Sample Preparation: Dilute protein samples to appropriate concentration (0.5-2 mg/mL) in desired buffer. Mix protein sample with 4X LDS sample buffer (or Laemmli buffer) at 3:1 ratio [14] [47]. For reduced conditions, include reducing agent (1X Bolt sample reducing agent or 5% beta-mercaptoethanol) [47]. Heat samples at 70°C for 10 minutes or 95°C for 3-5 minutes in a heat block [14] [32]. Centrifuge at 15,000 rpm for 1 minute to collect condensed sample [32].
Electrophoresis: Mount the gel cassette in the electrophoresis chamber and fill both upper and lower chambers with running buffer (25 mM Tris, 192 mM glycine, 0.1% SDS, pH 8.3) [48]. Remove the comb carefully and flush wells with running buffer to remove unpolymerized acrylamide. Load prepared samples (5-25 μg protein per well) and molecular weight markers in designated wells [14]. Connect to power supply and run at constant voltage (80-200V) until the dye front reaches the bottom of the gel [32] [47].
Post-Electrophoresis Analysis: Disassemble the gel apparatus and carefully remove the gel from glass plates. Proceed with appropriate detection method: Coomassie Blue staining for total protein visualization, silver staining for enhanced sensitivity, or western blotting for specific protein detection using antibodies [47].
Modified Native SDS-PAGE for Metal-Binding Protein Analysis
For therapeutic proteins requiring metal cofactors for activity, a modified Native SDS-PAGE (NSDS-PAGE) protocol preserves metal binding while maintaining good resolution [14]:
Sample Preparation: Mix 7.5 μL protein sample with 2.5 μL 4X NSDS sample buffer (100 mM Tris HCl, 150 mM Tris base, 10% glycerol, 0.0185% Coomassie G-250, 0.00625% Phenol Red, pH 8.5). Omit heating step to preserve native structure [14].
Gel Preparation: Use standard precast NuPAGE Novex 12% Bis-Tris 1.0 mm mini-gels. Pre-run at 200V for 30 minutes in double distilled H2O to remove storage buffer and unpolymerized acrylamide [14].
Electrophoresis: Conduct separation using NSDS-PAGE running buffer (50 mM MOPS, 50 mM Tris Base, 0.0375% SDS, pH 7.7) at constant voltage (200V) for approximately 45 minutes [14].
Detection: For metalloproteins, employ specific detection methods such as in-gel zinc staining using fluorophore TSQ or laser ablation-inductively coupled plasma-mass spectrometry for direct metal detection [14].
Advanced Applications in Drug Development
Purity Assessment of Engineered Antibody Constructs
SDS-PAGE provides critical purity assessment for increasingly complex engineered antibody formats, including full-length IgGs, bivalent fusion antibodies, bispecific tandem single-chain fragment variables (bi-scFv2-scFv1), and single-chain variable fragments (scFvs) [47]. Under reducing conditions, SDS-PAGE enables subunit analysis to verify proper molecular weights of heavy and light chains, identifying fragmentation or incomplete synthesis. Non-reducing conditions reveal information about oligomerization status and disulfide-mediated aggregates, common concerns with engineered fragments that display increased aggregation propensity [47]. The technique effectively detects proteolytic degradation, unwanted multimers, and product-related impurities that may compromise therapeutic safety or efficacy.
Table 2: SDS-PAGE Analysis of Representative Therapeutic Antibody Formats
| Construct Type | Structural Features | SDS-PAGE Analysis (Reducing Conditions) | Common Purity Concerns |
|---|---|---|---|
| Full-length IgG | Two heavy chains, two light chains, disulfide bonds | Bands at ~50 kDa (heavy chain) and ~25 kDa (light chain) | Fragmentation, incomplete reduction |
| scFv (single-chain variable fragment) | VH and VL domains connected by peptide linker | Single band at ~25-30 kDa | Proteolysis, aggregation, improper folding |
| Bispecific tandem scFv | Two scFv domains in tandem | Single band at ~50-60 kDa | Domain separation, multimers |
| Fusion antibody (Ab1-scFv1) | IgG with additional scFv domain | Heavy chain shift to ~75 kDa, light chain at ~25 kDa | Incomplete fusion, scFv cleavage |
Subunit Analysis for Structural Characterization
SDS-PAGE under reducing and non-reducing conditions provides essential information about subunit composition and disulfide bond integrity—critical quality attributes for therapeutic proteins. Comparative analysis under these conditions enables researchers to identify improper disulfide bonding, free thiol content, and subunit stoichiometry. For complex molecules like the bivalent fusion antibody (Ab1-scFv1), SDS-PAGE confirms the presence of both expected subunits and identifies potential cleavage products or incomplete assembly [47]. This analysis is particularly valuable for quality control during process development, formulation optimization, and stability studies where structural integrity must be monitored throughout the product lifecycle.
Expression Profiling and Optimization
In upstream process development, SDS-PAGE serves as a rapid screening tool for expression level assessment across different cell lines, culture conditions, and construct designs. When analyzing culture supernatants or cell lysates from transiently transfected Expi293 cells, SDS-PAGE enables semi-quantitative comparison of recombinant protein expression, identifying optimal production conditions [47]. The technique also detects proteolytic degradation or unexpected post-translational modifications that may occur during expression. For biosimilar development, SDS-PAGE provides a first-line comparison of banding patterns between innovator and proposed biosimilar products, ensuring similar protein profiles before embarking on more extensive analytical characterization.
Complementary Analytical Techniques
While SDS-PAGE provides valuable information about protein purity and molecular weight, comprehensive characterization of therapeutic proteins requires orthogonal analytical methods that assess different quality attributes. Size exclusion chromatography (SEC) separates proteins based on hydrodynamic volume, identifying soluble aggregates and fragmentation under native conditions [47]. Mass photometry enables accurate molecular weight determination and quantification of oligomeric states at high sensitivity [47]. Dynamic light scattering (DLS) assesses hydrodynamic diameter and polydispersity, providing rapid aggregation screening [47]. Nano differential scanning fluorimetry (nanoDSF) monitors thermal unfolding, revealing stability differences between constructs [47]. Circular dichroism (CD) spectroscopy evaluates secondary and tertiary structure, while small-angle X-ray scattering (SAXS) provides low-resolution structural information in solution [47].
Table 3: Orthogonal Methods for Comprehensive Protein Characterization
| Technique | Principle | Information Provided | Complement to SDS-PAGE |
|---|---|---|---|
| Size Exclusion Chromatography (SEC) | Hydrodynamic volume separation | Aggregation status, native oligomers | Confirms oligomers under non-denaturing conditions |
| Mass Photometry | Single-molecule imaging | Molecular mass, oligomeric distribution | High-resolution mass confirmation |
| Dynamic Light Scattering (DLS) | Brownian motion analysis | Hydrodynamic size, polydispersity | Rapid aggregation screening in native state |
| nanoDSF | Intrinsic fluorescence thermal shift | Thermal stability, unfolding transitions | Correlates purity with conformational stability |
| Circular Dichroism (CD) | Differential light absorption | Secondary and tertiary structure | Confirms proper folding after electrophoretic separation |
The Scientist's Toolkit: Essential Research Reagents
Successful SDS-PAGE analysis requires carefully selected reagents and equipment, each serving specific functions in the separation process. The following toolkit outlines essential components for therapeutic protein characterization:
Table 4: Essential Research Reagent Solutions for SDS-PAGE Analysis
| Reagent/Equipment | Specifications | Function in Analysis |
|---|---|---|
| Precast Gels | 4-12% Bis-Tris, 12-well comb | Consistent pore size for reproducibility; optimal for antibody separation |
| Sample Buffer | 4X LDS or Laemmli buffer | Denatures and charges proteins; includes tracking dye |
| Reducing Agent | DTT or beta-mercaptoethanol | Breaks disulfide bonds for complete subunit separation |
| Running Buffer | MOPS or Tris-Glycine with 0.1% SDS | Maintains pH and charge during electrophoresis |
| Molecular Weight Markers | Prestained or unstained standards | Enables molecular weight estimation and run monitoring |
| Protein Stain | Coomassie, silver stain, or SYPRO Ruby | Visualizes separated protein bands with varying sensitivity |
| Electrophoresis System | Mini-gel apparatus with power supply | Provides controlled electric field for separation |
| Transfer System | Wet or semi-dry transfer apparatus | For western blotting after separation |
Workflow Visualization
SDS-PAGE Workflow for Therapeutic Protein Analysis
SDS-PAGE Applications in Drug Development
Sodium Dodecyl Sulfate-Polyacrylamide Gel Electrophoresis (SDS-PAGE) stands as a cornerstone technique in biochemical analysis, providing unparalleled capability for separating complex protein mixtures based on molecular weight. Since its systematization by Laemmli in 1970, this method has become an indispensable tool across biological disciplines [12]. In food science, SDS-PAGE provides critical insights into protein composition, functionality, and structural changes induced by processing, making it fundamental for safety verification, quality control, and the detection of adulterants and allergens [12] [49]. The technique's robustness, reliability, and relative simplicity have ensured its enduring relevance in modern analytical laboratories.
This technical guide explores advanced applications of SDS-PAGE within food science, focusing on its pivotal role in addressing contemporary challenges in allergen detection, quality assurance, and product development. We examine sophisticated methodological adaptations and provide detailed protocols that enable researchers to extract maximum information from protein analysis, positioning SDS-PAGE not merely as an analytical tool but as a strategic asset in food research and development.
Core Principles and Methodological Innovations
Fundamental Separation Mechanics
SDS-PAGE separates proteins based primarily on their molecular mass through a sophisticated interplay of biochemical and physical principles. The anionic detergent SDS plays the crucial role of denaturing proteins by disrupting hydrogen bonds and hydrophobic interactions, while simultaneously conferring a uniform negative charge density upon the linearized polypeptides [50] [51]. This process nullifies inherent charge differences between proteins, ensuring that separation occurs based on size rather than charge [51]. The reducing agents β-mercaptoethanol (BME) or dithiothreitol (DTT) further denature proteins by breaking disulfide linkages, overcoming tertiary and quaternary structures [51] [52].
The electrophoretic separation occurs through a polyacrylamide gel matrix, whose tunable pore size acts as a molecular sieve [8] [52]. This three-dimensional network is created through the polymerization of acrylamide cross-linked by N,N'-methylenebisacrylamide, catalyzed by ammonium persulfate (APS) and tetramethylethylenediamine (TEMED) [8] [52]. Under an electric field, the SDS-coated protein complexes migrate toward the anode, with smaller proteins moving more rapidly through the gel matrix than larger counterparts [32] [51].
Discontinuous Buffer System and Gel Architecture
A critical innovation in standard SDS-PAGE is the discontinuous buffer system employing gels with two distinct regions—stacking and resolving gels—each with different pH and acrylamide concentrations [50] [8]. The stacking gel (typically pH 6.8 with ~4-5% acrylamide) serves to concentrate disparate protein samples into sharp, unified bands before they enter the resolving gel [8] [51]. This concentration effect is mediated by the differential mobility of glycine ions in the running buffer (pH 8.3), which exist as zwitterions in the stacking gel but become predominantly negatively charged (glycinate anions) upon encountering the higher pH (8.8) of the resolving gel [50]. The resulting ion front creates a voltage gradient that compresses protein samples into thin, discrete bands, ensuring they enter the resolving matrix simultaneously [50].
The resolving gel (typically pH 8.8 with 8-15% acrylamide, depending on target protein sizes) constitutes the separation engine where proteins resolve based on molecular weight [8]. Higher acrylamide concentrations create smaller pores, optimizing resolution for lower molecular weight proteins, while lower percentages provide larger pores suitable for separating high molecular weight proteins [8] [52]. This sophisticated two-tier system enables the exceptional resolution that makes SDS-PAGE so valuable for analytical applications.
Advanced Methodological Adaptations
Recent innovations have expanded SDS-PAGE applications beyond traditional denaturing analyses. Native SDS-PAGE (NSDS-PAGE) represents a significant methodological advancement that modifies standard conditions to preserve certain functional properties while maintaining high resolution [14]. By removing SDS and EDTA from sample buffers, omitting the heating step, and reducing SDS concentration in running buffers (e.g., to 0.0375%), this approach dramatically increases the retention of bound metal ions in metalloproteins (e.g., Zn²⁺ retention increased from 26% to 98%) and preserves enzymatic activity in many cases [14]. This adaptation bridges the resolution advantages of SDS-PAGE with the functional preservation of native electrophoresis, opening new possibilities for analyzing metalloproteins and enzyme complexes in food systems.
Table 1: Comparative Analysis of Electrophoresis Modalities
| Parameter | Standard SDS-PAGE | Native SDS-PAGE | Blue-Native PAGE |
|---|---|---|---|
| Resolution | High | High | Moderate |
| Protein State | Denatured | Partially Native | Native |
| Metal Retention | Low (e.g., 26% Zn²⁺) | High (e.g., 98% Zn²⁺) | High |
| Enzyme Activity | Destroyed | Preserved (7/9 model enzymes) | Preserved |
| Molecular Weight Determination | Accurate under denaturing conditions | Possible with calibration | Less accurate due to native structure |
| Buffer Composition | SDS, reducing agents, EDTA | Greatly reduced SDS, no EDTA, no reducing agents | Coomassie G-250, no SDS |
Advanced Applications in Food Science
Allergen Detection and Characterization
SDS-PAGE plays an indispensable role in identifying and characterizing food allergens, which represent a growing global public health concern [53]. The technique enables precise molecular weight profiling of known allergenic proteins, facilitating the detection of trace allergens in complex food matrices. This application is particularly crucial for verifying labeling accuracy, identifying cross-contamination, and developing hypoallergenic food products through processing technologies that modify allergen structure [53].
When coupled with Western blotting, SDS-PAGE provides a powerful tool for assessing the immunoreactivity of processed allergens. This combination allows researchers to monitor how structural modifications induced by thermal treatment, enzymatic processing, fermentation, or novel non-thermal technologies (e.g., high-pressure processing, cold plasma) affect the ability of allergenic proteins to bind IgE antibodies [53]. The discontinuous gel system ensures sharp band resolution, enabling clear identification of specific allergenic proteins like Ara h 1 in peanuts, casein in milk, or tropomyosin in shellfish [53].
Table 2: Major Food Allergens and Their Molecular Weights Accessible via SDS-PAGE
| Allergen Source | Major Allergenic Proteins | Molecular Weight Range (kDa) |
|---|---|---|
| Peanut | Ara h 1, Ara h 2, Ara h 3 | ~15-65 |
| Cow's Milk | Caseins, β-lactoglobulin, α-lactalbumin | ~14-25 |
| Hen's Egg | Ovalbumin, Ovomucoid | ~14-47 |
| Soybean | Gly m 4, Gly m 5 | ~18-80 |
| Wheat | Glutenins, Gliadins | ~30-90 |
| Shrimp | Tropomyosin | ~36 |
| Fish | Parvalbumin | ~12 |
Quality Control and Process Optimization
SDS-PAGE serves as a critical analytical tool for monitoring food quality and optimizing processing parameters across diverse food categories. The technique enables precise evaluation of protein integrity in raw materials, intermediate products, and finished goods, providing insights that directly impact product functionality and quality [12] [49]. In dairy science, SDS-PAGE effectively monitors proteolysis during cheese aging, where casein degradation to various peptides of different molecular weights directly influences flavor development and texture [49]. Similarly, in meat and seafood products, the method detects protein degradation indicative of spoilage or quality loss by visualizing myofibrillar protein breakdown [12].
The applications extend to assessing the impact of processing techniques on protein functionality. SDS-PAGE can visualize molecular weight distribution changes resulting from enzymatic hydrolysis, thermal treatments, or fermentation, enabling manufacturers to optimize processes for desired functional properties like solubility, emulsification, or gelling capacity [49]. When investigating ingredient performance issues or lot-to-lot variability, SDS-PAGE provides a definitive assessment of whether observed differences originate from protein components or other factors [49]. The technique also serves as a frontline defense against economic adulteration, enabling detection of unauthorized protein substitutions in high-value products through comparative banding pattern analysis with authentic references [49].
Novel Food Product Development
The burgeoning field of alternative proteins represents a frontier where SDS-PAGE provides critical analytical support. For plant-based meat and dairy alternatives, SDS-PAGE enables comprehensive characterization of protein isolates and concentrates, guiding ingredient selection and process optimization to achieve desired functional and sensory properties [12]. The technique helps researchers understand how processing history (e.g., extraction methods, drying conditions) affects protein integrity and, consequently, performance in final applications [49].
In stability studies, SDS-PAGE monitors protein changes during product shelf life, detecting undesirable proteolysis or aggregation that may compromise quality [49]. This application is particularly valuable for validating the effectiveness of preservation systems and establishing appropriate shelf-life specifications. As the food industry increasingly explores novel protein sources—from pulses, algae, and insects to cell-cultured proteins—SDS-PAGE provides the fundamental analytical framework for understanding these materials and successfully incorporating them into consumer products.
Experimental Protocols for Advanced Applications
Native SDS-PAGE for Metalloprotein Analysis
Background: This protocol adapts standard SDS-PAGE conditions to preserve metal cofactors and enzymatic activity while maintaining high resolution, based on methodology validated by [14].
Reagents and Solutions:
- NSDS Sample Buffer (4X): 100 mM Tris HCl, 150 mM Tris base, 10% (v/v) glycerol, 0.0185% (w/v) Coomassie G-250, 0.00625% (w/v) Phenol Red, pH 8.5
- NSDS Running Buffer: 50 mM MOPS, 50 mM Tris Base, 0.0375% SDS, pH 7.7
- Precast NuPAGE Novex 12% Bis-Tris 1.0 mm mini-gels
Procedure:
- Gel Pre-equilibration: Run precast gels at 200V for 30 minutes in double-distilled H₂O to remove storage buffer and unpolymerized acrylamide.
- Sample Preparation: Mix 7.5 μL protein sample with 2.5 μL of 4X NSDS sample buffer. Do not heat.
- Electrophoresis: Load prepared samples into pre-equilibrated gels. Run at constant voltage (200V) for approximately 45 minutes using NSDS running buffer until dye front reaches gel bottom.
- Post-Electrophoresis Analysis:
- For metal detection: Utilize laser ablation-inductively coupled plasma-mass spectrometry (LA-ICP-MS)
- For enzymatic activity: Perform in-gel activity assays with appropriate substrates
- For general protein visualization: Use standard Coomassie or silver staining
Validation: This method demonstrated 98% Zn²⁺ retention in metalloproteins compared to 26% with standard SDS-PAGE, with seven of nine model enzymes retaining activity post-electrophoresis [14].
Allergen Immunoreactivity Assessment by Western Blot
Background: This protocol details the combination of SDS-PAGE with Western blotting to evaluate how food processing affects allergen immunoreactivity, a crucial methodology in developing hypoallergenic foods [53] [54].
Reagents and Solutions:
- Sample Buffer (2X Laemmli): 4% SDS, 20% glycerol, 0.004% bromophenol blue, 100 mM Tris-HCl (pH 6.8), 10% β-mercaptoethanol (add fresh)
- Transfer Buffer: 25 mM Tris, 192 mM glycine, 20% methanol, 0.01-0.05% SDS
- Blocking Solution: 5% non-fat dry milk in TBST (Tris-buffered saline with 0.1% Tween-20)
- Primary Antibodies: Allergen-specific IgE antibodies from allergic individuals or animal models
- Secondary Antibodies: HRP-conjugated anti-human or anti-animal IgE
Procedure:
- Protein Separation:
- Mix protein samples with 2X Laemmli buffer
- Heat at 95°C for 5 minutes (for denaturing conditions) or omit heating (for structural studies)
- Load 20-50 μg protein per well and separate via standard SDS-PAGE (12% gel, 120V)
Protein Transfer:
- Pre-wet PVDF membrane in methanol for 1 minute, then equilibrate in transfer buffer
- Assemble transfer sandwich: sponge, filter paper, gel, membrane, filter paper, sponge
- Transfer at 100V for 1 hour at 4°C or 25V overnight
Allergen Detection:
- Block membrane with 5% milk in TBST for 1 hour at room temperature
- Incubate with primary IgE antibodies (appropriate dilution, typically 1:10-1:100) for 2 hours or overnight at 4°C
- Wash 3× with TBST, 5 minutes each
- Incubate with HRP-conjugated secondary antibody (1:2000-1:5000) for 1 hour
- Wash 3× with TBST, 5 minutes each
- Detect using enhanced chemiluminescence substrate and imaging system
Interpretation: Reduced band intensity indicates decreased IgE binding capacity, suggesting lower allergenicity resulting from processing treatments [53].
The Researcher's Toolkit: Essential Reagents and Materials
Table 3: Research Reagent Solutions for Advanced SDS-PAGE Applications
| Reagent/Material | Function | Application Notes |
|---|---|---|
| Acrylamide/Bis-acrylamide | Forms porous gel matrix for size-based separation | 30-40% stock solutions; neurotoxic—handle with gloves |
| SDS (Sodium Dodecyl Sulfate) | Denatures proteins and confers negative charge | Critical for separation; concentration varies (0.0375%-0.1%) |
| TEMED & APS | Catalyzes acrylamide polymerization | APS should be prepared fresh weekly; TEMED hygroscopic |
| DTT or β-Mercaptoethanol | Reduces disulfide bonds | Essential for complete denaturation; add fresh before use |
| Precast Gels | Ready-to-use separation matrix | Commercial options (e.g., NuPAGE Novex) ensure reproducibility |
| Glycine | Leading ion in discontinuous buffer system | Key to stacking effect; zwitterionic at stacking gel pH |
| Coomassie Stain | Protein visualization | Detects ~100 ng protein; compatible with downstream analysis |
| PVDF/Nitrocellulose Membranes | Protein immobilization for Western blot | PVDF requires methanol activation; higher protein binding capacity |
| Allergen-specific IgE | Detection of immunoreactive allergens | Human serum or animal models; defines allergenic potential |
Workflow Visualization
Advanced SDS-PAGE Workflow for Food Analysis
SDS-PAGE transcends its conventional role as a simple separation technique to become a sophisticated analytical platform addressing complex challenges in food science. Through methodological innovations like NSDS-PAGE and strategic integration with complementary techniques such as Western blotting, researchers can extract multidimensional information about protein composition, functionality, and immunoreactivity. The applications in allergen characterization, quality assurance, and novel food development demonstrate how this foundational method continues to evolve, providing critical insights that support food safety, quality, and innovation. As food systems grow increasingly complex, SDS-PAGE remains an essential component of the analytical arsenal, adapting to meet emerging needs while maintaining the reliability and reproducibility that have established it as a gold standard in protein analysis.
Troubleshooting SDS-PAGE: Solving Common Problems and Optimizing Resolution
Within the framework of a broader thesis on the basic components of the SDS-PAGE system and their pivotal roles in research, this guide addresses a critical challenge faced routinely by researchers: protein band artifacts. Sodium dodecyl sulfate-polyacrylamide gel electrophoresis (SDS-PAGE) is a foundational technique in molecular biology and drug development, enabling the separation of proteins based on their molecular weight [32] [1] [2]. The system relies on the coordinated function of several core components: the polyacrylamide gel matrix which acts as a molecular sieve, the anionic detergent SDS which denatures proteins and confers a uniform negative charge, and the electrical current which drives protein migration through the gel [2] [55]. When functioning optimally, this system yields sharp, well-resolved protein bands. However, deviations from optimal conditions manifest as artifacts—such as smiling, smearing, and streaking—that can compromise data interpretation, lead to erroneous conclusions, and hinder research progress. This technical guide provides an in-depth analysis of these common artifacts, their root causes, and evidence-based protocols for their remediation, equipping scientists with the knowledge to achieve reliable and reproducible protein separation.
Core Components of SDS-PAGE and Their Function
A thorough understanding of the SDS-PAGE system's mechanics is essential for diagnosing artifacts. The technique operates on the principle of denaturing proteins into linear polypeptides using SDS, which binds to proteins at a nearly constant ratio of 1.4 g SDS per 1.0 g of protein, masking their intrinsic charge and creating a uniform charge-to-mass ratio [1] [2]. Consequently, separation in the polyacrylamide gel is based primarily on molecular size [32].
The following diagram illustrates the logical relationship between the core components of the SDS-PAGE system, their proper states, and the artifacts that arise from their dysfunction.
The discontinuous buffer system is another cornerstone of SDS-PAGE. It involves a stacking gel (lower pH ~6.8, lower % acrylamide) and a separating gel (higher pH ~8.8, higher % acrylamide), which work in concert with the Tris-glycine running buffer to concentrate proteins into sharp bands before separation [1] [55]. The key to this stacking effect is the differential mobility of chloride ions (from the gel) and glycine ions (from the running buffer) at the pH of the stacking gel, creating a narrow voltage gradient that focuses the protein samples [55]. Any imbalance in this delicate system can readily produce artifacts.
Artifact Diagnosis and Resolution
This section provides a systematic breakdown of the three primary band artifacts, detailing their characteristics, root causes, and definitive solutions.
Smiling (Curved Bands)
The "smiling" artifact is characterized by upward-curving bands at the gel's edges, creating a smiling appearance. This phenomenon is predominantly caused by uneven heat distribution across the gel during electrophoresis [56].
Root Cause: High electrical current generates excessive heat, causing the gel to expand. The center of the gel, being less efficient at dissipating heat, becomes warmer and expands more than the edges, resulting in faster protein migration in the center and curved bands [56].
Solutions:
- Reduce Voltage: Lower the running voltage by 25-50% to decrease heat generation [57].
- Improve Cooling: Run the electrophoresis in a cold room or use a gel apparatus with a built-in cooling unit [56]. Placing ice packs in the buffer tank is also effective.
- Ensure Even Buffering: Completely fill the outer chamber with running buffer and consider using a magnetic stirrer to ensure even heat distribution throughout the buffer [58].
Smearing (Diffuse Bands)
Smearing appears as broad, diffuse bands or continuous vertical streaks, indicating poor resolution of proteins. Its causes are multifaceted, relating to sample quality, gel conditions, and running parameters.
Table 1: Causes and Solutions for Band Smearing
| Cause | Description | Solution |
|---|---|---|
| Voltage Too High | Excessively fast migration prevents proteins from resolving properly [57] [56]. | Decrease voltage by 25-50%; use 10-15 V/cm gel length as a guideline [57] [56]. |
| Protein Overloading | Too much protein exceeds the gel's capacity, causing a smear [57] [59]. | Load ≤2 µg for purified protein or ≤20 µg for complex mixtures like cell lysates [58]. |
| Incorrect Gel Concentration | The gel pore size is unsuitable for the target protein's size range [57]. | Use a lower % gel for large proteins (e.g., 4-8% for ≥200 kDa) and a higher % for small proteins [32] [58]. |
| Protein Degradation | Proteases in the sample cleave proteins into heterogeneous fragments [57] [59]. | Use fresh protease inhibitors; keep samples on ice; heat samples immediately after adding buffer [59]. |
Streaking (Vertical Streaks)
Streaking manifests as vertical lines running through multiple lanes, often from the top of the gel. This is frequently linked to issues with sample preparation.
Table 2: Causes and Solutions for Band Streaking
| Cause | Description | Solution |
|---|---|---|
| Incomplete Denaturation | Proteins retain secondary/tertiary structure, leading to abnormal migration [60]. | Heat samples at 95°C for 5 min (or 70°C for 10 min for heat-labile proteins) [32] [59]. |
| High Salt Concentration | Salt ions interfere with the current and protein migration [57]. | Dialyze samples, precipitate proteins with TCA/acetone, or use a desalting column [57] [59]. |
| Protein Precipitation/Aggregation | Insoluble material migrates unevenly through the gel [57]. | Centrifuge heated samples at 15,000 rpm for 1-3 min to pellet insolubles [32] [58]. |
| Presence of Nucleic Acids | Viscous DNA/RNA can cause uneven loading and migration [59]. | Treat samples with Benzonase nuclease or shear nucleic acids by sonication/vigorous vortexing [59]. |
Experimental Protocols for Artifact Investigation and Prevention
Protocol 1: Standard SDS-PAGE with Optimized Sample Preparation
This protocol incorporates critical steps to prevent common artifacts related to sample integrity [32] [59].
Sample Preparation:
- Mix protein sample with an appropriate volume of 2X Laemmli buffer (containing SDS, Tris-HCl, glycerol, bromophenol blue, and a reducing agent like β-mercaptoethanol or DTT) [32] [55]. Ensure the buffer is at least 2X concentration to maintain sufficient SDS [59].
- Denaturation: Heat the mixture at 95°C for 5 minutes in a heat block. For proteins susceptible to cleavage at Asp-Pro bonds, consider heating at 75°C for 5-10 minutes as a viable alternative that still inactivates proteases [59] [60].
- Clarification: Centrifuge the heated samples at 15,000 rpm for 1 minute at 4°C to pellet any insoluble or aggregated material [32]. Load the supernatant into the gel.
Gel Electrophoresis:
- Load samples and molecular weight markers into the wells immediately after preparation to prevent diffusion [56].
- Assemble the electrophoresis apparatus filled with running buffer (e.g., Tris-glycine-SDS).
- Apply a constant voltage of 100-150V. For mini-gels, start at 80-100V through the stacking gel and increase to 120-150V for the resolving gel. Monitor heat generation.
- Stop the run when the bromophenol blue dye front reaches the bottom of the gel [32] [56].
Protocol 2: Investigating Incomplete Denaturation Artifacts (Non-Reducing Gels)
This protocol is specifically designed to diagnose and resolve artifact bands, common in the analysis of antibodies under non-reducing conditions [60].
Sample Treatment Conditions: Prepare three aliquots of the same purified monoclonal antibody sample:
- Untreated Control: Mix with non-reducing sample buffer (no reducing agent). Do not heat.
- Heated Sample: Mix with non-reducing sample buffer and heat at 75°C for 5-10 minutes.
- Urea-Treated Sample: Mix with non-reducing sample buffer containing 8 M urea. Do not heat.
Electrophoresis and Analysis:
- Load all three treated samples onto an 8% Tris-glycine gel.
- Run the gel as described in Protocol 1.
- Expected Results: The untreated sample may show multiple artifact bands due to incomplete denaturation. The heated and urea-treated samples should show a minimization of these artifacts, confirming that incomplete denaturation was the primary cause [60]. Combining heating with iodoacetamide (IAM) treatment can further minimize bands caused by disulfide bond scrambling [60].
The workflow below outlines the key decision points and procedural steps in the two protocols described above, highlighting pathways that lead to optimal results versus common artifacts.
The Scientist's Toolkit: Essential Reagents and Materials
The following table catalogues the essential reagents and materials required for successful SDS-PAGE, along with their critical functions in the separation process and artifact prevention.
Table 3: Key Research Reagent Solutions for SDS-PAGE
| Reagent/Material | Function | Considerations for Artifact Prevention |
|---|---|---|
| SDS (Sodium Dodecyl Sulfate) | Anionic detergent that denatures proteins and confers uniform negative charge [32] [2]. | Use high-purity SDS; ensure excess is present in sample buffer (1.4 g SDS/g protein) for complete denaturation [59] [1]. |
| Acrylamide/Bis-Acrylamide | Forms the porous polyacrylamide gel matrix that separates proteins by size [32] [2]. | Filter solution and ensure proper polymerization for a uniform pore size. Choose % based on target protein size [57] [58]. |
| Reducing Agents (DTT, β-ME) | Break disulfide bonds to fully unfold proteins [32] [58]. | Use fresh DTT or β-ME. DTT is less odorous but less stable than β-ME [58]. Omit for non-reducing PAGE. |
| Tris-Based Buffers | Maintains pH in gels and running buffer; critical for the discontinuous buffer system [55]. | Prepare buffers accurately. Stacking gel (pH ~6.8), Resolving gel (pH ~8.8), Running buffer (pH ~8.3) [1] [55]. |
| Ammonium Persulfate (APS) & TEMED | Catalyzes the polymerization of acrylamide [32] [55]. | Use fresh APS and TEMED for complete and consistent gel polymerization [57]. |
| Molecular Weight Standards | Proteins of known size for estimating molecular weight of unknowns [32] [2]. | Include in every run as a control for separation efficiency and to monitor for artifacts like smiling. |
The diagnostic power of SDS-PAGE is undeniable, but it is contingent upon the precise functioning of its core components. As detailed in this guide, artifacts like smiling, smearing, and streaking are not mere inconveniences; they are symptoms of specific underlying issues in the sample, gel, or electrophoretic conditions. By adopting a systematic approach to troubleshooting—rooted in an understanding of SDS-PAGE principles and leveraging the experimental protocols and reagent knowledge provided—researchers and drug development professionals can effectively diagnose, resolve, and prevent these artifacts. This ensures the generation of high-quality, reproducible data that is critical for advancing scientific discovery and therapeutic development.
Addressing Polymerization Issues and Poor Well Formation
In the realm of molecular biology and drug development, the Sodium Dodecyl Sulfate-Polyacrylamide Gel Electrophoresis (SDS-PAGE) system stands as a cornerstone technique for protein analysis. Its utility in determining protein purity, molecular weight, and expression levels is unparalleled [14]. The basic components of an SDS-PAGE system work in concert to separate proteins based almost exclusively on their molecular mass by imparting a uniform negative charge through SDS binding and providing a molecular sieve via the polyacrylamide gel matrix [61] [8]. Within this system, two critical processes form the foundation of any successful separation: gel polymerization and sample well formation. These initial steps, if compromised, can invalidate subsequent data and lead to erroneous conclusions in research.
Achieving optimal gel polymerization is fundamental because the polyacrylamide gel's three-dimensional network acts as the molecular sieve that separates proteins by size [8]. This matrix is formed through the polymerization of acrylamide and the cross-linker N,N'-methylenebisacrylamide (bis-acrylamide), a reaction catalyzed by ammonium persulfate (APS) and accelerated by N,N,N',N'-tetramethylethylenediamine (TEMED) [8]. Similarly, proper well formation in the stacking gel is crucial as it ensures that all protein samples begin their electrophoretic journey from an identical starting point, concentrated into sharp bands before entering the separating gel [61]. When researchers encounter issues with these fundamental components, the integrity of the entire experiment is jeopardized, potentially leading to wasted resources and inconclusive results in critical drug development research.
The Science of Gel Polymerization
The Chemical Foundation of Polyacrylamide Gel Formation
The formation of a polyacrylamide gel is a precise chemical process involving the polymerization of acrylamide monomers into long chains cross-linked by bis-acrylamide. This reaction is initiated by the generation of free radicals from ammonium persulfate (APS), which is accelerated by the catalyst TEMED [8]. The resulting gel matrix creates a porous network through which proteins migrate during electrophoresis, with the pore size directly determined by the concentration of acrylamide and the degree of cross-linking [8]. This matrix is fundamental to the separation process, as it serves as a molecular sieve that differentially retards the movement of proteins based on their size [62].
The polymerization process is delicate and can be inhibited by several factors. Oxygen is a potent inhibitor of free radical polymerization, which is why degassing the acrylamide solution before adding TEMED and APS is often recommended to remove dissolved oxygen that could interfere with the reaction [57]. The quality of the chemical reagents is equally critical; degraded APS or TEMED will result in incomplete or failed polymerization [8]. Temperature also plays a significant role, as polymerization is slower at lower temperatures and may not proceed to completion [57]. Understanding these chemical fundamentals is essential for troubleshooting polymerization issues effectively.
Systematic Troubleshooting of Polymerization Problems
Researchers commonly encounter several specific issues related to gel polymerization, each with identifiable causes and solutions:
Failed or Incomplete Polymerization: When the gel remains liquid or does not solidify uniformly, the most common culprits are degraded APS or TEMED [8]. APS solutions should be prepared fresh weekly and stored at 4°C, as the free radicals necessary for initiation have a short lifespan [8]. Similarly, TEMED should be protected from light and air exposure to maintain its efficacy. If polymerization continues to fail, increasing the concentrations of APS and TEMED by 10-20% may help, though excessive amounts can cause overheating or create irregular pore structures [57].
Extended Polymerization Time: While standard polymerization requires 20-45 minutes [32] [8], significantly longer times suggest suboptimal conditions. This can result from storing acrylamide at low temperatures or using old ammonium persulfate [57]. Casting gels at room temperature (20-25°C) rather than in a cold room ensures optimal reaction kinetics. If problems persist, degassing the acrylamide solution before adding TEMED and APS can remove oxygen that inhibits polymerization [57].
Overheating During Polymerization: The polymerization reaction is exothermic, and excessive heat generation can cause the gel to crack or create bubbles that disrupt the uniform matrix [57]. Using cooled reagents or dividing the gel solution between multiple casting apparatuses can help dissipate heat. If cracking occurs consistently, reducing the amounts of APS and TEMED slightly may moderate the reaction exotherm [57].
Soft Gel Consistency or Gel Detachment: A gel that feels soft or detaches from the glass plates often indicates poor-quality acrylamide or incorrect bis-acrylamide concentration [57]. Acrylamide solutions should be checked for precipitation or cloudiness, which signals degradation. Ensuring glass plates are thoroughly cleaned with ethanol before casting promotes proper adhesion of the polymerized gel to the glass surface [32].
Table 1: Troubleshooting Guide for Common Polymerization Issues
| Problem | Possible Causes | Recommended Solutions |
|---|---|---|
| Gel does not polymerize | TEMED or APS omitted; Degraded reagents; Temperature too low | Check recipe; Use fresh APS (store ≤1 week at 4°C) and TEMED; Cast at room temperature [57] [8] |
| Extended polymerization time | Old ammonium persulfate; Acrylamide quality poor; High thiol reagent concentration | Use fresh reagents; Degas acrylamide solution; Cast at room temperature [57] |
| Gel too soft | Poor quality acrylamide or bis-acrylamide; Too little crosslinker | Check reagent quality; Increase amount of bis-acrylamide [57] |
| Gel turns white | Bis-acrylamide concentration too high | Recheck the amount used [57] |
| Gel cracked during polymerization | Excess heat generation | Use cooled reagents; Divide solution between multiple casts [57] |
The Critical Role of Proper Well Formation
Principles of Effective Well Architecture
In SDS-PAGE, sample wells are formed in the stacking gel by inserting a comb during polymerization. These wells serve as the entry points for protein samples and must maintain their structural integrity throughout the loading and initial electrophoresis phases. The stacking gel, with its lower acrylamide concentration (typically ~5%) and pH 6.8, creates an environment where proteins become concentrated into sharp bands before entering the resolving gel [61] [8]. This concentration effect is mediated by the discontinuous buffer system involving chloride ions from the gel and glycine ions from the running buffer [61].
Well formation issues can manifest in several ways, including torn or distorted wells, uneven well bottoms, and samples leaking between wells. The integrity of the well structure directly impacts the quality of separation, as damaged wells lead to irregular sample migration, band distortion, and potential cross-contamination between adjacent lanes [63]. Proper well formation requires attention to both the polymerization process of the stacking gel and the mechanical technique of comb removal and sample loading.
Comprehensive Troubleshooting for Well Formation Issues
Addressing poor well formation requires systematic analysis of both the gel composition and handling techniques:
Torn or Distorted Wells: This common issue often occurs when the comb is removed too forcefully or before the stacking gel has fully polymerized [63]. Stacking gels typically require 15-20 minutes to polymerize completely [8]. To prevent damage, remove the comb slowly and carefully after placing the gel in the running chamber filled with buffer, which provides lubrication and support [63]. If the stacking gel consistently resists comb removal, using a gel with a slightly lower acrylamide percentage (4% instead of 5%) may help [57].
Samples Leaking Between Wells: Leakage indicates physical damage to the well walls or bottom, often resulting from careless comb removal or pipette tips puncturing the well during sample loading [63]. To detect potential leakage before sample loading, fill wells with loading dye and observe for seepage. During sample loading, use fine pipette tips and avoid touching the sides or bottom of the wells. Precast gels that are too old may also develop spontaneous well degradation [63].
Uneven Well Bottoms: A non-uniform interface between the stacking and resolving gels creates uneven well bottoms, leading to samples entering the gel at different rates and causing curved or skewed bands [63]. To ensure a level interface, carefully overlay the resolving gel with water or isopropanol immediately after pouring to create a flat surface as it polymerizes [63]. After polymerization, completely remove the overlay liquid and rinse the gel surface with stacking gel buffer before pouring the stacking gel.
Samples Not Sinking to Well Bottom: If samples float or diffuse out of wells before electrophoresis begins, this typically indicates insufficient glycerol in the sample buffer [57]. The glycerol increases sample density, helping it settle into the wells. Additionally, if samples diffuse horizontally before current is applied, this suggests a delay between loading and starting electrophoresis [64]. To prevent this, start electrophoresis immediately after loading all samples.
Table 2: Troubleshooting Guide for Well Formation Issues
| Problem | Possible Causes | Recommended Solutions |
|---|---|---|
| Samples leaking out of wells | Wells damaged during comb removal; Using old precast gels; Pipette tips puncturing wells | Remove comb carefully after placing gel in running buffer; Use fresh precast gels; Load samples carefully without touching well bottom [63] |
| Uneven or slanted wells | Uneven stacking-resolving gel interface; Comb inserted at an angle | Overlay resolving gel with isopropanol/water for even interface; Use spirit level to ensure apparatus is even; Insert comb perfectly straight [63] [57] |
| Samples not sinking in wells | Insufficient glycerol in sample buffer; Comb removed before complete polymerization | Ensure proper glycerol concentration in sample buffer; Allow stacking gel to polymerize 30 minutes before comb removal [57] |
| Samples migrating off wells before running | Long delay between loading and starting electrophoresis | Minimize time between loading first sample and starting run; Load samples faster or run fewer samples at once [64] |
| Distorted bands in peripheral lanes | Edge effect from empty wells | Load ladders or protein samples in empty wells to prevent edge effect [64] |
Experimental Protocols for Optimal Gel Preparation
Standardized Protocol for Gel Casting
A reliable protocol for preparing SDS-PAGE gels with consistent polymerization and well-defined wells is essential for reproducible results. The following methodology has been adapted from best practices across multiple sources [32] [8] [65]:
Glass Plate Preparation: Thoroughly clean the glass plates with ethanol or methanol and assemble the gel casting apparatus according to the manufacturer's instructions. Ensure that the spacers are properly aligned and that the apparatus is leak-proof [32].
Resolving Gel Preparation: For a standard 10% resolving gel, combine 3.3 mL of 30% acrylamide/bis-acrylamide solution (29:1 or 37.5:1 ratio), 2.5 mL of 1.5 M Tris-HCl (pH 8.8), 100 μL of 10% SDS, and 3.9 mL deionized water in a 50 mL conical tube [8] [65]. Mix gently without introducing excessive air bubbles. Add 50 μL of fresh 10% ammonium persulfate and 5 μL TEMED, then mix again briefly.
Casting the Resolving Gel: Immediately pour the solution between the glass plates, leaving appropriate space for the stacking gel (approximately 1-1.5 cm below the comb teeth). Carefully overlay the gel surface with isopropanol or water to create a flat interface and prevent contact with oxygen, which inhibits polymerization [63] [32]. Allow the gel to polymerize for 20-30 minutes at room temperature.
Stacking Gel Preparation: After polymerization of the resolving gel, pour off the overlay liquid and rinse the gel surface with deionized water. Prepare the stacking gel solution by combining 0.83 mL of 30% acrylamide/bis-acrylamide, 0.63 mL of 1.0 M Tris-HCl (pH 6.8), 50 μL of 10% SDS, and 3.4 mL deionized water [8] [65]. Add 25 μL of 10% APS and 2.5 μL TEMED, then mix gently.
Well Formation: Pour the stacking gel solution onto the resolving gel and immediately insert a clean comb appropriate for the desired number of wells. Avoid trapping air bubbles under the comb teeth. Allow the stacking gel to polymerize for 15-20 minutes at room temperature [8]. Once polymerized, the gel can be used immediately or stored wrapped in moist paper towels and plastic wrap at 4°C for up to one week [8].
Quality Control Assessment for Polymerized Gels
Before using freshly prepared gels, perform these quality control checks to ensure proper polymerization and well formation:
Visual Inspection: Examine the gel against a light background. The gel should appear clear and homogeneous without cloudiness or streaks. The interface between stacking and resolving gels should be straight and uniform across the entire width [63].
Well Integrity Assessment: After removing the comb, examine the wells for uniformity and structural integrity. Wells should have straight vertical walls and flat bottoms without tears or distortions [63]. Fill wells with running buffer or loading dye to check for leaks.
Polymerization Completeness Test: Gently press on the gel surface with a gloved finger. The gel should feel firm and resilient without giving way. Overly soft or sticky surfaces indicate incomplete polymerization [63].
Following these standardized protocols and quality control measures will significantly increase the consistency and reliability of hand-cast SDS-PAGE gels, providing a solid foundation for high-quality protein separations.
Visualizing the Processes: From Gel Preparation to Problem Identification
The following workflow diagrams illustrate the key processes in gel preparation and troubleshooting, providing visual guidance for researchers implementing the techniques described in this guide.
Diagram 1: Optimal Gel Preparation Workflow
Diagram 2: Troubleshooting Common Polymerization and Well Issues
The Scientist's Toolkit: Essential Reagents and Materials
Table 3: Essential Research Reagents for SDS-PAGE Gel Preparation
| Reagent/Material | Function | Optimal Specifications & Usage Notes |
|---|---|---|
| Acrylamide/Bis-acrylamide | Forms the porous gel matrix that separates proteins by size | Standard concentrations: 30-40% stock solutions; Common bis:acrylamide ratios: 29:1, 37.5:1, or 39:1; Handle with care - neurotoxic [8] [65] |
| Tris-HCl Buffer | Maintains pH during electrophoresis | Resolving gel: 1.5 M, pH 8.8; Stacking gel: 1.0 M, pH 6.8; Running buffer: 25 mM Tris, 192 mM glycine, 0.1% SDS, pH 8.3 [8] |
| Ammonium Persulfate (APS) | Free radical initiator for polymerization | Prepare fresh 10% solution weekly; Store at 4°C; Standard usage: 0.05-0.1% final concentration [8] |
| TEMED | Catalyst that accelerates polymerization by stabilizing free radicals | Store protected from light at room temperature; Use at 0.05-0.1% final concentration; Degrades upon exposure to air [8] |
| SDS (Sodium Dodecyl Sulfate) | Anionic detergent that denatures proteins and imparts uniform negative charge | 10-20% stock solutions; Standard usage: 0.1% in gels and running buffers; Binds to proteins at ~1.4g SDS per 1g protein [8] |
| Glycine | Mobile ion in discontinuous buffer system | Running buffer component; Charge state changes with pH, enabling stacking effect; Zwitterionic at pH 6.8, anionic at pH 8.8 [61] |
| Combs | Creates wells for sample loading | Various well numbers and volumes available; Insert carefully after stacking gel is poured; Remove gently in running buffer [32] |
The integrity of SDS-PAGE results in protein research and drug development hinges fundamentally on proper gel polymerization and well formation. These technical foundations, while often considered basic laboratory skills, require precise execution and systematic troubleshooting when issues arise. Through understanding the chemical principles of polyacrylamide polymerization, implementing standardized protocols with quality controls, and applying targeted solutions to common problems, researchers can achieve the consistent, high-quality separations necessary for reliable data interpretation. As the field of proteomics continues to advance, with techniques like NSDS-PAGE emerging to preserve native protein properties while maintaining separation resolution [14], the fundamental mastery of these core SDS-PAGE components remains essential. By addressing polymerization issues and poor well formation with the comprehensive strategies outlined in this guide, scientists can ensure that their electrophoretic separations provide trustworthy foundations for critical research conclusions and drug development decisions.
Optimizing Voltage, Run Time, and Buffer Conditions for Superior Band Clarity
Sodium dodecyl sulfate-polyacrylamide gel electrophoresis (SDS-PAGE) stands as a cornerstone technique in biochemical research, enabling the separation of denatured proteins primarily by molecular weight [19] [1]. The core principle involves coating proteins with the anionic detergent SDS, which confers a uniform negative charge, thereby allowing migration through a polyacrylamide gel matrix under an electric field to be determined principally by size [38]. While the fundamental methodology is well-established, achieving consistently superior band clarity—characterized by sharp, well-resolved, and straight bands—remains a nuanced endeavor critical for accurate analysis in applications ranging from routine protein characterization to proteomic studies and drug development.
Band clarity serves as a key indicator of a well-optimized SDS-PAGE process. Fuzzy, smeared, or distorted bands can compromise molecular weight determination, obscure the detection of specific protein isoforms, and hinder quantitative analysis [66] [67]. The journey toward optimal resolution requires a sophisticated understanding of the interplay between three fundamental components: the electrical parameters (voltage, current, power), the temporal dimension (run time), and the chemical environment (buffer composition) [68] [69]. This guide delves into the systematic optimization of these parameters, providing a detailed technical framework for researchers seeking to achieve the highest standard of protein separation.
Core Principles: The Trifecta of Band Separation
The migration of proteins through a polyacrylamide gel is a complex process governed by several interdependent factors. A mastery of the underlying principles of the electrical field, the properties of the gel matrix, and the buffer system is a prerequisite for effective optimization.
The Electrophoretic Field: Current, Voltage, and Power
The application of an electric field is the driving force behind protein migration. Most modern power supplies offer the option to run gels under constant voltage, constant current, or constant power, each with distinct implications for band clarity and experimental reproducibility [68] [70].
Ohm's Law and Heat Production: The relationship between voltage (V, the driving force), current (I, the flow of charge), and resistance (R) is defined by Ohm's Law (V = I × R). Power (P, in watts), calculated as P = I × V, is directly proportional to the heat generated within the system—a phenomenon known as Joule heating [70]. Excessive heat is a primary adversary of band clarity, causing gels to expand unevenly and resulting in the "smiling" or "frowning" of bands where bands at the edges of the gel curve upward or downward [66] [68].
Choosing the Right Mode:
- Constant Voltage: In this mode, the voltage is fixed, and the current decreases as resistance increases during the run. This leads to a gradual reduction in protein migration rate but generates less heat over time, making it a safer option that minimizes overheating risks [70].
- Constant Current: This mode maintains a consistent migration rate, allowing for predictable run times. However, as resistance increases, the power supply must increase the voltage to maintain the set current, leading to increased heat production that can distort bands if not properly managed [70].
- Constant Power: This mode attempts to keep power, and thus heat production, constant. However, because both voltage and current fluctuate, the migration rate becomes less predictable [68] [70].
The Gel Matrix: A Molecular Sieve
The polyacrylamide gel acts as a molecular sieve. Its pore size, determined by the concentration of acrylamide and bisacrylamide, dictates the size range of proteins that can be effectively resolved [19]. A higher percentage of acrylamide creates a smaller pore size, ideal for separating lower molecular weight proteins, while a lower percentage is better suited for larger proteins [38]. Gradient gels, which contain a continuous increase in acrylamide concentration from top to bottom, provide a broader separation range within a single gel [19]. Incomplete polymerization of the gel can create uneven pore sizes, leading to poor resolution and fuzzy bands [67].
The Buffer System: The Ionic Environment
The running buffer is not merely a conductor of electricity; it is an active participant in the separation process. The traditional Laemmli discontinuous system uses Tris-glycine buffers at different pH levels in the stacking and resolving gels to concentrate proteins into sharp bands before separation [1] [69]. The leading chloride ions and trailing glycine ions create a moving boundary that stacks the protein samples. The ionic strength and pH of the buffer are critical; deviations can alter protein mobility, leading to diffuse bands or poor resolution [66] [38]. Recent advancements have introduced novel buffer formulations, such as Tris-Tricine-HEPES, to overcome limitations in resolving low molecular weight proteins and to reduce overall run times [69].
Optimization Parameters: A Systematic Approach
Voltage and Run Time Optimization
Optimizing electrical parameters is a balance between achieving a swift separation and generating excessive heat that compromises band quality. A common strategy is to initiate the run at a lower voltage in the stacking gel to ensure proper band formation, followed by an increase in voltage for the resolving gel [68] [71].
Table 1: Optimized Voltage and Run Time Guidelines for Standard Mini-Gels (∼1 mm thick)
| Step | Gel Region | Constant Voltage | Constant Current | Approx. Run Time | Key Rationale |
|---|---|---|---|---|---|
| Initial Phase | Stacking Gel | 50-80 V | 100-120 mA | 20-30 minutes | Allows proteins to concentrate into sharp bands before entering the resolving gel [68] [70]. |
| Main Phase | Resolving Gel | 100-150 V | 120-150 mA | 40-60 minutes (or until dye front reaches bottom) | Balances separation efficiency with heat generation. Higher voltages risk smiling bands [66] [38] [71]. |
| General Guideline | Entire Gel | 5-15 V/cm of gel length [70] | N/A | Varies by protocol | A standard rule of thumb for determining appropriate voltage based on gel size. |
To mitigate heat-induced band distortion ("smiling"), several strategies can be employed. These include running the gel in a cold room, submerging the apparatus in an ice bath, or using an external cooling system [66] [70]. Furthermore, monitoring the run and stopping it promptly when the dye front (e.g., bromophenol blue) approaches the bottom of the gel is crucial to prevent lower molecular weight proteins from running off the gel, which can also lead to a loss of band definition [66] [38].
Voltage Optimization Workflow
Buffer Composition and Advanced Systems
The choice of running buffer is pivotal for defining the separation landscape. While Tris-Glycine is the most common system, it has limitations, particularly in resolving small proteins (<15 kDa) and generating excessive heat at higher voltages [69]. Alternative buffer systems offer significant advantages for specific applications.
Table 2: Comparison of SDS-PAGE Running Buffer Systems
| Buffer System | Standard Composition | Optimal Protein Range | Key Advantages | Key Disadvantages |
|---|---|---|---|---|
| Tris-Glycine (Laemmli) | 25 mM Tris, 192 mM Glycine, 0.1% SDS [1] | 10 - 200 kDa [69] | Widely used, low cost, standard for most proteins. | Poor resolution of small proteins (<15 kDa); long run times; excessive heat at high voltage [69]. |
| Tris-Tricine | Tris, Tricine, 0.1% SDS [69] | < 15 kDa (small proteins/peptides) | Excellent resolution of low molecular weight proteins. | Poor for high MW proteins (>100 kDa); run times can be long (up to 5h) [69]. |
| Tris-Tricine-HEPES (FRB) | Tris, Tricine, HEPES, SDS [69] | 15 - 450 kDa in a single 10% gel | Wide molecular weight range; significantly reduced run time (e.g., ~35 min); less Joule's heat. | Novel formulation, may require protocol adaptation. |
| Bis-Tris with MES/MOPS | Bis-Tris gel, MES or MOPS in running buffer [72] | MES: ≤50 kDa\nMOPS: ≥50 kDa | Sharper bands; less background staining; stable, neutral pH extends gel shelf-life. | More expensive; Bis-Tris is a chelating agent [72]. |
The novel Tris-Tricine-HEPES (FRB) buffer represents a significant advancement. It creates multiple ionic boundaries that improve resolving power and allows for faster run times (e.g., 150 V for 15 min followed by 200 V for 20 min) without the associated excessive heat generation of traditional systems [69]. Similarly, the Bis-Tris gel system, used with MES (for low MW) or MOPS (for high MW) running buffer, operates at a more neutral pH. This suppresses cysteine reoxidation and protein cross-linking, which is a common cause of smeary bands and poorer resolution [72].
Buffer Selection Logic
Integrated Experimental Protocol for Superior Clarity
The following detailed protocol synthesizes the optimized parameters discussed above, providing a reliable methodology for achieving sharp, well-resolved protein bands.
Protocol: High-Resolution SDS-PAGE Using an Optimized Buffer System
I. Sample Preparation (Critical for Preventing Fuzzy Bands)
- Denaturation: Mix protein sample with 2X or 5X SDS-PAGE sample loading buffer. Ensure the final concentration of SDS is sufficient (∼1%) and include a reducing agent like Dithiothreitol (DTT, 10-100 mM) or β-mercaptoethanol (5%) to break disulfide bonds [1] [71].
- Heating: Heat samples at 95°C for 5 minutes (or 70°C for 10 minutes) to ensure complete denaturation and unfolding of proteins. Avoid prolonged heating, which can lead to protein aggregation [1] [71] [67].
- Cooling: Briefly centrifuge heated samples to bring down condensation before loading.
II. Gel Preparation and Loading
- Gel Choice: Select an appropriate acrylamide percentage for your target protein(s) (e.g., 10% for 15-100 kDa proteins) or use a gradient gel (e.g., 4-20%) for a broader range [19] [38]. Ensure the gel has polymerized completely.
- Loading: Rinse sample wells with deionized water or running buffer to remove unpolymerized acrylamide and debris [71]. Load an appropriate amount of protein; overloading wells is a common cause of smearing (start with 0.5 µg per band for cell lysates) [71] [67]. Include a molecular weight marker (protein ladder) in one well.
- Start Immediately: Begin electrophoresis as soon as possible after loading the samples to prevent diffusion from the wells [66] [71].
III. Electrophoresis Run with Optimized Conditions
- Buffer: Fill the electrode chambers with a freshly prepared running buffer. For a standard Tris-Glycine system, use 25 mM Tris, 192 mM Glycine, 0.1% SDS, pH 8.3 [1]. For superior results, consider the novel FRB (50 mM Tris, 150 mM Tricine, 50 mM HEPES, 0.1% SDS) [69] or a Bis-Tris/MOPS system for high molecular weight proteins [72].
- Run Parameters:
- Setting: Constant Voltage.
- Initial Phase: Run at 80 V through the stacking gel (∼30 min).
- Main Phase: Increase to 150 V for the resolving gel.
- Cooling: If the apparatus becomes warm to the touch, employ a cooling bath or run in a cold room [66] [70].
- Duration: Stop the run when the bromophenol blue dye front is about 0.5-1 cm from the bottom of the gel.
IV. Post-Electrophoresis
- Staining: Follow standard procedures for Coomassie Blue, silver staining, or other detection methods [38].
- Analysis: Use gel documentation and densitometry software for accurate analysis of band size and intensity [38].
The Scientist's Toolkit: Essential Reagents for Success
Table 3: Key Research Reagent Solutions for SDS-PAGE
| Reagent / Solution | Critical Function | Optimization Tip |
|---|---|---|
| SDS (Sodium Dodecyl Sulfate) | Denatures proteins and confers a uniform negative charge, enabling separation by mass [19] [38]. | Use high-purity SDS. Ensure excess SDS is present in the sample buffer (typically 1-2% w/v). |
| Acrylamide/Bis-acrylamide | Forms the cross-linked polyacrylamide gel matrix that acts as a molecular sieve [19]. | Adjust total percentage (e.g., 8%, 10%, 12%) based on target protein size. Use a gradient gel for a wider size range. |
| Reducing Agents (DTT, β-ME) | Cleaves disulfide bonds to fully unfold proteins, preventing aggregation and smearing [1] [71]. | Use fresh DTT (10-100 mM) or β-mercaptoethanol (5%). For Bis-Tris gels, adding sodium bisulfite to the running buffer can help. |
| TEMED & Ammonium Persulfate (APS) | Catalyzer (TEMED) and initiator (APS) for the free-radical polymerization of acrylamide gels [19] [1]. | Use fresh APS solution. Amounts can be adjusted to control polymerization speed. |
| Tris-Based Buffers | Maintains the pH required for proper protein charge and ion mobility [19] [1]. | For sharper bands and low MW proteins, consider Bis-Tris (pKa ~6.5) gels over traditional Tris (pKa ~8.1) [72]. |
| Alternative Trailing Ions (Tricine, MES, MOPS) | Replace glycine in running buffer to modify separation characteristics (e.g., better resolution of low MW proteins) [69] [72]. | Use MES for proteins ≤50 kDa and MOPS for proteins ≥50 kDa in Bis-Tris systems [72]. Tricine-HEPES buffers offer wide-range resolution [69]. |
Achieving superior band clarity in SDS-PAGE is not the product of a single factor but the culmination of a meticulously optimized system. As detailed in this guide, this requires a holistic approach that carefully balances electrical parameters to manage heat production, selects buffer systems tailored to the specific protein targets and desired outcomes, and adheres to rigorous sample preparation and running protocols. By understanding and controlling the synergy between voltage, run time, and buffer conditions, researchers can transform their SDS-PAGE results from variable to consistently publication-grade, thereby enhancing the reliability and precision of their scientific data in the demanding fields of research and drug development.
Within the framework of basic SDS-PAGE components and their roles in research, sample preparation emerges as the foundational step that dictates experimental success. The SDS-PAGE system relies on proteins being uniformly denatured and coated with the anionic detergent SDS to impart a consistent negative charge, allowing separation primarily by molecular weight within the polyacrylamide gel matrix [32] [73]. However, challenging samples containing high salt, aggregates, or precipitates can severely disrupt this process, leading to aberrant protein migration, poor resolution, and compromised data. For researchers and drug development professionals, mastering strategies to overcome these challenges is not merely a technical exercise but a critical component of generating reliable, reproducible protein data. This guide details evidence-based protocols to navigate these common yet disruptive sample issues, ensuring the integrity of downstream analyses.
Section 1: Managing High-Salt Concentrations
The Interference Mechanism of High Salt
High salt concentrations increase the electrical conductivity of the sample solution [74]. This altered conductivity disrupts the uniform voltage gradient across the gel, leading to inconsistent protein migration rates, distorted band shapes, and overall poor resolution [74]. In severe cases, high salt can create visible artifacts in adjacent lanes. Sample buffers for techniques like chromatography often contain salts or other components that can perturb electrophoresis and must be removed prior to analysis [75].
Precipitation Protocols for Desalting and Concentration
Precipitation is a highly effective method for simultaneously desalting and concentrating dilute protein samples.
Trichloroacetic Acid (TCA) Precipitation: A standard and robust protocol for pelletizing proteins.
- Procedure:
- Add an equal volume of 10% TCA to your protein sample (e.g., 100 µl sample + 100 µl 10% TCA) [39].
- Incubate on ice for 20 minutes to ensure complete precipitation.
- Centrifuge at maximum speed in a microcentrifuge (typically >12,000 × g) for 15 minutes to pellet the protein [39].
- Carefully decant the supernatant.
- Wash the pellet with 100 µl of ice-cold ethanol or acetone to remove residual TCA and salts.
- Air-dry the pellet briefly to evaporate the organic solvent.
- Resuspend the pellet in an appropriate volume of 1X SDS-PAGE sample buffer [39].
- Heat the sample at 85-95°C for 2-5 minutes to denature the protein [74] [39].
Pyrogallol Red-Molybdate Precipitation: An alternative method noted for its effectiveness with a wide range of interfering substances. Research has demonstrated its success in precipitating nanogram amounts of protein from solutions containing organic solvents, chaotropic agents, sucrose, chelators, and high salt (up to 1.0 M NaCl) [75]. This method is particularly useful for pilot-scale protein fractionation.
Table 1: Efficacy of Precipitation Methods Against Interfering Substances
| Interfering Substance | TCA Precipitation | Pyrogallol Red-Molybdate Precipitation |
|---|---|---|
| High Salt (e.g., 1 M NaCl) | Effective [39] | Effective [75] |
| Organic Solvents | Compatible | Effective (Acetonitrile, Methanol) [75] |
| Chaotropic Agents | Compatible | Effective (6 M Urea, 6 M Gu-HCl) [75] |
| Non-ionic Detergents | Compatible | Effective (Triton X-100, Tween 20) [75] |
| Ionic Detergents | Not Recommended | Not Effective (SDS, CTAB) [75] |
Figure 1: Decision workflow for handling samples with high salt concentrations.
Section 2: Resolving and Preventing Protein Aggregation
Understanding the Causes of Aggregation
Protein aggregation and precipitation in the sample well is a common issue that prevents proteins from entering the gel matrix, manifesting as clumping and improper migration [76]. This is often caused by hydrophobic interactions, improper folding, or overloading the well with too much protein, which leads to aggregation during electrophoresis [62] [76]. Samples containing genomic DNA can also become viscous, affecting migration and resolution [74].
Strategies for Maintaining Protein Solubility
A multi-faceted approach is required to combat aggregation, focusing on sample composition and handling.
- Optimized Denaturation and Reduction: Ensure complete unfolding by using sufficient SDS and a reducing agent. Dithiothreitol (DTT, 50 mM final), β-mercaptoethanol (2.5%), or Tris(2-carboxyethyl)phosphine (TCEP, 50 mM) are common choices for breaking disulfide bonds [74]. Heat samples at 85°C for 2-5 minutes for optimal denaturation, as overheating can promote proteolysis [74].
- Add Chaotropes for Hydrophobic Proteins: For proteins prone to aggregation due to hydrophobic regions, adding 4-8 M urea to the lysis buffer can help maintain solubility [76].
- Shear Genomic DNA: Viscous cell lysates containing genomic DNA should be sheared by sonication or passed through a small-gauge needle before centrifugation to remove debris [74].
- Optimize Protein Load: A general practice is to load 10-25 µg of total protein per well for a mini-gel [14] [76]. Excess protein can cause aggregation and poor band resolution [62]. Validate the optimal load for your specific protein and detection method.
- Prevent Renaturation: After boiling, immediately place samples on ice to prevent gradual cooling, which can allow proteins to renature and potentially aggregate [62].
Section 3: The Researcher's Toolkit for Difficult Samples
Successfully managing difficult samples requires a suite of specialized reagents and materials. The table below outlines key solutions for the challenges discussed.
Table 2: Essential Research Reagents for Troubleshooting SDS-PAGE Samples
| Reagent/Material | Primary Function | Application Notes |
|---|---|---|
| Trichloroacetic Acid (TCA) | Protein precipitation; desalting and concentration. | Effective for pelleting proteins from dilute or salt-containing solutions. Pellet must be thoroughly washed [39]. |
| Pyrogallol Red-Molybdate | Protein precipitation; removal of diverse interferents. | Useful for samples containing organic solvents, chaotropes, or chelators. Does not work with ionic detergents [75]. |
| Urea | Chaotrope; disrupts hydrophobic interactions. | Add at 4-8 M to lysis buffer to solubilize hydrophobic proteins and prevent aggregation [76]. |
| Dithiothreitol (DTT) | Reducing agent; breaks disulfide bonds. | Use at 50 mM final concentration. Avoid long-term storage of reduced samples to prevent reoxidation [74]. |
| Dialysis Tubing/Spin Columns | Desalting and buffer exchange. | Ideal for salt-sensitive proteins or when precipitation may lead to irreversible pellet formation [74]. |
| Benzonase Nuclease | Enzyme; degrades nucleic acids. | Reduces sample viscosity caused by genomic DNA, improving band resolution [14]. |
Section 4: Integrated Workflow for Complex Sample Preparation
Real-world samples often present multiple simultaneous challenges. The following integrated protocol is designed for a complex sample, such as a cell lysate in a high-salt buffer.
Objective: Prepare a viscous, high-salt cell lysate for high-resolution SDS-PAGE. Materials: Lysis buffer, TCA, ice-cold ethanol, SDS-PAGE sample buffer, DTT, microcentrifuge, sonicator or needle.
Procedure:
- Lysis and Clarification: Lyse cells in an appropriate buffer. Centrifuge the lysate at high speed (e.g., 12,000 × g) for 10 minutes at 4°C to remove insoluble debris and collect the supernatant [74].
- DNA Shearing: If the lysate is viscous, shear the genomic DNA by brief sonication or by passing the lysate several times through a 25-gauge needle [74].
- Protein Precipitation: Perform TCA precipitation as described in Section 1.2 to simultaneously concentrate the proteins and remove salts [39].
- Denaturation and Reduction: Resuspend the final protein pellet in 1X SDS-PAGE sample buffer containing 50 mM DTT. Vortex and briefly centrifuge to collect the sample at the bottom of the tube.
- Controlled Heating: Heat the samples at 85°C for 2-5 minutes to achieve complete denaturation without promoting degradation [74].
- Immediate Cooling: Immediately after heating, place the samples on ice until ready to load the gel to prevent renaturation [62].
Figure 2: Comprehensive workflow for preparing a complex sample, such as a high-salt cell lysate, for SDS-PAGE analysis.
Navigating the challenges of high salt, aggregates, and precipitates is an indispensable skill in protein biochemistry. By understanding the underlying principles of SDS-PAGE and applying the targeted strategies outlined in this guide—such as precipitation for desalting, the use of chaotropes and reducing agents to prevent aggregation, and adherence to optimized denaturation protocols—researchers can transform problematic samples into reliable data. These protocols, when executed within the context of a thoughtful experimental design, ensure the robustness and reproducibility of SDS-PAGE analysis, thereby solidifying the foundation for all subsequent protein characterization efforts in research and drug development.
Within the fundamental framework of SDS-PAGE (Sodium Dodecyl Sulfate–Polyacrylamide Gel Electrophoresis), a core technique for protein separation based on molecular weight, researchers often encounter limitations with standard single-concentration gels when addressing complex biological questions. These standard gels, while excellent for separating proteins within a specific size range, struggle with resolving broad molecular weight distributions or distinguishing between proteins of similar size. To overcome these constraints, advanced electrophoretic techniques have been developed. This guide focuses on two such powerful optimization strategies: gradient gels and two-dimensional electrophoresis. These methods represent significant refinements to the basic SDS-PAGE system, enabling researchers to achieve superior resolution and gain deeper insights into proteomic samples, which is crucial for fields such as drug development and biomarker discovery.
Gradient gels enhance the separation capability of the standard one-dimensional system by creating a pore matrix of varying density, while two-dimensional electrophoresis combines two orthogonal separation principles to resolve thousands of protein features simultaneously. Mastering these techniques allows scientists to maximize the value of their precious samples and obtain publication-quality data with high analytical confidence.
The Principle and Advantages of Gradient Gels
Unlike fixed-concentration polyacrylamide gels, gradient gels are formulated with a continuous range of acrylamide concentrations, typically from a low percentage at the top to a high percentage at the bottom [44]. This creates a pore structure where the mesh size becomes progressively smaller as proteins migrate through the gel. This design confers several key advantages over standard gels.
First, gradient gels can resolve a much broader range of protein sizes on a single gel. Where multiple fixed-concentration gels would be needed to separate proteins from 10 kDa to 200 kDa, a single 4-20% gradient gel can achieve this effectively, preserving limited sample material [44]. Second, gradient gels produce sharper bands. As a protein migrates, its leading edge encounters progressively smaller pores and slows down, while its trailing edge continues to move forward in larger pores. This phenomenon causes the protein band to "stack" on itself, resulting in tighter, sharper bands [44]. Finally, this technique offers superior separation of similarly-sized proteins. The increasing resistance faced by proteins as they migrate forces them to separate based on subtle size differences, putting more distance between close-traveling bands, which is particularly useful for analyzing protein isoforms or cleavage products [44] [77].
Selecting the Appropriate Gradient
Choosing the correct gradient is paramount and depends on the molecular weights of the target proteins. The optimal gradient range should be selected based on the specific proteins of interest to ensure optimal separation and resolution.
Table 1: Guideline for Selecting a Gradient Gel Based on Protein Size
| Range of Protein Sizes | Low/High Acrylamide Percentages | Primary Application |
|---|---|---|
| 4 – 250 kDa | 4% / 20% | Discovery work; analyzing entire proteomes without bias [44] |
| 10 – 100 kDa | 8% / 15% | Targeted analysis of a broad mid-range, avoiding multiple gels [44] |
| 50 – 75 kDa | 10% / 12.5% | High-resolution separation of similarly sized proteins [44] |
Comprehensive Workflow for Two-Dimensional Gel Electrophoresis
Two-dimensional polyacrylamide gel electrophoresis (2D-PAGE) represents a powerful extension of standard gel electrophoresis, enabling the high-resolution separation of complex protein mixtures by two distinct physicochemical properties: isoelectric point (pI) and molecular weight [78]. Its principal strength is the ability to resolve and investigate the abundance of several thousand proteins from a single sample, enabling the identification of major proteins in a tissue or subcellular fraction by mass spectrometric methods [78].
The typical 2D-PAGE workflow begins with sample preparation, which may involve prefractionation steps to reduce complexity and enrich for proteins from specific cellular compartments [78]. The first dimension is isoelectric focusing (IEF), where proteins are separated based on their pI using immobilized pH gradient (IPG) strips. The second dimension is SDS-PAGE, where the focused proteins from the IPG strip are separated orthogonally by their molecular weight, often using a gradient gel for enhanced resolution [78] [79]. The resulting gel is then stained (e.g., with Coomassie, silver, or fluorescent Sypro stains) and imaged for quantitative analysis [78].
Despite its resolving power, 2D-PAGE has limitations, including challenges in detecting very low-abundance proteins, proteins with extreme pI or high molecular weight, and hydrophobic proteins [78]. However, it remains a widely used and invaluable tool in proteomics for comparative analysis of protein expression across different samples, such as diseased versus healthy states, allowing researchers to identify proteins with correlated differences in expression that may participate in related biological processes [78].
Key Considerations for 2D-PAGE Optimization
- Protein Detection and Quantitation: The choice of stain is critical. While silver staining offers high sensitivity, it has a limited dynamic range and can be incompatible with mass spectrometry. Fluorescent stains like Sypro Ruby offer excellent sensitivity, a wide dynamic range, and compatibility with downstream protein identification [78]. For quantitative comparisons, specialized software is used to analyze spot intensities, though irreproducibility remains a challenge that requires careful experimental design and normalization [78].
- Complementary Technologies: While 2D-PAGE is a cornerstone of proteomics, newer techniques like multi-dimensional liquid chromatography (MD-LC) and isotope-coded affinity tagging (ICAT) have emerged. These methods are not necessarily replacements but rather complementary approaches that can be used in conjunction with 2D-PAGE to achieve more comprehensive proteome coverage [78].
Experimental Protocols
Protocol 1: Preparing a Gradient Gel
Two common methods exist for casting gradient gels. The following protocol outlines the use of a gradient maker, which provides a consistent and reproducible gradient [44].
Materials Required:
- Gradient maker (two-chamber apparatus with connecting valve and outlet)
- Peristaltic pump (optional, for controlled flow)
- Gel casting apparatus (glass plates, spacers, comb)
- Acrylamide/bis-acrylamide stock solutions (e.g., 30% for high-percentage solution, 4% for low-percentage solution)
- Separating gel buffer (e.g., 2.5x Tris-HCl, pH 8.8)
- Stacking gel buffer (e.g., 0.5x Tris-HCl, pH 6.8)
- Catalysts: 10% Ammonium Persulfate (APS) and TEMED
- Water-saturated butanol or isopropanol
Method:
- Assemble the Gel Cast: Set up the glass plates with spacers according to the manufacturer's instructions, ensuring a tight seal.
- Prepare Acrylamide Solutions: In two separate containers, prepare the low-percentage and high-percentage acrylamide solutions for the desired gradient (e.g., 8% and 15% for a 8-15% gradient). Use the separating gel buffer, water, and SDS. Do not add APS and TEMED at this stage [44].
- Set Up Gradient Maker: Place the gradient maker on a stir plate above the gel cast. Ensure the connecting valve between the two chambers is closed. Connect tubing from the outlet to the gel cast, possibly using a peristaltic pump.
- Initiate Polymerization and Pour: Add APS and TEMED to both acrylamide solutions and mix. Pour the low-percentage solution into the chamber of the gradient maker farthest from the outlet ("reservoir" chamber). Open the connecting valve briefly to fill the passage, then close it. Pour the high-percentage solution into the chamber nearest the outlet ("mixing" chamber). Add a small stir bar to the mixing chamber and begin stirring gently.
- Open Valves and Pour Gel: Open the connecting valve and then the outlet valve simultaneously. Allow the solutions to flow from the gradient maker into the gel cast. The high-percentage solution will flow first, followed by an increasingly dilute mixture as the low-percentage solution drains into the mixing chamber, creating the gradient.
- Overlay and Polymerize: Once poured, gently overlay the gel with water-saturated alcohol to exclude oxygen and create a flat meniscus. Allow the gel to polymerize completely (approx. 20-30 minutes).
- Add Stacking Gel: After polymerization, pour off the overlay, rinse the top of the gel, and pour a standard stacking gel on top. Insert the comb and allow it to polymerize.
Protocol 2: Standard SDS-PAGE for the Second Dimension of 2D-PAGE
This protocol describes running the second dimension SDS-PAGE, which can be performed on a standard or gradient gel [39].
Materials Required:
- Polymerized gel (with stacking and resolving layers)
- Protein samples, prepared with SDS-PAGE sample buffer
- Electrophoresis apparatus and power supply
- Running buffer (e.g., Tris-glycine-SDS buffer, pH 8.3)
- Molecular weight marker
Method:
- Sample Preparation: Mix protein samples with an equal volume of 2x SDS-PAGE sample buffer (containing SDS, glycerol, bromophenol blue, and a reducing agent like β-mercaptoethanol or DTT). Heat the samples at 95°C for 5 minutes to denature the proteins [39] [1].
- Assemble Apparatus: Mount the polymerized gel in the electrophoresis chamber. Fill the inner and outer chambers with running buffer, ensuring the wells are submerged.
- Load Samples: Using a microsyringe, load equal amounts of protein (e.g., 10-20 µg) or the prepared first-dimension IPG strip into the wells. Load a molecular weight marker in one well.
- Run Electrophoresis: Connect the apparatus to the power supply. Run the gel at a constant voltage (e.g., 80-100 V for a mini-gel) through the stacking gel, then increase to 120-150 V for the resolving gel. Continue until the dye front (bromophenol blue) reaches the bottom of the gel.
- Protein Visualization: After electrophoresis, carefully disassemble the gel apparatus. The gel can be stained with Coomassie Brilliant Blue, silver stain, or a fluorescent dye to visualize the separated protein bands or spots (for 2D gels) [39].
Table 2: Essential Research Reagent Solutions for Gel Electrophoresis
| Reagent Solution | Function and Role in Experimentation |
|---|---|
| Acrylamide/Bis-acrylamide | Forms the polyacrylamide gel matrix; the ratio and concentration determine pore size for molecular sieving [32] [39]. |
| SDS (Sodium Dodecyl Sulfate) | An ionic detergent that denatures proteins and confers a uniform negative charge, allowing separation by size alone [80] [1]. |
| Tris-Glycine Running Buffer | The discontinuous buffer system that facilitates protein stacking at the gel interface and conducts current during electrophoresis [80] [1]. |
| APS & TEMED | Catalyst (APS) and stabilizer (TEMED) for the free-radical polymerization of acrylamide into a solid gel [39] [1]. |
| Laemmli Sample Buffer | Contains SDS, glycerol, a reducing agent, and tracking dye to denature proteins, add density, and visualize migration [80] [1]. |
Visualization and Workflow Diagrams
The following diagrams illustrate the logical workflow for two-dimensional gel electrophoresis and the fundamental structure of a gradient gel.
Diagram 1: A simplified workflow for two-dimensional gel electrophoresis (2D-PAGE), separating proteins first by charge (pI) and then by molecular weight.
Diagram 2: The structure of a discontinuous gradient gel, showing the low-percentage stacking gel on top of the resolving gel, which features a continuous gradient of increasing acrylamide concentration and decreasing pore size from top to bottom.
Validating Results and Comparing Techniques: Ensuring Data Accuracy in Protein Analysis
Following protein separation via SDS-PAGE, visualization of the resulting protein bands requires specialized staining techniques. These methods enable researchers to detect, quantify, and analyze proteins based on band intensity and position, providing critical information about molecular weight, sample purity, and relative abundance. Among the various available techniques, Coomassie Brilliant Blue staining stands as a fundamental, widely-used method due to its simplicity and robustness, while silver staining offers an advanced alternative for cases requiring extreme sensitivity. This guide provides an in-depth technical examination of these core staining methodologies, detailing their principles, protocols, and applications within modern biochemical research and drug development pipelines. The selection of an appropriate staining method directly impacts the quality of data obtained and influences subsequent analytical steps, making this knowledge essential for experimental success.
Core Staining Methods: Principles and Characteristics
Protein staining after electrophoresis is a critical step for visualizing otherwise invisible protein bands within the polyacrylamide gel matrix. The two primary methods, Coomassie Blue and Silver Stain, function on different biochemical principles and offer distinct advantages.
Coomassie Brilliant Blue Staining is a widely used technique due to its simplicity, reproducibility, and compatibility with downstream protein analysis [81] [82]. The stain contains anionic triphenylmethane dye molecules that bind non-covalently to proteins primarily through ionic interactions with positively charged amino acid residues (arginine, lysine, and histidine) and, to a lesser extent, via hydrophobic interactions [82]. Upon binding, the dye undergoes a spectral shift, turning the protein bands a brilliant blue against a clear background [82]. The method is considered reliable and robust, making it a staple in most protein analysis workflows.
Silver Staining is a more complex and sensitive histological technique that has been adapted for protein detection in gels. Its principle relies on the binding of silver ions to protein functional groups (e.g., sulfhydryl and carboxyl groups), followed by their reduction to metallic silver, which deposits on the proteins and creates a visible brown-black color [83]. Recent optimizations, such as the novel method using a 1 mol/L silver nitrate solution with a gelatin-formic acid mixture, have improved its efficiency and reliability for staining intricate structures like the osteocyte lacuno-canalicular system (LCS) in bone research [83] [84]. This method is significantly more sensitive than Coomassie staining and is preferred when detecting very low protein quantities is necessary.
The table below summarizes the key characteristics of these two staining methods for easy comparison.
Table 1: Quantitative Comparison of Coomassie Blue and Silver Staining Methods
| Characteristic | Coomassie Blue Staining | Silver Staining |
|---|---|---|
| Detection Sensitivity | ~0.1 - 0.5 μg per band [82]; 5-30 ng per band [81] | Higher than Coomassie; exact values not specified in search results [83] |
| Mechanism of Action | Ionic & hydrophobic binding to basic amino acids [82] | Silver ion binding and reduction to metallic silver [83] |
| Primary Applications | Routine protein visualization, quantification, purity assessment [81] [82] | High-sensitivity detection, histology (e.g., osteocyte LCS) [83] [84] |
| Compatibility | Compatible with mass spectrometry [81] [82] | Information not specified in search results |
| Cost & Complexity | Low cost, simple protocol [81] | More complex protocol, cost-effective optimized methods available [83] [84] |
Detailed Experimental Protocols
Coomassie Blue Staining Protocol
The following protocol is a consolidated standard method derived from multiple laboratory resources [81] [82] [85]. The entire process can take several hours to overnight, though rapid microwave-assisted protocols can reduce this to under an hour [86].
Materials Required:
- Staining Solution: 0.1% (w/v) Coomassie Brilliant Blue R-250, 40% Ethanol (or Methanol), 10% Acetic Acid [82] [85].
- Destaining Solution: 10% Ethanol, 7.5% Acetic Acid (or 20-40% Methanol with 10% Acetic Acid) [82] [85].
- Gel Washing/Fixing Solution (Optional): 50% Methanol, 10% Acetic Acid [81].
- Storage Solution: 5% Acetic Acid [81].
- Equipment: Staining container, orbital shaker, microwave oven (optional), gel documentation system.
Step-by-Step Procedure:
- Fixing (Optional but Recommended): After electrophoresis, transfer the gel to a fixing solution (e.g., 50% ethanol, 10% acetic acid). Soak for 10 minutes to 1 hour with gentle agitation to precipitate proteins and remove SDS and buffer salts that can interfere with staining [81] [82].
- Washing: Decant the fixative. Cover the gel with a washing solution (e.g., 50% methanol, 10% acetic acid) and agitate gently for a minimum of 2 hours or overnight to ensure thorough protein fixation [81].
- Staining: Pour Coomassie staining solution over the gel to cover it completely. Agitate gently on an orbital shaker for a minimum of 3 hours or overnight for maximum sensitivity.
- Rapid Protocol: For faster staining, heat the gel in staining solution using a microwave (e.g., 15-second increments for a total of 1 minute, ensuring it does not boil) followed by 15-30 minutes of shaking [86].
- Destaining: Decant the stain solution. Rinse the gel briefly with deionized water. Add destaining solution to cover the gel and agitate. Change the destaining solution as needed until the background is clear and blue protein bands are visible [81] [85].
- Rapid Protocol: Microwave the gel in destaining solution (e.g., 1 minute) and then shake for 30-60 minutes, reheating once midway [86].
- Storage & Imaging: For long-term storage, equilibrate the gel in a storage solution (e.g., 5% acetic acid) for at least 1 hour. Image the gel using a standard gel documentation system [81].
Silver Staining Protocol (Optimized Method)
This protocol outlines a novel optimized silver nitrate staining method for protein gels, adapted from a recent histological technique for staining the osteocyte lacuno-canalicular system, demonstrating enhanced efficiency [83] [84].
Materials Required:
- Staining Solution: Prepare immediately before use by mixing:
- Termination Solution: Milli-Q water [83] [84].
Step-by-Step Procedure:
- Preparation: After electrophoresis, ensure the gel is properly fixed and washed to remove interfering substances.
- Staining Application: Cover the gel with the freshly prepared staining solution. Ensure the gel is fully immersed.
- Incubation: Perform staining for 1 hour under 254 nm ultraviolet light or for 90 minutes under regular room light (or in the dark) [83] [84].
- Termination: Wash the gel with copious amounts of Milli-Q water to terminate the staining reaction. This step replaces the traditional sodium thiosulfate wash [83] [84].
- Development & Imaging: The stained protein bands will appear distinct against the background. Image the gel using a standard documentation system. Note that for protein gels, this protocol may require optimization of development time compared to histological sections.
The Scientist's Toolkit: Essential Research Reagents
Successful post-electrophoresis analysis requires a set of key reagents, each with a specific function in the staining workflow.
Table 2: Essential Reagents for Protein Gel Staining
| Reagent Solution | Function & Role in Staining |
|---|---|
| Coomassie Brilliant Blue Dye | The active staining agent that binds to proteins via ionic and hydrophobic interactions, enabling visualization [82]. |
| Methanol / Ethanol | Acts as a fixative to precipitate proteins within the gel matrix and helps control the staining rate [81] [82]. |
| Acetic Acid | Provides an acidic environment that enhances the binding of Coomassie dye to proteins and aids in destaining the background [81] [82]. |
| Silver Nitrate (AgNO₃) | The source of silver ions that bind to protein functional groups and are subsequently reduced to form the visible stain [83]. |
| Gelatin-Formic Acid Solution | In optimized silver staining, it creates a matrix that facilitates the controlled reduction of silver ions, improving staining consistency [83]. |
Workflow and Process Visualization
The following diagram illustrates the logical sequence and key decision points in a standard post-electrophoresis staining workflow, incorporating both Coomassie and Silver staining paths.
The choice between Coomassie blue and silver staining is a fundamental decision in post-electrophoresis analysis, dictated by the specific requirements of sensitivity, speed, and downstream application. Coomassie staining remains the workhorse for routine protein analysis due to its straightforward protocol, cost-effectiveness, and excellent compatibility with mass spectrometry. In contrast, silver staining provides a powerful alternative when detecting minute quantities of protein is paramount. Recent methodological optimizations continue to enhance the efficiency, reliability, and accessibility of both techniques. As a cornerstone of protein biochemistry, mastery of these staining methods empowers researchers in fields ranging from basic molecular biology to targeted drug development, ensuring accurate and insightful protein characterization.
Validation Through Western Blotting and Molecular Weight Marker Calibration
In molecular biology and drug development, the Sodium Dodecyl Sulfate-Polyacrylamide Gel Electrophoresis (SDS-PAGE) and Western blotting system serves as a fundamental platform for protein analysis. The accuracy of this system hinges upon two cornerstone practices: the proper use of molecular weight markers for calibration and rigorous antibody validation. These components form an integrated system where molecular weight markers provide the essential frame of reference for protein separation, while antibody validation ensures the specificity and reliability of protein detection. Within the context of a broader thesis on basic components of SDS-PAGE systems, this technical guide examines the critical interplay between calibration standards and validation methodologies, providing researchers with detailed protocols to achieve reproducible and quantitatively accurate results in protein characterization.
The principle of SDS-PAGE separation relies on the denaturation of proteins by SDS, which binds to the protein backbone and imparts a uniform negative charge, effectively separating proteins based primarily on their molecular mass [32] [87]. This separation occurs as proteins migrate through a polyacrylamide gel matrix, where smaller proteins move faster than larger ones [32]. The Western blotting technique then transfers these separated proteins to a membrane support for specific immunodetection [88]. The entire process constitutes a discontinuous buffer system that stacks proteins into sharp bands before their resolution in the separating gel, a process critically dependent on the ionic states of glycine in buffers of different pH [87]. Understanding these core principles is essential for appreciating why proper calibration and validation are non-negotiable for experimental integrity.
Molecular Weight Markers: Essential Tools for System Calibration
Types and Characteristics of Molecular Weight Markers
Molecular weight markers (also known as protein ladders or standards) are indispensable reference tools that run alongside protein samples in SDS-PAGE. They provide a calibrated scale for estimating the molecular weight of unknown proteins and for monitoring electrophoresis and transfer efficiency. These markers have evolved significantly from simple unstained proteins to sophisticated multi-colored and detectable systems [89].
Table 1: Types of Molecular Weight Markers and Their Applications
| Marker Type | Primary Applications | Molecular Weight Accuracy | Key Advantages | Limitations |
|---|---|---|---|---|
| Unstained [89] | Accurate molecular weight determination | Highest accuracy | Ideal for precise size analysis; compatible with all post-staining methods | Invisible before staining; requires visualization step |
| Pre-stained [89] [90] | Monitoring electrophoresis and transfer efficiency | Slightly altered due to dye conjugation | Visible during electrophoresis and transfer; real-time monitoring | Not recommended for precise molecular weight determination |
| Western Blot Imaging/Exposure Markers [89] | Alignment and exposure reference during imaging | Moderate; designed for imaging consistency | Direct visibility on blot image; avoids overexposure errors | Not suitable for molecular weight estimation or gel monitoring |
| Specialized Broad-Range Markers [90] | Western blot and SDS-PAGE across wide molecular weight ranges | Varies with calibration | Extensive coverage (e.g., 10-245 kDa); ready-to-use formulations | May require validation for specific buffer systems |
The selection of appropriate markers depends heavily on the experimental goals. For instance, unstained markers provide the highest accuracy for molecular weight determination but require post-staining with Coomassie or silver stain for visualization [89]. In contrast, pre-stained markers allow researchers to monitor protein migration during electrophoresis and confirm efficient transfer to membranes, though their apparent molecular weights may shift due to dye conjugation [89]. Modern pre-stained markers often feature color-coded bands, such as reference bands at 25 kDa (green) and 75 kDa (red), to facilitate orientation during the experimental process [90].
Technical Considerations for Marker Selection and Use
Several technical factors influence the performance of molecular weight markers in SDS-PAGE systems. The apparent molecular weight of pre-stained standards can vary when run in different SDS-PAGE buffer systems due to variations in pH affecting the charge of labeled protein standards and their SDS-binding capacity [90]. This underscores the importance of consistent buffer conditions and awareness that migration patterns may differ between Tris-Glycine, Bis-Tris MOPS, and Bis-Tris MES buffer systems [90].
Common issues encountered with protein markers include missing bands, smeared or blurry bands, and fading over time. These problems typically stem from improper gel percentage selection, buffer contamination, old gels, excessive voltage, or extended running times [89]. For instance, a 12.5% gel can clearly separate bands between 8-180 kDa, while on a 10% gel, the 8, 15, and 17 kDa bands may compress together at the dye front [89]. Pre-stained markers are generally not recommended for native (non-denaturing) PAGE as they are already denatured and partially reduced in SDS buffer, making their indicated molecular weights unreliable for native protein mobility [89].
Table 2: Troubleshooting Guide for Molecular Weight Marker Issues
| Problem | Potential Causes | Solutions |
|---|---|---|
| Missing bands [89] | Inappropriate gel percentage; old gels | Use correct gel percentage for target protein size; use fresh gels |
| Smeared or blurry bands [89] | Buffer contamination; excessive voltage; old electrophoresis buffers | Use ultrapure water; optimize voltage; replace old buffers |
| Bands fade over time [89] | Protease contamination; repeated freeze-thaw cycles | Aliquot markers; use clean pipette tips and tubes |
| Inaccurate size estimation [89] [90] | Different buffer systems; dye interference | Use consistent buffer conditions; validate with unstained markers |
For quantitative Western blotting, specialized fluorescent markers such as the Chameleon Duo (LI-COR) enable multiplexed detection and precise molecular weight estimation without interfering with target protein signals [91]. These markers are particularly valuable in assays requiring simultaneous detection of multiple proteins, such as the novel Western blot assay for alpha-dystroglycan (αDG) glycosylation status in skeletal muscle tissue, where both glycosylated and core αDG are detected in a multiplexed format [91].
Antibody Validation: Ensuring Specificity in Protein Detection
Methodologies for Antibody Validation
Antibody validation constitutes a critical step in Western blotting that confirms an antibody recognizes its target protein with minimal cross-reactivity. Without proper validation, researchers risk misinterpretation of results due to non-specific binding or false positives. The International Working Group for Antibody Validation recommends several strategies for confirming antibody specificity, with at least two methods suggested for comprehensive validation [92].
Genetic Strategies involve measuring signal in control cells or tissues where the target epitope has been knocked out or knocked down using CRISPR-Cas9 or RNA interference (RNAi) [92]. With little to no expression of the target protein, any observed signal indicates cross-reactivity. This approach provides compelling evidence of specificity when comparing wild-type and knockout cell lines side-by-side [92].
Orthogonal Strategies employ antibody-independent methods to quantify target signal across several samples, then compare these measurements with antibody-based approaches [92]. Targeted proteomics approaches can serve this purpose, with strong correlation between methods supporting antibody specificity.
Independent Antibody Strategies utilize two or more different antibodies against the same target protein to gauge specificity [92]. For this approach to be effective, antibodies should have different epitopes (bind to different regions of the protein) to reduce the likelihood of identical off-target binding. This method pairs well with knockout or knockdown approaches [92].
Expression of Tagged Proteins involves expressing a protein with an affinity tag (e.g., FLAG or v5) or fluorescent protein (such as GFP or YFP), then matching antibody expression with that of the tagging method [92]. A limitation of this approach is that overexpressing the target protein might artificially drown out off-target binding, potentially masking validation issues.
Implementation of Validation Controls in Western Blotting
Practical implementation of antibody validation requires incorporation of appropriate controls throughout the Western blotting process. Cell Signaling Technology (CST) exemplifies rigorous validation protocols that include examination of multiple cell lines and/or tissues with known expression levels, treatment of cell lines with growth factors or chemical activators/inhibitors that modulate target expression, and use of siRNA transfection or knockout cell lines to verify target specificity [93].
In the development of a novel Western blot assay for monitoring alpha-dystroglycan (αDG) glycosylation patterns, researchers implemented a comprehensive validation scheme including dot blot assays to test specificity and cross-reactivity of both primary and secondary antibodies [91]. This involved preparing TA lysate at three different concentrations (30, 15, and 5 µg of total protein) and testing various combinations of primary and secondary antibodies to detect nonspecific binding [91].
The assay incorporated a calibration curve using normal donor tibialis anterior (TA) muscle for determination of relative amounts of αDG, along with quality controls to monitor assay performance [91]. This approach demonstrated precision, linearity, specificity, sensitivity, and consistency in detecting alterations in αDG levels—key validation parameters for any quantitative Western blot assay [91].
Diagram 1: Comprehensive antibody validation workflow following International Working Group recommendations, incorporating multiple strategies and controls to ensure specificity.
Integrated Experimental Protocols
Native SDS-PAGE for Metalloprotein Analysis
The standard SDS-PAGE method deliberately denatures proteins, destroying functional properties including non-covalently bound metal ions [14]. To address this limitation, researchers have developed Native SDS-PAGE (NSDS-PAGE), a modified technique that maintains protein functionality while achieving high-resolution separation [14].
Protocol for NSDS-PAGE:
- Sample Preparation: Prepare sample buffer without SDS and EDTA (100 mM Tris HCl, 150 mM Tris base, 10% v/v glycerol, 0.0185% w/v Coomassie G-250, 0.00625% w/v Phenol Red, pH 8.5) [14]. Omit the heating step typically used in standard SDS-PAGE.
- Sample Loading: Mix 7.5 μL of protein sample with 2.5 μL of 4X NSDS sample buffer [14].
- Gel Preparation: Use precast NuPAGE Novex 12% Bis-Tris 1.0 mm mini-gels. Pre-run gels at 200V for 30 minutes in double distilled H2O to remove storage buffer and any unpolymerized acrylamide [14].
- Running Buffer: Prepare NSDS-PAGE running buffer (50 mM MOPS, 50 mM Tris Base, 0.0375% SDS, pH 7.7) with reduced SDS concentration compared to standard SDS-PAGE (0.1% SDS) [14].
- Electrophoresis: Run at constant voltage (200V) for approximately 45 minutes until the dye front reaches the end of the gel [14].
This method demonstrated remarkable retention of Zn²⁺ bound in proteomic samples, increasing from 26% in standard SDS-PAGE to 98% in NSDS-PAGE. Furthermore, seven of nine model enzymes, including four Zn²⁺ proteins, retained activity after NSDS-PAGE separation [14]. Metal retention was confirmed using laser ablation-inductively coupled plasma-mass spectrometry and in-gel Zn-protein staining with the fluorophore TSQ [14].
Western Blot Assay for Alpha-Dystroglycan Analysis
A novel Western blot assay for monitoring patterns and levels of alpha-dystroglycan (αDG) in skeletal muscle exemplifies the integration of proper calibration and validation practices [91].
Protocol for αDG Western Blot Assay:
- Sample Homogenization: Combine frozen TA biopsy cores in a 2-mL tube with lysis buffer (125 mM Tris, 10% glycerol, 10% β-mercaptoethanol, urea, SDS, and 1 mM AEBSF protease inhibitor). Process using a TissueLyser II with a stainless-steel bead [91].
- Protein Separation: Load denatured samples onto 4-20% Tris-Glycine polyacrylamide gels. Separate proteins via electrophoresis [91].
- Protein Transfer: Transfer proteins to nitrocellulose membrane using an iBlot2 transfer device [91].
- Multiplexed Detection: Block membrane with Intercept blocking buffer. Incubate with a mixture of primary antibodies: IIH6C4 (detects glycosylated αDG) and AF6868 (detects core αDG) [91].
- Fluorescent Detection: Use IRDye 680-linked Goat anti-Mouse IgM and Alexa Fluor 790-linked Mouse anti-Sheep IgG as secondary antibodies. Detect using appropriate imaging systems [91].
- Quantification: Incorporate a calibration curve using normal donor TA lysate prepared in incremental amounts of total protein. Include quality controls (high positive, low positive, and negative controls) to monitor assay performance [91].
This assay successfully distinguished between different clinical forms of limb girdle muscular dystrophy, demonstrating significantly reduced levels of functional αDG in patient biopsies relative to unaffected controls [91]. The validation data established the assay's precision, linearity, specificity, and sensitivity, supporting its utility in evaluating potential therapeutics [91].
The Researcher's Toolkit: Essential Materials for Western Blot Validation
Table 3: Essential Research Reagent Solutions for Western Blot Validation
| Reagent/Category | Specific Examples | Function and Application Notes |
|---|---|---|
| Molecular Weight Markers | Unstained Protein Ladder (10-200 kDa) [89]; Prestained Protein Ladder (10-245 kDa) [90]; Chameleon Duo Marker [91] | Provide molecular weight calibration; monitor electrophoresis and transfer; reference for imaging and exposure |
| Validated Primary Antibodies | IIH6C4 anti-αDG [91]; AF6868 anti-core DG [91]; CST Validated Antibodies [93]; NeoBiotechnologies Recombinant Monoclonal Antibodies [88] | Target-specific detection; rigorously validated for reduced cross-reactivity; lot-to-lot consistency |
| Specialized Secondary Antibodies | IRDye 680 Goat anti-Mouse IgM [91]; Alexa Fluor 790 Mouse anti-Sheep IgG [91]; HRP-conjugated Secondaries [92] | Enable detection of primary antibodies; fluorophore or enzyme conjugates for signal generation |
| Separation Matrices | Precast 4-20% Tris-Glycine Gels [91]; NuPAGE Novex 12% Bis-Tris Gels [14] | Matrix for protein separation by size; different percentages optimize resolution of various molecular weight ranges |
| Membrane Supports | Nitrocellulose Membranes [91]; PVDF Membranes [88] | Immobilize transferred proteins for antibody probing; compatible with various detection methods |
| Buffer Systems | NSDS-PAGE Running Buffer (0.0375% SDS) [14]; MOPS/Tris Systems [14]; Tris-Glycine SDS Running Buffer [87] | Maintain pH and conductivity during electrophoresis; impact protein separation and marker migration |
| Detection Reagents | Chemiluminescent Substrates [88]; Fluorescent Detection Systems [91] | Generate detectable signals from antibody-antigen interactions; varying sensitivity and dynamic range |
Diagram 2: Decision workflow for selecting appropriate molecular weight markers based on experimental requirements, highlighting different marker types and their primary applications.
The integration of properly calibrated molecular weight markers and rigorously validated antibodies forms the foundation of reliable Western blotting practices within the broader SDS-PAGE system. Molecular weight markers provide the essential spatial context for protein separation, while antibody validation ensures the specificity of detection—together creating a robust framework for protein analysis. The continuing evolution of both markers (from unstained to specialized fluorescent standards) and validation methodologies (from simple controls to genetic strategies) reflects the scientific community's commitment to methodological rigor. As research progresses toward increasingly quantitative applications, particularly in drug development and diagnostic assays, the principles outlined in this technical guide will remain essential for generating reproducible, reliable data. By implementing these comprehensive protocols for calibration and validation, researchers can advance both basic scientific knowledge and therapeutic development with greater confidence in their experimental results.
Polyacrylamide Gel Electrophoresis (PAGE) represents a cornerstone technique in biochemical research that enables scientists to separate protein mixtures based on their physicochemical properties. Within this methodology, two principal approaches have emerged: Sodium Dodecyl Sulfate-Polyacrylamide Gel Electrophoresis (SDS-PAGE) and Native PAGE. These techniques serve fundamentally different purposes in protein analysis, with the former denaturing proteins for molecular weight determination and the latter preserving native structure for functional studies. The strategic selection between these methods directly impacts the validity and applicability of experimental results, particularly in drug development where understanding protein function and interaction is paramount [12] [94].
The basic principle underlying both techniques involves the migration of charged proteins through a polyacrylamide gel matrix under the influence of an electric field. The gel acts as a molecular sieve, separating proteins based on different physical characteristics [95]. While they share this fundamental mechanism, SDS-PAGE and Native PAGE differ dramatically in their treatment of protein structure, the type of information they yield, and their applications in research workflows. This whitepaper provides an in-depth technical examination of both methods, focusing on their mechanistic principles, methodological considerations, and appropriate applications within pharmaceutical and basic research contexts.
Core Principles and Mechanisms
SDS-PAGE: Denaturing Analysis for Molecular Weight Determination
SDS-PAGE operates on the principle of complete protein denaturation to achieve separation based primarily on molecular mass. The technique employs sodium dodecyl sulfate (SDS), an anionic detergent that binds quantitatively to proteins in a constant ratio of approximately 1.4g SDS per 1g of protein [95]. This SDS binding performs two critical functions: first, it disrupts nearly all non-covalent interactions within the protein molecule, destroying secondary, tertiary, and quaternary structures and unfolding the polypeptide chain into a linear form; second, the negatively charged SDS molecules overwhelm any intrinsic charge the protein may possess, creating a uniform net negative charge along the entire polypeptide backbone [94] [96].
The combination of these effects—charge uniformity and structural linearization—ensures that proteins migrate through the polyacrylamide gel matrix based almost exclusively on their molecular weight rather than their native charge or conformation [97]. Smaller proteins experience less resistance from the gel matrix and migrate faster, while larger proteins migrate more slowly. This relationship enables researchers to estimate protein molecular weight by comparing migration distances against standardized protein markers with known molecular weights [20].
The process typically employs a discontinuous buffer system first developed by Laemmli, which incorporates both stacking and resolving gels with different pore sizes and pH levels to concentrate samples into sharp bands before separation [12] [95]. The stacking gel, with lower acrylamide concentration (typically 4-5%) and pH ~6.8, allows protein-SDS complexes to form concentrated narrow zones. When these zones reach the resolving gel (typically 8-15% acrylamide, pH ~8.8), the changed pH environment and smaller pore size then separate the proteins by size [95].
Native PAGE: Preserving Protein Structure and Function
In stark contrast to SDS-PAGE, Native PAGE (also known as non-denaturing or native gel electrophoresis) maintains proteins in their folded, biologically active state throughout the separation process. This technique deliberately omits denaturing agents like SDS and reducing agents like β-mercaptoethanol or dithiothreitol (DTT) from all buffers and gel matrices [98]. Consequently, proteins retain their native conformation, enzymatic activity, and interaction capabilities during and after electrophoresis [96].
Without SDS to impart a uniform charge, separation in Native PAGE depends on both the protein's intrinsic net charge and its hydrodynamic size (related to molecular weight and three-dimensional shape) [98] [20]. The net charge at the buffer pH determines migration direction and relative speed, while the hydrodynamic size affects mobility through the gel matrix. A small, tightly folded protein with high charge density might migrate faster than a larger, more loosely structured protein with lower charge density [96]. This multi-parameter separation can provide information about a protein's natural oligomeric state, conformational changes, and protein-protein interactions that would be destroyed under denaturing conditions [98].
The preservation of protein structure makes Native PAGE particularly valuable for studying functional attributes. Researchers can directly assess enzyme activity, ligand binding, protein complex formation, and other biological properties after electrophoretic separation [98] [94]. Specialized variants like Blue Native (BN)-PAGE have been developed specifically for analyzing multi-protein complexes, particularly membrane protein complexes, under native conditions [94].
Table 1: Fundamental Differences Between SDS-PAGE and Native PAGE
| Parameter | SDS-PAGE | Native PAGE |
|---|---|---|
| Protein State | Denatured and linearized | Folded and native |
| Charge Properties | Uniform negative charge from SDS | Intrinsic charge maintained |
| Separation Basis | Molecular weight primarily | Charge, size, and shape |
| Structural Preservation | Destroys quaternary, tertiary, and secondary structures | Maintains native structure and complexes |
| Biological Activity | Lost during processing | Typically retained |
| Reducing Agents | Often used (β-mercaptoethanol, DTT) | Always omitted |
| Molecular Weight Determination | Accurate estimation possible | Not directly possible |
| Typical Applications | Purity assessment, Western blotting, subunit analysis | Enzyme activity assays, protein interaction studies, complex analysis |
Comparative Workflow and Separation Mechanisms
The following diagram illustrates the fundamental differences in how SDS-PAGE and Native PAGE process and separate protein samples:
Methodology and Technical Considerations
SDS-PAGE Experimental Protocol
The standard SDS-PAGE protocol involves multiple critical steps that must be carefully controlled to ensure reproducible, high-quality results. Sample preparation begins with protein extraction using appropriate lysis buffers, followed by quantification using methods such as Bradford, BCA, or Lowry assays to ensure consistent loading [99]. The sample is then mixed with SDS-PAGE loading buffer (typically containing SDS, glycerol, bromophenol blue tracking dye, and Tris-HCl buffer at pH ~6.8) and heated at 95-100°C for 5-10 minutes to ensure complete denaturation [20]. For reducing conditions, 2-mercaptoethanol (2-ME) or dithiothreitol (DTT) at concentrations of 1-5% are included to break disulfide bonds [12].
Gel preparation involves casting two distinct layers: the resolving gel and the stacking gel. The resolving gel concentration varies with target protein size—8% for high molecular weight proteins (70-200 kDa), 12% for mid-range proteins (40-100 kDa), and 15% for small proteins (10-50 kDa) [20]. Gradient gels (e.g., 4-20%) can resolve a broader size range simultaneously. After polymerization of the resolving gel, the stacking gel (typically 4-5% acrylamide) is poured on top with a comb to create sample wells. The gel is then placed in an electrophoresis chamber filled with running buffer (typically Tris-glycine-SDS, pH ~8.3) [95].
Electrophoresis is performed at constant voltage, typically 80-150V, for 1-2 hours. Lower voltages provide better resolution for difficult separations, while higher voltages decrease run time. The process is stopped when the tracking dye front reaches the bottom of the gel. Proteins are then visualized using stains such as Coomassie Brilliant Blue, silver stain, or fluorescent dyes, or transferred to membranes for Western blot analysis [20] [100].
Native PAGE Experimental Protocol
Native PAGE requires significant modifications to the standard SDS-PAGE protocol to preserve protein structure and function. Sample preparation is gentler, typically involving non-denaturing lysis buffers without detergents or with mild non-ionic detergents. Critically, samples are not heated before loading, and the loading buffer lacks SDS and reducing agents [98]. To maintain protein stability, native loading buffers often include glycerol (10-20%) to facilitate gel loading and tracking dyes, but exclude denaturants.
Gel composition for Native PAGE similarly excludes SDS from both the gel matrix and electrophoresis buffers. The acrylamide concentration is selected based on the target protein size, similar to SDS-PAGE, but may be optimized empirically for specific separations [98]. The pH of the gel and running buffers is particularly critical in Native PAGE, as it determines the net charge of the proteins. For acidic proteins (pI < 7), standard Tris-glycine buffers at pH 8.8 are used, causing proteins to migrate toward the anode. For basic proteins (pI > 7), lower pH buffer systems may be necessary, sometimes requiring reversal of electrode polarity [98].
Electrophoresis conditions for Native PAGE typically use lower voltages (e.g., 100V) and are often performed at 4°C to prevent heat-induced denaturation during separation. The migration time may be longer than SDS-PAGE since proteins are folded and may have lower charge-to-mass ratios [98]. After electrophoresis, proteins can be detected using standard staining methods. For functional analysis, specific activity stains may be applied directly to the gel, or proteins can be carefully extracted from the gel for further analysis while preserving biological activity [98].
Table 2: Buffer and Reagent Composition for SDS-PAGE vs Native PAGE
| Component | SDS-PAGE | Native PAGE |
|---|---|---|
| Sample Buffer | SDS, reducing agents, glycerol, tracking dye, Tris buffer (pH 6.8) | Glycerol, tracking dye, mild buffer (no SDS or reducing agents) |
| Sample Treatment | Heating at 95-100°C for 5-10 minutes | No heating, maintained at 4°C |
| Gel Composition | Acrylamide-bisacrylamide, SDS, Tris-HCl (pH 8.8), ammonium persulfate, TEMED | Acrylamide-bisacrylamide, Tris-HCl (appropriate pH), ammonium persulfate, TEMED (no SDS) |
| Running Buffer | Tris-glycine with SDS (pH 8.3) | Tris-glycine without SDS (pH may vary) |
| Electrophoresis Conditions | Constant voltage (80-200V), room temperature | Constant voltage (50-150V), often at 4°C |
| Detection Methods | Coomassie, silver stain, Western blot, fluorescent stains | Coomassie, silver stain, activity stains, functional assays |
Research Reagent Solutions for Protein Electrophoresis
Table 3: Essential Reagents for Protein Electrophoresis Experiments
| Reagent/Category | Function/Purpose | Key Considerations |
|---|---|---|
| Acrylamide-Bisacrylamide | Forms the porous gel matrix for molecular sieving | Standard ratio is 29:1 or 37.5:1 acrylamide:bis; concentration determines pore size |
| SDS (Sodium Dodecyl Sulfate) | Denatures proteins and confers uniform negative charge | Critical for SDS-PAGE; omitted in Native PAGE; purity affects reproducibility |
| Tris Buffers | Maintains pH during electrophoresis | Different pH for stacking (∼6.8) and resolving (∼8.8) gels in SDS-PAGE; pH critical for Native PAGE charge determination |
| Reducing Agents (DTT, β-mercaptoethanol) | Breaks disulfide bonds for complete denaturation | Used in reducing SDS-PAGE; omitted in Native PAGE; fresh preparation required |
| Ammonium Persulfate (APS) & TEMED | Catalyzes acrylamide polymerization | TEMED concentration affects polymerization rate; degassing improves consistency |
| Glycine | Leading ion in discontinuous buffer systems | Concentration affects mobility and resolution; different formulations for specialized systems |
| Protein Stains (Coomassie, Silver, Fluorescent) | Visualizes separated proteins | Coomassie: general use, moderate sensitivity; Silver: high sensitivity; Fluorescent: quantitative western normalization [99] |
| Molecular Weight Markers | Calibrates gel for size determination | Prestained: track migration; Unstained: accurate size determination; Broad range recommended for unknown samples [20] |
Applications in Research and Drug Development
Appropriate Applications for SDS-PAGE
SDS-PAGE serves as an indispensable tool in molecular biology and biochemistry laboratories, particularly for analyses requiring molecular weight determination or protein denaturation. Its most prominent application is as a preliminary step for Western blotting, where proteins must be linearized and separated by size for effective immunodetection [20] [94]. The denaturation process exposes epitopes that might otherwise be buried in the native structure, enabling antibody binding to linear sequences. Additionally, the predictable relationship between migration distance and molecular weight allows researchers to verify the identity of target proteins based on expected size [94].
Protein purity assessment represents another critical application of SDS-PAGE. The high resolution of the technique enables detection of contaminating proteins in purified samples, with silver staining capable of detecting nanogram quantities of impurities [12]. In pharmaceutical development, this application is crucial for quality control of therapeutic proteins, where even minor contaminants can affect safety and efficacy.
SDS-PAGE also provides valuable information about protein subunit composition. Under reducing conditions, multimeric proteins dissociate into their constituent polypeptides, allowing determination of the number and size of subunits [12]. This application is particularly important for characterizing monoclonal antibodies (separating heavy and light chains) and other complex biologics [12]. The technique also finds extensive use in expression analysis, where researchers can quickly assess recombinant protein expression levels, monitor purification fractions, and evaluate protein stability under various storage conditions [97].
Appropriate Applications for Native PAGE
Native PAGE excels in applications requiring preservation of protein function and higher-order structure. Its premier application is in the analysis of protein complexes and oligomeric states. Unlike SDS-PAGE, which dissociates complexes into subunits, Native PAGE maintains the native quaternary structure, allowing researchers to study protein-protein interactions, stoichiometry, and assembly states [98] [96]. This capability is particularly valuable in structural biology and for characterizing multi-subunit therapeutics.
Enzyme activity analysis represents another strength of Native PAGE. After electrophoretic separation, enzymes frequently retain catalytic activity and can be detected directly in the gel using specific activity stains [98]. This application enables researchers to identify different isoforms of an enzyme (isozymes), correlate catalytic activity with specific protein bands, and study enzyme kinetics without extensive purification. For drug discovery, this approach can rapidly screen for compounds that affect enzyme activity or stability.
The preservation of native conformation makes Native PAGE ideal for studying ligand-binding interactions. Researchers can detect protein-ligand complexes based on altered migration compared to unbound protein, providing information about binding stoichiometry and affinity [96]. This application is valuable for characterizing protein-drug interactions, receptor-ligand relationships, and immune complex formation. Native PAGE also serves important roles in characterizing membrane protein complexes, particularly when combined with mild detergents that maintain complex integrity, and in monitoring conformational changes that alter hydrodynamic properties without changing molecular weight [94].
Method Selection Guide and Troubleshooting
Strategic Selection Framework
Choosing between SDS-PAGE and Native PAGE requires careful consideration of research objectives, sample characteristics, and downstream applications. The following decision diagram provides a systematic approach to method selection:
Troubleshooting Common Issues
Both SDS-PAGE and Native PAGE present unique technical challenges that can affect data quality and interpretation. In SDS-PAGE, common issues include smiling effects (curved bands) caused by uneven heating, which can be addressed by reducing voltage or incorporating cooling systems [20]. Smeared bands often result from incomplete denaturation—solved by ensuring fresh reducing agents and adequate heating—or from protein degradation, which can be minimized with protease inhibitors [20]. Unexpected bands may represent proteolytic fragments, protein modifications, or non-specific antibody binding in subsequent Western blots [20].
For Native PAGE, the primary challenge lies in maintaining protein stability throughout the process. Protein aggregation during electrophoresis can be minimized by optimizing buffer conditions, including pH and ionic strength, and by incorporating mild non-ionic detergents [98]. Poor resolution may result from inappropriate pH selection relative to protein isoelectric points or from insufficient pore size for the target protein's hydrodynamic radius. Activity loss after Native PAGE can be mitigated by maintaining low temperatures, including essential cofactors in buffers, and minimizing run times [98].
Artifact formation represents another significant consideration in Native PAGE. Unlike SDS-PAGE, where proteins are uniformly denatured, Native PAGE may preserve specific interactions that form during sample preparation or electrophoresis itself. Appropriate controls, including variation of sample loading conditions and comparison with known standards, help distinguish biologically relevant interactions from artifacts [98] [96].
SDS-PAGE and Native PAGE represent complementary approaches to protein separation that serve fundamentally different research objectives. SDS-PAGE, with its denaturing conditions, provides robust, reproducible separation based primarily on molecular weight, making it ideal for analytical applications requiring size determination, purity assessment, and Western blot analysis. Conversely, Native PAGE preserves protein structure and function, enabling researchers to study biological activity, protein complexes, and interactions in their native states. The strategic selection between these techniques should be guided by specific research questions, with SDS-PAGE answering structural questions and Native PAGE addressing functional ones. As protein therapeutics and targeted drug development continue to advance, the appropriate application of these foundational techniques remains essential for generating reliable, meaningful data in biochemical research.
Sodium dodecyl sulfate polyacrylamide gel electrophoresis (SDS-PAGE) represents one of the most fundamental analytical techniques in molecular biology, providing high-resolution separation of complex protein mixtures based primarily on molecular weight. The conventional method relies on extensive protein denaturation through the application of SDS, an anionic detergent that binds to protein backbones at a constant molar ratio, unfolding higher-order structures and imparting a uniform negative charge. This process effectively eliminates the influence of native protein charge and structure, enabling separation based predominantly on polypeptide chain length [32] [101] [2]. While this denaturing approach achieves exceptional resolution, it comes at a significant cost: the complete destruction of native functional properties, including enzymatic activity, protein-protein interactions, and the presence of non-covalently bound cofactors such as metal ions [14] [102].
To address these limitations, Blue Native (BN)-PAGE was developed as an alternative electrophoretic approach that preserves native protein properties. This technique maintains protein complexes in their oligomeric states and retains biological functionality, making it valuable for studying protein-protein interactions and native enzyme activity [14] [103]. However, this preservation comes with its own compromise—significantly reduced protein resolving power compared to SDS-PAGE [14] [102]. The fundamental challenge, therefore, has been to develop a method that bridges this methodological gap, offering both the high resolution of denaturing electrophoresis and the functional preservation of native techniques.
Native SDS-PAGE (NSDS-PAGE) emerges as a innovative solution to this longstanding technical challenge. This modified electrophoretic approach maintains the exceptional separation capabilities of traditional SDS-PAGE while remarkably preserving crucial native protein properties, including bound metal ions and enzymatic activity [14] [104] [102]. By strategically modifying buffer composition and eliminating specific denaturing steps, researchers can now achieve high-resolution proteomic separation without sacrificing the functional characteristics that provide critical insights into protein mechanism and regulation.
Principles and Rationale: How NSDS-PAGE Achieves Dual Objectives
Theoretical Foundation: Reconciling Resolution and Native Integrity
The theoretical foundation of NSDS-PAGE rests on a crucial observation: the complete denaturation of proteins in traditional SDS-PAGE results from the cumulative impact of multiple factors rather than SDS alone. The standard method employs a combination of SDS, EDTA, reducing agents, and heat treatment to achieve thorough protein unfolding [14] [105]. This comprehensive denaturation strategy, while excellent for molecular weight determination, systematically dismantles the very structural features that enable biological function.
NSDS-PAGE operates on the principle that controlled reduction of denaturing conditions can preserve functional aspects while maintaining separation efficiency. The method strategically identifies and modifies the most disruptive elements of conventional SDS-PAGE while retaining just enough SDS to facilitate electrophoretic mobility and separation. This balanced approach recognizes that many proteins can maintain aspects of their native conformation, particularly metal binding sites, under mild detergent conditions that would normally be insufficient for complete unfolding [14]. The success of this methodology demonstrates that electrophoretic resolution and native property preservation exist on a continuum rather than as binary opposites, opening new possibilities for functional proteomic analysis.
Comparative Methodological Framework: NSDS-PAGE vs. Traditional Approaches
Table 1: Comparative Buffer Compositions Across Electrophoresis Methods
| Component | SDS-PAGE | BN-PAGE | NSDS-PAGE |
|---|---|---|---|
| Sample Buffer | 106 mM Tris HCl, 141 mM Tris Base, 0.51 mM EDTA, 2% LDS, 10% Glycerol, pH 8.5 | 50 mM BisTris, 50 mM NaCl, 16 mM HCl, 10% Glycerol, 0.001% Ponceau S, pH 7.2 | 100 mM Tris HCl, 150 mM Tris Base, 0.01875% Coomassie G-250, 0.00625% Phenol Red, 10% Glycerol, pH 8.5 |
| Running Buffer | 50 mM MOPS, 50 mM Tris Base, 1 mM EDTA, 0.1% SDS, pH 7.7 | Cathode: 50 mM BisTris, 50 mM Tricine, 0.02% Coomassie G-250, pH 6.8Anode: 50 mM BisTris, 50 mM Tricine, pH 6.8 | 50 mM MOPS, 50 mM Tris Base, 0.0375% SDS, pH 7.7 |
| Key Additives | SDS, EDTA, reducing agents | Coomassie G-250 | Trace Coomassie G-250, reduced SDS |
| Sample Preparation | Heating at 70-100°C for 10 min | No heating | No heating |
| Primary Application | Molecular weight determination, purity assessment | Native protein complexes, protein-protein interactions | Functional analysis, metal-binding studies, enzymatic assays |
The distinct advantage of NSDS-PAGE becomes evident when examining its practical performance compared to traditional methods. In critical evaluations using proteomic samples from pig kidney (LLC-PK1) cells, NSDS-PAGE demonstrated remarkable retention of zinc ions, with retention increasing from 26% in standard SDS-PAGE to 98% under modified conditions [14] [102]. This near-complete preservation of metal-protein interactions represents a breakthrough for metalloproteomics research, where maintaining these labile associations has previously been exceptionally challenging.
Furthermore, functional assessments revealed that seven of nine model enzymes, including four zinc-binding proteins, retained activity after NSDS-PAGE separation [14]. This preservation stands in stark contrast to conventional SDS-PAGE, where all nine enzymes underwent complete denaturation and lost function. Impressively, this functional retention was achieved while maintaining high-resolution separation comparable to traditional SDS-PAGE, as evidenced by electrophoretograms showing minimal impact on band sharpness or separation patterns [14] [102]. The methodology thus successfully balances what had previously been considered competing objectives: exceptional resolution and functional preservation.
Core Methodology: Implementing NSDS-PAGE
Critical Reagent Modifications and Protocol Adjustments
The transition from traditional SDS-PAGE to NSDS-PAGE requires specific modifications to standard protocols, primarily focused on buffer composition and sample handling. These deliberate adjustments target the key denaturing elements while preserving the electrophoretic properties necessary for effective separation.
Sample Buffer Preparation: The NSDS-PAGE sample buffer eliminates denaturing components while maintaining elements that facilitate loading and tracking. The optimized formulation consists of 100 mM Tris HCl, 150 mM Tris Base, 10% glycerol, 0.01875% Coomassie G-250, and 0.00625% Phenol Red, adjusted to pH 8.5 [14]. Critically, this formulation excludes SDS entirely and omits EDTA, which can chelate metal cofactors essential for protein function. The inclusion of a minimal amount of Coomassie G-250 provides mild charge-shift properties that aid protein migration without causing significant denaturation.
Running Buffer Optimization: The running buffer represents another crucial modification point. While traditional SDS-PAGE employs 0.1% SDS in the running buffer, NSDS-PAGE reduces this concentration to 0.0375% while simultaneously eliminating EDTA [14]. This reduced SDS concentration appears sufficient to maintain protein solubility and electrophoretic mobility while being insufficient to cause complete unfolding of many metal-binding proteins. The buffer maintains the same MOPS/Tris base composition (50 mM each) at pH 7.7 to preserve the discontinuous buffer system essential for effective protein stacking and separation.
Sample Preparation Protocol: Sample handling undergoes significant modification in NSDS-PAGE. The denaturing heat treatment step (typically 70-100°C for 10 minutes) is completely eliminated [14]. Instead, samples are simply mixed with the NSDS sample buffer and loaded directly onto the gel without heating. This room-temperature processing prevents thermal denaturation of labile protein structures while still allowing sufficient interaction with the mild detergent conditions to facilitate electrophoretic mobility.
Diagram 1: NSDS-PAGE Experimental Workflow highlighting critical modifications from standard SDS-PAGE
Electrophoresis Conditions and Equipment Specifications
The execution of NSDS-PAGE utilizes standard electrophoresis equipment, making it accessible to most laboratories familiar with conventional SDS-PAGE methodologies. The procedure employs precast NuPAGE Novex 12% Bis-Tris 1.0 mm mini-gels, though other gel formats can be adapted with appropriate optimization [14]. Prior to sample loading, gels are preconditioned by running in double-distilled water for 30 minutes at 200V to remove storage buffer components and any unpolymerized acrylamide that might interfere with native protein separation.
Electrophoresis itself is conducted at constant voltage (200V) for approximately 45 minutes at room temperature, similar to standard protocols [14]. The tracking dye (Phenol Red) migration should be monitored, with termination occurring when the dye front reaches the bottom of the gel. Throughout the process, the same safety precautions applicable to conventional SDS-PAGE should be observed, despite the reduced denaturant concentrations.
Detection Methodologies for Native Proteins
Post-electrophoretic analysis in NSDS-PAGE requires specific detection strategies that capitalize on the preserved native properties while accommodating the modified buffer system.
Functional Detection: The retention of enzymatic activity in NSDS-PAGE enables in-gel functional assays that are impossible with traditional methods. These assays employ specific substrates that produce detectable products (colorimetric, fluorescent, or chemiluminescent) at the location of active enzymes [14] [103]. For metalloenzymes, this functional preservation provides direct correlation between metal content and catalytic activity.
Metal Detection: The exceptional retention of bound metal ions enables sophisticated metallomic analyses. Laser ablation-inductively coupled plasma-mass spectrometry (LA-ICP-MS) can directly map metal distribution across gel lanes, providing element-specific detection of metalloproteins [14] [104]. For zinc-specific detection, the fluorophore TSQ (6-methoxy-8-p-toluenesulfonamido-quinoline) provides a sensitive and selective staining method that can detect zinc-proteins without extracting the metal from its protein binding site [14] [102].
Protein Staining: Standard protein staining methods remain applicable but may require slight modification. Coomassie staining can be performed using standard protocols (0.05% Coomassie Brilliant Blue R-250 in 40% ethanol, 10% acetic acid) with destaining in 40% ethanol, 10% acetic acid [106]. Silver staining may also be employed but requires optimization to avoid potential interference with subsequent functional assays [107]. The sensitivity of Coomassie staining typically allows detection of bands containing 50 ng protein or more, while silver staining can detect 2-5 ng protein per band [106] [107].
Practical Applications and Research Utility
Metalloprotein Analysis and Metal Retention Studies
NSDS-PAGE has proven particularly valuable in metalloprotein research, where maintaining metal-protein interactions during separation has historically been challenging. The dramatically improved zinc retention (98% in NSDS-PAGE versus 26% in SDS-PAGE) enables researchers to directly correlate protein bands with metal content, providing insights into metalloprotein distribution in complex proteomic samples [14] [102]. This capability is transformative for metallomics, where understanding metal distribution across the proteome remains a fundamental challenge.
The method has been successfully applied to analyze zinc proteins in mammalian cell and tissue extracts, including kidney epithelial cells [14]. Using parallel detection approaches—combining protein staining with TSQ fluorescence for zinc-specific detection—researchers can identify which separated protein bands correspond to zinc metalloproteins. This dual detection approach provides unprecedented capability to survey metalloprotein composition without requiring prior purification or enrichment.
Functional Proteomics and Enzyme Activity Screening
Beyond metalloprotein studies, NSDS-PAGE enables functional screening of enzymatic activities across separated proteomes. The retention of activity in seven of nine tested model enzymes demonstrates the broad applicability for enzyme characterization [14]. This preservation allows researchers to directly link separation patterns with catalytic function, enabling identification of novel enzymes in complex mixtures without requiring elaborate purification schemes.
The compatibility with in-gel activity assays makes NSDS-PAGE particularly valuable for pharmaceutical screening applications, where researchers can simultaneously separate complex protein mixtures and assess inhibitory effects on enzymatic activities. This dual capability streamlines drug discovery workflows that would traditionally require separate separation and functional analysis steps.
Membrane Protein Complex Analysis
While BN-PAGE has been the traditional method for membrane protein complexes, NSDS-PAGE offers complementary capabilities for certain applications. The mild detergent conditions can preserve some native interactions while providing higher resolution than BN-PAGE [103]. For studies balancing the need for resolution with preservation of functional states, NSDS-PAGE represents an attractive intermediate approach worth empirical evaluation.
Table 2: Research Reagent Solutions for NSDS-PAGE Implementation
| Reagent Category | Specific Products/Formulations | Function in NSDS-PAGE |
|---|---|---|
| Specialized Buffers | NSDS Sample Buffer (100 mM Tris HCl, 150 mM Tris Base, 10% glycerol, 0.01875% Coomassie G-250, 0.00625% Phenol Red, pH 8.5) | Maintains proteins in native state while providing necessary ions for electrophoresis |
| Modified Running Buffers | NSDS Running Buffer (50 mM MOPS, 50 mM Tris Base, 0.0375% SDS, pH 7.7) | Facilitates electrophoretic separation with minimal denaturation |
| Detection Reagents | TSQ (6-methoxy-8-p-toluenesulfonamido-quinoline) | Fluorophore for specific zinc-protein detection in gels |
| Activity Assay Reagents | Enzyme-specific substrates (e.g., NAD+ for dehydrogenases, p-nitrophenyl phosphate for phosphatases) | Enable in-gel functional detection of enzymatic activities |
| Metal Analysis Tools | LA-ICP-MS standards and calibration materials | Quantitative metal detection and mapping in gel segments |
Technical Considerations and Methodological Limitations
Optimization Requirements and Empirical Validation
While NSDS-PAGE provides a robust framework for native protein separation, researchers should recognize that optimal conditions may require protein-specific optimization. The reduced SDS concentration (0.0375%) represents a starting point that has proven effective for multiple model proteins and proteomic samples, but some proteins may demonstrate improved separation or maintained activity at slightly different concentrations [14]. Empirical testing is recommended when applying the method to new protein systems.
Similarly, the complete elimination of reducing agents represents a standard modification, but researchers studying proteins stabilized by disulfide bonds might consider controlled evaluation of mild reducing conditions if migration issues arise. The key principle remains balancing sufficient conditions for electrophoretic mobility against minimal disruption of native structure.
Analytical Limitations and Complementary Methods
Despite its significant advantages, NSDS-PAGE does not replace traditional SDS-PAGE or BN-PAGE but rather complements them. For absolute molecular weight determination, traditional SDS-PAGE remains the gold standard due to its complete denaturation and consistent charge-to-mass ratio [32] [2]. Similarly, for analyzing intact protein complexes, BN-PAGE may provide superior preservation of oligomeric states [14] [103].
NSDS-PAGE may also show variable success with different protein classes. Extremely hydrophobic membrane proteins or proteins with exceptionally stable tertiary structures may not separate effectively under the mild conditions. In these cases, traditional methods or specialized native techniques like High Resolution Clear Native Electrophoresis may be more appropriate [103].
Native SDS-PAGE represents a significant methodological advancement that successfully balances the competing objectives of high-resolution separation and native property retention. By strategically modifying buffer composition and eliminating denaturing steps, researchers can now perform electrophoretic analyses that preserve metal binding capability and enzymatic function while maintaining exceptional protein resolution. This capability opens new possibilities for functional proteomics, metalloprotein research, and enzyme characterization that were previously constrained by methodological limitations.
As proteomic research increasingly focuses on functional attributes beyond mere separation patterns, NSDS-PAGE provides a critical toolset that bridges the gap between purely denaturing and fully native electrophoretic techniques. Its implementation requires minimal specialized equipment beyond standard PAGE systems, making it readily accessible to research laboratories seeking to expand their analytical capabilities for protein characterization.
Comparative Analysis with Blue-Native PAGE and Other Alternative Electrophoretic Methods
Sodium dodecyl sulfate-polyacrylamide gel electrophoresis (SDS-PAGE) has served as the foundational method for protein separation since its development in the 1970s, providing high-resolution separation of denatured proteins based primarily on molecular mass [108]. The technique's ubiquity in molecular biology laboratories stems from its ability to denature proteins with the anionic detergent SDS, imparting a uniform negative charge that enables separation through a porous polyacrylamide gel matrix [14]. However, this very denaturation process represents the method's most significant limitation: the complete destruction of native protein structures, functional properties, and protein-protein interactions [14] [109]. This fundamental constraint has driven the development of alternative electrophoretic methods that preserve native conformations while maintaining separation efficacy.
Within the context of basic SDS-PAGE components and their roles in research, this technical guide explores specialized electrophoretic techniques that address the limitations of denaturing methods. These innovations allow researchers to probe protein complexes in their functional states, retain non-covalently bound cofactors, and investigate interaction networks—capabilities essential for comprehensive understanding of protein function in basic research and drug development. The emergence of methods like Blue-Native PAGE (BN-PAGE) and capillary gel electrophoresis represents significant advancements in the electrophoretic toolbox, each offering unique advantages for specific research applications while building upon the fundamental principles established by SDS-PAGE.
Fundamental Principles of Key Electrophoretic Methods
SDS-PAGE: The Denaturing Workhorse
Traditional SDS-PAGE operates on the principle of complete protein denaturation and uniform charge conferment. The SDS detergent binds to proteins at a ratio of approximately 1.4 g SDS per 1 g of protein, masking the proteins' intrinsic charges and creating anionic complexes with charge proportional to molecular mass [110]. When subjected to an electric field within a polyacrylamide gel matrix, these complexes separate primarily based on size, with smaller proteins migrating faster through the porous network [14]. The method reliably provides high-resolution separation for analytical applications including purity assessment, expression analysis, and immunoblotting, but eliminates all higher-order structure and functional characteristics [14].
Blue-Native PAGE: Preserving Native Complexes
BN-PAGE employs fundamentally different principles to maintain protein complexes in their native, functional states. Instead of the denaturing SDS detergent, BN-PAGE utilizes mild non-ionic detergents like n-dodecyl-β-D-maltoside or digitonin for solubilization, which disrupt lipid-lipid interactions while preserving protein-protein interactions [111] [109]. Negative charge is imparted through the binding of Coomassie Blue G-250 dye, which associates with hydrophobic protein surfaces and provides the uniform negative charge required for electrophoretic separation [111] [112]. This approach maintains enzymatic activity, protein-protein interactions, and cofactor binding while enabling separation based on both molecular mass and dye binding capacity [112] [109].
Capillary Gel Electrophoresis: The Automated Alternative
Capillary gel electrophoresis (CGE), also known as capillary sieving electrophoresis or SDS-capillary gel electrophoresis, represents an automated, capillary-based format that utilizes the same SDS-based separation principles as traditional SDS-PAGE [113] [108]. Proteins migrate through capillaries filled with a sieving matrix under an applied electric field, with on-column detection providing real-time data output as electropherograms [113]. This format eliminates many manual steps associated with slab gel electrophoresis while offering superior resolution for smaller proteins and quantitative precision [108].
NSDS-PAGE: A Hybrid Approach
A modified approach termed native SDS-PAGE (NSDS-PAGE) has been developed to bridge the gap between denaturing and native methods. This technique reduces SDS concentration in running buffers from 0.1% to 0.0375%, eliminates EDTA from buffers, and omits the heating step typically used in sample preparation [14]. These modifications maintain high resolution separation while dramatically increasing the retention of bound metal ions (from 26% to 98% for Zn²⁺) and preserving enzymatic activity in most model enzymes tested [14].
Table 1: Fundamental Characteristics of Electrophoretic Methods
| Method | Solubilization Agent | Charge Confernment | Protein State | Primary Separation Basis |
|---|---|---|---|---|
| SDS-PAGE | SDS (ionic detergent) | SDS binding | Denatured | Molecular mass |
| BN-PAGE | Mild detergents (e.g., n-dodecyl-β-D-maltoside, digitonin) | Coomassie Blue G-250 binding | Native | Molecular mass & dye binding |
| CGE | SDS (ionic detergent) | SDS binding | Denatured | Molecular mass |
| NSDS-PAGE | Reduced SDS concentration | Reduced SDS binding | Partially native | Molecular mass |
Comparative Method Analysis: Resolution, Applications, and Limitations
Technical Performance Metrics
The choice between electrophoretic methods involves careful consideration of performance characteristics relative to research objectives. SDS-PAGE provides exceptional resolution for denatured proteins, with well-established protocols for molecular weight determination and compatibility with downstream applications like western blotting [14]. BN-PAGE offers slightly reduced resolution compared to SDS-PAGE but maintains the significant advantage of preserving native protein complexes and enzymatic activity [14] [114]. CGE demonstrates superior resolution for smaller proteins and provides quantitative data with minimal manual intervention, though it suffers from reproducibility issues and limited parallel sample comparison capabilities [113].
Throughput and time requirements vary substantially between methods. Traditional SDS-PAGE typically requires 45-90 minutes for separation plus additional time for staining and destaining [14] [112]. BN-PAGE extends this timeframe to approximately 2 hours for the first dimension separation [112]. In contrast, CGE dramatically reduces analysis time to 5.5-25 minutes per sample depending on the cartridge system used, with complete automation eliminating hands-on time for staining and imaging [108].
Table 2: Performance Comparison of Electrophoretic Methods
| Parameter | SDS-PAGE | BN-PAGE | CGE | NSDS-PAGE |
|---|---|---|---|---|
| Resolution | High | Moderate-high | High (especially for small proteins) | High |
| Run Time | 45-90 min | ~120 min (1st dimension) | 5.5-25 min/sample | Similar to SDS-PAGE |
| Sample Throughput | Moderate (multiple samples per gel) | Moderate (multiple samples per gel) | Serial analysis (high throughput possible) | Moderate (multiple samples per gel) |
| Protein State | Denatured | Native | Denatured | Partially native |
| Enzymatic Activity | Destroyed | Preserved | Destroyed | Mostly preserved |
| Metal Cofactor Retention | Minimal (26% for Zn²⁺) | High | Minimal | High (98% for Zn²⁺) |
| Reproducibility | Moderate (gel-to-gel variability) | Moderate (gel-to-gel variability) | High (automated) | Moderate (gel-to-gel variability) |
Application-Specific Method Selection
Different research questions demand specific electrophoretic approaches. SDS-PAGE remains the gold standard for routine protein separation, molecular weight estimation, and denatured protein analysis [14]. BN-PAGE excels in investigations of protein-protein interactions, analysis of multi-protein complexes (particularly mitochondrial oxidative phosphorylation complexes), identification of assembly intermediates, and detection of enzymatic activities directly in gels [111] [109] [114]. The method has proven particularly valuable in diagnosing oxidative phosphorylation defects in clinical samples, where preserved enzymatic activity enables direct functional assessment [114].
CGE offers significant advantages in biopharmaceutical development, where its quantitative capabilities, automation, and reduced reagent consumption support regulatory filings and quality control processes [108]. NSDS-PAGE provides an optimal balance for metalloprotein studies, where high resolution separation must be coupled with metal cofactor retention [14]. The technique has demonstrated success in separating Zn-proteome components while maintaining bound Zn²⁺ ions and enzymatic activity in most model zinc proteins tested [14].
Diagram 1: Method Selection Guide
Limitations and Constraints
Each method carries specific limitations that must be considered in experimental design. SDS-PAGE's fundamental constraint is the complete destruction of native structure and function [14]. BN-PAGE, while preserving native characteristics, offers reduced resolution compared to denaturing methods and requires careful optimization of detergent conditions for different sample types [14] [109]. The technique can be challenging for soluble protein complexes, which may dissociate under electrophoretic conditions or during Coomassie dye binding [109]. Additionally, residual Coomassie dye can interfere with downstream in-gel enzyme activity staining, though this limitation can be addressed through clear-native PAGE (CN-PAGE) modifications that replace Coomassie with mixtures of anionic and neutral detergents [111].
CGE suffers from serial sample analysis that prevents convenient lane-to-lane comparison, demonstrates limited compatibility with two-dimensional separation approaches, and faces reproducibility challenges despite technological advances [113]. NSDS-PAGE, while successful in preserving metal ions and enzymatic activity in many proteins, does not maintain function as consistently as BN-PAGE across all enzyme classes [14].
Detailed Experimental Protocols
BN-PAGE for Protein Complex Analysis
BN-PAGE provides a robust method for separating intact protein complexes while preserving enzymatic activity and subunit interactions. The following protocol adapts established methodologies [111] [112] [109] for analysis of mitochondrial complexes or other multi-protein assemblies.
Sample Preparation:
- Isolate mitochondria from cells or tissues and resuspend 0.4 mg of sedimented mitochondria in 40 μL buffer containing 0.75 M 6-aminocaproic acid and 50 mM Bis-Tris (pH 7.0) [112].
- Add 7.5 μL of 10% n-dodecyl-β-D-maltoside and mix thoroughly.
- Incubate on ice for 30 minutes for complete solubilization.
- Centrifuge at 72,000 × g for 30 minutes at 4°C to remove insoluble material.
- Collect supernatant and add 2.5 μL of 5% Coomassie Blue G-250 solution in 0.5 M aminocaproic acid.
- Include protease inhibitors (1 mM PMSF, 1 μg/mL leupeptin, 1 μg/mL pepstatin) to prevent degradation [112].
Gel Casting and Electrophoresis:
- Prepare a linear gradient native gel (e.g., 6-13% acrylamide) using a gradient former:
- 6% acrylamide solution: 7.6 mL 30% acrylamide, 9 mL ddH₂O, 19 mL 1 M aminocaproic acid (pH 7.0), 1.9 mL 1 M Bis-Tris (pH 7.0), 200 μL 10% APS, 20 μL TEMED.
- 13% acrylamide solution: 14 mL 30% acrylamide, 0.2 mL ddH₂O, 16 mL 1 M aminocaproic acid (pH 7.0), 1.6 mL 1 M Bis-Tris (pH 7.0), 200 μL 10% APS, 20 μL TEMED [112].
- Cast gels and overlay with 50% isopropanol to ensure even polymerization.
- After polymerization, remove isopropanol and add stacking gel (0.7 mL 30% acrylamide, 1.6 mL ddH₂O, 0.25 mL 1 M Bis-Tris (pH 7.0), 2.5 mL 1 M aminocaproic acid (pH 7.0), 40 μL 10% APS, 10 μL TEMED).
- Load 5-20 μL of prepared samples into wells.
- Run electrophoresis at 150 V for approximately 2 hours using anode buffer (50 mM Bis-Tris, pH 7.0) and cathode buffer (50 mM Tricine, 15 mM Bis-Tris, 0.02% Coomassie Blue G, pH 7.0) until the dye front approaches the gel bottom [112].
Downstream Applications:
- For western blotting: Transfer proteins to PVDF membrane using fully submerged system at 150 mA for 1.5 hours [112].
- For in-gel activity assays: Incubate gels in appropriate substrate solutions to detect enzymatic activity of specific complexes [111] [114].
- For two-dimensional analysis: Excise BN-PAGE lanes, soak in SDS denaturing buffer, and separate on SDS-PAGE gel turned 90° from first dimension [112].
NSDS-PAGE for Metalloprotein Studies
The NSDS-PAGE protocol modifies standard SDS-PAGE conditions to preserve metal binding and enzymatic activity while maintaining high resolution separation [14].
Sample and Buffer Preparation:
- Prepare 4X NSDS sample buffer: 100 mM Tris HCl, 150 mM Tris base, 10% (v/v) glycerol, 0.0185% (w/v) Coomassie G-250, 0.00625% (w/v) Phenol Red, pH 8.5 [14].
- Prepare NSDS running buffer: 50 mM MOPS, 50 mM Tris Base, 0.0375% SDS, pH 7.7 [14].
- Mix 7.5 μL protein sample with 2.5 μL 4X NSDS sample buffer—do not heat the mixture.
- Pre-run precast NuPAGE Novex 12% Bis-Tris mini-gels in ddH₂O at 200V for 30 minutes to remove storage buffers and unpolymerized acrylamide.
Electrophoresis and Detection:
- Load prepared samples alongside prestained protein standards.
- Perform electrophoresis at constant voltage (200V) for approximately 45 minutes using NSDS running buffer.
- For zinc detection: Use in-gel staining with fluorophore TSQ (6-methoxy-8-p-toluenesulfonamido-quinoline) or laser ablation-inductively coupled plasma-mass spectrometry for direct metal quantification [14].
- For enzymatic activity assays: Incubate gels in appropriate substrate solutions immediately after electrophoresis.
Diagram 2: BN-PAGE Experimental Workflow
Research Reagent Solutions
Table 3: Essential Reagents for Native Electrophoresis
| Reagent | Function | Application Notes |
|---|---|---|
| n-Dodecyl-β-D-maltoside | Mild non-ionic detergent for solubilizing membrane protein complexes | Preserves protein-protein interactions; optimal for individual complex separation [111] [112] |
| Digitonin | Mild non-ionic detergent | Preserves supercomplex assemblies; ideal for respiratory chain complexes [111] [109] |
| Coomassie Blue G-250 | Anionic dye for charge conferment | Binds hydrophobic protein surfaces; induces negative charge shift [111] [112] |
| 6-Aminocaproic Acid | Zwitterionic salt | Supports protein solubilization; zero net charge at pH 7.0 [111] [112] |
| Bis-Tris | Buffering agent | Compatible with native conditions; pH 7.0 for electrophoresis [112] |
| Protease Inhibitor Cocktail | Prevents protein degradation | Essential for preserving complex integrity during isolation [112] |
| Tricine | Buffering agent | Component of cathode buffer system [112] |
| SDS (reduced concentration) | Ionic detergent for partial denaturation | Used at 0.0375% in NSDS-PAGE for balance of resolution and native state preservation [14] |
Applications in Research and Drug Development
The alternative electrophoretic methods discussed herein enable sophisticated applications across basic research and biopharmaceutical development. BN-PAGE has become indispensable in mitochondrial research, allowing identification of oxidative phosphorylation (OXPHOS) complex deficiencies in patient samples through direct in-gel activity staining [114]. The method enables detection of assembly intermediates and pathological mechanisms in monogenetic OXPHOS disorders, providing critical diagnostic and research capabilities [111]. Furthermore, BN-PAGE supports investigations of respiratory chain supercomplexes (respirasomes), revealing structural organization that challenges the traditional "liquid state" model of mitochondrial electron transport [111] [109].
In drug development, CGE has emerged as a preferred method for characterization of biotherapeutics, including monoclonal antibodies, antibody-drug conjugates, fusion proteins, and viral vectors [108]. The technique's quantitative precision, automation, and regulatory acceptance support quality control and product release testing, with commercial systems offering both high-throughput and high-resolution configurations for different development stages [108]. The method's minimal reagent consumption and reduced waste generation align with sustainability initiatives within the biopharmaceutical industry [108].
NSDS-PAGE offers particular utility in metalloprotein research and metal-targeted drug development, where preservation of metal cofactors is essential for structure-function studies [14]. The method's ability to maintain zinc binding in proteomic samples while providing high-resolution separation enables investigations of metalloprotein networks and their modulation by therapeutic compounds.
The electrophoretic landscape has evolved significantly beyond traditional SDS-PAGE, with specialized methods now enabling targeted analysis of protein complexes in their functional states. BN-PAGE provides unparalleled capability for native complex separation, NSDS-PAGE offers an optimal balance for metalloprotein studies, and CGE delivers automation and quantification for biopharmaceutical applications. Understanding the comparative strengths, limitations, and appropriate applications of each method empowers researchers to select optimal strategies for specific scientific questions. As protein science continues to advance toward more integrative and functional analyses, these specialized electrophoretic techniques will play increasingly critical roles in basic research and therapeutic development.
Conclusion
SDS-PAGE remains an indispensable and robust technique in the modern researcher's toolkit, providing critical insights into protein molecular weight, purity, and composition. Its power lies in the synergistic function of its core components—the denaturing action of SDS, the sieving properties of the polyacrylamide gel, and the focusing effect of the discontinuous buffer system. Mastery of both foundational principles and advanced methodological nuances, including troubleshooting and optimization strategies, is paramount for generating reliable, publication-quality data. As biomedical research advances, the integration of SDS-PAGE with sophisticated downstream applications like Western blotting and mass spectrometry, alongside the development of modified techniques such as NSDS-PAGE for metalloprotein analysis, will continue to expand its utility. Its proven applications in drug development, from characterizing biotherapeutics to quality control, ensure that a deep understanding of the SDS-PAGE system will remain a fundamental requirement for scientists driving innovation in clinical and biomedical research.
References
- 1. SDS-PAGE [https://en.wikipedia.org/wiki/SDS-PAGE]
- 2. Overview of SDS-PAGE [https://www.creative-proteomics.com/resource/overview-of-sds-page.htm]
- 3. Mechanism of SDS-PAGE in Protein Separation [https://www.mtoz-biolabs.com/mechanism-of-sds-page-in-protein-separation.html]
- 4. Protein Electrophoresis Using SDS-PAGE: A Detailed ... [https://www.goldbio.com/blogs/articles/protein-electrophoresis-sds-page-overview?srsltid=AfmBOopdw4A6IWqRcdryHNM7y8TafN8VTh_k4q1I_I2weS7BBZ0rbuVu]
- 5. SDS-PAGE: The science behind all those bubbles [https://www.antibodiesinc.com/pages/sds-page-demystified?srsltid=AfmBOoq9SRBhOwgMNMCRHE_KOD09lQekJ36jHA2SQjGAI8PmkEcPnCo7]
- 6. How SDS-PAGE Works: 7 Key Points Every Scientist ... [https://bitesizebio.com/580/how-sds-page-works/]
- 7. SDS-PAGE: A Cornerstone of Protein Analysis in Modern ... [https://www.metwarebio.com/sds-page-protein-analysis/]
- 8. How Does SDS-PAGE Work? A Comprehensive Guide [https://www.metwarebio.com/how-sds-page-works-guide/]
- 9. SDS-PAGE: The science behind all those bubbles [https://www.antibodiesinc.com/pages/sds-page-demystified?srsltid=AfmBOopIKrkaRvmvJhqL8EmymCzMWuODkVT518QB54O1a-iSCXBwG6gq]
- 10. Polyacrylamide Gel - an overview [https://www.sciencedirect.com/topics/pharmacology-toxicology-and-pharmaceutical-science/polyacrylamide-gel]
- 11. Optimization of Electrophoresis Gel Concentration [https://www.aatbio.com/resources/application-notes/optimization-of-electrophoresis-gel-concentration]
- 12. Deciphering food proteins: The applications of SDS-PAGE ... [https://www.sciencedirect.com/science/article/abs/pii/S2212429225003025]
- 13. Preparing protein samples for sds-page [https://www.ruf.rice.edu/~bioslabs/studies/sds-page/denature.html]
- 14. Native SDS-PAGE: High Resolution Electrophoretic ... [https://pmc.ncbi.nlm.nih.gov/articles/PMC4517606/]
- 15. Discontinuous electrophoresis [https://en.wikipedia.org/wiki/Discontinuous_electrophoresis]
- 16. One-dimensional SDS gel electrophoresis of proteins [https://pubmed.ncbi.nlm.nih.gov/18228518/]
- 17. SDS-PAGE - Mullins Lab - [https://mullinslab.ucsf.edu/sds-page/]
- 18. SDS-PAGE: The science behind all those bubbles [https://www.antibodiesinc.com/pages/sds-page-demystified?srsltid=AfmBOoo3gg0VQC7p3PqPZds0f7gTog9KwTLj4htsnu2mVmV9qticDLLL]
- 19. Overview of Protein Electrophoresis [https://www.thermofisher.com/us/en/home/life-science/protein-biology/protein-biology-learning-center/protein-biology-resource-library/pierce-protein-methods/overview-electrophoresis.html]
- 20. Western blotting guide: Part 2, Protein separation by SDS- ... [https://www.jacksonimmuno.com/secondary-antibody-resource/technical-tips/western-blotting-guide-part-2/]
- 21. SDS-PAGE: The science behind all those bubbles [https://www.antibodiesinc.com/pages/sds-page-demystified?srsltid=AfmBOoqjqzaIWDINUMt-8XdXmCjfpLoFBRO2HTpTqIr6af9064_oJY2U]
- 22. SDS Page Gel Electrophoresis PAGE [https://williams.chemistry.gatech.edu/course_Information/4581/techniques/gel_elect/page_protein.html]
- 23. APS (Ammonium persulphate) is used in SDS-PAGE [https://www.letstalkacademy.com/aps-ammonium-persulphate-is-used-in-sds-page/]
- 24. TEMED - FAQs [https://www.thermofisher.com/store/v3/products/faqs/17919]
- 25. Tris Tricine SDS PAGE: What is it and how to PERFORM it? [https://info.gbiosciences.com/blog/tris-tricine-sds-page-what-is-it-and-how-to-perfrom-it]
- 26. Laemmli Buffer: The 5 Critical Components [https://bitesizebio.com/44540/laemmli-buffer-what-is-it-for-anyway/]
- 27. Laemmli buffer: Preparation (1x,2x & 4x) and principle [https://sharebiology.com/laemmli-buffer-preparation/]
- 28. Laemmli Sample Buffers: A Practical Guide [https://www.bostonbioproducts.com/overview-laemmli-sample-buffers/]
- 29. Laemmli Sample Buffer - 20 ml [https://www.cytographica.com/lab/solutions/5XSB.htm]
- 30. An Easy SDS-PAGE Gel Recipe & 10-Step Protocol [https://bitesizebio.com/59429/sds-page-gel-recipe/]
- 31. Regular Article A Method for Protein Assay in Laemmli Buffer [https://www.sciencedirect.com/science/article/pii/S0003269784712437]
- 32. The principle and method of polyacrylamide gel ... [https://www.mblbio.com/bio/g/support/method/sds-page.html]
- 33. Protein Electrophoresis Using SDS-PAGE: A Detailed ... [https://www.goldbio.com/blogs/articles/protein-electrophoresis-sds-page-overview?srsltid=AfmBOoocKFdwsxdEm2CD7T7Q_T6pNZD-Hecyn989OPuScy9dDtH-pqO_]
- 34. SDS-PAGE: The science behind all those bubbles [https://www.antibodiesinc.com/pages/sds-page-demystified?srsltid=AfmBOop6FKRQ0xOxBsBWZA8SJk_CYalxyO9n1qY_rI_hMiMpwrWD9d6R]
- 35. SDS-PAGE and Western Blotting [https://www.protocols.io/view/sds-page-and-western-blotting-gy6gbxzbx.html]
- 36. Western Blot Sample Preparation Protocol [https://www.thermofisher.com/br/en/home/life-science/protein-biology/protein-biology-learning-center/protein-gel-electrophoresis-information/western-blot-protocols/western-blot-sample-preparation.html]
- 37. How to Master SDS-PAGE Gel & Western Blot [https://www.neobiotechnologies.com/resources/sds-page-gel-western-blot/?srsltid=AfmBOoriFjy8PwPOrWM1EbUqU8scm4LC76-W-u5Z49gJxTemIOyjRjPg]
- 38. SDS-PAGE guide: Sample preparation to analysis [https://www.abcam.com/en-us/knowledge-center/western-blot/sds-page-guide]
- 39. Protein analysis SDS PAGE [https://www.qiagen.com/us/knowledge-and-support/knowledge-hub/bench-guide/protein/protein-analysis/protein-analysis-sds-page]
- 40. Protein Electrophoresis Buffers and Reagents [https://www.thermofisher.com/us/en/home/life-science/protein-biology/protein-gel-electrophoresis/protein-electrophoresis-buffers-reagents.html]
- 41. A Simple Sodium Dodecyl Sulfate-assisted Sample ... [https://pmc.ncbi.nlm.nih.gov/articles/PMC3310275/]
- 42. Electrophoresis in western blot [https://www.abcam.com/en-us/technical-resources/guides/western-blot-guide/electrophoresis]
- 43. How to choose an acrylamide gel concentration for western ... [https://hellobio.com/how-to-choose-an-acrylamide-gel-concentration-for-western-blot/]
- 44. A Guide to Gradient Gels: The Why's and How's [https://bitesizebio.com/47184/gradient-gels/]
- 45. Western Blot SDS-PAGE [https://www.novusbio.com/support/support-by-application/western-blot-sds-page?srsltid=AfmBOoorkmdj9jdEnnqYJmrsNVCQeFhqSwFt6LvrE8uf77a9Q9XgLpPS]
- 46. Tips for Optimal SDS-PAGE Separation [https://www.rockland.com/resources/tips-for-optimal-sds-page-separation/?srsltid=AfmBOooNuqjJOduex8viceSQd0TcqoFPxtkgmok2zdrziWGDzGAPHds0]
- 47. Enhancing therapeutic antibody profiling: orthogonal ... [https://www.frontiersin.org/journals/pharmacology/articles/10.3389/fphar.2025.1667210/full]
- 48. SDS-PAGE: The science behind all those bubbles [https://www.antibodiesinc.com/pages/sds-page-demystified?srsltid=AfmBOorfDOmIeDjQ12VLxRQlACx7SE9eFd5XB1Va1HQevsqY0b8YixeX]
- 49. SDS-PAGE in Food Science: Elevating Protein Insight and ... [https://www.eurofinsus.com/food-testing/resources/sds-page-in-food-science-elevating-protein-insight-and-product-integrity/]
- 50. SDS-PAGE: The science behind all those bubbles [https://www.antibodiesinc.com/pages/sds-page-demystified?srsltid=AfmBOoqW6FiQbKx7-9TSkSQr7YQfkqolxuqX9-zWBd7M8DxUczYv8zAL]
- 51. Protein Electrophoresis Using SDS-PAGE: A Detailed ... [https://www.goldbio.com/blogs/articles/protein-electrophoresis-sds-page-overview?srsltid=AfmBOorxGBi5hdrkHGSIfzhGZFRWGD2B5ikRUG8ls9ZOjnEV1EvU7UL-]
- 52. Polyacrylamide gel electrophoresis [https://en.wikipedia.org/wiki/Polyacrylamide_gel_electrophoresis]
- 53. Advances in Food Processing Techniques for Allergenicity ... [https://pmc.ncbi.nlm.nih.gov/articles/PMC12651889/]
- 54. How to Master SDS-PAGE and Western Blot in 5 Easy Steps [https://www.neobiotechnologies.com/resources/sds-page-western-blot/?srsltid=AfmBOopeSu_ozHpmYWDuswBkMoyTX68C9MaE7wTujt-500FYXswcFaq2]
- 55. SDS-PAGE: The science behind all those bubbles [https://www.antibodiesinc.com/pages/sds-page-demystified?srsltid=AfmBOopAJZrXiRKLqWDPKFQ994ET8n7NEaa3etDaWv4c3YaRMxi8xI-O]
- 56. Troubleshooting SDS-PAGE Gel Running Issues [https://www.goldbio.com/blogs/articles/troubleshooting-sds-page-gel-running-issues?srsltid=AfmBOopsjYHTBwAvpZE8xpOCk5NaCWwlZ5I5TzwJ_4olBdqmxJcrEuq4]
- 57. Troubleshooting Sodium Dodecyl Sulfate- Polyacrylamide ... [https://www.hycultbiotech.com/sds-page/troubleshooting/]
- 58. Tips for Optimal SDS-PAGE Separation [https://www.rockland.com/resources/tips-for-optimal-sds-page-separation/?srsltid=AfmBOopHSGYXpXIbsfT2ebXGEHrF3SWZjYx6h3IPpjSyyfN3oBtkcZvf]
- 59. Common artifacts and mistakes made in electrophoresis [https://pmc.ncbi.nlm.nih.gov/articles/PMC7295095/]
- 60. Major cause of antibody artifact bands on non-reducing ... [https://www.sciencedirect.com/science/article/abs/pii/S1046592819303389]
- 61. SDS-PAGE: The science behind all those bubbles [https://www.antibodiesinc.com/pages/sds-page-demystified?srsltid=AfmBOopA7Xzgpa1gd1jv8ommzxNGnYIUN_l_hyx0e4m8UjJvgBXWUtrT]
- 62. 6 Best Tips for Troubleshooting Poor Band Separation on ... [https://azurebiosystems.com/blog/6-tips-for-troubleshooting-poor-band-separation-on-sds-page-gels/]
- 63. Troubleshooting Gel Casting/ Polymerization Issues in ... [https://www.goldbio.com/blogs/articles/troubleshooting-gel-casting-polymerization-issues-in-sds-page?srsltid=AfmBOoorExQf7HIF3Ux2PJA1Hiej6Wo0Hn0g2V8DJ5i25JK1nD74bOxT]
- 64. Troubleshooting SDS-PAGE Gel Running Issues [https://www.goldbio.com/blogs/articles/troubleshooting-sds-page-gel-running-issues?srsltid=AfmBOopNkx8e4sp7JkWKlf8FDRKh_Yy7kW6kJI0eWC5xMo7pJeYxCnMn]
- 65. SDS-PAGE and Western Blot Protocol [https://www.bostonbioproducts.com/resources/western-blotting-protocol/]
- 66. Troubleshooting SDS-PAGE Gel Running Issues [https://www.goldbio.com/blogs/articles/troubleshooting-sds-page-gel-running-issues?srsltid=AfmBOooXhJ_8lFzgi0cSH_rgchjcIlCL1UOY27LPIbEodm82OZlbOkkx]
- 67. SDS-PAGE Troubleshooting: Why Are My Protein Bands ... [https://synapse.patsnap.com/article/sds-page-troubleshooting-why-are-my-protein-bands-fuzzy]
- 68. How current, voltage, and power settings affect SDS-PAGE [https://www.biossusa.com/blogs/news/how-current-voltage-and-power-settings-affect-sds-page?srsltid=AfmBOorMctZH-jacfxkYVk2V6TAFLAHf3b322pOnK2YGdVUS0Mjxnw5N]
- 69. The gradient-like separation and reduced running time with ... [https://www.sciencedirect.com/science/article/abs/pii/S0003269722002457]
- 70. Constant Current or Voltage in SDS-PAGE [https://bitesizebio.com/51744/constant-current-or-voltage-in-sds-page/]
- 71. Top tips for optimum SDS-PAGE results [https://stjohnslabs.com/blog/top-tips-for-optimum-sds-page-results?srsltid=AfmBOopoXzRUnmpMDXp8RBQ-qysq62KRoKqVQpFiFkAjyKmQqHEtNZMe]
- 72. How to Prepare Bis-Tris Gels and Why They Are so Great! [https://bitesizebio.com/82474/bis-tris-gels-2/]
- 73. SDS-PAGE: The science behind all those bubbles [https://www.antibodiesinc.com/pages/sds-page-demystified?srsltid=AfmBOop5R_6mV89MyrJW-bNiNB5z5CAsLlAqakqmLXn9DShsLEfs5u-l]
- 74. Gel Electrophoresis Sample Preparation [https://www.thermofisher.com/us/en/home/references/protein-analysis-guide/protein-separation/gel-electrophoresis-sample-preparation.html]
- 75. Precipitation of dilute chromatographic samples (ng ... - PubMed [https://pubmed.ncbi.nlm.nih.gov/10036140/]
- 76. Troubleshooting SDS-PAGE Sample Preparation Issues [https://www.goldbio.com/blogs/articles/troubleshooting-sds-page-sample-preparation-issues?srsltid=AfmBOooFIj1PRyjOLZJkvEdxdFsdx7RDZYw8KKiBUGv8kaY8qtI5x7-V]
- 77. All you need to know when choosing a Gradient Gel [https://stjohnslabs.com/blog/all-you-need-to-know-when-choosing-a-gradient-gel?srsltid=AfmBOopmfFdVXYdLWMSyQBQWTbjENABMbeT8IKFMpHArP_jv8SQ8olq_]
- 78. Two-dimensional gel electrophoresis: recent advances in ... [https://www.sciencedirect.com/science/article/abs/pii/S1367593101002757]
- 79. Gel electrophoresis-based proteoform separation and ... [https://pubmed.ncbi.nlm.nih.gov/40645673/]
- 80. SDS-PAGE: The science behind all those bubbles [https://www.antibodiesinc.com/pages/sds-page-demystified?srsltid=AfmBOoo0c7z-7lIZg0fLX3H_p2iHBRnVTks-jMwcSWXQaZFWj_1dkEXH]
- 81. Protocol for Coomassie Staining [https://www.aatbio.com/resources/application-notes/protocol-for-coomassie-staining]
- 82. Coomassie blue staining - Proteins and protein analysis [https://www.abcam.com/en-us/knowledge-center/proteins-and-protein-analysis/coomassie-blue-staining]
- 83. A Novel Optimized Silver Nitrate Staining Method for ... [https://pmc.ncbi.nlm.nih.gov/articles/PMC12021683/]
- 84. A novel optimized silver nitrate staining method for ... [https://www.frontiersin.org/journals/endocrinology/articles/10.3389/fendo.2025.1561576/full]
- 85. Coomassi Blue Staining [https://www.thermofisher.com/us/en/home/references/protocols/proteins-expression-isolation-and-analysis/staining-protein-gels/coomassie-staining.html]
- 86. Coomassie staining [https://bio-protocol.org/exchange/minidetail?id=16126107&type=30]
- 87. SDS-PAGE: The science behind all those bubbles [https://www.antibodiesinc.com/pages/sds-page-demystified?srsltid=AfmBOopzQBn5qVj-tTl7SeGbIaARAxyYmHdx0ezWLIRjpB7mVbNzd10j]
- 88. How to Master SDS-PAGE and Western Blot in 5 Easy Steps [https://www.neobiotechnologies.com/resources/sds-page-western-blot/?srsltid=AfmBOorF3joTdbEijqPM4osvIpfM1yBV7vyepBFUGtw0su6_faF1bTPK]
- 89. From Unstained to Tricolor: The Evolution of Protein Markers ... [https://www.yeasenbio.com/blogs/molecular-biology/from-unstained-to-tricolor-the-evolution-of-protein-markers-for-smarter-western-blotting]
- 90. Prestained Protein Ladder - 245 kDa) (ab116028) [https://www.abcam.com/en-us/products/standards/prestained-protein-ladder-broad-molecular-weight-10-245-kda-ab116028]
- 91. Validation of a novel western blot assay to monitor patterns ... [https://link.springer.com/article/10.1007/s10974-024-09670-y]
- 92. How and why you should validate your antibodies [https://azurebiosystems.com/blog/quantitative-western-blotting-how-and-why-you-should-validate-your-antibodies/]
- 93. Antibody Validation for Western Blotting [https://www.cellsignal.com/about-us/our-approach-process/antibody-validation-western-blotting?srsltid=AfmBOooheUGkPqn8t6hCmWF8P8173pP8LoW3uMU-Gla-MJvhltP61Dcs]
- 94. 同样是蛋白电泳,SDS-PAGE和PAGE到底有啥不一样?_变性 [https://www.sohu.com/a/920651313_120325361]
- 95. 蛋白质电泳基本原理介绍 [https://www.ebio-ace.com/jswz/2.html]
- 96. How Is Native PAGE Different from SDS-PAGE? [https://synapse.patsnap.com/article/how-is-native-page-different-from-sds-page]
- 97. 赛默飞SDS-PAGE 凝胶电泳:蛋白质分离的原理 [https://digi.china.com/articles/20250701/202507011693776.html]
- 98. 一文说透Native-PAGE|蛋白质|电泳|蛋白|凝胶 - CN-Healthcare [https://www.cn-healthcare.com/articlewm/20251023/content-1659527.html]
- 99. A critical path to producing high quality, reproducible data ... [https://www.nature.com/articles/s41598-022-22294-x]
- 100. Western blotting [https://www.sciencedirect.com/science/article/pii/S1046202306000065?via%3Dihub]
- 101. SDS-PAGE: The science behind all those bubbles [https://www.antibodiesinc.com/pages/sds-page-demystified?srsltid=AfmBOopnFH9kQgUcVTiA7PpfBc1tc2k-B5YmqJT9_-txbKQ6wDai3O-0]
- 102. Native SDS-PAGE: high resolution electrophoretic separation ... [https://pubmed.ncbi.nlm.nih.gov/24686569/]
- 103. High Resolution Clear Native Electrophoresis for In-gel ... [https://www.sciencedirect.com/science/article/pii/S153594762031690X]
- 104. high resolution electrophoretic separation of proteins with ... [https://www.semanticscholar.org/paper/Native-SDS-PAGE%3A-high-resolution-electrophoretic-of-Nowakowski-Wobig/31919f2dee6d0a1da25134cbeeeca6f05060110a]
- 105. How to Master SDS-PAGE and Western Blot in 5 Easy Steps [https://www.neobiotechnologies.com/resources/sds-page-western-blot/?srsltid=AfmBOooBlsLKr0imem0PLaXufjdAqydPmKTJ6D4wBAXwrdqsR5tw6YsF]
- 106. Visualization of proteins in SDS PAGE gels [https://www.qiagen.com/us/knowledge-and-support/knowledge-hub/bench-guide/protein/protein-analysis/visualization-of-proteins-in-sds-page-gels]
- 107. 2-D native-PAGE/SDS-PAGE visualization of an oligomer's ... [https://pubmed.ncbi.nlm.nih.gov/16703630/]
- 108. The Evolution of SDS-Based Protein Separation [https://www.bio-techne.com/resources/blogs/advantages-of-ce-sds]
- 109. Blue-native PAGE in plants: a tool in analysis of protein ... [https://plantmethods.biomedcentral.com/articles/10.1186/1746-4811-1-11]
- 110. SDS protein interactions [https://www.sciencedirect.com/science/article/abs/pii/S0301462225001462]
- 111. Validation of blue- and clear-native polyacrylamide gel ... [https://pmc.ncbi.nlm.nih.gov/articles/PMC12445495/]
- 112. Blue native electrophoresis protocol [https://www.abcam.com/en-us/technical-resources/protocols/blue-native-electrophoresis]
- 113. Capillary Gel Electrophoresis: An Alternative to SDS-PAGE? [https://bitesizebio.com/24080/capillary-gel-electrophoresis-an-alternative-to-sds-page/]
- 114. Blue Native Polyacrylamide Gel Electrophoresis [https://www.nature.com/articles/pr2001236]