CE-SDS vs. SDS-PAGE: A Modern Guide to Antibody Purity Analysis for Biopharmaceutical Development
This article provides a comprehensive comparison of Sodium Dodecyl Sulfate-Polyacrylamide Gel Electrophoresis (SDS-PAGE) and Capillary Electrophoresis-Sodium Dodecyl Sulfate (CE-SDS) for analyzing the purity of therapeutic monoclonal antibodies.
CE-SDS vs. SDS-PAGE: A Modern Guide to Antibody Purity Analysis for Biopharmaceutical Development
Abstract
This article provides a comprehensive comparison of Sodium Dodecyl Sulfate-Polyacrylamide Gel Electrophoresis (SDS-PAGE) and Capillary Electrophoresis-Sodium Dodecyl Sulfate (CE-SDS) for analyzing the purity of therapeutic monoclonal antibodies. Tailored for researchers, scientists, and drug development professionals, it explores the foundational principles of both techniques, details methodological workflows and applications in quality control and forced degradation studies, offers troubleshooting and optimization strategies for robust method development, and presents a rigorous validation and comparative assessment of data quality, reproducibility, and regulatory compliance. The synthesis of these core intents delivers a decisive resource for laboratories modernizing their analytical practices to meet the stringent demands of biopharmaceutical development and quality assurance.
Core Principles: Understanding SDS-PAGE and CE-SDS Separation Mechanisms
Core Scientific Principle of SDS Binding
In sodium dodecyl sulfate-polyacrylamide gel electrophoresis (SDS-PAGE), the fundamental mechanism enabling molecular weight-based separation relies on the detergent SDS fundamentally altering protein structure and charge. SDS is a strong anionic surfactant that binds to protein backbones through hydrophobic interactions, effectively unfolding higher-order structures into linear polypeptide chains [1] [2]. This denaturation process eliminates variations in protein shape and intrinsic charge that would otherwise influence electrophoretic mobility.
The binding occurs at an approximately constant ratio of 1.4 grams of SDS per 1 gram of protein [3] [4], which equates to roughly one SDS molecule per two amino acids [4]. This uniform coating confers a similar net negative charge to all proteins, creating a consistent charge-to-mass ratio across different polypeptide species [4] [2]. Consequently, when subjected to an electric field within the polyacrylamide gel matrix, protein migration depends primarily on molecular size rather than native charge or conformation [1] [4]. The polyacrylamide gel acts as a molecular sieve, with smaller proteins migrating more rapidly through the porous network while larger molecules experience greater resistance and move more slowly [4].
Table: Key Characteristics of SDS-Protein Binding
| Parameter | Specification | Effect on Separation |
|---|---|---|
| Binding Ratio | 1.4 g SDS : 1 g protein [3] | Uniform charge masking |
| Denaturation | Disruption of hydrogen bonds & non-covalent interactions [2] | Linearization of polypeptides |
| Charge Conferral | Negative charge proportional to polypeptide length [1] | Consistent charge-to-mass ratio |
| Critical Micelle Concentration | 7-10 mM (monomer to micelle transition) [4] | Only monomers bind proteins [4] |
SDS-PAGE vs. CE-SDS: Technical Comparison
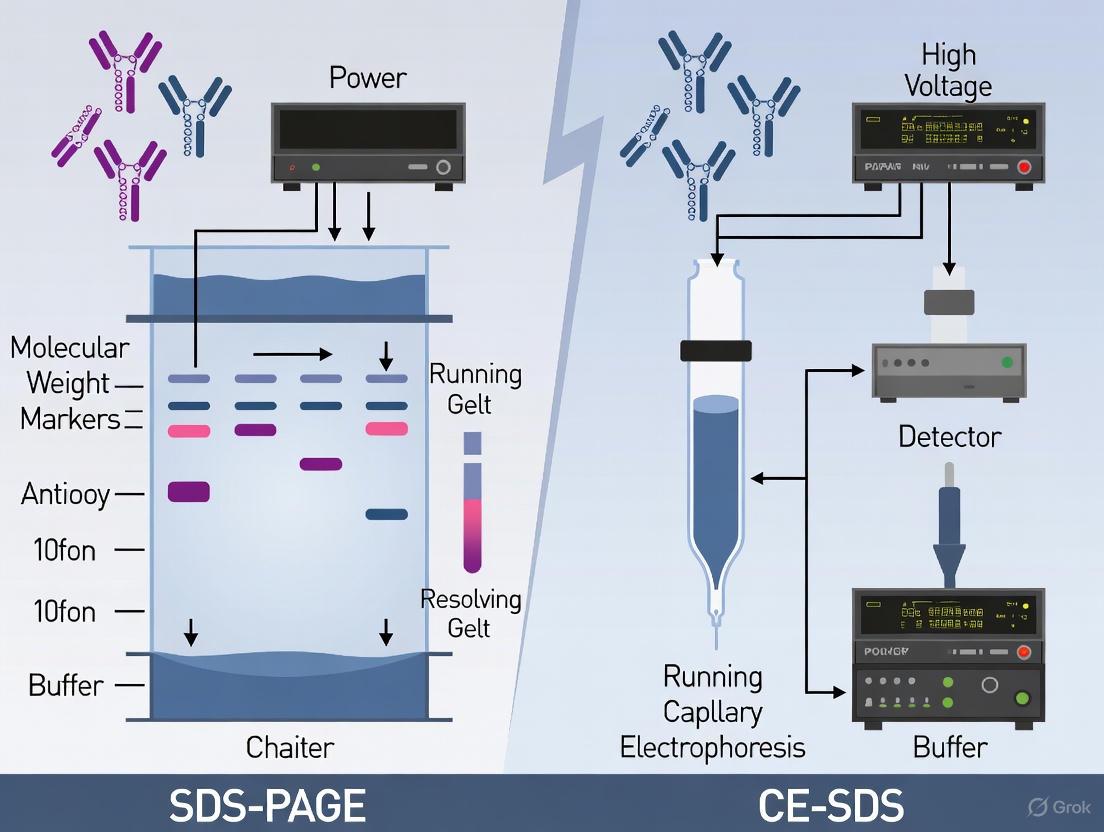
While both SDS-PAGE and capillary electrophoresis with SDS (CE-SDS) utilize SDS binding for size-based separation, they differ significantly in methodology, resolution, and application. SDS-PAGE employs a discontinuous gel system with stacking and resolving phases in a slab gel format, where proteins separate visually as bands after staining [4]. In contrast, CE-SDS performs electrophoresis in SDS-gel filled capillaries with automated UV detection, providing digital electropherograms for quantification [3].
For antibody purity analysis, CE-SDS demonstrates superior resolution and quantification capabilities. A direct comparison using IgG samples revealed that CE-SDS provided higher signal-to-noise ratios and could detect nonglycosylated IgG species that SDS-PAGE failed to resolve [3]. The automated nature of CE-SDS eliminates staining variability and enables precise quantification of antibody fragments, with excellent reproducibility (demonstrated by low %CV in consecutive analyses) [3]. Furthermore, CE-SDS separation resolution can be optimized by fine-tuning separation temperature, as temperature variations differentially affect the electromigration of SDS-protein complexes based on their activation energy requirements [5].
Table: Performance Comparison of SDS-PAGE and CE-SDS for Antibody Analysis
| Parameter | SDS-PAGE | CE-SDS |
|---|---|---|
| Separation Format | Discontinuous slab gel [4] | Capillary with replaceable gel buffer [3] |
| Detection Method | Post-electrophoresis staining (e.g., Coomassie) [4] | On-capillary UV detection (220 nm) [3] |
| Quantitation | Densitometry (band intensity) [3] | Direct UV absorbance [3] |
| Resolution | Limited; cannot detect nonglycosylated IgG [3] | High; resolves nonglycosylated IgG and fragments [3] |
| Signal-to-Noise Ratio | Lower, difficult autointegration [3] | Higher, enables precise quantitation [3] |
| Sample Throughput | Lower (multiple gels in parallel) | Higher (multicapillary systems available) [6] |
| Reproducibility | Moderate (staining variability) | Excellent (%CV demonstrated) [3] |
Experimental Protocols and Methodologies
Standard SDS-PAGE Protocol
The SDS-PAGE procedure involves sequential steps of gel preparation, sample preparation, electrophoresis, and detection [1] [4]:
Gel Production: Polyacrylamide gels are formed through free radical polymerization between glass plates. The standard discontinuous system consists of a stacking gel (pH ~6.8, 4-6% acrylamide) and a separating gel (pH ~8.8, 10-20% acrylamide) [4]. The polymerization is catalyzed by TEMED and ammonium persulfate [4]. Gradient gels with increasing acrylamide concentration (e.g., 4-12%) can be cast for broader separation ranges [4].
Sample Preparation: Protein samples are mixed with Laemmli buffer (containing Tris-HCl, SDS, glycerol, bromophenol blue, and reducing agents like β-mercaptoethanol or DTT) [4] [2]. Samples are then heated at 95°C for 5 minutes or 70°C for 10 minutes to ensure complete denaturation [1] [4]. Reducing agents cleave disulfide bonds to facilitate complete unfolding [4].
Electrophoresis: Prepared samples are loaded into wells alongside molecular weight markers. Electrophoresis is typically performed at constant voltage (100-200V) using Tris-glycine-SDS running buffer (pH ~8.3) until the dye front approaches the gel bottom [7] [4]. The discontinuous buffer system creates a stacking effect at the gel interface, concentrating proteins before entry into the separating gel [2].
Detection: Following electrophoresis, proteins are visualized through staining techniques such as Coomassie Brilliant Blue or more sensitive fluorescent stains [4].
CE-SDS Protocol for Antibody Analysis
The CE-SDS methodology for antibody purity analysis involves specific preparation and separation conditions [3] [6]:
Sample Preparation: Antibody samples (1 mg/mL) are mixed with SDS sample buffer and alkylating agents such as iodoacetamide to prevent disulfide bond reformation [6]. Samples are heated at 70°C for 3-5 minutes before injection [3] [6]. Both pH 9.0 and pH 6.8 sample buffers are used, with the lower pH reducing artifacts from thiol-disulfide exchange [6].
Instrumentation and Separation: Samples are injected into bare fused-silica capillaries filled with SDS-gel matrix using electrokinetic injection (5-10 kV for 20 seconds) [3] [5]. Separation occurs at 500 V/cm for approximately 35 minutes in reverse polarity mode (anode at detection side) [3]. Detection is performed via UV absorbance at 220 nm [3].
Temperature Optimization: Separation temperature can be adjusted between 20-50°C to optimize resolution, as different SDS-protein complexes have unique temperature-dependent mobility characteristics [5].
Signaling Pathways and Workflows
The following diagram illustrates the fundamental process of how SDS binding enables molecular weight-based separation in both SDS-PAGE and CE-SDS systems:
Research Reagent Solutions
The following table outlines essential reagents and materials required for implementing SDS-based separation techniques in antibody research:
Table: Essential Research Reagents for SDS-Based Separation Techniques
| Reagent/Material | Function | Application Notes |
|---|---|---|
| Sodium Dodecyl Sulfate (SDS) | Protein denaturation and charge conferral [4] | Critical micelle concentration: 7-10 mM; only monomers bind proteins [4] |
| Polyacrylamide Gel | Sieving matrix for size-based separation [1] | Concentration determines resolution range (typically 4-20%) [4] |
| Tris-Glycine Buffer | Discontinuous electrophoresis buffer system [2] | pH-dependent glycine charge state enables stacking effect [2] |
| β-Mercaptoethanol/DTT | Reduction of disulfide bonds [4] | Essential for complete unfolding of antibodies [4] |
| Iodoacetamide | Alkylating agent for cysteine residues [6] | Prevents reformation of disulfide bonds in CE-SDS [6] |
| Coomassie Blue Stain | Protein detection in SDS-PAGE [4] | Standard visualization method; limited sensitivity [4] |
| Molecular Weight Markers | Size calibration standards [4] | Essential for molecular weight estimation [4] |
| CE-SDS Gel Buffer | Replaceable sieving matrix for capillaries [5] | Borate cross-linked dextran optimized for ≤225 kDa [5] |
Sodium Dodecyl Sulfate-Polyacrylamide Gel Electrophoresis (SDS-PAGE) remains a foundational analytical technique in biochemistry and biopharmaceutical development for separating proteins based on their molecular weight. In the context of monoclonal antibody (mAb) therapeutic development, SDS-PAGE serves as a crucial tool for monitoring product purity, identifying impurities, and ensuring batch-to-batch consistency [8] [9]. The technique operates on the principle that proteins denatured by the anionic detergent SDS acquire a uniform negative charge, causing their migration through a polyacrylamide gel matrix under an electric field to depend solely on molecular size rather than inherent charge or shape [3] [10]. This reliable separation mechanism has established SDS-PAGE as a staple in laboratories worldwide, despite the emergence of alternative technologies like capillary electrophoresis (CE-SDS).
The manual gel-based workflow encompasses multiple stages: protein separation via electrophoresis, followed by protein visualization through staining and destaining processes. This comprehensive workflow, while time-consuming, provides researchers with a direct visual assessment of protein composition that has proven invaluable for characterizing mAb purity and detecting size variants such as fragments and aggregates [9]. As the biopharmaceutical industry faces increasing demands for purity and stricter regulatory requirements, understanding the precise execution, capabilities, and limitations of the SDS-PAGE workflow becomes essential for researchers and drug development professionals [9].
Principles and Core Methodology of SDS-PAGE
Fundamental Mechanisms
The resolving power of SDS-PAGE stems from two interconnected mechanisms: charge uniformity and molecular sieving. The process begins with sample preparation where proteins are denatured and linearized by heating in a buffer containing SDS and reducing agents like dithiothreitol (DTT) or β-mercaptoethanol [10]. SDS binds to the hydrophobic regions of proteins at an approximately constant ratio of 1.4g SDS per 1g of protein, conferring a uniform negative charge density that masks the protein's intrinsic charge [3] [10]. The reducing agents break disulfide bonds, ensuring complete unfolding of protein subunits and eliminating shape-related migration artifacts [10].
The separation occurs within a polyacrylamide gel matrix created through chemical copolymerization of acrylamide monomers and N,N'-methylenebisacrylamide (Bis) crosslinker, catalyzed by ammonium persulfate (APS) and tetramethylethylenediamine (TEMED) [10]. The resulting three-dimensional network acts as a molecular sieve, with pore sizes determined by the concentrations of acrylamide (%T) and bisacrylamide (%C). Under an applied electric field, smaller protein-SDS complexes navigate these pores more readily than larger complexes, resulting in size-dependent separation [10] [11]. The discontinuous buffer system employing stacking (pH 6.8) and separating (pH 8.8) gels further enhances resolution by initially concentrating proteins into narrow bands before they enter the separating gel where actual size-based separation occurs [10].
Workflow Visualization
The complete SDS-PAGE workflow encompasses both the electrophoretic separation and subsequent detection steps, as illustrated below:
Detailed Experimental Protocols
Protein Separation via Electrophoresis
The SDS-PAGE separation process begins with gel preparation, though many laboratories now use commercial precast gels to ensure consistency. The polyacrylamide gel consists of two distinct layers: a stacking gel with low acrylamide concentration (typically 4-5%) and large pores layered atop a separating gel with higher acrylamide concentration (usually 8-15%) that determines the separation range [10]. For most mAb applications, gels between 10-12% are ideal for resolving heavy chain (50-55 kDa) and light chain (25 kDa) fragments under reducing conditions [3].
Sample preparation requires careful denaturation: protein samples are diluted in buffer containing SDS (typically 1-2%) and, for reduced samples, a reducing agent such as DTT (50-100 mM) or β-mercaptoethanol (5%) [3] [10]. The mixture is heated at 70-95°C for 3-10 minutes to ensure complete denaturation [3]. For mAb analysis under non-reducing conditions, the reducing agent is omitted, allowing evaluation of intact antibodies and disulfide-linked complexes [3]. Prepared samples and molecular weight markers are loaded into wells, and electrophoresis is performed at constant voltage (typically 100-200 V) until the dye front approaches the gel bottom [10]. The entire separation process typically requires 45-90 minutes, depending on gel thickness and voltage applied.
Coomassie Staining and Destaining Protocol
Following electrophoresis, the gel must be processed to visualize separated proteins. Coomassie staining is the most widely used method due to its simplicity, reliability, and compatibility with downstream applications. The following table summarizes a standardized Coomassie staining and destaining protocol adapted from multiple research sources [12] [13] [14]:
| Step | Procedure | Duration | Key Solutions & Composition |
|---|---|---|---|
| 1. Fixation | Remove gel from plates; rinse with ddH2O; cover with fixative | 10-60 min | 50% ethanol, 10% acetic acid [13] |
| 2. Washing | Agitate gel in wash solution | 2 hr to overnight | 50% methanol, 10% acetic acid [13] |
| 3. Staining | Incubate gel in Coomassie stain with agitation | 10 min (microwave) to several hours | 0.1% Coomassie R-250, 10% acetic acid, 40% methanol [12] or 0.1% Coomassie, 20% methanol, 10% acetic acid [13] |
| 4. Destaining | Replace stain with destain solution; add Kimwipes or sponges to absorb excess dye; agitate | 10 min to overnight (with changes) | 10% acetic acid, 20-50% methanol [12] [13] |
| 5. Storage | Equilibrate gel in storage solution | Minimum 1 hr | 5% acetic acid [13] |
Critical procedural notes: The protocol can be significantly accelerated by microwave heating during staining and destaining steps (40-60 seconds until the solution boils) [12]. For Coomassie R-250 staining, the microwave method reduces staining time to 5-10 minutes and destaining to 20-30 minutes with one to two solution changes [12]. Both staining and destaining solutions can typically be recycled 2-3 times by filtering through coffee filters or similar materials to remove precipitated dye [12]. For optimal results, gels should be gently agitated throughout all steps using an orbital or plate shaker to ensure even treatment [13].
Alternative Protein Staining Methods
While Coomassie staining offers simplicity and cost-effectiveness, alternative staining methods provide different sensitivity levels for specific applications:
| Method | Sensitivity (per band) | Protocol Time | Key Advantages | Limitations |
|---|---|---|---|---|
| Coomassie Staining | 5-25 ng [14] | 10-135 min [14] | Simple, cost-effective, MS compatible [14] | Moderate sensitivity |
| Silver Staining | 0.25-0.5 ng [14] | 30-120 min [14] | Highest sensitivity of colorimetric methods [14] | Complex protocol, potential protein modification |
| Fluorescent Staining | 0.25-0.5 ng [14] | ~60 min [14] | Broad linear dynamic range, MS compatible [14] | Requires imaging instrumentation |
| Zinc Staining | 0.25-0.5 ng [14] | ~15 min [14] | Rapid, reversible, no protein modification [14] | Bands appear as clear areas on opaque background |
Essential Research Reagent Solutions
Successful execution of the SDS-PAGE workflow requires specific reagents and equipment, each performing critical functions in the separation and detection process:
- SDS (Sodium Dodecyl Sulfate): Anionic detergent that denatures proteins and confers uniform negative charge [10]
- Acrylamide/Bis-acrylamide: Monomer and crosslinker that form the porous gel matrix for molecular sieving [10]
- APS (Ammonium Persulfate) and TEMED: Polymerization initiators that catalyze gel formation [10]
- Reducing Agents (DTT or β-mercaptoethanol): Break disulfide bonds to ensure complete protein unfolding [10]
- Coomassie R-250 or G-250: Triphenylmethane dyes that bind basic and hydrophobic amino acid residues [13] [14]
- Molecular Weight Standards: Pre-stained or unstained protein ladders for size estimation [10]
- Methanol and Acetic Acid: Solvents that fix proteins in gels and regulate dye binding in Coomassie protocols [12] [13]
Comparative Analysis: SDS-PAGE vs. CE-SDS for mAb Purity
Performance Comparison in mAb Analysis
When applied to monoclonal antibody purity analysis, SDS-PAGE demonstrates distinct advantages and limitations compared to the increasingly adopted CE-SDS method. A direct comparison study evaluating both normal and heat-stressed IgG samples revealed significant differences in analytical capabilities [3]:
| Parameter | SDS-PAGE | CE-SDS |
|---|---|---|
| Resolution | Moderate | High [3] |
| Signal-to-Noise Ratio | Lower | Significantly higher [3] |
| Detection of Nonglycosylated IgG | Not resolved | Easily detected [3] |
| Quantitation Capability | Semi-quantitative | Fully quantitative [3] |
| Analysis Time | 2-4 hours (including staining) | 10-35 minutes [3] [15] |
| Sensitivity | ~5-25 ng (Coomassie) [14] | Comparable to Coomassie (UV detection) [15] |
| Automation Potential | Low | High [15] |
| Sample Throughput | Low to moderate | 8-fold higher in new systems [16] |
| Data Reproducibility | Gel-to-gel variability | High reproducibility [3] [15] |
Practical Implications for mAb Characterization
The technical differences between methods have direct practical implications for antibody therapeutic development. CE-SDS demonstrated superior resolution in separating fragments of heat-stressed IgG, revealing distinct peaks at 300, 130, 90, and 25 kDa that were poorly resolved by SDS-PAGE [3]. Most notably, CE-SDS successfully detected nonglycosylated IgG species that SDS-PAGE could not resolve—a critical advantage since glycosylation significantly affects antibody effector functions and must be monitored for biopharmaceutical quality control [3].
From a workflow perspective, SDS-PAGE requires manual processing including gel casting (unless using precast gels), staining, destaining, and imaging, typically spanning several hours [15]. In contrast, CE-SDS automates separation and detection without staining requirements, providing quantitative digital data in under 35 minutes [3] [15]. However, SDS-PAGE maintains advantages in accessibility and cost, requiring minimal instrumentation compared to the significant capital investment for CE-SDS systems [15]. SDS-PAGE also allows simultaneous analysis of multiple samples on a single gel, which can be advantageous for small-scale comparative studies.
The manual SDS-PAGE workflow, encompassing gel-based separation, staining, and destaining, remains a vital technique in biopharmaceutical research, particularly for laboratories requiring visual protein assessment and those with budget constraints. The well-established protocols for Coomassie staining provide a balance of sensitivity, cost-effectiveness, and compatibility with downstream protein analysis. However, for regulated biopharmaceutical environments requiring high precision, quantitative data, and detection of critical quality attributes like glycosylation variants, CE-SDS represents a superior analytical approach [3] [9].
As the biopharmaceutical industry advances toward increasingly automated and high-throughput operations, the role of traditional SDS-PAGE is evolving toward research applications where its visual nature provides intuitive value, while CE-SDS is becoming the technology of choice for cGMP environments and high-throughput screening [16]. Understanding both the capabilities of the established SDS-PAGE workflow and the advantages of emerging technologies enables researchers to select the most appropriate method based on their specific analytical needs, resource constraints, and regulatory requirements.
In the development of biopharmaceuticals, particularly monoclonal antibodies (MAbs), analytical techniques for assessing purity and integrity are critical for ensuring product quality. For decades, sodium dodecyl sulfate-polyacrylamide gel electrophoresis (SDS-PAGE) has been a foundational method for protein separation based on molecular weight. However, the limitations of this manual, labor-intensive technique have driven the adoption of more advanced automated approaches. Capillary Electrophoresis with Sodium Dodecyl Sulfate (CE-SDS) represents a technological evolution that maintains the fundamental separation principles of SDS-PAGE while introducing automation, quantitative capabilities, and significantly enhanced reproducibility. This guide objectively compares the performance of the CE-SDS workflow, specifically utilizing in-line UV detection, against traditional SDS-PAGE and other detection methods within the context of antibody purity analysis, providing researchers with experimental data to inform their analytical decisions.
Fundamental Principles: From SDS-PAGE to CE-SDS
Core Separation Mechanism
Both SDS-PAGE and CE-SDS rely on the fundamental principle of SDS-protein complex formation. When proteins are denatured with SDS, this detergent binds to the polypeptide backbone at a constant ratio of 1.4 g SDS per 1 g of protein, imparting a uniform negative charge density. This process negates the intrinsic charge of the proteins, ensuring that separation occurs primarily based on molecular size (hydrodynamic radius) as the SDS-protein complexes migrate through a sieving matrix under an electric field [3]. Despite this shared principle, the implementation and execution of the separation differ dramatically, leading to significant disparities in data quality and workflow efficiency.
Implementation Differences
The primary distinction lies in the separation platform. SDS-PAGE is performed manually in a polyacrylamide gel slab, requiring numerous hands-on steps including gel casting, sample loading, running, and post-separation staining/destaining [17]. In contrast, CE-SDS is an automated technique where separation occurs within a narrow fused-silica capillary filled with a replaceable polymer-based sieving matrix. Samples are injected electrokinetically, separated, and detected in-line via UV absorbance near the distal end of the capillary, eliminating manual intervention and variability after sample loading [3].
Experimental Comparison: A Side-by-Side Evaluation
Methodology for Direct Comparison
A direct comparative study evaluated the same human IgG antibody sample in both normal and heat-stressed (45°C for 14 days) states using both SDS-PAGE and CE-SDS methodologies [3].
SDS-PAGE Protocol: An Invitrogen NuPAGE Mini-Gel electrophoresis system with 4–12% Bis-Tris gel was used. Samples were diluted to 0.2 mg/mL with water and further diluted to 0.15 mg/mL with 4× LDS sample buffer. Gel preparation, sample loading, and analysis followed the manufacturer's procedure. Gels were stained with GelCode Blue stain and imaged using Alpha View integration software for band quantification [3].
CE-SDS Protocol (UV Detection): A Beckman Coulter PA 800 plus system with a bare, fused-silica capillary and in-line UV detection at 220 nm was employed. Antibody samples were diluted to 1.0 mg/mL with SDS sample buffer. Non-reduced samples were heated at 70°C for three minutes before electrokinetic injection at 5 kV for 20 seconds. Separation occurred in an electric field of 500 V/cm for 35 minutes. No staining or destaining was required. Data was processed using Beckman Coulter 32 Karat software for quantitation [3].
Key Performance Findings
The experimental results demonstrated marked differences in analytical performance:
- Resolution and Signal-to-Noise: CE-SDS results for both IgG and degraded IgG showed high-resolution separation, allowing for easy quantitation of degradation species attributable to a significantly higher signal-to-noise ratio compared to SDS-PAGE [3].
- Detection of Critical Species: CE-SDS readily detected nonglycosylated IgG, a species that was not resolved by SDS-PAGE. This is a critical advantage because glycosylation significantly impacts IgG function, and its quantification is essential for comprehensive characterization [3].
- Quantitation Capability: Auto-integration of impurity bands was challenging with SDS-PAGE using Alpha View software. In contrast, CE-SDS with UV detection provided clear electropherograms suitable for precise peak integration and quantitation [3].
Quantitative Data Comparison
The following tables summarize key performance metrics and characteristics derived from the experimental data and technical specifications within the search results.
Table 1: Direct Experimental Results from IgG Purity Analysis
| Performance Metric | SDS-PAGE | CE-SDS (UV Detection) |
|---|---|---|
| Detection of Nonglycosylated IgG | Not Resolved [3] | Easily Detected [3] |
| Signal-to-Noise Ratio | Low (difficult autointegration) [3] | High (easy quantitation) [3] |
| Data Reproducibility (RSD%) | Variable due to manual steps [17] | High (< 1% RSD for migration time; < 3% RSD for peak area) [18] |
| Analysis Time per Sample | Several hours (including staining) [17] | ~5.5 to 35 minutes (no staining) [3] [17] |
Table 2: General Workflow and Method Characteristics
| Characteristic | SDS-PAGE | CE-SDS (UV Detection) |
|---|---|---|
| Automation Level | Manual [17] | Highly Automated [17] |
| Separation Medium | Polyacrylamide Gel [17] | Polymer-based Sieving Matrix [17] |
| Sample Loading | Manual Pipetting [17] | Automated Electrokinetic Injection [3] |
| Detection Method | Post-stain Imaging (e.g., Coomassie) [17] | In-line UV Absorbance (220 nm) [3] |
| Data Output | Gel Image (Semi-Quantitative) [17] | Electropherogram (Fully Quantitative) [3] [17] |
| Regulatory Recognition | - | Included in USP General Chapter <129> [17] |
Advanced CE-SDS Workflows and Detection Modes
While UV absorbance is the most common detection method for CE-SDS, alternative technologies offer solutions for specific analytical challenges, particularly concerning sensitivity.
Laser-Induced Fluorescence (LIF) Detection
For applications requiring high sensitivity, such as analyzing viral vector proteins or low-abundance impurities, CE-SDS can be coupled with LIF detection. This requires labeling samples with a fluorescent dye like (3-(2-furoyl) quinoline-2-carboxaldehyde (FQ) [19]. The CE-SDS LIF method outperforms SDS-PAGE with Sypro Ruby staining in sensitivity, resolution, and throughput, and is suitable for characterizing complex products like enveloped viruses [19]. The main drawback is the additional time and potential for artifact introduction during the labeling process [20].
Native Fluorescence Detection (NFD)
A label-free alternative to LIF is Native Fluorescence Detection (NFD), which leverages the intrinsic fluorescence of tryptophan residues in proteins (excitation ~280 nm, emission ~350 nm). The BioPhase 8800 system with NFD demonstrates exceptional performance, with %RSD < 0.1% for relative migration time and < 0.4% for corrected peak area of the heavy chain. It provides a more stable, flattened baseline and easier peak integration compared to UV, thereby speeding up data processing while avoiding the labeling step required for LIF [20].
Table 3: Comparison of CE-SDS Detection Modalities
| Detection Mode | Typical Sensitivity | Key Advantage | Key Disadvantage |
|---|---|---|---|
| UV Absorbance | Standard (requires ~1 mg/mL) [20] | Label-free; simple sample prep [3] | Lower sensitivity; baseline noise [20] |
| Laser-Induced Fluorescence (LIF) | High (100x less sample than SDS-PAGE) [19] | Extreme sensitivity for low-abundance species [19] | Time-consuming dye labeling; potential artifacts [20] |
| Native Fluorescence (NFD) | Enhanced vs. UV [20] | Label-free with high sensitivity & flat baseline [20] | Limited to proteins with Trp/Tyr residues [20] |
Essential Research Reagent Solutions
A robust CE-SDS workflow relies on standardized kits and consumables to ensure reproducibility and reliability, particularly for quality control (QC) in biopharmaceutical development.
Table 4: Key Reagents and Materials for CE-SDS Analysis
| Item | Function | Example Product |
|---|---|---|
| CE-SDS Analysis Kit | Provides optimized sieving matrix, sample buffer, and internal standards for reproducible separation. | SCIEX CE-SDS Protein Analysis Kit (PN: C30085) [18] [20] |
| Capillary Cartridge | The platform for separation; bare fused-silica capillaries of defined length and diameter. | BioPhase BFS Capillary Cartridge (e.g., 8 x 30 cm) [18] [20] |
| Alkylating Agent | Used in non-reduced analysis to block free thiols and prevent disulfide scrambling. | Iodoacetamide (IAM) [18] [20] |
| Reducing Agent | Breaks disulfide bonds for reduced analysis to separate heavy and light chains. | β-Mercaptoethanol (β-ME) [18] [20] |
| Internal Standard | A low-molecular-weight protein (e.g., 10 kDa) used to normalize migration times. | Included in CE-SDS kits [18] [20] |
| Fluorescent Dye | For LIF detection, labels proteins for high-sensitivity analysis. | ATTO-TAG FQ Dye or Chromeo P503 [18] [19] |
The evidence from direct comparative studies and technical evaluations clearly positions CE-SDS with in-line UV detection as a superior analytical technology for antibody purity analysis compared to traditional SDS-PAGE. The key advantages of automation, quantitative data output, superior resolution and signal-to-noise, and the specific ability to detect critical quality attributes like nonglycosylated IgG make CE-SDS an indispensable tool for modern biopharmaceutical development [3] [17]. For applications where UV detection sensitivity is limiting, advanced label-free (NFD) or label-based (LIF) detection modes are available to extend the utility of the CE-SDS workflow. As the industry continues to demand higher quality standards and faster development timelines, the transition from SDS-PAGE to the automated, reproducible, and quantitative CE-SDS workflow is not just an optimization but a necessity for robust therapeutic protein characterization.
The analysis of protein purity, particularly for therapeutic antibodies, is a critical requirement in biopharmaceutical development. For decades, sodium dodecyl sulfate-polyacrylamide gel electrophoresis (SDS-PAGE) utilizing cross-linked polyacrylamide gels has been the standard laboratory technique for separating proteins by molecular weight. However, capillary electrophoresis formats using replaceable polymer sieving matrices are increasingly replacing traditional slab gel methods in analytical workflows. This transition is particularly evident in the characterization of monoclonal antibodies (mAbs), where the superior resolution, quantitative capabilities, and automation of capillary electrophoresis SDS (CE-SDS) methods provide significant advantages for quality control and regulatory compliance [21] [3]. The separation medium itself represents a fundamental technological difference between these approaches, with implications for resolution, reproducibility, throughput, and data quality in biopharmaceutical analysis.
This guide provides an objective comparison of these two separation media frameworks, contextualized within the broader methodology shift from SDS-PAGE to CE-SDS for antibody characterization. We examine their compositional differences, performance characteristics under standardized experimental conditions, and practical applications in biopharmaceutical development.
Fundamental Composition and Physical Properties
The structural and compositional differences between cross-linked polyacrylamide gels and replaceable polymer matrices define their operational characteristics and application suitability.
Cross-Linked Polyacrylamide Gels
- Chemical Structure: Formed through covalent cross-linking of acrylamide monomers with bisacrylamide, creating a permanent, porous gel matrix [22].
- Physical State: Rigid solid gel cast between glass plates that must be prepared fresh or stored under controlled conditions.
- Separation Mechanism: Proteins are separated by molecular sieving as they migrate through the stable pore network of the gel matrix under an electric field.
- Sample Capacity: Typically allows multiple samples (10-15) to be run simultaneously on the same gel, facilitating direct comparisons [22].
Replaceable Polymer Sieving Matrices
- Chemical Structure: Composed of linear polymer chains (e.g., linear polyacrylamide, dextran, or cellulose derivatives) in solution without permanent cross-links [23] [24].
- Physical State: Viscous liquid polymer solution that can be easily replaced between runs, enabling automation and capillary format implementation.
- Separation Mechanism: Functions as an entangled polymer network that separates biomolecules through transient pore structures [24].
- Application Flexibility: Matrix composition and polymer concentration can be optimized for specific separation ranges, such as the replaceable cross-linked polyacrylamide (rCPA) developed for high-performance separation of proteins across a wide molecular weight range (4-300 kDa) [23].
Performance Comparison in Antibody Analysis
Resolution and Separation Efficiency
Multiple studies have directly compared the separation performance of these media for antibody characterization. Replaceable polymer matrices in CE-SDS consistently demonstrate superior resolution for detecting antibody fragments and impurities compared to traditional SDS-PAGE.
A comparative study analyzing a heat-stressed IgG antibody found that CE-SDS could readily resolve and quantify degradation species including light chains, heavy chains, and nonglycosylated IgG with a high signal-to-noise ratio. In contrast, the same samples analyzed by SDS-PAGE showed lower resolution and difficulty in autointegration of impurity bands using imaging software [3]. This enhanced resolution is particularly valuable for detecting low-abundance impurities in therapeutic antibodies, where even minor degradation products must be identified and quantified.
The separation efficiency of replaceable polymers has been systematically optimized. For example, the replaceable cross-linked polyacrylamide (rCPA) matrix can be conveniently pressurized into separation capillaries (80 psi) and generates high resolutions across a wide protein separation range with comparable or increased separation speed compared to other sieving matrices [23].
Reproducibility and Quantitative Accuracy
The automation potential of replaceable polymer matrices significantly enhances analytical reproducibility. A key advantage of CE-SDS with replaceable polymers is its excellent precision across consecutive analyses, as demonstrated in reproducibility testing of degraded IgG samples [3]. This reproducibility is critical for quality control in biopharmaceutical manufacturing.
Traditional SDS-PAGE suffers from gel-to-gel variability due to differences in polymerization efficiency, buffer conditions, and running parameters. This variability complicates quantitative comparisons between experiments and across laboratories. In contrast, CE-SDS methods with replaceable polymers demonstrate minimal run-to-run variation when properly validated [21].
Method validation studies following ICH Q2(R2) guidelines have confirmed that CE-SDS methods with replaceable polymers show excellent precision parameters. One study reported RSD values below 2.5% for repeatability of main peak areas in both reduced and non-reduced conditions, with intermediate precision RSD values below 1.0% for intact IgG quantification [21].
Throughput and Automation Capability
The physical format of replaceable polymer matrices enables significant advantages in analytical throughput and automation.
Table 1: Throughput Comparison Between Separation Media
| Parameter | Cross-Linked Polyacrylamide Gel | Replaceable Polymer Matrix |
|---|---|---|
| Sample Preparation | Manual, batch processing | Automated or manual |
| Gel/Matrix Loading | Manual per gel | Automated capillary filling |
| Simultaneous Samples | 10-15 per gel | 1 per capillary (typically) |
| Run Time | 60-90 minutes | 30-50 minutes |
| Staining/Destaining | 2-4 hours additional | No staining required |
| Total Hands-on Time | High | Minimal after setup |
| Daily Throughput | 20-30 samples | Up to 96 samples with automation |
Instrumentation advances have further increased the throughput advantage of replaceable polymers. A bridging case study comparing CE-SDS instruments found that the Sciex BioPhase 8800 system provided an 8-fold higher throughput than classical CE-SDS instruments while maintaining comparable performance and precision [16]. This high throughput enables more comprehensive screening and design of experiment (DoE) studies to become mainstream applications in analytical development.
Detection and Data Analysis
The detection methods employed with these separation media differ significantly, impacting data quality and analytical capabilities.
Cross-Linked Gels: Typically require post-separation staining with Coomassie Blue, silver stain, or fluorescent dyes [22]. This adds time and introduces potential variability. Detection is based on densitometry of stained bands, which has limited linear range and sensitivity [3].
Replaceable Polymers: In CE-SDS, detection occurs in real-time via UV absorbance at 220 nm as separated components pass through a detection window [3]. This provides direct quantification without additional staining steps and offers a wider dynamic range for quantification.
A critical advantage of replaceable polymer systems is the digital output of electropherograms, which facilitates automated integration, more accurate quantification, and better data tracking for regulatory purposes. The software-based analysis in CE-SDS allows for precise peak identification and integration, compared to the band detection challenges often encountered with SDS-PAGE analysis [3].
Experimental Considerations and Methodologies
Standard SDS-PAGE Protocol with Cross-Linked Gels
The standard protocol for SDS-PAGE using cross-linked polyacrylamide gels involves multiple manual steps [22]:
Gel Casting:
- Prepare resolving gel solution (acrylamide/bis-acrylamide, Tris-HCl pH 8.8, SDS, APS, TEMED)
- Pour between glass plates, overlay with water to ensure even polymerization
- After polymerization (30 minutes), prepare and pour stacking gel (acrylamide/bis-acrylamide, Tris-HCl pH 6.8, SDS, APS, TEMED)
- Insert comb and allow to polymerize for at least 1 hour
Sample Preparation:
- Mix protein solution with loading buffer containing SDS and reducing agent (if needed)
- Denature at 95-100°C for 5-10 minutes [22]
- Centrifuge briefly to collect condensed sample
Electrophoresis:
- Load samples into wells alongside molecular weight markers
- Run at constant voltage (90V through stacking gel, 150V through resolving gel) until dye front reaches bottom
Detection:
- Stain with Coomassie Blue for 30-45 minutes
- Destain for 4-20 hours until background is clear [22]
- Image using gel documentation system
CE-SDS Protocol with Replaceable Polymers
The CE-SDS method using replaceable polymer sieving matrices follows a more streamlined process [21] [3]:
Sample Preparation:
- Dilute antibody samples to 1-2 mg/mL with SDS sample buffer
- For non-reduced analysis, include alkylating agent (iodoacetamide) to prevent disulfide rearrangement
- Denature at 70-95°C for 3-10 minutes [3]
Capillary Setup:
- Install bare-fused silica capillary in instrument
- Prime capillary with separation matrix (replaceable polymer solution)
Separation:
- Inject sample electrokinetically (5-10 kV for 10-30 seconds)
- Separate with electric field of 400-600 V/cm for 25-40 minutes
- Detect proteins by UV absorbance at 220 nm
Data Analysis:
- Automated peak identification and integration using instrument software
- Compare migration times to IgG standard for peak assignment
Special Considerations for Antibody Analysis
Antibodies present particular challenges in electrophoretic analysis due to their complex structure. Studies have shown that non-reducing SDS-PAGE of IgG antibodies can yield anomalous banding patterns and overestimated molecular weights due to differential unfolding of Fab, CH2, and CH3 domains in SDS [25]. These artifacts are dependent on sample preparation conditions, including heating temperature and duration.
The inclusion of short-chain alcohols (e.g., propanol, butanol) in sample buffer has been found to modulate these anomalous migrations in traditional SDS-PAGE [25]. Such artifacts are less prevalent in CE-SDS with replaceable polymers, likely due to more consistent denaturation and separation conditions.
Tabular Comparison of Key Characteristics
Table 2: Comprehensive Performance Comparison for Antibody Purity Analysis
| Characteristic | Cross-Linked Polyacrylamide Gel | Replaceable Polymer Matrix |
|---|---|---|
| Separation Mechanism | Molecular sieving through fixed pores | Molecular sieving through entangled polymer network |
| Resolution | Moderate | High [3] |
| Reproducibility (RSD) | 5-15% gel-to-gel variability | <2.5% run-to-run [21] |
| Quantitation | Semi-quantitative (densitometry) | Fully quantitative (UV absorbance) [3] |
| Detection Limit | ~5-10 ng (Coomassie) | ~0.1-1 μg (UV 220 nm) |
| Linear Dynamic Range | ~10-fold | ~100-fold |
| Ability to Detect Nonglycosylated IgG | Limited resolution | Excellent resolution [3] |
| Automation Potential | Low | High |
| Sample Throughput | Moderate (10-15 samples/gel) | High (up to 96 samples automated) [16] |
| Hands-on Time | High | Low after method setup |
| Regulatory Acceptance | Well-established | Increasingly preferred [21] |
Orthogonal Analytical Techniques and Advanced Applications
Integration with Mass Spectrometry
A significant advantage of replaceable polymer systems is their compatibility with advanced detection methods. While SDS interferes with mass spectrometric analysis, recent developments in capillary zone electrophoresis-mass spectrometry (CZE-MS) enable direct identification of antibody impurities separated by size-based methods [26].
This approach combines the high-resolution separation of CE with the identification power of MS, creating a spectral library for unambiguous assignment of impurity peaks detected in routine CE-SDS analysis [26]. Such integration is challenging with traditional polyacrylamide gels due to the difficulty of extracting proteins for subsequent analysis and the interference of gel-related contaminants.
Forced Degradation Studies
Both separation media are employed in forced degradation studies to assess antibody stability, but replaceable polymers in CE-SDS provide more reliable quantification of degradation products. Studies monitoring thermal stress on antibodies at 37°C and 50°C have demonstrated the ability of CE-SDS to precisely track the time-dependent increase in low-molecular-weight fragments and decrease in intact antibody [21].
The quantitative nature of CE-SDS with replaceable polymers allows for more accurate kinetics studies of degradation pathways, providing valuable data for formulation development and shelf-life determination of biotherapeutic products.
Visualizing the Separation Workflows
The following workflow diagrams illustrate the key procedural differences between the two separation techniques and their performance relationship:
Workflow and Performance Comparison Between Separation Methods
Essential Research Reagents and Materials
Table 3: Key Reagent Solutions for Separation Media
| Reagent/Material | Function/Purpose | Cross-Linked Gel | Replaceable Polymer |
|---|---|---|---|
| Acrylamide/Bis-acrylamide | Forms gel matrix | Required | Not typically used |
| Linear Polymers | Sieving matrix | Not used | Required (various types) |
| SDS (Sodium Dodecyl Sulfate) | Protein denaturation & charge masking | Required | Required |
| Tris-based Buffers | Maintain pH during separation | Required | Required |
| APS & TEMED | Gel polymerization catalysts | Required | Not needed |
| Reducing Agents (DTT/BME) | Disulfide bond reduction | Optional | Optional |
| Alkylating Agents (IAM) | Prevent disulfide rearrangement | Sometimes used | Standard in non-reduced CE-SDS [21] |
| Coomassie/Silver Stain | Protein detection | Required | Not needed |
| UV-transparent Plates/Components | Detection path | Not applicable | Required |
The comparison between cross-linked polyacrylamide gels and replaceable polymer sieving matrices reveals a clear technological evolution in protein separation methodology. While cross-linked gels remain valuable for educational purposes and initial screening due to their low equipment costs and visualization simplicity, replaceable polymer matrices in CE-SDS formats offer superior resolution, excellent reproducibility, full quantitation, and significantly higher throughput for antibody characterization in biopharmaceutical development.
The transition toward replaceable polymer systems reflects the increasing demands for robust, quantitative analytical methods in biopharmaceutical quality control. As therapeutic antibodies continue to dominate the biologics landscape, CE-SDS with optimized replaceable polymer matrices is positioned as the preferred technology for purity analysis in regulated environments, particularly when combined with orthogonal techniques like mass spectrometry for comprehensive characterization.
The Role of Electrophoresis in Monitoring Critical Quality Attributes (CQAs) of mAbs
Monoclonal antibodies (mAbs) have revolutionized the treatment of cancer, autoimmune disorders, and infectious diseases, but their complex structure presents unique challenges for biopharmaceutical development [27]. These large biomolecules (~150 kDa) consist of two light chains (LC) and two heavy chains (HC) linked by disulfide bonds, with additional complexity introduced by glycan moieties attached to the HC [28]. During manufacturing and storage, mAbs are susceptible to various degradation pathways, including fragmentation, aggregation, and chemical modifications such as deamidation and oxidation [29] [27]. These alterations represent Critical Quality Attributes (CQAs)—properties that must remain within appropriate limits to ensure product safety and efficacy [27].
Electrophoretic techniques serve as fundamental tools for monitoring these CQAs, providing critical data about mAb purity, integrity, and stability [3] [30]. This guide objectively compares two principal electrophoretic methods—traditional SDS-PAGE and modern capillary electrophoresis CE-SDS—examining their performance characteristics, experimental requirements, and applications in biopharmaceutical development and quality control.
Electrophoresis Fundamentals: Separation Principles and Applications
Core Technological Principles
Both SDS-PAGE and CE-SDS separate proteins based on their molecular weight under denaturing conditions, but employ different separation mechanisms and detection systems:
SDS-PAGE (Sodium Dodecyl Sulfate Polyacrylamide Gel Electrophoresis): Proteins are denatured with SDS, which binds proportionally (1:1.4 ratio) to create negatively charged complexes [3]. These complexes migrate through a cross-linked polyacrylamide gel matrix when an electric field is applied, with separation occurring as smaller proteins move faster through the pores [3]. Detection typically requires post-separation staining with dyes like Coomassie Blue or GelCode Blue, followed by destaining and densitometry analysis [3].
CE-SDS (Capillary Electrophoresis with Sodium Dodecyl Sulfate): Samples are injected into a bare, fused-silica capillary filled with a replaceable SDS-gel buffer [3] [28]. Application of a high-voltage electric field (typically 500 V/cm) drives separation in a sieving matrix [3]. On-column detection occurs via UV absorbance (usually 220 nm) near the distal end of the capillary, eliminating staining requirements and enabling direct quantification [3] [28].
Electrophoresis Workflow and Critical Quality Attributes
The following diagram illustrates the general workflow for using electrophoresis to monitor mAb Critical Quality Attributes, highlighting key decision points and outputs:
Experimental Comparison: Methodologies and Performance Data
Direct Experimental Comparison of SDS-PAGE and CE-SDS
A direct comparative study analyzed identical samples of human IgG antibody in both normal and heat-stressed states (14 days at 45°C) using both techniques [3]:
SDS-PAGE Protocol: Researchers used an Invitrogen NuPAGE Mini-Gel electrophoresis system with 4-12% Bis-Tris gel. Samples were diluted to 0.2 mg/mL with water and further diluted to 0.15 mg/mL with 4× LDS sample buffer. GelCode Blue stain was employed, with imaging and quantification performed using Alpha View integration software [3].
CE-SDS Protocol: Analysis utilized a Beckman Coulter PA 800 plus system with bare, fused-silica capillary. Antibody samples were diluted to 1.0 mg/mL with SDS sample buffer, with non-reduced samples heated at 70°C for three minutes before injection at 5 kV for 20 seconds. Separation occurred in an electric field of 500 V/cm for 35 minutes, with UV detection at 220 nm [3].
Quantitative Performance Comparison
The table below summarizes key performance metrics derived from experimental data:
Table 1: Performance Comparison of SDS-PAGE and CE-SDS for mAb Analysis
| Performance Parameter | SDS-PAGE | CE-SDS | Experimental Basis |
|---|---|---|---|
| Resolution | Single major band at 150 kDa with minor bands visible | High-resolution separation enabling easy quantitation of degradation species | Analysis of heat-stressed IgG samples [3] |
| Signal-to-Noise Ratio | Lower, making autointegration difficult | Significantly higher, facilitating precise quantification | Comparison of gel scans vs. electropherograms [3] |
| Detection of Nonglycosylated IgG | Not resolved | Easily detected and quantified | Analysis of IgG standard [3] |
| Reproducibility | Not specifically reported | Good overall reproducibility across fragments (4 consecutive analyses) | Consecutive analyses of degraded IgG [3] |
| Automation & Throughput | Manual processing required | Fully automated; newer instruments offer 8x higher throughput | Comparison of classical vs. new instrumentation [16] |
| Sample Preparation | Multiple dilution and staining steps | Simplified preparation with minimal steps | Experimental protocols [3] |
Applications in Monitoring Specific CQAs
Hinge Region Fragmentation
Hinge fragmentation represents a significant CQA for IgG1 monoclonal antibodies. Studies demonstrate CE-SDS's strong correlation with size exclusion chromatography (SEC) for monitoring these fragments [30]. Under low pH stress conditions, CE-SDS effectively separates and quantifies Fc-Fab (~100 kDa), Fab (~47 kDa), and Fc fragments, providing complementary information to SEC [30].
Forced Degradation Studies
Validated CE-SDS methods effectively monitor thermal stress-induced degradation. Recent studies show time- and temperature-dependent increases in low-molecular-weight fragments at 37°C and 50°C, with corresponding decreases in intact IgG [21]. Such forced degradation studies are essential for biosimilarity assessments, demonstrating comparable degradation profiles between biosimilar and originator products [21].
The Scientist's Toolkit: Essential Research Reagents and Materials
Table 2: Essential Research Reagents and Materials for Electrophoretic Analysis
| Item Category | Specific Examples | Function/Purpose |
|---|---|---|
| Separation Systems | Invitrogen NuPAGE Mini-Gel system (SDS-PAGE); Beckman Coulter PA 800 plus or SCIEX BioPhase 8800 (CE-SDS) | Platform for electrophoretic separation [3] [16] |
| Separation Matrices | 4-12% Bis-Tris polyacrylamide gels (SDS-PAGE); SDS-MW Gel Buffer, pH 8 (CE-SDS) | Sieving matrix for size-based separation [3] [28] |
| Chemical Reagents | SDS sample buffer, iodoacetamide (IAM), β-mercaptoethanol (BME) | Denaturation, alkylation, and reduction of disulfide bonds [28] |
| Detection Reagents | GelCode Blue stain (SDS-PAGE); intrinsic UV detection at 220 nm (CE-SDS) | Visualization and quantification of separated protein species [3] [28] |
| Reference Standards | Molecular weight markers, IgG control standard, 10 kDa internal standard | System suitability testing and molecular weight assignment [3] [28] |
| Capillaries | Bare-fused silica capillary (30.2 cm, 50 µm ID) for CE-SDS | Separation channel for CE-SDS analysis [28] |
Method Selection Guide: Technical Considerations and Decision Framework
The choice between SDS-PAGE and CE-SDS depends on multiple factors, including analysis requirements, stage of development, and available resources. The following decision pathway provides a structured approach to method selection:
Analysis of Selection Criteria
Throughput Requirements: CE-SDS provides significant advantages for high-throughput applications, with modern instruments like the SCIEX BioPhase 8800 offering 8-fold higher throughput compared to classical systems [16]. This enables more comprehensive Design of Experiment (DoE) studies and accelerated method development.
Data Quality Needs: For precise quantification, CE-SDS demonstrates superior performance with higher signal-to-noise ratios and better resolution of critical impurities like nonglycosylated heavy chain [3]. SDS-PAGE may suffice for initial characterization where semi-quantitative data is acceptable.
Regulatory Compliance: The application of Analytical Quality by Design (AQbD) principles to CE-SDS method development enhances regulatory alignment [28]. AQbD incorporates risk assessment and Design of Experiments to define Method Operable Design Regions (MODRs), ensuring method robustness for quality control applications [28].
Resource Considerations: While CE-SDS requires higher initial instrumentation investment, it offers reduced operational costs through automation and reduced reagent consumption. SDS-PAGE remains accessible for laboratories with limited capital resources.
Both SDS-PAGE and CE-SDS provide valuable approaches for monitoring Critical Quality Attributes of monoclonal antibodies, with distinct advantages suited to different applications. SDS-PAGE maintains utility for initial screening and educational purposes due to its visual accessibility and lower equipment costs. However, CE-SDS demonstrates clear superiority for regulatory filing, quality control environments, and studies requiring precise quantification through its automated operation, superior resolution, and quantitative capabilities.
The evolution of CE-SDS instrumentation and methodology, including implementation of AQbD principles and development of higher-throughput systems, positions this technology as the growing standard for mAb purity analysis in biopharmaceutical development [16] [28]. As the biotherapeutic landscape continues to advance with increasingly complex modalities, electrophoretic techniques will remain essential tools for ensuring the quality, safety, and efficacy of monoclonal antibody products.
Practical Implementation: Protocols and Applications in mAb Analysis
Capillary Electrophoresis with Sodium Dodecyl Sulfate (CE-SDS) has emerged as a premier analytical technique for purity and impurity analysis of monoclonal antibodies (mAbs) within the biopharmaceutical industry [21]. This technique represents an automated, instrumental evolution of traditional SDS-Polyacrylamide Gel Electrophoresis (SDS-PAGE), offering superior resolution, reproducibility, and quantitative capabilities [3] [31] [32]. While the separation mechanism of CE-SDS is similar to SDS-PAGE—relying on the proportional binding of SDS to denatured polypeptides to separate them by molecular weight—its automated nature and on-column detection eliminate the need for manual staining and destaining steps, thereby reducing variability and improving data accuracy [3] [31].
The reliability of any CE-SDS analysis, however, is fundamentally dependent on proper sample preparation. Inadequately prepared samples can introduce artifacts, such as additional fragments or aggregates, that do not represent the true state of the product, ultimately leading to incorrect purity assessments [33] [31]. This guide provides detailed, evidence-based Standard Operating Procedures for sample preparation under both reduced and non-reduced conditions, framing them within a comparative context against traditional SDS-PAGE to highlight the analytical advantages of CE-SDS.
Technical and Performance Comparison
The transition from SDS-PAGE to CE-SDS represents a significant technological advancement for quality control in biopharmaceutical development. Table 1 summarizes the critical differences between these two techniques.
Table 1: Comparative Analysis: CE-SDS vs. SDS-PAGE
| Feature | CE-SDS | SDS-PAGE |
|---|---|---|
| Automation & Throughput | Fully automated sample injection and data analysis; higher throughput capabilities (e.g., BioPhase 8800 offers 8-fold higher throughput than older models) [16] [31]. | Manual operation for gel casting, sample loading, staining, and destaining [31]. |
| Quantitation | Accurate, quantitative on-line UV or fluorescence detection providing high signal-to-noise ratios for easy integration [3] [21]. | Semi-quantitative, relies on dye staining intensity; lower signal-to-noise ratio makes autointegration difficult [3]. |
| Resolution & Sensitivity | Superior resolution, capable of detecting critical variants like nonglycosylated IgG [3]. Lower limit of quantitation (LOQ) at 0.02 mg/mL for reduced and non-reduced mAb [31]. | Lower resolving power; cannot reliably detect nonglycosylated IgG [3]. |
| Reproducibility | High precision and reproducibility, suitable for quality control (QC) environments and regulatory filing [3] [21]. | Higher variability due to multiple manual processing steps [3]. |
| Data Output | Electropherogram for direct digital analysis and reporting [3]. | Gel image requiring scanning and software analysis [3]. |
| Sample Preparation | Critical, with optimized parameters like buffer pH to prevent artifactual fragmentation [33] [31]. | Less sensitive to specific sample buffer conditions like pH [33]. |
Key Advantages of CE-SDS
The data in Table 1 demonstrates that CE-SDS provides direct detection, enhanced resolution, and accurate quantification critical for biopharma applications [32]. A direct comparison study found CE-SDS to be a "much higher-resolving analytical separation option" with a significant difference in peak resolution and signal-to-noise ratio [3]. Furthermore, CE-SDS can easily detect nonglycosylated IgG, a species that SDS-PAGE cannot resolve [3]. This is a significant functional advantage because glycosylation is critical to the effector function of antibodies, and its accurate quantification is essential for ensuring product quality.
Materials and Reagents
The Scientist's Toolkit: Essential Research Reagent Solutions
The following reagents and instruments are fundamental for executing the sample preparation and analysis procedures described in this guide.
Table 2: Key Research Reagent Solutions for CE-SDS
| Item | Function/Description | Example Sources / Notes |
|---|---|---|
| Capillary Electrophoresis System | Instrument for automated electrophoresis, injection, and detection. | Beckman Coulter PA 800 plus or Sciex BioPhase 8800 systems [3] [16]. |
| SDS Sample Buffer | Denatures the protein and confers a uniform negative charge. | Critical parameter: pH should be ~6.0 to minimize artifactual fragmentation [33] [31]. |
| Iodoacetamide (IAM) | Alkylating agent used as a sulfhydryl sealant in non-reduced sample preparation to cap free cysteine residues [31] [21]. | Typically used at 0.25 M concentration [31]. |
| N-Ethyl Maleimide (NEM) | Alternative alkylating agent for sulfhydryl sealing in non-reduced CE-SDS [33]. | Study shows low pH (6.0) is optimal for its sealing efficacy [33]. |
| 2-Mercaptoethanol (2-ME) | Reducing agent that breaks disulfide bonds for reduced CE-SDS analysis [31] [21]. | Can be used at a 5-fold dilution [31]. |
| Bare Fused-Silica Capillary | The separation channel for the CE-SDS system. | — |
| Replaceable SDS-Gel Buffer | Linear polymer sieving matrix that separates SDS-protein complexes by size. | Replaced after each run for enhanced reproducibility [3] [31]. |
Standard Operating Procedures for CE-SDS Sample Preparation
The workflow for CE-SDS analysis begins with critical sample preparation, which diverges significantly based on the desired analysis type (reduced or non-reduced). The following diagram illustrates the key decision points and steps involved.
General Considerations and Critical Parameters
Before starting, note these universally critical parameters established by experimental data:
- Sample Buffer pH: This is a paramount factor, especially for non-reduced analysis. Multiple studies have conclusively shown that a slightly acidic sample buffer (pH 6.0–6.5) greatly decreases thermally induced fragmentation of non-reduced monoclonal antibodies compared to higher pH buffers (e.g., pH 9.0) [33] [31]. A pH of 6.0 is considered the optimal preparation condition for purity detection of non-reduced mAbs [33].
- Incubation Conditions: A standard incubation of 65°C for 5 minutes is widely used and validated for both reduced and non-reduced samples [31] [21].
- Sample Concentration: A final protein concentration of 0.5–1.0 mg/mL is typical for analysis [3] [31] [21].
Procedure for Non-Reduced CE-SDS
Purpose: To analyze the intact antibody and its related size variants (fragments and aggregates) while preserving the native disulfide bond structure.
- Dilution: Dilute the antibody sample to a concentration of 1.0 mg/mL using an SDS sample buffer at pH 6.0 [33] [31].
- Alkylation (Sulfhydryl Sealing): Add iodoacetamide (IAM) to the sample mixture to a final concentration of approximately 0.25 M. This step alkylates free cysteine residues, preventing disulfide bond scrambling or rearrangement during the heating step [31] [21].
- Denaturation: Heat the prepared sample at 70°C for 3–5 minutes to ensure complete denaturation and formation of SDS-protein complexes [3] [31].
- Analysis: Inject the sample into the CE-SDS instrument (e.g., at 5 kV for 20 seconds) for separation and analysis [3].
Procedure for Reduced CE-SDS
Purpose: To break disulfide bonds and separate the individual light and heavy chains, allowing for analysis of chain-based impurities and non-glycosylated heavy chain (NGHC).
- Dilution: Dilute the antibody sample to a concentration of 1.0 mg/mL using an SDS sample buffer.
- Reduction: Add a reducing agent, such as 2-mercaptoethanol (2-ME), to the sample. An optimized condition is to use 10 μL of a 5-fold diluted 2-ME solution [31].
- Denaturation and Reduction: Incubate the sample at 65°C for 5–10 minutes. This step simultaneously denatures the protein and reduces the disulfide bonds [31] [21].
- Analysis: Inject the sample into the CE-SDS instrument for separation.
Method Validation and Application Data
Validation of CE-SDS Methods
For a method to be suitable for quality control (QC) and regulatory filing, it must undergo rigorous validation. Data from a 2025 study demonstrates that properly developed CE-SDS methods meet international standards [21]. Table 3 summarizes key validation parameters for both non-reduced (nrCE-SDS) and reduced (rCE-SDS) methods.
Table 3: Summary of CE-SDS Method Validation Parameters (Adapted from [21])
| Validation Parameter | nrCE-SDS (Intact IgG) | rCE-SDS (Total Impurity) | Acceptance Criteria |
|---|---|---|---|
| Specificity | No interference from buffer | No interference from buffer | Complies |
| Linearity (R²) | 0.99 | 0.98 | R² ≥ 0.98 |
| Accuracy | 90–116% | 85–114% | Generally 80–120% |
| Precision (Repeatability, RSD) | 2.0% | 4.5% | RSD < 5% |
| Intermediate Precision (RSD) | 0.1% | 2.2% | RSD < 5% |
| Limit of Quantitation (LOQ) | — | 0.6% | — |
| Range | 1.25–15.0 mg/mL | 0.158–15.0 mg/mL | — |
| Robustness | Complies | Complies | Complies |
Experimental Data from Comparative Studies
The superiority of CE-SDS is not merely theoretical but is demonstrated in experimental data. A direct comparison study analyzed the same normal and heat-stressed IgG samples using both SDS-PAGE and CE-SDS [3].
- In the SDS-PAGE gel image, impurity bands for the heat-stressed sample showed much lower signal-to-noise ratios, making autointegration difficult [3].
- In contrast, the CE-SDS electropherogram for the same samples showed high-resolution separation, allowing for easy quantitation of degradation species due to a high signal-to-noise ratio [3].
- A key finding was that CE-SDS could easily detect nonglycosylated IgG, which was not resolved by SDS-PAGE [3]. This is a critical advantage for functional characterization.
Furthermore, a bridging study comparing the classical PA800+ instrument with the new high-throughput BioPhase 8800 system found that data generated on the new instrument were highly comparable, demonstrating the robustness and transferability of well-developed CE-SDS methods [16]. The 8-fold higher throughput of modern systems also makes extensive screening and Design of Experiment (DoE) studies a mainstream application [16].
For decades, sodium dodecyl sulfate-polyacrylamide gel electrophoresis (SDS-PAGE) has been a fundamental technique for monitoring the purity and impurity profiles of monoclonal antibody (mAb) biopharmaceuticals during quality control (QC). However, the evolution of capillary electrophoresis (CE-SDS) has introduced an automated, instrumental alternative that is increasingly being adopted in biopharmaceutical workflows. This comparison guide objectively evaluates the performance of both technologies within the context of product release testing, focusing on critical QC parameters including resolution, quantitation, reproducibility, and compliance with regulatory standards. As the biopharmaceutical industry advances toward more stringent quality requirements, understanding the technical capabilities of each method becomes essential for researchers, scientists, and drug development professionals making platform technology decisions.
Performance Comparison: Key Analytical Parameters
Direct comparative studies using standardized samples reveal significant differences in the performance characteristics of CE-SDS and SDS-PAGE for antibody purity analysis. The table below summarizes quantitative data comparing both technologies across critical QC parameters.
Table 1: Direct Performance Comparison of CE-SDS and SDS-PAGE for mAb Purity Analysis
| Analytical Parameter | CE-SDS Performance | SDS-PAGE Performance | Implication for QC Testing |
|---|---|---|---|
| Resolution & Sensitivity | High-resolution separation; easily quantitates degradation species with high signal-to-noise ratio [3] | Lower signal-to-noise ratios for impurities; difficulty auto-integrating impurity bands [3] | More reliable detection and quantitation of low-abundance impurities for product release |
| Detection of Nonglycosylated IgG | Capable of detecting nonglycosylated IgG [3] | Unable to resolve nonglycosylated IgG species [3] | Critical for assessing CQAs since glycosylation impacts IgG function |
| Quantitation & Linearity | Excellent linearity (R² = 0.99) across analytical range (e.g., 0.25-3.0 mg/mL) [34] [21] | Semi-quantitative; limited accuracy in band quantification [3] [35] | Enables precise potency assessment and is preferable for stability-indicating assays |
| Precision (Repeatability) | High precision; RSD typically <2.5% for main species [21] | Higher variability due to manual staining/destaining and imaging steps [3] | Better supports batch-to-batch consistency and manufacturing control |
| Limit of Quantitation (LOQ) | LOQ determined at 0.02 mg/mL for mAb fragments [34] | Less sensitive; detection limits dependent on staining technique [34] | More sensitive monitoring of product-related impurities |
| Assay Reproducibility | Excellent overall reproducibility across consecutive analyses [3] | Manual operation leads to greater inter-operator and inter-assay variability [35] | Essential for interlab comparability and regulatory compliance |
Experimental Protocols for Technology Comparison
Side-by-Side Instrumentation and Operation
The fundamental differences in operation between the two techniques dictate their suitability for a QC environment.
CE-SDS Protocol (Automated Capillary System):
- Instrumentation: PA 800 plus system (Beckman Coulter) or similar [3]
- Capillary: Bare, fused-silica capillary with replaceable SDS-gel polymer matrix [3] [34]
- Sample Prep: Antibody samples diluted to 1.0 mg/mL with SDS sample buffer; nonreduced samples heated at 70°C for 3 minutes [3]
- Injection: Automated electrokinetic injection at 5 kV for 20 seconds [3]
- Separation: Electric field of 500 V/cm for 35 minutes with UV detection at 220 nm [3]
- Data Analysis: Automated peak identification and quantitation using instrument software (e.g., 32 Karat software) [3]
SDS-PAGE Protocol (Manual Gel-Based System):
- Instrumentation: Invitrogen NuPAGE Mini-Gel electrophoresis system with 4–12% Bis-Tris gel [3]
- Sample Prep: Samples diluted to 0.2 mg/mL with water, then to 0.15 mg/mL with 4× LDS sample buffer [3]
- Separation: Gel electrophoresis per manufacturer's procedure [3]
- Detection: Post-separation staining with GelCode Blue stain, followed by destaining [3]
- Data Analysis: Manual imaging with quantification software (e.g., Alpha View); difficult auto-integration for impurity bands [3]
Sample Preparation and Optimization
Proper sample preparation is critical for both methods, with specific optimizations needed for CE-SDS to ensure robustness.
Sample Buffer pH Optimization: Studies show that a slightly acidic sample buffer (pH 5.5–6.5) greatly decreases thermally induced fragmentation of non-reduced mAbs compared to alkaline buffers (pH 9.0) [34]. A citrate–phosphate buffer at pH 6.5 is recommended to minimize artificial fragment generation during sample preparation [34].
Incubation Conditions: Optimal sample preparation conditions were established as incubation at 65°C for 5 minutes for both reduced and non-reduced antibodies [34].
Reduction and Alkylation: For reduced CE-SDS, conditions were optimized to 10 μL of 5-fold diluted 2-mercaptoethanol (2-ME); for alkylation, 10 μL of 0.25 M iodoacetamide (IAM) is used [34].
Figure 1: CE-SDS Automated Workflow. This streamlined process eliminates manual gel handling and staining steps required for SDS-PAGE.
The Scientist's Toolkit: Essential Research Reagents
Successful implementation of either methodology requires specific reagent systems optimized for protein separation and detection.
Table 2: Essential Research Reagents for CE-SDS and SDS-PAGE Analysis
| Reagent/Chemical | Function in Analysis | Technology Application |
|---|---|---|
| SDS (Sodium Dodecyl Sulfate) | Denatures proteins; confers uniform negative charge (1.4g SDS/g protein) [3] [34] | CE-SDS & SDS-PAGE (Core to both techniques) |
| 2-Mercaptoethanol (2-ME) | Reducing agent breaks disulfide bonds for reduced analyses [34] | CE-SDS & SDS-PAGE (Reduced conditions) |
| Iodoacetamide (IAM) | Alkylating agent stabilizes reduced cysteine residues [34] | CE-SDS & SDS-PAGE (Alkylation for reduced samples) |
| Replaceable SDS-Gel Polymer | Linear polymer network acts as molecular sieve; replaced between runs [34] | CE-SDS (Separation matrix) |
| Cross-linked Polyacrylamide Gel | Fixed gel matrix separates proteins based on molecular size [3] | SDS-PAGE (Separation matrix) |
| Citrate-Phosphate Buffer | Optimized sample buffer (pH 6.5) minimizes stress-induced fragmentation [34] | CE-SDS (Sample buffer) |
| Coomassie-Based Stain (GelCode Blue) | Protein staining for visualization after electrophoresis [3] | SDS-PAGE (Detection) |
Application in Forced Degradation Studies
Forced degradation studies represent a critical application for purity analysis in biosimilar development, where CE-SDS demonstrates particular advantage. Recent studies comparing biosimilar and originator anti-VEGF mAbs under thermal stress conditions (37°C and 50°C for up to 14 days) utilized validated CE-SDS methods to monitor fragmentation profiles [21]. Non-reduced CE-SDS analysis revealed time- and temperature-dependent increases in low-molecular-weight fragments with a corresponding decrease in the intact form, while reduced CE-SDS showed increased total impurity levels accompanied by decreases in light and heavy chain content [21]. These studies confirmed comparable degradation profiles between biosimilar and originator mAbs, demonstrating CE-SDS's capability to provide high-resolution data for regulatory comparability assessments under stressed conditions [21].
Figure 2: mAb Species Resolved by CE-SDS. The technique separates both covalent complexes under non-reduced conditions and individual subunits under reduced conditions.
The comprehensive comparison of analytical performance, experimental workflows, and practical applications in quality control demonstrates that CE-SDS represents a significant advancement over traditional SDS-PAGE for antibody purity and impurity profiling. While SDS-PAGE remains a valuable qualitative tool, CE-SDS provides superior resolution, detection sensitivity, quantitative accuracy, and reproducibility—attributes essential for modern biopharmaceutical quality control. The automated nature of CE-SDS, combined with its ability to detect critical quality attributes like nonglycosylated IgG and provide validated methods for regulatory filing, positions it as the preferred technology for product release testing in current Good Manufacturing Practice (cGMP) environments. As the biopharmaceutical industry continues to evolve toward more automated and data-rich analytical approaches, CE-SDS is poised to completely replace SDS-PAGE for purity analysis in QC laboratories focused on monoclonal antibody therapeutics.
Forced degradation studies are indispensable in the development of biopharmaceuticals, providing critical insights into the stability of therapeutic proteins such as monoclonal antibodies (mAbs). A key objective of these studies is to identify potential degradation pathways under various stress conditions, with thermal stress being one of the most versatile and commonly applied methods for inducing fragmentation and aggregation [21]. The selection of an appropriate analytical technique is paramount for accurately monitoring these changes. This guide provides a comparative evaluation of two principal electrophoretic techniques—SDS-PAGE and Capillary Electrophoresis with Sodium Dodecyl Sulfate (CE-SDS)—for assessing antibody purity and fragmentation under thermal stress, offering experimental data and protocols to inform analytical decisions.
Technical Comparison of SDS-PAGE and CE-SDS
Fundamental Principles and Workflows
- SDS-PAGE (Sodium Dodecyl Sulfate-Polyacrylamide Gel Electrophoresis): This traditional slab-gel technique separates proteins based on their molecular weight. Proteins are denatured and coated with SDS, imparting a uniform negative charge. Separation occurs as proteins migrate through a polyacrylamide gel matrix under an electric field, with smaller proteins moving faster. Detection typically involves post-separation staining (e.g., Coomassie Blue), and quantification requires densitometric scanning of the stained gel bands [3].
- CE-SDS (Capillary Electrophoresis-Sodium Dodecyl Sulfate): As an advanced, automated counterpart to SDS-PAGE, CE-SDS performs the separation within a fused-silica capillary filled with a replaceable SDS-gel polymer solution. Proteins are injected into the capillary and driven through the sieving matrix by high voltage. Quantitative, real-time detection occurs via UV absorbance (often at 220 nm) at the distal end of the capillary, eliminating the need for staining and destaining [3] [21].
Comparative Performance Characteristics
Direct comparisons using standardized samples, including normal and heat-stressed IgG, reveal significant differences in performance, as summarized in the table below.
Table 1: Performance Comparison of SDS-PAGE and CE-SDS in Antibody Analysis
| Feature | SDS-PAGE | CE-SDS |
|---|---|---|
| Resolution | Moderate; bands can be diffuse. | High; sharp peaks, superior separation of fragments [3]. |
| Quantitation | Semi-quantitative; relies on staining intensity and scanning. | Highly quantitative with low signal-to-noise ratio; direct UV detection enables precise peak integration [3] [21]. |
| Reproducibility | Subject to manual processing variability; higher Relative Standard Deviation (RSD). | Excellent automation leads to high precision and low RSD (e.g., <2.0% for repeatability) [3] [21]. |
| Detection of Nonglycosylated IgG | Poorly resolved or not detected [3]. | Easily detected and quantified, a significant functional advantage [3]. |
| Sample Throughput | Lower; manual, batch-based processing. | Higher; automated analysis with walk-away capability. |
| Data Analysis | Manual or semi-automated band analysis. | Fully automated software-driven peak assignment and quantification [3]. |
A key finding from comparative studies is that CE-SDS provides a much higher signal-to-noise ratio, allowing for easy quantitation of degradation species that are difficult to detect via SDS-PAGE [3]. Furthermore, CE-SDS can reliably detect and quantify nonglycosylated IgG, a species functionally distinct from its glycosylated counterpart, which SDS-PAGE often misses [3].
Experimental Data from Forced Degradation Studies
Thermal Stress Protocol and Analysis
Forced degradation studies typically subject monoclonal antibodies to elevated temperatures to accelerate fragmentation and aggregation. A standard protocol involves incubating antibody samples (e.g., at 1.0 mg/mL) at stress temperatures such as 37°C (physiologically relevant) and 50°C (severe stress) for defined periods ranging from 3 to 14 days [21]. Control samples are kept at recommended storage temperatures (e.g., 2-8°C). Subsequently, both non-reduced (nrCE-SDS) and reduced (rCE-SDS) analyses are performed to characterize the degradation profile.
Table 2: Quantification of Fragments in Heat-Stressed IgG by CE-SDS
| Sample Condition | Intact IgG (%) | Low Molecular Weight (LMW) Fragments (%) | High Molecular Weight (HMW) Aggregates (%) | Key Fragment Identities |
|---|---|---|---|---|
| Normal IgG | >95% | <5% | Minimal | Free Light Chain (LC), 2H1L (Two Heavy + One Light chain) [3]. |
| Heat-Stressed IgG (14 days at 45°C) | Decrease of ~5-10% | Increase of ~5-10% | Increase of ~1-3% | LC, 2H (Two Heavy chains), 2H1L, nonglycosylated IgG [3]. |
| Heat-Stressed IgG (14 days at 50°C) | Significant decrease (>10%) | Significant increase (>10%) | Increase of ~3-5% | Prominent Fab, Fc, and Fc-Fab fragments from hinge cleavage; CH2 domain fragments [21] [30] [36]. |
Experimental data demonstrates a clear time- and temperature-dependent increase in LMW fragments and a corresponding decrease in the intact antibody [21]. Under non-reducing conditions (nrCE-SDS), the primary degradation products include disulfide-linked fragments like Fc-Fab. Under reducing conditions (rCE-SDS), these complexes dissociate into their constituent light chains (L), heavy chains (H), and non-glycosylated heavy chains (NGH), allowing for a more detailed assessment of the cleavage sites [21].
Advanced Characterization of Fragments
CE-SDS not only quantifies fragments but, when coupled with other techniques, enables their identification. For example, hydrophobic interaction chromatography (HIC) can be used to fractionate stressed samples. Subsequent analysis of these fractions by CE-SDS and LC-MS/MS has identified that front shoulder peaks on the main IgG peak in nrCE-SDS often correspond to fragments resulting from cleavages in the CH2 domain (e.g., at leucine 306 or 309) where the complementary fragments remain linked by an intrachain disulfide bond [36]. This level of characterization is crucial for understanding root causes of degradation.
Recommended Experimental Protocols
CE-SDS Method for Forced Degradation Analysis
The following validated protocol is adapted from recent biosimilarity assessments and can be applied to monitor thermal fragmentation [21].
- Sample Preparation: Dilute the antibody sample to a concentration of 1.0 mg/mL using a commercial SDS sample buffer.
- For non-reduced (nrCE-SDS) analysis, include iodoacetamide (IAM) in the buffer to alkylate free thiols and prevent disulfide scrambling.
- For reduced (rCE-SDS) analysis, include a reducing agent such as 2-mercaptoethanol (BME) at a concentration of 50 mM to break disulfide bonds.
- Heat the samples at 70°C for 3-10 minutes to ensure complete denaturation.
- Instrumentation: Use a commercial CE system (e.g., Beckman Coulter PA 800 plus or equivalent) with a bare fused-silica capillary.
- Separation Conditions:
- Injection: Electrokinetic injection at 5 kV for 10-20 seconds.
- Separation Voltage: 500 V/cm (e.g., ~15 kV) for 25-35 minutes.
- Capillary Temperature: 25°C.
- Detection: UV absorbance at 220 nm.
- Data Analysis: Use instrument software (e.g., Beckman Coulter 32 Karat) to integrate peaks and calculate the relative percent area for the intact antibody, LMW fragments, and HMW species.
SDS-PAGE Protocol for Comparative Analysis
- Sample Preparation: Dilute the antibody to 0.2 mg/mL with water, then mix with 4x LDS sample buffer to a final concentration of 0.15 mg/mL.
- For reduced analysis, include a reducing agent like dithiothreitol (DTT).
- Heat samples at 70°C for 10 minutes.
- Gel Electrophoresis: Use a pre-cast Bis-Tris gradient gel (e.g., 4-12%) with an appropriate buffer system (e.g., MOPS or MES). Run at a constant voltage (e.g., 200 V) for approximately 35-45 minutes.
- Staining and Visualization: Stain the gel with a protein stain such as GelCode Blue. Follow the manufacturer's protocol for destaining (if necessary).
- Image Acquisition and Quantification: Scan the gel and use densitometry software (e.g., Alpha View) to quantify the intensity of the bands.
The Scientist's Toolkit: Key Research Reagents
Successful forced degradation and analysis rely on specific, high-quality reagents.
Table 3: Essential Reagents for CE-SDS-based Forced Degradation Studies
| Reagent / Material | Function in the Experiment | Example & Notes |
|---|---|---|
| SDS Sample Buffer | Denatures proteins and confers a uniform negative charge for size-based separation. | Commercial CE-SDS sample buffer (e.g., from Beckman Coulter or Bio-Rad). |
| Reducing Agent | Breaks disulfide bonds to separate heavy and light chains for reduced analysis. | 2-Mercaptoethanol (BME) or Dithiothreitol (DTT), typically at 50 mM [21]. |
| Alkylating Agent | Alkylates free cysteine thiols to prevent reformation of disulfide bonds in non-reduced analysis. | Iodoacetamide (IAM). |
| Molecular Weight Marker | Provides a standard curve for apparent molecular weight determination. | Use a marker designed for CE-SDS; choice significantly impacts accuracy [37]. |
| Capillary & Sieving Matrix | The physical platform for separation using a polymer sieving matrix. | Bare fused-silica capillary with a proprietary SDS-gel solution (e.g., from Beckman Coulter). |
| Formulation Buffer | Serves as a control and for sample dilution to the target concentration. | The buffer in which the antibody is formulated (e.g., histidine buffer, succinate buffer). |
Workflow and Signaling Diagram
The following diagram illustrates the logical workflow for designing and executing a forced degradation study using CE-SDS, integrating the key steps and decision points discussed in this guide.
In the context of forced degradation studies for assessing thermal stress and fragmentation, CE-SDS demonstrates clear and significant advantages over traditional SDS-PAGE. Its superior resolution, quantitative accuracy, high reproducibility, and automation make it a more robust and reliable platform for monitoring critical quality attributes of therapeutic antibodies. While SDS-PAGE remains a useful qualitative tool, the data clearly supports the adoption of CE-SDS as the primary method for decisive analytical characterization, stability testing, and quality control in modern biopharmaceutical development.
The detection of the non-glycosylated heavy chain (NGHC) represents a critical quality attribute in the development and manufacturing of therapeutic monoclonal antibodies (mAbs). NGHC occurs when the heavy chain of an antibody lacks the core N-linked glycan at position N297 in the Fc region, a modification essential for proper effector functions such as antibody-dependent cellular cytotoxicity (ADCC) [38]. Even small quantities of NGHC can significantly impact therapeutic efficacy and lot-to-lot consistency, necessitating highly sensitive and reliable analytical methods for its detection and quantification [3] [21]. While sodium dodecyl sulfate-polyacrylamide gel electrophoresis (SDS-PAGE) has traditionally been employed for protein purity analysis, capillary electrophoresis sodium dodecyl sulfate (CE-SDS) has emerged as a superior technological platform for resolving critical species like NGHC with enhanced precision, sensitivity, and resolution [3] [37]. This guide provides a comprehensive comparative analysis of these techniques, focusing specifically on their performance in NGHC detection, with experimental data and methodologies to inform analytical decision-making in biopharmaceutical development.
Technical Comparison: CE-SDS vs. SDS-PAGE for NGHC Analysis
Table 1: Comparative Performance of CE-SDS and SDS-PAGE for NGHC Detection
| Performance Characteristic | CE-SDS | SDS-PAGE |
|---|---|---|
| NGHC Detection Capability | Directly detects and resolves NGHC [3] | Cannot reliably detect or resolve NGHC [3] |
| Resolution | High-resolution separation allowing easy quantitation [3] | Limited resolution for closely migrating species [3] |
| Quantitation | Excellent reproducibility (Peak Area RSD <5%) [39] | Difficult quantitation due to staining variability [3] |
| Signal-to-Noise Ratio | Superior, enabling confident peak integration [3] [20] | Significantly lower, complicating impurity detection [3] |
| Detection Sensitivity | LOQ as low as 0.6% for impurities; Enhanced with Native Fluorescence Detection [21] [20] | Limited by staining sensitivity [3] |
| Automation & Throughput | Fully automated with online detection [3] [31] | Manual process with post-run staining [3] |
| Data Analysis | Automated peak integration and assignment [3] [20] | Manual band quantification requiring densitometry [3] |
The experimental basis for this comparison stems from a direct study comparing both technologies using the same IgG samples. The research demonstrated that "CE-SDS could detect nonglycosylated IgG easily, whereas SDS-PAGE could not detect that species" [3]. This fundamental difference in detection capability is attributed to CE-SDS's superior resolution and quantitative nature, which provides a high-resolution separation that allows for easy quantitation of degradation species attributable to a high signal-to-noise ratio [3]. Furthermore, the baseline stability in CE-SDS electropherograms facilitates more accurate integration of low-abundance species like NGHC compared to the fluctuating baselines often encountered in SDS-PAGE gel scans [3] [20].
Experimental Evidence: Key Studies Demonstrating CE-SDS Superiority
Direct Comparative Study of IgG Analysis
A head-to-head comparison study analyzed the same human IgG antibody sample in both normal and heat-stressed states using SDS-PAGE and CE-SDS methodologies. The SDS-PAGE analysis was performed using an Invitrogen NuPAGE Mini-Gel electrophoresis system with 4–12% Bis-Tris gel and GelCode Blue stain, with samples diluted to 0.2 mg/mL and further processed with LDS sample buffer. Gel imaging and quantification were conducted using Alpha View integration software [3]. In parallel, CE-SDS analysis was performed using a PA 800 plus system with samples diluted to 1.0 mg/mL with SDS sample buffer. Non-reduced samples were heated at 70°C for three minutes before injection into a bare, fused-silica capillary at 5 kV for 20 seconds. Separation occurred in an electric field of 500 V/cm for 35 minutes, with UV detection at 220 nm [3].
The results were striking: while the SDS-PAGE analysis showed a single major band at 150 kDa and minor bands at higher molecular weights for heat-stressed IgG, the CE-SDS analysis easily resolved and quantified multiple degradation species, including the NGHC. The authors concluded that "CE-SDS technology [is] a much higher-resolving analytical separation option than SDS-PAGE for separation of a normal and heat-stressed IgG samples in purity determinations" [3].
Workflow for Comprehensive mAb Characterization
A detailed workflow for the characterization of bamlanivimab, an anti-SARS-CoV-2 therapeutic antibody, further exemplifies the application of CE-SDS for NGHC analysis. Researchers employed SDS capillary gel electrophoresis (SDS-CGE) for size heterogeneity analysis to determine the presence and quantity of the NGHC fragment. Their results showed "the presence of negligible amount of non-glycosylated heavy chain (NGHC)" at approximately 0.44% of the total peak area, a level of quantification that would challenge traditional SDS-PAGE methodologies [38] [20]. This workflow integrated CE-SDS-based size analysis with capillary isoelectric focusing for charge variant determination and glycosylation profiling, providing a comprehensive characterization platform that underscores the central role of CE-SDS in modern biotherapeutic analysis [38].
Table 2: Key Research Reagent Solutions for CE-SDS Analysis of NGHC
| Reagent/Kit | Function in NGHC Analysis | Example Application |
|---|---|---|
| CE-SDS Protein Analysis Kit | Provides optimized gel buffer, sample buffer, and standards for reproducible separation [20]. | Standardized purity analysis for mAbs under reducing and non-reducing conditions [20]. |
| Iodoacetamide (IAM) | Alkylating agent that blocks free thiols to prevent disulfide scrambling during sample prep [31] [40]. | Used in non-reduced CE-SDS to minimize artificial fragments [31]. |
| 2-Mercaptoethanol (BME) | Reducing agent that breaks inter- and intra-chain disulfide bonds for reduced analysis [31] [21]. | Sample reduction for quantifying individual light and heavy chains [31]. |
| Internal Standard (10 kDa) | Migration time reference for precise relative migration time calculation [31] [20]. | System suitability and migration time normalization [20]. |
| Native Fluorescence Detection (NFD) | Label-free detection utilizing intrinsic fluorescence of tryptophan residues for enhanced sensitivity [20]. | Detection of low-abundance impurities with superior signal-to-noise compared to UV [20]. |
Methodologies: Detailed Protocols for CE-SDS Analysis of NGHC
Standard Reduced CE-SDS Method for Purity Assessment
A validated reduced CE-SDS method provides a robust approach for monitoring NGHC and other product-related impurities. The typical protocol involves diluting the antibody sample to a concentration of 1.0 mg/mL with SDS sample buffer. For reduced analysis, the sample is mixed with 2-mercaptoethanol (typically 5-10 μL of a diluted solution) and heated at 70°C for 10 minutes to achieve complete reduction and denaturation. The prepared sample is then injected into a bare fused silica capillary (e.g., 50 μm ID × 30 cm length) using pressure or electrokinetic injection (5 kV for 20 seconds). Separation is performed in a replaceable sieving polymer matrix under reverse polarity at an electric field of 500 V/cm for approximately 30-35 minutes with UV detection at 220 nm [3] [31] [21]. This method enables the separation of light chain, heavy chain, and NGHC, with the NGHC typically migrating slightly faster than the glycosylated heavy chain due to its lower molecular weight [3] [38].
Method Optimization Strategies for Enhanced NGHC Detection
Method optimization is often required to achieve accurate NGHC quantification while minimizing artifacts. Key parameters include:
- Sample Buffer pH: Using slightly acidic sample buffer (pH 5.5-6.5) instead of alkaline buffers (pH 9.0) can greatly decrease thermally induced fragmentation of non-reduced antibodies during sample preparation [31].
- Incubation Conditions: Optimal sample denaturation is typically achieved at 65-70°C for 5-10 minutes. Excessive heat or prolonged incubation should be avoided to prevent protein degradation [31].
- Artifact Elimination: For antibodies prone to non-covalent aggregation artifacts (e.g., pertuzumab), unusual operating conditions such as enhanced capillary separation temperature (60°C) and decreased separation voltage (9.5 kV) can effectively eliminate interfering species without compromising NGHC detection [40].
- Detection Mode Selection: While UV detection at 220 nm is standard, native fluorescence detection (NFD) provides enhanced sensitivity for low-abundance species by utilizing the intrinsic fluorescence of tryptophan residues, resulting in improved signal-to-noise ratios and more stable baselines for easier peak integration [20].
Advanced Applications: CE-SDS in Forced Degradation and Biosimilarity Studies
Forced degradation studies provide critical insights into the stability and degradation pathways of therapeutic antibodies, with CE-SDS serving as a primary analytical tool for monitoring fragment formation, including NGHC. A comprehensive biosimilarity assessment of an anti-VEGF mAb employed validated CE-SDS methods to compare the degradation profiles of a biosimilar candidate with its originator counterparts under thermal stress conditions (37°C and 50°C for up to 14 days). The study demonstrated that reduced CE-SDS effectively monitored the decrease in total light and heavy chain content and the corresponding increase in total impurities, including NGHC, demonstrating comparable degradation profiles between the biosimilar and originator products [21]. This application highlights the critical role of CE-SDS in establishing biosimilarity through sensitive detection of product-related size variants, including NGHC, under accelerated stress conditions.
The comprehensive experimental data and methodological comparisons presented in this guide unequivocally demonstrate the superiority of CE-SDS over SDS-PAGE for the detection and quantification of NGHC in therapeutic antibodies. CE-SDS provides the necessary resolution, sensitivity, and quantitative precision required for monitoring this critical quality attribute throughout biopharmaceutical development, manufacturing, and stability studies. As the biopharmaceutical industry continues to advance with increasingly complex modalities, CE-SDS methodologies—including emerging enhancements like native fluorescence detection and novel sieving matrices—will remain indispensable tools for ensuring the quality, efficacy, and safety of therapeutic antibodies.
NGHC Detection Advantage with CE-SDS
Diagram Title: NGHC Detection Advantage of CE-SDS
CE-SDS Workflow for NGHC Analysis
Diagram Title: CE-SDS Workflow for NGHC Analysis
The characterization of monoclonal antibodies (mAbs) requires precise analytical methods to monitor critical quality attributes (CQAs) such as purity, fragmentation, and aggregation. For decades, sodium dodecyl sulfate-polyacrylamide gel electrophoresis (SDS-PAGE) served as the primary technique for size-based purity analysis, separating denatured proteins based on their molecular weight through a gel matrix [3]. While foundational, this method presents significant limitations for modern biopharmaceutical development, including limited quantitative capabilities, low throughput, and procedural complexity requiring extensive manual processing [3] [21].
Capillary electrophoresis with sodium dodecyl sulfate (CE-SDS) has emerged as the superior analytical approach, offering automated, quantitative analysis with enhanced resolution and reproducibility [3] [21]. The transition to capillary-based systems represents a paradigm shift in analytical support for biomanufacturing, enabling researchers to obtain higher quality data with significantly reduced manual intervention. This evolution is particularly crucial as the biopharmaceutical industry faces increasing pressure to accelerate development timelines while ensuring product quality and regulatory compliance.
The introduction of multi-capillary systems represents the latest advancement in this technological evolution, specifically designed to address the throughput demands of modern biomanufacturing support. These instruments parallelize the separation process, dramatically increasing analytical capacity while maintaining the precision and data quality required for critical assessments during biotherapeutic development [41] [16].
Multi-capillary CE-SDS instruments represent a significant engineering achievement in analytical separation science. Unlike traditional single-capillary systems, these platforms incorporate multiple capillaries that operate simultaneously under identical conditions, enabling parallel processing of several samples [41]. This architectural innovation directly addresses one of the most significant bottlenecks in analytical characterization – throughput – without compromising data quality.
The BioPhase 8800 system exemplifies this technological advancement with its 8-capillary configuration, which allows biopharma scientists to run multiple samples in parallel, thereby accelerating the development and execution of sensitive, high-throughput analytical methods [41]. This parallel processing capability is particularly valuable for method development, stability studies, and comparability assessments that require analysis of numerous samples under identical conditions [41].
A key feature of these advanced systems is the application of equal separation voltage to each capillary, ensuring high reproducibility across all parallel separations [41]. This technical specification is crucial for obtaining reliable, comparable data across multiple samples analyzed simultaneously. Additionally, factory-built cartridges and push-in loading mechanisms minimize user error and variability, further enhancing data consistency [41].
Modern multi-capillary systems also incorporate sophisticated detection capabilities, offering flexibility for diverse workflow requirements. The BioPhase 8800 system, for instance, enables simple switching between native fluorescence (NF), UV, or laser-induced fluorescence (LIF) detection modes without manual detector changes [41]. This integrated optical detection system provides significant methodological flexibility, allowing researchers to select the most appropriate detection method based on their specific sensitivity requirements and analytical goals.
Temperature control represents another critical advancement in these systems. Liquid-based temperature control of each capillary maximizes data reproducibility, while uniform temperature control across the sample plate maintains sample stability [41]. The ability to rapidly adjust the sample chamber temperature between 4-37°C further enhances operational readiness for diverse analytical scenarios [41].
Performance Comparison: Quantitative Data Analysis
Direct performance comparisons between established CE-SDS platforms and newer multi-capillary systems demonstrate comparable data quality with significantly enhanced throughput. A bridging study comparing the BioPhase 8800 system with the established PA800+ platform analyzed four different monoclonal antibodies under both reducing and non-reducing conditions [16]. The results demonstrated that data generated on the BioPhase 8800 were highly comparable to those obtained on the PA800+ instrument, with high precision achievable with both manual and automated sample preparation [16].
Table 1: System Configuration and Throughput Comparison
| Parameter | Single-Capillary System (PA800+) | Multi-Capillary System (BioPhase 8800) |
|---|---|---|
| Number of Capillaries | 1 | 8 |
| Throughput Capacity | Sequential sample processing | Parallel processing of 8 samples |
| Throughput Multiplier | 1x | 8-fold increase [16] |
| Precision (Intra-capillary %RSD CPA%) | Not specified | < 0.4% for heavy chain [20] |
| Precision (Inter-capillary %RSD CPA%) | Not specified | < 0.3% for heavy chain [20] |
| Detection Modes | Standard UV or LIF | UV, LIF, and Native Fluorescence [41] |
| Sensitivity Enhancement | Standard | Up to 10x improvement with NF vs. UV [41] |
The throughput advantage of multi-capillary systems enables experimental approaches that were previously impractical due to time constraints. Specifically, the 8-fold higher throughput of the BioPhase 8800 makes screening and design of experiment (DoE) studies a mainstream application of CE-SDS experiments [16]. This capability is particularly valuable for manufacturing support applications requiring rapid method development, formulation screening, and stability assessment under multiple conditions.
Detection technology represents another area of significant advancement in modern multi-capillary systems. Native fluorescence detection (NFD) on the BioPhase 8800 system offers a label-free alternative for protein CQA analysis with sensitivity higher than UV detection [20]. This detection method utilizes the intrinsic fluorescence of aromatic amino acids – primarily tryptophan – which exhibit strong absorption at 280 nm and emit fluorescence near 350 nm upon excitation [20]. This natural property enables sensitive detection without chemical derivatization, providing a stable, flattened baseline that facilitates easier peak integration and faster data analysis compared to UV detection [20].
Table 2: Detection Mode Performance Comparison
| Performance Metric | UV Detection | Native Fluorescence Detection |
|---|---|---|
| Baseline Stability | Fluctuations complicate integration [20] | Stable, flattened baseline [20] |
| Sensitivity | Standard | Enhanced sensitivity [41] |
| Signal-to-Noise Ratio | Lower (e.g., 78 for HC fragment) [20] | Significantly higher (e.g., 185 for HC fragment) [20] |
| Sample Preparation | Direct analysis | Direct analysis, no labeling required |
| Low-Level Impurity Quantitation | Baseline noise interference [20] | Enables quantitation down to 0.01% [41] |
| Labeling Required | No | No |
The quantitative performance of multi-capillary systems in purity analysis demonstrates exceptional precision. An intermediate precision study on the BioPhase 8800 system with NFD showed excellent intra-capillary and inter-capillary reproducibility, with %RSD < 0.1% for relative migration time and < 0.4% for corrected peak area percentage of the heavy chain [20]. This level of precision meets the rigorous requirements for analytical methods supporting manufacturing and quality control.
Experimental Protocols: Methodologies for High-Throughput Analysis
CE-SDS Method for Purity and Impurity Analysis
The following detailed methodology has been adapted from validated protocols used for comparative studies between single and multi-capillary systems [16] [20] [21]:
Sample Preparation:
- Dilute antibody samples to 1.0 mg/mL with SDS sample buffer [3].
- For non-reduced samples: Add 40 μL of iodoacetamide (IAM) working solution to 720 μL of CE-SDS sample buffer and 80 μL of antibody (10 mg/mL) [20]. Heat at 70°C for 10 minutes [3] [20].
- For reduced samples: Combine 950 μL of IgG with 50 μL of β-mercaptoethanol and 100 μL of 10 kDa internal standard. Vortex, centrifuge at 2,500 g, and heat denature at 70°C for 10 minutes [20].
- Cool samples to room temperature before analysis.
Instrumental Conditions:
- System: BioPhase 8800 multi-capillary system with 8 capillaries [41] [16].
- Capillary: Bare fused silica cartridge, 8 × 30 cm [20].
- Detection: Native fluorescence detection with 350 nm filter or UV detection at 220 nm [41] [20].
- Temperature: 25°C for both sample storage compartment and separation cartridge [20].
- Injection: Electrokinetic injection at 5 kV for 20 seconds or pressure injection [3].
- Separation: Electric field of 500 V/cm for 35 minutes [3].
Data Analysis:
- Use instrument software for peak identification and quantification.
- Report protein variant levels as corrected peak area percentage (CPA%) [20].
- Identify fragments based on relative migration compared to internal standards [3].
This method has been validated according to ICH Q2(R2) guidelines, demonstrating specificity, linearity (R² = 0.99), accuracy (85-128%), precision (repeatability RSD < 2.4%, intermediate precision RSD < 2.2%), and robustness for both non-reduced and reduced CE-SDS analyses [21].
Forced Degradation Study Protocol
Forced degradation studies are critical for identifying potential degradation pathways of monoclonal antibodies and evaluating the stability-indicating capability of analytical methods [21]. The following protocol has been used in comparability assessments:
Thermal Stress Conditions:
- Prepare samples of biosimilar and originator products.
- Incubate samples at 37°C and 50°C for 3, 7, and 14 days to represent physiologically relevant and accelerated stress conditions [21].
- Include unstressed controls stored at recommended conditions.
Analysis:
- Analyze stressed samples and controls using the CE-SDS method described above.
- Perform analysis under both non-reducing and reducing conditions to evaluate different aspects of degradation [21].
- Complement with orthogonal methods such as size-exclusion ultra-performance liquid chromatography (SE-UPLC) and liquid chromatography-tandem mass spectrometry (LC-MS/MS) for comprehensive characterization [21].
Data Interpretation:
- Under non-reduced conditions: Monitor decreases in intact antibody and increases in low-molecular-weight (LMW) fragments [21].
- Under reduced conditions: Monitor decreases in light and heavy chain content and increases in total impurities [21].
- Use statistical analysis to compare degradation profiles across different products and conditions.
This approach has demonstrated that the degradation profiles of biosimilar and originator mAbs were highly comparable under thermal stress, with no significant qualitative differences detected when analyzed using validated CE-SDS methods [21].
Visualization of Workflows and System Components
High-Throughput CE-SDS Workflow
The following diagram illustrates the integrated workflow for high-throughput purity analysis using multi-capillary CE-SDS systems:
High-Throughput CE-SDS Workflow
Detection Technology Comparison
The selection of detection methodology significantly impacts assay sensitivity and data quality. The following diagram illustrates the key detection technologies available in modern multi-capillary systems:
Detection Technology Comparison
Research Reagent Solutions for CE-SDS Analysis
Successful implementation of high-throughput CE-SDS methods requires specific reagents and consumables optimized for multi-capillary systems. The following table details essential materials and their functions based on established experimental protocols:
Table 3: Essential Research Reagents and Consumables
| Reagent/Consumable | Function | Application Notes |
|---|---|---|
| BioPhase CE-SDS Protein Analysis Kit [20] | Complete reagent set for CE-SDS analysis | Ensures consistency and overall data reproducibility |
| BioPhase BFS Capillary Cartridge - 8 × 30 cm [20] | Multi-capillary array for separation | Factory-built cartridges reduce user error and ensure performance |
| BioPhase Sample and Reagent Plates [20] | Specialized plates for sample loading | Optimized for compatibility with multi-capillary systems |
| Iodoacetamide (IAM) [20] | Alkylating agent for non-reduced analysis | Prevents reformation of disulfide bonds; prepare fresh daily |
| β-mercaptoethanol (β-ME) [20] | Reducing agent for reduced CE-SDS | Breaks disulfide bonds for subunit analysis |
| Lysozyme [20] | Internal standard for system suitability | Used for low-level impurity detection studies |
| NISTmAb Reference Material [20] | Standardized antibody for method qualification | Provides benchmark for system performance and data comparability |
Multi-capillary CE-SDS systems represent a significant advancement in analytical technology for biopharmaceutical manufacturing support. The demonstrated 8-fold throughput improvement over single-capillary systems, combined with excellent precision and advanced detection capabilities, positions these instruments as essential tools for modern biotherapeutic development [16]. The compatibility of data between established systems and new multi-capillary platforms facilitates straightforward method transfer and implementation [16].
The integration of native fluorescence detection provides particular value for manufacturing support applications, offering enhanced sensitivity for low-level impurity detection without the need for time-consuming sample derivatization [41] [20]. This capability is crucial for monitoring product-related impurities that may impact drug safety and efficacy.
For researchers supporting biomanufacturing operations, multi-capillary CE-SDS systems enable comprehensive characterization strategies that were previously impractical due to throughput limitations. The ability to perform rigorous DoE studies, accelerated stability testing, and multi-attribute monitoring within feasible timelines represents a transformative capability for ensuring product quality throughout the development lifecycle and commercial manufacturing [16]. As biotherapeutic modalities continue to increase in complexity, these high-throughput analytical platforms will play an increasingly vital role in ensuring the quality, safety, and efficacy of biological products.
Advanced Strategies: Overcoming Challenges and Optimizing CE-SDS Methods
For decades, sodium dodecyl sulfate-polyacrylamide gel electrophoresis (SDS-PAGE) has been a cornerstone technique for assessing protein purity and molecular weight in biopharmaceutical development [3]. The technique relies on SDS to denature proteins and impart a uniform negative charge, allowing separation based primarily on molecular size as proteins migrate through a polyacrylamide gel matrix [3]. However, SDS-PAGE suffers from several limitations including manual operation, long analysis times, and inadequate quantification capabilities [31]. These limitations have driven the adoption of capillary electrophoresis SDS (CE-SDS), an automated, quantitative approach that offers superior resolution and reproducibility [3] [42].
Within this transition, sample preparation has emerged as a critical factor influencing analytical accuracy, particularly regarding buffer pH. Traditional sample preparation for CE-SDS often employed alkaline conditions (pH 9.0), which unfortunately induces fragmentation artifacts that misrepresent the true integrity of monoclonal antibody (mAb) products [31] [42]. This guide examines how optimizing buffer pH to slightly acidic conditions (pH 6.0-6.5) significantly reduces these artifacts, providing more accurate purity assessments for biotherapeutic development.
The Fragmentation Artifact Challenge in CE-SDS Analysis
Understanding Artifact Generation
Fragmentation artifacts are artificial fragments generated during sample preparation rather than actual product-related impurities. These artifacts predominantly form when non-reduced mAb samples are heated in SDS-containing buffers at traditional alkaline pH (e.g., pH 9.0) [31] [42]. The combination of high temperature and pH induces disulfide bond scrambling and peptide backbone cleavage through beta-elimination reactions, creating fragments that do not reflect the true stability or composition of the therapeutic protein [43].
This artifact generation has significant consequences for product characterization. It leads to:
- Overestimation of impurity levels, potentially triggering unnecessary investigation or rejection of product batches
- Masking of true degradation profiles, complicating stability assessment
- Reduced accuracy in purity quantification, affecting product release decisions
Comparative Limitations of SDS-PAGE
While SDS-PAGE is less susceptible to specific pH-induced artifacts due to its different matrix system, it suffers from substantial limitations in resolution and quantification [3]. SDS-PAGE cannot reliably detect nonglycosylated IgG variants—a significant functional consideration for therapeutic antibodies—whereas CE-SDS readily separates these species [3]. Additionally, the signal-to-noise ratio for impurity detection is markedly lower in SDS-PAGE, making accurate quantification of minor fragments challenging [3].
Table 1: Fundamental Differences Between SDS-PAGE and CE-SDS
| Parameter | SDS-PAGE | CE-SDS |
|---|---|---|
| Resolution | Moderate | High |
| Quantitation | Semi-quantitative | Fully quantitative |
| Detection of Nonglycosylated IgG | Not resolved | Easily detected |
| Automation | Manual | Fully automated |
| Analysis Time | 2-3 hours | ~35 minutes |
| Sample Throughput | Low | High |
| Data Reproducibility | Moderate (10-20% RSD) | High (<2% RSD) |
Buffer pH Optimization: Mechanisms and Experimental Evidence
pH-Dependent Fragmentation Mechanisms
The molecular mechanisms underlying pH-dependent fragmentation involve several pathways:
- Disulfide Bond Scrambling: Under alkaline conditions (pH >8.0), thiol-disulfide exchange reactions are accelerated, leading to non-native disulfide arrangements and fragment generation [42].
- Peptide Bond Hydrolysis: Acidic and alkaline conditions both accelerate peptide bond hydrolysis, with minimal rates observed between pH 5-6 [43].
- Beta-Elimination: At high pH, cysteine and serine residues undergo beta-elimination reactions that cleave the protein backbone [43].
- Aspartic Acid Isomerization and Cleavage: Acidic conditions promote cleavage at aspartic acid residues, particularly Asp-Pro sequences [43].
These mechanisms collectively contribute to artifactual fragmentation, with their relative contributions depending on the specific pH conditions and primary sequence of the antibody.
Key Experimental Studies Demonstrating pH Effects
Several systematic studies have quantified the impact of buffer pH on fragmentation artifacts:
Dong and Kang directly compared CE-SDS with SDS-PAGE for analyzing IgG samples, demonstrating that CE-SDS provided superior resolution for detecting purity variants but highlighted the critical importance of sample preparation conditions [3]. In method development studies, researchers observed that thermally induced fragmentation of non-reduced mAbs was "greatly decreased" under slightly acidic conditions (pH 5.5-6.5) compared to traditional alkaline buffers [31]. This finding prompted the replacement of the original Beckman sample buffer (pH 9.0) with a citrate-phosphate buffer at pH 6.5 for sample preparation [31].
Genentech researchers systematically optimized CE-SDS sample preparation to suppress artifactual fragmentation [42]. Their studies demonstrated that adjusting sample buffer to pH 6.5, combined with optimized incubation temperature and alkylating agent concentration, significantly reduced fragmentation artifacts. The corrected percentage peak area (%CPA) of the intact antibody increased from 90.0% to 98.5% when using the optimized conditions compared to traditional preparation methods [42].
Table 2: Quantitative Impact of Sample Preparation Conditions on Fragmentation
| Preparation Condition | Buffer pH | Incubation Conditions | Alkylating Agent | Intact Antibody (%) | Artifactual Fragments (%) |
|---|---|---|---|---|---|
| Traditional | 9.0 | 90°C, 5 min | None | 90.0 | 10.0 |
| Optimized | 6.5 | 70°C, 5 min | 40 mM IAM | 98.5 | 1.5 |
| Acidic Buffer | 6.0 | 70°C, 5 min | 40 mM IAM | 98.2 | 1.8 |
| Mildly Acidic | 6.5 | 65°C, 5 min | 25 mM IAM | 97.8 | 2.2 |
A patent application further supports these findings, disclosing that MES/SDS buffer at pH 6.3-6.7 "obviously reduce[s] the generation of artificial fragment peaks" compared to traditional Tris-HCl SDS buffer at pH 9.0 [44]. This optimized buffer formulation enables accurate CE-SDS analysis by minimizing heat-induced artifacts during protein denaturation.
Optimized CE-SDS Protocol for mAb Analysis
Recommended Reagents and Materials
Table 3: Essential Research Reagents for CE-SDS Analysis
| Reagent/Material | Specification | Function | Optimized Condition |
|---|---|---|---|
| Sample Buffer | Citrate-phosphate or MES | Provides buffering capacity | pH 6.3-6.5 |
| Alkylating Agent | Iodoacetamide (IAM) | Blocks free thiols | 25-40 mM |
| Reducing Agent | 2-Mercaptoethanol or DTT | Reduces disulfide bonds | For reduced analyses only |
| SDS | Electrophoresis grade | Protein denaturation & charge | 1% (w/v) |
| Incubation Conditions | Temperature-controlled block | Protein denaturation | 65-70°C for 5 min |
| Capillary | Bare fused silica | Separation channel | 50 μm ID, ~50 cm length |
Step-by-Step Methodology
Based on the optimized parameters from multiple studies [31] [42] [21], the following protocol is recommended for non-reduced CE-SDS analysis of mAbs:
Sample Preparation:
- Dilute the mAb sample to 1-2 mg/mL using deionized water.
- Prepare sample buffer: 86 mM citrate-phosphate buffer, pH 6.5, containing 1% SDS.
- Combine 70 μL sample buffer, 25 μL diluted mAb sample, and 5 μL of 0.25 M iodoacetamide (40 mM final concentration).
Denaturation and Alkylation:
- Mix the sample thoroughly by vortexing.
- Incubate at 70°C for 5 minutes in a controlled temperature block.
- Cool the sample to room temperature.
CE-SDS Analysis:
- Inject samples into the capillary electrophoresis system (e.g., Beckman PA 800 plus or Bio-Techne Maurice).
- Apply separation voltage of 500 V/cm for 30-35 minutes.
- Detect using UV absorbance at 220 nm.
Data Analysis:
- Identify peaks based on migration time compared to standards.
- Quantify percent area for each species.
- Report main peak (intact mAb) and impurity peaks (fragments).
For reduced CE-SDS, add 10 μL of 5-fold diluted 2-mercaptoethanol instead of IAM and follow similar incubation conditions [31].
Comparative Performance: Optimized CE-SDS vs. Alternatives
Quantitative Comparison of Method Performance
The effectiveness of pH-optimized CE-SDS is evident when comparing its performance metrics with traditional CE-SDS and SDS-PAGE:
Table 4: Comprehensive Method Comparison for mAb Purity Analysis
| Performance Metric | SDS-PAGE | Traditional CE-SDS (pH 9.0) | Optimized CE-SDS (pH 6.5) |
|---|---|---|---|
| Intact mAb Recovery | Not reliably quantifiable | 90.0% | 98.5% |
| Artifactual Fragments | Variable | ~10% | <2% |
| Repeatability (RSD) | 10-20% | 3-5% | 0.1-0.6% |
| Intermediate Precision | 15-25% | 5-8% | 0.5-2.4% |
| Detection of NGHC | No | Yes | Yes |
| Analysis Time | 2-3 hours + staining | 40 minutes | 40 minutes |
| Automation Potential | Low | High | High |
| Regulatory Acceptance | Established | Increasing | Recommended |
Application in Forced Degradation Studies
Recent studies applying optimized CE-SDS methods demonstrate their value in forced degradation assessments. Research published in 2025 utilized validated CE-SDS methods to compare degradation profiles of biosimilar and originator mAbs under thermal stress [21]. The methods successfully detected time- and temperature-dependent fragmentation, providing crucial data for biosimilarity assessments. The study further confirmed that nrCE-SDS and rCE-SDS offer complementary information for comprehensive characterization of fragmentation and aggregation profiles [21].
Implications for Biopharmaceutical Development
The optimization of buffer pH in CE-SDS sample preparation represents a significant advancement in analytical accuracy for biopharmaceutical development. The implementation of slightly acidic buffers (pH 6.0-6.5) provides substantial benefits:
- More Accurate Purity Measurements: By reducing artifactual fragments from ~10% to <2%, developers obtain a truer representation of product quality [31] [42].
- Improved Stability Assessment: Accurate fragmentation profiles enable better prediction of shelf life and identification of actual degradation pathways.
- Enhanced Comparability Studies: The high precision and accuracy of optimized CE-SDS methods (RSD <2.4%) make them ideal for demonstrating analytical similarity in biosimilar development [21].
- Robust Quality Control: Transfer of methods to QC laboratories is facilitated by the improved robustness and reduced variability of pH-optimized methods.
While CE-SDS with optimized sample preparation provides superior quantification of antibody fragments, it should be viewed as complementary to SDS-PAGE rather than a complete replacement. SDS-PAGE remains valuable for initial screening and educational applications, while CE-SDS delivers the precision and accuracy required for regulatory filings and product release [3] [45].
Buffer pH represents a critical parameter in CE-SDS sample preparation that directly impacts the accuracy of mAb purity analysis. The optimization from traditional alkaline buffers (pH 9.0) to slightly acidic conditions (pH 6.0-6.5) significantly reduces thermally induced fragmentation artifacts, enabling more accurate quantification of product-related impurities. When combined with appropriate alkylating agents and controlled incubation conditions, pH-optimized CE-SDS provides superior resolution, reproducibility, and accuracy compared to both traditional CE-SDS and SDS-PAGE methodologies. As the biopharmaceutical industry continues to advance, this optimized approach supports more reliable characterization of therapeutic antibodies, ultimately contributing to the development of safer and more effective biologic medicines.
In the analysis of therapeutic monoclonal antibodies (mAbs), ensuring sample integrity during preparation is a paramount concern for researchers and drug development professionals. A central challenge lies in controlling the thiol-disulfide exchange, a fundamental chemical process that can inadvertently alter the native structure of protein biologics during analytical testing. This exchange reaction, if unmanaged, leads to the generation of artifactual fragments and impurities, compromising the accuracy of purity and stability assessments. Within the broader context of comparing SDS-PAGE and capillary electrophoresis CE-SDS for antibody purity research, sample preparation emerges as a critical differentiator. This guide objectively compares the application of alkylating agents and acidic buffers as two pivotal tools to quench this exchange. We will provide supporting experimental data to demonstrate how these strategies, particularly when used in CE-SDS, enhance the fidelity of analytical results by preserving the native state of the antibody throughout the sample preparation process.
The Core Challenge: Thiol-Disulfide Exchange in Sample Preparation
The thiol-disulfide exchange is a nucleophilic substitution reaction where a thiolate anion attacks a disulfide bond, leading to the scrambling of disulfide pairings [46]. Under the slightly basic conditions (pH ~9.0) found in many traditional sample buffers for SDS-PAGE and CE-SDS, this reaction is highly favored. The reactivity of the sulfhydryl group is dominated by its deprotonated form (thiolate), and the fraction of thiol in this reactive form increases as the pH approaches or exceeds its pKa [46]. For biological thiols, this can lead to significant artifactual fragmentation and the formation of non-native structures during the heat-denaturation step that precedes electrophoresis.
Figure 1: The pathway to analytical artifacts in antibody purity analysis. Under basic buffer conditions and heat, the native IgG is prone to thiol-disulfide exchange, generating artifactual fragments that distort the purity profile. The solution involves using acidic buffers and alkylating agents to control this process.
In therapeutic antibody development, this is particularly problematic as it becomes difficult to distinguish between true product-related impurities and process-induced artifacts. Data obtained under these conditions may not accurately reflect the product's actual stability and purity, leading to challenges in quality control and batch release.
Systematic Evaluation of Alkylating Agents
Alkylation is a critical step following the reduction of disulfide bonds in bottom-up proteomics and protein analysis. Its purpose is to permanently block free cysteine thiols, preventing their re-oxidation or participation in disulfide scrambling. The choice of alkylating agent directly impacts the completeness of alkylation and the minimization of side reactions.
Mechanism and Comparison of Common Reagents
A systematic evaluation using digested peptides from a yeast whole-cell lysate revealed dramatic differences in the performance of common alkylating reagents [47]. While the number of proteins and peptides identified was similar across different reducing reagents, the results for alkylating agents varied significantly.
- Iodoacetamide (IAA): This reagent operates through a bimolecular nucleophilic substitution (SN2) mechanism. The study found IAA yielded the highest number of peptides with alkylated cysteine and the lowest number of peptides with incomplete alkylation or side reactions [47].
- N-Ethylmaleimide (NEM): NEM functions via a Michael addition mechanism. A key advantage is its rapid reaction with thiols at neutral or slightly acidic pH, with rate constants 3-4 orders of magnitude faster than iodoacetamide under comparable conditions [46]. However, a potential drawback is that the adducts can be subject to base-catalyzed reverse Michael reactions, potentially leading to migration of the label between thiol targets [46].
- Acrylamide (AA): Also a Michael acceptor, acrylamide is used for alkylation but was shown to be less effective than IAA in the comparative study [47].
- 4-Vinylpyridine (4-VP): This reagent reacts with thiols at the double bond but reacts more than 500-fold slower than NEM, often requiring high concentrations and long reaction times for complete reaction [46].
Table 1: Comparison of Common Alkylating Reagents for Cysteine Modification
| Alkylating Reagent | Mechanism | Key Advantages | Key Disadvantages/Limitations | Reported Performance in Cysteine Alkylation |
|---|---|---|---|---|
| Iodoacetamide (IAA) | SN2 | High alkylation completeness; low side reactions [47] | Can modify other nucleophilic side chains (e.g., Lys) at high pH [46] | Best - Highest peptides with alkylated Cys [47] |
| N-Ethylmaleimide (NEM) | Michael Addition | Very fast reaction at neutral/acidic pH [46] | Adducts can be unstable, leading to label migration [46] | Not the best in direct comparison [47] |
| Acrylamide (AA) | Michael Addition | Common availability | Less effective than IAA [47] | Lower than IAA [47] |
| 4-Vinylpyridine (4-VP) | Michael Addition | - | Very slow reaction kinetics [46] | Not the best in direct comparison [47] |
Optimized Protocol for Iodoacetamide Alkylation
Based on the systematic evaluation, iodoacetamide is recommended as the superior alkylating reagent. The following protocol can be employed for effective and controlled alkylation:
- Following reduction (e.g., with 5 mM DTT at 56°C for 25 minutes), cool the sample to room temperature [47].
- Add iodoacetamide to the sample from a fresh, concentrated stock solution to achieve a final concentration of 14 mM [47]. Optimization experiments suggest this concentration provides a good balance of completeness and minimized side-reactions.
- Incubate the reaction in the dark at room temperature for 30 minutes [47]. The absence of light prevents the decomposition of iodoacetamide.
- Quench the reaction by adding a reducing agent (e.g., DTT) to consume any remaining IAA [47].
The Role of Acidic Buffers in Controlling Artifacts
While alkylation is effective, it is typically performed after reduction. For analyses run under non-reducing conditions, another strategy is needed to prevent disulfide scrambling during sample denaturation. Here, the use of acidic buffers provides a powerful solution.
Experimental Evidence and pH Optimization
Research has demonstrated that the pH of the sample buffer profoundly impacts the stability of antibodies during the heat-denaturation step prior to CE-SDS analysis. One study found that under slightly acidic conditions (pH 5.5–6.5), thermally induced fragmentation of non-reduced mAbs was greatly decreased [34]. Consequently, the authors optimized their method using a citrate-phosphate buffer at pH 6.5 instead of a traditional basic buffer (pH 9.0) [34].
A separate technical note from SCIEX provides further validation. Comparing their SDS-MW sample buffer (pH 9.0) with a low pH SDS sample buffer (pH 6.8), they analyzed several mAbs under alkylating and non-reducing conditions [6]. The results were striking: for the antibody drozitumab, sample preparation with the pH 6.8 buffer resulted in a main peak purity of 99.0%, with the primary impurity (HHL) at 0.9%. In contrast, preparation with the pH 9.0 buffer showed significant artifactual reduction, with the HHL impurity rising to 12.3% and the main peak purity dropping to 82.3% [6]. This clearly shows that a basic pH highly favors thiol-disulfide exchange, leading to overestimation of impurities.
Optimized Protocol for Low-pH CE-SDS Sample Preparation
The following protocol, adapted from published methods, is recommended for non-reduced purity analysis of mAbs using CE-SDS to minimize artifacts:
- Prepare a 500 µM solution of iodoacetamide (IAM) in distilled water. This can be stored at 4°C for short periods [6].
- To 50 µL of mAb sample (at ~1 mg/mL), add 5 µL of the prepared IAM solution and 45 µL of a low pH SDS sample buffer (e.g., pH 6.8) [6]. The alkylating agent IAM is used here to cap any free thiols, while the acidic buffer suppresses thiol-disulfide exchange.
- Mix the solution briefly by vortexing and pulse-centrifuge to collect the contents at the bottom of the tube.
- Incubate the sample at 70°C for 5 minutes in a thermal cycler or heat block to denature the protein [6].
- Allow the sample to cool to room temperature for at least 10 minutes before analysis on the CE-SDS system.
Integrated Workflow for Accurate Purity Analysis
The combined use of alkylating agents and acidic buffers creates a robust defense against thiol-disulfide exchange during sample preparation for CE-SDS. The synergistic effect of these strategies ensures that the analytical data reflects the true purity of the product, rather than preparation-induced artifacts.
Figure 2: An integrated workflow for accurate antibody purity analysis. Incorporating both an alkylating agent and an acidic sample buffer before heat denaturation and CE-SDS analysis effectively suppresses thiol-disulfide exchange, leading to a final purity profile that is a faithful representation of the sample.
The transition from SDS-PAGE to CE-SDS as the industry standard for purity analysis brings benefits of automation, quantitation, and resolution [3] [48]. However, this transition also necessitates a refined approach to sample preparation. The high-resolution power of CE-SDS can reveal impurities that were once masked by the poor resolution of SDS-PAGE, making the control of pre-analytical variables even more critical.
The Scientist's Toolkit: Essential Reagents for Controlled Analysis
Table 2: Key Research Reagent Solutions for Controlling Thiol-Disulfide Exchange
| Reagent / Solution | Function & Mechanism | Key Consideration for Use |
|---|---|---|
| Iodoacetamide (IAM) | Alkylating agent; permanently blocks free thiols via SN2 reaction to prevent disulfide scrambling [47]. | Prepare fresh; protect from light during reaction; optimize concentration (e.g., 14 mM) [47]. |
| N-Ethylmaleimide (NEM) | Alkylating agent; rapidly blocks thiols via Michael addition, effective at neutral-acidic pH [46]. | Be aware of potential adduct instability (reverse reaction) at basic pH [46]. |
| Low pH SDS Sample Buffer (pH ~6.8) | Suppresses thiol-disulfide exchange by protonating cysteine thiolates, shifting equilibrium away from the reactive nucleophile [34] [6]. | Replaces traditional basic buffers; crucial for non-reduced sample preparation to minimize heat-induced artifacts [6]. |
| Tris(2-carboxyethyl)phosphine (TCEP) | Reducing agent; directly reduces disulfide bonds to thiols, is air-stable and effective at low pH [47]. | Often used instead of DTT for more robust and rapid reduction. |
| Capillary Gel Electrophoresis System | Automated instrumentation (e.g., BioPhase 8800, PA 800 plus) that performs high-resolution CE-SDS separation with UV detection [6] [34]. | Provides quantitative, reproducible data superior to traditional SDS-PAGE for purity analysis [3] [48]. |
Within the critical field of antibody purity analysis, controlling the thiol-disulfide exchange is not merely a technical detail but a fundamental requirement for data integrity. The experimental data presented in this guide consistently demonstrates that:
- The choice of alkylating agent is crucial, with iodoacetamide providing the most complete cysteine modification and minimal side reactions.
- The pH of the sample buffer is a powerful lever; switching from a basic (pH 9.0) to a slightly acidic (pH 6.5-6.8) buffer dramatically reduces artifactual fragmentation in non-reduced samples. By systematically implementing these strategies—either individually or in combination—within the CE-SDS workflow, scientists and drug development professionals can achieve a more accurate and reliable assessment of therapeutic antibody purity, ultimately supporting the development of safer and more effective biopharmaceuticals.
In the biopharmaceutical industry, the accuracy of antibody purity analysis hinges on the complete denaturation of protein samples. The incubation step—defined by its temperature and duration—is a critical foundational procedure that ensures sodium dodecyl sulfate (SDS) can effectively bind to and linearize protein molecules, allowing subsequent separation by size to be accurate and reliable. This guide provides a detailed, data-driven comparison of incubation parameter optimization between traditional SDS-Polyacrylamide Gel Electrophoresis (SDS-PAGE) and the increasingly automated Capillary Electrophoresis-SDS (CE-SDS) method. For researchers and drug development professionals, selecting the appropriate denaturation protocol directly impacts the resolution of critical quality attributes, such as antibody fragments and aggregates, which can influence therapeutic efficacy and safety [21] [9].
Experimental Protocols for Denaturation
CE-SDS Denaturation Protocol
The following protocol is representative of methods used for the analysis of monoclonal antibodies (mAbs) under both non-reduced and reduced conditions, as applied in recent biosimilarity assessments [21].
- Sample Preparation: Antibody samples, such as a biosimilar anti-VEGF mAb and its originator counterparts, are diluted to a target concentration of 10.0 mg/mL using a compatible sample buffer, typically containing SDS [21].
- Denaturation and Reduction (for rCE-SDS): For reduced CE-SDS analysis, the sample solution is mixed with a reducing agent, commonly 2-mercaptoethanol (BME), to break disulfide bonds. The specific concentration of BME is a variable optimized during method development [21].
- Incubation: The prepared samples are heated at a high temperature, typically 70°C for 3-10 minutes, to achieve complete denaturation. The PA 800 Plus system protocol, for instance, specifies heating at 70°C for three minutes before injection [3].
- Analysis: After cooling to room temperature, the samples are injected into the capillary system and separated under an electric field, with detection often at 220 nm [3].
SDS-PAGE Denaturation Protocol
Traditional SDS-PAGE remains a widely used technique, though its protocols can be more variable and less automated.
- Sample Preparation: A protein sample, such as a human IgG antibody, is diluted to 0.2 mg/mL with water and then further diluted with a sample buffer (e.g., 4x LDS sample buffer) [3].
- Denaturation and Reduction: The sample buffer contains SDS and often a reducing agent. The mixture is vortexed to ensure homogeneity.
- Incubation: The sample is heated, often at 70°C for 10 minutes or as specified by the gel manufacturer, to denature the proteins [3].
- Analysis: The denatured samples are loaded onto a pre-cast gel (e.g., 4–12% Bis-Tris gel) and separated by electrophoresis. The gel is then stained (e.g., with GelCode Blue stain) to visualize the protein bands [3].
Comparative Data on Incubation Parameters
The table below summarizes standard and optimized incubation parameters for both techniques, synthesizing data from industry and research applications.
Table 1: Comparison of Standard Incubation Parameters for Protein Denaturation
| Parameter | CE-SDS | SDS-PAGE |
|---|---|---|
| Typical Sample Concentration | 1.0 - 10.0 mg/mL [21] [3] | ~0.15 - 0.2 mg/mL [3] |
| Standard Incubation Temperature | 70°C - 100°C [3] [5] | 70°C - 100°C [3] [49] |
| Standard Incubation Duration | 3 - 10 minutes [3] [5] | 5 - 10 minutes [3] |
| Impact of Incomplete Denaturation | Altered migration, inaccurate quantitation of fragments/aggregates [21] | Poor band resolution, smearing, inaccurate molecular weight estimation [3] |
Advanced Optimization and Forced Degradation Studies
Beyond standard protocols, forced degradation studies provide a context for understanding the impact of longer, stressful incubation on antibody integrity. One study investigating the thermal stability of biosimilar mAbs incubated samples at 37°C and 50°C for extended periods of 3, 7, and 14 days to simulate long-term and accelerated stability scenarios [21]. These conditions are not used for sample prep but demonstrate that temperature and time are critical stress factors that directly induce fragmentation and aggregation, which must be accurately monitored by techniques like CE-SDS [21].
Furthermore, an emerging technique called denaturing Mass Photometry (dMP) has developed a robust 2-step denaturation protocol using urea or guanidine hydrochloride (GdnHCl) that achieves 95% irreversible denaturation within just 5 minutes at room temperature [50]. This highlights a trend toward rapid and highly efficient denaturation methods that could influence future best practices.
The Scientist's Toolkit: Key Research Reagent Solutions
The following table details essential reagents and their functions in the sample denaturation process for both CE-SDS and SDS-PAGE.
Table 2: Essential Reagents for Protein Denaturation and Analysis
| Reagent | Function | Application in CE-SDS / SDS-PAGE |
|---|---|---|
| Sodium Dodecyl Sulfate (SDS) | Anionic detergent that binds to and denatures proteins, imparting a uniform negative charge and unfolding the structure [3] [9]. | Universal for both techniques. |
| 2-Mercaptoethanol (BME) / Dithiothreitol (DTT) | Reducing agents that cleave disulfide bonds between cysteine residues, fully dissociating protein subunits [21] [5]. | Used in reduced (rCE-SDS) and reduced SDS-PAGE analysis. |
| Iodoacetamide (IAM) | Alkylating agent used to cap free cysteine thiols after reduction, preventing reformation of disulfide bonds [21] [26]. | Often used in non-reduced (nrCE-SDS) methods to alkylate samples before analysis [21]. |
| SDS-MW Gel Buffer / Sieving Matrix | A replaceable gel buffer (e.g., borate cross-linked dextran) that acts as a molecular sieve, enabling size-based separation in the capillary [5]. | Specific to CE-SDS. |
| Tris-based Sample Buffer | Provides the appropriate pH (typically alkaline, e.g., pH 9.0) for the denaturation reaction and subsequent electrophoresis [5]. | Universal for both techniques. |
Workflow and Impact of Denaturation
The following diagram illustrates the critical role of the incubation step within the broader experimental workflow for antibody purity analysis, and how its optimization directly impacts the final results.
Fine-tuning incubation parameters is not a mere procedural formality but a critical determinant for success in antibody purity analysis. While both CE-SDS and SDS-PAGE rely on the fundamental principle of heat-induced denaturation in the presence of SDS, the move toward standardized, shorter, and higher-temperature incubation protocols (e.g., 70°C for 3-10 minutes) in CE-SDS enhances its robustness, reproducibility, and quantitative capability compared to the more variable SDS-PAGE. As the biopharmaceutical industry continues to demand higher-resolution analytics for novel modalities like bispecific antibodies and antibody-drug conjugates, the precise control offered by CE-SDS, extendable even to temperature-driven resolution tuning of the separation itself [5], makes it the superior platform for modern drug development and quality control.
In the development and quality control of monoclonal antibody (mAb) biopharmaceuticals, purity analysis is paramount for ensuring product safety and efficacy. Sodium dodecyl sulfate-polyacrylamide gel electrophoresis (SDS-PAGE) has traditionally been the standard technique for monitoring manufacturing consistency and determining protein molecular weight. However, capillary electrophoresis sodium dodecyl sulfate (CE-SDS) has emerged as a powerful alternative, offering superior automation, reproducibility, and quantitative capabilities [3] [32]. This guide provides an objective comparison of these two techniques, focusing on troubleshooting three common analytical issues: poor resolution, peak tailing, and irreproducible migration. Understanding the root causes of these problems and their solutions in both platforms enables researchers to select the optimal method for their specific application and ensure reliable characterization of therapeutic proteins.
Technical Comparison of CE-SDS and SDS-PAGE
Fundamental Principles and Workflows
SDS-PAGE separates proteins based on their molecular weight through a cross-linked polyacrylamide gel matrix. Proteins are denatured and coated with SDS, imparting a uniform negative charge. When an electric field is applied, proteins migrate through the gel pores at rates inversely proportional to their size. The process involves gel casting, sample loading, electrophoresis, and post-staining for visualization [3]. CE-SDS also separates SDS-coated proteins by molecular weight but utilizes a capillary format with a replaceable sieving polymer matrix. Proteins are injected into the capillary and separated under high voltage, with on-column UV detection near the distal end. This format eliminates the need for staining and destaining, enabling full automation and direct quantification [3] [21].
Direct Performance Comparison
Comparative studies reveal significant differences in performance attributes between the two techniques.
Table 1: Direct Performance Comparison between SDS-PAGE and CE-SDS
| Performance Attribute | SDS-PAGE | CE-SDS |
|---|---|---|
| Resolution | Moderate; sufficient for major bands [3] | Superior; high-resolution separation of fragments and variants [3] |
| Quantitation | Semi-quantitative via band intensity; limited dynamic range [3] | Fully quantitative with high accuracy; linear response [21] [32] |
| Reproducibility | Moderate to low (RSD ~5-10%); manual steps introduce variability [3] | High (RSD <2% for migration, <5% peak area); automated process [39] [16] |
| Sensitivity | Limited by staining sensitivity [51] | Enhanced signal-to-noise ratio; low UV detection [3] |
| Throughput | Low; manual processing limits number of runs [32] | High; automated with 8-fold higher throughput capabilities [16] |
| Data Output | Band patterns on a gel [3] | Electropherograms with peaks for easy integration [3] |
| Glycoprotein Analysis | Standard performance [52] | Complex migration; reduced mobility vs. SDS-PAGE [52] |
A key application is the analysis of antibody fragments. In one study, CE-SDS easily detected and quantified nonglycosylated IgG, a species that SDS-PAGE could not resolve, which is critical as glycosylation significantly impacts antibody function [3]. Furthermore, when analyzing a heat-stressed antibody, the signal-to-noise ratio for impurity bands was significantly lower in SDS-PAGE scans compared to the corresponding peaks in CE-SDS electropherograms, where autointegration was straightforward [3].
Troubleshooting Common Issues
Poor Resolution
Poor resolution results in blurred, overlapping bands or peaks, complicating accurate identification and quantification.
SDS-PAGE:
- Causes: Insufficient electrophoresis time, incorrect acrylamide concentration, improper running buffer preparation, or uneven gel casting [53] [51].
- Solutions: Ensure the gel is run until the dye front nears the bottom. For high molecular weight proteins, a longer run time or lower acrylamide percentage may be needed. Remake the running buffer if ion concentration is incorrect, as this disrupts current flow and pH [53].
CE-SDS:
- Context: CE-SDS generally provides superior resolution [3]. However, baseline disturbances or "humps" can sometimes impair quantification.
- Solutions: A novel approach using a tetrahydroxyborate cross-linked agarose matrix (SDS-CAGE) has been shown to effectively eliminate baseline humps, enabling rapid, high-resolution analysis of proteins across a wide molecular weight range [39].
Peak Tailing or Band Smiling
This issue manifests as curved bands ("smiling") in gels or tailing peaks in electropherograms.
SDS-PAGE (Band Smiling):
- Cause: Excessive heat generation during electrophoresis causes uneven gel expansion [53] [51].
- Solutions: Run the gel at a lower voltage for a longer duration. Perform electrophoresis in a cold room or use a cooled apparatus with ice packs to dissipate heat [53] [51].
CE-SDS (Peak Tailing):
- Cause: While less common, peak tailing can result from protein-protein interactions or overloading.
- Solutions: Optimize sample preparation, including heating time and temperature. Ensure the use of alkylating agents like iodoacetamide (IAM) in non-reduced CE-SDS to cap free thiols and prevent reformation of disulfide bonds during analysis, which can cause aggregation and tailing [21].
Irreproducible Migration
Inconsistent migration times or band positions between runs compromise data reliability and comparability.
SDS-PAGE:
- Causes: Variations in gel polymerization, buffer concentration and pH, and running temperature. The manual nature of gel casting and loading introduces significant variability [51].
- Solutions: Use fresh, properly prepared buffers and reagents. Ensure consistent gel casting practices. Pre-cast gels can improve consistency. Do not leave wells empty, as this causes an "edge effect" that distorts bands in peripheral lanes [53].
CE-SDS:
- Causes: Fluctuations in sample injection, capillary temperature, or buffer composition. Capillary aging or coating degradation can also contribute.
- Solutions: Employ rigorous system suitability tests. Use internal standards. Automated instruments like the BioPhase 8800 or PA800+ demonstrate high precision, with RSD for migration time below 0.3% and for peak area below 5% [39] [16]. Method validation ensures robustness across parameters like sample concentration, incubation time, and reagent concentrations [21].
Table 2: Summary of Troubleshooting Recommendations
| Issue | Technique | Root Cause | Corrective Action |
|---|---|---|---|
| Poor Resolution | SDS-PAGE | Short run time; Wrong gel %; Bad buffer [53] [51] | Increase run time; Optimize acrylamide %; Remake buffer [53] |
| CE-SDS | Baseline humps in standard matrices [39] | Use novel sieving matrix (e.g., borate-agarose) [39] | |
| Peak Tailing / Band Smiling | SDS-PAGE (Smiling) | Excessive heat generation [53] [51] | Lower voltage; Use cooling apparatus/ cold room [53] |
| CE-SDS (Tailing) | Protein interactions; Incomplete denaturation [21] | Optimize sample prep (heat, alkylation) [21] | |
| Irreproducible Migration | SDS-PAGE | Manual processes; Buffer/gel variability [51] | Use pre-cast gels; Fresh buffers; Standardize practice [53] [51] |
| CE-SDS | Injection fluctuations; Capillary condition [21] | System suitability tests; Internal standards; Automated platforms [39] [16] |
Experimental Protocols for Comparison
CE-SDS Protocol for mAb Purity
The following validated method is adapted from studies comparing mAb purity [3] [21]:
- Sample Preparation: Dilute the antibody sample to 1.0 mg/mL with SDS sample buffer. For non-reduced analysis, include 1-2% iodoacetamide (IAM) and heat at 70°C for 3-10 minutes. For reduced analysis, use 2-mercaptoethanol (BME) or dithiothreitol (DTT) as the reducing agent and heat at 70°C for 10 minutes [3] [21].
- Instrument Setup: Use a CE system (e.g., Beckman PA800+ or Sciex BioPhase 8800) with a bare fused-silica capillary. The capillary length can vary from 10 cm to 50 cm depending on the required resolution and throughput [3] [39].
- Separation: Hydrodynamically inject the sample (e.g., 5 kV for 20 seconds). Apply a separation voltage of 500 V/cm for approximately 35 minutes (shorter for high-throughput methods) using a commercial SDS-MW gel buffer [3] [16].
- Detection & Analysis: Detect proteins by UV absorbance at 220 nm. Identify species based on migration time relative to an SDS-MW standard and quantify using peak area percentages [3] [21].
SDS-PAGE Protocol for mAb Purity
This standard protocol highlights key steps that influence reproducibility and resolution [3] [53]:
- Gel Preparation: Use a pre-cast 4-12% Bis-Tris gradient gel or cast a gel manually with a stacking and resolving layer. Ensure complete polymerization [3] [51].
- Sample Preparation: Dilute the antibody to 0.2 mg/mL with water, then mix with 4x LDS sample buffer to a final concentration of 0.15 mg/mL. For reduced samples, include a reducing agent like DTT. Heat at 70°C for 10 minutes [3].
- Electrophoresis: Load the samples and molecular weight marker. Run the gel in a suitable running buffer (e.g., MES or MOPS) at a constant voltage of 150-200 V until the dye front reaches the bottom. Use cooling to minimize heat-related artifacts [3] [53].
- Staining & Visualization: After electrophoresis, stain the gel with Coomassie Blue or a more sensitive fluorescent stain. Destain if necessary. Image the gel and perform semi-quantitative analysis using densitometry software [3].
The Scientist's Toolkit: Essential Research Reagent Solutions
The following reagents and instruments are critical for successful electrophoresis analysis.
Table 3: Essential Research Reagent Solutions
| Item | Function/Application | Examples / Key Considerations |
|---|---|---|
| Reducing Agents (BME, DTT) | Breaks disulfide bonds for reduced analysis of heavy and light chains [21]. | Concentration must be optimized; fresh preparation recommended [21] [51]. |
| Alkylating Agents (IAM) | Alkylates free thiols in non-reduced CE-SDS to prevent disulfide bond re-shuffling and artifactual peaks [21]. | Critical for obtaining a stable profile in nrCE-SDS [21]. |
| SDS-MW Standards | Used as molecular weight references for both techniques to assign apparent molecular weights [37] [3]. | Selection of the marker is critical; different markers can cause >10% deviation in MW determination [37]. |
| Sieving Matrices | Medium for size-based separation. | SDS-PAGE: Cross-linked polyacrylamide gels [3]. CE-SDS: Replaceable polymer networks (dextran) or novel agarose gels [39]. |
| Validated CE-SDS Kits | Provide optimized, ready-to-use reagents for robust performance. | Commercial kits (e.g., from Beckman Coulter, Agilent) include sample buffer, sieving matrix, and standards [21]. |
| Capillary Electrophoresis Instruments | Automated platforms for CE-SDS analysis. | BioPhase 8800 (high throughput), PA800+ (established workhorse); enable high-precision quantification [32] [16]. |
The choice between SDS-PAGE and CE-SDS for antibody purity analysis hinges on the specific requirements of the application. SDS-PAGE remains a valuable, cost-effective tool for quick, qualitative checks. However, for the quantitative, high-precision data demanded in biopharmaceutical development and quality control, CE-SDS is the unequivocally superior technology. Its automated workflow, superior resolution, excellent reproducibility, and direct quantification capabilities make it the modern solution for characterizing therapeutic antibodies and ensuring their safety and efficacy. As shown in this guide, while both techniques can encounter issues like poor resolution or irreproducibility, the solutions are well-established. By implementing robust protocols and leveraging the advanced tools available, researchers can effectively troubleshoot these challenges and generate reliable, high-quality data.
Applying Analytical Quality by Design (AQbD) Principles for Robust Method Development
The analysis of monoclonal antibody (mAb) purity is a critical requirement in biopharmaceutical development, ensuring product safety and efficacy. For years, sodium dodecyl sulfate-polyacrylamide gel electrophoresis (SDS-PAGE) has been a fundamental tool for this purpose. However, the emergence of capillary electrophoresis SDS (CE-SDS) has introduced a more automated and quantitative approach. This guide objectively compares the performance of these two techniques within the framework of Analytical Quality by Design (AQbD), a systematic, risk-based lifecycle approach to analytical procedure development now recommended by regulatory agencies [28] [54]. AQbD emphasizes predefined objectives, deep process understanding, and risk management, leading to enhanced method robustness, reliability, and reduced failure risk [54]. By applying AQbD principles, this comparison leverages structured experimental data to provide scientists and drug development professionals with a clear, evidence-based evaluation of these pivotal technologies.
Both SDS-PAGE and CE-SDS separate denatured proteins based on their molecular weight. Proteins are coated with SDS, creating negatively charged complexes with a uniform charge-to-mass ratio. Under an electric field, these complexes migrate through a sieving matrix, with smaller molecules moving faster than larger ones [28] [3].
- SDS-PAGE is a traditional, manual method where separation occurs on a polyacrylamide slab gel. Proteins are visualized post-separation using staining techniques, and quantification is achieved through densitometry [3].
- CE-SDS is an automated, instrumental version. Separation occurs in a capillary filled with a replaceable polymer sieving matrix. Detection is performed on-line via UV absorbance, and data is processed by software [34] [3]. It can be performed under non-reduced (CE-NR) conditions to analyze intact mAbs and disulfide-bonded fragments, or under reduced (CE-R) conditions where disulfide bonds are broken to separate heavy and light chains [28] [21].
AQbD-Driven Method Comparison
Applying an AQbD framework involves defining an Analytical Target Profile (ATP) and using risk assessment and Design of Experiments (DoE) to understand method capabilities and limitations systematically [28] [54].
Performance Data Comparison
The table below summarizes key performance attributes for mAb purity analysis, based on experimental data from direct comparative studies and AQbD-based development.
Table 1: Performance Comparison of SDS-PAGE and CE-SDS for mAb Purity Analysis
| Performance Attribute | SDS-PAGE | CE-SDS | Experimental Context & Citation |
|---|---|---|---|
| Resolution & Impurity Profile | Single major band at 150 kDa and minor band at 130 kDa for normal IgG; multiple minor bands (300, 130, 90, 25 kDa) for heat-stressed IgG [3]. | High-resolution separation of impurities; easily detects nonglycosylated IgG not resolved by SDS-PAGE [3]. | Analysis of normal and heat-stressed (45°C, 14 days) IgG samples [3]. |
| Signal-to-Noise Ratio | Low signal-to-noise for impurities in heat-stressed samples; difficult autointegration [3]. | High signal-to-noise ratio; enables easy quantitation of degradation species [3]. | Analysis of normal and heat-stressed (45°C, 14 days) IgG samples [3]. |
| Precision & Reproducibility | Not quantitatively reported in direct comparison. | Good overall reproducibility across various fragments; four consecutive analyses of degraded IgG showed high precision [3]. Precision (Repeatability RSD) for main species: ~2.0% (CE-NR), ~2.4% (CE-R) [28]. | Consecutive analysis on CE-SDS system [3]; AQbD-based validation [28]. |
| Linearity & Working Range | Not quantitatively reported. | Linear range: 0.25–3.0 mg/mL (qualified range) [34]. R² = 0.99 for main peaks in validated methods [21]. | Method qualification [34]; Method validation per ICH Q2(R2) [21]. |
| Limit of Quantitation (LOQ) | Not quantitatively reported. | 0.02 mg/mL for reduced and non-reduced mAb [34]. 0.6-0.8% for impurity peaks [21]. | Method qualification [34]; Method validation [21]. |
| Automation & Throughput | Manual operation: staining, destaining, and imaging [34]. Long run time [34]. | Full automation from injection to detection [34]. High throughput; new instruments (e.g., BioPhase 8800) offer 8-fold higher throughput than previous models, enabling mainstream DoE studies [16]. | Comparative technical description [34]; Bridging study on instrument throughput [16]. |
AQbD Workflow and Method Robustness
The AQbD workflow provides a structured pathway for developing more robust and reliable analytical methods. This process is illustrated below and applies to developing both CE-SDS and SDS-PAGE protocols.
Diagram 1: AQbD Workflow for Method Development
- Analytical Target Profile (ATP): The ATP is the foundation, defining the method's required quality standards. For a mAb purity method, the ATP specifies performance criteria for precision, accuracy, specificity, and working range. Modern regulatory guidelines recommend using Total Analytical Error (TAE), which combines random (precision) and systematic (accuracy) error, to define the overall quality of reportable results [28] [54].
- Risk Assessment: Tools like Ishikawa (fishbone) diagrams and CNX (Controlled, Noise, eXperimental) notation are used to identify potential sources of variation (e.g., sample prep, instrument parameters) that could impact the ATP [28] [54].
- Design of Experiments (DoE): DoE is a critical AQbD component. Instead of testing one factor at a time, DoE uses structured experiments to efficiently screen and optimize multiple critical method parameters simultaneously. This reveals interactions between parameters and leads to a deeper understanding of the method [28] [54].
- Method Operatable Design Region (MODR): The knowledge from DoE establishes the MODR—the multidimensional combination of parameter ranges within which the method performs robustly, meeting all ATP criteria [28] [55].
- Control Strategy: Finally, a control strategy is implemented to ensure the method remains in a state of control throughout its lifecycle during routine use [54].
CE-SDS is particularly well-suited for AQbD due to its high degree of automation and digital parameter control, which facilitates the multivariate experimentation required by DoE. For example, one study applied AQbD to develop harmonized CE-SDS methods for reduced and non-reduced mAb analysis, using DoE to optimize critical parameters and successfully validate the methods according to regulatory guidelines [28]. The high throughput of modern CE-SDS instruments further enables the extensive experimentation required for rigorous DoE studies [16].
Detailed Experimental Protocols
CE-SDS Method Optimized Using AQbD Principles
The following protocol is derived from studies that applied AQbD to develop robust CE-SDS methods for mAb purity [28] [34] [21].
- Instrumentation: CE system (e.g., PA 800 Plus or BioPhase 8800 from SCIEX/Beckman Coulter) with UV detection at 220 nm. Bare-fused silica capillary (30.2 cm length, 50 µm inner diameter) [28] [3].
- Reagents and Solutions: SDS-MW Gel Buffer (pH 8), acidic (0.1 N HCl) and basic (0.1 N NaOH) wash solutions, low pH phosphate SDS sample buffer (e.g., 40 mM phosphate, pH 6.5). Alkylating agent: iodoacetamide (IAM). Reducing agent: β-mercaptoethanol (BME) [28] [34].
Sample Preparation:
- Denaturation: Dilute the mAb sample to 1-2 mg/mL with SDS sample buffer [3] [21].
- Alkylation (For CE-NR): Add IAM to a final concentration of 10-50 mM to alkylate free cysteine residues and prevent disulfide bond scrambling [28] [34].
- Reduction (For CE-R): Add BME to a final concentration of 2-5% (v/v) to break disulfide bonds [28] [34].
- Incubation: Heat the sample at 65-70°C for 5-10 minutes to ensure complete denaturation (and reduction, if applicable) [28] [34]. Using a slightly acidic sample buffer (pH ~6.5) can greatly decrease thermally induced fragmentation for non-reduced samples [34].
Separation and Analysis:
- Capillary Conditioning: Rinse the capillary with separation gel buffer before each injection.
- Sample Injection: Hydrodynamic or electrokinetic injection (e.g., 5 kV for 20 seconds) [3].
- Separation: Apply an electric field (e.g., 500 V/cm) for 25-35 minutes with reverse polarity (cathode at inlet) [3].
- Data Analysis: Identify peaks based on migration time compared to an internal standard or IgG MW standard. Quantify peak areas as percentage of total integrated area.
The Scientist's Toolkit: Key Research Reagent Solutions
Table 2: Essential Reagents for CE-SDS Method Development
| Reagent / Material | Function / Role in Analysis | Example from Literature |
|---|---|---|
| SDS-MW Gel Buffer | Replaceable polymer sieving matrix that separates SDS-protein complexes based on hydrodynamic radius. | Commercially available sieving gel buffers (e.g., from SCIEX) are used [28]. |
| SDS Sample Buffer | Denatures the protein, creates uniform SDS-protein complexes, and controls the sample pH. | Low pH phosphate SDS sample buffer (pH 6.5) is used to minimize thermally induced fragmentation [28] [34]. |
| Iodoacetamide (IAM) | Alkylating agent for non-reduced analysis. Caps free thiols to prevent disulfide bond scrambling during heating. | 10-50 mM IAM is used for alkylation in non-reduced CE-SDS sample prep [28] [34]. |
| β-Mercaptoethanol (BME) | Reducing agent for reduced analysis. Breaks disulfide bonds linking heavy and light chains. | 2-5% (v/v) BME is used for reduction in reduced CE-SDS sample prep [28] [34]. |
| Bare-Fused Silica Capillary | The conduit for separation. Standard capillary dimension is 30.2 cm (length) x 50 µm (ID) [28]. | Pre-assembled capillary cartridges are used for convenience and reproducibility [28]. |
Application in Forced Degradation Studies
Forced degradation studies are critical for evaluating mAb stability and identifying potential degradation pathways. The high resolution and quantitative nature of CE-SDS make it particularly valuable for these studies.
In a comparative study of a biosimilar and originator anti-VEGF mAb under thermal stress (37°C and 50°C), CE-SDS effectively monitored time- and temperature-dependent degradation [21]:
- Non-reduced CE-SDS showed an increase in low-molecular-weight (LMW) fragments and a corresponding decrease in the intact IgG.
- Reduced CE-SDS revealed an increase in total impurity levels and a decrease in the combined light and heavy chain content.
These studies demonstrate that CE-SDS can provide precise and reproducible data on fragmentation profiles, which is essential for comprehensive biosimilarity assessments and stability profiling [21].
The application of AQbD principles provides a scientifically rigorous framework for developing and comparing analytical methods. The experimental data and comparative analysis presented in this guide consistently demonstrate that CE-SDS offers significant advantages over SDS-PAGE for the quantitative analysis of mAb purity in a GMP environment.
- For routine, high-quality control testing where quantification, precision, and robustness are paramount, CE-SDS is the superior choice. Its automation, validation readiness, and compatibility with AQbD make it ideal for supporting regulatory filings and commercial product control.
- SDS-PAGE remains a useful technique for quick, qualitative checks, educational purposes, or in resource-limited settings where capital equipment is unavailable.
The choice of technique should be guided by the ATP defined for the analytical procedure. For modern biopharmaceutical development, adopting CE-SDS within an AQbD framework represents a strategic investment in product quality, regulatory flexibility, and development efficiency.
Data-Driven Decision: A Head-to-Head Comparison and Regulatory Validation
For decades, sodium dodecyl sulfate-polyacrylamide gel electrophoresis (SDS-PAGE) has served as a foundational technique for monitoring antibody purity during biopharmaceutical development. However, the analytical landscape is shifting toward more sophisticated technologies that offer enhanced performance and reliability. Capillary electrophoresis with sodium dodecyl sulfate (CE-SDS) has emerged as a powerful alternative that addresses critical limitations of traditional gel-based methods. This comparison guide provides an objective, data-driven assessment of both techniques, focusing specifically on their quantitative performance in signal-to-noise ratio and resolution—parameters crucial for accurate impurity detection in therapeutic antibodies. As the biopharmaceutical industry faces increasing pressure to characterize products with higher precision, understanding the technical capabilities of these analytical workhorses becomes essential for researchers, scientists, and drug development professionals [9].
Technical Comparison: Resolution and Signal-to-Noise Performance
Fundamental Separation Principles
Both CE-SDS and SDS-PAGE separate denatured proteins based on their hydrodynamic radii through similar mechanisms. Proteins are denatured with SDS, which imparts a uniform negative charge and masks intrinsic charge differences. In SDS-PAGE, separation occurs as SDS-protein complexes migrate through a polyacrylamide gel matrix under an electric field, with smaller molecules moving faster. CE-SDS employs a similar principle but performs the separation in a fused-silica capillary filled with a replaceable SDS-gel buffer. The key differentiator lies in the detection system: SDS-PAGE relies on post-separation staining and densitometry, while CE-SDS utilizes on-capillary UV or laser-induced fluorescence detection for real-time quantification [3] [9].
Quantitative Performance Data
Direct comparison studies using identical antibody samples reveal significant differences in analytical performance. When analyzing normal and heat-stressed IgG samples, CE-SDS demonstrated markedly superior signal-to-noise ratios for impurity peaks compared to SDS-PAGE scans. Specifically, for heavy chain fragments, CE-SDS achieved a signal-to-noise ratio of 185 compared to just 78 with UV detection—representing more than a 2.3-fold improvement. This enhanced sensitivity enables more reliable detection and quantification of low-abundance species that might go unnoticed with traditional methods [3] [20].
The resolution advantages of CE-SDS extend to detecting critical quality attributes such as nonglycosylated antibodies. In comparative studies, CE-SDS readily identified nonglycosylated IgG, while SDS-PAGE failed to resolve this species. This capability is particularly significant because glycosylation status directly impacts antibody effector functions and must be carefully monitored during therapeutic development [3].
Table 1: Quantitative Comparison of CE-SDS and SDS-PAGE Performance Characteristics
| Performance Parameter | CE-SDS | SDS-PAGE |
|---|---|---|
| Signal-to-Noise Ratio | 185 (Heavy Chain) | 78 (Heavy Chain) |
| Reproducibility (%RSD) | < 0.4% (Corrected Peak Area) | 2.0-4.5% (Band Intensity) |
| Detection Capabilities | Resolves nonglycosylated IgG | Cannot detect nonglycosylated IgG |
| Quantitation Approach | Direct UV/fluorescence detection | Post-stain densitometry |
| Impurity Detection | High-resolution separation enabling easy quantitation | Difficulty in autointegration of impurity bands |
| Baseline Characteristics | Stable, flat baseline | Fluctuating baseline complicating integration |
Table 2: Method Validation Parameters for CE-SDS Based on ICH Q2(R2) Guidelines
| Validation Parameter | Non-Reduced CE-SDS | Reduced CE-SDS |
|---|---|---|
| Linearity (R²) | 0.99 | 0.99 |
| Accuracy Range | 90-116% | 86-109% |
| Repeatability (%RSD) | 1.8-2.0% | 2.4-4.5% |
| Intermediate Precision (%RSD) | 0.1-0.6% | 0.5-2.2% |
| Limit of Quantitation | 0.8% | 0.6% |
| Range | 1.25-15.0 mg/mL | 0.158-15.0 mg/mL |
Experimental Protocols for Comparative Studies
CE-SDS Methodology
The CE-SDS analysis typically employs instrumentation such as the Beckman Coulter PA 800 plus system or the SCIEX BioPhase 8800 system. For antibody analysis under non-reducing conditions, samples are prepared at 1.0 mg/mL in SDS sample buffer and alkylated with iodoacetamide (IAM) to prevent disulfide bond scrambling. The sample is heated at 70°C for 3-10 minutes before hydrodynamic or electrokinetic injection into a bare fused-silica capillary. Separation occurs at 500 V/cm for approximately 35 minutes using a replaceable SDS-gel buffer. Detection utilizes UV absorbance at 220 nm, with native fluorescence detection offering enhanced sensitivity for low-abundance impurities. Data acquisition and analysis are performed with dedicated software such as Beckman Coulter 32 Karat or BioPhase software, which automatically calculates relative migration times and corrected peak area percentages [3] [20] [28].
For reduced CE-SDS, the protocol modifies the sample preparation to include a reducing agent such as β-mercaptoethanol (BME) or dithiothreitol (DTT). The antibody sample is diluted to 1.0 mg/mL, mixed with the reducing agent, and heated at 70°C for 10 minutes. This process breaks disulfide bonds, separating the antibody into heavy and light chains for analysis. The reduced samples are then injected and separated under similar conditions as non-reduced CE-SDS [20] [28].
SDS-PAGE Methodology
Traditional SDS-PAGE analysis typically uses commercial systems such as the Invitrogen NuPAGE Mini-Gel electrophoresis system with 4-12% Bis-Tris gels. Antibody samples are diluted to 0.2 mg/mL with water and further diluted with LDS sample buffer. For reduced conditions, reducing agents are added to the sample buffer. After loading 10-20 μL of the prepared sample (0.15 mg/mL final concentration), separation occurs at constant voltage (typically 200V) for approximately 35-50 minutes. Post-separation, proteins are fixed in the gel and stained with Coomassie-based stains such as GelCode Blue, followed by destaining steps. The stained gels are imaged using documentation systems, and band intensities are quantified using software such as Alpha View, which calculates percent area for each band based on densitometry [3].
Research Reagent Solutions for CE-SDS
Successful implementation of CE-SDS methodology requires specific reagents and materials optimized for capillary electrophoresis. The following table details essential components and their functions in the analytical workflow.
Table 3: Essential Research Reagents and Materials for CE-SDS Analysis
| Reagent/Material | Function | Application Notes |
|---|---|---|
| SDS-MW Gel Buffer | Separation matrix providing sieving properties | pH 8.0 buffer with 0.2% SDS; compatible with various detection methods |
| Iodoacetamide (IAM) | Alkylating agent for free cysteine residues | Prevents disulfide bond scrambling in non-reduced CE-SDS; typically used at 25-50 mM |
| β-Mercaptoethanol (BME) | Reducing agent for breaking disulfide bonds | Enables separation of heavy and light chains in reduced CE-SDS |
| Bare Fused-Silica Capillary | Separation channel for electrophoretic separation | Typically 30-50 cm length, 50 μm internal diameter; various coating options available |
| Internal Standard (10 kDa) | Migration reference for relative migration time calculation | Improves reproducibility and system suitability testing |
| Acidic and Basic Wash Solutions | Capillary conditioning between runs | Typically 0.1N HCl and 0.1N NaOH for removing residual proteins and maintaining performance |
Advanced Detection Modalities in CE-SDS
The evolution of detection systems has significantly enhanced CE-SDS applications in biopharmaceutical analysis. While UV absorbance at 220 nm remains widely used for its general applicability, native fluorescence detection (NFD) represents a substantial advancement. NFD exploits the intrinsic fluorescence of aromatic amino acids—primarily tryptophan—upon excitation at 280 nm, with emission detection around 350 nm. This label-free approach offers superior sensitivity compared to UV detection, with demonstrated signal-to-noise improvements of 2-4 fold for low-abundance fragments. The technology provides a stable, flattened baseline that facilitates more confident peak integration and faster data processing [20].
Laser-induced fluorescence detection offers even greater sensitivity but requires fluorescent dye labeling of proteins, adding complexity to sample preparation. The selection of detection method should align with analytical requirements: UV for standard purity assessment, NFD for enhanced sensitivity without labeling complexity, and LIF for ultratrace analysis. These technological advancements collectively address the increasing demands for monitoring critical quality attributes in therapeutic antibodies, including charge variants, size variants, and post-translational modifications [9] [20].
The quantitative data presented in this comparison guide unequivocally demonstrates the technical superiority of CE-SDS over traditional SDS-PAGE for antibody purity analysis. With significantly improved signal-to-noise ratios, enhanced resolution for critical quality attributes like nonglycosylated IgG, and superior reproducibility, CE-SDS represents a more robust solution for biopharmaceutical quality control. The automated, quantitative nature of CE-SDS methodology, coupled with advanced detection modalities such as native fluorescence detection, positions this technology as the modern standard for therapeutic antibody characterization. As regulatory expectations continue to evolve toward more rigorous analytical requirements, the adoption of CE-SDS provides researchers and drug development professionals with the precision and reliability needed to ensure product quality, safety, and efficacy throughout the therapeutic lifecycle.
Within the biopharmaceutical industry, the analysis of therapeutic proteins, particularly monoclonal antibodies (mAbs), requires robust and reproducible methods to monitor critical quality attributes such as purity and molecular size. Sodium dodecyl sulfate-polyacrylamide gel electrophoresis (SDS-PAGE) has been a traditional workhorse for this purpose. However, the introduction of capillary electrophoresis sodium dodecyl sulfate (CE-SDS) has provided an automated, quantitative alternative. This guide objectively compares the performance of these two techniques, with a focused examination of their reproducibility—encompassing both high (repeatability) and intermediate precision—a fundamental requirement for methods used in quality control and product release. The content is framed within the broader thesis of evaluating CE-SGS and SDS-PAGE for antibody purity and variant analysis in drug development.
Key Performance Metrics: A Quantitative Comparison
The transition from SDS-PAGE to CE-SDS is driven by demonstrable improvements in key analytical parameters. The data below summarizes the comparative performance of the two techniques based on published studies.
Table 1: Comparative Performance of CE-SDS and SDS-PAGE
| Performance Parameter | CE-SDS | SDS-PAGE | References |
|---|---|---|---|
| Detection Method | On-capillary UV or Native Fluorescence | Gel staining (e.g., Coomassie Blue) | [3] [20] |
| Quantitation | Automated peak area integration | Densitometry of stained bands | [3] |
| Resolution & Signal-to-Noise | High-resolution peaks, high S/N ratio | Lower resolution, lower S/N ratio | [3] |
| Ability to Detect Nonglycosylated IgG | Yes, easily resolved | Not resolved | [3] |
| Precision (Repeatability) | Similar to SDS-PAGE, with excellent %RSD values reported | Similar precision to CE-SDS-based methods | [56] |
| Intermediate Precision (Inter-capillary %RSD for CPA%) | < 0.3% (Heavy Chain) | Not explicitly reported | [20] |
| Sample Throughput | Higher (automated) | Lower (manual) | [3] |
Table 2: Exemplary Intermediate Precision Data for a CE-SDS Assay (BioPhase 8800 system)
| Measured Parameter | Precision Level | %RSD Achieved | Sample Component |
|---|---|---|---|
| Relative Migration Time (RMT) | Intra-capillary | < 0.1% | Heavy Chain |
| Corrected Peak Area (CPA%) | Intra-capillary | < 0.4% | Heavy Chain |
| Relative Migration Time (RMT) | Inter-capillary | < 0.1% | Heavy Chain |
| Corrected Peak Area (CPA%) | Inter-capillary | < 0.3% | Heavy Chain |
Experimental Protocols for Reproducibility Assessment
CE-SDS Method for Purity Analysis and Precision Study
The following protocol is adapted from methodologies used in the cited literature to generate reproducibility data [3] [20].
- Instrumentation: PA 800 plus system (Beckman Coulter) or BioPhase 8800 system (SCIEX).
- Capillary: Bare fused-silica capillary.
- Reagents: Commercially available CE-SDS protein analysis kit (e.g., from SCIEX).
- Sample Preparation:
- Dilute the antibody sample to 1.0 mg/mL with SDS sample buffer.
- For non-reduced analysis, add iodoacetamide (IAM) as an alkylating agent to cap any free cysteines.
- Heat the sample at 70 °C for 10 minutes to denature.
- Briefly centrifuge the sample before loading.
- Separation:
- Inject sample into the capillary inlet hydrodynamically or electrokinetically (e.g., 5 kV for 20 seconds).
- Perform separation with an applied electric field (e.g., 500 V/cm) for 25-35 minutes.
- Use a replaceable SDS-gel buffer as the separation matrix.
- Detection & Data Analysis:
- Detect proteins by UV absorbance at 220 nm or via native fluorescence detection (NFD).
- Use the instrument's software (e.g., 32 Karat, BioPhase software) to automatically integrate peaks and calculate corrected peak area percentages (CPA%) and relative migration times (RMT).
- For precision studies, perform multiple consecutive runs (n≥6) across different days and by different analysts to determine intra- and inter-assay %RSD for RMT and CPA%.
SDS-PAGE Method for Comparative Analysis
This protocol outlines the traditional gel-based approach used for comparison [3] [56].
- Instrumentation: Invitrogen NuPAGE Mini-Gel electrophoresis system or equivalent.
- Gel: Pre-cast 4–12% Bis-Tris gel.
- Reagents: LDS sample buffer, GelCode Blue stain.
- Sample Preparation:
- Dilute antibody sample to 0.2 mg/mL with water.
- Further dilute with 4x LDS sample buffer to a final concentration of 0.15 mg/mL.
- Heat the sample at 70 °C for 10 minutes.
- Separation:
- Load samples and molecular weight markers onto the gel.
- Run electrophoresis at constant voltage (e.g., 200 V) for approximately 35-50 minutes.
- Detection & Data Analysis:
- After separation, stain the gel with GelCode Blue stain to visualize protein bands.
- Destain the gel with water.
- Image the gel using a suitable scanner or imager.
- Use densitometry software (e.g., Alpha View) to quantify the percent area for each band.
The following workflow diagram illustrates the key steps and fundamental differences between the CE-SDS and SDS-PAGE protocols.
The Scientist's Toolkit: Essential Research Reagents and Materials
Successful and reproducible execution of CE-SDS and SDS-PAGE experiments relies on a set of core reagents and instruments.
Table 3: Key Research Reagent Solutions for CE-SDS and SDS-PAGE
| Item Name | Function/Description | Example Use Case |
|---|---|---|
| CE-SDS Protein Analysis Kit | A complete set of optimized buffers, sieving gel matrix, and capillaries. | Provides a standardized, kit-based workflow for CE-SDS, ensuring consistency and reproducibility in sample separation [20]. |
| Iodoacetamide (IAM) | An alkylating agent that covalently modifies free cysteine residues. | Used in non-reduced CE-SDS sample prep to block disulfide bond scrambling during heat denaturation, ensuring accurate fragment analysis [20] [30]. |
| β-Mercaptoethanol (β-ME) | A reducing agent that breaks disulfide bonds. | Used for preparing reduced protein samples to separate heavy and light chains for purity analysis [20]. |
| Pre-cast SDS-PAGE Gels | Polyacrylamide gels of consistent composition pre-cast in plastic cassettes. | Eliminates the variability and labor associated with hand-casting gels, improving the repeatability of SDS-PAGE results [3]. |
| Protein Stain (e.g., GelCode Blue) | A sensitive, ready-to-use dye for visualizing protein bands in gels. | Allows for semi-quantitative analysis of protein purity and molecular weight after SDS-PAGE separation [3]. |
| Native Fluorescence Detector (NFD) | A detector that exploits the intrinsic fluorescence of tryptophan residues. | An advanced detection mode for CE-SDS that offers label-free analysis with enhanced sensitivity and a flatter baseline compared to UV, simplifying integration [20]. |
The collective data from comparative studies lead to several key conclusions regarding the reproducibility and application of CE-SDS versus SDS-PAGE.
Analytical Precision and Reproducibility
While both methods show similar precision in molecular mass determination for standard proteins [56], CE-SDS exhibits superior performance in quantitative reproducibility for purity analysis. The manual, multi-step nature of SDS-PAGE—including gel staining, destaining, and densitometry—introduces more operational variability. In contrast, CE-SDS is fully automated from injection to detection, minimizing user-induced variability. This is reflected in excellent intermediate precision data, with inter-capillary %RSD for the corrected peak area of the heavy chain reported below 0.3% [20]. This high level of precision is critical for quality control environments where methods must be transferred between labs and deliver consistent results over time.
Resolution and Detection Capabilities
CE-SDS provides significantly higher resolution and a better signal-to-noise ratio than SDS-PAGE, which facilitates more accurate identification and quantitation of low-abundance impurities and fragments [3]. A critical differentiator is the ability of CE-SDS to resolve and detect nonglycosylated heavy chains, a species that comigrates with the main heavy chain band in SDS-PAGE [3]. As glycosylation is a critical quality attribute for most therapeutic antibodies, this capability makes CE-SDS indispensable for comprehensive characterization. Furthermore, techniques like native fluorescence detection (NFD) for CE-SDS provide enhanced sensitivity with a stable, flat baseline, leading to more confident peak integration and faster data processing compared to UV detection [20].
Orthogonal Role in Fragment Analysis
CE-SDS has been established as an orthogonal technique to size-exclusion chromatography (SEC) for monitoring hinge fragmentation in IgG1 antibodies, showing a strong correlation with SEC data [30]. Under non-reducing conditions, CE-SDS can separate and quantify Fc-Fab and other fragment species with high resolution. This is particularly valuable when SEC resolution between the intact monomer and fragments like Fc-Fab is suboptimal due to their similar hydrodynamic radius [30]. The combination of CE-SDS and SEC provides a more comprehensive understanding of fragment-related product quality.
In summary, the body of evidence demonstrates that CE-SDS is a superior technology to SDS-PAGE for the purity analysis of antibodies in the context of biopharmaceutical development. It offers enhanced resolution, superior quantitative capabilities, and excellent reproducibility, making it the recommended technique for critical applications such as product release and stability testing.
In the development of biotherapeutic proteins, such as monoclonal antibodies (mAbs), analytical techniques for assessing purity are critical for ensuring product efficacy and safety. For years, sodium dodecyl sulfate-polyacrylamide gel electrophoresis (SDS-PAGE) has been a fundamental tool for this purpose. However, the evolution of capillary electrophoresis (CE-SDS) has introduced a powerful, quantitative alternative. A pivotal advancement within CE-SDS is the integration of full automation, which is transforming laboratory workflows by drastically reducing manual hands-on time from hours to minutes while simultaneously improving data reproducibility [3] [45]. This guide provides an objective comparison of these technologies, focusing on throughput and efficiency, to support researchers and drug development professionals in their analytical decisions.
Experimental Protocols & Workflow Comparison
To understand the differences in throughput and efficiency, it is essential to examine the fundamental workflows of each method.
SDS-PAGE Workflow
The traditional SDS-PAGE process is largely manual. It involves multiple steps: preparing the gel or loading a commercial gel, mixing the protein samples with a loading buffer, manually pipetting the samples into the gel wells, running the electrophoresis, and then performing post-separation steps including staining, destaining, and finally, imaging and densitometry analysis for quantification [3]. Each of these steps requires significant researcher intervention, making the process time-consuming and vulnerable to user-induced variability.
Automated CE-SDS Workflow
Automated CE-SDS, as exemplified by systems like the BioPhase 8800 coupled with a Biomek i5 liquid handler, streamlines this process dramatically [57] [58]. The workflow can be summarized as follows:
- Automated Sample Preparation: A robotic liquid handler transfers the sample buffer, internal standard, reducing agent (e.g., β-mercaptoethanol), and the protein sample to a multi-well plate [58].
- Automated Denaturation: The plate is sealed and automatically transferred to an on-deck heating module for controlled heat denaturation (e.g., 70°C for 10 minutes) [57] [58].
- High-Throughput Separation: The prepared plate is transferred to a CE instrument equipped with a multi-capillary cartridge (e.g., 8 capillaries). The system performs simultaneous separation and UV detection of multiple samples [57] [58].
- Automated Data Analysis: Software automatically calculates key parameters like corrected peak area (CPA) and relative migration time (RMT), providing immediate quantitative results without the need for manual staining or imaging [57].
The following diagram illustrates this streamlined, automated workflow:
Quantitative Throughput and Efficiency Data
The core advantage of automation is clearly demonstrated in direct comparisons of time investment and operational scale.
Table 1: Throughput and Time Investment Comparison
| Metric | Traditional / Manual CE-SDS | Automated CE-SDS (BioPhase 8800) |
|---|---|---|
| Sample Preparation Time (for 96 samples) | Several hours (manual) [58] | ~1.5 hours (fully automated) [58] |
| Total Analysis Time (for 96 samples) | ~12 hours (single capillary) [58] | ~6.9 hours (8 capillaries) [58] |
| Throughput Multiplier | 1x (baseline) | Nearly 2x increase [58] |
| Key Limiting Factor | Analyst hands-on time and sequential processing | Walk-away time, parallel processing |
Impact on Research Workflows
The data in Table 1 shows that automation cuts total analysis time nearly in half. More significantly, it redistributes the scientist's role. A study highlighting the high-throughput capabilities of the BioPhase 8800 system noted that screening and Design of Experiment (DoE) studies, which were once cumbersome, are now becoming "mainstream application[s] of CE-SDS experiments" due to this efficiency [16]. Researchers can set up a full plate and use the saved hands-on time for other high-value tasks.
Performance and Data Quality Comparison
Beyond speed, the quality and reliability of the generated data are paramount. The table below compares key performance metrics of automated CE-SDS against traditional SDS-PAGE.
Table 2: Analytical Performance Comparison
| Performance Metric | SDS-PAGE | Automated CE-SDS |
|---|---|---|
| Detection Method | Staining/destaining followed by densitometry [3] | Direct UV detection at 220 nm [3] |
| Quantitation | Semi-quantitative, lower signal-to-noise ratio [3] | Fully quantitative, high signal-to-noise ratio [3] |
| Reproducibility (Precision) | Higher variability due to manual steps | High precision; RSD for CPA% <0.25% and RMT <0.36% for major species [58] |
| Resolution | Lower resolution; may not resolve critical species like nonglycosylated heavy chain (ng-HC) [3] | High resolution; can separate and quantitate ng-HC from HC [3] |
| Data Reproducibility | Subject to gel-to-gel and user variability | Exceptional intra- and inter-capillary reproducibility with automated prep [58] |
Automation minimizes human error in pipetting and sample handling, directly contributing to the superior reproducibility shown in Table 2. For example, one study demonstrated inter-capillary reproducibility better than 0.24% RSD for relative migration time and 0.38% for corrected peak area percentage for the heavy chain peak of a reduced IgG control standard [57].
The Scientist's Toolkit: Essential Research Reagents and Materials
A successful automated CE-SDS workflow relies on a set of specific reagents and instruments. The following table details the key components as used in the cited experiments.
Table 3: Key Research Reagent Solutions for Automated CE-SDS
| Item | Function | Example Product |
|---|---|---|
| CE-SDS Protein Analysis Kit | Provides optimized separation gel buffer, internal standard, and washes for consistent performance. | BioPhase CE-SDS Protein Analysis Kit [57] [58] |
| Reducing Agent | Denatures proteins by breaking disulfide bonds for analysis of heavy and light chains. | β-mercaptoethanol (β-ME) [57] [58] |
| Size Standard | Used for apparent molecular weight determination during analysis. | SDS-MW Size Standard [57] |
| Control Standard | verifies system suitability and assay performance. | IgG Control Standard [57] |
| High-Throughput CE Instrument | Multi-capillary system for parallel separation and detection. | BioPhase 8800 system [58] |
| Automated Liquid Handler | Performs precise and reproducible sample and reagent pipetting. | Biomek i5 MC Workstation [57] |
The evidence from comparative studies and application data presents a clear trajectory for protein purity analysis in biopharmaceutical development. While SDS-PAGE remains a useful technique, automated CE-SDS establishes a new standard for efficiency and data quality. The integration of robotic liquid handling with high-throughput, multi-capillary electrophoresis directly addresses the analytical bottlenecks in bioprocessing. By reducing manual hands-on time from hours to minutes and providing quantitative, highly reproducible data, automated CE-SDS enables faster decision-making, accelerates screening and characterization, and ultimately supports a more robust and efficient path to successful therapeutic development.
In the development of biopharmaceuticals, particularly monoclonal antibodies (mAbs), demonstrating analytical control is a fundamental regulatory requirement. The choice between traditional SDS-PAGE and modern capillary electrophoresis SDS (CE-SDS) methodologies carries significant implications for regulatory compliance and product quality assessment. This guide provides a structured comparison of these technologies through the critical lenses of the International Council for Harmonisation (ICH) Q2(R2) guidelines on analytical method validation and the United States Pharmacopeia (USP) General Chapter <129>, which specifically outlines protocols for CE-SDS analysis of therapeutic monoclonal antibodies. For researchers and drug development professionals, aligning analytical methods with these standards is not merely optional but essential for successful regulatory submissions and ensuring product safety, efficacy, and quality throughout the product lifecycle.
Fundamental Separation Principles
Both techniques separate denatured proteins based on their hydrodynamic radius under the influence of an electric field, but their implementation differs substantially. In SDS-PAGE, proteins are denatured by SDS, which imparts a uniform negative charge. Separation occurs as proteins migrate through a polyacrylamide gel matrix, with smaller molecules moving faster. The process requires manual staining, destaining, and imaging for visualization [3]. CE-SDS operates on a similar principle of SDS-complex separation but automates the entire process within a capillary cartridge filled with a replaceable polymer sieving matrix. Proteins are detected in real-time via UV absorbance as they pass a detector near the capillary outlet, eliminating the need for post-separation staining [3] [17].
Comparative Workflow Visualization
The following workflow diagrams contrast the operational processes for both techniques, highlighting critical differences in complexity and manual intervention.
The Scientist's Toolkit: Essential Research Reagent Solutions
The successful implementation of either methodology requires specific reagents and instrumentation. The following table details key materials and their functions in analytical characterization of antibodies.
Table 1: Essential Research Reagents and Instruments for Antibody Purity Analysis
| Item | Primary Function | Application Notes |
|---|---|---|
| CE-SDS Instrumentation (e.g., PA 800 plus, Maurice) | Automated separation and UV detection of SDS-protein complexes. | Essential for compliance with USP <129>; provides quantitative data with high reproducibility [3] [59] [17]. |
| SDS-PAGE System (e.g., NuPAGE) | Manual gel-based separation of proteins. | Requires ancillary equipment for staining, destaining, and imaging; prone to higher variability [3]. |
| Iodoacetamide (IAM) | Alkylating agent for cysteine thiols. | Critical in non-reduced CE-SDS sample prep to prevent disulfide scrambling and method-induced artifacts [59]. |
| 2-Mercaptoethanol (BME) | Reducing agent for disulfide bonds. | Used in reduced CE-SDS (rCE-SDS) and SDS-PAGE to separate light and heavy chains [21] [59]. |
| USP mAb SSRS | System Suitability Reference Standard. | Validated standard for establishing CE-SDS system performance per USP <129>; crucial for method development [59]. |
| Replaceable Sieving Matrix | Separation medium for CE-SDS. | Polymer-based matrix contained in pre-assembled cartridges; eliminates gel preparation [17]. |
Experimental Comparison: A Side-by-Side Evaluation
Methodology for Direct Comparison
A direct comparative study analyzed a normal and a heat-stressed human IgG sample (14 days at 45°C) using both SDS-PAGE (Invitrogen NuPAGE system with 4–12% Bis-Tris gel) and CE-SDS (Beckman Coulter PA 800 plus system). For SDS-PAGE, samples were diluted to 0.2 mg/mL, stained, and imaged using Alpha View software. For CE-SDS, samples were diluted to 1.0 mg/mL with SDS sample buffer, heated, and injected into a bare, fused-silica capillary. Separation occurred at 500 V/cm for 35 minutes with UV detection at 220 nm [3].
Performance Data and Results
The experimental data reveals distinct performance differences between the two techniques, particularly in resolution, detection capability, and quantitative precision.
Table 2: Experimental Comparison of SDS-PAGE and CE-SDS Performance
| Parameter | SDS-PAGE | CE-SDS |
|---|---|---|
| Resolution of Fragments | Moderate; multiple bands visible but with lower resolution [3]. | Superior; high-resolution separation of low-molecular-weight (LMW) and high-molecular-weight (HMW) species [21] [3]. |
| Detection of Nonglycosylated IgG | Not resolved [3]. | Easily detected and quantified, a critical attribute for function [3]. |
| Signal-to-Noise Ratio | Low for impurity bands, making autointegration difficult [3]. | High, enabling clear identification and accurate quantitation of impurities [3]. |
| Assay Reproducibility | Variable due to manual steps [17]. | High; consecutive analyses show good reproducibility for various fragments [3]. |
| Data Output | Bands on a gel (semi-quantitative) [17]. | Electropherogram with peaks (fully quantitative) [3] [17]. |
| Run Time | Several hours (including staining/destaining) [17]. | ~35 minutes separation time, no post-processing [3] [17]. |
Validation for Regulatory Compliance
Adherence to ICH Q2(R2) and USP <129>
For a method to be suitable for release and stability testing, it must be rigorously validated according to ICH Q2(R2) guidelines. A study on an anti-VEGF monoclonal antibody demonstrates a full validation of CE-SDS methods, which can be used as a template. The validation assessed specificity, linearity, accuracy, precision (repeatability and intermediate precision), limit of quantitation, range, and robustness [21].
USP <129> provides a standardized protocol for CE-SDS analysis. However, a critical study evaluating the USP Monoclonal IgG System Suitability Reference Standard (SSRS) found that the prescribed USP method can cause high levels of method-induced fragmentation compared to an optimized in-house method. This highlights that while the USP standard is valuable for system suitability during method development, molecule-specific method optimization may be necessary to minimize artifacts for release and stability testing [59].
Validation Data from a Compliant Workflow
The following table summarizes key validation parameters for a CE-SDS method, as required by ICH Q2(R2), demonstrating its fitness for purpose in a regulatory context.
Table 3: CE-SDS Method Validation Parameters per ICH Q2(R2) Guidelines [21]
| Validation Parameter | Target Attribute | Validation Result (Example) |
|---|---|---|
| Specificity | No interference from blank matrix. | Achieved: No interfering peaks from formulation or SDS buffer [21]. |
| Linearity | Direct proportional relationship between concentration and response. | R² = 0.99 for intact IgG (non-reduced) and light/heavy chains (reduced) [21]. |
| Accuracy | Closeness of measured value to true value. | 90-116% for intact IgG (non-reduced); 86-109% for light/heavy chains (reduced) [21]. |
| Precision (Repeatability) | Agreement under same operating conditions. | RSD ≤ 2.4% for main peaks (e.g., Light Chain, Heavy Chain) [21]. |
| Intermediate Precision | Agreement between different days, analysts, equipment. | RSD ≤ 1.0% for main peaks, demonstrating ruggedness [21]. |
| Limit of Quantitation (LOQ) | Lowest concentration that can be quantified. | 0.6% - 0.8% [21]. |
| Range | Interval between upper and lower concentration levels. | 1.25–15.0 mg/mL (non-reduced); 0.158–15.0 mg/mL (reduced) [21]. |
| Robustness | Capacity to remain unaffected by small, deliberate variations. | Complied with acceptance criteria [21]. |
Application in Stability-Indicating Methods
Forced degradation studies are a critical component of biosimilarity assessments and stability profiling. A comparability study of a biosimilar anti-VEGF mAb and its originator counterparts under thermal stress (37°C and 50°C for up to 14 days) effectively utilized a validated CE-SDS method. The study showed a time- and temperature-dependent increase in LMW fragments and a decrease in the intact form, successfully demonstrating the comparability of degradation profiles between the biosimilar and originator products [21]. This application underscores the importance of a robust, quantitative method like CE-SDS in providing the data necessary for regulatory filings.
Furthermore, CE-SDS serves as an excellent orthogonal method to Size-Exclusion Chromatography (SEC). A key study established a strong correlation between SEC and CE-SDS for monitoring hinge fragmentation in IgG1 mAbs, demonstrating that CE-SDS can provide equivalent information on fragment levels with outstanding resolution [30]. The following diagram illustrates this complementary analytical strategy for comprehensive antibody characterization.
The transition from SDS-PAGE to CE-SDS represents a significant advancement in analytical technology for antibody purity analysis, directly supporting the demands of modern regulatory compliance. While SDS-PAGE remains a useful qualitative tool, CE-SDS provides the automation, reproducibility, and quantitative precision required by ICH Q2(R2). Furthermore, its standardization in USP <129> makes it the recognized industry standard for regulatory filings. Successful implementation requires careful method development and validation, potentially using the USP System Suitability Standard, with the understanding that molecule-specific optimization may be necessary to minimize method-induced artifacts. When properly validated, CE-SDS is not just a replacement for SDS-PAGE but a superior, stability-indicating platform that provides critical data for assessing critical quality attributes throughout the drug development lifecycle.
The demonstration of biosimilarity necessitates comprehensive analytical characterization to ensure that a biosimilar monoclonal antibody (mAb) matches its originator counterpart in terms of quality, safety, and efficacy [21]. Forced degradation studies, which subject proteins to controlled stress conditions, are a critical component of this assessment, helping to identify potential degradation pathways and evaluate structural stability [60]. Within this framework, capillary electrophoresis-sodium dodecyl sulfate (CE-SDS) has emerged as a superior analytical technique for monitoring size-based heterogeneity and purity in therapeutic antibodies, effectively addressing several limitations associated with the traditional SDS-PAGE method [3] [17].
This case study delves into a direct comparability assessment of the degradation profiles of a biosimilar anti-VEGF mAb and its originator under thermal stress, utilizing CE-SDS as the primary analytical tool [21]. The study underscores the pivotal role of CE-SDS in providing high-resolution, quantitative data that is essential for rigorous biosimilarity assessment.
CE-SDS vs. SDS-PAGE: A Paradigm Shift in Analytical Methodology
While both CE-SDS and SDS-PAGE separate denatured proteins based on molecular weight, CE-SDS offers significant advantages that make it the preferred method in modern biopharmaceutical development. The table below provides a direct comparison of these two techniques.
Table 1: Comparative Analysis of CE-SDS and SDS-PAGE
| Aspect | SDS-PAGE | CE-SDS |
|---|---|---|
| Automation | Manual process [17] | Highly automated [17] |
| Quantification | Semi-quantitative [17] | Fully quantitative [3] [17] |
| Reproducibility | Variable, dependent on manual steps [17] | High, due to automated systems [3] [17] |
| Separation Medium | Polyacrylamide gel [3] | Replaceable polymer sieving matrix [3] [61] |
| Sample Throughput | Lower [17] | Higher and faster [62] [17] |
| Data Interpretation | Requires staining/destaining; image capture [17] | Real-time UV absorbance provides immediate results [3] [17] |
| Detection Sensitivity | Limited by staining efficiency | Can detect impurities as low as 0.1% [61] |
| Key Advantage | Familiarity, low initial cost | Superior resolution, automation, and quantitative data crucial for quality control [3] [62] |
A key differentiator is the ability of CE-SDS to resolve critical quality attributes that SDS-PAGE cannot. For instance, one study found that CE-SDS could easily detect nonglycosylated IgG, a species that was not resolved by SDS-PAGE [3]. Since glycosylation can significantly impact IgG function, this separation capability is a major advantage for CE-SDS in ensuring antibody quality [3].
Case Study: Direct Comparability of Anti-VEGF mAb Degradation Profiles
Experimental Design and Methodology
This case study is based on a forced degradation study that performed a head-to-head comparability assessment of a biosimilar candidate and its originator anti-VEGF mAb (sourced from both the United States and European Union) [21].
Sample Preparation:
- Antibody samples were diluted to a concentration of 1.0 mg/mL with SDS sample buffer [21].
- For non-reduced (nrCE-SDS) analysis, samples were alkylated with iodoacetamide (IAM) to prevent disulfide bond reformation [21].
- For reduced (rCE-SDS) analysis, disulfide bonds were broken using 2-mercaptoethanol (BME) [21].
- Samples were denatured by heating at 70°C for 3-10 minutes before injection [21].
Thermal Stress Protocol:
- Samples were subjected to thermal stress by incubation at two temperatures: 37°C (a physiologically relevant temperature) and 50°C (a more severe stress condition) [21] [60].
- Samples were analyzed at multiple time points: 3, 7, and 14 days [21].
- Control samples were stored at recommended conditions (2-8°C) until analysis [60].
CE-SDS Analysis:
- Instrumentation: Analysis was performed using a capillary electrophoresis system (e.g., PA 800 Plus system) with a bare fused-silica capillary [21].
- Injection & Separation: Samples were injected electrokinetically at 5 kV for 20 seconds. Separation was achieved in an electric field of 500 V/cm for approximately 35 minutes [21].
- Detection: Quantitative detection was performed via UV absorbance at 220 nm [21].
The following workflow diagram illustrates the key stages of this experimental process.
Key Findings and Quantitative Data
The study yielded quantitative data on the degradation profiles of the biosimilar and originator mAbs, which are summarized in the tables below.
Table 2: Key Findings from Non-Reduced CE-SDS (nrCE-SDS) Analysis of Thermally Stressed mAbs
| Sample Condition | Intact IgG (%) | Total LMW Fragments (%) | Key Observations |
|---|---|---|---|
| Control (Unstressed) | High (Major band) | Low (Minor band) | Single major band at ~150 kDa [3] |
| 37°C Stress (14 days) | Decrease | Time-dependent increase | More pronounced effects at 50°C [21] |
| 50°C Stress (14 days) | Significant Decrease | Significant Increase | Appearance of additional fragments (e.g., 300, 90, 25 kDa) [3] |
Table 3: Key Findings from Reduced CE-SDS (rCE-SDS) and Orthogonal Analyses (14-day stress)
| Analytical Method | Parameter Assessed | Biosimilar (BS) & Originator (OR) Findings |
|---|---|---|
| Reduced CE-SDS | Total Impurity Levels | Rapid increase at 50°C, with decrease in total light (L) and heavy (H) chain content [21] |
| Size-Exclusion UPLC | Aggregation (HMW Species) | Enhanced aggregation under thermal stress, more pronounced at 50°C [21] |
| LC-MS/MS | Post-Translational Modifications | Identified increased deamidation (Asn) and N-terminal pyroglutamic acid (pE) formation [21] |
The data demonstrated a clear time- and temperature-dependent increase in low-molecular-weight (LMW) fragments and a corresponding decrease in the intact mAb form [21]. Notably, the degradation profiles of the biosimilar and the two originator products were highly comparable, with no significant qualitative differences detected, thus underscoring the biosimilarity of the candidate product [21].
Essential Reagents and Research Tools for CE-SDS
Successful execution of CE-SDS analysis, as described in this case study, relies on a suite of specialized reagents and instruments.
Table 4: Research Reagent Solutions for CE-SDS Purity Analysis
| Item | Function/Description | Example Product/Kit |
|---|---|---|
| CE-SDS Analysis Kit | Provides optimized sieving polymer, SDS running buffer, and sample buffer for reproducible separations. | SDS-MW Analysis Kit (Sciex) [61] |
| Reducing Agent | Breaks disulfide bonds for analysis under reduced conditions (rCE-SDS). | 2-Mercaptoethanol (BME) [21] |
| Alkylating Agent | Alkylates free thiols to prevent reformation of disulfide bonds in non-reduced (nrCE-SDS) analysis. | Iodoacetamide (IAM) [21] |
| Capillary Cartridge | The separation pathway; bare fused-silica capillaries are standard for CE-SDS. | Pre-assembled BFS Capillary Cartridge [61] |
| Instrument Platform | Automated system for injection, separation, and UV detection. | PA 800 Plus System (Beckman) [3] [61] |
| Software | For instrument control, data acquisition, and peak quantitation. | 32 Karat Software (Beckman) [3] |
This case study powerfully illustrates that CE-SDS is an indispensable tool in the biopharmaceutical arsenal. It provides the high-resolution, quantitative, and reproducible data necessary for a direct and rigorous comparability assessment between biosimilar and originator mAbs [3] [21]. The demonstrated biosimilarity under forced degradation conditions not only builds confidence in the product's quality but also de-risks the development pathway [63] [60].
The transition from SDS-PAGE to CE-SDS represents more than just a technical upgrade; it signifies a commitment to higher analytical standards required by regulatory bodies like the USP, which has incorporated CE-SDS into its general chapter <129> [21] [17]. As the biopharmaceutical industry continues to evolve, CE-SDS will undoubtedly remain a cornerstone technique for ensuring the purity, stability, and overall quality of therapeutic antibodies.
Conclusion
The comparative analysis unequivocally establishes CE-SDS as the superior technology for antibody purity analysis in the modern biopharmaceutical landscape. While SDS-PAGE serves as a foundational technique, CE-SDS offers transformative advantages in automation, quantitative accuracy, resolution, and reproducibility, directly addressing the needs of quality control and regulatory compliance. The ability of CE-SDS to reliably detect critical quality attributes, such as nonglycosylated antibodies and low-abundance fragments, provides deeper insights into product stability and comparability, as evidenced in forced degradation and biosimilarity studies. As the industry continues to advance, the widespread adoption and continued optimization of CE-SDS will be paramount for ensuring the quality, safety, and efficacy of therapeutic antibodies, solidifying its role as the gold standard for characterization in both development and manufacturing environments.
References
- 1. The principle and method of polyacrylamide gel ... [https://www.mblbio.com/bio/g/support/method/sds-page.html]
- 2. SDS-PAGE: The science behind all those bubbles [https://www.antibodiesinc.com/pages/sds-page-demystified?srsltid=AfmBOorkDbpdiZiaLyFY-JyNYmRI3rN5Idm6kCWKIJSoFMM5cOHKOGoY]
- 3. Comparing SDS-PAGE and CE-SDS for Antibody Purity ... [https://www.bioprocessintl.com/qa-qc/comparing-sds-page-and-ce-sds-for-antibody-purity-analysis]
- 4. SDS-PAGE [https://en.wikipedia.org/wiki/SDS-PAGE]
- 5. Better Separation Resolution of New Biopharmaceutical ... [https://sciex.com/tech-notes/ce/better-separation-resolution-of-new-biopharmaceutical-modalities]
- 6. Monoclonal antibody CE-SDS purity analysis with ... [https://sciex.com/tech-notes/biopharma/monoclonal-antibody-ce-sds-purity-analysis-with-the-sciex-low-ph]
- 7. Native SDS-PAGE: High Resolution Electrophoretic ... [https://pmc.ncbi.nlm.nih.gov/articles/PMC4517606/]
- 8. What is SDS-PAGE? Uses, How It Works & Top Companies ... [https://www.linkedin.com/pulse/what-sds-page-uses-how-works-top-companies-2025-clearsedge-research-kztwf]
- 9. Advances in monoclonal antibody purity control [https://www.sciencedirect.com/science/article/abs/pii/S1046592825000671]
- 10. SDS-PAGE: A Cornerstone of Protein Analysis in Modern ... [https://www.metwarebio.com/sds-page-protein-analysis/]
- 11. SDS-PAGE Analysis of proteins: Principles, methodology, ... [https://deepscienceresearch.com/dsr/catalog/book/107/chapter/407]
- 12. Coomassie Staining and Destaining - Oslo [https://www.ous-research.no/no/enserink/Protocols/14535]
- 13. Protocol for Coomassie Staining [https://www.aatbio.com/resources/application-notes/protocol-for-coomassie-staining]
- 14. Protein Gel Staining Methods [https://www.thermofisher.com/us/en/home/life-science/protein-biology/protein-biology-learning-center/protein-biology-resource-library/pierce-protein-methods/protein-gel-stains.html]
- 15. Capillary Electrophoresis in the Biopharmaceutical Industry [https://www.chromatographyonline.com/view/capillary-electrophoresis-biopharmaceutical-industry-part-i]
- 16. Increasing the Throughput of CE-SDS Experiments for ... [https://chemrxiv.org/engage/chemrxiv/article-details/68127ee6927d1c2e6672faaa]
- 17. Resolve SDS-PAGE Disadvantages with CE-SDS [https://www.bio-techne.com/instruments/ice/advantages-ce-sds-over-sds-page]
- 18. Lightning capillary electrophoresis sodium dodecyl sulfate ... [https://sciex.com/tech-notes/ce/lightning-capillary-electrophoresis-sodium-dodecyl-sulfate-ce-sds-workflow-for-high-throughput-analysis-of-biotherapeutics]
- 19. Assessing Multi-Attribute Characterization of Enveloped ... [https://pmc.ncbi.nlm.nih.gov/articles/PMC9695396/]
- 20. Intermediate precision study of the CE-SDS assay on ... [https://sciex.com/tech-notes/biopharma/intermediate-precision-study-of-ce-sds-assay-on-biophase8800-with-native-fluorescence-detection]
- 21. Assessing the Comparability of Degradation Profiles ... [https://pmc.ncbi.nlm.nih.gov/articles/PMC12472202/]
- 22. SDS-PAGE Protocol [https://neutab.creative-biolabs.com/sds-page-analysis.htm]
- 23. Replaceable cross-linked polyacrylamide for high ... [https://pubmed.ncbi.nlm.nih.gov/15952750/]
- 24. Replaceable polymers in DNA sequencing by capillary ... [https://www.sciencedirect.com/science/article/abs/pii/S0958166997801620]
- 25. Unfolding of IgG domains detected by non-reducing SDS- ... [https://pmc.ncbi.nlm.nih.gov/articles/PMC6095737/]
- 26. Rapid identification of antibody impurities in size-based ... [https://www.nature.com/articles/s41598-024-70914-5]
- 27. Defining Critical Quality Attributes for Monoclonal Antibody ... [https://www.biopharminternational.com/view/defining-critical-quality-attributes-monoclonal-antibody-therapeutic-products]
- 28. Application of Analytical Quality by Design to the ... [https://www.sciencedirect.com/science/article/abs/pii/S0731708524004266]
- 29. Assessing monoclonal antibody product quality attribute ... [https://pmc.ncbi.nlm.nih.gov/articles/PMC2958571/]
- 30. Comparison of SEC and CE-SDS methods for monitoring ... [https://www.sciencedirect.com/science/article/abs/pii/S0731708517306374]
- 31. Method development and validation of capillary sodium ... [https://www.sciencedirect.com/science/article/abs/pii/S073170851000419X]
- 32. CE-SDS vs. SDS-PAGE for Antibody-Purity Analysis [https://www.linkedin.com/posts/gregory-mark_ce-in-qc-part-ii-ce-sds-method-development-activity-7221574957745541123-va9c]
- 33. [Optimization of sample preparation condition for sodium ... [https://pubmed.ncbi.nlm.nih.gov/31152519/]
- 34. Method development and validation of capillary sodium ... [https://www.sciencedirect.com/science/article/pii/S073170851000419X]
- 35. - Comparing With Maurice SDS - PAGE For Protein CE ... SDS Purity [https://www.cellandgene.com/doc/comparing-sds-page-with-maurice-ce-sds-for-protein-purity-analysis-0001]
- 36. Identification of a CE-SDS shoulder peak as disulfide ... [https://pmc.ncbi.nlm.nih.gov/articles/PMC8565840/]
- 37. A comparative study of CE-SDS, SDS-PAGE, and Simple ... [https://pubmed.ncbi.nlm.nih.gov/33185281/]
- 38. Introduction of a Capillary Gel Electrophoresis-Based ... [https://www.frontiersin.org/journals/bioengineering-and-biotechnology/articles/10.3389/fbioe.2022.839374/full]
- 39. Rapid baseline hump-free analysis of therapeutic proteins ... [https://www.sciencedirect.com/science/article/pii/S0003267025005410]
- 40. Characterization and elimination of artificial non-covalent ... [https://www.sciencedirect.com/science/article/abs/pii/S0731708520314138]
- 41. BioPhase 8800 system [https://sciex.com/products/capillary-electrophoresis/biophase-8800]
- 42. Optimization Approaches in the Routine Analysis of ... [https://www.chromatographyonline.com/view/optimization-approaches-routine-analysis-monoclonal-anitbodies-capillary-electrophoresis-0]
- 43. Fragmentation of monoclonal antibodies - PMC [https://pmc.ncbi.nlm.nih.gov/articles/PMC3149706/]
- 44. Application of MES and SDS buffer solution in reduction ... [https://patents.google.com/patent/CN112305048A/en]
- 45. Comparing SDS-PAGE with Maurice for Protein Purity ... [https://www.bio-techne.com/resources/literature/comparing-sds-page-maurice-ce-sds-protein-purity-analysis]
- 46. Quantification of Thiols and Disulfides - PMC - PubMed Central [https://pmc.ncbi.nlm.nih.gov/articles/PMC3766385/]
- 47. Evaluation and optimization of reduction and alkylation ... [https://pmc.ncbi.nlm.nih.gov/articles/PMC5698164/]
- 48. Development, validation, and implementation of capillary ... [https://pubmed.ncbi.nlm.nih.gov/20087870/]
- 49. Optimization of enzymatic hydrolysis for obtaining ... [https://www.sciencedirect.com/science/article/pii/S2772502225005773]
- 50. Denaturing mass photometry for rapid optimization of ... [https://www.nature.com/articles/s41467-024-47732-4]
- 51. Troubleshooting Sodium Dodecyl Sulfate- Polyacrylamide ... [https://www.hycultbiotech.com/sds-page/troubleshooting/]
- 52. Comparison of glycoprotein separation reveals greater ... [https://www.sciencedirect.com/science/article/abs/pii/S0731708519319922]
- 53. Troubleshooting SDS-PAGE Gel Running Issues [https://www.goldbio.com/blogs/articles/troubleshooting-sds-page-gel-running-issues?srsltid=AfmBOorglBSTVFJUmUFwfsZEngFcGbXqlS8FfYb6aiGNOzD_psgAZ3hu]
- 54. Analytical Quality by Design as applied to the development ... [https://www.sciencedirect.com/science/article/pii/S0731708524002607]
- 55. Application of Analytical Quality by Design to the ... [https://pubmed.ncbi.nlm.nih.gov/39083921/]
- 56. A comparative study of CE-SDS, SDS-PAGE, and Simple ... [https://pubmed.ncbi.nlm.nih.gov/33956358/]
- 57. high-throughput-ce-sds-protein-analysis-using-fully- ... [https://sciex.com/tech-notes/biopharma/high-throughput-ce-sds-protein-analysis-using-fully-automated-sa]
- 58. High-throughput capillary electrophoresis-sodium dodecyl ... [https://sciex.com/tech-notes/biopharma/high-throughput-capillary-electrophoresis-sodium-dodecyl-sulfate]
- 59. Implementation of USP antibody standard for system ... [https://www.sciencedirect.com/science/article/abs/pii/S0731708516303235]
- 60. Comparative Forced Degradation Study of Anticomplement ... [https://www.mdpi.com/1424-8247/18/4/579]
- 61. CE-SDS Biologics Purity Analysis Kit [https://sciex.com/products/consumables/ce-sds-kit]
- 62. Applications of CE SDS gel in development ... [https://pubmed.ncbi.nlm.nih.gov/18803223/]
- 63. Effects of thermal treatment on quality of biosimilar and ... [https://www.sciencedirect.com/science/article/pii/S2772582024000081]