Bridging the Divide: A Strategic Guide to Managing Intracellular vs. Extracellular Physicochemical Conditions in Biomedical Research
This article provides a comprehensive guide for researchers and drug development professionals on the critical, yet often overlooked, differences between intracellular and extracellular physicochemical environments.
Bridging the Divide: A Strategic Guide to Managing Intracellular vs. Extracellular Physicochemical Conditions in Biomedical Research
Abstract
This article provides a comprehensive guide for researchers and drug development professionals on the critical, yet often overlooked, differences between intracellular and extracellular physicochemical environments. It explores the foundational science behind these distinct conditions, presents methodological approaches for mimicking intracellular settings in vitro, offers troubleshooting strategies for common experimental discrepancies, and discusses validation techniques for translating findings from biochemical to cellular contexts. By synthesizing the latest research, this resource aims to bridge the gap between simplified assay conditions and complex biological reality, ultimately enhancing the predictive power and clinical relevance of preclinical research.
The Cellular Divide: Understanding Fundamental Intracellular vs. Extracellular Physicochemical Landscapes
Frequently Asked Questions
- What is the primary mechanism maintaining the K+/Na+ gradient? The sodium-potassium pump (Na+/K+-ATPase) is the primary active transport mechanism. For every ATP molecule hydrolyzed, it exports three sodium ions (Na+) out of the cell and imports two potassium ions (K+) in, working against their concentration gradients [1].
- My cell viability is dropping; could ionic imbalance be the cause? Yes. Failure of the Na+/K+ pumps can lead to cell swelling and lysis. The pump helps control cell volume by maintaining internal osmolarity. When the cell swells, the change in internal ion concentrations can automatically activate the Na+/K+ pump to restore volume [1].
- Why is the K+/Na+ gradient critical for drug development? This gradient is fundamental to cellular physiology. It drives the activity of numerous secondary active transporters that move nutrients like glucose and amino acids into cells [1]. The gradient is essential for nerve impulse transmission and muscle contraction [2], and disruptions can impair fundamental processes like ribosome function and enzyme activity [3] [4].
- How do magnesium and calcium factor into this ionic landscape? Magnesium (Mg²⁺) is crucial for stabilizing DNA and RNA structures, is a cofactor for many enzymes, and forms the functional Mg-ATP complex [3]. Calcium (Ca²⁺) acts as a key second messenger in cell signaling [5]. Their intracellular and extracellular concentrations are also tightly regulated.
- How can I experimentally modulate this ionic environment in my cell cultures? You can use ion-specific transporters or channel inhibitors (e.g., ouabain for Na+/K+-ATPase) [1]. The ionic composition of the cell culture medium can be precisely adjusted. Additionally, ionophores can be used to make membranes permeable to specific ions.
Troubleshooting Common Experimental Issues
Problem 1: Observed Cell Swelling and Decreased Viability
- Potential Cause: Compromised Na+/K+ pump activity, leading to osmotic imbalance.
- Investigation & Resolution:
- Verify Pump Function: Assess Na+/K+-ATPase activity using a commercial assay kit. Check the expression levels of pump subunits via western blot.
- Check Energetics: The pump consumes substantial ATP [1]. Measure intracellular ATP levels. Ensure an adequate energy supply, as the pump is linked to glycolysis in some cell types [1].
- Review Media: Confirm that your culture medium contains adequate K+ and glucose concentrations to support pump function.
Problem 2: Inconsistent Results in Electrophysiology or Flux Studies
- Potential Cause: Unaccounted-for variability in intracellular ion concentrations or pump regulation.
- Investigation & Resolution:
- Quantify Ions: Use precise methods like flame photometry or ICP-MS to directly measure intracellular K+ and Na+ levels in your samples [4].
- Control for Signaling: Be aware that the Na+/K+ pump can also function as a signal transducer, interacting with pathways like MAPK, which can be triggered by ligands binding to G-protein-coupled receptors (GPCRs) [1]. Control for these variables in your experimental design.
- Standardize Protocols: Ensure consistent cell passage numbers, confluence levels, and serum starvation times, as these can affect ionic homeostasis.
Problem 3: Unexpected Enzyme or Ribosomal Activity
- Potential Cause: Deviation from required ionic co-factor conditions.
- Investigation & Resolution:
- Optimize Buffers: Ensure your reaction or lysis buffers contain the necessary monovalent (K+) and divalent (e.g., Mg²⁺) ions at correct concentrations. Note that K+ and Na+ can compete for binding sites on macromolecules like the ribosome [3].
- Chelate Cautiously: If using chelators like EDTA or EGTA, be mindful that they can remove essential divalent cations like Mg²⁺, which is critical for the function of many enzymes, ribosomes, and RNA structures [3].
The tables below summarize the core ionic differences and the energy-dependent mechanism that maintains them.
| Ion & Primary Role | Typical Intracellular Fluid (ICF) Concentration | Typical Extracellular Fluid (ECF) Concentration | Key Biological Functions |
|---|---|---|---|
| Potassium (K⁺)Major intracellular cation | 100–140 mM [1] / 5–15 mM [1] (Note: ICF K+ is typically high) | 3.5–5 mM [1] | Maintains resting membrane potential; essential for enzyme activity; regulates cellular osmolarity [6] [2]. |
| Sodium (Na⁺)Major extracellular cation | 5–15 mM [1] | 135–145 mM [1] | Generates action potentials; maintains blood pressure/volume; drives secondary active transport [6] [2]. |
| Magnesium (Mg²⁺)Critical enzymatic cofactor | Elevated amounts [6] | Lower amounts | Stabilizes DNA/RNA structures; essential for ATP-dependent enzymes; required for ribosome function [3]. |
| Calcium (Ca²⁺)Key signaling ion | Very low (~100 nM resting) | ~1–2 mM [5] | Acts as a second messenger; triggers exocytosis, muscle contraction, and apoptosis [5]. |
Table 1: Comparison of Major Ion Concentrations and Functions in Body Fluid Compartments. Concentrations are approximate and can vary by cell type. The high intracellular K+ and low Na+ are maintained by the Na+/K+ ATPase pump against a steep concentration gradient [6] [1].
| Parameter | Specification |
|---|---|
| Ion Stoichiometry | 3 Na⁺ exported out / 2 K⁺ imported in per cycle [1]. |
| Energy Consumption | Consumes one ATP molecule per cycle [1]. Can account for 30-70% of a cell's ATP expenditure (up to 3/4 in neurons) [1]. |
| Electrogenic Effect | Net export of one positive charge per cycle, contributing to the negative interior of the cell membrane [1]. |
| Primary Inhibitors | Ouabain and other cardiac glycosides [1]. |
| Key Regulatory Factors | Upregulated by cAMP and associated signaling pathways; regulated by reversible phosphorylation and inositol pyrophosphates [1]. |
Table 2: Key Properties of the Sodium-Potassium Pump (Na⁺/K⁺-ATPase).
Detailed Experimental Protocols
Protocol 1: Measuring Intracellular K⁺ and Na⁺ via Flame Photometry or ICP-MS
This protocol provides a method for directly quantifying intracellular ion content.
- Principle: Cells are harvested, washed free of extracellular ions, and digested. The ion content of the lysate is then measured against standard curves.
- Key Reagent Solutions:
- Ice-cold Washing Buffer: 300 mM Sucrose, 10 mM HEPES, 1 mM MgCl₂ (pH 7.4). The non-ionic sucrose maintains osmolarity without adding ions.
- Lysis/Digestion Solution: 1% (v/v) Ultrapure Nitric Acid or 0.5% (w/v) Sodium Dodecyl Sulfate (SDS).
- Workflow:
- Cell Harvesting: Grow cells to 80-90% confluence. Wash the monolayer twice with ice-cold washing buffer to remove all traces of culture medium.
- Lysate Preparation: Lyse the cells directly on the plate with a known volume of lysis/digestion solution. Scrape and transfer the lysate to a microcentrifuge tube. Incubate for 1 hour at room temperature or overnight at 4°C.
- Clarification: Centrifuge the lysate at 12,000 × g for 10 minutes to remove insoluble debris.
- Dilution: Dilute the supernatant appropriately with deionized water for analysis.
- Measurement: Analyze the samples using flame photometry or Inductively Coupled Plasma Mass Spectrometry (ICP-MS). Compare readings to standard curves prepared from known concentrations of K⁺ and Na⁺.
- Normalization: Determine the protein content of a parallel, unlysed sample using a Bradford or BCA assay. Express ion concentrations as mmol/mg of protein.
Diagram 1: Workflow for Measuring Intracellular Ions.
Protocol 2: Assessing Na⁺/K⁺-ATPase Pump Activity
This protocol measures the hydrolytic activity of the pump by quantifying inorganic phosphate release.
- Principle: In a controlled assay buffer, the hydrolysis of ATP by the Na⁺/K⁺-ATPase produces ADP and inorganic phosphate (Pi). The Pi is quantified colorimetrically.
- Key Reagent Solutions:
- Assay Buffer (with ions): 20 mM HEPES (pH 7.4), 130 mM NaCl, 20 mM KCl, 3 mM MgCl₂, 1 mM EGTA.
- Assay Buffer (ion-free control): 20 mM HEPES (pH 7.4), 130 mM Choline Chloride, 20 mM Choline Chloride, 3 mM MgCl₂, 1 mM EGTA. (Ouabain can also be used as a specific inhibitor control).
- ATP Solution: 5 mM ATP in assay buffer.
- Stop/Colorimetric Reagent: Malachite Green-based phosphate detection kit.
- Workflow:
- Sample Preparation: Prepare a cell membrane fraction or use whole cells permeabilized with a low concentration of digitonin.
- Reaction Setup: Incubate samples in both the ion-containing and ion-free (or ouabain-containing) assay buffers for 5 minutes at 37°C.
- Initiate Reaction: Start the reaction by adding the ATP solution. Incubate for 30-60 minutes at 37°C.
- Stop Reaction: Add the stop/colorimetric reagent to terminate the reaction.
- Measurement: Measure the absorbance at 620-660 nm after color development. The ouabain-sensitive or ion-dependent activity (difference between the two buffers) represents the specific Na⁺/K⁺-ATPase activity.
- Calculation: Calculate the Pi released using a standard curve and normalize to the protein content of the sample.
Diagram 2: Na⁺/K⁺-ATPase Activity Assay Workflow.
The Scientist's Toolkit: Essential Research Reagents
| Reagent / Material | Function in Research |
|---|---|
| Ouabain | A specific, high-affinity inhibitor of the Na⁺/K⁺-ATPase. Used to block pump activity in control experiments and to study pump-dependent signaling [1]. |
| Sucrose-based Washing Buffer | An iso-osmotic, ion-free solution used to wash cells before ion measurement, preventing efflux/influx of ions during the washing process. |
| Digitonin | A mild detergent used to selectively permeabilize the plasma membrane without disrupting intracellular organelles. Allows controlled access to the cytosol for introducing probes or substrates. |
| Flame Photometer / ICP-MS | Analytical instruments for precise quantification of elemental ion concentrations (K⁺, Na⁺, Mg²⁺, Ca²⁺) in biological samples [4]. |
| Malachite Green Phosphate Assay Kit | A colorimetric method for sensitive detection of inorganic phosphate (Pi), used to measure ATPase enzyme activity like that of the Na⁺/K⁺-ATPase. |
| cAMP Modulators (e.g., Forskolin) | Pharmacological agents used to increase intracellular cAMP levels, which upregulates Na⁺/K⁺-ATPase activity, allowing researchers to study its regulation [1]. |
| Ionophores (e.g., Nigericin) | Compounds that make lipid membranes permeable to specific ions (e.g., K⁺), used to experimentally collapse ion gradients. |
Key Signaling and Metabolic Pathways
The Na⁺/K⁺-ATPase is not just an ion pump; it is a nexus for cellular signaling.
Diagram 3: Na⁺/K⁺-ATPase Signal Transduction.
The Impact of Macromolecular Crowding and Cytoplasmic Viscosity on Molecular Interactions
FAQs: Macromolecular Crowding and Cytoplasmic Viscosity
1. What is macromolecular crowding and why is it important for in vitro experiments? Macromolecular crowding refers to the effects induced by a high total concentration of macromolecules (typically 100 g/L or higher) in a solution, which occupies a significant portion of the total volume [7]. The intracellular environment is densely packed, with macromolecules occupying 5–40% of the total cellular volume [8]. This is crucial for in vitro experiments because crowding strongly affects biochemical reactions by reducing the available solvent volume for other molecules. This excluded-volume effect can significantly alter thermodynamic activity, protein folding, molecular diffusion, and association rates compared to ideal, dilute buffer conditions typically used in labs [7] [8] [9]. Ignoring this can lead to a poor correlation between in vitro biochemical assay results and cellular activity [10].
2. How does cytoplasmic viscosity differ from bulk viscosity, and how does it affect molecular diffusion? The effective viscosity experienced by a molecule inside a cell depends on its size, unlike the macroscopic viscosity of a simple liquid. Smaller molecules experience a lower effective viscosity, while larger ones experience a viscosity closer to the macroscopic value of the cytoplasm [9]. This is described as length-scale dependent viscosity [9]. Consequently, the diffusion coefficient (D) of a molecule in the cytoplasm becomes dependent on its hydrodynamic radius (rp). For example, in HeLa cells, a probe with a radius much smaller than the characteristic crowding length scales (~5 nm) will diffuse more freely than a large protein complex, which will be severely hindered [9]. This relationship means the standard Stokes-Einstein equation, which assumes a uniform viscosity, often fails to accurately predict diffusion inside cells.
3. My in-cell NMR signals show protein destabilization, but crowding theory predicts stabilization. What could be the cause? While simple excluded volume models predict that crowding should stabilize more compact, native protein structures, experimental observations like yours are not uncommon. Atomistic simulations of a bacterial cytoplasm suggest that non-specific protein-protein interactions can sometimes destabilize native structures [11]. In these cases, favorable, shape-driven van der Waals interactions with other crowders can overcome the stabilizing excluded volume effect, leading to partial unfolding [11]. Therefore, the net effect of the cellular environment is a balance between excluded volume (which favors compaction) and weak, non-specific chemical interactions (which can favor compaction or destabilization).
4. How can I mimic intracellular crowding and viscosity in my test tube assays? To better approximate intracellular conditions, you can use crowding agents in your assay buffers. Common agents and their characteristics include:
- Dextran: A linear glucose polymer that increases both crowding and solution viscosity [7].
- Ficoll: A highly branched, synthetic sucrose polymer. It is often used to create a strong crowding effect with a relatively lower impact on solution viscosity compared to linear polymers of similar molecular weight [7] [9].
- Polyethylene Glycol (PEG): A flexible linear polymer frequently used in crowding studies. Its solutions have been used to model the length-scale dependent viscous response of the cytoplasm [9]. The choice of agent and its concentration should be tailored to the specific process under study, as different polymers can have varying effects on reaction rates and assembly processes [7].
Troubleshooting Guides
Guide 1: Discrepancies Between Biochemical and Cellular Assay Results
Problem: The binding affinity (Kd) or activity of a compound measured in a purified in vitro system does not match the activity observed in subsequent cellular assays.
| Possible Cause | Experimental Checks & Solutions |
|---|---|
| Neglect of Crowding Effects | Check: Compare your dilute buffer conditions (e.g., PBS) to intracellular estimates. Solution: Repeat the binding assay in a buffer containing crowding agents (e.g., 100-200 g/L Ficoll 70 or dextran) to see if the measured Kd shifts closer to the cellular value [10]. |
| Altered Molecular Diffusion | Check: Literature review on the diffusion coefficient of your target molecule in cells. Solution: If the reaction is diffusion-limited, the rate in cells will be slower. Consider that crowding can increase association rates for some proteins but decrease diffusion-limited reaction rates [8] [9]. |
| Non-Specific Interactions | Check: Test for compound aggregation or binding to other cellular macromolecules. Solution: The crowded environment increases the chance of weak, non-specific interactions, which can sequester your compound and reduce its effective concentration [11]. |
Step-by-Step Verification Protocol:
- Identify the Discrepancy: Quantify the difference between the in vitro IC50 and the cellular EC50.
- Replicate with Crowding: Perform the in vitro binding or activity assay using a buffer containing ~100 g/L of a crowding agent like Ficoll 70 or a mix of crowders to more closely mimic the cytoplasmic environment [7] [10].
- Check for Stability: Verify that your protein target and the compound are stable in the crowded buffer and do not precipitate.
- Analyze: Determine if the new Kd or IC50 measured under crowded conditions more accurately predicts the cellular activity.
Guide 2: Low Efficiency in Intracellular Delivery of Macromolecules
Problem: Low transfection efficiency or poor delivery of DNA, proteins, or other large molecules into cells for functional studies.
| Possible Cause | Experimental Checks & Solutions |
|---|---|
| Barrier of Crowded Cytoplasm | Check: Review the size of your macromolecule. Solution: The highly crowded cytoplasm significantly hinders the diffusion of large molecules [9]. Consider using smaller constructs or tags if possible. |
| Inefficient Delivery Method | Check: Evaluate the efficiency of your current transfection method (e.g., lipofection, electroporation). Solution: For difficult-to-transfect cells, investigate advanced physical methods. For example, coupling nanostraws with an electric field has been shown to significantly improve DNA transfection efficiency across various cell lines by directly penetrating the membrane and bypassing endocytosis [12]. |
| Cytoplasmic Viscosity | Check: The hydrodynamic radius of your delivered molecule. Solution: Be aware that once inside the cell, the effective cytoplasmic viscosity will slow down the movement of your molecule to its target site, which could delay the observable effect [9]. |
Table 1: Effects of Macromolecular Crowding on Biomolecular Processes
This table summarizes key quantitative findings on how crowding impacts various molecular properties and reactions.
| Process or Property | Change in Crowded Environment | Magnitude of Effect & Conditions | Reference |
|---|---|---|---|
| Protein Diffusion (in cells) | Decreased | Up to 10-100 fold reduction for GFP-sized proteins; effect is size-dependent [9]. | [8] [9] |
| Protein Association Rates | Increased | Up to 10-fold increase for protein-protein associations due to excluded volume effects [8]. | [8] |
| Protein Stability (Native State) | Variable | Can be increased (by ~kJ/mol) due to excluded volume or decreased due to non-specific interactions [11]. | [11] |
| Enzyme Activity | Variable | May increase or decrease; e.g., can promote structural changes that enhance activity (PGK) [11]. | [11] |
| Gene Expression | Altered | Crowding can enhance transcription factor binding and modulate expression levels [9]. | [9] |
Table 2: Key Reagent Solutions for Mimicking Intracellular Environments
A selection of common reagents used to study crowding effects in vitro.
| Research Reagent | Function & Mechanism | Example Application & Notes |
|---|---|---|
| Ficoll 70 | Branched polymer crowder; provides strong excluded volume effect with relatively low viscosity increase. | Used at 50-200 g/L to mimic cytoplasmic crowding in protein folding and association studies [7]. |
| Dextran | Linear polymer crowder; increases both excluded volume and solution viscosity. | Used to study the separate effects of crowding and viscosity, e.g., in cellulose synthesis at 5-20% w/v [7]. |
| Polyethylene Glycol (PEG) | Flexible linear polymer; used as a crowder and to model length-scale dependent viscosity. | Common in protein folding/precipitation studies; various molecular weights used (e.g., PEG 1000-8000) [9] [11]. |
| Cytomimetic Buffer | A buffer system incorporating crowders, metabolites, and ions to mimic cytoplasmic physicochemical conditions. | Used for in vitro assays to bridge the gap with cellular data; composition is actively researched [10]. |
Experimental Protocols
Protocol 1: Measuring Protein Diffusion in Crowded EnvironmentsIn Vitro
Objective: To quantify the reduction in the diffusion coefficient of a protein of interest in the presence of macromolecular crowders using fluorescence recovery after photobleaching (FRAP).
Key Materials:
- Purified, fluorescently labeled protein.
- Crowding agents (e.g., Ficoll 70, dextran).
- Assay buffer.
- Confocal microscope with FRAP capability.
- Glass-bottom dish or chamber slides.
Methodology:
- Sample Preparation:
- Prepare a solution of your fluorescent protein (e.g., 1 µM) in assay buffer.
- Prepare identical protein solutions containing various concentrations (e.g., 50, 100, 150 g/L) of your chosen crowding agent.
- Ensure all solutions are properly mixed and equilibrated to the experimental temperature.
- Data Acquisition:
- Place a droplet of the sample on the microscope stage.
- Select a region of interest (ROI) for photobleaching using a high-intensity laser pulse.
- Monitor the recovery of fluorescence into the bleached area over time.
- Perform multiple replicates for each condition.
- Data Analysis:
- Fit the fluorescence recovery curves to an appropriate diffusion model to obtain the diffusion coefficient (D).
- Normalize the diffusion coefficient in crowded solutions (D) to that in buffer alone (D0).
- Plot D/D0 as a function of crowder concentration and probe size to characterize the crowding effect [9].
Protocol 2: Assessing Protein-Ligand Binding under Crowded Conditions
Objective: To determine the dissociation constant (Kd) of a protein-ligand interaction in the presence and absence of crowding agents.
Key Materials:
- Purified protein and ligand.
- Crowding agents (e.g., Ficoll 70).
- Equipment for binding measurement (e.g., Isothermal Titration Calorimetry (ITC), Surface Plasmon Resonance (SPR), or fluorescence anisotropy).
Methodology:
- Buffer Preparation:
- Prepare a standard assay buffer.
- Prepare an identical buffer containing your chosen crowding agent (e.g., 100 g/L Ficoll 70).
- Binding Experiment:
- Perform your standard binding assay (e.g., ITC titration) using the protein and ligand in the standard buffer.
- Repeat the exact same experiment using the protein and ligand prepared in the crowding buffer.
- Crucially, ensure the crowder is present in all solutions (protein, ligand, and syringe) to avoid osmotic shock during the experiment.
- Data Analysis:
- For each experiment, fit the binding isotherm to obtain the Kd.
- Compare the Kd values from the crowded and non-crowded experiments.
- A change in Kd indicates that macromolecular crowding influences the binding thermodynamics, which may explain discrepancies with cellular assays [10].
Conceptual Diagrams
Diagram 1: Crowding Effects on Molecular Processes
Diagram Title: Cellular Crowding Effects on Molecules
This diagram illustrates the major effects of macromolecular crowding on key biomolecular processes, highlighting the common discrepancies (in vitro vs. in vivo) that researchers must manage.
Diagram 2: Troubleshooting Assay Discrepancies
Diagram Title: Troubleshooting Assay Discrepancies Flowchart
This troubleshooting flowchart provides a logical pathway for diagnosing common causes of disparity between simplified in vitro experiments and results obtained in a cellular context.
Technical Support Center
Troubleshooting Guides
Issue 1: Inaccurate or Inconsistent Intracellular Redox Potential Measurements
- Problem: Reported redox potential values vary significantly between cell samples or do not align with expected physiological ranges.
- Investigation & Solution:
- Confirm Sensor Calibration: Ensure SERS nanosensors are calibrated for both redox potential and pH before each experiment, as pH influences redox measurements [13].
- Check for Chemical Interference: Review your cell culture medium composition. Certain components or metabolites can interfere with nanosensor function.
- Verify Specificity: Confirm that the nanosensors are specifically targeted to the cytosolic compartment and not localizing to organelles with different redox conditions.
Issue 2: Difficulty Maintaining Stable Physico-Chemical Conditions in Cell Culture
- Problem: The pH of the culture medium drifts during experiments, compromising the validity of measurements related to both pH and redox potential [14].
- Investigation & Solution:
- Inspect CO₂ Supply: For CO₂-bicarbonate buffered systems, ensure the incubator is maintaining a consistent 5% CO₂ atmosphere. Check for leaks or calibration drift in the CO₂ sensor [14].
- Assess Bicarbonate Levels: Confirm that the culture medium contains an adequate concentration of sodium bicarbonate for the CO₂ level used.
- Use pH Indicators: Utilize media containing phenol red as a visual pH indicator (yellow at pH < 6.8, purple at pH > 8.2) for a quick check of culture conditions [14].
- Control Temperature: Maintain culture temperature at 36°C to 37°C to prevent thermal shock and ensure normal cellular metabolism [14].
Issue 3: Low Signal or Poor Quality from SERS Nanosensors
- Problem: The signal obtained from the nanosensors is weak, leading to poor-quality data for redox and pH quantification.
- Investigation & Solution:
- Optimize Nanosensor Concentration: Titrate the concentration of nanosensors used for cell incubation to find the optimal balance between sufficient signal and minimal cellular disruption.
- Confirm Cellular Uptake: Use microscopy to verify that nanosensors are effectively internalized into the live cells of interest [13].
- Check Laser Alignment and Power: Ensure the Raman spectroscopy system is properly aligned and that laser power is optimized to obtain a strong signal without damaging the cells.
Frequently Asked Questions (FAQs)
Q1: Why is it essential to measure both redox potential and pH simultaneously in live cells? The intracellular redox potential is critically involved in cellular health and function, and its dysregulation is linked to numerous diseases. Crucially, redox potential is determined not only by the balance of oxidants and reductants but also by pH. Therefore, for a quantitative and accurate understanding, a technique that can multiplex both measurements is highly desirable [13].
Q2: What is the primary functional difference between intracellular and extracellular fluid? The primary difference lies in their location and composition. Intracellular fluid (ICF) is found inside cells and is the site of many biochemical reactions. Extracellular fluid (ECF) surrounds cells and is the medium for intercellular communication and transport [15] [16]. Their distinct compositions are maintained by the plasma membrane.
Q3: My research involves isolating a specific intracellular enzyme. Why must I carefully control the lysis buffer conditions? During cell lysis, the intracellular environment is exposed to artificial conditions. Using an inappropriate buffer pH or osmolarity can denature your target enzyme or activate proteases, drastically reducing yield and activity. The buffer must mimic key intracellular physico-chemical conditions to maintain enzyme stability and function.
Q4: What are some key indicators of poor physico-chemical control in my cell cultures? Key indicators include:
- Rapid color change of phenol red in the medium (indicating pH drift) [14].
- Changes in cell morphology or reduced viability/growth rates.
- High variability in experimental results between replicates, especially in sensitive assays like redox potential measurements.
Table 1: Characteristic Ion Concentrations in Body Fluid Compartments
Data derived from physiological compilations [16].
| Ion / Component | Intracellular Fluid (ICF) Concentration | Extracellular Fluid (ECF) Concentration |
|---|---|---|
| Sodium (Na⁺) | Low | High |
| Potassium (K⁺) | High | Low |
| Chloride (Cl⁻) | Low | High |
| Bicarbonate | Low | High |
| Magnesium (Mg²⁺) | High | Low |
| Phosphate | High | Low |
| Proteins | High | Low (in interstitial fluid) |
Table 2: Typical Physico-Cultural Conditions for Mammalian Cell Lines
Standard in vitro culture parameters [14].
| Parameter | Typical Optimal Value/Range | Importance & Notes |
|---|---|---|
| pH | 7.4 | Critical for enzyme function and overall cell health; tightly regulated in vivo. |
| CO₂ | 5% | Standard atmospheric level used in conjunction with bicarbonate buffer to maintain physiological pH. |
| Temperature | 36°C to 37°C | Matches mammalian body temperature to support optimal growth and metabolism. Prevents thermal shock. |
| Osmolarity | ~290 mOsm/kg [16] | Must be controlled to prevent osmotic stress and water shift between intracellular and extracellular compartments. |
Experimental Protocol: Simultaneous Intracellular Redox and pH Measurement
Title: Multiplexed Measurement of Intracellular Redox Potential and pH in Live Single Cells Using SERS Nanosensors [13]
Objective: To quantitatively measure both redox potential and pH within the cytosol of live cells simultaneously.
Materials:
- SERS nanosensors functionalized for redox and pH response
- Appropriate mammalian cell line
- Standard cell culture equipment (CO₂ incubator, biosafety cabinet)
- Confocal Raman microscope (or similar SERS-capable system)
- Culture medium
Methodology:
- Sensor Preparation & Calibration: Calibrate the SERS nanosensors in solutions of known redox potential and pH to establish a standard curve for each parameter.
- Cell Preparation & Incubation: Culture cells according to standard protocols. Incubate the calibrated SERS nanosensors with the live cells to allow for cellular uptake and localization within the cytosol [13].
- Data Acquisition: Place the culture dish on the microscope stage. For single-cell analysis, locate a viable cell. Acquire SERS spectra from the nanosensors inside the cell. The spectral features (e.g., peak shifts or intensity ratios) will be specific to the local redox potential and pH [13].
- Data Analysis: Correlate the acquired SERS spectra against the pre-established calibration curves to derive quantitative values for both intracellular redox potential and pH simultaneously [13].
Conceptual and Workflow Diagrams
DOT Script: Cellular Ion Gradients
DOT Script: SERS Measurement Workflow
The Scientist's Toolkit
Table 3: Key Research Reagent Solutions
| Reagent / Material | Primary Function in Research |
|---|---|
| SERS Nanosensors | Functionalized nanoparticles enabling multiplexed, quantitative measurement of intracellular parameters like redox potential and pH in live single cells through Surface Enhanced Raman Scattering [13]. |
| CO₂-Bicarbonate Buffer | A buffering system used in cell culture media to maintain a stable physiological pH (around 7.4) by balancing dissolved carbon dioxide and bicarbonate ions [14]. |
| Phenol Red | A pH indicator added to cell culture media; provides a visual cue for pH status (e.g., yellow at acidic pH, red at physiological pH, purple at basic pH) [14]. |
| Lysis Buffers | Solutions designed to disrupt cell membranes while preserving the native state of intracellular components (e.g., proteins, enzymes) by maintaining appropriate pH, osmolarity, and ionic strength. |
| Ionophores & Chemical Probes | Small molecules that can selectively transport ions across membranes or fluoresce in response to specific ions (e.g., Ca²⁺, H⁺), used to manipulate or measure ion gradients. |
Why Standard Buffers Like PBS Fail to Replicate the Intracellular Environment
Frequently Asked Questions (FAQs)
Q1: What is the main limitation of using PBS in biochemical assays? The primary limitation is that PBS does not mimic the complex intracellular environment. Biochemical assays performed in PBS measure activity under idealized, simple-salt conditions, which can differ significantly from the crowded, viscous, and compositionally distinct environment inside a cell. This often leads to discrepancies between biochemical data (e.g., binding affinity) and observed activity in cellular assays [10].
Q2: My drug compound shows high binding affinity in a PBS-based assay but low cellular activity. Could PBS be the cause? Yes, this is a common issue. The simplified conditions in PBS, including its specific ionic strength, pH, and lack of macromolecular crowding, can alter the true binding affinity (Kd) of a compound. The intracellular environment can change how both the drug and its target behave, leading to a mismatch between in vitro and cellular results [10].
Q3: Besides PBS, what other factors contribute to the gap between biochemical and cellular assay results? While the buffer is a key factor, other compound-specific properties are also often involved. These include the compound's cell permeability, solubility in a cellular context, specificity for the intended target, and metabolic stability inside the cell [10].
Q4: What are the key physicochemical parameters of the intracellular space that PBS fails to replicate? PBS is designed to mimic the osmolarity and ion concentrations of blood and other extracellular fluids, not the inside of a cell. The intracellular space, or cytoplasm, has a different profile in several key aspects [17] [10] [18]. The table below summarizes the fundamental differences.
Table 1: Key Differences Between PBS and the Intracellular Environment
| Physicochemical Parameter | Standard PBS | Intracellular Environment (Cytoplasm) |
|---|---|---|
| Macromolecular Crowding | Low | High |
| Viscosity | Low, water-like | High, gel-like |
| Ionic Composition | High Na+, Low K+ | Low Na+, High K+ |
| Redox Environment | Oxidizing | Reducing |
| Primary Role | Maintain pH and osmolarity outside the cell | Facilitate complex biochemical reactions inside the cell |
Troubleshooting Guide: Addressing PBS-Related Experimental Discrepancies
Problem: Inconsistency between biochemical binding data and cellular activity.
This guide will help you systematically determine if your buffer conditions are contributing to misleading results.
Step 1: Repeat the Experiment
- Unless cost or time prohibitive, first repeat the biochemical assay to rule out simple human error or technical mistakes [19].
Step 2: Validate with Appropriate Controls
- Introduce a positive control—a compound with known performance in both biochemical and cellular assays for your target. If it also shows a discrepancy, the assay conditions are likely a key variable [19].
Step 3: Evaluate Your Buffer System
- Question the Relevance: Ask if PBS is the right buffer for your experiment. Is your target located inside the cell? If so, a buffer that better mimics cytoplasmic conditions may be necessary [10].
- Check for Precipitation: Note that PBS will precipitate in the presence of divalent metals like zinc. If your assay involves such ions, PBS is unsuitable [20] [17].
Step 4: Systematically Change Variables
- If you suspect PBS is a problem, begin testing alternative buffers. Change only one variable at a time to clearly identify the cause of improvement [19]. For example, compare results in PBS against a buffer with:
- High K+ / Low Na+ concentrations.
- Macromolecular crowding agents (e.g., Ficoll, PEG).
- A reducing agent to mimic the intracellular redox state.
- If you suspect PBS is a problem, begin testing alternative buffers. Change only one variable at a time to clearly identify the cause of improvement [19]. For example, compare results in PBS against a buffer with:
Step 5: Document Everything
- Keep detailed notes on the exact buffer compositions, pH, and results for each experiment. This is crucial for reproducing successful conditions and understanding the influence of each parameter [19].
The following diagram illustrates this troubleshooting workflow.
Quantitative Comparison: PBS vs. Intracellular Conditions
To understand why PBS is a poor substitute for the intracellular environment, it is helpful to compare their specific ionic compositions. The table below details the standard formulation for 1X PBS and the estimated ionic concentrations in a typical mammalian cell.
Table 2: Ionic Composition of PBS vs. Typical Intracellular Conditions
| Component | Concentration in 1X PBS (mmol/L) | Concentration in PBS (g/L) | Estimated Typical Intracellular Concentration (mmol/L) |
|---|---|---|---|
| Na+ | 157 [17] | - | ~5-15 (Low) |
| Cl- | 140 [17] | - | ~5-15 (Low) |
| K+ | 4.45 [17] | - | ~140 (High) |
| HPO42- | 10.1 [17] | - | Varies |
| H2PO4- | 1.76 [17] | - | Varies |
| NaCl | - | 8.0 [17] | - |
| KCl | - | 0.2 [17] | - |
| Na₂HPO₄ | - | 1.15 [17] | - |
| KH₂PO₄ | - | 0.2 [17] | - |
The Scientist's Toolkit: Key Research Reagent Solutions
When moving beyond standard PBS, consider these reagents and materials to create more physiologically relevant assay conditions.
Table 3: Essential Reagents for Intracellular Environment Research
| Reagent / Material | Function & Explanation |
|---|---|
| Potassium-based Buffers | Used to create buffers with high K+ / low Na+ concentration, mirroring the cytoplasmic ionic balance rather than extracellular fluid like PBS. |
| Macromolecular Crowding Agents | Agents like Ficoll PM-70 or PEG are used to simulate the highly crowded interior of a cell, which can dramatically influence protein folding, binding affinity, and reaction rates. |
| DTT (Dithiothreitol) or TCEP | Reducing agents added to buffer systems to maintain a reducing environment similar to the cytoplasm, which is crucial for the stability of many proteins and biomolecules. |
| HEPES Buffer | A well-buffered substance for maintaining physiological pH in cell culture and biochemical experiments, often used as an alternative to phosphate buffers. |
| PBS (Phosphate Buffered Saline) | A standard isotonic buffer for extracellular applications, such as washing cells, diluting substances, and transporting tissues. It is not suitable for mimicking intracellular conditions [20] [17]. |
Experimental Protocol: Microinjection to Study Protein Conformation in Cells
This protocol, based on published research, details how to directly study protein behavior inside living cells, bypassing the limitations of external buffers [21].
Objective: To investigate the conformational changes of an intrinsically disordered protein (e.g., α-Synuclein) upon binding to intracellular membranes.
Background: In vitro experiments in PBS suggested the protein gains structure upon membrane binding, but in-cell studies failed to confirm this. This protocol uses microinjection and FRET to resolve this contradiction [21].
Workflow Diagram:
Materials:
- Purified protein of interest (e.g., α-Synuclein)
- FRET donor and acceptor dyes (e.g., Cy3 and Cy5)
- SH-SY5Y or other relevant cell line
- Microinjection system
- Confocal fluorescence microscope with FRET capability
- Cell culture reagents and labware
Methodology:
- Protein Preparation and Labeling:
- Purify the protein of interest and label it with a pair of FRET-compatible dyes.
- Confirm the labeling efficiency and protein function in vitro.
Cell Preparation and Microinjection:
- Culture cells on an appropriate imaging dish until they reach a suitable confluency.
- Using a microinjection system, inject a small volume of the labeled protein solution directly into the cytoplasm of the cells.
FRET Measurement and Analysis:
- Place the injected cells on a confocal microscope.
- Acquire FRET images over time to monitor the protein's behavior.
- Calculate FRET efficiency, which is inversely related to the distance between the two dyes, providing a measure of protein conformation.
Data Interpretation:
- Compare the FRET efficiency of the protein in the cytosol versus when bound to intracellular membranes.
- The identification of different FRET efficiencies confirms the existence of distinct conformational subensembles inside the living cell, a finding that simple buffer-based experiments could not reveal [21].
Frequently Asked Questions (FAQs)
1. What is the fundamental difference between Kd, Ki, and IC50?
Answer: Kd (Dissociation Constant) and Ki (Inhibition Constant) are both intrinsic affinity measures. The Kd describes the equilibrium between a ligand and its binding partner, while the Ki is a specific type of Kd for an enzyme inhibitor [22]. In contrast, IC50 (Half-Maximal Inhibitory Concentration) is a functional potency measure of the concentration needed to reduce a biological activity by half under specific experimental conditions [22] [23].
The key difference is that Kd and Ki are true constants reflecting binding affinity, whereas IC50 is an operational parameter that can be influenced by experimental conditions like enzyme and substrate concentrations [24] [22]. The following table summarizes their core differences:
| Parameter | Definition | Dependence on Conditions | Reports On |
|---|---|---|---|
| Kd | Dissociation constant for a ligand-receptor complex | Independent of concentration; an intrinsic property [23] | Binding Affinity |
| Ki | Dissociation constant for an enzyme-inhibitor complex | Independent of enzyme concentration (but may depend on substrate) [22] | Binding Affinity |
| IC50 | Concentration reducing activity to 50% | Highly dependent on enzyme and substrate concentrations, pH, temperature, etc. [24] [22] | Functional Potency |
2. Why do my IC50 values from biochemical assays differ from those in cellular assays?
Answer: Discrepancies between biochemical and cellular IC50 values are common and often stem from the vast differences in physicochemical conditions between simplified in vitro buffers and the complex intracellular environment [10]. Key factors include:
- Molecular Crowding & Viscosity: The crowded cellular interior can alter diffusion rates and binding equilibria [10].
- pH & Ionic Composition: The cytoplasmic pH and salt composition differ from common assay buffers like PBS, which can directly impact a compound's protonation state, solubility, and binding affinity (Kd) [10].
- Cellular Permeability & Efflux: In cells, the compound must cross membranes and avoid export pumps, which biochemical assays do not account for [22].
To bridge this gap, consider performing biochemical measurements under conditions that more accurately mimic the intracellular environment [10].
3. How does substrate concentration specifically affect my measured IC50?
Answer: The effect of substrate concentration on your IC50 is dictated by the mechanism of inhibition [22]. The relationship is mathematically defined for common mechanisms, as shown in the table below. Failure to account for this can lead to significant misinterpretation of inhibitor potency.
| Inhibition Mechanism | IC50 Relationship | Practical Implication |
|---|---|---|
| Competitive | IC50 = Ki (1 + [S]/Km) [22] | IC50 increases as [S] increases. Use low [S] to find best potency. |
| Non-Competitive | IC50 = Ki [22] | IC50 is independent of [S]. |
| Uncompetitive | IC50 = Ki (1 + [S]/Km) | IC50 decreases as [S] increases. |
4. When can I approximate Kd from an IC50 value?
Answer: Approximating Kd from IC50 is only acceptable under a very narrow set of conditions [24]. According to exact mass action law calculations, the IC50 will be less than 20% larger than the Kd only if:
- The tracer/conjugate concentration is much smaller than the Kd.
- The receptor/enzyme concentration is much smaller than the Kd [24].
Otherwise, the two values can be vastly different. It is highly recommended to use specialized software packages to determine Kd values from experimental data for meaningful comparisons [24].
Troubleshooting Guide: Experimental Results
Problem 1: Inconsistent Ki values derived from IC50 measurements.
- Potential Cause 1: Unaccounted enzyme concentration. In "tight-binding" inhibition, where the inhibitor affinity is very high (Ki is similar to or lower than the total enzyme concentration [E]T), the free inhibitor is depleted by binding to the enzyme. This causes the apparent IC50 to be higher than the true Ki [22].
- Solution: Apply a tight-binding correction to your data. The relationship is given by IC50 = Ki + [E]T/2, highlighting the direct dependence on enzyme concentration [23]. Ensure your experimental design uses enzyme concentrations well below the expected Ki.
- Potential Cause 2: Incorrect assumption of inhibition mechanism. Using the wrong equation (e.g., a competitive model for an uncompetitive inhibitor) to convert IC50 to Ki will yield an incorrect Ki value [22].
- Solution: Perform a full kinetic analysis (e.g., vary substrate and inhibitor concentrations) to rigorously determine the mechanism of inhibition before calculating Ki.
Problem 2: Poor correlation between compound affinity (Kd/Ki) and cellular activity.
- Potential Cause: Divergent physicochemical environments. The buffer used in your biochemical affinity assay (e.g., PBS) does not replicate the cytoplasmic environment, affecting the compound's true affinity in a cellular context [10]. Factors like pH, ionic strength, and molecular crowding can alter Kd values.
- Solution: Develop or use biochemical assay buffers that more closely mimic the intracellular milieu in terms of pH, salt composition, and crowding agents [10]. This helps minimize the physicochemical gap between assay types.
The Scientist's Toolkit: Key Reagent Solutions
The following table lists essential reagents and their functions for studying binding and inhibition, with a focus on managing physicochemical conditions.
| Reagent / Material | Function in Experiment |
|---|---|
| Defined Acidified Citrate Medium (D-ACM) [25] | An axenic culture medium that mimics the acidic (pH ~4.75) and nutrient-defined environment of the phagolysosome. Useful for studying pathogens or proteins that function in acidic intracellular compartments. |
| Buffer Systems for Cytoplasmic Mimicry [10] | Specially formulated buffers designed to replicate the cytoplasmic environment (e.g., specific pH, ionic strength, redox potential) for in vitro assays, helping to bridge the gap with cellular data. |
| Methyl-β-cyclodextrin [25] | Used in culture media to deliver hydrophobic nutrients or compounds, improving solubility and uptake in aqueous environments. |
| Octanol-Water Mixture | The standard two-phase solvent system for experimentally determining the partition coefficient (Log P), a key parameter of compound hydrophobicity [26]. |
| High Gelling Temperature Agarose [25] | Used for preparing solid growth media for fastidious organisms like Coxiella burnetii, allowing for colony formation under defined physicochemical conditions. |
Essential Experimental Workflows
Protocol 1: Converting IC50 to Ki for a Competitive Inhibitor
This protocol outlines the steps for accurately determining the inhibition constant (Ki) from a measured IC50 value under the assumption of competitive inhibition [22].
- Determine Km: Run a Michaelis-Menten experiment by measuring reaction initial velocities (v0) at a minimum of six different substrate concentrations ([S]). Plot v0 vs. [S] and fit the data to non-linear regression to determine the Km value for your substrate under your specific assay conditions.
- Measure IC50: Run an inhibitor dose-response experiment. Hold the substrate concentration ([S]) fixed and measure reaction velocity at a minimum of eight different inhibitor concentrations ([I]). Fit the data to a standard dose-response curve (e.g.,
Response = Bottom + (Top-Bottom)/(1 + 10^((LogIC50 - X)*HillSlope))) to determine the IC50. - Apply the Cheng-Prusoff Equation: Use the following equation to calculate Ki:
- Ki = IC50 / (1 + [S]/Km) [22]
- Report Conditions: Always report the experimental conditions used, including the specific [S] and the determined Km value, as these are critical for interpreting the Ki.
Protocol 2: Assessing the Impact of Cytoplasmic-Mimicry Buffer on Kd
This protocol compares the binding affinity (Kd) of a ligand measured in a standard buffer versus a buffer designed to mimic the cytoplasmic environment [10].
- Buffer Preparation:
- Prepare a standard assay buffer (e.g., PBS at pH 7.4).
- Prepare a cytoplasmic-mimicry buffer. While the exact composition may vary, it should consider factors like a specific pH (e.g., ~7.2), potassium as the major cation, and the potential inclusion of macromolecular crowding agents like Ficoll or bovine serum albumin.
- Binding Assay: Using a direct binding method (e.g., surface plasmon resonance, isothermal titration calorimetry, fluorescence anisotropy), perform a full titration of your ligand against its target.
- Parallel Measurement: Conduct the full binding experiment in both the standard buffer and the cytoplasmic-mimicry buffer, keeping all other variables (temperature, target concentration, etc.) constant.
- Data Analysis: Fit the binding data from each buffer condition to a suitable binding model (e.g., 1:1 binding) to extract the Kd value for each environment.
- Comparison: Compare the two Kd values. A significant difference indicates that the standard buffer may not accurately reflect the true affinity within a cell, highlighting the importance of physicochemical conditions.
Visualizing the Relationships: Concepts and Workflows
Diagram 1: IC50 to Ki Relationship Logic
Diagram 2: Biochemical vs. Cellular Assay Divide
From Theory to Bench: Practical Methods to Mimic and Manage Intracellular Conditions
A significant challenge in biochemical research is the frequent inconsistency between activity measurements from simplified in vitro assays and those from more complex cellular environments. This discrepancy can delay research progress and drug development [10]. While factors like compound permeability and stability are often blamed, a key reason is that standard biochemical buffers do not replicate the intricate physicochemical conditions of the living cell's cytoplasm [10]. This guide provides a framework for designing buffers that more accurately mimic the cytoplasmic environment, thereby bridging the gap between in vitro and cellular data.
FAQ: Fundamentals of Cytoplasmic Mimicry
1. Why is there a discrepancy between biochemical and cellular assay results?
The inconsistency in activity values (e.g., Kd) between simplified in vitro assays and cellular assays often arises because the intracellular physicochemical conditions are vastly different from those in standard biochemical buffers like PBS. Factors such as macromolecular crowding, cytoplasmic viscosity, specific ionic strength, and pH alter molecular interactions and equilibria [10]. Designing buffers that mimic the cytoplasmic environment helps minimize these discrepancies.
2. What are the key compositional differences between intracellular and extracellular fluids?
The chemical composition of body fluids is highly compartmentalized [16]. The table below summarizes the major differences.
Table 1: Key Differences Between Intracellular and Extracellular Fluid Composition
| Component | Intracellular Fluid | Extracellular Fluid |
|---|---|---|
| Cations | High K+, Mg2+ | High Na+ |
| Anions | High Phosphate, proteins | High Chloride, bicarbonate |
| Proteins | High concentration | Lower concentration (especially in interstitial fluid) |
| Origin | Cytoplasm of cells | Plasma and interstitial space |
3. What is macromolecular crowding and why is it important?
The cytoplasm is densely packed with macromolecules (proteins, nucleic acids, etc.) at concentrations estimated at 200–350 mg/ml, occupying a volume fraction of up to 40% [27]. This creates a crowded environment that generates an excluded volume effect, which favors association reactions and can shift conformational equilibria of proteins and nucleic acids [28]. This effect is largely absent in traditional dilute biochemical assays.
4. How do cosolvents differ from crowding agents?
Both are crucial components of the cellular milieu, but they function differently:
- Crowding Agents: These are high-molecular-weight, inert molecules (e.g., dextran, Ficoll) that act primarily through steric repulsion (excluded volume effect) [29] [28].
- Cosolvents: These are small, soluble molecules (e.g., TMAO, urea, glycerol) that affect biomolecular stability and reactions through direct chemical interactions (e.g., altering water structure) rather than simple volume exclusion [28]. They can be stabilizing (kosmotropes) or destabilizing (chaotropes).
The Scientist's Toolkit: Research Reagent Solutions
Table 2: Essential Reagents for Cytoplasm-Mimicking Buffers
| Reagent | Function & Rationale | Example Uses & Considerations |
|---|---|---|
| Dextran | A common polymeric crowding agent to mimic the excluded volume effect. Relatively inert and highly water-soluble [29]. | Used at high concentrations (e.g., 70-100 g/L) to simulate cellular crowding. Average molecular weight (e.g., 70 kDa) can be selected. |
| Trimethylamine-N-oxide (TMAO) | A kosmotropic cosolvent that stabilizes protein native states and counteracts denaturing stresses [29]. | Often used at 1 M concentrations to study its protective effects on protein structure and association reactions. |
| Potassium Chloride (KCl) | To set the correct ionic strength and mirror the high K+ concentration found inside cells [16]. | Concentration must be optimized, but typically ranges from 100-150 mM for ionic strength mimicry. |
| Potassium Phosphate | Provides a buffering system while also contributing K+ ions and phosphate, both abundant intracellularly [16]. | pKa suitable for near-neutral pH. The potassium salt is preferred over sodium. |
| TRIS & HEPES | Common "Biological Buffers" or "Good Buffers" with defined pKa values for controlling pH [30]. | Select buffer based on desired pH (pKa ± 1). These buffers often have lower conductivity than inorganic alternatives. |
| ATP & Mg2+ | To replicate the energy-rich state of the cytoplasm and serve as cofactors for numerous enzymatic reactions [31]. | Mg2+ is often required to chelate ATP. Concentrations should reflect physiological levels (e.g., low mM range). |
Troubleshooting Guide: Common Experimental Issues
Problem: Irreproducible binding kinetics or protein aggregation in the mimic buffer.
- Potential Cause 1: Inconsistent Buffer Preparation. The terms "phosphate buffer" or "borate buffer" are ambiguous and can lead to preparations with different ionic strengths and buffering capacities [30].
- Solution: Define the buffer recipe with "exquisite detail" in methods. Specify the exact salt (e.g., disodium hydrogen orthophosphate), the concentration, the agent and its molarity used for pH adjustment (e.g., "adjusted to pH 7.4 with 1M HCl"), and the temperature at which pH was measured [30].
- Potential Cause 2: Inadequate buffering capacity at the target pH. A buffer is only effective within one pH unit of its pKa [30].
- Solution: Select a buffering ion with a pKa value close to your desired cytoplasmic pH (typically ~7.2). Refer to Table 2 for common buffers and their pKa values.
Problem: The mimic buffer does not recapitulate the enhanced association rates observed in cells.
- Potential Cause: Lack of or insufficient macromolecular crowding. In dilute solutions, the entropic drive for biomolecules to associate is weaker [29] [28].
- Solution: Introduce high concentrations of inert crowding agents like dextran. For example, cell-like crowding conditions have been shown to increase the nucleation and association rates of actin polymerization by an order of magnitude [29]. Titrate the concentration of your crowding agent to find the optimal effect.
Problem: Protein misfolding or inactivation in the mimic buffer, despite correct ionic strength.
- Potential Cause: Missing stabilizing cosolvents. The cytoplasmic environment contains a complex mixture of osmolytes that help maintain protein stability [28].
- Solution: Include stabilizing cosolvents like TMAO (e.g., at 1 M) in your buffer formulation. TMAO is known to counteract the deleterious effects of denaturing stresses and can shift equilibria towards the oligomeric state of proteins [29].
Problem: Unusually high electrical current or overheating during electrophoretic techniques.
- Potential Cause: Buffer ionic strength is too high. While higher ionic strength can improve peak shape in techniques like capillary electrophoresis, it also increases current generation [30].
- Solution: Optimize the buffer strength as a compromise. It is recommended to adjust operating conditions to maintain current levels below 100 μA to prevent self-heating and method instability [30].
Experimental Protocols & Data Presentation
Quantitative Effects of Cosolvents and Crowding
The following table summarizes quantitative data on how different solution conditions can affect a specific biochemical process—the polymerization kinetics of actin. This serves as a model for how cytoplasmic conditions alter biomolecular reactions.
Table 3: Effects of Cosolvents and Crowding on Actin Polymerization Kinetics [29]
| Solution Condition | Effect on Association Rate Constant | Effect on Critical Concentration (cc) | Proposed Mechanism |
|---|---|---|---|
| 1 M TMAO (Kosmotrope) | Drastically increased | Not specified (decreased) | Shifts equilibria towards associated/oligomeric states; stabilizes interactions. |
| 1 M Urea (Chaotrope) | Decreased | Increased | Denatures proteins and perturbs favorable protein-protein interactions. |
| TMAO + Urea Mixture | Counteracts urea's effect | Counteracts urea's effect | TMAO offsets the denaturing effect of urea on both structure and interactions. |
| Dextran (Crowder) | Increased by one order of magnitude | Not specified (decreased) | Excluded volume effect favors association over dissociation. |
Detailed Protocol: Setting Up a Basic Cytomimic Buffer for Protein Studies
This protocol is adapted from principles used to create long-lived cell-free protein synthesis systems [31].
Base Buffer Preparation: Start with a buffer that mimics the intracellular ion profile. For example, prepare a solution containing:
- 100-150 mM KCl
- 10-50 mM Potassium Phosphate buffer, pH 7.2
- 1-5 mM MgCl2
- 1 mM ATP
pH Adjustment: Adjust the pH to 7.2 using a KOH solution. Critical step: Always measure the pH at the temperature the experiment will be conducted at, as pH is temperature-dependent [30].
Adding Crowding Agents: Dissolve a macromolecular crowder like dextran (average molecular weight 70 kDa) to a final concentration of 80-100 g/L. This will simulate the crowded cytoplasmic volume fraction [29].
Adding Cosolvents (Optional): Depending on the experimental question, add stabilizing cosolvents like TMAO (e.g., 0.5-1 M final concentration) to study their protective effects [29].
Final Buffer Validation: Filter sterilize the buffer if necessary. Avoid diluting a concentrated, pH-adjusted stock buffer, as this can lead to slight but significant pH shifts. Prepare the buffer at its final working concentration for best reproducibility [30].
Diagram Specifications
The following diagram illustrates the logical workflow and key considerations for designing a cytoplasm-mimicking buffer.
Diagram Title: Cytoplasm-Mimicking Buffer Design Workflow
Advanced Techniques for Distinguishing Intracellular vs. Extracellular Compound Localization
Foundational Concepts: Intracellular vs. Extracellular Environments
FAQ: What is the fundamental difference between intracellular and extracellular localization?
The primary distinction lies in whether a compound, such as a protein, enzyme, or nanoparticle, is located inside the cell (intracellular) or outside the cell (extracellular). This localization is critically tied to function [32].
- Intracellular Compounds: Function within the cell's cytoplasm, nucleus, or organelles (e.g., mitochondria). They manage the cell's internal economy, including processes like glycolysis, DNA replication, and cellular respiration [32].
- Extracellular Compounds: Are synthesized inside the cell but are secreted to function outside. They act as external processors, breaking down external substrates (like food in the digestive tract) into simpler molecules for cellular uptake [32].
FAQ: Why is accurate determination of compound localization critical in drug development?
Incorrect localization can lead to complete therapeutic failure. For instance, the efficacy of nanoparticle-based photodynamic therapy can exhibit order-of-magnitude differences depending on whether the particles are inside or outside the target cancer cells. Precise intracellular localization is often paramount for eradicating malignancies and ensuring successful drug delivery [33].
Technique 1: Chiroptical Spectroscopy for Nanoparticle Localization
Troubleshooting Guide: My nanoparticle dimers do not show the expected chirality reversal upon cellular uptake. What could be wrong?
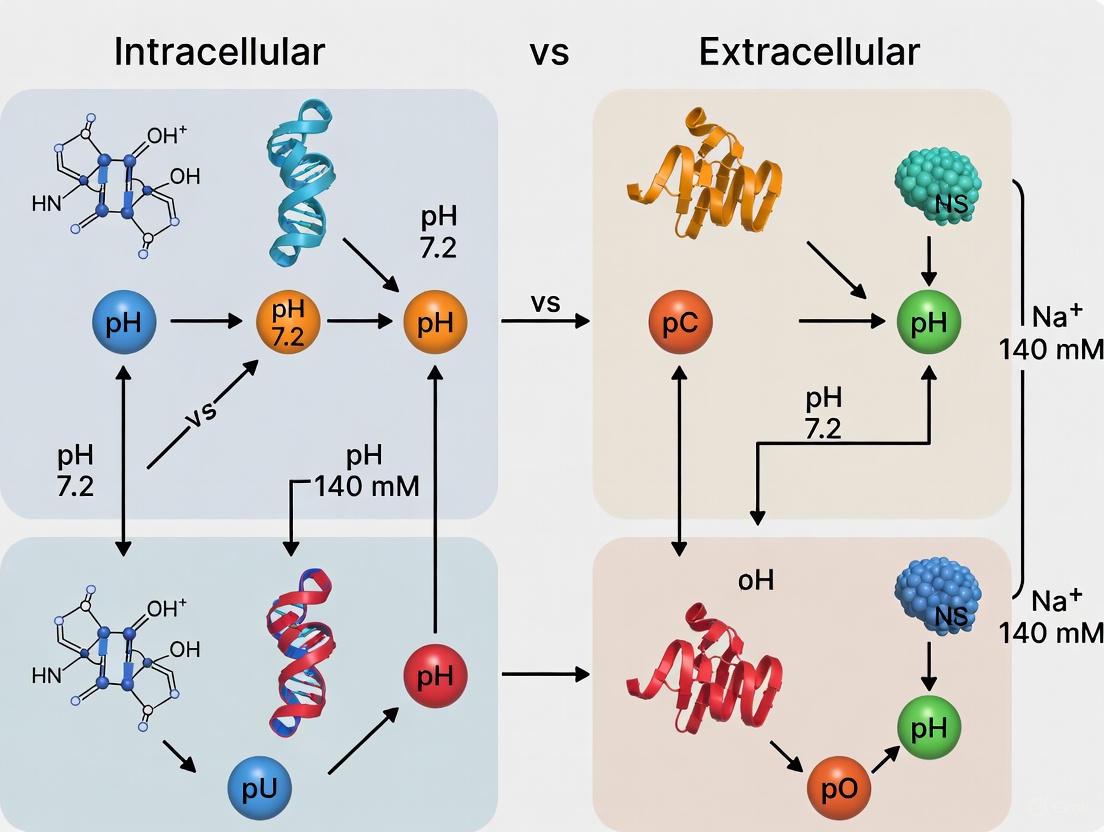
This technique exploits the unique chiroptical activity (circular dichroism in the visible range) of DNA-bridged plasmonic nanoparticle dimers. These dimers exhibit a spontaneous twisting motion around their DNA bridge, causing a measurable reversal of their circular dichroism (CD) peaks from negative to positive when moving from the extracellular fluid to the cytosol [33].
| Issue | Possible Cause | Solution |
|---|---|---|
| No chirality reversal | The dimer structure is too rigid to reconfigure in the new environment. | Ensure dimers are not over-stabilized. Avoid coating with rigid polymers like PS-PAA, which impedes the twisting motion [33]. |
| Weak or noisy CD signal | Insufficient number of DNA bridges or low nanoparticle concentration. | Verify the number of DNA strands between nanoparticles does not exceed 1.6 ± 0.2 and optimize particle concentration [33]. |
| No cellular uptake | Nanoparticles lack a cell-penetrating mechanism. | Functionalize nanoparticles with cell-penetrating peptides (e.g., TAT, ~190 ligands per NP) to facilitate direct cytosolic penetration and avoid endosomal segregation [33]. |
Experimental Protocol: Monitoring Transmembrane Transport via CD Spectroscopy
- Dimer Assembly: Assemble dimers from slightly oblong Au NPs (e.g., 22 nm length) using a specific double-stranded DNA bridge (e.g., 5′-CAATAGCCCTTGGAT-3′ and its complement) to create a scissor-like geometry with inherent chirality [33].
- Surface Coating: Coat dimers with thiol-modified polyethylene glycol-5000 (SH-PEG-5000; ~860 molecules/NP) to reduce non-specific protein adsorption. Incorporate TAT peptides (~190 molecules/NP) to enable virus-like transmembrane transport [33].
- Cell Incubation & Measurement: Incubate dimers with mammalian cells (e.g., cervical cancer HeLa cells). Monitor the CD spectrum in the visible range (400-900 nm) in real-time. A reversal of CD peaks (e.g., from negative/positive to positive/negative at ~500/530 nm) indicates successful internalization from the interstitial fluid into the cytosol [33].
- Validation: Confirm intracellular localization using biological transmission electron microscopy (bio-TEM) or cryo-TEM tomography to visualize the reconfigured dimer geometry inside the cell [33].
Technique 2: Flow Cytometry for Surface and Intracellular Antigens
Troubleshooting Guide: I am getting high background noise in my intracellular staining. How can I improve the signal-to-noise ratio?
Flow cytometry allows for the simultaneous analysis of cell surface markers (extracellular) and internal proteins (intracellular). Detecting intracellular targets requires fixation and permeabilization steps to allow antibodies access to the inside of the cell [34] [35].
| Issue | Possible Cause | Solution |
|---|---|---|
| High background | Non-specific antibody binding or dead cells. | Include an Fc receptor blocking step (e.g., with 2-10% goat serum). Use a viability dye (e.g., 7-AAD, DAPI) to exclude dead cells during analysis [35]. |
| Weak intracellular signal | Inadequate permeabilization. | Optimize the detergent and concentration. Use harsh detergents (e.g., 0.1-1% Triton X-100) for nuclear antigens and mild detergents (e.g., 0.2-0.5% saponin) for cytoplasmic antigens [35]. |
| Loss of cell surface signal | Fixation/permeabilization damages surface epitopes. | Always perform cell surface staining before the fixation and permeabilization steps for combined intra/extracellular analysis [35]. |
| Poor cell viability | Over-digestion during cell harvesting. | When creating a single-cell suspension from adherent cultures, avoid over-trypsinization. Gently dislodge cells and quench trypsin promptly [34]. |
Experimental Protocol: Combined Surface and Intracellular Antigen Staining
- Harvest and Wash: Harvest cells and create a single-cell suspension. Wash with a cold suspension buffer (e.g., PBS with 5-10% FBS). Determine cell count and viability (aim for 90-95%) [35].
- Viability Staining: Resuspend cells and incubate with an appropriate viability dye (e.g., 7-AAD) in the dark at 4°C. Wash twice [35].
- Surface Antigen Staining:
- Fixation and Permeabilization:
- Intracellular Staining: Incubate cells with antibodies against your target intracellular antigen. Wash thoroughly and resuspend in buffer for flow cytometric analysis [35].
The Scientist's Toolkit: Key Research Reagent Solutions
This table outlines essential materials used in the featured techniques to guide your experimental setup.
| Reagent | Function & Application |
|---|---|
| TAT Peptide | A cell-penetrating peptide that facilitates direct, virus-like transport of nanoparticles into the cytosol, bypassing endosomal pathways [33]. |
| SH-PEG-5000 | Thiol-modified polyethylene glycol used to coat gold nanoparticles. Camouflages particles and reduces non-specific protein adsorption (bio-fouling) [33]. |
| Viability Dyes (e.g., 7-AAD) | DNA-binding dyes that only penetrate cells with compromised membranes. Used in flow cytometry to distinguish and exclude dead cells from analysis [35]. |
| FcR Blocking Reagent | (e.g., goat serum, human IgG). Prevents non-specific binding of antibodies to Fc receptors on immune cells, reducing background noise in flow cytometry [35]. |
| Permeabilization Detergents | Agents like Triton X-100 or saponin that disrupt the cell membrane to allow antibody access for intracellular staining in flow cytometry [35]. |
| CD Marker Antibodies | Fluorescently-labeled antibodies targeting Cluster of Differentiation (CD) surface antigens. Used to identify and characterize specific cell populations via flow cytometry [34]. |
FAQ: My research involves detecting pathogens. Are there localization-specific recognition pathways?
Yes, innate immune systems have specialized pathways for extracellular versus intracellular pathogen detection, a concept conserved in mammals and flies [36].
- Extracellular Recognition: Primarily mediated by receptors like Toll-like Receptors (TLRs). For example, TLR3 is involved in recognizing extracellular double-stranded RNA (dsRNA), a common viral pattern [37].
- Intracellular Recognition: Mediated by intracellular sensors like RIG-I and MDA5 (RNA helicases) and NOD proteins. These detect viral components within the cytosol and initiate powerful defense responses [36] [37].
- Key Insight: These pathways are not redundant; they utilize different signaling molecules. For instance, intracellular dsRNA signaling can lead to a more potent and sustained induction of antiviral genes (like IFNB) compared to extracellular signaling [37].
Frequently Asked Questions (FAQs)
FAQ 1: Why is there often a discrepancy between biochemical assay results and cellular assay results for the same compound? This discrepancy frequently arises because traditional in vitro biochemical assays are performed in simplified buffer systems (e.g., PBS) that do not replicate the complex intracellular environment. The cytoplasmic milieu has different physicochemical conditions, including molecular crowding, specific ionic composition, and viscosity, which can alter a ligand's binding affinity (Kd) and stability. To minimize this inconsistency, use buffers that more accurately mimic the cytoplasmic environment for biochemical measurements [10].
FAQ 2: What is "Redox Buffer Capacity" and why is it important to measure? Redox buffer capacity quantitatively describes a cell's ability to resist changes in its redox state upon exposure to oxidants or reductants. It is crucial because the intracellular redox state governs critical processes like proliferation, differentiation, and signal transduction. Measuring it helps predict whether reactive oxygen species (ROS) will activate beneficial redox signaling or cause deleterious oxidative stress, thus providing a quantitative basis for understanding redox biology [38] [39].
FAQ 3: How can I experimentally characterize a cell's redox buffer capacity? A standard protocol involves using a redox-sensitive fluorescent probe like 2,7-Dichlorodihydrofluorescein (H2DCF). Cells are loaded with H2DCF and then challenged with specific oxidants, such as hydrogen peroxide (H2O2) or peroxynitrite (ONOO⁻). The subsequent change in fluorescence intensity, which corresponds to the oxidation of the probe, is measured over time. The cell's redox buffer capacity is inversely related to the rate of fluorescence increase [38] [39].
FAQ 4: What are the common side effects of nutritional buffering supplements and how can they be managed?
- Sodium Bicarbonate (& Sodium Citrate): Often causes gastrointestinal (GI) distress. This can be mitigated by ingesting the dose with a carbohydrate-rich meal, using split-dose protocols, or using enteric-coated capsules [40].
- Beta-Alanine: Causes paresthesia (a transient tingling sensation on the skin). This side effect can be minimized by using sustained-release formulations or dividing the total daily dose into multiple smaller doses (e.g., 4-6 doses of 1-1.6 g) throughout the day [40].
FAQ 5: My cells are not responding to substrate stiffness cues in a 3D culture as expected. What could be wrong? Traditional 2D culture on flat, rigid surfaces (like glass or plastic) fails to replicate the complex mechano-chemical cues of the native extracellular matrix (ECM). Ensure your 3D culture system uses biomimetic scaffolds (e.g., specific hydrogels) that control parameters such as stiffness, nanotopography, and ligand presentation. The interplay between these physical cues and biochemical signaling is essential for proper cell function, including differentiation and proliferation [41] [42] [43].
Troubleshooting Guides
Issue 1: Inconsistent Results in Redox Signaling Experiments
Problem: High variability in fluorescent signal when using redox probes like H2DCF.
| Possible Cause | Solution / Verification Step |
|---|---|
| Probe Overloading | Optimize loading concentration and incubation time. Perform a dye titration curve to find the optimal signal-to-noise ratio without causing cellular toxicity or auto-oxidation. |
| Oxidant Instability | Freshly prepare oxidant stocks (e.g., H2O2, ONOO⁻) immediately before use. Verify concentration spectrophotometrically if possible. Remember that cells have different redox buffer capacities for different oxidants [38]. |
| Inconsistent Cell State | Standardize cell culture conditions (passage number, confluence, serum starvation) and ensure consistent pre-treatment protocols, as the basal redox state is highly sensitive to the cell's metabolic condition. |
Issue 2: Lack of Ergogenic Effect from Buffering Supplementation
Problem: After administering beta-alanine or sodium bicarbonate, no performance improvement is observed in the model.
| Possible Cause | Solution / Verification Step |
|---|---|
| Insufficient Loading/Dosing | For beta-alanine, ensure chronic supplementation (typically 3–6.4 g/day for at least 4 weeks) to significantly elevate muscle carnosine [40]. For sodium bicarbonate, use an acute dose of ~0.3 g/kg body mass, ingested 1–2 hours before testing [40]. |
| Incorrect Exercise Model | These supplements are most effective for exercises that rely heavily on glycolysis and last between 1-10 minutes, where acidosis is a major fatigue factor. Verify that your exercise protocol matches this intensity and duration [40]. |
| High Interindividual Variability | Account for factors like baseline muscle carnosine levels, diet, and training status. Use a placebo-controlled, crossover study design to account for individual responses. |
Issue 3: Poor Biomimicry in In Vitro Assays
Problem: Cellular behavior in synthetic environments does not reflect predicted or in vivo behavior.
| Possible Cause | Solution / Verification Step |
|---|---|
| Over-simplified 2D Environment | Transition to 3D culture systems using hydrogels (e.g., fibrin, collagen, PEG-based) that allow control over mechanical (elasticity, viscoelasticity) and topographical cues [42] [43]. |
| Non-physiological Buffer System | Replace standard buffers like PBS with newly developed "cytomimetic" buffers that incorporate molecular crowding, physiological ionic strength, and glutathione to better mimic the cytoplasmic physicochemical environment [10]. |
| Ignoring Dynamic Remodeling | Implement co-cultures or use scaffolds that allow for cellular remodeling. The cell-ECM interaction is dynamic; cells synthesize and remodel their ECM, which in turn provides feedback to control cell function [41]. |
Experimental Protocols & Data
Protocol 1: Assessing Redox Buffer Capacity Using H2DCF
Objective: To quantify the intracellular redox buffer capacity of adherent cells in response to hydrogen peroxide.
Materials:
- Cell culture (e.g., erythrocytes, cultured adherent cells)
- 2,7-Dichlorodihydrofluorescein diacetate (H2DCF-DA)
- Hydrogen peroxide (H2O2) stock solution
- Appropriate cell culture buffer (e.g., HBSS, pH 7.4)
- Fluorescent plate reader or microscope
Method:
- Cell Preparation: Seed cells in a 96-well black-walled plate and culture until desired confluence.
- Probe Loading: Wash cells with buffer. Load cells with 10-20 µM H2DCF-DA in buffer for 30 minutes at 37°C.
- Wash: Thoroughly wash cells 2-3 times with buffer to remove extracellular dye.
- Oxidant Challenge: Add a predetermined, sub-lethal concentration of H2O2 (e.g., 100-500 µM) to the wells. Include control wells with buffer only.
- Kinetic Measurement: Immediately place the plate in a fluorescent plate reader (Ex/Em ~485/535 nm) and take readings every 1-2 minutes for 60-90 minutes.
- Data Analysis: Plot fluorescence intensity versus time. The redox buffer capacity is inversely proportional to the initial slope of the fluorescence increase. Compare slopes between treatment groups and controls.
Protocol 2: Chronic Beta-Alanine Supplementation Protocol
Objective: To elevate intramuscular carnosine content and increase intracellular buffering capacity.
Materials:
- Pharmaceutical-grade beta-alanine
- Placebo (e.g., maltodextrin)
Method:
- Dosing Regimen: Administer beta-alanine at a dose of 3–6.4 g per day.
- Dosing Strategy: To minimize paresthesia, split the total daily dose into 4-6 smaller doses of 1-1.6 g taken every 3-4 hours throughout the day, or use a sustained-release formulation.
- Duration: Continue supplementation for a minimum of 4 weeks; studies show muscle carnosine content increases progressively for at least 10-12 weeks.
- Verification: The ergogenic effect is typically assessed post-loading using high-intensity exercise tests (e.g., time to exhaustion at 110% VO₂max) [40].
Quantitative Data on Nutritional Buffering Supplements
Table 1: Summary of Nutritional Strategies to Modulate Buffering Capacity [40]
| Supplement | Primary Mechanism | Effective Dose & Duration | Key Exercise Benefits | Reported Effect Size / Increase |
|---|---|---|---|---|
| Beta-Alanine | Increases intramuscular carnosine (intracellular buffer, pKa ~6.83). | 3–6.4 g/day for ≥4 weeks. | Improves performance in high-intensity exercise lasting 1-10 min. | Muscle carnosine content: 60-80%. Performance in 60-240s tasks: Small to moderate improvement. |
| Sodium Bicarbonate | Increases extracellular bicarbonate buffering capacity. | Acute: 0.3 g/kg BM, 60-90 min pre-test. | Improves high-intensity exercise performance and capacity. | Blood [HCO₃⁻]: Significant increase. Performance: Small to moderate improvement. |
| Sodium Citrate | Induces metabolic alkalosis, increasing extracellular buffering. | Acute: 0.3-0.5 g/kg BM, ~2 hrs pre-test. | Evidence for ergogenic effect is weaker than sodium bicarbonate. | Blood [HCO₃⁻]: Increases, but performance effects inconsistent. |
Table 2: Comparative Redox Buffer Capacity of Erythrocytes to Different Oxidants [38] [39]
| Oxidant Challenge | Relative Redox Buffer Capacity (Higher value = greater buffering) | Experimental Context |
|---|---|---|
| Hydrogen Peroxide (H₂O₂) | 2.1 times higher | Measured in erythrocytes using H2DCF oxidation. |
| Peroxynitrite (ONOO⁻) | Baseline (1x) | Measured in erythrocytes using H2DCF oxidation. |
The Scientist's Toolkit: Research Reagent Solutions
Table 3: Essential Reagents for Cellular Buffering and Redox Research
| Reagent / Material | Function / Application | Key Considerations |
|---|---|---|
| H2DCF-DA | Cell-permeable fluorescent probe for detecting general redox state and ROS generation. | Non-specific; can undergo auto-oxidation. Requires careful optimization of loading conditions [38] [39]. |
| Beta-Alanine | Nutritional supplement to chronically increase intracellular buffering capacity via carnosine synthesis. | The rate-limiting precursor for carnosine; requires chronic loading to be effective [40]. |
| Sodium Bicarbonate | Acute nutritional supplement to increase extracellular buffering capacity. | Effective dose often causes GI distress; requires timing and dosing optimization [40]. |
| Biomimetic Hydrogels (e.g., PEG-Fibrinogen, Collagen) | 3D scaffolding materials to create in vitro environments with tunable stiffness and topography for cell culture. | Stiffness and ligand density can direct stem cell fate and influence cellular redox responses [41] [42]. |
| Cytomimetic Buffers | Advanced buffer systems designed to mimic the intracellular environment (crowding, ion composition). | Used to bridge the gap between biochemical and cellular assay results [10]. |
Signaling Pathways and Workflows
Physicochemical Modulation for Enhanced Production of Biologics like Extracellular Vesicles
Troubleshooting Guides and FAQs for Researchers
This technical support center provides targeted guidance for researchers managing the complex interplay between intracellular and extracellular physicochemical conditions to enhance the production of biologics, with a focus on extracellular vesicles (EVs). The following FAQs address common experimental challenges.
Frequently Asked Questions
FAQ 1: My EV yields remain low despite using high-cell-density cultures. What are the primary physicochemical levers I can adjust to enhance secretion?
Low EV yields are often due to suboptimal culture conditions that do not sufficiently stimulate cellular secretion pathways. The primary levers involve modulating the chemical, mechanical, and structural environment of your cells [44] [45].
- Solution 1: Chemical Modulation. Systematically adjust your culture medium and conditions. Key parameters to investigate are listed in Table 1 below.
- Solution 2: Mechanical Stimulation. Apply controlled physical forces, such as shear stress from perfusion systems or low-frequency ultrasound, to mimic physiological conditions that promote EV release [44] [45].
- Solution 3: Structural Stimulation. Transition from two-dimensional (2D) culture to three-dimensional (3D) systems, such as spheroids or scaffolds, or employ bioreactors. These systems enhance cell-cell interactions and mimic the native cellular microenvironment, which has been shown to significantly increase EV production compared to conventional 2D flasks [44] [45] [46].
FAQ 2: How do I determine the optimal chemical stimulants for my specific cell type without running an intractable number of experiments?
The optimal chemical stimulant is cell-type dependent, but a targeted approach based on known signaling pathways is most efficient. Start by profiling the expression of key EV biogenesis genes (e.g., Rab GTPases, ESCRT components) in your cell line under baseline conditions.
- Solution: Focus on stimulants that target pathways your cells naturally utilize. Table 1 provides a summary of common chemical modulators and their mechanistic targets, which can serve as a starting point for experimental design. Furthermore, implement a Design of Experiments (DoE) approach to efficiently test multiple parameters and their interactions in a structured, high-throughput manner [46].
FAQ 3: I am achieving high EV yield, but the resulting vesicles show impaired functionality in downstream therapeutic assays. How can I ensure product quality and functional integrity?
This critical issue highlights the balance between yield and quality. Over-stimulation or harsh physicochemical conditions can damage cells or alter the normal cargo-sorting mechanisms, leading to dysfunctional EVs [47].
- Solution 1: Modulate Stimulation Intensity and Duration. Avoid extreme conditions. For example, instead of severe nutrient starvation, try mild depletion. Instead of continuous shear stress, apply it in intervals. Always couple production experiments with a potency assay relevant to your therapeutic application (e.g., a immune cell modulation assay or a uptake efficiency assay) [44] [45].
- Solution 2: Characterize EVs Rigorously. Adhere to the MISEV (Minimal Information for Studies of Extracellular Vesicles) guidelines to ensure your EVs are well-characterized [48]. Beyond concentration and size, confirm the presence of key functional surface proteins and cargo (e.g., specific miRNAs or enzymes) that are expected for your parent cell type and intended function.
FAQ 4: What are the most significant challenges in scaling up EV production from laboratory to clinical scale, and how can they be mitigated?
Scaling up presents challenges in consistency, cost, and purification [44] [46] [47].
- Challenge 1: Reproducibility and Control. Laboratory-scale protocols are often difficult to replicate in large bioreactors.
- Mitigation: Use controlled bioreactors that allow for precise, real-time monitoring and adjustment of physicochemical parameters like pH, dissolved oxygen, and temperature [46].
- Challenge 2: Downstream Processing. Purifying EVs from large volumes of conditioned medium without aggregation or loss of function is complex.
- Challenge 3: Cost of Goods. Large-scale production of clinical-grade culture media and reagents is expensive.
Quantitative Data on Physicochemical Modulation
Table 1: Chemical Modulation Strategies for Enhanced EV Production
| Modulation Strategy | Typical Experimental Conditions | Key Signaling Pathways / Molecules Affected | Reported Effect on EV Yield |
|---|---|---|---|
| pH Regulation | Culture medium pH < 6.5 (acidic environment) [45] | Increased membrane fusion and MVB docking [45] | Up to 69-fold increase in observable EV content in some cancer cell lines [45] |
| Temperature (Heat Stress) | Incubation at 40–42°C; short-term exposure to 40–60°C [45] | Induction of Heat Shock Proteins (HSPs) and ATP release [45] | Enhanced EV secretion via HSP-mediated biogenesis [45] |
| Hypoxia / Low Oxygen | 1-5% O₂ [44] [45] | Activation of HIF signaling pathway; upregulation of Rab22A and Rab27a [45] | Significantly increased EV release in breast and ovarian cancer cells [45] |
| Nutrient Starvation | Serum-free culture for 24-120 hours [45] | Upregulation of G-protein, GTPase, and Rab family genes (e.g., ARF6) [45] | Higher EV yield without significant change in vesicle size [45] |
| Oxidative Stress | Induction of Reactive Oxygen Species (ROS) [45] | Activation of the Caspase-3 pathway [45] | Promoted EV release [45] |
| Cholesterol Regulation | Modulation of intracellular cholesterol levels [45] | Regulation of EV release through the PI3K-Akt pathway [45] | Altered EV secretion dynamics [45] |
Table 2: Mechanical and Structural Modulation Strategies
| Modulation Strategy | Experimental Setup / Parameters | Mechanism of Action | Impact on Production Scale |
|---|---|---|---|
| Shear Stress | Laminar fluid flow in bioreactors [44] [45] | Mimics physiological blood flow; applied mechanical force on cell membrane [44] [45] | Enables large-volume, continuous production in scalable bioreactors [44] [46] |
| 3D Culture Systems | Spheroids, scaffolds, or hydrogel encapsulation [44] [45] | Enhances cell-cell contact and mimics native tissue microenvironment [44] [45] | Increases cell density and EV yield per unit volume compared to 2D culture [44] |
| Ultrasound | Low-frequency ultrasound application [44] [45] | Temporary permeabilization of the cell membrane and stimulation of cytosol shedding [44] | Can be applied to large-scale culture vessels; potential for yield enhancement [44] |
Detailed Experimental Protocols
Protocol 1: Enhancing EV Yield via Serum Starvation and Acidic pH Modulation
This protocol is designed to increase EV production by inducing mild metabolic stress and modulating the extracellular pH [45].
- Cell Culture: Seed your target cells (e.g., HEK293T, MSCs) in standard growth medium with serum and allow them to adhere overnight.
- Starvation Phase: After cells reach 70-80% confluency, aspirate the growth medium. Wash the cell monolayer twice with sterile phosphate-buffered saline (PBS) to remove residual serum. Replace the medium with serum-free medium (e.g., Opti-MEM).
- pH Modulation: Adjust the pH of the fresh serum-free medium to a target of 6.3 - 6.5 using a sterile acid (e.g., HCl) or base (e.g., NaOH) as required. Use a calibrated pH meter for accuracy.
- Conditioned Medium Collection: Incubate the cells in the low-pH, serum-free medium for 24-48 hours. Following incubation, collect the conditioned medium.
- EV Isolation: Centrifuge the conditioned medium at 300 × g for 10 minutes to remove live cells, followed by 2,000 × g for 20 minutes to remove dead cells and debris. Isolate EVs from the supernatant using your preferred method (e.g., ultracentrifugation at 100,000 × g for 70 minutes, or tangential flow filtration for larger volumes) [45] [49].
- Characterization: Resuspend the EV pellet in PBS and characterize according to MISEV guidelines, including nanoparticle tracking analysis (NTA) for concentration and size, and western blot for EV markers (e.g., CD63, TSG101) [48].
Protocol 2: Applying Shear Stress in a Bioreactor System for Scalable Production
This protocol outlines the use of a benchtop bioreactor to apply controlled shear stress for enhanced EV production [44] [46].
- Bioreactor Setup and Inoculation: Set up a stirred-tank bioreactor according to the manufacturer's instructions. Calibrate the probes for pH and dissolved oxygen (DO). Inoculate the bioreactor with your target cells at a specific density in the growth medium.
- Baseline Culture: Allow the cells to grow under standard conditions (37°C, pH 7.4, high DO) until they reach the mid-log phase of growth.
- Shear Stress Application: Once the target cell density is achieved, initiate the shear stress regimen by increasing the impeller speed. The optimal speed must be determined empirically for each cell type to balance increased yield against potential cell damage. Monitor cell viability closely.
- Conditioned Medium Harvest: Collect the conditioned medium from the bioreactor continuously or in batches.
- Downstream Processing: Clarify and concentrate the large volume of conditioned medium using scalable methods like tangential flow filtration. Follow this with a purification step, such as size-exclusion chromatography, to obtain a pure EV sample [46].
- Quality Control: Perform a full battery of characterization tests, including functional assays, to ensure the scaled-up EVs meet the required specifications for your research or therapeutic application [48] [47].
Key Signaling Pathways and Experimental Workflows
The Scientist's Toolkit: Essential Research Reagents and Materials
Table 3: Key Reagents and Materials for Physicochemical Modulation Experiments
| Item Category | Specific Examples | Function in EV Production Research |
|---|---|---|
| Culture Media | Serum-free Media (e.g., Opti-MEM), Defined Low-nutrient Media [45] | To induce nutrient starvation and eliminate contaminating bovine EVs from FBS. |
| Chemical Inducers | Forskolin, Norepinephrine, Cisplatin, Hydrogen Peroxide (H₂O₂) [45] | To activate specific intracellular pathways (e.g., ceramide generation, Rab27 expression, ROS) that stimulate EV biogenesis. |
| Bioreactors | Stirred-tank Bioreactors, Hollow-fiber Bioreactors [44] [46] | To provide controlled shear stress and enable large-scale, high-density cell culture for mass production. |
| 3D Culture Systems | Spheroid Formation Plates, Alginate or Synthetic Scaffolds [44] [45] | To create a more physiologically relevant microenvironment that enhances cell signaling and EV secretion. |
| Isolation Kits | Size-Exclusion Chromatography (SEC) Columns, Tangential Flow Filtration (TFF) Systems [46] [49] | For scalable, high-purity isolation of EVs from large volumes of conditioned medium. |
| Characterization Tools | Nanoparticle Tracking Analyzer (NTA), Antibodies for EV Markers (CD9, CD63, CD81, TSG101) [48] | To quantify EV yield, size distribution, and confirm identity according to MISEV guidelines. |
The Intracellular Targeting Challenge Modern drug discovery increasingly focuses on challenging intracellular targets, such as those involved in oncology, intracellular pathogens, and genetic disorders. The relationship between a drug's chemical structure and its biological activity (Structure-Activity Relationship, or SAR) is traditionally established under simplified experimental conditions. However, the intracellular milieu—characterized by unique pH gradients, redox potential, enzyme activity, and viscosity—profoundly influences drug behavior. A compound's efficacy is not solely determined by its structure, but by the interaction between its physicochemical properties and this complex intracellular environment. This case study explores how accounting for these intracellular conditions refines SAR models, leading to more predictive data and successful clinical outcomes for challenging drug targets.
Core Concepts: Intracellular vs. Extracellular Conditions The fundamental thesis of this work is that managing the research of intracellular versus extracellular physicochemical conditions is critical for accurate SAR development. The table below outlines the key differential factors.
Table 1: Key Differences Between Extracellular and Intracellular Experimental Conditions
| Parameter | Typical Extracellular (In Vitro) Assay Conditions | Relevant Intracellular Milieu | Impact on Drug Behavior |
|---|---|---|---|
| pH | Neutral (pH 7.4) | Variable (e.g., acidic in endosomes/lysosomes, pH 4.5-6.5) | Alters drug ionization, solubility, and stability [50] |
| Redox Environment | Oxidizing | Compartment-dependent (e.g., reducing in cytosol) | Can degrade or activate redox-sensitive drug linkers |
| Ionic Strength | Controlled (e.g., PBS) | Complex ion mixtures (K+, Mg2+, Ca2+, etc.) | Affects drug-receptor binding and colloidal stability of formulations |
| Macromolecular Crowding | Low | High (80-400 mg/mL of proteins/RNA) | Impacts diffusion rates, binding kinetics, and drug availability [51] |
| Enzymatic Activity | Minimal or absent | High (proteases, nucleases, etc.) | Can lead to drug metabolism or premature activation before reaching the target |
| Subcellular Compartments | Not applicable | Distinct environments (nucleus, mitochondria, lysosomes) | Requires specific targeting signals for organelle-specific drug delivery [52] [51] |
Troubleshooting Guides
Guide 1: Addressing Discrepancies Between In-Vitro Potency and Cellular Efficacy
Problem: A compound shows excellent potency in a purified, cell-free enzyme assay (e.g., IC50 = 10 nM) but demonstrates weak or no activity in a subsequent cellular assay.
Potential Causes & Solutions:
Table 2: Troubleshooting In-Vitro to In-Cellular Efficacy Gaps
| Observed Symptom | Most Likely Cause | Diagnostic Experiments | Recommended Solutions |
|---|---|---|---|
| High enzyme inhibition, no cellular activity | Poor cellular permeability or efflux | 1. Measure logP/logD (e.g., using SiriusT3 [53]).2. Perform Caco-2 or PAMPA permeability assay.3. Test activity in the presence of an efflux pump inhibitor (e.g., verapamil). | 1. Reduce hydrogen bond donors/acceptors.2. Increase lipophilicity (optimize logD ~2-3).3. Modify structure to evade efflux pumps. |
| Good permeability but low activity | Instability in the cellular environment | 1. Incubate compound with cell lysates and analyze by LC-MS.2. Test compound stability at different pHs (e.g., 4.5, 7.4). | 1. Identify metabolic soft spots and block them (e.g., fluorination).2. Use prodrug strategies. |
| Activity in some cells but not others | Inefficient release from endocytic vesicles | 1. Use confocal microscopy with a fluorescently-labeled analog to track cellular trafficking.2. Measure activity after adding endosomolytic agents (e.g., chloroquine). | 1. Incorporate endosomolytic/disruptive motifs (e.g., histidine-rich peptides, viral peptides) [52].2. Switch to a nanoparticle delivery system that escapes the endosome. |
| Potency varies with cell confluency or media | Failure to engage the target due to intracellular protein binding or sequestration in organelles | 1. Perform cellular thermal shift assays (CETSA).2. Fractionate cells to measure drug concentration in cytosol vs. organelles. | 1. Increase target binding affinity to outcompete non-specific binding.2. Engineer organelle-specific targeting [51]. |
Guide 2: Refining SAR for Intracellular Protein-Protein Interaction (PPI) Targets
Problem: SAR data is noisy and non-predictive for a challenging intracellular target, such as a protein-protein interaction, making lead optimization difficult.
Potential Causes & Solutions:
Table 3: Troubleshooting Noisy or Non-Predictive SAR Data
| Observed Symptom | Most Likely Cause | Diagnostic Experiments | Recommended Solutions |
|---|---|---|---|
| High micomolar cellular IC50 despite nanomolar biochemical binding | The compound's physicochemical properties prevent it from reaching the cytosol/nucleus in sufficient concentration. | 1. Determine the compound's physicochemical properties (pKa, logD, solubility) [53].2. Correlate cellular activity with calculated properties like polar surface area (PSA) and molecular weight. | 1. Focus on leads with MW <500 and lower PSA to improve passive diffusion.2. Use cell-penetrating peptides (CPPs) or antibody-drug conjugates for delivery. |
| Steep or flat SAR; small structural changes cause dramatic activity loss. | The compound is acting on an off-target or the assay is measuring a downstream, indirect effect. | 1. Use a orthogonal cellular readout (e.g., qPCR, Western blot of a downstream marker).2. Perform counter-screening against a panel of related targets. | 1. Validate target engagement directly in cells using techniques like CETSA or NanoBRET.2. Use a CRISPRi/CRISPRa model to confirm the phenotype is target-specific. |
| Inconsistent data between similar cell lines. | Variable expression of the target protein or of transporters involved in drug uptake/efflux. | 1. Quantify target protein expression in different cell lines by Western blot.2. Profile expression of major efflux transporters (e.g., P-gp, BCRP). | 1. Use isogenic cell lines that differ only in the expression of the target protein.2. Standardize assays using a well-characterized, relevant cell model. |
Frequently Asked Questions (FAQs)
Q1: Why is my compound's logP not correlating well with its cellular permeability? A: LogP (partition coefficient) measures partitioning between octanol and water, which is a simplistic model of a lipid membrane. A more relevant metric is logD (distribution coefficient) at physiological pH (7.4), which accounts for the ionization state of the molecule. A compound with a high logP might be mostly ionized at pH 7.4, resulting in a low logD and poor permeability. Always measure or calculate logD7.4 for a more accurate prediction of passive diffusion [53]. Furthermore, specific transporters or efflux pumps can override the passive permeability predicted by logD.
Q2: How can I experimentally determine if my compound is reaching its intracellular target? A: Several advanced techniques can directly confirm target engagement in a cellular context:
- Cellular Thermal Shift Assay (CETSA): This method detects ligand binding by measuring the stabilization of the target protein against thermal denaturation. A shift in the protein's melting temperature in compound-treated cells confirms the compound is entering the cell and binding its target.
- NanoBRET / FRET-based Assays: These assays use energy transfer between tags on the target protein and a fluorescent ligand to monitor binding in live cells.
- Intracellular Protein Crystallography: Though challenging, this can provide a direct structural view of the drug-target interaction within the cell.
Q3: What are the key physicochemical property ranges for compounds targeting intracellular sites? A: While the classic "Rule of Five" (MW ≤ 500, logP ≤ 5, HBD ≤ 5, HBA ≤ 10) provides a general guide for oral bioavailability, intracellular targets, especially those beyond the cytosol, may have stricter requirements. For passive diffusion into the cytosol, aim for:
- Molecular Weight: < 450 Da
- logD7.4: 1 - 3
- Polar Surface Area (TPSA): < 100 Ų Compounds that require active targeting (e.g., using peptides or antibodies) can exceed these ranges but face different challenges related to trafficking and endosomal escape [54].
Q4: Our lead compound works well in a cell line but shows no efficacy in a mouse model. Could intracellular conditions be a factor? A: Absolutely. The discrepancy can arise from several factors rooted in intracellular biology. The target protein's expression level, its subcellular localization, or the intracellular concentration of co-factors may differ between the cell line and the primary cells in the animal model. Furthermore, the intracellular concentration of the drug in the target tissue in mice might be insufficient due to more potent efflux transporters or more aggressive metabolic degradation in vivo compared to your in vitro cell system. Measuring tissue drug concentrations and performing PD biomarker analysis in the target tissue is crucial.
Featured Experimental Protocols
Protocol 1: Determining the Impact of Intracellular pH on Compound Stability and Activity
Objective: To evaluate if a compound's loss of activity in cells is due to instability in acidic intracellular compartments (e.g., endosomes, lysosomes).
Materials:
- Test compound
- Relevant buffer solutions: Citrate-phosphate buffer (pH 4.0, 5.0, 6.0), Phosphate-buffered saline (PBS, pH 7.4)
- LC-MS or HPLC system with UV-Vis detector
- Heated water bath or incubator
- Cellular assay kit for measuring target activity
Methodology:
- Preparation: Prepare a 10 mM stock solution of the test compound in DMSO.
- Incubation: Dilute the compound to 100 µM in each of the different pH buffers (4.0, 5.0, 6.0, 7.4) in microcentrifuge tubes. Perform replicates (n=3).
- Stability Challenge: Incubate the samples at 37°C for 0, 1, 4, and 24 hours.
- Analysis:
- Chemical Stability: At each time point, remove an aliquot and analyze by LC-MS/HPLC. Quantify the percentage of parent compound remaining versus degradation products.
- Functional Stability: At the 4-hour time point, take an aliquot from each pH condition, neutralize if necessary, and test its activity in your cell-free biochemical assay.
- Data Interpretation: A sharp decrease in the percentage of parent compound and a loss of biochemical activity at low pH indicates acid-mediated instability, explaining potential failure in cellular assays.
Protocol 2: Measuring Intracellular Compound Concentration and Localization
Objective: To quantify how much of a compound enters cells and to identify its subcellular localization.
Materials:
- Fluorescently-labeled analog of the test compound (or the parent compound if it is intrinsically fluorescent)
- Cultured target cells
- Confocal microscope
- Cell fractionation kit (e.g., plasma membrane, cytosol, organelle isolation)
- LC-MS/MS system for quantification
Methodology:
- Treatment: Treat cells with the fluorescent compound or the parent compound at a relevant concentration (e.g., 1-10 µM) for a set time (e.g., 2-4 hours).
- Localization (Imaging):
- For the fluorescent analog: Fix the cells and stain with organelle-specific dyes (e.g., MitoTracker for mitochondria, Hoechst for nucleus, LysoTracker for lysosomes).
- Image using a confocal microscope. Co-localization of the compound's fluorescence with an organelle marker indicates its subcellular distribution [51].
- Quantification (Fractionation):
- Treat a larger number of cells with the parent compound.
- Wash the cells to remove extracellular compound.
- Use a cell fractionation kit to separate cytosol, membranes, and organelles.
- Lyse each fraction and use LC-MS/MS to quantify the absolute amount of the compound in each compartment.
- Data Interpretation: This protocol reveals whether the compound is efficiently entering the cell and, crucially, if it is accumulating in the correct compartment to engage its target (e.g., nucleus for a DNA-binding drug).
Visualization: Key Signaling Pathways and Workflows
Diagram 1: Intracellular SAR Determinants - This workflow illustrates how a compound's physicochemical properties dictate its journey through cellular barriers and its ultimate intracellular fate, which collectively determine the cellular response and define the true SAR.
Diagram 2: Intracellular Drug Delivery - This pathway outlines the multi-step journey of a targeted therapeutic from the extracellular space to its specific intracellular target organelle, highlighting endosomal escape as a critical bottleneck.
The Scientist's Toolkit: Essential Research Reagents & Materials
Table 4: Key Reagents and Tools for Intracellular SAR Research
| Reagent / Tool | Function / Application | Key Considerations |
|---|---|---|
| SiriusT3 Instrument | Automated measurement of key physicochemical properties: pKa, logP/logD, and intrinsic solubility [53]. | Provides high-throughput, reliable data under different pH conditions, crucial for predicting intracellular behavior. |
| Organelle-Specific Dyes (e.g., MitoTracker, LysoTracker, Hoechst) | Fluorescent markers for specific subcellular compartments (mitochondria, lysosomes, nucleus). | Used in confocal microscopy to determine the localization of fluorescent drug analogs. |
| Cell Fractionation Kits | Isolate specific cellular components (e.g., cytosol, membranes, nuclei, mitochondria). | Allows for quantitative measurement of drug concentration in the relevant subcellular compartment via LC-MS/MS. |
| Cellular Thermal Shift Assay (CETSA) Kits | Directly measure target engagement of a compound within the intact cellular environment. | Confirms that a compound not only enters the cell but also binds to its intended protein target. |
| PAMPA (Parallel Artificial Membrane Permeability Assay) | A high-throughput, non-cell-based model for predicting passive transcellular permeability. | Useful for early-stage screening of compound libraries before moving to more complex cell-based assays (e.g., Caco-2). |
| Endosomolytic Agents (e.g., Chloroquine) | Chemicals that disrupt endosomal membranes, leading to the release of endocytosed cargo into the cytosol. | Used as a diagnostic tool to test if a compound's inactivity is due to entrapment within the endo-lysosomal system. |
Solving the Discrepancy: Troubleshooting Inconsistencies Between Biochemical and Cellular Assays
Core Concepts: Intracellular vs. Extracellular Environments in Drug Research
In pharmaceutical research, the therapeutic efficacy of a compound is profoundly influenced by its journey through various biological compartments. A fundamental distinction in this journey is between the intracellular space (inside the cell) and the extracellular space (outside the cell) [15] [16]. These environments possess distinct physicochemical landscapes that can dictate a molecule's behavior.
The extracellular fluid typically contains high concentrations of sodium, chloride, and bicarbonate. In contrast, the intracellular fluid is characterized by high levels of potassium, magnesium, phosphate, and proteins [16]. These differences in composition create gradients that drive passive and active transport across the semi-permeable plasma membrane [16] [55]. For a drug to reach an intracellular target, it must successfully navigate this extracellular environment, cross the membrane, and then remain active in the intracellular milieu. Challenges can arise at any of these stages, making it crucial to diagnose whether a failure is due to poor membrane permeability, inadequate solubility in the relevant fluid, or an incompatible physicochemical condition (e.g., pH, ionic strength) in either compartment.
Table 1: Key Characteristics of Intracellular and Extracellular Fluids
| Feature | Intracellular Fluid | Extracellular Fluid |
|---|---|---|
| Primary Cations | High Potassium (K⁺), Magnesium (Mg²⁺) | High Sodium (Na⁺) |
| Primary Anions | High Phosphate, Proteins | High Chloride (Cl⁻), Bicarbonate (HCO₃⁻) |
| Approx. % of Body Weight | ~40% | ~20% (Plasma ~5%, Interstitial ~12%) |
| General Function | Site of metabolic reactions, cell signaling | Medium for nutrient/waste transport, intercellular communication |
Troubleshooting Guide & FAQs
FAQ 1: Our lead compound shows excellent in vitro binding to an intracellular enzyme target, but no efficacy in cellular assays. How do we diagnose if the issue is permeability or solubility?
This is a classic problem in drug discovery. A structured approach is needed to isolate the variable causing the failure.
Step 1: Evaluate Aqueous Solubility in Physiologically Relevant Buffers
- Protocol: Prepare a saturated solution of your compound in buffers mimicking both extracellular (pH 7.4) and intracellular (pH ~7.2) conditions. Shake for 24 hours at 37°C, then filter and quantify the concentration in the supernatant using HPLC-UV [56] [57].
- Interpretation: If the measured solubility in the extracellular buffer is below the concentration required for the desired pharmacological effect, solubility is a likely culprit. Remember, a compound must be dissolved to permeate.
Step 2: Assess Membrane Permeability
- Protocol: Use the parallel artificial membrane permeability assay (PAMPA) or a cell-based model like Caco-2 to determine the apparent permeability (Papp) [56] [57]. The PAMPA assay involves creating an artificial lipid membrane between a donor and an acceptor compartment. Test your compound at a concentration well below its solubility limit to ensure the measurement reflects permeability, not precipitation.
- Interpretation: A low Papp value suggests poor passive diffusion across lipid membranes. This indicates that the compound, even if soluble, may not be efficiently entering the cell.
Step 3: Investigate Intracellular Accumulation
- Protocol: Use techniques like liquid chromatography with tandem mass spectrometry (LC-MS/MS) to directly measure the intracellular concentration of the compound after exposure. Compare this to the extracellular concentration to calculate an accumulation ratio.
- Interpretation: A low accumulation ratio confirms a permeability or active efflux issue. A high ratio suggests successful penetration, pointing the investigation toward potential intracellular metabolism or target engagement problems.
FAQ 2: We suspect our experimental results are being confounded by shifts in extracellular pH. What is the mechanistic basis for this, and how can we control it?
Changes in extracellular pH can dramatically alter a compound's ionization state, thereby affecting both its solubility and permeability, a concept central to the Biopharmaceutics Classification System (BCS) [56].
Mechanistic Explanation: The pH partition hypothesis states that primarily the uncharged, lipophilic form of a molecule passively diffuses across cell membranes. For ionizable compounds, the fraction in this uncharged state is governed by the Henderson-Hasselbalch equation and the compound's acid dissociation constant (pKa) [56]. An acidic extracellular environment (e.g., in some tumor microenvironments) can protonate weak bases, increasing their charge and reducing their permeability. Conversely, it can deprotonate weak acids, making them more permeable. Furthermore, pH can directly influence the chemical stability of the compound.
Experimental Control and Modulation Protocol:
- Systematic pH Profiling: Conduct key assays (e.g., solubility, permeability, efficacy) across a physiologically relevant pH range (e.g., pH 6.5 to 7.8) to map the pH-dependent activity of your compound [56] [57].
- Use of Buffered Systems: Employ well-calibrated biological buffers (e.g., HEPES, phosphate) in your culture media and assay solutions to maintain a stable and precise pH. Monitor pH before and after experiments.
- Chemical Modulation: In cell culture or tissue models, you can carefully manipulate extracellular pH using buffers or by controlling CO₂ levels in the incubator. However, be aware that this can induce cellular stress responses and confound results.
FAQ 3: How can we differentiate between the effects of intracellular vs. extracellular vesicles in our co-culture experiments, and why does it matter?
Extracellular vesicles (EVs) are nanoparticles secreted by cells that mediate intercellular communication by transferring proteins, lipids, and nucleic acids [58] [59]. Differentiating their effects is vital because they represent two distinct communication pathways.
Why It Matters: Intracellular vesicles (e.g., endosomes, lysosomes) are involved in internal cell processes like metabolism and signaling. EVs, once released, act as external messengers that can influence recipient cells in an autocrine, paracrine, or endocrine manner. Confounding the two can lead to a fundamental misunderstanding of the communication mechanism being studied [59].
Methodologies for Differentiation:
- Inhibitor-Based Strategy: Use small molecule inhibitors that block key steps in EV biogenesis or release. For example, GW4869 inhibits neutral sphingomyelinase, which is involved in the formation of intraluminal vesicles within multivesicular bodies, thereby reducing exosome secretion [58]. A reduction in the observed biological effect in the presence of such inhibitors strongly implicates EVs.
- Physical Separation (Ultracentrifugation): Isolate EVs from the conditioned media of donor cells before adding the media to recipient cells. If the biological effect is lost with EV-depleted media but is restored by adding back the isolated EVs, it confirms the EV-mediated effect [58].
- Fluorescent Labeling and Tracking: Label donor cell membranes or EV-specific proteins (e.g., CD63, CD81) with a fluorescent tag (e.g., GFP, RFP). Using live-cell imaging or flow cytometry, you can then track the transfer of fluorescence from donor to recipient cells, visually confirming EV uptake and ruling out direct cell-cell contact or other soluble factors.
The Scientist's Toolkit: Key Reagent Solutions
Table 2: Essential Reagents for Investigating Physicochemical Properties
| Reagent / Tool | Primary Function | Application Note |
|---|---|---|
| PAMPA Plate | To measure passive permeability through an artificial lipid membrane. | A high-throughput, cell-free tool for early-stage permeability ranking. Does not account for active transport [56]. |
| Octanol & Aqueous Buffers | For experimentally determining the logP (lipophilicity) and logD (pH-dependent distribution) of a compound. | A core physicochemical descriptor; high logP often correlates with better permeability but can hurt solubility [56] [57]. |
| HEPES & Phosphate Buffers | To provide stable, physiologically relevant pH control in extracellular and intracellular mimicry experiments. | Critical for isolating pH effects on solubility, permeability, and stability [56]. |
| GW4869 | A chemical inhibitor of neutral sphingomyelinase, used to block the biogenesis and release of exosomes. | A key tool for experimentally implicating EVs in a observed biological process [58]. |
| Opti-MEM (Serum-Free Medium) | A low-protein, serum-free medium used for EV production and other sensitive cellular assays. | Reduces confounding by exogenous vesicles and proteins found in fetal bovine serum (FBS) [58]. |
Signaling Pathways & Experimental Workflows
The following diagram illustrates a generalized pathway of how extracellular stimuli or stressful physicochemical conditions can trigger intracellular signaling cascades, ultimately leading to the production and release of extracellular vesicles—a key communication mechanism in physiological and pathological states.
Diagram 1: Signaling pathways leading to EV release under stress.
The experimental workflow for systematically diagnosing issues related to solubility, permeability, and physicochemical conditions is outlined below. This structured approach helps researchers efficiently pinpoint the source of experimental failure.
Diagram 2: Physicochemical problem diagnosis workflow.
Optimizing Assay Conditions to Bridge the Gap Between Biochemical (BcA) and Cellular (CBA) Results
FAQs on BcA-CBA Discrepancies
Why is there often a discrepancy between the activity (e.g., IC₅₀) of a compound measured in a biochemical assay (BcA) versus a cellular assay (CBA)?
The discrepancy arises because standard biochemical assays are performed in simple buffer solutions like PBS, which mimic extracellular physicochemical (PCh) conditions. In contrast, cellular assays measure activity in the complex intracellular environment. Key differences include macromolecular crowding, high viscosity, distinct salt compositions (high K⁺/low Na⁺), and different cosolvent content, all of which can significantly alter a compound's apparent binding affinity (Kd) and the resulting IC₅₀ values [60].
What are the key physicochemical parameters of the intracellular environment that I should replicate in a biochemical assay?
To better mimic the intracellular environment in your BcA, consider adjusting the following key parameters [60]:
- Macromolecular Crowding: The cytoplasm is densely packed with macromolecules (100-200 mg/mL), which can be simulated using crowding agents like Ficoll, polyethylene glycol (PEG), or dextran.
- Salt Composition: Intracellular fluid has a high K⁺ (~140-150 mM) and low Na⁺ (~14 mM) concentration, which is the inverse of standard PBS.
- Viscosity: Cytoplasmic viscosity is higher than water. Glycerol or sucrose can be used to modulate viscosity in vitro.
- Lipophilicity/Cosolvents: The presence of various metabolites and cosolvents affects the solvation of compounds.
Can you provide a specific protocol for measuring an intracellular parameter?
Yes, the following is a rapid microplate assay for determining intracellular ascorbate levels [61].
Protocol: Determination of Intracellular Ascorbate
- Principle: This method quantifies ascorbate by incubating cell extracts with ascorbate oxidase to selectively deplete it. The remaining ascorbate reduces ferricyanide to ferrocyanide, which then reacts with ferric iron to form a chromogenic complex that can be measured spectrophotometrically [61].
- Key Steps:
- Cell Preparation: Culture and harvest your cells. Prepare a cellular extract.
- Standard Curve: Prepare a series of ascorbate standards (e.g., 0-20 µM) in a 96-well plate.
- Reaction: Add PBS or ascorbate oxidase (AO) to paired wells. Add potassium ferricyanide to all wells.
- Detection: Add a solution of acetic acid and trichloroacetic acid, followed by a ferricyanide detection solution.
- Measurement: Orbital mix the plate in the dark for 30 minutes and read the absorbance at 593 nm.
- Calculation: Determine the amount of intracellular ascorbate from the standard curve and normalize it to the protein content [61].
Troubleshooting Guide: Bridging the BcA-CBA Gap
| Problem Area | Common Issue | Potential Solution |
|---|---|---|
| Buffer Conditions | Using PBS, which mimics extracellular space [60]. | Switch to a cytoplasm-mimicking buffer (see table below). |
| Neglecting macromolecular crowding [60]. | Add crowding agents (e.g., 100 mg/mL Ficoll 70) to the assay buffer. | |
| Data Interpretation | Significant, unexplained difference between BcA and CBA Kd/IC₅₀ values [60]. | Re-run the BcA using a cytoplasm-mimicking buffer and compare the new values. |
| Poor correlation in Structure-Activity Relationship (SAR) between BcA and CBA data [60]. | Ensure biochemical assays are performed under conditions relevant to the cellular target's native environment. | |
| Cell Health & Assay Readout | Cytotoxicity obscuring the intended therapeutic effect. | Use a cell viability assay (e.g., CCK-8) in parallel to confirm the effect is not due to general cell death [62]. |
| Unoptimized cell numbers leading to inaccurate viability readings. | Perform a cell titration in a 96-well plate to determine the optimal seeding density for your assay [62]. |
Research Reagent Solutions
The table below lists key reagents and their roles in optimizing assay conditions.
| Reagent / Solution | Function / Explanation |
|---|---|
| Cytoplasm-Mimicking Buffer | A buffer solution formulated with high K⁺, crowding agents, and adjusted viscosity to better replicate the intracellular environment than standard PBS [60]. |
| Macromolecular Crowding Agents | Inert polymers like Ficoll 70 or PEG used to simulate the dense, crowded interior of a cell, which can influence protein-ligand interactions and Kd values [60]. |
| Cell Counting Kit-8 (CCK-8) | A colorimetric assay using WST-8 to measure cell viability and proliferation. It is water-soluble, non-radioactive, and allows for simple, one-step procedures [62]. |
| WST-1 Assay Reagent | A tetrazolium salt used in colorimetric cell viability assays. It is reduced by mitochondrial dehydrogenases in metabolically active cells to a water-soluble formazan dye [63]. |
| Ascorbate Oxidase | An enzyme used in specific protocols to selectively oxidize and deplete ascorbate, allowing for the measurement of intracellular ascorbate levels in cultured cells [61]. |
Standard vs. Cytoplasm-Mimicking Buffer Formulation
The following table provides a direct comparison between a standard buffer and a proposed formulation for a cytoplasm-mimicking buffer.
| Parameter | Phosphate-Buffered Saline (PBS) | Proposed Cytoplasm-Mimicking Buffer |
|---|---|---|
| Primary Cation | Na⁺ (157 mM) | K⁺ (~140 mM) |
| K⁺ Concentration | Low (4.5 mM) | High (~140 mM) |
| Na⁺ Concentration | High (157 mM) | Low (~14 mM) |
| Macromolecular Crowding | None | High (e.g., 100 mg/mL Ficoll 70) |
| Viscosity | Low (like water) | Adjusted to be higher (e.g., with glycerol) |
| Intended Environment | Extracellular space | Intracellular (cytoplasmic) space |
Experimental Pathways and Workflows
The following diagram illustrates the core concept of how optimizing buffer conditions can bridge the gap between different assay types.
Diagram 1: Strategy for aligning BcA and CBA results.
This workflow outlines the process for implementing and validating an improved, intracellular-like assay condition.
Diagram 2: Workflow for buffer optimization.
Frequently Asked Questions (FAQs)
Q1: What exactly are "Goldilocks molecules," and why are they significant for intracellular targets?
Goldilocks molecules are a class of synthetic therapeutic compounds that occupy a crucial middle ground between traditional small molecules and large biologics. Typically ranging from 1–2 kDa in size, they are "not too small, not too large, but just right" [64]. Their significance lies in their ability to target intracellular proteins that were previously considered "undruggable," such as transcription factors and other regulatory proteins that lack well-defined pockets for small molecules to bind [64]. They are structured enough to bind with high specificity to flat protein surfaces, yet small and modular enough to navigate the intracellular environment, a feat biologics generally cannot achieve due to their inability to cross cellular membranes [64] [65].
Q2: My Goldilocks molecule shows high binding affinity in a biochemical assay but no activity in a subsequent cell-based assay. What could be the reason?
This is a common challenge and often points to issues with cell permeability. High-affinity binding does not guarantee that the molecule can cross the cell membrane to reach its intracellular target [64]. Other potential causes include:
- The compound is being pumped out of the cell by efflux transporters like P-glycoprotein [66] [67].
- Rapid metabolic degradation of the compound inside the cell [64].
- The compound is sequestered in endosomal/lysosomal compartments after endocytic uptake, preventing it from reaching its cytosolic or nuclear target [67] [68].
- The target protein in the cell-based assay may be in an inactive conformation, or the activity may be mediated by an upstream or downstream kinase [66].
Q3: What does the "hook effect" mean in the context of PROTACs, which are a type of Goldilocks modality?
The "hook effect" is a concentration-dependent phenomenon specific to heterobifunctional molecules like PROTACs. At high concentrations, the PROTAC is more likely to form non-productive binary complexes with either the target protein or the E3 ubiquitin ligase, rather than the productive ternary complex (target-PROTAC-ligase) needed for degradation. This leads to a reduction in degradation potency at higher concentrations, which can misleadingly suggest low efficacy if not tested at a proper concentration range [69].
Q4: How can I improve the oral bioavailability of a macrocyclic peptide candidate?
Oral bioavailability requires survival of the harsh gastrointestinal (GI) environment and efficient absorption. Strategies include:
- Designing for Chameleonicity: Engineering the peptide to change its conformation, hiding its polar backbone in the hydrophobic environment of the GI tract and cell membranes, then flipping back to its active form inside the cell. Natural products like cyclosporine employ this strategy [65].
- Enhancing Permeation: Using permeation enhancers, such as thiomers (thiolated polymers), which can reversibly open tight junctions between intestinal epithelial cells, facilitating paracellular transport [67].
- Formulation Innovations: Utilizing advanced formulations like polymeric micelles, lipid-based nanoparticles, or amorphous solid dispersions to protect the peptide from degradation and enhance its absorption [69].
Troubleshooting Guides
Problem: Lack of Cell Permeability
Issue: Your potent Goldilocks molecule fails to exhibit activity in cell-based assays despite high affinity in biochemical assays.
Possible Causes & Solutions:
| Cause | Diagnostic Experiments | Solution Strategies |
|---|---|---|
| High Polarity | Calculate cLogP; assess hydrogen bond donors/acceptors. | Chemically modify the structure to reduce polarity; incorporate "chameleonic" properties that shield polarity during membrane passage [65]. |
| Endosomal Trapping | Use co-localization studies with lysosomal markers (e.g., LysoTracker). | Conjugate with endosomolytic peptides or polymers that disrupt the endosomal membrane [67]. |
| Efflux by Transporters | Test activity in the presence of efflux pump inhibitors (e.g., verapamil). | Modify structure to be a poorer substrate for efflux pumps; use nanoparticulate carriers that bypass efflux mechanisms [67]. |
Recommended Experimental Protocol: Assessing Intracellular Uptake
- Fluorescent Labeling: Tag your Goldilocks molecule with a stable, cell-permeant fluorophore (e.g., FITC, TAMRA).
- Cell Treatment: Incubate the labeled compound with live target cells at a relevant concentration (e.g., 1-10 µM) for 1-4 hours.
- Confocal Microscopy Imaging:
- Use a high-resolution confocal microscope.
- Stain the nucleus with Hoechst 33342 and lysosomes with LysoTracker Deep Red.
- Acquire Z-stack images to confirm intracellular localization versus membrane adhesion.
- Data Analysis: Analyze co-localization coefficients (e.g., Pearson's coefficient) to determine if the compound is trapped in lysosomes or distributed in the cytosol [68].
Problem: Poor Solubility and Bioavailability
Issue: The molecule has low aqueous solubility, leading to aggregation, poor absorption, and unreliable assay results.
Possible Causes & Solutions:
| Cause | Diagnostic Experiments | Solution Strategies |
|---|---|---|
| High Hydrophobicity | Check for precipitation in aqueous buffers; measure solubility. | Formulate: Use solubilizing agents (e.g., cyclodextrins), polymeric micelles, or lipid nanoparticles [69]. |
| Molecular Obesity | Review molecular weight, rotatable bonds, and topological polar surface area. | Redesign: Optimize the linker in bifunctional molecules (e.g., PROTACs); employ a "tag-on" approach with solubilizing groups [69]. |
Recommended Experimental Protocol: Solubility and Formulation Screening
- Preparation: Prepare a 10 mM stock solution of the compound in DMSO.
- Dilution: Dilute the stock into various assay-compatible buffers (e.g., PBS, HEPES) and different formulation vehicles (e.g., 0.1% BSA, 2% HP-β-Cyclodextrin) to a target concentration of 10 µM.
- Incubation: Incubate the diluted solutions at 37°C for 1 hour.
- Analysis: Visually inspect for precipitation and/or measure the absorbance at 600 nm (light scattering) using a microplate reader. Solutions with high absorbance indicate precipitation.
- Selection: Proceed with the vehicle that shows the lowest absorbance for downstream functional assays.
Properties of Goldilocks Molecules vs. Traditional Modalities
Table 1: Comparing key properties of Goldilocks molecules with small molecules and biologics.
| Property | Small Molecules | Goldilocks Molecules | Biologics (e.g., mAbs) |
|---|---|---|---|
| Typical Molecular Weight | <500 Da [64] | 1-2 kDa [64] | >150 kDa |
| Target Type | Defined pockets (e.g., enzymes, GPCRs) [64] | Protein-protein interactions, flat surfaces [64] [65] | Extracellular domains, soluble proteins [64] |
| Cell Permeability | High | Variable; a key design challenge [64] [65] | Very Low [64] |
| Oral Bioavailability | Often good | Possible but challenging (e.g., 1-2% for MK-0616) [65] | Not feasible [64] |
| Typical ROA | Oral | Oral / Injectable | Injectable |
Efficacy Metrics for Featured Goldilocks Candidates
Table 2: Experimental data from pre-clinical and clinical studies of highlighted Goldilocks molecules.
| Molecule Name | Target / Indication | Key Efficacy Metric (Experimental) | Reported Challenge / Note |
|---|---|---|---|
| MK-0616 (Macrocyclic Peptide) | PCSK9 / High Cholesterol | Reduced free PCSK9 to near-zero levels in Phase 1 [65] | Low oral bioavailability (1-2%) compensated by high potency [65] |
| ARV-110 (PROTAC) | AR / Prostate Cancer | Phase II/III clinical trial (NCT03888612) [69] | Low aqueous solubility and bioavailability addressed via oral formulation [69] |
| Cyclic Cationic AMPs | Bacterial Membranes / Infection | MIC values vs. E. coli; binding affinity to LPS [70] | Requires "Goldilocks" affinity for LPS: not too tight, not too loose [70] |
The Scientist's Toolkit: Research Reagent Solutions
Table 3: Essential reagents and tools for developing and analyzing Goldilocks molecules.
| Tool / Reagent | Function | Example Use-Case |
|---|---|---|
| DNA-Encoded Libraries (DELs) | High-throughput screening of billions of compounds against a protein target to identify high-affinity binders [64]. | Discovery of macrocyclic peptide leads against "undruggable" targets like PCSK9 [64] [65]. |
| TR-FRET Assays | Ratiometric binding assays that minimize well-to-well variability and provide robust data (high Z'-factor) for characterizing interactions [66] [71]. | Measuring the binding affinity of a Spiroligomer molecule to a kinase in a LanthaScreen Eu Kinase Binding Assay [64] [72]. |
| Surface Plasmon Resonance (SPR) | Label-free technique to quantify binding kinetics (association/dissociation rates) and affinity between a molecule and its target [70]. | Determining the binding kinetics of cyclic antimicrobial peptides to lipopolysaccharides (LPS) [70]. |
| Cell-Penetrating Peptides (CPPs) | Short peptides that facilitate the cellular uptake of cargo molecules [73]. | Conjugated to a Goldilocks molecule to improve its cytosolic delivery [64] [73]. |
| Lipid Nanoparticles (LNPs) | A delivery system that encapsulates therapeutics to improve solubility, stability, and intracellular delivery [69]. | Formulating a hydrophobic PROTAC for in vivo administration to enhance its bioavailability [69]. |
Key Concepts and Workflow Visualizations
Goldilocks Molecules: A Third Path in Drug Discovery
Goldilocks Molecules Bridge the Gap
Intracellular Delivery Challenge and Strategies
The Intracellular Delivery Journey
PROTAC Mechanism and the Hook Effect
PROTAC Mechanism and the Hook Effect
Strategic Use of Chemical and Mechanical Stimulation to Modulate Cellular Environments
Frequently Asked Questions (FAQs)
FAQ 1: What is the fundamental difference between managing intracellular and extracellular physicochemical conditions? Managing intracellular conditions focuses on the environment within the cell membrane, including the cytoplasm and organelles, which is a crowded, granular medium affecting reaction rates and diffusion [74]. Managing extracellular conditions targets the cell's external environment (e.g., interstitial fluid, tissue culture media), aiming to influence cellular responses like migration or cytokine secretion by altering external biochemical and biophysical cues [75] [76].
FAQ 2: Why would an experiment involving mechanical stimulation fail to produce the expected cellular response? Several factors could be at play:
- Inappropriate Stimulation Parameters: The specific mechanical cue (e.g., pressure, substrate stiffness) may be outside the effective range for your cell type.
- Heterogeneous Cell Population: The response may be masked if only a subpopulation of cells (e.g., specific stem cells) is sensitive to the stimulation. Identifying cells using markers like size, stiffness, and nuclear dynamics is crucial [76].
- Incorrect Extracellular Environment: The chemical composition of the culture medium (e.g., growth factors, pH) may not support the mechanotransduction pathway.
FAQ 3: How can I troubleshoot an experiment where cells are not migrating as expected under applied mechanical stimulation? A systematic troubleshooting approach is recommended [19] [77]:
- Repeat the experiment to rule out simple human error.
- Verify your controls: Ensure you have positive controls (e.g., a known chemoattractant) to confirm the cells' intrinsic ability to migrate.
- Check your equipment and reagents: Confirm the mechanical stimulator is calibrated and functioning. Ensure culture media and reagents are fresh and stored correctly.
- Isolate variables: Systematically change one parameter at a time (e.g., pressure magnitude, frequency, co-culture conditions) to identify the critical factor, as the presence of neighboring cell types can drastically alter the outcome [75].
FAQ 4: What are some key reagents for researching intracellular-extracellular crosstalk? Essential reagents include:
- Buffering Agents: Sodium bicarbonate (for extracellular pH) and beta-alanine (to increase intracellular carnosine, an endogenous buffer) [40].
- Cytokine Detection Kits: For quantifying chemical outputs (e.g., from stem cells) in response to stimulation [76].
- Metabolic Substrates: Such as glucose and galactose, used in studies to trace metabolic activity differences between intracellular and extracellular polysaccharides [78].
Troubleshooting Guides
Guide 1: Low Cytokine Secretion from Stem Cells After Mechanical Stimulation
Problem: Mesenchymal stem cells subjected to mechanical stimulation show low levels of desired cytokine output.
Solution:
- Step 1: Confirm Cell Identity. Verify that you are working with a pure or enriched stem cell population. Use identification markers such as cell size, mechanical stiffness, and nuclear dynamics [76].
- Step 2: Characterize the Material Environment. Systematically quantify the mechanical properties (e.g., stiffness, roughness) of the synthetic materials the cells are interacting with, as these directly correlate with chemical production [76].
- Step 3: Profile Cytokines. Perform a broad cytokine profile to determine if the stimulation is altering the types, rather than just the total amount, of cytokines secreted [76].
- Step 4: Optimize Stimulation Parameters. Design an experiment to test a range of stimulation intensities and durations to find the optimal cue for your specific setup.
Guide 2: Inconsistent Results in Modulating Intracellular vs. Extracellular Buffering
Problem: Inconsistent findings when attempting to influence the intracellular and extracellular buffering capacity to combat exercise-induced acidosis.
Solution:
- Step 1: Verify Supplement Protocols. Ensure dosing and duration align with established research.
- Step 2: Check for Contamination. Ensure supplements are pure and not degraded.
- Step 3: Control Subject Diet. Standardize diet before testing, as food can influence blood and urinary pH.
- Step 4: Use Validated Measurement Techniques. For intracellular buffering, use muscle biopsies to measure carnosine. For extracellular buffering, use blood gas analyzers to measure bicarbonate and pH.
Data Presentation
Table 1: Quantitative Comparison of Intracellular and Extracellular Polysaccharide Properties and Activities
This table summarizes key data from a comparative study on polysaccharides from Morchella esculenta [78].
| Property / Activity | Intracellular Polysaccharide (IPS) | Extracellular Polysaccharide (EPS) |
|---|---|---|
| Molecular Weight | Higher | Lower |
| Particle Size | Higher | Lower |
| Thermal Stability | Lower | Greater |
| Apparent Viscosity | Higher | Lower |
| Sulphate Content | Lower | Higher |
| Molar Ratio of Galactose | Lower | Higher |
| α-amylase Inhibition | Lower activity | Stronger activity |
| α-glucosidase Inhibition | Lower activity | Stronger activity |
| Glucose Adsorption Capacity | Stronger | Weaker |
Table 2: Key Research Reagent Solutions for Cellular Environment Modulation
This table details essential materials used in experiments related to modulating cellular environments.
| Reagent / Material | Function / Explanation |
|---|---|
| Beta-Alanine | A non-essential amino acid that is the rate-limiting precursor for synthesizing carnosine, an intracellular pH buffer in muscle cells [40]. |
| Sodium Bicarbonate | An extracellular buffering agent that increases blood bicarbonate concentration, helping to neutralize hydrogen ions (H+) that diffuse from muscle during high-intensity exercise [40]. |
| Inertial Microfluidic Separator | A device used to sort and enrich heterogeneous cell populations (e.g., stem cells from bone marrow) based on properties like cell size, a key step in ensuring a consistent experimental sample [76]. |
| Synthetic Material Scaffolds | Engineered materials with tunable stiffness and roughness used to provide controlled mechanical stimulation to cells and study cell-material interactions [76]. |
| Carnosine | A cytoplasmic dipeptide that functions as an obligatory physicochemical buffer within the cell due to the optimal pKa (6.83) of its imidazole ring [40]. |
Experimental Protocols
Protocol 1: In Vitro Assay for Hypoglycemic Activity of Polysaccharides
This protocol is adapted from methods used to compare intracellular (IPS) and extracellular (EPS) polysaccharides [78].
Objective: To evaluate and compare the inhibitory activity of polysaccharide samples on digestive enzymes (α-amylase and α-glucosidase) and their glucose adsorption capacity.
Materials:
- Polysaccharide samples (IPS and EPS)
- α-amylase enzyme solution
- α-glucosidase enzyme solution
- Substrate solutions (e.g., starch solution for α-amylase, p-nitrophenyl-α-D-glucopyranoside for α-glucosidase)
- Glucose solution
- Phosphate buffer (pH 6.8 for α-amylase; pH 6.9 for α-glucosidase)
- Colorimetric reagents (e.g., DNS reagent for α-amylase; Na2CO3 solution for α-glucosidase)
- Spectrophotometer
- Water bath or incubator
Method: A. α-Amylase Inhibitory Assay:
- Mix a suitable volume of polysaccharide sample with α-amylase solution and pre-incubate.
- Add starch solution and incub further.
- Stop the reaction with DNS reagent and heat.
- Measure the absorbance and calculate the inhibition percentage relative to a control.
B. α-Glucosidase Inhibitory Assay:
- Mix the polysaccharide sample with α-glucosidase solution and pre-incubate.
- Add the substrate (pNPG) and incubate.
- Stop the reaction with Na2CO3 solution.
- Measure the absorbance and calculate the inhibition percentage.
C. Glucose Adsorption Capacity:
- Mix the polysaccharide sample with a glucose solution.
- Incubate in a water bath with gentle shaking.
- Measure the glucose concentration in the supernatant at intervals.
- Calculate the amount of glucose adsorbed per gram of polysaccharide.
Protocol 2: Modulating Stem Cell Cytokine Secretion via Material Properties
This protocol outlines an approach to alter the chemical output of stem cells by changing their mechanical environment [76].
Objective: To manipulate the secretion of tissue-repair cytokines from bone marrow-derived stem cells by growing them on synthetic materials with varying mechanical properties.
Materials:
- Primary bone marrow-derived mesenchymal stem cells (MSCs)
- Cell culture plates coated with polyacrylamide hydrogels or other polymers of varying stiffness
- Standard cell culture medium
- Inertial microfluidic separation device (for cell sorting)
- ELISA kits or other cytokine detection assays
Method:
- Cell Preparation: Isolate MSCs from bone marrow. Use an inertial microfluidic separator to enrich for a subpopulation of stem cells based on size and stiffness to reduce population heterogeneity [76].
- Plating: Seed the enriched stem cells onto the prepared material substrates with a range of controlled stiffness (e.g., from 1 kPa to 50 kPa).
- Stimulation and Culture: Maintain the cells under standard conditions for a set period (e.g., 24-72 hours) to allow them to respond to the material cues.
- Conditioned Media Collection: Collect the culture medium (now "conditioned") after the incubation period. Centrifuge to remove any cells or debris.
- Cytokine Quantification: Use specific ELISA kits to quantify the concentration of target cytokines (e.g., VEGF, IL-6, IGF-1) in the conditioned media.
- Data Analysis: Correlate the cytokine secretion profiles with the measured mechanical properties of the material substrates.
Experimental Workflows and Pathways
Troubleshooting Guides
pH Control Troubleshooting
Problem: Inconsistent or drifting pH measurements in cell culture media.
| Possible Cause | Diagnostic Steps | Corrective Action |
|---|---|---|
| CO₂ Efflux | Measure pH immediately after removal from incubator and again after 10 minutes at room temperature. | Minimize exposure to ambient air; use pre-equilibrated buffers or sealed measurement systems. |
| Bicarbonate Buffer Instability | Confirm media age and storage conditions; check for contamination. | Use fresh culture media; consider switching to HEPES-buffered (20-25 mM) systems for better external pH control outside incubators [58]. |
| Metabolic Acidification | Monitor glucose consumption and lactate production; track intracellular vs. extracellular pH differentials. | Implement medium refresh schedules or perfusion systems; modulate cell density or nutrient composition to manage metabolic load [58]. |
Problem: Inaccurate intracellular pH (pHi) estimation.
| Possible Cause | Diagnostic Steps | Corrective Action |
|---|---|---|
| Dye Leakage/Compartmentalization | Perform calibration curves post-experiment using high-K⁺/nigericin method; check for punctate staining under microscope. | Use ratiometric dyes (e.g., BCECF-AM); ensure proper loading protocols and include inhibitor cocktails to reduce dye sequestration. |
| Insufficient Buffer Capacity | Measure extracellular pH (pHe) drift during experiment. | Increase HEPES concentration (10-25 mM) while ensuring osmolality is maintained; use specialized, high-buffer-capacity imaging media. |
Viscosity Management Troubleshooting
Problem: Unexpectedly high viscosity in extracellular vesicle (EV) preparations or cell lysates.
| Possible Cause | Diagnostic Steps | Corrective Action |
|---|---|---|
| DNA/RNA Contamination | Treat sample with nucleases (e.g., DNase I, RNase A); re-measure viscosity. | Incorporate a nuclease digestion step (e.g., 10-50 U/mL for 30 min at 37°C) into the purification protocol. |
| High Macromolecular Crowding | Measure protein concentration (e.g., BCA assay); analyze sample via SDS-PAGE. | Increase dilution factor; optimize purification steps (e.g., size-exclusion chromatography, differential centrifugation) to isolate target components. |
| Polysaccharide Content | Use specific biochemical assays (e.g., phenol-sulfuric acid method) for carbohydrate quantification. | For intracellular polysaccharides (IPS) vs. extracellular polysaccharides (EPS), note that IPS often has higher molecular weight and apparent viscosity [78]. Adjust purification to selectively isolate desired fraction. |
Lipophilicity Assessment Troubleshooting
Problem: Poor correlation between calculated and experimental logP/logD values.
| Possible Cause | Diagnostic Steps | Corrective Action |
|---|---|---|
| Ignoring Ionization at assay pH | Calculate the fraction ionized using the compound's pKa and the pH of the measurement system. | Use the distribution coefficient logD instead of the partition coefficient logP for ionizable molecules. logDpH = logPN + log(1 + 10^(pH-pKa) for bases) [79]. |
| Neglecting Ion Pair Partitioning | Compare measured logD in different buffer systems. | For charged species, account for apparent ion pair partitioning (PIPapp). This can be predicted using machine learning models or determined experimentally [79]. |
| Incorrect Octanol-Water System | Verify octanol and aqueous phase are pre-saturated with each other. | Always use mutually saturated solvents. For ionizable compounds, use buffered aqueous solutions at the relevant physiological pH (e.g., pH 7.4). |
Frequently Asked Questions (FAQs)
Q1: Why is controlling the pH of the extracellular environment (pHe) not sufficient for managing intracellular pH (pHi)?
The plasma membrane creates a barrier, and pHi is regulated by active transporters and cellular metabolism, creating a differential from pHe. Changes in pHe can indirectly affect pHi, but the relationship is not 1:1. Intracellular compartments (e.g., lysosomes, endosomes) can have vastly different pH values, and assays targeting these require specific probes. Effective management requires separate monitoring and control strategies for both intracellular and extracellular domains.
Q2: How do the physicochemical properties of intracellular vs. extracellular polysaccharides differ, and why does it matter for viscosity?
Studies on polysaccharides like those from Morchella esculenta show systematic differences. Intracellular Polysaccharides (IPS) often have a higher molecular weight and larger particle size, leading to higher apparent viscosity. Extracellular Polysaccharides (EPS) often have a lower molecular weight and different monosaccharide ratios (e.g., higher galactose), which can result in lower solution viscosity but potentially different bioactivity [78]. This matters because IPS and EPS will contribute differently to the overall viscous load in a sample and may require different isolation and handling protocols.
Q3: What is the fundamental difference between logP and logD, and when should I use each?
logP (Partition Coefficient) describes the partition of the neutral, un-ionized form of a compound between octanol and water. logD (Distribution Coefficient) describes the distribution of all forms of the compound (ionized and un-ionized) at a specific pH. You should:
- Use logP only for neutral compounds that do not ionize.
- Always use logD at a specific pH (e.g., logD₇.₄) for ionizable compounds, as this reflects the true distribution under physiological conditions and is critical for predicting ADME properties [79].
Q4: What are some chemical modulation strategies to enhance the production of extracellular vesicles (EVs) in cell culture?
Several culture condition parameters can be chemically modulated to increase EV yield [58]:
- pH: An acidic extracellular environment (pH < 6.5) has been shown to accelerate EV release in some cancer cell lines.
- Nutrient Starvation: Serum depletion or starvation can induce metabolic stress and upregulate genes related to EV biogenesis (e.g., Rab GTPases).
- Oxidative Stress: Inducing reactive oxygen species (ROS) can promote EV release via pathways like Caspase-3 activation.
- Small Molecules: Chemical inducers like norepinephrine, forskolin, or cisplatin can increase EV secretion by modulating pathways involving ceramide generation and Rab27 protein expression.
Experimental Protocols for Key Assays
Protocol 1: Determining the Distribution Coefficient (logD)
Principle: This shake-flask method determines the distribution of a compound between octanol and an aqueous buffer at a specified pH, accounting for all ionized and neutral species.
Materials:
- Research Reagent Solutions:
- n-Octanol: High-purity solvent for the organic phase.
- Aqueous Buffer: Phosphate buffer (e.g., 0.1 M, pH 7.4) to simulate physiological conditions.
- Test Compound: Solution of the compound in a water-miscible solvent (e.g., DMSO, methanol).
- Saturated Solvents: n-Octanol and buffer mutually saturated with each other for 24 hours prior to use.
Method:
- Preparation: Saturate high-purity n-octanol and the aqueous buffer (e.g., 0.1 M phosphate buffer, pH 7.4) with each other by mixing for 24 hours. Allow phases to separate fully before use.
- Partitioning: Add a known volume of the mutually saturated aqueous buffer (e.g., 10 mL) to a known volume of the mutually saturated octanol (e.g., 10 mL) in a sealed glass vial. Spike with a small volume of the test compound solution.
- Equilibration: Shake the mixture vigorously for 1 hour at constant temperature (e.g., 25°C) to reach equilibrium.
- Separation: Centrifuge the mixture (e.g., 3000 × g, 10 minutes) to achieve complete phase separation.
- Analysis: Carefully sample from both the octanol and aqueous phases. Quantify the compound concentration in each phase using a suitable analytical method (e.g., HPLC-UV, LC-MS).
- Calculation: Calculate logD using the formula:
- logDpH = log10 ( [Compound]ₒcₜₐₙₒₗ / [Compound]ₐqᵤₑₒᵤₛ ) where the concentrations are measured after partitioning at the specific pH.
Protocol 2: Modulating Extracellular pH to Stimulate EV Production
Principle: Mimicking the acidic tumor microenvironment by culturing cells at a lower pHe can significantly enhance the release of extracellular vesicles [58].
Materials:
- Research Reagent Solutions:
- Acidification Medium: Standard cell culture medium (e.g., DMEM) adjusted to the target acidic pH (e.g., pH 6.0 - 6.5) using HCl or lactic acid.
- Control Medium: Standard culture medium at pH 7.4.
- HEPES Buffer: Added to both media (20-25 mM final concentration) to maintain stable pH outside a CO₂ incubator.
- EV Depleted FBS: Fetal Bovine Serum processed via ultracentrifugation to remove endogenous vesicles.
Method:
- Cell Culture: Seed adherent cells in standard growth medium and allow them to reach 60-80% confluence.
- Medium Exchange: Aspirate the standard medium. Gently wash the cells with PBS.
- Stimulation: Add the pre-warmed, HEPES-buffered acidification medium (pH ~6.2) to the experimental group. Add the control medium (pH 7.4) to the control group.
- Incubation: Incubate the cells for the desired stimulation period (e.g., 4-24 hours) under standard conditions (37°C). For extended incubations, medium may need to be replaced to maintain the pH gradient.
- Harvesting: Collect the conditioned medium from both groups.
- EV Isolation: Centrifuge the medium (e.g., 2,000 × g, 10 min) to remove cells and debris. Isolate EVs from the supernatant using standard techniques like ultracentrifugation (100,000 × g, 70 min) or size-exclusion chromatography.
- Characterization: Quantify EV yield (e.g., via nanoparticle tracking analysis, BCA assay for protein content) and characterize (e.g., TEM, western blot for markers like CD63, CD81).
Critical Parameter Relationships Visualized
Diagram: pH Impact on Lipophilicity & EV Release
Diagram: Intracellular vs. Extracellular Polysaccharide Properties
The Scientist's Toolkit: Essential Research Reagents
| Reagent / Material | Function / Application |
|---|---|
| HEPES Buffer | A non-volatile, zwitterionic buffer used to maintain stable physiological pH in cell culture, especially during manipulations outside a CO₂ incubator [58]. |
| Octanol-Water Saturated Systems | The standard solvent system for experimental determination of partition (logP) and distribution (logD) coefficients, mimicking the partitioning between lipid and aqueous cellular environments [79]. |
| Size-Exclusion Chromatography (SEC) Columns | Used for purifying macromolecules like EVs or polysaccharides based on hydrodynamic size, effectively separating them from contaminants that contribute to viscosity. |
| Ratiometric pH Dyes (e.g., BCECF-AM) | Cell-permeant fluorescent dyes used for accurate measurement of intracellular pH (pHi). The ratiometric measurement reduces artifacts from dye loading or leakage. |
| Nuclease Enzymes (DNase I, RNase A) | Added to cell lysates or viscous samples to digest nucleic acid contaminants, thereby reducing sample viscosity and improving downstream analysis [58]. |
| Serum Depletion/Opti-MEM | Culture under serum-free or serum-reduced conditions is a common chemical modulation to induce metabolic stress and enhance the production of extracellular vesicles [58]. |
Validation and Comparative Analysis: Ensuring Predictive Power from In Vitro to In Vivo
Frequently Asked Questions (FAQs)
FAQ 1: Why do my measured Kd values differ between purified biochemical assays and cellular assays?
The discrepancy arises because the simplified conditions of a standard biochemical assay (BcA) do not replicate the complex intracellular environment. Key differences include [60]:
- Macromolecular Crowding: The cytoplasm is densely packed with macromolecules (constituting 30–60% of the weight), which can alter binding equilibria and increase the apparent Kd by up to 20-fold or more [60].
- Ionic Composition: Common buffers like PBS mimic extracellular fluid (high Na+, low K+), whereas the cytosol has a reverse ratio (high K+ ~140-150 mM, low Na+ ~14 mM). This difference in salt composition can significantly influence Kd values [60].
- Viscosity and Cosolvents: Cytoplasmic viscosity and the presence of cosolvents that modulate lipophilicity affect molecular diffusion and conformational dynamics, impacting both equilibrium binding and reaction kinetics [60].
FAQ 2: How long should I incubate my binding reaction to ensure I measure a true equilibrium Kd?
You must experimentally determine the time required for the reaction to reach equilibrium. The incubation time is dependent on the dissociation rate constant (koff) and the ligand concentration [80].
- Key Control: Systematically vary the incubation time until the fraction of bound complex no longer increases.
- Rule of Thumb: A binding reaction reaches ~97% completion after five half-lives (5 × t~1/2~). The half-life can be estimated as t~1/2~ = ln(2) / k~equil~, where k~equil~ is the equilibration rate constant. At the lowest protein concentrations, k~equil~ approaches k~off~, meaning tight-binding complexes (low k~off~) require longer incubation times [81] [80].
FAQ 3: What is "ligand depletion" and how can I avoid it in my binding assay?
Ligand depletion occurs when a significant fraction of the total ligand is bound to the receptor, causing the concentration of free ligand to be substantially lower than what was added. This violates a key assumption of the Kd derivation equation and leads to inaccurate measurements [80].
- How to Avoid: Ensure that the concentration of the limiting component (usually the receptor, [R]~T~) is kept much lower than the Kd ([R]~T~ << K~d~). A good practice is to use [R]~T~ ≤ 0.1 × K~d~. Empirically, you can test for titration by varying the receptor concentration; the measured Kd should remain constant if ligand depletion is not occurring [80].
FAQ 4: Can I use Phosphate-Buffered Saline (PBS) for assays targeting intracellular proteins?
While common, PBS is suboptimal for studying intracellular interactions because its ionic composition (high Na+, low K+) mimics the extracellular environment, not the cytoplasm. Using a buffer that more closely matches the intracellular ionic milieu (e.g., high K+, low Na+) can yield more physiologically relevant Kd values [60].
Troubleshooting Common Experimental Issues
Problem: Large Discrepancy Between Biochemical and Cellular Assay Kd Values
| Potential Cause | Investigation & Solution |
|---|---|
| Non-physiological Buffer | Action: Replace standard buffers (e.g., PBS) with a cytoplasm-mimicking buffer. Include crowding agents (e.g., Ficoll, PEG) and adjust salt composition to high K+/low Na+ [60]. |
| Cellular Compound Handling | Action: Evaluate the test compound's membrane permeability, solubility, and stability in the cellular environment. These factors can prevent the compound from reaching its intracellular target at the expected concentration [60]. |
| Assay Not at Equilibrium | Action: Perform a time-course experiment in both assays to confirm that measurements are taken after binding equilibrium is established, especially at the lowest ligand concentrations [80]. |
Problem: High Background or Non-Specific Binding in Cellular Assays
| Potential Cause | Investigation & Solution |
|---|---|
| Ligand Specificity | Action: Include rigorous controls, such as mutated non-binding protein sequences or competitive binding with an unlabeled ligand, to confirm the signal is specific [82]. |
| Fluorophore Artifacts | Action: For fluorescent labels, be aware that properties like aggregation or interaction with cellular components can cause artifactual signals. Consider using label-free methods or validating with an alternative detection technique [82]. |
Quantitative Data Comparison
Reported Kd Differences Across Assay Types
The following table compiles examples of how Kd values can vary depending on the measurement environment.
| Target / Ligand | Biochemical Assay (in vitro) Kd | Cellular / In-Cell Kd | Observed Fold-Change | Key Factor for Discrepancy |
|---|---|---|---|---|
| General Protein-Ligand | Reference value | Up to 20-fold higher (or more) [60] | ≥ 20 | Macromolecular crowding, differential ionic conditions [60]. |
| Ca²⁺ Indicators | Varies by indicator (e.g., Fura-2, Indo-1) [83] | Significant differences for specific indicators [83] | Varies | Altered physicochemical environment inside the cell [60] [83]. |
| Puf4 RNA-protein | Actual Kd | Apparent Kd (if controls omitted) up to 7-fold higher [80] | ≤ 7 | Failure to reach equilibrium or ligand depletion [80]. |
Comparison of Key Physicochemical Parameters in Different Environments
This table summarizes the critical differences between standard assay buffers and the intracellular environment.
| Parameter | Standard Biochemical Assay (e.g., PBS) | Intracellular (Cytoplasmic) Environment |
|---|---|---|
| Major Cations | High Na+ (157 mM), Low K+ (4.5 mM) [60] | High K+ (149 mM), Low Na+ (10 mM) [84] |
| Macromolecular Crowding | Low (dilute solution) | High (30-60% of weight is macromolecules) [60] |
| Viscosity | Low (near water) | High [60] |
| Redox Potential | Oxidizing | Reducing (high glutathione) [60] |
Essential Experimental Protocols
Protocol 1: Determining Time to Equilibrium for a Binding Assay
Purpose: To establish the minimum incubation time required for a binding reaction to reach equilibrium, which is critical for an accurate Kd measurement [80].
Procedure:
- Setup: Prepare multiple identical reaction mixtures containing your receptor and ligand. The ligand concentration should be near the expected Kd value.
- Incubation: Incubate each reaction for a different amount of time (e.g., 0, 5, 15, 30, 60, 120 minutes).
- Measurement: At each time point, measure the amount of bound complex.
- Analysis: Plot the fraction of bound complex versus time. The time required for the signal to plateau is the minimum incubation time needed to reach equilibrium. All subsequent Kd measurements must use an incubation time longer than this.
Protocol 2: Direct-Cell Binding Assay for Kd Determination
Purpose: To measure the binding affinity (Kd) of a soluble ligand to a receptor presented on the surface of a cell (e.g., yeast or mammalian) [81].
Procedure:
- Cell Preparation: Culture cells expressing the surface-displayed receptor of interest.
- Ligand Titration: Incubate a constant number of cells with a range of concentrations of the soluble, labeled ligand. Ensure the incubation time is confirmed to be at equilibrium (see Protocol 1).
- Washing and Measurement: Wash cells to remove unbound ligand. Measure the bound ligand signal (e.g., via flow cytometry for a fluorescent label).
- Data Analysis: Plot the bound signal versus the ligand concentration. Fit the data to a binding isotherm to determine the Kd, which is the ligand concentration at which half of the receptors are occupied [81].
Diagram: Workflow for Reliable Kd Measurement
The Scientist's Toolkit: Key Reagent Solutions
Essential Reagents for Cytoplasm-Mimicking Buffers
| Reagent | Function | Rationale |
|---|---|---|
| KCl / K-gluconate | To provide high potassium concentration. | Mimics the primary intracellular cation (K+ ~150 mM) [60] [84]. |
| Macromolecular Crowding Agents(e.g., Ficoll PM-70, PEG 8000) | To simulate the crowded cytoplasmic environment. | Increases solution viscosity and macromolecular crowding, which can significantly alter Kd values and enzyme kinetics [60]. |
| HEPES or PIPES Buffer | To maintain physiological intracellular pH (~7.2). | Provides stable buffering capacity in the physiological pH range. |
| Reducing Agents (use with caution)(e.g., DTT, TCEP) | To simulate the reducing environment of the cytosol. | Cytosol is reducing due to high glutathione levels. Note: Avoid if your target protein relies on disulfide bonds for stability [60]. |
Diagram: Factors Altering Kd from in vitro to in cellulo
Frequently Asked Questions (FAQs)
Q1: What is the primary reason for a complete lack of assay window in a TR-FRET assay? The most common reason is incorrect instrument setup, particularly the choice of emission filters. Unlike other fluorescence assays, TR-FRET requires specific emission filters to function correctly. The excitation filter has a greater impact on the assay window itself. It is critical to consult instrument setup guides for your specific microplate reader before beginning experimental work. [66]
Q2: Why might a compound show excellent activity on a purified target but no effect in a subsequent cell-based assay? Several factors can cause this discrepancy:
- Cellular Access: The compound may be unable to cross the cell membrane or could be actively pumped out of the cell by efflux transporters. [66]
- Target Form: The cell-based assay may be evaluating a different, inactive form of the kinase, or the compound's effect may be on an upstream or downstream kinase, which is not present in the purified target assay. [66]
- Intracellular Environment: Once inside the cell, the compound encounters a complex physicochemical environment (e.g., different pH, binding proteins, metabolic enzymes) that can alter its stability, binding, or activity, which is not a factor in a purified system.
Q3: What is the critical difference between analyzing raw fluorescence units (RFU) and ratiometric data in TR-FRET? Ratiometric analysis is considered best practice. The acceptor signal (e.g., 520 nm for Tb) is divided by the donor signal (e.g., 495 nm for Tb). This ratio accounts for variations in pipetting, reagent volume, and lot-to-lot variability of the reagents because the donor acts as an internal reference. Ratiometric data provides a more robust and reliable measurement than raw RFU values alone. [66]
Q4: How does the Z'-factor differ from just having a large assay window? The Z'-factor is a key metric that assesses assay quality by combining both the size of the assay window and the variability (standard deviation) of the data. A large assay window with high noise can have a poor Z'-factor, whereas a smaller window with very low noise can have an excellent Z'-factor. An assay with a Z'-factor > 0.5 is generally considered suitable for screening, as it indicates a robust and reproducible assay system. [66]
Q5: Why is understanding the intracellular vs. extracellular environment critical for this validation path? The journey from a purified target (an extracellular-like system) to a functional cellular model (an intracellular system) introduces immense complexity. The intracellular environment has a different composition of ions, proteins, and nucleic acids, and contains organelles that can sequester compounds or alter their activity. [32] [15] [16] Furthermore, the physicochemical conditions inside the cell (pH, redox state) can profoundly affect compound behavior. Recognizing this context is essential for troubleshooting failed validation and designing more predictive experiments.
Troubleshooting Guides
Guide: Troubleshooting Lack of Efficacy in Cellular Assays After Success in Biochemical Assays
Problem: A test compound is highly active against a purified target in a biochemical assay but shows no or weak efficacy in a follow-up cell-based assay.
Investigation Path and Potential Solutions:
| Investigation Area | Specific Check or Action | Underlying Principle / Rationale |
|---|---|---|
| Cellular Permeability | - Perform a logP calculation to assess lipophilicity.- Use predictive software or assays for membrane permeability (e.g., PAMPA).- Test compounds with structural modifications aimed at improving permeability. | The plasma membrane is a selective barrier. Compounds must be sufficiently lipophilic to passively diffuse across, or utilize active transport mechanisms. [66] [15] |
| Efflux Transport | - Co-incubate the compound with a broad-spectrum efflux pump inhibitor (e.g., verapamil for P-gp).- If efficacy is restored, efflux is a likely mechanism of resistance. | Transporters like P-glycoprotein can actively pump compounds out of cells, reducing intracellular concentration below the effective level. [66] |
| Intracellular Metabolism | - Incubate the compound with cell lysates and analyze by LC-MS for degradation products.- Use metabolic stabilizers or structural analogs resistant to hydrolysis/oxidation. | Intracellular enzymes (e.g., esterases, cytochrome P450s) can metabolize and inactivate the compound before it reaches its target. [32] |
| Target Engagement | - Use a cellular target engagement assay (e.g., LanthaScreen Eu Kinase Binding Assay).- Confirm the target protein is expressed and in the correct active form in your cellular model. | Activity on a purified protein does not guarantee the compound can bind to the target in the crowded cellular environment or that the correct target form is present. [66] |
| Cellular Context | - Verify that the required signaling pathway and all necessary co-factors are present and functional in the chosen cell line. | The target's function may depend on upstream regulators or downstream effectors that are absent in the simplified biochemical system. |
Guide: Troubleshooting a Failed TR-FRET Assay
Problem: A TR-FRET assay shows no signal or a very low assay window.
Investigation Path and Potential Solutions:
| Step | Action | Expected Outcome & Interpretation |
|---|---|---|
| 1 | Verify Instrument Setup: Confirm the microplate reader is equipped with the exact excitation and emission filters recommended for your specific TR-FRET assay (Tb vs. Eu). | Using incorrect filters is the single most common reason for assay failure. The instrument may be unable to detect the specific TR-FRET signal. [66] |
| 2 | Test Development Reaction (if applicable): For assays like Z'-LYTE, test the development reagent separately. Expose the 0% phosphopeptide (substrate) to a high concentration of development reagent and keep the 100% phosphopeptide control unexposed. | A proper development reaction should show a significant (e.g., 10-fold) difference in the ratio between these two controls. If not, the development reagent may be faulty or used at the wrong concentration. [66] |
| 3 | Check Reagent Integrity: Ensure all reagents (donor, acceptor, buffers) are fresh, properly stored, and not expired. Confirm that the stock solutions of compounds or substrates are accurately prepared. | Degraded reagents or incorrect stock solution concentrations will prevent the TR-FRET interaction from occurring, leading to a lack of signal. [66] |
| 4 | Control for Compound Interference: Test the compound library for intrinsic fluorescence or quenching properties at the wavelengths used for the donor and acceptor. | Fluorescent or quenching compounds can interfere with the energy transfer process or the direct detection of signals, artificially suppressing or enhancing the ratiometric readout. |
The following table summarizes key quantitative benchmarks for assay validation and performance, crucial for ensuring data reliability as you transition between experimental systems.
Table 1: Key Quantitative Benchmarks for Assay Performance
| Metric | Definition | Calculation Formula | Interpretation / Target Value | ||
|---|---|---|---|---|---|
| Z'-Factor [66] | A measure of assay robustness and quality, suitable for high-throughput screening. It incorporates both the assay window and data variation. | `1 - [ (3σc+ + 3σc-) / | μc+ - μc- | ]`Where σ=std dev, μ=mean, c+=positive control, c-=negative control. | > 0.5: Excellent assay, suitable for screening.0.5 to 0: A marginal assay.< 0: The signals from the controls overlap. |
| Assay Window [66] | The fold-difference between the positive and negative control signals. | (Signal of Max Control) / (Signal of Min Control) |
A large window (e.g., >3-fold) is desirable, but must be interpreted alongside the Z'-factor. A 10-fold window with 5% error gives a Z' of ~0.82. [66] | ||
| Signal-to-Noise Ratio (SNR) | The ratio of the desired signal level to the background noise level. | (Signal of Sample - Signal of Background) / σ_background |
A higher ratio indicates a more detectable signal. Values >10 are generally good, but context-dependent. | ||
| Coefficient of Variation (CV) | A standardized measure of data dispersion. | (σ / μ) * 100% |
Lower values indicate higher precision. A CV < 10-20% is typically acceptable for biological assays. |
Experimental Protocols
Protocol: Performing a Forward and Backward Pass for Critical Path Analysis in Assay Development
This methodology, adapted from project management, is useful for identifying the longest sequence of dependent tasks (the critical path) in a complex experimental workflow, helping to estimate total project time and identify tasks that cannot be delayed. [85] [86] [87]
Methodology:
- List All Activities and Dependencies: Break down the assay development process into individual tasks (e.g., "Express & purify protein," "Validate antibody," "Optimize buffer conditions"). Define the dependencies between them (e.g., "Start assay optimization" cannot begin until "Receive critical reagents" is finished). [86] [87]
- Estimate Task Durations: Assign a realistic time estimate (e.g., in days) to each task. [85]
- Create a Network Diagram: Visually represent the tasks and their dependencies. The diagram below illustrates a simplified workflow.
- Forward Pass (Calculate ES and EF):
- Start from the first task. Its Earliest Start (ES) is 0.
- The Earliest Finish (EF) is ES + Task Duration.
- For subsequent tasks, the ES is the maximum EF of all its predecessor tasks.
- Continue through the entire network. The final EF is the earliest project completion time. [85]
- Backward Pass (Calculate LS and LF):
- Start from the last task. Its Latest Finish (LF) is equal to the project completion time (or the EF from the forward pass).
- The Latest Start (LS) is LF - Task Duration.
- For preceding tasks, the LF is the minimum LS of all its successor tasks.
- Continue backward through the entire network. [85]
- Calculate Slack and Identify Critical Path:
Diagram: Simplified Assay Development Workflow. The critical path (A->B->C->D->F->G->H) is highlighted in yellow. Buffer optimization (E) has slack and is not on the critical path.
Protocol: Ratiometric Data Analysis for TR-FRET Assays
Methodology:
- Run Assay and Collect Data: Perform the TR-FRET experiment on your microplate reader, ensuring correct filter setup. Collect raw fluorescence data for both the donor and acceptor emission channels. [66]
- Calculate Emission Ratio: For each well, calculate the emission ratio using the formula:
- For Tb-based assays: Ratio = Acceptor (520 nm) / Donor (495 nm)
- For Eu-based assays: Ratio = Acceptor (665 nm) / Donor (615 nm) [66]
- Normalize Data (Optional but Recommended): To easily visualize the assay window, data can be normalized to a response ratio. Divide all emission ratio values by the average emission ratio of the negative control (bottom of the curve). This sets the bottom of the curve to 1.0. [66]
- Plot and Analyze: Plot the normalized response ratio (or the raw emission ratio) against the logarithm of the compound concentration. Fit a sigmoidal dose-response curve to determine EC50/IC50 values. [66]
Diagram: TR-FRET Ratiometric Analysis Workflow. Key calculation steps are highlighted in red.
The Scientist's Toolkit: Research Reagent Solutions
Table 2: Essential Reagents and Materials for Target and Cellular Validation
| Item | Function / Application |
|---|---|
| LanthaScreen TR-FRET Assays | A common platform for studying biomolecular interactions (e.g., kinase activity, protein-protein interactions) in a purified system. Uses time-resolved fluorescence to reduce background noise. [66] |
| Cell-Permeable Tracers | Fluorescently labeled probes used in cellular binding assays (e.g., LanthaScreen Eu Kinase Binding Assays) to measure intracellular target engagement. [66] |
| Efflux Pump Inhibitors | Pharmacological agents (e.g., Verapamil, Elacridar) used in cellular assays to inhibit transporters like P-glycoprotein, helping to determine if poor cellular activity is due to active efflux. [66] |
| Cellular Dielectric Spectroscopy | A label-free technology used to monitor real-time changes in cell morphology, adhesion, and viability, providing functional readouts in a more physiologically relevant context. |
| Stable Cell Lines | Engineered cell lines that constitutively or inducibly express the target protein of interest, ensuring consistent and reproducible expression for cellular assays. |
| Ion Channel Modulators | Reference compounds (e.g., Verapamil for Ca2+ channels, Tetraethylammonium for K+ channels) used as positive controls in functional cellular assays for ion channel targets. |
Hydrolysis is a fundamental chemical process where a molecule is cleaved into two parts by the addition of a water molecule. In the context of protein extraction, this process is used to break down complex structures, facilitating the release and recovery of proteins from biological samples like sludge. The reaction can be represented as: XY + HOH XH + YOH [88]. The efficacy of this process varies dramatically depending on whether the target proteins are located inside cells (intracellular) or within the extracellular polymeric substance (EPS) matrix surrounding cells [89].
Intracellular proteins are enclosed within the cell membrane, requiring an effective wall-breaking step for their release. Extracellular proteins, on the other hand, are embedded in the EPS and are more readily accessible [89] [90]. Selecting the appropriate hydrolysis method is therefore critical, as it directly impacts the yield, the degree of hydrolysis, and the final application of the extracted protein products, whether for industrial foaming agents, foliar fertilizers, or other high-value products [89].
The following diagram illustrates the core decision-making workflow for selecting and optimizing a hydrolysis method based on your protein source and desired outcome.
Method Comparison & Quantitative Data
Different hydrolysis techniques offer distinct advantages and drawbacks for disrupting cellular and extracellular structures. The choice of method directly influences the yield of proteins, peptides, and amino acids, which in turn determines the suitable applications for the final product.
Table 1: Head-to-Head Comparison of Hydrolysis Methods for Protein Extraction
| Feature | Alkaline Thermal Hydrolysis (ATH) | Enzymatic Hydrolysis (EH) | Ultrasonic-Assisted Enzymatic Hydrolysis (UEH) |
|---|---|---|---|
| Core Mechanism | Combination of high pH and heat to dissolve structures and break chemical bonds [89]. | Proteolytic enzymes (e.g., alkaline protease) selectively cleave peptide bonds under mild conditions [89] [91]. | Ultrasonic cavitation and shear forces disrupt physical structures, synergistically enhancing enzymatic action [90]. |
| Wall-Breaking Efficiency | High; effectively breaks cell walls to release abundant intracellular content [89]. | Low to Moderate; limited ability to disrupt intact cells without pretreatment [89]. | Very High; ultrasound pretreatment effectively disrupts EPS and cell walls [90]. |
| Intracellular Protein Extraction Yield | 376.9 mg/g VSS [89] | 127.9 mg/g VSS [89] | 1.9x higher than EH alone (approx. 243 mg/g VSS) [90] |
| Key Hydrolysate Products | Rich in polypeptides (approx. 38% of proteins hydrolyzed to peptides) [89]. | Rich in free amino acids; linear correlation between protein extracted and amino acids formed [89]. | Balanced increase in peptides (115.6% higher than EH) and amino acids (20.6% higher than EH) [90]. |
| Kinetic Rate Constant (k) | 1.63 h⁻¹ (for protein extraction in UEH) [90] | - | 1.63 h⁻¹ (for protein extraction, twice as fast as EH alone) [90] |
| Impact on EPS Barrier | Not specifically quantified, but effective for integral hydrolysis. | High barrier effect; EPS hinders enzyme access to intracellular proteins [90]. | Reduces EPS barrier effect by approximately 50% [90]. |
| Recommended Application | Industrial foaming agents [89]. | Foliar fertilizers [89]. | Versatile, for high-yield production of both peptides and amino acids [90]. |
| Pros | High intracellular yield; continuous protein release over time [89]. | Mild conditions prevent protein denaturation; environmentally friendly [89] [90]. | Fastest extraction kinetics; highest overall yields; green and efficient [90]. |
| Cons | Harsh conditions may denature some sensitive proteins. | Limited by EPS and cell wall; slower kinetics without assistance [89] [90]. | Requires specialized ultrasonic equipment; process optimization can be complex. |
Detailed Experimental Protocols
Protocol 1: Ultrasonic-Assisted Enzymatic Hydrolysis (UEH) for Maximum Yield
This protocol is optimized for the efficient extraction of both intracellular and extracellular proteins from excess sludge, leveraging ultrasound to enhance enzymatic activity [90].
Materials:
- Sample: Excess sludge from a wastewater treatment plant (pH 6.8–7.4).
- Enzyme: Alkaline protease (e.g., 200,000 U/g activity).
- Reagents: NaOH for pH adjustment.
- Equipment: Ultrasonic cell disruptor (e.g., JY92-IIDN with 900W max power), centrifuge, water bath, pH-stat apparatus.
Step-by-Step Procedure:
- Sample Preparation: Adjust the moisture content of the sludge to approximately 95% by centrifugation [90].
- Ultrasonic Pretreatment: Place 200 mL of sludge in a 250 mL beaker. Subject it to ultrasonic treatment at a power density of 1 W/mL for 20 minutes. Ensure the probe is immersed appropriately [90].
- Hydrolysis Setup: Adjust the temperature of the pretreated sludge to 50°C and maintain for 1 hour. Adjust and maintain the pH at 11.0 using 0.5 M NaOH [90].
- Enzyme Addition: Add alkaline protease at a ratio of 3500 U/g to the sludge [90].
- Incubation: Hydrolyze the mixture at 50°C for 4 hours with constant stirring (500 rpm). Maintain pH at 11.0 using a pH-stat [90].
- Reaction Termination & Analysis: After hydrolysis, the solution can be heated to 80°C for 10 minutes to inactivate the enzyme [91]. Clarify the hydrolysate by centrifugation (10,000-17,000 x g for 5-20 minutes) and collect the supernatant for analysis of protein, peptide, and amino acid content [90].
Protocol 2: Standard Enzymatic Hydrolysis (EH) for Mild Extraction
This protocol is suitable for extracting proteins under mild conditions, ideal when preserving native protein structure or maximizing amino acid yield is desired [89] [91].
Materials:
- Sample: Excess sludge or other biological material.
- Enzyme: Alkaline protease (200,000 U/g activity).
- Reagents: NaOH for pH adjustment.
- Equipment: Water bath or incubator, centrifuge, pH-stat.
Step-by-Step Procedure:
- Sample Preparation: Hydrate the substrate (e.g., 8-10% w/w in water) by stirring at 5°C for 16 hours [91].
- Hydrolysis Setup: Adjust the sample temperature to 50°C and pH to 11.0 [90] [91].
- Enzyme Addition: Add alkaline protease at a ratio of 6500 U/g to the sludge [90].
- Incubation: Hydrolyze the mixture at 50°C for 4 hours with constant stirring. Maintain pH at 11.0 using a pH-stat [90] [91].
- Reaction Termination & Analysis: Heat the hydrolysate to 80°C for 10 minutes to terminate the reaction [91]. Centrifuge and analyze the supernatant.
Troubleshooting Guides & FAQs
Common Experimental Problems and Solutions
Problem: Low overall protein yield.
- Possible Cause 1: Inefficient cell wall or EPS disruption, especially for intracellular proteins.
- Solution: Introduce a pretreatment step. Ultrasonic pretreatment (1 W/mL, 20 min) is highly effective. Alternatively, consider Alkaline Thermal Hydrolysis for a more aggressive approach [89] [90].
- Possible Cause 2: Suboptimal enzymatic conditions (pH, temperature, enzyme-to-substrate ratio).
- Solution: Systemically re-optimize hydrolysis parameters. Ensure the pH is maintained at the optimum for your specific enzyme (e.g., pH 11 for alkaline protease) and verify the enzyme activity [90] [91].
Problem: Excessive degradation to amino acids; low peptide yield.
- Possible Cause: Over-hydrolysis due to prolonged incubation time or excessive enzyme dosage.
- Solution: Reduce the hydrolysis time and/or lower the enzyme-to-substrate ratio. Monitor the formation of peptides (intermediates) and amino acids (end-products) over time to identify the optimal stopping point [89] [90].
Problem: High process viscosity leading to handling difficulties.
- Possible Cause: The physical properties of the hydrolysate are substrate- and DH-dependent.
- Solution: Note that hydrolysis itself often reduces viscosity. If viscosity remains high after hydrolysis, an enzyme heat inactivation step (80°C for 10 min) can further alter the physicochemical properties and reduce viscosity, especially at higher Degrees of Hydrolysis (DH) [91].
Frequently Asked Questions (FAQs)
Q1: How do I decide between ATH, EH, or UEH for my specific project?
- A: The choice hinges on your target protein's location and desired end-product.
- Use ATH for maximum intracellular protein and polypeptide yield (e.g., for foaming agents).
- Use EH for a richer amino acid profile under mild conditions (e.g., for fertilizers).
- Use UEH for the highest overall efficiency and a balanced product profile, provided you have the necessary equipment [89] [90].
Q2: Why is my peptide yield low even though my protein extraction is efficient?
- A: Peptides are intermediate products in the hydrolysis pathway (Protein → Peptides → Amino Acids). Low peptide yield indicates that the hydrolysis process has proceeded too far, converting peptides into amino acids. To increase peptide yield, shorten the hydrolysis time or adjust enzyme dosage to arrest the process at the peptide stage [89] [90].
Q3: Can these hydrolysis methods be applied to sources other than sludge?
- A: Yes, the principles are universal. Enzymatic hydrolysis is widely used in food science (e.g., modifying the functional properties of milk proteins) [91] and biofuel production (breaking down cellulosic biomass) [88]. The specific parameters (enzyme type, pH, temperature) must be optimized for each new substrate.
The Scientist's Toolkit: Essential Research Reagents & Materials
Table 2: Key Reagents and Equipment for Hydrolysis Experiments
| Item | Function / Role | Specification / Example |
|---|---|---|
| Alkaline Protease | Catalyzes the hydrolysis of peptide bonds in proteins under alkaline conditions. | Activity: 200,000 U/g; Optimal pH: 9-12; Optimal Temp: 40-50°C [90]. |
| Ultrasonic Cell Disruptor | Provides physical disruption of cell walls and EPS via cavitation and shear forces, enhancing enzyme accessibility. | e.g., JY92-IIDN; Power density: 1-2 W/mL; Probe immersion critical [90]. |
| pH-stat Apparatus | Automatically maintains a constant pH during the hydrolysis reaction by adding base (e.g., NaOH), which is crucial for reproducible kinetics and DH calculation. | Used with 0.5 M NaOH at pH 7.0 or 11.0 [91]. |
| Centrifuge | Clarifies the hydrolysate by separating solid debris from the liquid supernatant containing proteins, peptides, and amino acids. | Speeds: 10,000-17,000 x g; Time: 5-20 min [90]. |
| BCA Protein Assay Kit | Accurately determines the concentration of soluble protein in the extracted supernatant. | Colorimetric method based on bicinchoninic acid [90]. |
| TNBS (2,4,6-Trinitrobenzenesulfonic acid) | Used in a spectrophotometric assay to determine the Degree of Hydrolysis (DH%) by reacting with primary amines [91]. | -- |
| Ninhydrin | A reagent used in colorimetric methods to detect and quantify free amino acids. | -- |
| Serum-Free Culture Medium | Used when concentrating secreted proteins from cell culture supernatant via ultrafiltration to avoid interference from serum proteins [92]. | -- |
Advanced Data & Kinetic Analysis
For researchers aiming to deeply understand and model the hydrolysis process, kinetic analysis provides powerful insights. The transformation of sludge (S₀) to protein (Cpr), then to peptides (Cpe), and finally to amino acids can be effectively described using tandem kinetic reactions [90].
The following diagram visualizes this reaction pathway and its associated mathematical model.
Key Kinetic Insights:
- Protein Extraction: The release of protein from sludge generally follows a first-order kinetic model:
dCpr/dt = k₁·S₀[90]. The rate constant k₁ is a direct measure of extraction efficiency. For example, UEH achieves a k₁ of 1.63 h⁻¹, which is twice as fast as EH alone, highlighting the kinetic advantage of ultrasonic assistance [90]. - Peptide Formation: The formation and consumption of peptides, as intermediate products, conform to a tandem reaction model:
dCpe/dt = k₂·Cpr - k₃·Cpe[90]. Studies indicate that the yield of peptides is more significantly affected by the dose of enzymes (which influences k₂ and k₃) than by the presence of ultrasound. This means that to control the peptide/amino acid ratio in your final product, careful optimization of enzyme dosage and reaction time is paramount [90].
Benchmarking Cytoplasm-Mimicking Buffers Against Standard Assay Conditions
Frequently Asked Questions (FAQs)
FAQ 1: Why is there often a discrepancy between activity data from biochemical assays (BcAs) and cell-based assays (CBAs)?
It is common to observe significant differences, sometimes by orders of magnitude, between the half-maximal inhibitory concentration (IC₅₀) or dissociation constant (Kd) values obtained from biochemical assays using purified proteins and those from cell-based assays [93] [60]. While factors like a compound's solubility, membrane permeability, and stability are often blamed, the discrepancy frequently persists even when these are accounted for. A critical, yet often overlooked, reason is that standard biochemical assay buffers (e.g., phosphate-buffered saline (PBS)) do not replicate the complex intracellular environment [10] [93]. The cytoplasm has distinct physicochemical (PCh) conditions, including macromolecular crowding, high viscosity, specific ion concentrations (high K⁺/low Na⁺), and different lipophilic parameters, all of which can dramatically influence protein-ligand binding and enzyme kinetics [93] [60].
FAQ 2: What are the key limitations of using common buffers like PBS for intracellular target studies?
Phosphate-buffered saline (PBS) is designed to mimic extracellular fluid, making it unsuitable for studying intracellular targets for several reasons [93] [60]:
- Incorrect Ionic Composition: PBS contains high sodium (∼157 mM) and low potassium (∼4.5 mM) levels. The intracellular cytoplasm has the reverse, with high potassium (∼140-150 mM) and low sodium (∼14 mM) [93] [60].
- Lacks Macromolecular Crowding: The cytoplasm is densely packed with macromolecules (200–350 mg/ml), creating a crowded environment that affects diffusion, binding affinity, and reaction rates. PBS lacks any crowding agents [93] [27].
- Ignores Cytoplasmic Viscosity and Lipophilicity: The internal environment of a cell has specific viscosity and lipophilicity that are not replicated in simple salt solutions like PBS [93].
FAQ 3: What core physicochemical parameters must a cytoplasm-mimicking buffer replicate?
To more accurately mimic the intracellular environment for in vitro biochemical assays, a buffer should be designed to incorporate the following key parameters [93] [60]:
- pH: Cytosolic pH is generally maintained around 7.2, but can vary.
- Ionic Strength and Composition: High K⁺, low Na⁺, and specific anion concentrations.
- Macromolecular Crowding: The addition of inert, water-soluble polymers (e.g., PEG, Ficoll) to simulate the high concentration of biomolecules.
- Viscosity: Modifiers to achieve cytoplasmic-like viscosity.
- Cosolvents: To mimic the lipophilic character of the cytoplasm.
- Redox Potential: The cytosol is a reducing environment, though caution is needed with reducing agents like DTT to avoid disrupting protein structures [93] [60].
FAQ 4: How significant is the impact of cytoplasmic conditions on binding and kinetics?
The impact is profound. Experimental data shows that Kd values measured inside living cells can differ from those in standard dilute buffer by up to 20-fold or more [93]. Furthermore, enzyme kinetics have been shown to change by as much as 2000% under macromolecular crowding conditions [93]. A pH-driven transition of the cytoplasm from a fluid- to a solid-like state can also drastically reduce molecular mobility and affect metabolic activity [27].
Troubleshooting Guide
Problem 1: Poor reproducibility of results and quantitative precision in assays.
- Potential Cause: Inconsistent buffer preparation is a major source of variability, especially in sensitive techniques like capillary electrophoresis (CE) and HPLC [30].
- Solutions:
- Document Exquisitely: Record the exact salt form, precise weights, and the full pH adjustment procedure (including the concentration and type of acid/base used) [30].
- Avoid Stock Dilution: Do not prepare a concentrated stock at the target pH and then dilute it. Always prepare the working buffer at its final concentration and desired pH, as dilution can alter the pH [30].
- Calibrate pH Meter Properly: Ensure the pH meter is calibrated with fresh buffers that span your pH range of interest. Electrodes must be clean and properly filled. Always measure pH at room temperature after the buffer has cooled [30] [94].
Problem 2: Discrepancy between biochemical assay (BcA) and cellular assay (CBA) data for an intracellular target.
- Potential Cause: The standard BcA buffer (e.g., PBS) fails to mimic the intracellular PCh environment, leading to inaccurate estimates of a compound's true activity inside a cell [10] [93].
- Solutions:
- Benchmark with Cytoplasm-Mimicking Buffer: Reformulate your biochemical assay buffer to include key cytoplasmic features. Refer to Table 2 for a quantitative comparison and the Experimental Protocols section for formulation guidance.
- Validate with In-Cell Data: Whenever possible, compare your in vitro results with direct in-cell measurements (e.g., from live-cell assays) to calibrate your system [93].
Problem 3: Low signal or abnormal peak shapes in separation-based assays (e.g., CE).
- Potential Causes:
- Electrodispersion: A mismatch between the electrophoretic mobility of your analyte and the buffer ions [30].
- Incorrect Buffer Strength: A buffer ionic strength that is too low may fail to shield capillary walls or stack samples effectively, while one that is too high generates excessive current and heat [30].
- Buffer Depletion: Gradual pH changes in the buffer vials during long sequences, especially in CE [30].
- Solutions:
- Match Mobilities: For basic analytes, use a counter-ion with a larger ionic radius (e.g., triethanolamine) to better match mobilities and reduce peak distortion [30].
- Optimize Ionic Strength: Increase buffer ionic strength to improve peak shape, but keep the resulting current below 100 μA to avoid self-heating [30].
- Ensure Buffering Capacity: Use a buffer with good capacity at your target pH to resist depletion. "Good buffers" like HEPES or MES can be used at high concentrations due to their low conductivity [30].
Table 1: Key Differences Between Standard PBS and Intracellular Cytoplasmic Conditions
| Parameter | Standard PBS (Extracellular Mimic) | Intracellular Cytoplasm | Impact on Assays |
|---|---|---|---|
| Primary Cation | High Na⁺ (∼157 mM) [93] [60] | High K⁺ (∼140-150 mM) [93] [60] | Alters ion-sensitive protein conformations and interactions. |
| K⁺:Na⁺ Ratio | Low (∼0.03) [93] [60] | High (∼10) [93] [60] | Critical for targets regulated by potassium channels/pumps. |
| Macromolecular Crowding | None | High (200-350 mg/ml) [93] [27] | Increases effective binding affinity (Kd), alters reaction kinetics. |
| Viscosity | Low (~1 cP) | High & Variable [93] | Reduces diffusion rates, affecting reaction speeds and equilibria. |
| Redox Potential | Oxidizing | Reducing [93] [60] | Can affect disulfide bond formation and protein stability. |
Table 2: Observed Impact of Cytoplasmic Conditions on Binding and Kinetics
| Assay Parameter | Change in Standard Buffer vs. Cytoplasmic Conditions | Experimental Basis |
|---|---|---|
| Protein-Ligand Kd | Up to 20-fold or greater difference [93] | Direct measurement of Kd values inside living cells vs. in dilute buffer. |
| Enzyme Kinetics | Changes of up to 2000% [93] | Measurement of enzyme reaction rates under macromolecular crowding. |
| Particle/Organelle Mobility | Significantly reduced [27] | Single-particle tracking in energy-depleted, acidic cytoplasm. |
Experimental Protocols
Protocol 1: Formulating a Basic Cytoplasm-Mimicking Buffer
This protocol provides a starting point for creating a buffer that more closely reflects the intracellular environment.
- Base Buffer Selection: Choose a "Good buffer" like HEPES, Tris, or MES for its pKa near the physiological cytosolic pH (∼7.2) and low conductivity [30] [95]. Prepare it at a concentration of 20-50 mM.
- Adjust Ionic Composition:
- Add KCl to a final concentration of ~140-150 mM.
- Add NaCl to a final concentration of ~10-15 mM.
- Adjust other ions (e.g., Mg²⁺) as required for your specific target.
- Adjust pH: Using a properly calibrated pH meter, titrate the buffer to pH 7.2 at room temperature using a solution of KOH. Allow the buffer to reach room temperature before final measurement [30] [94].
- Add Macromolecular Crowding Agents: Incorporate crowding agents to simulate the dense cellular interior. Common choices include:
- Polyethylene Glycol (PEG): A synthetic polymer available in various molecular weights.
- Ficoll: A synthetic, non-ionic sucrose polymer.
- Albumin: A natural protein.
- The typical final concentration should aim to achieve a total macromolecular density of 50-100 g/L as a starting point, which can be optimized [93].
- Final Filtration: Sterile-filter the buffer through a 0.22 µm filter to maintain sterility and remove any aggregates from the crowding agents.
Protocol 2: Benchmarking a Compound in Standard vs. Cytoplasm-Mimicking Buffer
This protocol describes how to compare compound activity across different buffer conditions.
- Prepare Assay Plates: Use a design-of-experiments (DoE) approach to efficiently test multiple conditions. An automated liquid handler can be used to dispense different buffers and create compound concentration gradients reliably [96].
- Run Parallel Biochemical Assays:
- Condition A: Perform the standard biochemical assay (e.g., inhibition assay) in your conventional buffer (e.g., PBS).
- Condition B: Perform the identical assay in the newly formulated cytoplasm-mimicking buffer.
- Keep all other parameters constant (temperature, protein concentration, incubation time).
- Measure Dose-Response: For both conditions, measure the compound's dose-response curve and calculate the IC₅₀ value.
- Calculate Apparent Kd/Ki: Use appropriate equations (e.g., Cheng-Prusoff for competitive inhibition: Ki = IC₅₀ / (1 + [S]/Km)) to determine the binding or inhibition constants for both conditions [93] [60].
- Data Analysis: Compare the Kd or Ki values from the two buffer conditions. A significant difference highlights the impact of the cytoplasmic environment. Correlate these findings with data from cellular assays (CBAs) to see which in vitro condition better predicts cellular activity.
Visualization of Concepts and Workflows
Diagram 1: Buffer Conditions and Assay Discrepancy This diagram contrasts the properties of standard assay buffers with cytoplasm-mimicking buffers and their collective link to the observed discrepancy between biochemical (BcA) and cell-based (CBA) data.
Diagram 2: Experimental Benchmarking Workflow This workflow outlines the key steps for benchmarking a compound's activity in standard versus cytoplasm-mimicking buffers to improve correlation with cellular assay data.
The Scientist's Toolkit: Key Research Reagent Solutions
Table 3: Essential Reagents for Cytoplasm-Mimicking Assay Development
| Reagent / Material | Function / Purpose | Key Considerations |
|---|---|---|
| 'Good' Biological Buffers (e.g., HEPES, Tris, MES) [30] [95] | Provides stable pH control near physiological range (pKa ± 1). | Prefer over PBS for intracellular mimicry. Lower conductivity allows higher concentrations [30]. |
| Potassium Chloride (KCl) [93] [60] | Replicates the high intracellular K⁺ concentration (~150 mM). | Critical for establishing correct ionic strength and cation balance. |
| Macromolecular Crowding Agents (e.g., PEG, Ficoll) [93] | Simulates the volume exclusion and crowded nature of the cytoplasm. | Molecular weight and concentration of the agent can differentially affect molecular interactions. |
| Automated Liquid Handler [96] | Ensures precision and reproducibility when dispensing buffers, compounds, and reagents. | Essential for high-throughput screening and reliable DoE workflows. |
| Calibrated pH Meter [30] [94] | Accurately measures and adjusts buffer pH. | Requires regular calibration with fresh standard buffers. Measure pH at room temperature. |
Troubleshooting Guide: Common DEL and Intracellular Screening Issues
FAQ: Why is my DEL selection resulting in high background or non-specific binders?
- Potential Cause: Inefficient washing steps during affinity selection.
- Solution: Optimize the stringency of wash buffers. Increase salt concentration (e.g., with NaCl) or add mild detergents to reduce non-specific interactions. Ensure the immobilized protein target is properly blocked before adding the library [97].
- Prevention: Include control selections with a non-relevant protein or an inactive target mutant to identify and subtract background binders. Always use a well-characterized, high-purity protein preparation [98] [97].
FAQ: Why do I get no enrichment after a DEL selection?
- Potential Cause: The protein target may be inactive or denatured upon immobilization.
- Solution: Confirm protein activity after immobilization using a functional assay or a known positive control ligand. Consider alternative immobilization strategies, such as different tags or streptavidin beads [97].
- Potential Cause: The DEL itself may have degraded.
- Solution: Check the integrity of the DNA tags in your library by PCR amplification before selection. Store libraries in appropriate buffers at recommended temperatures to prevent DNA degradation [98].
FAQ: How can I validate that a compound identified by DEL screening truly engages the target inside a cell?
- Solution: Implement a cellular target engagement assay, such as the NanoBRET intracellular kinase assay. This technique can confirm that the compound penetrates the cell membrane and physically binds to the target protein in its physiological environment [99] [100].
- Protocol Outline:
- Fuse your target protein genetically to a NanoLuc luciferase donor.
- Use a cell-permeable fluorescent tracer that binds to the target.
- Express the fusion protein in live cells and add your compound.
- If the compound engages the intracellular target, it will compete with the tracer, reducing the BRET signal, which can be quantified in a microplate reader [100].
FAQ: My intracellular binding data does not correlate with biochemical activity. What could be wrong?
- Potential Cause: The physicochemical properties of the compound prevent efficient cellular uptake.
- Solution: Analyze key physicochemical parameters like logP (lipophilicity) and pKa. Compounds that are too polar may not cross the cell membrane, while highly lipophilic compounds may get trapped. The ideal property space for cell permeability often aligns with the "Rule of Five" [26].
- Potential Cause: The compound is a substrate for efflux pumps.
- Solution: Test for efflux pump susceptibility in your cell model. Consider structure-activity relationship (SAR) studies to modify the compound and circumvent efflux [26].
Key Experimental Protocols
Protocol 1: Affinity Selection with a DNA-Encoded Library
This protocol outlines the core process for screening a DEL against a protein target of interest [98] [97].
- Target Immobilization: Immobilize a purified, tagged target protein (e.g., biotinylated) onto solid support beads (e.g., streptavidin-coated magnetic beads). Block the beads to prevent non-specific binding.
- Incubation: Incubate the immobilized target with the DEL in a suitable binding buffer for 30 minutes to several hours at a controlled temperature (e.g., 4°C or room temperature).
- Washing: Separate the beads from the solution and perform multiple washes with binding buffer to remove unbound and weakly bound library members.
- Elution: Recover the specifically bound library members by eluting the beads. This can be achieved through a change in pH, high salt, denaturing conditions, or by heat denaturation.
- Amplification and Identification: PCR-amplify the DNA tags from the eluted fraction. Analyze the amplified DNA by next-generation sequencing (NGS) to identify the enriched barcodes and decode the corresponding chemical structures.
Protocol 2: NanoBRET Target Engagement Assay in Live Cells
This protocol measures direct target engagement of small molecules in the intracellular milieu [99] [100].
- Construct Generation: Clone your target protein (e.g., a kinase) as a genetic fusion with the NanoLuc luciferase (Nluc) donor.
- Cell Culture and Transfection: Culture appropriate cells (e.g., HEK293T) and transiently transfect them with the Nluc-target fusion construct.
- Tracer Incubation: Add a cell-permeable, fluorescent tracer molecule that is a known binder of your target.
- Compound Testing: Treat the cells with the test compound(s) at various concentrations.
- Substrate Addition and Reading: Add the Nluc substrate to the cells. Measure both the donor luminescence and the acceptor (tracer) emission using a plate reader capable of detecting BRET.
- Data Analysis: Calculate the BRET ratio. A decrease in the BRET ratio upon addition of a test compound indicates competitive displacement of the tracer and successful intracellular target engagement.
Quantitative Data Comparison
The table below summarizes key characteristics of different screening methodologies.
Table 1: Comparison of High-Throughput Screening (HTS) and DNA-Encoded Library (DEL) Technologies
| Feature | Conventional HTS | DNA-Encoded Libraries (DELs) | Intracellular BRET Assay |
|---|---|---|---|
| Library Size | Typically 10,000 - 2 million compounds [101] [102] | Billions to trillions of compounds [97] | N/A (Used for follow-up validation) |
| Screening Format | Compound-per-well in microplates (96 to 1536 wells) [101] | Pooled library in a single tube (affinity selection) [98] [97] | Typically 384-well microplates [99] |
| Key Readout | Biochemical or phenotypic activity [101] | Physical binding to a purified target [98] | Direct target engagement in live cells [100] |
| Throughput | 10,000 - 100,000 compounds per day [102] | Extremely high; entire library screened at once [97] | High-throughput compatible (e.g., 530 compounds screened) [99] |
| Primary Application | Identifying active compounds from discrete collections [101] | Discovering binders from ultra-large combinatorial spaces [97] | Confirming intracellular target engagement and binding kinetics [100] |
Workflow and Pathway Visualizations
DEL Selection and Hit Identification Workflow
Intracellular Target Engagement via BRET
The Scientist's Toolkit: Key Research Reagent Solutions
Table 2: Essential Reagents and Materials for DEL and Intracellular Engagement Studies
| Item | Function in Experiment | Key Consideration |
|---|---|---|
| DNA-Encoded Library (DEL) | Source of billions of small molecules for affinity selection against purified targets. | Libraries can be constructed in-house or sourced from commercial providers. Quality control via PCR is essential [98] [97]. |
| Streptavidin-Coated Magnetic Beads | For immobilization of biotin-tagged protein targets during DEL selection. | Ensure high binding capacity and low non-specific binding to minimize background [97]. |
| NanoLuc Luciferase (Nluc) | A small, bright luciferase used as a BRET donor for intracellular target engagement assays. | Its small size minimizes disruption to the native function of the target protein [100]. |
| Cell-Permeable Fluorescent Tracer | A BRET acceptor that binds to the target of interest inside live cells. | Must be cell-permeable and have spectral overlap with Nluc emission (e.g., NCT dye) [100]. |
| qPCR/NGS Reagents | For amplifying and sequencing the DNA barcodes of enriched hits from a DEL selection. | Critical for decoding the chemical structure of binding molecules [98] [97]. |
Conclusion
Effectively managing the distinct intracellular and extracellular physicochemical environments is not merely a technical detail but a fundamental requirement for robust and translatable biomedical research. By adopting the strategies outlined—from employing cytoplasm-mimicking buffers to validating findings across assay systems—researchers can significantly improve the predictive accuracy of their models. Future progress hinges on the continued development of advanced biomimetic systems, a deeper understanding of cell-type-specific physicochemical variations, and the integration of these principles into the discovery and optimization of novel therapeutic modalities, particularly for intracellular targets currently deemed 'undruggable.' This holistic approach promises to accelerate drug development and enhance the success rate of clinical translation.
References
- 1. Sodium–potassium pump [https://en.wikipedia.org/wiki/Sodium%E2%80%93potassium_pump]
- 2. Biological Importance of Sodium and Potassium for IIT JEE [https://www.vedantu.com/jee-main/chemistry-biological-importance-of-sodium-and-potassium]
- 3. IonoBiology: The functional dynamics of the intracellular ... [https://pmc.ncbi.nlm.nih.gov/articles/PMC8570674/]
- 4. The molecular landscape of cellular metal ion biology [https://www.sciencedirect.com/science/article/pii/S2405471225001528]
- 5. Impact of Metal Ions on Cellular Functions: A Focus on ... [https://www.mdpi.com/1422-0067/25/18/10127]
- 6. Body Fluids and Fluid Compartments [https://courses.lumenlearning.com/suny-ap2/chapter/body-fluids-and-fluid-compartments-no-content/]
- 7. sciencedirect.com/topics/biochemistry-genetics-and- molecular -biology... [https://www.sciencedirect.com/topics/biochemistry-genetics-and-molecular-biology/macromolecular-crowding]
- 8. Connecting the Dots: The Effects of Macromolecular on... Crowding [https://pmc.ncbi.nlm.nih.gov/articles/PMC4269789/]
- 9. Frontiers | The effect of macromolecular crowding on mobility of ... [https://www.frontiersin.org/articles/10.3389/fphy.2014.00054/full]
- 10. Comparative Analysis of Biochemical and Cellular Assay Conditions ... [https://pubmed.ncbi.nlm.nih.gov/40942155/]
- 11. Biomolecular interactions modulate macromolecular structure and... [https://elifesciences.org/articles/19274]
- 12. Coupling of nanostraws with diverse physicochemical perforation... [https://link.springer.com/article/10.1186/s12951-024-02392-w]
- 13. Simultaneous intracellular and redox measurements in... potential pH [https://pubmed.ncbi.nlm.nih.gov/25700000/]
- 14. Physico-chemical conditions - Labster [https://theory.labster.com/physico-chemical-conditions/]
- 15. Difference Between Intracellular and Extracellular | Out-Class [https://www.out-class.org/blogs/difference-between-intracellular-and-extracellular]
- 16. Physiology, Body Fluids - StatPearls - NCBI Bookshelf [https://www.ncbi.nlm.nih.gov/books/NBK482447/]
- 17. Phosphate-buffered saline - Wikipedia [https://en.wikipedia.org/wiki/Phosphate-buffered_saline]
- 18. Extracellular space - Wikipedia [https://en.wikipedia.org/wiki/Extracellular_space]
- 19. Troubleshooting Protocols - Biological Sciences: Summer Research Institute (SRI) - CMU LibGuides at Carnegie Mellon University [https://guides.library.cmu.edu/biologicalsciencesSRI/troubleshooting]
- 20. (Phosphate PBS Saline) (1X, pH... | AAT Bioquest Buffered [https://www.aatbio.com/resources/buffer-preparations-and-recipes/pbs-phosphate-buffered-saline]
- 21. Different Conformational Subensembles of the Intrinsically Disordered... [https://research.utwente.nl/en/publications/different-conformational-subensembles-of-the-intrinsically-disord]
- 22. The difference between Ki, Kd, IC50, and EC50 values - The Science Snail [https://www.sciencesnail.com/science/the-difference-between-ki-kd-ic50-and-ec50-values]
- 23. What is the difference between Ki and IC in enzyme... | AAT Bioquest 50 [https://www.aatbio.com/resources/faq-frequently-asked-questions/What-is-the-difference-between-Ki-and-IC50-in-enzyme-inhibition]
- 24. Equilibrium, affinity, dissociation constants, IC5O: Facts and fantasies [https://pubmed.ncbi.nlm.nih.gov/30977282/]
- 25. Frontiers | Physicochemical and Nutritional Requirements for Axenic... [https://www.frontiersin.org/journals/cellular-and-infection-microbiology/articles/10.3389/fcimb.2017.00190/full]
- 26. Physicochemical Properties and Environmental Fate - A Framework to Guide Selection of Chemical Alternatives - NCBI Bookshelf [https://www.ncbi.nlm.nih.gov/books/NBK253956/]
- 27. A pH-driven transition of the cytoplasm from a fluid- to a solid-like state promotes entry into dormancy | eLife [https://elifesciences.org/articles/09347]
- 28. Crowders and Cosolvents -Major Contributors to the Cellular Milieu... [https://pubmed.ncbi.nlm.nih.gov/28810057/]
- 29. and Cosolvent effects on the polymerization kinetics of actin... crowding [https://pubs.rsc.org/en/content/articlehtml/2015/cp/c4cp04431b]
- 30. Buffer Preparation — Hints, Tips and Common Errors | LCGC International [https://www.chromatographyonline.com/view/buffer-preparation-hints-tips-and-common-errors-0]
- 31. Mimicking the Escherichia coli cytoplasmic environment activates long-lived and efficient cell-free protein synthesis - PubMed [https://pubmed.ncbi.nlm.nih.gov/15007837/]
- 32. Enzymes: Key Differences & Functions Intracellular vs Extracellular [https://www.vedantu.com/biology/intracellular-and-extracellular-enzyme]
- 33. of nanoparticle... | Nature Communications Intracellular localization [https://www.nature.com/articles/s41467-017-01337-2?error=cookies_not_supported&code=07f7eb4e-cd55-4ec2-84dc-db6f58c5f9da]
- 34. Flow Cytometry Protocols for Surface and Intracellular Antigen Analyses of Neural Cell Types - PMC [https://pmc.ncbi.nlm.nih.gov/articles/PMC4396953/]
- 35. Flow Cytometry Protocol | Abcam [https://www.abcam.com/en-us/technical-resources/protocols/flow-cytometry-for-intracellular-and-extracellular-targets]
- 36. recognition of pathogens--common... Intracellular vs extracellular [https://pubmed.ncbi.nlm.nih.gov/11912027/]
- 37. Differential utilization of NF-kappaB RELA and RELB in response to... [https://bmcimmunol.biomedcentral.com/articles/10.1186/1471-2172-12-15]
- 38. of the Redox : Theoretical and Experimental... Buffer Capacity Cell [https://link.springer.com/article/10.1007/s12013-010-9090-3]
- 39. (PDF) Redox of the Buffer : Theoretical and... Capacity Cell [https://www.academia.edu/129492388/Redox_Buffer_Capacity_of_the_Cell_Theoretical_and_Experimental_Approach]
- 40. Nutritional Strategies to Modulate Intracellular and Extracellular... [https://link.springer.com/article/10.1007/s40279-015-0397-5]
- 41. Frontiers | Editorial: Physico-Chemical Control of Cell Function [https://www.frontiersin.org/articles/10.3389/fphys.2019.00355/full]
- 42. Elucidating the molecular mechanisms underlying cellular response ... [https://ncbi.nlm.nih.gov/pmc/articles/PMC5079403]
- 43. Frontiers | Physico-Chemical Control of Cell Function [https://www.frontiersin.org/research-topics/6325/physico-chemical-control-of-cell-function]
- 44. Strategies for Mass Physicochemical of... Modulation Production [https://pubmed.ncbi.nlm.nih.gov/40471522/]
- 45. Physicochemical Modulation Strategies for Mass Production of Extracellular Vesicle - PMC [https://pmc.ncbi.nlm.nih.gov/articles/PMC12209107/]
- 46. Emerging technologies towards extracellular vesicles large-scale production - ScienceDirect [https://www.sciencedirect.com/science/article/pii/S2452199X25002336]
- 47. The physico-chemical landscape of extracellular vesicles | Nature Reviews Bioengineering [https://www.nature.com/articles/s44222-024-00255-5]
- 48. MISEV [https://www.isev.org/misev]
- 49. Harnessing engineered extracellular for vesicles ... enhanced [https://jeccr.biomedcentral.com/articles/10.1186/s13046-025-03403-w]
- 50. Unraveling the enigma: elucidating the relationship between the... [https://aacijournal.biomedcentral.com/articles/10.1186/s13223-018-0305-2]
- 51. Intracellular and extracellular targets as mechanisms of cancer therapy by nanomaterials in relation to their physicochemical properties - PMC [https://pmc.ncbi.nlm.nih.gov/articles/PMC7988657/]
- 52. Toward Intracellular Targeted Delivery of Cancer Therapeutics: Progress and Clinical Outlook for Brain Tumor Therapy - PMC [https://pmc.ncbi.nlm.nih.gov/articles/PMC3755874/]
- 53. SiriusT3: Physicochemical Property Analysis for Drug Development in... [https://www.aimil.com/blog/physicochemical-property-analysis-for-drug-development-in-india/]
- 54. Challenges in Drug Discovery for Intracellular Bacteria - PMC [https://pmc.ncbi.nlm.nih.gov/articles/PMC8468363/]
- 55. Volume and Osmolality of Extracellular and Intracellular Fluids in... [https://www.brainkart.com/article/Volume-and-Osmolality-of-Extracellular-and-Intracellular-Fluids-in-Abnormal-States_19377/]
- 56. profiling ( Physicochemical , solubility and charge state) permeability [https://pubmed.ncbi.nlm.nih.gov/11899112/]
- 57. Rapid Experimental Measurements of Physicochemical Properties to Inform Models and Testing - PMC [https://pmc.ncbi.nlm.nih.gov/articles/PMC6214190/]
- 58. Modulation Strategies for Mass Production of... Physicochemical [https://link.springer.com/article/10.1007/s13770-025-00726-9]
- 59. Vesicles and Cell-cell Communication in Normal Cellular... Extracellular [https://www.frontiersin.org/research-topics/37981/extracellular-vesicles-and-cell-cell-communication-in-normal-cellular-processes-and-cancer/magazine]
- 60. Comparative Analysis of Biochemical and Cellular Assay Conditions ... [https://www.mdpi.com/1420-3049/30/17/3630]
- 61. Video: A Rapid and Specific Microplate Assay for the Determination of... [https://www.jove.com/v/51322/a-rapid-specific-microplate-assay-for-determination-intra]
- 62. What Is the CCK-8 Assay ? A Guide to Cell Viability Testing | Boster Bio [https://www.bosterbio.com/blog/post/what-is-the-cck-8-assay]
- 63. WST-1 Assay : principles, protocol & best practices for cell viability [https://www.abcam.com/en-us/knowledge-center/cell-biology/wst-1-assay-principles-protocols-and-best-practices-for-cell-viability]
- 64. : Unlocking the next frontier in drug discovery... Goldilocks molecules [https://www.ddw-online.com/goldilocks-molecules-unlocking-the-next-frontier-in-drug-discovery-36001-202508/]
- 65. A new Goldilocks drug class: macrocyclic... | Drug Discovery News [https://www.drugdiscoverynews.com/a-new-goldilocks-drug-class-macrocyclic-peptides-15931]
- 66. Drug Discovery Assays Support—Troubleshooting | Thermo Fisher Scientific - US [https://www.thermofisher.com/us/en/home/technical-resources/technical-reference-library/drug-discovery-development-support-center/drug-discovery-assays-support/drug-discovery-assays-support-troubleshooting.html]
- 67. Strategies for the enhanced intracellular delivery of nanomaterials - PMC [https://pmc.ncbi.nlm.nih.gov/articles/PMC7108348/]
- 68. Intracellular Drug Delivery: Mechanisms for Cell Entry - PubMed [https://pubmed.ncbi.nlm.nih.gov/26675221/]
- 69. PROTAC Delivery Strategies for Overcoming Physicochemical ... [https://pmc.ncbi.nlm.nih.gov/articles/PMC12030311/]
- 70. Dilemma: LPS Works Both as the Initial Goldilocks and... Target [https://pmc.ncbi.nlm.nih.gov/articles/PMC10377513/]
- 71. Drug Discovery Assays Support—Getting Started | Thermo Fisher Scientific - US [https://www.thermofisher.com/us/en/home/technical-resources/technical-reference-library/drug-discovery-development-support-center/drug-discovery-assays-support/drug-discovery-assays-support-getting-started.html]
- 72. Drug Discovery Assays Support | Thermo Fisher Scientific - US [https://www.thermofisher.com/us/en/home/technical-resources/technical-reference-library/drug-discovery-development-support-center/drug-discovery-assays-support.html]
- 73. Intracellular Drug Delivery - an overview | ScienceDirect Topics [https://www.sciencedirect.com/topics/pharmacology-toxicology-and-pharmaceutical-science/intracellular-drug-delivery]
- 74. Intracellular Space - an overview | ScienceDirect Topics [https://www.sciencedirect.com/topics/immunology-and-microbiology/intracellular-space]
- 75. and the presence of neighboring Mechanical greatly... stimulation cells [https://pubmed.ncbi.nlm.nih.gov/23881314/]
- 76. stem Mechanically | MIT News | Massachusetts... stimulating cells [https://news.mit.edu/2015/mechanically-stimulating-stem-cells-0320]
- 77. How to be a Better Troubleshooter in Your Laboratory | GoldBio [https://goldbio.com/articles/article/how-to-be-a-better-troubleshooter]
- 78. Comparative study on physicochemical properties and hypoglycemic... [https://pubmed.ncbi.nlm.nih.gov/39151842/]
- 79. Assessment of Critical -Dependent pH Profiles of Small... Lipophilicity [https://pubmed.ncbi.nlm.nih.gov/37788220/]
- 80. How to measure and evaluate binding affinities - PMC [https://pmc.ncbi.nlm.nih.gov/articles/PMC7452723/]
- 81. -Binding Cell for Determining the Affinity of Protein–Protein... Assays [https://pmc.ncbi.nlm.nih.gov/articles/PMC6067677/]
- 82. Dissociation Constant (Kd) Measurement for Small-Molecule Binding Aptamers: Homogeneous Assay Methods and Critical Evaluations - PubMed [https://pubmed.ncbi.nlm.nih.gov/39511863/]
- 83. of in vitro and in situ Comparison for various Ca2+... Kd values [https://www.thermofisher.com/de/de/home/references/molecular-probes-the-handbook/tables/comparison-of-in-vitro-and-in-situ-kd-values-for-various-ca2-indicators.html]
- 84. Ions and electrolytes physiology | GetBodySmart [https://www.getbodysmart.com/neurophysiology/ions-ditribution/]
- 85. pmcalculators.com/how-to-calculate-the- critical - path [https://www.pmcalculators.com/how-to-calculate-the-critical-path/]
- 86. How To Use Critical Method in 2025 Path [https://planyway.com/blog/critical-path-method-for-project-managers]
- 87. Use Critical Method (CPM) for Project Management [2025] • Asana Path [https://asana.com/resources/critical-path-method]
- 88. Hydrolysis - an overview | ScienceDirect Topics [https://www.sciencedirect.com/topics/immunology-and-microbiology/hydrolysis]
- 89. and Intracellular sources, transformation process and... extracellular [https://pubmed.ncbi.nlm.nih.gov/36063951/]
- 90. and Proteolysis of Sludge Extraction Using... | Research Square Protein [https://www.researchsquare.com/article/rs-2887824/v1]
- 91. Impact of Enzymatic Hydrolysis and Heat Inactivation on the Physicochemical Properties of Milk Protein Hydrolysates - PMC [https://pmc.ncbi.nlm.nih.gov/articles/PMC8871203/]
- 92. Sample preparation of secreted proteins for western blot | Abcam [https://www.abcam.com/en-us/technical-resources/protocols/sample-preparation-of-secreted-proteins-for-western-blot]
- 93. Comparative Analysis of Biochemical and Cellular Assay Conditions and the Need for a Buffer That Mimics Cytoplasmic Environments - PMC [https://pmc.ncbi.nlm.nih.gov/articles/PMC12429910/]
- 94. Calibration Tips for pH | Your Guide to Perfect pH Calibration [https://murphyanddickey.com/calibration-tips-for-ph/]
- 95. Universal buffers for use in biochemistry and biophysical experiments [https://www.aimspress.com/article/10.3934/biophy.2015.3.336/fulltext.html]
- 96. Boosting Accuracy and Efficiency: Assay Development and Validation Process for Drug Discovery [https://dispendix.com/blog/boosting-accuracy-and-efficiency-assay-development-and-validation-process-for-drug-discovery]
- 97. - DNA Chemical Encoded : A Comprehensive Review with... Libraries [https://pmc.ncbi.nlm.nih.gov/articles/PMC8369695/]
- 98. - DNA chemical encoded - Wikipedia library [https://en.wikipedia.org/wiki/DNA-encoded_chemical_library]
- 99. High-Throughput Implementation of the NanoBRET Target... [https://pubmed.ncbi.nlm.nih.gov/31849250/]
- 100. Target engagement and drug residence time... | Nature Communications [https://www.nature.com/articles/ncomms10091?error=cookies_not_supported&code=8503b15c-c868-4473-bb1c-c1b5517d877a]
- 101. High-throughput screening - Wikipedia [https://en.wikipedia.org/wiki/High-throughput_screening]
- 102. High Throughput Screening - an overview | ScienceDirect Topics [https://www.sciencedirect.com/topics/biochemistry-genetics-and-molecular-biology/high-throughput-screening]