Agarose Gel Electrophoresis for PCR Analysis: A Complete Guide from Basics to Advanced Applications
This article provides a comprehensive guide to agarose gel electrophoresis for researchers, scientists, and drug development professionals analyzing PCR products.
Agarose Gel Electrophoresis for PCR Analysis: A Complete Guide from Basics to Advanced Applications
Abstract
This article provides a comprehensive guide to agarose gel electrophoresis for researchers, scientists, and drug development professionals analyzing PCR products. It covers foundational principles and market context, detailed methodological protocols, systematic troubleshooting for common issues like faint or smeared bands, and advanced validation techniques compared to other molecular detection methods. The content synthesizes current market data, technical best practices, and real-world applications in biomedical research, diagnostics, and forensic science to offer a complete resource for optimizing PCR product analysis.
The Essential Role of Agarose Gel Electrophoresis in Modern Molecular Biology
Agarose gel electrophoresis is a foundational technique in molecular biology for separating DNA fragments by size. For researchers and drug development professionals, a deep understanding of its core principles is essential for accurate PCR product analysis, ensuring reliable data for downstream applications like cloning, sequencing, and diagnostic assays [1] [2].
The Core Separation Mechanism
The fundamental principle of agarose gel electrophoresis is molecular sieving [3] [2]. The agarose gel forms a porous, three-dimensional matrix through which charged molecules migrate under the influence of an electric field [3].
- Charged Molecules in an Electric Field: The phosphate backbone of DNA is negatively charged at neutral pH. When an electric field is applied, DNA fragments are pulled through the gel toward the positive anode ( cathode ) [3] [1].
- The Sieving Matrix: The agarose gel is not a solid barrier but a network of pores. The pore size is inversely related to the agarose concentration; a higher percentage agarose gel creates a smaller average pore size [3].
- Size-Dependent Migration: As DNA molecules move through this matrix, shorter DNA fragments navigate the pores more easily and migrate faster and farther than larger fragments, which are impeded and slowed down by collisions with the gel matrix [3] [2]. This relationship between fragment size and migration distance allows for separation and size estimation [1].
For DNA molecules larger than approximately 1 kilobase, the reptation model best describes their movement. In this model, the DNA molecule crawls in a "snake-like" fashion through the pores, with its leading end biased in the direction of the electric field [3].
Key Factors Influencing DNA Migration
Several factors beyond fragment length can affect the rate of DNA migration through an agarose gel. Optimizing these parameters is crucial for achieving high-resolution separation.
- Agarose Gel Concentration: The concentration of the gel is the primary factor determining the size range of DNA fragments that can be effectively separated [4].
- Voltage Applied: Higher voltages increase the speed of migration. However, excessive voltage can cause heating, which may melt the gel or reduce resolution by causing band "smiling" [3] [2].
- DNA Conformation: The physical shape of a DNA molecule affects its mobility. Supercoiled plasmid DNA migrates faster than linear DNA of the same molecular weight, while nicked or open-circular DNA migrates more slowly [3] [5].
- Buffer Ionic Strength: The electrophoresis buffer (e.g., TAE or TBE) provides the ions necessary to carry the current. Exhausted buffer can lead to poor conductivity and inconsistent results [2].
The table below summarizes the critical relationship between agarose percentage and the effective separation range for double-stranded DNA fragments.
Table 1: Agarose Gel Concentration and DNA Fragment Separation Range [4]
| Agarose Percentage (%) | Effective Separation Range (base pairs) |
|---|---|
| 0.5 | 1,000 to 30,000 |
| 0.7 | 800 to 12,000 |
| 1.0 | 500 to 10,000 |
| 1.2 | 400 to 7,000 |
| 1.5 | 200 to 3,000 |
| 3.0 - 4.0 (Sieving) | 10 to 1,000 |
Detailed Experimental Protocol for PCR Product Analysis
This protocol provides a step-by-step guide for analyzing PCR products, such as verifying amplification success and estimating product size.
Materials and Reagent Solutions
Table 2: Essential Research Reagents and Equipment [2] [6]
| Item | Function / Description |
|---|---|
| Agarose | A polysaccharide derived from seaweed that forms the sieving matrix of the gel. |
| Electrophoresis Buffer (1X TAE or TBE) | Provides the ionic medium for conductivity and maintains a stable pH during the run. |
| DNA Loading Dye | Contains a dense agent (e.g., glycerol) to help samples sink into wells, and tracking dyes (e.g., Bromophenol Blue) to monitor migration progress. |
| DNA Molecular Weight Ladder | A mixture of DNA fragments of known sizes, used to estimate the size of unknown samples. |
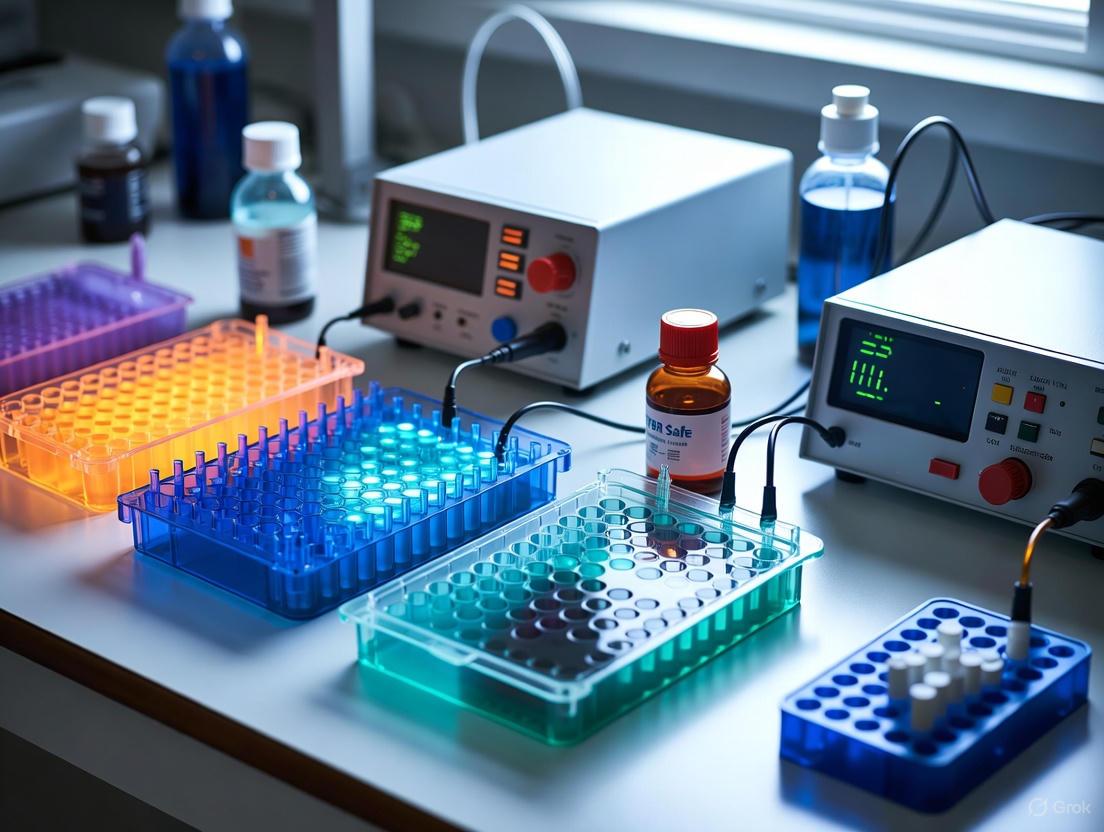
| Nucleic Acid Stain | A fluorescent dye (e.g., SYBR Safe, GelGreen, Ethidium Bromide) that intercalates with DNA, allowing visualization under specific light. |
| Horizontal Gel Electrophoresis System | Consists of a casting tray, comb, and tank to hold the gel and buffer during the run. |
| Power Supply | Provides the controlled electric field required for electrophoresis. |
| Gel Documentation System | Equipment with a light source (UV or blue light) and a camera to image and record the stained gel. |
Step-by-Step Workflow
Diagram 1: Agarose Gel Electrophoresis Workflow.
Gel Preparation and Casting
- Prepare an agarose solution by dissolving the appropriate amount of agarose powder in 1X electrophoresis buffer (e.g., TAE or TBE) in a glass flask. The percentage used depends on the expected size of your PCR product (see Table 1); a 1-2% gel is standard for many PCR amplicons [6] [4].
- Heat the mixture in a microwave oven until the agarose is completely dissolved and the solution is clear. Swirl gently to ensure even heating.
- Let the solution cool to approximately 60°C to avoid warping the casting tray. If using an intercalating dye for post-staining, add it to the molten agarose at this stage (e.g., 6 µL of 10,000X SYBR Safe per 60 mL gel) [6].
- Pour the molten agarose into a casting tray with a well-forming comb in place. Allow the gel to solidify completely at room temperature for about 20-30 minutes [2].
Sample and Ladder Loading
- Prepare your DNA samples by mixing the PCR reaction with a 6X loading dye to a final 1X concentration. The dye adds density for loading and allows visual tracking of migration [6].
- Carefully remove the comb from the solidified gel and place the gel into the electrophoresis chamber. Submerge the gel in 1X electrophoresis buffer, ensuring the buffer just covers the surface.
- Load the prepared DNA samples and a DNA molecular weight ladder into the wells. Pipette slowly and steadily to avoid damaging the wells and losing the sample [6].
Electrophoresis Run
- Secure the lid on the tank, ensuring the electrodes are correctly aligned (black to black, red to red). DNA is negatively charged and will migrate from the cathode (black, negative electrode) toward the anode (red, positive electrode) [6].
- Turn on the power supply and set it to a constant voltage appropriate for your gel size. A common setting is 100-120 V for a standard mini-gel, running for 30-45 minutes. Monitor the progress by tracking the migration of the dye fronts [2] [6].
Visualization and Analysis
- After the run, turn off the power and carefully remove the gel from the tank. If the gel was not pre-stained, it must be stained by soaking in a solution containing an appropriate dye (e.g., Ethidium Bromide or SYBR Safe) followed by a destaining step if necessary [2].
- Place the gel on a UV or blue light transilluminator. Caution: Always wear appropriate personal protective equipment when working with UV light. The DNA bands will fluoresce and become visible [2] [6].
- Capture an image of the gel using a documentation system. Compare the migration distance of your PCR product bands to the bands of the DNA ladder to estimate their size [6].
Advanced Applications and Considerations
Analysis of Plasmid DNA Conformations
Agarose gel electrophoresis is crucial for qualitative analysis of plasmid DNA, which can exist in several topological forms that migrate at different speeds [5]:
- Supercoiled (Covalently Closed Circular): The most compact form, migrates fastest.
- Linear: Resulting from a double-strand break, migrates at an intermediate speed.
- Open Circular (Nicked): Resulting from a single-strand break, is relaxed and migrates slowest [5].
Capillary Gel Electrophoresis (CGE) is emerging as a modern, quantitative alternative to traditional agarose gel electrophoresis (AGE) for analyzing plasmid DNA isoforms. CGE offers advantages including higher reproducibility, automation, and avoidance of hazardous dyes, making it suitable for quality control in pharmaceutical development and radiation research [5].
Molecular Weight Estimation
Accurate size determination relies on a standard curve generated from the DNA ladder. By plotting the logarithm of the size (in base pairs) of the known ladder fragments against their migration distance, a linear relationship can be established for the relevant size range. The size of an unknown PCR product can then be interpolated from this standard curve [3] [2].
The global agarose gel market is experiencing robust growth, driven by its indispensable role in biotechnology, molecular diagnostics, and pharmaceutical research. Agarose gel electrophoresis remains a cornerstone technique for separating and analyzing nucleic acids, with expanding applications across diverse scientific fields.
Market Size and Growth Projections
Recent market analyses reveal a consistently positive growth trajectory for the agarose gel sector, with variations in reported figures reflecting different market segment focuses.
Table 1: Agarose Gel Market Size and Growth Projections
| Market Segment | 2024 Baseline | 203X Projection | CAGR | Source Year |
|---|---|---|---|---|
| Agarose for Gel Electrophoresis | USD 98.2 million [7] | USD 177.6 million by 2034 [7] | 6.1% [7] | 2024-2034 |
| Agarose Gel Electrophoresis System | USD 3.51 billion [8] [9] | USD 5.22 billion by 2029 [8] [9] | ~8.2%-8.5% [8] [9] | 2024-2029 |
| Precast Agarose Gel | USD 150 million (2023) [10] | USD 240 million by 2032 [10] | 5.2% [10] | 2023-2032 |
| Agarose Precast Gel (Alternate Source) | 656.6 USD Million [11] | 1,200 USD Million by 2035 [11] | 5.6% [11] | 2024-2035 |
Market Segment Analysis
The market is segmented by product type, application, and end-user, each contributing differently to the overall growth dynamics.
Table 2: Agarose Gel Market Segmentation and Key Characteristics
| Segmentation | Leading Category | Market Share / Key Detail | Primary Growth Drivers |
|---|---|---|---|
| By Product Type | Standard Melting Agarose [7] | ~69.2% share [7] | High gel strength, mechanical stability, suitability for routine DNA/RNA separation [7] |
| By Application | Nucleic Acid Electrophoresis [7] | 44.3% share [7] | Fundamental technique in molecular biology for DNA/RNA analysis post-PCR and restriction digestion [7] |
| By End-User | Academic & Research Institutions [12] | ~55% of the market [12] | Extensive use in basic and applied research in genomics and molecular biology [12] [10] |
Regional Market Landscape
Geographically, the market showcases distinct leadership and growth patterns, influenced by regional research infrastructure and investment.
Regional Market Dynamics
North America dominates the market, holding more than a 36.5% share [7], attributed to its strong biotechnology sector, significant research funding, and high concentration of pharmaceutical companies and academic institutions [12] [7]. Europe also represents a major market with a mature pharmaceutical industry and strong governmental support for life sciences [12]. The Asia-Pacific region is poised for the most rapid growth, fueled by expanding healthcare infrastructure, increasing research activities, and burgeoning pharmaceutical and biotechnology sectors in countries like China and India [12] [10].
Key Market Drivers and Trends
Primary Growth Drivers
Several interconnected factors are propelling the agarose gel market forward:
- Rising Focus on Personalized Medicine: The push for treatments tailored to individual genetic profiles increases demand for genetic analysis techniques. Agarose gel electrophoresis is crucial for separating and analyzing DNA fragments for genetic testing [8] [9]. For instance, the FDA approved 16 novel personalized therapies in 2023, up from six in 2022 [8] [9].
- Growing Prevalence of Genetic Disorders: Increased awareness and diagnosis of genetic conditions drive the need for reliable diagnostic tools. Agarose gel electrophoresis is used to detect genetic mutations and abnormalities [8] [9]. Over 6,000 genetic conditions are known, with 1 in 25 UK children affected [8] [9].
- Expansion in Biopharmaceutical and Biotechnology Sectors: These industries rely heavily on agarose gels for drug discovery, development, quality control, and biomanufacturing processes [8] [10] [9].
- Increasing Applications in Diagnostics and Forensic Science: The technique is vital in vaccine development, antibiotic testing [7], and forensic DNA fingerprinting, with systems like the FBI's CODIS aiding over 600,000 investigations [7].
Emerging Market Trends
The market is evolving with several key trends shaping its future:
- Product Innovation and Automation: Development of high-resolution precast gels [11], advanced staining techniques [10], and automated electrophoresis systems enhance reproducibility, efficiency, and ease of use [10].
- Shift Towards Precast Gels: Growing preference for ready-to-use precast gels over traditional lab-poured gels due to convenience, time-saving benefits, and improved consistency [11] [10].
- Integration of Advanced Imaging and AI: Introduction of high-performance gel imaging systems [8] [9] and the application of artificial intelligence for data analysis are improving accuracy and interpretation of results [8] [9].
- Sustainability and Green Practices: Manufacturers are increasingly adopting eco-friendly production processes and exploring sustainable materials in response to regulatory shifts and environmental concerns [13].
Application Note: Agarose Gel Electrophoresis for PCR Product Analysis
Agarose gel electrophoresis is a fundamental and robust method for validating PCR amplification success, determining amplicon size, and semi-quantifying yield, making it a critical quality control step in genetic research and diagnostics [14] [15].
Experimental Workflow
The standard procedure for analyzing PCR products involves a sequential process from gel preparation to data interpretation.
PCR Product Analysis Workflow
Detailed Protocol
3.2.1 Materials and Reagents
Table 3: Research Reagent Solutions for PCR Product Analysis
| Item | Function / Specification | Technical Notes |
|---|---|---|
| Agarose | Matrix for separation; Standard melting point (35-40°C gelling) is typical [7]. | Concentration determines pore size (0.8%-2.0%); higher % for smaller DNA fragments [7]. |
| 1X TAE Buffer | (Tris-acetate-EDTA) Conducting medium for electrophoresis [14]. | Diluted from 50X concentrated stock [14]. |
| DNA Binding Dye | Intercalating agent for nucleic acid visualization (e.g., Red Safe, Ethidium Bromide) [14]. | Added directly to gel or used for post-staining. |
| DNA Molecular Weight Ladder | Size standard for estimating amplicon length [14]. | Contains DNA fragments of known sizes. |
| 6X Loading Buffer | Contains dyes (e.g., Bromophenol Blue) to track migration and glycerol to densify sample [14]. | Mixed with PCR product before loading. |
| PCR Product | Sample for analysis; typically 5-20 µL from a PCR reaction [14]. |
3.2.2 Step-by-Step Methodology
Gel Preparation: For a 1% gel, mix 1 g of agarose with 100 mL of 1X TAE buffer [14]. Heat in a microwave until the agarose is completely dissolved. Allow the solution to cool slightly (around 50-60°C), add the appropriate DNA binding dye as per manufacturer's instructions, and pour into a gel casting tray with a well comb inserted. Let it solidify at room temperature for 20-30 minutes.
Sample Preparation: Combine 5-20 µL of your PCR product with a volume of 6X loading dye (e.g., 2 µL of dye for 10 µL of product) [14]. Mix thoroughly by pipetting.
Electrophoresis Setup: Place the solidified gel in an electrophoresis chamber filled with 1X TAE buffer to just cover the gel surface. Carefully remove the well comb. Load the prepared samples and 5 µL of DNA molecular weight ladder into adjacent wells.
Run Conditions: Connect the electrodes (DNA migrates toward the positive anode, red). Apply a constant voltage of 5-10 V/cm distance between electrodes [14]. Run until the bromophenol blue tracking dye has migrated 50-75% of the gel length.
Visualization and Analysis: Image the gel using a UV or blue light transilluminator with an appropriate imaging system. Compare the migration distance of your PCR product bands to those of the molecular weight ladder to estimate amplicon size.
Data Interpretation and Troubleshooting
Correct interpretation is key to validating PCR success and guiding downstream steps.
Table 4: Interpreting PCR Results on an Agarose Gel
| Observed Result | Interpretation | Recommended Action |
|---|---|---|
| Single, sharp band of expected size | Successful amplification of the target DNA region [14]. | Proceed to downstream applications like purification for sequencing [14]. |
| No bands | PCR amplification failed [14]. | Check reagent concentrations, annealing temperature, and template DNA quality. |
| Multiple bands | Non-specific binding of primers; amplification of non-target regions [14]. | Optimize PCR conditions (e.g., increase annealing temperature, use a hot-start polymerase). |
| Smear of DNA | Non-specific amplification or degradation of DNA. | Re-design primers, check template DNA integrity, optimize Mg²⁺ concentration. |
A 2022 study confirmed that assessing the relative quantity of amplicons by band brightness is sufficiently precise for many post-PCR analyses, correlating well with results from spectrophotometry, fluorometry, and qPCR [15].
Strategic Market Outlook
The future growth of the agarose gel market is anchored in its fundamental role in the expanding biotechnology and life sciences landscape. Key players like Thermo Fisher Scientific, Bio-Rad Laboratories, Merck KGaA, and Lonza are focusing on innovation, strategic partnerships, and expanding distribution networks to strengthen their market positions [12] [16] [11]. The continuous evolution of gel formulations, integration with automated high-throughput systems, and the rising demand from emerging markets are expected to sustain the market's robust growth trajectory, supporting advancements in genomics, personalized medicine, and molecular diagnostics [8] [10] [9].
In the realm of molecular biology, particularly in PCR product analysis, agarose gel electrophoresis stands as a fundamental technique for separating and analyzing DNA fragments by size. The selection of an appropriate agarose type is not merely a procedural step but a critical determinant of experimental success, influencing everything from band resolution to downstream applications. The two primary categories of agarose relevant to PCR product analysis are Standard Agarose (including its Low Electroendosmosis or LE variant) and Low-Melting Point (LMP) Agarose. Each possesses distinct physical and chemical properties tailored for specific experimental workflows. Standard agarose is typically employed for routine analytical electrophoresis, while low-melting point agarose is indispensable for preparative techniques that require the recovery and subsequent manipulation of DNA fragments, such as cloning, ligation, or sequencing. Understanding the scientific basis for choosing between them—guided by parameters like electroendosmosis, gelling temperature, and fragment size—ensures optimal resolution, efficiency, and compatibility with post-electrophoresis protocols [17] [18].
The property of electroendosmosis (EEO) is a pivotal differentiator between agarose types. EEO refers to the movement of water and dissolved ions through the porous agarose matrix in the opposite direction to DNA migration when an electric field is applied. This phenomenon is largely influenced by the sulfate content in the agarose; higher sulfate concentrations impart more negative charge, leading to a stronger counterflow of positive buffer ions (cations). This counterflow can hinder the movement of negatively charged DNA, resulting in reduced resolution, band smearing, and slower run times. Agarose LE is a purified standard agarose characterized by a low EEO value (typically 0.07-0.13), which minimizes this counterflow, thereby enhancing band sharpness and separation accuracy. This makes it the ideal choice for precise analytical work and many preparative procedures [17] [19].
Table 1: Key Characteristics of Standard and Low-Melting Point Agarose
| Property | Standard Agarose (Multipurpose) | Agarose LE (Low EEO) | Low-Melting Point (LMP) Agarose |
|---|---|---|---|
| Electroendosmosis (EEO) | 0.12 - 0.15 [17] | 0.07 - 0.13 [17] | ≤ 0.12 [18] |
| Typical Melting Point | > 90°C [19] | > 90°C [19] | ≤ 65.5°C [18] |
| Typical Gelling Point | 34-38°C [19] | 34-38°C [19] | 24-28°C [18] |
| Sulfate Content | Moderate | Low [17] | Low (≤ 0.12%) [18] |
| Primary Application | Routine nucleic acid electrophoresis [17] | PCR analysis, blotting, preparative electrophoresis [17] | In-gel enzymatic reactions, high-purity DNA/RNA recovery [18] |
Selection Guidelines Based on Application
Choosing Between Standard and Low-Melting Point Agarose
The decision-making flowchart for selecting the appropriate agarose type is based on the experimental goal. The following diagram outlines the critical questions a researcher must ask to guide this selection, ensuring the agarose properties align with the intended application.
The fundamental question driving agarose selection is the nature of the downstream application. For experiments concluding with simple visualization and size estimation under UV light, standard agarose is often sufficient and cost-effective. However, if the experimental design requires a step after electrophoresis, the choice becomes more critical.
- Standard Agarose (Multipurpose): This is the default choice for routine analysis, such as checking PCR success, quantifying DNA, or roughly estimating fragment sizes. Its higher melting point (~90°C) makes it robust for handling but unsuitable for gel extraction methods involving simple melting of the gel slice [17].
- Agarose LE (Low EEO): When your protocol requires superior resolution for accurate analysis or involves downstream blotting techniques (e.g., Southern or Northern blotting), Agarose LE is recommended. Its low electroendosmosis property ensures minimal band distortion and sharper bands, which is crucial for precise interpretation and efficient transfer in blotting procedures [17].
- Low-Melting Point (LMP) Agarose: This specialized agarose is engineered for preparative work. Its key feature is a much lower melting point (≤65°C), which allows the gel slice containing your DNA fragment to be melted at a temperature that does not denature the DNA itself. This liquid gel-DNA mixture can then be used directly in enzymatic reactions like ligation, restriction digestion, or labeling without the need for prior DNA purification. This streamlines workflows for cloning, probe preparation, and other applications where the DNA must be recovered and remain biologically active [19] [18].
Optimizing Agarose Concentration for DNA Fragment Size
The concentration of the agarose gel directly determines its pore size and, consequently, its resolving power for different DNA fragments. Selecting the wrong concentration can lead to poor separation, compromised resolution, or inability to distinguish bands of interest. The following table provides a guideline for choosing the optimal agarose concentration based on the expected size of your DNA fragments, particularly PCR products.
Table 2: Agarose Concentration Guidelines for DNA Fragment Separation
| Agarose Concentration (%) | Optimal DNA Fragment Separation Range (bp) | Common Application Examples |
|---|---|---|
| 0.5% - 0.8% | 1,000 - 10,000+ [20] | Genomic DNA, large plasmid digests |
| 0.8% - 1.0% | 500 - 8,000 [20] | Standard PCR product checking, plasmid linearization |
| 1.2% - 1.5% | 300 - 3,000 [20] | Most common range for analytical PCR products |
| 2.0% - 3.0% | 50 - 1,000 [20] | Small PCR products, multiplex PCR, amplicon sequencing libraries |
For the analysis of typical PCR products, which often range from 100 bp to 3,000 bp, agarose concentrations between 1.2% and 1.5% offer the best balance between resolution and gel strength. Lower percentages (e.g., 0.8%) are better for resolving larger fragments but provide poor separation for smaller products. Conversely, higher percentages (e.g., 2%) create tighter meshworks that optimally resolve small fragments but can cause larger DNA to migrate poorly or not at all [21] [20].
Detailed Experimental Protocols
Protocol 1: Analytical Gel Electrophoresis for PCR Product Verification
This protocol is designed for the rapid verification of PCR products using a standard or LE agarose gel, focusing on speed and clear visualization.
- Objective: To separate, visualize, and estimate the size of DNA fragments from a PCR reaction to confirm amplification success and specificity.
- Principle: DNA fragments are negatively charged and will migrate through an agarose gel matrix under an electric field. Separation occurs as smaller fragments move through the pores more easily than larger ones. A DNA ladder is run alongside for size comparison, and a fluorescent dye intercalated into the DNA allows visualization under UV light.
Table 3: Research Reagent Solutions for Analytical Gel Electrophoresis
| Reagent/Material | Function/Description | Example/Note |
|---|---|---|
| Agarose LE or Standard | Matrix for sieving DNA fragments by size. | Choose LE for superior resolution [17]. |
| 1x TAE Buffer | Running buffer providing ions for conductivity and maintaining pH. | Preferred for longer fragments and preparative gels; compatible with downstream enzymatic steps [21]. |
| DNA Loading Dye | Colored marker to visualize sample loading and migration; contains glycerol to make sample sink in well. | Contains dyes (e.g., bromophenol blue) that co-migrate with specific DNA sizes [21]. |
| DNA Ladder | Molecular weight standard with fragments of known sizes for calibrating the gel. | Essential for determining the size of PCR products. |
| Fluorescent Nucleic Acid Stain | Intercalates with DNA and fluoresces under UV light for visualization. | e.g., SYBR Safe, Ethidium Bromide [22]. |
Procedure:
- Prepare the Gel Solution: Weigh out the appropriate amount of agarose (refer to Table 2 for concentration) into a clean flask. For a mini-gel system, a 40 mL volume is typical. Add 1x TAE buffer to the flask to achieve the desired volume and concentration [22].
- Melt the Agarose: Heat the mixture in a microwave oven in short bursts (20-30 seconds), swirling gently between heats, until the agarose is completely dissolved and the solution is clear. Take care to avoid violent boiling and superheating. Let the solution cool on the bench until it is warm to the touch (approximately 50-60°C) [22].
- Add Stain and Cast the Gel: Once cooled, add the fluorescent stain (e.g., 4-6 µL of SYBR Safe per 40 mL gel) and mix gently to avoid introducing bubbles. Pour the molten agarose into a gel tray with the well comb in place. Allow the gel to solidify completely at room temperature for 20-30 minutes [22].
- Prepare Samples and Load the Gel: After solidification, carefully remove the comb and place the gel tray into the electrophoresis chamber. Fill the chamber with 1x TAE buffer until the gel is submerged under 3-5 mm of buffer. Mix your PCR samples with a 6x DNA loading dye to a final 1x concentration. Load 10-50 ng of DNA per band (e.g., 10-20 µL of a typical PCR reaction) into the wells. Load 3-5 µL of a DNA ladder into a separate well [22] [21].
- Run the Gel: Connect the electrodes (DNA migrates toward the positive anode/red electrode). Run the gel at 5-10 V/cm of gel length (e.g., 100-120 V for a standard mini-gel) until the dye front has migrated 50-75% down the gel [22].
- Visualize and Document: Carefully remove the gel from the tray and image it using a UV or blue light transilluminator with an appropriate imaging system [22].
Protocol 2: Preparative Gel Electrophoresis Using Low-Melting Point Agarose
This protocol is used when a specific DNA band needs to be excised from the gel for downstream applications like cloning or sequencing.
- Objective: To separate and cleanly recover a specific DNA fragment from a gel for use in downstream enzymatic applications.
- Principle: Low-melting point agarose allows for the gentle melting of the excised gel slice at lower temperatures (around 65°C) that do not harm the DNA. The molten gel mixture can then be used directly in enzymatic reactions or processed further for purification [18].
Procedure:
- Cast an LMP Agarose Gel: Follow the steps in Protocol 1, but substitute Low-Melting Point Agarose. Note that LMP agarose is often softer; handle the cast gel with extra care to avoid damage [18].
- Run and Visualize the Gel: Load and run the gel as described in Protocol 1. Use TAE buffer for running, as it is compatible with downstream enzymatic steps. After electrophoresis, visualize the gel on a UV transilluminator. To minimize DNA damage, use a low-intensity UV light and keep the exposure time as short as possible while still allowing you to identify the correct band.
- Excise the DNA Band: Using a clean, sharp scalpel or razor blade, carefully excise the gel slice containing your DNA band of interest. Work quickly and trim away as much excess agarose as possible.
- Purify DNA (Multiple Methods):
- Silica Column Method: Follow a commercial gel extraction kit protocol. This typically involves dissolving the gel slice in a chaotropic salt solution, binding the DNA to a silica membrane, washing away impurities, and eluting the pure DNA [23].
- Freezing and Precipitation Method: For a cost-effective, non-kit approach, place the gel slice in a microcentrifuge tube and freeze it completely (e.g., at -20°C for 20-30 minutes). Then, thaw the sample and centrifuge. This process disrupts the gel matrix, releasing the DNA into the supernatant, which can then be precipitated with ethanol [23].
- Direct Use in Enzymatic Reactions: Due to its low gelling temperature, the excised LMP agarose slice can be melted at 65°C for 5-10 minutes. Once liquefied and cooled to room temperature (or 37°C, depending on the enzyme), the DNA-containing solution can be used directly as a substrate in enzymatic reactions like ligation or restriction digestion, as the agarose remains liquid and does not inhibit the enzymes [18].
Troubleshooting and Pro Tips
Even with proper agarose selection, several factors can impact gel quality and results.
- Avoid the "Smiling" Effect: If DNA bands in the center lanes migrate faster than those on the sides, creating a crescent shape, this is often due to uneven heating from excessive voltage. Solution: Run the gel at a lower voltage. Also, ensure the electrophoresis apparatus is functioning correctly and all contacts are tight [21].
- Optimize DNA Loading Quantity: Overloading a well with too much DNA can cause band distortion, smearing, and anomalous migration, making the fragment appear larger than it is. Underloading will result in faint, undetectable bands. A good starting point is to load at least 20 ng of DNA per band for stains like SYBR Safe or ethidium bromide [21].
- Ensure Proper Buffer Volume: The gel must be fully submerged, but an excessive amount of buffer can decrease mobility and cause band distortion. Maintain a buffer level that covers the gel surface by 3-5 mm [21].
Agarose gel electrophoresis remains a cornerstone technique in molecular biology, leveraging its simplicity, low cost, and immediate qualitative feedback to maintain its status as the go-to method for the separation, purification, and semi-quantitative analysis of biomolecules like DNA and RNA [24]. This fundamental procedure exploits the negative charge of the phosphate backbone in nucleic acids. When an electric field is applied, these molecules migrate through a porous agarose matrix toward the positive electrode, separating by size as smaller fragments navigate the pores more easily than larger ones [25]. The concentration of agarose in the gel dictates the pore size, allowing researchers to optimize separation for specific fragment size ranges.
Despite the advent of more sophisticated technologies, the core principles of gel electrophoresis have remained unchanged for decades. However, its applications continue to evolve and expand across the scientific landscape. From basic academic research to advanced clinical diagnostics, agarose gel electrophoresis provides critical data that informs decision-making in experimental and development workflows. Recent advancements, including the integration of artificial intelligence for image analysis, are revitalizing this classic technique, enhancing its accuracy, throughput, and applicability in data-driven environments [24]. This application note details the specific protocols and quantitative applications of agarose gel electrophoresis across university laboratories, pharmaceutical R&D, and clinical diagnostics.
Application Note: Quantitative and Qualitative Analysis Across Sectors
University Labs: PCR Product Verification and DNA Fragment Analysis
In academic settings, agarose gel electrophoresis is primarily used for verifying the success and size of PCR products, checking cloning experiments, and analyzing general genetic variations [26]. The outcome is the visualization of clear, distinguishable bands that allow for rapid size estimation against a known DNA ladder.
Detailed Protocol for Routine DNA Analysis [22] [25]:
- Gel Preparation: Combine 1x TAE buffer and agarose powder in a flask to create a gel with a concentration appropriate for the expected DNA fragment sizes (e.g., 0.8% for standard PCR products). Microwave the mixture for 1.5-2 minutes, checking every 30 seconds to prevent boiling over, until the solution is clear and free of translucent pellets.
- Staining: Once the molten agarose has cooled below 60°C, add a fluorescent nucleic acid stain such as SYBR Safe at a 10,000X dilution (e.g., 6 µL for a 60 mL gel). Swirl to mix thoroughly.
- Casting: Pour the agarose into a casting tray with a comb inserted. Remove any bubbles with a clean pipette tip. Allow the gel to solidify for 15-20 minutes.
- Sample Preparation: Mix DNA samples with a 6X loading dye to a final concentration of 1X. Gently flick tubes to mix and centrifuge briefly to collect the contents.
- Electrophoresis: Place the solidified gel in a chamber filled with 1x TAE buffer. Load 3 µL of DNA ladder and the prepared samples into the wells. Run the gel at 100-150 V until the dye front has migrated a sufficient distance.
- Visualization: Image the gel using a UV transilluminator or a dedicated gel imaging system to visualize the DNA bands.
Table 1: Agarose Gel Concentrations for DNA Analysis [25]
| Agarose Percentage (%) | Optimal DNA Separation Range (base pairs) |
|---|---|
| 0.7 | 1,000 - 10,000 |
| 1.0 | 500 - 7,000 |
| 1.5 | 300 - 3,000 |
| 2.0 | 100 - 1,000 |
Pharmaceutical R&D: Protein-DNA Interaction Studies (EMSA)
In drug discovery and development, understanding gene regulation is paramount. The Electrophoretic Mobility Shift Assay (EMSA), performed with agarose gels, is a critical tool for analyzing protein-DNA interactions, such as those involving transcription factors, which are common drug targets [26] [27]. This assay detects binding by observing a "shift" in the migration of a DNA probe when it is bound by a protein.
Detailed Protocol for EMSA [27]:
- Reaction Setup: Prepare binding reactions in a final volume of 25 µL. Each reaction should contain:
- 0.2 nM of linearized, double-stranded DNA substrate.
- Varying concentrations of the intrinsically disordered protein region (IDR) or protein of interest (e.g., 0.1 - 0.4 µM). A high molar excess of protein to DNA is often required to visualize the shift.
- IDR Suspension Buffer (ISB) and 2X EMSA buffer to maintain consistent conditions. The optimized EMSA buffer includes components like NP-40 and β-Mercaptoethanol to prevent protein aggregation and stabilize interactions.
- Incubation: Incubate the reactions at room temperature to allow complex formation.
- Gel Electrophoresis: Load the entire reaction onto a pre-cast 0.8-1.5% agarose gel made with 1X TAE buffer. Run the gel at a low voltage (e.g., 5-6 V/cm) in a cold room or with cooling to maintain complex integrity until the dye front has adequately migrated.
- Visualization: Stain the gel with SYBR Gold or a similar stain and visualize under UV light. The free DNA will migrate faster, while the protein-bound DNA will be retarded in the well or appear as a higher molecular weight complex.
Table 2: Sample Setup for EMSA Binding Reactions [27]
| Binding Reaction | Final Protein Concentration (µM) | Volume of 5 µM IDR (µL) | Volume of ISB (µL) | Volume of 2X EMSA Buffer (µL) |
|---|---|---|---|---|
| 1 (Free DNA control) | 0 | - | 12.5 | 12.5 |
| 2 | 0.1 | 5 | 7.5 | 12.5 |
| 3 | 0.15 | 7.5 | 5.0 | 12.5 |
| 4 | 0.2 | 10 | 2.5 | 12.5 |
| 5 | 0.25 | 12.5 | - | 12.5 |
Clinical Diagnostics: Genotyping and GMO Detection
Clinical and quality control laboratories use agarose gel electrophoresis for genotyping, forensic analysis, and checking the purity of nucleic acid products [26]. A specific application is the detection of Genetically Modified Organisms (GMOs) in food products, which relies on PCR amplification of specific genetic markers followed by gel analysis.
Detailed Protocol for GMO Detection via DNA Extraction and PCR [28]:
- DNA Extraction from Oils: The primary challenge is obtaining sufficient quality DNA from lipid-rich samples. The manual hexane-based extraction method has been shown to overcome PCR inhibitors present in crude and refined oils (e.g., from soybean, maize, canola) better than commercial kits or CTAB methods.
- PCR Amplification: Conduct PCR using primers specific to genes identifying the oil type (e.g., Lectin for soybean) and primers for common transgenic elements (e.g., 35S promoter, NOs terminator).
- Gel Analysis: Analyze the PCR products on a 1.5-2% agarose gel. The presence of bands of the expected size in sample lanes, when compared to positive and negative controls, indicates the presence of the target organism and its transgenic status.
Diagram 1: GMO Detection Workflow
The Scientist's Toolkit: Essential Research Reagent Solutions
Table 3: Key Reagents for Agarose Gel Electrophoresis
| Reagent/Material | Function | Specific Examples |
|---|---|---|
| Agarose Powder | Forms the porous gel matrix that acts as a molecular sieve for separation. | Invitrogen UltraPure Agarose [27] |
| Electrophoresis Buffer | Provides the conductive medium and maintains stable pH for nucleic acid migration. | Tris-Acetate-EDTA (TAE), Tris-Borate-EDTA (TBE) [25] |
| DNA/RNA Ladders | Contains nucleic acid fragments of known sizes for estimating the size of unknown samples. | FroggaBio 1 kb DNA Ladder, NEB 1kb Plus Ladder [22] [27] |
| Nucleic Acid Stain | Intercalates with DNA/RNA, allowing visualization under specific light. | SYBR Safe DNA Gel Stain, SYBR Gold [22] [27] |
| Loading Dye | Contains a dense agent to sink samples into wells and tracking dyes to monitor migration. | Gel Loading Dye, Purple (6X) [22] |
| Restriction Enzymes | Used to cut DNA into specific fragments for analysis (e.g., in RFLP). | EcoRI-HF [27] |
Advanced Data Analysis: The Rise of AI in Gel Quantitation
Traditional gel image analysis relies on manual inspection or semi-automated software to extract lane profiles and identify bands, a process prone to subjectivity and inconsistency [24]. A groundbreaking shift is occurring with the introduction of AI-powered tools like GelGenie, an open-source application that uses a U-Net model trained on over 500 manually-labelled gel images [24].
This AI framework performs segmentation, classifying each pixel in a gel image as 'band' or 'background'. This method bypasses the limitations of reducing a lane to a 1D intensity profile, leading to superior band identification in sub-optimal conditions like high background, warped bands, or faint signals. In quantitative tests, GelGenie matched the accuracy of established software like GelAnalyzer but with significantly improved speed, consistency, and ease of use, requiring no expert knowledge [24]. This allows for reproducible, high-throughput analysis suitable for all research and diagnostic settings.
Diagram 2: AI-Based Gel Analysis
Step-by-Step Protocol: Optimizing Agarose Gel Electrophoresis for PCR Products
Within the broader context of agarose gel electrophoresis for PCR product analysis research, the preparation and casting of the gel constitute the foundational step that determines the success of the entire experiment. Agarose gel electrophoresis is a standard molecular biology technique used to separate and visualize DNA fragments by size [29]. The concentration of agarose in the gel directly controls the size of the pores in the matrix, which in turn dictates the range of DNA fragment sizes that can be effectively resolved [30]. For routine analysis of PCR products, typically ranging from a few hundred to a few thousand base pairs, agarose concentrations between 1.0% and 1.5% are most commonly employed [29] [30]. This application note provides a detailed protocol and critical considerations for calculating agarose concentration and executing reliable gel casting techniques, ensuring high-quality data for researchers and drug development professionals.
The Fundamentals of Agarose Concentration
The percentage of an agarose gel is defined as a weight/volume ratio, meaning a 1% gel contains 1 gram of agarose powder dissolved in 100 mL of buffer [30]. The concentration of agarose is the most critical variable affecting the separation of DNA fragments.
Choosing the Correct Agarose Percentage
The following table summarizes the effective separation ranges for standard agarose gel percentages, guiding the selection for expected PCR product sizes.
Table 1: Agarose Gel Percentage and DNA Fragment Separation Range
| Agarose Gel Percentage | Effective Separation Range (base pairs) |
|---|---|
| 0.5% | 2,000 – 50,000 |
| 1.0% | 400 – 8,000 |
| 1.5% | 200 – 3,000 |
| 2.0% | 100 – 2,000 |
For routine analysis of standard PCR products, a 1.0% to 1.5% gel offers an optimal balance [29] [30]. A 1.0% gel provides excellent separation for larger fragments within its range (e.g., 1,500-8,000 bp), while a 1.5% or 2.0% gel is superior for resolving smaller fragments (e.g., 200-500 bp) [30]. Higher percentage gels create a denser mesh with smaller pores, which is better for resolving smaller DNA fragments but also increases run time and gel fragility [30]. Conversely, lower percentage gels, with their larger pores, are ideal for separating very large DNA fragments but are more prone to tearing [30].
Figure 1: Decision workflow for selecting agarose gel percentage based on target DNA fragment size.
Detailed Protocol: Casting a Standard Agarose Gel
Reagents and Equipment
Table 2: Research Reagent Solutions and Essential Materials
| Item | Function/Description |
|---|---|
| Agarose Powder | Polysaccharide derived from seaweed that forms the porous gel matrix for DNA separation [30]. |
| Electrophoresis Buffer (TAE or TBE) | Provides the conductive medium for electrophoresis. TAE (Tris-acetate-EDTA) is common; TBE (Tris-borate-EDTA) offers better resolution for smaller fragments [30] [31]. |
| DNA Stain (e.g., RED Safe, EtBr, GelGreen) | Intercalates with DNA to allow visualization under UV light [29] [31]. EtBr is a known mutagen and requires careful handling [31]. |
| Loading Dye/Buffer | Contains a dense agent (e.g., glycerol) to help samples settle in wells and tracking dyes to monitor migration progress [31]. |
| Microwave/Hot Plate | To dissolve agarose powder completely in buffer [31]. |
| Gel Casting Tray & Comb | The mold and well former for creating the gel and sample lanes [31]. |
Step-by-Step Gel Casting Procedure
The following workflow outlines the key steps in preparing and running an agarose gel.
Figure 2: Agarose gel preparation and electrophoresis workflow.
Calculate and Weigh Agarose: For a standard 1% gel, measure 1 g of agarose powder for every 100 mL of 1x electrophoresis buffer (TAE or TBE) required to fill the casting tray [31]. Adjust the mass proportionally for other percentages (e.g., 1.5 g for a 1.5% gel in 100 mL) [31].
Dissolve Agarose: Mix the agarose powder with the appropriate volume of 1x buffer in a microwavable flask [31]. Safety Note: The flask will become hot.
- Microwave the mixture for 1-3 minutes, pausing to swirl periodically, until the agarose is completely dissolved and the solution appears clear with no suspended particles [31]. To prevent evaporative loss and boil-overs, use short heating pulses and avoid over-boiling.
Cool the Solution: Allow the dissolved agarose to cool on the bench until the flask is comfortable to touch (approximately 50°C) [31]. This step is crucial to prevent warping of the casting tray and to minimize evaporation from the heat when pouring.
Add Nucleic Acid Stain: Once cooled, add the appropriate DNA stain according to the manufacturer's instructions. For example, if using ethidium bromide (EtBr), add it to a final concentration of 0.2-0.5 μg/mL (typically 2-3 μL of a 10 mg/mL stock per 100 mL gel) [31]. Safety Note: EtBr is a known mutagen. Always wear appropriate personal protective equipment (PPE) including a lab coat, gloves, and safety goggles when handling [31].
Pour the Gel:
- Seal the ends of the gel casting tray as per the manufacturer's instructions.
- Place a well comb into the tray, ensuring it is positioned about 0.5-1.0 mm above the tray surface to prevent the bottom of the wells from being too thin and tearing.
- Slowly pour the cooled agarose solution into the casting tray. To avoid bubbles, pour steadily. If bubbles form, they can be nudged to the side of the tray using a pipette tip [31].
Gel Solidification: Let the gel stand at room temperature for 20-30 minutes until it has solidified completely [31]. The gel will become opaque and firm to the touch. For faster solidification, the sealed casting tray can be placed at 4°C for 10-15 minutes [31].
Alternative Casting Techniques
Beyond the traditional method using raw powder, simplified alternatives exist:
- Agarose Tabs: Pre-measured tabs containing agarose allow users to avoid weighing powder but still require the addition of buffer and stain, offering a balance between convenience and flexibility [32].
- All-in-One Agarose Tabs: These tabs contain agarose, buffer, and stain, requiring only dissolution in water and heating. This is the most convenient method but may conceal parts of the process for educational purposes [32].
Troubleshooting and Optimization
- Poor Band Resolution: For crisper bands, consider running the gel at a lower voltage for a longer period, using a wider/thinner comb, or loading less DNA [31]. Overloading the well is a common cause of smeared or blurry bands [30].
- Gel Does not Set: This is typically due to inaccurate measurement of agarose powder or buffer volume. Always double-check calculations and ensure the powder was fully dissolved before pouring.
- Bands are Too Close Together: Adjust the agarose percentage. Use a higher percentage to better separate smaller bands and a lower percentage to resolve larger bands [31].
- Fragile Gels: Lower percentage gels are inherently more prone to tearing. Using a higher percentage (e.g., 2%) can be helpful for those new to the technique [30].
Within the framework of research on agarose gel electrophoresis for PCR product analysis, the sample preparation stage is a critical determinant of experimental success. The accuracy of downstream analyses, including fragment sizing and purity assessment, hinges on the precise preparation of DNA samples prior to loading. This application note details evidence-based protocols for determining optimal DNA quantities and selecting appropriate loading dyes to ensure high-resolution separation and clear visualization of PCR products. Adherence to these guidelines is fundamental for obtaining reliable and reproducible data in molecular biology research and drug development workflows.
Determining Optimal DNA Loading Quantities
Loading an optimal amount of DNA is crucial for achieving sharp, well-defined bands. Underloading can result in faint bands that are difficult or impossible to visualize, while overloading can cause smearing, distorted band shapes, and poor resolution [33].
Quantitative Guideline
A general recommendation for optimal DNA loading is 0.1–0.2 μg of DNA per millimeter of gel well width [33]. This quantitative rule helps ensure that the sample volume is appropriate for the well capacity, minimizing diffusion and preventing overloading.
Practical Considerations for Sample Volume
In practice, the total sample volume loaded into a well must also be managed. The sample volume should fill at least 30% of the well's capacity to avoid band distortion during loading, but should not overflow the well [33]. For standard mini-gel systems, this typically translates to a loading volume of 20-25 μL.
Composition and Selection of DNA Loading Dyes
Loading dyes are dense, colored solutions mixed with DNA samples prior to loading. They serve two primary functions: (1) providing visual tracking of migration progress during electrophoresis, and (2) increasing the density of the sample to ensure it settles evenly at the bottom of the well [31].
Key Components of Loading Dyes
- Density Agents: Compounds such as glycerol, Ficoll, or sucrose give the solution higher density than the electrophoresis buffer, preventing sample diffusion into the buffer.
- Tracking Dyes: Small, colored molecules (e.g., bromophenol blue, xylene cyanol) migrate at predictable rates through the gel, allowing researchers to monitor run progress.
- Staining Dyes (Optional): Modern "loading dye-type" DNA-staining reagents, such as Midori Green Direct and Safelook Load-Green, combine the loading function with safe, non-mutagenic DNA staining, simplifying the workflow [34] [35].
Selecting a Compatible Loading Dye
The choice of loading dye should be compatible with the nucleic acid type and experimental goals.
- Double-stranded DNA: Use standard loading dyes without denaturants. Avoid heating samples unless specifically required [33].
- Single-stranded Nucleic Acids (e.g., RNA): Use a loading dye containing a denaturant (e.g., formamide, SDS) and heat the sample before loading to prevent formation of secondary structures [33].
- Downstream Applications (e.g., Sequencing): If the PCR product is intended for sequencing, use a staining dye that will not interfere. For example, SYBR Green DNA stain is noted to interfere with sequencing reactions and should not be added to the entire PCR product sample [36].
Research Reagent Solutions: Essential Materials
The table below catalogs key reagents essential for preparing DNA samples for agarose gel electrophoresis.
| Reagent Name | Function/Brief Explanation |
|---|---|
| NEB 6× Purple Loading Dye | A common loading dye containing Ficoll (density agent); provides sharp bands and contains SDS to remove DNA-bound proteins [37]. |
| Midori Green Direct | A non-mutagenic, loading dye-type DNA-staining reagent; excited by blue/cyan LED light (~490 nm) and emits green fluorescence [34] [35]. |
| Safelook Load-Green | Another non-mutagenic, loading dye-type reagent; properties similar to Midori Green Direct [35]. |
| EZ-Vision One | A non-mutagenic, loading dye-type reagent; excited by longer-wave UV light (~365 nm, "black light") and emits blue fluorescence [35]. |
| SYBR Safe | A major nontoxic, post-electrophoresis DNA-staining reagent; can also be used with the cyan LED detection system [35]. |
| Ethidium Bromide | A traditional, high-sensitivity DNA intercalating dye; a known mutagen that requires careful handling and short-wave UV light for visualization [34] [31]. |
| 1Kb Plus DNA Ladder | A collection of DNA fragments of known lengths; essential for determining the approximate size of DNA fragments in sample lanes [37]. |
| No-SDS Loading Dye | A specialized loading dye lacking SDS; recommended for preparing DNA ladders when using safe stains to prevent smearing and maintain band sharpness [37]. |
Integrated Experimental Workflow: From Sample to Image
The following diagram illustrates the complete workflow for preparing and analyzing DNA samples on an agarose gel, integrating the key concepts of quantification and dye selection.
Step-by-Step Protocol for Sample Preparation and Loading
Sample Preparation with Loading Dye
- Quantify DNA: Determine the concentration of your PCR product using a spectrophotometer or fluorometer.
- Calculate Volume: Based on the DNA concentration and the well width of your gel, calculate the volume required to load 0.1–0.2 μg of DNA per mm of well width [33]. For a standard 5-mm wide well, this equates to 0.5–1.0 μg of DNA total.
- Mix with Loading Dye: Combine the calculated DNA volume with the appropriate loading dye. A typical ratio is 1 volume of 6x dye to 5 volumes of DNA sample [36]. Mix thoroughly by pipetting or gentle vortexing.
- Denature if Required: For RNA or single-stranded DNA applications, heat the sample-dye mixture at 65–70°C for 5 minutes, then place immediately on ice to prevent secondary structure formation [33]. Skip this step for standard double-stranded DNA analysis.
Gel Loading and Electrophoresis
- Prepare Gel: Submerge the solidified agarose gel in the electrophoresis chamber filled with the appropriate running buffer (e.g., 1x TAE or TBE), covering the gel with ~2–3 mm of buffer [38] [31].
- Load Marker and Samples:
- Load a DNA ladder (e.g., 5-20 μL depending on well size and ladder concentration) into the first well [31] [37].
- Load your prepared samples into subsequent wells.
- Pipetting technique: Use steady pressure to expel the sample. Place the pipette tip just above the well and slowly dispense, watching the sample settle at the bottom. Avoid introducing bubbles or puncturing the well bottom [33] [31].
- Run Electrophoresis: Close the lid and connect the electrodes (DNA migrates toward the positive anode). Run the gel at a voltage suitable for the gel size and concentration (e.g., 80-150 V). Monitor the migration of the tracking dyes to determine when to stop the run [31].
- Visualize: After electrophoresis, visualize the DNA fragments using an appropriate light source (e.g., UV transilluminator, blue light, or "black light") that matches the excitation wavelength of the DNA stain used [34] [35].
Troubleshooting Common Issues
Despite careful preparation, issues can arise. The table below links common gel problems directly to potential errors in sample preparation.
| Problem | Possible Cause Related to Sample | Recommended Solution |
|---|---|---|
| Faint or No Bands | Low quantity of loaded DNA [33]. | Increase the amount of DNA loaded within the 0.1–0.2 μg/mm guideline. |
| Smeared Bands | Sample overloading [33]; DNA degradation; high salt concentration in sample buffer. | Reduce the amount of DNA loaded. Ensure nuclease-free techniques and reagents. Dilute or purify sample in nuclease-free water to remove excess salt. |
| Poorly Separated Bands | Sample overloading; incorrect gel percentage for fragment size [33]. | Reduce DNA load. Use a higher percentage agarose gel for smaller fragments and a lower percentage for larger fragments. |
| U-shaped or Warped Bands | Sample overloading [33]; well damaged during loading. | Load less DNA. Take care not to puncture the well with the pipette tip. |
| Bands in Wrong Location | Use of denaturing dye/conditions with dsDNA, or vice-versa [33]. | For dsDNA, use standard dye and do not heat. For RNA/ssDNA, use a denaturing dye and heat the sample. |
Meticulous preparation of DNA samples, characterized by the precise application of the 0.1–0.2 μg per mm well width guideline and the informed selection of compatible loading dyes, is a foundational practice in agarose gel electrophoresis. By integrating these quantitative principles with the operational protocols outlined herein, researchers can significantly enhance the quality, reliability, and interpretability of their PCR product analyses, thereby strengthening the overall validity of their scientific findings.
Agarose gel electrophoresis is a foundational technique in molecular biology, critical for the separation, visualization, and analysis of DNA fragments, including PCR products. Within the context of PCR product analysis for drug development research, the reliability of results is paramount. The conditions under which electrophoresis is performed—specifically the buffer system, applied voltage, and run time—directly influence the resolution, sharpness, and accurate sizing of DNA bands. Suboptimal conditions can lead to band artifacts, poor separation, and inconclusive data, ultimately compromising downstream applications. This application note provides a detailed, evidence-based protocol for optimizing these key parameters, focusing on the commonly used voltage range of 110-130V, to ensure reproducible, high-quality results for research and diagnostic professionals.
The Scientist's Toolkit: Essential Reagents and Materials
The following table catalogues the essential materials required for the electrophoresis protocols described in this document.
Table 1: Key Research Reagent Solutions for Agarose Gel Electrophoresis
| Item | Function/Description | Key Considerations |
|---|---|---|
| Agarose LE | Forms the porous gel matrix that separates DNA fragments by size. | High-quality, low EEO (Electroendosmosis) agarose is recommended for superior resolution [39]. |
| TAE Buffer (1X) | Conducts current and maintains stable pH during electrophoresis. | 40 mM Tris, 20 mM acetic acid, 1 mM EDTA [40]. Preferred for longer DNA fragments and preparative gels [21]. |
| TBE Buffer (1X) | Conducts current and maintains stable pH. | ~89 mM Tris, ~89 mM boric acid, 2 mM EDTA [40]. Provides better resolution for small DNA fragments (<1 kb) [21]. |
| DNA Loading Dye | Adds density to samples for well loading and provides visual tracking of migration progress. | Contains agents like Ficoll or glycerol, and tracking dyes (e.g., bromophenol blue) [39] [31]. |
| DNA Ladder | Provides a reference for estimating the size of unknown DNA fragments. | Choose a ladder with bands covering the expected size range of your PCR products [21]. Chromatography-purified ladders are recommended for clean, sharp bands. |
| Ethidium Bromide | Fluorescent dye that intercalates with DNA for visualization under UV light. | A known mutagen; handle with appropriate personal protective equipment (PPE) [31]. Alternatives like SYBR Safe or SYBR Gold are available. |
| Horizontal Gel Electrophoresis System | Apparatus consisting of a gel tray, comb, and tank. | Mini-gel systems (e.g., 8 x 10 cm) are common for rapid analysis [31]. Ensure the tank is clean and electrodes are intact to prevent uneven fields [21]. |
Core Principles and Optimization Data
Buffer System Selection: TAE vs. TBE
The choice of buffer is a primary determinant in the success of electrophoresis. The two standard buffers, TAE and TBE, have distinct properties that make them suitable for different applications.
Table 2: Comparative Analysis of TAE and TBE Buffer Systems
| Parameter | TAE Buffer | TBE Buffer |
|---|---|---|
| Full Name | Tris-Acetate-EDTA | Tris-Borate-EDTA |
| Standard 1X Composition | 40 mM Tris, 20 mM acetic acid, 1 mM EDTA [40] | ~89 mM Tris, ~89 mM boric acid, 2 mM EDTA [40] |
| Recommended Fragment Size | Longer fragments (>1 kb); better resolution for large DNA [21]. | Smaller fragments (<1 kb); superior separation of short DNA [21]. |
| Relative Migration Speed | Faster migration of linear DNA [21]. | ~10% slower migration compared to TAE [21]. |
| Buffering Capacity | Lower; may not be suitable for very long runs [21]. | Higher; more stable for extended electrophoresis times [21]. |
| Compatibility | Compatible with enzymatic reactions post-electrophoresis (e.g., gel extraction for cloning) [21]. | Borate can inhibit enzymatic reactions; not ideal for subsequent enzymatic steps [21]. |
| Key Consideration | Ideal for preparative gels and resolution of large PCR products. | Best for analytical gels where high resolution of small PCR products is critical. |
Voltage and Run Time Optimization (110-130V Range)
The applied voltage governs the speed of DNA migration and the generation of heat. The common voltage setting of 110-130V is appropriate for a standard mini-gel system (e.g., with a 10 cm gel length). However, the optimal setting within this range depends on the desired balance between speed and resolution.
- General Guideline: A standard recommendation is to use 5-10 V per centimeter of distance between the electrodes [41]. For a typical mini-gel with a 10 cm electrode distance, this translates to 50-100V. The 110-130V range is at the higher end of this spectrum, leading to faster run times.
- Voltage vs. Resolution: Higher voltages (e.g., 130V) cause DNA to migrate faster but can generate significant heat. This heat can lead to band artifacts like "smiling" (where bands in center lanes curve upwards) and poor resolution, especially if the gel cooling system is inefficient [21] [40]. Lower voltages provide better resolution and are recommended for separating large DNA fragments (>1.5 kb) [41].
- Run Time: At 110-130V, a standard 1% agarose mini-gel typically runs for 1-1.5 hours, or until the leading dye front has migrated 75-80% of the way down the gel [31]. Precise run time should be determined by monitoring the migration of the loading dye, not by time alone.
- Current and Heat Management: The electrical current is strongly dependent on the buffer volume and composition. Using thinner gels and minimizing the height of the buffer covering the gel (e.g., 2-3 mm instead of 6 mm) can significantly reduce current and heating, allowing for more stable operation at higher voltages [40].
Table 3: Voltage Optimization Guide for PCR Product Analysis
| Experimental Goal | Recommended Voltage | Estimated Run Time (Mini-gel) | Protocol Notes |
|---|---|---|---|
| Rapid Analysis of Small Fragments (<1 kb) | 130 V | 30-60 minutes | Use TBE buffer for best resolution. Ensure gel is fully submerged in buffer to prevent overheating [21]. |
| Standard Resolution of Mixed Fragments (0.5-3 kb) | 110-120 V | 1-1.5 hours | Compatible with both TAE and TBE. A robust default for most PCR product checks. |
| High Resolution of Large Fragments (>3 kb) | 100 V or lower | 1.5+ hours | Use TAE buffer. Lower voltage and longer run time minimizes band distortion and smiling [41] [21]. |
| SURE Electrophoresis for Dilute Samples | 6 V/cm (e.g., ~84 V for 14 cm gel) | Brief pulses (20-40 sec) between loadings [39] | A specialized method for concentrating dilute DNA directly in the gel well. Not for standard analysis [39]. |
Detailed Experimental Protocols
Protocol 1: Standard Agarose Gel Electrophoresis for PCR Product Analysis
This protocol is designed for the routine analysis of PCR products to confirm amplicon size and purity.
Workflow Overview:
Materials:
- Reagents listed in Table 1.
- PCR samples.
- Microwave or hot plate.
- Gel casting tray and comb.
- Power supply.
Method:
- Prepare Agarose Gel:
- For a 1% gel, weigh 1 g of agarose and add it to 100 mL of 1X TAE or TBE buffer in a microwavable flask [31].
- Heat the mixture in a microwave until the agarose is completely dissolved, swirling intermittently to ensure even heating. Let the solution cool to approximately 50°C (comfortable to touch) [31].
Cast the Gel:
- Seal the ends of the gel casting tray. Place the well comb in position.
- Optional: Add a fluorescent DNA stain like ethidium bromide to the cooled agarose solution (e.g., 2-3 µL of 10 mg/mL stock per 100 mL gel) [31]. Caution: Ethidium bromide is a mutagen.
- Pour the molten agarose into the tray, avoiding bubbles. Allow the gel to solidify completely at room temperature for 20-30 minutes [31].
Load Samples and Ladder:
- Mix each PCR sample with a DNA loading dye (e.g., 5 µL dye per 25 µL sample) [31].
- Place the solidified gel into the electrophoresis chamber and fill the chamber with the same 1X buffer used to prepare the gel, covering the gel by 3-5 mm [21] [40].
- Carefully load the DNA ladder into the first lane. Load the prepared samples into subsequent wells.
Run Electrophoresis:
Stain and Visualize:
- If stain was not included in the gel, carefully transfer the gel to a staining solution containing ethidium bromide (0.5 µg/mL) for 10-20 minutes, followed by destaining in water if needed [39] [31].
- Visualize the DNA bands using a UV transilluminator or blue light system. Wear appropriate PPE for UV light.
Protocol 2: SURE Electrophoresis for Concentrating Dilute PCR Samples
The Successive Reloading (SURE) electrophoresis method is invaluable for visualizing DNA from highly dilute samples, a common challenge in downstream PCR applications [39].
Workflow Overview:
Materials:
- Standard electrophoresis materials (see Protocol 1).
- Dilute DNA sample(s).
Method:
- Sample Preparation: Mix your dilute DNA sample with an appropriate loading dye. Ensure the sample is in a low-EDTA or EDTA-free solution like TE or water for optimal stacking [39].
- Initial Loading: Load a volume that is less than the total well capacity (e.g., 25 µL for a 35 µL well) slowly into the well [39].
- Voltage Pulse: Immediately connect the power supply and apply a voltage of ~6 V/cm (e.g., ~84 V for a 14 cm gel) for a brief pulse of 20-40 seconds. This stacks the DNA at the gel interface [39].
- Successive Reloading: Turn off the power. Load another identical aliquot of the same sample into the same well. Repeat the voltage pulse. This cycle can be repeated multiple times (e.g., 6-20 times) to concentrate a large total volume (up to 800 µL) into a single, sharp band [39].
- Final Electrophoresis: After the final loading and pulse, continue electrophoresis at a standard voltage (e.g., 130 V) until the tracking dye has migrated an appropriate distance down the gel.
- Stain and Visualize: Proceed with staining and visualization as described in Protocol 1. The concentrated band will be significantly more intense than what would be achievable from a single loading.
Advanced Optimization and Troubleshooting
Troubleshooting Common Issues
- "Smiling" Bands (Bands Curve Upwards): Caused by uneven heating, often from excessively high voltage. Solution: Reduce the voltage, ensure the electrophoresis tank is on a level surface, and check for loose contacts in the tank [21].
- Poor Band Resolution: Solution: Optimize the agarose concentration for the fragment size (e.g., 1.5-2% for small fragments <500 bp). Ensure the correct buffer is used (TBE for small fragments). Run the gel at a lower voltage for a longer time to improve separation [31] [21].
- Faint or No Bands: Solution: Increase the amount of DNA loaded. For ethidium bromide, load at least 20 ng of DNA per band; for more sensitive stains like SYBR Gold, 1 ng per band may suffice [21]. For very dilute samples, employ the SURE electrophoresis protocol [39].
- Melting or Distortion of Gel: Solution: Ensure the gel is fully submerged in running buffer, but avoid an excessive buffer height which increases current and heat [40]. Use a buffer with lower ionic strength or run at a lower voltage.
Advanced Technical Considerations
- Buffer Modification: Recent studies show that modifying the standard buffer formulations can improve performance. For instance, reducing the concentration of EDTA (a conductive component) and optimizing Tris/acid concentrations can lower electrical current, allowing the use of higher voltages (e.g., 20-25 V/cm) without excessive heating, thereby reducing run times by up to 3-fold while improving the resolution of small nucleic acids [40].
- AI-Powered Analysis: For high-throughput or highly quantitative work, consider leveraging new software tools. AI-based systems like GelGenie can automatically and accurately identify bands in gel images through segmentation, surpassing the capabilities of traditional analysis software in both ease-of-use and versatility [24].
Within the broader scope of thesis research on agarose gel electrophoresis for PCR product analysis, the selection of an appropriate nucleic acid stain is a critical methodological consideration that impacts data quality, safety, and downstream application success. While ethidium bromide (EtBr) has been a traditional mainstay, its well-documented mutagenicity and handling hazards have driven the development of safer, high-performance alternatives [42] [43]. This application note provides a detailed comparative analysis of three prominent stains—Erythrosin B (EB), SYBR Safe, and GelRed—framed within the context of post-PCR amplification analysis. We summarize key performance characteristics in structured tables and provide optimized experimental protocols to guide researchers and drug development professionals in selecting and implementing the most suitable staining method for their specific workflows.
Comparative Stain Analysis and Selection Guide
The optimal stain for visualizing PCR amplicons depends on a balance of sensitivity, safety, cost, and compatibility with available imaging systems. The following section provides a quantitative comparison and guidance for selection.
Table 1: Quantitative Comparison of Nucleic Acid Stains for PCR Product Analysis
| Parameter | Erythrosin B (EB) | SYBR Safe | GelRed |
|---|---|---|---|
| Staining Mechanism | Chromogenic; membrane impermeant dye [44] | Fluorescent; intercalates into DNA [42] | Fluorescent; bis-intercalates into DNA [43] |
| Primary Excitation (nm) | Brightfield (visible spectrum) [44] | ~280 (UV), ~502 (Blue light) [45] | ~279 (UV) [43] |
| Primary Emission (nm) | N/A (Red color) [44] | ~530 [46] | ~600 [43] |
| Sensitivity (dsDNA) | Information Missing | ~0.5 ng/band [45] (similar to EtBr) | High (specific data missing; described as high-affinity) [43] |
| Mutagenicity/Toxicity | Low cytotoxicity [44] | Non-mutagenic in mammalian cell assays; less hazardous than EtBr [42] [47] | Non-mutagenic (Ames test); designed to prevent cell membrane penetration [43] |
| Optimal Imaging Mode | Brightfield/Automated image-based counters [44] | Blue-light or UV transilluminator [45] | UV transilluminator [43] |
| Key Advantage | Low toxicity; no fluorescence equipment needed [44] | Safer profile; improved cloning efficiency with blue light [42] [45] | High binding affinity and safety profile; red emission [43] |
| Key Limitation | Not suitable for fluorescence-based detection [44] | Sensitivity lower than SYBR Gold [47] | Higher initial cost [43] |
Table 2: Stain Compatibility with Downstream Applications
| Application | Erythrosin B (EB) | SYBR Safe | GelRed |
|---|---|---|---|
| Routine PCR Verification | Limited application | Excellent [45] | Excellent [43] |
| Gel Purification/Cloning | Not recommended | Excellent (especially with blue light) [42] [45] | Excellent [43] |
| DNA Quantification | Not suitable | Good (linear range similar to EtBr) | Good (high affinity) [43] |
| ssDNA/RNA Staining | Not suitable | Yes (with reduced sensitivity vs. dsDNA) [47] | Information Missing |
The following decision pathway provides a logical framework for selecting the most appropriate stain based on experimental priorities:
Detailed Experimental Protocols
Protocol 1: In-Gel Staining with SYBR Safe DNA Gel Stain
Principle: SYBR Safe stain is incorporated directly into the molten agarose gel before casting and electrophoresis. Upon binding to DNA, its fluorescence increases dramatically, allowing for visualization post-run [46] [45].
Materials:
- SYBR Safe DNA Gel Stain (10,000X concentrate in DMSO) [46]
- Agarose powder
- 1X TAE or TBE electrophoresis buffer
- Microwave or hot plate
- Gel casting tray and comb
- Blue-light or UV transilluminator [45]
Procedure:
- Prepare Agarose Gel: Dissolve the appropriate amount of agarose powder in 1X TAE or TBE buffer to create a solution of the desired percentage (e.g., 1-2% for standard PCR product separation).
- Add SYBR Safe Stain: Microwave the solution until the agarose is completely dissolved. Allow the solution to cool slightly (to ~50-60°C). Add 1 µL of the 10,000X SYBR Safe concentrate for every 10 mL of molten agarose gel solution (i.e., a 1:10,000 dilution) [45]. Swirl gently to mix thoroughly. Note: The stain can be briefly microwaved with no loss of performance if the gel solidifies during handling [45].
- Cast the Gel: Pour the stained agarose solution into the casting tray with the comb in place. Allow the gel to solidify completely at room temperature.
- Electrophoresis: Place the gel in the electrophoresis tank filled with 1X TAE or TBE running buffer. Load DNA samples mixed with an appropriate loading dye. Run the gel at a constant voltage (e.g., 5-10 V/cm of gel length) until the dyes have migrated sufficiently.
- Visualization: Image the gel directly on a blue-light transilluminator for the highest cloning efficiency, or on a standard UV transilluminator. Use appropriate emission filters for optimal detection [45].
Protocol 2: Post-Staining with GelRed
Principle: The gel is immersed in a dilute aqueous solution of GelRed after electrophoresis. The dye penetrates the gel and binds to nucleic acids, producing a strong fluorescent signal [43].
Materials:
- GelRed Nucleic Acid Gel Stain (10,000X in water) [43]
- 1X TAE or TBE electrophoresis buffer
- Staining container (e.g., a small tray)
- Platform shaker (optional)
- UV transilluminator
Procedure:
- Electrophoresis: Prepare and run an unstained agarose gel as described in Protocol 1, steps 1, 3, and 4.
- Prepare Staining Solution: Dilute the GelRed 10,000X stock solution to a 1X final working concentration in 1X TAE or TBE buffer. For example, add 5 µL of stock to 50 mL of buffer for a mini-gel [43].
- Stain the Gel: Carefully transfer the gel from the electrophoresis tray to a clean container containing the diluted GelRed stain. Ensure the gel is fully submerged.
- Incubate: Allow the gel to stain with gentle agitation (e.g., on a platform shaker) for 15-30 minutes at room temperature. Staining can be performed in light-protected conditions, but extended exposure is required for significant signal loss.
- Destain (Optional): For lower background, transfer the gel to clean water or buffer and destain for 5-10 minutes.
- Visualization: Image the gel on a UV transilluminator. Due to its red emission (~600 nm), ensure your gel documentation system is equipped with appropriate filters [43].
The Scientist's Toolkit: Essential Research Reagent Solutions
Successful nucleic acid visualization requires a suite of reliable reagents and equipment. The following table details key materials for the featured staining protocols.
Table 3: Essential Reagents and Equipment for Nucleic Acid Visualization
| Item | Function/Description | Example/Catalog Number |
|---|---|---|
| SYBR Safe DNA Gel Stain | A non-mutagenic, safer alternative to EtBr for in-gel or post-staining; excited by blue or UV light [42] [46]. | Invitrogen S33102 [46] |
| GelRed Nucleic Acid Gel Stain | A high-affinity, non-mutagenic dye that bis-intercalates into DNA; requires UV excitation and emits red fluorescence [43]. | Biotium 41003 [43] |
| Erythrosin B (EB) | A low-cytotoxicity chromogenic dye for brightfield imaging; stains cells red based on membrane integrity [44]. | Logos Biosystems L13002 [44] |
| Blue-Light Transilluminator | A safe and effective light source for visualizing SYBR Safe-stained DNA; minimizes DNA damage, improving downstream cloning efficiency [42] [45]. | Safe Imager Blue-Light Transilluminator [45] |
| Agarose | A polysaccharide polymer used to form the sieving matrix for electrophoresis of nucleic acids. | Standard Low EEO Agarose |
| Electrophoresis Buffer | Provides the ionic environment and conductivity necessary for DNA migration during electrophoresis. | 1X TAE or 1X TBE |
| DNA Loading Dye | A colored, dense solution mixed with DNA samples to track migration progress and ensure samples sink into wells. | - |
| DNA Ladder | A molecular weight standard containing DNA fragments of known sizes, used to estimate the size of unknown DNA fragments. | - |
Detection and Imaging Best Practices
Proper visualization is the final critical step. The compatibility of your stain with the detection system directly impacts sensitivity and data quality, as illustrated below.
Key Imaging Considerations:
- Filter Compatibility: Using the correct emission filter is paramount. SYBR Safe has an emission maximum of ~530 nm (green) and requires a filter appropriate for FITC or SYBR Green I. Deep amber or red filters designed for EtBr (which emits at ~600 nm) will not detect SYBR Safe effectively [45]. GelRed, with its red emission (~600 nm), is more compatible with standard EtBr filter sets [43].
- Light Source Selection: For SYBR Safe, a blue-light transilluminator is recommended. This not only provides a safer work environment by eliminating exposure to harmful UV radiation but also significantly improves cloning efficiency by minimizing UV-induced DNA damage [42] [45]. GelRed requires a UV transilluminator for excitation.
- Safety and Cloning Efficiency: If the DNA is to be extracted from the gel for downstream cloning applications, the combination of SYBR Safe and a blue-light transilluminator is highly recommended. Studies show this combination maintains cloning efficiency at nearly 100%, whereas exposure to UV light can cause an 80% reduction in successfully transformed colonies [42].
The transition from traditional, hazardous stains like ethidium bromide to safer, high-performance alternatives is a cornerstone of modern molecular biology. For the analysis of PCR products via agarose gel electrophoresis, SYBR Safe offers an excellent balance of safety, sensitivity, and compatibility with downstream applications, particularly when paired with blue-light visualization. GelRed provides a robust alternative with high DNA binding affinity and a red emission profile compatible with existing UV-based imaging systems. While Erythrosin B has specific applications in brightfield imaging, its utility in standard nucleic acid electrophoresis is limited. By following the optimized protocols and imaging guidelines outlined in this document, researchers can ensure the acquisition of reliable, high-quality data while maintaining a safe laboratory environment.
Solving Common Electrophoresis Problems: From Faint Bands to Smearing
Agarose gel electrophoresis is a foundational method in molecular biology for analyzing PCR products, enabling researchers to verify amplification success, approximate fragment size, and identify nonspecific products [29]. However, the occurrence of faint or absent bands significantly hinders experimental workflow and can compromise downstream applications [33]. This application note systematically addresses this common challenge, providing a structured troubleshooting guide framed within the context of PCR product analysis research. We summarize prevalent issues across three critical phases—sample preparation, gel run, and visualization—and offer detailed, actionable protocols to ensure reliable and interpretable results for scientists and drug development professionals.
Troubleshooting Faint or No Bands
The causes of faint or absent bands can be categorized according to the experimental phase in which they originate. The table below outlines common issues and their respective solutions.
Table 1: Troubleshooting Faint or Absent Bands in Agarose Gel Electrophoresis
| Phase | Possible Cause | Recommendation |
|---|---|---|
| Sample Preparation | Low quantity of loaded DNA/RNA | Load minimum of 0.1–0.2 μg of nucleic acid per millimeter of gel well width [33]. |
| Sample degradation | Use molecular biology-grade reagents and nuclease-free labware. Wear gloves and use designated areas for nucleic acid handling, especially for RNA [33]. | |
| Primer-dimer formation | Optimize primer design and concentration. Avoid primers with complementary 3' ends. Typical optimal primer concentration is between 0.1–1 μM [48]. | |
| Gel Run | Gel over-run | Monitor run time and dye migration to prevent small fragments from running off the gel [33]. |
| Incorrect electrode polarity | Ensure electrodes are correctly connected; gel wells must be on the cathode (negative electrode) side [33]. | |
| Suboptimal voltage or run time | Apply recommended voltage for the nucleic acid size and buffer system. Excessive run time can cause band diffusion [33]. | |
| Visualization | Low sensitivity of stain | Check stain sensitivity. Use more stain or longer staining time. For thick/high-percentage gels, allow longer stain penetration [33]. |
| High background | Destain the gel or select a stain with low intrinsic fluorescence to improve contrast [33]. | |
| Incorrect light source for dye | Ensure the transilluminator's excitation wavelength is optimal for the fluorescent dye used (e.g., UV for ethidium bromide, blue light for SYBR Safe) [49] [50]. |
The Scientist's Toolkit: Key Reagents and Materials
Table 2: Essential Research Reagent Solutions
| Item | Function/Benefit |
|---|---|
| SYBR Gold Nucleic Acid Gel Stain | A highly sensitive fluorescent dye capable of detecting as little as 25 pg of DNA. It can be excited by both UV and blue light, preventing DNA nicking for downstream applications [50]. |
| GelRed | A non-hazardous, fluorescent dye engineered to not pass through cell membranes, making it a safer alternative to ethidium bromide. It shares the same excitation and emission spectra as EtBr [50]. |
| Hot-Start DNA Polymerase | A modified polymerase (e.g., antibody-bound or chemically modified) that is inactive at room temperature. This prevents non-specific amplification and primer-dimer formation prior to the initial denaturation step, improving specificity and yield [48]. |
| Dimethyl Sulfoxide (DMSO) | An additive used at 1-10% final concentration to optimize PCR amplification of templates with high GC content by lowering the melting temperature and disrupting secondary structures [48]. |
| BSA (Bovine Serum Albumin) | Used at ~400 ng/μL to alleviate the effects of inhibitors that may be present in biological samples (e.g., fecal matter) or water sources, stabilizing the reaction [48]. |
Detailed Experimental Protocols
Protocol: Optimizing PCR Primer Concentration
Poor PCR amplification efficiency is a primary cause of faint bands. Optimizing primer concentration minimizes primer-dimer formation and maximizes specific product yield [51].
- Prepare Reaction Master Mix: Create a master mix containing all standard PCR components (1X buffer, 1.5 mM MgCl₂, 200 μM dNTPs, DNA polymerase, template DNA) except primers.
- Dilute Primers: Prepare a dilution series for both forward and reverse primers (e.g., 50 nM, 100 nM, 200 nM, 400 nM, 600 nM).
- Set Up Reactions: Aliquot the master mix into PCR tubes. Add forward and reverse primers from the dilution series to test different concentration combinations as shown in the plate layout below.
- Run PCR: Perform amplification using optimized cycling conditions, typically with an annealing temperature of 60°C.
- Analyze Results: Resolve PCR products on an agarose gel. The optimal primer concentration combination is the one that yields the brightest specific band with the lowest Cq value (for qPCR), shows no primer-dimer formation, and has a negative no-template control (NTC) [51].
Figure 1: Workflow for optimizing PCR primer concentrations to maximize amplification efficiency and minimize non-specific products.
Protocol: Agarose Gel Electrophoresis for PCR Product Analysis
This standard protocol ensures clear resolution and accurate visualization of DNA fragments [29].
- Prepare Agarose Gel: Weigh out agarose for a 2% gel and dissolve in an appropriate volume of 0.5X TBE buffer by heating. Allow the solution to cool slightly.
- Add Stain and Cast Gel: Add a fluorescent DNA stain, such as RED Safe or SYBR Safe, to the molten agarose, mix thoroughly, and pour into a gel tray with a well comb inserted. Allow it to solidify completely.
- Prepare Samples and Load Gel: Mix PCR samples with a loading dye. Carefully pipette the samples into the wells, ensuring no air bubbles are trapped. Include an appropriate DNA ladder/marker in one well.
- Run Electrophoresis: Submerge the gel in the electrophoresis tank filled with 0.5X TBE buffer. Run at a constant voltage (e.g., 5-10 V/cm distance between electrodes) until the loading dye has migrated sufficiently.
- Visualize and Document: Place the gel on a UV or blue light transilluminator, depending on the stain used, and capture an image using a gel documentation system.
Protocol: Recycling Agarose Gels for Sustainability
For high-throughput labs, recycling agarose reduces costs and environmental impact without sacrificing performance. A single gel can be reused up to 10 times [52].
- Fragment and Initial Diffusion: After documentation, slice the used gel into strips and place them in a large Erlenmeyer flask (1st Diffusion Station). Cover with distilled water.
- Diffuse Contaminants: Replace the water at least once daily for several days to allow ethidium bromide, DNA, and salts to diffuse out. Transfer the gel pieces to a second flask (2nd Diffusion Station) with ultrapure water for further cleaning.
- Drain and Dry: Drain the cleaned gel pieces thoroughly, then spread them on stainless steel or glass dishes. Bake in a drying oven at 55–60°C until completely dry.
- Grind and Store: Grind the dried agarose chunks into a fine powder using a coffee or spice grinder. Store the recycled agarose powder in a sealed container for future use [52].
Advanced Considerations for Optimal Results
Optimizing PCR Components and Cycling Conditions
Beyond primer concentration, several factors are critical for robust PCR amplification:
- Template DNA: For human genomic DNA, 30-100 ng is typically optimal. For GC-rich templates, use additives like DMSO or formamide to disrupt secondary structures [48].
- DNA Polymerase Selection: Choose a polymerase based on application needs. High-fidelity enzymes (e.g., Pfu) with 3'-5' exonuclease activity are essential for cloning, while Taq polymerase is sufficient for routine PCR [48].
- Magnesium Concentration: Magnesium is a crucial cofactor for DNA polymerases. The final concentration of Mg²⁺ in the PCR reaction mix usually ranges between 0.5-5.0 mM and may require optimization [48].
- Cycling Conditions: For a standard 3-step PCR, an annealing temperature 5°C below the primer Tm is a good starting point. Extension time is typically 1 minute per 1000 base pairs [48].
Systematic Troubleshooting Workflow
A methodical approach is key to diagnosing electrophoresis problems efficiently. The following decision tree guides users through the most critical checks.
Figure 2: A systematic diagnostic workflow for identifying the root cause of faint or absent bands in gel electrophoresis.
Agarose gel electrophoresis is a fundamental technique for PCR product analysis, yet smearing remains a pervasive issue that compromises data integrity and interpretation. This application note systematically addresses the three most prevalent causes of electrophoretic smearing—sample degradation, sample overloading, and inappropriate voltage conditions—within the context of PCR-based research. We present validated troubleshooting methodologies, quantitative optimization parameters, and practical protocols to enable researchers to obtain crisp, publication-quality band separation. By implementing these targeted strategies, scientists can significantly enhance the reliability of their nucleic acid analyses and ensure robust downstream applications in drug development and diagnostic research.
In molecular biology research, the clarity of results obtained through agarose gel electrophoresis directly impacts the interpretation of experimental outcomes, particularly in PCR product analysis. Band smearing presents a significant obstacle, obscuring results and complicating data analysis. Within the broader thesis of optimizing agarose gel electrophoresis for PCR product analysis, this work focuses specifically on resolving smearing artifacts through systematic investigation of their root causes. We demonstrate that the majority of smearing issues originate from three primary sources: compromised sample integrity, inappropriate sample quantities, and suboptimal electrophoretic conditions. By addressing these factors through controlled experiments and quantitative analysis, we provide researchers with a comprehensive framework for obtaining reproducible, high-resolution separations essential for advanced applications in genomics and drug development.
Fundamental Principles of Agarose Gel Electrophoresis
Agarose gel electrophoresis separates DNA fragments based on size using an electric field applied through a porous agarose matrix [53]. The phosphate backbone of DNA confers a uniform negative charge, causing fragments to migrate toward the positive electrode. Separation occurs as smaller DNA fragments navigate the gel matrix more readily than larger fragments [53]. The "biased reptation" model describes this process, wherein the leading edge of DNA molecules pulls the remainder through the gel pores [53]. Several critical factors influence migration rate and resolution: DNA size, agarose concentration, DNA conformation, applied voltage, buffer composition, and staining method [53]. Understanding these fundamentals provides the necessary foundation for troubleshooting separation anomalies such as smearing.
Materials and Methods
Research Reagent Solutions
Table 1: Essential reagents for agarose gel electrophoresis
| Reagent | Function | Application Notes |
|---|---|---|
| Agarose Powder | Forms porous gel matrix for size-based separation | Choose concentration based on target DNA size: 0.7%-1% for 1-20 kb, 1.5%-2% for 0.1-3 kb [31] |
| TAE Buffer (Tris-Acetate-EDTA) | Running buffer for electrophoresis | Preferred for DNA recovery and downstream applications; better for larger fragments [54] |
| TBE Buffer (Tris-Borate-EDTA) | Running buffer for electrophoresis | Provides greater resolution for small fragments (<1 kb); higher buffering capacity for longer runs [54] |
| DNA Loading Dye | Adds density for well loading; contains tracking dyes | Typically 6X concentration with bromophenol blue/xylene cyanol; contains glycerol/ficoll for density [53] |
| Ethidium Bromide | Intercalating DNA stain for visualization | Use at 0.5 μg/mL; mutagenic—handle with appropriate PPE [53] |
| SYBR Safe | Alternative DNA stain | Lower toxicity; compatible with blue light transillumination [55] |
| DNA Ladder | Molecular weight standard | Essential for size determination; use appropriate range for expected fragment sizes |
Standard Agarose Gel Protocol
Gel Preparation
- Gel Concentration Selection: Choose agarose percentage based on expected DNA fragment sizes (Table 2) [31].
- Gel Casting: Combine agarose powder with 1X running buffer (TAE or TBE) in a flask not exceeding 50% capacity to prevent overflow [55]. Heat until completely dissolved using microwave with intermittent swirling [31].
- Staining Method: Add nucleic acid stain when agarose cools to approximately 50-60°C [22] [31]. For ethidium bromide, use final concentration of 0.2-0.5 μg/mL [53]. Alternative stains like SYBR Safe or GelRed may be used for reduced toxicity [55].
- Pouring and Setting: Pour molten agarose into casting tray with well comb positioned correctly. Allow to solidify completely at room temperature (15-30 minutes) [31]. Ensure uniform thickness of 3-4 mm for optimal results [33].
Sample Preparation and Loading
- Sample Mixing: Combine DNA samples with loading dye to final 1X concentration [22]. Mix thoroughly by flicking or pipetting.
- Optimal Loading Volume: Load appropriate volume based on well capacity and DNA concentration. For analytical applications, load 15-50 μL depending on gel thickness [22].
- Loading Technique: Carefully pipette samples into wells without puncturing well bottoms [33]. Include appropriate DNA ladder in first lane for size reference [31].
Electrophoresis Conditions
- Buffer Level: Submerge gel completely in running buffer, using the same buffer formulation as used for gel preparation [31].
- Voltage Parameters: Apply voltage based on gel size and desired resolution. Standard conditions: 5-10 V/cm distance between electrodes [53]. For mini-gels, 80-150V is typical [31].
- Run Duration: Electrophorese until tracking dye migrates 75-80% through gel [31]. Monitor buffer temperature during extended runs.
Visualization
- Image Capture: Visualize DNA bands using appropriate UV or blue light transillumination based on stain used [22] [55].
- Documentation: Capture gel image using gel documentation system with optimized focus and exposure [53] [33].
Systematic Troubleshooting of Smearing
Sample Degradation
Diagnostic Criteria
Degraded DNA typically appears as a continuous smear extending from the well downward, often lacking distinct bands [56]. In severe cases, high molecular weight DNA may be absent, with smearing concentrated in the lower molecular weight regions [56].
Experimental Protocol for Assessing DNA Integrity
- Prepare Control DNA: Use intact genomic DNA (tight high molecular weight band) and purposefully degraded DNA (heat-treated at 99°C for varying durations) as comparison standards [56].
- Parallel Electrophoresis: Run test samples alongside controls using 0.8% agarose gel to maximize separation range.
- Staining and Visualization: Use intercalating dye at standard concentration with consistent imaging parameters.
- Interpretation: Compare band patterns between test samples and degradation controls to assess sample integrity.
Preventive Strategies
- Nuclease-Free Techniques: Use molecular biology grade reagents; wear gloves; employ RNase/DNase-free labware [33].
- Proper Storage: Store DNA samples at -20°C in TE buffer; avoid repeated freeze-thaw cycles by creating aliquots [56].
- Handling Conditions: Minimize exposure to heat, physical shearing, and nucleases during extraction [56].
Sample Overloading
Diagnostic Criteria
Overloaded samples exhibit trailing smears, warped or U-shaped bands, and poorly resolved fragments that appear fused together [33]. The excessive DNA saturates the gel matrix, impeding clean separation.
Experimental Protocol for Optimization of Loading Concentration
- Serial Dilution Series: Prepare a dilution series of PCR product (neat, 1:2, 1:5, 1:10) in nuclease-free water.
- Standardized Loading: Mix equal volumes of each dilution with loading dye and load into adjacent wells.
- Electrophoresis: Run gel at optimal voltage (5-8 V/cm) for sufficient time to resolve target fragments.
- Analysis: Identify the dilution producing crisp, well-resolved bands without saturation effects.
Table 2: Optimal DNA loading quantities based on well dimensions
| Well Width (mm) | Recommended DNA Mass (μg) | Maximum Volume (μL) |
|---|---|---|
| 5 | 0.5-1.0 | 15-20 |
| 10 | 1.0-2.0 | 30-40 |
Corrective Approaches
- Quantitative Assessment: Precisely measure DNA concentration using spectrophotometry or fluorescence assays before loading.
- Volume Optimization: Adhere to the guideline of 0.1-0.2 μg DNA per millimeter of well width [33].
- Well Selection: Use deep, narrow wells for higher concentration samples to maintain resolution while loading appropriate mass [33].
Voltage Issues
Diagnostic Criteria
Excessive voltage causes "smiling" or "frowning" bands where migration is faster in center lanes, uneven heating throughout the gel, and blurred or diffuse band patterns [54]. In extreme cases, the gel may physically warp or melt.
Experimental Protocol for Voltage Optimization
- Gel Setup: Prepare identical 1.2% agarose gels with the same DNA samples and ladder.
- Voltage Gradient: Run parallel gels at different voltages (50V, 75V, 100V, 150V) while maintaining other constant conditions.
- Temperature Monitoring: Record buffer temperature at beginning and end of each run.
- Resolution Assessment: Compare band sharpness, resolution between adjacent fragments, and gel appearance.
Table 3: Voltage optimization guidelines for different gel applications
| Application | Recommended Voltage | Run Time | Advantages |
|---|---|---|---|
| High resolution separation | 5-8 V/cm (50-75V for mini-gel) | Extended (60-90 min) | Superior band separation; minimal heat |
| Analytical quick check | 10-15 V/cm (100-150V for mini-gel) | Short (20-30 min) | Rapid results; adequate for clear size differences |
| Large DNA fragments (>10 kb) | 3-5 V/cm (30-50V for mini-gel) | Extended (2-4 hours) | Prevents band inversion; better separation |
Optimization Strategies
- Voltage Calculation: Determine appropriate voltage based on distance between electrodes (5-10 V/cm) rather than fixed values [53].
- Temperature Management: Run gels in a cold room or with circulating cooling buffer for high-voltage applications [54].
- Buffer Freshness: Always use freshly prepared running buffer, as exhausted buffer increases electrical resistance and heating [54].
Advanced Technical Considerations
Integrated Troubleshooting Workflow
The following diagnostic pathway provides a systematic approach to resolving smearing issues in agarose gel electrophoresis:
Buffer and Gel Matrix Optimization
The choice between TAE and TBE buffers significantly impacts band resolution, particularly for specific fragment size ranges. TAE (Tris-acetate-EDTA) provides better resolution for larger DNA fragments (>1 kb) and is preferred when DNA recovery for downstream applications is required [54]. TBE (Tris-borate-EDTA) offers superior resolution for smaller fragments (<1 kb) due to its higher buffering capacity, making it suitable for longer runs [54]. However, borate in TBE can inhibit enzymatic reactions in downstream applications. Agarose concentration directly affects pore size and thus resolution capabilities. Lower percentages (0.7-0.8%) provide better separation of larger fragments (5-20 kb), while higher percentages (1.5-2.0%) optimize resolution of smaller fragments (0.1-1 kb) [31].
Innovative Method for Dilute Samples
The SURE (Successive Reloading) electrophoresis method enables concentration of dilute nucleic acid samples directly within the gel matrix [57]. This approach involves loading multiple aliquots of the same sample into a single well, with brief electrophoretic pulses between each loading. The method can incorporate up to 20 successive loadings, permitting as much as 800 μL to be concentrated into a single sharp band with approximately 97% efficiency [57]. This technique is particularly valuable for detecting previously undetectable DNA in highly dilute samples (<0.0007 ng/μL) and enhances yields for preparative applications without the sample loss associated with precipitation methods.
Eliminating smearing in agarose gel electrophoresis requires methodical investigation of sample integrity, loading parameters, and electrophoretic conditions. This application note provides researchers with evidence-based protocols to diagnose and resolve the most common sources of band diffusion and poor resolution. By implementing these standardized approaches—including quantitative loading guidelines, voltage optimization, and systematic troubleshooting—scientists can significantly improve the quality and interpretability of their electrophoretic separations. The methodologies presented herein contribute to the broader thesis of optimized PCR product analysis by establishing robust, reproducible protocols that enhance data reliability in molecular biology research and drug development applications.
Within the broader context of agarose gel electrophoresis for PCR product analysis research, achieving crisp, well-separated bands is a fundamental requirement for accurate data interpretation. Poor band separation can compromise downstream analyses, from simple size verification to complex cloning procedures. This application note provides a detailed, evidence-based framework for researchers and drug development professionals to systematically troubleshoot and optimize two of the most critical factors influencing resolution: agarose gel concentration and electrophoresis conditions. The protocols herein are designed to integrate seamlessly into a high-quality research workflow, ensuring reliable and reproducible results.
Systematic Optimization of Agarose Gel Percentage
The concentration of agarose in a gel determines the pore size of the matrix, which acts as a molecular sieve. Selecting the appropriate gel percentage is the most decisive step in separating DNA fragments of similar sizes [30] [53].
Quantitative Guidelines for Gel Percentage Selection
The table below provides a precise guideline for choosing an agarose concentration based on the expected size range of your DNA fragments.
Table 1: Agarose Gel Percentage Selection for Optimal DNA Separation
| Agarose Gel Percentage (%) | Effective Range of Separation (bp) | Minimum Resolvable Size Difference (bp)* |
|---|---|---|
| 0.5% | 2,000 – 50,000 [30] | >200 bp [58] |
| 1.0% | 400 – 8,000 [30] | >100-200 bp [58] |
| 1.5% | 200 – 3,000 [30] | >50-100 bp [58] |
| 2.0% | 100 – 2,000 [30] | 20-50 bp [58] |
| 2.5% - 3.0% | Up to 500 [58] | 20-50 bp [58] |
| 3.0% - 4.0% | Up to 250 [58] | <20 bp [58] |
Note: For fragments differing by less than 20 bp, high-resolution agarose (e.g., MetaPhor) is recommended [58].
Experimental Protocol: Casting a Standard Agarose Gel
Materials:
- Agarose powder (standard or high-resolution)
- Electrophoresis buffer (1x TAE or TBE, see Section 3.1)
- Erlenmeyer flask
- Microwave or hot plate
- Gel casting tray and comb
- DNA stain (e.g., Ethidium Bromide, SYBR Safe, GelGreen)
Method:
- Weigh Agarose: Calculate the required volume of buffer for your gel cassette. For a 1% gel, add 1 g of agarose powder to every 100 mL of 1x buffer in an Erlenmeyer flask [31]. Adjust the mass for other percentages (e.g., 1.5 g for a 1.5% gel in 100 mL).
- Dissolve Agarose: Heat the mixture in a microwave using short, 30-45 second bursts, swirling gently between heats to ensure even dissolution and to prevent boiling over. Continue until the solution is completely clear and no suspended particles remain [31].
- Cool Agarose: Allow the molten agarose to cool on the benchtop to approximately 50-60°C (a temperature comfortable to the touch) to prevent warping the casting tray [53] [31].
- Add DNA Stain: If post-staining is not preferred, add an intercalating dye like ethidium bromide to a final concentration of 0.2-0.5 µg/mL and mix thoroughly. Caution: EtBr is a known mutagen; wear appropriate personal protective equipment (PPE) [31].
- Cast the Gel: Place the comb in the casting tray. Pour the cooled agarose into the tray, avoiding bubble formation. Bubbles can be pushed away with a pipette tip. Let the gel solidify completely at room temperature for 20-30 minutes [31].
Optimizing Electrophoresis Conditions
Once the correct gel percentage is selected, the conditions under which the gel is run are critical for achieving sharp, straight bands.
The Critical Role of Running Buffer
The choice between the two common running buffers, TAE (Tris-Acetate-EDTA) and TBE (Tris-Borate-EDTA), impacts migration speed and resolution, especially for different fragment sizes.
Table 2: Running Buffer Selection Guidelines
| Buffer | Best Suited For | Key Considerations |
|---|---|---|
| TAE | Longer fragments (>1 kb); preparative gel electrophoresis [21]. | • DNA migrates ~10% faster than in TBE [21]. • Not ideal for long runs due to lower buffering capacity [21]. |
| TBE | Better separation of small DNA fragments [21] [30]. | • Higher ionic strength makes it suitable for long runs [21]. • Not recommended for enzymatic steps post-electrophoresis [21]. |
Protocol:
- Always use the same buffer to prepare the gel and to fill the electrophoresis tank. Do not use water, as this will cause the gel to melt during the run [59].
- Ensure the gel is fully submerged under 3-5 mm of buffer. Insufficient buffer leads to poor resolution, band distortion, and gel melting, while excess buffer can decrease DNA mobility [21].
Voltage and Run Time
- Avoid the "Smiling Effect": Uneven heating across the gel, often caused by high voltage, can make bands in the center lanes migrate faster than those on the sides, creating a crescent shape. To avoid this, run the gel at a lower voltage (e.g., 1-5 V/cm between electrodes) for a longer duration [21] [53].
- Crisper Bands: Running a gel at a lower voltage for a longer period generally increases resolution and produces crisper bands [31].
Sample Preparation and Loading
- Loading Dye: Always mix your DNA sample with a loading dye containing a dense agent (e.g., glycerol) to help the sample sink to the bottom of the well, and tracking dyes (e.g., bromophenol blue, xylene cyanol) to monitor migration [21] [53]. Be aware that these dyes comigrate with specific DNA fragment sizes and can mask bands of interest [21].
- Optimal DNA Quantity: Overloading a well with too much DNA will cause smearing and aberrant migration, making fragments appear larger than they are. A good starting point is 20-50 ng of DNA per band for EtBr or SYBR Safe staining. For more sensitive stains like SYBR Gold, 1 ng per band may be sufficient [21].
The following workflow diagram summarizes the key decision points and optimization steps for achieving perfect band separation.
Troubleshooting Common Gel Artifacts
Even with optimization, issues can arise. The table below outlines common problems and their evidence-based solutions.
Table 3: Troubleshooting Guide for Poor Band Separation
| Gel Artifact | Primary Cause | Solution |
|---|---|---|
| Smiling Bands (bands curve upward) | Uneven heating across the gel, often from high voltage [21]. | Run the gel at a lower voltage. Check for loose contacts in the electrophoresis tank [21]. |
| Smeared Bands | Overloading of DNA [21] [60]; excessive heating melting the gel [60]. | Load less DNA. Reduce running voltage. For low % gels, use a buffer that runs cooler (e.g., sodium borate) [60]. |
| Poor Band Separation | Incorrect agarose percentage [30]; gel run for insufficient time/distance [60]. | Refer to Table 1 and select a higher % gel for small fragments. Run the gel for a longer time/distance [60] [31]. |
| Faint or No Bands | Too little DNA loaded [21]; DNA stain forgotten or degraded [59]. | Ensure at least 20 ng/band is loaded for EtBr. Verify staining procedure; post-stain if necessary [21] [59]. |
| Crooked Lane Migration | Gel was not set or run on a level surface [60]. | Use a spirit level to ensure the gel box is placed on a flat, level surface [60]. |
| Gel Melting During Run | Water used instead of buffer [59]; insufficient buffer covering the gel [21]. | Always use the correct running buffer (TAE/TBE) and ensure the gel is fully submerged [21] [59]. |
The Scientist's Toolkit: Essential Reagents and Materials
Table 4: Research Reagent Solutions for Agarose Gel Electrophoresis
| Item | Function & Importance | Examples & Notes |
|---|---|---|
| DNA Ladder | Essential for sizing DNA fragments and assessing gel run quality. | Choose a ladder with sharp, distinct bands in your size range. Quality-controlled ladders (e.g., FastRuler) ensure accuracy [21]. |
| Agarose | Forms the sieving matrix. The grade and type matter. | Standard for routine analysis; High-Resolution Agarose (e.g., MetaPhor) is critical for separating fragments <20 bp apart [58]. |
| Running Buffer | Conducts current and maintains stable pH. | TAE or TBE; must be the same for gel preparation and tank [21] [59]. |
| DNA Stain | Enables visualization of DNA bands under UV light. | Ethidium Bromide: Cost-effective but toxic [31]. SYBR Safe/GelGreen: Safer alternatives with varying sensitivities [21] [60]. |
| Loading Dye | Adds density to samples and provides visual tracking of migration. | Contains dyes (e.g., bromophenol blue) that migrate at known rates; avoid masking bands of similar size [21] [53]. |
| Thermostable DNA Polymerase | For robust and specific PCR amplification. | Hot-Start Taq reduces primer-dimers and non-specific amplification, yielding cleaner products for electrophoresis [48]. |
Within the critical context of PCR product analysis for drug development and biomedical research, the integrity of experimental data is paramount. Band distortion in agarose gel electrophoresis represents a significant challenge, potentially leading to misinterpretation of results, incorrect sizing of DNA fragments, and ultimately, a lack of reproducible data required for scientific validation [53] [61]. This application note provides detailed methodologies and optimization strategies to identify, prevent, and correct common artifacts, ensuring the highest quality analytical and preparative results from your agarose gel electrophoresis.
Core Principles and Causes of Band Distortion
The migration of DNA through an agarose gel matrix is governed by its charge and the molecular sieving effect. Several key factors can disrupt this process, leading to band distortion.
- Gel Overheating: Excessive voltage generates heat, which can cause localized gel melting, leading to smearing and uneven migration fronts [61]. Running gels at high voltage for extended periods exacerbates this issue.
- Improper Gel Concentration: Using a single gel percentage for a wide range of DNA fragment sizes is a primary cause of poor resolution. High percentage gels better resolve small fragments but cause larger fragments to co-migrate, while low percentage gels have the opposite effect [62] [53].
- Sample Overloading: Introducing too much DNA into a well overwhelms the gel's capacity, resulting in smeared bands and horizontal band spreading [31] [61]. The 10% rule is recommended to account for pipetting loss and ensure consistent loading [31].
- Incorrect Buffer Conditions: Old or improperly prepared buffers have diminished buffering capacity, leading to pH shifts and distorted migration patterns [61]. Always use freshly prepared TAE or TBE buffer.
- DNA Conformation and Damage: Non-linear DNA conformations (e.g., nicked, supercoiled, or linear) migrate at different rates, which can create multiple bands from a single fragment and be misinterpreted without proper controls [53].
Optimization Strategies and Protocols
Gel Preparation and Buffer Selection
Protocol: Preparing a Standard 1% Agarose Gel
- Measure: Weigh 1 g of agarose powder [31].
- Mix: Combine with 100 mL of 1x TAE or TBE buffer in a microwavable flask [31]. Labs should standardize on one buffer; do not mix TAE and TBE.
- Dissolve: Microwave in short pulses (30-45 seconds), swirling intermittently until the solution is completely clear. Caution: Eruptive boiling can occur [31].
- Cool: Allow the solution to cool to approximately 50°C (comfortable to touch) before pouring, about 5 minutes [31].
- Stain (Optional): For post-staining, add ethidium bromide (EtBr) to a final concentration of 0.2-0.5 μg/mL (e.g., 2-3 μL of a 10 mg/mL stock per 100 mL gel). Caution: EtBr is a known mutagen; wear appropriate personal protective equipment (PPE) [31] [53].
- Pour: Slowly pour the agarose into a gel tray with the comb in place to avoid bubbles. Use a pipette tip to push any bubbles away from the wells [31].
- Solidify: Let the gel solidify completely at room temperature for 20-30 minutes, or at 4°C for 10-15 minutes for faster setting [31].
Optimization Notes:
- Buffer Choice: TAE (40 mM Tris-acetate, 1 mM EDTA) is preferred for longer runs and subsequent DNA extraction, while TBE (45 mM Tris-borate, 1 mM EDTA) offers superior buffering capacity for high-voltage runs but can impede some enzymatic reactions post-purification [63] [53].
- Gel Concentration: Select the agarose percentage based on your target DNA fragment size for optimal resolution. The table below provides guidance.
Table 1: Agarose Gel Concentration Guidelines for DNA Fragment Separation [62]
| Agarose Percentage (%) | Optimal Separation Range (base pairs) |
|---|---|
| 0.5 | 2,000 – 50,000 |
| 0.7 | 800 – 12,000 |
| 0.8 | 800 – 10,000 |
| 1.0 | 400 – 8,000 |
| 1.2 | 300 – 7,000 |
| 1.5 | 200 – 3,000 |
| 2.0 | 100 – 2,000 |
| 3.0 | 25 – 1,000 |
| 4.0 | 10 – 500 |
Sample Preparation and Loading Technique
Protocol: Sample Preparation and Loading
- Add Loading Dye: Mix your DNA sample with 6X loading dye. A typical ratio is 5 μL of dye per 25 μL of sample [31]. The dye increases sample density for proper well settling and provides visual tracking of migration progress [53].
- Load Carefully: Place the gel in the electrophoresis box and submerge in 1x running buffer. Using a micropipette, slowly load your samples into the wells.
- Pro-Tip: Maintain positive pressure on the pipette plunger to prevent buffer backflow into the tip. Position the tip just above the well and expel the sample steadily. After unloading, push to the second stop and remove the pipette straight up [31].
- Include Controls: Always load an appropriate DNA molecular weight ladder in the first lane for fragment size determination [31].
Optimization Notes:
- Loading Volume: Do not exceed the well capacity. For a standard mini-gel, 20-35 μL is typical. Overloading is a primary cause of smearing [61].
- SURE Electrophoresis for Dilute Samples: For highly dilute DNA samples (<0.0007 ng/μL), successive reloading (SURE) electrophoresis can concentrate the sample directly in the gel well. Load 15-25 μL into a well, apply a brief electrical pulse (e.g., 6 V/cm for 20-40 seconds), then disconnect the power and load the next aliquot into the same well. Repeat this process for up to 20 cycles. This stacks the DNA into a single, intense band with minimal broadening [39].
Electrophoresis Running Conditions
Protocol: Running the Gel
- Apply Voltage: Connect the electrodes to the power supply (Always Run to Red: DNA is negatively charged and migrates toward the positive anode) [31].
- Set Parameters: Run the gel at 80-150 V until the leading dye front has migrated 75-80% of the way down the gel. A typical run time is 1-1.5 hours [31].
- Monitor Temperature: If the gel box feels warm to the touch, the voltage is likely too high, causing overheating.
Optimization Notes:
- Voltage vs. Resolution: Running at a lower voltage (e.g., 1-5 V/cm distance between electrodes) for a longer period is a highly effective way to increase band crispness and resolution, as it minimizes heat-induced distortions [31] [53] [61].
- Prevent Overheating: Ensure adequate buffer levels to dissipate heat. For critical applications or long runs, perform electrophoresis in a cold room or use a dedicated cooling apparatus [61].
Visualization and Analysis
Protocol: Staining and Visualization
- Post-Stain (if not added to gel): If EtBr was not incorporated into the gel, place the gel in a container with 0.5 μg/mL EtBr in TAE/TBE buffer (e.g., 100 mL buffer + 5 μL of 10 mg/mL stock). Stain for 20-30 minutes on a rocker, then destain in water for 5 minutes to reduce background [31].
- Visualize: Place the gel on a UV transilluminator. DNA fragments will appear as orange fluorescent bands.
Troubleshooting Common Issues
Table 2: Troubleshooting Guide for Band Distortion
| Problem | Potential Causes | Solutions |
|---|---|---|
| Band Smearing | Sample degradation by nucleases; overloading of DNA; running gel at too high a voltage; insufficient gel concentration [61]. | Use fresh, high-quality samples and nuclease-free reagents; reduce DNA loading amount; run gel at lower voltage; increase agarose gel percentage [31] [61]. |
| Uneven Band Migration | Uneven gel polymerization; uneven buffer level in gel tank; damaged gel bottom or wells [61]. | Ensure agarose is fully dissolved and mixed before pouring; check that the gel box is level; fill gel box with sufficient buffer to fully submerge the gel; inspect gel tray and comb for damage [61]. |
| No or Faint Bands | Insufficient DNA loaded; incorrect staining procedure; DNA is highly dilute [61]. | Increase amount of DNA loaded (ensure it is within detection limits); verify staining protocol and dye activity; employ SURE electrophoresis for concentration [39] [61]. |
| Bands Too Broad | Well comb too thick; overloading of DNA [31]. | Use a thinner comb; reduce DNA loading amount. |
| Unexpected Band Sizes | DNA conformation (supercoiled, nicked circular, linear); incorrect buffer composition; degraded DNA ladder [53]. | Interpret band patterns with knowledge of DNA topology; always use fresh, correct buffer; run a fresh, undegraded DNA ladder for accurate size comparison [53]. |
The Scientist's Toolkit: Essential Reagents and Materials
Table 3: Research Reagent Solutions for Agarose Gel Electrophoresis
| Item | Function and Application Notes |
|---|---|
| Agarose LE | Standard-grade agarose for routine separation of DNA fragments. Forms a homogeneous gel matrix with defined pore sizes [39] [53]. |
| TAE Buffer (50X) | A common running buffer (Tris-Acetate-EDTA). Preferred for longer DNA fragments and is better for subsequent DNA extraction from gels. Prone to buffer exhaustion during long runs [63] [53]. |
| TBE Buffer (10X) | An alternative running buffer (Tris-Borate-EDTA). Has higher buffering capacity, ideal for higher voltage runs and separation of smaller fragments (<1 kb). Borate can interfere with downstream enzymatic reactions [63] [53]. |
| Ethidium Bromide | Intercalating dye that binds to DNA and fluoresces under UV light, allowing visualization. Handle as a mutagen with appropriate PPE and disposal protocols [31] [53]. |
| 6X Loading Dye | Typically contains Ficoll/sucrose/glycerol to weigh down the sample, and tracking dyes (e.g., bromophenol blue, xylene cyanol) to monitor migration progress [39]. |
| DNA Molecular Ladder | A mixture of DNA fragments of known sizes, essential for estimating the size of unknown DNA fragments in sample lanes [31] [62]. |
Workflow and Conceptual Diagrams
Agarose Gel Optimization Workflow
SURE Electrophoresis for Dilute Samples
Beyond Basic Analysis: Validation, Quantitative Methods, and Emerging Techniques
Within the framework of research on agarose gel electrophoresis for PCR product analysis, the validation of amplification success, product size, and purity is a critical gateway to reliable downstream applications. Polymerase Chain Reaction (PCR) is a foundational technique that allows for the amplification of specific DNA fragments from a complex pool of DNA [64]. However, the mere act of amplification is not sufficient; researchers must confirm that the correct target sequence has been amplified to the expected size and is free of contaminants that could interfere with subsequent experiments. This application note details standardized protocols for validating PCR products, integrating both classical and advanced methods to ensure data integrity for research and drug development.
The core methods for analysis can be divided into two approaches: the end-point analysis typified by agarose gel electrophoresis, which provides a snapshot of the reaction products after amplification is complete, and real-time detection, which monitors the amplification as it occurs, providing both quantitative and qualitative data [65] [64]. The choice of method depends on the required outcome—whether the goal is simple confirmation of amplification, precise quantification, or detection of specific genetic sequences in a complex sample, such as in quality control for cosmetics or food [66] [67].
Methodological Approaches for PCR Product Analysis
Agarose Gel Electrophoresis for End-Point Analysis
Agarose gel electrophoresis is the most widely used method for the initial, qualitative assessment of a PCR product. It is a standard molecular biology technique used to separate and visualize DNA fragments by size, allowing researchers to verify amplification success, approximate the size of the product, and detect any nonspecific amplification [29] [64].
Experimental Protocol:
- Gel Preparation: Prepare a 2% agarose gel by dissolving agarose in 0.5X TBE buffer. The percentage of agarose can be adjusted based on the expected size of the PCR product for optimal resolution.
- Staining: Add a DNA intercalating dye, such as RED Safe DNA stain or ethidium bromide, to the cooled agarose solution before casting the gel. These dyes bind to the DNA and allow visualization under UV light.
- Sample Loading: Mix the PCR amplification product with a loading dye that contains a density agent (e.g., glycerol) to allow the sample to sink into the well, and a tracking dye to monitor the migration front.
- Electrophoresis: Load the samples onto the gel and separate the DNA fragments by applying an electric field (typically 5-10 V/cm of gel length) in 0.5X TBE buffer.
- Visualization: Place the gel on a UV transilluminator to visualize the separated DNA bands. The presence of a single, sharp band at the expected size confirms successful amplification [29] [64].
Performance Data for Agarose Gel Electrophoresis: Table 1: Key characteristics of the agarose gel electrophoresis method for PCR product validation.
| Parameter | Specification | Application/Note |
|---|---|---|
| Detection Method | End-point, post-amplification | Analysis occurs after PCR is complete [65]. |
| Primary Output | Size verification & specificity | Confirms the presence and approximate size of the target amplicon [64]. |
| Quantification | Semi-quantitative | Band intensity can be compared but is not highly accurate. |
| Sensitivity | Moderate | Requires a visible amount of DNA; less sensitive than qPCR [64]. |
| Hands-on Time | ~60-90 minutes | Includes gel casting, sample loading, and running. |
Quantitative Real-Time PCR (qPCR) for Real-Time Analysis
Quantitative PCR (qPCR), also known as real-time PCR (rt-PCR), has revolutionized PCR product analysis by enabling accurate quantification. This technique combines amplification with real-time detection, allowing researchers to monitor the accumulation of PCR products cycle-by-cycle [65]. It is extensively used for absolute and relative quantification in applications like gene expression analysis, pathogen detection, and biomarker discovery [65] [67].
Experimental Protocol (Two-Step RT-qPCR for Gene Expression):
- RNA Extraction and Reverse Transcription: Extract high-quality total RNA from the sample. Convert RNA into complementary DNA (cDNA) using reverse transcriptase. This step can be primed using oligo(dT) primers, random hexamers, or gene-specific primers.
- qPCR Setup and Amplification: Prepare a reaction mix containing the cDNA template, forward and reverse primers, and a fluorescent detection system (e.g., SYBR Green dye or sequence-specific TaqMan probes). SYBR Green binds non-specifically to double-stranded DNA, while TaqMan probes provide higher specificity through a fluorogenic oligonucleotide probe.
- Data Acquisition and Analysis: Run the reaction in a real-time PCR instrument that measures the fluorescence at the end of each cycle. The instrument calculates the Ct (Threshold Cycle), which is the cycle number at which the fluorescence crosses a threshold above background. The Ct value is inversely proportional to the starting quantity of the target nucleic acid [65].
Performance Data for Quantitative Real-Time PCR: Table 2: Key characteristics of the quantitative real-time PCR (qPCR) method for PCR product validation.
| Parameter | Specification | Application/Note |
|---|---|---|
| Detection Method | Real-time, during amplification | Monitors product accumulation in real-time [65]. |
| Primary Output | Quantification & detection | Provides both qualitative (presence/absence) and quantitative (amount) data. |
| Quantification | Highly accurate | Enables absolute or relative quantification with a wide dynamic range [65]. |
| Sensitivity | Very High | Can detect down to a single copy of a DNA template [65]. |
| Throughput | High | 96- or 384-well plate formats allow for high-throughput analysis. |
Workflow Diagram: PCR Product Validation Pathways
The following diagram illustrates the decision-making workflow and methodologies for PCR product validation detailed in this application note.
PCR Product Purification and Purity Assessment
Following amplification and analysis, PCR products often require purification to remove enzymes, primers, nucleotides, and buffer components before they can be used in downstream applications like cloning or sequencing [68]. The purity of the DNA is critical for the success of these applications.
Purification Protocols
Two common purification methods are silica-based column purification and gel extraction.
- Silica-Based Column Purification: This is a rapid and efficient method for removing salts, primers, and enzymes from a PCR reaction. The protocol involves three key steps [68]:
- Bind: The PCR reaction is mixed with a binding buffer containing a chaotropic salt (e.g., guanidinium thiocyanate) and added to a silica membrane column. The DNA binds to the silica in the presence of high salt concentrations, while impurities are removed [69].
- Wash: The column is washed with an ethanol-based buffer to further remove contaminants and salts without eluting the DNA.
- Elute: Pure DNA is eluted from the membrane using a low-ionic-strength solution like TE buffer or nuclease-free water. Pre-warming the elution buffer to 50°C can enhance the recovery of larger DNA fragments [68].
- Gel Extraction: When a specific band needs to be isolated from a complex mixture (e.g., after agarose gel electrophoresis), gel extraction is used. The DNA band is excised from the gel, and the DNA is purified using a silica column or other methods. Recent studies have validated cost-effective protocols using chaotropic salts like KI or a freeze-and-precipitate method to dissolve the agarose and recover DNA suitable for downstream applications like cloning and PCR [23].
Assessing DNA Yield and Purity
Determination of nucleic acid concentration and purity is an essential but often overlooked step in PCR troubleshooting [69]. Spectrophotometric methods are commonly used:
- The A260/A280 ratio is used to assess protein contamination. A pure DNA sample typically has a ratio of approximately 1.8 [68].
- The A260/A230 ratio is used to assess contamination from salts or organic compounds. A pure preparation typically has a ratio between 2.0 and 2.3 [68]. Ensuring high DNA purity is paramount, as contaminants from the extraction process or the original sample matrix (e.g., heme, heparin) can act as potent inhibitors in downstream PCR and multiplex PCR reactions [69].
The Scientist's Toolkit: Essential Reagents and Materials
Table 3: Key research reagent solutions for PCR product validation workflows.
| Item | Function | Example & Notes |
|---|---|---|
| Agarose | Matrix for separating DNA fragments by electrophoresis. | UltraPure Agarose for high-quality gels resolving fragments from 100 bp to >30 kb [70]. |
| DNA Stains | Visualize DNA under UV light after electrophoresis. | RED Safe Stain or ethidium bromide; intercalates into double-stranded DNA [29] [64]. |
| DNA Ladder | Molecular weight standard for sizing PCR products on a gel. | A predetermined set of DNA fragments of known sizes run alongside samples. |
| qPCR Detection Chemistry | Fluorescently monitor DNA amplification in real-time. | SYBR Green dye (binds dsDNA) or TaqMan probes (sequence-specific, higher specificity) [65]. |
| PCR Purification Kit | Remove enzymes, primers, and salts from PCR reactions. | Monarch Spin PCR & DNA Cleanup Kit; uses silica membrane technology for rapid cleanup (<10 min) [68]. |
| Gel Extraction Kit | Purify specific DNA fragments from agarose gels. | PureLink Quick Gel Extraction Kit; uses silica column to isolate DNA from dissolved gel [70]. |
| Nucleic Acid Extraction Kit | Isolate high-purity DNA/RNA from complex samples. | PowerSoil Pro Kit; used for efficient extraction from challenging matrices for downstream rt-PCR [67]. |
| Elution Buffer | Solution used to resuspend and store purified DNA. | TE buffer (10 mM Tris, 0.1 mM EDTA, pH 8.5) is ideal for long-term DNA stability [68]. |
Agarose gel electrophoresis has long been a foundational technique in molecular biology laboratories for the analysis of PCR products, providing a simple, cost-effective method for size-based separation and visual confirmation of nucleic acids [29]. However, the evolving demands of modern diagnostics and research require a clear understanding of how this traditional method compares with advanced techniques such as quantitative PCR (qPCR), loop-mediated isothermal amplification (LAMP), and capillary electrophoresis. Each of these methods offers distinct advantages in sensitivity, quantification, speed, and applicability in resource-limited versus high-throughput settings. This analysis provides a structured comparison of these technologies, supported by experimental protocols and performance data, to guide researchers and drug development professionals in selecting the optimal method for their specific application needs within the context of PCR product analysis.
Comparative Performance Analysis
The selection of an appropriate analytical method depends on multiple performance parameters. The following table summarizes the key characteristics of agarose gel electrophoresis, qPCR, LAMP, and capillary electrophoresis based on current literature and application notes.
Table 1: Performance Comparison of Molecular Analysis Techniques
| Method | Sensitivity | Quantification Capability | Speed | Equipment Needs | Cost | Primary Applications |
|---|---|---|---|---|---|---|
| Agarose Gel Electrophoresis | Moderate (visualization limit ~1-10 ng) | Semi-quantitative (band intensity) | Slow (1-2 hours) | Low (power supply, gel tank, imager) | Low | PCR product verification, size estimation, cloning [71] [29] |
| qPCR | High (e.g., 100 copies/μL [72]) | Fully quantitative (Ct values) | Fast (30 min - 2 hours) | High (thermocycler with detection) | High | Pathogen quantification, gene expression, viral load monitoring [72] [73] |
| LAMP | High (e.g., 7.47 pg/μL [72]) | Semi-quantitative (time-to-positive) | Very Fast (30-60 min) | Low (water bath/block) | Low | Rapid field diagnostics, point-of-care testing [72] [74] |
| Capillary Electrophoresis | High (picogram level [71]) | Fully quantitative (peak area) | Very Fast (minutes [71]) | High (instrument, capillary array) | High | High-resolution fragment analysis, Sanger sequencing, quality control [71] [75] |
Table 2: Analytical Performance in Diagnostic Applications
| Method | Diagnostic Target | Reported Sensitivity | Reported Specificity | Reference |
|---|---|---|---|---|
| qPCR | Spirometra mansoni (cytb gene) | 100 copies/μL | 100% (no cross-reactivity) | [72] |
| LAMP | Spirometra mansoni (cytb gene) | 355.5 fg/μL (egg DNA) | 100% (no cross-reactivity) | [72] |
| Two-step Endpoint RT-PCR + Agarose Gel | SARS-CoV-2 | 95.1% (vs. RT-qPCR) | 95.8% (vs. RT-qPCR) | [76] |
| Capillary Electrophoresis | Monoclonal Immunoglobulins | 92% (vs. Immunofixation) | 74% | [77] |
Detailed Experimental Protocols
Protocol 1: Standard Agarose Gel Electrophoresis for PCR Product Analysis
This protocol is adapted for the verification of PCR amplicons, such as in the detection of Spirometra mansoni or SARS-CoV-2 [72] [76].
- Reagent Preparation: Prepare a 2-3% agarose gel by dissolving agarose powder in 0.5X TBE or TAE buffer. Microwave until completely clear. Allow the solution to cool slightly, then add a nucleic acid stain such as SYBR Safe or RED Safe to a final concentration of 1X. Pour the gel into a casting tray with a well comb and allow it to solidify completely [29] [76].
- Sample Loading and Electrophoresis: Mix the PCR product (e.g., 5 μL) with a DNA loading dye. Load the mixture into the wells of the solidified gel. Include a suitable DNA ladder for size determination. Run the gel at 5-10 V/cm in an electrophoresis chamber filled with 0.5X TBE buffer until adequate separation of bands is achieved [29].
- Visualization and Analysis: Visualize the gel using a UV or blue light transilluminator. A successful PCR is confirmed by the presence of a sharp band at the expected size, as demonstrated in SARS-CoV-2 detection where N1 and N2 gene amplicons (72 bp and 67 bp) are visualized [76].
Protocol 2: Quantitative PCR (qPCR) for Pathogen Detection
This TaqMan probe-based protocol is optimized for high-sensitivity detection, as used for Spirometra mansoni and Carpione rhabdovirus (CAPRV2023) [72] [73].
- Reaction Setup: The qPCR master mix should contain the following components at optimized concentrations: primers (e.g., 0.2-0.4 μM each), a sequence-specific TaqMan probe (e.g., 0.25-0.5 μM) labeled with a fluorophore (e.g., FAM) and a quencher (e.g., BHQ1), and a qPCR master mix containing DNA polymerase, dNTPs, and buffer. Typically, 1-100 ng of template DNA is used in a final reaction volume of 20-25 μL [72] [73].
- Thermal Cycling: Run the reaction on a real-time PCR instrument with the following cycling conditions: an initial denaturation at 95°C for 60 seconds, followed by 40 cycles of denaturation at 95°C for 10-15 seconds and a combined annealing/extension at 55-60°C for 30-60 seconds. Fluorescence data is collected at the end of each annealing/extension step [72] [73].
- Data Analysis: The cycle threshold (Ct) is determined for each sample. A standard curve, generated from samples with known copy numbers (e.g., a plasmid standard), is used to interpolate the target concentration in unknown samples. The amplification efficiency, ideally between 90-110%, is calculated from the slope of the standard curve [73].
Protocol 3: Loop-Mediated Isothermal Amplification (LAMP)
This protocol describes a colorimetric LAMP assay suitable for field deployment, as validated for Avian Influenza Virus (AIV) and Spirometra mansoni [72] [74].
- Reaction Setup: Prepare a LAMP reaction mixture containing 1.6-2.0 μM each of inner primers (FIP, BIP), 0.2-0.4 μM each of outer primers (F3, B3), isothermal amplification buffer, Bst DNA polymerase (or similar strand-displacing polymerase), dNTPs, MgSO₄, and a visual indicator. Common indicators include cresol red (color change from red to orange), malachite green, or calcein. Use 1-10 μL of extracted DNA or RNA template [72] [74].
- Amplification: Incubate the reaction tubes at a constant temperature of 60-65°C for 30-60 minutes. No thermal cycler is required; a heating block or water bath suffices [72] [74].
- Result Interpretation: For colorimetric assays, a positive reaction is indicated by a visible color change. For example, with cresol red, a change from red (alkaline) to orange/yellow (acidic) due to a pH shift from pyrophosphate production indicates amplification. Results can also be verified by agarose gel electrophoresis, which shows a characteristic ladder-like pattern of amplicons [74].
Research Reagent Solutions
The following table outlines essential reagents and their functions for implementing the described protocols.
Table 3: Key Reagents for Molecular Detection Workflows
| Reagent / Material | Function / Application | Example Use-Case |
|---|---|---|
| Agarose Powder | Forms porous gel matrix for size-based DNA separation [26]. | Analysis of PCR amplicons in 2-3% gels [76]. |
| SYBR Safe / RED Safe | Fluorescent nucleic acid gel stain for DNA visualization [29]. | Safe alternative to ethidium bromide for staining DNA in gels [29]. |
| TaqMan Probe | Sequence-specific, fluorescently-labeled probe for qPCR; enables high specificity and quantification [72] [73]. | Detection of Spirometra mansoni cytb gene with FAM/BHQ1 [72]. |
| Bst DNA Polymerase | Strand-displacing DNA polymerase essential for isothermal LAMP reactions [74]. | Enables amplification at constant temperature (60-65°C) in AIV detection [74]. |
| Cresol Red | pH-sensitive dye for visual interpretation of LAMP results; color change indicates amplification [74]. | Colorimetric detection of Avian Influenza Virus (AIV) [74]. |
| Fused-Silica Capillary | Separation channel for high-resolution capillary electrophoresis [71] [78]. | SDS-capillary agarose gel electrophoresis of therapeutic proteins [78]. |
Workflow and Signaling Pathways
The following diagrams illustrate the procedural workflows for the key techniques discussed, highlighting their operational differences.
Agarose gel electrophoresis (AGE) stands as a foundational technique in molecular biology, providing a robust method for separating DNA fragments by size. Within the broader context of thesis research on agarose gel electrophoresis for PCR product analysis, this application note details its advanced uses in three critical fields: forensic science, clinical pathogen detection, and quality control for mRNA-based therapeutics. The technique leverages a porous agarose matrix through which negatively charged DNA molecules migrate under an electric field, with smaller fragments traveling faster and farther than larger ones [79]. This simple yet powerful principle allows researchers to visualize and analyze PCR-amplified products, confirming the presence, size, and quantity of specific nucleic acid sequences. The following sections provide detailed protocols and data analysis techniques tailored to each advanced application, underscoring the indispensable role of AGE in modern biological research and diagnostic development.
Application Note & Protocol Details
Forensic DNA Fingerprinting
1. Experimental Principle and Workflow DNA fingerprinting, also known as DNA profiling, is a laboratory technique that forensic analysts use to compare a DNA sample collected from a crime scene with a DNA sample from a suspect [80]. Although 99.9% of the human genome is identical across the population, the remaining 0.1% contains variable sequences called polymorphic markers [80]. These variable regions, specifically short tandem repeats (STRs), are amplified by PCR and then separated by agarose gel electrophoresis to produce unique banding patterns that can differentiate individuals [80]. A match between the DNA fragments from a suspect and the crime scene evidence indicates that the individual was present at the scene.
The complete experimental workflow is summarized in the diagram below:
2. Detailed Protocol
Step 1: DNA Extraction and Preparation. Extract genomic DNA from crime scene evidence (e.g., hair, skin cells, blood) and suspect samples using a commercial DNA extraction kit. Quantify the DNA using a spectrophotometer and dilute to a working concentration of 1-10 ng/μL for PCR amplification [80].
Step 2: PCR Amplification of STR Markers. Prepare a PCR master mix containing Taq polymerase, dNTPs, reaction buffer, and primers specific to multiple STR loci. Aliquot the mix into PCR tubes and add template DNA from the crime scene and suspects. Run the PCR in a thermal cycler with the following cycling conditions [81]:
- Initial Denaturation: 95°C for 5 minutes.
- Amplification Cycles (25-35 cycles):
- Denaturation: 95°C for 30 seconds.
- Annealing: 55-65°C (primer-specific) for 30 seconds.
- Extension: 72°C for 1 minute.
- Final Extension: 72°C for 7 minutes.
- Hold: 4°C indefinitely.
Step 3: Agarose Gel Preparation. Prepare a 2-3% agarose gel by dissolving agarose powder in 0.5X TBE or TAE buffer. Heat the mixture until the agarose is completely dissolved, then allow it to cool to approximately 55-60°C. Add a DNA intercalating dye, such as RED Safe or ethidium bromide, pour the gel into a casting tray with a comb, and allow it to solidify at room temperature for 20-30 minutes [29] [82].
Step 4: Gel Electrophoresis. Place the solidified gel into an electrophoresis chamber filled with 0.5X TBE or TAE running buffer until the gel is submerged. Carefully remove the comb. Mix 5-10 μL of each PCR product with 6X DNA loading dye. Load the mixtures into the wells, including a DNA molecular weight ladder in one well. Run the gel at 80-120 V for 45-90 minutes, or until the dye front has migrated 75-80% of the gel length [80] [82].
Step 5: Visualization and Analysis. Visualize the gel under UV light using a transilluminator or gel documentation system [29] [82]. Compare the banding patterns of the crime scene DNA with those of the suspect samples. A match between bands confirms the suspect's presence at the crime scene.
3. Expected Results and Data Interpretation Successful analysis will show a distinct banding pattern for each sample. The crime scene sample is considered to match a suspect sample if the bands align perfectly at the same molecular weights for all STR loci analyzed. The table below outlines the expected data analysis:
Table 1: Expected Results for Forensic DNA Fingerprinting Analysis
| Sample Type | Expected Banding Pattern | Interpretation |
|---|---|---|
| Crime Scene DNA | Multiple distinct bands at specific sizes (e.g., 100 bp, 150 bp, 200 bp) | Reference profile for comparison with suspects. |
| Suspect 1 DNA | Bands align with crime scene DNA at all loci | Positive match; suspect was present at the scene. |
| Suspect 2 DNA | Bands do not align with crime scene DNA at one or more loci | No match; suspect was not present at the scene. |
| Negative Control | No bands | Confirms no contamination in reagents. |
Pathogen Detection
1. Experimental Principle and Workflow PCR coupled with agarose gel electrophoresis is a gold-standard method for detecting bacterial and viral pathogens in clinical samples [81]. This application targets unique genomic sequences of pathogens, such as viruses like SARS-CoV-2, with high sensitivity and specificity. Following reverse transcription in the case of RNA viruses, PCR amplifies a specific region of the pathogen's genome, which is then separated by AGE to confirm the presence and size of the expected amplicon, enabling rapid diagnosis [81].
2. Detailed Protocol
Step 1: Nucleic Acid Extraction. Extract total nucleic acid (DNA or RNA) from patient samples using swabs, washes, or bronchoalveolar lavage. For RNA viruses like SARS-CoV-2, use a commercial RNA extraction kit. Elute the nucleic acid in nuclease-free water [81].
Step 2: Reverse Transcription and PCR Amplification. For RNA viruses, perform reverse transcription (RT) to generate complementary DNA (cDNA) using a reverse transcriptase enzyme [81]. Subsequently, prepare a PCR mix containing specific primers targeting the pathogen. Use positive and negative controls in each run. Amplify using a thermal cycler with appropriate cycles.
Step 3: Gel Analysis. Follow the standard agarose gel electrophoresis protocol detailed in Section 2.1 (Steps 3-5) using a 1.5-2% gel. Include a positive control (pathogen-specific amplicon) and a DNA ladder for size confirmation.
3. Expected Results and Data Interpretation A positive result is indicated by a clear band at the expected molecular weight for the targeted pathogen amplicon. The absence of a band suggests a negative result, while bands at incorrect sizes may indicate non-specific amplification. The table below summarizes the expected outcomes:
Table 2: Expected Results for Pathogen Detection via PCR and AGE
| Sample Type | Expected Band | Interpretation |
|---|---|---|
| Patient Sample (Positive) | A single, sharp band at the expected size (e.g., 150 bp for a specific virus) | Confirms presence of the target pathogen. |
| Patient Sample (Negative) | No band at the expected size | Suggests absence of the target pathogen. |
| Positive Control | A band at the expected size | Validates the PCR and electrophoresis process. |
| Negative Control (No template) | No bands | Confirms no reagent contamination. |
Vaccine Quality Control
1. Experimental Principle and Workflow The rapid development of mRNA-based therapeutics, including vaccines, necessitates rigorous quality control (QC) to ensure product safety and efficacy [83]. Agarose gel electrophoresis is a fundamental tool used to assess critical quality attributes of in vitro transcribed (IVT) mRNA, such as integrity (full-length mRNA), purity (absence of truncated products), and the detection of impurities like double-stranded RNA (dsRNA) that can elicit unwanted immune responses [83]. This analysis ensures that the mRNA is intact and free from significant contaminants before release.
The workflow for mRNA quality control is outlined below:
2. Detailed Protocol
Step 1: Sample Preparation. Dilute the IVT mRNA sample in nuclease-free water. Mix an appropriate volume (containing ~100-500 ng RNA) with a loading dye containing denaturants if necessary.
Step 2: Gel Preparation and Electrophoresis. Prepare a 1-1.2% denaturing agarose gel (e.g., with formaldehyde) in an appropriate buffer to maintain RNA in a denatured state. Cast and load the gel as described in Section 2.1. Run the gel at a lower voltage (e.g., 5-10 V/cm) to prevent overheating and RNA degradation. For dsRNA detection, a native (non-denaturing) gel can be used, as dsRNA migrates differently than single-stranded RNA (ssRNA) [83].
Step 3: Visualization and Analysis. Stain the gel with an appropriate fluorescent nucleic acid stain and visualize under UV light. Analyze the gel for a single, sharp band corresponding to the full-length mRNA (confirming integrity) and the absence of lower molecular weight smears (indicating degradation) or higher molecular weight bands (suggesting aggregates or dsRNA) [83].
3. Expected Results and Data Interpretation A high-quality mRNA therapeutic sample will appear as a single, dominant band on the gel, corresponding to the full-length product. The presence of additional bands or a smear indicates impurities or degradation, which can compromise vaccine efficacy and safety. The table below details the quality assessment:
Table 3: mRNA Quality Control Analysis via Agarose Gel Electrophoresis
| Sample Attribute | Optimal Gel Result | Suboptimal Gel Result & Implications |
|---|---|---|
| Integrity | A single, sharp, high-intensity band at the expected size. | A smear of lower molecular weight bands; indicates RNA degradation, reduces protein expression efficacy [83]. |
| dsRNA Impurity | No secondary bands above the main mRNA band. | Discrete bands or a smear at a higher molecular weight; indicates immunogenic dsRNA contamination [83]. |
| Product Purity | No background smearing between the well and the main band. | Significant smearing below the main band; indicates abundant truncated RNA species, reducing product potency [83]. |
The Scientist's Toolkit
Successful execution of the protocols above requires specific reagents and equipment. The following table catalogs the essential components of the research toolkit for agarose gel electrophoresis in advanced applications.
Table 4: Essential Research Reagent Solutions and Equipment
| Tool Name | Function/Application |
|---|---|
| Agarose | Polysaccharide used to create the porous gel matrix for size-based separation of DNA/RNA fragments [79]. |
| TBE/TAE Buffer | Provides the ions necessary to conduct electrical current and maintains a stable pH during electrophoresis [79]. |
| DNA/RNA Loading Dye | Contains dyes (e.g., bromophenol blue) for visual tracking during loading and glycerol to increase sample density for sinking in wells [82]. |
| Nucleic Acid Stain (e.g., RED Safe, Ethidium Bromide) | Intercalates with DNA/RNA and fluoresces under UV light, enabling visualization of separated bands [29] [79]. |
| DNA Molecular Weight Ladder | A mixture of DNA fragments of known sizes loaded alongside samples to estimate the size of unknown DNA fragments [82]. |
| Thermal Cycler | Instrument that automates the temperature cycling required for PCR amplification [81]. |
| Electrophoresis Chamber & Power Supply | The chamber holds the gel and running buffer, while the power supply applies a controlled electrical field to drive nucleic acid migration [82]. |
| UV Transilluminator or Gel Doc System | Equipment used to visualize and document the fluorescently stained nucleic acid bands after electrophoresis [82]. |
Agarose gel electrophoresis remains a cornerstone technique for the analysis of PCR products, providing critical validation of amplification success, amplicon size, and sample purity. However, the evolving demands of modern molecular biology—characterized by increasing sample throughput, requirements for greater quantitative precision, and the need for seamless integration with downstream workflows—are driving significant technological transformations. This application note explores three pivotal advancements shaping the future of agarose gel electrophoresis: artificial intelligence (AI)-enabled image analysis, automated instrumentation, and enhanced compatibility with next-generation sequencing (NGS) workflows. We provide detailed protocols and data-driven insights to empower researchers and drug development professionals to leverage these innovations, thereby increasing reproducibility, efficiency, and data yield in their experimental pipelines.
Quantitative Market and Technology Trends
The adoption of advanced electrophoresis technologies is underpinned by strong market growth and clear technological shifts. The following tables summarize key quantitative data relevant for strategic laboratory planning.
Table 1: Agarose Gel and Electrophoresis Market Forecasts
| Metric | Agarose Gel Market | Overall Electrophoresis Market |
|---|---|---|
| Market Size (2024/2025) | USD 750 Million (2024) [13] | USD 3.43 Billion (2025) [84] |
| Projected Market Size (2032/2033) | USD 1.2 Billion (2033) [13] | USD 5.02 Billion (2032) [84] |
| Compound Annual Growth Rate (CAGR) | 5.5% [13] | 5.6% (2025-2032) [84] |
| Dominant Product Segment | - | Instruments (44% share) [84] |
| Key Growth Driver | Demand from molecular biology research & diagnostics [85] | Increasing application in cancer research and genetic diseases [84] |
Table 2: Regional Market Analysis and Dominant Segments
| Region | Market Position | Key Growth Factors |
|---|---|---|
| North America | Dominant (33.5% share of electrophoresis market) [84] | Robust academic and biotech R&D ecosystem, substantial funding, early tech adoption [85] [84]. |
| Asia-Pacific | Fastest-growing region [85] | Increasing R&D investments, growing number of academic and biotech institutions, government genomics initiatives (e.g., India's National Genomics Mission) [85] [84]. |
| Key Agarose Gel Type | 1-1.5% concentration [85] | Optimal balance for separating a wide spectrum of DNA fragment sizes, ideal for routine analysis like PCR product verification [85]. |
| Key End User | University Laboratories & Business Research Institutes [85] | Core of scientific inquiry and drug discovery endeavors [85]. |
AI-Enhanced Gel Image Analysis
The Limitation of Traditional Analysis
Traditional gel image analysis relies on manual band identification or semi-automated algorithms that reduce lane data to one-dimensional intensity profiles. These methods are often tedious, prone to human error, and struggle with sub-optimal gel conditions such as high background, warped bands, or diffuse signals [24]. This variability can compromise data integrity and reproducibility.
GelGenie: An AI-Powered Solution
GelGenie represents a paradigm shift, employing a deep learning model (U-Net) trained on a dataset of over 500 manually labelled gel images to perform pixel-level segmentation, classifying each pixel as 'band' or 'background' [24]. This approach requires no expert knowledge from the user and functions as a single-click application.
Experimental Protocol: Utilizing GelGenie for PCR Product Analysis
- Software Acquisition: Download the open-source GelGenie application from the official repository [24].
- Image Preparation: Capture a digital image of your ethidium bromide-stained agarose gel under UV transillumination. Save the image in a common format (e.g., JPEG, PNG, TIFF). Ensure the image is in focus and has minimal background glare.
- Band Segmentation:
- Open the gel image in the GelGenie application.
- The AI model will automatically pre-process the image and perform band segmentation without requiring user input for lane definition or background correction.
- Data Quantification:
- GelGenie generates a unitless volume for each identified band based on the segmented pixel data.
- For semi-quantitative analysis (e.g., estimating DNA mass), create a standard curve using a DNA ladder with known mass values run on the same gel.
- The software's segmentation-based quantification has been validated to match or surpass the accuracy of traditional background-corrected software like GelAnalyzer [24].
Benefits: This method offers superior performance in identifying bands under challenging conditions, high consistency, and drastically reduced analysis time (results in seconds) [24].
Automation in Agarose Gel Workflows
The manual processes of gel casting, band identification, and excision are significant bottlenecks and sources of variability in high-throughput settings.
Experimental Protocol: Automated Size Selection and QC using the Hamilton NIMBUS Select with Ranger Technology
This protocol enables automated, high-throughput size selection and quality control of PCR products prior to NGS library preparation.
- Principle: The system uses pre-manufactured agarose gel cassettes and a gantry-mounted camera to image DNA fragments during electrophoresis using visible light, avoiding UV-induced damage. Software analyzes the images in real-time, and a robotic arm recovers the target fragment by aligning it with an extraction well [86].
- Materials:
- Hamilton Microlab NIMBUS Select workstation with Ranger Technology [86].
- Ranger agarose gel cassettes.
- Source plate (96-well) containing purified PCR products.
- Elution buffer and collection plate.
- Procedure:
- Setup: Load the source plate and a fresh Ranger cassette onto the workstation deck.
- Parameter Definition: In the control software, define the target base pair range for size selection for each sample.
- Automated Run Initiation: The workstation automatically loads samples from the source plate into the cassette wells.
- Electrophoresis and Imaging: The system runs the electrophoresis, with the integrated camera capturing multiple images to track the migration of DNA bands.
- Target Recovery: The software identifies the target fragment based on its migration distance and automatically positions the cassette to elute the fragment into the collection plate as it passes the recovery well.
- QC Analysis: The system automatically generates electropherograms for all samples before and after size selection, providing immediate quality control data [86].
- Performance Data: This system can process 96 samples in approximately 2 hours, a significant reduction compared to manual protocols. It improves recovery yields, minimizes off-target fragments, and enhances library normalization for sequencing [86].
Integration with Next-Generation Sequencing
Agarose gel electrophoresis plays a critical role in the quality control (QC) and sample preparation steps of NGS workflows. Ensuring the integrity and correct size of DNA libraries before sequencing is vital for achieving high-quality data.
Experimental Protocol: QC of NGS Libraries Using Automated Electrophoresis
- Objective: To validate the fragment size distribution and approximate concentration of a constructed NGS library prior to sequencing.
- Workflow Integration: This protocol fits into the "Library Preparation" and "QC" steps of the standard NGS workflow, which includes Nucleic Acid Extraction, Library Preparation, Sequencing, and Data Analysis [87].
- Procedure:
- Following adapter ligation and PCR amplification of your NGS library, dilute a small aliquot (e.g., 1 µL) of the library.
- Follow the Automated Protocol (Section 4 of this document) using the Hamilton NIMBUS Select with Ranger Technology, but select the "Analytics Only" mode. This mode allows characterization of up to 192 samples in a single run without physical size selection [86].
- The system will generate high-resolution electropherograms for each sample, showing the fragment size distribution. Verify that the distribution peak corresponds to the expected insert size.
- Use the relative fluorescence or integrated signal to approximate library concentration for downstream pooling and normalization.
- Impact: This automated QC step ensures that only libraries passing quality thresholds proceed to sequencing, maximizing sequencing efficiency and reducing costs associated with failed runs [84] [86].
The Scientist's Toolkit: Essential Research Reagents and Materials
Table 3: Key Reagents and Technologies for Advanced Agarose Gel Workflows
| Item | Function/Application | Note |
|---|---|---|
| Agarose Gels (1-1.5%) | Standard workhorse for separation of mid-range DNA fragments (e.g., PCR products) [85]. | Offers optimal pore size for resolving fragments from hundreds of base pairs to several kilobases [85]. |
| Low-Melt Agarose | For specialized applications requiring gentle recovery of DNA, such as molecular cloning. | Enables precise excision of fragments with minimal damage. |
| High-Purity Agarose | Critical for sensitive applications like RNA analysis or long-fragment sequencing. | Minimizes background fluorescence and enzymatic inhibitors. |
| Pre-cast Agarose Gels | For standardized, convenient electrophoresis, compatible with automated systems. | Improves reproducibility and reduces hands-on time. |
| Ranger Technology Cassettes | Pre-manufactured gels for automated size selection and analytics on the Hamilton platform [86]. | Uses visible light for imaging, avoiding DNA damage from UV light. |
| GelGenie Software | Open-source AI application for automated, accurate band identification and quantification [24]. | Requires no expert knowledge; provides results in seconds. |
Workflow Visualization
The following diagrams illustrate the logical and procedural relationships between traditional, AI-enhanced, and automated workflows.
Diagram 1: A comparison of workflow paths for traditional, AI-enhanced, and fully automated agarose gel analysis, highlighting the reduction in manual steps and integration of advanced technologies.
Diagram 2: The integration of advanced agarose gel electrophoresis as a critical QC checkpoint within a broader NGS workflow, enhanced by AI and automation.
The future of agarose gel electrophoresis is one of intelligent integration and automation. The convergence of AI-powered software like GelGenie for unparalleled analytical accuracy, and automated hardware systems like the Hamilton NIMBUS with Ranger Technology for hands-off, high-throughput physical sample handling, is transforming this foundational technique from a manual art into a robust, data-rich, and highly efficient process. By adopting the detailed application notes and protocols outlined in this document, research and development laboratories can significantly enhance the reliability and throughput of their PCR product analysis, seamlessly bridge their work to downstream NGS applications, and maintain a competitive edge in the rapidly advancing fields of molecular biology and drug development.
Conclusion
Agarose gel electrophoresis remains a cornerstone technique for PCR product analysis, indispensable in research, diagnostic, and drug development pipelines. Its enduring value lies in its simplicity, cost-effectiveness, and versatility, from routine verification to critical applications in forensic science and pathogen detection. As the field advances, the integration of higher-purity agarose formulations, automated systems, and AI-driven analysis will further enhance its precision and throughput. Mastery of both foundational practices and advanced troubleshooting ensures reliable results, solidifying its role in the evolving landscape of molecular biology and personalized medicine.
References
- 1. Mastering Electrophoresis: Techniques, Equipment, and ... [https://www.labx.com/resources/mastering-electrophoresis-techniques-equipment-and-applications-in-dna-rna-and-protei/5535]
- 2. Agarose Gel Electrophoresis and Documentation [https://www.nebiogroup.com/gel-documentation-101-agarose-gel-electrophoresis/]
- 3. Agarose gel electrophoresis [https://en.wikipedia.org/wiki/Agarose_gel_electrophoresis]
- 4. Gel Electrophoresis Tables [https://www.thermofisher.com/us/en/home/references/ambion-tech-support/rna-electrophoresis-markers/general-articles/gel-electrophoresis-tables.html]
- 5. Rapid quantitative analysis of double-stranded plasmid ... [https://www.nature.com/articles/s41598-025-85132-w]
- 6. Agarose gel electrophoresis - QB3 Berkeley [https://qb3.berkeley.edu/education/lab-fundamentals-bootcamp/manual/cloning/gel-electrophoresis/]
- 7. Agarose for Gel Electrophoresis Market Size | CAGR of 6.1% [https://market.us/report/agarose-for-gel-electrophoresis-market/]
- 8. Key Trends Reshaping the Agarose Gel Electrophoresis System [https://www.openpr.com/news/4142996/key-trends-reshaping-the-agarose-gel-electrophoresis-system]
- 9. Agarose Gel Electrophoresis System Global Market Report ... [https://www.thebusinessresearchcompany.com/report/agarose-gel-electrophoresis-system-global-market-report]
- 10. Precast Agarose Gel Market Report [https://dataintelo.com/report/global-precast-agarose-gel-market]
- 11. Agarose Precast Gel Market: Future Outlook and Trends 2035 [https://www.wiseguyreports.com/reports/agarose-precast-gel-market]
- 12. Agarose Gel Cell Culture Medium 5.1 CAGR Growth Outlook ... [https://www.archivemarketresearch.com/reports/agarose-gel-cell-culture-medium-781440]
- 13. Agarose Gel Market Demand Forecasts, Size & Trends ... [https://www.linkedin.com/pulse/agarose-gel-market-demand-forecasts-size-trends-2026-2033-tgy3c/]
- 14. 1.8: Unknown Molecular Part II- Agarose Gel and PCR ... [https://bio.libretexts.org/Bookshelves/Microbiology/Introductory_Bacteriology_Lab_Manual_(Turnbull)/01%3A_Labs/1.08%3A_Unknown_Molecular_Part_II-_Agarose_Gel_and_PCR_purification]
- 15. Agarose gel electrophoresis to assess PCR product yield [https://pubmed.ncbi.nlm.nih.gov/35311378/]
- 16. The growing Agarose Market industry's significant 10.3% ... [https://www.linkedin.com/pulse/success-road-map-growing-agarose-market-industrys-6lxhc]
- 17. Agarose LE vs. Agarose – What's the Difference? [https://www.goldbio.com/blogs/articles/agarose-le-vs-agarose-the-difference?srsltid=AfmBOoqpbjB_9E8kuDRcMwRdmKzvKT_16s7cyPwX7sy5mebXZOwg5HVa]
- 18. Low Melt Agarose - High Purity DNA/RNA Recovery [https://www.ibisci.com/products/low-melt-agarose]
- 19. Five Considerations for the Nucleic Acid Gel ... [https://www.thermofisher.com/us/en/home/life-science/cloning/cloning-learning-center/invitrogen-school-of-molecular-biology/na-electrophoresis-education/na-electrophoresis-considerations.html]
- 20. Optimization of Electrophoresis Gel Concentration [https://www.aatbio.com/resources/application-notes/optimization-of-electrophoresis-gel-concentration]
- 21. Eight Tips to Improve Gel Electrophoresis Results [https://www.thermofisher.com/us/en/home/brands/thermo-scientific/molecular-biology/molecular-biology-learning-center/molecular-biology-resource-library/spotlight-articles/8-DNA-ladder-tips.html]
- 22. Agarose Gel Electrophoresis - 2025 UBC iGEM Wiki [https://2025.igem.wiki/ubc-vancouver/protocols/agarose-gel-electrophoresis]
- 23. An affordable and simple method for DNA extraction from ... [https://www.nature.com/articles/s41598-025-87572-w]
- 24. GelGenie: an AI-powered framework for gel ... [https://www.nature.com/articles/s41467-025-59189-0]
- 25. How to do to Agarose Gel Electrophoresis for DNA and RNA ... [https://www.clyte.tech/post/mastering-the-matrix-your-comprehensive-guide-to-agarose-gel-electrophoresis-for-dna-and-rna-analys?srsltid=AfmBOor2T_6DbtvX2CI3FEd4duR1_P1RojG5RNwOw2anIfj3g2nWBX_x]
- 26. Agarose Powder in the Real World: 5 Uses You'll Actually ... [https://www.linkedin.com/pulse/agarose-powder-real-world-5-uses-youll-actually-see-2025-be8ze/]
- 27. Protocol for detecting interactions between intrinsically ... [https://pmc.ncbi.nlm.nih.gov/articles/PMC12305580/]
- 28. Quantitative and qualitative analysis of three DNA ... [https://www.sciencedirect.com/science/article/pii/S266656622400008X]
- 29. Agarose Gel Electrophoresis for Analysis of PCR Products [https://ojs.library.ubc.ca/index.php/UJEMI/article/view/200819]
- 30. Choosing the right agarose percentage for gel ... [https://www.minipcr.com/choosing-the-right-agarose-percentage/]
- 31. Protocols Agarose Gel Electrophoresis [https://www.addgene.org/protocols/gel-electrophoresis/]
- 32. How to Pour an Agarose Gel [https://www.minipcr.com/how-to-pour-an-agarose-gel/]
- 33. Nucleic Acid Gel Electrophoresis Troubleshooting [https://www.thermofisher.com/us/en/home/life-science/cloning/cloning-learning-center/invitrogen-school-of-molecular-biology/na-electrophoresis-education/na-electrophoresis-troubleshooting.html]
- 34. Development of highly sensitive and low-cost DNA agarose ... [https://journals.plos.org/plosone/article?id=10.1371/journal.pone.0222209]
- 35. Development of highly sensitive and low-cost DNA agarose ... [https://pmc.ncbi.nlm.nih.gov/articles/PMC6733488/]
- 36. IV. Analyze PCR Products by Gel Electrophoresis [https://dnabarcoding101.org/lab/protocol-4.html]
- 37. DNA Agarose Gel Electrophoresis [https://wiki.rice.edu/confluence/display/BIODESIGN/DNA+Agarose+Gel+Electrophoresis]
- 38. Agarose Gel Electrophoresis of PCR Products Using E- ... [https://www.thermofisher.com/us/en/home/life-science/dna-rna-purification-analysis/nucleic-acid-gel-electrophoresis/dna-electrophoresis/agarose-gel-electrophoreis/agarose-gel-electrophoresis-protocols-e-gel-ex-agarose-gel-and-ultrapure-agarose.html]
- 39. SURE gel electrophoresis: A method for improved ... [https://pmc.ncbi.nlm.nih.gov/articles/PMC11733979/]
- 40. Modification of gel architecture and TBE/TAE buffer ... [https://pmc.ncbi.nlm.nih.gov/articles/PMC4021863/]
- 41. Choosing the right voltage for your gel electrophoresis run [https://www.minipcr.com/choosing-the-right-voltage/]
- 42. SYBR Safe DNA Gel Stain [https://www.thermofisher.com/us/en/home/life-science/dna-rna-purification-analysis/nucleic-acid-gel-electrophoresis/dna-stains/sybr-safe.html]
- 43. GelRed [https://www.aatbio.com/resources/application-notes/gelred]
- 44. Viability Stain Automated Cell Counting [https://logosbio.com/how-to-choose-the-right-viability-stain-for-automated-cell-counting-tb-eb-ao-pi-and-fda-pi-compared/]
- 45. SYBR™ Safe DNA Gel Stain Starter Kit - FAQs [https://www.thermofisher.com/order/catalog/product/S33110/faqs]
- 46. Invitrogen SYBR Safe DNA Gel Stain 400 μL | Buy Online [https://www.fishersci.com/shop/products/invitrogen-sybr-safe-dna-gel-stain-1/S33102]
- 47. DNA Stains for Gel Electrophoresis [https://www.thermofisher.com/us/en/home/life-science/dna-rna-purification-analysis/nucleic-acid-gel-electrophoresis/dna-stains.html]
- 48. Optimizing PCR: Proven Tips and Troubleshooting Tricks [https://www.the-scientist.com/optimizing-pcr-proven-tips-and-troubleshooting-tricks-71660]
- 49. Sustainable and Cost-Effective Gel Documentation - PMC [https://pmc.ncbi.nlm.nih.gov/articles/PMC10037652/]
- 50. How Do YOU Stain Your DNA? [https://bitesizebio.com/13520/how-do-you-stain-your-dna/]
- 51. PCR Assay Optimization and Validation [https://www.sigmaaldrich.com/US/en/technical-documents/technical-article/genomics/pcr/assay-optimization-and-validation?srsltid=AfmBOooJvlbSNSY0GDLH56XMOU7MIpWSngJEx0kmpn3cFAEzaW1-DYXR]
- 52. Sustainable Methodologies for Efficient Gel ... [https://www.mdpi.com/2409-9279/6/2/25]
- 53. Agarose Gel Electrophoresis for the Separation of DNA ... [https://pmc.ncbi.nlm.nih.gov/articles/PMC4846332/]
- 54. Troubleshooting Agarose Gels: Top Tips for Perfect Images [https://bitesizebio.com/50016/troubleshooting-agarose-gel/]
- 55. Troubleshooting Nucleic Acid Gel Electrophoresis—Solved in ... [https://www.yeasenbio.com/blogs/molecular-biology/troubleshooting-nucleic-acid-gel-electrophoresis-solved-in-one-go]
- 56. Your DNA may be degraded [https://www.thermofisher.com/us/en/home/life-science/pcr/real-time-pcr/real-time-pcr-learning-center/real-time-pcr-basics/real-time-pcr-troubleshooting-tool/snp-genotyping-troubleshooting/trailing-clusters/dna-may-be-degraded.html]
- 57. SURE gel electrophoresis: A method for improved ... [https://www.sciencedirect.com/science/article/abs/pii/S000326972300338X]
- 58. How can I separate PCR fragments that are small and very ... [https://www.qiagen.com/us/resources/faq/800]
- 59. 5 Ways to Destroy your Agarose Gel and How to Avoid Them! [https://bitesizebio.com/10199/5-ways-to-destroy-your-agarose-gel/]
- 60. Interpreting Electrophoresis Gels [https://bento.bio/resources/bento-lab-advice/interpreting-electrophoresis-gels-with-bento-lab/]
- 61. Mastering Gel Electrophoresis: 10 Tips and Tricks for ... [https://americanlaboratorytrading.com/mastering-gel-electrophoresis-10-tips-and-tricks-for-successful-results/?srsltid=AfmBOorCMwwfCUxkp-aGtU8I_e1CJj4kfCSZsNW8T5qm99s8jkOqNfDR]
- 62. 核酸电泳工作流程-琼脂糖凝胶电泳步骤方法 - 赛默飞 [https://www.thermofisher.cn/cn/zh/home/life-science/cloning/cloning-learning-center/invitrogen-school-of-molecular-biology/na-electrophoresis-education/na-electrophoresis-workflow.html]
- 63. 13.3: Lab Technique - Agarose Gel Electrophoresis of DNA [https://bio.libretexts.org/Courses/West_Los_Angeles_College/Biotechnology/13%3A_Biotechnology_Lab_Protocols/13.03%3A_Lab_Technique_-_Agarose_Gel_Electrophoresis_of_DNA]
- 64. Polymerase Chain Reaction (PCR) - PMC [https://pmc.ncbi.nlm.nih.gov/articles/PMC4102308/]
- 65. Introduction to Quantitative PCR (qPCR) Gene Expression ... [https://www.thermofisher.com/us/en/home/life-science/pcr/real-time-pcr/real-time-pcr-learning-center/gene-expression-analysis-real-time-pcr-information/introduction-gene-expression.html]
- 66. ISO 11781:2025 - Molecular biomarker analysis [https://www.iso.org/standard/83912.html]
- 67. Development of real-time PCR methods for quality control ... [https://pmc.ncbi.nlm.nih.gov/articles/PMC12058689/]
- 68. Essential Tips for PCR & DNA Cleanup: Maximize Your ... [https://www.neb.com/en-us/nebinspired-blog/essential-tips-for-pcr-and-dna-cleanup-maximize-your-dna-purity-and-yield?srsltid=AfmBOopeSbu0R-K_Vn3H4DYJWrejcG8DeeWoEBk-3-qjN3uiHcyYyenB]
- 69. Assessment of DNA Yield and Purity: an Overlooked Detail ... [https://www.sciencedirect.com/science/article/abs/pii/S0196439911000560]
- 70. PCR Cleanup: Purifying Your PCR Product [https://www.thermofisher.com/us/en/home/references/an-introduction-to-cloning-a-researchers-guide-to-cloning-dna/purifying-your-pcr-product.html]
- 71. Capillary vs. Gel Electrophoresis: Differences, Advantages, ... [https://www.bostonind.com/blog/capillary-vs-gel-electrophoresis-differences-advantages-and-applications?srsltid=AfmBOoo9h6jN_nI3ksI-yzzl2uaoobl1xFVvPGHJIv3yHvqGw_0hMAYs]
- 72. Development of PCR, qPCR and LAMP methods for the ... [https://pmc.ncbi.nlm.nih.gov/articles/PMC12508883/]
- 73. One-step and two-step qPCR assays for CAPRV2023 [https://www.frontiersin.org/journals/veterinary-science/articles/10.3389/fvets.2025.1620997/full]
- 74. Optimization of Loop-Mediated Isothermal Amplification for ... [https://pmc.ncbi.nlm.nih.gov/articles/PMC12560903/]
- 75. Capillary Electrophoresis vs. Gel Electrophoresis [https://www.labx.com/resources/capillary-electrophoresis-vs-gel-electrophoresis-a-comprehensive-guide/5548]
- 76. High sensitivity-low cost detection of SARS-CoV-2 by two ... [https://www.nature.com/articles/s41598-021-00900-8]
- 77. Performance comparison of capillary and agarose gel ... [https://pubmed.ncbi.nlm.nih.gov/18285269/]
- 78. Rapid baseline hump-free analysis of therapeutic proteins ... [https://pubmed.ncbi.nlm.nih.gov/40409905/]
- 79. Agarose gel electrophoresis of DNA: Principles, protocols, ... [https://deepscienceresearch.com/dsr/catalog/book/107/chapter/405]
- 80. 10: Gel Electrophoresis, Restriction Enzymes, and DNA ... [https://bio.libretexts.org/Courses/Harrisburg_Area_Community_College/BIOL_101%3A_Lab_Manual-_Version_2/10%3A_Gel_Electrophoresis_Restriction_Enzymes_and_DNA_Fingerprinting]
- 81. Polymerase Chain Reaction (PCR) - StatPearls - NCBI - NIH [https://www.ncbi.nlm.nih.gov/books/NBK589663/]
- 82. Gel Electrophoresis Steps [https://azurebiosystems.com/blog/gel-electrophoresis-steps/]
- 83. Current Analytical Strategies for mRNA-Based Therapeutics [https://pmc.ncbi.nlm.nih.gov/articles/PMC11990077/]
- 84. Electrophoresis Market Trends, Share and Forecast, 2025- ... [https://www.coherentmarketinsights.com/market-insight/electrophoresis-market-2666]
- 85. Key Drivers for Agarose Gel Market Growth [https://www.datainsightsmarket.com/reports/agarose-gel-1033304]
- 86. How Automating Agarose Gel Fragment Selection and ... [https://www.labmanager.com/how-it-works-a-workstation-for-automating-agarose-gel-fragment-selection-and-sample-analysis-8062]
- 87. 了解NGS工作流程的基本步骤 [https://www.illumina.com.cn/science/technology/next-generation-sequencing/beginners/ngs-workflow.html]