A Comprehensive Step-by-Step Guide to SDS-PAGE: From Basic Principles to Advanced Troubleshooting
This article provides researchers, scientists, and drug development professionals with a complete guide to SDS-PAGE protein separation.
A Comprehensive Step-by-Step Guide to SDS-PAGE: From Basic Principles to Advanced Troubleshooting
Abstract
This article provides researchers, scientists, and drug development professionals with a complete guide to SDS-PAGE protein separation. It covers foundational principles of protein electrophoresis, detailed methodological protocols, essential troubleshooting for common issues, and advanced validation techniques. The content integrates theoretical understanding with practical laboratory applications, offering optimization strategies to ensure reliable, reproducible results in proteomic analysis and biomedical research.
Understanding SDS-PAGE: Core Principles and Electrophoresis Fundamentals
Electrophoresis is a fundamental laboratory technique used to separate biomolecules such as proteins, nucleic acids, and other charged particles based on their differential migration in an electric field. When charged molecules are placed in an electric field, they experience a force that causes them to migrate toward the oppositely charged electrode. The rate of migration depends on the molecule's net charge, size, shape, and the properties of the surrounding matrix. This technique has become indispensable in biochemistry, molecular biology, and biotechnology for analyzing complex mixtures of biological molecules.
Sodium Dodecyl Sulfate-Polyacrylamide Gel Electrophoresis (SDS-PAGE) represents a specialized and highly effective application of this principle for protein analysis. Developed by Ulrich Laemmli in 1970, SDS-PAGE has become one of the most widely cited methods in biological research due to its reliability and resolving power [1] [2]. By combining the molecular sieving properties of a polyacrylamide gel matrix with the uniform charging effect of SDS detergent, this technique allows researchers to separate protein mixtures with high resolution based primarily on molecular weight.
Fundamental Principles of SDS-PAGE
The Role of Sodium Dodecyl Sulfate (SDS)
SDS is an anionic detergent that plays two critical roles in protein electrophoresis. First, it denatures proteins by breaking non-covalent bonds including hydrogen bonds and hydrophobic interactions [3] [4]. This disruption of higher-order structure causes proteins to unfold into linear polypeptide chains. Second, SDS binds to the unfolded proteins at a relatively constant ratio of approximately 1.4 grams of SDS per gram of protein [1] [4]. Since SDS is negatively charged, it confers a uniform negative charge to all proteins in direct proportion to their mass [3].
This SDS coating achieves two important effects:
- It eliminates the influence of the protein's intrinsic charge
- It creates a relatively uniform charge-to-mass ratio across different proteins
As a result, when placed in an electric field, all SDS-coated proteins migrate toward the positive anode (the positively charged electrode), with their migration rate determined primarily by molecular size rather than native charge [3] [2]. The only exception to this general rule involves proteins with significant post-translational modifications such as glycosylation or phosphorylation, which may bind SDS differently and cause minor deviations from expected migration [3].
Polyacrylamide Gel as a Molecular Sieve
The polyacrylamide gel matrix serves as a molecular sieve that imposes frictional resistance on migrating proteins [4]. This gel is created through the polymerization of acrylamide monomers cross-linked by N,N'-methylenebisacrylamide, forming a three-dimensional network with controllable pore sizes [5] [4]. The pore size distribution within this network is determined by the concentration of acrylamide and bis-acrylamide, with higher percentages creating smaller pores [3].
During electrophoresis, smaller proteins navigate through this porous matrix more easily than larger proteins, allowing separation based on molecular dimensions [2]. This molecular sieving effect means that under the influence of an electric field, smaller polypeptides migrate more rapidly through the gel, while larger polypeptides are retarded [4]. The gel concentration can be optimized for specific protein size ranges, with lower acrylamide concentrations (e.g., 5-8%) better suited for separating high molecular weight proteins, and higher concentrations (e.g., 12-15%) providing superior resolution for smaller proteins [5] [2].
The Discontinuous Buffer System
SDS-PAGE employs a discontinuous buffer system that significantly enhances separation resolution compared to continuous systems [3] [1]. This system utilizes:
- A stacking gel with lower acrylamide concentration (typically 4-5%) and pH 6.8
- A separating (resolving) gel with higher acrylamide concentration (typically 8-15%) and pH 8.8
- A running buffer at pH 8.3 containing Tris, glycine, and SDS [3] [4]
The key to this system lies in the ionic behavior of glycine. In the stacking gel at pH 6.8, glycine exists primarily as zwitterions with minimal net charge, causing it to migrate slowly [3]. Chloride ions (from Tris-HCl) migrate rapidly as leading ions, while glycine zwitterions function as trailing ions. This creates a narrow voltage gradient that concentrates protein samples into sharp bands before they enter the separating gel [3] [1]. When this stacked protein front reaches the separating gel at pH 8.8, glycine becomes predominantly negatively charged and migrates faster, depositing the proteins in a tight band at the top of the separating gel where actual size-based separation begins [3].
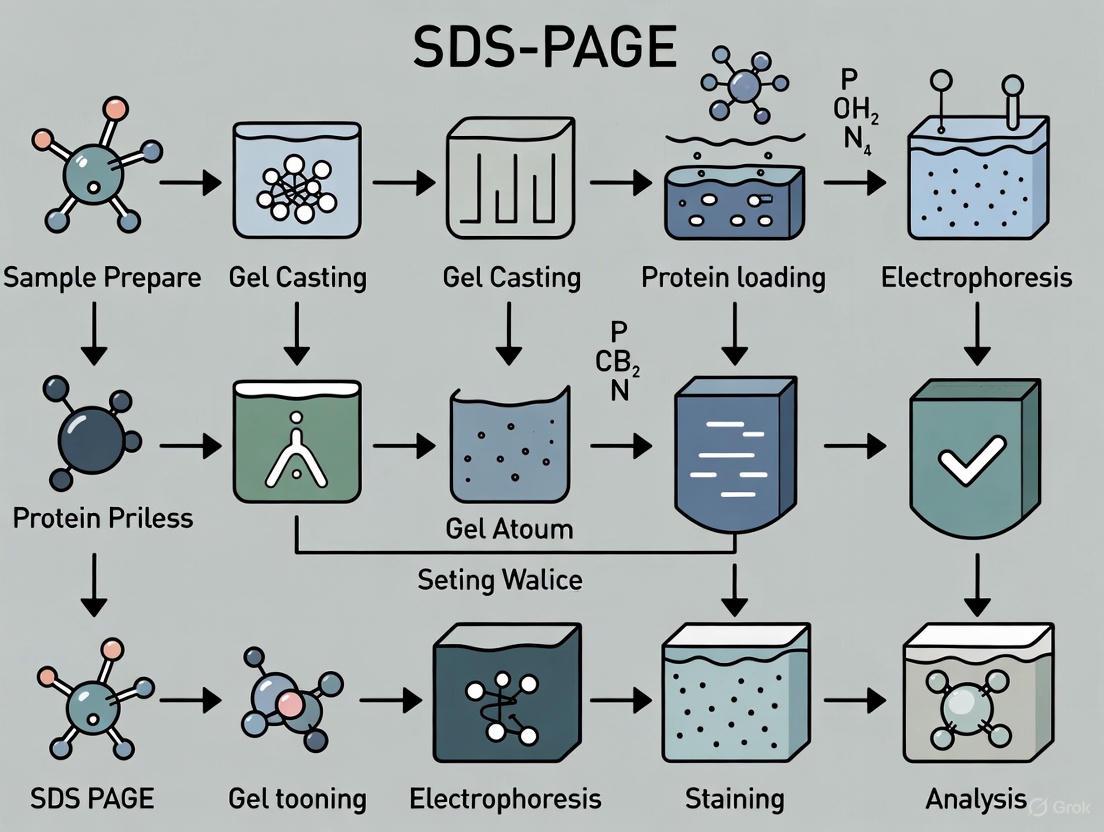
Visualization of the SDS-PAGE separation mechanism showing the stepwise process from sample preparation to final separation.
Research Reagent Solutions
Successful SDS-PAGE requires specific biochemical reagents, each serving a distinct function in the separation process. The table below details the essential components and their roles in the electrophoresis system.
Table 1: Essential Reagents for SDS-PAGE and Their Functions
| Reagent | Composition/Properties | Function in SDS-PAGE |
|---|---|---|
| SDS (Sodium Dodecyl Sulfate) | Anionic detergent [3] | Denatures proteins, confers uniform negative charge, masks intrinsic protein charge [3] [2] |
| Acrylamide/Bis-acrylamide | Monomer (acrylamide) and cross-linker (bis-acrylamide) [4] | Forms polyacrylamide gel matrix with controlled pore sizes for molecular sieving [3] [5] |
| Tris Buffers | Tris-HCl at different pH values (6.8 for stacking, 8.8 for separating gel) [3] [5] | Maintains pH critical for discontinuous buffer system and glycine charge states [3] |
| Glycine | Amino acid with pH-dependent charge [3] | Key component of running buffer; zwitterionic in stacking gel, anionic in separating gel [3] [1] |
| Ammonium Persulfate (APS) & TEMED | Persulfate radical initiator and tertiary amine catalyst [5] [4] | Catalyzes acrylamide polymerization by generating free radicals [3] [1] |
| Molecular Weight Standards | Proteins of known molecular weight, prestained or unstained [6] | Reference for estimating molecular weights of unknown proteins [5] [6] |
| Sample Buffer | Tris-HCl, SDS, glycerol, bromophenol blue, β-mercaptoethanol or DTT [3] [4] | Denatures proteins, provides tracking dye, adds density for loading, reduces disulfide bonds [3] |
Step-by-Step SDS-PAGE Protocol
Gel Preparation
Table 2: Typical Gel Compositions for Different Protein Size Ranges
| Gel Acrylamide Concentration (%) | Optimal Separation Range (kDa) | Application Notes |
|---|---|---|
| 5% | 57-212 [5] | Best for very high molecular weight proteins |
| 7.5% | 36-94 [5] | Medium to high molecular weight proteins |
| 10% | 16-68 [5] | Standard range for most routine applications |
| 12% | 12-60 (extrapolated) | Enhanced resolution for medium-sized proteins |
| 15% | 12-43 [5] | Optimal for low molecular weight proteins |
Safety Note: Acrylamide is a potent neurotoxin and should be handled with appropriate personal protective equipment, including gloves [5] [4].
Separating Gel Preparation
- Assemble glass plates according to manufacturer's instructions, ensuring a tight seal to prevent leakage [5].
- Prepare separating gel solution by mixing the following components in the order listed for a 10% gel (adjust volumes according to gel size):
- Degas the solution briefly to remove oxygen which can inhibit polymerization [4].
- Add polymerization catalysts: 50 μL 10% ammonium persulfate (freshly prepared) and 5 μL TEMED [4]. Mix gently without introducing bubbles.
- Pour the gel solution immediately between the glass plates, leaving space for the stacking gel (approximately 1-2 cm below the comb).
- Overlay with saturated butanol or isopropanol to create a flat interface and exclude oxygen [5] [1].
- Allow complete polymerization for 20-30 minutes at room temperature. A distinct refractive interface will be visible when polymerization is complete.
Stacking Gel Preparation
- Pour off the overlay liquid and rinse the top of the polymerized separating gel with deionized water. Remove excess water with filter paper [5].
- Prepare stacking gel solution by mixing:
- Degas the solution and add catalysts: 25 μL 10% ammonium persulfate and 5 μL TEMED [4].
- Pour the stacking gel solution onto the polymerized separating gel.
- Immediately insert a clean comb without introducing air bubbles.
- Allow polymerization for 15-20 minutes at room temperature [4].
Sample Preparation
- Dilute protein samples in an appropriate buffer. For samples in high-salt buffers, consider precipitating proteins using TCA/acetone to remove interfering salts [5].
- Mix protein solution with SDS-PAGE sample buffer (typically 4:1 sample to buffer ratio) containing:
- Heat samples at 95°C for 5 minutes (or 70°C for 10 minutes) to ensure complete denaturation [1] [4].
- Briefly centrifuge samples to collect condensation and ensure uniform sample distribution.
Electrophoresis Procedure
- Assemble the gel apparatus according to manufacturer's instructions and place in the electrophoresis tank.
- Fill the inner and outer chambers with running buffer (25 mM Tris, 192 mM glycine, 0.1% SDS, pH 8.3) [4].
- Carefully remove the comb and rinse wells with running buffer to remove unpolymerized acrylamide.
- Load samples and molecular weight markers into appropriate wells using gel-loading pipette tips. Include molecular weight standards in at least one lane [5] [6].
- Connect the power supply with correct polarity (proteins migrate toward the positive anode).
- Run electrophoresis at constant voltage:
- Turn off the power supply when electrophoresis is complete.
Protein Visualization
Coomassie Staining
Coomassie Brilliant Blue staining provides a robust, quantitative method for protein detection with sensitivity to approximately 50 ng per band [7].
Table 3: Coomassie Staining Protocol
| Step | Solution | Duration | Purpose |
|---|---|---|---|
| Fixation | 40% ethanol, 10% acetic acid [4] | 30 minutes | Precipitate and immobilize proteins in gel |
| Staining | 0.05% Coomassie R-250 in 40% ethanol, 10% acetic acid [7] | 1-2 hours with gentle agitation | Bind dye to proteins |
| Destaining | 40% ethanol, 10% acetic acid [7] | 1-2 hours with multiple changes | Remove background stain |
| Storage | 7% acetic acid or water | Indefinitely | Preserve stained gel |
Silver Staining
Silver staining offers higher sensitivity (2-5 ng protein per band) but is less quantitative and may interfere with downstream applications [7]. The protocol typically includes fixation, sensitization, silver impregnation, development, and termination steps [4].
Applications and Analysis
Molecular Weight Determination
SDS-PAGE enables estimation of protein molecular weight by comparing the migration distance of unknown proteins to that of standard proteins with known molecular weights [5] [2]. A semi-logarithmic plot of molecular weight versus migration distance (Rf value) typically produces a linear relationship through which unknown molecular weights can be interpolated [4].
Quality Control and Purity Assessment
SDS-PAGE is widely used to assess:
- Protein sample purity by visualizing contaminating bands [2]
- Protein integrity by detecting proteolytic degradation or aggregation
- Expression levels in recombinant protein production
- Post-translational modifications that alter electrophoretic mobility [2]
Preparative Applications
Beyond analytical applications, SDS-PAGE serves as a preparative technique for:
- Western blotting by transferring separated proteins to membranes for immunodetection [5] [2]
- Protein purification by excising bands from preparative gels
- Protein sequencing and mass spectrometric analysis
SDS-PAGE experimental workflow from sample preparation to data analysis, highlighting key steps and approximate time requirements.
Troubleshooting Common Issues
Even well-optimized SDS-PAGE protocols can encounter problems. The table below addresses common issues and their solutions.
Table 4: Troubleshooting Common SDS-PAGE Problems
| Problem | Possible Causes | Solutions |
|---|---|---|
| Smiling or frowning bands | Uneven heating, poor buffer circulation, uneven gel polymerization [2] | Ensure adequate buffer volume, use constant voltage, check cooling systems [2] |
| Vertical streaking | Incomplete denaturation, protein aggregation, air bubbles in gel [4] | Extend heating time, add fresh reducing agents, degas gel solutions [4] |
| Poor resolution | Incorrect gel percentage, too fast electrophoresis, old buffers [2] | Optimize acrylamide concentration, reduce voltage, prepare fresh buffers [5] [2] |
| Atypical migration | Improper SDS binding, post-translational modifications [3] | Ensure fresh SDS in buffers, consider protein modifications [3] [4] |
| Gel polymerization issues | Degraded APS, oxygen inhibition, impure reagents [4] | Use fresh APS (<1 week old), degas solutions, use high-purity reagents [4] |
| No bands or faint bands | Insufficient protein, inefficient transfer, protease degradation | Increase protein load, add protease inhibitors, verify staining protocol |
Advanced Applications and Recent Developments
While traditional SDS-PAGE remains widely used, several advanced implementations have enhanced its capabilities:
- Gradient gels provide a continuous pore size gradient, allowing simultaneous separation of proteins across a broad molecular weight range [1] [2].
- Two-dimensional electrophoresis combines isoelectric focusing (first dimension) with SDS-PAGE (second dimension) to resolve complex protein mixtures with high resolution [2].
- Fluorescent detection methods offer improved sensitivity, quantitative linear range, and compatibility with downstream mass spectrometric analysis compared to traditional staining methods [8].
- Capillary gel electrophoresis versions of SDS-PAGE provide automated, quantitative analysis with minimal sample requirements [9].
The fundamental principles of electrophoresis that enable SDS-PAGE continue to support innovations in protein analysis, making it an enduring cornerstone technique in biological research and biopharmaceutical development.
Sodium dodecyl sulfate-polyacrylamide gel electrophoresis (SDS-PAGE) is a foundational technique in biochemistry and molecular biology that enables the separation of proteins based primarily on their molecular weight [10]. This method relies on the synergistic action of SDS, an anionic detergent, and a polyacrylamide gel matrix to resolve complex protein mixtures with high resolution [2]. The critical innovation that makes this separation possible is the ability of SDS to denature proteins and confer upon them a uniform charge-to-mass ratio, thereby eliminating the influence of native protein charge and structure on electrophoretic mobility [11] [10]. Within the context of a broader thesis on protein separation methodologies, this application note provides detailed protocols and fundamental principles underlying SDS-PAGE, with specific emphasis on its application in research and drug development settings.
Principles of SDS-Mediated Protein Denaturation
Mechanism of SDS Action
SDS plays two crucial roles in protein denaturation for electrophoresis. First, as an anionic detergent, it disrupts nearly all non-covalent interactions—including hydrogen bonds, hydrophobic interactions, and ionic bonds—that maintain protein secondary and tertiary structures [2] [10]. This disruption unfolds the native protein conformation, converting complex three-dimensional structures into linear polypeptide chains [12]. Second, SDS binds to the denatured polypeptides with high affinity at a consistent ratio of approximately 1.4 grams of SDS per 1 gram of protein [11] [10]. This extensive binding coats the protein backbone with negative charges, effectively masking the proteins' intrinsic charge contributed by acidic and basic amino acid residues [11].
Establishment of Uniform Charge-to-Mass Ratio
The uniform binding of SDS to polypeptides creates a consistent net negative charge across all proteins in the sample. Since the amount of SDS bound is directly proportional to protein size (molecular weight), the charge-to-mass ratio becomes essentially identical for all SDS-coated proteins [11] [10]. This fundamental principle transforms electrophoretic separation from a process influenced by multiple protein characteristics (size, charge, shape) into one determined primarily by molecular size alone [13]. When subjected to an electric field, these linear, negatively charged polypeptides will migrate through the polyacrylamide gel matrix at rates inversely proportional to their molecular weights, with smaller proteins moving faster than larger ones [14] [2].
Table 1: Key Steps in SDS-Mediated Protein Denaturation
| Step | Process | Outcome |
|---|---|---|
| 1 | SDS disruption of non-covalent bonds | Loss of secondary/tertiary structure |
| 2 | Linearization of polypeptide chains | Formation of random coil conformations |
| 3 | SDS binding to hydrophobic regions | Uniform negative charge distribution |
| 4 | Reduction of disulfide bonds | Separation of protein subunits |
| 5 | Heat application | Complete denaturation and SDS binding |
Visualization of SDS-Mediated Protein Denaturation and Separation
The following diagram illustrates the sequential process from native protein denaturation to size-based separation in SDS-PAGE:
Materials and Reagents
The Scientist's Toolkit: Essential Research Reagent Solutions
Successful SDS-PAGE requires precise preparation and quality reagents. The following table details essential materials and their specific functions in the electrophoresis process:
Table 2: Essential Reagents for SDS-PAGE and Their Functions
| Reagent/Chemical | Function | Critical Specifications |
|---|---|---|
| SDS (Sodium Dodecyl Sulfate) | Denatures proteins; imparts uniform negative charge [2] [10] | High purity; concentration typically 0.1-1% in buffers |
| Acrylamide/Bis-acrylamide | Forms cross-linked gel matrix for molecular sieving [14] [10] | 29:1 or 37.5:1 ratio of acrylamide to bis-acrylamide |
| Tris-HCl Buffer | Maintains pH during gel polymerization and electrophoresis [12] | Stacking gel: pH 6.8; Resolving gel: pH 8.8 [11] |
| Ammonium Persulfate (APS) | Initiates free radical polymerization of acrylamide [14] | Freshly prepared 10% solution recommended |
| TEMED | Catalyzes acrylamide polymerization reaction [14] [15] | Stored refrigerated; protects from light |
| Glycine | Mobile ion in discontinuous buffer system [11] [12] | Electrophoresis grade; running buffer component |
| β-mercaptoethanol or DTT | Reducing agent breaks disulfide bonds [16] [10] | Added fresh to sample buffer; typically 0.1-0.5M |
| Molecular Weight Markers | Size standards for protein weight estimation [14] [10] | Pre-stained or unstained; cover expected size range |
| Coomassie Brilliant Blue | Protein stain for visualization after electrophoresis [17] [15] | 0.1% in destaining solution (methanol:acetic acid:water) |
Detailed SDS-PAGE Protocol
Sample Preparation
Proper sample preparation is critical for successful protein separation. The protocol must ensure complete denaturation and reduction of protein samples:
Prepare Sample Buffer: Create 2X Laemmli buffer containing 4% SDS, 10% glycerol, 125 mM Tris-HCl (pH 6.8), 0.02% bromophenol blue, and 10% β-mercaptoethanol (or 100 mM DTT) as reducing agent [16] [12]. The inclusion of a reducing agent is essential for breaking disulfide bonds that may maintain polypeptide connectivity [10].
Mix Sample with Buffer: Combine protein sample with an equal volume of 2X sample buffer in a microcentrifuge tube [16]. For cell lysates, typical total protein loading amounts range from 10-50 μg per lane; for purified proteins, 1-10 μg may be sufficient [16] [15].
Denature Proteins: Heat samples at 95-100°C for 5-10 minutes in a heating block or water bath [16] [15]. This heating step facilitates complete denaturation and ensures optimal SDS binding to the polypeptide chains.
Brief Centrifugation: Centrifuge heated samples at 12,000 × g for 30 seconds to pellet any insoluble debris that might interfere with electrophoresis [15].
Gel Selection and Preparation
The appropriate acrylamide concentration must be selected based on the molecular weight range of the target proteins:
Table 3: Acrylamide Concentration Guidelines for Optimal Protein Separation
| Acrylamide Percentage | Effective Separation Range | Applications |
|---|---|---|
| 8% | 25-200 kDa [2] | Large proteins and protein complexes |
| 10% | 15-100 kDa [2] | Standard separation for most proteins |
| 12% | 10-200 kDa [14] [11] | Broad range separation |
| 15% | 10-50 kDa [14] | Small to medium-sized proteins |
| 4-20% Gradient | 10-300 kDa [14] [2] | Optimal for samples with diverse molecular weights |
For manual gel preparation:
Prepare Resolving Gel: Mix appropriate volumes of acrylamide/bis-acrylamide solution, Tris-HCl (pH 8.8), SDS, and water. Add ammonium persulfate and TEMED last to initiate polymerization, then immediately pour the gel solution between assembled glass plates, leaving space for the stacking gel [15]. Carefully overlay with water-saturated butanol or isopropanol to create a flat interface [14].
Prepare Stacking Gel: After resolving gel polymerization (approximately 30 minutes), pour off the overlay and prepare stacking gel solution containing lower acrylamide concentration (typically 4-5%) and Tris-HCl (pH 6.8) [11] [10]. Add APS and TEMED, pour over the resolving gel, and immediately insert a clean comb [15].
Polymerization: Allow the stacking gel to polymerize completely for at least 30-60 minutes at room temperature before use [15].
Electrophoresis Procedure
The electrophoresis process employs a discontinuous buffer system to achieve high-resolution separation:
Assemble Electrophoresis Unit: Place the polymerized gel into the electrophoresis chamber and fill both inner and outer chambers with running buffer (25 mM Tris, 192 mM glycine, 0.1% SDS, pH 8.3) [16] [12].
Load Samples: Carefully load prepared protein samples and molecular weight markers into the wells using a micropipette. Appropriate loading volumes typically range from 5-35 μL per lane depending on well size and protein concentration [16].
Apply Electrical Current: Connect the power supply with the cathode (negative electrode) at the top and anode (positive electrode) at the bottom. Run the gel at constant voltage: 80-100 V through the stacking gel, then 120-150 V through the resolving gel until the dye front reaches the bottom of the gel [16] [15]. Total run time is typically 45-90 minutes depending on gel size and voltage [16].
Terminate Electrophoresis: Turn off the power supply when the bromophenol blue tracking dye reaches approximately 1 cm from the bottom of the gel [15].
Protein Visualization
Following electrophoresis, separated proteins must be stained for visualization and analysis:
Gel Staining: Carefully remove the gel from the glass plates and place in Coomassie Brilliant Blue staining solution (0.1% Coomassie R-250 in 40% methanol, 10% acetic acid) for 15-60 minutes with gentle agitation [17] [15].
Destaining: Transfer the gel to destaining solution (40% methanol, 10% acetic acid) for 30-60 minutes with several changes of solution until the background is clear and protein bands are distinctly visible [17] [15].
Imaging and Analysis: Capture a digital image of the stained gel using a gel documentation system. Analyze band patterns, estimate molecular weights by comparison with standards, and assess protein purity based on band number and sharpness [17] [10].
Troubleshooting Common Issues
Even with careful execution, various issues may arise during SDS-PAGE that affect result interpretation:
Table 4: Common SDS-PAGE Issues and Recommended Solutions
| Problem | Potential Causes | Solutions |
|---|---|---|
| Smiling or frowning bands | Uneven heating across gel [14] | Ensure uniform buffer distribution; reduce voltage if necessary |
| Smeared bands | Incomplete denaturation [14] | Add fresh reducing agent; ensure adequate boiling time |
| Vertical band streaking | Protein aggregation or precipitation [14] | Centrifuge samples before loading; reduce protein concentration |
| Diffuse bands | Incorrect buffer pH [14] | Prepare fresh running and sample buffers |
| Uneven band migration | Improper polymerization [2] | Ensure fresh APS and TEMED; mix gel solutions thoroughly |
| No bands or faint bands | Insufficient protein loading [14] | Increase protein amount; optimize staining protocol |
| Unexpected molecular weight | Post-translational modifications [12] | Consider glycosylation, phosphorylation; use deglycosylation enzymes |
Advanced Applications and Modifications
Western Blotting Integration
SDS-PAGE routinely serves as the first step in western blotting, providing size-based separation prior to protein transfer to a membrane for antibody-based detection [2] [15]. For western applications, prestained molecular weight markers are particularly valuable as they allow visualization of transfer efficiency and protein size estimation directly on the membrane [14].
Two-Dimensional Electrophoresis
For complex protein mixtures, two-dimensional electrophoresis combines isoelectric focusing (first dimension) with SDS-PAGE (second dimension) to dramatically increase resolution [2]. This technique separates proteins based on both charge and molecular weight, enabling resolution of thousands of protein spots from a single sample [2].
Native SDS-PAGE Modifications
A modified approach called native SDS-PAGE (NSDS-PAGE) reduces SDS concentration and eliminates heating and reducing agents to preserve certain functional properties while maintaining good protein resolution [18]. This technique enables retention of enzymatic activity and metal cofactors in some proteins, with studies demonstrating 98% zinc retention in metalloproteins compared to 26% with standard SDS-PAGE [18].
SDS-PAGE remains an indispensable technique in protein research decades after its development, primarily due to the robust mechanism of SDS-mediated protein denaturation that achieves uniform charge-to-mass ratios across diverse protein populations [11] [2]. The comprehensive protocol detailed in this application note provides researchers with a reliable framework for protein separation, while troubleshooting guidelines address common practical challenges. When executed with attention to critical steps—particularly sample preparation with adequate reduction and denaturation, appropriate gel percentage selection, and proper buffer preparation—SDS-PAGE delivers reproducible, high-resolution protein separation that forms the foundation for numerous downstream applications in research and drug development.
The polyacrylamide gel matrix serves as the fundamental molecular sieve in numerous electrophoretic techniques, most notably in Sodium Dodecyl Sulfate-Polyacrylamide Gel Electrophoresis (SDS-PAGE). This three-dimensional network is formed through the chemical polymerization of acrylamide monomers cross-linked by N,N'-methylenebisacrylamide (Bis) [19] [10]. The resulting structure creates a porous mesh that selectively retards the movement of molecules based on their size and shape during electrophoresis [19]. The gel matrix is chemically inert, mechanically stable, and exhibits minimal endosmosis, making it an ideal medium for the high-resolution separation of biological macromolecules, particularly proteins and nucleic acids [20].
The discovery and continuous refinement of polyacrylamide gel electrophoresis represent a cornerstone in modern molecular biology and biochemistry. While early electrophoretic methods utilized starch gel, the introduction of polyacrylamide gels by Raymond & Weintraub in 1959 marked a significant advancement [20]. The subsequent development of the discontinuous SDS-PAGE system by Ulrich Laemmli in 1970 revolutionized protein analysis by allowing separation primarily based on molecular weight, substantially improving the resolution of protein bands [1] [2]. This system remains the foundation for most contemporary protein electrophoretic techniques, enabling researchers to analyze complex protein mixtures with exceptional precision and reproducibility.
Table 1: Key Historical Developments in Polyacrylamide Gel Electrophoresis
| Year | Development | Key Contributors | Significance |
|---|---|---|---|
| 1959 | Introduction of PAGE | Raymond & Weintraub | First use of polyacrylamide gels for electrophoretic separation |
| 1960s | Discontinuous electrophoresis | Davis and Ornstein | Introduced stacking and separating gel concept |
| 1970 | SDS-PAGE system | Laemmli | Incorporated SDS for molecular weight-based separation |
| 1980s+ | Gradient and native PAGE | Multiple researchers | Enhanced resolution for diverse molecular weights and native states |
The Molecular Sieve Effect: Principles and Mechanisms
Fundamental Principles of Molecular Sieving
The molecular sieve effect describes the phenomenon where a porous matrix selectively retards the passage of molecules based on their physical dimensions. In polyacrylamide gel electrophoresis, this effect enables the separation of proteins according to their molecular weights [10] [21]. When an electric field is applied, negatively charged protein-SDS complexes migrate toward the anode through the gel matrix. Smaller proteins navigate the porous network more easily, encountering less resistance, while larger proteins experience greater frictional drag and are progressively retarded [1] [2]. This differential migration results in the spatial separation of proteins along the gel, with smaller proteins traveling farther from the origin than their larger counterparts [10].
The molecular sieve effect operates independently of the inherent charge characteristics of proteins, thanks to the uniform negative charge imparted by SDS binding. This fundamental principle ensures that electrophoretic mobility depends almost exclusively on molecular size rather than charge or shape [21] [2]. The polyacrylamide gel thus acts as a tunable molecular filter, with its sieving properties precisely controlled by the researcher through adjustments in gel composition and concentration [19].
Pore Size Determinants in Polyacrylamide Gels
The pore size of a polyacrylamide gel is not fixed but represents an average distribution within the three-dimensional network. This critical parameter primarily depends on two factors: the total acrylamide concentration (%T) and the cross-linker proportion (%C) [19] [20].
Total Acrylamide Concentration (%T): This represents the combined concentration of both acrylamide and bisacrylamide in the gel solution. As %T increases, the average pore size decreases, creating a tighter mesh that provides better resolution for smaller proteins. Conversely, lower %T values create larger pores suitable for separating higher molecular weight proteins [19] [22].
Cross-linker Proportion (%C): This defines the weight percentage of bisacrylamide relative to the total acrylamide. The cross-linker determines the density of junctions between polyacrylamide chains, directly influencing the mechanical stability and porosity of the resulting gel [20]. Optimal cross-linking typically occurs at 2.5-5% C, with deviations from this range resulting in either brittle gels (high %C) or overly fragile gels (low %C) [20].
Table 2: Recommended Gel Concentrations for Protein Separation
| Target Protein Size Range | Recommended Gel Percentage | Primary Application |
|---|---|---|
| 4-40 kDa | 15-20% | Small peptides and proteins |
| 10-70 kDa | 12.5% | Broad middle range separation |
| 15-100 kDa | 10% | Common protein separation |
| 50-200 kDa | 8% | Large proteins |
| >200 kDa | 4-6% | Very large proteins and complexes |
The polymerization reaction itself is initiated by ammonium persulfate (APS), which generates free radicals, and N,N,N',N'-tetramethylethylenediamine (TEMED), which catalyzes the polymerization process [1] [21]. The kinetics of this reaction affect the homogeneity of the resulting gel matrix, with rapid polymerization potentially leading to heterogeneous pore size distribution. Environmental factors such as temperature and oxygen presence (which inhibits polymerization) must be carefully controlled to ensure reproducible gel formation with consistent sieving properties [23].
Experimental Protocols for Gel Matrix Preparation
Standard Polyacrylamide Gel Formulation
The preparation of polyacrylamide gels with defined pore sizes requires precise formulation and controlled polymerization conditions. The following protocol details the preparation of a standard discontinuous SDS-PAGE gel system, consisting of a stacking gel and a resolving gel with different acrylamide concentrations and pH values [1] [10].
Materials Required:
- Acrylamide/bis-acrylamide stock solution (30% T, 2.6% C)
- Tris-HCl buffers (0.5 M, pH 6.8 for stacking gel; 1.5 M, pH 8.8 for resolving gel)
- Sodium dodecyl sulfate (SDS, 10% solution)
- Ammonium persulfate (APS, 10% solution, freshly prepared)
- N,N,N',N'-Tetramethylethylenediamine (TEMED)
- Water-saturated isobutanol or butanol
- Protein molecular weight standards
Resolving Gel Preparation Protocol:
- Assemble gel cassette according to manufacturer's instructions, ensuring no leaks.
- Prepare resolving gel solution based on desired acrylamide concentration (refer to Table 2 for guidance). For a 10% resolving gel, combine:
- 3.3 mL acrylamide/bis solution (30%)
- 4.0 mL Tris-HCl (1.5 M, pH 8.8)
- 2.6 mL deionized water
- 100 μL SDS (10%)
- 100 μL APS (10%)
- 10 μL TEMED
- Mix gently but thoroughly and immediately pipette the solution into the gel cassette, leaving space for the stacking gel.
- Carefully overlay with water-saturated isobutanol to exclude oxygen and ensure a flat gel surface.
- Allow complete polymerization (typically 20-30 minutes at room temperature).
- After polymerization, pour off the overlay and rinse gel surface with deionized water.
Stacking Gel Preparation Protocol:
- Prepare stacking gel solution (typically 4-5% acrylamide):
- 0.65 mL acrylamide/bis solution (30%)
- 1.25 mL Tris-HCl (0.5 M, pH 6.8)
- 3.05 mL deionized water
- 50 μL SDS (10%)
- 50 μL APS (10%)
- 10 μL TEMED
- Mix gently and immediately pipette onto the polymerized resolving gel.
- Immediately insert a clean comb, avoiding air bubbles.
- Allow complete polymerization (15-20 minutes at room temperature).
- Carefully remove the comb and rinse wells with electrophoresis buffer.
Gradient Gel Preparation Techniques
Polyacrylamide gradient gels provide a continuous change in pore size from the top to the bottom of the gel, creating a pore gradient that separates a broader range of protein sizes on a single gel than fixed-concentration gels [19] [22]. Gradient gels produce sharper protein bands because as proteins migrate, the leading edge encounters smaller pores and slows down while the trailing edge continues moving, creating a stacking effect throughout the gel [22].
Two methods for gradient gel preparation:
Using a Gradient Mixer:
- Prepare low and high acrylamide concentration solutions (without TEMED and APS).
- Place low-concentration solution in the reservoir chamber and high-concentration solution in the mixing chamber.
- Add catalysts to both solutions immediately before pouring.
- Open the connection between chambers and start flow to gel cassette using gravity or a peristaltic pump.
- The gradient forms as the high-concentration solution mixes with the decreasing volume of low-concentration solution.
Pipette Method (Simplified Approach):
- Prepare low and high acrylamide solutions with catalysts.
- Using a serological pipette, draw up half the total volume needed from the low-concentration solution.
- Without releasing the bulb, draw the second half from the high-concentration solution.
- Aspirate a small air bubble (approximately 0.5 mL) and allow it to travel up the pipette to mix the solutions.
- Slowly dispense the gradient solution into the gel cassette [22].
Table 3: Gradient Gel Formulations for Different Separation Needs
| Separation Goal | Gradient Range | Protein Size Range | Key Advantage |
|---|---|---|---|
| Broad discovery | 4-20% | 4-250 kDa | Maximum range in single gel |
| Targeted analysis | 8-15% | 10-100 kDa | Optimized for common proteins |
| High resolution | 10-12.5% | 50-75 kDa | Separation of similar sizes |
The Scientist's Toolkit: Essential Reagents and Materials
Successful polyacrylamide gel electrophoresis requires specific reagents and equipment, each serving a critical function in the separation process. The following table details the essential components of the SDS-PAGE workflow.
Table 4: Essential Research Reagents and Materials for SDS-PAGE
| Reagent/Material | Composition/Specifications | Primary Function |
|---|---|---|
| Acrylamide-Bis Solution | 29:1 or 37.5:1 acrylamide:bis ratio; typically 30-40% stock | Forms the backbone of the gel matrix; concentration determines pore size |
| Tris-HCl Buffer | 0.5-1.5 M; pH 6.8 (stacking) and 8.8 (separating) | Maintains pH during electrophoresis; critical for discontinuous system |
| SDS (Sodium Dodecyl Sulfate) | 10-20% aqueous solution | Denatures proteins and confers uniform negative charge |
| APS (Ammonium Persulfate) | 10% solution in water (freshly prepared) | Free radical initiator for acrylamide polymerization |
| TEMED | N,N,N',N'-Tetramethylethylenediamine | Catalyzes polymerization by accelerating free radical formation |
| Electrophoresis Buffer | Tris-glycine with 0.1% SDS, pH ~8.3 | Conducts current and maintains pH during separation |
| Sample Buffer | Tris-HCl, SDS, glycerol, bromophenol blue, ± reducing agent | Denatures proteins, adds density for loading, provides visible marker |
| Protein Standards | Pre-stained or unstained proteins of known molecular weight | Molecular weight calibration and migration control |
| Gel Staining Reagents | Coomassie Blue, Silver Stain, or fluorescent dyes | Visualizes separated proteins after electrophoresis |
Advanced Applications and Methodological Variations
Specialized Electrophoresis Techniques
The versatility of polyacrylamide gel matrices extends beyond standard SDS-PAGE to several specialized applications that address specific research needs:
Tricine-SDS-PAGE: This variation is particularly optimized for the separation of small proteins and peptides (1-100 kDa) that may co-migrate with SDS micelles in traditional glycine-based systems. The tricine trailing ion system provides better resolution in the lower molecular weight range, making it invaluable for proteomic studies involving peptide analysis [1] [23].
Native PAGE (NSDS-PAGE): Contrary to standard denaturing SDS-PAGE, native PAGE preserves protein structure and function by omitting SDS from the buffer system or using minimal concentrations. This technique allows separation based on both charge and size while maintaining enzymatic activity and protein-protein interactions [18]. Recent modifications have demonstrated that reducing SDS concentration to 0.0375% while eliminating EDTA and heating steps can retain Zn²⁺ binding in metalloproteins while maintaining high resolution [18].
Two-Dimensional Electrophoresis (2D-PAGE): This sophisticated technique combines two orthogonal separation methods: isoelectric focusing (IEF) in the first dimension followed by SDS-PAGE in the second dimension. The result is a high-resolution map where thousands of protein spots can be resolved and analyzed, making it particularly powerful for proteomic studies, biomarker discovery, and analysis of post-translational modifications [19] [2].
Applications in Food Science and Biotechnology
The polyacrylamide gel matrix serves as an indispensable tool in food science and biotechnology, with diverse applications:
Food Authentication and Adulteration Detection: SDS-PAGE is widely employed for species identification in meat and seafood products, detection of adulterants in gluten-free products, and verification of food labeling accuracy through unique protein fingerprinting [23].
Quality Control in Processing: The technique monitors protein integrity and quality changes during various food processing stages, including the impact of thermal processing, fermentation, and storage on protein structure and functionality [23].
Allergen Detection: Specific protein allergens in complex food matrices can be identified and quantified using SDS-PAGE in combination with immunoblotting techniques, contributing to food safety assurance [23].
Functional Property Assessment: The technique helps correlate protein composition with functional properties such as elasticity (gluten), foaming (albumins and globulins), and gelling capacity, guiding product development in the food industry [23].
Workflow Visualization: SDS-PAGE Experimental Process
The following diagram illustrates the complete SDS-PAGE workflow, from gel preparation to protein separation, highlighting the molecular sieve effect:
Troubleshooting and Optimization Strategies
Common Technical Issues and Solutions
Several factors can impact the accuracy and resolution of protein separation in polyacrylamide gels. Understanding these variables is crucial for refining methodology to achieve distinct, sharply defined bands that accurately represent the proteins under examination [23]:
Smiling or Frowning Bands: This common artifact, where bands curve upward or downward, typically results from uneven heating during electrophoresis. To mitigate this issue, ensure consistent sample loading, avoid overloading wells, reduce voltage slightly, and use an efficient cooling system if available. Additionally, verify that buffer levels are equal across both chambers of the electrophoresis unit [2].
Incomplete Protein Separation: Poor resolution between protein bands often stems from insufficient run time, incorrect acrylamide concentration, or improper buffer preparation. To improve separation, allow sufficient migration time (tracking dye should approach bottom of gel), adjust acrylamide concentration to match target protein size range, and freshly prepare electrophoresis buffers to maintain proper pH and conductivity [2].
Gel Polymerization Problems: Inconsistent polymerization can lead to non-parallel bands, sample leakage, and poor separation. Ensure full polymerization by using fresh APS solutions, maintaining consistent temperature during casting, and protecting the gel from oxygen exposure (which inhibits polymerization). Handle wells carefully during comb removal to prevent tearing [2].
Optimization of Electrophoresis Conditions
Voltage and Run Time Optimization: Standard practice involves running gels at 100-150 volts for 40-60 minutes or until the dye front reaches the gel's bottom. Running the gel too long can lead to the loss of lower molecular weight bands, while running it too briefly may result in poor resolution, particularly for smaller proteins [2].
Buffer System Selection: The choice of running buffer affects protein migration characteristics. For instance, proteins tend to migrate faster through the same concentration of polyacrylamide when using MOPS-based running buffer compared to MES-based buffer, with the former providing greater resolution between bands and the latter allowing visualization of a broader protein size range [22].
Gel Thickness Considerations: Standard mini-gels typically have thicknesses of 0.75 mm or 1.5 mm, which directly affects loading capacity and resolution. Thinner gels (0.75 mm) provide sharper bands but lower sample capacity, while thicker gels (1.5 mm) allow more protein loading but may produce slightly broader bands and require longer run times [1].
The development of polyacrylamide gel electrophoresis (PAGE) represents a cornerstone achievement in biochemical analysis, enabling researchers to separate complex protein mixtures with high resolution. The journey from Raymond and Weintraub's pioneering work to Laemmli's refined protocol marks a critical evolution in protein science methodology. This progression transformed a technically challenging process into a standardized, widely accessible technique that continues to underpin modern molecular biology and drug development research.
This protocol traces the historical pathway of SDS-PAGE development, detailing the specific technical limitations that each innovation addressed and providing a comprehensive modern methodology for today's research applications. Understanding this historical context provides researchers with deeper insight into both the theoretical foundations and practical considerations essential for successful protein separation experiments.
Historical Context and Technical Evolution
The development of protein electrophoresis technologies occurred through sequential innovations that progressively enhanced reproducibility, resolution, and practicality.
Table 1: Key Historical Developments in PAGE Methodology
| Year(s) | Researcher(s) | Key Innovation | Technical Limitation Overcome |
|---|---|---|---|
| 1959 | Raymond and Weintraub | First polyacrylamide gels for electrophoresis | Lack of a suitable supporting matrix for protein separation |
| Early 1960s | Davis, Ornstein | Discontinuous gel electrophoresis with stacking and separating gels | Poor band resolution and sharpness |
| 1970 | Laemmli | Incorporation of SDS into discontinuous PAGE system | Protein separation influenced by charge and shape rather than molecular weight alone |
The Raymond and Weintraub Foundation
In 1959, Raymond and Weintraub introduced polyacrylamide as a novel matrix for electrophoretic separation, creating the foundation for all subsequent PAGE methodologies. Their critical insight was that polyacrylamide gels provided a stable, chemically inert, and tunable pore size matrix that could effectively separate protein molecules based on their size and charge characteristics. This innovation addressed the fundamental need for a supporting medium that could minimize diffusion and convection during electrophoresis, thereby enabling sharper band separation than previously possible with paper or cellulose acetate supports.
Discontinuous System Development
Throughout the early 1960s, researchers including Davis and Ornstein made crucial advancements by developing the discontinuous gel electrophoresis system. This approach utilized a two-layer gel structure consisting of:
- A stacking gel with large pores and different pH chemistry that concentrated proteins into a sharp starting zone
- A separating gel with appropriate pore size that resolved proteins based on size
This concentration effect significantly improved band sharpness and resolution compared to the single-phase systems initially used, setting the stage for further refinements in separation technology.
Laemmli's Transformative Contribution
The most significant advancement came in 1970 when Ulrich Laemmli published his SDS-PAGE protocol, which incorporated sodium dodecyl sulfate (SDS) into the discontinuous gel system. This integration created a unified methodology that offered several critical advantages:
Molecular Weight-Based Separation: SDS, an anionic detergent, binds to proteins at a relatively constant ratio (approximately 1.4g SDS per 1g protein), masking the proteins' intrinsic charge and imparting a uniform negative charge density. This eliminated migration variability due to protein charge or shape, enabling separation primarily by molecular weight [2].
Protein Denaturation: SDS effectively denatures proteins by breaking hydrophobic interactions and disrupting hydrogen bonds, unfolding proteins into linear chains and facilitating accurate size-based separation [2].
Standardized Methodology: Laemmli's specific buffer formulations, gel compositions, and running conditions created a reproducible protocol that could be universally adopted across laboratories.
The profound impact of Laemmli's system lies in its ability to provide reliable protein separation that directly correlates with molecular weight, a capability that has made it an indispensable tool in molecular biology for nearly five decades.
Modern SDS-PAGE Protocol
This section provides a detailed step-by-step methodology for performing SDS-PAGE according to Laemmli's principles, incorporating contemporary refinements and practical considerations.
Research Reagent Solutions
Table 2: Essential Reagents and Materials for SDS-PAGE
| Reagent/Material | Function/Purpose | Key Considerations |
|---|---|---|
| Acrylamide/Bis Solution | Forms polyacrylamide gel matrix; pore size determines separation range | Concentration typically 30-40% acrylamide with 2.6-3.3% bis-acrylamide; neurotoxin in monomer form |
| SDS (Sodium Dodecyl Sulfate) | Denatures proteins and confers uniform negative charge | Critical for disrupting non-covalent interactions; typically used at 0.1% in gels and buffers |
| Ammonium Persulfate (APS) | Initiates acrylamide polymerization | Fresh preparation recommended; decay reduces polymerization efficiency |
| TEMED (Tetramethylethylenediamine) | Catalyzes acrylamide polymerization | Accelerates free radical formation; added just before casting |
| Tris Buffers | Maintain pH during electrophoresis and protein stability | Stacking gel (pH 6.8), resolving gel (pH 8.8), and running buffer (pH 8.3) |
| Glycine | Leading ion in discontinuous buffer system | Mobility changes with pH to create stacking effect |
| Protein Molecular Weight Marker | Provides size references for unknown proteins | Pre-stained or unstained options available; essential for quantification [24] |
| Reducing Agents (DTT, β-mercaptoethanol) | Breaks disulfide bonds for complete denaturation | Critical for analyzing multi-subunit proteins; typically 50-100mM concentration |
Sample Preparation Protocol
Proper sample preparation is critical for accurate protein separation and analysis:
Protein Extraction: Homogenize tissue or cell samples in lysis buffer containing Tris-HCl (pH 6.8), SDS, and glycerol. For skeletal muscle tissues, mechanical homogenization using a polytron homogenizer followed by sonication is recommended for complete protein extraction [25].
Protein Quantification: Determine protein concentration using a colorimetric assay (e.g., Bradford assay). Adjust concentrations to ensure equal loading across gels [24].
Sample Denaturation: Mix protein samples with Laemmli buffer (62.5 mM Tris-HCl pH 6.8, 2% SDS, 10% glycerol, 5% β-mercaptoethanol, 0.01% bromophenol blue) and heat at 95-100°C for 5-10 minutes to ensure complete denaturation [2].
Centrifugation: Briefly centrifuge samples (12,000 × g, 1 minute) to collect condensation and ensure uniform sample loading.
Gel Casting and Electrophoresis
The following workflow diagram illustrates the complete SDS-PAGE process:
Gel Preparation
Resolving Gel Solution: Combine appropriate volumes of acrylamide/bis solution (typically 8-15% depending on target protein size), 1.5 M Tris-HCl (pH 8.8), SDS, and water. Deaerate the solution to prevent bubble formation during polymerization.
Polymerization Initiation: Add ammonium persulfate (0.05% final concentration) and TEMED (0.1% final concentration), mix gently, and immediately pour between glass plates. Overlay with isopropanol or water to create a flat interface.
Stacking Gel Solution: Once resolving gel has polymerized (20-30 minutes), prepare stacking gel solution (typically 4-5% acrylamide) with 0.5 M Tris-HCl (pH 6.8). Add APS and TEMED, pour over resolving gel, and insert well comb.
Table 3: Gel Concentration Guidelines for Protein Separation
| Target Protein Size Range | Recommended Acrylamide Concentration | Expected Migration Position |
|---|---|---|
| <20 kDa | 12-20% | Near dye front in lower gel |
| 20-100 kDa | 10-12% | Middle to lower third of gel |
| 100-200 kDa | 8-10% | Upper to middle third of gel |
| >200 kDa | 5-8% | Top portion of separating gel |
Electrophoresis Conditions
Assembly and Buffer: Place polymerized gel in electrophoresis chamber and fill with running buffer (25 mM Tris, 192 mM glycine, 0.1% SDS, pH 8.3).
Sample Loading: Load prepared protein samples (typically 10-50 μg total protein) and molecular weight markers into wells.
Electrophoresis Parameters: Run gel at constant voltage:
- 80 V through stacking gel (approximately 20-30 minutes)
- 120-150 V through resolving gel (approximately 60-90 minutes)
- Continue until dye front reaches bottom of gel (approximately 1-1.5 hours total)
Analysis and Quantification Methods
Following electrophoresis, multiple approaches are available for protein visualization and quantification.
Protein Staining and Visualization
- Coomassie Brilliant Blue: Standard staining for general protein detection; sensitivity ~50-100 ng/band
- Silver Staining: High-sensitivity detection; can visualize 0.1-1 ng/band
- Fluorescent Stains: Broad dynamic range and compatibility with downstream analyses
- Destaining: Remove excess dye using methanol-acetic acid solution (Coomassie) or water (fluorescent stains) to enhance band clarity [2]
Densitometry and Quantitative Analysis
Protein bands can be quantified using densitometry, which measures optical density and corresponds to protein concentration in each band [2] [24].
Gel Imaging: Capture high-resolution digital image of stained gel using appropriate lighting (transmission for Coomassie, epi-illumination for fluorescence).
Image Analysis: Use software such as ImageJ to:
- Convert image to grayscale
- Subtract background using rolling ball algorithm (typically 250 pixels radius)
- Define lanes and detect bands
- Measure peak area for each band [24]
Quantification: Generate standard curve using known protein standards (e.g., BSA dilution series) or molecular weight markers with known concentrations. Plot band intensity versus protein concentration to determine unknown sample concentrations [24].
Troubleshooting and Optimization
Successful SDS-PAGE requires attention to potential technical challenges and optimization opportunities.
Table 4: Common SDS-PAGE Issues and Solutions
| Problem | Potential Causes | Solutions |
|---|---|---|
| Smiling or frowning bands | Uneven heating, buffer ion depletion, improper buffer concentration | Ensure uniform cooling, use fresh running buffer, verify buffer composition |
| Poor resolution | Incorrect gel percentage, insufficient run time, protein aggregation | Adjust acrylamide concentration based on protein size, extend run time, optimize sample preparation with reducing agents [2] |
| Vertical streaking | Incomplete sample dissolution, particulate matter | Centrifuge samples before loading, ensure complete homogenization |
| Diffuse bands | Too much sample loaded, gel polymerization issues | Reduce protein load, ensure complete gel polymerization before use |
Advanced Applications and Modifications
Gradient Gels: Polyacrylamide gradients (e.g., 5-20%) provide enhanced resolution for complex protein mixtures across a wide molecular weight range [2].
Two-Dimensional Electrophoresis: Combines isoelectric focusing (first dimension) with SDS-PAGE (second dimension) to resolve thousands of proteins in a single analysis [2].
Stain-Free Technology: Utilizes trihalo compounds to modify tryptophan residues, enabling protein detection without traditional staining through UV-induced fluorescence [24].
The historical progression from Raymond and Weintraub's initial polyacrylamide gels to Laemmli's comprehensive SDS-PAGE protocol represents a paradigm shift in protein analysis capabilities. Laemmli's incorporation of SDS into the discontinuous gel system created a robust, reproducible methodology that remains the gold standard for protein separation five decades after its introduction. This technique's enduring relevance stems from its unique combination of molecular weight-based separation, high resolution, and technical accessibility.
For contemporary researchers, understanding both the historical development and practical implementation of SDS-PAGE provides valuable insights for adapting this fundamental technique to increasingly complex analytical challenges in biochemistry, molecular biology, and drug development. The protocol detailed herein maintains the core principles established by Laemmli while incorporating modern refinements that enhance reliability and quantitative capabilities, ensuring its continued utility for future scientific advancement.
Sodium dodecyl sulfate-polyacrylamide gel electrophoresis (SDS-PAGE) is a foundational technique in biochemistry and molecular biology for separating proteins based on their molecular weight. [1] The effectiveness of this separation hinges on the precise formation of a polyacrylamide gel matrix with specific sieving properties. This application note details the critical roles of acrylamide, bisacrylamide, and TEMED in forming this matrix, providing researchers and drug development professionals with a detailed protocol and framework for understanding SDS-PAGE gel chemistry within the broader context of protein separation research.
The Chemist's Toolkit: Core Reagents for SDS-PAGE Gel Formation
The formation of a polyacrylamide gel requires a specific set of reagents, each fulfilling a distinct and critical role in creating the three-dimensional network essential for protein separation.
Table 1: Essential Reagents for Polyacrylamide Gel Formation
| Reagent | Chemical Function | Role in Gel Formation |
|---|---|---|
| Acrylamide | Monomer | Serves as the primary building block, forming linear polymer chains that constitute the gel's backbone. [26] [27] |
| Bisacrylamide | Cross-linking agent | Links adjacent polyacrylamide chains to form a three-dimensional mesh network, determining the gel's pore size and mechanical stability. [26] [27] |
| TEMED | Catalyst / Free radical stabilizer | Initiates and accelerates the polymerization reaction by catalyzing the formation of free radicals from ammonium persulfate (APS). [28] [27] |
| Ammonium Persulfate (APS) | Free radical initiator | Provides the free radicals necessary to initiate the polymerization chain reaction of acrylamide and bisacrylamide monomers. [28] [27] |
| Tris-HCl Buffer | pH stabilizer | Maintains the optimal pH for the polymerization reaction and the subsequent electrophoretic separation. [29] |
The Polymerization Mechanism: From Monomers to Gel Matrix
The formation of the polyacrylamide gel is a chemical polymerization reaction initiated by a free-radical system. The sequence of events and the specific interactions between the components can be visualized in the following workflow.
Figure 1: Workflow of the free radical polymerization process in polyacrylamide gel formation.
The process begins when TEMED catalyzes the decomposition of APS into free radicals. [28] [30] These free radicals then activate the acrylamide monomers, initiating a chain reaction where these monomers link together to form long, linear polyacrylamide chains. [26] Simultaneously, the bisacrylamide monomers, which contain two acrylamide groups, are incorporated into the growing polymer chains. Because of its bifunctional nature, bisacrylamide forms covalent bridges between adjacent polyacrylamide chains, thereby creating a stable, cross-linked three-dimensional network. [26] [27] The concentration of acrylamide and the ratio of acrylamide to bisacrylamide ultimately define the pore size of the resulting gel, which determines its protein separation range. [27]
Quantitative Guide to Gel Percentage and Protein Separation
The resolving power of an SDS-PAGE gel is primarily controlled by the total concentration of acrylamide and bisacrylamide, denoted as %T. Selecting the appropriate gel percentage is crucial for achieving optimal separation of the target proteins.
Table 2: Acrylamide Gel Percentage and Effective Protein Separation Range
| Size of Protein (kDa) | % Acrylamide in Resolving Gel |
|---|---|
| 4 – 40 | 20% |
| 12 – 45 | 15% |
| 10 – 70 | 12.5% |
| 15 – 100 | 10% |
| 25 - 200 | 8% |
Adapted from a common SDS-PAGE gel recipe. [30]
Detailed Protocol: Casting a Discontinuous SDS-PAGE Gel
The following protocol provides a step-by-step methodology for preparing a standard discontinuous SDS-PAGE gel with a 12% resolving gel and a 4% stacking gel, suitable for separating a wide range of proteins. [30]
Materials and Reagent Preparation
- Acrylamide/Bis-acrylamide Solution: 30% (w/v) stock, typically at a 37.5:1 ratio. [30]
- Resolving Gel Buffer: 1.5 M Tris-HCl, pH 8.8. [29]
- Stacking Gel Buffer: 0.5 M Tris-HCl, pH 6.8. [29]
- SDS Solution: 10% (w/v). [30]
- Ammonium Persulfate (APS): 10% (w/v) solution in water, prepared fresh. [31]
- TEMED
- Water-saturated Butanol or Isopropanol for overlaying. [29] [30]
Step-by-Step Procedure
- Assemble Gel Cassette: Clean and dry the glass plates and spacers. Assemble the cassette and secure it in the casting stand according to the manufacturer's instructions, ensuring a leak-proof seal. [30] [31]
- Prepare Resolving Gel Mix: For a 12% resolving gel, combine the following components in a beaker or flask in the order listed, excluding TEMED and APS initially: [30]
- 4.0 mL of 30% Acrylamide/Bis solution
- 3.75 mL of 1.5 M Tris-HCl, pH 8.8
- 150 µL of 10% SDS
- 4.1 mL of deionized H₂O
- Initiate Resolving Gel Polymerization: Add 75 µL of 10% APS and 7.5 µL of TEMED to the mixture. [30] Swirl gently to mix without introducing bubbles.
- Pour Resolving Gel: Immediately pipette the resolving gel solution into the gap between the glass plates, leaving space for the stacking gel (approximately 2.5 cm from the top). [30]
- Overlay with Alcohol: Carefully layer a small amount of water-saturated butanol or isopropanol on top of the resolving gel to exclude oxygen and ensure a flat, uniform interface. [29] [30] Allow the gel to polymerize completely (typically 30-45 minutes). A distinct schlieren line will appear upon polymerization.
- Prepare Stacking Gel Mix: After pouring off the overlay and rinsing the gel surface with water, prepare the 4% stacking gel by combining: [30]
- 1.98 mL of 30% Acrylamide/Bis solution
- 3.78 mL of 0.5 M Tris-HCl, pH 6.8
- 150 µL of 10% SDS
- 9 mL of deionized H₂O
- Initiate Stacking Gel Polymerization: Add 75 µL of 10% APS and 15 µL of TEMED to the stacking gel solution and mix. [30]
- Pour Stacking Gel and Insert Comb: Pour the stacking gel solution directly onto the polymerized resolving gel. Immediately insert a clean comb into the cassette, being careful to avoid trapping air bubbles under the teeth. Allow the stacking gel to polymerize for 30-45 minutes. [30]
- Remove Comb and Store Gel: Once polymerized, carefully remove the comb. The gel can be used immediately or wrapped in moist tissue paper, sealed in plastic wrap, and stored at 4°C for several weeks. [30]
Safety Considerations
Acrylamide and bisacrylamide monomers are potent neurotoxins and are suspected carcinogens. [31] Always wear appropriate personal protective equipment (PPE), including gloves and a lab coat, when handling solutions containing these chemicals. Work in a well-ventilated area, preferably within a fume hood, and clean up any spills immediately. [29] Dispose of acrylamide-contaminated materials according to institutional hazardous waste regulations. [31]
A deep understanding of the roles of acrylamide, bisacrylamide, and TEMED is fundamental to mastering SDS-PAGE. Acrylamide forms the polymer backbone, bisacrylamide creates the defining pore structure, and TEMED is an essential catalyst for the gelation reaction. By precisely controlling the concentrations and ratios of these critical components as outlined in this application note, researchers can reliably produce gels tailored for specific protein separation needs, thereby ensuring robust and reproducible results in protein analysis and drug development workflows.
Mastering SDS-PAGE Protocol: Step-by-Step Laboratory Execution
Sodium dodecyl sulfate-polyacrylamide gel electrophoresis (SDS-PAGE) is a foundational technique in biochemical research for separating proteins based on their molecular weight. The success of this technique hinges on the precise preparation of stacking and resolving gel solutions. These solutions create a discontinuous gel system that first concentrates protein samples into sharp bands before resolving them by size with high resolution. The composition of these gels directly impacts pore size, which determines the effective separation range for proteins. Proper reagent preparation requires not only accuracy in measurement but also an understanding of the biochemical role each component plays in the electrophoresis process. This protocol provides detailed recipes and methodologies for preparing SDS-PAGE gels that deliver consistent, reproducible results for protein analysis in research and drug development applications.
Principles of SDS-PAGE Gel Formulation
The resolving power of SDS-PAGE stems from a polyacrylamide gel matrix formed through the copolymerization of acrylamide and a cross-linking agent, N,N'-methylenebisacrylamide (bis-acrylamide). This polymerization is catalyzed by ammonium persulfate (APS) and accelerated by the catalyst N,N,N',N'-tetramethylethylenediamine (TEMED), creating a three-dimensional network with pores that sieve proteins during electrophoresis [4].
The discontinuous gel system comprises two distinct layers with different pore sizes and pH environments [4]. The stacking gel (pH ~6.8) has a large-pore, low-concentration polyacrylamide matrix that concentrates the protein samples into a narrow zone before they enter the resolving gel. The separating gel (pH ~8.8) has a smaller-pore, higher-concentration polyacrylamide matrix that performs the actual size-based separation of protein-SDS complexes. When subjected to an electric field, these complexes migrate toward the anode, with smaller proteins moving faster through the gel matrix than larger ones [5] [4].
The critical parameter controlling separation range is the acrylamide concentration in the resolving gel. Lower percentages (e.g., 8%) resolve high molecular weight proteins better, while higher percentages (e.g., 15%) are optimal for lower molecular weight proteins [5].
Essential Reagents and Their Functions
Research Reagent Solutions
The following table details key reagents required for SDS-PAGE gel preparation and their specific functions in the electrophoresis process.
| Reagent | Function | Key Specifications |
|---|---|---|
| Acrylamide/Bis-acrylamide [5] [4] | Forms the gel matrix; pore size depends on concentration and cross-linking ratio. | Typically used as a 30% (w/v) stock solution at a 37.5:1 ratio (acrylamide:bis). |
| Tris-HCl Buffer [5] [15] | Provides the appropriate pH for polymerization and electrophoresis. | Separating gel: 1.5 M, pH 8.8. Stacking gel: 1.0 M, pH 6.8. |
| Sodium Dodecyl Sulfate (SDS) [5] [4] | Anionic detergent that denatures proteins and confers uniform negative charge. | Typically used as a 10% (w/v) stock solution. |
| Ammonium Persulfate (APS) [4] [15] | Initiator of the free-radical polymerization reaction. | Freshly prepared 10% (w/v) aqueous solution. |
| TEMED [4] [15] | Catalyst that accelerates the polymerization reaction by decomposing APS. | Used as supplied in liquid form. |
| Electrophoresis Buffer [5] | Conducts current and maintains pH during run (Tris-glycine-SDS). | 25 mM Tris, 192 mM glycine, 0.1% SDS, pH ~8.3. |
Safety Considerations
Acrylamide is a potent neurotoxin and can be absorbed through the skin. Appropriate safety measures must be taken when handling powdered acrylamide/bis-acrylamide or their solutions [5]. Always wear gloves and work in a fume hood when weighing powders or handling stock solutions. Properly dispose of polymerized gels and liquid waste according to institutional safety guidelines.
Comprehensive Gel Recipes
The following tables provide standardized recipes for preparing stacking and resolving gels. These formulations are scalable based on the number and thickness of gels needed. For 4 x 0.75-mm thick gels, use the volumes provided. For 4 x 1.00-mm or 4 x 1.50-mm thick gels, multiply all components by 1.5 or 2.0, respectively [30].
Resolving Gel Recipe for Different Percentages
Table 1: Recipe for a 15 mL resolving gel at various acrylamide percentages. Adapted from [30] and [4].
| Component | 8% Gel | 10% Gel | 12% Gel | 15% Gel |
|---|---|---|---|---|
| 30% Acrylamide Solution | 4.0 mL | 5.0 mL | 6.0 mL | 7.5 mL |
| 1.5 M Tris-HCl (pH 8.8) | 3.75 mL | 3.75 mL | 3.75 mL | 3.75 mL |
| 10% (w/v) SDS | 150 µL | 150 µL | 150 µL | 150 µL |
| Deionized H₂O | 7.1 mL | 6.1 mL | 5.1 mL | 3.6 mL |
| 10% (w/v) APS | 75 µL | 75 µL | 75 µL | 75 µL |
| TEMED | 7.5 µL | 7.5 µL | 7.5 µL | 7.5 µL |
Stacking Gel Recipe
Table 2: Standard recipe for a 5 mL, 5% stacking gel. Sources: [30] [4] [15].
| Component | Volume |
|---|---|
| 30% Acrylamide Solution | 0.83 mL |
| 1.0 M Tris-HCl (pH 6.8) | 0.63 mL |
| 10% (w/v) SDS | 50 µL |
| Deionized H₂O | 3.4 mL |
| 10% (w/v) APS | 25 µL |
| TEMED | 5 µL |
Gel Percentage Selection Guide
Table 3: Recommended acrylamide percentages for optimal separation of proteins based on molecular weight. Data compiled from [30] and [5].
| Protein Size Range (kDa) | Recommended Acrylamide % |
|---|---|
| 4 - 40 | 20% |
| 12 - 45 | 15% |
| 10 - 70 | 12.5% |
| 15 - 100 | 10% |
| 25 - 200 | 8% |
Step-by-Step Gel Casting Protocol
Workflow for SDS-PAGE Gel Casting
Detailed Casting Instructions
Gel Assembly: Clean glass plates thoroughly with ethanol or industrial methylated spirit (IMS) and assemble the gel cassette according to the manufacturer's instructions, ensuring a leak-proof seal [30] [15].
Resolving Gel Preparation: In a suitable receptacle, combine all components for the resolving gel except APS and TEMED according to Table 1. Mix gently without introducing air bubbles. Just before pouring, add the specified volumes of 10% APS and TEMED, and mix gently again [30] [4].
Pouring and Polymerization: Immediately pour the resolving gel mixture into the assembled glass plates, leaving approximately 2.5 cm (or the height of the comb) from the top. Carefully overlay the gel surface with isopropanol or distilled water to create a flat, even interface. Allow the gel to polymerize completely for 30-45 minutes at room temperature. A distinct schlieren line will appear at the gel-overlay interface once polymerization is complete [30] [4] [15].
Stacking Gel Preparation: After polymerization, pour off the overlay liquid. Rinse the top of the resolving gel with distilled water to remove any residual isopropanol, and wick away excess liquid with lint-free tissue or filter paper [30]. In a separate container, mix stacking gel components (excluding APS and TEMED) as per Table 2. Add APS and TEMED last, mix, and pour immediately on top of the resolving gel, filling the cassette completely.
Comb Insertion: Carefully insert a clean, dry comb into the stacking gel, avoiding air bubbles. Allow the stacking gel to polymerize for 15-20 minutes at room temperature [15].
Gel Storage: Once polymerized, the gel can be used immediately. For storage, wrap the gel cassette in a damp paper towel (squeezed to remove excess water), then seal it in plastic wrap. Label with the date and gel percentage, and store at 4°C for up to a few weeks [30] [4].
Related Reagent Formulations
Electrophoresis and Staining Reagents
5x Electrophoresis Running Buffer [5]:
- 25 mM Tris base, 192 mM glycine, 0.1% (w/v) SDS.
- For 1L: 60.6 g Tris base, 144.1 g glycine, 5 g SDS. Dilute to 1x before use.
Coomassie Staining Solution [5]:
- 0.05% (w/v) Coomassie Brilliant Blue R-250, 40% (v/v) ethanol, 10% (v/v) glacial acetic acid.
- For 100 mL: 50 mg Coomassie Blue, 40 mL ethanol, 10 mL glacial acetic acid, 50 mL water.
Destaining Solution [5]:
- 40% (v/v) ethanol, 10% (v/v) glacial acetic acid.
- For 100 mL: 40 mL ethanol, 10 mL glacial acetic acid, 50 mL water.
5x SDS-PAGE Sample Buffer (Laemmli Buffer) [4]:
- 4% SDS, 20% glycerol, 0.004% bromophenol blue, 100 mM Tris-HCl (pH 6.8). Add 10% β-mercaptoethanol fresh before use.
Troubleshooting Common Preparation Issues
Table 4: Common issues in gel preparation and their solutions. Based on [30] and [4].
| Problem | Possible Cause | Solution |
|---|---|---|
| Slow/No Polymerization | Degraded APS or TEMED; Insufficient mixing. | Prepare fresh 10% APS weekly (store at 4°C); Ensure TEMED is not old; Mix components thoroughly after adding catalysts. |
| Wavy Gel Interface | Uneven overlay or disturbance during polymerization. | Tilt the casting stand slightly while adding the overlay liquid; Do not move the gel during polymerization. |
| Air Bubbles in Gel | Pouring too vigorously; Not tapping out bubbles. | Pour the gel solution along the edge of the glass plate using a Pasteur pipette; Gently tap the plates to dislodge bubbles after pouring. |
| Leaking Gel Cassette | Improperly assembled cassette; Damaged spacers. | Reassemble the casting stand carefully, ensuring spacers are aligned and seals are tight. |
Within the broader framework of a thesis on SDS-PAGE protein separation research, mastering the gel casting process is a fundamental prerequisite for generating reliable, reproducible data. Proper gel polymerization is not merely a preliminary step but a critical determinant of electrophoretic success, directly impacting band resolution, pattern quality, and the validity of subsequent analyses. Inconsistent or improper polymerization can introduce artifacts, distort band morphology, and compromise quantitative assessments, thereby undermining experimental conclusions. This Application Note provides a detailed, step-by-step protocol and troubleshooting guide to empower researchers in achieving optimal gel polymerization and consistency, forming a solid foundation for high-quality protein separation research.
Theoretical Foundations of Gel Polymerization
Chemical Basis of Polyacrylamide Gel Formation
Polyacrylamide gels are formed through a chemical polymerization reaction creating a porous matrix essential for biomolecular separation. The gel structure arises from the copolymerization of acrylamide monomers with N,N'-methylene-bis-acrylamide (Bis) cross-linker [32]. The relative concentrations of these two components precisely control the gel's porosity: higher acrylamide percentages create smaller pores, providing better resolution for lower molecular weight proteins, while lower percentages are suited for separating larger proteins [33] [32].
The polymerization reaction is initiated by a free-radical system. Ammonium persulfate (APS) serves as the initiator, providing the free radicals necessary to start the chain reaction, while N,N,N',N'-Tetramethylethylenediamine (TEMED) acts as a catalyst, accelerating the radical formation from APS and thus the overall polymerization rate [32]. This chemical process is highly sensitive to several factors, which must be carefully controlled to ensure reproducible gel quality.
Critical Factors Affecting Polymerization Quality and Kinetics
The polymerization reaction is influenced by several key variables that researchers must optimize for consistent results:
- APS and TEMED Concentrations: These are the most critical factors controlling polymerization speed [34]. Increasing the concentration of either component accelerates the reaction. APS solutions degrade over time, especially when not stored properly, leading to slower and incomplete polymerization; fresh aliquots are recommended for reliable results [34].
- Temperature: Warmer environments significantly accelerate polymerization, while reactions proceed slowly or may not complete in cold conditions [34]. Consistent, room-temperature environments are ideal for predictable gelation times.
- Inhibition by Oxygen: Ambient oxygen inhibits the free-radical polymerization process. Proper sealing of the gel cassette and layering with isopropanol or water over the resolving gel surface exclude oxygen and ensure even polymerization across the entire gel surface [33].
The diagram below illustrates the logical relationship between key controllable factors and the final gel quality outcomes.
Experimental Protocols
Reagent Preparation and Standard Formulations
The foundation of consistent gel casting begins with precise reagent preparation. The table below summarizes key research reagent solutions essential for SDS-PAGE gel preparation.
Table 1: Essential Research Reagent Solutions for SDS-PAGE Gel Casting
| Reagent/Material | Function/Role | Critical Storage & Handling Notes |
|---|---|---|
| Acrylamide/Bis Solution | Forms the gel matrix; concentration determines pore size [32]. | Store protected from light at 4°C; monitor for crystal formation indicating degradation. |
| Ammonium Persulfate (APS) | Free radical initiator for polymerization reaction [32]. | Prepare fresh aliquots weekly; store frozen at -20°C; avoid freeze-thaw cycles [34]. |
| TEMED | Catalyst that accelerates radical formation from APS [32]. | Store at room temperature, tightly sealed; highly hygroscopic. |
| Tris-HCl Buffer (Resolving Gel) | Maintains pH at 8.8 for optimal protein separation [35]. | Stable at 4°C for months; check pH before each use. |
| Tris-HCl Buffer (Stacking Gel) | Maintains pH at 6.8 for effective protein stacking [32]. | Stable at 4°C for months; check pH before each use. |
| SDS Solution | Denatures proteins and confers uniform negative charge [32]. | Store at room temperature; may precipitate in cold. |
Step-by-Step Gel Casting Protocol
A. Resolving Gel Preparation and Casting
- Assemble Gel Cassette: Secure clean glass plates in a casting stand with appropriate spacers, ensuring a tight seal to prevent leakage.
- Mix Resolving Gel Solution: Combine components in the volumes specified in the table below for a standard mini-gel. Add TEMED last to initiate polymerization, then mix gently without introducing bubbles.
- Pour the Gel: Immediately pipette the resolving gel solution into the assembled cassette, leaving appropriate space for the stacking gel (approximately 1-1.5 cm below the comb teeth).
- Overlay with Isopropanol: Gently layer saturated isopropanol or deionized water over the gel surface using a fine-tip pipette. This step is critical for excluding oxygen and ensuring a flat, uniform polymerization surface [33].
- Polymerize: Allow the gel to polymerize completely at room temperature. Typical polymerization time is 20-30 minutes, indicated by a distinct schlieren line between the gel and the overlay. Do not disturb during polymerization.
B. Stacking Gel Preparation and Casting
- Remove Overlay: Once the resolving gel has set, pour off the isopropanol/water overlay. Invert the cassette to remove residual liquid and briefly blot with a lint-free tissue.
- Prepare Stacking Gel Solution: Mix components as per the table below. Add TEMED last and mix.
- Pour Stacking Gel: Pipette the stacking gel solution directly onto the polymerized resolving gel.
- Insert Comb: Immediately place a clean, dry comb at a slight angle into the stacking gel solution, avoiding air bubbles. Gently press into place.
- Polymerize: Allow the stacking gel to polymerize for 15-20 minutes at room temperature. After polymerization, the gel can be used immediately or stored wrapped in moist paper towels within a sealed bag at 4°C for 1-2 days.
Table 2: Standard Mini-Gel Formulations for SDS-PAGE
| Component | 12% Resolving Gel (mL) | 6% Stacking Gel (mL) |
|---|---|---|
| Distilled Water | 3.35 | 3.45 |
| 1.5 M Tris-HCl (pH 8.8) | 2.5 | - |
| 0.5 M Tris-HCl (pH 6.8) | - | 1.25 |
| 30% Acrylamide/Bis Solution | 4.0 | 1.0 |
| 10% SDS | 0.1 | 0.05 |
| 10% APS | 0.05 | 0.025 |
| TEMED | 0.02 | 0.01 |
| Total Volume | ~10 mL | ~5.8 mL |
Polymerization Quality Control and Assessment
A systematic workflow is essential for verifying successful gel polymerization before proceeding to electrophoresis. The following diagram outlines the key quality control checkpoints.
Key Verification Steps:
- Visual Inspection: After the allotted polymerization time, check for a sharp, refractive schlieren line between the stacking and resolving gels [33].
- Leftover Mix Test: A reliable practice is to leave a small volume of the gel mix in the preparation tube or beaker; its polymerization confirms that the chemical reaction has proceeded to completion [34].
- Well Integrity Check: After comb removal, rinse wells thoroughly with 1X running buffer. Prior to sample loading, pipette a small amount of loading dye into a well to ensure it remains contained without leaking into adjacent wells [33].
Troubleshooting Common Polymerization Issues
Even with careful technique, polymerization issues can arise. The table below diagnoses common problems, their root causes, and recommended corrective actions.
Table 3: Troubleshooting Guide for Gel Polymerization and Casting Issues
| Observed Problem | Potential Causes | Recommended Solutions |
|---|---|---|
| Long polymerization time or incomplete gelation | Old/degraded APS [34], insufficient TEMED, low ambient temperature [34], oxygen inhibition. | Use fresh APS aliquots; slightly increase TEMED concentration; ensure reaction at room temperature; overlay properly with isopropanol. |
| Gel polymerizes too quickly | Excess APS or TEMED [34], high ambient temperature. | Reduce catalyst/initiator concentrations in next preparation; work in a cooler environment. |
| Non-parallel or wavy bands | Uneven polymerization leading to non-linear gel interface [33], uneven well bottoms. | Always overlay resolving gel with isopropanol/water for a flat surface [33]; ensure comb is perfectly horizontal and clean during insertion. |
| Samples leaking from wells | Damaged wells from comb removal [33], old or poorly polymerized gel at well base. | Remove comb gently with steady, straight-up motion after placing gel in running chamber with buffer [33]; use gels soon after polymerization. |
| Poor band resolution or smearing | Incorrect acrylamide percentage for target protein size [33], improper buffer pH, unpolymerized acrylamide. | Optimize gel percentage (higher % for small proteins, lower % for large proteins) [33] [32]; ensure buffers are at correct pH; allow full polymerization time. |
Advanced Applications and Integration with Modern Analysis
While proper gel casting is fundamental, recent technological advancements are revolutionizing downstream analysis. AI-powered tools like GelGenie represent a paradigm shift in gel image analysis. This framework uses U-Net convolutional neural networks trained on over 500 manually-labeled gel images to perform pixel-level segmentation, automatically identifying bands as 'band' or 'background' with high accuracy across diverse experimental conditions [36] [37]. This AI approach surpasses traditional software in ease-of-use and versatility, enabling researchers to extract band data in seconds without expert knowledge, thus ensuring analytical consistency that begins with a perfectly polymerized gel [36]. Integrating robust, traditional wet-lab techniques with such cutting-edge computational tools creates a powerful pipeline for high-quality, reproducible protein research.
Mastering optimal gel casting is a critical skill that directly influences the credibility of electrophoretic data in protein separation research. Consistency begins with understanding the polymerization chemistry, meticulously preparing reagents, and rigorously following a standardized casting protocol. By implementing the detailed methodologies, quality control checks, and troubleshooting strategies outlined in this Application Note, researchers can eliminate polymerization variability as a source of experimental error. This ensures the production of reliable, high-quality gels that form the foundation for robust and reproducible SDS-PAGE analysis, ultimately strengthening the validity of scientific findings in drug development and basic research.
Proper protein sample preparation is the most critical step for successful sodium dodecyl sulfate-polyacrylamide gel electrophoresis (SDS-PAGE), a foundational technique in biochemistry and molecular biology used to separate proteins by their molecular weight [2] [21]. The ultimate goal of sample preparation is to completely denature protein complexes into their individual polypeptide subunits, mask their intrinsic charges, and linearize them such that their electrophoretic migration depends solely on molecular size rather than charge or three-dimensional structure [38] [39]. This application note provides detailed methodologies for optimizing denaturation, reduction, and loading buffer composition to ensure reliable, reproducible protein separation within the broader context of SDS-PAGE research.
Core Principles of SDS-PAGE Sample Preparation
The Role of SDS in Protein Denaturation
SDS, an anionic detergent, serves two primary functions in protein denaturation. First, it disrupts hydrophobic interactions and hydrogen bonds that maintain secondary and tertiary protein structures, effectively unfolding proteins into random coil conformations [2] [39]. Second, SDS binds to polypeptides at a relatively constant ratio of approximately 1.4 g SDS per 1 g of protein, conferring a uniform negative charge density that masks proteins' intrinsic charges [21]. This ensures all proteins migrate toward the anode during electrophoresis with mobility dependent solely on molecular weight [39].
Reduction of Disulfide Bonds
While SDS effectively disrupts non-covalent interactions, reducing agents are required to break covalent disulfide bonds that stabilize tertiary and quaternary structures [39] [40]. Compounds such as β-mercaptoethanol (BME) or dithiothreitol (DTT) break S-S bonds by reducing them to sulfhydryl groups (SH), facilitating complete unfolding of multi-subunit proteins and ensuring accurate molecular weight determination [39] [40]. For non-reduced SDS-PAGE, these agents are omitted to preserve disulfide-linked complexes.
Heat-Mediated Denaturation
Heating samples to 95°C for several minutes after SDS and reducing agent treatment provides the thermal energy necessary to disrupt stubborn hydrogen bonds and complete the denaturation process [41] [40]. This step is particularly crucial for membrane proteins and protein complexes with extensive secondary structure [40]. However, excessive heating can promote protein aggregation and should be optimized for each protein type [40].
Composition and Optimization of Loading Buffers
The protein loading buffer, also known as Laemmli buffer, is a critical component that ensures proper protein denaturation, visualization, and loading [38].
Table 1: Essential Components of SDS-PAGE Loading Buffer
| Component | Typical Concentration | Primary Function | Optimization Notes |
|---|---|---|---|
| SDS | 1-2% (w/v) | Denatures proteins and confers negative charge | Concentration must be sufficient to saturate all proteins (≥1.4g SDS/g protein) [21] |
| Reducing Agent (DTT or BME) | 50-100 mM (DTT) or 1-5% (v/v) BME | Breaks disulfide bonds | DTT is more stable and less odorous than BME; concentration critical for complex proteins [39] [40] |
| Tris-HCl Buffer | 50-100 mM (pH ~6.8) | Maintains stable pH | pH critical for proper stacking in discontinuous buffer systems [38] |
| Glycerol | 5-20% (v/v) | Increases sample density for well loading | Prevents sample diffusion out of wells during loading [38] |
| Tracking Dye (Bromophenol Blue) | 0.001-0.01% (w/v) | Visualizes migration progress | Migrates at approximately the same position as a 5 kDa protein [38] |
Sample Preparation Protocol
Sample Dilution and Buffer Exchange: For proteins in non-compatible buffers (especially high salt concentrations), use dialysis, desalting columns, or buffer exchange to minimize interference with electrophoresis [41]. The Abcam optiblot SDS-PAGE sample preparation kit provides a rapid method for concentrating proteins and removing interfering buffers in under ten minutes [2].
Buffer Addition: Combine protein sample with an equal volume of 2× Laemmli buffer (or appropriate volume for other concentrations) [38]. Ensure final SDS concentration is sufficient to fully denature all proteins in the sample.
Reduction and Denaturation: Heat samples at 95°C for 2-10 minutes [41] [40]. The optimal time varies by protein type—membrane proteins typically require longer denaturation (5-10 minutes) while many soluble proteins denature completely in 2-5 minutes.
Cooling and Storage: Briefly centrifuge heated samples to collect condensation. Samples can be stored at -20°C or -80°C for future use, though repeated freeze-thaw cycles should be avoided.
Table 2: Troubleshooting Common Sample Preparation Issues
| Problem | Potential Causes | Solutions |
|---|---|---|
| Smearing Bands | Incomplete denaturation [41], protein degradation [41], or overloading [41] | Ensure fresh reducing agents, adequate heating (95°C, 5 min) [41], use protease inhibitors [41], reduce sample load [41] |
| Vertical Streaking | High salt concentration [41] or particulate matter | Desalt samples [41], centrifuge before loading, filter through 0.22µm membrane |
| Unexpected Molecular Weight | Incomplete reduction [38] or post-translational modifications [38] | Increase reducing agent concentration, fresh DTT/BME, consider glycosylation/phosphorylation |
| Protein Aggregation | Excessive heating [40] or insufficient SDS | Optimize heating time [40], increase SDS concentration, include urea in buffer |
| Non-specific Bands | Proteolytic degradation [41] or disulfide scrambling | Use fresh protease inhibitors [41], alkylate with iodoacetamide after reduction |
The following workflow summarizes the optimized sample preparation process:
Advanced Optimization Strategies
Gel Percentage Selection
The appropriate acrylamide concentration is critical for resolving proteins of different sizes. The following table provides guidance on gel percentage selection based on target protein molecular weight:
Table 3: Optimal Gel Percentage for Protein Separation
| Protein Molecular Weight Range | Recommended Gel Percentage | Separation Principle |
|---|---|---|
| 100-600 kDa | 4-8% | Larger pore sizes allow big proteins to enter and migrate |
| 50-500 kDa | 6-10% | Moderate pore size for medium-large proteins |
| 30-300 kDa | 8-12% | Standard range for most applications |
| 10-200 kDa | 10-15% | Smaller pores for better resolution of medium-small proteins |
| 3-100 kDa | 12-20% | Very small pores retard small proteins for improved separation |
Gradient gels (e.g., 4-20%) provide a broad separation range and are particularly useful for samples containing proteins of diverse molecular weights [42] [2].
Addressing Method-Induced Artifacts
Recent research has identified that some proteins, particularly complex formats like bispecific antibodies, may resist complete denaturation by SDS or form non-covalent aggregates during sample preparation [43]. These artifacts can lead to inaccurate molecular weight assessment and misinterpretation of results. Strategies to minimize these artifacts include:
- Alternative Denaturants: Supplementing with more hydrophobic detergents like sodium hexadecyl sulfate (SHS) can improve denaturation of challenging proteins [43].
- Temperature Optimization: Increasing incubation temperature during sample preparation can enhance complete denaturation [43].
- Fresh Reagents: Always prepare reducing agents fresh as they oxidize readily, decreasing effectiveness [40].
The Scientist's Toolkit: Essential Research Reagents
Table 4: Essential Reagents for SDS-PAGE Sample Preparation
| Reagent | Function | Key Considerations |
|---|---|---|
| SDS | Protein denaturation and charge masking | Use high-purity grade; prepare fresh solutions to prevent precipitation [39] |
| Dithiothreitol (DTT) | Reduction of disulfide bonds | Prepare fresh stock solutions; more stable and less odorous than BME [39] |
| β-Mercaptoethanol (BME) | Alternative reducing agent | Use in fume hood due to strong odor; slightly less effective than DTT [39] |
| Tris-HCl Buffer | pH maintenance | Critical for discontinuous buffer system; ensure correct pH (6.8 for stacking) [38] |
| Glycerol | Density agent for loading | Enables sample to settle in wells without diffusing [38] |
| Bromophenol Blue | Migration tracking dye | Visualizes migration front; approximates 5 kDa protein migration [38] |
| Protease Inhibitor Cocktails | Prevent protein degradation | Essential for labile proteins; specific combinations for different proteases [41] |
| Iodoacetamide | Cysteine alkylation | Prevents disulfide reformation after reduction; used before SDS-PAGE under non-reducing conditions [43] |
Optimized protein sample preparation through controlled denaturation, reduction, and proper buffer formulation is fundamental to successful SDS-PAGE analysis. By systematically addressing each component of the process—from SDS concentration and reducing agent selection to heat denaturation parameters—researchers can avoid common artifacts and obtain clear, reproducible results. The protocols and optimization strategies presented here provide a foundation for reliable protein separation, essential for downstream applications including western blotting, protein characterization, and drug development research. As antibody therapeutics and complex protein formats continue to evolve [43], meticulous attention to sample preparation details becomes increasingly critical for accurate analytical characterization.
The separation of proteins by sodium dodecyl sulfate-polyacrylamide gel electrophoresis (SDS-PAGE) is a foundational technique in biochemical research. Its success hinges on the precise control of three critical running parameters: voltage, time, and temperature. These parameters are deeply interconnected and govern the migration rate, resolution, and integrity of protein bands. Excessive heat generation from inappropriate electrical settings can cause gel deformation, leading to distorted "smiling" bands or smeared results, while inadequate run times or voltages result in poor separation [44] [45]. This application note provides a detailed, step-by-step protocol for optimizing these parameters to achieve reproducible, high-quality SDS-PAGE results within the context of protein separation research.
Theoretical Foundations of Electrophoresis Parameters
In SDS-PAGE, an electric field provides the driving force for protein migration. The relationship between the key electrical parameters—voltage (V, in volts), current (I, in amperes), and power (P, in watts)—is defined by fundamental laws of electricity. Ohm's Law (V = I × R) describes how voltage is the product of current and resistance (R) [44] [46]. The power generated, which is directly converted to heat, is given by Joule's Law (P = I × V) [46]. Consequently, any increase in current or voltage will increase power output and, thus, heat production within the gel system [44].
Modern power supplies allow operation in constant current, constant voltage, or constant power mode, each with distinct advantages and disadvantages for SDS-PAGE, particularly concerning heat management and run time consistency [44] [46].
The Interplay of Parameters and Heat
Heat is a critical factor in SDS-PAGE performance. While mild heat can aid in protein denaturation, excessive heat causes several problems:
- Gel Expansion: The gel can expand unevenly, creating curved "smiling" bands [44] [45].
- Protein Denaturation: Excessive heat can denature proteins of interest, making them undetectable in subsequent western blotting and producing distorted, smeary bands [46].
- Buffer Evaporation: Can lead to changes in buffer ion concentration and system resistance.
The choice of running mode directly influences the thermal profile of the run. Under constant current, the migration rate remains stable, but voltage and heat tend to increase as buffer ions are consumed and resistance rises [44]. Under constant voltage, current and power decrease as resistance increases, leading to a cooler but progressively slower run [44] [46]. Constant power aims to limit heat production while maintaining a more consistent migration speed, though "constant" conditions are hard to define as both voltage and current can vary [44].
Optimizing Running Parameters: A Step-by-Step Protocol
Pre-Run Considerations
A. Gel Percentage Selection: The appropriate acrylamide concentration is the primary factor for resolving proteins of different sizes.
Table 1: Polyacrylamide Gel Percentage and Protein Separation Range [5]
| Gel Acrylamide Concentration (%) | Linear Separation Range (kDa) |
|---|---|
| 15.0 | 12 – 43 |
| 10.0 | 16 – 68 |
| 7.5 | 36 – 94 |
| 5.0 | 57 – 212 |
B. Sample Preparation:
- Mix protein sample with an appropriate volume of SDS-PAGE sample buffer (e.g., 4 volumes sample to 1 volume of 5x buffer) [5].
- Denature the samples by heating at 95°C for 5 minutes [47] [5]. For membrane proteins or difficult samples, ensure thorough heating to dissociate hydrophobic interactions [47].
- Briefly centrifuge samples at maximum speed for 2-3 minutes to pellet any aggregates or insoluble material [47].
C. Gel Apparatus Assembly:
- Assemble the gel cassette according to the manufacturer's instructions.
- Place the cassette in the electrophoresis chamber.
- Fill the inner (if applicable) and outer chambers with fresh running buffer. Reused buffer can have altered ion concentrations, hindering separation [48].
- Load samples into the wells immediately after removing the comb. To prevent the "edge effect" and distorted peripheral lanes, load unused wells with sample buffer [45] [5].
Two-Stage Electrophoresis Run Protocol
A two-stage run is recommended for optimal protein separation, beginning with a low voltage through the stacking gel followed by a higher voltage through the resolving gel [44].
Stage 1: Stacking Gel Run
- Objective: To concentrate and align all protein samples into sharp bands before they enter the resolving gel.
- Voltage: 50-60 V [44] or 5-15 V per cm of gel [46].
- Time: Approximately 30 minutes, or until the dye front has moved through the entire stacking gel and entered the resolving gel.
Stage 2: Resolving Gel Run
- Objective: To separate proteins by molecular weight in the resolving gel.
- Voltage: 100-150 V for mini-gels. A general rule is 5-15 V per cm of gel length [44] [47]. Larger gels may require voltages up to 300 V [44].
- Time: 45 minutes to 2 hours, or until the bromophenol blue dye front reaches the bottom of the gel [44] [47]. Terminating the run prematurely results in poor resolution, while over-running causes lower molecular weight proteins to migrate off the gel [45] [47].
Quantitative Parameter Settings
The following table provides a summary of standard running conditions for different gel formats and operational modes.
Table 2: SDS-PAGE Run Parameter Guidelines
| Parameter | Constant Voltage | Constant Current | Notes & Recommendations |
|---|---|---|---|
| Typical Voltage (Mini-gel) | 100-150 V [47] | Initial setting: 100-120 mA [46] | Voltage is proportional to gel size: 5-15 V/cm of gel [44] [46]. |
| Running Time | ~40-60 minutes [47] | Predictable, can be set precisely [46] | Stop when the dye front reaches the bottom of the gel [45] [5]. |
| Heat Production | Decreases during the run as current drops [44] | Increases during the run as voltage rises [44] | High heat causes smiling bands, diffuse bands, or gel warping [44] [45]. |
| Primary Advantage | Safer; multiple chambers can run from one pack [46] | Consistent sample migration rate [44] | Constant current requires active cooling [44]. |
| Primary Disadvantage | Slowing migration can lead to longer runs/diffuse bands [44] [46] | High risk of overheating [44] | For constant current, run in a cold room or with an ice bath [44] [46]. |
Temperature Control Strategies
Maintaining a consistent gel temperature between 10°C and 20°C is paramount for even protein migration [47]. Effective strategies include:
- Active Cooling: Place the entire electrophoresis apparatus in a cold room (4°C) or an ice bath. If using a cold room, keep the power pack at room temperature to prevent condensation damage, and run the leads into the fridge [46].
- Reduced Voltage: Running the gel at a lower voltage for a longer duration directly reduces Joule heating [45] [48].
- Buffer Stirring: Use a magnetic stirrer in the outer buffer chamber to ensure efficient heat transfer and prevent temperature gradients [47].
- Specialized Equipment: Utilize gel tanks with built-in cooling coils or compatible ice packs [48].
Troubleshooting Common Issues
- "Smiling" Bands (Curved Bands): Caused by uneven heat distribution, with the center of the gel hotter than the edges [44] [45]. Solution: Improve cooling by running the gel in a cold room, at a lower voltage, or with buffer stirring [45] [47].
- Smeared Bands: Can result from running the gel at too high a voltage, overloading the protein sample, or incomplete denaturation [45] [48]. Solution: Reduce voltage, load less protein, ensure samples are properly boiled and centrifuged [45] [48] [47].
- Poor Band Resolution: Caused by an incorrect acrylamide percentage, insufficient run time, or improper buffer preparation [45]. Solution: Select a gel percentage appropriate for your protein's size (Table 1), run the gel until the dye front reaches the bottom, and prepare fresh running buffer [45] [48] [5].
- Protein Samples Migrating Out of Wells Before Run: Due to a long delay between loading the sample and applying the electric current [45]. Solution: Start electrophoresis immediately after loading the final sample [45] [47].
The Scientist's Toolkit: Essential Reagents and Materials
Table 3: Key Research Reagent Solutions for SDS-PAGE
| Reagent/Material | Function |
|---|---|
| SDS (Sodium Dodecyl Sulfate) | Anionic detergent that denatures proteins and confers a uniform negative charge, allowing separation based primarily on size [49]. |
| Polyacrylamide/Bis-acrylamide | Forms a cross-linked gel matrix that acts as a molecular sieve. Pore size is determined by the concentration, governing protein separation [5] [49]. |
| Tris-Glycine-SDS Running Buffer | Conducts current and maintains pH during electrophoresis. Glycine ions play a critical role in the discontinuous buffer system for band stacking [5] [49]. |
| Laemmli Sample Buffer (with SDS, Glycerol, Bromophenol Blue) | Denatures proteins, provides density for well loading, and allows visual tracking of migration [49]. |
| Reducing Agents (DTT or β-Mercaptoethanol) | Break disulfide bonds in proteins to ensure complete denaturation and linearization [47] [49]. |
| TEMED & Ammonium Persulfate (APS) | Catalyze the polymerization of acrylamide to form the polyacrylamide gel [5] [49]. |
| Protein Molecular Weight Ladder | Essential for accurately determining the molecular weight of separated proteins and monitoring run progress [47]. |
Workflow for Parameter Optimization
The following diagram illustrates the logical decision-making process for optimizing SDS-PAGE running parameters to achieve high-quality results.
Within the framework of SDS-PAGE protein separation research, the subsequent visualization of separated proteins is a critical step for analysis. Following electrophoresis, proteins embedded within the polyacrylamide gel are invisible and must be stained to be detected, quantified, and analyzed [50]. The choice of visualization method is governed by key experimental requirements, including sensitivity, quantitative capability, and compatibility with downstream applications such as mass spectrometry or Western blotting [7] [50]. This application note provides detailed protocols and a comparative analysis of the primary staining techniques used to detect protein bands after SDS-PAGE, enabling researchers to select and implement the optimal method for their specific needs.
The Scientist's Toolkit: Essential Reagents for Protein Visualization
The following table catalogues the fundamental reagents and materials required for the protein visualization methods described in this note.
Table 1: Key Research Reagent Solutions for Protein Staining
| Item | Function/Description |
|---|---|
| Coomassie Brilliant Blue R-250 | A triphenylmethane dye that binds nonspecifically to proteins via hydrophobic and ionic interactions, yielding blue bands [7]. |
| Ethanol and Glacial Acetic Acid | Key components of staining and destaining solutions; the alcohol helps fix proteins in the gel, while acetic acid improves dye binding and background clarity [7]. |
| Silver Nitrate | The source of silver ions in silver staining that bind to protein functional groups (e.g., carboxyl groups) and are reduced to metallic silver for visualization [50]. |
| SYPRO Ruby / Fluorescent Dyes | Fluorescent stains that bind proteins non-covalently, offering high sensitivity and a broad linear dynamic range; detection requires a UV or laser scanner [50]. |
| Zinc Chloride & Imidazole | Components of zinc stains; they create an opaque background in the gel while protein bands remain clear, providing a rapid, reversible, and sensitive detection method [50]. |
| Molecular Weight Markers | A mixture of proteins of known sizes run alongside samples to estimate the molecular weight of unknown proteins and monitor electrophoresis progress [51] [14]. |
| Fixative Solutions | Typically containing methanol or acetic acid, used in sensitive staining methods (e.g., silver, fluorescent) to precipitate and retain proteins within the gel matrix [50]. |
Staining Methodologies: Principles and Quantitative Comparison
This section outlines the core principles and relative performance of the most common protein staining techniques. The choice of method represents a trade-off between factors such as sensitivity, speed, cost, and compatibility with further analysis.
Table 2: Quantitative Comparison of Major Protein Staining Methods
| Method | Sensitivity (per band) | Typical Protocol Time | Key Advantages | Limitations / Downstream Compatibility |
|---|---|---|---|---|
| Coomassie Staining | 5–50 ng [7] [50] | 10 min - 2 hours [50] | Simple, inexpensive, quantitative, and reversible; compatible with mass spectrometry (MS) and protein sequencing [7] [50]. | Lower sensitivity compared to other methods [7]. |
| Silver Staining | 0.25 - 0.5 ng [50] | 30 min - 2 hours [50] | Extremely high sensitivity; the most sensitive colorimetric method [50]. | Multi-step, technically demanding; not quantitative; some formulations are incompatible with MS due to protein cross-linking [7] [50]. |
| Fluorescent Staining | 0.25 - 0.5 ng [50] | ~60 min [50] | Very high sensitivity, broad linear dynamic range for quantification, and generally MS compatible [50]. | Requires a fluorescence imaging instrument; dyes can be light-sensitive [50]. |
| Zinc Staining | < 1 ng [50] | ~15 min [50] | Extremely fast and reversible; MS and Western blotting compatible; stains the background, leaving proteins clear [50]. | Protein bands are not directly stained (negative image); requires a dark background for visualization [50]. |
Coomassie Staining
Coomassie Brilliant Blue dye binds nonspecifically to proteins through interactions with basic and hydrophobic amino acid residues [50]. In an acidic environment, this binding causes a color shift from reddish-brown to an intense blue, creating visible bands against a clear background [50]. Its simplicity, quantitative nature, and excellent compatibility with downstream protein analysis make it the workhorse stain for routine laboratory use.
Silver Staining
Silver staining is a multi-step process that involves the binding of silver ions to protein functional groups, followed by their reduction to metallic silver [50]. This deposition process amplifies the signal, allowing detection of sub-nanogram amounts of protein. However, the technique is not quantitative, as different proteins can stain to varying intensities based on their chemical composition [7].
Fluorescent Staining
These methods utilize dyes that fluoresce under specific wavelengths of light after binding to proteins via hydrophobic or other non-covalent interactions [50]. They offer an excellent combination of high sensitivity and a wide linear dynamic range, making them superior for quantitative applications. Most fluorescent stains do not permanently modify proteins, maintaining compatibility with mass spectrometry.
Zinc Staining
A unique "reverse" or "negative" stain, this method uses zinc ions and imidazole to precipitate throughout the gel background except where proteins are located [50]. The result is transparent protein bands on an opaque, milky-white background, which must be visualized over a dark surface. Its speed and full reversibility are major advantages.
Detailed Experimental Protocols
Standard Coomassie Staining Protocol
Materials:
- Coomassie Staining Solution (0.05% w/v Coomassie Brilliant Blue R-250, 40% ethanol, 10% glacial acetic acid) [7]
- Destaining Solution (40% ethanol, 10% glacial acetic acid) [7]
- Orbital shaker
- Plastic container
Method:
- Fixation (Optional): Following electrophoresis, carefully remove the gel from its cassette. For best results, especially with low-percentage gels, the gel can be incubated in a fixative solution (e.g., 40% ethanol, 10% acetic acid) for 15-30 minutes to prevent protein diffusion. This step is often integrated into the staining process itself with Coomassie [50].
- Staining: Submerge the gel in a sufficient volume of Coomassie staining solution. Incubate with gentle agitation on an orbital shaker for 30 minutes to 2 hours [7].
- Destaining: Transfer the gel to destaining solution. Agitate gently until the background becomes clear and protein bands are sharply defined (1-2 hours). To accelerate destaining and conserve solution, include a folded paper towel in the container to absorb eluted dye [7].
- Storage and Imaging: For long-term storage, place the destained gel in a sealed bag with 1% acetic acid. Image the gel on a white-light scanner or documenter.
Silver Staining Protocol (Colorimetric)
Materials:
- Fixing Solution (40% Ethanol, 10% Acetic Acid)
- Sensitizing Solution (e.g., 0.2% Sodium Thiosulfate)
- Silver Nitrate Solution (0.1% w/v)
- Developing Solution (2% w/v Sodium Carbonate, 0.04% v/v Formaldehyde)
- Stop Solution (1% Glycine or 5% Acetic Acid)
- High-purity water (e.g., Milli-Q)
Method: Note: Use high-purity water for all rinses and solution preparation to prevent background staining.
- Fixation: Place the gel in Fixing Solution for 30 minutes with agitation to precipitate and immobilize proteins.
- Sensitization: Rinse gel with water (3 x 5 min). Treat with Sensitizing Solution for 1-2 minutes to increase sensitivity and uniformity.
- Rinsing: Rinse gel thoroughly with water (3 x 1 min).
- Silver Impregnation: Incubate the gel in Silver Nitrate Solution for 30 minutes in the dark.
- Rinsing: Quickly rinse the gel with water (2 x 1 min).
- Development: Transfer the gel to Developing Solution. Agitate until the desired band intensity is achieved (typically 2-10 minutes). Protein bands will appear as brown-black spots.
- Stopping: Once development is complete, stop the reaction by incubating the gel in Stop Solution for 15 minutes.
- Rinsing and Storage: Rinse the gel thoroughly with water. Store gels in a sealed bag with 1% acetic acid at 4°C and image promptly.
Interpreting Band Patterns and Troubleshooting
Accurate interpretation of banding patterns is crucial for drawing valid conclusions from an SDS-PAGE experiment.
- Purity Assessment: A single, clear band at the expected molecular weight suggests a pure protein sample [52]. Multiple bands can indicate protein degradation, contamination, or the presence of protein isoforms [14] [52].
- Molecular Weight Estimation: Compare the migration distance of the protein band to a curve generated from the molecular weight markers run on the same gel [51] [14]. Note that post-translational modifications (e.g., glycosylation, phosphorylation) can cause shifts in apparent molecular weight.
- Band Intensity: The intensity of a stained band is generally proportional to the amount of protein present, which allows for semi-quantitative analysis. Faint bands suggest low protein abundance or concentration, while very intense, smeared bands may indicate overloading of the gel [14] [52].
Table 3: Common Staining and Band Artifacts and Solutions
| Problem | Potential Cause | Recommended Solution |
|---|---|---|
| High Background | Incomplete destaining (Coomassie); contaminated water or glassware (Silver); insufficient washing. | Extend destaining time; use high-purity water; ensure all containers are meticulously cleaned. |
| Faint/No Bands | Protein concentration too low; over-destaining. | Concentrate sample; use a more sensitive stain (e.g., silver or fluorescent); reduce destaining time. |
| Smeared Bands | Sample not properly denatured; protein degradation; gel improperly polymerized. | Ensure fresh reducing agent (DTT/BME) is used and boiling is for a full 5 minutes [14]. Add protease inhibitors to sample. Check gel polymerization. |
| "Smiling" Bands | Excessive heat generation during electrophoresis. | Run gel at a lower voltage or ensure the electrophoresis unit is cooled [14]. |
| Horizontal Cracks/Crazing | Gel dried out during processing. | Ensure the gel is always covered with solution during all staining and washing steps. |
Integrated Workflow from Separation to Detection
The process from completing the SDS-PAGE run to visualizing protein bands involves a series of deliberate steps, with the specific pathway determined by the chosen staining method. The following workflow diagram maps out the critical decision points and procedures for the four primary techniques discussed.
Sodium Dodecyl Sulfate-Polyacrylamide Gel Electrophoresis (SDS-PAGE) is a foundational technique in molecular biology that separates proteins based almost exclusively on their molecular weight [1]. The combined use of sodium dodecyl sulfate (SDS) and polyacrylamide gel eliminates the influence of protein structure and inherent charge, allowing researchers to determine protein sizes with an accuracy of approximately ±10% [1]. The polyacrylamide gel matrix acts as a molecular sieve with tunable pore sizes, which are primarily determined by the gel concentration [4]. Understanding the relationship between acrylamide percentage and effective separation range is therefore critical for optimizing protein separation efficiency.
The separation mechanism relies on the fact that polyacrylamide gel is formed through the polymerization of acrylamide monomers and N,N'-methylenebisacrylamide cross-linkers, creating a three-dimensional network with pores that physically impede protein migration [4]. When an electric field is applied, SDS-coated proteins (which carry a uniform negative charge) migrate toward the anode, with smaller proteins moving more rapidly through the gel matrix while larger proteins are retarded [14] [4]. This simple yet powerful principle makes SDS-PAGE indispensable for protein analysis in research and diagnostics.
Principles of Gel Percentage Selection
The Relationship Between Acrylamide Percentage and Pore Size
The pore size of a polyacrylamide gel is inversely related to the total acrylamide concentration (%T), which refers to the combined mass of acrylamide and bisacrylamide per 100 mL of solution [4]. Higher percentages of acrylamide create denser matrices with smaller pores, providing better resolution for lower molecular weight proteins. Conversely, lower percentages create more open structures with larger pores, allowing higher molecular weight proteins to migrate more freely [14].
This relationship enables researchers to select gel percentages that optimize separation for their proteins of interest. For instance, a 15% gel provides excellent resolution for proteins in the 10-50 kDa range, while a 7.5% gel is more suitable for proteins weighing 70 kDa or more [14]. Gradient gels, which contain a continuous increase in acrylamide concentration (typically from 4% to 12%), offer an extended separation range by creating a pore size gradient that resolves both high and low molecular weight proteins simultaneously [1].
Gel Percentage Recommendations for Specific Molecular Weight Ranges
The following table provides detailed guidance for selecting appropriate gel percentages based on target protein molecular weights:
Table 1: Gel Percentage Selection Guide for Optimal Protein Separation
| Acrylamide Percentage | Effective Separation Range | Applications and Notes |
|---|---|---|
| 8-10% [14] | 70 kDa and larger [14] | Ideal for high molecular weight proteins; provides larger pore sizes for big proteins |
| 10-12% [1] | Standard range for many applications | Common starting point for unknown samples |
| 12% [14] | 40-100 kDa [14] | Standard working range for many cellular proteins |
| 15% [14] | 10-50 kDa [14] | Excellent for low molecular weight proteins; denser matrix |
| 4-20% Gradient [53] | Extended range | Broad separation capability; commercial pre-cast gels often available |
| 4-12% Gradient [1] | Extended range | Suitable for samples with wide molecular weight distribution |
For proteins with molecular weights exceeding 200 kDa, specialized techniques may be required. While standard SDS-PAGE effectively separates proteins up to 250 kDa [1], very large proteins (700-4,200 kDa) may be better resolved using agarose gels, which offer substantially larger pore sizes [14].
Experimental Protocol for SDS-PAGE
Reagent Preparation
Separating Gel Solution (10%, 10 mL)
- 3.3 mL 30% Acrylamide/Bis Mix
- 2.5 mL 1.5 M Tris-HCl (pH 8.8)
- 100 μL 10% SDS
- 3.9 mL Deionized Water
- 50 μL 10% Ammonium Persulfate (APS)
- 5 μL TEMED [4]
Stacking Gel Solution (5%, 5 mL)
- 0.83 mL 30% Acrylamide/Bis Mix
- 0.63 mL 1.0 M Tris-HCl (pH 6.8)
- 50 μL 10% SDS
- 3.4 mL Deionized Water
- 25 μL 10% APS
- 5 μL TEMED [4]
Safety Note: Acrylamide monomer is a potent neurotoxin. Always wear appropriate personal protective equipment, including gloves, and work in a fume hood when handling the unpolymerized solution [4].
Gel Casting Procedure
- Assemble glass plates in casting stand according to manufacturer's instructions, ensuring a tight seal to prevent leakage.
- Prepare separating gel mixture by combining all components except APS and TEMED. Degas the solution briefly to remove oxygen which inhibits polymerization.
- Add APS and TEMED to initiate polymerization, mix gently without introducing bubbles, and immediately pipette the solution between the glass plates.
- Overlay with isopropanol to create a flat interface and exclude oxygen. Allow to polymerize completely (20-30 minutes).
- Pour off isopropanol and remove any residual liquid with filter paper.
- Prepare stacking gel as in step 2, add APS and TEMED, then pour over the polymerized separating gel.
- Insert sample comb carefully, avoiding air bubbles. Polymerize for 15-20 minutes [4].
Sample Preparation and Electrophoresis
- Mix protein samples with 2× Laemmli buffer (4% SDS, 20% glycerol, 0.004% bromophenol blue, 100 mM Tris-HCl pH 6.8, 10% β-mercaptoethanol) [4].
- Denature samples by heating to 95°C for 5 minutes, then cool on ice [1].
- Load samples into wells, including an appropriate protein molecular weight marker [14].
- Assemble electrophoresis apparatus and fill with running buffer (25 mM Tris, 192 mM glycine, 0.1% SDS, pH 8.3) [4].
- Run electrophoresis at 80V until samples migrate through stacking gel, then increase to 120V until dye front reaches bottom of gel [4].
- Disassemble apparatus and process gel for staining or western blotting.
The following workflow diagram illustrates the complete SDS-PAGE procedure:
The Scientist's Toolkit: Essential Reagents and Materials
Table 2: Essential Research Reagents for SDS-PAGE
| Reagent/Material | Function and Application Notes |
|---|---|
| Protein Molecular Weight Markers | Size calibration standards containing proteins of known molecular weight [54] [53] [6] |
| Acrylamide/Bis-acrylamide | Monomer and cross-linker that form the porous gel matrix [4] |
| SDS (Sodium Dodecyl Sulfate) | Anionic detergent that denatures proteins and confers uniform charge [1] |
| Tris-HCl Buffers | Maintain appropriate pH during electrophoresis (pH 6.8 for stacking, 8.8 for separating gel) [4] |
| APS and TEMED | Polymerization initiator and catalyst for gel formation [4] |
| Reducing Agents (DTT, β-mercaptoethanol) | Cleave disulfide bonds to ensure complete protein unfolding [1] |
| Coomassie Brilliant Blue | Protein stain for visualization after electrophoresis [54] [4] |
Troubleshooting Common Issues
Table 3: Troubleshooting Guide for SDS-PAGE
| Issue | Possible Cause | Solution |
|---|---|---|
| Smearing/Streaking Bands | Incomplete denaturation | Extend boiling time; add fresh reducing agents [4] |
| Vertical Streaks | Air bubbles in gel matrix | Degas gel solution before polymerization [4] |
| "Smiling" Bands | Buffer/gel overheating | Run at lower voltage; ensure adequate cooling [14] |
| Smeared Bands | High salt concentration | Desalt samples; keep salt below 500 mM [14] |
| Multiple/Unexpected Bands | Protein degradation | Use protease inhibitors; include sodium azide [14] |
| Failed Polymerization | Degraded APS/TEMED | Prepare fresh APS (store ≤1 week at 4°C) [4] |
Advanced Applications and Considerations
For specialized applications, researchers may employ modified SDS-PAGE techniques. The Tris-Tricine buffer system provides superior resolution for smaller proteins and peptides in the 0.5-50 kDa range [1]. For very high molecular weight proteins (exceeding 250 kDa), agarose gels offer larger pore sizes and better separation [14]. Additionally, pre-cast commercial gels utilizing Bis-tris methane with nearly neutral pH (6.4-7.2) provide enhanced stability and can be stored for several weeks while minimizing cysteine modifications [1].
When precise molecular weight determination is critical, unstained protein ladders are recommended as they are not labeled with dyes that can alter apparent molecular weight [6]. These can be visualized after electrophoresis using standard staining protocols such as Coomassie brilliant blue [6]. For monitoring electrophoresis progress and transfer efficiency during western blotting, prestained markers in various color formats are available [6].
The appropriate selection of gel percentage based on protein molecular weight, combined with optimized sample preparation and electrophoresis conditions, ensures high-resolution protein separation essential for accurate molecular weight estimation, protein quantification, and downstream applications in proteomics and drug development.
SDS-PAGE Troubleshooting: Diagnosing and Solving Common Separation Issues
Sodium dodecyl sulfate-polyacrylamide gel electrophoresis (SDS-PAGE) remains a foundational technique in molecular biology and biochemistry for separating proteins by molecular weight. Despite its widespread use, researchers frequently encounter analytical artifacts that can compromise data interpretation. Band distortions—specifically smiling effects, smearing, and edge artifacts—represent predictable consequences of underlying physical, chemical, or procedural errors that arise during electrophoresis. These artifacts can obscure results, lead to incorrect molecular weight determinations, and ultimately delay research progress. A 2025 analysis of common Western blotting issues identified band distortion as one of the eight most frequent failures researchers encounter, highlighting the persistent nature of these technical challenges [55]. This application note provides a systematic framework for diagnosing, resolving, and preventing these common SDS-PAGE artifacts within the context of a standardized protein separation protocol, enabling researchers to produce publication-quality data with consistent reliability.
Principles of SDS-PAGE and Artifact Formation
Fundamental Mechanisms of SDS-PAGE Separation
In SDS-PAGE, the anionic detergent SDS denatures proteins by binding to polypeptide backbones in a constant weight ratio (approximately 1.4g SDS per 1g protein), unfolding secondary and tertiary structures and imparting a uniform negative charge density [56]. This process eliminates charge as a migration factor, allowing proteins to be separated primarily by molecular size as they move through the polyacrylamide gel matrix under an electric field. The polyacrylamide gel acts as a molecular sieve, with smaller proteins migrating faster through the pores than larger proteins [2]. The discontinuous buffer system, typically utilizing Tris-glycine buffers at different pH values (stacking gel at pH 6.8, resolving gel at pH 8.8), creates a stacking effect that concentrates protein samples into sharp bands before they enter the resolving gel, enhancing separation resolution [57].
Biochemical Basis for Common Artifacts
Artifacts arise when deviations from ideal conditions disrupt the precise interplay between proteins, SDS, and the gel matrix. Incomplete denaturation can cause proteins to retain aspects of their higher-order structure, leading to abnormal migration patterns. This is particularly problematic under non-reducing conditions, where disulfide bonds remain intact and can promote the formation of artifactual bands through incomplete separation of protein complexes [58]. Joule heating, an inevitable consequence of current passing through the resistive gel matrix, can create temperature gradients that differentially affect migration rates across the gel. Similarly, improper buffer composition or depleted reagents can alter the system's conductivity and pH, fundamentally changing protein mobility and leading to various distortion patterns [59].
Characterization and Diagnosis of Band Artifacts
Smiling and Frowning Bands
Smiling bands, characterized by upward-curving band patterns where samples in middle lanes migrate faster than those at the edges, result primarily from uneven heat distribution across the gel. This phenomenon, known as Joule heating, occurs when resistance within the gel generates excessive heat, typically at higher voltages. The center of the gel becomes warmer than the edges, reducing viscosity and increasing migration rates in central lanes [59] [60]. Frowning bands (downward curving) represent the opposite pattern and often indicate cooler conditions in the gel center, potentially from improper apparatus assembly or cooling system issues.
Band Smearing and Fuzziness
Band smearing appears as a continuous downward streak rather than discrete, sharp bands and indicates heterogeneity in protein size within a sample. Common causes include:
- Sample degradation: Proteolytic activity from endogenous proteases or contaminated reagents breaks proteins into fragments of varying sizes [59].
- Excessive voltage: High voltages cause localized overheating, potentially denaturing proteins and creating migration artifacts [60].
- Incomplete denaturation: Proteins not fully unfolded by SDS may migrate based on both size and residual structure rather than molecular weight alone [2].
- Overloaded wells: Excessive protein quantity can overwhelm the local buffer capacity and create a heterogeneous migration front [59].
Edge Effects and Peripheral Distortion
Edge effects manifest as distorted bands in the outermost lanes of a gel, often showing different migration patterns compared to internal lanes. This artifact typically occurs when peripheral wells are left empty, creating an uneven electric field distribution across the gel [60]. The buffer ions and current flow concentrate in loaded wells, creating differential resistance that alters migration kinetics in edge lanes. This effect can be particularly pronounced in mini-gel systems with wider well spacing.
Experimental Protocols for Artifact Resolution
Standardized SDS-PAGE Protocol
Sample Preparation
- Protein Extraction: Lyse cells or tissues in appropriate buffer (e.g., RIPA buffer) containing protease inhibitors to prevent degradation. Keep samples on ice throughout preparation.
- Denaturation: Mix protein sample with Laemmli buffer (62.5 mM Tris-HCl pH 6.8, 2% SDS, 10% glycerol, 0.01% bromophenol blue) containing 5% β-mercaptoethanol [57].
- Heat Denaturation: Heat samples at 70-100°C for 5-10 minutes to ensure complete denaturation [56]. For heat-sensitive proteins, consider alternative denaturation methods such as incubation with 8M urea [58].
- Cooling: Briefly centrifuge heated samples to collect condensation and ensure complete sample recovery.
Gel Preparation
- Resolving Gel: Prepare appropriate acrylamide concentration (see Table 1) in Tris-HCl pH 8.8. Add ammonium persulfate (APS) and TEMED last to initiate polymerization. Pour between plates, leaving space for stacking gel, and overlay with isopropanol or water to ensure even solidification.
- Stacking Gel: After resolving gel polymerizes, prepare stacking gel (lower acrylamide percentage, typically 4-5%) in Tris-HCl pH 6.8. Add APS and TEMED, pour over resolving gel, and immediately insert comb without introducing bubbles.
- Polymerization: Allow complete polymerization (typically 30-45 minutes) before removing comb and mounting gel in electrophoresis apparatus.
Electrophoresis Conditions
- Apparatus Assembly: Place gel in chamber, fill with running buffer (25 mM Tris, 192 mM glycine, 0.1% SDS, pH 8.3), and ensure buffer covers electrodes completely.
- Sample Loading: Rinse wells with running buffer to remove unpolymerized acrylamide and residual contaminants. Load equal protein amounts (typically 20-50 μg) alongside molecular weight markers.
- Electrophoresis: Run at constant voltage (100-150V for mini-gels) until dye front reaches bottom (approximately 60-90 minutes). Monitor temperature throughout run.
- Post-Electrophoresis Analysis: Proceed with staining (Coomassie, silver stain, etc.) or Western blot transfer as required.
Table 1: Optimal Acrylamide Concentrations for Protein Separation
| Protein Size Range (kDa) | Acrylamide Percentage (%) | Separation Characteristics |
|---|---|---|
| 5-50 | 12-15 | Optimal for small proteins |
| 10-100 | 10-12 | Standard separation range |
| 50-200 | 7-10 | Optimal for large proteins |
| 15-300 | 4-20% gradient | Broad range separation |
Troubleshooting Workflow for Band Distortion
The following diagnostic workflow provides a systematic approach to identifying and resolving common SDS-PAGE artifacts:
Specialized Protocol for Problematic Samples
For Samples Prone to Incomplete Denaturation
- Prepare sample buffer with increased SDS concentration (up to 4%).
- Heat samples at 95°C for 10 minutes with occasional vortexing.
- For extremely recalcitrant proteins, add urea to a final concentration of 8M and incubate at room temperature for 30 minutes before loading [58].
- For non-reducing conditions, consider adding iodoacetamide (IAM) to alkylate free sulfhydryl groups and prevent disulfide scrambling [58].
For High-Salt Samples
- Desalt samples using dialysis, spin columns, or precipitation methods.
- Dilute samples with low-salt buffer to reduce conductivity.
- Increase stacking gel volume to improve salt dispersal before entering resolving gel.
For Temperature-Sensitive Proteins
- Pre-run gel for 30 minutes at low voltage to equilibrate temperature.
- Run electrophoresis in cold room or with external cooling apparatus.
- Use lower voltage (80-100V) with extended run time to minimize heating.
Research Reagent Solutions for Optimal SDS-PAGE
Table 2: Essential Reagents for High-Quality SDS-PAGE
| Reagent/Category | Function | Key Considerations |
|---|---|---|
| Acrylamide/Bis-acrylamide | Forms porous gel matrix for size-based separation | Concentration determines pore size; 29:1 or 37.5:1 acrylamide:bis ratio standard [56] |
| SDS (Sodium Dodecyl Sulfate) | Denatures proteins and confers uniform negative charge | Purity critical for consistent binding; concentration affects denaturation efficiency [2] |
| Tris-Glycine Buffer | Discontinuous buffer system for stacking and separation | pH critical for proper ion mobility; fresh preparation prevents pH drift [57] |
| TEMED/Ammonium Persulfate | Catalyzes acrylamide polymerization | Fresh APS solution ensures complete polymerization; TEMED concentration affects polymerization rate [56] |
| β-Mercaptoethanol/DTT | Reducing agents that break disulfide bonds | Essential for complete unfolding; concentration affects reduction efficiency [2] |
| Protease Inhibitor Cocktails | Prevent protein degradation during sample preparation | Broad-spectrum inhibitors recommended for complex samples [59] |
| Molecular Weight Markers | Reference standards for size determination | Pre-stained and unstained varieties available; should span expected molecular weight range [56] |
| Coomassie/Silver Stains | Protein visualization after electrophoresis | Coomassie for standard detection (∼50ng sensitivity); silver stain for high sensitivity (∼1ng) [2] |
Quantitative Optimization Parameters
Table 3: Troubleshooting Guide with Quantitative Corrective Actions
| Artifact Type | Primary Cause | Diagnostic Checkpoints | Corrective Actions |
|---|---|---|---|
| Smiling Bands | Uneven heating | Center lanes migrate faster than edges; gel warm to touch | Reduce voltage to 100-120V; Use constant current setting; Implement external cooling [59] [61] |
| Frowning Bands | Cool center | Edge lanes migrate faster than center | Verify proper apparatus assembly; Ensure buffer circulation; Check for uneven cooling |
| Vertical Smearing | Sample degradation | Continuous stain from well through separation zone | Add fresh protease inhibitors; Keep samples on ice; Minimize preparation time [59] |
| Horizontal Smearing | Incomplete denaturation | Bands spread laterally rather than vertically | Increase heating time (10min at 95°C); Add urea to 8M; Verify SDS concentration [58] |
| Edge Effects | Empty peripheral wells | Distorted bands only in outer lanes | Load all wells with sample or dummy buffer; Verify even buffer levels [60] |
| Poor Resolution | Incorrect gel percentage | Bands too close together, difficult to distinguish | Adjust acrylamide concentration (see Table 1); Extend run time; Lower voltage [2] |
| No Bands | Transfer/Detection failure | Marker visible but sample bands absent | Verify power supply connections; Check staining protocol; Confirm sample concentration [59] |
Band distortion artifacts in SDS-PAGE represent solvable challenges when approached through systematic troubleshooting and method optimization. The smiling effects, smearing, and edge artifacts discussed herein predominantly stem from identifiable issues in heat management, sample integrity, and electrophoretic conditions. By implementing the standardized protocols, diagnostic workflows, and quantitative corrective measures outlined in this application note, researchers can significantly improve the quality and reproducibility of their protein separation data. Mastery of these troubleshooting principles not only resolves immediate experimental challenges but also develops the fundamental technical competency essential for rigorous molecular biology research. Through meticulous attention to procedural details and methodical artifact investigation, researchers can transform SDS-PAGE from a source of frustration into a reliable, reproducible analytical technique that generates publication-quality results with consistent accuracy.
Sodium dodecyl sulfate-polyacrylamide gel electrophoresis (SDS-PAGE) is a foundational technique in biochemistry and molecular biology, enabling the separation of complex protein mixtures based on molecular weight [62]. The method relies on SDS to denature proteins and impart a uniform negative charge, allowing migration through a polyacrylamide gel matrix under an electric field [63]. Despite its widespread use, researchers frequently encounter suboptimal results including poor band separation, blurry bands, and smearing, which compromise downstream analysis and interpretation [48].
This application note provides a comprehensive, step-by-step framework for troubleshooting and optimizing SDS-PAGE to achieve high-resolution protein separation. Within the broader context of methodological rigor in protein research, we present detailed protocols addressing common pitfalls, strategic optimization approaches, and practical solutions tailored for researchers, scientists, and drug development professionals seeking reliable protein analysis data.
Fundamentals of SDS-PAGE Separation
Understanding the core principles of SDS-PAGE is essential for effective troubleshooting. The technique employs a discontinuous buffer system with two distinct gel layers: a stacking gel (pH ~6.8) and a resolving gel (pH ~8.8) [63]. The stacking gel concentrates proteins into a sharp starting zone, while the resolving gel separates them based on molecular size [14].
Proteins are denatured and linearized by SDS, which binds in a relatively constant ratio (~1.4g SDS per 1g protein), masking native charge and creating a uniform charge-to-mass ratio [63]. Under an electric field, proteins migrate toward the anode, with smaller proteins moving faster through the polyacrylamide matrix [14]. The gel pore size, determined by acrylamide concentration, governs the separation range and resolution [64] [48].
Glycine's ionic state plays a critical role in the stacking mechanism. At the stacking gel's pH, glycine exists primarily as a zwitterion with limited mobility, creating a voltage gradient that focuses proteins into a narrow zone between chloride ions (leading ion) and glycine (trailing ion) [63]. When this zone reaches the higher pH resolving gel, glycine gains negative charge and migrates faster, depositing proteins as a tight band at the top of the resolving gel for optimal separation [63].
Troubleshooting Common Issues
Poor protein resolution manifests in various forms, each with distinct causes and solutions. The table below summarizes the primary issues and their troubleshooting strategies.
Table 1: Troubleshooting Guide for Poor SDS-PAGE Separation
| Issue Observed | Potential Causes | Recommended Solutions |
|---|---|---|
| Smearing or blurry bands | Incomplete protein denaturation [14] [48] | Add fresh reducing agent (DTT or β-mercaptoethanol); boil samples for 5 minutes at 95-100°C [64] [14]. |
| Protein overload [64] [48] | Load appropriate amount (≤2 µg purified protein; ≤20 µg complex mixture for Coomassie) [64]; validate protein concentration via Bradford/BCA assay [14]. | |
| High salt concentration [14] | Desalt samples; keep salt concentrations below 500 mM [14]. | |
| 'Smiling' or 'frowning' bands | Uneven gel temperature [64] [14] | Use magnetic stirrer in buffer chamber; run gel at lower voltage; ensure proper buffer level in outer chamber [64]. |
| Incorrect buffer composition/pH [14] | Prepare fresh running buffer; verify pH (typically 8.3 for Tris-glycine) [14] [63]. | |
| Poor separation/compressed bands | Incorrect gel percentage [64] [48] | Use lower % gel for large proteins (4-8% for ≥200 kDa); higher % for small proteins (15% for 10-50 kDa) [64]; consider gradient gels (e.g., 4-20%) [64] [14]. |
| Incomplete gel polymerization [48] | Ensure TEMED and ammonium persulfate are fresh; allow sufficient polymerization time [48]. | |
| Vertical band 'streaking' | Sample precipitation/aggregation [64] | Centrifuge denatured samples at max speed for 2-3 minutes before loading [64]. |
| Well overfilling or spillover [14] | Use gel loading tips; ensure buffer level above wells; avoid overloading wells [64] [14]. | |
| Atypical migration | Improper reduction/denaturation [48] | Ensure sufficient SDS; consider protein properties (hydrophobic/PTMs may affect SDS binding) [64] [63]. |
| Protein degradation [14] | Use protease inhibitors; include PMSF, sodium azide; keep samples on ice [14]. |
Optimizing Sample Preparation
Proper sample preparation is the most critical factor for achieving high-resolution separation. The following protocol ensures complete denaturation and reduction:
Protocol: Sample Denaturation and Reduction
- Sample Buffer Composition: Prepare Laemmli buffer containing 1-2% SDS, 5-10% glycerol, 62.5 mM Tris-HCl (pH 6.8), and 0.01% bromophenol blue [63]. For reduced conditions, add fresh DTT (1-5 mM) or β-mercaptoethanol (1-5%) to break disulfide bonds [64] [14].
- Denaturation: Mix protein sample with sample buffer (typically 1:1 to 1:4 ratio). For diluted samples, use more concentrated buffer stocks (5X or 6X) to maintain SDS and reducing agent concentration while allowing larger sample volume loading [64].
- Heat Denaturation: Incubate at 95-100°C for 5 minutes to complete denaturation. Avoid excessive heating (>10 minutes) to prevent protein degradation and aggregation [64] [48].
- Clarification: Centrifuge at maximum speed (10,000-16,000 × g) for 2-3 minutes to pellet any insoluble material or aggregates [64].
- Loading: Carefully load supernatant using gel loading tips to prevent well overflow and cross-contamination [64].
For challenging samples such as membrane proteins, extend the heating time to 10 minutes to disrupt hydrophobic interactions [64]. For native protein analysis (NSDS-PAGE), omit reducing agents and heating, and reduce SDS concentration to preserve protein function and metal cofactors [18].
Strategic Optimization Approaches
Gel Composition and Selection
Choosing the appropriate gel percentage is paramount for optimal resolution. The table below provides guidance based on target protein molecular weight.
Table 2: Gel Percentage Selection Guide for Optimal Resolution
| Acrylamide Percentage | Effective Separation Range | Applications and Notes |
|---|---|---|
| 8-10% | 70 kDa and larger [14] | Ideal for high molecular weight proteins; provides larger pore sizes. |
| 10-12% | 40-100 kDa [14] | Standard range for many applications; balances resolution for medium to large proteins. |
| 12-15% | 10-50 kDa [14] | Optimal for low molecular weight proteins; creates smaller pores for better separation. |
| 4-20% Gradient | Broad range (10-200 kDa) [64] | Excellent for samples with unknown composition or wide molecular weight distribution. |
For very large proteins (>200 kDa), use 4-8% gels to facilitate migration through the matrix [64]. For small proteins and peptides (<10 kDa), consider Tricine-SDS-PAGE instead of traditional glycine systems for improved resolution [14].
Electrophoresis Conditions
Optimal running conditions maintain protein stability and ensure even migration:
Protocol: Electrophoresis Setup and Execution
- Buffer Preparation: Prepare fresh Tris-glycine running buffer (25 mM Tris, 192 mM glycine, 0.1% SDS, pH 8.3) [63]. For NSDS-PAGE, reduce SDS to 0.0375% to maintain partial native structure [18].
- Temperature Management: Maintain gel temperature between 10°C-20°C during separation [64]. For high-voltage runs, use a cooling system or perform electrophoresis in a cold room.
- Voltage Parameters: Run gels at 100-150 volts for 40-60 minutes or until dye front reaches bottom [64]. For better resolution, use lower voltage (80-100 V) for initial migration through stacking gel, then increase to 120-150 V for resolving gel.
- Run Termination: Stop electrophoresis when the dye front is approximately 0.5-1 cm from the bottom to prevent loss of low molecular weight proteins [64].
To prevent "smiling" bands (curved bands where outer lanes migrate slower), ensure efficient heat dissipation by completely filling the outer buffer chamber and using a magnetic stirrer [64].
The Scientist's Toolkit: Essential Reagents
Table 3: Research Reagent Solutions for SDS-PAGE Optimization
| Reagent/Chemical | Function/Purpose | Optimization Notes |
|---|---|---|
| SDS (Sodium Dodecyl Sulfate) | Denatures proteins; confers negative charge [63] | Ensure adequate concentration; hydrophobic proteins may bind more SDS [63]. |
| DTT (Dithiothreitol) | Reducing agent for disulfide bonds [64] | Less odor than β-mercaptoethanol but less stable; prepare fresh solutions [64]. |
| β-mercaptoethanol | Reducing agent for disulfide bonds [64] | More stable than DTT; can be freeze-thawed repeatedly [64]. |
| TEMED & Ammonium Persulfate | Catalyzes acrylamide polymerization [63] | Ensure freshness for complete gel polymerization; critical for consistent pore size [48]. |
| Tris-Glycine Buffer | Running buffer for electrophoresis [63] | Maintain pH ~8.3; glycine charge state crucial for stacking effect [63]. |
| Protease Inhibitors | Prevent protein degradation [14] | Essential for preserving sample integrity; use PMSF, complete protease inhibitor cocktails. |
| Glycerol | Adds density to samples [63] | Prevents sample diffusion in wells; included in loading buffer. |
| Bromophenol Blue | Tracking dye [63] | Visualizes migration front; allows monitoring of run progress. |
Advanced Applications and Methodological Variations
Native SDS-PAGE for Functional Analysis
Standard SDS-PAGE denatures proteins, destroying functional properties and stripping bound cofactors [18] [62]. For applications requiring retention of protein activity, Native SDS-PAGE (NSDS-PAGE) provides an effective alternative:
Protocol: NSDS-PAGE for Metal Retention and Activity
- Sample Preparation: Omit heating step and reducing agents. Use modified sample buffer without SDS and EDTA [18].
- Running Buffer: Reduce SDS concentration to 0.0375% in running buffer [18].
- Electrophoresis: Conduct at standard voltages (200V for 30-45 minutes) [18].
- Analysis: Retained enzymatic activity can be detected through specific activity assays; metal retention confirmed using laser ablation-inductively coupled plasma-mass spectrometry or in-gel staining with metal-sensitive fluorophores like TSQ [18].
This method preserves 70-98% of bound metal ions and maintains activity for most Zn²⁺ metalloproteins while providing resolution comparable to denaturing SDS-PAGE [18].
Protein Load Optimization
Optimal protein loading depends on sample complexity and detection method:
Protocol: Determining Optimal Protein Load
- Purified Proteins: Load ≤2 µg per well for Coomassie staining [64].
- Complex Mixtures: Load ≤20 µg total protein per well for whole cell lysates with Coomassie staining [64].
- Western Blotting: Load 5-50 µg total protein depending on target abundance [64].
- High-Sensitivity Staining: Reduce load 5-10 fold for silver staining or fluorescent detection [64].
For quantitative comparisons, include loading controls such as housekeeping proteins (β-actin, GAPDH) to normalize for loading variations [14].
Workflow Integration and Quality Control
The following workflow diagram illustrates the comprehensive troubleshooting approach for optimizing SDS-PAGE resolution:
Diagram 1: SDS-PAGE Troubleshooting Workflow - This comprehensive workflow systematically addresses sample preparation, gel/buffer conditions, and electrophoresis parameters to resolve common SDS-PAGE issues.
Quality Control Measures
Implement these controls for reproducible, high-quality results:
- Molecular Weight Markers: Include in every run for size calibration and separation monitoring [64] [14]. Prestained markers allow visual tracking during electrophoresis.
- Positive and Negative Controls: For western blotting, include tissue/cell samples known to express or lack the target protein to verify antibody specificity [14].
- Loading Controls: Use housekeeping proteins (β-actin, GAPDH) to normalize for protein load variations in quantitative applications [14].
- Buffer Integrity: Regularly prepare fresh running and sample buffers to maintain proper pH and ionic strength [48].
Achieving optimal protein resolution in SDS-PAGE requires systematic attention to sample preparation, gel selection, and electrophoresis conditions. By understanding the fundamental principles and implementing the detailed protocols outlined in this application note, researchers can effectively troubleshoot common issues such as blurry bands, smearing, and poor separation. The comprehensive workflow and strategic optimization approaches provide a structured framework for obtaining reliable, high-quality protein separation data essential for advancing research and drug development projects.
Utilizing the appropriate gel percentage for target protein size, ensuring complete denaturation with fresh reducing agents, controlling gel temperature during runs, and implementing proper quality controls form the foundation of successful SDS-PAGE optimization. Through methodical application of these principles, researchers can transform problematic protein separations into publication-quality results.
In protein separation research, the integrity of experimental data is paramount. Sample loss and poor resolution during SDS-Polyacrylamide Gel Electrophoresis (SDS-PAGE) represent significant challenges that can compromise data accuracy, lead to erroneous conclusions, and waste precious research materials. These issues manifest primarily through two phenomena: uncontrolled migration, where proteins diffuse unpredictably or run off the gel matrix, and gel over-running, where proteins of interest migrate out of the gel entirely due to excessive electrophoresis time [65].
Within the broader context of a thesis on SDS-PAGE protocols, mastering the prevention of these artifacts is a fundamental competency. For researchers, scientists, and drug development professionals, consistently obtaining clear, reproducible protein bands is not merely convenient but essential for accurate molecular weight determination, purity assessment, and validation of protein expression [21]. This application note provides a detailed, step-by-step framework for identifying, troubleshooting, and preventing these common yet critical issues, ensuring the reliability of downstream analyses.
Principles and Common Causes of Sample Loss
Sample loss and migration issues typically stem from deviations in standard SDS-PAGE protocol. Understanding the underlying principles is the first step toward effective prevention.
- Sample Diffusion from Wells: When there is a significant delay between loading samples and applying the electric current, proteins can diffuse out of the wells haphazardly. The electric current is necessary for the streamlined, concordant migration of proteins toward the anode; without it, samples migrate uncontrollably, leading to loss and distorted bands [65].
- Gel Over-running: Electrophoresis is typically stopped when the dye front reaches the bottom of the gel. Running the gel beyond this point causes proteins, particularly those of lower molecular weight, to migrate off the gel into the running buffer, resulting in a blank or incomplete gel image and total loss of sample [65].
- Excessive Voltage: Running the gel at too high a voltage generates excessive heat. This can cause the gel to expand unevenly and create curved "smiling" bands, but it can also lead to smeared bands as proteins denature prematurely or interact unpredictably with the gel matrix [65] [4].
- Incorrect Gel Percentage: Using a gel with an inappropriate acrylamide concentration for the target protein's size will hinder proper separation. Large proteins require a low-percentage gel with larger pores to migrate effectively, while small proteins require a high-percentage gel with smaller pores to achieve resolution. An incorrect pore size can trap proteins or allow them to co-migrate as an unresolved smear [48].
The following workflow outlines the key decision points and checks in a protocol designed to prevent sample loss.
Troubleshooting Migration and Over-Running Issues
When problems occur, a systematic approach to troubleshooting is essential. The table below summarizes common issues, their root causes, and definitive solutions.
Table 1: Troubleshooting Guide for Sample Loss and Migration Issues
| Observed Problem | Primary Cause | Recommended Solution | Preventive Protocol Adjustment |
|---|---|---|---|
| Smeared Bands [65] [66] | Gel run at excessively high voltage. | Decrease voltage by 25-50% [66]. | Run gel at 10-15 V/cm gel length; use lower voltage for longer time [65]. |
| Smeared Bands [48] | Incomplete protein denaturation. | Ensure samples are boiled at 95–100°C for 5 minutes with fresh SDS and DTT [4] [48]. | Always use fresh sample buffer with adequate reducing agent. |
| Protein Ran Off Gel [65] [66] | Gel run for too long (over-running). | Stop electrophoresis immediately when dye front reaches the bottom (~1 cm from end). | For high molecular weight proteins, extend run time cautiously; for low MW proteins, reduce run time [65]. |
| Sample Migrates Out of Well Before Run [65] | Lag between sample loading and power application. | Start electrophoresis immediately after loading the last sample. | Minimize loading time; load fewer samples per gel if necessary [65]. |
| "Smiling" Bands (curved upwards) [65] [14] | Uneven heat distribution across gel. | Run gel in a cold room or with an ice pack in the apparatus [65]. | Use a lower voltage for a longer duration to reduce heat generation [65]. |
| Poor Band Resolution [65] [48] | Incorrect acrylamide concentration. | Use a gel percentage appropriate for target protein size (see Table 2). | For a wide MW range, use a gradient gel (e.g., 4–20%) [66] [2]. |
| Poor Band Resolution [65] | Improperly prepared or over-used running buffer. | Prepare fresh running buffer with correct salt concentration and pH. | Maintain a stock of fresh buffer components and avoid re-using buffer multiple times. |
| Vertical Streaking [66] | Sample overload or protein precipitation. | Centrifuge samples before loading; reduce amount of protein loaded per well. | Perform a protein concentration assay (e.g., BCA) to optimize loading amount [48]. |
Detailed Preventive Protocols and Procedures
Protocol 1: Optimized Sample Preparation and Loading
This protocol ensures proteins are properly denatured and loaded to prevent diffusion and smearing.
Step 1: Denaturation
- Mix protein sample with 2X Laemmli buffer (containing 4% SDS, 10% glycerol, 0.004% bromophenol blue, 100 mM Tris-HCl pH 6.8) [4].
- Add a fresh reducing agent (e.g., 5% β-mercaptoethanol or 100 mM DTT) to break disulfide bonds [48] [21].
- Heat the mixture at 95°C for 5 minutes to ensure complete denaturation and linearization [4] [48].
- Briefly centrifuge (e.g., 12,000 x g for 30 seconds) to collect condensation and any precipitated material.
Step 2: Synchronized Loading and Run Initiation
- Load the prepared samples into the wells promptly.
- Critical Step: Begin electrophoresis as soon as possible after loading the first sample. The maximum lag time should not exceed 10 minutes to prevent diffusion from wells [65].
- If loading a large number of wells, work quickly and in teams, or split samples across multiple gels.
Protocol 2: Controlling Electrophoresis Conditions to Prevent Over-Running
This protocol establishes parameters for precise control of the electrophoresis run.
Step 1: Voltage and Temperature Control
- Fill the tank with fresh Tris-glycine-SDS running buffer (25 mM Tris, 192 mM glycine, 0.1% SDS, pH 8.3) [4].
- For a standard mini-gel, apply 80-150 V during the run [65] [2].
- If the apparatus feels warm to the touch, reduce the voltage or employ a cooling method (e.g., run in a cold room, use a unit with a built-in cooling module, or place an ice pack in the buffer chamber) [65] [48].
Step 2: Determining the Optimal Run Time
- Monitor the migration of the bromophenol blue dye front.
- Stop the run immediately when the dye front is approximately 1 cm from the bottom of the gel [65]. This prevents lower molecular weight proteins from exiting the gel.
- For proteins >100 kDa, the dye front may be allowed to run off, but the run should be stopped as soon as sufficient separation of the target band is achieved.
Protocol 3: Gel Selection and Casting for Optimal Resolution
Choosing the right gel matrix is critical for effective separation without loss.
- Step 1: Selecting Acrylamide Concentration
Table 2: Guide to Gel Percentage Selection Based on Protein Size
| Percentage of Acrylamide | Effective Separation Range | Ideal for Protein Size |
|---|---|---|
| 15% | 10 - 50 kDa | Small Proteins |
| 12% | 40 - 100 kDa | Medium-Sized Proteins |
| 10% | 70 kDa and larger | Large Proteins |
| 4-20% Gradient | 10 - 300 kDa | Complex Mixtures / Unknown Sizes |
- Step 2: Ensuring Proper Gel Polymerization
- When casting gels, ensure all components are fresh, especially ammonium persulfate (APS) and TEMED, which catalyze polymerization [48].
- After pouring the resolving gel, overlay it with isopropanol or water-saturated butanol to create a flat, even interface [4].
- Allow the gel to polymerize completely (typically 20-30 minutes) before removing the overlay and pouring the stacking gel. Incomplete polymerization leads to poor well integrity and distorted migration [66] [48].
The Scientist's Toolkit: Essential Research Reagents
The following reagents and materials are fundamental for executing the protocols described and preventing sample loss.
Table 3: Essential Reagents and Materials for Reliable SDS-PAGE
| Reagent/Material | Function and Role in Prevention | Key Considerations |
|---|---|---|
| Sodium Dodecyl Sulfate (SDS) [2] [21] | Anionic detergent that denatures proteins and confers uniform negative charge. | Prevents migration artifacts due to native protein charge or structure. Use high-purity SDS. |
| Dithiothreitol (DTT) or β-mercaptoethanol [23] [21] | Reducing agent that breaks disulfide bonds in proteins. | Ensures complete linearization of proteins. Must be fresh to be effective. |
| Acrylamide/Bis-acrylamide [4] [21] | Monomer and cross-linker that form the porous gel matrix. | The ratio and concentration determine gel pore size, which dictates separation resolution. |
| Tris-Glycine-SDS Running Buffer [4] | Maintains pH and provides ions for current conduction during electrophoresis. | Fresh buffer is critical; old or diluted buffer can cause poor resolution and smearing [65] [48]. |
| Ammonium Persulfate (APS) & TEMED [4] | Catalyze the polymerization of acrylamide to form the gel. | Degraded APS is a common cause of incomplete gel polymerization, leading to poor well formation and running defects [66] [48]. |
| Pre-stained Protein Ladder [14] | Contains proteins of known size for molecular weight estimation and run monitoring. | Allows for visual tracking of electrophoresis progress to prevent over-running. |
The Tris-glycine-sodium dodecyl sulfate-polyacrylamide gel electrophoresis (SDS-PAGE) buffer system is a cornerstone technique for protein separation based on molecular weight, serving as a critical first step in western blotting and various proteomic analyses [14] [56]. Its reliability, however, is fundamentally dependent on the precise ionic strength and pH of the constituent buffers. The entire process relies on a discontinuous buffer system—employing different ions and pH values in the stacking gel, resolving gel, and running buffer—to first concentrate protein samples into sharp bands before separating them by size in the resolving gel [67] [68] [56]. Even minor deviations in buffer composition can disrupt the delicate ionic boundaries that drive this process, leading to poor resolution, aberrant migration, and failed experiments.
This application note provides a detailed, step-by-step guide for troubleshooting SDS-PAGE buffer systems, with a focused examination of how ionic strength and pH impact protein separation. Designed for researchers, scientists, and drug development professionals, the protocols herein are framed within the broader context of ensuring reproducible and high-quality protein analysis.
Theoretical Principles: The Role of Ions and pH
The Discontinuous Buffer System
The Laemmli system, the most common implementation of SDS-PAGE, uses a discontinuous buffering system to achieve high-resolution separation [68]. This system creates a moving boundary that compresses protein samples into extremely narrow bands before they enter the resolving gel. The key to this phenomenon lies in the differential mobility of ions under distinct pH conditions [67].
- Stacking Gel (pH ~6.8): The stacking gel is buffered with Tris-HCl at a lower pH. When the electric field is applied, the glycine molecules from the running buffer (pH 8.3) enter this low-pH environment. At pH 6.8, glycine exists primarily as a zwitterion with a net charge close to zero, giving it low electrophoretic mobility [67] [68].
- Chloride and Glycinate Fronts: The chloride ions (Cl⁻) from the Tris-HCl in the gel are highly mobile and form a leading ion front. The glycine zwitterions, with their low mobility, form a trailing ion front. Proteins, with mobilities intermediate between Cl⁻ and glycine, are compressed into a sharp zone between these two fronts [67] [68].
- Resolving Gel (pH ~8.8): Upon reaching the resolving gel, the pH abruptly increases. At this higher pH, glycine loses a proton and becomes the negatively charged glycinate anion, gaining high mobility. It overtakes the proteins, which are then left in a uniform electric field to be separated by the sieving effect of the polyacrylamide matrix based solely on their molecular weight [67] [68] [56].
The Critical Impact of Ionic Strength and pH
The proper execution of this process is exquisitely sensitive to buffer ionic strength and pH.
- Ionic Strength: The ions in the running buffer are essential for carrying the electric current through the gel [69]. If the ionic strength is too low (e.g., from an overly diluted buffer), the resistance increases, potentially leading to slower migration, poor band resolution, and excessive heat generation [69] [4]. Conversely, excessively high salt concentrations in the protein sample (e.g., >200-500 mM) can disrupt the SDS-protein complex, cause band smearing, or even precipitate SDS [14] [68].
- pH: Each buffer must maintain its specified pH to ensure proper protein charge and ion mobility. An incorrect pH in the running buffer can alter the charge of migrating proteins, leading to poor separation and artifacts like "smiling" bands [14]. If the sample buffer is at the wrong pH (e.g., indicated by a yellow color instead of blue), it can compromise protein stability and entry into the gel [14].
Recommended Reagents and Solutions
The following table details the essential reagents required for preparing a standard Tris-glycine SDS-PAGE buffer system.
Table 1: Research Reagent Solutions for SDS-PAGE Buffer Systems
| Reagent/Solution | Typical Composition | Primary Function |
|---|---|---|
| Running Buffer | 25 mM Tris, 192 mM glycine, 0.1% SDS, pH ~8.3 [4] | Conducts current, maintains pH during run, provides glycine for stacking |
| Resolving Gel Buffer | 1.5 M Tris-HCl, 0.4% SDS, pH ~8.8 [4] [56] | Sets pH for protein separation; high pH deprotonates glycine |
| Stacking Gel Buffer | 0.5 M Tris-HCl, 0.4% SDS, pH ~6.8 [4] [56] | Sets acidic pH to create glycine zwitterion for sample stacking |
| Sample Loading Buffer (Laemmli Buffer) | 62.5 mM Tris-HCl (pH 6.8), 2% SDS, 10% glycerol, 0.01% bromophenol blue, 5% β-mercaptoethanol [67] [4] | Denatures proteins, adds negative charge, provides dye front, adds density for loading |
| Tris (Base) | Tris(hydroxymethyl)aminomethane | Primary buffering agent for all solutions |
| Glycine | Aminoacetic acid | Trailing ion in stacking gel; mobility is pH-dependent [67] |
| SDS (Sodium Dodecyl Sulfate) | Anionic detergent | Denatures proteins and confers uniform negative charge [70] [56] |
Step-by-Step Protocol for Buffer Preparation and Electrophoresis
Buffer Preparation Protocol
Accurate preparation is critical. Use high-purity water (e.g., deionized, 18 MΩ-cm) and analytical-grade reagents.
Step 1: 10X Running Buffer Stock Solution
- Weigh out 30.0 g of Tris base and 144.0 g of glycine. Dissolve in approximately 800 mL of deionized water.
- Add 100 mL of a 10% (w/v) SDS solution.
- Adjust the final volume to 1 L with deionized water. The pH should be approximately 8.3 and typically does not require adjustment.
- Storage: Store at room temperature. Dilute to 1X working concentration with deionized water prior to use [4] [56].
Step 2: Resolving Gel Buffer (1.5 M Tris-HCl, pH 8.8)
- Dissolve 181.7 g of Tris base in 800 mL of deionized water.
- Slowly add concentrated HCl while stirring and monitoring the pH until a stable pH of 8.8 is reached.
- Add 40 mL of 10% (w/v) SDS solution.
- Adjust the final volume to 1 L with deionized water.
- Storage: Filter sterilize and store at 4°C [4].
Step 3: Stacking Gel Buffer (0.5 M Tris-HCl, pH 6.8)
- Dissolve 60.6 g of Tris base in 800 mL of deionized water.
- Slowly add concentrated HCl while stirring and monitoring the pH until a stable pH of 6.8 is reached.
- Add 40 mL of 10% (w/v) SDS solution.
- Adjust the final volume to 1 L with deionized water.
- Storage: Filter sterilize and store at 4°C [4].
Step 4: 2X Laemmli Sample Buffer
- Combine 2.5 mL of 0.5 M Tris-HCl (pH 6.8), 0.4 g of SDS, 2.0 mL of glycerol, and 2.0 mg of Bromophenol Blue.
- Bring the volume to 8 mL with deionized water.
- Critical: Add 1.0 mL of β-mercaptoethanol (BME) or 0.3 M Dithiothreitol (DTT) fresh before use to reduce disulfide bonds [14] [70].
- Storage: The buffer without reducing agent can be stored at room temperature; add reducing agent aliquots just before use.
Gel Electrophoresis Execution Protocol
Step 1: Sample Preparation
- Mix protein sample with an equal volume of 2X Laemmli Sample Buffer.
- Heat the mixture at 95°C for 5 minutes to ensure complete denaturation [4].
- Centrifuge briefly (10,000-15,000 x g for 30 seconds) to pellet any insoluble debris.
Step 2: Gel Loading and Run Conditions
- Load 10-50 µg of protein per well for Coomassie staining, or 1-10 µg for silver staining or western blotting [4].
- Fill the electrophoresis tank with 1X running buffer.
- Run Conditions: Apply a constant voltage. For a standard mini-gel:
- Stacking Phase: 80 V until the dye front has completely entered the resolving gel.
- Separating Phase: 120 V until the dye front reaches the bottom of the gel (approximately 60-90 minutes) [4].
- Temperature Control: Run the gel in a cold room or use a unit with a cooling function to dissipate heat and prevent "smiling" bands [69].
The workflow and ionic dynamics of the SDS-PAGE buffer system are summarized in the diagram below.
Troubleshooting Guide: Ionic Strength and pH Issues
The following table provides a systematic guide to diagnosing and resolving common buffer-related issues.
Table 2: Troubleshooting SDS-PAGE Buffer Ionic Strength and pH Issues
| Observed Problem | Potential Cause (Ionic Strength/pH) | Proposed Solution(s) | Preventive Protocol |
|---|---|---|---|
| Smeared bands [69] [14] | Running buffer too diluted (low ionic strength); \nVery high voltage causing overheating. | Remake running buffer at correct concentration (1X). \nRun gel at lower voltage (e.g., 100-150V). | Confirm stock solution concentration; \nUse constant voltage per cm gel length (10-15 V/cm) [69]. |
| 'Smiling' bands (curved upwards) [69] [14] | Buffer/gel overheating due to high voltage or incorrect buffer ionic strength/pH. | Run gel in a cold room or with cooling apparatus. \nVerify running buffer composition and pH. | Ensure adequate cooling; \nCheck pH of running buffer (should be ~8.3). |
| Poor band resolution or \nimproper separation [69] | Incorrect running buffer ion concentration; \nWrong pH of resolving gel buffer. | Remake running and resolving gel buffers accurately. \nEnsure resolving gel is at pH 8.8. | Calibrate pH meter before use; \nPrepare fresh resolving buffer stocks periodically. |
| Very fast or very slow \nmigration rate [69] | Running buffer too diluted (low ionic strength) or too concentrated (high ionic strength); \nIncorrect buffer pH. | Remake running buffer to correct 1X specification. \nCheck and adjust pH of running buffer to 8.3. | Always use the correct dilution factor from a accurately prepared stock. |
| Sample turns yellow [14] | Sample or running buffer is too acidic (low pH). | Add a small amount of NaOH to sample buffer to return blue color. \nRemake running buffer to pH 8.3. | Check sample buffer pH; ensure it is blue before loading. |
| Vertical streaks [4] | Air bubbles trapped in gel during casting; \nProtein aggregation due to high salt in sample. | Degas gel solution before polymerization. \nReduce salt concentration in sample (<200 mM) via dialysis or dilution [68]. | Degas acrylamide mix; \nDesalt protein samples before preparation. |
| Bands in peripheral \nlanes distorted (edge effect) [69] | Empty wells at gel periphery alter local electric field and ionic flow. | Load all peripheral wells with sample or dummy loading buffer. \nLoad protein ladder in one of the edge wells. | Plan experiment to fill all wells; use loading buffer in unused wells. |
The reproducibility and success of SDS-PAGE are inextricably linked to the meticulous preparation and understanding of its buffer systems. The ionic strength and pH are not mere recipe ingredients; they are active and dynamic players in establishing the moving boundaries that enable high-resolution protein separation. By adhering to the detailed protocols for buffer preparation outlined in this document and employing the systematic troubleshooting guide when issues arise, researchers can confidently diagnose and rectify common problems. This ensures the generation of reliable, publication-quality data, thereby supporting robust downstream analyses in drug development and basic research.
In protein biochemistry, SDS-PAGE (sodium dodecyl sulfate-polyacrylamide gel electrophoresis) stands as a fundamental technique for separating proteins by molecular weight. Central to its principle is that SDS confers a uniform negative charge to proteins, enabling separation primarily based on size under an electric field. However, the application of this electric field inevitably generates heat through Joule heating, where current passing through the resistive buffer solution converts electrical energy into thermal energy. This heating effect is not merely a background phenomenon but a critical variable that, if unmanaged, introduces significant thermal artifacts—deviations in band migration patterns that compromise the accuracy, reproducibility, and interpretability of results.
The core challenge lies in the temperature-sensitive nature of the separation matrix and the migrating proteins. Excessive or uneven heating within the gel can cause band smiling, where bands in central lanes curve upward due to faster migration compared to cooler outer lanes [71] [72]. More subtly, heat can induce protein aggregation or partial denaturation, leading to smeared bands, poor resolution, or even the complete loss of protein samples [72] [2]. For researchers and drug development professionals, these artifacts are not just inconveniences; they represent a direct threat to data integrity, potentially obscuring critical findings on protein purity, molecular weight, and post-translational modifications. Therefore, implementing robust heat management strategies is not an optional refinement but an essential component of a rigorous SDS-PAGE protocol.
Mechanisms and Impact of Electrophoresis Heating
Fundamental Principles of Heat Generation
The primary source of heat in electrophoresis is the Joule effect. As current flows through the conductive running buffer between the electrodes, the electrical energy is dissipated as thermal energy. The amount of heat generated (Q) is directly proportional to the square of the current (I) and the electrical resistance (R) of the system, as described by the equation Q = I²R. This relationship highlights why operating conditions, particularly the applied voltage and current, are primary levers in heat management. Higher voltages and currents, often used to expedite runs, dramatically increase heat output. The composition and ionic strength of the running buffer also significantly influence resistance and, consequently, heat generation [71] [2].
Consequences of Inadequate Thermal Control
Unmanaged heat leads to a cascade of problems that degrade gel quality. The most visually apparent is the "smiling effect" (or in some cases, "frowning"), where bands in the center of the gel, which is typically warmer, migrate faster than those on the cooler edges, creating a curved pattern [71] [72]. This uneven migration frustrates accurate molecular weight determination and complicates inter-lane comparisons.
Beyond band distortion, excessive heat can cause several other critical issues:
- Band Smearing: High temperatures can cause protein denaturation or aggregation within the gel matrix, resulting in diffuse, smeared bands rather than sharp, well-defined ones [72] [2].
- Gel Melting: In severe cases, particularly with agarose gels or high-percentage polyacrylamide gels, localized overheating can literally melt the gel matrix, creating holes or distortions that render the experiment useless [72].
- Altered Migration Kinetics: The viscosity of the gel and running buffer is temperature-dependent. As temperature increases, viscosity decreases, allowing all molecules to migrate faster. However, this effect is not always uniform across proteins of different sizes, potentially leading to inaccurate size estimations [73].
Table 1: Common Thermal Artifacts and Their Causes in SDS-PAGE
| Thermal Artifact | Primary Cause | Impact on Results |
|---|---|---|
| Band Smiling/Frowning | Uneven heating across the gel width [71] | Inaccurate inter-lane comparisons and molecular weight determination |
| Band Smearing | Protein aggregation or denaturation due to high temperature [72] [2] | Poor resolution, inability to distinguish closely sized proteins |
| Poor Resolution | Overheating causing diffusion of protein bands [72] | Loss of fine detail in complex protein mixtures |
| Gel Melting | Localized extreme heating, often from high voltage or insufficient buffer [72] | Physical destruction of the gel, loss of sample |
Furthermore, emerging techniques like capillary gel electrophoresis (CE-SDS) have quantitatively demonstrated that the electrophoretic mobility of protein-SDS complexes is a temperature-activated process. The relationship between mobility (μ) and temperature (T) follows an Arrhenius-type behavior, described by μ ∝ exp(-Ea/RT), where Ea is the activation energy required for the complex to drift through the sieving matrix [73]. This finding underscores that temperature is not just a source of artifact but a fundamental parameter that directly governs the separation physics. Different protein-SDS complexes can have distinct activation energies, meaning that temperature changes can selectively alter the resolution between specific protein species [74] [73].
Quantitative Data and Temperature Effects
A systematic understanding of heat management requires a quantitative look at how temperature influences key separation parameters. Data from Capillary SDS-Gel Electrophoresis (CE-SDS) provides precise insights into these relationships. As separation temperature increases from 20°C to 50°C, the electrophoretic mobility of all protein-SDS complexes increases, leading to a consistent decrease in migration time [73]. This is primarily attributed to a decrease in the viscosity of the sieving matrix. However, the extent of this change is not uniform for all proteins.
The activation energy (Ea) required for a protein-SDS complex to migrate through the sieving matrix is a unique characteristic that determines its temperature sensitivity. Research has shown that different species within a biopharmaceutical sample, such as the light and heavy chains of a monoclonal antibody or smaller nanobodies, possess distinct activation energies [73]. Consequently, the resolution between two specific protein peaks does not change monotonically with temperature; instead, it can be fine-tuned. For instance, in a mixture containing a 10 kDa standard, a 14.26 kDa nanobody, and the light chain (23.89 kDa) of a therapeutic antibody, raising the temperature from 20°C to 50°C can increase the resolution between the 10 kDa protein and the nanobody while simultaneously decreasing the resolution between the nanobody and the light chain [73]. This highlights that there is no single "ideal" temperature for all separations; the optimal temperature is application-specific.
Table 2: Effect of Separation Temperature on Resolution in CE-SDS of a Biopharma Sample Mixture [73]
| Temperature (°C) | Resolution (10 kDa vs. Nanobody) | Resolution (Nanobody vs. Light Chain) | Resolution (Light Chain vs. Heavy Chain) |
|---|---|---|---|
| 20 | Lower | Higher | Higher |
| 30 | Increasing | High | High |
| 40 | Higher | Decreasing | Moderate |
| 50 | Highest | Lower | Lower |
These findings from CE-SDS are directly analogous to traditional SDS-PAGE. The ability to precisely control and adjust temperature is not merely for preventing artifacts but can be leveraged as an active optimization parameter to achieve the desired separation for specific protein targets, a crucial consideration for the analysis of complex therapeutic proteins like bispecific antibodies and fusion proteins [73].
Protocols for Minimizing Thermal Artifacts
Pre-Run Planning and Setup
Proper setup is the first line of defense against thermal artifacts.
Protocol 1: Gel and Buffer Selection
- Choose the Appropriate Running Buffer: Tris-Glycine-SDS is standard, but be aware that TBE (Tris-Borate-EDTA) has a higher ionic strength than TAE (Tris-Acetate-EDTA) and may be more suitable for longer runs as it generates less heat [71] [72].
- Prepare Fresh Buffer: Always use freshly prepared running buffer to ensure consistent ionic strength and pH. Degraded or contaminated buffers can have altered conductivity, leading to unstable and hotter runs [72].
- Select the Correct Gel Percentage: Match the gel pore size (acrylamide percentage) to your target protein size. Using a gel that is too dense for large proteins increases resistance and heat generation. For a wide size range, consider a gradient gel [2].
Protocol 2: Apparatus Assembly and Inspection
- Inspect the Electrophoresis Unit: Before use, visually check the tank, electrodes, and lid for cracks, corrosion, or buffer crystallization. Damaged components can cause uneven current flow and localized heating [75].
- Ensure a Proper Seal: Verify that the gel is properly seated in the apparatus with secure gaskets to prevent buffer leaks, which can alter current paths and create hot spots [75].
- Submerge the Gel Correctly: After placing the gel in the tank, fill it with running buffer so the gel is fully submerged with 3–5 mm of buffer above its surface. Insufficient buffer leads to overheating, while too much can slow migration and distort bands [71].
Optimizing Running Conditions
The parameters set on the power supply are the most direct means of managing heat during the run.
Protocol 3: Voltage and Current Regulation
- Avoid Constant High Voltage: While tempting for faster results, high voltage is a primary driver of Joule heating. For standard mini-gels, a constant voltage of 100-150 V is typically a safe and effective range [2].
- Consider Constant Current Mode: If your power supply supports it, running in constant current mode can help stabilize heat generation, as the current (I), a key factor in the I²R heat equation, is held steady.
- Employ a Staged Protocol: For maximum resolution with minimal heat, start the run at a lower voltage (e.g., 80 V) to allow proteins to stack at the top of the resolving gel. After the dye front has entered the resolving gel (∼15-20 minutes), increase the voltage to the desired level for separation [72].
Protocol 4: Active Cooling and Run Monitoring
- Utilize a Cooling Apparatus: If available, use a thermostatic circulator to pump coolant through a jacket in the electrophoresis tank. This is the most effective method for maintaining a constant temperature [74] [73].
- Run in a Cold Room: Performing the electrophoresis in a 4°C cold room is a highly effective and low-tech way to dissipate heat and maintain a consistent, low temperature throughout the run.
- Monitor Run Time Closely: Do not leave gels running unattended for excessively long periods. Over-running the gel can cause proteins, especially low molecular weight ones, to migrate off the gel and can exacerbate heat-related distortions [2].
Post-Run Analysis and System Maintenance
Proper care of equipment ensures consistent performance and helps prevent future artifacts.
- Protocol 5: Post-Run Equipment Care
- Immediate Rinsing: Immediately after the run, disassemble the unit and rinse the tank, gel trays, and combs thoroughly with deionized water to prevent buffer salts from crystallizing, which can damage components and create current irregularities in future runs [75].
- Regular Electrode Cleaning: Clean the electrodes according to the manufacturer's instructions. Corroded or contaminated electrodes can lead to uneven current distribution [75].
- Periodic Safety Checks: Regularly inspect power cords and connectors for fraying or damage. Faulty wiring can cause electrical fluctuations that contribute to overheating [76] [75].
The Scientist's Toolkit: Essential Research Reagents and Materials
Successful management of thermal artifacts relies on the use of appropriate reagents and equipment. The following table details key solutions and materials essential for implementing the protocols outlined in this document.
Table 3: Research Reagent Solutions for Thermal Management in Electrophoresis
| Item | Function/Description | Application Note |
|---|---|---|
| Pre-cast Gels | Polyacrylamide gels cast under controlled, consistent conditions. | Eliminates variability from in-house gel polymerization, which can be exothermic and introduce initial structural inconsistencies [76]. |
| TBE Buffer (Tris-Borate-EDTA) | A common running buffer with higher ionic strength than TAE. | Better buffering capacity and less resistive heating during longer runs; ideal for separating smaller DNA/protein fragments [71] [72]. |
| TAE Buffer (Tris-Acetate-EDTA) | A common running buffer with lower ionic strength. | Preferred for resolving longer fragments; may run cooler than TBE at equivalent voltages due to differences in conductivity [71]. |
| Thermostatic Circulator | An external device that circulates temperature-controlled fluid through the electrophoresis apparatus. | Provides active cooling to maintain a constant, user-defined temperature, crucial for high-resolution and reproducible separations [74] [73]. |
| PA 800 Plus System (or equivalent) | A capillary electrophoresis instrument with precise temperature control. | Allows for fine-tuning separation temperature with high precision (±0.1°C) to optimize resolution for specific analytes like therapeutic proteins [73]. |
| SYBR Safe DNA Gel Stain | A less hazardous, sensitive fluorescent nucleic acid stain. | A safer alternative to ethidium bromide; its high sensitivity allows for shorter run times, indirectly reducing heat exposure [71]. |
| FastRuler DNA Ladders | Size markers designed for fast separation and short migration. | Reduces required run time and voltage, thereby minimizing the total heat load applied to the gel [71]. |
Effective heat management is a cornerstone of high-quality electrophoresis, transforming it from a simple technique into a refined and robust analytical method. The strategies detailed herein—from meticulous pre-run preparation and optimization of electrical parameters to the strategic use of cooling and high-quality reagents—provide a comprehensive framework for mitigating thermal artifacts. It is critical for researchers, particularly those in drug development where characterization must be exact, to recognize temperature not as a nuisance variable, but as a fundamental and controllable parameter of the separation process. By adopting these protocols and understanding the underlying principles of Joule heating and its effects, scientists can ensure their SDS-PAGE results are characterized by sharp bands, accurate molecular weight determination, and the high level of reproducibility required for impactful research and regulatory compliance.
Sodium dodecyl sulfate-polyacrylamide gel electrophoresis (SDS-PAGE) remains a cornerstone technique in molecular biology and biopharmaceutical development for separating proteins by their apparent molecular weight [77]. The principle of this assay relies on the fact that the relative migration distance of a protein is negatively proportional to its molecular weight, allowing researchers to analyze protein purity, composition, and approximate size [15]. While the basic protocol is widely established, advanced optimization of gel composition—specifically the concentration of polyacrylamide—is crucial for achieving optimal resolution across different protein molecular weight ranges. This application note provides detailed methodologies and data-driven recommendations for tailoring SDS-PAGE conditions to specific protein size ranges, enabling researchers in drug development and protein research to obtain superior separation results for their target proteins.
The foundation of SDS-PAGE was established in the 1960s and 1970s, with the pioneering work of Ulrick K. Laemmli building upon earlier developments by Shapiro, Viñuela, and Maizel [77]. Despite the emergence of capillary electrophoresis technologies like CE-SDS that offer automation and improved reproducibility, traditional SDS-PAGE continues to be widely used due to its accessibility, low cost, and flexibility [77]. The technique's resolution capabilities directly depend on the pore size of the polyacrylamide gel matrix, which is determined by the total acrylamide concentration and the degree of cross-linking. Understanding these relationships allows researchers to systematically optimize separation conditions for specific protein targets, which is particularly valuable in biopharmaceutical development when characterizing therapeutic proteins such as monoclonal antibodies, bispecific antibodies, ADCs, and fusion proteins [77].
Principles of Protein Separation in SDS-PAGE
In SDS-PAGE, proteins are denatured and linearized through incubation with sodium dodecyl sulfate (SDS) and heat, which confers a uniform negative charge density proportional to their mass [15]. When an electric field is applied, these SDS-protein complexes migrate through the porous polyacrylamide gel matrix toward the anode. The sieving effect of the gel matrix causes smaller proteins to migrate faster than larger ones, resulting in separation based primarily on molecular weight rather than charge or conformation.
The relationship between protein migration distance and molecular weight is logarithmic, following the equation: log(MW) = a - b × μ, where MW is molecular weight, μ is mobility, and a and b are constants dependent on gel composition. The optimal acrylamide concentration creates a pore size distribution that maximizes separation efficiency for a specific molecular weight range. The use of a discontinuous gel system—with a stacking gel that concentrates the protein samples into a sharp band before entering the separating gel—further enhances resolution [15]. For visualization, Coomassie brilliant blue, an anionic dye that binds to proteins, is typically used to make them visible as blue bands on a clear background after destaining [15].
The following diagram illustrates the core principle of how proteins are separated by size within the gel matrix:
Gel Composition Optimization Strategies
Polyacrylamide Concentration and Protein Range Correlation
The concentration of polyacrylamide in the resolving gel directly determines the effective pore size and thus the range of molecular weights that can be separated with optimal resolution. Higher acrylamide concentrations create smaller pores, providing better resolution for lower molecular weight proteins, while lower concentrations create larger pores suitable for separating higher molecular weight proteins. The table below provides detailed recommendations for gel compositions optimized for specific protein ranges:
Table 1: Optimized Gel Compositions for Specific Protein Ranges
| Target Protein Range (kDa) | Recommended Acrylamide Concentration (%) | Cross-Linker Ratio (%) | Expected Migration Distance Ratio (High:Low MW) | Optimal Gel Type |
|---|---|---|---|---|
| <10 | 12-20% | 2.5-3% | 2.8:1 | Uniform high % |
| 10-50 | 10-12% | 2.5-3% | 2.5:1 | Uniform |
| 15-100 | 8-10% | 2.5-3% | 2.2:1 | Uniform |
| 50-200 | 5-8% | 2.5-3% | 1.8:1 | Uniform or gradient |
| >200 | 3-6% | 2.5-3% | 1.5:1 | Gradient recommended |
For complex samples with proteins spanning a wide molecular weight range, gradient gels provide superior resolution across the entire separation spectrum. These gels create a continuously changing pore size environment, offering sharp band resolution for both high and low molecular weight proteins simultaneously. The increasing polyacrylamide concentration along the migration path causes proteins to slow down progressively, with each protein reaching a "pore limit" where it can no longer migrate effectively through the constricting gel matrix [78]. Commercial precast gradient gels are widely available in various ranges (e.g., 4-20%, 8-16%, 10-20%), providing researchers with flexible options for different applications while eliminating the technical challenges of casting gradient gels manually [78].
Buffer System Considerations
While the Laemmli Tris-glycine discontinuous buffer system remains the most widely used for SDS-PAGE, alternative buffer systems can enhance resolution for specific applications. Tris-acetate buffers with higher pH values (pH ~8.5) provide better resolution for high molecular weight proteins (>150 kDa) due to increased negative charge on the SDS-protein complexes and altered gel conductivity. For low molecular weight proteins and peptides, Tris-tricine buffer systems offer superior resolution below 20 kDa by maintaining SDS binding and providing a more favorable pH gradient. The stacking gel pH (6.8) and resolving gel pH (8.8) in the traditional Laemmli system should be precisely controlled to ensure proper formation of the moving boundary that concentrates proteins before separation [15].
Experimental Protocols
Standard SDS-PAGE Protocol for Mid-Range Proteins (15-100 kDa)
This protocol provides detailed methodology for separating proteins in the 15-100 kDa range using a 10% polyacrylamide gel, which represents the most commonly encountered protein size range in research applications.
Materials:
- 30% Acrylamide/bis-acrylamide solution (29:1)
- 1.5 M Tris-HCl, pH 8.8 (resolving gel buffer)
- 1.0 M Tris-HCl, pH 6.8 (stacking gel buffer)
- 10% Sodium dodecyl sulfate (SDS)
- 10% Ammonium persulfate (APS, freshly prepared)
- Tetramethylethylenediamine (TEMED)
- Protein molecular weight marker
- 2X SDS-PAGE sample loading buffer (125 mM Tris-HCl pH 6.8, 4% SDS, 20% glycerol, 0.02% bromophenol blue, with 10% β-mercaptoethanol added fresh for reduced conditions)
- Running buffer (25 mM Tris, 192 mM glycine, 0.1% SDS, pH 8.3)
- Coomassie Brilliant Blue staining solution (0.1% Coomassie R-250, 40% methanol, 10% acetic acid)
- Destaining solution (40% methanol, 10% acetic acid) [15]
Instrumentation:
- Electrophoresis chamber with glass plates, spacers, and comb
- Power supply capable of constant voltage/current
- Heating block or water bath (95-100°C)
- Centrifuge for microcentrifuge tubes
- Gel documentation system or white light transilluminator [15] [79]
Method:
- Assemble glass plates and spacers in the gel casting apparatus according to manufacturer instructions, ensuring a tight seal to prevent leakage.
Prepare resolving gel solution (10 mL for two mini-gels):
- 3.3 mL 30% acrylamide/bis solution
- 2.5 mL 1.5 M Tris-HCl, pH 8.8
- 4.1 mL deionized water
- 100 μL 10% SDS
- 50 μL 10% APS
- 10 μL TEMED
- Add TEMED last and mix gently to avoid introducing bubbles
Pour resolving gel immediately after adding TEMED, using a pipette to transfer the solution between glass plates. Leave space for the stacking gel (approximately 2 cm below the top of the shorter plate).
Overlay with saturated butanol or deionized water to create a flat interface and exclude oxygen which inhibits polymerization. Allow gel to polymerize for 20-30 minutes at room temperature.
Prepare stacking gel solution (5 mL for two mini-gels):
- 830 μL 30% acrylamide/bis solution
- 630 μL 1.0 M Tris-HCl, pH 6.8
- 3.4 mL deionized water
- 50 μL 10% SDS
- 25 μL 10% APS
- 5 μL TEMED
Pour stacking gel: Remove overlay liquid from polymerized resolving gel, rinse with deionized water, and drain completely. Pour stacking gel solution and immediately insert a clean comb, avoiding air bubbles. Allow to polymerize for 20-30 minutes.
Prepare protein samples: Mix protein solution with equal volume of 2X SDS sample loading buffer. Denature at 95-100°C for 5-10 minutes, then centrifuge briefly at 12,000 × g to collect condensation [15].
Load samples: Place polymerized gel in electrophoresis chamber and fill with running buffer. Carefully remove comb and load samples into wells, including appropriate molecular weight markers.
Run electrophoresis: Connect power supply and run at constant voltage (90-120 V) until dye front reaches the bottom of the gel (approximately 60-90 minutes for mini-gels). For better resolution, start at 80 V until samples enter resolving gel, then increase to 120 V.
Stain and destain gel: Carefully separate glass plates and transfer gel to Coomassie staining solution. Stain with gentle agitation for 15 minutes to overnight depending on desired sensitivity. Transfer to destaining solution with gentle agitation, changing solution periodically until background is clear and protein bands are visible [15].
Document results: Image gel using a gel documentation system with white light transilluminator or standard light box [79].
Specialized Protocol for High Molecular Weight Proteins (>200 kDa)
For high molecular weight proteins, modifications to the standard protocol are necessary to achieve optimal separation:
- Use lower acrylamide concentrations (3-6%) to create larger pores
- Consider gradient gels (e.g., 3-8% or 4-10%) for optimal resolution
- Use Tris-acetate buffer system (pH ~7.0) instead of Tris-glycine
- Extend run times at lower voltages (80-100 V) to prevent overheating and protein smearing
- Include 2-4 M urea in the gel to improve solubility of large proteins
- Reduce SDS concentration to 0.05% in the gel to prevent SDS-induced aggregation
Specialized Protocol for Low Molecular Weight Proteins and Peptides (<10 kDa)
For low molecular weight proteins and peptides, the following modifications enhance resolution:
- Use higher acrylamide concentrations (12-20%) to create smaller pores
- Implement Tris-tricine buffer system instead of Tris-glycine
- Increase cross-linking to 3-5% for more rigid gel matrix
- Reduce gel thickness to 0.5-0.75 mm for sharper bands
- Include 4-6 M urea in gel to prevent peptide aggregation
- Use lower voltages (100-120 V) with extended run times
The Scientist's Toolkit: Essential Research Reagents and Materials
Successful SDS-PAGE optimization requires high-quality reagents and specialized equipment. The following table details essential materials for advanced gel composition optimization:
Table 2: Essential Research Reagents and Materials for SDS-PAGE Optimization
| Item | Function/Application | Specifications & Considerations |
|---|---|---|
| Acrylamide/Bis-acrylamide | Forms the porous gel matrix for protein separation | 30-40% stock solution (29:1 or 37.5:1 acrylamide:bis ratio); neurotoxin—handle with gloves |
| TEMED | Catalyzes acrylamide polymerization | Accelerates polymerization; amount affects gel polymerization time and porosity |
| Ammonium Persulfate | Free radical initiator for polymerization | Prepare fresh 10% solution; concentration affects polymerization rate and gel structure |
| Tris-HCl Buffers | Maintains pH during electrophoresis | 1.5 M, pH 8.8 (resolving gel); 1.0 M, pH 6.8 (stacking gel); precise pH critical for discontinuous system |
| SDS (Sodium Dodecyl Sulfate) | Denatures proteins and confers negative charge | 10-20% solution; purity affects background staining and band sharpness |
| Protein Molecular Weight Marker | Reference for molecular weight estimation | Pre-stained or unstained; should span target separation range |
| Coomassie Brilliant Blue | Protein staining and visualization | R-250 (high sensitivity) or G-250 (quick staining); dissolves in methanol/acetic acid |
| Precast Gels | Ready-to-use gels for consistency and convenience | Available in various percentages and gradients; eliminate casting variability [78] |
| Gel Documentation System | Imaging and analysis of separated proteins | Digital capture with appropriate filters; smartphone/tablet-based systems offer cost-effective alternatives [79] |
Advanced Optimization Workflow
The following diagram illustrates the systematic decision-making process for optimizing gel composition based on protein characteristics:
Applications in Biopharmaceutical Development
Optimized SDS-PAGE protocols play a critical role throughout the biopharmaceutical development pipeline, from early research to quality control of final products. In characterization of therapeutic proteins such as monoclonal antibodies, SDS-PAGE under reducing conditions separates heavy and light chains for assessment of purity and integrity [77]. Under non-reducing conditions, the technique can detect fragments, aggregates, and other product-related impurities that may affect safety or efficacy. For more complex modalities like antibody-drug conjugates (ADCs) and bispecific antibodies, optimized gradient gels provide essential information about drug-antibody ratio and heterodimer formation [77].
The technique also serves as a foundational method for western blotting, where proteins separated by SDS-PAGE are transferred to membranes for specific detection with antibodies [15]. This application is particularly valuable in biomarker verification and signaling pathway analysis in drug discovery. In quality control environments, SDS-PAGE methods must be rigorously optimized and validated to ensure consistency, with precast gels often preferred to minimize variability [78]. While capillary electrophoresis-SDS (CE-SDS) is increasingly implemented in regulated environments for its automation and quantitative capabilities, traditional SDS-PAGE remains widely used for its flexibility, low cost, and visual interpretability [77].
Advanced optimization of gel composition represents a critical step in obtaining high-quality protein separation results using SDS-PAGE. By systematically tailoring acrylamide concentration, cross-linking ratio, buffer systems, and running conditions to specific protein size ranges, researchers can achieve resolution that meets the demanding requirements of modern protein research and biopharmaceutical development. The protocols and recommendations provided in this application note offer a structured approach to this optimization process, enabling scientists to overcome common separation challenges and generate reliable, reproducible data. As protein therapeutics continue to increase in complexity and diversity, these fundamental separation techniques remain essential tools in the analytical toolbox of life science researchers.
Advanced SDS-PAGE Applications: Validation, Interpretation and Integration
Within the framework of protein separation research via SDS-PAGE, the accurate determination of molecular weight is a foundational procedure. Sodium Dodecyl Sulfate Polyacrylamide Gel Electrophoresis (SDS-PAGE) separates proteins based almost exclusively on their molecular mass by negating the effects of protein charge and shape [80] [10]. This application note details a standardized protocol for determining protein molecular weight, generating a reliable standard curve, and critically assessing the factors influencing the accuracy of this method, providing researchers and drug development professionals with a robust analytical tool.
Principle of Molecular Weight Determination
The core principle of molecular weight determination by SDS-PAGE relies on the inverse logarithmic relationship between the molecular weight of a polypeptide and its electrophoretic mobility through a polyacrylamide gel matrix [81] [21].
The anionic detergent SDS plays a critical role by binding to hydrophobic regions of proteins at an approximate ratio of 1.4 g SDS per 1 g of protein [21] [10]. This binding confers a uniform negative charge density, effectively masking the protein's intrinsic charge. Simultaneously, SDS disrupts nearly all non-covalent bonds, denaturing the protein into a linear polypeptide chain [80]. The use of reducing agents like Dithiothreitol (DTT) or β-mercaptoethanol further breaks disulfide bonds, ensuring complete denaturation [21] [80].
During electrophoresis, these denatured, SDS-coated polypeptides migrate through the pores of the polyacrylamide gel when an electric field is applied. Smaller proteins navigate the pores more easily and migrate faster, while larger proteins are impeded and migrate more slowly [10]. The migration distance of a protein is thus inversely proportional to the logarithm of its molecular weight [81].
Materials and Reagents
Research Reagent Solutions
The following table details the essential reagents and their specific functions in the SDS-PAGE process.
Table 1: Essential Reagents for SDS-PAGE Molecular Weight Determination
| Item | Function/Description |
|---|---|
| Sodium Dodecyl Sulfate (SDS) | Anionic detergent that denatures proteins and imparts a uniform negative charge, ensuring separation is based solely on molecular weight [21] [10]. |
| Acrylamide/Bis-acrylamide | Monomer and crosslinker that polymerize to form the porous gel matrix, which acts as a molecular sieve [80] [10]. |
| Ammonium Persulfate (APS) | Catalyst that initiates the free-radical polymerization reaction of the polyacrylamide gel [80]. |
| TEMED | Stabilizer that works with APS to accelerate the polymerization of acrylamide and bis-acrylamide [80]. |
| Tris-Glycine Buffer | Common running buffer that provides the necessary ions and pH for electrophoresis and protein migration [10]. |
| Dithiothreitol (DTT) or β-Mercaptoethanol | Reducing agents that break disulfide bonds within and between protein subunits, ensuring complete linearization [21] [80]. |
| Protein Molecular Weight Standards | A set of proteins with known, pre-defined molecular weights used to construct the standard calibration curve [81] [10]. |
| Coomassie Brilliant Blue / Silver Stain | Stains used to visualize separated protein bands on the gel post-electrophoresis [10] [82]. |
Protocol for Molecular Weight Determination and Standard Curve Generation
Experimental Workflow
The following diagram illustrates the comprehensive workflow for determining protein molecular weight using SDS-PAGE, from sample preparation to data analysis.
Step-by-Step Procedure
Step 1: Protein Sample and Standard Preparation
- Dilute protein samples and molecular weight standards in an appropriate sample buffer. A standard 2X Laemmli buffer is commonly used, which contains SDS, glycerol, bromophenol blue, and a reducing agent [80] [10].
- Heat the mixtures at 95°C for 5-10 minutes to ensure complete denaturation and reduction of the proteins [80].
Step 2: Gel Casting
- Assemble the gel cassette.
- Preparing the Resolving Gel: Mix acrylamide/bis-acrylamide solution at the desired percentage, Tris-HCl buffer (pH 8.8), SDS, APS, and TEMED. Pour the mixture into the cassette and overlay with isopropanol or water to create a flat interface. Allow it to polymerize completely [80] [10].
- Preparing the Stacking Gel: After removing the overlay, pour the stacking gel mixture (lower acrylamide percentage, Tris-HCl pH 6.8, SDS, APS, TEMED) on top of the resolving gel and insert a comb. Allow it to polymerize [80] [10].
Step 3: Electrophoresis
- Place the polymerized gel into the electrophoresis chamber and fill the tank with running buffer.
- Carefully load the prepared samples and molecular weight standards into the wells.
- Connect the power supply and run the gel at a constant voltage (e.g., 80-150 V) until the dye front reaches the bottom of the gel [10] [82].
Step 4: Protein Visualization
- After electrophoresis, carefully remove the gel from the cassette.
- Stain the gel with Coomassie Brilliant Blue or a more sensitive silver stain to visualize the protein bands [10] [82].
- Destain the gel to remove background stain and achieve clear, visible bands.
Step 5: Data Collection and Standard Curve Generation
- Measure the migration distance of each protein band in the molecular weight standard and the unknown samples. The migration distance is measured from the top of the separating gel to the center of each band [81].
- Calculate the relative front (Rf) for each standard and unknown protein using the formula: Rf = Migration distance of protein / Migration distance of dye front [81].
- Plot the Rf values of the standard proteins against the logarithm of their known molecular weights. This typically generates a linear plot for most proteins within the effective separation range of the gel [81].
- Perform linear regression analysis on the standard points to obtain the equation of the line, typically in the form of Log(MW) = -m * Rf + c [81].
Step 6: Determination of Unknown Molecular Weight
- Using the Rf value of the unknown protein band, interpolate its logarithmic molecular weight from the standard curve equation.
- Calculate the actual molecular weight by taking the inverse logarithm (antilog) of the obtained value [81].
Accuracy Assessment
The accuracy of molecular weight determination by SDS-PAGE is typically within 5-10% for most standard, globular proteins [81]. However, several critical factors can influence this accuracy, as summarized in the table below.
Table 2: Factors Affecting Accuracy in SDS-PAGE Molecular Weight Determination
| Factor | Impact on Accuracy | Mitigation Strategy |
|---|---|---|
| Gel Percentage | Higher % gels better resolve smaller proteins; lower % gels better resolve larger proteins [21]. | Choose a gel percentage appropriate for the protein's expected MW range (e.g., 12% for 10-250 kDa). Use gradient gels for broad MW ranges [21]. |
| Protein Characteristics | Glycoproteins and lipoproteins may not bind SDS uniformly due to their carbohydrate/lipid moieties, leading to aberrant migration and overestimation of MW [81]. | Use deglycosylation enzymes prior to electrophoresis or alternative methods like mass spectrometry for validation [83]. |
| Sample Preparation | Incomplete denaturation or reduction can leave residual secondary/tertiary structure, causing anomalous migration [21] [23]. | Ensure thorough heating and use fresh reducing agents in the sample buffer [80]. |
| Standard Curve Linearity | Using standards outside their linear range or having poor curve fit reduces accuracy [81]. | Ensure unknown protein Rf falls within the linear range of the standard curve. Use a high-quality standard with multiple points. |
| Electrophoresis Conditions | Variations in voltage, buffer concentration, and temperature can affect band sharpness and migration [23]. | Maintain consistent running conditions across experiments. |
Troubleshooting and Optimization
- No or Faint Bands: This indicates low protein concentration or issues with staining. Concentrate the sample if necessary and ensure adequate staining/destaining times. The BCA method can be used beforehand to determine protein concentration [84].
- Smearing Bands: Often caused by protein degradation or overloading. Use fresh protein samples and protease inhibitors, and optimize the loading amount [10].
- Atypical Standard Curves: A sigmoidal instead of a linear standard curve suggests that the gel percentage is inappropriate for the molecular weight range of the standards, or that the proteins are not fully denatured [81].
- Inconsistent Replicates: To ensure statistical significance, generate multiple data points by running at least three replicate gels [81].
SDS-PAGE remains a cornerstone technique for protein molecular weight determination due to its relative simplicity, cost-effectiveness, and reliability for a wide range of applications. By adhering to this detailed protocol—meticulously preparing samples, generating a robust standard curve with appropriate markers, and understanding the factors affecting accuracy—researchers can obtain highly reproducible and accurate molecular weight estimates. This foundational data is critical for protein characterization, purity assessment, and supporting research and development in biotechnology and pharmaceutical sciences.
Method validation is a critical component of scientific research, ensuring that analytical techniques produce consistent, accurate, and reliable results. In the context of protein separation research, Sodium Dodecyl Sulfate-Polyacrylamide Gel Electrophoresis (SDS-PAGE) stands as a fundamental technique whose validation is paramount for data integrity across diverse fields including biochemistry, pharmaceutical development, and clinical diagnostics. The principle of SDS-PAGE involves the denaturation of proteins by the anionic detergent SDS, which confers a uniform negative charge, allowing separation primarily based on molecular weight as proteins migrate through a polyacrylamide gel matrix under an electric field [23] [2] [56]. This application note outlines comprehensive method validation protocols for SDS-PAGE, providing researchers and drug development professionals with a structured framework to establish reproducibility and reliability in their experimental workflows, thereby supporting robust scientific conclusions and regulatory compliance.
Key Validation Parameters and Acceptance Criteria
A method is considered validated when it demonstrates consistent performance against pre-defined analytical parameters. For qualitative and semi-quantitative SDS-PAGE analysis, the following table summarizes the core validation parameters, their assessment methods, and typical acceptance criteria.
Table 1: Key Validation Parameters for SDS-PAGE Methods
| Validation Parameter | Description | Assessment Method | Typical Acceptance Criteria |
|---|---|---|---|
| Specificity/Resolution | Ability to distinguish between adjacent protein bands. | Separation of protein standards in a molecular weight marker [15]. | Distinct, sharp bands; resolution of proteins differing by ≥5% in molecular weight. |
| Linearity & Range | The range over which band intensity is proportional to protein amount. | Densitometry analysis of a dilution series of a standard protein (e.g., BSA) [85]. | Linear correlation (R² ≥ 0.98) over a defined range (e.g., 50-500 ng). |
| Precision (Repeatability) | Agreement between replicate analyses within the same laboratory. | Multiple loadings of the same sample on the same gel (intra-assay) or different gels (inter-assay) [85]. | Coefficient of variation (CV) < 10-15% for band intensity. |
| Limit of Detection (LOD) | Lowest amount of protein that can be detected. | Analysis of serial dilutions of a standard protein visualized with stain [86]. | Consistent visual or densitometric detection at the target level (e.g., 3 mg/L for albumin) [86]. |
| Robustness | Capacity to remain unaffected by small, deliberate variations in method parameters. | Testing the impact of changes in gel concentration, buffer pH, voltage, or staining time [23] [2]. | Consistent migration patterns and band shapes across variations. |
Validated Step-by-Step SDS-PAGE Protocol
Materials and Reagents
The following reagents and instruments are essential for executing a validated SDS-PAGE protocol. Consistent sourcing of high-quality materials is fundamental to reproducibility.
Table 2: Essential Research Reagent Solutions for SDS-PAGE
| Item | Function / Role in the Protocol |
|---|---|
| Acrylamide/Bis-acrylamide | Forms the cross-linked polyacrylamide gel matrix that acts as a molecular sieve [56]. |
| SDS (Sodium Dodecyl Sulfate) | Anionic detergent that denatures proteins and imparts a uniform negative charge [2]. |
| Tris-HCl Buffers | Provides the appropriate pH environment for gel polymerization and electrophoresis (e.g., pH 6.8 for stacking gel, pH 8.8 for resolving gel) [15]. |
| Ammonium Persulfate (APS) & TEMED | Catalysts for the polymerization reaction of the polyacrylamide gel [15] [56]. |
| 2-Mercaptoethanol or DTT | Reducing agents that break disulfide bonds in proteins for "reducing SDS-PAGE" [23]. |
| Protein Molecular Weight Marker | Standard containing proteins of known sizes for estimating the molecular weight of unknown proteins [15] [56]. |
| Coomassie Brilliant Blue Stain | Dye that binds to proteins, allowing visualization of separated bands [15]. |
| Vertical Gel Electrophoresis System | Apparatus that holds the gel cassette and provides the electrical field for separation [15] [87]. |
| Power Supply | Provides the constant voltage or current required for electrophoresis [15]. |
Detailed Validated Methodology
1. Gel Preparation (Casting)
- Resolving Gel: Mix components (e.g., for a 10% gel: 30% acrylamide, 1.5 M Tris-HCl pH 8.8, 10% SDS, 10% APS, and TEMED). Pour between assembled glass plates, leaving space for the stacking gel. Overlay with isopropanol or water to ensure a flat, even interface. Allow 30 minutes to polymerize completely [15] [87].
- Stacking Gel: After removing the overlay, pour the stacking gel solution (lower acrylamide %, e.g., 5%, and 1 M Tris-HCl pH 6.8) and immediately insert a clean comb. Polymerize for at least 1 hour at room temperature [15].
2. Sample Preparation
- Mix the protein solution with an equal volume of 2X Laemmli loading buffer (containing SDS and a reducing agent like 2-mercaptoethanol) [15].
- Denature the samples by heating at 70-100°C for 5-10 minutes [2] [56]. Centrifuge briefly (e.g., 12,000g for 30 seconds) to collect condensation [15].
3. Gel Electrophoresis
- Assemble the gel cassette in the electrophoresis chamber filled with freshly prepared running buffer (e.g., Tris-Glycine-SDS) [15] [87].
- Load equal volumes or masses of prepared samples and molecular weight markers into the wells.
- Apply a constant voltage: 90V until the dye front enters the resolving gel, then increase to 150V until the dye front reaches the bottom of the gel [15]. To prevent overheating, which can cause "smiling" bands, the run can be performed in a cold room or with an ice pack in the tank [87].
4. Protein Detection
- Carefully disassemble the cassette and transfer the gel to a staining tray.
- Submerge the gel in Coomassie Blue stain solution and incubate with gentle shaking for 15 minutes to several hours [15].
- Destain by replacing the stain with a destain solution (e.g., methanol/acetic acid), changing the solution periodically until the background is clear and protein bands are sharply visible [15] [2].
The following workflow diagram illustrates the key stages of this validated SDS-PAGE protocol.
Data Analysis and Quantification Protocol
For semi-quantitative analysis, gel images can be processed using software like ImageJ/Fiji. The validated protocol involves:
- Image Capture: Scanning the gel as a grayscale TIFF image at 300-600 dpi [85].
- Background Subtraction: Using the software's rolling ball algorithm (50-200 pixels) to correct for uneven background [85].
- Band Quantification:
- Method 1 (Gel Analyzer): Defining lanes, plotting lane profiles, and using the wand tool to measure the integrated density (area under the curve) for each band [85].
- Method 2 (Static ROI): Manually drawing identically sized regions of interest (ROIs) on each band and measuring the mean gray value or integrated density [85].
- Normalization: Generating a standard curve from known amounts of a standard protein (e.g., BSA) and interpolating the quantity of unknown samples from this curve. Alternatively, normalizing band intensities to an internal control band loaded on the same gel [85].
Troubleshooting and Optimization for Robustness
A validated method must account for potential variability. The table below outlines common issues and validated solutions to ensure robustness.
Table 3: Troubleshooting Common SDS-PAGE Issues
| Problem | Potential Cause | Validated Corrective Action |
|---|---|---|
| Smiling or Frowning Bands | Uneven heating across the gel. | Ensure proper contact between glass plates and gasket; run gel at a lower voltage or in a cold room; use fresh running buffer in the inner cathode chamber [87] [2]. |
| Poor Resolution or Smearing | Incomplete denaturation; incorrect gel percentage; insufficient run time. | Ensure samples are properly heated; optimize acrylamide concentration for target protein size (e.g., 8% for large, 12% for small proteins); allow electrophoresis to complete [2]. |
| High Background Staining | Insufficient destaining. | Increase destaining time with multiple changes of destain solution; consider using a destain solution with a small piece of absorbent paper to trap excess dye [15]. |
| Gel Leakage | Improperly assembled cassette or debris on glass plates. | Thoroughly clean glass plates before use; verify that plates are aligned parallel and sealed correctly in the casting frame [87]. |
Applications in Research and Development
The reliability of a validated SDS-PAGE protocol underpins its utility in critical applications. In biopharmaceutical development, SDS-PAGE is used for purity analysis and size confirmation of therapeutic proteins like monoclonal antibodies. Capillary SDS-PAGE (cSDS), an automated format, has been rigorously validated for this purpose, demonstrating robustness and reproducibility for product release testing [88]. In clinical diagnostics, SDS-PAGE serves as a semiquantitative tool for characterizing proteinuria, where different banding patterns reliably differentiate between glomerular, tubular, and overflow proteinuria, aiding in the diagnosis and management of kidney disease [86]. Furthermore, in basic research and food science, validated SDS-PAGE methods are indispensable for monitoring protein structural changes induced by processing, detecting adulterants, and evaluating functional properties like gluten quality in cereals [23].
Rigorous method validation is not an optional enhancement but a fundamental requirement for generating credible and actionable scientific data. The protocols detailed herein for SDS-PAGE—encompassing specific performance parameters, a controlled step-by-step methodology, robust data analysis, and systematic troubleshooting—provide a solid foundation for ensuring reproducibility and reliability. By adhering to such validated protocols, researchers and drug development professionals can confidently utilize SDS-PAGE as a robust analytical tool, thereby strengthening the integrity of their findings in protein separation research.
Within biochemistry and molecular biology, SDS-PAGE (Sodium Dodecyl Sulfate-Polyacrylamide Gel Electrophoresis) is a cornerstone technique for protein separation. A critical distinction in its application lies in the use of reducing or non-reducing conditions, a choice that fundamentally impacts experimental outcomes. Under reducing conditions, disulfide bonds are broken, and proteins are fully denatured into their constituent polypeptide subunits. In contrast, non-reducing conditions preserve native disulfide linkages, allowing for the analysis of oligomeric structures and folding states [23] [89]. This article provides a detailed comparative analysis of these two approaches, offering structured protocols and application guidelines for researchers in protein science and drug development.
Core Principles and Comparative Analysis
The fundamental principle of SDS-PAGE is the separation of proteins based on their molecular mass as they migrate through a polyacrylamide gel matrix under an electric field. The anionic detergent SDS binds to proteins, masking their intrinsic charge and imparting a uniform negative charge density [21] [90]. The key difference between reducing and non-reducing SDS-PAGE is the sample preparation prior to electrophoresis.
- Reducing SDS-PAGE: Incorporates a reducing agent, such as dithiothreitol (DTT) or β-mercaptoethanol, in the sample buffer. These agents break disulfide bonds, both intra- and inter-molecular. When combined with heat denaturation, this treatment fully unfolds proteins and dissociates subunits held together by covalent disulfide bonds, allowing separation based purely on the molecular weight of the individual polypeptide chains [21] [90].
- Non-Reducing SDS-PAGE: The sample buffer lacks any reducing agent. While SDS denatures the protein by disrupting non-covalent interactions, disulfide bonds remain intact. This means that protein complexes or oligomers stabilized by these covalent linkages will migrate through the gel as a single unit, resulting in a higher apparent molecular weight than their constituent subunits [91] [89].
The table below summarizes the critical differences between the two methodologies.
Table 1: Comparative Analysis of Reducing vs. Non-Reducing SDS-PAGE
| Parameter | Reducing SDS-PAGE | Non-Reducing SDS-PAGE |
|---|---|---|
| Sample Buffer | Contains SDS and a reducing agent (e.g., DTT, β-mercaptoethanol) [91] | Contains SDS, but no reducing agent [92] [91] |
| Disulfide Bonds | Broken [21] | Preserved [89] |
| Protein State | Fully denatured into individual polypeptide subunits [90] | Denatured, but disulfide-linked complexes remain intact [89] |
| Molecular Weight Determination | Accurate for individual polypeptide chains [21] | Apparent molecular weight reflects the oligomeric complex [89] |
| Primary Applications | Determining subunit composition, protein purity, and molecular weight of monomers [23] [21] | Analyzing disulfide-linked multimeric complexes (dimers, oligomers), and protein misfolding [91] [89] |
The following workflow diagram illustrates the parallel experimental paths and resulting outcomes for reducing and non-reducing SDS-PAGE.
Detailed Experimental Protocols
Protocol for Reducing SDS-PAGE
This protocol is optimized for the complete denaturation of proteins and the separation of their constituent subunits.
Sample Preparation:
- Mix protein sample (e.g., 7.5 µL) with 4X LDS Sample Buffer (2.5 µL) [18].
- Add a reducing agent, such as DTT to a final concentration of 50-100 mM or β-mercaptoethanol (e.g., 500 mM) [92] [91].
- Heat the mixture at 70–95°C for 5–10 minutes in a dry bath or heating block to ensure full denaturation and reduction [18] [91].
Gel Electrophoresis:
- Load the prepared samples and a pre-stained protein molecular weight standard into the wells of a precast polyacrylamide gel (e.g., 12% Bis-Tris) [18] [91].
- Fill the electrophoresis tank with 1X MOPS SDS or MES SDS Running Buffer [18] [91].
- Run the gel at a constant voltage of 200 V for 28–45 minutes, or until the dye front reaches the bottom of the gel [18] [92].
Protocol for Non-Reducing SDS-PAGE
This protocol is designed to preserve disulfide-bonded protein complexes.
Sample Preparation:
- Mix protein sample with a non-reducing sample buffer. This can be a standard LDS Sample Buffer with no reducing agent added [92], or a specialized native sample buffer [18].
- Do not add DTT, β-mercaptoethanol, or any other reducing agent.
- A heating step (e.g., 95°C for 5 min) is often still performed to ensure SDS binding and denaturation of non-covalent interactions, but this can be omitted for delicate complexes if necessary [92] [91].
Gel Electrophoresis:
- Load the samples and protein standard onto a precast gel.
- Use a standard SDS-based running buffer (e.g., 1X Tris-Glycine with 0.1% SDS) or a modified running buffer with a lower SDS concentration (e.g., 0.0375%) for enhanced native state preservation [18] [89].
- Run the gel at 200 V for the duration required by the gel system [92] [89].
Table 2: Key Research Reagent Solutions for SDS-PAGE
| Reagent / Kit | Function / Description | Example Catalog Number |
|---|---|---|
| NuPAGE LDS Sample Buffer (4X) | Ionic detergent for sample preparation; denatures proteins and confers negative charge. | NP0007 [92] [91] |
| Dithiothreitol (DTT) | Reducing agent; breaks disulfide bonds. | D0632 [91] |
| β-Mercaptoethanol | Alternative reducing agent. | M3148 [91] |
| NuPAGE MES SDS Running Buffer (20X) | SDS-based buffer for gel electrophoresis. | NP000202 [91] |
| NuPAGE Bis-Tris Precast Gels (12%) | Precast polyacrylamide gels for protein separation. | NP0342BOX [91] |
| cOmplete, Mini Protease Inhibitor Cocktail | Inhibits proteases to prevent sample degradation during preparation. | 11836153001 [91] |
| Clarity Western ECL Substrate | Chemiluminescent substrate for immunoblot detection after electrophoresis. | 1705061 [91] |
Advanced Applications in Research and Drug Development
The choice between reducing and non-reducing SDS-PAGE enables specific insights into protein structure and function, with critical applications in biomedical research.
Analysis of Protein Misfolding in Disease
Non-reducing SDS-PAGE is a powerful tool for studying protein misfolding diseases. In diabetes research, it has been refined to accurately quantify the ratio of native proinsulin monomers to misfolded proinsulin monomers and higher-order disulfide-linked complexes in pancreatic β-cells [91]. This protocol involves:
- Lysing cells (e.g., MIN6 β-cells) in RIPA buffer with protease inhibitors.
- Preparing samples under both non-reducing and reducing conditions for comparison.
- Resolving proteins on a fixed-percentage gel (e.g., 12%) to ensure uniform electrotransfer efficiency.
- In some protocols, a post-electrophoresis in-gel DTT treatment (100 mM, 60°C) is applied before transfer to improve quantification accuracy [91].
This method allows researchers to monitor proinsulin folding status under different metabolic conditions, providing insights into the molecular pathogenesis of type 2 diabetes.
Characterization of Multimeric Protein Complexes
Non-reducing SDS-PAGE is indispensable for confirming the presence and stability of disulfide-stabilized multimeric proteins, such as antibodies or cytokine receptors [89]. The intact complexes migrate at their expected oligomeric molecular weight, while a shift to lower molecular weight bands under reducing conditions confirms the disulfide-dependent nature of the quaternary structure [90]. This is crucial in biopharmaceutical development for quality control of therapeutic proteins.
Food Science and Allergen Detection
In food bioscience, SDS-PAGE is widely used for protein profiling to identify species, verify authenticity, and detect adulterants or allergens. Comparing protein patterns under reducing and non-reducing conditions can reveal the presence of specific disulfide-linked storage proteins (e.g., glutenins in wheat) or assess the impact of processing on protein structure and potential allergenicity [23].
Critical Technical Considerations
Successful execution and interpretation of SDS-PAGE experiments require attention to several key factors:
- Gel Composition: The concentration of acrylamide determines the pore size and thus the effective separation range. Gradient gels (e.g., 4-12%) can resolve a wider size range of proteins in a single run [18] [78].
- Buffer System: The discontinuous buffer system (stacking and separating gels) is crucial for sharp band formation. The pH and composition of the running buffer must be compatible with the gel chemistry [18] [21].
- Heat Denaturation: While standard for denaturing SDS-PAGE, the heating step in non-reducing protocols can sometimes disrupt weak disulfide linkages or promote aggregation. Testing samples with and without heat is recommended for novel proteins [18].
- Quantification Accuracy: As demonstrated in proinsulin studies, antibody affinity can vary for different protein forms (monomer vs. complex), potentially leading to overestimation of misfolded species. Protocol modifications, such as post-gel DTT treatment, may be necessary for accurate quantification [91].
The foundation of a successful western blot experiment is the efficient transfer of proteins from the electrophoresis gel onto a membrane, a step entirely dependent on the preceding gel preparation [93]. Proper gel preparation ensures that proteins are correctly separated by molecular weight and are in an optimal state for subsequent electrophoretic transfer [94]. This protocol details the integrated process of preparing polyacrylamide gels specifically to facilitate complete and efficient protein transfer, a critical consideration often overlooked in standard procedures. The gel's composition and structure directly influence transfer efficiency, impacting the sensitivity and accuracy of downstream immunodetection [95] [96]. By optimizing gel preparation for transfer, researchers can significantly enhance data quality, reduce artifacts, and ensure reliable detection of target proteins across a broad molecular weight range.
Principles of Gel-Based Protein Separation and Transfer
Western blotting relies on the electrophoretic separation of proteins based on their molecular weight followed by their immobilization on a solid membrane support [97] [94]. Sodium dodecyl sulfate-polyacrylamide gel electrophoresis (SDS-PAGE) denatures proteins and imparts a uniform negative charge, allowing separation solely by polypeptide chain length as molecules migrate through the porous polyacrylamide matrix under an electric field [98] [94]. The polyacrylamide gel concentration determines the effective pore size, which must be selected according to the target protein's molecular weight to achieve optimal separation without hindering subsequent transfer [95].
Following electrophoresis, proteins are transferred from the gel onto a membrane using an electric field in a process called electroblotting [93]. The transfer efficiency is influenced by multiple gel-related factors: gel percentage, thickness, polymerization quality, and the size of the proteins being transferred [93] [96]. Denser gels with smaller pore sizes (higher % acrylamide) provide superior resolution for low molecular weight proteins but can impede the transfer of larger proteins [95]. Understanding this interplay between separation and transfer is essential for designing western blot experiments that yield clear, reproducible results.
The diagram below illustrates the integrated workflow from gel preparation to transfer verification, highlighting how each preparation step influences the final transfer outcome.
Gel Selection and Formulation for Transfer Optimization
Acrylamide Concentration Guidelines
The concentration of acrylamide in the resolving gel directly determines pore size and must be matched to the molecular weight of the target protein to balance resolution with transfer efficiency [95]. Table 1 provides optimized gel concentration recommendations based on protein molecular weight ranges, considering both separation resolution and subsequent transfer efficiency.
Table 1: Gel Concentration Recommendations Based on Protein Molecular Weight
| Protein Molecular Weight Range | Recommended Gel Concentration | Transfer Considerations |
|---|---|---|
| 100-600 kDa | 4-7% | Lower acrylamide percentages facilitate movement of large proteins out of the gel matrix [95]. |
| 50-500 kDa | 7% | Moderate percentage balances resolution and transfer efficiency for medium-large proteins. |
| 30-300 kDa | 10% | Standard workhorse concentration for most applications. |
| 10-200 kDa | 12% | Provides good resolution for medium-small proteins without significantly impeding transfer. |
| 3-100 kDa | 15% | Higher percentages optimize resolution but may require longer transfer times for complete elution [95]. |
For proteins with very broad molecular weight ranges or when analyzing multiple unknown targets, gradient gels (e.g., 4-12% or 4-20% acrylamide) provide an excellent solution by offering optimal pore sizes across a continuum, ensuring both good separation and efficient transfer for proteins of varying sizes [98].
Gel Composition and Crosslinking
The ratio of acrylamide to bis-acrylamide determines the crosslinking density of the gel matrix, which fine-tunes the pore structure and mechanical properties [95]. Standard protocols typically use a 37.5:1 ratio of acrylamide to bis-acrylamide, but adjusting this ratio can optimize transfer for specific applications [99]. Lower bis-acrylamide concentrations create larger pores, potentially enhancing transfer efficiency for high molecular weight proteins, while higher crosslinking densities provide better resolution for lower molecular weight targets but may retard their movement during transfer.
Detailed Experimental Protocols
Protocol 1: Preparing SDS-PAGE Gels for Optimal Transfer
This protocol describes the preparation of polyacrylamide gels optimized for subsequent protein transfer, with specific attention to factors influencing transfer efficiency.
Materials Required
- 30% Acrylamide/Bis-acrylamide Solution (37.5:1) [99]
- 4X Resolving Gel Buffer: 1.5 M Tris-HCl, pH 8.8 [99]
- 4X Stacking Gel Buffer: 0.5 M Tris-HCl, pH 6.8 [99]
- 10% (w/v) Ammonium Persulfate (APS) - prepared fresh in deionized water [99]
- N,N,N',N'-Tetramethylethylene-diamine (TEMED) [99]
- 10% (w/v) Sodium Dodecyl Sulfate (SDS) [99]
- Deionized Water
- Gel Casting System (plates, spacers, comb, casting stand)
Procedure
- Assemble Casting Apparatus: Clean glass plates and spacers thoroughly. Assemble the gel cassette according to the manufacturer's instructions, ensuring a leak-proof seal.
- Prepare Resolving Gel Solution: Combine components for the resolving gel in a clean flask or tube according to Table 2, adding TEMED and APS last to initiate polymerization. Mix gently by swirling to avoid introducing air bubbles.
- Cast Resolving Gel: Immediately pipette the resolving gel solution into the assembled gel cassette, leaving appropriate space for the stacking gel (approximately 1-2 cm below the bottom of the comb teeth). Carefully overlay the gel solution with isopropanol or water-saturated butanol to create a flat, even interface and exclude oxygen.
- Polymerize: Allow the resolving gel to polymerize completely for 20-30 minutes at room temperature. Polymerization is indicated by a distinct schlieren line at the alcohol-gel interface.
- Prepare Stacking Gel Solution: While the resolving gel polymerizes, prepare the stacking gel solution according to Table 2. Do not add TEMED and APS until ready to cast.
- Cast Stacking Gel: Pour off the overlay liquid from the polymerized resolving gel. Rinse the gel surface with deionized water and drain completely. Add TEMED and APS to the stacking gel solution, mix, and pipette onto the resolving gel. Immediately insert a clean comb without introducing air bubbles.
- Complete Polymerization: Allow the stacking gel to polymerize for 15-20 minutes at room temperature. Once polymerized, gels can be used immediately or stored wrapped in moist paper towel and plastic film at 4°C for up to 48 hours.
Table 2: Gel Formulation Recipes for Different Percentage Gels (10 mL total volume)
| Component | 7.5% Resolving Gel | 10% Resolving Gel | 12% Resolving Gel | 15% Resolving Gel | 4% Stacking Gel |
|---|---|---|---|---|---|
| Deionized Water | 4.8 mL | 4.0 mL | 3.3 mL | 2.3 mL | 4.6 mL |
| 30% Acrylamide/Bis (37.5:1) | 2.5 mL | 3.3 mL | 4.0 mL | 5.0 mL | 1.3 mL |
| 4X Resolving Gel Buffer (Tris pH 8.8) | 2.5 mL | 2.5 mL | 2.5 mL | 2.5 mL | - |
| 4X Stacking Gel Buffer (Tris pH 6.8) | - | - | - | - | 2.5 mL |
| 10% SDS | 100 µL | 100 µL | 100 µL | 100 µL | 100 µL |
| 10% APS | 100 µL | 100 µL | 100 µL | 100 µL | 100 µL |
| TEMED | 6 µL | 6 µL | 6 µL | 6 µL | 6 µL |
Protocol 2: Pre-Transfer Gel Equilibration and Assessment
Proper gel handling after electrophoresis and before transfer is critical for maximizing transfer efficiency.
Materials Required
- Transfer Buffer (e.g., Towbin buffer: 25 mM Tris, 192 mM glycine, 20% methanol, pH 8.3) [93] [94]
- Pre-stained Protein Molecular Weight Marker [96]
- Coomassie Blue Staining Solution [96] [99]
- Gel Destaining Solution (40% methanol, 10% acetic acid) [99]
- Ponceau S Stain (optional) [99]
Procedure
- Post-Electrophoresis Processing: Following SDS-PAGE, carefully open the gel cassette and remove the gel. Cut away the stacking gel and any unused lanes.
- Gel Equilibration: Place the gel in a container with sufficient transfer buffer to cover it completely. Gently agitate for 10-15 minutes at room temperature [99]. Equilibration replaces electrophoresis buffers, removes SDS and salt contaminants that can interfere with transfer, and standardizes the gel size, particularly important if methanol is present in the transfer buffer [94].
- Transfer Efficiency Assessment (Pre-Transfer): Monitor transfer efficiency using a pre-stained protein ladder. After electrophoresis and before transfer, visualize the gel to confirm all ladder bands are present. After transfer, check if the colored bands have migrated completely from the gel onto the membrane [96].
- Post-Transfer Validation (Post-Transfer): After transfer, stain the gel with Coomassie Blue to visualize residual proteins. A well-transferred gel will show minimal protein remaining, particularly in the regions corresponding to the target molecular weights [96]. For additional confirmation, the membrane can be briefly stained with Ponceau S to visualize the transferred protein pattern before proceeding with immunoblotting [99].
Optimization Strategies for Challenging Proteins
Transfer of Extreme Molecular Weight Proteins
High Molecular Weight Proteins (>150 kDa): Large proteins migrate slowly through the gel matrix and can be difficult to elute completely. For optimal transfer of these targets:
- Use low-percentage gels (4-8% acrylamide) to minimize pore size restriction [98].
- Incorporate a small amount of SDS (0.01-0.1%) in the transfer buffer to help maintain protein solubility and mobility [93] [94].
- Extend transfer times (overnight wet transfer at low voltage) or use specialized high-molecular-weight transfer protocols [93].
Low Molecular Weight Proteins (<20 kDa): Small proteins transfer efficiently but can over-transfer or pass through the membrane if not properly retained.
- Use higher percentage gels (12-15%) to improve resolution [95].
- Select membranes with smaller pore sizes (0.2 µm instead of 0.45 µm) to prevent blow-through [93].
- Consider reducing transfer time or using lower current settings to retain small proteins on the membrane [96].
Troubleshooting Common Transfer Issues Related to Gel Preparation
Table 3: Troubleshooting Gel-Related Transfer Problems
| Problem | Potential Causes Related to Gel Preparation | Solutions |
|---|---|---|
| Incomplete transfer of high MW proteins | Gel percentage too high; insufficient transfer time; inadequate equilibration. | Decrease acrylamide concentration; extend transfer time; ensure complete gel equilibration [95] [93]. |
| Small proteins pass through membrane | Gel percentage appropriate but transfer too prolonged; membrane pore size too large. | Optimize transfer duration; use 0.2 µm pore size membrane; add methanol to transfer buffer to enhance protein binding [93] [96]. |
| Uneven or distorted transfer patterns | Irregular gel polymerization; air bubbles in transfer stack; gel thickness variation. | Ensure uniform gel polymerization; remove all air bubbles; use consistent spacer thickness [96]. |
| High background noise | Residual SDS or contaminants from gel; over-transfer. | Extend gel equilibration in transfer buffer; optimize transfer time; ensure proper blocking [100]. |
The Scientist's Toolkit: Essential Reagents and Materials
Table 4: Key Research Reagent Solutions for Gel Preparation and Transfer
| Reagent/Material | Function/Application | Key Considerations |
|---|---|---|
| Acrylamide/Bis-acrylamide | Forms the porous polyacrylamide gel matrix for protein separation. | Standard 37.5:1 ratio is typical; adjust for specialized applications. Handle with care as it is a neurotoxin [99]. |
| Tris-HCl Buffers | Provides appropriate pH environment for gel polymerization and electrophoresis (pH 6.8 stacking, pH 8.8 resolving). | Buffer pH is critical for the discontinuous electrophoresis system; prepare fresh or store aliquots [99] [94]. |
| Ammonium Persulfate (APS) | Initiates free-radical polymerization of acrylamide with TEMED. | Prepare fresh 10% solution for optimal polymerization efficiency [99]. |
| TEMED | Catalyst that accelerates acrylamide polymerization by generating free radicals from APS. | Add immediately before casting as polymerization begins rapidly [99]. |
| SDS (Sodium Dodecyl Sulfate) | Anionic detergent that denatures proteins and confers uniform negative charge. | Essential for denaturing SDS-PAGE; quality and concentration affect protein separation and transfer [94]. |
| Transfer Buffer | Conducts current and facilitates protein migration from gel to membrane during electroblotting. | Standard Towbin buffer contains methanol for enhanced protein binding; methanol-free options exist for specific applications [93] [100]. |
| Nitrocellulose/PVDF Membranes | Solid support that binds transferred proteins for antibody probing. | Nitrocellulose is general-purpose; PVDF offers higher binding capacity and mechanical strength for stripping/reprobing [93] [94]. |
The preparation of polyacrylamide gels is a foundational step in western blotting that directly and significantly impacts the efficiency of protein transfer. By carefully considering gel percentage, crosslinking density, and polymerization quality during the preparation phase, researchers can dramatically improve transfer outcomes. The protocols and optimization strategies presented here provide a systematic approach to gel preparation that prioritizes successful protein transfer alongside effective separation. Implementing these integrated practices ensures robust, reproducible western blot results across diverse experimental applications and protein targets, ultimately enhancing the reliability of protein analysis in research and drug development.
Sodium dodecyl sulfate-polyacrylamide gel electrophoresis (SDS-PAGE) stands as a cornerstone technique in analytical biochemistry, enabling high-resolution separation of complex protein mixtures based on their molecular weight [23]. The method was fundamentally advanced by Ulrich Laemmli in 1970, who incorporated SDS into the polyacrylamide gel electrophoresis system, creating a discontinuous buffer system that dramatically improved protein separation resolution [2]. This technical advancement transformed protein analysis, providing researchers with a reliable method to separate proteins under denaturing conditions.
The core principle of SDS-PAGE relies on the ability of SDS, an anionic detergent, to bind to protein backbones at a relatively constant ratio of approximately 1.4 g SDS per 1 g of protein [2]. This binding accomplishes two critical functions: first, it denatures proteins by disrupting hydrogen bonds and non-polar interactions, effectively unfolding secondary and tertiary structures; second, it imparts a uniform negative charge to all proteins, rendering their intrinsic charge negligible compared to the overwhelming negative charge provided by SDS [101] [102]. When subjected to an electric field within a polyacrylamide gel matrix, these SDS-coated proteins migrate toward the anode at rates inversely proportional to their molecular weights, with smaller proteins moving faster through the gel pores than larger ones [13].
The significance of SDS-PAGE extends across multiple scientific disciplines, from basic research to applied industrial applications. In food science, it serves as an indispensable tool for evaluating protein integrity, detecting adulteration, monitoring processing effects, and characterizing functional properties in various food matrices including cereals, dairy, meat, and plant-based products [23] [103]. In biomedical research, SDS-PAGE provides fundamental insights into protein expression, purity, and molecular weight, while also serving as a critical preparatory step for western blotting and other downstream analytical techniques [18] [14]. The technique's versatility, reproducibility, and relative simplicity have secured its position as an essential methodology in laboratories worldwide.
Principles of SDS-PAGE Separation
Fundamental Mechanisms
The separation mechanism in SDS-PAGE operates on the principle that the polyacrylamide gel matrix creates a molecular sieve through which proteins migrate under the influence of an electric field. The polyacrylamide gel is formed through the polymerization of acrylamide monomers cross-linked by N,N'-methylene-bis-acrylamide, creating a porous network whose pore size determines the separation range [14]. The porosity of the gel can be precisely controlled by varying the concentrations of acrylamide and bisacrylamide, with higher percentages creating smaller pores that better resolve lower molecular weight proteins [2].
When proteins are denatured with SDS and a reducing agent, they unfold into linear polypeptide chains with a uniform charge-to-mass ratio [102]. As these negatively charged complexes migrate through the gel toward the positive electrode, their movement is impeded by the gel matrix in a size-dependent manner. Smaller proteins navigate the porous network more easily and migrate further toward the bottom of the gel, while larger proteins encounter greater resistance and remain closer to the point of origin [13]. This differential migration results in the separation of proteins primarily by molecular size rather than native charge or structure.
The discontinuous buffer system developed by Laemmli employs two distinct gel regions with different pore sizes and pH values: a stacking gel and a resolving (or separating) gel [2]. The stacking gel, with larger pores and lower pH (approximately 6.8), serves to concentrate all protein samples into sharp bands before they enter the resolving gel. The resolving gel, with smaller pores and higher pH (approximately 8.8), then separates the concentrated protein bands based on molecular weight [14]. This two-tiered system significantly enhances resolution compared to continuous gel systems.
Visualization and Molecular Weight Determination
Following electrophoresis, proteins are visualized using various staining techniques that reveal their positions within the gel. Coomassie Brilliant Blue staining is commonly used for general protein detection, offering a balance between sensitivity, cost, and compatibility with downstream analyses [2]. For enhanced sensitivity, silver staining can detect proteins in the nanogram range, while fluorescent stains provide a broad dynamic range and are ideal for quantitative proteomic applications [2].
Molecular weight determination is achieved by comparing the migration distance of unknown proteins to that of standard proteins with known molecular weights (molecular weight markers) run concurrently on the same gel [101]. A standard curve is generated by plotting the logarithm of the molecular weights of the standard proteins against their migration distances (Rf values), enabling the estimation of unknown protein sizes based on their relative migration [101]. This approach provides reasonably accurate molecular weight estimates for most proteins, though anomalies can occur with heavily glycosylated proteins, membrane proteins, or proteins with unusual amino acid compositions that may bind SDS differently [101].
Materials and Reagent Solutions
Research Reagent Solutions
The following table details essential reagents and materials required for successful SDS-PAGE analysis:
Table 1: Essential Reagents and Materials for SDS-PAGE
| Reagent/Material | Function/Purpose | Key Considerations |
|---|---|---|
| Sodium Dodecyl Sulfate (SDS) | Denatures proteins and confers uniform negative charge [102] | Critical for disrupting non-covalent interactions; ensures separation by size rather than charge |
| Acrylamide/Bis-acrylamide | Forms cross-linked polyacrylamide gel matrix [14] | Concentration determines pore size; typically 4-20% depending on target protein size [101] |
| Reducing Agents (DTT, β-mercaptoethanol) | Breaks disulfide bonds in proteins [101] | Essential for complete denaturation; DTT has less odor but is less stable than β-mercaptoethanol [104] |
| Tris Buffers | Maintains appropriate pH throughout electrophoresis [102] | Discontinuous system uses different pH in stacking (pH 6.8) and resolving (pH 8.8) gels [14] |
| Ammonium Persulfate (APS) & TEMED | Catalyzes acrylamide polymerization [14] | TEMED stabilizes the free radical reaction; fresh APS ensures proper gel polymerization |
| Molecular Weight Markers | Reference standards for size determination [101] | Pre-stained markers allow visual tracking; unstained provide higher accuracy after staining |
| Coomassie Blue/Silver Stain | Visualizes separated proteins after electrophoresis [2] | Coomassie for general use; silver for enhanced sensitivity; fluorescent stains for quantification |
| Glycine | Leading ion in discontinuous buffer system [14] | Facilitates stacking effect at interface between stacking and resolving gels |
Specialized Equipment
Specialized equipment required for SDS-PAGE includes gel casting systems, electrophoresis chambers, and power supplies capable of providing constant voltage. Vertical electrophoresis units are standard, allowing the gel to be suspended between two buffer chambers with the cathode at the top and anode at the bottom [14]. Power supplies must deliver consistent voltage, typically between 100-150V for mini-gel systems, to ensure uniform migration of proteins through the gel matrix [101] [104]. Pre-cast gels are commercially available and offer convenience and reproducibility, though many researchers still prepare gels manually to customize acrylamide concentrations and formats [104].
Detailed SDS-PAGE Protocol
Step-by-Step Experimental Procedure
The following workflow diagram illustrates the complete SDS-PAGE process from sample preparation to analysis:
Sample Preparation Protocol
Proper sample preparation is critical for successful SDS-PAGE separation. Proteins must be completely denatured and reduced to ensure accurate molecular weight determination. The following steps outline a standard sample preparation protocol:
Sample Dilution: Transfer protein sample to a clean microcentrifuge tube and mix with an equal volume of 2X SDS sample buffer. For dilute samples, use more concentrated sample buffer (5X or 6X) to maintain appropriate protein concentration in the final loading volume [104]. The final SDS concentration should be at least 1% to ensure complete denaturation [105].
Reducing Agent Addition: Add reducing agent to break disulfide bonds. For β-mercaptoethanol, use a final concentration of 0.55M (approximately 1 μL per 25 μL of sample) [101]. Alternatively, dithiothreitol (DTT) can be used at 20-100 mM final concentration. DTT offers reduced odor but is less stable than β-mercaptoethanol during long-term storage [104].
Denaturation: Heat samples at 95°C for 5 minutes in a heating block or water bath to complete the denaturation process [101]. This step is particularly critical for membrane proteins and protein complexes with strong hydrophobic interactions [104]. Avoid excessive heating times as this can promote protein aggregation.
Clarification: Centrifuge heated samples at maximum speed (approximately 15,000 × g) for 2-3 minutes using a microcentrifuge to pellet any insoluble debris or aggregates [101] [104]. This step prevents clogging of gel wells and ensures clear sample loading.
Protein Concentration Considerations: Ideal loading amounts depend on the detection method. For Coomassie staining, load 0.5-2 μg of purified protein or 10-20 μg of complex mixtures like cell lysates per lane [101] [104]. For western blotting, smaller amounts (0.1-1 μg) may be sufficient, depending on target abundance and antibody sensitivity [104].
Gel Preparation and Electrophoresis
The electrophoresis phase involves careful gel preparation and precise running conditions:
- Gel Selection: Choose an appropriate acrylamide concentration based on the molecular weight range of target proteins. The table below provides guidance on gel percentage selection:
Table 2: Gel Percentage Selection Guide Based on Protein Size
| Acrylamide Percentage | Optimal Separation Range | Typical Applications |
|---|---|---|
| 4-8% | 100-500 kDa [101] | Large proteins, protein complexes |
| 8-12% | 40-100 kDa [14] | Medium-sized proteins, standard separations |
| 12-15% | 10-50 kDa [14] | Small proteins, peptides |
| 4-20% Gradient | 10-200 kDa [101] | Broad range separation, unknown samples |
Gel Casting: For hand-cast gels, first prepare the resolving gel solution with desired acrylamide concentration, then pour between glass plates, overlay with water-saturated butanol or water to exclude oxygen and ensure even polymerization [102]. After polymerization (approximately 20-30 minutes), remove the overlay, pour the stacking gel (typically 4-5% acrylamide), and insert the comb [102].
Electrophoresis Setup: Assemble the gel in the electrophoresis chamber, fill both inner and outer chambers with running buffer (typically Tris-glycine buffer with 0.1% SDS) [101]. Ensure no air bubbles are trapped beneath the gel, as this can cause irregular migration.
Sample Loading: Load prepared samples and molecular weight markers into wells using gel loading tips for precision [104]. Record lane assignments, sample descriptions, and loading amounts for accurate analysis.
Electrophoresis Running Conditions: Run gels at constant voltage (100-150V for mini-gels) until the dye front reaches the bottom of the gel (typically 40-60 minutes) [101] [104]. Maintain temperature between 10-20°C to prevent "smiling" effects caused by uneven heat distribution [104]. For high molecular weight proteins (>100 kDa), longer run times or lower percentages of acrylamide may be necessary for optimal separation.
Applications in Food Science and Biomedical Research
Food Science Applications
SDS-PAGE serves as a powerful analytical tool throughout the food industry, providing critical insights into protein composition, quality, and functionality:
Protein Purity and Authenticity Assessment: SDS-PAGE enables detection of adulteration in high-value protein ingredients by comparing banding patterns to authentic references. For example, the technique can identify unauthorized substitution of costly fish species with lower-value alternatives or detect adulteration of milk protein concentrates with plant-based proteins [23] [103].
Process Impact Evaluation: Food processing methods such as enzymatic hydrolysis, thermal treatment, and fermentation significantly alter protein molecular weight profiles. SDS-PAGE visualizes these changes, allowing manufacturers to optimize processes for desired functional properties. In cheese production, SDS-PAGE monitors casein proteolysis during aging, which correlates with flavor development and texture modification [103].
Allergen Detection and Monitoring: The technique facilitates identification and quantification of known allergenic proteins in food products, supporting allergen control programs and regulatory compliance. Specific protein bands corresponding to major allergens (e.g., peanut Ara h 1, milk caseins, or gluten proteins) can be tracked across production lines to prevent cross-contamination [23].
Functional Property Analysis: Protein functionality in food systems (e.g., solubility, foaming, gelling, and emulsification) often correlates with molecular characteristics revealed by SDS-PAGE. In wheat, the composition of high and low molecular weight glutenin subunits directly influences dough elasticity and baking performance [23].
Species Identification: SDS-PAGE creates unique protein fingerprints for different biological materials, enabling species identification in meat and seafood products and authentication of botanical origins in cereal and pulse ingredients [23].
Biomedical Applications
In biomedical research and pharmaceutical development, SDS-PAGE provides fundamental analytical capabilities:
Protein Expression Analysis: Researchers routinely use SDS-PAGE to assess recombinant protein expression levels, monitor induction efficiency, and compare expression across different experimental conditions or cell lines [2].
Purity Assessment and Quality Control: The technique is indispensable for evaluating purification efficiency and determining the homogeneity of protein preparations used in therapeutic development, vaccine production, and diagnostic applications [101] [2].
Western Blotting: SDS-PAGE serves as the first dimension of western blotting, separating proteins before transfer to membranes for specific antigen detection with antibodies. This application is fundamental to cellular and molecular biology research, clinical diagnostics, and biomarker validation [14] [13].
Post-Translational Modification Detection: Although SDS-PAGE separates primarily by molecular weight, shifts in band mobility can indicate post-translational modifications such as glycosylation, phosphorylation, or proteolytic processing that alter protein apparent size [2].
Clinical Diagnostics: SDS-PAGE analysis of biological fluids (e.g., serum, urine, CSF) enables detection of abnormal protein patterns associated with specific disease states, supporting diagnostic applications in conditions such as multiple myeloma and renal disorders [2].
Troubleshooting and Optimization
Common Issues and Solutions
Even well-established protocols can encounter challenges. The following table outlines common SDS-PAGE issues and their solutions:
Table 3: Troubleshooting Guide for Common SDS-PAGE Problems
| Problem | Possible Causes | Solutions |
|---|---|---|
| Smiling or frowning bands | Uneven heat distribution across gel [104] | Use magnetic stirrer in buffer chamber; reduce voltage; ensure proper buffer volume for heat dissipation |
| Smeared bands | Incomplete denaturation [14]; protein aggregation; high salt concentration | Add fresh reducing agent; ensure proper heating (95°C, 5 min); desalt samples if necessary |
| Weak/faint bands | Insufficient protein loaded [14] | Increase loading amount; concentrate dilute samples; use more sensitive detection (silver stain) |
| Multiple/unexpected bands | Protein degradation [14]; proteolytic activity | Add protease inhibitors to samples; include PMSF or complete protease inhibitor cocktails |
| Vertical streaking | Sample precipitation; incomplete dissolution | Centrifuge samples before loading; ensure complete mixing with sample buffer |
| Poor resolution | Incorrect gel percentage [2]; insufficient run time | Match gel percentage to protein size; extend run time; use gradient gels for broad MW range |
| No bands | Protein transfer issues (in western blot); inactive detection reagents | Include positive controls; verify staining procedures; check power supply connections |
Method Optimization Strategies
To achieve optimal SDS-PAGE results, consider these specific optimization strategies:
Gel Composition Optimization: For proteins outside the standard 10-200 kDa range, adjust acrylamide concentration accordingly. Large proteins (>200 kDa) separate better in low-percentage gels (4-8%), while small proteins (<30 kDa) may require higher percentages (12-15%) or specialized Tris-Tricine buffer systems for optimal resolution [101] [104].
Buffer System Modifications: The standard Laemmli Tris-glycine system effectively separates proteins in the 10-200 kDa range. For enhanced resolution of very low molecular weight peptides (<10 kDa), switch to Tris-tricine buffer systems, which provide better separation at the lower molecular weight range [14].
Native SDS-PAGE Modifications: To retain enzymatic activity or protein-protein interactions while maintaining high resolution, consider native SDS-PAGE (NSDS-PAGE) modifications. This approach eliminates SDS from sample buffers, omits the heating step, and reduces SDS concentration in running buffers (e.g., to 0.0375%) [18]. This modification preserves metal cofactors in metalloproteins and maintains activity in many enzymes while still providing good separation resolution [18].
Detection Method Selection: Choose staining methods based on sensitivity requirements and downstream applications. Coomassie staining detects 10-100 ng of protein per band and is MS-compatible; silver staining detects 0.1-1 ng protein but may not be MS-compatible; fluorescent stains offer wide linear dynamic ranges (over 3 orders of magnitude) ideal for quantification [2].
Sample Loading Optimization: For complex mixtures like whole cell lysates, optimal loading typically ranges from 10-50 μg total protein per lane for Coomassie staining and 5-20 μg for western blotting [104]. For purified proteins, 0.5-5 μg per lane usually suffices. When analyzing unknown samples, run a dilution series to determine optimal loading concentrations.
Advanced Applications and Future Perspectives
Two-Dimensional Electrophoresis
While one-dimensional SDS-PAGE separates proteins by molecular weight, two-dimensional electrophoresis (2-DE) combines isoelectric focusing (IEF) with SDS-PAGE to resolve complex protein mixtures based on both isoelectric point and molecular weight [2]. This technique enables the visualization of thousands of protein spots on a single gel, providing a comprehensive view of proteome complexity. 2-DE is particularly valuable for detecting post-translational modifications that alter protein charge, such as phosphorylation and acetylation, which appear as horizontal shifts in the 2D pattern [2]. Recent advances in 2-DE have improved reproducibility, resolution, and compatibility with mass spectrometry, strengthening its position in proteomic research.
Alternative Electrophoresis Techniques
While SDS-PAGE remains the workhorse for protein separation, several alternative techniques address specific analytical needs:
Blue Native PAGE (BN-PAGE): This technique preserves protein complexes in their native state by using Coomassie G-250 to impart charge while maintaining protein-protein interactions [18]. BN-PAGE is particularly valuable for studying multiprotein complexes, mitochondrial respiratory chains, and membrane protein assemblies [18].
Native SDS-PAGE (NSDS-PAGE): This hybrid approach modifies standard SDS-PAGE conditions by removing SDS and EDTA from sample buffers, omitting the heating step, and reducing SDS concentration in running buffers [18]. These modifications preserve Zn²⁺ binding in metalloproteins and maintain enzymatic activity in many cases while providing resolution superior to BN-PAGE [18].
Agarose Gel Electrophoresis: For very high molecular weight proteins (700-4,200 kDa) or protein complexes that cannot enter standard polyacrylamide gels, agarose gels with larger pore sizes offer better separation [14].
Future Directions
The continuing evolution of SDS-PAGE methodology focuses on enhancing reproducibility, throughput, and quantitative capabilities. Integration with automated liquid handling systems streamlines sample preparation and loading, while advanced imaging platforms with sophisticated analysis software improve quantification accuracy and detection sensitivity [2]. The development of fluorescent pre-stained markers with exceptionally tight size distributions facilitates more precise molecular weight determination. As mass spectrometry-based proteomics continues to advance, SDS-PAGE maintains its relevance as a robust front-end separation technique, particularly for complex samples requiring fractionation before LC-MS/MS analysis [2]. These ongoing innovations ensure that SDS-PAGE will remain an essential tool in both food science and biomedical research for the foreseeable future.
Sodium dodecyl sulfate-polyacrylamide gel electrophoresis (SDS-PAGE) stands as a foundational technique in molecular biology and biochemistry, providing a reliable method for separating proteins based on their molecular mass. The technique, pioneered by Ulrich K. Laemmli in 1970, has become one of the most cited methodologies in scientific history, with over 259,000 citations attesting to its fundamental importance [77] [1]. SDS-PAGE achieves protein separation by denaturing samples with SDS, an ionic detergent that confers a uniform negative charge-to-mass ratio, effectively negating the influence of native protein charge or structure during electrophoretic migration through a polyacrylamide gel matrix [106] [1]. This process enables researchers to estimate molecular weights, assess protein purity, and analyze complex protein mixtures across diverse applications from basic research to biopharmaceutical development [107] [23].
Despite its widespread adoption and utility, SDS-PAGE possesses inherent limitations that can impact its effectiveness for specific applications. These constraints range from resolution capabilities and quantification accuracy to issues with reproducibility and throughput [77] [106]. This application note examines the technical boundaries of traditional SDS-PAGE methodology within the context of a comprehensive protein separation research protocol, providing researchers with clear criteria for selecting alternative approaches when project requirements exceed the capabilities of conventional gel electrophoresis. We present detailed comparative data, methodological protocols, and decision-making frameworks to guide scientists in choosing the most appropriate separation technology for their specific research objectives.
Technical Limitations of SDS-PAGE: A Systematic Analysis
Resolution and Sensitivity Constraints
The resolving power of SDS-PAGE is fundamentally constrained by its separation mechanism. While effective for distinguishing proteins with significant molecular weight differences, the technique struggles with resolving proteins or protein fragments with minimal mass variations. Comparative studies have demonstrated that SDS-PAGE may fail to detect critical protein variants, including nonglycosylated antibodies, which can be readily identified by capillary electrophoresis methods [106]. This limitation becomes particularly problematic when analyzing complex biological samples or characterizing biopharmaceutical products where subtle molecular differences can significantly impact function.
The sensitivity of SDS-PAGE is additionally compromised by its detection methods. Traditional staining techniques using Coomassie Brilliant Blue typically have detection limits in the nanogram range (approximately 10-50 ng), requiring substantial protein loading for adequate visualization [14]. While silver staining can improve sensitivity to the low nanogram range, it introduces issues with quantitative linearity and reproducibility. Furthermore, the manual nature of staining and destaining procedures introduces variability that can obscure accurate quantification of protein bands, particularly for low-abundance species [77] [14].
Quantitative Limitations and Reproducibility Challenges
A significant constraint of SDS-PAGE lies in its semi-quantitative nature. Band intensity assessment relies on subjective visual comparison or densitometry measurements that are influenced by multiple variables including staining efficiency, background interference, and signal saturation [77] [106]. These factors introduce substantial variability, with inter-gel comparisons particularly vulnerable to inconsistency. The manual processes involved in gel casting, sample loading, and staining contribute significantly to this reproducibility challenge, with gel-to-gel variability affecting migration patterns and band sharpness [77].
Experimental evidence highlights these quantitative limitations. In direct comparison studies evaluating antibody purity, CE-SDS demonstrated significantly higher resolution and signal-to-noise ratios compared to SDS-PAGE, enabling more accurate quantitation of degradation species [106]. The CE-SDS method provided superior reproducibility across consecutive analyses, a critical requirement for quality control in biopharmaceutical development where precise quantification of product-related impurities is essential [106].
Throughput and Operational Considerations
The operational workflow of SDS-PAGE presents substantial throughput limitations. The multi-step process encompassing gel preparation, electrophoresis, staining, and destaining typically requires several hours to complete, with some staining protocols extending overnight [77] [14]. This extended timeline impedes rapid decision-making in process development and quality control environments. Additionally, the manual nature of these procedures demands significant researcher time and attention, further reducing overall efficiency.
Modern laboratory settings increasingly prioritize automation to enhance reproducibility and throughput while reducing operator-dependent variability. SDS-PAGE lacks robust automation capabilities, particularly in the gel casting and sample loading phases [77]. The technique also generates considerable hazardous waste through neurotoxic acrylamide monomers, staining solutions, and destaining reagents, creating environmental concerns and disposal challenges [77]. These operational constraints have driven the development and adoption of alternative approaches that offer streamlined workflows with reduced manual intervention.
Table 1: Comparative Analysis of SDS-PAGE Limitations and Impact on Research Applications
| Limitation Category | Specific Technical Constraints | Impact on Research Applications |
|---|---|---|
| Resolution & Sensitivity | Limited separation of proteins with minimal mass differences (<5%)Detection limit ~10-50 ng with Coomassie stainingPoor detection of post-translational modifications | Inadequate for characterizing complex protein variantsLimited utility for low-abundance proteinsPotential missed detection of critical quality attributes in biotherapeutics |
| Quantification & Reproducibility | Semi-quantitative densitometryGel-to-gel variabilityStaining inconsistencySubjective band intensity assessment | Unreliable for precise impurity profilingChallenging inter-laboratory comparisonsLimited compliance with regulatory standards for QC |
| Throughput & Operations | Multi-step process (4-24 hours)Manual gel casting and stainingLimited automation capabilitiesSignificant hazardous waste generation | Low sample throughputHigh researcher time commitmentEnvironmental safety concernsEscalating operational costs |
Complementary and Alternative Methods: Technical Protocols
Capillary Electrophoresis-SDS (CE-SDS)
Principle and Advantages
Capillary electrophoresis with SDS (CE-SDS) represents a sophisticated alternative to traditional slab gel electrophoresis, maintaining the fundamental separation principle of SDS-PAGE while offering significant technical enhancements. In CE-SDS, separation occurs within narrow-bore capillaries (internal diameters of 3 mm to 75 μM) filled with replaceable polymer matrices, with detection occurring via UV absorbance near the capillary outlet [77] [106]. This configuration provides multiple advantages over conventional SDS-PAGE, including automated operation, elimination of manual staining procedures, enhanced resolution from minimized band broadening, and superior quantitative precision through integrated detection systems [77].
The quantitative benefits of CE-SDS have been experimentally validated in direct comparison studies. When analyzing monoclonal antibody samples, CE-SDS demonstrated superior resolution for detecting fragmentation and nonglycosylated species that were poorly resolved by SDS-PAGE [106]. The method showed excellent reproducibility across consecutive analyses, with quantitative precision meeting rigorous quality control requirements for biopharmaceutical development [106]. Additionally, CE-SDS offers substantial throughput improvements, with analysis times as rapid as 5.5 minutes per sample for high-throughput cartridges compared to several hours for traditional SDS-PAGE [77].
Detailed CE-SDS Protocol
Sample Preparation:
- Dilute protein samples to 1.0 mg/mL using SDS sample buffer [106]
- For non-reduced samples: Heat at 70°C for 3 minutes prior to injection [106]
- For reduced samples: Add fresh reducing agent (DTT or β-mercaptoethanol) and heat at 70°C for 10 minutes [106]
- Include appropriate molecular weight standards for calibration
Instrument Setup and Operation:
- Utilize bare, fused-silica capillaries with appropriate internal diameter (50-75 μm) [77]
- Install capillary cartridge according to manufacturer specifications
- Prime capillary with SDS-gel buffer for 2-3 minutes
- Set instrument parameters: Injection at 5 kV for 20 seconds; separation at 500 V/cm for 25-35 minutes [106]
- Configure UV detection at 220 nm for optimal protein detection [106]
Data Analysis:
- Acquire electropherograms using instrument software (e.g., Beckman Coulter 32 Karat, Compass for iCE) [77] [106]
- Identify peaks based on migration time relative to molecular weight standards
- Quantify peak areas for percentage calculation of individual species
- Generate reports with virtual gel images if required for comparison to traditional formats [77]
Two-Dimensional Electrophoresis (2D-PAGE)
Principle and Application Scope
Two-dimensional electrophoresis significantly expands the separation power of conventional SDS-PAGE by combining two orthogonal separation techniques: isoelectric focusing (IEF) in the first dimension and SDS-PAGE in the second dimension [23]. This approach resolves proteins based on two independent properties - isoelectric point and molecular weight - providing unparalleled resolution for complex protein mixtures. The technique is particularly valuable for proteomic applications, including protein profiling of food products, detection of post-translational modifications, and analysis of processing-induced changes in protein structure [23].
The resolving power of 2D-PAGE enables detection of protein modifications that remain invisible to standard SDS-PAGE, including phosphorylation, glycosylation, and genetic polymorphisms that alter protein charge [23]. In food science applications, 2D-PAGE has proven effective for characterizing storage proteins in cereals, identifying allergen variations, and detecting speciation and adulteration in animal and plant products [23]. The technique provides a comprehensive view of proteomic complexity that single-dimension separation cannot achieve.
Detailed 2D-PAGE Protocol
First Dimension - Isoelectric Focusing:
- Prepare protein samples in appropriate rehydration buffer containing urea, thiourea, CHAPS, and appropriate ampholytes [23]
- Apply samples to immobilized pH gradient (IPG) strips (typically 7-24 cm) via active or passive rehydration
- Perform isoelectric focusing using stepwise or gradient voltage programming:
- Step 1: 250 V for 30 minutes (initial separation)
- Step 2: 500 V for 1 hour (sample entry)
- Step 3: 1000 V for 1 hour (transition)
- Step 4: 8000 V gradient over 3 hours (focusing)
- Step 5: 8000 V until 50,000 Vhr total achieved [23]
- Following IEF, store strips at -80°C or proceed immediately to second dimension
IPG Strip Equilibration:
- Incubate strips in equilibration buffer I (6 M urea, 75 mM Tris-HCl pH 8.8, 29.3% glycerol, 2% SDS, 1% DTT) for 15 minutes with gentle agitation
- Transfer to equilibration buffer II (6 M urea, 75 mM Tris-HCl pH 8.8, 29.3% glycerol, 2% SDS, 2.5% iodoacetamide) for 15 minutes [23]
- Rinse briefly with SDS-PAGE running buffer to remove excess equilibration solution
Second Dimension - SDS-PAGE:
- Place equilibrated IPG strips onto pre-cast or hand-cast polyacrylamide gels (8-12%)
- Overlay with agarose sealing solution (0.5% agarose in running buffer with bromophenol blue)
- Perform electrophoresis using standard SDS-PAGE conditions:
- Initial run: 50 V for 30 minutes (protein stacking)
- Main separation: 150-200 V until dye front reaches bottom of gel [23]
- Proceed to protein detection via staining (Coomassie, silver, or fluorescent dyes) or western blotting
Tricine-SDS-PAGE for Low Molecular Weight Proteins
Technical Basis and Applications
Traditional Laemmli SDS-PAGE systems utilizing Tris-glycine buffers exhibit limited resolution for proteins and peptides below 30 kDa [23]. Tricine-SDS-PAGE, developed by Schägger and von Jagow, addresses this limitation by employing tricine as the trailing ion in the discontinuous buffer system, providing improved separation efficiency for low molecular weight polypeptides (0.5-50 kDa) [1] [23]. The technique is particularly valuable for analyzing small proteins, extensive protein fragments, and peptides generated by enzymatic digestion.
The enhanced separation of tricine-SDS-PAGE stems from the different migration characteristics of tricine compared to glycine. Tricine migrates more slowly than glycine in the stacking gel and has a higher electrophoretic mobility in the separating gel, creating a more effective trailing ion system for low molecular weight species [1]. This buffer configuration minimizes diffusion-related band broadening and improves spatial separation between small polypeptides that would co-migrate in traditional glycine-based systems.
Detailed Tricine-SDS-PAGE Protocol
Gel Preparation:
- Prepare separating gel solution (10-16% T, 3% C acrylamide) in 1 M Tris-HCl (pH 8.45) containing 0.1% SDS [1]
- Add ammonium persulfate (0.05% final concentration) and TEMED (0.05% final concentration) to initiate polymerization
- Pour separating gel and overlay with butanol-saturated water or isopropanol
- After polymerization, prepare stacking gel (4% T acrylamide) in 0.5 M Tris-HCl (pH 6.8) with 0.1% SDS
- Insert sample comb and allow stacking gel to polymerize completely
Sample and Buffer Preparation:
- Prepare protein samples in tricine sample buffer (50 mM Tris-HCl pH 6.8, 4% SDS, 12% glycerol, 2% β-mercaptoethanol, 0.01% Coomassie G-250) [1]
- Heat samples at 40°C for 30-60 minutes (avoid higher temperatures for low MW proteins)
- Prepare anode buffer (0.2 M Tris-HCl, pH 8.9) and cathode buffer (0.1 M Tris, 0.1 M tricine, 0.1% SDS, pH 8.25) [1]
Electrophoresis Conditions:
- Load samples and molecular weight markers appropriate for low MW range
- Conduct electrophoresis at constant voltage:
- 30 V for 30 minutes (stacking phase)
- 100-120 V for 3-4 hours (separation phase) [1]
- Terminate electrophoresis when dye front approaches bottom of gel (approximately 1 cm from end)
- Process gel for staining, western blotting, or mass spectrometry analysis
Table 2: Method Selection Guide Based on Protein Characteristics and Research Objectives
| Research Application | Recommended Method | Key Technical Advantages | Typical Analysis Time |
|---|---|---|---|
| Routine protein separation (teaching labs) | Traditional SDS-PAGE | Low cost, simplicity, visual results, educational value | 3-6 hours |
| Biopharmaceutical quality control | CE-SDS | Automated, quantitative, regulatory compliance, high reproducibility | 5.5-25 minutes per sample |
| Complex proteome analysis | 2D-PAGE | High resolution, detection of PTMs, comprehensive profiling | 24-48 hours |
| Low MW proteins/peptides (<30 kDa) | Tricine-SDS-PAGE | Enhanced resolution of small proteins, minimal protein loss | 4-5 hours |
| High-throughput screening | Microfluidic/Chip-based systems | Minimal sample volume, rapid analysis, automated data capture | 1-10 minutes per sample |
Decision Framework: Method Selection Guidelines
Application-Specific Recommendations
The selection of an appropriate protein separation methodology requires careful consideration of research objectives, sample characteristics, and required data quality. The following application-specific guidelines assist researchers in choosing the most suitable approach:
Biopharmaceutical Development and QC: For monoclonal antibody characterization and biotherapeutic analysis, CE-SDS represents the preferred method due to its quantitative precision, reproducibility, and regulatory acceptance [77] [106]. The technology effectively resolves and quantifies antibody fragments, nonglycosylated species, and process-related impurities that impact product quality and safety. CE-SDS meets the rigorous validation requirements for product release testing in biopharmaceutical manufacturing, providing the documentation and data integrity necessary for regulatory filings [77].
Food Science and Agriculture Applications: Traditional SDS-PAGE remains a valuable tool for protein profiling of cereals, pulses, dairy products, and meat/seafood, enabling quality assessment, varietal identification, and detection of adulteration [23]. For complex analyses requiring detection of processing-induced modifications or genetic polymorphisms, 2D-PAGE provides superior resolution. The technique effectively characterizes storage proteins (glutenins, gliadins, caseins) and identifies allergen variations across food commodities [23].
Diagnostic and Clinical Research: In clinical settings requiring high throughput and standardized results, automated CE-SDS systems offer advantages for serum protein analysis and biomarker detection [77] [106]. For research applications exploring disease-associated protein patterns, 2D-PAGE enables comprehensive proteomic profiling of tissue and fluid samples. Traditional SDS-PAGE remains appropriate for educational and preliminary screening applications where cost considerations outweigh the need for precise quantification [108].
Proteomic and Discovery Research: For exploratory investigations requiring maximal protein separation, 2D-PAGE provides unparalleled resolution of complex biological samples [23]. When analyzing small proteins and peptides (particularly below 30 kDa), tricine-SDS-PAGE delivers superior resolution compared to traditional Laemmli systems. Emerging microfluidic platforms offer advantages for high-throughput discovery applications where sample volume is limited and rapid analysis is prioritized [78].
Integrated Workflow Strategies
Strategic integration of multiple separation techniques often provides complementary insights that surpass the capabilities of any single method. The following workflow strategies optimize protein characterization across diverse research scenarios:
Comprehensive Biotherapeutic Analysis:
- Primary screening: CE-SDS for rapid purity assessment and quantification of product-related impurities [77] [106]
- In-depth characterization: 2D-PAGE for detection of charge variants and post-translational modifications [23]
- Orthogonal confirmation: LC-MS for identity confirmation of specific variants
Food Protein Quality Assessment:
- Initial profiling: SDS-PAGE for efficient separation of major storage proteins and detection of adulteration [23]
- Allergen detection: Immunoblotting following SDS-PAGE for specific protein identification
- Functional assessment: 2D-PAGE for monitoring processing-induced modifications that impact functionality
Proteomic Discovery Pipeline:
- Global separation: 2D-PAGE for comprehensive proteome visualization and differential analysis [23]
- Targeted analysis: Tricine-SDS-PAGE for enhanced resolution of low molecular weight proteome
- Validation: Western blotting following appropriate electrophoresis method for specific protein confirmation
Diagram 1: Protein Separation Method Selection Algorithm
Research Reagent Solutions: Essential Materials for Protein Separation
Table 3: Essential Research Reagents and Materials for Protein Separation Techniques
| Reagent/Material | Technical Function | Application Notes | Quality Considerations |
|---|---|---|---|
| Acrylamide/Bis-acrylamide | Forms polyacrylamide gel matrix; pore size determines separation range [1] [109] | Vary concentration (8-16%) based on target protein size; lower % for large proteins, higher % for small proteins | High purity (electrophoresis grade); prepare fresh or store protected from light; neurotoxic in monomer form |
| SDS (Sodium Dodecyl Sulfate) | Ionic detergent denatures proteins; confers negative charge proportional to mass [1] [13] | Use 1-2% in sample buffer; critical micelle concentration ~7-10 mM; binds ~1.4g SDS per gram protein [1] | ≥99% purity; recrystallize if necessary; prepare 10-20% stock solutions |
| TEMED & Ammonium Persulfate | Catalyzes acrylamide polymerization; TEMED stabilizes free radicals; APS initiates reaction [1] [109] | Add last to gel solutions; polymerization rate temperature-dependent; adjust concentrations for gel thickness | TEMED: store at 4°C protected from light; APS: prepare fresh weekly or aliquot and freeze |
| Tris-Based Buffers | Maintain pH during electrophoresis; discontinuous systems use different pH in stacking vs. resolving gels [1] | Stacking gel: Tris-HCl pH 6.8; Resolving gel: Tris-HCl pH 8.8; Running buffer: Tris-glycine pH 8.3 [1] | High purity (>99.9%); filter through 0.45μm membrane; degas if necessary for gradient gels |
| Reducing Agents (DTT, β-ME) | Cleaves disulfide bonds; ensures complete protein denaturation and subunit separation [1] [23] | DTT (10-100 mM) preferred for stronger reducing power and less odor; add fresh before heating samples | Aliquot and store at -20°C; avoid repeated freeze-thaw cycles; check solution pH (acidic DTT solutions degrade) |
| Molecular Weight Markers | Calibrate gel migration; estimate protein sizes; monitor electrophoresis progress [14] [13] | Pre-stained markers visualize migration; broad range (10-250 kDa) for unknown samples; specialty ladders for specific ranges | Verify integrity before use; avoid repeated freeze-thaw cycles; include markers appropriate for detection method |
| Protein Stains | Visualize separated proteins; varying sensitivity and compatibility with downstream applications [14] [1] | Coomassie: 50-100 ng detection limit; silver: 1-5 ng; fluorescent dyes: 1-10 ng with linear quantification [14] | Consider MS-compatibility if proceeding to mass spectrometry; fluorescent dyes offer widest linear dynamic range |
SDS-PAGE remains a fundamental technique in protein science, offering accessibility, visual interpretability, and established methodology that ensures its continued relevance in research and education. However, recognition of its limitations regarding resolution, quantification, and throughput is essential for appropriate methodological selection. Capillary electrophoresis-based approaches provide automated, quantitative alternatives for applications demanding precision and reproducibility, particularly in regulated environments such as biopharmaceutical development. For complex separation challenges involving low molecular weight proteins or entire proteomes, specialized methods including tricine-SDS-PAGE and two-dimensional electrophoresis offer enhanced resolution that addresses specific technical constraints.
The evolving landscape of protein separation technologies continues to provide researchers with increasingly sophisticated tools that build upon the foundational principles established by SDS-PAGE. Emerging platforms incorporating microfluidics, advanced detection modalities, and integrated data analytics promise to further expand our capabilities for protein characterization. By understanding both the capabilities and constraints of available methodologies, researchers can make informed decisions that align technical approach with research objectives, ensuring optimal outcomes across diverse applications from basic science to applied biotechnology.
Conclusion
SDS-PAGE remains an indispensable technique in protein research, providing fundamental insights into molecular weight, purity, and composition. Mastering both the theoretical principles and practical execution—from proper sample preparation and gel formulation to systematic troubleshooting—ensures reliable, reproducible results. Future directions include increased integration with downstream applications like mass spectrometry, development of more sensitive detection methods, and adaptation for analyzing complex protein modifications. As drug development advances toward targeted therapies, robust protein separation and characterization through optimized SDS-PAGE protocols will continue to be crucial for biomarker discovery, quality control, and diagnostic applications in biomedical research.
References
- 1. SDS-PAGE [https://en.wikipedia.org/wiki/SDS-PAGE]
- 2. SDS-PAGE guide: Sample preparation to analysis [https://www.abcam.com/en-us/knowledge-center/western-blot/sds-page-guide]
- 3. SDS-PAGE: The science behind all those bubbles [https://www.antibodiesinc.com/pages/sds-page-demystified?srsltid=AfmBOopy-sXzsNslt0TXCCMb6hOmcudindg6Pmh8-2Kh7z5F1c_ZNESl]
- 4. How Does SDS-PAGE Work? A Comprehensive Guide [https://www.metwarebio.com/how-sds-page-works-guide/]
- 5. Protein analysis SDS PAGE [https://www.qiagen.com/us/knowledge-and-support/knowledge-hub/bench-guide/protein/protein-analysis/protein-analysis-sds-page]
- 6. Protein Standards & Ladders [https://www.thermofisher.com/us/en/home/life-science/protein-biology/protein-gel-electrophoresis/protein-standards-ladders.html]
- 7. Visualization of proteins in SDS PAGE gels [https://www.qiagen.com/us/knowledge-and-support/knowledge-hub/bench-guide/protein/protein-analysis/visualization-of-proteins-in-sds-page-gels]
- 8. SDS-PAGE and Western Blot Image Capture Guide - TotalLab [https://totallab.com/resources/western-blot-image-capture/]
- 9. Effect of the operational parameters on the electromigration ... [https://www.sciencedirect.com/science/article/pii/S0039914025000876]
- 10. Overview of SDS-PAGE [https://www.creative-proteomics.com/resource/overview-of-sds-page.htm]
- 11. How SDS-PAGE Works [https://bitesizebio.com/580/how-sds-page-works/]
- 12. SDS-PAGE: The science behind all those bubbles [https://www.antibodiesinc.com/pages/sds-page-demystified?srsltid=AfmBOoqRVHN4G2Jkj3Evcustv9yMiRE7NG7SgaTxmQWzG78M81YDjn4X]
- 13. How SDS-PAGE Separates Proteins [https://azurebiosystems.com/blog/how-sds-page-separates-proteins/]
- 14. Western blotting guide: Part 2, Protein separation by SDS- ... [https://www.jacksonimmuno.com/secondary-antibody-resource/technical-tips/western-blotting-guide-part-2/]
- 15. SDS-PAGE Protocol [https://neutab.creative-biolabs.com/sds-page-analysis.htm]
- 16. SDS-PAGE Protocol [https://www.rockland.com/resources/sds-page-protocol/?srsltid=AfmBOoodNy52kEFTu0j_pmIXxtcuGgEVGCHSi1G4k1-12XnxgwE4bL8o]
- 17. Analysis of SDS-PAGE Gel Electrophoresis Results [https://www.mtoz-biolabs.com/analysis-of-sds-page-gel-electrophoresis-results.html]
- 18. Native SDS-PAGE: High Resolution Electrophoretic ... [https://pmc.ncbi.nlm.nih.gov/articles/PMC4517606/]
- 19. Polyacrylamide Gel Electrophoresis - an overview [https://www.sciencedirect.com/topics/agricultural-and-biological-sciences/polyacrylamide-gel-electrophoresis]
- 20. SDS-PAGE Analysis of proteins: Principles, methodology ... [https://deepscienceresearch.com/dsr/catalog/book/107/chapter/407]
- 21. SDS-PAGE: A Cornerstone of Protein Analysis in Modern ... [https://www.metwarebio.com/sds-page-protein-analysis/]
- 22. A Guide to Gradient Gels: The Why's and How's [https://bitesizebio.com/47184/gradient-gels/]
- 23. Deciphering food proteins: The applications of SDS-PAGE ... [https://www.sciencedirect.com/science/article/abs/pii/S2212429225003025]
- 24. A protocol for recombinant protein quantification by ... [https://pmc.ncbi.nlm.nih.gov/articles/PMC7294310/]
- 25. An overview of technical considerations for Western ... [https://pmc.ncbi.nlm.nih.gov/articles/PMC5138151/]
- 26. Protein Electrophoresis Using SDS-PAGE: A Detailed ... [https://www.goldbio.com/blogs/articles/protein-electrophoresis-sds-page-overview?srsltid=AfmBOore0uahfHlxC29ft04h1Yp6j4XYm5-y6Gc9aTJMagI48Vk1Au5z]
- 27. SDS Page Gel Electrophoresis PAGE [https://williams.chemistry.gatech.edu/course_Information/4581/techniques/gel_elect/page_protein.html]
- 28. 1.15: SDS-PAGE [https://bio.libretexts.org/Bookshelves/Biotechnology/Lab_Manual%3A_Introduction_to_Biotechnology/01%3A_Techniques/1.15%3A_SDS-PAGE]
- 29. Preparing SDS gels [https://www.ruf.rice.edu/~bioslabs/studies/sds-page/gellab2a.html]
- 30. An Easy SDS-PAGE Gel Recipe & 10-Step Protocol [https://bitesizebio.com/59429/sds-page-gel-recipe/]
- 31. SDS-PAGE Using TGX Acrylamide Kit--CHEM 584 [https://www.protocols.io/view/sds-page-using-tgx-acrylamide-kit-chem-584-byakpscw.html]
- 32. Polyacrylamide Gel - an overview | ScienceDirect Topics [https://www.sciencedirect.com/topics/pharmacology-toxicology-and-pharmaceutical-science/polyacrylamide-gel]
- 33. Troubleshooting Gel Casting/ Polymerization Issues in SDS-PAGE | GoldBio [https://goldbio.com/articles/article/troubleshooting-gel-casting-polymerization-issues-in-sds-page]
- 34. molecular biology - What is SDS PAGE gel polymerization time? - Biology Stack Exchange [https://biology.stackexchange.com/questions/26120/what-is-sds-page-gel-polymerization-time]
- 35. One-Dimensional SDS and Non-Denaturing Gel ... [https://www.thermofisher.com/us/en/home/references/protocols/proteins-expression-isolation-and-analysis/sds-page-protocol/one-dimensional-sds-and-non-denaturing-gel-electrophoresis.html]
- 36. GelGenie: an AI-powered framework for gel ... [https://www.nature.com/articles/s41467-025-59189-0]
- 37. an AI-powered framework for gel electrophoresis image ... [https://ui.adsabs.harvard.edu/abs/2025NatCo..16.4087A/abstract]
- 38. SDS-PAGE: The science behind all those bubbles [https://www.antibodiesinc.com/pages/sds-page-demystified?srsltid=AfmBOopxNT4CYAGufbL9NrzOdOTP7a2KBWuG0zz8fDnG2NkxhdACYwpj]
- 39. Protein Electrophoresis Using SDS-PAGE: A Detailed ... [https://www.goldbio.com/blogs/articles/protein-electrophoresis-sds-page-overview?srsltid=AfmBOor36L6lxcsmMTy-_jiSW0g2KYJucgFcNpsULWFdwUQFO4-VW5d_]
- 40. Top tips for optimum SDS-PAGE results [https://stjohnslabs.com/blog/top-tips-for-optimum-sds-page-results?srsltid=AfmBOoodi-WHYU1iuHz6A8BH5d_hPKk-Cg5R2xc-UeJu5a3ErCgUuk0f]
- 41. Guide to SDS-PAGE: Tips for Better Results with NuSep ... [https://nusep.us/pages/guide-to-sds-page-tips-for-better-results-with-nusep-precast-gels?srsltid=AfmBOoqF-h6IoYOCWg-ofBMReh-_p2txFs_oRU_1BBOu5Rhvr70sDGGW]
- 42. SDS-PAGE Optimization for Western Blot [https://www.bosterbio.com/protocol-and-troubleshooting/western-blotting-optimization/sds-page?srsltid=AfmBOorZb4yS5RKSK8UsJp7cfknKaEOqEsit0tMb2H5skxOyF2gy6ybI]
- 43. Investigation and elimination of noncovalent artificial ... [https://www.sciencedirect.com/science/article/abs/pii/S0731708525000147]
- 44. How current, voltage, and power settings affect SDS-PAGE [https://www.biossusa.com/blogs/news/how-current-voltage-and-power-settings-affect-sds-page?srsltid=AfmBOorksMdmhOx_KSxu9DuWpBxbLHGj5YNau6OmGhV38MaUSK_lE4LJ]
- 45. Troubleshooting SDS-PAGE Gel Running Issues [https://www.goldbio.com/blogs/articles/troubleshooting-sds-page-gel-running-issues?srsltid=AfmBOorVIimAFbrBS3A4oJ4FILIvlIDLLecOa7OJ_kBc_kL4Ipe3fLim]
- 46. Constant Current or Voltage in SDS-PAGE [https://bitesizebio.com/51744/constant-current-or-voltage-in-sds-page/]
- 47. Tips for Optimal SDS-PAGE Separation [https://www.rockland.com/resources/tips-for-optimal-sds-page-separation/?srsltid=AfmBOoqUlA2TysZnXLfNQEKHpsASI2BRCy3eDyByhdJorbZ5QcuQyP1K]
- 48. 6 Best Tips for Troubleshooting Poor Band Separation on ... [https://azurebiosystems.com/blog/6-tips-for-troubleshooting-poor-band-separation-on-sds-page-gels/]
- 49. SDS-PAGE: The science behind all those bubbles [https://www.antibodiesinc.com/pages/sds-page-demystified?srsltid=AfmBOoq-0hw2d9NNHt0EdUoXLsatomuNO-rceSJ4fJkenPfC5eRcbsO1]
- 50. Protein Gel Staining Methods [https://www.thermofisher.com/us/en/home/life-science/protein-biology/protein-biology-learning-center/protein-biology-resource-library/pierce-protein-methods/protein-gel-stains.html]
- 51. SDS-PAGE Protocol [https://www.rockland.com/resources/sds-page-protocol/?srsltid=AfmBOooq3mn4aP04Ih6JqyaXeVoGZqyAzyMvKILtusuVnCbq20q2hWjz]
- 52. How to Run an SDS-PAGE and Interpret Bands [https://synapse.patsnap.com/article/how-to-run-an-sds-page-and-interpret-bands]
- 53. PAGE-MASTER Protein Standard (for SDS-PAGE) [https://www.genscript.com/molecule/M00516-PAGE_MASTER_Protein_Standard_for_SDS_PAGE_.html]
- 54. Protein molecular weight markers [https://www.takarabio.com/products/protein-research/sds-page-and-western-blotting/protein-molecular-weight-markers/low-high-and-broad-range]
- 55. The 8 Western Blot Failures and How to Prevent Them (2025 ... [https://wildtypeone.substack.com/p/the-8-western-blot-failures-and-how?utm_campaign=post&triedRedirect=true]
- 56. Overview of Protein Electrophoresis [https://www.thermofisher.com/us/en/home/life-science/protein-biology/protein-biology-learning-center/protein-biology-resource-library/pierce-protein-methods/overview-electrophoresis.html]
- 57. SDS-PAGE: The science behind all those bubbles [https://www.antibodiesinc.com/pages/sds-page-demystified?srsltid=AfmBOopBx5mfsaMs774xo815M9C6k7nUHI5Z8M5u2db_z0neucJTfAli]
- 58. Major cause of antibody artifact bands on non-reducing ... [https://www.sciencedirect.com/science/article/abs/pii/S1046592819303389]
- 59. Troubleshooting Common Electrophoresis Problems and ... [https://www.labx.com/resources/troubleshooting-common-electrophoresis-problems-and-artifacts/5539]
- 60. Troubleshooting SDS-PAGE Gel Running Issues [https://www.goldbio.com/blogs/articles/troubleshooting-sds-page-gel-running-issues?srsltid=AfmBOoqpCQcIB7xJsGKo_U-p4uOzLfhx08ozgseFN_3ouTJlqiZug4fl]
- 61. Tips for Successful SDS-PAGE [https://blog.edvotek.com/2021/05/13/tips-for-successful-sds-page/]
- 62. Advantages and Disadvantages of SDS-PAGE for Protein ... [https://www.mtoz-biolabs.com/advantages-and-disadvantages-of-sds-page-for-protein-separation.html]
- 63. SDS-PAGE: The science behind all those bubbles [https://www.antibodiesinc.com/pages/sds-page-demystified?srsltid=AfmBOoplLWa0oofcM02ysOdka360J27cS7yJFnNaogOpC30nbIpIqSXc]
- 64. Tips for Optimal SDS-PAGE Separation [https://www.rockland.com/resources/tips-for-optimal-sds-page-separation/?srsltid=AfmBOopjAArzHLvO38iLsH0OMtYl7P4r7A3UvXzSrEFHKizXgmaYJsjj]
- 65. Troubleshooting SDS-PAGE Gel Running Issues [https://www.goldbio.com/blogs/articles/troubleshooting-sds-page-gel-running-issues?srsltid=AfmBOooOjGb_24hEmdtwlU2uwss6CtJE73vZCTXD7AbASnuqq9rMDAgG]
- 66. Troubleshooting Sodium Dodecyl Sulfate- Polyacrylamide ... [https://www.hycultbiotech.com/sds-page/troubleshooting/]
- 67. SDS-PAGE: The science behind all those bubbles [https://www.antibodiesinc.com/pages/sds-page-demystified?srsltid=AfmBOopY_oRPPSpEoIqhIiV8Ad8jWYC8gaxmPiXVQRi5bS2Q_IQUT0O5]
- 68. SDS-PAGE - Mullins Lab - [https://mullinslab.ucsf.edu/sds-page/]
- 69. Troubleshooting SDS-PAGE Gel Running Issues [https://www.goldbio.com/blogs/articles/troubleshooting-sds-page-gel-running-issues?srsltid=AfmBOorOYQcCruGQuk_9ws26aqDrkmcC4CQwVGnro4RQ9P8izH34rUon]
- 70. Protein Electrophoresis Using SDS-PAGE: A Detailed ... [https://www.goldbio.com/blogs/articles/protein-electrophoresis-sds-page-overview?srsltid=AfmBOopio9RM8I3rRuScfC4CNGYJ5LQK0PAoH2HtGMxJsHnbwC-2GGPW]
- 71. Eight Tips to Improve Gel Electrophoresis Results [https://www.thermofisher.com/us/en/home/brands/thermo-scientific/molecular-biology/molecular-biology-learning-center/molecular-biology-resource-library/spotlight-articles/8-DNA-ladder-tips.html]
- 72. Mastering Gel Electrophoresis: 10 Tips and Tricks for ... [https://americanlaboratorytrading.com/mastering-gel-electrophoresis-10-tips-and-tricks-for-successful-results/?srsltid=AfmBOorzW_pblC7gD74inQl8lNzCHCIE5HrlOL1MEfof4s3Q38vXhvh1]
- 73. Better Separation Resolution of New Biopharmaceutical ... [https://sciex.com/tech-notes/ce/better-separation-resolution-of-new-biopharmaceutical-modalities]
- 74. Better Resolution for CE-SDS Analysis of New ... [https://www.labroots.com/webinar/ce-sds-temperature-effect-purity-heterogeneity-analysis-protein-therapeutic-modalities?srsltid=AfmBOoqicInlzZhNnxT9kXRlpA864hsZG1Ib1IPdvWl6IoljQdz8pIgk]
- 75. Essential Guide to Caring for Your Electrophoresis Unit in ... [https://blog.edvotek.com/2025/07/31/essential-guide-to-caring-for-your-electrophoresis-unit-in-the-laboratory/]
- 76. Electrophoresis Safety [https://ehs.stanford.edu/reference/electrophoresis-safety]
- 77. The Evolution of SDS-Based Protein Separation [https://www.bio-techne.com/resources/blogs/advantages-of-ce-sds]
- 78. SDS-PAGE Electrophoresis Market Size & Share 2025-2032 [https://www.360iresearch.com/library/intelligence/sds-page-electrophoresis]
- 79. Sustainable and Cost-Effective Gel Documentation - PMC [https://pmc.ncbi.nlm.nih.gov/articles/PMC10037652/]
- 80. Protein Electrophoresis Using SDS-PAGE: A Detailed ... [https://www.goldbio.com/blogs/articles/protein-electrophoresis-sds-page-overview?srsltid=AfmBOornSr6IfO0LHrT31yQbp65DoqOjWPFADpIYXRgtUDeIMJ3epFkS]
- 81. Determining Protein Molecular Weight with SDS-PAGE [https://info.gbiosciences.com/blog/bid/196974/determining-protein-molecular-weight-with-sds-page-an-overview-of-the-process]
- 82. Determination of Molecular Weight of Protein by SDS PAGE [https://www.mtoz-biolabs.com/determination-of-molecular-weight-of-protein-by-sds-page.html]
- 83. Optimization of a Western blot protocol for the detection ... [https://pmc.ncbi.nlm.nih.gov/articles/PMC12455089/]
- 84. | BIT - iGEM 2025 [https://2025.igem.wiki/bit/results]
- 85. Protein quantification in SDS‑PAGE gels by densitometry ... [https://www.protocols.io/view/protein-quantification-in-sds-page-gels-by-densito-g8aubzsex.html]
- 86. SDS Electrophoresis on Gradient Polyacrylamide Gels as a ... [https://www.mdpi.com/2075-4418/13/9/1513]
- 87. The Practical Guide to Running a Perfect Homemade SDS ... [https://bitesizebio.com/25239/making-sds-page-gel-practical-guide/]
- 88. Method development and validation of capillary sodium ... [https://www.sciencedirect.com/science/article/pii/S073170851000419X]
- 89. Non-Reducing SDS PAGE: A Method to Analyze Disulfide- ... [https://www.jove.com/v/30387/non-reducing-sds-page-method-to-analyze-disulfide-linked-multimeric]
- 90. Gel Electrophoresis, PAGE, SDS - Biochemistry [https://www.medschoolcoach.com/gel-electrophoresis-page-sds-page-mcat-biochemistry/]
- 91. Quantification of Folded and Misfolded Proinsulin Forms ... [https://pmc.ncbi.nlm.nih.gov/articles/PMC12152102/]
- 92. Non-reducing PAGE and native PAGE protein analysis [https://bio-protocol.org/exchange/minidetail?id=16558527&type=30]
- 93. Western Blot Transfer Methods [https://www.thermofisher.com/us/en/home/life-science/protein-biology/protein-biology-learning-center/protein-biology-resource-library/pierce-protein-methods/western-blot-transfer-methods.html]
- 94. Western Blot - StatPearls - NCBI Bookshelf - NIH [https://www.ncbi.nlm.nih.gov/books/NBK542290/]
- 95. SDS-PAGE Optimization for Western Blot [https://www.bosterbio.com/protocol-and-troubleshooting/western-blotting-optimization/sds-page?srsltid=AfmBOooJ45E3-zikNoNrIGLZTj4F7VgpzxMu7mM_kmqsOnf_5Y7WZlzL]
- 96. How to Optimize Your Western Blot Transfers [https://bitesizebio.com/8276/how-to-optimize-your-western-blot-transfers/]
- 97. Western blotting guide: Part 1, Introduction and Sample ... [https://www.jacksonimmuno.com/secondary-antibody-resource/technical-tips/western-blotting-guide-part-1/]
- 98. Western blot protocol [https://www.abcam.com/en-us/technical-resources/protocols/western-blot]
- 99. Western Blotting Protocol | Antibodies Inc [https://www.antibodiesinc.com/pages/western-protocol?srsltid=AfmBOoqKLqT56BEIoW5G6w8H9R_av5fQlextsvS96RjsK3RvI7ttjCpX]
- 100. Western Blot Protocols and Recipes [https://www.thermofisher.com/us/en/home/life-science/protein-biology/protein-biology-learning-center/protein-gel-electrophoresis-information/western-blot-protocols.html]
- 101. SDS-PAGE Protocol [https://www.rockland.com/resources/sds-page-protocol/?srsltid=AfmBOoo8zRkhA5xIAivV5c018aN4hrz8jNYJLbUGVWoeS9rz7JcXbCvb]
- 102. The principle and method of polyacrylamide gel ... [https://ruo.mbl.co.jp/bio/e/support/method/sds-page.html]
- 103. SDS-PAGE in Food Science: Elevating Protein Insight and ... [https://www.eurofinsus.com/food-testing/resources/sds-page-in-food-science-elevating-protein-insight-and-product-integrity/]
- 104. Tips for Optimal SDS-PAGE Separation [https://www.rockland.com/resources/tips-for-optimal-sds-page-separation/?srsltid=AfmBOoo0DMHgmGVhSHuMckUv0HIbs8pVeevE-Bc5BmxGCxkvdp4jxyfH]
- 105. Research paper – characterization of red blood cell ... [https://www.ruf.rice.edu/~bioslabs/studies/sds-page/sdsreport.html]
- 106. Comparing SDS-PAGE and CE-SDS for Antibody Purity ... [https://www.bioprocessintl.com/qa-qc/comparing-sds-page-and-ce-sds-for-antibody-purity-analysis]
- 107. What is SDS-PAGE? Uses, How It Works & Top Companies ... [https://www.linkedin.com/pulse/what-sds-page-uses-how-works-top-companies-2025-clearsedge-research-kztwf]
- 108. 5 Ways to Make SDS-PAGE A More Approachable Topic [https://www.labster.com/blog/make-sds-page-more-approachable]
- 109. 13.11: Lab Technique - SDS-PAGE [https://bio.libretexts.org/Courses/West_Los_Angeles_College/Biotechnology/13%3A_Biotechnology_Lab_Protocols/13.11%3A_Lab_Technique_-_SDS-PAGE]