1D PAGE vs 2D PAGE: A Comprehensive Guide for Proteomic Analysis in Biomedical Research
This article provides a detailed comparative analysis of 1D and 2D Polyacrylamide Gel Electrophoresis (PAGE) for proteomic applications.
1D PAGE vs 2D PAGE: A Comprehensive Guide for Proteomic Analysis in Biomedical Research
Abstract
This article provides a detailed comparative analysis of 1D and 2D Polyacrylamide Gel Electrophoresis (PAGE) for proteomic applications. Tailored for researchers, scientists, and drug development professionals, it covers foundational principles, methodological workflows, and practical applications of both techniques. The content addresses key challenges in protein separation, including resolution of complex mixtures, detection of low-abundance proteins, and analysis of post-translational modifications. Through systematic comparison of technical capabilities, limitations, and optimization strategies, this guide enables informed selection of electrophoretic methods for various research scenarios, from basic protein characterization to advanced biomarker discovery and therapeutic development.
Core Principles of Protein Separation: Understanding 1D and 2D PAGE Fundamentals
Historical Development and Evolution of Gel Electrophoresis in Proteomics
Gel electrophoresis represents a foundational technology in the field of proteomics, providing the critical capability to separate complex protein mixtures for analysis. The evolution from one-dimensional (1D) to two-dimensional (2D) separation techniques marked a revolutionary advancement in our ability to visualize and characterize proteomes. This guide objectively compares 1D and 2D polyacrylamide gel electrophoresis (PAGE) methodologies within proteomics research, examining their technical principles, historical development, and performance characteristics. The trajectory of these techniques parallels the very emergence of proteomics as a scientific discipline—from early protein separation methods to contemporary integrated workflows that combine electrophoretic separation with mass spectrometric analysis. Understanding the capabilities, limitations, and appropriate applications of each method remains essential for researchers designing proteomic studies in basic research, biomarker discovery, and drug development contexts.
Historical Development
The genesis of gel electrophoresis dates to the 1930s with Arne Tiselius's pioneering work on moving-boundary electrophoresis, for which he received the Nobel Prize in 1948 [1]. However, the technique truly became accessible to most laboratories with the introduction of supporting media like starch and polyacrylamide, which minimized convection and improved resolution. The development of polyacrylamide gel electrophoresis (PAGE) provided a versatile matrix that could be tailored with different pore sizes to separate biomolecules according to their size, charge, or both [2].
The 1970s marked a critical turning point with the introduction of two-dimensional gel electrophoresis by O'Farrell and Klose, working independently [3] [4]. This revolutionary approach combined isoelectric focusing (IEF) with SDS-PAGE to separate proteins based on two independent properties: isoelectric point in the first dimension and molecular weight in the second dimension. O'Farrell's 1975 method demonstrated unprecedented resolution, capable of separating thousands of proteins from a single sample, and effectively laid the groundwork for modern proteomics [3] [5]. In his own account, O'Farrell recalled that as a graduate student, he calculated that a two-dimensional approach achieving the product of the resolution of individual methods would enable the resolution of thousands of proteins simultaneously, extending protein separation capabilities to complex organisms [3].
The term "proteome" itself would not be coined until 1994 by Marc Wilkins, and "proteomics" emerged as a recognized field in the 1990s as these separation technologies converged with advances in mass spectrometry and genomics [6]. The evolution continued with methodological improvements such as immobilized pH gradients (IPG) for enhanced reproducibility in the first dimension, fluorescent labeling techniques (DIGE) for improved quantification, and specialized variants including blue native PAGE for studying protein complexes [5] [7].
Technical Principles and Methodologies
1D SDS-PAGE Fundamentals
One-dimensional SDS-PAGE separates proteins primarily by molecular weight using the anionic detergent sodium dodecyl sulfate (SDS) [2]. The methodology is built upon several key principles:
- Protein Denaturation and Uniform Charge: SDS denatures proteins and binds to polypeptide chains in a constant weight ratio (approximately 1.4 g SDS per 1 g protein), conferring a uniform negative charge density that masks proteins' intrinsic charges [2].
- Molecular Sieving: Polyacrylamide gels create a porous matrix through which proteins migrate when an electric field is applied. The polymerization reaction between acrylamide and bisacrylamide, catalyzed by ammonium persulfate (APS) and TEMED, determines the gel's pore size and sieving properties [2].
- Discontinuous Buffer System: Most SDS-PAGE implementations use a stacking gel with larger pores and different pH to concentrate proteins into a sharp band before they enter the resolving gel, enhancing resolution [2].
A typical protocol involves preparing a polyacrylamide gel (e.g., 10-12% for standard separations), loading samples mixed with SDS-containing buffer, and applying constant current until the dye front approaches the gel bottom. Proteins are then visualized using stains such as Coomassie Brilliant Blue, silver stain, or fluorescent dyes, with detection limits ranging from 100 ng (Coomassie) to below 1 ng (silver stain) [5].
2D-PAGE Fundamentals
Two-dimensional PAGE separates proteins based on two independent physicochemical properties: isoelectric point (pI) in the first dimension and molecular weight in the second dimension [5]. The technique involves two distinct separation steps:
- First Dimension - Isoelectric Focusing (IEF): Proteins are separated according to their pI using immobilized pH gradient (IPG) strips that establish a stable pH gradient. Proteins migrate through the gradient until they reach the pH position where their net charge is zero (isoelectric point) [5].
- Second Dimension - SDS-PAGE: The IPG strip is equilibrated with SDS-containing buffer, then placed on a polyacrylamide gel where proteins are separated by molecular weight perpendicular to the first separation [5] [4].
This orthogonal separation approach provides dramatically enhanced resolution compared to 1D methods. Where 1D-SDS-PAGE might separate 100-200 proteins into discrete bands, 2D-PAGE can resolve thousands of proteins into individual spots [5] [1]. The method is particularly valuable for detecting post-translational modifications, which often cause predictable shifts in protein pI and molecular weight, manifesting as specific spot patterns on the 2D gel [5].
Table 1: Key Differences in Fundamental Principles Between 1D and 2D PAGE
| Parameter | 1D SDS-PAGE | 2D-PAGE |
|---|---|---|
| Separation Principles | Molecular weight | Isoelectric point (pI) then molecular weight |
| Resolution | ~100-200 protein bands | ~1000-5000 protein spots |
| Information Obtained | Molecular weight estimation, abundance | pI, molecular weight, PTM detection |
| Typical Run Time | 1-2 hours | 1-2 days |
| Sample Throughput | High (multiple samples per gel) | Low (typically one sample per gel) |
Evolution to High-Sensitivity Applications
Both 1D and 2D approaches have evolved to interface with mass spectrometry, enabling protein identification and characterization. Following electrophoretic separation, proteins of interest are excised, digested with trypsin, and the resulting peptides analyzed by LC-MS/MS [8] [9]. This electrophoretic-MS hybrid approach has been successfully applied in various proteomic applications, from profiling core proteomes of human cell lines [9] to metaproteomic analysis of microbial communities [8].
Performance Comparison and Experimental Data
Resolution and Proteome Coverage
The fundamental distinction between 1D and 2D PAGE lies in their separation resolution and consequent proteome coverage. While 1D-SDS-PAGE typically resolves 100-200 distinguishable protein bands, 2D-PAGE can resolve thousands of protein spots from a single sample. O'Farrell's original high-resolution 2D method demonstrated the capacity to resolve up to 5,000 proteins in a single gel, distributed across two dimensions [5]. This represents approximately a 25-50 fold increase in resolution compared to 1D approaches.
In practical applications, a study profiling core proteomes of human cell lines using 1D-PAGE combined with LC-MS/MS identified up to 1,785 non-redundant proteins from a single cell line when systematically fractionating the gel lane into 48 slices [9]. This gridding approach enhances the dynamic range of protein identification to approximately 1:2000 [9]. Nevertheless, 2D-PAGE maintains an advantage for visualizing intact proteoforms, including post-translationally modified variants that appear as distinct spots with characteristic shifts in pI and/or molecular weight [5] [7].
Dynamic Range and Sensitivity
The dynamic range of protein detection represents a critical performance parameter in proteomic analyses. Autoradiographic detection of proteins labeled with radioactive amino acids (e.g., ³⁵S-methionine) provides exceptional sensitivity, covering intensity differences over six orders of magnitude with multiple exposures [3]. With pre-enrichment strategies, sensitivities reaching one part in 10⁹ have been documented [3].
Modern staining methods offer varying dynamic ranges:
- Coomassie Brilliant Blue: Detection limit ~100 ng, narrow dynamic range [5]
- Colloidal Coomassie: Detection limit ~10 ng [5]
- Silver Staining: Detection limit <1 ng [5]
- Fluorescent Dyes (SYPRO Ruby, Deep Purple): Detection limit ~1 ng, wider dynamic range [5]
A significant challenge for 2D-PAGE is that highly abundant proteins can mask less abundant ones, limiting the effective dynamic range. This can be partially mitigated by depletion of abundant proteins (e.g., albumin), fractionation approaches, or loading larger amounts of protein on larger format gels, though the latter may produce overcrowded images with poorly separated spots [5].
Reproducibility and Throughput
1D-SDS-PAGE generally offers higher reproducibility and throughput compared to 2D approaches. The simplicity of the 1D method, standardized protocols, and the ability to run multiple samples in parallel on the same gel contribute to its robust reproducibility [2]. In contrast, 2D-PAGE has historically faced reproducibility challenges, particularly with carrier ampholyte-based pH gradients that exhibited batch-to-batch variability and cathodic drift [5].
The introduction of immobilized pH gradients (IPG) significantly improved 2D-PAGE reproducibility by providing stable, predefined pH gradients [5]. A multi-laboratory study demonstrated that 70-93% of protein spots showed coefficient of variation (CVs) less than 20% within the same laboratory, while 72% of spots had CVs below 20% across different laboratories [5]. Further advancements such as 2D-DIGE (Differential In-Gel Electrophoresis), which uses multiplexed fluorescent dyes to label multiple samples run on the same gel, have additionally addressed gel-to-gel variability by enabling internal standardization [5].
Table 2: Performance Comparison Based on Experimental Data
| Performance Metric | 1D SDS-PAGE | 2D-PAGE |
|---|---|---|
| Proteins Resolved | ~100-200 bands | ~1000-5000 spots [5] |
| Identification Dynamic Range | ~1:2000 (with fractionation) [9] | Limited by abundant protein masking [5] |
| Reproducibility | High (standardized protocols) | Moderate (improved with IPG strips) [5] |
| Sample Throughput | High (multiple samples/gel) | Low (1-2 samples/gel) |
| PTM Detection | Limited | Excellent (characteristic shifts) [5] |
| Hands-on Time | 1-2 hours | 2-3 days [5] |
Applications in Proteomic Research
Established Applications and Use Cases
Both 1D and 2D PAGE maintain important roles in contemporary proteomic research, with each technique offering distinct advantages for specific applications:
1D SDS-PAGE is particularly suitable for:
- Rapid protein purity assessment and quantification [2]
- Western blotting analysis of specific targets [2]
- Molecular weight determination [2]
- Quality control in protein purification [2]
- Preparative separation for downstream mass spectrometry analysis [9]
2D-PAGE excels in applications requiring:
- Comprehensive proteome mapping [5] [7]
- Detection of post-translational modifications and protein isoforms [5] [7]
- Differential expression analysis across experimental conditions [5]
- Biomarker discovery in clinical samples [5] [6]
- Analysis of protein complexes and interactions [1]
The unique strength of 2D-PAGE lies in its ability to provide direct visual evidence of proteoforms—different molecular forms in which the protein product of a single gene can be found [6]. This includes changes due to genetic variations, alternative splicing, and post-translational modifications, which frequently manifest as specific spot patterns on 2D gels [5] [7].
Integration with Modern Proteomic Workflows
While gel-based approaches once dominated proteomics, they now typically function as components within integrated workflows that combine separation techniques with mass spectrometry. GeLC-MS/MS, which couples 1D-SDS-PAGE fractionation with liquid chromatography-tandem mass spectrometry, has proven particularly powerful for in-depth proteome analysis [8] [9].
In metaproteomic analyses of complex microbial communities, GeLC-MS/MS has demonstrated performance comparable to two-dimensional liquid chromatography approaches, albeit with increased sample preparation time [8]. Similarly, studies profiling human cell line proteomes have identified up to 38 proteins from a single gel band in one LC-MS/MS experiment, demonstrating the efficiency of this integrated approach [9].
For 2D-PAGE, the standard workflow typically involves spot excision, in-gel digestion, and MS analysis for protein identification. This combination has been fundamental to numerous biomarker discovery pipelines, particularly in cancer research [6] and the study of proteinopathies such as Alzheimer's and Parkinson's diseases [6].
The Scientist's Toolkit: Essential Research Reagents
Successful implementation of electrophoretic methods requires specific reagents and materials optimized for each technique. The following table details essential components for both 1D and 2D PAGE workflows:
Table 3: Essential Research Reagents for Gel Electrophoresis
| Reagent/Material | Function | Application |
|---|---|---|
| Acrylamide/Bis-acrylamide | Forms cross-linked polyacrylamide gel matrix | Both 1D and 2D PAGE [2] |
| SDS (Sodium Dodecyl Sulfate) | Denatures proteins and confers uniform charge | 1D SDS-PAGE [2] |
| IPG Strips | Establish stable pH gradient for first dimension separation | 2D-PAGE (IEF) [5] |
| Urea and Thiourea | Chaotropic agents for protein solubilization | 2D-PAGE sample preparation [5] |
| CHAPS | Zwitterionic detergent for protein solubilization | 2D-PAGE sample preparation [5] |
| DTT or DTE | Reducing agent for disulfide bond cleavage | Both 1D and 2D PAGE [2] [5] |
| Ampholytes | Generate pH gradient for IEF | Traditional 2D-PAGE [5] |
| SYPRO Ruby/Silver Stain | High-sensitivity protein detection | Both (especially 2D-PAGE) [5] |
| Coomassie Brilliant Blue | Routine protein staining | Both (especially 1D-PAGE) [5] |
Current Status and Emerging Directions
Despite predictions of its obsolescence in the face of advanced liquid chromatography-mass spectrometry approaches, gel electrophoresis maintains relevance in modern proteomics. As one review notes: "Gel electrophoresis is still a valid technique, with its own particularities, strengths, and weaknesses, 'irreplaceable' in top-down experiments directed at investigating protein species, loci and allelic variants, and isoforms" [1].
The Human Proteome Project and related initiatives continue to employ 2D-PAGE among other separation methods in their mission to characterize the entire human proteome [6]. As of 2022, the Human Proteome Project had identified 93.2% of the predicted human proteome (18,407 of 19,750 proteins) [6]. Meanwhile, emerging artificial intelligence tools like AlphaFold for protein structure prediction complement rather than replace experimental separation techniques [6].
Recent methodological advances focus on addressing specific limitations of traditional gel-based approaches. 2D-DIGE improves quantification accuracy and statistical confidence through multiplexed fluorescent labeling [5]. Blue native PAGE enables analysis of membrane proteins and protein complexes under non-denaturing conditions [1] [7]. Zymography techniques combine electrophoretic separation with functional enzyme activity assays [7].
Each method occupies a specific niche: 1D-PAGE offers simplicity, robustness and compatibility with high-throughput workflows, while 2D-PAGE provides unparalleled resolution for detecting proteoforms and modifications. Rather than competing technologies, they represent complementary tools within the proteomic arsenal, with selection dependent on experimental goals, sample characteristics, and analytical requirements. Their continued evolution and integration with mass spectrometry ensure that both 1D and 2D gel electrophoresis will remain fundamental components of proteomic research for the foreseeable future.
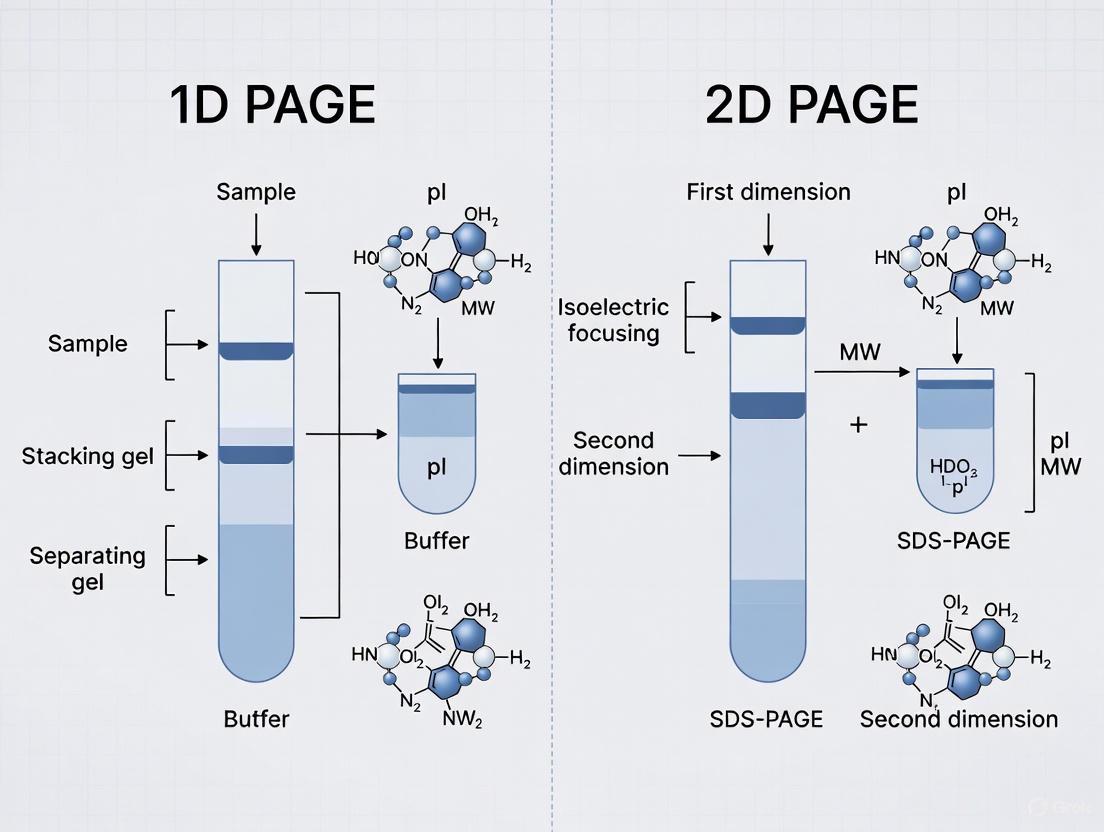
In the field of proteomic research, the separation and analysis of complex protein mixtures is a fundamental requirement. Polyacrylamide gel electrophoresis (PAGE) serves as a cornerstone technology for this purpose, with one-dimensional sodium dodecyl sulfate-polyacrylamide gel electrophoresis (1D SDS-PAGE) and two-dimensional polyacrylamide gel electrophoresis (2D-PAGE) representing two primary approaches. 1D SDS-PAGE separates proteins primarily by molecular weight, providing a simplified, rapid analysis suitable for comparative screening. In contrast, 2D-PAGE separates proteins based on two distinct properties: isoelectric point in the first dimension and molecular weight in the second, offering superior resolution for analyzing complex protein mixtures. Understanding the principles, capabilities, and limitations of each method is essential for selecting the appropriate technique for specific research objectives in drug development and basic biological research.
The principle of 1D SDS-PAGE relies on the powerful anionic detergent sodium dodecyl sulfate (SDS), which denatures proteins and confers upon them a uniform negative charge. When subjected to an electric field within a polyacrylamide gel matrix, the protein-SDS complexes migrate toward the anode at rates inversely proportional to their molecular weights, with smaller proteins moving faster through the gel matrix than larger ones. This molecular sieving effect allows researchers to separate proteins based almost exclusively on polypeptide chain length, providing a relatively straightforward method for molecular weight estimation and comparative analysis. The technique's simplicity, speed, and reliability have established it as one of the most widely used methods in protein biology.
Fundamental Principles of 1D SDS-PAGE
Protein Denaturation and Charge Uniformity
The resolving power of 1D SDS-PAGE stems from the dual action of SDS and reducing agents on protein structure. SDS is a strong anionic detergent that binds to the hydrophobic regions of proteins, disrupting hydrogen bonds and van der Waals forces that maintain secondary and tertiary structures. Approximately 1.4 grams of SDS binds to 1 gram of polypeptide, creating a uniform negative charge per unit mass that overwhelms the protein's intrinsic charge. Simultaneously, reducing agents such as β-mercaptoethanol or dithiothreitol (DTT) cleave disulfide bonds, ensuring complete unfolding of protein subunits. This treatment transforms diverse protein structures into linear SDS-polypeptide complexes with similar charge densities and shapes, enabling separation based primarily on molecular size rather than charge or structural differences [10] [11] [2].
Molecular Sieving in Polyacrylamide Gels
The polyacrylamide gel matrix serves as a molecular sieve that differentially retards the migration of proteins based on their size. Polyacrylamide gels are formed through the polymerization of acrylamide monomers cross-linked by N,N'-methylenebisacrylamide. The porosity of the gel is determined by the concentration of both components; higher percentages of acrylamide create smaller pores, providing better resolution for lower molecular weight proteins, while lower percentages create larger pores suitable for separating higher molecular weight proteins. During electrophoresis, the gel's mesh-like structure creates frictional resistance that affects protein migration—smaller proteins navigate the pores more easily and migrate faster, while larger proteins encounter greater resistance and migrate more slowly. This sieving effect allows researchers to separate proteins ranging from approximately 5 to 250 kDa by selecting appropriate gel concentrations [11] [2].
Discontinuous Buffer System and Stacking
A critical innovation in standard SDS-PAGE protocols is the use of a discontinuous buffer system that incorporates both stacking and resolving gels. The stacking gel, with a lower acrylamide concentration (typically 4-5%) and different pH, serves to concentrate proteins into a sharp band before they enter the resolving gel. This concentration occurs due to differences in electrophoretic mobility between chloride ions (from the gel buffer), glycine ions (from the running buffer), and protein-SDS complexes. The phenomenon, known as isotachophoresis, results in the formation of a sharp protein stack that enters the resolving gel simultaneously, dramatically improving resolution. The resolving gel then separates the proteins based on size, with the higher acrylamide concentration (typically 8-16%) providing the appropriate pore size for molecular sieving [11].
Experimental Protocol for 1D SDS-PAGE
Gel Preparation and Casting
The electrophoresis process begins with the preparation of polyacrylamide gels, which can be precast or laboratory-cast. For laboratory-cast gels, the protocol involves:
- Glass plate assembly: Clean glass plates and spacers are assembled into a casting cassette using binder clips to prevent leakage [11].
- Resolving gel preparation and casting: The resolving gel solution is prepared by mixing appropriate volumes of acrylamide/bis-acrylamide solution, Tris-HCl buffer (pH 8.8), SDS, ammonium persulfate (APS, the polymerization catalyst), and TEMED (the polymerization accelerator). The solution is poured into the cassette and overlaid with water or alcohol to prevent oxygen inhibition of polymerization and create a flat gel surface. Polymerization typically requires 20-30 minutes [11] [2].
- Stacking gel preparation and casting: After polymerization, the overlay is removed, and the stacking gel solution (with lower acrylamide concentration and Tris-HCl buffer at pH 6.8) is poured on top of the resolving gel. A comb is immediately inserted to create sample wells and allowed to polymerize for 20-30 minutes [11].
Sample Preparation
Proper sample preparation is crucial for successful SDS-PAGE separation:
- Sample buffer formulation: Protein samples are mixed with SDS-PAGE sample buffer, typically containing Tris-HCl (pH 6.8), SDS, glycerol, bromophenol blue tracking dye, and a reducing agent such as β-mercaptoethanol or DTT [11].
- Denaturation: The protein-sample buffer mixtures are heated at 70-100°C for 3-10 minutes to ensure complete denaturation and SDS binding. Heating at 100°C for 3 minutes is commonly employed for efficient denaturation [11] [2].
- Centrifugation: After heating, samples are centrifuged at 15,000 rpm for 1 minute to pellet any insoluble material, and the supernatant is used for electrophoresis [11].
Electrophoresis Conditions
The prepared gel is mounted in an electrophoresis chamber filled with running buffer (typically Tris-glycine containing 0.1% SDS):
- Sample loading: Denatured protein samples and molecular weight markers are loaded into the wells using a micropipette [11] [2].
- Electrophoresis run: The power supply is turned on, and electrophoresis is performed at constant voltage (typically 150-200V for mini-gels) until the dye front reaches the bottom of the gel (approximately 45-60 minutes for a 60mm gel) [12] [11].
- Post-electrophoresis processing: After separation, gels can be stained with Coomassie Blue, silver stain, or other detection methods, or used for western blotting or mass spectrometry analysis [11] [2].
Comparative Performance Data: 1D SDS-PAGE vs. 2D-PAGE
Identification Capacity and Quantitative Analysis
Multiple studies have directly compared the performance of 1D and 2D separation methods in proteomic analyses. The table below summarizes key quantitative comparisons:
Table 1: Comparative Performance of 1D SDS-PAGE and 2D-PAGE in Proteomic Analysis
| Performance Metric | 1D SDS-PAGE | 2D-PAGE | Experimental Context |
|---|---|---|---|
| Protein Identifications | 2,552 proteins | 4,323 proteins | Analysis of human bronchial smooth muscle cell supernatant fraction [13] |
| Dynamic Range | 3.5% to 2×10⁻⁴% abundance | 3.6% to 1×10⁻⁵% abundance | Same study as above, demonstrating 2D-PAGE's enhanced sensitivity [13] |
| Membrane Protein Analysis | Effective for precipitate fraction | Limited for insoluble proteins | Complementary approaches for different cellular fractions [13] |
| Metaproteomic Capacity | Comparable to 2D-LC with faster runtime | >10,000 protein groups with 2D-LC-MS | Mock community microbial analysis [8] |
| Comparative Quantitation | Advantageous for comparing differently treated samples | Limited by gel-to-gel variability | Direct comparison of quantitative performance [13] |
Practical Considerations for Method Selection
Beyond identification numbers, several practical factors influence method selection for proteomic studies:
- Sample throughput: 1D SDS-PAGE offers significantly faster analysis time, with typical run times of 45-60 minutes compared to several hours or overnight runs for 2D-PAGE [12] [2].
- Technical expertise requirement: 1D SDS-PAGE is technically more accessible with a simpler workflow, while 2D-PAGE requires specialized expertise, particularly for the isoelectric focusing step [14] [2].
- Compatibility with downstream applications: Both methods interface well with mass spectrometry, but 1D SDS-PAGE offers advantages for western blot validation due to direct molecular weight correspondence [13] [15].
- Protein property limitations: 2D-PAGE has poor separation efficiency for highly hydrophobic proteins, particularly those with more than four transmembrane segments, whereas 1D SDS-PAGE effectively handles such proteins [14].
Methodological Variations and Recent Advances
Native SDS-PAGE for Functional Proteomics
A significant limitation of conventional SDS-PAGE is the complete denaturation of proteins, which destroys functional properties including enzymatic activity and non-covalently bound cofactors. To address this shortcoming, researchers have developed native SDS-PAGE (NSDS-PAGE), a modified approach that preserves certain functional characteristics while maintaining high resolution. In NSDS-PAGE, SDS and EDTA are removed from the sample buffer, the heating step is omitted, and SDS in the running buffer is reduced from 0.1% to 0.0375%. These modifications dramatically increase metal ion retention in metalloproteins from 26% to 98% compared to standard SDS-PAGE, with seven of nine model enzymes retaining activity after separation. This approach bridges the gap between fully denaturing SDS-PAGE and low-resolution native PAGE methods [12].
Gel-Free Proteomic Approaches
While gel-based methods remain fundamental in proteomics, gel-free liquid chromatography-mass spectrometry (LC-MS/MS) approaches have emerged as powerful alternatives:
- 1D-LC-MS/MS: Utilizes single-dimension liquid chromatography coupled to mass spectrometry, offering faster analysis times and easier setup. Advances in column technology, including very long columns (50-75 cm) with extended gradients (up to 12 hours), have significantly improved resolution [8].
- 2D-LC-MS/MS: Incorporates two orthogonal separation dimensions (typically strong cation exchange followed by reversed-phase chromatography) prior to MS analysis, enabling identification of >10,000 protein groups in metaproteomic studies [8].
- GeLC-MS/MS: An intermediate approach where proteins are first separated by 1D SDS-PAGE, the gel lane is cut into slices, and proteins in each slice are subjected to in-gel digestion and LC-MS/MS analysis. This method combines molecular weight fractionation with sophisticated MS analysis, yielding results comparable to 2D-LC approaches [8].
Table 2: Comparison of Proteomic Separation and Analysis Platforms
| Platform | Key Features | Typical Identifications | Advantages | Limitations |
|---|---|---|---|---|
| 1D SDS-PAGE | Separation by molecular weight | Varies with sample complexity | Simple, inexpensive, molecular weight information | Limited resolution for complex samples |
| 2D-PAGE | Separation by pI and molecular weight | 4,323 proteins (supernatant) [13] | High resolution, visual protein mapping | Technical complexity, limited for hydrophobic proteins |
| 1D-LC-MS/MS | Single-dimension peptide separation | Varies with gradient length | High throughput, automation | Limited peak capacity for complex samples |
| 2D-LC-MS/MS | Two-dimensional peptide separation | >10,000 protein groups [8] | High identification numbers | Longer analysis times, complex instrumentation |
| GeLC-MS/MS | Gel pre-fractionation + LC-MS/MS | Comparable to 2D-LC approaches [8] | Combines molecular weight separation with MS sensitivity | Increased sample preparation time |
Essential Reagents and Research Solutions
Successful implementation of 1D SDS-PAGE requires specific reagents and materials, each serving a critical function in the separation process:
Table 3: Essential Research Reagents for 1D SDS-PAGE
| Reagent/Material | Function | Typical Composition/Specifications |
|---|---|---|
| SDS (Sodium Dodecyl Sulfate) | Denatures proteins and confers negative charge | 1.4g SDS per 1g protein; 0.1-0.2% in buffers [10] [2] |
| Acrylamide/Bis-acrylamide | Forms porous gel matrix for molecular sieving | 29:1 or 37.5:1 ratio of acrylamide to bis-acrylamide; 6-15% total concentration [11] [2] |
| APS and TEMED | Catalyzes acrylamide polymerization | 0.1% ammonium persulfate (APS) and 0.01-0.1% TEMED [2] |
| Tris Buffers | Maintains pH during electrophoresis | Stacking gel: Tris-HCl, pH 6.8; Resolving gel: Tris-HCl, pH 8.8; Running buffer: Tris-Glycine, pH ~8.3 [11] [2] |
| Reducing Agents | Cleaves disulfide bonds for complete unfolding | β-mercaptoethanol or DTT (50-100mM) in sample buffer [2] |
| Molecular Weight Markers | Provides size references for estimation | Pre-stained or unstained proteins of known molecular weight [11] [2] |
| Tracking Dye | Visualizes migration progress | Bromophenol Blue (0.001-0.01%) in sample buffer [11] |
Workflow Visualization
The following diagram illustrates the key procedural steps and decision points in the 1D SDS-PAGE workflow, highlighting its comparative simplicity against 2D-PAGE:
1D SDS-PAGE remains a fundamental technique in proteomic research, providing robust separation of proteins based on molecular weight with simplicity, reliability, and broad compatibility with downstream applications. While 2D-PAGE offers superior resolution for analyzing complex protein mixtures and can identify thousands more proteins in specific applications, the choice between these techniques depends heavily on research objectives, sample complexity, and practical considerations. For routine analysis, comparative quantitation, and membrane protein characterization, 1D SDS-PAGE delivers exceptional performance with significantly faster processing times. Methodological innovations such as native SDS-PAGE and integrated GeLC-MS/MS approaches continue to expand the applications of this foundational technology, ensuring its ongoing relevance in proteomic research and drug development. The complementary strengths of 1D and 2D separation methods underscore the importance of strategic method selection based on specific research requirements rather than a universal superiority of either approach.
The analysis of complex protein mixtures requires powerful separation techniques that can resolve thousands of components simultaneously. Two-dimensional polyacrylamide gel electrophoresis (2D-PAGE) represents a foundational method in proteomics that employs orthogonal separation parameters to achieve high-resolution protein profiling. This technique separates proteins based on two independent physicochemical properties: isoelectric point (pI) in the first dimension and molecular mass in the second dimension [16] [2]. The orthogonal nature of this separation—using two unrelated protein characteristics—provides significantly enhanced resolution compared to one-dimensional methods, enabling researchers to distinguish between closely related protein species, including various post-translationally modified forms [17].
The pioneering work by Patrick H. O'Farrell in 1975 established 2D-PAGE as one of the most important high-resolution protein separation techniques of modern biochemistry [17]. For decades, it has served as a cornerstone technology in protein biochemistry and proteomics, allowing the simultaneous resolution of thousands of distinct protein species within the same gel system [16]. This article provides a comprehensive comparison between 1D-PAGE and 2D-PAGE methodologies, examining their relative performances, applications, and suitability for different proteomic research scenarios.
Fundamental Principles of 2D-PAGE
First Dimension: Isoelectric Focusing (IEF)
The first dimension of 2D-PAGE employs isoelectric focusing (IEF), which separates proteins according to their native isoelectric point (pI)—the specific pH at which a protein carries no net electrical charge [16] [2]. During IEF, proteins are applied to an immobilized pH gradient (IPG) strip and an electrical field is applied. Each protein migrates through the pH gradient until it reaches the position where the ambient pH matches its pI, at which point its net charge becomes zero and migration ceases [16]. This process results in proteins being focused into sharp bands at their respective pI positions, effectively separating the complex protein mixture based on charge differences.
The implementation of IEF requires specialized buffer systems or ampholyte mixtures to establish stable pH gradients along the separation strip. Ready-made IPG strips are commercially available in various pH ranges (broad for initial surveys, narrow for enhanced resolution of specific protein groups), providing researchers with flexible options tailored to their specific separation needs [2]. The introduction of IPG strips has significantly improved the reproducibility of 2D-PAGE compared to earlier carrier ampholyte methods, addressing one of the historical limitations of the technique.
Second Dimension: SDS-PAGE
Following IEF, the second dimension separation is performed using sodium dodecyl sulfate polyacrylamide gel electrophoresis (SDS-PAGE), which resolves proteins according to their molecular mass [16] [2]. Before this step, the IPG strip is equilibrated in a buffer containing SDS, an anionic detergent that denatures proteins and confers a uniform negative charge proportional to polypeptide length [2]. The SDS-protein complexes are then applied to a polyacrylamide gel and separated under an electrical field based on molecular size, with smaller proteins migrating faster through the gel matrix than larger proteins due to the sieving effect of the polyacrylamide network [2].
The pore size of the polyacrylamide gel can be optimized for specific molecular weight ranges by adjusting the acrylamide concentration. Lower percentage gels (e.g., 7-10%) provide larger pores suitable for resolving high molecular weight proteins, while higher percentage gels (e.g., 12-15%) offer smaller pores ideal for separating lower molecular weight proteins [2]. Gradient gels, which progressively increase in acrylamide concentration from top to bottom, extend the separation range and allow resolution of proteins with diverse molecular masses within a single gel [2].
Protein Detection and Analysis
Following two-dimensional separation, proteins appear as distinct spots distributed across the gel surface rather than the linear bands characteristic of 1D-PAGE. These protein spots are typically visualized using staining methods such as Colloidal Coomassie Blue, silver staining, or more sensitive fluorescent dyes including SYPRO Ruby and Deep Purple [16] [17]. The stained gels are then digitized using specialized scanners, and the resulting images are analyzed with software packages such as PDQuest or Melanie to quantify spot intensities and positions [16]. Protein spots of interest can be excised—manually or robotically—and subjected to enzymatic digestion (typically with trypsin) followed by mass spectrometric analysis for protein identification [16] [17].
Comparative Performance Analysis: 1D-PAGE vs. 2D-PAGE
Resolution and Proteome Coverage
The critical advantage of 2D-PAGE over its one-dimensional counterpart lies in its dramatically enhanced resolution for analyzing complex protein mixtures. While 1D-PAGE typically separates proteins into 100-200 discrete bands, 2D-PAGE can resolve thousands of distinct protein spots from a single sample [16] [17]. This orthogonal separation approach is particularly powerful for distinguishing protein isoforms and post-translationally modified species that may share similar molecular weights but differ in charge characteristics due to phosphorylation, glycosylation, or other modifications [17].
Experimental comparisons demonstrate clear differences in proteome coverage between the two techniques. In a study analyzing human bronchial smooth muscle cells (HBSMC), 1D SDS-PAGE combined with LC-MS/MS identified 2,552 proteins from the supernatant fraction, while nondenaturing 2D-PAGE with LC-MS/MS detected 4,323 proteins from the same fraction—approximately 70% more protein identifications [13]. The 2D approach also demonstrated a superior dynamic range, detecting proteins with percent abundance as low as 1×10⁻⁵% compared to 2×10⁻⁴% for the 1D method [13]. This enhanced sensitivity enables researchers to detect lower abundance proteins that might be obscured in 1D separations.
Technical Considerations and Limitations
Despite its superior resolution, 2D-PAGE presents several technical challenges not encountered with 1D methods. The technique is more labor-intensive, time-consuming, and requires greater technical expertise to achieve reproducible results [16]. Additionally, certain protein classes are notoriously difficult to analyze by standard 2D-PAGE, including membrane proteins, which tend to precipitate during IEF, and proteins at the extreme ends of the molecular weight or pI spectrum [16] [18].
1D-PAGE offers distinct advantages in terms of simplicity, speed, and quantitative analysis. The straightforward banding patterns generated by 1D separations are more amenable to densitometric quantification, making this method preferable for comparative expression analysis of specific protein targets [13]. Furthermore, 1D-PAGE demonstrates better compatibility with hydrophobic membrane proteins, as evidenced by the identification of 2,614 proteins from the insoluble precipitate fraction of HBSMC that could not be analyzed by nondenaturing 2D-PAGE [13].
Table 1: Performance Comparison of 1D-PAGE vs. 2D-PAGE
| Parameter | 1D-PAGE | 2D-PAGE | Experimental Basis |
|---|---|---|---|
| Proteins Identified | 2,552 proteins (supernatant) | 4,323 proteins (supernatant) | HBSMC analysis [13] |
| Detection Dynamic Range | 3.5% to 2×10⁻⁴% | 3.6% to 1×10⁻⁵% | HBSMC analysis [13] |
| Separation Basis | Molecular mass only | pI (charge) and molecular mass | Orthogonal separation [16] [2] |
| Handling of Membrane Proteins | 2,614 proteins identified from precipitate | Limited effectiveness for precipitate proteins | HBSMC fraction analysis [13] |
| Throughput | Higher, faster processing | Lower, more time-consuming | Method complexity [16] [18] |
| Information Content | Mass information only | Mass, pI, and modification information | Isoform separation capability [17] |
Research Applications and Method Selection
Applications in Skeletal Muscle Proteomics
The application of 2D-PAGE has played a pivotal role in advancing our understanding of skeletal muscle biochemistry and physiology. This technique has enabled researchers to study protein changes during myogenesis, muscle maturation, fiber type specification, physiological adaptations to exercise, disuse atrophy, and natural aging processes [17]. The high-resolution capability of 2D-PAGE has been instrumental in identifying and characterizing several thousand muscle-associated protein species, including contractile proteins of the acto-myosin apparatus, metabolic enzymes, signaling proteins, and molecular chaperones [17].
The technique has proven particularly valuable for creating comprehensive protein databases and mapping fiber-type specific proteomes. According to literature surveys, nearly 33,000 publications in the PubMed database contain the keyword "two-dimensional gel electrophoresis," with over 600 of these publications specifically focused on skeletal muscle applications [17]. The integration of MS-based proteomics with 2D-PAGE since approximately 2004 has significantly expanded these research capabilities, enabling systematic cataloging of the skeletal muscle proteome under various physiological and pathological conditions [17].
Guidelines for Method Selection
The choice between 1D-PAGE and 2D-PAGE should be guided by specific research objectives, sample characteristics, and technical considerations. 2D-PAGE is the preferred method for discovery-based studies aimed at comprehensive proteome profiling, detection of post-translational modifications, or analysis of complex samples where maximum resolution is required [16] [17]. This approach is particularly valuable when studying biological processes involving charge-based protein modifications or when reference maps exist for the biological system under investigation.
Conversely, 1D-PAGE represents a more suitable choice for targeted protein analysis, routine quality control assessments, and studies focused on specific proteins or simple mixtures [13]. Its simplicity, higher throughput, and better performance with membrane proteins make it ideal for comparative expression analysis and situations where laboratory resources or technical expertise may be limited [13]. When maximum proteome coverage is required, researchers often combine both techniques in complementary approaches, using 1D-PAGE for membrane fractions and 2D-PAGE for soluble fractions to achieve comprehensive analysis [13].
Table 2: Method Selection Guide Based on Research Objectives
| Research Goal | Recommended Method | Rationale | Supporting Evidence |
|---|---|---|---|
| Comprehensive Proteome Mapping | 2D-PAGE | Superior resolution for complex mixtures | Resolves thousands of protein spots [16] [17] |
| Targeted Protein Quantitation | 1D-PAGE | Simplified quantification of specific bands | Better for comparative expression studies [13] |
| Post-Translational Modification Detection | 2D-PAGE | Charge-based separation reveals modifications | Identifies protein isoforms [17] |
| Membrane Protein Analysis | 1D-PAGE | Better solubility and separation | Identified 2,614 precipitate proteins [13] |
| High-Throughput Screening | 1D-PAGE | Faster processing and simpler workflow | Less time-consuming and labor-intensive [16] |
| Limited Sample Material | 1D or 2D-LC-MS/MS | Higher sensitivity with minimal sample loss | Alternative to gel-based methods [18] |
Essential Research Reagents and Materials
Successful implementation of 2D-PAGE methodology requires specific reagents and materials optimized for the technique's unique requirements. The following table outlines key solutions and their functions in the 2D-PAGE workflow.
Table 3: Essential Research Reagent Solutions for 2D-PAGE
| Reagent/Material | Function | Application Notes |
|---|---|---|
| IPG Strips | First dimension separation by pI | Available in various pH ranges (broad 3-10, narrow 4-7, etc.) [2] |
| Carrier Ampholytes | Establish pH gradient for IEF | Required for carrier ampholyte-based IEF systems [16] |
| Lysis Buffer (SDT) | Protein extraction and solubilization | Contains 4% SDS, 100 mM Tris-HCl pH 7.6, 0.1 M DTT [18] |
| Equilibration Buffer | Prepare proteins for second dimension | Contains SDS–Tris buffer with reducing and alkylating agents [16] |
| Polyacrylamide Gel | Second dimension separation by mass | Gradient gels (e.g., 4-20%) extend separation range [2] |
| Staining Solutions | Protein detection and visualization | SYPRO Ruby, Coomassie Blue, or silver stain [16] [17] |
Advanced Technical Considerations
Methodological Variations and Innovations
Several methodological adaptations have been developed to address specific research needs and technical challenges associated with 2D-PAGE. Difference in Gel Electrophoresis (DIGE) represents a significant advancement that enables multiplexed analysis by labeling different protein samples with distinct fluorescent cyanide dyes prior to separation on the same 2D gel [16]. This approach minimizes gel-to-gel variation and improves quantification accuracy through the inclusion of an internal standard in each gel [16]. The application of DIGE has proven valuable in comparative proteomic studies, such as investigations of cellular defense mechanisms in eukaryotes exposed to metal treatments [16].
Alternative separation methodologies have also emerged to complement traditional 2D-PAGE. Two-dimensional liquid chromatography (2D-LC) coupled with mass spectrometry provides a gel-free approach for analyzing complex protein mixtures, offering advantages for automated, high-throughput applications and improved detection of hydrophobic proteins [18]. While 2D-LC methods can achieve higher overall protein identifications (up to >10,000 protein groups), they require specialized instrumentation and lack the direct visualization capabilities of gel-based methods [18]. The GeLC approach, which combines 1D SDS gel pre-fractionation with LC-MS/MS, represents another alternative that yields results comparable to 2D-LC while maintaining the protein fractionation benefits of gel-based separation [18].
Future Perspectives
While 2D-PAGE remains a valuable tool in proteomics, particularly for applications requiring protein visualization and isoform separation, its role in the proteomics workflow continues to evolve alongside advancing technologies. The technique is increasingly being complemented by gel-free approaches such as multidimensional liquid chromatography and sophisticated mass spectrometry methods that offer higher throughput and improved detection of certain protein classes [16] [18]. Nevertheless, 2D-PAGE maintains unique advantages for providing quantitative information on protein abundance, detecting specific post-translational modifications, and offering a visual representation of proteome status that remains intuitively accessible to researchers [17].
The future application of 2D-PAGE will likely focus on specialized applications that leverage its distinctive strengths, while increasingly sophisticated LC-MS/MS approaches address the growing demands of systems biology and large-scale proteomic profiling. However, the fundamental principle of orthogonal separation implemented in 2D-PAGE continues to influence next-generation proteomic technologies, ensuring that the conceptual legacy of this foundational methodology will endure even as specific technical implementations continue to advance.
Gel electrophoresis is a cornerstone technique in proteomic research, enabling the separation and analysis of complex protein mixtures. The two primary forms, 1D PAGE (One-Dimensional Polyacrylamide Gel Electrophoresis) and 2D PAGE (Two-Dimensional Polyacrylamide Gel Electrophoresis), serve complementary roles in the researcher's toolkit. 1D PAGE, particularly SDS-PAGE, separates proteins based on a single property—molecular mass—providing a straightforward analysis of protein size and abundance. In contrast, 2D PAGE separates proteins in two dimensions: first by their isoelectric point (pI) and second by molecular mass, offering superior resolution for analyzing complex protein samples. The performance of both techniques hinges on three fundamental technical components: the polyacrylamide matrix that forms the separation gel, the buffer systems that control the electrophoretic environment, and the detection methods that visualize the separated proteins. This guide objectively compares how these components are implemented in 1D versus 2D PAGE methodologies and examines their performance in proteomic analysis, providing researchers with the experimental data needed to select the appropriate technique for their specific applications.
Technical Comparison of 1D and 2D PAGE
Polyacrylamide Matrices
The polyacrylamide matrix forms the critical sieving environment that separates proteins during electrophoresis. In both 1D and 2D PAGE, this matrix is created through the polymerization of acrylamide and a cross-linker, typically bis-acrylamide, with the pore size determined by the total acrylamide concentration.
1D PAGE Matrices: SDS-PAGE employs a discontinuous gel system consisting of two distinct layers: a stacking gel and a resolving gel [19]. The stacking gel has a lower acrylamide concentration (typically 4-5%) and uses a different pH buffer to concentrate proteins into a sharp band before they enter the resolving gel, which has a higher acrylamide concentration (ranging from 8-18% depending on the target protein sizes) for separation based on molecular weight [20]. The Laemmli system, developed in 1970, remains the standard protocol for this method [20].
2D PAGE Matrices: For the second dimension, 2D PAGE typically uses SDS-PAGE gels similar to 1D systems [21]. However, the first dimension employs specialized matrices for isoelectric focusing (IEF). Two main systems are used: Immobilized pH Gradient (IPG) strips where the pH gradient is fixed within the polyacrylamide matrix, and carrier ampholyte-based gels such as those used in Non-Equilibrium pH Gradient Electrophoresis (NEPHGE) where the pH gradient forms during electrophoresis [21]. IPG strips offer superior reproducibility for acidic proteins, while NEPHGE-based methods demonstrate better performance for basic proteins (pI > 7) [21].
Table 1: Comparison of Polyacrylamide Matrix Configurations
| Parameter | 1D SDS-PAGE | 2D PAGE (First Dimension) | 2D PAGE (Second Dimension) |
|---|---|---|---|
| Matrix Type | Discontinuous polyacrylamide | IPG strips or carrier ampholyte gels | SDS-polyacrylamide gel |
| Separation Basis | Molecular weight | Isoelectric point (pI) | Molecular weight |
| Gradient Type | Single percentage or gradient gel | Linear or nonlinear pH gradient | Single percentage or gradient gel |
| Optimal Resolution | Proteins > 30 kDa | IPG: acidic proteins; NEPHGE: basic proteins | All protein sizes |
| Reproducibility | High | Moderate to high (IPG more reproducible) | High |
Buffer Systems
Buffer systems control the pH environment and electrophoretic conditions during protein separation, significantly impacting resolution and reliability.
1D PAGE Buffers: SDS-PAGE uses a discontinuous buffer system with Tris-HCl buffers at different pH values—pH 6.8 for the stacking gel and pH 8.8 for the resolving gel—with Tris-glycine-SDS (pH 8.3) as the running buffer [19] [20]. The inclusion of Sodium Dodecyl Sulfate (SDS) denatures proteins and confers a uniform negative charge, allowing separation based primarily on molecular mass rather than inherent charge [20]. For low molecular weight proteins (< 30 kDa), Tricine-SDS-PAGE is often preferred over the traditional glycine-based systems [20].
2D PAGE Buffers: Buffer requirements are more complex, with different systems for each dimension. The first dimension uses IEF buffers containing urea, thiourea, and nonionic or zwitterionic detergents like CHAPS to solubilize proteins while maintaining their charge characteristics for pI-based separation [21]. The second dimension uses SDS-based buffers similar to 1D PAGE after equilibration of the first-dimension gel or strip to transfer proteins to the second dimension [21]. Specialized buffer systems like MICS-BN-PAGE (Metal Ion Contaminant Sweeping-Blue Native-PAGE) can be employed for specific applications such as metalloprotein analysis, using compounds like CBB G-250 dye to recognize structural differences between metal-bound and metal-free protein forms [22].
Detection Methods
Detection methods visualize separated proteins after electrophoresis, with sensitivity and compatibility being key considerations.
General Protein Detection: Coomassie Brilliant Blue (CBB) staining is widely used for both 1D and 2D gels, offering a balance between sensitivity, cost, and compatibility with downstream mass spectrometry analysis [22]. CBB G-250, in particular, has demonstrated specific molecular recognition capabilities for metalloproteins in specialized PAGE applications [22]. Silver staining provides higher sensitivity but can be incompatible with MS analysis if not properly modified. Fluorescent stains like SYPRO Ruby offer broad linear dynamic ranges and MS compatibility, making them valuable for quantitative proteomics.
Specific Protein Detection: Western blotting (immunoblotting) following SDS-PAGE enables specific protein detection using antibodies [19]. This technique is particularly valuable for confirming protein identity, assessing post-translational modifications, and quantifying low-abundance proteins when combined with enrichment strategies like immunoprecipitation or wheat germ agglutinin (WGA) bead purification [19].
Table 2: Performance Comparison of 1D vs. 2D PAGE in Proteomic Analysis
| Performance Metric | 1D SDS-PAGE | Nondenaturing 2DE | Key Findings |
|---|---|---|---|
| Proteins Identified (Supernatant Fraction) | 2,552 proteins | 4,323 proteins | 2DE showed ~70% higher protein identification [23] |
| Percent Abundance Range | 3.5% to 2×10⁻⁴% | 3.6% to 1×10⁻⁵% | 2DE demonstrated higher sensitivity for low-abundance proteins [23] |
| Membrane Protein Analysis | Effective for precipitate fraction | Limited effectiveness | SDS-PAGE better for transmembrane proteins in precipitate fractions [23] |
| Protein Interaction Information | Limited | Advantageous | 2DE preserves protein-protein interactions under nondenaturing conditions [23] |
| Reproducibility | High | Moderate (depends on first-dimension method) | NEPHGE-based 2DE shows better reproducibility for basic proteins than IPG-based methods [21] |
Experimental Data and Workflows
Experimental Protocols
1D SDS-PAGE Protocol for Protein Separation [19] [20]:
- Sample Preparation: Lyse cells or tissues in an appropriate buffer (e.g., RIPA buffer for whole cell extracts) containing protease and phosphatase inhibitors to prevent degradation. Determine protein concentration using BCA or Bradford assay.
- Sample Denaturation: Mix protein samples with Laemmli buffer containing SDS and a reducing agent (DTT or β-mercaptoethanol). Heat at 90-95°C for 5 minutes to denature proteins.
- Gel Preparation: Prepare discontinuous polyacrylamide gels with a stacking gel (4-5% acrylamide, pH 6.8) and a resolving gel (8-18% acrylamide depending on protein size range, pH 8.8).
- Electrophoresis: Load samples and molecular weight markers. Run at constant voltage (typically 100-200V) using Tris-glycine-SDS running buffer (pH 8.3) until the dye front reaches the bottom of the gel.
- Detection: Stain with Coomassie Blue, silver stain, or transfer to membrane for Western blotting.
2D PAGE Protocol for Comprehensive Proteome Analysis [21]:
- First Dimension - Isoelectric Focusing:
- For IPG strips: Rehydrate dry IPG strips with sample in rehydration buffer containing urea, thiourea, CHAPS, DTT, and carrier ampholytes.
- Perform IEF using a stepwise voltage protocol (e.g., 200V for 20 min, 4500V for 1.5 hr, 4500V for 3 hr) until total volt-hours reach approximately 35,000.
- For NEPHGE: Load samples onto tube gels and run for shorter durations without reaching equilibrium to preserve basic protein separation.
- Gel Equilibration: Incubate IPG strips or tube gels in SDS equilibration buffer containing Tris-HCl (pH 8.8), urea, glycerol, SDS, and DTT.
- Second Dimension - SDS-PAGE:
- Place equilibrated IPG strips or tube gels on top of SDS-polyacrylamide gels.
- Embed with agarose solution to prevent air gaps.
- Perform electrophoresis using standard SDS-PAGE conditions.
- Detection and Analysis: Stain gels with appropriate detection method and analyze using 2D gel analysis software.
Performance Data from Comparative Studies
A direct comparative study of 1D SDS-PAGE versus nondenaturing 2DE for analyzing proteins from human bronchial smooth muscle cells revealed significant differences in performance [23]. When analyzing the supernatant fraction, 2DE identified 4,323 proteins with percent abundance ranging from 3.6% to 1×10⁻⁵%, while 1D SDS-PAGE identified 2,552 proteins with percent abundance ranging from 3.5% to 2×10⁻⁴% [23]. This demonstrates 2DE's superior sensitivity and dynamic range for soluble proteins. However, for precipitate fractions containing membrane proteins, SDS-PAGE showed particular advantages, effectively analyzing transmembrane proteins that were challenging for the 2DE method [23].
The study also highlighted the complementary nature of these techniques. Approximately 600 membrane proteins showed more than two-fold higher percent abundance in 2DE-MS compared to SDS-PAGE-MS, suggesting that the isoelectric focusing step in 2DE can enhance detection for certain protein classes [23]. Furthermore, nondenaturing 2DE preserved protein-protein interactions, providing biological insights beyond simple separation [23].
Research Reagent Solutions
Successful PAGE experiments require carefully selected reagents optimized for specific applications. The following table details essential solutions for both 1D and 2D PAGE workflows.
Table 3: Essential Research Reagents for PAGE Experiments
| Reagent Category | Specific Examples | Function in PAGE | Application Notes |
|---|---|---|---|
| Detergents | SDS, Triton X-100, CHAPS | Protein solubilization, denaturation | SDS for denaturing conditions; CHAPS for 2D PAGE first dimension [19] [24] |
| Reducing Agents | DTT, β-mercaptoethanol, TCEP | Disulfide bond reduction | Essential for protein denaturation in SDS-PAGE; fresh preparation recommended [19] |
| Protease Inhibitors | PMSF, Aprotinin, Leupeptin | Prevent protein degradation | Added to lysis buffers; specific inhibitors target different protease classes [19] |
| Buffers | Tris-HCl, HEPES, Laemmli buffer | pH control, protein stability | Discontinuous buffer system critical for SDS-PAGE resolution [20] |
| Staining Reagents | Coomassie Blue, SYPRO Ruby, Silver stain | Protein visualization | Coomassie offers balance of sensitivity and cost; fluorescent stains better for quantification [22] |
| Specialized Additives | Urea, Thiourea, Glycerol | Solubilization, stability | Urea/thiourea essential for 2D PAGE first dimension; glycerol for sample density [21] |
Application Scenarios and Selection Guidance
When to Choose 1D PAGE
1D SDS-PAGE is the preferred technique for:
- Routine protein analysis requiring molecular weight determination or purity assessment [20]
- Western blotting applications where specific protein detection is needed [19]
- Membrane protein analysis, particularly transmembrane proteins that may precipitate during IEF [23]
- High-throughput screening scenarios where simplicity, speed, and reproducibility are prioritized [25]
- Analysis of protein complexes under non-reducing versus reducing conditions to study disulfide bonds [20]
When to Choose 2D PAGE
2D PAGE is superior for:
- Comprehensive proteome mapping where maximum protein separation is required [23]
- Detection of post-translational modifications that alter protein charge, such as phosphorylation [21]
- Analysis of protein isoforms with similar molecular weights but different pI values [21]
- Studying protein-protein interactions under nondenaturing conditions [23]
- Biomarker discovery where entire proteome patterns must be compared across samples [22]
Technological Advancements and Future Directions
Recent advancements in PAGE technologies continue to enhance their capabilities for proteomic research:
Detergent Screening: Emerging research shows that combining proteomics datasets from different detergents (including anionic, cationic, and hybrid detergents) can increase the number of unique protein identities observed in bottom-up proteomics [24]. Hybrid detergents that fuse ionic and nonionic headgroups show particular promise for expanding the observable proteome.
Microfluidic Applications: Lab-on-chip systems and microfluidic technologies are transforming traditional electrophoresis, addressing efficiency and precision challenges while maintaining robustness [20]. These systems enable rapid analysis of small sample volumes with automated operation.
Computational Integration: Combining computational simulation with high-throughput screening enhances protein formulation development and stability assessment [26]. Tools like UNCLE (high-throughput protein stability analyzer) allow simultaneous analysis of multiple samples with minimal material requirements.
Specialized Detection Methods: Innovations like the HAC-2D MICS-BN-PAGE methodology enable selective isolation and identification of metalloproteins based on differential migration of holo- and apo-forms [22]. This addresses previous challenges with metal dissociation and contamination in metalloprotein analysis.
These developments suggest a future where PAGE technologies become increasingly integrated with complementary analytical methods, computational prediction tools, and automated platforms to accelerate proteomic research and drug development.
The Role of Electrophoresis in Modern Proteomics Workflows
Protein electrophoresis is a foundational laboratory technique in which charged protein molecules are transported through a solvent by an electrical field, serving as a simple, rapid, and sensitive analytical tool for separating proteins and nucleic acids [2]. At any pH other than their isoelectric point (pI), biological molecules carry a net charge and will migrate at a rate proportional to their charge density. Their mobility is influenced by several factors: field strength, net charge, size and shape, ionic strength, and the properties of the matrix through which they migrate [2]. In modern proteomics, which aims to characterize the entire protein complement of a cell, tissue, or organism, electrophoresis remains indispensable for protein separation, fractionation, and analysis prior to downstream characterization by mass spectrometry [17] [5].
Polyacrylamide and agarose are the two support matrices most commonly used in electrophoresis, both serving as porous media that behave like molecular sieves [2]. Agarose, with its large pore size, is suitable for separating nucleic acids and large protein complexes, while polyacrylamide's smaller pore size makes it ideal for separating most proteins and smaller nucleic acids [2]. The polyacrylamide matrix is created by mixing acrylamide with bisacrylamide to form a crosslinked polymer network when the polymerizing agent ammonium persulfate (APS) is added, with TEMED (N,N,N',N'-tetramethylenediamine) catalyzing the polymerization reaction [2]. The pore size and rigidity of the final gel matrix—critical factors affecting the range of separable protein sizes—are determined by the ratio of bisacrylamide to acrylamide and the total concentration of both components [2].
This article focuses on the comparison between one-dimensional polyacrylamide gel electrophoresis (1D PAGE) and two-dimensional polyacrylamide gel electrophoresis (2D PAGE), examining their respective roles, performance characteristics, and applications in contemporary proteomics research. As proteomics continues to advance our understanding of cellular functions at the molecular level, the choice between these electrophoretic techniques significantly impacts the depth and breadth of proteome coverage, the quality of separations, and the ultimate biological insights gained from proteomic studies.
Fundamental Principles of 1D and 2D PAGE
1D SDS-PAGE: Separation by Molecular Weight
Sodium dodecyl sulfate polyacrylamide gel electrophoresis (SDS-PAGE) is the most widely used electrophoresis technique for protein analysis [2]. In this denaturing method, the ionic detergent SDS binds to proteins in a constant weight ratio (approximately 1.4 g SDS per 1 g polypeptide), denaturing them and conferring a uniform negative charge [2]. This process neutralizes the proteins' intrinsic charges, resulting in SDS-polypeptide complexes with essentially identical charge densities and shapes. Consequently, proteins migrate through the gel strictly according to polypeptide size with minimal effect from compositional differences, with smaller mass proteins moving more rapidly through the gel matrix than larger ones [2].
The simplicity, speed, and minimal protein requirements (microgram quantities) of SDS-PAGE have made it the primary method for determining polypeptide molecular mass [2]. The technique utilizes a discontinuous buffer system with a stacking gel that concentrates proteins into a tight band before they enter the resolving gel, thereby enhancing resolution [2]. Protein separation occurs in a single dimension, with molecular weight estimation achieved by comparing migration distances to protein standards of known mass run alongside samples [2].
Native PAGE: Separation by Charge and Size
In contrast to denaturing SDS-PAGE, native PAGE (nondenaturing PAGE) separates proteins according to their net charge, size, and shape while maintaining their native structure [2]. Without denaturants, proteins carry their intrinsic charges and migrate at rates proportional to their charge density in alkaline running buffers, while simultaneously experiencing the sieving effect of the gel matrix according to their size and three-dimensional structure [2]. This technique preserves subunit interactions within multimeric proteins, providing information about quaternary structure, and often maintains enzymatic activity following separation, enabling preparation of purified, functional proteins [2].
2D PAGE: Orthogonal Separation by pI and Molecular Weight
Two-dimensional polyacrylamide gel electrophoresis (2D PAGE) represents a high-resolution orthogonal approach that separates proteins based on two independent physicochemical properties: isoelectric point (pI) in the first dimension and molecular weight in the second dimension [2] [5]. This method, pioneered by O'Farrell in 1975, can resolve thousands of distinct protein species in a single gel, providing exceptional separation power for complex protein mixtures [17] [5].
The first dimension employs isoelectric focusing (IEF), where proteins migrate through a pH gradient until they reach the position where their net charge is zero (their pI) [2] [5]. Modern 2D PAGE typically uses immobilized pH gradient (IPG) strips, which provide superior reproducibility compared to earlier carrier ampholyte-based systems [5]. The second dimension then separates these focused proteins by mass using standard SDS-PAGE, with the IPG strip physically connected to an SDS-polyacrylamide gel [2] [5]. The result is a two-dimensional protein map where individual proteins appear as distinct spots rather than bands, with their position indicating both pI and molecular weight [5].
Comparative Performance Analysis
Resolution and Proteome Coverage
The fundamental distinction between 1D and 2D PAGE lies in their separation resolution and consequent ability to resolve complex protein mixtures. While 1D SDS-PAGE separates proteins primarily by molecular weight, 2D PAGE employs orthogonal separation principles (pI and MW) that provide significantly higher resolution [5] [4]. This enhanced resolution enables 2D PAGE to separate thousands of proteins in a single gel, making it particularly valuable for comprehensive proteome analysis [17].
Experimental comparisons demonstrate substantial differences in proteome coverage between the two techniques. A study analyzing human bronchial smooth muscle cells (HBSMC) found that 1D SDS-PAGE coupled with LC-MS/MS identified 2,552 proteins from the supernatant fraction, while nondenaturing 2D PAGE with LC-MS/MS identified 4,323 proteins from the same fraction—approximately 70% more protein identifications [13]. This increased sensitivity in 2D PAGE was reflected in the percent abundance ranges of detected proteins: 3.5% to 2×10⁻⁴% for SDS-PAGE versus 3.6% to 1×10⁻⁵% for 2D PAGE, indicating better detection of low-abundance proteins with the 2D approach [13].
The metaproteomics field, which analyzes protein expression in microbial communities, faces exceptional challenges due to sample complexity. Research comparing separation methods for metaproteomics found that while 1D-LC approaches (often coupled with SDS-PAGE pre-fractionation) are faster and easier to set up, 2D-LC approaches (analogous to 2D PAGE in separation logic) enable higher overall identifications, with up to >10,000 protein groups identified in some 2D configurations [8]. Notably, the GeLC workflow (SDS-PAGE pre-fractionation followed by LC-MS/MS) yielded results comparable to 2D-LC approaches, though with significantly increased sample preparation time [8].
Quantitative Performance and Reproducibility
The quantitative capabilities of 1D and 2D PAGE differ substantially in their applications and reliability. SDS-PAGE excels in comparative quantification between samples, with the intensity of protein bands providing reliable relative abundance measurements when proper controls are implemented [13]. This makes 1D PAGE particularly suitable for targeted comparative studies where specific protein changes are monitored across multiple conditions.
In contrast, 2D PAGE provides comprehensive quantitative information across the entire separated proteome, with spot intensities reflecting relative protein abundances [5]. However, traditional 2D PAGE has faced challenges with reproducibility due to gel-to-gel variability, though methodological advances have substantially improved this limitation [5]. The introduction of two-dimensional difference gel electrophoresis (2D-DIGE), which uses multiplexed fluorescent dyes to label multiple protein samples run on the same gel, has been particularly effective in addressing variability concerns by enabling internal standardization and more accurate quantification [5].
Recent multi-laboratory studies have demonstrated significantly improved reproducibility for 2D PAGE, with 70-93% of spots showing coefficients of variation (CVs) less than 20% within the same laboratory, and 72% of spots maintaining CVs below 20% across different laboratories [5]. This level of reproducibility makes 2D PAGE suitable for many quantitative proteomic applications, though it still requires careful technical execution.
Table 1: Performance Comparison of 1D PAGE vs. 2D PAGE
| Parameter | 1D SDS-PAGE | 2D PAGE | Experimental Evidence |
|---|---|---|---|
| Proteins Identified | 2,552 proteins (HBSMC supernatant) [13] | 4,323 proteins (HBSMC supernatant) [13] | Analysis of human bronchial smooth muscle cells |
| Detection Dynamic Range | 3.5% to 2×10⁻⁴% abundance [13] | 3.6% to 1×10⁻⁵% abundance [13] | Percent abundance range in HBSMC analysis |
| Separation Basis | Molecular weight (denaturing) or size/charge (native) [2] | pI (1st dimension) and molecular weight (2nd dimension) [2] [5] | Fundamental separation principles |
| Resolution | Low to moderate [4] | High [5] [4] | Ability to resolve complex mixtures |
| Reproducibility | High for molecular weight determination [2] | Moderate to high (70-93% of spots with CV <20%) [5] | Multi-laboratory reproducibility study |
| Sample Throughput | High (rapid analysis) [2] [8] | Low (labor-intensive) [5] | Methodological comparisons |
| Cost | Low [4] | High [4] | Resource requirements |
Protein Characterization Capabilities
Beyond separation and quantification, the two electrophoretic techniques offer complementary capabilities for protein characterization. SDS-PAGE provides reliable molecular weight estimation and is excellent for analyzing protein purity, monitoring purification processes, and assessing protein integrity [2] [27]. When combined with western blotting, it enables specific protein detection and characterization in complex mixtures.
2D PAGE provides significantly more comprehensive protein characterization, enabling direct visualization of protein isoforms and post-translational modifications (PTMs) that alter protein charge or mass [17] [5]. These modifications appear as characteristic spot patterns—horizontal trains for charge variants (e.g., phosphorylation, deamidation) and vertical shifts for mass changes (e.g., truncations, degradations) [5]. This unique capability has made 2D PAGE invaluable for studying PTM dynamics in cellular processes, disease states, and physiological adaptations.
The analysis of skeletal muscle proteins exemplifies the power of 2D PAGE in characterizing complex proteome dynamics. Studies of muscle fiber type specification, exercise-induced adaptations, and muscle aging have leveraged 2D PAGE to identify changes in numerous protein isoforms belonging to diverse functional groups: contractile proteins of the acto-myosin apparatus, cytoskeletal proteins, metabolic enzymes, signaling proteins, ion-handling proteins, molecular chaperones, and extracellular matrix proteins [17]. Such comprehensive characterization would be challenging with 1D PAGE alone.
Table 2: Application-Based Method Selection Guide
| Research Goal | Recommended Method | Rationale | Technical Considerations |
|---|---|---|---|
| Molecular Weight Determination | 1D SDS-PAGE [2] [27] | Excellent size-based separation with reference standards | Use appropriate acrylamide percentage for target protein size range |
| Protein Purity Assessment | 1D SDS-PAGE [27] | Rapid detection of contaminants or degradation products | Coomassie staining typically sufficient; silver staining for higher sensitivity |
| Comparative Quantification | 1D SDS-PAGE [13] | Direct band intensity comparison between samples | Ensure equal protein loading and standardized staining |
| Comprehensive Proteome Mapping | 2D PAGE [17] [5] | Maximum resolution for complex mixtures | Requires optimized sample preparation and IEF conditions |
| Post-Translational Modification Analysis | 2D PAGE [17] [5] | Detects charge and mass alterations from PTMs | Specific staining or western blotting can confirm modifications |
| Protein Isoform Characterization | 2D PAGE [17] | Resolves multiple forms of the same protein | Narrow-range pH gradients enhance resolution for specific pI ranges |
| Membrane Protein Analysis | Modified 2D PAGE [14] | Special protocols for hydrophobic proteins | Use of specific detergents (CHAPS, Triton X-114) improves solubilization |
| Functional/Active Protein Studies | Native PAGE [2] | Preserves protein structure and activity | Avoid denaturing conditions throughout process |
Technical Protocols and Methodologies
Standard 1D SDS-PAGE Protocol
The following protocol for denaturing SDS-PAGE represents a standard methodology widely used in proteomics research [2]:
Sample Preparation:
- Dilute protein samples in SDS-PAGE sample buffer (typically containing Tris-HCl, SDS, glycerol, bromophenol blue)
- Add reducing agent (β-mercaptoethanol or DTT) to final concentration of 1-5% to disrupt disulfide bonds
- Heat samples at 70-100°C for 5-10 minutes to denature proteins
- Centrifuge briefly to collect condensed sample
Gel Preparation:
- Prepare resolving gel solution appropriate for target protein size range (e.g., 8-16% acrylamide)
- Add ammonium persulfate (APS) and TEMED to initiate polymerization
- Pour gel solution between glass plates, overlay with water-saturated butanol or isopropanol
- After polymerization, prepare stacking gel (lower acrylamide concentration, typically 4-5%)
- Insert comb to create sample wells
Electrophoresis:
- Assemble gel in electrophoresis chamber filled with running buffer (Tris-glycine-SDS)
- Load samples and molecular weight markers (5-20 μg protein per lane for Coomassie staining)
- Apply constant voltage (100-150V for mini-gels) until dye front reaches bottom
- Proceed to protein detection or western blot transfer
Protein Detection:
- Fix proteins in gel (40% ethanol, 10% acetic acid) for 30 minutes
- Stain with Coomassie Brilliant Blue (detection limit ~50-100 ng) or silver stain (detection limit ~0.1 ng)
- Destain until background is clear and bands are visible
- Image gel for documentation and analysis
Comprehensive 2D PAGE Protocol
The following protocol outlines the standard procedure for high-resolution two-dimensional gel electrophoresis [28] [5]:
Sample Preparation:
- Precipitate or lyophilize protein samples to minimize ionic strength
- Resuspend in rehydration/sample buffer (typically containing urea, thiourea, CHAPS, DTT, carrier ampholytes)
- Centrifuge at high speed (14,000-100,000 × g) to remove insoluble material
First Dimension - Isoelectric Focusing:
- Actively rehydrate IPG strips (7-24 cm) with sample in rehydration buffer (5-12 hours)
- Perform isoelectric focusing using stepwise or gradient voltage program:
- Step 1: 250 V for 15-30 minutes (removes salts)
- Step 2: 500-1000 V for 30-60 minutes (sample entry)
- Step 3: 8000-10,000 V for several hours (focusing to steady state)
- Total volt-hours: 20,000-80,000 Vh depending on strip length and pH range
- After IEF, strips can be stored at -80°C or processed immediately
Strip Equilibration:
- Equilibrate IPG strips in reducing buffer (urea, SDS, glycerol, DTT) for 15 minutes
- Transfer to alkylating buffer (urea, SDS, glycerol, iodoacetamide) for 15 minutes
- Rinse in SDS electrophoresis buffer
Second Dimension - SDS-PAGE:
- Place equilibrated IPG strip on top of SDS-polyacrylamide gel
- Seal with agarose solution to ensure good contact
- Perform electrophoresis at low constant current (5-15 mA/gel) initially, then increase to 20-40 mA/gel
- Continue until dye front reaches bottom of gel (typically 4-6 hours for standard format)
Protein Detection and Analysis:
- Fix proteins in gel (40% ethanol, 10% acetic acid)
- Stain with appropriate method: Coomassie, silver, or fluorescent dyes (SYPRO Ruby)
- Image gels using high-resolution scanner or imager
- Analyze using 2D analysis software for spot detection, matching, and quantification
Specialized Applications and Limitations
Membrane Protein Proteomics
The analysis of membrane proteins presents particular challenges for electrophoretic techniques due to their hydrophobic nature and poor solubility in aqueous buffers [14]. Traditional 2D PAGE using IEF in the first dimension effectively separates membrane proteins with one or two transmembrane segments but struggles with those containing more than four transmembrane domains [14]. This limitation arises because membrane proteins tend to precipitate at their isoelectric points during IEF, even when solubilized with non-ionic or zwitterionic detergents.
Modified 2D PAGE approaches have been developed to address these limitations. The use of alternative detergent systems—including cationic detergents like benzyldimethyl-n-hexadecylammonium chloride (16-BAC) in the first dimension followed by SDS-PAGE in the second dimension—has improved membrane protein separation [14]. Similarly, Blue Native PAGE preserves protein complexes in their native state for the first dimension before denaturing SDS-PAGE in the second dimension, enabling analysis of membrane protein complexes [14]. Despite these advances, comprehensive membrane proteome coverage remains challenging, with studies indicating that 2D PAGE effectively separates only a fraction of the predicted integral membrane proteins in biological systems [14].
Complementary LC-MS/MS Approaches
In modern proteomics, electrophoretic techniques are often combined with or compared to liquid chromatography-mass spectrometry (LC-MS/MS) approaches. Research comparing 1D and 2D-LC-MS/MS methods for metaproteomics found that while 2D-LC approaches enable higher overall protein identifications (>10,000 protein groups), 1D-LC methods are faster and easier to implement [8]. The GeLC-MS/MS workflow, which incorporates SDS-PAGE pre-fractionation before LC-MS/MS analysis, provides a robust alternative that yields results comparable to 2D-LC approaches, though with increased sample preparation time [8].
These findings highlight the complementary nature of electrophoretic and chromatographic separation methods in proteomics. Electrophoretic techniques offer unique advantages for protein visualization, integrity assessment, and specific applications like PTM analysis, while LC-based methods often provide higher throughput and different selectivity for peptide-level analysis.
Practical Limitations and Considerations
Both 1D and 2D PAGE have practical limitations that researchers must consider when designing proteomics experiments:
1D SDS-PAGE Limitations:
- Limited resolution for complex samples due to single separation parameter
- Co-migration of different proteins in same molecular weight range
- Limited dynamic range for detection of low-abundance proteins
- Potential for incomplete denaturation or aggregation
2D PAGE Limitations:
- Low reproducibility without careful standardization [5]
- Difficulty separating hydrophobic and extremely acidic or basic proteins [5] [14]
- Narrow dynamic range where highly abundant proteins mask faint spots [5]
- Labor-intensive with relatively low throughput [5]
- Technical expertise required for troubleshooting [5]
Recent advances have addressed many of these limitations. The development of immobilized pH gradients (IPG) has significantly improved 2D PAGE reproducibility [5]. Sensitive fluorescent dyes (SYPRO Ruby, Deep Purple) have expanded dynamic range detection capabilities [5]. Depletion of highly abundant proteins and sample pre-fractionation strategies can further enhance detection of low-abundance proteins [5].
Essential Research Reagent Solutions
Successful implementation of electrophoretic techniques in proteomics requires specific reagents and materials optimized for protein separation and analysis. The following table details key research reagent solutions essential for both 1D and 2D PAGE workflows.
Table 3: Essential Research Reagents for Protein Electrophoresis
| Reagent Category | Specific Examples | Function and Application | Technical Considerations |
|---|---|---|---|
| Denaturing Detergents | SDS (Sodium Dodecyl Sulfate) [2] | Denatures proteins and confers uniform charge for SDS-PAGE | Critical for molecular weight-based separation |
| Reducing Agents | DTT (Dithiothreitol), TCEP (Tris(2-carboxyethyl)phosphine) [28] | Breaks disulfide bonds for complete denaturation | TCEP more stable than DTT; avoid in IEF due to charge [28] |
| Alkylating Agents | Iodoacetamide [28] | Modifies cysteine residues to prevent reformation of disulfides | Apply after reduction; use fresh solution protected from light |
| Chaotropes | Urea, Thiourea [5] | Disrupts hydrogen bonding to solubilize proteins | Avoid heating urea solutions to prevent protein carbamylation |
| Zwitterionic Detergents | CHAPS, SB 3-10 [5] [14] | Solubilizes membrane proteins without interfering with IEF | Essential for hydrophobic protein separation in 2D PAGE |
| Carrier Ampholytes | Bio-Lyte, Pharmalyte [5] | Generates pH gradient for IEF in first dimension of 2D PAGE | Being replaced by IPG strips for better reproducibility |
| IPG Strips | Immobilized pH Gradient strips [28] [5] | Stable pH gradient for reproducible first dimension IEF | Various lengths (7-24 cm) and pH ranges (broad vs. narrow) available |
| Staining Dyes | Coomassie G250/R250, SYPRO Ruby, Silver nitrate [5] [27] | Visualizes separated proteins with varying sensitivity | Silver staining most sensitive but less compatible with MS [5] |
| Proteases | Trypsin [28] | Digests gel-separated proteins for MS identification | Sequencing grade modified for higher specificity |
Electrophoresis remains a cornerstone technology in modern proteomics, with 1D and 2D PAGE offering complementary capabilities for protein separation and analysis. The choice between these techniques depends fundamentally on research objectives: 1D SDS-PAGE provides rapid, straightforward molecular weight-based separation ideal for routine analysis and comparative studies, while 2D PAGE offers superior resolution for comprehensive proteome mapping, isoform detection, and post-translational modification analysis.
Technical advances continue to enhance both approaches. For 1D PAGE, improvements in gel chemistry, staining sensitivity, and compatibility with downstream mass spectrometry have maintained its relevance in high-throughput proteomics. For 2D PAGE, the development of immobilized pH gradients, fluorescent DIGE technology, and optimized protocols for challenging protein classes have addressed earlier limitations regarding reproducibility and membrane protein separation.
In contemporary proteomics workflows, electrophoretic techniques frequently integrate with chromatographic and mass spectrometric methods in hybrid approaches that leverage the unique strengths of each technology. As proteomics continues to evolve toward more comprehensive and quantitative analyses, both 1D and 2D electrophoresis will remain essential tools in the researcher's toolkit, providing robust, visually intuitive, and highly effective methods for protein separation that continue to drive discoveries in basic biology, biomarker identification, and drug development.
Practical Implementation: Methodologies and Research Applications for 1D and 2D PAGE
In the field of proteomic research, polyacrylamide gel electrophoresis (PAGE) serves as a fundamental tool for protein separation and analysis. Among the available techniques, one-dimensional sodium dodecyl sulfate polyacrylamide gel electrophoresis (1D SDS-PAGE) represents a cornerstone methodology for rapid protein separation by molecular weight. This technique uses the anionic detergent sodium dodecyl sulfate (SDS) to denature proteins and impart a uniform negative charge, allowing separation primarily based on polypeptide size rather than inherent charge [29] [2]. The simplicity, speed, and reliability of 1D SDS-PAGE have cemented its position as a ubiquitous technique in molecular biology laboratories worldwide.
This guide objectively compares 1D SDS-PAGE with the more complex two-dimensional polyacrylamide gel electrophoresis (2D PAGE) within the context of proteomic analysis. While 2D PAGE provides superior resolution by separating proteins based on both isoelectric point and molecular weight, 1D SDS-PAGE offers distinct advantages in simplicity, throughput, and cost-effectiveness for many applications [23] [30]. Understanding the strengths and limitations of each technique enables researchers to select the most appropriate method for their specific experimental needs in drug development and basic research.
Theoretical Foundation: Principles of Protein Separation by SDS-PAGE
The separation mechanism of SDS-PAGE relies on the fundamental principle that all proteins will migrate toward the anode when subjected to an electric field after being complexed with SDS. This detergent denatures proteins by wrapping around the polypeptide backbone, with approximately 1.4 grams of SDS binding per gram of protein [29] [2]. This binding confers a relatively uniform negative charge density, effectively masking the protein's intrinsic charge. Consequently, the SDS-polypeptide complexes migrate through the polyacrylamide gel matrix strictly according to molecular weight, with smaller polypeptides moving more rapidly than larger ones due to less resistance from the gel pores [2].
The polyacrylamide gel matrix serves as a molecular sieve, with its pore size determined by the concentration of acrylamide and bis-acrylamide. Table 1 illustrates the relationship between acrylamide concentration and effective separation range for proteins of different sizes. The use of a discontinuous buffer system—with different pH and composition in the stacking and resolving gels—further enhances resolution by concentrating protein samples into sharp bands before they enter the resolving gel [29]. This concentration effect significantly improves the clarity and sharpness of separated protein bands.
Table 1: Recommended Acrylamide Concentrations for Separating Various Protein Sizes
| Acrylamide Concentration (%) | Effective Separation Range (kDa) |
|---|---|
| 5% | 36 - 200 |
| 7.5% | 24 - 200 |
| 10% | 14 - 200 |
| 12% | 12 - 60 |
| 15% | 10 - 40 |
Detailed 1D SDS-PAGE Protocol: A Step-by-Step Guide
Materials and Reagent Preparation
Research Reagent Solutions and Essential Materials:
- SDS Loading Buffer (5X): Typically contains 250 mM Tris-HCl (pH 6.8), 10% SDS, 30% glycerol, 5% β-mercaptoethanol or 100 mM DTT, and 0.02% bromophenol blue [31]. The reducing agents break disulfide bonds, while SDS denatures proteins and provides negative charge.
- Running Buffer (10X): Commonly 250 mM Tris, 1.92 M glycine, and 1% SDS, diluted to 1X before use [31] [29]. This buffer conducts current and maintains the pH necessary for separation.
- Polyacrylamide Gel: Composed of acrylamide-bisacrylamide mixture, polymerized with ammonium persulfate (APS) and TEMED catalyst [2]. The concentration determines pore size and resolution range.
- Protein Molecular Weight Marker: A mixture of proteins of known molecular weights, essential for estimating the size of unknown proteins [2].
- Coomassie Stain: Brilliant Blue R-250 or G-250 dissolved in a mixture of methanol, acetic acid, and water, or as a ready-to-use colloidal formulation [31] [32].
Sample Preparation Protocol
- Dilute Protein Samples: Mix your protein samples with an appropriate volume of SDS loading buffer. A common ratio is 1:4 (sample:buffer), but this may vary. For example, one protocol recommends mixing 10 μL of protein fraction with 30 μL of wash buffer and 10 μL of 5X SDS loading buffer [31].
- Denature Proteins: Heat the mixture at 70-100°C for 5-10 minutes to ensure complete denaturation [29]. This step unravels the protein structure for optimal SDS binding.
- Brief Centrifugation: Spin down the heated samples briefly in a microcentrifuge to collect all condensation and ensure the entire sample is at the bottom of the tube [29].
Gel Electrophoresis Procedure
- Assemble Gel Apparatus: Set up the gel electrophoresis unit according to the manufacturer's instructions. Ensure the gel cassette is properly seated to prevent buffer leaks.
- Add Running Buffer: Pour the diluted 1X running buffer into both the inner and outer chambers of the gel box. The inner chamber should completely submerge the gel wells [31].
- Load Samples: Carefully load 20-30 μL of prepared samples and 10 μL of prestained protein ladder into separate wells using gel-loading tips [31]. Record the loading pattern for accurate identification.
- Run Electrophoresis: Attach the lid, connect the power supply, and run at a constant voltage. A typical protocol uses 120-200V [31] [29]. Run until the dye front nearly reaches the bottom of the gel (approximately 30-60 minutes, depending on gel size and voltage).
- Terminate Run: Turn off the power supply when separation is complete, disconnect the leads, and proceed to protein visualization.
Protein Visualization: Coomassie Staining Protocol
- Gel Removal: Carefully pry apart the gel plates and transfer the gel to a suitable container.
- Initial Wash: Rinse the gel with distilled water for 5 minutes on a shaker to remove electrophoresis buffers [31] [32].
- Staining: Add enough Bio-Safe Coomassie stain to completely cover the gel. Incubate with shaking for 1 hour at room temperature. For low-abundance proteins, stain overnight for enhanced sensitivity [31].
- Destaining: Remove the stain and rinse the gel with water. For more complete destaining, add several changes of destaining solution (e.g., water or methanol-acetic acid solution) until the background is clear and protein bands are distinctly visible [31] [32].
- Imaging and Analysis: Capture an image of the stained gel using a documentation system. Analyze the band pattern to determine if your protein runs at the expected molecular weight, which sample contains your protein of interest, and the purity of your sample [31].
Figure 1: 1D SDS-PAGE Experimental Workflow. This diagram outlines the key steps in the SDS-PAGE protocol, from sample preparation to final analysis.
Performance Comparison: 1D SDS-PAGE vs. 2D PAGE in Proteomic Research
Technical Comparison and Experimental Data
The choice between 1D SDS-PAGE and 2D PAGE depends heavily on research objectives, sample complexity, and available resources. Table 2 provides a direct comparison of key performance metrics based on experimental data from proteomic studies.
Table 2: Performance Comparison of 1D SDS-PAGE vs. 2D PAGE for Proteomic Analysis
| Parameter | 1D SDS-PAGE | 2D PAGE |
|---|---|---|
| Separation Principle | Molecular weight only [2] | Isoelectric point (pI) then molecular weight [30] |
| Proteins Identified | 2,552 proteins (supernatant fraction) [23] | 4,323 proteins (supernatant fraction) [23] |
| Dynamic Range | Limited by staining method [30] | Limited by staining method; can be improved with prefractionation [30] |
| Reproducibility | High [33] | Moderate; improved with IPG strips [30] |
| Sample Throughput | High; multiple samples per gel [2] | Low; one sample per gel [30] |
| Hands-on Time | 1-2 hours (excluding staining) [31] | 1-3 days [30] |
| Detection Sensitivity | 5-25 ng (Coomassie) [32] | 0.25-0.5 ng (Silver stain) [32] |
| Membrane Protein Analysis | Better for precipitate fractions [23] | Difficulty with hydrophobic proteins [30] |
| Equipment Cost | Low to moderate [33] | Moderate to high [33] |
| Post-Translational Modification Detection | Limited [30] | Excellent; detects charge and mass shifts [30] |
Advantages and Limitations in Research Applications
1D SDS-PAGE Advantages:
- High Resolution for Molecular Weight Separation: Effectively separates proteins with similar molecular weights, particularly in the lower molecular weight range [33].
- Simplicity and Efficiency: The procedure is relatively straightforward, uses common laboratory equipment, and is suitable for rapid analysis and large-scale screening [33].
- Broad Sample Compatibility: Applicable to various protein samples including cell lysates, serum, and tissue extracts [33].
- Quantitative Potential: Allows for semi-quantitative analysis by comparing band intensity with standards [33].
1D SDS-PAGE Limitations:
- Limited Resolution for Complex Mixtures: May not sufficiently resolve proteins with very similar molecular weights in highly complex samples [33].
- Protein Denaturation: The use of SDS fully denatures proteins, destroying native structure and function [33] [12].
- No Isoelectric Point Information: Does not provide information on protein charge properties [33].
- Limited Multiplexing: Typically analyzes different samples in separate lanes rather than multiple samples simultaneously [30].
2D PAGE Advantages:
- Superior Resolution: Capable of resolving thousands of proteins simultaneously by two different properties [30].
- Post-Translational Modification Detection: Can visualize protein isoforms and modifications that alter charge or mass [30].
- Intact Protein Analysis: Separates and visualizes full-length proteins [30].
2D PAGE Limitations:
- Technical Complexity: Requires experienced operators and stringent experimental conditions [33] [30].
- Low Throughput: Time-consuming and labor-intensive, making it less suitable for analyzing large sample sets [30].
- Difficulty with Extreme Proteins: Challenges in separating very hydrophobic, highly acidic, or basic proteins [30].
- Cost: Requires more expensive equipment and reagents [33].
Figure 2: Method Selection Guide. This diagram compares the primary advantages and limitations of 1D SDS-PAGE and 2D PAGE to guide method selection.
The comparative analysis presented in this guide demonstrates that both 1D SDS-PAGE and 2D PAGE offer distinct advantages for proteomic research. 1D SDS-PAGE provides an efficient, cost-effective approach for routine protein separation by molecular weight, making it ideal for applications such as purity assessment, expression analysis, and western blotting [2]. Its simplicity and throughput make it particularly valuable for drug development pipelines where multiple samples need rapid analysis.
Conversely, 2D PAGE remains the method of choice for comprehensive analysis of complex protein mixtures when investigating post-translational modifications, protein isoforms, or when maximum resolution is required [23] [30]. The techniques should be viewed as complementary rather than competing, with 1D SDS-PAGE serving as a workhorse for routine analyses and 2D PAGE providing specialized capabilities for in-depth proteomic characterization. The integration of both methods with mass spectrometric analysis, as evidenced in recent research [23] [34], provides a powerful framework for advancing proteomic knowledge and accelerating biomarker discovery and drug development.
Two-dimensional polyacrylamide gel electrophoresis (2D-PAGE) remains a cornerstone technique in proteomic research, providing unparalleled resolution for analyzing complex protein mixtures. This method separates proteins based on two independent molecular properties: isoelectric point (pI) in the first dimension and molecular mass in the second dimension [35] [36]. The technique was independently introduced in 1969 by Macko and Stegemann and by Dale and Latner, but its modern implementation owes much to O'Farrell's 1975 work that established the high-resolution framework now used worldwide [35] [14].
In the context of comparative proteomic analysis, 2D-PAGE enables researchers to simultaneously separate over 1,000 different proteins on a single gel, creating a protein "map" where each spot potentially represents a unique protein species [36] [14]. This comprehensive visualization capability makes 2D-PAGE particularly valuable for detecting post-translational modifications, which often manifest as characteristic pI shifts while maintaining molecular mass [37]. Despite the emergence of gel-free proteomic approaches, 2D-PAGE maintains its relevance through direct quantitative capabilities and the ability to resolve protein isoforms that might be obscured in liquid chromatography-based methods [38].
This guide examines the complete 2D-PAGE workflow with particular emphasis on the critical relationship between first-dimension isoelectric focusing (IEF) and second-dimension SDS-PAGE separation, providing experimental data and methodological details to inform researchers' experimental design.
Fundamental Principles: How 2D-PAGE Separates Proteins
Orthogonal Separation Mechanisms
The resolving power of 2D-PAGE stems from its use of two orthogonal separation principles that exploit different physicochemical properties of proteins:
- First Dimension (IEF): Separation based on isoelectric point using immobilized pH gradient (IPG) strips
- Second Dimension (SDS-PAGE): Separation based on molecular mass through discontinuous polyacrylamide gel electrophoresis [35] [2]
In the first dimension, proteins migrate through a pH gradient under an electric field until they reach their isoelectric point—the specific pH where their net charge becomes zero [35] [36]. This focusing effect concentrates each protein into a tight band at its characteristic pI position. The second dimension then resolves these focused bands according to molecular mass by employing sodium dodecyl sulfate (SDS), which denatures proteins and imparts a uniform negative charge proportional to polypeptide length [2] [39]. The result is a two-dimensional protein map where coordinates correspond to specific molecular properties rather than merely migration distances.
Visualization of 2D-PAGE Separation Principles
The following diagram illustrates the core separation mechanism of the 2D-PAGE technique:
First Dimension: Isoelectric Focusing Methodologies
Immobilized pH Gradient (IPG) Technology
Modern 2D-PAGE predominantly employs immobilized pH gradient (IPG) strips for the first dimension separation. Unlike carrier ampholyte-generated gradients, IPG strips contain fixed pH gradients covalently bonded to the polyacrylamide matrix, providing exceptional reproducibility and stability [36] [21]. Commercial IPG strips are available in various lengths (7-24 cm) and pH ranges (broad-range pH 3-10 or narrow-range for enhanced resolution) [21]. The typical IEF protocol involves:
- Strip Rehydration: IPG strips are rehydrated with sample-containing or sample-free buffer for 6-12 hours
- Active IEF: Voltage is gradually increased to 5000-8000 V over several hours for optimal focusing
- Equilibration: Focused strips are equilibrated in SDS-containing buffer to prepare for second dimension [21]
A systematic evaluation of mosquito proteomic profiling demonstrated that optimized IEF protocols significantly improve protein solubility, resolution, and visualization for comparative analysis of protein expression [37].
IPG vs. NEPHGE: Comparative Performance for Basic Proteins
While IPG represents the current standard for most applications, non-equilibrium pH gradient electrophoresis (NEPHGE) maintains relevance for specific applications, particularly basic protein separation:
Table 1: Comparison of First-Dimension IEF Techniques
| Parameter | IPG-Based IEF | NEPHGE-Based IEF |
|---|---|---|
| Reproducibility | High for acidic proteins | Excellent for basic proteins |
| Protein Loss | Higher, especially for basic proteins | Lower overall |
| Handling | Simple, standardized protocol | Technically demanding, skill-dependent |
| Basic Protein Recovery (pI > 7) | ~50% unreproducible by Coomassie staining | Excellent reproducibility in basic range |
| Equipment | Commercially available systems | Specialized equipment required |
| Optimal Application | Acidic protein analysis (pH 4-7) | Basic protein analysis (pH > 7) |
Direct comparison experiments using Saccharomyces cerevisiae proteome revealed that NEPHGE-based methods outperform IPG for basic proteins (pI > 7), with approximately half of detected basic protein spots being unreproducible by IPG-based 2DE [21]. However, IPG remains superior for acidic protein analysis and offers significantly simpler handling and standardization.
Second Dimension: SDS-PAGE Separation
Discontinuous Gel Electrophoresis
The second dimension employs SDS-polyacrylamide gel electrophoresis to separate focused proteins from the first dimension according to molecular mass [2] [39]. This process utilizes a discontinuous buffer system with two distinct gel regions:
- Stacking Gel (lower acrylamide concentration, pH ~6.8): Concentrates proteins into sharp bands before entry into separating gel
- Separating/Resolving Gel (higher acrylamide concentration, pH ~8.8): Resolves proteins based on molecular size [2] [40]
The SDS-binding ratio (approximately 1.4g SDS per 1g protein) confers a uniform negative charge, ensuring migration velocity depends primarily on polypeptide chain length through the sieving effect of the polyacrylamide matrix [39]. Smaller proteins migrate faster through the porous network, while larger proteins experience greater frictional resistance.
Gel Composition and Molecular Weight Resolution
Table 2: SDS-PAGE Resolution Ranges by Acrylamide Percentage
| Acrylamide Percentage | Effective Separation Range | Applications |
|---|---|---|
| 15% | 10-50 kDa | Small proteins, peptides |
| 12% | 40-100 kDa | Medium-sized proteins |
| 10% | >70 kDa | Large proteins |
| 8-16% Gradient | Broad dynamic range | Complex mixtures with diverse sizes |
| 4-20% Gradient | Enhanced resolution across sizes | Comprehensive proteomic analysis |
Gradient gels with increasing acrylamide concentration provide superior resolution across broad molecular weight ranges by creating progressively smaller pores that retard larger proteins more effectively at greater migration distances [2] [40]. Tris-glycine is the standard buffer system, though Tris-tricine buffers offer advantages for low molecular weight peptides (<10 kDa) [14].
Comparative Performance: 1D PAGE vs. 2D PAGE in Proteomic Analysis
Resolution and Detection Capabilities
The fundamental distinction between 1D and 2D electrophoresis lies in their separation dimensionality and resulting resolution capacity:
Table 3: Performance Comparison of 1D PAGE vs. 2D PAGE
| Analysis Parameter | 1D SDS-PAGE | 2D PAGE |
|---|---|---|
| Separation Principle | Molecular weight only | pI and molecular weight |
| Maximum Proteins Resolved | ~100 bands | 1,000-10,000 spots |
| Post-Translational Modifications | Limited detection | Excellent detection (charge shifts) |
| Sample Throughput | Higher | Lower |
| Technical Complexity | Lower | Higher |
| Reproducibility | High | Moderate (gel-to-gel variation) |
| Protein Identification | Band excision, less specific | Spot excision, more specific |
| Quantitative Capability | Relative (band intensity) | Relative (spot intensity/volume) |
| Required Sample Amount | 1-50 μg | 50-200 μg |
While 1D SDS-PAGE separates proteins primarily by mass into bands, 2D-PAGE resolves complex mixtures into individual spots, dramatically enhancing resolution for detailed proteome mapping [2] [36]. This orthogonal separation makes 2D-PAGE particularly valuable for detecting charge modifications such as phosphorylation and glycosylation that may not alter molecular mass sufficiently for 1D resolution [37].
Experimental Detection Metrics
Direct comparison of separation techniques using mitochondrial extracts from rat liver revealed complementary protein identification patterns:
Table 4: Protein Identification Metrics by Separation Technique
| Separation Technique | Protein Identifications | Peptides per Protein | Key Advantages |
|---|---|---|---|
| 1D SDS-PAGE | Highest number | Moderate | Simplicity, high throughput |
| Preparative 1D SDS-PAGE | High | Moderate | Pre-fractionation capability |
| IEF-IPG | High | Highest | Superior for charge-based separation |
| 2D PAGE | Complementary set | Lower | Comprehensive proteome visualization |
The IEF-IPG technique demonstrated the highest average number of detected peptides per protein, potentially benefiting quantitative and structural characterization in large-scale biomedical applications [41]. Each technique offers complementary advantages, with optimal experimental design often incorporating multiple approaches for comprehensive proteome coverage.
Limitations and Methodological Constraints
Despite its powerful separation capabilities, standard 2D-PAGE faces several significant technical limitations:
- Molecular Weight Constraints: Effective separation typically limited to 10-200 kDa range [36]
- pI Limitations: Poor resolution for extremely acidic (pI < 3.5) or basic (pI > 11.5) proteins [36]
- Hydrophobic Protein Representation: Membrane proteins with multiple transmembrane domains (>4 TMS) are consistently underrepresented [14]
- Dynamic Range Issues: Difficulty detecting low-abundance proteins without pre-fractionation [36] [14]
- Technical Artifacts: Vertical and horizontal streaking can obscure analysis, particularly with inadequate sample preparation [36]
Modifications to standard protocols, including alternative detergents, specialized buffer systems, and subcellular pre-fractionation, can partially address these limitations. For instance, using Tris-tricine discontinuous SDS-PAGE in the second dimension instead of Tris-glycine systems improves resolution of hydrophobic membrane proteins [14].
Essential Reagents and Research Solutions
Successful 2D-PAGE experimentation requires specific reagents and materials optimized for protein separation:
Table 5: Essential Research Reagents for 2D-PAGE Workflows
| Reagent/Material | Function | Application Notes |
|---|---|---|
| IPG Strips | First dimension pI separation | Various pH ranges and lengths available |
| Urea/Thiourea | Protein denaturant in IEF | Improves solubility of membrane proteins |
| CHAPS | Zwitterionic detergent | Protein solubilization without interference with IEF |
| DTT/β-mercaptoethanol | Reducing agent | Breaks disulfide bonds for complete denaturation |
| SDS | Anionic detergent | Imparts uniform charge for size-based separation |
| Acrylamide/Bis-acrylamide | Gel matrix formation | Cross-linking creates molecular sieving effect |
| Ammonium Persulfate/TEMED | Polymerization catalysts | Initiate and stabilize polyacrylamide gel formation |
| Coomassie/SYPRO Ruby/Silver | Protein staining | Different sensitivity levels (ng to μg range) |
The optimized protocol for mosquito proteomic profiling emphasized that specific reagent combinations significantly impact protein solubility, resolution, and visualization in comparative expression analysis [37]. Appropriate reagent selection tailored to sample characteristics is crucial for methodological success.
Advanced Applications and Workflow Integration
Differential Gel Electrophoresis (DIGE)
Advanced 2D-PAGE implementations include two-dimensional fluorescence difference gel electrophoresis (DIGE), which enables multiplexed analysis by labeling different protein samples with spectrally distinct fluorescent cyanine dyes before combined separation on the same 2D gel [36]. This approach minimizes gel-to-gel variation and improves quantitative accuracy through internal standardization, allowing precise measurement of expression changes between control and experimental conditions [36].
Mass Spectrometry Integration
Following 2D separation, protein identification typically involves spot excision, in-gel enzymatic digestion, and mass spectrometric analysis [35] [36]. The generation of "picking lists" from 2D gel analysis software guides automated spot excision systems for high-throughput proteomic pipelines [35]. Mass spectrometry then provides precise mass measurements and peptide sequencing data (typically 1,000-4,000 atomic mass units) for protein identification against genomic databases [35].
Complementary Technique Integration
The following workflow illustrates how 2D-PAGE integrates with complementary separation approaches in comprehensive proteomic studies:
While gel-free proteomic approaches continue to advance, 2D-PAGE maintains significant relevance in functional proteomics through direct visualization capabilities, compatibility with various staining and detection methods, and unparalleled resolution for detecting protein modifications [38]. The technique's ability to provide quantitative information across thousands of protein features simultaneously makes it particularly valuable for comparative expression analysis.
Methodological improvements continue to address traditional limitations, with narrow-range IPG strips enhancing resolution for specific pI regions, specialized detergents improving membrane protein solubility, and fluorescent staining technologies expanding dynamic range [21] [14]. These developments ensure 2D-PAGE remains a powerful tool in the proteomics arsenal, particularly when integrated with complementary separation and identification technologies for comprehensive protein analysis.
For researchers designing proteomic studies, 2D-PAGE offers the highest resolution for direct protein separation and visualization, while 1D approaches provide superior throughput for targeted analyses. The orthogonal separation principles of IEF and SDS-PAGE in two dimensions create a powerful analytical tool that continues to reveal proteomic complexity inaccessible to single-dimension separation methods.
Protein Purity Assessment and Molecular Weight Determination Using 1D PAGE
In the field of proteomic analysis research, the selection of an appropriate electrophoretic separation technique is fundamental to obtaining accurate, reproducible, and biologically relevant data. Among the most established methods are one-dimensional polyacrylamide gel electrophoresis (1D PAGE) and two-dimensional gel electrophoresis (2D PAGE), each with distinct advantages and limitations. This guide provides an objective comparison of 1D SDS-PAGE versus 2D PAGE, focusing on their application in protein purity assessment and molecular weight determination. We will evaluate their performance based on separation principles, practical considerations, and supporting experimental data, providing researchers, scientists, and drug development professionals with a clear framework for selecting the optimal method for specific analytical needs.
The resolution of complex protein mixtures is a cornerstone of modern biochemistry and proteomics. While 2D PAGE offers superior resolving power for comprehensive proteome analysis, 1D SDS-PAGE remains the workhorse technique for routine protein purity checks and molecular weight estimation due to its simplicity, robustness, and cost-effectiveness [42] [43]. Understanding the specific strengths of each method enables more informed experimental design and resource allocation in research and development pipelines.
Technical Principles and Separation Mechanisms
1D SDS-PAGE: Separation by Molecular Mass
1D SDS-PAGE is a denaturing electrophoresis technique that separates proteins primarily based on their molecular mass [42]. The anionic detergent sodium dodecyl sulfate (SDS) plays a crucial role in this process by denaturing proteins and binding to the polypeptide backbone in a constant weight ratio (approximately 1.4 g SDS per 1 g of protein) [42]. This SDS-binding confers a uniform negative charge density to all proteins, effectively masking their intrinsic charge differences [42]. When an electric field is applied, these SDS-protein complexes migrate through the cross-linked polyacrylamide gel matrix toward the anode, with smaller proteins moving faster due to less resistance from the gel pores [42] [44].
The polyacrylamide gel concentration determines the effective separation range, with lower percentages (e.g., 8-10%) optimal for high molecular weight proteins and higher percentages (e.g., 12-15%) better for resolving smaller proteins [42] [27]. Most 1D SDS-PAGE systems employ a discontinuous buffer system with a stacking gel that concentrates proteins into a sharp band before they enter the resolving gel, enhancing resolution [42]. This fundamental principle makes 1D SDS-PAGE exceptionally reliable for molecular weight estimation when calibrated with appropriate standards [42] [44].
Figure 1: 1D SDS-PAGE Workflow. The process begins with protein denaturation in SDS-containing buffer, followed by loading onto a stacking gel where proteins are concentrated before entering the resolving gel for separation by molecular weight [42] [44].
2D PAGE: Orthogonal Separation by Charge and Mass
2D PAGE represents a more sophisticated approach that separates proteins based on two independent properties: isoelectric point (pI) in the first dimension and molecular mass in the second dimension [17] [43]. The first dimension employs isoelectric focusing (IEF), where proteins migrate through a pH gradient until they reach the position where the pH equals their isoelectric point (net charge zero) [43]. This step can resolve proteins differing by as little as 0.001 pH units in their pI [27].
For the second dimension, the IEF strip is equilibrated with SDS buffer and applied to an SDS-PAGE gel, where separation occurs according to molecular mass similarly to 1D SDS-PAGE [43]. This orthogonal separation mechanism provides dramatically higher resolution than 1D methods, capable of resolving thousands of protein spots from a single sample [17]. This makes 2D PAGE particularly valuable for detecting post-translational modifications that alter protein charge, such as phosphorylation and acetylation, which appear as distinct spots with similar molecular weights but different pI values [17] [45].
Comparative Performance Analysis
Direct Comparison of Key Parameters
Table 1: Comprehensive comparison of 1D SDS-PAGE versus 2D PAGE for proteomic applications
| Parameter | 1D SDS-PAGE | 2D PAGE | Experimental Support |
|---|---|---|---|
| Separation Principle | Molecular mass | First dimension: Isoelectric point (pI)Second dimension: Molecular mass | [42] [43] |
| Resolution Capacity | 10-100 bands per lane | 1,000-10,000 spots per gel | [17] [43] |
| Molecular Weight Determination | Excellent (primary application) | Good (secondary dimension) | [42] [44] |
| Protein Purity Assessment | Good for major contaminants | Superior for detecting charge variants and PTMs | [45] [46] |
| Sample Throughput | High (multiple samples per gel) | Low (typically 1 sample per gel) | [42] [43] |
| Membrane Protein Handling | Good (22 membrane proteins identified in liver microsomes) | Poor (only 3 membrane proteins identified in same sample) | [47] |
| PTM Detection | Limited | Excellent for charge-altering PTMs | [17] [45] |
| Technical Complexity | Low to moderate | High | [44] [43] |
| Experiment Duration | 3-4 hours | 1-2 days | [44] [43] |
| Required Expertise | Basic training | Extensive experience needed | [43] |
Quantitative Performance Data in Specific Applications
Table 2: Experimental data supporting method selection for specific research applications
| Application Scenario | Performance Metric | 1D SDS-PAGE | 2D PAGE | Reference |
|---|---|---|---|---|
| Membrane Protein Analysis | Number of integral membrane proteins identified from rat liver microsomes | 22 proteins | 3 proteins | [47] |
| Post-Translational Modification Detection | Phosphorylated ovalbumin isoforms resolved | 3 bands | 11 distinct spots | [45] |
| Metalloprotein Analysis | Zinc retention in Zn-proteome after electrophoresis | 26% retention | Not reported | [12] |
| Metalloprotein Analysis (Native Conditions) | Zinc retention in Zn-proteome with NSDS-PAGE | 98% retention | Not applicable | [12] |
| Enzyme Activity Preservation | Model enzymes retaining activity post-electrophoresis | 0/9 enzymes (standard SDS-PAGE)7/9 enzymes (NSDS-PAGE) | 9/9 enzymes (BN-PAGE) | [12] |
Experimental Protocols for Core Applications
Detailed Protocol: Protein Purity Assessment Using 1D SDS-PAGE
Objective: To assess the purity of a protein sample and estimate the molecular weights of its components.
Equipment and Reagents:
- PAGE gel casting stand, glass plates, spacers, and combs
- Power supply
- Mini-gel electrophoresis apparatus
- Protein molecular weight markers
- Acrylamide/bis-acrylamide solution (19:1)
- Tris-HCl buffers (pH 6.8 and 8.8)
- SDS, ammonium persulfate (APS), and TEMED
- Sample buffer (62.5 mM Tris-HCl, pH 6.8, 2% SDS, 10% glycerol, 5% β-mercaptoethanol, 0.01% bromophenol blue)
Procedure:
- Gel Preparation: Prepare a discontinuous gel system consisting of:
- Resolving Gel: 12% acrylamide, 375 mM Tris-HCl (pH 8.8), 0.1% SDS. Add 0.05% APS and 0.1% TEMED to initiate polymerization. Pour between glass plates and overlay with water or butanol [44].
- Stacking Gel: 5% acrylamide, 125 mM Tris-HCl (pH 6.8), 0.1% SDS. Once resolving gel has polymerized, pour stacking gel and insert appropriate comb [44].
Sample Preparation: Mix protein samples with 2X sample buffer at a 1:1 ratio. Heat at 70-100°C for 5-10 minutes to denature proteins [42] [27]. Centrifuge briefly to collect condensate.
Electrophoresis: Assemble gel in electrophoresis chamber filled with running buffer (25 mM Tris, 192 mM glycine, 0.1% SDS). Load samples and molecular weight markers. Run at constant voltage (200V) for approximately 45-60 minutes until dye front reaches bottom [12] [44].
Detection and Analysis: Stain with Coomassie Blue (detection limit: 50-100 ng) or silver stain (detection limit: 0.1 ng) [27]. Compare band pattern to molecular weight markers to estimate sizes and assess purity based on presence of additional bands.
Modified Protocol: Native SDS-PAGE for Functional Analysis
Objective: To separate proteins under mild conditions that preserve enzymatic activity and metal cofactors.
Modifications to Standard Protocol:
- Sample Buffer: Omit SDS and reducing agents from sample buffer. Do not heat samples [12].
- Running Buffer: Reduce SDS concentration to 0.0375% and omit EDTA [12].
- Electrophoresis Conditions: Run at constant voltage (200V) at 4°C to maintain protein stability [12].
Applications: This modification enables molecular weight-based separation while preserving protein function, with 98% zinc retention in metalloproteins and 7 out of 9 model enzymes retaining activity post-electrophoresis [12].
The Scientist's Toolkit: Essential Research Reagents
Table 3: Key reagents and materials for 1D SDS-PAGE experiments
| Reagent/Material | Function | Critical Specifications |
|---|---|---|
| Acrylamide/Bis-acrylamide | Forms cross-linked polymer matrix for molecular sieving | 19:1 or 29:1 ratio; concentration determines pore size (4-20%) [42] |
| SDS (Sodium Dodecyl Sulfate) | Denatures proteins and confers uniform negative charge | High purity; critical micelle concentration ~0.23% in water [42] |
| TEMED & Ammonium Persulfate | Catalyzes acrylamide polymerization | TEMED stabilizes free radicals; APS concentration affects polymerization rate [42] |
| Tris-HCl Buffers | Maintains pH during electrophoresis | Stacking gel: pH 6.8; Resolving gel: pH 8.8 [44] |
| Molecular Weight Markers | Reference for molecular weight estimation | Pre-stained or unstained; should cover expected size range [42] |
| β-mercaptoethanol or DTT | Reduces disulfide bonds | Essential for complete denaturation; typically 5% in sample buffer [27] |
| Coomassie/Silver Stains | Visualizes separated proteins | Coomassie: 50-100 ng sensitivity; Silver: 0.1 ng sensitivity [27] |
Application-Specific Method Selection
Decision Framework for Technique Selection
Figure 2: Decision Framework for Method Selection. This flowchart guides researchers in selecting the most appropriate electrophoretic method based on their specific research objectives and sample characteristics [42] [47] [43].
Integrated Approaches for Comprehensive Protein Analysis
For many research applications, a combination of electrophoretic techniques provides the most comprehensive analysis:
Initial Screening with 1D SDS-PAGE: Use 1D SDS-PAGE for rapid assessment of protein purity, expression levels, and approximate molecular weights across multiple samples [46] [44].
High-Resolution Analysis with 2D PAGE: Employ 2D PAGE for detailed characterization of specific samples showing complex band patterns in 1D gels or when post-translational modifications are suspected [17] [45].
Functional Studies with Native Techniques: Apply native SDS-PAGE or BN-PAGE when protein function, enzyme activity, or metal cofactor retention is paramount [12].
This integrated approach maximizes efficiency while providing multiple layers of protein characterization, making it particularly valuable in drug development pipelines where both quantity and quality of protein characterization are critical.
The comparative analysis of 1D and 2D PAGE demonstrates that each technique occupies a distinct niche in proteomic research. 1D SDS-PAGE excels in protein purity assessment, molecular weight determination, and high-throughput applications, offering simplicity, robustness, and compatibility with downstream analyses like western blotting. Its modified native version further expands its utility to functional studies. Conversely, 2D PAGE provides unparalleled resolution for detecting protein isoforms and post-translational modifications, making it invaluable for comprehensive proteome mapping despite its technical complexity and lower throughput.
The selection between these techniques should be guided by specific research objectives, sample characteristics, and practical constraints. For most routine applications in protein purity assessment and molecular weight determination, 1D SDS-PAGE remains the preferred method due to its established reliability, quantitative capabilities, and experimental efficiency. Researchers are encouraged to consider both techniques as complementary rather than competing approaches, leveraging their respective strengths through integrated experimental designs that provide comprehensive protein characterization across multiple analytical dimensions.
High-Resolution Proteome Mapping and Biomarker Discovery with 2D PAGE
In the field of proteomics, the ability to comprehensively separate and analyze complex protein mixtures is fundamental to understanding cellular mechanisms, disease pathology, and identifying potential biomarkers. For decades, polyacrylamide gel electrophoresis (PAGE) has served as a cornerstone technology for protein separation. The progression from one-dimensional (1D) to two-dimensional (2D) PAGE represents a significant evolution in analytical capability, enabling researchers to obtain far more detailed protein expression profiles. While 1D sodium dodecyl sulfate-PAGE (SDS-PAGE) separates proteins primarily by molecular weight, 2D PAGE combines isoelectric focusing (IEF) with SDS-PAGE to resolve proteins based on two independent physicochemical properties: isoelectric point (pI) in the first dimension and molecular weight in the second dimension [5] [2]. This orthogonal separation approach provides a powerful tool for visual proteomics, allowing simultaneous fractionation of hundreds to thousands of proteins from tissues, cells, or other biological samples [5]. The technique has become particularly valuable in biomarker discovery, cancer research, and studying protein post-translational modifications, providing critical insights that cannot be predicted from genomic sequences alone [5] [48].
Fundamental Principles: 1D PAGE vs. 2D PAGE
Technical Foundations of Each Method
1D SDS-PAGE operates on a relatively straightforward principle. Proteins are denatured and linearized with the anionic detergent SDS, which confers a uniform negative charge relative to their mass. When an electric field is applied, these SDS-bound proteins migrate through a polyacrylamide gel matrix toward the anode, with separation occurring primarily according to molecular weight [2]. Smaller proteins navigate the porous gel network more readily and migrate farther, while larger proteins remain closer to the origin. This provides a simple, rapid method for estimating protein size and semi-quantitative analysis through band intensity comparison [33] [2].
2D PAGE employs a two-step separation process that substantially enhances resolution. In the first dimension, proteins are separated based on their isoelectric point (pI) using isoelectric focusing (IEF). Proteins migrate through a pH gradient until they reach a pH where their net charge is zero (their pI) [5] [2]. This initial separation is followed by a second dimension where the IEF strip is placed on top of an SDS-PAGE gel, and proteins are separated orthogonal to the first dimension according to their molecular weight [5]. The result is a two-dimensional protein map where individual proteins appear as spots distributed across the gel surface rather than bands in a single lane, with each spot representing a unique combination of pI and molecular weight [5].
Comparative Technical Specifications
Table 1: Core Technical Differences Between 1D PAGE and 2D PAGE
| Parameter | 1D PAGE | 2D PAGE |
|---|---|---|
| Separation Principle | Molecular weight | Isoelectric point (pI) & molecular weight |
| Resolution Capacity | ~100 protein bands [2] | 1,000-5,000 protein spots [5] |
| Protein Attributes Revealed | Molecular weight information | pI, molecular weight, potential post-translational modifications [5] |
| Typical Analysis Output | Lanes of protein bands | 2D map of protein spots |
| Detection of Protein Isoforms | Limited | Excellent [5] [49] |
| Throughput | High | Medium to low [5] [50] |
| Technical Complexity | Low to moderate [33] | High [5] [50] |
Experimental Design and Methodologies
Standard 2D PAGE Workflow for Proteome Analysis
A robust 2D PAGE protocol requires careful execution at each step to ensure reproducible, high-quality results. The following methodology has been optimized for comprehensive proteome mapping:
Sample Preparation: Protein extraction is performed using appropriate lysis buffers containing chaotropes (e.g., 7-8 M urea, 2 M thiourea), non-ionic or zwitterionic detergents (e.g., 2-4% CHAPS), reducing agents (e.g., 50 mM DTT), and carrier ampholytes [5] [51]. For tissues, mechanical disruption via homogenization or sonication is typically required. Subsequent cleanup procedures, such as precipitation or filter-based methods, remove interfering substances like salts, lipids, and nucleic acids. Protein quantification is critical for loading consistency, with fluorescent assays being preferred over colorimetric methods when detergents are present [5].
First Dimension - Isoelectric Focusing: Immobilized pH gradient (IPG) strips (e.g., 7-24 cm, pH 3-10 linear or nonlinear) are rehydrated with sample-containing or sample-free buffer. IEF is performed using stepwise or gradient voltage programs optimized for the specific IPG strip length and pH range. Typical conditions for 24 cm strips might include: 30 V for 12-16 hours (active rehydration), stepwise increases to 1000 V over 1 hour, 8000 V over 30 minutes, and maintenance at 8000 V until reaching 50-80 kVh total [5]. Temperature-controlled focusing (20°C) minimizes protein precipitation and urea crystallization.
IPG Strip Equilibration: Following IEF, strips are equilibrated for 15-30 minutes in buffer containing 50 mM Tris-HCl (pH 8.8), 6 M urea, 30% glycerol, 2% SDS, and trace bromophenol blue. Initial equilibration includes 1% DTT to reduce proteins, followed by 2.5-4.5% iodoacetamide to alkylate cysteine residues [5].
Second Dimension - SDS-PAGE: Equilibrated IPG strips are sealed onto SDS-polyacrylamide gels (8-18% T, depending on protein size range) using agarose sealing solution. Electrophoresis is performed using standard Laemmli Tris-glycine-SDS or Tris-Tricine buffer systems, initially at low current (10-15 mA/gel) until proteins enter the resolving gel, then increased (20-40 mA/gel) until the dye front reaches the bottom [5] [2]. Temperature control (10-15°C) during running prevents overheating and gel distortion.
Protein Detection and Image Acquisition: Gels are stained with Coomassie Brilliant Blue, SYPRO Ruby, or silver nitrate depending on sensitivity requirements and downstream applications [5] [51]. Fluorescent stains like SYPRO Ruby offer the best combination of sensitivity (1-10 ng), dynamic range (3-4 orders of magnitude), and mass spectrometry compatibility [5] [51]. High-resolution digital imaging using CCD cameras or laser scanners captures the 2D protein spot patterns for subsequent analysis.
Advanced 2D-DIGE Methodology for Quantitative Profiling
Two-dimensional difference gel electrophoresis (2D-DIGE) represents a significant advancement for quantitative proteomics, minimizing gel-to-gel variation through multiplexed sample analysis [5] [49]. In this method:
Fluorescent Labeling: Up to three protein samples (e.g., control, treated, and internal standard) are minimally labeled with different cyanine dyes (Cy2, Cy3, Cy5) on lysine residues [49]. The internal standard, typically a pool of all samples, enables accurate cross-gel spot matching and normalization.
Electrophoresis and Imaging: Labeled samples are combined and separated on the same 2D gel, eliminating gel-to-gel variability [5]. The gel is sequentially imaged using wavelength-specific lasers to generate separate images for each sample, which are then overlaid for differential analysis.
DeCyder Software Analysis: Automated spot detection, background subtraction, and normalization algorithms quantify protein abundance changes with high statistical confidence, typically detecting differences as small as 1.2-fold with >90% confidence [49].
Performance Comparison and Experimental Data
Resolution and Protein Detection Capabilities
The superior resolving power of 2D PAGE is evident when comparing its protein detection capacity with 1D PAGE. While 1D SDS-PAGE typically resolves approximately 100 distinguishable bands in a complex mixture, 2D PAGE can separate between 1,000 to 5,000 protein spots from a single sample, with high-resolution modifications enabling even greater separation [5] [2]. This dramatic increase in resolution allows researchers to detect protein isoforms and post-translational modifications that appear as distinct spots with slightly different pI values and/or molecular weights on the 2D gel [5]. For example, phosphorylated proteins often appear as trains of spots shifted toward more acidic pI values compared to their non-phosphorylated counterparts [5].
Table 2: Quantitative Performance Comparison of 1D PAGE vs. 2D PAGE
| Performance Metric | 1D PAGE | 2D PAGE | Experimental Basis |
|---|---|---|---|
| Protein Capacity | ~100 bands [2] | 1,000-5,000 spots [5] | Comparative analysis of E. coli lysate separation |
| Reproducibility | High (CV <10%) [33] | Moderate (72% of spots with CV <20% across labs) [5] | Multi-laboratory reproducibility study |
| Dynamic Range | 2-3 orders of magnitude | 3-4 orders of magnitude (with fluorescent stains) [5] | SYPRO Ruby vs. Coomassie sensitivity comparison |
| Detection Sensitivity | 1-10 ng (silver stain) [5] | 0.1-1 ng (silver stain) [5] | Standard curve with serial protein dilution |
| Quantitative Accuracy | Semi-quantitative (band density) | Good (spot volume with internal standards in DIGE) [49] | DIGE vs. conventional 2D PAGE comparison |
| Sample Throughput | High (multiple samples per gel) | Low (1-3 samples per gel, DIGE) [5] [49] | Typical experiment duration comparison |
Applications in Biomarker Discovery and Disease Research
The application of 2D PAGE in neurological disease research demonstrates its unique capabilities in biomarker discovery. In studies of Alzheimer's disease and Creutzfeldt-Jakob disease, 2D PAGE has successfully identified changes in protein expression patterns that correlate with disease progression [48]. For example, analysis of cerebrospinal fluid (CSF) proteins using 2D PAGE revealed specific spot pattern alterations that distinguished diseased from control samples, leading to the identification of potential diagnostic biomarkers [48]. Similarly, in cancer research, 2D PAGE has facilitated the discovery of protein signatures associated with tumor progression and response to therapy [5]. The compatibility of 2D PAGE with mass spectrometric identification enables rapid characterization of these differentially expressed proteins, bridging the gap between protein detection and identification [5] [48].
Technical Challenges and Limitations
Key Limitations of 2D PAGE Technology
Despite its powerful separation capabilities, 2D PAGE faces several technical challenges that can impact its utility in comprehensive proteome analysis:
Reproducibility Issues: While the implementation of immobilized pH gradients (IPG) has significantly improved reproducibility compared to carrier ampholyte-based systems, 2D PAGE still exhibits greater variability than 1D approaches [5] [50]. Inter-laboratory studies show that approximately 72% of protein spots demonstrate coefficient of variation (CV) values below 20% across different laboratories, compared to typically less than 10% CV for band migration in 1D PAGE [5] [33].
Limited Dynamic Range: The presence of highly abundant proteins can mask low-abundance species, restricting the effective dynamic range of 2D PAGE [5]. While pre-fractionation methods and abundant protein depletion strategies can partially address this limitation, the detection sensitivity does not fully align with the actual dynamic range of protein concentrations in biological samples [5].
Hydrophobic and Extreme Protein Separation: Membrane proteins with high hydrophobicity remain challenging to separate using standard 2D PAGE protocols due to solubility issues during IEF [5]. Similarly, proteins with extreme pI values (<3 or >10) or very high molecular weights (>200 kDa) are typically underrepresented on standard 2D gels [5] [51].
Throughput and Technical Demands: 2D PAGE is labor-intensive and requires significant technical expertise for troubleshooting and optimization [5] [50]. The multi-step process typically spans 2-3 days for completion, making it less suitable for high-throughput screening applications compared to 1D PAGE, which can be completed in a few hours [33].
Decision Framework for Method Selection
Essential Research Reagents and Materials
Successful 2D PAGE experiments require specific reagents optimized for two-dimensional separation. The following table details key components and their functions in the workflow.
Table 3: Essential Research Reagents for 2D PAGE Experiments
| Reagent Category | Specific Examples | Function | Technical Notes |
|---|---|---|---|
| Chaotropes | Urea, Thiourea | Protein denaturation & solubilization | Typically 7-8 M urea + 2 M thiourea; prevent heating >37°C [5] |
| Detergents | CHAPS, Triton X-114, SB 3-10 | Solubilize hydrophobic proteins | Zwitterionic detergents preferred; concentration 2-4% [5] |
| Reducing Agents | DTT, DTE, TCEP | Disrupt disulfide bonds | 50-100 mM DTT; fresh preparation critical [5] |
| Alkylating Agents | Iodoacetamide | Cysteine alkylation | 2.5-4.5% after reduction; protect from light [5] |
| Carrier Ampholytes | Bio-Lyte, Pharmalyte | Enhance solubility & stabilize pH gradient | 0.5-2% concentration; appropriate pH range [5] |
| IPG Strips | Immobilized pH gradient strips | First dimension separation | Various lengths (7-24 cm) & pH ranges (narrow/broad) [5] |
| Staining Reagents | SYPRO Ruby, Coomassie, Silver nitrate | Protein visualization | SYPRO Ruby: MS-compatible, 1-10 ng sensitivity [5] [51] |
The comparative analysis of 1D and 2D PAGE technologies reveals a clear trade-off between analytical depth and practical expediency. While 1D SDS-PAGE offers simplicity, reproducibility, and throughput advantages for routine protein separation and molecular weight determination, 2D PAGE provides unparalleled resolution for comprehensive proteome mapping and biomarker discovery. The unique ability of 2D PAGE to resolve protein isoforms and post-translational modifications makes it particularly valuable for detecting subtle molecular changes in disease states [5] [48]. Technological advancements such as 2D-DIGE have further enhanced the quantitative capabilities of 2D PAGE, addressing some of its historical limitations in reproducibility [49]. For researchers pursuing high-resolution proteome mapping, 2D PAGE remains an indispensable tool despite its technical challenges, especially when combined with mass spectrometric identification for comprehensive protein characterization. The complementary strengths of these electrophoretic methods suggest that rather than representing competing technologies, they form a hierarchical analytical approach that can be selectively applied based on specific research objectives and sample characteristics.
Comparison of 1D PAGE vs 2D PAGE for Proteomic Analysis Research
Polyacrylamide gel electrophoresis (PAGE) serves as a fundamental tool in proteomic research for separating complex protein mixtures. The choice between one-dimensional (1D) and two-dimensional (2D) PAGE represents a critical methodological decision that directly impacts protein separation efficiency, detection capability, and analytical outcomes. 1D PAGE, typically performed as SDS-PAGE, separates proteins primarily by molecular weight under denaturing conditions [2]. In this method, the anionic detergent sodium dodecyl sulfate (SDS) binds to proteins in a constant weight ratio, imparting a uniform negative charge that causes proteins to migrate through the polyacrylamide gel matrix at rates inversely proportional to their molecular weight [2] [40]. The resulting separation produces distinct protein bands along a single dimension, with smaller proteins migrating faster and larger proteins remaining closer to the origin [4].
In contrast, 2D PAGE employs two orthogonal separation steps to resolve proteins based on different physicochemical properties. The first dimension separates proteins according to their isoelectric point (pI) using isoelectric focusing (IEF), where proteins migrate through a pH gradient until they reach their pI (the pH at which they carry no net charge) [4] [5]. The second dimension then separates these focused proteins by molecular weight using standard SDS-PAGE [2] [5]. This two-step process results in proteins being distributed across a two-dimensional gel surface rather than linear bands, with each spot theoretically representing an individual protein or post-translationally modified variant [5]. The fundamental distinction between these techniques lies in their separation principles: 1D PAGE utilizes a single parameter (molecular weight), while 2D PAGE employs two independent parameters (pI and molecular weight) to achieve superior resolution of complex protein mixtures [4].
Performance Comparison for Proteomic Applications
Resolution and Protein Identification Capability
The resolution capacity of 2D PAGE significantly exceeds that of 1D PAGE, making it the preferred method for analyzing complex protein mixtures. Where 1D SDS-PAGE might separate proteins into dozens of distinguishable bands, 2D PAGE can resolve thousands of individual protein spots from a single sample [5]. This high-resolution separation allows researchers to detect protein isoforms and post-translational modifications that appear as distinct spots with slightly different pI values or molecular weights [5]. In comparative proteomics studies, this resolving power translates to more comprehensive protein detection, with one study reporting 2D PAGE identifying 4,323 proteins from human bronchial smooth muscle cells compared to 2,552 proteins detected by 1D SDS-PAGE when both were coupled with LC-MS/MS analysis [23].
The enhanced resolution of 2D PAGE comes with important practical considerations for detection sensitivity. The dynamic range of 2D PAGE is constrained by the detection method employed, with Coomassie staining detecting approximately 100 ng of protein, colloidal Coomassie about 10 ng, and highly sensitive fluorescent dyes or silver staining detecting below 1 ng [5]. This limitation means highly abundant proteins can mask faint spots representing low-abundance proteins, though pre-fractionation methods or abundant protein depletion strategies can mitigate this issue [5]. For 1D PAGE, the simpler band pattern presents less risk of overlap, but the technique cannot distinguish proteins with similar molecular weights but different pI values.
Table 1: Performance Comparison of 1D PAGE vs. 2D PAGE for Proteomic Analysis
| Parameter | 1D PAGE | 2D PAGE |
|---|---|---|
| Separation Principle | Molecular weight only [4] | Isoelectric point (pI) and molecular weight [4] |
| Maximum Proteins Resolved | Dozens of bands | Up to 5,000 protein spots [5] |
| Detection of PTMs | Limited | High (detects shifts in pI and MW) [5] |
| Reproducibility | High | Moderate to high (improved with IPG strips) [5] |
| Sample Throughput | High (rapid analysis) | Low (labor-intensive) [5] |
| Hands-on Time | Low | High (multi-day process) [28] [5] |
| Cost per Analysis | Low [4] | High [4] |
| Technical Expertise Required | Basic | Advanced [5] |
| Compatibility with MS Analysis | High (in-gel digestion) [28] | High (in-gel digestion) [5] |
Application-Specific Performance Metrics
The performance of 1D and 2D PAGE varies significantly depending on the specific proteomic application, with each technique offering distinct advantages for different research objectives. For differential expression studies, 1D SDS-PAGE provides advantages in visualizing quantity differences between samples when combined with quantitative LC-MS/MS [23]. The linear band pattern simplifies densitometric analysis and comparison across multiple samples run on the same gel. Furthermore, 1D PAGE demonstrates superior performance for analyzing membrane proteins, with one study showing better detection of transmembrane proteins in the precipitate fraction of cell lysates [23].
For post-translational modification (PTM) analysis, 2D PAGE offers unique capabilities due to its sensitivity to changes in both molecular weight and isoelectric point. Phosphorylation, glycosylation, and other common PTMs frequently alter protein pI, causing horizontal shifts in the 2D gel pattern that enable detection without additional enrichment steps [5]. This visualization of protein charge variants provides direct evidence of modification status that 1D PAGE cannot offer. Additionally, nondenaturing 2D PAGE can reveal protein-protein interactions by preserving native protein complexes during separation [23].
In mass spectrometry-based proteomics, both techniques serve as effective prefractionation methods, though with different trade-offs. The simplified protein bands from 1D PAGE are easily excised for in-gel digestion, making the technique accessible for most laboratories [28]. For 2D PAGE, the spot patterns require more expertise for accurate excision, but the reduced complexity of individual spots can improve protein identification rates in downstream MS analysis [5]. When processing time is considered, 1D PAGE offers clear advantages, with typical runs requiring 1-2 hours compared to the multi-day process for 2D PAGE, which includes overnight rehydration, 5-6 hours of isoelectric focusing, and subsequent SDS-PAGE separation [28].
Table 2: Application-Based Method Selection Guide
| Research Application | Recommended Method | Rationale |
|---|---|---|
| Routine Protein Separation | 1D PAGE | Faster, easier to set up, lower cost [4] |
| Complex Mixture Analysis | 2D PAGE | Higher resolution, separates thousands of proteins [5] |
| Post-Translational Modification Detection | 2D PAGE | Detects pI and MW shifts from modifications [5] |
| Membrane Protein Studies | 1D PAGE | Better for hydrophobic/transmembrane proteins [23] |
| Differential Expression Screening | 1D PAGE | Advantages in visualizing quantity differences between samples [23] |
| Protein-Protein Interaction Studies | 2D PAGE (native) | Preserves protein complexes and interactions [23] |
| High-Abundance Protein Analysis | Either | Both methods suitable |
| Low-Abundance Protein Detection | 2D PAGE with sensitive staining | Higher sensitivity with fluorescent dyes [5] |
Experimental Protocols and Workflows
1D SDS-PAGE Methodology
The standard 1D SDS-PAGE protocol begins with sample preparation using Laemmli buffer containing SDS and a reducing agent such as dithiothreitol (DTT) or tris(2-carboxyethyl)phosphine (TCEP) [40] [28]. Proteins are denatured by heating at 70-100°C for 5-10 minutes, which ensures complete unfolding and binding of SDS to create uniformly negatively charged protein-SDS complexes [2]. The gel cassette is assembled in a vertical electrophoresis apparatus, typically consisting of a stacking gel (pH ~6.8) layered above a resolving gel (pH 8.0-9.0) with different acrylamide concentrations optimized for the target protein size range [2]. Common resolving gel concentrations include 15% for low molecular weight proteins (10-50 kDa), 12% for medium range proteins (40-100 kDa), and 10% for larger proteins (>70 kDa) [40].
During electrophoresis, proteins migrate through the large-pore stacking gel where they become concentrated into a tight band before entering the resolving gel [2]. The separation occurs in the resolving gel where the smaller pore size creates a molecular sieving effect, retarding larger proteins while allowing smaller proteins to migrate more freely [2]. The process is typically completed within 1-2 hours, after which proteins are visualized using stains like Coomassie Brilliant Blue or Silver Stain, or transferred to membranes for western blotting [40]. For mass spectrometric analysis, protein bands are excised, destained, and subjected to in-gel digestion with trypsin or other proteases to generate peptides for LC-MS/MS identification [28].
2D PAGE Methodology
The 2D PAGE workflow is substantially more complex and time-consuming, typically spanning two days [28]. On the first day, protein samples are dissolved in rehydration buffer containing chaotropes (urea, thiourea), detergents (CHAPS, SB-104), reducing agents, and carrier ampholytes [5]. Immobilized pH gradient (IPG) strips are rehydrated with this protein solution for 8-16 hours, typically overnight [28]. For complex samples stained with Coomassie, approximately 100 μg of protein is loaded, though this amount varies based on stain sensitivity, IPG range, and downstream applications [28].
On the second day, isoelectric focusing (IEF) is performed using programmed voltage steps that gradually increase to high voltages (up to 8000 V) over 5-6 hours to achieve sufficient volt-hours for proper protein separation [28] [5]. Following IEF, the IPG strips are equilibrated in two steps: first in a buffer containing reducing agent (DTT or TCEP) to break disulfide bonds, then in alkylating agent (iodoacetamide) to prevent reformation of disulfides [28]. The strips are then rinsed in SDS running buffer and placed atop SDS-PAGE gels, sealed with agarose, and electrophoresis is performed perpendicular to the first dimension separation [28]. After separation, gels are stained with compatible dyes (SYPRO Ruby, Flamingo, or silver stain) and imaged using appropriate instrumentation [5]. Protein spots of interest are excised, digested, and identified by mass spectrometry, or transferred to membranes for immunodetection [5].
Advanced Technical Considerations
Detection of Post-Translational Modifications
The superior capability of 2D PAGE for PTM analysis stems from its two-dimensional separation mechanism, which can detect subtle changes in both molecular weight and isoelectric point that frequently accompany post-translational modifications [5]. Phosphorylation events add negatively charged phosphate groups to proteins, significantly shifting their pI toward more acidic values while causing minimal changes in molecular weight. This results in horizontal spot shifts in 2D gels that are easily detectable [5]. Similarly, glycosylation modifications add substantial mass with minimal charge alteration, producing vertical shifts in the 2D pattern. Acetylation, methylation, and other charge-altering modifications create distinct horizontal displacement patterns that enable researchers to identify and characterize multiple PTM states simultaneously [5].
For comprehensive PTM analysis, 2D DIGE (Difference Gel Electrophoresis) technology represents a significant advancement that improves quantification accuracy and reduces gel-to-gel variability [5]. In this approach, multiple protein samples are labeled with different fluorescent cyanine dyes (Cy2, Cy3, Cy5) and separated on the same 2D gel [5]. The co-separation eliminates quantitative artifacts caused by gel variations and enables direct spot intensity comparisons across samples. Software-based analysis detects statistically significant changes in PTM patterns between experimental conditions, making 2D DIGE particularly valuable for biomarker discovery and drug response studies where post-translational regulation plays a crucial functional role [5].
Methodological Limitations and Troubleshooting
Both 1D and 2D PAGE present specific technical challenges that researchers must address for successful proteomic analysis. 1D SDS-PAGE commonly exhibits issues such as smiling bands (caused by improper buffer composition or excessive voltage), smeared bands (from insufficient reduction/denaturation or high salt concentrations), and multiple bands from degraded or modified proteins [40]. These problems can be mitigated by using fresh reducing agents, maintaining salt concentrations below 500 mM, adding protease and phosphatase inhibitors, and verifying protein integrity before analysis [40].
2D PAGE faces more complex challenges, including difficulty separating hydrophobic membrane proteins and extreme pI proteins, low reproducibility between gels, and limited dynamic range [5]. The hydrophobic nature of membrane proteins causes precipitation during IEF, but this can be improved using specialized detergents like Triton X-114, CHAPS, or benzyldimethyl-n-hexadecylammonium chloride [5]. Reproducibility issues, particularly cathodic drift of basic proteins, have been largely addressed through immobilized pH gradient (IPG) strips that provide stable pH gradients [5]. The limited dynamic range, where abundant proteins mask scarce ones, can be improved by prefractionation methods, depletion of highly abundant proteins, or using oversized gels (24 cm) with high-sensitivity fluorescent dyes [5].
Essential Research Reagent Solutions
Successful implementation of either electrophoretic method requires careful selection of reagents and materials optimized for specific applications. The following table details key components essential for both techniques.
Table 3: Essential Research Reagents for PAGE-Based Proteomics
| Reagent/Material | Function | Application Notes |
|---|---|---|
| Acrylamide/Bis-acrylamide | Forms porous gel matrix for separation | Concentration determines pore size; higher % for smaller proteins [2] |
| SDS (Sodium Dodecyl Sulfate) | Denatures proteins and confers negative charge | Critical for molecular weight-based separation in both 1D and 2D PAGE [2] [40] |
| DTT or TCEP | Reduces disulfide bonds | TCEP preferred for stability and broader pH range; DTT avoided in IEF due to charge [28] |
| IPG Strips | Provides stable pH gradient for IEF | Available in various pH ranges (broad 3-10 or narrow) and lengths (7-24 cm) [28] [5] |
| Urea/Thiourea | Chaotropic agents for protein solubilization | Essential for denaturing proteins in first dimension of 2D PAGE [5] |
| CHAPS/SB-104 | Zwitterionic detergents for solubility | Prevents protein aggregation during IEF while compatible with pH gradient [5] |
| Coomassie/SYPRO Ruby | Protein staining | Coomassie for abundant proteins; fluorescent dyes for higher sensitivity [5] |
| Molecular Weight Markers | Size calibration standards | Essential for estimating protein molecular weight in both dimensions [2] [40] |
The choice between 1D and 2D PAGE for proteomic analysis depends primarily on research objectives, sample complexity, and available resources. 1D SDS-PAGE offers a rapid, straightforward approach for routine protein separation, molecular weight determination, and analysis of less complex mixtures, with particular utility for membrane protein studies and differential expression screening [23] [40]. Its simplicity, reproducibility, and compatibility with downstream mass spectrometry make it an accessible choice for most laboratories. Conversely, 2D PAGE provides unparalleled resolution for complex protein mixtures, enabling simultaneous analysis of thousands of proteins including their post-translationally modified forms [5]. This comprehensive profiling capability comes at the cost of increased technical complexity, longer processing times, and higher reagent expenses [4] [5].
For researchers focusing on post-translational modification analysis, 2D PAGE remains a powerful tool due to its unique ability to detect charge and mass alterations resulting from common modifications [5]. The visual mapping of protein isoforms provides immediate insight into modification states that would require multiple orthogonal techniques to achieve with 1D separation. For differential expression studies, the optimal choice depends on the experimental design: 1D PAGE coupled with quantitative LC-MS/MS offers advantages for comparing limited numbers of samples [23], while 2D DIGE provides superior statistical power for complex experimental designs with multiple conditions [5]. As proteomic technologies continue to evolve, both methods maintain their relevance as foundational techniques that enable comprehensive protein characterization in basic research and drug development.
Overcoming Technical Challenges: Optimization and Troubleshooting for Both Methods
Protein gel electrophoresis is a standard laboratory technique by which charged protein molecules are transported through a solvent by an electrical field, serving as a simple, rapid, and sensitive analytical tool for protein separation [42]. Among the various forms of polyacrylamide gel electrophoresis (PAGE), one-dimensional sodium dodecyl sulfate PAGE (1D SDS-PAGE) represents the most widely used electrophoresis technique, providing a fundamental step in many kinds of proteomics analysis [42]. In SDS-PAGE, the ionic detergent SDS denatures and binds to proteins, making them uniformly negatively charged, which causes them to migrate through the gel toward the positively charged electrode primarily by mass [42].
However, despite its widespread use and simplicity, researchers frequently encounter technical challenges that can compromise data quality and interpretation. This guide objectively examines common 1D PAGE issues—band streaking, poor resolution, and artifact formation—within the broader context of proteomic analysis research, comparing its capabilities with two-dimensional PAGE (2D-PAGE). For drug development professionals and researchers, understanding these limitations is crucial for selecting appropriate separation technologies for specific applications, particularly when analyzing complex protein samples or post-translational modifications.
Fundamental Principles of 1D and 2D PAGE
1D PAGE Methodology
The most common form of protein gel electrophoresis is comparative analysis of multiple samples by one-dimensional (1D) electrophoresis [42]. In 1D SDS-PAGE, proteins are denatured and linearized, then separated based primarily on molecular weight as they migrate through a polyacrylamide gel matrix under an electric field [17]. The polyacrylamide gel serves as a porous medium that behaves like a molecular sieve, with pore size inversely related to the polyacrylamide percentage [42]. Low-percentage gels (e.g., 7%) have larger pores and resolve large proteins, while high-percentage gels (e.g., 12%) have smaller pores and resolve small proteins [42]. A key feature of the standard 1D SDS-PAGE system is the use of a stacking gel with lower concentration acrylamide, lower pH, and different ionic content that concentrates proteins into a tight band before they enter the resolving portion of the gel [42].
2D PAGE Methodology
Two-dimensional polyacrylamide gel electrophoresis (2D-PAGE) represents a high-resolution protein separation technique that combines two orthogonal separation principles [17]. The first dimension separates proteins according to their native isoelectric point (pI) using isoelectric focusing (IEF), while the second dimension separates by mass using ordinary SDS-PAGE [42]. To perform IEF, a pH gradient is established in a tube or strip gel using a specially formulated buffer system or ampholyte mixture [42]. This technique, pioneered by Patrick H. O'Farrell, can resolve thousands of distinct protein species within the same gel system, providing exceptional resolution for protein analysis [17]. The ability of 2D-PAGE to resolve highly complex isoform patterns makes it particularly suitable for analyzing post-translational modifications [45].
Comparative Workflow Visualization
The following diagram illustrates the key procedural differences between 1D PAGE and 2D PAGE workflows, highlighting the additional complexity of the 2D approach:
Common 1D PAGE Issues: Causes and Experimental Solutions
Band Streaking
Band streaking appears as vertical smears instead of sharp, defined bands and significantly compromises data interpretation.
- Cause: Improper Sample Preparation → Proteases acting at room temperature before heat denaturation can cause protein degradation, while insufficient SDS or thiol reagents lead to incomplete denaturation [52] [53]. Excess salt in the sample (exceeding 50-100 mM) creates conductivity issues, and insoluble material in the sample causes heterogeneous migration [52] [53].
Experimental Solution → Heat samples immediately (75-100°C for 5 minutes) after adding SDS sample buffer to inactivate proteases [53]. Ensure proper SDS-to-protein ratio (at least 3:1) and use fresh reducing agents [52] [53]. Remove excess salt by dialysis, desalting columns, or precipitation, and clarify samples by centrifugation (17,000 × g for 2 minutes) to remove insoluble material [52] [53].
Cause: Gel Polymerization Issues → Insufficient polymerization of the polyacrylamide gel creates uneven matrices, while expired gels or improper storage conditions cause gel degradation [52].
- Experimental Solution → Use fresh ammonium persulfate (APS) and TEMED for proper polymerization [42] [53]. Ensure gels are stored properly at 4°C and not used beyond expiration date [52]. Verify polyacrylamide solution integrity and avoid oxygen contamination during polymerization [53].
Poor Resolution
Poor resolution manifests as blurred, poorly separated bands that hinder accurate molecular weight determination and protein identification.
- Cause: Electrophoresis Conditions → Voltage set too high generates excessive heat, causing band distortion and smiling effects [54]. Running the gel too briefly prevents adequate separation, while incorrect buffer concentration or pH impairs proper charge-based separation [52] [54].
Experimental Solution → Run gels at recommended voltages (typically 10-15 V/cm gel length) and ensure adequate running time until the dye front reaches the bottom [54]. Use freshly prepared running buffer at correct concentration and pH [54]. For heat-sensitive separations, run in a cold room or use a cooled apparatus [52].
Cause: Gel Selection and Protein Load → Using a gel percentage inappropriate for the target protein size range prevents optimal separation [42] [52]. Overloading wells with too much protein (especially problematic with sensitive stains like silver stain) creates overcrowded lanes, while underloading makes detection difficult [53].
- Experimental Solution → Select appropriate gel percentage: 7-10% for high molecular weight proteins (>100 kDa), 10-12% for average proteins (30-100 kDa), and 12-15% for small proteins (<30 kDa) [42]. Optimize protein load: 0.5-4.0 μg for purified proteins, 40-60 μg for crude samples with Coomassie staining, and less for silver staining [53]. For broad size ranges, use gradient gels (e.g., 4-20%) [42].
Artifact Formation
Artifacts encompass various unexpected patterns including ghost bands, smiling bands, and horizontal band distortion.
- Cause: Contamination and Chemical Artifacts → Keratin contamination from skin, dander, or contaminated buffers appears as heterogeneous clusters around 55-65 kDa [53]. Carbamylation occurs from urea breakdown to cyanate, modifying protein charge [53]. Leaching of chemicals from plasticware introduces unknown contaminants [53].
Experimental Solution → Wear gloves, use filtered tips, and aliquot buffers to prevent keratin contamination [53]. For urea solutions, use fresh urea, treat with mixed-bed resins, or add scavengers like glycylglycine to minimize carbamylation [53]. Wash plasticware with methanol or DMSO before use to remove manufacturing chemicals [53].
Cause: Temperature and Operational Factors → Excessive heat generation during electrophoresis causes "smiling" bands where bands curve upward at the edges [54]. Edge effects from empty peripheral wells distort bands in outer lanes [54]. Delay between sample loading and current application allows sample diffusion [54].
- Experimental Solution → Maintain consistent temperature by using cooled systems, lower voltages, or ice packs [54]. Load all wells with samples or buffer to prevent edge effects [54]. Minimize time between loading and starting electrophoresis [54].
Comparative Experimental Data: 1D PAGE vs. 2D PAGE
Resolution Capability for Protein Isoforms
A comparative study analyzing phosphorylated ovalbumin demonstrated significant differences in resolution capability between 1D PAGE, 2D PAGE, and liquid chromatography [45]. The experimental protocol involved separating ovalbumin using each technique, followed by tryptic digestion and MALDI-TOF mass spectrometry for phosphorylation site analysis [45].
Table 1: Resolution of Ovalbumin Isoforms by Different Separation Techniques
| Separation Technique | Number of Resolved Isoforms | Key Findings |
|---|---|---|
| 1D SDS-PAGE | 3 bands | One main band at ~46 kDa and a minor double band at 41 kDa; no significant differences in sequence coverage between bands [45] |
| 2D IEF-SDS-PAGE | 11 major spots | Demonstrated complex pattern with different phosphorylation states; superior resolution of protein isoforms [45] |
| Reversed-Phase LC (PS-DVB columns) | Limited resolution | Low resolution for analysis of post-translational modifications; faster but less informative for PTM characterization [45] |
Technical Comparison for Proteomic Applications
When selecting an electrophoresis method for proteomic research, researchers must consider multiple technical parameters and their implications for experimental outcomes.
Table 2: Technical Comparison of 1D PAGE vs. 2D PAGE for Proteomic Analysis
| Parameter | 1D PAGE | 2D PAGE |
|---|---|---|
| Separation Principle | Molecular weight [42] | First dimension: isoelectric point; Second dimension: molecular weight [42] |
| Resolution Capacity | Limited; typically 50-100 bands [17] | High; thousands of protein spots [17] |
| PTM Analysis | Limited capability [45] | Excellent for phosphorylation, glycosylation, and other charge-modifying PTMs [45] [17] |
| Sample Throughput | High; multiple samples per gel [42] | Lower; typically one sample per gel [17] |
| Technical Complexity | Low; simple protocol [42] | High; requires specialized expertise [17] |
| Reproducibility | High [42] | Moderate; requires strict standardization [17] |
| Dynamic Range | Limited for complex samples [17] | Broader separation range [17] |
| Protein Recovery | Good for western blotting [42] | Possible but more challenging [42] |
| Required Equipment | Standard electrophoresis setup [42] | IEF equipment, specialized gel setups [42] |
The Scientist's Toolkit: Essential Research Reagents and Materials
Successful electrophoresis experiments require high-quality reagents and proper equipment. The following table details essential materials and their functions for both 1D and 2D PAGE workflows.
Table 3: Essential Research Reagents and Materials for PAGE Experiments
| Reagent/Material | Function | Application Notes |
|---|---|---|
| Acrylamide/Bis-acrylamide | Forms cross-linked polymer network for molecular sieving [42] | Ratio determines pore size; typically 37.5:1 or 29:1 acrylamide:bis-acrylamide [42] |
| Ammonium Persulfate (APS) | Polymerizing agent for polyacrylamide gels [42] | Use fresh solutions; concentration affects polymerization rate [42] |
| TEMED | Catalyzes polymerization by promoting free radical production [42] | Critical for gel formation; concentration affects polymerization speed [42] |
| SDS (Sodium Dodecyl Sulfate) | Denatures proteins and confers uniform negative charge [42] | Essential for SDS-PAGE; ensures separation by molecular weight [42] |
| DTT or β-mercaptoethanol | Reducing agents that break disulfide bonds [52] | Use fresh solutions; prevents re-oxidation during run [52] |
| Ampholytes | Establish pH gradient for isoelectric focusing [55] | Critical for 2D-PAGE; choice of pH range depends on sample [55] |
| Tris-based Buffers | Maintain pH during electrophoresis [42] | Tris-glycine for running buffer; Tris-HCl for gel buffers [42] |
| Urea | Protein denaturant for IEF samples [53] | Minimize cyanate contamination; use with scavengers for sensitive samples [53] |
| Protein Molecular Weight Markers | Reference standards for size determination [42] | Include both broad-range and precision markers for accurate quantification [42] |
This comparison demonstrates that both 1D PAGE and 2D PAGE offer distinct advantages and limitations for proteomic analysis. While 1D PAGE provides a rapid, straightforward approach for routine protein separation and molecular weight estimation, it exhibits significant limitations in resolving complex protein mixtures and characterizing post-translational modifications. The common issues of band streaking, poor resolution, and artifact formation can be mitigated through careful attention to sample preparation, electrophoresis conditions, and reagent quality, but fundamental resolution limitations remain.
For research applications requiring comprehensive protein characterization, particularly in biomarker discovery and PTM analysis, 2D PAGE offers superior resolution capabilities despite its technical complexity [45] [17]. The experimental data clearly shows that 2D PAGE can resolve numerous protein isoforms that remain undetected by 1D PAGE [45]. However, for high-throughput screening, quality control applications, and initial protein characterization, 1D PAGE remains an invaluable tool in the proteomics workflow. Researchers should select their separation methodology based on experimental objectives, considering the trade-offs between resolution, throughput, and technical requirements to ensure optimal outcomes for their specific proteomic research needs.
In the field of proteomics, two-dimensional polyacrylamide gel electrophoresis (2D PAGE) stands as a powerful high-resolution technique for separating complex protein mixtures. First developed from the pioneering work of Patrick H. O'Farrell, this method separates proteins in two sequential steps: first by their isoelectric point (pI) using isoelectric focusing (IEF), and second by their molecular weight using SDS-PAGE [17]. This orthogonal separation approach can resolve thousands of distinct protein species within the same gel system, providing invaluable information about their relative molecular mass, pI value, and abundance [17]. Consequently, 2D PAGE has played an essential role in proteomic studies across diverse fields, from skeletal muscle biochemistry [17] to pharmaceutical development [56].
However, despite its impressive resolving power, 2D PAGE is technically demanding and prone to specific artifacts that can compromise data quality. Among the most common and frustrating problems are protein streaking, spot smearing, and incomplete focusing [57]. These issues are particularly problematic in comparative proteomic studies, where precise quantification of protein expression changes is crucial. This guide objectively examines these technical challenges within the broader context of comparing 1D PAGE and 2D PAGE for proteomic analysis, providing experimental data and methodologies to help researchers optimize their separation outcomes.
Table 1: Fundamental Differences Between 1D PAGE and 2D PAGE
| Parameter | 1D PAGE (SDS-PAGE) | 2D PAGE |
|---|---|---|
| Separation Principle | Molecular weight | Isoelectric point (1st dimension) & Molecular weight (2nd dimension) |
| Dimensions | Single dimension | Two orthogonal dimensions |
| Proteins Resolved | Typically <100 | Thousands of protein spots [17] |
| Information Obtained | Molecular weight, purity, abundance | Molecular weight, pI, post-translational modifications [17] |
| Throughput | High | Medium to Low |
| Technical Complexity | Low | High |
| Common Applications | Protein size determination, Western blotting, purity checks [2] | Proteomic profiling, biomarker discovery, post-translational modification analysis [17] |
Technical Challenges in 2D PAGE: Causes and Experimental Identification
The complex nature of 2D PAGE introduces multiple potential failure points throughout the experimental workflow. Understanding the root causes of common artifacts is essential for effective troubleshooting.
Horizontal Streaking
Horizontal streaking primarily occurs during the first dimension (IEF) and appears as horizontal smears across the gel. The most prevalent causes include:
- Incomplete or Excessive IEF: Incomplete focusing prevents proteins from reaching their pI, causing streaks, while overfocusing beyond approximately 100,000 Vhr can induce electroosmosis and water transport, leading to horizontal streaks [57].
- Protein Overloading: Excessive total protein or the presence of highly abundant proteins (e.g., serum albumin comprising 70-90% of serum protein) can lead to aggregation and precipitation at the protein's pI ("pI fallout"), resulting in horizontal streaking [57].
- Sample Preparation Problems: Ionic contaminants such as salts, detergents, nucleic acids, and lipids are major contributors. These contaminants increase current during IEF, limit voltage, prolong run times, and ultimately cause underfocusing and streaking [57].
- Poor Protein Solubilization: Inadequate solubilization of all proteins in the sample, particularly hydrophobic membrane proteins, will result in horizontal streaking due to incomplete entry and migration during IEF [57].
Vertical Streaking
Vertical streaking manifests in the second dimension (SDS-PAGE) and appears as vertical smears descending from well-resolved spots.
- Ineffective Equilibration: After IEF, proteins must be coated with SDS during equilibration to become soluble for the second dimension. Omission of key components like glycerol (should be ≥20%) or insufficient SDS concentration (<2%) can prevent proper resolubilization, causing vertical streaking [57].
- Protein Overloading: Large protein quantities or highly abundant proteins may not fully resolubilize during equilibration, leading to vertical streaking and tailing of intense spots [57].
- Protein Oxidation: Oxidative crosslinking during the second dimension separation can cause vertical streaking. Proper reduction and alkylation of cysteine sulfhydryl groups is crucial to prevent this [57].
Spot Smearing and Incomplete Focusing
Spot smearing and incomplete focusing represent a failure of proteins to focus into discrete, sharp spots at their correct pI positions.
- Incomplete Focusing: This can result from running samples with very different conductivities together in the same IEF tray, as more conductive samples draw most of the current and decrease the focusing rate of others [57].
- Disulfide Bond Formation: Random intra- and intermolecular disulfide bond formation creates various protein configurations, appearing as spot tails, phantom spots, missing spots, and smearing [57].
- Carbamylation: Using low-purity urea or heating samples above 30°C can lead to carbamylation of polypeptides, generating charge heterogeneity and smearing between spots, particularly when broad pH gradients are used [57].
Diagram 1: 2D PAGE Technical Challenges and Their Relationships. This flowchart maps the primary artifacts in 2D PAGE to their root causes and recommended solutions.
Comparative Experimental Data: 1D PAGE vs. 2D PAGE Performance
To objectively compare the performance characteristics of 1D PAGE versus 2D PAGE, we summarize key quantitative and qualitative metrics from experimental observations.
Table 2: Performance Comparison Between 1D PAGE and 2D PAGE in Proteomic Analysis
| Performance Metric | 1D PAGE | 2D PAGE | Experimental Evidence |
|---|---|---|---|
| Number of Proteins Resolved | Limited (typically <100 bands) | High (thousands of spots) [17] | 2D-IEF/SDS-PAGE successfully employed to identify several thousand muscle-associated protein species [17] |
| Detection of Low-Abundance Proteins | Limited without prior fractionation | Limited to high-abundance proteins without prefractionation [56] | 2D-PAGE combined with MS detects only the most abundant proteins [56] |
| Resolution of Protein Isoforms/PTMs | Limited | Excellent | 2D-GE method is efficient for separation of different protein isoforms with dynamic post-translational modifications [17] |
| Reproducibility | High | Medium (requires strict protocol standardization) | Gel-to-gel variability is a known challenge in 2D PAGE [17] |
| Technical Variability | Low | High | Multiple steps (IEF, equilibration, SDS-PAGE) introduce potential variability [57] |
| Sample Throughput | High (multiple samples per gel) | Low (typically one sample per gel) | Small 1D PAGE gels require less time and reagents than larger 2D PAGE counterparts [2] |
| Hands-on Time | Low | High | 2D PAGE requires multiple manual steps over 1-2 days [57] |
Detailed Methodologies for Key Experiments
Standard 2D PAGE Protocol for Proteomic Analysis
The following methodology outlines a standard 2D PAGE workflow suitable for most proteomic applications, with specific notes for troubleshooting common artifacts:
Sample Preparation:
- Extract proteins using appropriate lysis buffer containing 8-9 M urea, 2-4% CHAPS or other zwitterionic detergent, 50-100 mM DTT or other reducing agent, and carrier ampholytes [57] [17].
- For difficult samples, include additional solubilizing agents such as thiourea (2 M) or novel detergents like amidosulfobetaine-14 (ASB-14) for membrane proteins [57].
- Remove insoluble material by centrifugation at 15,000-20,000 × g for 15-30 minutes.
- Determine protein concentration using compatible assays (e.g., Bradford, BCA).
- Remove interfering substances (salts, nucleic acids, lipids) using 2D cleanup kits, dialysis, or desalting columns [57].
First Dimension - Isoelectric Focusing:
- Use commercially available IPG strips (e.g., ReadyStrip IPG strips) of appropriate pH range and length [57].
- Apply sample by in-gel rehydration or cup loading.
- Perform IEF using recommended conditions for specific IPG strips. A typical protocol might include:
- Step 1: 250 V for 30 minutes (rapid)
- Step 2: 500 V for 1 hour (rapid)
- Step 3: 1000 V for 1 hour (linear)
- Step 4: 8000 V for 3 hours (linear)
- Step 5: 8000 V until 40,000 Vhr is reached (rapid) [57]
- Avoid exceeding 100,000 Vhr total to prevent electroosmosis and streaking [57].
Strip Equilibration:
- Equilibrate focused IPG strips in two steps:
- Step 1: 15-20 minutes in equilibration buffer (6 M urea, 2% SDS, 50 mM Tris-HCl pH 8.8, 20% glycerol) containing 1% DTT
- Step 2: 15-20 minutes in the same buffer containing 2.5-5% iodoacetamide instead of DTT [57]
- Include at least 20% glycerol in the equilibration solution to prevent vertical streaking [57].
Second Dimension - SDS-PAGE:
- Place equilibrated IPG strip onto a polyacrylamide gel (8-16% acrylamide depending on protein size range).
- Embed strip with 0.5-1% agarose in running buffer to prevent movement.
- Run electrophoresis using standard SDS-PAGE conditions (e.g., 15-30 mA per gel) until dye front reaches bottom [2] [17].
Protein Detection:
- Visualize proteins using compatible stains (Coomassie blue, silver stain, SYPRO Ruby, or fluorescent stains) [56] [17].
- For subsequent western blotting, transfer proteins to PVDF or nitrocellulose membrane [58].
Troubleshooting Experiment for Horizontal Streaking
Objective: To determine whether horizontal streaking is caused by ionic contaminants versus protein overloading.
Methodology:
- Split sample into three aliquots:
- Aliquot 1: Untreated original sample
- Aliquot 2: Treated with 2D cleanup kit to remove ionic contaminants
- Aliquot 3: Diluted 1:5 with rehydration buffer
- Run all three aliquots on identical IPG strips with identical IEF conditions.
- Compare streaking patterns across samples.
Expected Results:
- If streaking disappears in Aliquot 2 but not Aliquot 3 → ionic contaminants are the cause.
- If streaking disappears in Aliquot 3 but not Aliquot 2 → protein overloading is the cause.
- If streaking persists in both treated samples → consider other causes (e.g., poor solubilization).
Comparative 1D SDS-PAGE Protocol
For comparison, a standard 1D SDS-PAGE protocol is included:
Sample Preparation:
- Mix protein sample with 2X SDS sample buffer (4% SDS, 10% glycerol, 125 mM Tris-HCl pH 6.8, bromophenol blue) with or without reducing agents (100 mM DTT or 5% 2-mercaptoethanol) [2] [20].
- Heat samples at 70-100°C for 5-10 minutes [2].
- Centrifuge briefly to collect condensate.
Gel Electrophoresis:
- Use appropriate acrylamide concentration based on target protein size:
- 12% acrylamide for proteins >50 kDa
- 15% acrylamide for proteins 15-50 kDa
- 20% acrylamide for proteins <15 kDa [58]
- Load samples and molecular weight markers.
- Run gel at constant current (20-40 mA) until dye front reaches bottom [58].
- Visualize proteins with appropriate stain or proceed to western blotting.
Diagram 2: 2D PAGE Experimental Workflow with Critical Trouble Points. This workflow diagram highlights key steps in the 2D PAGE process and identifies where specific technical challenges typically emerge.
The Scientist's Toolkit: Essential Research Reagent Solutions
Successful 2D PAGE requires specific reagents and materials to address its technical challenges. The following table details essential solutions for optimal results.
Table 3: Essential Research Reagents for 2D PAGE Troubleshooting
| Reagent/Category | Function/Purpose | Specific Examples & Notes |
|---|---|---|
| Chaotropic Agents | Disrupt hydrogen bonds to solubilize proteins | Urea (8-9 M), Thiourea (2 M) - improves solubilization of membrane proteins [57] |
| Detergents | Solubilize hydrophobic proteins, prevent aggregation | CHAPS, Nonidet P-40 (nonionic); ASB-14 (zwitterionic) for difficult membrane proteins [57] |
| Reducing Agents | Break disulfide bonds, prevent oxidation | DTT (50-100 mM), Tributylphosphine - must be fresh to prevent reoxidation artifacts [57] |
| Alkylating Agents | Block cysteine residues to prevent reformation of disulfide bonds | Iodoacetamide (2.5-5%) - applied after reduction in second equilibration step [57] |
| Carrier Ampholytes | Establish stable pH gradient for IEF | Commercial IPG strips with immobilized pH gradients - preferred over carrier ampholyte techniques [57] |
| Protease Inhibitors | Prevent protein degradation during extraction | Complete protease inhibitor cocktails - essential in extraction buffers [17] |
| Cleanup Kits | Remove interfering contaminants | 2D cleanup kits - effectively remove salts, lipids, nucleic acids that cause streaking [57] |
| Specialized Stains | Detect proteins with high sensitivity | SYPRO Ruby, fluorescent stains - higher sensitivity than Coomassie for lower abundance proteins [56] |
The choice between 1D PAGE and 2D PAGE for proteomic research represents a strategic balance between resolution power and technical practicality. While 2D PAGE offers unparalleled resolution for detecting protein isoforms and post-translational modifications, it demands substantial expertise and careful troubleshooting to overcome its inherent challenges with streaking, smearing, and focusing artifacts [57] [17]. Conversely, 1D PAGE provides robust, reproducible separations suitable for routine protein analysis and quantification, albeit with limited ability to resolve complex protein mixtures [2] [20].
For researchers facing persistent challenges with 2D PAGE, several advanced alternatives are emerging. Capillary electrophoresis sodium dodecyl sulfate (CE-SDS) offers automated separation with superior reproducibility, quantitative precision, and reduced hands-on time compared to traditional gel-based methods [59]. Additionally, gel-free proteomic approaches using multidimensional liquid chromatography coupled to mass spectrometry are increasingly addressing the limitations of both 1D and 2D PAGE, particularly for membrane proteins and low-abundance species [56].
Ultimately, the selection of an appropriate separation strategy should be guided by the specific research question, available resources, and required throughput. For comprehensive proteome mapping where resolution of protein isoforms is critical, 2D PAGE remains a powerful technique when its technical challenges are properly managed through optimized protocols and systematic troubleshooting.
Optimization Strategies for Low-Abundance Protein Detection
The detection of low-abundance proteins represents a significant challenge in proteomic research, where the dynamic range of protein expression can exceed ten orders of magnitude. Within this context, polyacrylamide gel electrophoresis (PAGE) serves as a fundamental separation technique, with both one-dimensional (1D) and two-dimensional (2D) approaches offering distinct advantages and limitations for resolving rare protein species. The selection between 1D PAGE and 2D PAGE requires careful consideration of experimental goals, sample characteristics, and technical constraints. This guide provides an objective comparison of these methodologies, supported by experimental data and optimization strategies specifically tailored for enhancing detection sensitivity for low-abundance targets in drug development and basic research applications.
Fundamental Principles of PAGE Technologies
1D PAGE: Molecular Weight-Based Separation
1D PAGE, particularly SDS-PAGE, separates proteins primarily by molecular weight using a discontinuous buffer system [2]. The ionic detergent sodium dodecyl sulfate (SDS) denatures proteins and confers a uniform negative charge, effectively masking proteins' intrinsic charge and enabling separation based largely on polypeptide size [2]. The polyacrylamide gel matrix acts as a molecular sieve, with pore size inversely related to the acrylamide percentage [2]. Low-percentage gels (e.g., 7%) resolve large proteins, while high-percentage gels (e.g., 12%) separate small proteins more effectively [2]. Gradient gels with increasing acrylamide concentration from top to bottom provide broader separation ranges and naturally stack proteins without requiring a separate stacking gel [2].
2D PAGE: High-Resolution Orthogonal Separation
2D PAGE employs two orthogonal separation dimensions: isoelectric focusing (IEF) followed by SDS-PAGE [5]. The first dimension (IEF) separates proteins according to their isoelectric point (pI) using a pH gradient, while the second dimension separates by molecular weight [5]. This technique can resolve thousands of proteins in a single gel, providing direct visualization of protein spots with information about their physicochemical properties, including molecular weight, pI, and relative abundance [5]. The high-resolution capability of 2D PAGE enables detection of post-translational modifications that manifest as horizontal or vertical spot shifts on the 2D gel map [5].
Table 1: Core Principles of 1D PAGE vs. 2D PAGE
| Feature | 1D PAGE | 2D PAGE |
|---|---|---|
| Separation Principle | Molecular weight | First dimension: Isoelectric point (pI); Second dimension: Molecular weight |
| Resolution Capacity | ~100 distinct bands | 1,000-5,000 protein spots [5] |
| Key Applications | Molecular weight determination, protein immunoblotting, comparative analysis of multiple samples | Proteomic profiling, detection of protein isoforms and post-translational modifications, biomarker discovery [5] |
| Typical Sample Load | 50-100 μg for low-abundance targets [60] | Higher loads required (often >500 μg) for comprehensive detection [50] |
| Information Obtained | Protein size, relative abundance | Protein size, pI, relative abundance, potential modifications [5] |
Figure 1: Comparative Workflows of 1D PAGE and 2D PAGE
Comparative Performance Analysis
Sensitivity and Dynamic Range
For low-abundance protein detection, 1D PAGE coupled with western blotting offers superior sensitivity through various signal amplification strategies. With optimization, western blotting can detect proteins down to the attogram level using high-sensitivity chemiluminescent substrates [61]. Experimental data demonstrates that specialized loading devices can increase detection sensitivity by up to 5-fold, enabling analysis of samples with less than 10μg of total protein [62]. This enhanced sensitivity is particularly valuable for rare samples where pooling is undesirable, such as specific tissue regions in developmental studies [62].
In contrast, 2D PAGE has a narrower dynamic range, where highly abundant proteins can mask low-abundance ones [5]. The visualization of faint protein spots is limited by staining sensitivity, with classical Coomassie blue detecting only approximately 100ng of protein [5]. While more sensitive staining methods like silver stain (detection limit <1ng) and fluorescent dyes (e.g., SYPRO-Ruby) can improve detection, the inherent dynamic range limitations remain a challenge for comprehensive low-abundance protein detection in complex samples [5].
Reproducibility and Technical Complexity
1D PAGE offers relatively straightforward implementation with high reproducibility across experiments. The technique is rapid, with run times typically between 20-40 minutes for mini-gels, and requires standard laboratory equipment [2]. The simplicity of the protocol contributes to its reliability, making it accessible for routine laboratory use.
2D PAGE suffers from technical complexity and reproducibility challenges due to its multiple steps, including sample preparation, isoelectric focusing, SDS-PAGE, staining, and image analysis [50]. Each step requires stringent control and optimization, demanding significant technical expertise [50]. Batch-to-batch variability of reagents and cathodic drift (a progressive loss of basic proteins during prolonged IEF runs) can further compromise reproducibility [5]. These factors have limited the adoption of 2D PAGE for large-scale clinical studies where reproducibility is essential [5].
Table 2: Performance Comparison for Low-Abundance Protein Detection
| Parameter | 1D PAGE | 2D PAGE | Experimental Support |
|---|---|---|---|
| Detection Sensitivity | 5-fold increase with microloader devices; attogram level with optimized chemiluminescence [61] [62] | Limited by abundant protein masking; improved with sensitive stains (silver: <1ng) [5] | FAK detection increased from 2μg to 0.5μg using microloader [62] |
| Dynamic Range | Can be optimized for low-abundance targets via sample enrichment | Narrow; high-abundance proteins mask low-abundance targets [5] | Depletion of albumin/hemoglobin improves dynamic range in 2D PAGE [5] |
| Reproducibility | High with standardized protocols | Variable; 70-93% of spots showed CVs <20% within same lab [5] | Multi-laboratory study demonstrated technical variability [5] |
| Sample Throughput | High; multiple samples run simultaneously | Low; labor-intensive and time-consuming (up to 3 days for large gels) [5] | Suitable for small-scale studies but challenging for large clinical screens [5] |
| Handling of Hydrophobic Proteins | Effective with proper detergent selection | Poor for proteins with >4 transmembrane segments [14] | Modified protocols with powerful detergents (CHAPS, Triton X-114) improve recovery [5] [14] |
Optimization Strategies for Low-Abundance Protein Detection
1D PAGE Optimization Techniques
Sample Preparation Enhancements: Effective protein extraction is crucial for detecting low-abundance targets. Using optimized buffers specific to sample source and target protein location improves yield [61]. Addition of broad-spectrum protease inhibitors prevents protein degradation during extraction, while ultrasonication facilitates the release of nuclear proteins [60]. For membrane proteins, avoiding high-temperature heating prevents aggregation, with alternatives including room temperature incubation or mild heating at 70°C for 10-20 minutes [60]. Increasing sample load to 50-100μg per lane and using 5× loading buffer instead of 2× buffer minimizes sample dilution [60].
Gel Chemistry Selection: Choosing appropriate gel chemistry significantly impacts resolution of low-abundance proteins. Bis-Tris gels with neutral pH preserve protein integrity and provide better band resolution compared to traditional Tris-glycine gels [61]. For high molecular weight proteins (>300kDa), Tris-acetate gels improve transfer efficiency, while Tricine gels provide superior resolution for low molecular weight proteins (<40kDa) [61]. Gradient gels (e.g., 4-20%) enable superior separation across broad molecular weight ranges, preventing abundant proteins from obscuring faint bands of low-abundance targets [60].
Transfer and Detection Optimization: Complete protein transfer is essential for low-abundance protein detection. PVDF membranes offer higher protein-binding capacity than nitrocellulose and are preferred for their superior retention characteristics [60]. Neutral-pH gels such as Bis-Tris and Tris-acetate provide better transfer efficiencies than alkaline Tris-glycine gels by minimizing protein degradation [61]. For immunodetection, using specificity-verified antibodies designed for western blotting and high-sensitivity chemiluminescent substrates such as SuperSignal West Atto can provide over 3× more sensitivity than conventional ECL substrates [61].
Innovative Loading Techniques: A novel microloader device with a funnel-like structure filled with 4% stacking gel can concentrate proteins during electrophoresis, resulting in a 5-fold increase in antigen detection sensitivity [62]. This approach enables detection and quantification of proteins from samples containing less than 1μg of total protein, making it particularly valuable for limited samples such as specific embryonic tissue regions [62].
2D PAGE Optimization Techniques
Sample Prefractionation and Enrichment: Depletion of highly abundant proteins such as albumin and immunoglobulin significantly improves the dynamic range of 2D PAGE by allowing better focusing and detection of low-abundance species [5]. Subcellular fractionation or affinity-based enrichment strategies can concentrate rare proteins before separation. These methods reduce sample complexity and increase the likelihood of detecting low-copy-number proteins.
Solubilization Improvements: Efficient solubilization is critical for 2D PAGE separation, particularly for membrane proteins. Using denaturing solutions containing urea and thiourea combined with zwitterionic detergents like CHAPS improves solubilization of hydrophobic proteins [5] [14]. Cationic detergents such as benzyldimethyl-n-hexadecylammonium chloride have demonstrated effectiveness for resolving hydrophobic proteins with GRAVY index as low as 0.56 [5]. Stepwise extraction using multiple detergents can sequentially solubilize different protein classes from complex samples [14].
Advanced Staining and Detection: Employing highly sensitive fluorescent dyes like SYPRO Ruby and Deep Purple fluorophore significantly improves detection limits compared to conventional Coomassie staining [5]. These dyes offer broader dynamic ranges and better compatibility with downstream mass spectrometry analysis. For maximum sensitivity, silver staining remains the most sensitive option, though with potential limitations for mass spectrometry compatibility without protocol modifications [5].
DIGE Technology: Two-dimensional difference gel electrophoresis (2D-DIGE) uses multiplexed fluorescent cyanine dyes to label multiple protein samples that are then separated on the same 2D gel [5]. This approach minimizes gel-to-gel variability and improves the statistical confidence in detecting subtle changes in low-abundance proteins between experimental conditions [5]. Internal standards further enhance quantification accuracy and reproducibility.
Figure 2: Optimization Pathways for Low-Abundance Protein Detection
The Scientist's Toolkit: Essential Research Reagents
Table 3: Essential Reagents for Low-Abundance Protein Detection
| Reagent Category | Specific Products/Formulations | Function in Low-Abundance Detection |
|---|---|---|
| Protease Inhibitors | Broad-spectrum protease inhibitor cocktails | Prevent degradation of low-abundance targets during extraction [61] |
| Specialized Gels | Bis-Tris gels (neutral pH), Tris-acetate gels (high MW), Tricine gels (low MW) | Optimize resolution based on protein properties; preserve protein integrity [61] |
| Transfer Membranes | PVDF membranes | Higher protein-binding capacity for improved retention of low-abundance proteins [60] |
| Detection Substrates | SuperSignal West Atto Ultimate Sensitivity Substrate | Enhanced chemiluminescence with detection down to attogram level [61] |
| Solubilization Reagents | CHAPS, Triton X-114, urea/thiourea mixtures | Improve extraction and separation of hydrophobic membrane proteins [5] [14] |
| Staining Dyes | SYPRO Ruby, Deep Purple fluorophore | High sensitivity detection for 2D gels with broad dynamic range [5] |
| Abundant Protein Depletion Kits | Albumin/IgG depletion columns | Remove high-abundance proteins to improve detection of low-abundance species [5] |
The optimal choice between 1D PAGE and 2D PAGE for low-abundance protein detection depends on specific research objectives and sample characteristics. 1D PAGE with western blotting offers superior sensitivity, reproducibility, and throughput for targeted analysis of specific low-abundance proteins, particularly when combined with optimization strategies such as specialized loading devices, appropriate gel chemistry, and high-sensitivity detection methods. Conversely, 2D PAGE provides unparalleled resolution for discovery-based proteomics where comprehensive protein profiling and detection of post-translational modifications are prioritized, though with limitations in dynamic range and reproducibility that require sophisticated optimization approaches. Researchers should select methodologies based on a careful evaluation of these performance characteristics relative to their specific protein detection challenges.
Improving Reproducibility and Resolution in Complex Protein Mixtures
For researchers in proteomics, selecting the optimal electrophoretic technique is a critical first step that dictates the depth and reliability of subsequent analysis. The choice between one-dimensional polyacrylamide gel electrophoresis (1D PAGE) and two-dimensional polyacrylamide gel electrophoresis (2D PAGE) involves balancing resolution, reproducibility, and analytical throughput. This guide provides a comparative analysis of these foundational techniques, supported by experimental data, to inform method selection for proteomic research and drug development.
Core Principles and Comparative Workflow
At its core, 1D PAGE separates proteins based on a single property: molecular weight. Under denaturing conditions (SDS-PAGE), the detergent SDS binds to proteins, imparting a uniform negative charge and masking the proteins' intrinsic charge. Separation occurs as these SDS-polypeptide complexes migrate through a polyacrylamide gel matrix, with smaller proteins moving faster than larger ones [2].
In contrast, 2D PAGE separates proteins based on two independent properties in a sequential manner. The first dimension is isoelectric focusing (IEF), which separates proteins based on their isoelectric point (pI). Proteins migrate through a pH gradient until they reach the position where the pH equals their pI and their net charge is zero [5] [43]. The second dimension is SDS-PAGE, which then separates these focused proteins by their molecular weight. The result is a two-dimensional map where individual proteins appear as spots spread across the gel [2] [4] [63].
The workflow for 2D PAGE is inherently more complex, as visualized below.
Direct Performance Comparison: Resolution and Reproducibility
The fundamental difference in separation principles leads to a significant disparity in performance, particularly regarding resolution and the ability to analyze complex samples.
Analytical Resolution and Protein Detection
The primary advantage of 2D PAGE is its superior resolution for complex mixtures. While 1D SDS-PAGE is excellent for separating proteins by mass, it cannot resolve proteins of similar molecular weights. 2D PAGE overcomes this by adding an orthogonal separation step [4] [17]. A comparative LC-MS/MS study analyzing human bronchial smooth muscle cells quantified this difference, demonstrating 2D PAGE's enhanced capability for protein detection [23].
| Performance Metric | 1D SDS-PAGE | 2D PAGE |
|---|---|---|
| Number of Proteins Detected (HBSMC supernatant) | 2,552 proteins [23] | 4,323 proteins [23] |
| Dynamic Range of Protein Abundance | 3.5% to 0.0002% [23] | 3.6% to 0.00001% [23] |
| Separation Basis | Molecular weight only [2] [4] | Isoelectric point (pI) and molecular weight [4] [17] |
| Ability to Resolve Protein Isoforms & PTMs | Limited; modifications causing large mass shifts may be visible [2] | High; PTMs alter pI and/or mass, causing characteristic spot shifts [5] |
Reproducibility and Technical Challenges
Reproducibility is a major consideration for large-scale or longitudinal studies. 1D SDS-PAGE is a robust and straightforward technique with high inter-experimental reproducibility due to its simplicity [2].
2D PAGE, however, has historically faced reproducibility challenges. A key advancement was the replacement of carrier ampholyte-based pH gradients with Immobilized pH Gradients (IPG), which greatly improved gel-to-gel consistency [5]. Furthermore, the development of 2D-DIGE (Difference in Gel Electrophoresis), which uses multiplexed fluorescent dyes to run multiple samples on the same gel, minimizes gel-to-gel variability and allows for more accurate quantitative comparisons [5]. Despite these advances, the technique remains susceptible to issues like horizontal or vertical streaking, often caused by sample overloading, salt contamination, or protein degradation [43].
| Characteristic | 1D SDS-PAGE | 2D PAGE |
|---|---|---|
| Technical Reproducibility | High [2] | Moderate; improved with IPG strips and 2D-DIGE [5] |
| Sample Throughput | High; multiple samples run in parallel [2] | Low; labor-intensive and time-consuming [5] [43] |
| Key Limitations | - Cannot separate proteins of identical mass- Low resolution for complex samples [17] | - Difficulty with hydrophobic membrane proteins [5] [14]- Low dynamic range (abundant proteins mask rare ones) [5]- Challenging for very acidic/basic proteins [5] [14] |
Optimizing the 2D PAGE Protocol for Enhanced Performance
The performance of 2D PAGE is highly dependent on sample preparation. A systematic optimization of the IEF rehydration buffer (RB) using the Taguchi method—a statistical approach for robust optimization—led to a protocol that increased detected polypeptides by approximately fourfold on small-format gels [64].
Optimized Rehydration Buffer Composition
The optimal RB was determined to contain:
- Chaotropes: 7 M Urea and 2 M Thiourea for effective protein solubilization and denaturation.
- Detergents: A combination of 1.2% CHAPS and 0.4% ASB-14 to help solubilize a wider range of proteins, including hydrophobic ones.
- Reducing Agent: 43 mM DTT to keep proteins in a reduced state.
- Carrier Ampholytes: 0.25% to enhance protein solubility and maintain the pH gradient.
- Alkylating Agent: 60 mM Acrylamide for in-gel alkylation of cysteine residues after reduction, which prevents reformation of disulfide bonds and reduces artifacts [64].
This optimized RB improves protein solubility, leading to better resolution, reduced streaking, and higher spot detection rates.
Essential Research Reagent Solutions
The following reagents are critical for successful gel electrophoresis, and their selection should be tailored to the specific goals of the experiment.
| Research Reagent | Function in Electrophoresis | Application Notes |
|---|---|---|
| SDS (Sodium Dodecyl Sulfate) | Denatures proteins and confers a uniform negative charge, enabling separation by mass in 1D and 2D PAGE [2]. | Essential for SDS-PAGE; not used in native (non-denaturing) PAGE. |
| IPG (Immobilized pH Gradient) Strips | Provides a stable, reproducible pH gradient for the first dimension (IEF) of 2D PAGE [5]. | Key innovation that greatly improved the reproducibility of 2D PAGE. |
| CHAPS & ASB-14 Detergents | Zwitterionic detergents that solubilize proteins and prevent aggregation during IEF [64]. | Critical for resolving hydrophobic proteins; often used in combination. |
| DTT (Dithiothreitol) | Reducing agent that breaks disulfide bonds to fully denature proteins [2] [64]. | Higher concentrations (e.g., 40+ mM) in optimized buffers improve focusing [64]. |
| Urea & Thiourea | Chaotropic agents that denature proteins and increase solubility in the rehydration buffer [64]. | The 7 M Urea / 2 M Thiourea combination is more effective than 8 M Urea alone. |
| Fluorescent Dyes (e.g., CyDyes for DIGE) | Used to label different protein samples for multiplexed analysis on the same 2D gel [5]. | Enables accurate quantitative comparisons and minimizes gel-to-gel variation. |
The choice between 1D and 2D PAGE is not a matter of one technique being superior to the other, but rather of selecting the right tool for the specific research question.
1D SDS-PAGE is the workhorse for routine analysis. It is ideal for quick protein size checks, assessing sample purity, immunoblotting, and comparing a small number of proteins across many samples. Its strength lies in its simplicity, high throughput, and robust reproducibility [2].
2D PAGE is a powerful discovery tool. Its unmatched ability to resolve thousands of proteins simultaneously makes it invaluable for profiling complex protein mixtures, identifying changes in protein expression across different conditions (e.g., disease vs. healthy), and detecting post-translational modifications (PTMs) like phosphorylation, which manifest as predictable pI shifts on the 2D map [5] [17]. It is particularly powerful when coupled with mass spectrometry for protein identification.
Researchers must weigh the need for high resolution against the demands of reproducibility, time, and cost. For proteomic studies aimed at biomarker discovery, understanding systems-level biology, or characterizing PTMs, the resolving power of 2D PAGE is often indispensable. For targeted, high-throughput analysis of specific proteins, 1D PAGE remains the most efficient and reliable choice.
In the field of proteomics, the ability to separate, visualize, and quantify complex protein mixtures is fundamental to understanding cellular mechanisms in health and disease. For decades, one-dimensional polyacrylamide gel electrophoresis (1D PAGE) has served as a foundational tool for protein separation by molecular weight. However, the need for higher resolution to analyze thousands of proteins simultaneously drove the development of two-dimensional polyacrylamide gel electrophoresis (2D PAGE), which separates proteins based on two independent properties: isoelectric point (pI) and molecular weight [4]. This evolution culminated in advanced technologies like two-dimensional fluorescence difference gel electrophoresis (2D-DIGE), which introduces sophisticated multiplexing and quantitative capabilities [65] [66]. This guide provides a comprehensive comparison of these techniques, focusing on the technical advantages and applications of DIGE technology and gradient gels in modern proteomic research, particularly in drug development and biomarker discovery.
Fundamental Principles and Comparative Analysis
Core Separation Mechanisms
- 1D PAGE: This technique separates proteins solely by their molecular weight using SDS-PAGE. Proteins are denatured and coated with the anionic detergent SDS, giving them a uniform charge-to-mass ratio. As they migrate through a polyacrylamide gel, smaller proteins move faster, while larger ones are retarded by the gel matrix [4] [2].
- 2D PAGE: This orthogonal approach combines two separation principles. The first dimension involves isoelectric focusing (IEF), where proteins migrate through a pH gradient until they reach their isoelectric point (pI)—the pH where their net charge is zero. The second dimension then separates these focused proteins by molecular weight using SDS-PAGE, resulting in proteins spread across a 2D plane rather than a single lane [65] [67].
Direct Comparison of 1D PAGE, 2D PAGE, and 2D-DIGE
Table 1: Technical comparison of gel electrophoresis methods for proteomic analysis.
| Parameter | 1D PAGE | Traditional 2D PAGE | 2D-DIGE |
|---|---|---|---|
| Separation Basis | Molecular weight | pI (1st dimension) and Molecular Weight (2nd dimension) | pI and Molecular Weight, with fluorescent labeling |
| Resolution | Low (100-200 bands) | High (1,000-5,000 spots) [67] | Very High (up to 5,000 spots) [65] |
| Quantitative Accuracy | Semi-quantitative | Moderate (20-30% CV) [66] | High (< 2% error with internal standard) [66] |
| Throughput | High (rapid analysis) | Low (labor-intensive, 3-5 days) [66] | Medium (improved via multiplexing) |
| Detection Dynamic Range | ~2 orders of magnitude | ~3-4 orders of magnitude | >4 orders of magnitude [30] |
| Key Advantage | Speed, simplicity, cost-effectiveness | High-resolution protein mapping | Superior quantification, reduced gel-to-gel variation [65] [68] |
| Major Limitation | Low resolution for complex mixtures | Gel-to-gel variability, difficult spot matching | Higher cost, proprietary equipment/dyes [66] |
Table 2: Capabilities for detecting post-translational modifications (PTMs) and protein isoforms.
| Feature | 1D PAGE | Traditional 2D PAGE | 2D-DIGE |
|---|---|---|---|
| PTM Detection | Limited; may cause band smearing or shifts | Excellent; PTMs cause pI/MW shifts visible as spot trains [30] | Excellent; sensitive detection of PTM-induced shifts [65] |
| Isoform Resolution | Poor; co-migration likely | High; can resolve multiple isoforms of a single protein [45] | Very High; quantitative comparison of isoforms [68] |
| Statistical Confidence | Low, reliant on replicates | Moderate | High, enabled by internal standard [66] [68] |
| Best Application | Quick purity check, western blot sample prep | Discovery-based profiling, PTM analysis | Differential expression studies, biomarker validation |
Detailed Experimental Protocols
Standard 2D-DIGE Workflow Protocol
The following protocol for a typical 2D-DIGE experiment is adapted from published methodologies and can be completed in approximately 3-5 weeks [66].
Sample Preparation (3-5 days)
- Protein Extraction: Homogenize tissue or lyse cells in a suitable lysis buffer (e.g., 30 mM Tris-HCl, 2 M thiourea, 7 M urea, 4% CHAPS, pH 8.5). The use of protease inhibitors is critical to prevent degradation [66].
- Clean-up: Precipitate proteins using a 2D clean-up kit to remove contaminants like salts, lipids, and nucleic acids that interfere with IEF.
- Quantification: Accurately determine protein concentration using a compatible assay (e.g., 2D-Quant kit).
- Preparation of Internal Standard: Create a pooled internal standard by combining equal aliquots of all samples in the experiment. This standard is crucial for cross-gel statistical analysis [66] [68].
Fluorescent Labeling (2 days)
- Dye Preparation: Reconstitute CyDye DIGE Fluor minimal dyes (Cy2, Cy3, Cy5) in high-grade anhydrous dimethylformamide (DMF).
- Minimal Labeling: Label 50 µg of each protein sample with 100-300 pmol of Cy3 or Cy5. Label the pooled internal standard with Cy2. The dye-to-protein ratio is critical to ensure only one lysine residue per protein is labeled, preventing alterations in protein mobility [66].
- Reaction Quenching: Stop the labeling reaction by adding a 10 mM lysine solution.
2D Electrophoresis (5-7 days)
- First Dimension - IEF: Combine equal amounts of Cy2-, Cy3-, and Cy5-labeled samples (e.g., 50 µg each) and apply to an immobilized pH gradient (IPG) strip (e.g., 24 cm, pH 4-7). Actively rehydrate the strips, followed by IEF using a programmed voltage gradient to a total of 60-80 kVhr [67].
- Strip Equilibration: Equilibrate the focused IPG strips in a buffer containing SDS and dithiothreitol (DTT) to reduce disulfide bonds, followed by iodoacetamide to alkylate cysteine residues.
- Second Dimension - SDS-PAGE: Place the equilibrated IPG strip onto a vertical SDS-PAGE gel (e.g., 8-16% gradient gel). Seal it with agarose and run at constant current or power until the dye front reaches the bottom.
Image Acquisition and Analysis (5-7 days)
- Scanning: Scan the gel using a multi-wavelength fluorescence imager (e.g., Typhoon scanner) with specific lasers/emission filters for each CyDye: Cy2 (488/520 nm), Cy3 (532/580 nm), and Cy5 (633/670 nm) [66].
- Image Analysis: Use specialized software (e.g., DeCyder, Progenesis) for spot detection, matching, and quantification. The software performs Differential In-gel Analysis (DIA) to calculate Cy3:Cy2 and Cy5:Cy2 ratios for each protein spot, followed by Biological Variation Analysis (BVA) to determine statistically significant changes across all gels in the experiment [66].
Protocol Visualization
The following diagram illustrates the core workflow and logical structure of a 2D-DIGE experiment.
The Scientist's Toolkit: Essential Research Reagents
Successful implementation of DIGE and gradient gel electrophoresis relies on a specific set of high-quality reagents and instruments.
Table 3: Key research reagent solutions for 2D-DIGE experiments.
| Reagent/Equipment | Function | Critical Specifications |
|---|---|---|
| CyDye DIGE Fluor Minimal Dyes (Cy2, Cy3, Cy5) [66] | Fluorescently label lysine residues in different protein samples for multiplexing. | N-hydroxysuccinimidyl ester reactive group; minimal labeling (1-2% of lysines). |
| IPG Strips [67] | First-dimension IEF separation. | Immobilized linear/nonlinear pH gradient (e.g., pH 3-11, 4-7); various lengths (7-24 cm). |
| Urea & Thiourea | Primary chaotropes in IEF sample buffer. | Ultrapure grade to minimize cyanate formation which causes protein carbamylation. |
| CHAPS | Zwitterionic detergent in IEF buffer. | Improves solubility of hydrophobic proteins without interfering with IEF. |
| Destreak Rehydration Buffer | Used for IEF strip rehydration. | Contains reducing agents and other components to improve IEF and reduce horizontal streaking. |
| Sypro Ruby/Deep Purple | Fluorescent post-staining for total protein visualization. | High sensitivity (~1 ng), MS-compatible, broad dynamic range [65] [30]. |
| Multiplex Fluorescence Imager | Scanning 2D-DIGE gels. | Capable of sequential scanning at ex/em: 488/520, 532/580, 633/670 nm [66]. |
| DeCyder Software | Differential analysis of 2D-DIGE images. | Performs DIA (in-gel analysis) and BVA (cross-gel statistical analysis) [66]. |
The progression from 1D PAGE to 2D PAGE and the innovative 2D-DIGE technology represents a significant leap in analytical power for proteomics. While 1D PAGE remains a rapid, cost-effective tool for simple protein analysis, 2D-DIGE stands out as the superior technology for complex, quantitative differential protein expression studies. Its ability to multiplex samples with an internal standard on a single gel directly addresses the reproducibility issues of traditional 2D PAGE, providing the statistical confidence required for biomarker discovery and systems biology research [65] [68]. The choice of technique ultimately depends on the research question, but for applications demanding high-resolution separation and rigorous quantification of protein changes, 2D-DIGE is an indispensable tool in the modern proteomics laboratory.
Strategic Selection: Comparative Analysis and Validation of 1D vs 2D PAGE
In proteomic research, the separation of complex protein mixtures is a fundamental step, and gel electrophoresis remains a cornerstone technique for this purpose. The choice between one-dimensional polyacrylamide gel electrophoresis (1D PAGE) and two-dimensional polyacrylamide gel electrophoresis (2D PAGE) significantly impacts the depth and quality of analytical results. This guide provides a direct, data-driven comparison of these two methods, focusing on their resolution power and protein loading capacity—two parameters critical for experimental design in research and drug development. While 1D PAGE separates proteins based solely on molecular weight, 2D PAGE employs two orthogonal separation steps: isoelectric focusing (IEF) followed by molecular weight separation, enabling the resolution of thousands of proteins from a single sample. [2] [67] [5]
Quantitative Comparison at a Glance
The table below summarizes the core performance differences between 1D and 2D PAGE based on experimental data.
| Performance Characteristic | 1D PAGE (SDS-PAGE) | 2D PAGE |
|---|---|---|
| Primary Separation Principle | Molecular weight [2] | Isoelectric point (pI) and Molecular weight [5] [4] |
| Theoretical Maximum Resolution | ~100 bands per gel [2] | 5,000+ spots per gel [67] [5] |
| Practical Typical Resolution | Information missing | 1,000 - 2,000 spots per gel [67] |
| Protein Loading Capacity | Information missing | Lower; high abundance proteins can mask low abundance ones [5] |
| Dynamic Range | Information missing | Narrow without pre-fractionation or highly sensitive stains [5] |
| Analysis of Hydrophobic/Membrane Proteins | Effective; SDS solubilizes most proteins [2] | Challenging; requires special detergents (e.g., CHAPS, Triton X-114) [5] |
| Quantitative Data from LC-MS/MS (Supernatant Fraction) | 2,552 proteins identified [23] | 4,323 proteins identified [23] |
| Relative Abundance Range in LC-MS/MS | 3.5% to 0.0002% [23] | 3.6% to 0.00001% [23] |
Detailed Methodologies and Experimental Protocols
1D SDS-PAGE Experimental Protocol
Principle: Proteins are denatured and uniformly coated with the anionic detergent sodium dodecyl sulfate (SDS), conferring a uniform negative charge. Separation occurs as these SDS-polypeptide complexes migrate through a polyacrylamide gel matrix under an electric field, primarily according to their molecular weight. [2]
Detailed Protocol:
- Gel Casting: Prepare a discontinuous gel system consisting of a stacking gel (e.g., low acrylamide percentage like 4%, pH ~6.8) layered on top of a resolving gel (e.g., 10-12% acrylamide, pH ~8.8). The stacking gel concentrates the protein sample into a sharp band before it enters the resolving gel, enhancing resolution. [2]
- Sample Preparation: Dilute protein samples in a buffer containing SDS and a reducing agent (e.g., β-mercaptoethanol or DTT). Heat the samples at 70-100°C for 5-10 minutes to denature proteins and break disulfide bonds. [2]
- Electrophoresis: Load samples and molecular weight markers into the wells. Apply a constant voltage: start at 50-80 V for the stacking phase, then increase to 100-200 V for the resolving phase. The run is typically complete when the dye front reaches the bottom of the gel. Excessive heat generation during this step can cause band distortion ("smiling" bands); thus, running the gel in a cold room or with a cooling apparatus is recommended. [69]
- Detection: After electrophoresis, proteins are visualized using stains like Coomassie Blue, Silver Stain, or fluorescent dyes (e.g., SYPRO Ruby) for subsequent analysis. [2]
2D PAGE Experimental Protocol
Principle: This orthogonal method first separates native proteins based on their isoelectric point (pI) using isoelectric focusing (IEF). In the second dimension, these focused proteins are separated by their molecular weight using standard SDS-PAGE. [67] [5]
Detailed Protocol:
- First Dimension: Isoelectric Focusing (IEF)
- Sample Preparation: Protein extracts are prepared in a rehydration buffer containing high concentrations of urea and thiourea (chaotropes), non-ionic or zwitterionic detergents (e.g., CHAPS), and carrier ampholytes. This cocktail solubilizes proteins and maintains their native charge. [67] [5]
- IEF Run: Samples are applied to commercial immobilized pH gradient (IPG) strips. These strips have a stable, linear pH gradient covalently incorporated into the gel matrix. Active rehydration can be used, where a low voltage is applied during sample uptake. IEF is then performed with a programmed voltage gradient (e.g., step-wise increases to 8,000 V) until the proteins migrate to their respective pI positions (reaching equilibrium). [67]
Strip Equilibration: After IEF, the IPG strip is incubated in an equilibration buffer containing SDS and DTT. This step denatures the proteins and coats them with SDS, preparing them for the second dimension. [67]
Second Dimension: SDS-PAGE
- The equilibrated IPG strip is placed directly onto the top of a vertical SDS-polyacrylamide gel (either homogeneous or gradient).
- It is sealed in place with agarose to ensure electrical contact.
- Electrophoresis is then performed as in 1D SDS-PAGE, separating the proteins orthogonally based on molecular weight. [67]
Detection: The resulting 2D gel is stained, and proteins appear as spots rather than bands. Image analysis software is used to detect, quantify, and match spots across multiple gels. [5]
Critical Analysis and Technical Considerations
Strengths and Limitations in Practice
1D PAGE Strengths:
- Simplicity and Speed: The protocol is straightforward and rapid, often completed within a few hours. [2]
- High Tolerance for Samples: The use of SDS allows for the analysis of proteins from almost any source and is particularly effective for hydrophobic and membrane proteins. [2] [23]
- Molecular Weight Determination: When run with standards, it provides a reliable estimate of protein molecular weight. [2]
1D PAGE Limitations:
- Low Resolution: It cannot separate proteins with similar molecular weights or resolve different isoforms of the same protein (e.g., phosphorylated vs. non-phosphorylated forms). [5] [4]
2D PAGE Strengths:
- Unparalleled Resolution: It is the most powerful method for resolving complex protein mixtures into individual components, capable of separating thousands of proteins. [67] [5]
- Detection of Post-Translational Modifications (PTMs): Charge-altering PTMs cause horizontal shifts in protein spots, allowing for their direct visualization. [5]
- Visual Protein Map: Provides a direct visual representation of the proteome, showing changes in protein abundance and modification. [5]
2D PAGE Limitations:
- Limited Dynamic Range: High-abundance proteins can mask the detection of low-abundance proteins, a significant challenge for biomarker discovery. This can be mitigated by pre-fractionation or depletion of abundant proteins. [5]
- Difficulty with Extreme Proteins: Very acidic, basic, large, or hydrophobic proteins are often under-represented due to solubility issues during IEF. [5]
- Throughput and Reproducibility: The technique is labor-intensive, time-consuming, and can suffer from gel-to-gel variability, though this has been improved with commercial IPG strips. [67] [5]
Advanced Techniques and Complementary Data
To address the limitations of 2D PAGE, advanced methods like 2D-Differential Gel Electrophoresis (2D-DIGE) were developed. In 2D-DIGE, multiple protein samples are labeled with different fluorescent cyanine dyes (Cy2, Cy3, Cy5) and co-separated on the same 2D gel. This multiplexing minimizes gel-to-gel variation and allows for more accurate quantitative comparisons. [5]
For comprehensive proteomic coverage, both techniques are often coupled with mass spectrometry (LC-MS/MS). A comparative study analyzing human bronchial smooth muscle cells highlights their complementary nature: 2D PAGE identified 4,323 proteins from the supernatant fraction with a wider abundance range, while 1D PAGE was able to characterize precipitate fractions rich in transmembrane proteins that were inaccessible to 2D analysis. [23]
The Scientist's Toolkit: Essential Research Reagents
The table below lists key reagents required for successful gel electrophoresis experiments and their critical functions.
| Reagent | Function |
|---|---|
| Acrylamide/Bis-acrylamide | Forms the cross-linked polyacrylamide gel matrix that acts as a molecular sieve. [2] |
| SDS (Sodium Dodecyl Sulfate) | Anionic detergent that denatures proteins and confers a uniform negative charge, enabling separation by mass. [2] |
| APS & TEMED | Ammonium persulfate (APS) and TEMED are catalysts that initiate and accelerate the polymerization of acrylamide. [2] |
| IPG Strips (Immobilized pH Gradient) | Commercial pre-cast gels used for the first dimension of 2D PAGE, providing a stable and reproducible pH gradient for IEF. [67] |
| Urea & Thiourea | Powerful chaotropic agents used in 2D PAGE sample buffers to solubilize proteins and prevent aggregation. [67] [5] |
| CHAPS | A zwitterionic detergent used in 2D PAGE to improve the solubility of hydrophobic proteins during IEF. [5] |
| DTT (Dithiothreitol) | A reducing agent that breaks disulfide bonds within and between protein molecules, ensuring complete denaturation. [2] |
The analysis of proteins across a wide concentration range is a fundamental challenge in proteomics. The dynamic range of a technique defines its ability to detect both high-abundance and low-abundance proteins within a complex biological sample. This comparison guide objectively evaluates the performance of two core separation methods—1D Polyacrylamide Gel Electrophoresis (1D PAGE) and 2D Polyacrylamide Gel Electrophoresis (2D PAGE)—in this critical area, providing researchers with experimental data to inform their methodological choices.
Principles of Separation and Their Impact on Dynamic Range
The fundamental difference in how 1D and 2D PAGE separate proteins directly influences their ability to resolve species of varying abundance.
1D PAGE (SDS-PAGE) primarily separates proteins based on a single property: molecular weight. The ionic detergent SDS denatures proteins and confers a uniform negative charge, causing migration through the gel matrix to be inversely proportional to protein size [70]. While excellent for comparing protein size and relative quantity across multiple samples, this one-dimensional separation can lead to overlapping bands where multiple proteins of similar mass co-migrate. This co-migration can mask low-abundance proteins if they are overshadowed by more abundant proteins of similar size [30].
2D PAGE employs an orthogonal, two-step separation process. In the first dimension, proteins are separated by their isoelectric point (pI) using isoelectric focusing (IEF). In the second dimension, they are separated by molecular weight using standard SDS-PAGE [70] [30]. This two-parameter separation spreads proteins across a two-dimensional plane, significantly increasing resolution. It allows for the visualization of thousands of proteins as distinct spots and can reveal post-translational modifications (PTMs), such as phosphorylation or glycosylation, which often appear as characteristic horizontal or vertical shifts in spot position [30]. This enhanced resolution is key to unmasking low-abundance proteins that would otherwise be obscured in a 1D gel.
The diagram below illustrates the core procedural difference between the two techniques and its impact on resolution.
Comparative Performance Data
Direct comparisons of the two techniques reveal clear differences in their performance metrics, particularly regarding the number of proteins identified and their effective dynamic range.
Table 1: Quantitative Comparison of 1D PAGE vs. 2D PAGE Performance
| Performance Metric | 1D PAGE (SDS-PAGE) | 2D PAGE | Experimental Context |
|---|---|---|---|
| Proteins Identified | 2,552 proteins | 4,323 proteins | Analysis of supernatant fraction from human bronchial smooth muscle cells [23]. |
| Dynamic Range (Abundance Range) | 3.5% to 2×10⁻⁴% | 3.6% to 1×10⁻⁵% | Same study as above, demonstrating 2D-PAGE's superior sensitivity for low-abundance species [23]. |
| Membrane Protein Identification | 22 legitimate membrane proteins identified | Only 3 of the same membrane proteins identified | Analysis of rat liver microsomes; 1D PAGE shows clear superiority for hydrophobic proteins [47]. |
| Performance in Metaproteomics | Faster, easier setup. More identifications per minute of runtime. | Higher total identifications (>10,000 protein groups). | Evaluation using a 32-species microbial mock community; 2D-LC was used as a proxy for 2D separation principle [8]. |
The data indicates that 2D PAGE generally offers a higher overall dynamic range and is more effective for resolving complex mixtures into individual components, thereby improving the detection of low-abundance proteins [23]. However, a significant weakness of 2D PAGE is its poor performance with hydrophobic proteins, such as membrane proteins, where 1D PAGE proves dramatically more effective [47].
Detailed Experimental Protocols
To ensure reproducibility and provide a clear understanding of the workflows being compared, the core methodologies are outlined below.
1D SDS-PAGE Protocol
This is a standard denaturing gel electrophoresis protocol for separating proteins by mass [70].
- Sample Preparation: Protein samples are mixed with a loading buffer containing SDS (an ionic detergent) and a thiol reagent (e.g., DTT or TCEP). The mixture is heated (70–100°C) to denature proteins and reduce disulfide bonds. SDS binds to the polypeptides in a constant ratio, masking their native charge and imparting a uniform negative charge.
- Gel Casting: A polyacrylamide gel is cast between two glass plates. The gel typically consists of a lower, higher-percentage "resolving gel" (e.g., 8-16%) and an upper, lower-percentage "stacking gel" (e.g., 4-5%). The stacking gel concentrates all proteins into a sharp band before they enter the resolving gel, improving resolution.
- Electrophoresis: The prepared samples and molecular weight markers are loaded into wells. Current is applied, and proteins migrate through the stacking and resolving gels towards the anode. Separation occurs primarily based on molecular size due to the sieving effect of the polyacrylamide matrix.
- Detection: After electrophoresis, proteins are visualized in the gel using stains like Coomassie Brilliant Blue or more sensitive fluorescent dyes like SYPRO Ruby.
2D PAGE Protocol
This protocol involves two separate electrophoresis steps to resolve proteins based on independent properties [28] [30].
Day 1: First Dimension - Isoelectric Focusing (IEF)
- Sample Preparation: Protein samples are dissolved in a rehydration buffer containing chaotropes (e.g., urea, thiourea) and zwitterionic detergents (e.g., CHAPS) to solubilize and denature proteins while maintaining their charge.
- Strip Rehydration: Immobilized pH Gradient (IPG) strips are rehydrated with the protein sample solution, typically overnight. IPG strips have a fixed, linear pH gradient (e.g., pH 3-10, or narrower).
- Isoelectric Focusing: The rehydrated IPG strip is placed in an IEF unit, and a voltage is applied. Proteins migrate through the strip until they reach the position where the pH equals their isoelectric point (pI). At this location, their net charge is zero, and migration stops.
Day 2: Second Dimension - SDS-PAGE
- Strip Equilibration: The focused IPG strip is first incubated in an equilibration buffer containing SDS and DTT (or TCEP) to denature the proteins and reduce disulfide bonds. A second equilibration step with iodoacetamide is often performed to alkylate the reduced cysteine residues and prevent reformation of disulfide bonds.
- Gel Assembly: The equilibrated IPG strip is placed on top of a pre-cast SDS-PAGE gel.
- Electrophoresis and Detection: Current is applied, and proteins from the IPG strip are separated in the second dimension by molecular weight. The gel is then stained for visualization, as in 1D PAGE.
The Scientist's Toolkit: Essential Reagents and Materials
Successful execution of these techniques relies on specific reagents and instruments. The table below lists key solutions and their functions.
Table 2: Key Research Reagent Solutions for PAGE
| Item | Function in Protocol | Key Consideration |
|---|---|---|
| SDS (Sodium Dodecyl Sulfate) | Denatures proteins and confers uniform negative charge for separation by mass in both 1D and 2nd dimension of 2D PAGE [70]. | Purity is critical for consistent results. |
| IPG Strips (Immobilized pH Gradient) | Provides a stable pH gradient for the first-dimension isoelectric focusing (IEF) in 2D PAGE [28] [30]. | Choice of pH range (broad vs. narrow) determines the proteome fraction analyzed. |
| Chaotropes (Urea, Thiourea) | Disrupt hydrogen bonds to solubilize and denature proteins, preventing aggregation during IEF in 2D PAGE [30]. | Must be of high purity; solutions should not be heated excessively to prevent protein carbamylation. |
| Zwitterionic Detergents (CHAPS) | Solubilizes proteins, particularly hydrophobic ones, without interfering with the IEF step in 2D PAGE [30]. | More effective than ionic detergents for maintaining protein solubility during IEF. |
| Reducing Agents (DTT, TCEP) | Cleaves disulfide bonds to fully denature proteins for both 1D and 2D PAGE [28]. | TCEP is more stable and odorless than DTT and is effective at a broader pH range. |
| SYPRO Ruby / Deep Purple Dyes | Highly sensitive fluorescent stains for detecting proteins on gels after electrophoresis [30]. | Offer a wider dynamic range of detection than traditional Coomassie staining. |
Analysis of Protein Isoforms and Post-Translational Modifications
The superior resolving power of 2D PAGE makes it the preferred method for analyzing protein isoforms and post-translational modifications (PTMs). A comparative study using phosphorylated ovalbumin demonstrated this starkly [45].
- 1D SDS-PAGE separation resulted in only three bands, failing to resolve the underlying complexity.
- 2D IEF-SDS-PAGE revealed a complex pattern of 11 major spots from the same sample.
These multiple spots represent different isoforms of ovalbumin, predominantly varying in their phosphorylation status. Because PTMs like phosphorylation change a protein's charge (pI), they cause a horizontal shift in the 2D gel. This allows for direct visualization and subsequent excision of individual isoforms for further characterization by mass spectrometry [45] [30]. 1D PAGE lacks this capability, as charge variants of the same protein will typically co-migrate as a single band.
The choice between 1D and 2D PAGE for dynamic range assessment is not a matter of one technique being universally superior, but rather of selecting the right tool for the specific research question.
- For high-resolution analysis of complex mixtures, detection of low-abundance proteins, and characterization of protein isoforms and PTMs, 2D PAGE is the more powerful technique. Its orthogonal separation provides unparalleled resolution to unmask components that would co-migrate in a 1D gel.
- For higher throughput, analysis of membrane proteins, and straightforward comparison of protein molecular weights across multiple samples, 1D PAGE offers a faster, more robust, and often more effective solution.
Researchers must weigh the need for comprehensive resolution against practical considerations like throughput, sample type, and technical expertise. In many cases, these techniques are not mutually exclusive but are used as complementary tools in a comprehensive proteomics workflow.
The choice between one-dimensional polyacrylamide gel electrophoresis (1D PAGE) and two-dimensional polyacrylamide gel electrophoresis (2D PAGE) represents a fundamental strategic decision in proteomic research. This guide provides an objective comparison of these core techniques, focusing on their relative throughput, time requirements, and technical complexity. For researchers in drug development and basic science, understanding these practical differences is crucial for selecting the appropriate method for their specific experimental goals, whether for rapid protein screening or comprehensive proteome analysis.
Core Principles and Throughput Comparison
1D PAGE, most commonly performed as SDS-PAGE, separates proteins along a single axis according to their molecular mass [2]. The ionic detergent SDS denatures proteins and confers a uniform negative charge, causing proteins to migrate through the polyacrylamide gel matrix at rates inversely proportional to the logarithm of their mass [2]. This simplicity makes it ideal for comparative analysis of multiple samples run in adjacent lanes, providing quick information on protein size and relative abundance [2].
2D PAGE separates proteins based on two independent properties in two sequential steps [17] [2]. The first dimension, isoelectric focusing (IEF), separates proteins according to their native isoelectric point (pI). The second dimension, SDS-PAGE, then separates these proteins further by their molecular mass [17] [2]. This orthogonal separation mechanism provides the highest resolution for protein analysis, capable of resolving thousands of proteins from a single sample and revealing information about protein isoforms and post-translational modifications that are indistinguishable by 1D PAGE [17] [38].
The table below summarizes the key differences in throughput and analytical output between the two techniques.
Table 1: Throughput and Analytical Output Comparison
| Feature | 1D PAGE | 2D PAGE |
|---|---|---|
| Primary Separation Mechanism | Molecular mass | Isoelectric point (pI) & Molecular mass |
| Typical Analytical Goal | Compare multiple samples; check purity, size, and approximate amount of proteins. | Comprehensive analysis of a single sample; resolve complex mixtures. |
| Proteins Resolved per Sample | Dozens to ~100 [2] | Several thousand [17] [38] |
| Ability to Detect Isoforms/PTMs | Limited | High [17] |
| Sample Throughput | High (Multiple samples per gel) | Low (Typically one sample per gel) |
Time Requirements and Workflow Complexity
The procedural workflow is a major differentiator governing the time investment and technical skill required for each method.
1D PAGE Workflow and Duration
The 1D SDS-PAGE workflow is streamlined and can be completed rapidly. For a standard mini gel, the process from gel preparation to result visualization often takes less than a single day [2]. The workflow involves casting the gel, loading prepared samples, running the electrophoresis (typically 20-40 minutes for a mini gel), and finally, staining and destaining to visualize the protein bands [2]. The entire process is highly standardized, with pre-cast gels and optimized buffers available to further reduce hands-on time and enhance reproducibility.
2D PAGE Workflow and Duration
In contrast, the 2D PAGE workflow is inherently more complex and time-consuming, often spanning 2-3 days [17]. The process requires sequential execution of multiple, delicate steps, each of which can introduce variability. The first-dimension IEF is particularly critical and can take several hours to overnight. The subsequent equilibration step prepares the proteins for the second dimension, which is SDS-PAGE. The entire process demands significant hands-on time and rigorous optimization to achieve reproducible, high-quality results.
Table 2: Time and Complexity Analysis of Experimental Workflows
| Workflow Stage | 1D PAGE | 2D PAGE |
|---|---|---|
| Gel Preparation | ~1 hour (can use pre-cast gels) | Several hours (IPG strip rehydration & IEF gel setup) |
| Sample Preparation | 10-30 minutes (denaturation) | Several hours (solubilization, reduction, alkylation) |
| Separation Step | 20-40 minutes (electrophoresis) | First dimension: Several hours to overnight (IEF)Second dimension: ~1 hour (SDS-PAGE) |
| Detection/Staining | 1-2 hours | 1-2 hours, plus additional destaining time |
| Total Hands-On Time | Low (2-3 hours) | High (4-6+ hours) |
| Total Project Duration | Less than 1 day | 2-3 days |
| Technical Skill Required | Moderate | High |
The following diagram illustrates the core workflows for both techniques, highlighting the increased number of steps and longer timeline associated with 2D PAGE.
Supporting Experimental Data and Technical Reproducibility
Experimental Data from Direct Comparisons
A direct comparative study analyzed protein fractions from human bronchial smooth muscle cells (HBSMC) using both 1D SDS-PAGE-LC-MS/MS and nondenaturing 2DE-LC-MS/MS [13]. The study found that 1D SDS-PAGE-MS of the supernatant fraction assigned 2,552 proteins, while 2DE-MS of the same fraction assigned 4,323 proteins, demonstrating the higher resolving power and sensitivity of the 2D approach for complex mixtures [13]. However, the same study concluded that the two methods provide complementary information, with SDS-PAGE being advantageous for comparative quantification between samples, while nondenaturing 2DE was superior for analyzing protein interactions [13].
Technical Reproducibility and Skill Requirements
The technical complexity of 2D PAGE directly impacts its reproducibility. The technique is sensitive to factors such as the quality of the pH gradient in the first dimension, the efficiency of protein transfer between dimensions, and staining consistency [17] [38]. Inconsistencies in these steps can lead to gel-to-gel variation, making spot matching and quantitative comparisons across multiple gels challenging. While 1D PAGE is also subject to technical variation, its simpler workflow and the ability to run all comparative samples on the same gel make it generally more reproducible for straightforward quantitative comparisons.
Essential Research Reagent Solutions
The following table details key reagents and materials required for these electrophoretic techniques, along with their critical functions.
Table 3: Essential Reagents and Materials for PAGE
| Reagent/Material | Function | Key Consideration |
|---|---|---|
| Acrylamide/Bis-acrylamide | Forms the cross-linked polyacrylamide gel matrix that acts as a molecular sieve. | The concentration ratio and total %T determine gel pore size and resolution range [2]. |
| SDS (Sodium Dodecyl Sulfate) | Denatures proteins and confers a uniform negative charge, enabling separation primarily by mass [2]. | Essential for denaturing (SDS-)PAGE; not used in native PAGE. |
| TEMED & Ammonium Persulfate (APS) | Catalyzer (TEMED) and initiator (APS) for the free-radical polymerization of acrylamide gels [2]. | Fresh APS is critical for consistent and timely gel polymerization. |
| IEF Strips (IPG Strips) | Pre-cast immobilized pH gradient gels used for the first dimension of 2D PAGE [2]. | The chosen pH gradient (e.g., narrow vs. broad) determines the range of pI values resolved [2]. |
| Mass Spectrometry-Compatible Stain | Allows visualization of separated proteins without interfering with downstream protein identification by MS. | Examples: Coomassie, SYPRO Ruby, silver stain (with special protocols) [13]. |
The choice between 1D and 2D PAGE involves a direct trade-off between throughput and analytical depth. 1D SDS-PAGE is the superior choice for high-throughput applications where the goal is to rapidly compare multiple samples, confirm protein size, or assess purity and relative abundance. Its strengths are speed, simplicity, lower technical demand, and excellent quantitative reproducibility for inter-sample comparisons on a single gel. 2D PAGE is the definitive method for achieving the highest resolution of a complex protein sample. It is indispensable for discovering protein isoforms, post-translational modifications, and for comprehensively profiling a proteome. Its primary drawbacks are low sample throughput, significant time investment, high technical complexity, and challenges in gel-to-gel reproducibility. Researchers must align their choice with their specific analytical objectives, weighing the need for comprehensive detail against the constraints of time and technical resources.
In the field of proteomics, the separation of complex protein mixtures is a critical first step before in-depth analysis. Two-dimensional polyacrylamide gel electrophoresis (2D PAGE) and one-dimensional sodium dodecyl sulfate polyacrylamide gel electrophoresis (1D SDS-PAGE) represent two foundational techniques for this purpose, each with distinct advantages and limitations. Their utility is greatly enhanced when coupled with modern mass spectrometry (MS) and liquid chromatography (LC) platforms, creating integrated workflows that facilitate comprehensive protein analysis [13] [17] [71]. This guide objectively compares the performance of 1D PAGE versus 2D PAGE methodologies when integrated with LC-MS/MS, providing experimental data and detailed protocols to inform researchers and drug development professionals in their experimental design.
Technical Comparison: 1D PAGE vs. 2D PAGE in Integrated Workflows
Core Principles and Workflows
1D SDS-PAGE separates proteins primarily based on a single physicochemical property: molecular weight. Proteins are denatured, linearized, and coated with SDS, giving them a uniform charge-to-mass ratio. When an electric field is applied, migration through the polyacrylamide gel matrix is inversely proportional to the logarithm of their molecular mass [17] [41].
In contrast, 2D PAGE employs two orthogonal separation parameters. The first dimension involves isoelectric focusing (IEF), which separates native or partially denatured proteins based on their isoelectric point (pI). The second dimension then resolves these focused proteins by molecular weight using SDS-PAGE. This two-step process spreads proteins across a two-dimensional plane, allowing visualization of thousands of protein spots, including different isoforms and post-translationally modified forms [17] [71].
The subsequent integration with LC-MS/MS is a crucial step for protein identification and quantification. In a typical "bottom-up" proteomics workflow, gel regions (bands from 1D or spots from 2D) are excised, subjected to in-gel enzymatic digestion (usually with trypsin), and the resulting peptides are separated by nano-liquid chromatography before being introduced into the mass spectrometer for sequencing and quantification [72] [73].
Performance Metrics and Experimental Data
Direct comparative studies provide quantitative insights into the performance of these integrated approaches. A systematic investigation analyzing human bronchial smooth muscle cells (HBSMC) using both methods yielded the following results [13]:
Table 1: Comparative Protein Identification from HBSMC Supernatant Fraction
| Method | Total Proteins Identified | Percent Abundance Range | Key Strengths |
|---|---|---|---|
| 1D SDS-PAGE-LC-MS/MS | 2,552 proteins | 3.5% to 2×10⁻⁴% | Superior for comparative quantitation between samples |
| 2D PAGE-LC-MS/MS | 4,323 proteins | 3.6% to 1×10⁻⁵% | Enhanced sensitivity; superior for analyzing protein interactions |
Further comparative analysis of separation techniques using standard protein mixtures and mitochondrial extracts demonstrated complementary performance characteristics [41]:
Table 2: Technical Comparison of Gel-Based Separation Techniques
| Parameter | 1D SDS-PAGE | Preparative 1D PAGE | IEF-IPG | 2D PAGE |
|---|---|---|---|---|
| Protein Identifications | High | Moderate | Highest | Moderate |
| Peptides per Protein | Moderate | Moderate | Highest | Moderate |
| Dynamic Range | High | Moderate | High | Moderate |
| Fractionation Basis | Molecular weight | Molecular weight | Isoelectric point | pI & Molecular weight |
| Throughput | High | Moderate | High | Low |
| Technical Complexity | Low | Low | Moderate | High |
The data indicates that while 2D PAGE provides higher total protein identifications in specific applications, 1D SDS-PAGE offers advantages in quantitative performance and throughput. Importantly, these techniques are largely complementary rather than strictly competitive, with each addressing different analytical needs [13] [41].
Detailed Experimental Protocols
1D SDS-PAGE-LC-MS/MS Protocol
Sample Preparation:
- Extract proteins using appropriate lysis buffer (e.g., RIPA buffer with protease inhibitors).
- Determine protein concentration using a compatible assay (e.g., BCA or Bradford).
- Dilute protein samples in SDS-PAGE sample buffer (63 mM Tris-HCl, pH 6.8, 2% SDS, 10% glycerol, 0.0025% bromophenol blue) supplemented with 50 mM DTT [41].
- Heat denature at 95°C for 5 minutes.
Gel Electrophoresis:
- Load 10-100 μg of protein per lane onto a pre-cast gradient gel (e.g., 4-20% or 8-16% Tris-Glycine).
- Run electrophoresis at constant voltage (120-150V) until the dye front reaches the bottom.
- Stain with Coomassie Brilliant Blue or compatible fluorescent stain for visualization [13].
Gel Processing and Digestion:
- Excise entire lane and slice into uniform segments (typically 20-33 pieces of equal size).
- Destain gel pieces with 50 mM ammonium bicarbonate in 50% acetonitrile.
- Reduce proteins with 5 mM Tris(2-carboxyethyl)phosphine (TCEP) or 10 mM DTT at 37°C for 30-60 minutes.
- Alkylate with 10 mM iodoacetamide or acrylamide at room temperature in the dark for 30 minutes.
- Digest with sequencing-grade modified trypsin (10-20 ng/μL) at 37°C overnight [13] [41].
- Extract peptides with 50% acetonitrile/5% formic acid, and concentrate by vacuum centrifugation.
LC-MS/MS Analysis:
- Reconstitute peptides in 0.1% formic acid.
- Separate using nanoflow LC system with C18 column (75 μm × 150 mm, 2 μm particles).
- Employ a linear gradient from 2% to 35% acetonitrile in 0.1% formic acid over 60-120 minutes.
- Analyze eluting peptides using a high-resolution tandem mass spectrometer (e.g., Orbitrap instruments) operated in data-dependent acquisition mode [13] [73].
- Use database search algorithms (Mascot, Sequest, X!Tandem) for protein identification against appropriate protein databases [72].
2D PAGE-LC-MS/MS Protocol
Sample Preparation for IEF:
- Prepare protein extracts in appropriate IEF-compatible buffer (7 M urea, 2 M thiourea, 4% CHAPS, 20-50 mM DTT).
- Adjust sample conductivity to ≤300 μS/cm using centrifugal ultrafiltration if necessary [41].
First Dimension - Isoelectric Focusing:
- Load 50-500 μg of protein onto immobilized pH gradient (IPG) strips (e.g., pH 3-10 NL, 7 cm, 11 cm, or 24 cm).
- Perform active rehydration at 50 V for 12 hours.
- Run IEF using a stepwise voltage protocol: 500 V for 1 hour, 1000 V for 1 hour, and 8000 V until 40,000 Vhr is reached [37] [17].
Second Dimension - SDS-PAGE:
- Equilibrate focused IPG strips in buffer containing 6 M urea, 2% SDS, 50 mM Tris-HCl (pH 8.8), and 30% glycerol.
- First equilibration: Add 1% DTT for 15 minutes.
- Second equilibration: Add 2.5% iodoacetamide for 15 minutes.
- Place IPG strip onto SDS-PAGE gel (8-16% gradient) and embed with 0.5% agarose.
- Run electrophoresis at constant current or voltage until dye front migrates off the gel [37] [17].
Protein Visualization and Processing:
- Stain with Colloidal Coomassie, SYPRO Ruby, or fluorescent stains compatible with MS.
- Image gels using appropriate scanner (e.g., Typhoon or ChemiDoc).
- Excise protein spots of interest robotically or manually.
- Process spots for in-gel digestion following similar reduction, alkylation, and trypsin digestion protocol as described for 1D gels [17] [71].
LC-MS/MS Analysis:
- Analyze digested peptides using similar LC-MS/MS parameters as for 1D gel samples.
- For comparative studies, consider using isobaric tags (TMT or iTRAQ) for multiplexed quantification of different experimental conditions [73].
Research Reagent Solutions
Table 3: Essential Research Reagents for Gel-LC-MS/MS Workflows
| Reagent/Category | Specific Examples | Function in Workflow |
|---|---|---|
| Separation Gels | Criterion TGX Precast Gels (Bio-Rad), NuPAGE Bis-Tris Gels (Thermo Fisher) | Provide matrix for protein separation by size (1D) or size/pI (2D) |
| IPG Strips | Immobiline DryStrips (Cytiva), ReadyStrip IPG Strips (Bio-Rad) | First dimension separation for 2D PAGE based on isoelectric point |
| Proteolytic Enzymes | Sequencing-grade modified trypsin (Promega), Lys-C (Roche) | Digest proteins into peptides amenable to LC-MS/MS analysis |
| Mass Spectrometers | Orbitrap Exploris Series (Thermo Fisher), timsTOF (Bruker) | High-sensitivity identification and quantification of peptides |
| Chromatography Systems | NanoElute (Bruker), EASY-nLC (Thermo Fisher) | High-resolution separation of peptides prior to MS analysis |
| Database Search Software | Proteome Discoverer (Thermo Fisher), MaxQuant (Open Source), Mascot (Matrix Science) | Identify proteins from MS/MS spectra by searching protein databases |
Applications and Biological Insights
The complementary nature of 1D and 2D PAGE approaches is evident in their applications to different biological questions. Each method provides unique insights that can be leveraged depending on research goals.
1D PAGE-LC-MS/MS excels in studies requiring comparative quantification across multiple samples. For instance, in drug development, this approach efficiently identifies protein expression changes in response to compound treatment [73]. The method's compatibility with insoluble protein fractions after solubilization with SDS makes it invaluable for membrane proteome analysis, which constitutes a significant challenge in proteomics [13]. The higher throughput and more straightforward quantitative capabilities also make 1D approaches suitable for time-course studies and larger sample cohorts.
2D PAGE-LC-MS/MS provides unique capabilities for analyzing protein interactions and complexes when performed under nondenaturing conditions [13]. The method's exceptional resolution of protein isoforms and post-translationally modified forms has proven instrumental in detecting disease-specific proteoforms that might serve as biomarkers [17] [71]. The technique's higher sensitivity in certain applications, as evidenced by the wider dynamic range of protein abundance detection, enables identification of low-abundance proteins that might be missed by other methods [13].
The integration of both 1D and 2D gel electrophoresis with LC-MS/MS represents complementary rather than competing approaches in modern proteomics. 1D SDS-PAGE-LC-MS/MS offers superior performance for comparative quantification, membrane proteome analysis, and higher-throughput applications. In contrast, 2D PAGE-LC-MS/MS provides enhanced capabilities for detecting protein isoforms, post-translational modifications, and protein complexes, with generally higher sensitivity and the ability to resolve thousands of protein features in a single analysis.
The choice between these methodologies should be guided by specific research objectives, sample characteristics, and analytical requirements. For comprehensive proteome characterization, particularly in discovery-phase research, employing both techniques in a complementary manner often yields the most complete biological insights. As LC-MS/MS technology continues to advance in sensitivity and throughput, both separation methods will remain essential components of the proteomics toolkit, each contributing unique strengths to the challenging task of comprehensive protein analysis.
In the field of proteomics, the selection of an appropriate protein separation technique is a critical foundational step that can profoundly influence the outcome of research and development projects. One-dimensional polyacrylamide gel electrophoresis (1D PAGE) and two-dimensional polyacrylamide gel electrophoresis (2D PAGE) represent two fundamental approaches with distinct strengths and limitations. This guide provides an objective comparison of their performance through experimental data and detailed case studies, offering drug development professionals a evidence-based framework for selecting the optimal method for their specific research contexts.
1D PAGE separates proteins primarily by molecular mass using sodium dodecyl sulfate (SDS) to denature proteins and impart a uniform negative charge [2]. The result is lanes of protein bands, where migration distance correlates with molecular weight.
2D PAGE combines two orthogonal separation techniques: isoelectric focusing (IEF) in the first dimension, which separates proteins based on their isoelectric point (pI), followed by SDS-PAGE in the second dimension, which separates by molecular mass [5] [2]. This results in a two-dimensional map where individual proteins appear as spots spread across the gel according to their unique pI and mass characteristics [43].
The workflow differences are substantial, with 2D PAGE requiring more complex procedures including IPG strip rehydration, isoelectric focusing, strip equilibration, and second-dimension separation, typically spanning multiple days [28].
Performance Comparison: Experimental Data
Direct comparative studies provide quantitative insights into the performance characteristics of each method. The table below summarizes key experimental findings from proteomic analyses:
Table 1: Quantitative Comparison of Protein Identification in Proteomic Analyses
| Sample Type | 1D PAGE Results | 2D PAGE Results | Reference |
|---|---|---|---|
| Human Bronchial Smooth Muscle Cells (Supernatant Fraction) | 2,552 proteins identified; Dynamic range: 3.5% to 2×10⁻⁴% abundance | 4,323 proteins identified; Dynamic range: 3.6% to 1×10⁻⁵% abundance | [13] [23] |
| Rat Liver Microsomes (Membrane Proteins) | 22 legitimate membrane proteins identified | Only 3 membrane proteins identified | [47] |
| Metaproteomic Analysis (Mock Microbial Community) | Faster runtime; More identifications per minute | Up to >10,000 protein groups identified; Higher overall identifications | [8] |
These findings highlight a critical trade-off: while 2D PAGE generally offers higher resolution and protein identification capabilities for complex mixtures, it demonstrates significant limitations for specific protein classes, particularly membrane proteins [14] [47]. The isoelectric focusing step in 2D PAGE improves overall sensitivity and dynamic range [13], but hydrophobic membrane proteins often precipitate at their pI values and are consequently underrepresented [14].
Experimental Protocols for Method Evaluation
1D SDS-PAGE Protocol for Membrane Protein Analysis
This protocol is adapted from the successful application in rat liver microsome studies that identified 22 membrane proteins [47]:
- Sample Preparation: Solubilize membrane proteins using SDT lysis buffer (4% SDS, 100 mM Tris-HCl pH 7.6, 0.1 M DTT) with bead-beating disruption [8].
- Protein Quantification: Determine protein concentration using compatible assays (Bradford, BCA, or 2D-Quant kit) [66].
- Gel Electrophoresis: Cast polyacrylamide gels with appropriate percentage (10-12%) or gradient (4-20%) for target protein size range [2]. Load 10-20 μg protein per lane for analytical gels.
- Electrophoresis Conditions: Run at constant voltage (100-150V) using Tris-glycine-SDS running buffer until dye front reaches bottom [2].
- Protein Detection: Use Coomassie Brilliant Blue for abundant proteins or SYPRO Ruby for higher sensitivity [5].
- Downstream Analysis: Excise bands of interest for in-gel digestion and LC-MS/MS identification [28].
2D PAGE Protocol for Comprehensive Proteome Analysis
This protocol is adapted from methods that successfully identified over 4,000 proteins from human bronchial smooth muscle cells [13] [23]:
Table 2: Essential Research Reagents for 2D PAGE
| Reagent/Category | Specific Examples | Function |
|---|---|---|
| Lysis Buffer Components | 2 M thiourea, 7 M urea, 4% CHAPS | Protein solubilization while maintaining integrity for IEF [66] |
| Reducing Agent | Dithiothreitol (DTT) or Tris(2-carboxyethyl)phosphine (TCEP) | Reduction of disulfide bonds [28] |
| IPG Strips | Immobiline DryStrips (pH 3-10, 4-7, or other ranges) | First dimension separation based on isoelectric point [28] |
| Rehydration Buffer | 8 M urea, 2% CHAPS, 0.002% bromophenol blue | Hydration of IPG strips and sample incorporation [66] |
| Equilibration Buffer | 6 M urea, 2% SDS, 0.375 M Tris-HCl (pH 8.8), 20% glycerol | Preparation of proteins for second dimension separation [28] |
Detailed Procedure:
Sample Preparation: Extract proteins using appropriate lysis buffer (e.g., 30 mM Tris-HCl, 2 M thiourea, 7 M urea, 4% CHAPS, pH 8.5) [66]. Clarify by centrifugation at 15,000 × g for 15 minutes.
Protein Cleanup: Use 2D clean-up kit to remove contaminants interfering with IEF [66].
First Dimension - Isoelectric Focusing:
Strip Equilibration: Incubate focused IPG strips in equilibration buffer (6 M urea, 2% SDS, 0.375 M Tris-HCl pH 8.8, 20% glycerol) with 1% DTT for 15 minutes, then same buffer with 2.5% iodoacetamide for 15 minutes [28].
Second Dimension - SDS-PAGE:
- Place equilibrated IPG strip onto 8-16% polyacrylamide gradient gel.
- Embed with agarose sealing solution.
- Run electrophoresis at constant voltage (100-150V) until dye front reaches bottom [13].
Protein Detection: Use SYPRO Ruby or similar fluorescent stain for optimal sensitivity and MS-compatibility [5].
Image Analysis and Spot Picking: Use specialized software (e.g., DeCyder, Progenesis) for spot detection, quantification, and matching across multiple gels [66].
Workflow Visualization
Application Case Studies in Drug Development
Biomarker Discovery for Respiratory Diseases
In research on human bronchial smooth muscle cells (HBSMC), 2D PAGE demonstrated exceptional capability for comprehensive proteome mapping, identifying 4,323 proteins with a dynamic range extending to 1×10⁻⁵% abundance [13]. This sensitivity enabled detection of low-abundance signaling proteins and protein interaction networks relevant to asthma and chronic obstructive pulmonary disease (COPD). The method's ability to separate protein isoforms and post-translationally modified forms provided insights into disease mechanisms that would be missed by 1D approaches [23].
Membrane Protein Profiling for Drug Target Identification
The study of rat liver microsomes revealed 1D PAGE's superior performance for membrane protein analysis, with identification of 22 legitimate membrane proteins compared to only 3 detected by 2D PAGE [47]. This advantage is critical for drug development, as membrane proteins represent over 60% of current drug targets. The difficulty in separating hydrophobic proteins by 2D PAGE, particularly those with multiple transmembrane domains, limits its utility for this important protein class [14].
Microbial Metaproteomics for Antibiotic Discovery
In metaproteomic analysis of microbial communities, 2D-LC approaches coupled with 2D separation principles enabled identification of over 10,000 protein groups, providing comprehensive functional analysis of microbial systems [8]. However, researchers noted that 1D-LC approaches offered faster analysis with more identifications per minute of runtime, suggesting a strategic choice between depth of analysis and throughput depending on research goals.
Strategic Selection Guidelines
Table 3: Method Selection Guide Based on Research Objectives
| Research Goal | Recommended Method | Rationale | Key Considerations |
|---|---|---|---|
| Membrane Protein Profiling | 1D PAGE | Superior identification of hydrophobic proteins with multiple transmembrane domains [47] | Compatible with strong detergents; avoids IEF-induced precipitation [14] |
| Biomarker Discovery (Complex Samples) | 2D PAGE | Higher resolution and protein identification capacity; superior dynamic range [13] | Enables detection of low-abundance regulatory proteins and PTMs [5] |
| High-Throughput Screening | 1D PAGE | Faster processing (hours vs. days); higher throughput [8] | Ideal for rapid comparative analysis of multiple samples [2] |
| Protein Interaction Studies | 2D PAGE (Native) | Preservation of protein complexes; visualization of interaction networks [13] | Maintains native protein structure and function [23] |
| Post-Translational Modification Analysis | 2D PAGE | Superior separation of protein isoforms with different pI values [5] | Detects charge shifts from phosphorylation, glycosylation, etc. [43] |
Advanced Technical Considerations
Addressing 2D PAGE Limitations
Recent methodological advances have mitigated some traditional limitations of 2D PAGE:
- Dynamic Range Improvement: Depletion of high-abundance proteins and use of sensitive fluorescent dyes (SYPRO Ruby, Deep Purple) have expanded detectable protein concentration ranges [5].
- Reproducibility Enhancements: Introduction of immobilized pH gradients (IPG) and standardized protocols have reduced gel-to-gel variability [5].
- Multiplexed Analysis: Two-dimensional difference gel electrophoresis (2D-DIGE) enables multiple sample comparison on the same gel using different cyanine dyes (Cy2, Cy3, Cy5), minimizing gel-to-gel variation and improving quantitative accuracy [66].
Complementary Approaches
For comprehensive proteomic coverage, many research teams employ both techniques strategically:
- Use 1D PAGE for membrane protein fractions and 2D PAGE for soluble fractions within the same study [13].
- Employ 1D PAGE for rapid screening followed by targeted 2D PAGE analysis of specific interest areas.
- Combine gel-based separation with gel-free LC-MS/MS approaches for maximum proteome coverage [8].
The selection between 1D and 2D PAGE represents a critical strategic decision in proteomic experimental design for drug development and clinical research. 1D PAGE offers advantages in speed, simplicity, and effectiveness for membrane protein analysis, while 2D PAGE provides superior resolution, dynamic range, and capability for detecting post-translational modifications. The most successful applications emerge from aligning methodological strengths with specific research objectives, often employing both techniques in complementary roles within integrated proteomic workflows. As technological advances continue to address current limitations, both methods remain essential tools in the proteomics toolkit for advancing drug discovery and clinical research.
Conclusion
The comparison between 1D and 2D PAGE reveals complementary roles in proteomic research rather than outright superiority of either technique. 1D PAGE remains the method of choice for rapid protein separation, purity assessment, and molecular weight determination due to its simplicity, speed, and cost-effectiveness. In contrast, 2D PAGE provides unparalleled resolution for complex protein mixtures, enabling comprehensive proteome profiling, detection of post-translational modifications, and biomarker discovery. The future of protein separation lies in strategic integration of both methods with advanced technologies like mass spectrometry and liquid chromatography, creating hybrid workflows that leverage the strengths of each approach. For biomedical researchers, the selection between 1D and 2D PAGE should be guided by specific research objectives, sample complexity, and available resources, with both techniques maintaining crucial roles in advancing drug development and clinical proteomics.
References
- 1. Gel electrophoresis-based plant proteomics: Past, present ... [https://www.sciencedirect.com/science/article/abs/pii/S1874391918303269]
- 2. Overview of Protein Electrophoresis [https://www.thermofisher.com/us/en/home/life-science/protein-biology/protein-biology-learning-center/protein-biology-resource-library/pierce-protein-methods/overview-electrophoresis.html]
- 3. The pre-omics era: The early days of two-dimensional gels [https://pmc.ncbi.nlm.nih.gov/articles/PMC2731566/]
- 4. Difference between 1D-Gel Electrophoresis and 2D- ... [https://byjus.com/neet/difference-between-1d-and-2d-gel-electrophoresis/]
- 5. Basics and recent advances of two dimensional [https://pmc.ncbi.nlm.nih.gov/articles/PMC3996944/]
- 6. After the Genome—A Brief History of Proteomics [https://proteomics.northwestern.edu/after-the-genome-a-brief-history-of-proteomics/]
- 7. The Evolution of Two-Dimensional Gel Electrophoresis [https://pubmed.ncbi.nlm.nih.gov/31836310/]
- 8. More Is Not Always Better: Evaluation of 1D and 2D-LC-MS ... [https://pmc.ncbi.nlm.nih.gov/articles/PMC6383543/]
- 9. Profiling Core Proteomes of Human Cell Lines by One- ... [https://www.sciencedirect.com/science/article/pii/S1535947620346831]
- 10. Principle of 1D SDS-PAGE and IEF [https://www.mtoz-biolabs.com/principle-of-1d-sds-page-and-ief.html]
- 11. The principle and method of polyacrylamide gel ... [https://www.mblbio.com/bio/g/support/method/sds-page.html]
- 12. Native SDS-PAGE: High Resolution Electrophoretic ... [https://pmc.ncbi.nlm.nih.gov/articles/PMC4517606/]
- 13. Comparison of the performance of 1D SDS-PAGE with ... [https://www.sciencedirect.com/science/article/abs/pii/S1570023218312546]
- 14. Effectiveness and limitation of two-dimensional gel ... [https://www.sciencedirect.com/science/article/abs/pii/S1570023204006749]
- 15. Label-free Quantitative Analysis of One-dimensional PAGE ... [https://pmc.ncbi.nlm.nih.gov/articles/PMC2596345/]
- 16. Two-Dimensional Gel Electrophoresis - an overview [https://www.sciencedirect.com/topics/chemical-engineering/two-dimensional-gel-electrophoresis]
- 17. Comparative Skeletal Muscle Proteomics Using Two ... [https://pmc.ncbi.nlm.nih.gov/articles/PMC5217355/]
- 18. More Is Not Always Better: Evaluation of 1D and 2D-LC-MS ... [https://www.frontiersin.org/journals/microbiology/articles/10.3389/fmicb.2019.00238/full]
- 19. Western Blot: The Complete Guide [https://www.antibodies.com/applications/western-blotting]
- 20. Deciphering food proteins: The applications of SDS-PAGE ... [https://www.sciencedirect.com/science/article/abs/pii/S2212429225003025]
- 21. Comparison of first dimension IPG and NEPHGE techniques ... [https://proteomesci.biomedcentral.com/articles/10.1186/1477-5956-11-36]
- 22. Two-Dimensional Polyacrylamide Gel Electrophoresis for ... [https://www.nature.com/articles/s41598-019-46955-6]
- 23. Comparison of the performance of 1D SDS-PAGE with ... [https://pubmed.ncbi.nlm.nih.gov/30599360/]
- 24. Detergent Screening With Hybrid Detergents Increases ... [https://pmc.ncbi.nlm.nih.gov/articles/PMC12329390/]
- 25. Separation methods for food protein purification and analysis [https://www.explorationpub.com/Journals/eff/Article/101043]
- 26. Integrating computational simulation and high-throughput ... [https://pmc.ncbi.nlm.nih.gov/articles/PMC12599885/]
- 27. 1D SDS-PAGE, IEF Service [https://www.creative-proteomics.com/services/1d-sds-page-ief.htm]
- 28. 1D and 2D PAGE | Proteomics and Mass Spectrometry ... [https://sites.psu.edu/msproteomics/category/sample-prep/1d-and-2d-page/]
- 29. How to Perform 1D SDS-PAGE [https://www.news-medical.net/whitepaper/20200930/How-to-Perform-1D-SDS-PAGE.aspx]
- 30. Basics and recent advances of two dimensional [https://clinicalproteomicsjournal.biomedcentral.com/articles/10.1186/1559-0275-11-16]
- 31. SDS-PAGE and Coomassie staining - QB3 Berkeley [https://qb3.berkeley.edu/education/lab-fundamentals-bootcamp/manual/proteins/protein-gels/]
- 32. Protein Gel Staining Methods [https://www.thermofisher.com/us/en/home/life-science/protein-biology/protein-biology-learning-center/protein-biology-resource-library/pierce-protein-methods/protein-gel-stains.html]
- 33. Advantages and Disadvantages of 1D SDS-PAGE and IEF [https://www.mtoz-biolabs.com/advantages-and-disadvantages-of-1d-sds-page-and-ief.html]
- 34. Clinical proteomics: Current status, challenges, and future ... [https://www.sciencedirect.com/science/article/pii/S1607551X1000015X]
- 35. - Two electrophoresis - Wikipedia dimensional gel [https://en.wikipedia.org/wiki/Two-dimensional_gel_electrophoresis]
- 36. Two-Dimensional Gel Electrophoresis - an overview [https://www.sciencedirect.com/topics/neuroscience/two-dimensional-gel-electrophoresis]
- 37. A systematic evaluation of sample preparation and 2-D gel ... [https://www.sciencedirect.com/science/article/pii/S2215016124001316]
- 38. Synthetic Data Generation for the Development of 2D Gel ... [https://www.mdpi.com/2076-3417/12/9/4393]
- 39. Overview of SDS-PAGE [https://www.creative-proteomics.com/resource/overview-of-sds-page.htm]
- 40. Western blotting guide: Part 2, Protein separation by SDS- ... [https://www.jacksonimmuno.com/secondary-antibody-resource/technical-tips/western-blotting-guide-part-2/]
- 41. Comparison of in-gel protein separation techniques ... [https://pmc.ncbi.nlm.nih.gov/articles/PMC4234072/]
- 42. Overview of Protein Electrophoresis [https://www.thermofisher.com/ru/en/home/life-science/protein-biology/protein-biology-learning-center/protein-biology-resource-library/pierce-protein-methods/overview-electrophoresis.html]
- 43. Overview of Two-Dimensional Gel Electrophoresis [https://www.creative-proteomics.com/resource/overview-of-two-dimensional-gel-electrophoresis.htm]
- 44. One-dimensional SDS-Polyacrylamide Gel Electrophoresis ... [https://www.sciencedirect.com/science/chapter/bookseries/pii/B9780124201194000124]
- 45. Comparison of different separation technologies for ... [https://www.sciencedirect.com/science/article/abs/pii/S0021967306011319]
- 46. 1D Gel Electrophoresis [https://www.appliedbiomics.com/1d-gel-electrophoresis/]
- 47. Comparison of one-dimensional and ... | Article - H1 Connect [https://connect.h1.co/article/1007835]
- 48. Two-dimensional protein electrophoresis - PubMed Central [https://pmc.ncbi.nlm.nih.gov/articles/PMC3593383/]
- 49. Two-Dimensional Gel Electrophoresis and 2D-DIGE [https://pubmed.ncbi.nlm.nih.gov/29019120/]
- 50. Advantages and Disadvantages of 2D Gel Electrophoresis ... [https://www.mtoz-biolabs.com/advantages-and-disadvantages-of-2d-gel-electrophoresis-image.html]
- 51. Two-dimensional gel electrophoresis: recent advances in ... [https://www.sciencedirect.com/science/article/abs/pii/S1367593101002757]
- 52. Protein Gel 1D Electrophoresis Support—Troubleshooting [https://www.thermofisher.com/us/en/home/technical-resources/technical-reference-library/protein-electrophoresis-western-blotting-support-center/protein-gel-1d-electrophoresis-support1/protein-gel-1d-electrophoresis-support-troubleshooting.html]
- 53. Common artifacts and mistakes made in electrophoresis [https://pmc.ncbi.nlm.nih.gov/articles/PMC7295095/]
- 54. Troubleshooting SDS-PAGE Gel Running Issues [https://www.goldbio.com/blogs/articles/troubleshooting-sds-page-gel-running-issues?srsltid=AfmBOooKlVcyTtlMpaoKVQ0jWagYZK5YQggrYaHfvbv3aNyCAS2kWBtP]
- 55. Isoelectric Focusing: Principles, Applications, Advantages ... [https://www.creative-proteomics.com/resource/isoelectric-focusing-principles-applications-advantages-limitations.htm]
- 56. Application of Separation technologies to Proteomics ... [https://www.sciencedirect.com/science/article/abs/pii/S0065323303010222]
- 57. Tips to Prevent Streaking on 2-D Gels [https://www.americanlaboratory.com/914-Application-Notes/30736-Tips-to-Prevent-Streaking-on-2-D-Gels/]
- 58. R&D Systems Quality Control Western Blot Protocol [https://www.rndsystems.com/resources/protocols/western-blot-qc-protocol]
- 59. The Evolution of SDS-Based Protein Separation [https://www.bio-techne.com/resources/blogs/advantages-of-ce-sds]
- 60. Western blot protocol for low abundance proteins [https://www.abcam.com/en-us/technical-resources/protocols/western-blot-protocol-for-low-abundance-proteins]
- 61. Detecting Low Abundance Proteins in Western Blotting [https://www.thermofisher.com/us/en/home/life-science/protein-biology/protein-biology-learning-center/protein-biology-resource-library/pierce-protein-methods/detecting-low-abundance-proteins-in-western-blotting.html]
- 62. A novel method that improves sensitivity of protein ... [https://pmc.ncbi.nlm.nih.gov/articles/PMC3768259/]
- 63. Difference between 1D-Gel Electrophoresis and 2D- ... [https://testbook.com/key-differences/difference-between-1d-and-2d-gel-electrophoresis]
- 64. Optimisation of the two-dimensional gel electrophoresis ... [https://proteomesci.biomedcentral.com/articles/10.1186/1477-5956-2-6]
- 65. 2-D Fluorescence Difference Gel Electrophoresis (DIGE) in Neuroproteomics - Neuroproteomics - NCBI Bookshelf [https://www.ncbi.nlm.nih.gov/books/NBK56019/]
- 66. Two-dimensional fluorescence difference gel ... [https://pmc.ncbi.nlm.nih.gov/articles/PMC2001252/]
- 67. UNIT 10.4 Comparing Complex Protein Samples Using Two ... [https://pmc.ncbi.nlm.nih.gov/articles/PMC6579672/]
- 68. All about DIGE : Expert Review of Proteomics [https://www.ovid.com/journals/expr/fulltext/10.1586/14789450.1.4.401~all-about-dige-quantification-technology-for]
- 69. How current, voltage, and power settings affect SDS-PAGE [https://www.biossusa.com/blogs/news/how-current-voltage-and-power-settings-affect-sds-page?srsltid=AfmBOooNHZLKVGWqbgXFmbOHiAF1czuu5X7cWXv_IjpkcuHmiTEORoZH]
- 70. Overview of Protein Electrophoresis [https://www.thermofisher.com/tr/en/home/life-science/protein-biology/protein-biology-learning-center/protein-biology-resource-library/pierce-protein-methods/overview-electrophoresis.html]
- 71. High-throughput proteomics: a methodological mini-review [https://www.nature.com/articles/s41374-022-00830-7]
- 72. Liquid Chromatography Mass Spectrometry-Based ... [https://pmc.ncbi.nlm.nih.gov/articles/PMC3095207/]
- 73. LC-MS-based proteomics: insights into natural product- ... [https://www.sciencedirect.com/science/article/pii/S1359644625002478]