SDS-PAGE vs Native PAGE: A Comprehensive Guide to Protein Separation Resolution for Life Science Research
This article provides researchers, scientists, and drug development professionals with a systematic comparison of SDS-PAGE and Native PAGE resolution capabilities.
SDS-PAGE vs Native PAGE: A Comprehensive Guide to Protein Separation Resolution for Life Science Research
Abstract
This article provides researchers, scientists, and drug development professionals with a systematic comparison of SDS-PAGE and Native PAGE resolution capabilities. It explores the fundamental principles governing each technique, details methodological protocols for diverse applications, offers practical troubleshooting guidance for common resolution issues, and establishes frameworks for validating and interpreting results. By synthesizing foundational knowledge with advanced optimization strategies, this guide enables informed selection and implementation of the most appropriate electrophoretic method for specific research objectives, from basic protein characterization to complex functional studies in drug discovery.
Core Principles of Protein Separation: Understanding the Resolution Fundamentals of SDS-PAGE and Native PAGE
In biomedical research, the ability to separate and analyze proteins with high precision is fundamental to advancing our understanding of biological systems and developing new therapeutics. Resolution in protein electrophoresis refers to the degree of separation between adjacent protein bands, determining the technique's capacity to distinguish between proteins with similar properties. For researchers and drug development professionals, selecting the appropriate electrophoretic method directly impacts the reliability and interpretability of experimental data.
This guide provides a comprehensive comparison of resolution in two fundamental techniques: SDS-PAGE (Sodium Dodecyl Sulfate-Polyacrylamide Gel Electrophoresis) and Native PAGE (Native Polyacrylamide Gel Electrophoresis). By examining their key metrics, experimental protocols, and applications, we aim to equip scientists with the knowledge to choose the optimal separation method for their specific research objectives, from basic protein characterization to complex functional studies.
Fundamentals of Electrophoretic Resolution
Resolution in gel electrophoresis is quantitatively defined as the distance between the centers of two adjacent protein bands divided by the average width of the bands. Higher resolution allows researchers to distinguish between proteins with minimal differences in their physicochemical properties. Several critical factors influence resolution:
- Gel pore size: Controlled by polyacrylamide concentration, with higher percentages providing better separation of lower molecular weight proteins [1]
- Sample preparation: Denaturing versus non-denaturing conditions fundamentally alter separation mechanisms [2]
- Buffer systems: Ionic strength and pH affect protein mobility and band sharpness [3]
- Electric field strength: Optimal voltage applications minimize band diffusion and improve separation [1]
The choice between SDS-PAGE and Native PAGE represents a fundamental trade-off between the high resolution of denatured proteins and the preservation of native structure and function.
SDS-PAGE vs. Native PAGE: A Comparative Framework
Core Principles and Separation Mechanisms
Table 1: Fundamental Differences Between SDS-PAGE and Native PAGE
| Parameter | SDS-PAGE | Native PAGE |
|---|---|---|
| Separation Basis | Molecular weight primarily [2] [4] [1] | Size, charge, and shape of native protein [2] [4] [1] |
| Gel Conditions | Denaturing [2] [4] | Non-denaturing [2] [4] |
| Sample Treatment | Heating with SDS and reducing agents (DTT/BME) [4] | No heating; no denaturing agents [4] |
| Protein Charge | Uniform negative charge from SDS binding [2] [1] | Intrinsic charge based on protein sequence and pH [5] [1] |
| Protein State | Denatured to linear polypeptides [1] | Native folded conformation retained [5] [1] |
| Temperature | Room temperature [4] | Often run at 4°C to maintain stability [4] |
| Protein Recovery | Generally not recoverable in functional form [2] [4] | Can be recovered with preserved function [2] [4] [5] |
Quantitative Resolution Metrics and Performance
Table 2: Resolution Performance Characteristics and Applications
| Characteristic | SDS-PAGE | Native PAGE |
|---|---|---|
| Molecular Weight Determination | High accuracy for polypeptide chains [1] | Approximate due to influence of charge and shape [5] |
| Detection Sensitivity | Excellent with Coomassie, silver, or fluorescent stains [1] | May be reduced due to native conformation [6] |
| Functional Preservation | Enzymatic activity destroyed [3] [5] | Enzymatic activity typically retained [3] [5] [7] |
| Complex Stability | Subunits dissociated [1] | Protein complexes and quaternary structures maintained [5] [1] |
| Optimal Protein Size Range | 5-250 kDa [2] | Variable based on native charge and size [8] |
| Band Sharpness | Typically high due to uniform charge-mass ratio [1] | Variable based on charge heterogeneity [8] |
| Downstream Applications | Western blotting, mass spectrometry [5] [9] | Functional assays, activity staining, complex isolation [5] [7] |
Experimental Protocols for Resolution Assessment
Standard SDS-PAGE Protocol for High-Resolution Separation
Sample Preparation:
- Combine protein sample with SDS-containing loading buffer (e.g., 106 mM Tris HCl, 141 mM Tris Base, 0.51 mM EDTA, 2% LDS, 10% glycerol, pH 8.5) [3]
- Heat samples at 70-100°C for 10 minutes to ensure complete denaturation [1]
- Include reducing agents (DTT or beta-mercaptoethanol) to break disulfide bonds [2]
Gel Electrophoresis:
- Use appropriate polyacrylamide concentration (e.g., 12% for 10-100 kDa proteins) [1]
- Employ discontinuous buffer system with stacking (pH 6.8) and resolving (pH 8.8) gels [1]
- Run at constant voltage (200V) using MOPS/Tris running buffer with 0.1% SDS [3]
- Include molecular weight standards for calibration [1]
Visualization:
- Stain with Coomassie Blue, silver stain, or fluorescent dyes [1]
- Transfer to membrane for western blotting if needed [5]
Native PAGE Protocol for Functional Resolution
Sample Preparation:
- Mix protein sample with non-denaturing buffer (e.g., 50 mM BisTris, 50 mM NaCl, 10% glycerol, pH 7.2) [3]
- Avoid heating, SDS, and reducing agents to preserve native structure [4] [1]
- Keep samples at 4°C to maintain stability [4]
Gel Electrophoresis:
- Use pre-cast native gels or prepare without SDS [3]
- Run in specialized native running buffers (e.g., BisTris/Tricine system) [3]
- Maintain temperature at 4°C during electrophoresis [4]
- Apply constant voltage (150V) for longer run times [3]
Activity Detection:
- For enzymatic activity, incubate gel in substrate solution (e.g., octanoyl-CoA with nitro blue tetrazolium for MCAD detection) [7]
- Detect formation of insoluble colored product at enzyme locations [7]
Advanced Techniques and Modifications
Blue Native (BN-) PAGE and Clear Native (CN-) PAGE
Blue Native PAGE incorporates Coomassie G-250 dye, which imparts negative charge to protein complexes, allowing separation based primarily on size while maintaining native conditions [8]. This technique offers excellent resolution for membrane protein complexes but may interfere with downstream fluorescence studies or enzymatic assays [6].
Clear Native PAGE eliminates the Coomassie dye, relying on the intrinsic charge of proteins [8]. While milder than BN-PAGE and better for retaining labile supramolecular assemblies, CN-PAGE typically provides lower resolution and can suffer from protein aggregation and band broadening [8].
High-Resolution Clear Native PAGE (hrCN-PAGE) represents an advanced modification where non-colored mixtures of anionic and neutral detergents substitute for Coomassie dye, offering resolution comparable to BN-PAGE while maintaining compatibility with in-gel catalytic activity assays and fluorescence studies [6].
Native SDS-PAGE (NSDS-PAGE)
A hybrid approach called Native SDS-PAGE modifies traditional SDS-PAGE by reducing SDS concentration in the running buffer from 0.1% to 0.0375%, eliminating EDTA, and omitting the heating step [3]. This method preserves significant enzymatic activity in many proteins (seven of nine model enzymes retained function) while maintaining high-resolution separation capabilities [3]. Metal retention in metalloproteins increased from 26% in standard SDS-PAGE to 98% using this modified approach [3].
Research Reagent Solutions for Electrophoresis
Table 3: Essential Reagents for Protein Electrophoresis
| Reagent/Category | Function | Specific Examples |
|---|---|---|
| Denaturing Agents | Disrupt protein structure, impart uniform charge | Sodium dodecyl sulfate (SDS) [2] [1] |
| Reducing Agents | Break disulfide bonds | Dithiothreitol (DTT), Beta-mercaptoethanol [2] [4] |
| Gel Matrix Components | Form porous separation matrix | Acrylamide, Bis-acrylamide [1] |
| Polymerization Catalysts | Initiate and accelerate gel formation | Ammonium persulfate (APS), TEMED [1] |
| Buffer Systems | Maintain pH, provide conducting medium | Tris-glycine, Tris-HCl, BisTris, MOPS [3] [1] |
| Tracking Dyes | Monitor electrophoresis progress | Bromophenol blue, Phenol red [3] |
| Molecular Weight Standards | Calibrate and estimate protein size | Pre-stained protein ladders, unstained standards [1] |
| Activity Assay Reagents | Detect enzymatic function in native gels | Nitro blue tetrazolium (NBT), substrate-specific compounds [7] |
Applications in Biomedical Research and Drug Development
Case Study: MCAD Deficiency Analysis
A 2025 study demonstrated the power of high-resolution clear native electrophoresis in diagnosing and understanding Medium-Chain Acyl-CoA Dehydrogenase (MCAD) deficiency [7]. Researchers adapted a colorimetric in-gel assay to quantify the activity of MCAD tetramers separately from other protein forms, providing novel insights into how pathogenic variants affect MCAD structure and function [7]. This approach allowed differentiation of subtle differences in protein shape, enzymatic activity, and FAD content that would be undetectable using standard enzymatic assays or SDS-PAGE [7].
Metalloprotein Analysis
Native SDS-PAGE has shown particular utility in metalloprotein research, where retention of non-covalently bound metal ions is crucial for analysis [3]. Using modified SDS-PAGE conditions, researchers achieved 98% zinc retention in proteomic samples compared to only 26% with standard SDS-PAGE [3]. This preservation enables more accurate characterization of metalloprotein composition and function.
Membrane Protein Complexes
BN-PAGE and hrCN-PAGE have become indispensable tools for studying membrane protein complexes, which are often targets for pharmaceutical development [8] [6]. These techniques enable the isolation of intact complexes from biological membranes while retaining their native composition and activity [2] [6]. The high resolution achieved allows researchers to distinguish between different oligomeric states and identify protein-protein interactions critical for function [6].
The choice between SDS-PAGE and Native PAGE involves careful consideration of research objectives and the specific protein properties of interest. SDS-PAGE remains the gold standard for determining molecular weight, assessing protein purity, and analyzing denatured proteins with high resolution [1]. Conversely, Native PAGE and its advanced variants (BN-PAGE, CN-PAGE) are essential for studying native protein function, complexes, and enzymatic activities [5] [7].
Recent methodological advances, including Native SDS-PAGE and high-resolution clear native PAGE, are bridging the gap between these techniques, offering improved capabilities for resolving complex protein mixtures while preserving functional properties [3] [6]. As biomedical research continues to focus on increasingly complex protein systems and their roles in disease, the strategic selection and optimization of electrophoretic methods will remain fundamental to progress in basic research and drug development.
In the field of protein analysis, polyacrylamide gel electrophoresis (PAGE) serves as a foundational technique for separating and characterizing proteins. Two principal methodologies—SDS-PAGE and Native PAGE—offer complementary approaches with distinct mechanistic principles and applications. SDS-PAGE achieves separation primarily by molecular weight under denaturing conditions, while Native PAGE preserves native protein structures, separating molecules based on size, charge, and shape. For researchers and drug development professionals, understanding these differential separation mechanisms is crucial for selecting the appropriate analytical tool, whether for determining protein purity and molecular weight, studying native protein complexes, or ensuring the quality of biopharmaceutical products. This guide provides a detailed comparison of these techniques, their underlying mechanisms, and their applications in modern protein science.
Core Separation Mechanisms and Key Differences
The fundamental distinction between SDS-PAGE and Native PAGE lies in their treatment of protein structure and the resulting basis for separation.
SDS-PAGE: Molecular Weight-Based Separation
Sodium dodecyl sulfate-polyacrylamide gel electrophoresis (SDS-PAGE) employs a denaturing approach to separate proteins primarily by molecular mass [4] [1]. The anionic detergent SDS plays a critical role by binding uniformly to polypeptide chains in a constant weight ratio (approximately 1.4 g SDS per 1 g of protein) [10]. This SDS coating masks the proteins' intrinsic charges and confers a uniform negative charge density, effectively linearizing the polypeptides by disrupting non-covalent interactions and secondary structure [5] [1] [10]. When an electric field is applied, these SDS-polypeptide complexes migrate through the porous polyacrylamide gel matrix toward the anode, with separation governed principally by molecular size due to the sieving effect of the gel [1] [11]. Smaller proteins navigate the pores more readily and migrate faster, while larger proteins are impeded, resulting in distinct bands corresponding to molecular weight [12].
Native PAGE: Multi-Parameter Separation of Native Proteins
In contrast, Native PAGE (non-denaturing PAGE) separates proteins in their native, folded conformation without denaturants [4] [1]. Without SDS to override intrinsic charge, separation depends on a combination of the protein's net charge, hydrodynamic size (influenced by molecular mass and three-dimensional shape), and the protein's inherent charge at the running buffer pH [5] [1]. Proteins migrate toward the electrode of opposite charge, with the frictional force of the gel matrix creating a sieving effect that regulates movement according to size and shape [1]. This technique preserves protein function, enzymatic activity, and multimeric quaternary structures, making it invaluable for studying protein complexes and functional properties [4] [1].
Table 1: Fundamental Differences Between SDS-PAGE and Native PAGE
| Parameter | SDS-PAGE | Native PAGE |
|---|---|---|
| Separation Basis | Molecular weight [4] | Size, overall charge, and shape [4] |
| Protein State | Denatured/unfolded [4] [1] | Native/folded [4] [1] |
| Detergent (SDS) | Present (denaturing agent) [4] | Absent [4] |
| Sample Preparation | Heated with SDS and reducing agents [4] | Not heated; no denaturing agents [4] |
| Protein Function Post-Separation | Lost [4] | Retained [4] |
| Information Provided | Polypeptide chain molecular weight, purity [4] | Oligomeric state, protein-protein interactions, native charge [5] |
Experimental Protocols and Methodologies
Standardized protocols are essential for obtaining reproducible results with either electrophoresis technique.
SDS-PAGE Experimental Workflow
The SDS-PAGE procedure involves a discontinuous gel system with distinct stacking and resolving phases, originally developed by Laemmli [10]. The process begins with sample preparation, where proteins are diluted in a sample buffer containing SDS, a reducing agent (such as β-mercaptoethanol or DTT to break disulfide bonds), and glycerol [4] [10]. This mixture is heated to 95°C for 5 minutes to ensure complete denaturation [10]. Simultaneously, a polyacrylamide gel is prepared, typically consisting of a large-pore stacking gel (pH ~6.8) layered over a small-pore resolving gel (pH ~8.8) [12] [10]. The denatured samples and a molecular weight marker are loaded into wells, and electrophoresis is initiated in a buffer system (e.g., Tris-glycine) containing 0.1% SDS [10]. The stacking gel concentrates proteins into a sharp band before they enter the resolving gel, where high-resolution separation by size occurs [10]. Following separation, proteins are visualized by staining with Coomassie Brilliant Blue, silver stain, or other specialized dyes [10].
Native PAGE Experimental Workflow
For Native PAGE, the sample preparation is milder; proteins are mixed with a non-denaturing sample buffer without SDS or reducing agents, and the sample is not heated [4]. The gel composition also lacks SDS and may utilize a continuous buffer system throughout, though discontinuous systems are also possible [1]. The running buffer similarly contains no SDS or other denaturants [4]. Because the native state must be preserved, electrophoresis is often performed at 4°C to minimize denaturation and proteolysis [4] [1]. Following electrophoresis, proteins can be detected by staining or, uniquely, recovered from the gel for functional assays [4] [1].
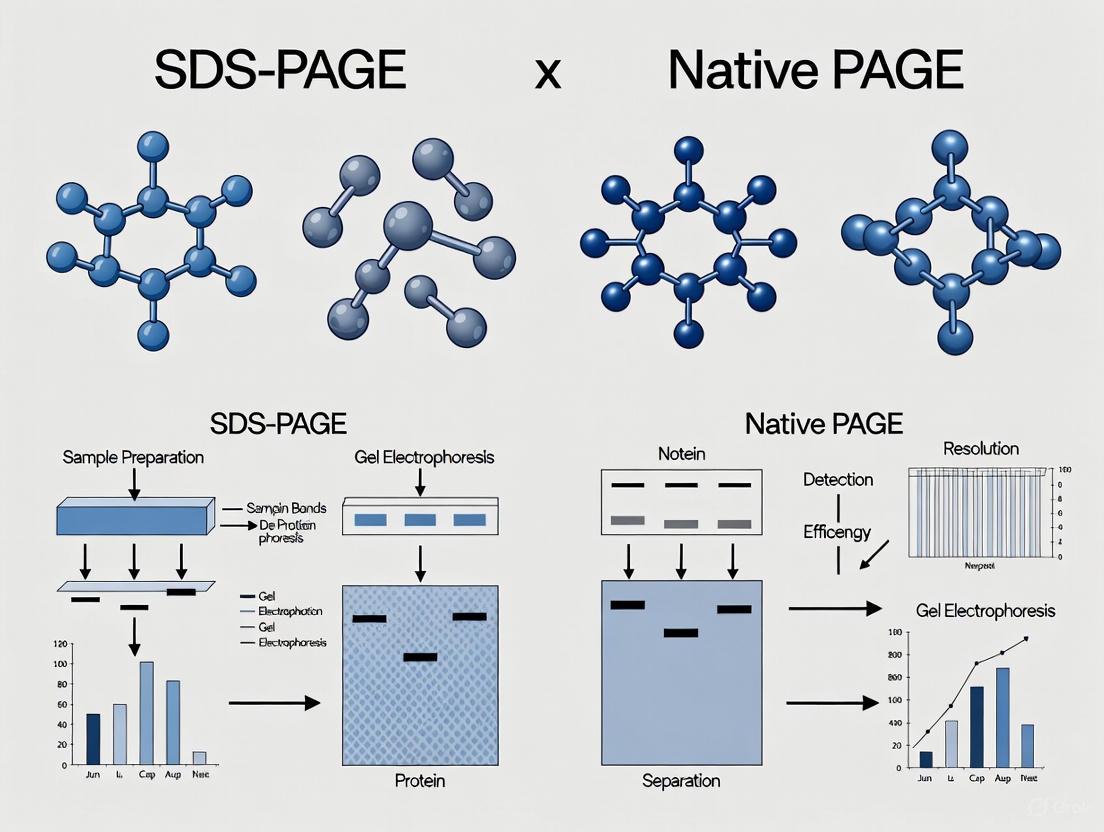
Diagram 1: Comparative workflow of SDS-PAGE versus Native PAGE
Comparative Data and Resolution Analysis
The choice between SDS-PAGE and Native PAGE significantly impacts the resolution of protein features and the biological information obtained.
Quantitative Performance Comparison
Table 2: Performance and Application Comparison
| Characteristic | SDS-PAGE | Native PAGE |
|---|---|---|
| Typical Run Temperature | Room Temperature [4] | 4°C [4] |
| Protein Recovery Post-Separation | Not functional; cannot be recovered [4] | Functional; can be recovered [4] |
| Quaternary Structure Analysis | Disrupts non-covalent multimers [4] [13] | Preserves multimeric complexes [4] [13] |
| Key Applications | Molecular weight determination, purity check, protein expression analysis [4] | Study of protein structure, subunit composition, and function [4] |
| Impact on Metal Cofactors | Removes non-covalently bound metal ions [3] | Can retain metal cofactors and enzymatic activity [3] |
Resolution and Separation Efficiency
The resolution of SDS-PAGE for molecular weight determination is typically within ±10% of the true value when calibrated with appropriate standards [10]. Its high resolving power for polypeptide chains is evidenced by its ability to distinguish proteins differing in molecular weight by as little as 2% [4]. The discontinuous buffer system (stacking and resolving gels) is critical for achieving sharp, well-defined bands [12] [10]. In contrast, Native PAGE resolution is influenced by the protein's native charge-to-mass ratio, which may not resolve proteins with similar hydrodynamic radii but different masses as effectively [5]. However, Native PAGE provides superior resolution for detecting different oligomeric states and protein complexes that are disrupted in SDS-PAGE [13].
Advanced variants like Blue Native PAGE (BN-PAGE) use Coomassie dye to impart charge for separation, while Clear Native PAGE (CN-PAGE) relies on the protein's intrinsic charge [4]. A hybrid technique, NSDS-PAGE, reduces SDS concentration and eliminates heating and reducing agents, enabling high-resolution separation while retaining Zn²⺠in 98% of metalloproteins and preserving activity in 7 of 9 model enzymes, compared to complete denaturation in standard SDS-PAGE [3].
Essential Research Reagent Solutions
Successful electrophoresis requires specific reagents, each serving a distinct function in the separation process.
Table 3: Key Reagents for Protein Electrophoresis
| Reagent | Function | Application in SDS-PAGE | Application in Native PAGE |
|---|---|---|---|
| SDS (Sodium Dodecyl Sulfate) | Denatures proteins; confers uniform negative charge [1] [10] | Essential [4] | Not Used [4] |
| Reducing Agents (DTT, β-ME) | Breaks disulfide bonds [4] [10] | Used (in reducing SDS-PAGE) [4] | Not Used [4] |
| Polyacrylamide Gel | Sieving matrix for size-based separation [1] | Used [4] | Used [4] |
| Tris-based Buffers | Maintains pH for electrophoresis and charge states [10] | Used (e.g., Tris-glycine) [10] | Used (e.g., Tris-borate) [1] |
| Tracking Dye (Bromophenol Blue) | Visualizes migration front during run [10] | Used [10] | Used (alternative dyes possible) [3] |
| Coomassie Brilliant Blue | Stains proteins post-electrophoresis [4] | Common [4] | Common (especially in BN-PAGE) [4] [3] |
Technological Evolution: From Gels to Capillaries
Protein separation technologies have evolved significantly since the inception of SDS-PAGE. While slab gel systems remain widely used, Capillary Electrophoresis-SDS (CE-SDS) has emerged as a powerful automated alternative that addresses several limitations of traditional SDS-PAGE [14]. CE-SDS provides higher resolution, superior quantitative precision, and better reproducibility while reducing hands-on time and toxic waste generation by eliminating gel casting, staining, and destaining [14]. This method is now extensively used in biopharmaceutical development for the analysis of monoclonal antibodies, bispecific antibodies, antibody-drug conjugates, and other therapeutic proteins, with many leading companies adopting it for regulatory filings [14].
Troubleshooting Common Experimental Issues
Successful implementation of electrophoresis requires awareness of potential pitfalls and their solutions. "Smiling" bands (curving upward at gel edges) indicate excessive heat generation during runs and can be mitigated by running at a lower voltage or ensuring adequate cooling [12]. Smeared bands often result from incomplete denaturation (insufficient heating or fresh reducing agent) or overly high salt concentrations in the sample [12]. Unexpected bands can arise from protein degradation, which can be minimized by using protease inhibitors, or from post-translational modifications like phosphorylation [12]. Weak or faint bands typically signal insufficient protein loading, while "bulging" bands suggest overloading, highlighting the need for accurate protein quantification before loading [12].
SDS-PAGE and Native PAGE serve as fundamental, yet distinct, tools in the protein scientist's arsenal. SDS-PAGE provides unparalleled resolution for determining molecular weight and analyzing polypeptide composition under denaturing conditions, making it ideal for routine analytical applications. Native PAGE, while offering lower resolution for molecular weight determination, is indispensable for studying functional protein properties, native complexes, and enzymatic activities. The choice between these techniques should be guided by the specific research question—whether it requires knowledge of polypeptide size or insight into native protein structure and function. As protein therapeutics and complex biological questions advance, the complementary use of both techniques, along with emerging technologies like CE-SDS, will continue to provide critical insights into protein characterization.
In the field of protein science, the analytical technique of polyacrylamide gel electrophoresis (PAGE) serves as a fundamental tool for separating and characterizing proteins. However, researchers must choose between two principal methodologies that offer contrasting information: denaturing SDS-PAGE and non-denaturing Native PAGE. While SDS-PAGE (sodium dodecyl sulfate-polyacrylamide gel electrophoresis) has become a ubiquitous workhorse in molecular biology laboratories for determining protein molecular weight, it achieves this at a significant cost—the complete destruction of native protein structure and function [4] [1]. In contrast, Native PAGE represents a sophisticated alternative that preserves proteins in their biologically active state, enabling the study of protein complexes, interactions, and enzymatic activity under conditions that closely mimic the cellular environment [2] [5]. This guide provides a comprehensive comparison of these techniques, with particular emphasis on the separation mechanism of Native PAGE and its critical applications in modern drug development and biomedical research where maintaining structural and functional integrity is paramount.
Fundamental Principles of Separation
Core Mechanism of Native PAGE
The Native PAGE technique operates on the principle of separating proteins based on their intrinsic charge, size, and three-dimensional shape simultaneously [4] [1]. Unlike its denaturing counterpart, Native PAGE employs non-denaturing conditions without sodium dodecyl sulfate (SDS) or reducing agents, thereby preserving the protein's native conformation [2]. In this system, proteins migrate through the polyacrylamide gel matrix under the influence of an electric field at a rate determined by their charge-to-mass ratio and the frictional force imposed by their hydrodynamic volume [1]. Proteins with higher negative charge density migrate faster toward the anode, while larger proteins experience greater frictional resistance, slowing their progression [15]. The gel matrix itself acts as a molecular sieve, with pore size regulated by the polyacrylamide concentration [1]. This multi-parameter separation mechanism allows researchers to resolve not just individual proteins but also functionally distinct protein complexes while maintaining their biological activity [5].
Core Mechanism of SDS-PAGE
In stark contrast, SDS-PAGE employs a simplification strategy through deliberate denaturation. The technique relies on the anionic detergent SDS, which binds to proteins in a constant weight ratio (approximately 1.4 g SDS per 1 g of protein) and confers a uniform negative charge that masks the proteins' intrinsic charge [1] [11]. Combined with heat treatment and reducing agents like β-mercaptoethanol or DTT that break disulfide bonds, SDS unravels proteins into linear polypeptide chains [4] [2]. This denaturation process eliminates the influence of protein shape and charge heterogeneity, resulting in separation based almost exclusively on molecular mass [1] [11]. Smaller polypeptides migrate more rapidly through the gel matrix, while larger ones lag behind, enabling molecular weight estimation when compared with standardized protein ladders [11].
Table 1: Fundamental Separation Mechanisms Compared
| Parameter | Native PAGE | SDS-PAGE |
|---|---|---|
| Separation Basis | Size, intrinsic charge, and 3D structure | Molecular weight primarily |
| Protein State | Native, folded structure | Denatured, linearized polypeptides |
| Charge Characteristics | Native charge preserved | Uniform negative charge from SDS |
| Complex Integrity | Maintains quaternary structure | Disassembles protein complexes |
| Molecular Sieving | Based on hydrodynamic volume | Based on polypeptide chain length |
Comparative Experimental Data
Quantitative Performance Metrics
Recent studies have provided quantitative insights into the performance characteristics of both separation techniques. In proteomic profiling applications, Native PAGE techniques (including BN-PAGE and CN-PAGE) demonstrate particular utility for resolving membrane protein complexes and studying protein-protein interactions [16] [17]. A 2025 study analyzing medium-chain acyl-CoA dehydrogenase (MCAD) using high-resolution clear native PAGE (hrCN-PAGE) demonstrated linear correlation between protein amount and enzymatic activity, with the assay sensitive enough to quantify activity from less than 1 µg of protein [7]. This preservation of function stands in stark contrast to SDS-PAGE, where complete denaturation occurs.
Research on metalloprotein retention demonstrates another key advantage of native techniques. A comparative study found that zinc retention increased from 26% in standard SDS-PAGE to 98% using modified native conditions, highlighting the dramatic improvement in cofactor preservation [3]. Furthermore, enzymatic activity assays revealed that seven of nine model enzymes, including four zinc-containing proteins, retained function after native electrophoresis, whereas all were denatured during SDS-PAGE [3].
Table 2: Experimental Performance Comparison
| Performance Metric | Native PAGE | SDS-PAGE |
|---|---|---|
| Metal Cofactor Retention | Up to 98% [3] | ~26% [3] |
| Enzymatic Activity Preservation | 7/9 model enzymes active post-separation [3] | 0/9 model enzymes active [3] |
| Detection Sensitivity | <1 µg protein for activity assays [7] | Typically 0.1-1 µg with Coomassie staining |
| Molecular Weight Determination | Approximate (size + charge) | High accuracy (mass-based) |
| Complex Resolution | Excellent for protein complexes [17] | Poor (complexes dissociated) |
Technical Workflow Comparison
The following diagram illustrates the key procedural differences between Native PAGE and SDS-PAGE workflows, highlighting steps critical for preserving native structure:
Methodologies and Protocols
Standard Native PAGE Protocol
The following protocol for Native PAGE separation has been adapted from established methodologies used in recent research [7] [17]:
Sample Preparation: Suspend protein samples in non-denaturing buffer (e.g., 50 mM BisTris, 50 mM NaCl, 10% glycerol, pH 7.2) without SDS or reducing agents [3] [17]. Do not heat samples.
Gel Casting: Prepare polyacrylamide gels (typically 4-16% gradient) without SDS. Both manually cast gels and commercial precast gels (e.g., Thermo Fisher NativePAGE Bis-Tris system) are suitable [17]. A stacking gel may be used but is not always necessary with gradient gels.
Electrophoresis Conditions:
Detection:
Variants of Native PAGE
Several specialized Native PAGE variants have been developed for specific applications:
Blue Native (BN)-PAGE: Uses Coomassie G-250 dye to impart negative charge on membrane proteins, ideal for resolving oxidative phosphorylation complexes and their superassemblies [17].
Clear Native (CN)-PAGE: Employes mixed detergent micelles instead of Coomassie dye, eliminating dye interference in downstream activity assays [7] [17].
High-Resolution CN-PAGE: Provides enhanced resolution for detecting subtle conformational changes in protein variants, as demonstrated in MCAD deficiency studies [7].
Research Applications and Reagent Solutions
Key Research Applications
Native PAGE provides critical insights across multiple research domains:
- Protein Complex Analysis: Resolves intact protein complexes and determines stoichiometry [5] [17]
- Enzymatic Activity Studies: Enables in-gel activity assays for dehydrogenases, phosphatases, and respiratory chain complexes [7] [17]
- Metalloprotein Characterization: Preserves metal cofactors essential for function [3]
- Therapeutic Protein Development: Assesses native conformation and aggregation state of biologics
- Diagnostic Applications: Identifies pathological protein variants causing metabolic disorders [7]
Essential Research Reagents
Table 3: Key Reagents for Native PAGE Experiments
| Reagent/Category | Function | Examples & Notes |
|---|---|---|
| Mild Detergents | Solubilize membrane proteins while preserving complexes | n-Dodecyl-β-D-maltoside, Digitonin [17] |
| Charge Shift Agents | Impart negative charge for electrophoretic mobility | Coomassie G-250 (BN-PAGE), mixed detergents (CN-PAGE) [17] |
| Stabilizing Compounds | Maintain native structure during separation | Glycerol (10%), aminocaproic acid [17] |
| Activity Stain Components | Detect functional enzymes in-gel | Nitro blue tetrazolium, specific substrates [7] |
| Specialized Buffers | Maintain optimal pH and ionic strength | BisTris, Tricine, Imidazole-based systems [3] [17] |
Native PAGE represents an indispensable tool in the protein scientist's arsenal, offering unique capabilities for analyzing proteins in their native, functional state. Its separation mechanism—based on size, intrinsic charge, and shape—provides complementary information to the mass-based separation of SDS-PAGE. While SDS-PAGE remains the technique of choice for determining molecular weight and assessing purity, Native PAGE excels in applications requiring preservation of protein function, complex integrity, and cofactor binding. The continuing development of Native PAGE variants, including BN-PAGE and high-resolution CN-PAGE, expands its utility for studying challenging targets like membrane protein complexes and pathological variants. For researchers in drug development and structural biology, understanding both techniques and selecting the appropriate method based on experimental goals is crucial for generating biologically relevant data on protein systems.
Polyacrylamide gel electrophoresis (PAGE) serves as a fundamental tool in biochemistry and molecular biology for separating complex protein mixtures. The technique relies on a polyacrylamide matrix that functions as a molecular sieve, differentially retarding the migration of proteins based on their physical characteristics. The pore size of this matrix, determined by the concentration of acrylamide and bisacrylamide, represents a critical experimental parameter that researchers can manipulate to optimize separation resolution [1]. This analysis examines the mechanistic relationship between polyacrylamide matrix pore size and protein mobility, comparing the performance of denaturing SDS-PAGE and native PAGE systems. Understanding these principles is essential for researchers, particularly in drug development, where accurate protein characterization—from target identification to purity assessment of biologics—is paramount [18] [3].
Principles of Molecular Sieving in Polyacrylamide Gels
The molecular sieve effect in PAGE arises from a cross-linked polymer network formed through the copolymerization of acrylamide monomers and N,N'-methylenebisacrylamide cross-linker [1]. The pore size of the resulting gel is inversely related to the total acrylamide concentration (%T). Lower percentage gels (e.g., 7-10%) feature larger pores and are optimal for resolving high molecular weight proteins, while higher percentage gels (e.g., 12-20%) with smaller pores provide better separation for lower molecular weight proteins [1]. The degree of crosslinkage also influences the mechanical properties and pore structure of the gel [19].
During electrophoresis, charged protein molecules are driven by an electrical field through this porous matrix. The migration rate of a protein is governed by a combination of factors: the field strength, the protein's net charge, its size and shape, the ionic strength of the buffer, and the sieving properties of the gel matrix itself [1]. The molecular sieve effect describes how the gel's pore structure physically impedes the movement of larger molecules to a greater extent than smaller ones, facilitating separation based on physical dimensions [20] [19].
Comparative Analysis of SDS-PAGE vs. Native PAGE
While both SDS-PAGE and Native PAGE utilize a polyacrylamide matrix for separation, their underlying mechanisms and applications differ significantly, primarily due to their treatment of protein structure.
SDS-PAGE: Separation by Mass
In SDS-PAGE, the anionic detergent sodium dodecyl sulfate (SDS) denatures proteins by binding to the polypeptide backbone in a constant weight ratio (approximately 1.4 g SDS per 1 g of protein) [1]. This SDS coating confers a uniform negative charge to all proteins, effectively masking their intrinsic charges. Consequently, the charge-to-mass ratio becomes nearly identical for all SDS-polypeptide complexes [21] [1]. When an electric field is applied, these complexes migrate through the gel matrix at rates primarily determined by their polypeptide chain length, as the sieving effect of the gel pores retards larger complexes more than smaller ones [22] [1]. This allows for a reliable estimation of protein molecular weight by comparing their mobility to that of standard markers [1].
Native PAGE: Separation by Charge, Size, and Shape
Native PAGE, in contrast, separates proteins in their native, functional state without denaturation [22] [1]. The migration of a protein in this system depends on the combined influence of its intrinsic net charge, its size, and its three-dimensional shape [21] [1]. In alkaline running buffers, most proteins carry a net negative charge and migrate toward the anode. A protein with a higher charge density will migrate faster, while the gel matrix exerts a frictional, sieving force that regulates movement according to the protein's size and shape [1]. This technique is indispensable for studying functional properties, such as enzymatic activity, protein-protein interactions, and quaternary structure, as these features remain intact throughout the separation process [22] [1].
Table 1: Core Principles of SDS-PAGE vs. Native PAGE
| Feature | SDS-PAGE | Native PAGE |
|---|---|---|
| Protein State | Denatured and unfolded [22] | Native, folded structure maintained [22] |
| Separation Basis | Molecular mass of polypeptide chains [21] [1] | Net charge, size, and shape of native protein [21] [1] |
| Charge State | Uniform negative charge from bound SDS [1] | Intrinsic charge of the protein at the running buffer pH [1] |
| Key Applications | Molecular weight determination, purity assessment [22] [1] | Analysis of oligomeric state, enzyme activity assays, protein-protein interactions [22] [1] |
| Functional Info | Destroys native function; provides covalent structural info [3] | Preserves native function, including enzymatic activity and bound cofactors [1] [3] |
The Critical Role of Acrylamide Concentration and Pore Size
The concentration of acrylamide (%T) directly determines the average pore size of the gel matrix, which in turn dictates the size range of proteins that can be effectively resolved. This relationship is a key experimental parameter in both SDS-PAGE and Native PAGE.
Optimizing Separation by Protein Size
As a general rule, low-percentage gels (e.g., 8-10%) with larger pore sizes are used to resolve high molecular weight proteins, whereas high-percentage gels (e.g., 12-15%) with smaller pore sizes are used for lower molecular weight proteins [1]. For example, a 7% gel has significantly larger pores than a 12% gel [1]. To achieve a broader separation range, researchers often use gradient gels, which have a low acrylamide percentage at the top and a high percentage at the bottom. This setup allows proteins to encounter progressively smaller pores as they migrate, sharpening the bands and resolving a wider spectrum of protein sizes within a single gel [1].
Anomalous Migration of Membrane Proteins
The influence of acrylamide concentration is particularly pronounced for helical transmembrane proteins, which are notorious for their anomalous migration on SDS-PAGE [18]. These proteins, which constitute a majority of drug targets, often migrate to positions that do not correspond to their actual molecular weight [18]. Research has demonstrated that the magnitude and direction of this anomalous migration are controlled by the acrylamide concentration in the gel [18]. At lower gel concentrations (e.g., 11-13% T), larger transmembrane proteins (≥30 kDa) may exhibit enhanced mobility (faster migration), while at higher concentrations (≥14% T), smaller transmembrane mimetics (e.g., a 3.5-kDa peptide) can migrate as if they were much larger (e.g., ~7 kDa) [18]. This occurs because transmembrane proteins bind more SDS than water-soluble proteins due to their high hydrophobicity, leading to a complex interplay between the protein/DS particle's effective molecular size, net charge, and the restrictive properties of the gel matrix [18].
Table 2: Impact of Acrylamide Concentration on Protein Separation
| Acrylamide Concentration | Approximate Pore Size* | Optimal Protein Separation Range | Special Considerations |
|---|---|---|---|
| 6-8% T | ~150 Ã… (at 3%) [19] | Very high molecular weight proteins (>100 kDa) [1] | Gels can be fragile and difficult to handle [18] |
| 10-12% T | ~50 Ã… (at 7.5%) [19] | Broad range; standard for many applications (e.g., 14-200 kDa) [18] [1] | Standard workhorse for most routine protein analyses |
| 15-20% T | ~20 Ã… (at 20%) [19] | Low molecular weight proteins and peptides (e.g., <30 kDa) [18] [1] | Gels can be brittle; used for high-resolution separation of small proteins [18] |
| 4-20% T (Gradient) | Varies continuously from top to bottom | Very broad range (e.g., 3.5-200 kDa) [18] [1] | Performs the function of a stacking gel; provides superior resolution across a wide mass range [1] |
Note: Pore size estimates are approximate and can vary with the degree of crosslinking [19].
Experimental Methodologies and Data Interpretation
Standard SDS-PAGE Protocol
A standard denaturing SDS-PAGE protocol involves a discontinuous buffer system with a stacking gel and a resolving gel [1]. The sample is prepared in a buffer containing SDS and a thiol reagent (like β-mercaptoethanol) and is typically heated at 70–100°C to fully denature the proteins and reduce disulfide bonds [1]. The stacking gel, with a lower acrylamide percentage (e.g., 4-5%) and lower pH (e.g., 6.8), concentrates the protein samples into a sharp band before they enter the resolving gel. The resolving gel, with a higher acrylamide percentage (e.g., 8-20%) and pH (e.g., 8.8), then separates the proteins based on size [1]. Gels are run in a buffer containing SDS and EDTA, often using a constant voltage of 150-200V for mini-gels [3].
Ferguson Plot Analysis
A more sophisticated analysis of electrophoretic mobility involves the use of Ferguson plots [18]. This method requires running the same protein sample on gels with at least four different acrylamide concentrations. A plot of the log of the relative migration (Rf) versus the gel concentration (%T) is generated for each protein [18]. The slope of this line, known as the retardation coefficient (Kr), is a measure of the effective molecular size of the protein-SDS complex. The Y-intercept (log10 Y0) reflects the protein's free electrophoretic mobility, which is related to its net charge [18]. This analysis is particularly useful for characterizing proteins like membrane proteins, which may not follow standard migration patterns.
Native SDS-PAGE (NSDS-PAGE)
To bridge the gap between the high resolution of SDS-PAGE and the native state preservation of BN-PAGE, a modified method called Native SDS-PAGE (NSDS-PAGE) has been developed [3]. This protocol omits the heating step and reduces or removes SDS and EDTA from the sample and running buffers (e.g., using 0.0375% SDS in the running buffer instead of 0.1%) [3]. This gentle treatment allows many proteins to retain their enzymatic activity and non-covalently bound metal ions after separation. For instance, Zn²⺠retention in proteomic samples increased from 26% in standard SDS-PAGE to 98% in NSDS-PAGE, and most tested enzymes remained active post-electrophoresis [3].
Essential Research Reagent Solutions
Successful protein separation requires a suite of specialized reagents and materials. The following table details key components of the "Researcher's Toolkit" for polyacrylamide gel electrophoresis.
Table 3: Essential Research Reagents for PAGE Analysis
| Reagent/Material | Function/Purpose | Example Application/Note |
|---|---|---|
| Acrylamide & Bis-acrylamide | Monomer and cross-linker that polymerize to form the porous gel matrix [1]. | The ratio (%C) and total concentration (%T) determine gel pore size and rigidity [1]. |
| Ammonium Persulfate (APS) & TEMED | Polymerizing agents; APS provides free radicals, and TEMED catalyzes the reaction [1]. | Used to initiate and accelerate the cross-linking polymerization process when casting gels [1]. |
| SDS (Sodium Dodecyl Sulfate) | Anionic detergent that denatures proteins and confers a uniform negative charge [22] [1]. | Essential for SDS-PAGE; binds polypeptides at a constant ratio, enabling separation by mass [1]. |
| Tris-based Buffers | Provides the appropriate pH and ionic environment for electrophoresis and protein stability [1] [3]. | Common in both Laemmli (Tris-glycine) and Bis-Tris gel systems for resolving and stacking gels [18] [3]. |
| β-Mercaptoethanol or DTT | Reducing agent that cleaves disulfide bonds to fully denature protein subunits [1]. | Added to SDS-PAGE sample buffer to ensure complete protein unfolding and denaturation [1]. |
| Coomassie Blue/Silver Stains | Protein dyes for visualizing separated protein bands post-electrophoresis [1]. | Coomassie is a standard general stain; silver offers higher sensitivity for low-abundance proteins [1]. |
| Molecular Weight Markers | Pre-stained or unstained protein standards of known mass for calibration and size estimation [1]. | Run alongside samples to create a standard curve for determining approximate molecular weights [1]. |
The separation resolution in polyacrylamide gel electrophoresis is profoundly governed by the molecular sieving properties of the gel matrix. The pore size, controlled by the acrylamide concentration, is a versatile parameter that researchers can fine-tune to achieve optimal separation for their target proteins. While SDS-PAGE offers high-resolution separation and mass determination under denaturing conditions, Native PAGE preserves protein function at the cost of some resolution and straightforward interpretability. The choice between these systems, and the specific gel percentage, should be guided by the experimental objective—whether it is precise molecular weight determination, functional activity assays, or the analysis of challenging proteins like helical membrane proteins. Emerging hybrid techniques like NSDS-PAGE demonstrate that the field continues to evolve, seeking to combine the best attributes of both established methods to meet the demanding needs of modern proteomics and drug development.
Historical Development and Technological Evolution of Both Techniques
Polyacrylamide gel electrophoresis (PAGE) represents a cornerstone technique in biochemical analysis, with its two primary variants—SDS-PAGE and Native PAGE—serving complementary roles in proteomics research. The historical development of these techniques reveals a technological evolution driven by the competing needs for either high-resolution molecular weight separation or the preservation of native protein structure and function. While SDS-PAGE emerged as a powerful tool for determining protein size under denaturing conditions, Native PAGE developed as an essential method for studying proteins in their biologically active states [5] [1]. This guide objectively compares the protein separation resolution of these techniques within the context of modern biochemical research, providing researchers with experimental data and methodologies to inform their selection of appropriate separation strategies.
Historical Development and Technological Trajectories
The Emergence of Native PAGE
The foundational development of Native PAGE dates back to the work of Ornstein and Davis in the 1960s, who established the first systematic approaches for separating native proteins based on their intrinsic charge and size [4]. This initial methodology leveraged the natural charge of proteins under non-denaturing conditions, allowing for separation influenced by both molecular size and charge density [1]. The technique represented a significant advancement over previous electrophoretic methods by providing a matrix that could separate proteins while preserving their biological activity and complex quaternary structures.
A major technological evolution occurred with the introduction of Blue-Native PAGE (BN-PAGE) in the 1990s, which addressed resolution limitations in standard Native PAGE [3] [8]. This innovative approach incorporated the anionic Coomassie dye, which imposed a charge shift on proteins, thereby improving resolution and enabling more accurate molecular weight estimations [8]. Subsequently, Clear-Native PAGE (CN-PAGE) was developed as a milder alternative, particularly valuable for preserving labile protein complexes that might dissociate under BN-PAGE conditions [8]. This evolution toward specialized native techniques provided researchers with tools for investigating membrane protein complexes, oligomeric states, and enzymatically active structures that were previously inaccessible to electrophoretic analysis.
The Revolution of SDS-PAGE
The development of SDS-PAGE by Ulrich K. Laemmli in the 1970s marked a paradigm shift in protein separation technology [4]. This innovative method fundamentally addressed the challenge of resolving complex protein mixtures by introducing sodium dodecyl sulfate (SDS), which denatures proteins and confers a uniform negative charge proportional to molecular mass [3] [23]. The revolutionary aspect of this technique was its ability to separate proteins primarily by molecular weight rather than by a combination of size, charge, and shape, dramatically simplifying protein analysis and molecular weight determination.
The technological evolution of SDS-PAGE has centered on optimizing buffer systems, gel compositions, and standardization. The introduction of discontinuous buffer systems with stacking and resolving gels significantly enhanced resolution by concentrating protein samples into sharp bands before separation [1] [23]. The commercialization of pre-cast gels with consistent pore sizes and the development of sensitive staining methods further standardized the technique, making it accessible and reproducible across laboratories [1]. These advancements solidified SDS-PAGE as the workhorse method for routine protein analysis, purity assessment, and molecular weight estimation.
Hybrid Approaches: NSDS-PAGE
The most recent evolutionary development involves hybrid techniques that attempt to combine the advantages of both approaches. Native SDS-PAGE (NSDS-PAGE) has emerged as a modification that reduces SDS concentration, eliminates EDTA and heating steps, and significantly reduces protein denaturation while maintaining high resolution [3]. Experimental data demonstrates that this approach retains 98% of bound Zn²⺠in metalloproteins compared to only 26% in standard SDS-PAGE, with seven of nine model enzymes retaining activity post-electrophoresis [3]. This hybrid represents a continuing evolution in electrophoretic technology aimed at overcoming the traditional limitations of both primary techniques.
Principles of Separation: A Comparative Analysis
Fundamental Separation Mechanisms
The separation principles underlying SDS-PAGE and Native PAGE reflect their divergent applications in protein research. In SDS-PAGE, the anionic detergent SDS binds to proteins at a consistent ratio of approximately 1.4 g SDS per 1 g of protein, linearizing the polypeptide chains and masking their intrinsic charge [24] [23]. This creates a uniform charge-to-mass ratio, ensuring that separation occurs primarily according to molecular weight as proteins migrate through the polyacrylamide matrix [1]. The sieving effect of the gel pores then regulates mobility, with smaller proteins migrating faster than larger ones [23].
In contrast, Native PAGE separates proteins based on a combination of molecular size, intrinsic charge, and three-dimensional structure [5] [1]. Without denaturing agents, proteins maintain their native conformation, quaternary structure, and biological activity [2] [4]. The migration depends on both the protein's charge density at the running buffer pH and the frictional forces imposed by the gel matrix [1]. This complex interplay of factors means that Native PAGE can resolve protein complexes and oligomers that would dissociate under SDS-PAGE conditions.
Figure 1: Workflow comparison between SDS-PAGE and Native PAGE separation methodologies.
Key Technological Parameters
Table 1: Comparative analysis of SDS-PAGE and Native PAGE separation principles
| Parameter | SDS-PAGE | Native PAGE |
|---|---|---|
| Separation Basis | Molecular weight | Size, charge, and shape |
| Protein State | Denatured and linearized [24] [23] | Native folded conformation [2] [4] |
| Charge Characteristics | Uniform negative charge from SDS [23] | Intrinsic charge at running buffer pH [1] |
| Quaternary Structure | Disrupted into subunits [1] | Maintained for multimeric proteins [1] |
| Molecular Weight Determination | Direct estimation possible [23] | Approximate, requires calibration [8] |
| Biological Activity | Lost during separation [24] | Typically retained [2] [4] |
| Resolution Power | High for polypeptides [24] | Variable, dependent on charge heterogeneity [8] |
Experimental Data and Resolution Comparison
Quantitative Performance Metrics
Direct comparison of the separation performance between SDS-PAGE and Native PAGE reveals distinct advantages and limitations for each technique. SDS-PAGE consistently demonstrates superior resolution for separating complex protein mixtures based on molecular weight, capable of distinguishing polypeptides with small mass differences [24]. This high resolution makes it particularly valuable for analyzing protein purity, estimating molecular weights, and detecting proteolytic fragments or isoforms in denatured samples.
Native PAGE, while generally providing lower resolution for complex mixtures, offers unparalleled capability for preserving protein function and complex integrity. Experimental data demonstrates that nine model enzymes subjected to BN-PAGE retained full activity, whereas all were denatured during standard SDS-PAGE [3]. The resolution in Native PAGE varies significantly with the specific variant employed, with BN-PAGE generally providing higher resolution than CN-PAGE due to the charge-shifting effect of Coomassie dye [8].
Table 2: Experimental performance comparison of PAGE techniques
| Performance Metric | SDS-PAGE | BN-PAGE | CN-PAGE | NSDS-PAGE |
|---|---|---|---|---|
| Molecular Weight Resolution | High [24] | Moderate [8] | Lower [8] | High [3] |
| Metal Retention (Zn²âº) | 26% [3] | >90% (estimated) | >90% (estimated) | 98% [3] |
| Enzyme Activity Retention | 0% (all denatured) [3] | 100% (9/9 enzymes) [3] | High [8] | 78% (7/9 enzymes) [3] |
| Membrane Protein Complex Preservation | Poor (dissociates) | Good [8] | Excellent (retains labile assemblies) [8] | Moderate [3] |
| Separation Time | 45-60 minutes [3] | 90-95 minutes [3] | Similar to BN-PAGE | Similar to SDS-PAGE [3] |
| Quantitative Capability | Limited [24] | Moderate | Moderate | Limited |
Specialized Applications and Limitations
The experimental applications of each technique highlight their complementary nature in biochemical research. SDS-PAGE excels in immunoblotting applications where denatured epitopes are targeted, protein purity assessment, and molecular weight determination [1] [23]. However, it cannot preserve non-covalently bound cofactors, metal ions, or protein-protein interactions [3]. The requirement for complete denaturation also means that proteins cannot be recovered in functional form for downstream applications [2].
Native PAGE, particularly BN-PAGE and CN-PAGE, enables investigation of oligomeric states, protein-protein interactions, and enzymatic activities directly after separation [8] [25]. CN-PAGE specifically demonstrates advantages for studying labile supramolecular assemblies of membrane protein complexes that dissociate under BN-PAGE conditions [8]. A notable application includes identification of enzymatically active oligomeric states of mitochondrial ATP synthase that were previously undetectable using BN-PAGE [8]. The limitations of Native PAGE include challenges in molecular weight determination and generally lower resolution compared to SDS-PAGE [8] [5].
Detailed Experimental Protocols
Standard SDS-PAGE Protocol
The following protocol is adapted from Invitrogen NuPAGE specifications as described in experimental comparisons [3]:
Sample Preparation: Combine 7.5 μL protein sample (5-25 μg protein) with 2.5 μL of 4X LDS sample loading buffer containing SDS and reducing agent.
Denaturation: Heat samples at 70°C for 10 minutes to ensure complete denaturation [3].
Gel Preparation: Use pre-cast NuPAGE Novex 12% Bis-Tris 1.0 mm minigels or prepare equivalent polyacrylamide gels with stacking (4-5% acrylamide) and resolving (7.5-20% acrylamide) regions [1].
Electrophoresis: Load samples alongside molecular weight standards. Perform electrophoresis at constant voltage (200V) for approximately 45 minutes using 1X MOPS SDS running buffer (50 mM MOPS, 50 mM Tris Base, 1 mM EDTA, 0.1% SDS, pH 7.7) until dye front reaches gel end [3].
Detection: Resolved proteins can be visualized using Coomassie Brilliant Blue, silver staining, or transferred to membranes for immunoblotting [23].
Blue-Native PAGE Protocol
Based on manufacturer protocols and experimental applications [3] [8]:
Sample Preparation: Mix 7.5 μL of protein sample with 2.5 μL of 4X BN-PAGE sample buffer (50 mM BisTris, 50 mM NaCl, 16 mM HCl, 10% Glycerol, 0.001% Ponceau S, pH 7.2) [3].
Gel System: Use pre-cast Native-PAGE Novex 4-16% Bis-Tris 1.0 mm minigels or prepare gradient gels (4-16% acrylamide) without denaturants [3].
Electrophoresis: Load samples with NativeMarkTM unstained protein standards. Run at constant voltage (150V) at 4°C for 90-95 minutes using anode (50 mM BisTris, 50 mM Tricine, pH 6.8) and cathode (50 mM BisTris, 50 mM Tricine, 0.02% Coomassie G-250, pH 6.8) buffers until dye front migrates to gel end [3].
Activity Staining: For functional analysis, proteins can be subjected to activity assays directly after electrophoresis [1].
Native SDS-PAGE (NSDS-PAGE) Protocol
As a hybrid approach, NSDS-PAGE modifies standard protocols to balance resolution and native state preservation [3]:
Sample Preparation: Combine 7.5 μL protein sample with 2.5 μL of 4X NSDS sample buffer (100 mM Tris HCl, 150 mM Tris base, 10% v/v glycerol, 0.0185% w/v Coomassie G-250, 0.00625% w/v Phenol Red, pH 8.5). Omit heating step [3].
Gel Equilibration: Pre-run precast NuPAGE Novex 12% Bis-Tris 1.0 mm mini-gels at 200V for 30 minutes in double distilled Hâ‚‚O to remove storage buffer and unpolymerized acrylamide [3].
Electrophoresis: Perform separation at 200V for 30 minutes using modified running buffer (50 mM MOPS, 50 mM Tris Base, 0.0375% SDS, pH 7.7) with reduced SDS concentration and no EDTA [3].
Detection: Analyze metal retention using laser ablation-inductively coupled plasma-mass spectrometry or in-gel fluorescence with metal-sensitive fluorophores like TSQ [3].
Research Reagent Solutions
Table 3: Essential reagents for PAGE techniques and their functions
| Reagent | Function | SDS-PAGE | Native PAGE | Notes |
|---|---|---|---|---|
| SDS (Sodium Dodecyl Sulfate) | Denatures proteins, imparts uniform charge [23] | Required (0.1-0.5%) | Not used | Critical for mass-based separation |
| Reducing Agents (DTT, β-mercaptoethanol) | Breaks disulfide bonds [23] | Required | Not typically used | Ensures complete denaturation |
| Coomassie G-250 | Charge-shifting dye for improved resolution [3] [8] | Not used | Required for BN-PAGE | Mild alternative to SDS |
| LMNG (Lauryl Maltose Neopentyl Glycol) | Mild detergent for membrane protein solubilization [25] | Not compatible | Required for membrane proteins | Preserves protein complexes |
| Glycerol | Increases sample density for loading [23] | 10% in sample buffer | 10% in sample buffer | Prevents diffusion from wells |
| Tracking Dyes (Bromophenol Blue, Phenol Red) | Visualize migration progress [3] [23] | Used | Used | Concentration varies by method |
| Molecular Weight Standards | Size calibration and reference [1] | Denatured proteins | Native protein complexes | Essential for accurate analysis |
The historical development and technological evolution of SDS-PAGE and Native PAGE reflect the ongoing pursuit of optimal protein separation strategies for diverse research applications. SDS-PAGE remains the gold standard for high-resolution separation based on molecular weight, while Native PAGE and its variants provide essential tools for investigating native protein structures and functions. The recent development of hybrid techniques like NSDS-PAGE demonstrates continued innovation aimed at overcoming the traditional limitations of both approaches. For researchers and drug development professionals, selection between these techniques must be guided by experimental objectives: SDS-PAGE for analytical resolution of denatured proteins, and Native PAGE for functional studies of native complexes. As electrophoretic technology continues to evolve, the integration of these complementary approaches will further advance proteomic research and therapeutic development.
In the field of protein science, the resolution of a separation technique defines its ability to distinguish between individual protein components within a complex mixture. Polyacrylamide Gel Electrophoresis (PAGE) is a foundational method, yet its two primary forms—SDS-PAGE and Native PAGE—offer different paths to achieving separation power. The theoretical resolution limit for each technique is the point at which it can no longer distinguish two proteins based on its primary separation mechanism. For SDS-PAGE, this limit is predominantly a function of molecular weight sieving, while for Native PAGE, it is a more complex interplay of size, charge, and shape. This guide objectively compares the performance of these techniques by examining the fundamental principles that govern their maximum separating power, supported by experimental data and protocols relevant to researchers and drug development professionals.
Principles of Separation and Resolution Limits
The resolution in gel electrophoresis is determined by how effectively the gel matrix and running conditions can convert differences in protein properties into distinct, non-overlapping bands.
SDS-PAGE Resolution Mechanism: SDS-PAGE achieves separation by rendering all proteins as uniformly charged, linearized chains. The anionic detergent sodium dodecyl sulfate (SDS) binds to proteins in a constant mass ratio (approximately 1.4 g SDS per 1 g of protein), masking their intrinsic charge and conferring a uniform negative charge density [10] [1]. During electrophoresis, the polyacrylamide gel acts as a molecular sieve, separating proteins based almost exclusively on the molecular weight of their polypeptide chains [2] [21]. The pore size of the gel, controlled by the percentage of acrylamide, is the primary factor determining the resolution. Lower percentage gels (e.g., 8%) resolve larger proteins, while higher percentage gels (e.g., 15%) are optimal for smaller proteins [1]. The use of a discontinuous buffer system (e.g., Tris-glycine) with a stacking gel concentrates the protein sample into a sharp band before it enters the separating gel, significantly enhancing resolution [10].
Native PAGE Resolution Mechanism: In contrast, Native PAGE separates proteins in their folded, native state without denaturants. Consequently, a protein's migration depends on its intrinsic charge, size, and three-dimensional shape [2] [1]. The net charge at the running buffer's pH determines its electrophoretic mobility, while the gel matrix imposes a sieving effect based on the protein's hydrodynamic volume and shape [5]. This multi-parameter dependence can be both an advantage and a limitation; it allows for the separation of proteins with identical mass but different charges, but it can also complicate data interpretation and reduce resolution for complex mixtures where charge and size differences counteract each other [4].
The table below summarizes the core principles governing resolution in each technique.
Table 1: Fundamental Principles Governing Resolution in SDS-PAGE and Native PAGE
| Aspect | SDS-PAGE | Native PAGE |
|---|---|---|
| Primary Separation Basis | Molecular weight of polypeptide chains [2] [21] | Native size, intrinsic charge, and 3D shape [1] [5] |
| Protein State | Denatured and linearized [10] | Folded, native conformation [2] |
| Key Resolution Factor | Gel pore size (acrylamide %) [1] | Complex interplay of charge-to-mass ratio and hydrodynamic size [5] |
| Typical Resolving Power | High resolution for polypeptides by mass; can distinguish small weight differences (e.g., 1-2 kDa under optimal conditions) [10] | Lower resolution for complex mixtures; effective for separating proteins with different quaternary structures or net charges [3] |
| Theoretical Limit | Inability to distinguish proteins of identical molecular weight, regardless of charge or function [10] | Inability to distinguish proteins with identical charge-to-mass ratio and hydrodynamic size [5] |
Quantitative Performance and Experimental Data
Experimental data and advanced techniques help define the practical and theoretical boundaries of each method's resolution.
SDS-PAGE: Pushing the Limits of Mass-Based Separation
Standard SDS-PAGE is highly effective for separating proteins in the 5 to 250 kDa molecular weight range [10]. To extend this range and improve resolution, researchers employ gradient gels (e.g., from 4% to 12% acrylamide), which provide a broader separation profile and can sharpen protein bands [10]. For very small proteins and peptides (< 5-10 kDa), the Tris-Tricine buffer system developed by Schägger and von Jagow offers superior resolution compared to the traditional Tris-glycine system, effectively pushing the lower limit of separation down to about 0.5 kDa [10].
Cutting-edge research continues to explore these limits. One study scaled down SDS-PAGE to a microfluidic chip for single-molecule analysis, successfully separating a set of recombinant proteins labeled with a fluorophore in the 14–70 kDa size range. The measured mobilities showed an exponential dependence on molecular weight, confirming the technique's fundamental principle even at the nanoscale [26]. This demonstrates that the resolution limit of SDS-PAGE is fundamentally tied to the precision of the molecular sieving process.
Native PAGE and the Quest for High-Resolution Native Separation
A significant advancement in native electrophoresis is the development of Blue Native PAGE (BN-PAGE), which uses Coomassie G-250 dye to impart a negative charge on native protein complexes, allowing their separation primarily by size [3]. While BN-PAGE is powerful for studying macromolecular complexes, it sometimes sacrifices the high resolution of SDS-PAGE for the retention of native properties [3] [27].
To bridge this gap, a hybrid technique called Native SDS-PAGE (NSDS-PAGE) has been developed. This method modifies standard SDS-PAGE conditions by removing SDS and EDTA from the sample buffer, omitting the heating step, and reducing the SDS concentration in the running buffer from 0.1% to 0.0375% [3] [27]. These conditions result in a powerful separation that closely mirrors the high resolution of traditional SDS-PAGE while remarkably retaining native properties. Experimental data shows that zinc ion retention in proteomic samples increased from 26% (standard SDS-PAGE) to 98% (NSDS-PAGE). Furthermore, seven out of nine model enzymes, including four zinc-binding proteins, retained their activity after NSDS-PAGE, whereas all were denatured in standard SDS-PAGE [27]. This demonstrates that NSDS-PAGE can achieve a resolution comparable to denaturing SDS-PAGE while preserving function, pushing the limits of what is possible in native protein analysis.
Table 2: Comparative Experimental Data on Separation Performance
| Technique | Effective Separation Range | Key Performance Metric | Reported Outcome |
|---|---|---|---|
| SDS-PAGE (Standard) | 5 - 250 kDa [10] | Polypeptide separation by mass | High-resolution separation based on molecular weight [1] |
| SDS-PAGE (Tris-Tricine) | 0.5 - 50 kDa [10] | Small protein/peptide resolution | Superior resolution for low molecular weight targets [10] |
| BN-PAGE | > 100 kDa (complexes) | Retention of native activity | Retains function but with lower proteomic resolution than SDS-PAGE [3] |
| NSDS-PAGE (Hybrid) | Similar to SDS-PAGE | Retention of bound metals & enzyme activity | 98% Zn²⺠retention; 7/9 enzymes remained active [27] |
Detailed Experimental Protocols
To achieve the reported resolution limits, specific and optimized protocols must be followed.
Protocol for High-Resolution Denaturing SDS-PAGE
This protocol is adapted from common procedures using Invitrogen's NuPAGE system [10] [3].
- Gel Preparation: Use pre-cast Novex 12% Bis-Tris mini-gels or prepare a discontinuous gel system manually. The separating gel (e.g., pH 8.8) contains a higher acrylamide concentration (e.g., 10-12%) for resolution, while the stacking gel (e.g., pH 6.8) has a lower concentration (4-6%) to concentrate samples [10] [1]. Adding SDS (e.g., 0.1-0.3%) to both gels is essential for denaturation.
- Sample Preparation: Mix the protein sample with a 4X LDS (Lithium Dodecyl Sulfate) sample buffer containing a reducing agent like DTT (Dithiothreitol) or β-mercaptoethanol to break disulfide bonds. A typical preparation is 7.5 μL protein sample with 2.5 μL 4X LDS buffer [3]. Heat the samples at 70°C for 10 minutes to ensure complete denaturation [3].
- Electrophoresis: Load the samples and an appropriate molecular weight marker onto the gel. Run the gel in 1X MOPS SDS Running Buffer (containing 50 mM MOPS, 50 mM Tris Base, 0.1% SDS, 1 mM EDTA, pH 7.7) at a constant voltage of 200 V for approximately 45 minutes, or until the dye front reaches the gel bottom [3].
- Post-Run Analysis: Proteins can be visualized by staining with Coomassie Brilliant Blue or other protein stains [10]. For further analysis, proteins can be transferred to a membrane for Western blotting [1].
Protocol for High-Resolution Native SDS-PAGE (NSDS-PAGE)
This protocol, derived from published research, modifies SDS-PAGE to retain native properties without sacrificing resolution [3] [27].
- Gel Preparation: Use the same pre-cast Novex 12% Bis-Tris mini-gels as for standard SDS-PAGE. Prior to running, the gel is pre-run in double-distilled Hâ‚‚O at 200 V for 30 minutes to remove the storage buffer and any unpolymerized acrylamide [3].
- Sample Preparation: The key to NSDS-PAGE is the non-denaturing sample buffer. Mix 7.5 μL of protein sample with 2.5 μL of 4X NSDS Sample Buffer (100 mM Tris HCl, 150 mM Tris base, 10% glycerol, 0.0185% Coomassie G-250, 0.00625% Phenol Red, pH 8.5). Crucially, do not add SDS or EDTA to the sample buffer, and do not heat the sample [3].
- Electrophoresis: Load the prepared samples. Run the gel in a modified NSDS-PAGE Running Buffer (50 mM MOPS, 50 mM Tris Base, 0.0375% SDS, pH 7.7). Note the significantly reduced SDS concentration and the absence of EDTA compared to standard running buffer. Electrophoresis is performed at a constant 200 V for about 30 minutes [3].
- Post-Run Analysis: Proteins can be visualized with standard stains. To confirm retention of native properties, in-gel activity assays or metal staining (e.g., with TSQ fluorophore for zinc) can be performed [27].
Signaling Pathways and Workflows
The following diagram illustrates the critical decision points and experimental workflows for selecting and executing the appropriate high-resolution electrophoresis technique.
Diagram 1: Technique Selection and Experimental Workflow. This diagram outlines the decision-making process for selecting an electrophoresis method based on research goals and the key protocol steps that define each technique's resolution and outcome.
The Scientist's Toolkit: Essential Reagents for High-Resolution PAGE
Achieving the theoretical resolution limits of these techniques requires the use of specific, high-quality reagents. The following table catalogues the essential materials.
Table 3: Essential Research Reagent Solutions for PAGE Techniques
| Reagent / Material | Function / Purpose | Key Consideration for Resolution |
|---|---|---|
| Acrylamide / Bis-acrylamide | Forms the porous gel matrix for molecular sieving [1]. | The concentration ratio and total % (T) directly control pore size, determining the effective separation range [1]. |
| SDS (Sodium Dodecyl Sulfate) | Denatures proteins and confers uniform negative charge [10]. | Critical for SDS-PAGE; concentration must be sufficient (e.g., 0.1-1%) for complete denaturation and charge masking [10]. Reduced in NSDS-PAGE [3]. |
| DTT or β-Mercaptoethanol | Reducing agents that break disulfide bonds [10]. | Ensures complete unfolding in SDS-PAGE, leading to accurate mass-based separation [10]. Omitted in Native PAGE to preserve structure. |
| TEMED & Ammonium Persulfate (APS) | Catalyst and initiator for acrylamide polymerization [1]. | Freshness and concentration affect polymerization quality and consistency, impacting gel uniformity and resolution [1]. |
| Tris-based Buffers | Provide the conductive medium and maintain pH [10]. | The discontinuous system (stacking vs. separating gel with different pH and ionic strength) is key for sharp band formation in SDS-PAGE [10]. |
| Coomassie G-250 | Anionic dye used in BN-PAGE and NSDS-PAGE protocols [3]. | Imparts charge to native proteins for electrophoresis, enabling size-based separation of complexes without full denaturation [3]. |
| Molecular Weight Markers | Standard proteins of known size for calibration [1]. | Essential for estimating the molecular weight of unknown proteins and verifying the performance and resolution of the gel [10]. |
| Cathepsin Inhibitor 2 | Cathepsin Inhibitor 2, MF:C19H21F6N3O, MW:421.4 g/mol | Chemical Reagent |
| Cyproheptadine-d3 | Cyproheptadine-d3|High-Quality Research Chemical | Cyproheptadine-d3 is a deuterated internal standard for precise bioanalysis. This product is for Research Use Only (RUO). Not for human or veterinary diagnostic or therapeutic use. |
SDS-PAGE and Native PAGE are complementary techniques whose theoretical resolution limits are defined by their foundational separation principles. SDS-PAGE achieves its maximum power—the ability to distinguish minute differences in molecular weight—when proteins are fully denatured and linearized, but it fails to separate proteins with identical mass. Native PAGE and its advanced forms like BN-PAGE and NSDS-PAGE sacrifice some of this mass-based resolution to separate proteins based on a combination of native properties, with NSDS-PAGE emerging as a powerful hybrid that nearly matches the high resolution of SDS-PAGE while preserving metal binding and enzymatic function. The choice of technique is therefore not a question of which is universally superior, but which is optimally suited to the specific research question—whether it is determining polypeptide mass, analyzing subunit composition, or probing the functional intricacies of native proteins and their complexes.
Practical Implementation: Method Selection and Protocol Optimization for Maximum Resolution
Sodium dodecyl sulfate-polyacrylamide gel electrophoresis (SDS-PAGE) stands as a foundational technique in molecular biology and biotechnology for separating proteins based primarily on their molecular weight [2]. Developed by Ulrich K. Laemmli in 1970, this method has become the gold standard for protein analysis across diverse fields, from basic research to biopharmaceutical development [14] [28]. The technique's enduring relevance stems from its simplicity, speed, and the requirement for only microgram quantities of protein, making it widely accessible to researchers worldwide [1].
Within the context of protein electrophoresis, SDS-PAGE serves a distinct purpose compared to its native counterpart. While native PAGE separates proteins based on their intrinsic charge, size, and three-dimensional shape under non-denaturing conditions, SDS-PAGE employs denaturing conditions to separate proteins primarily by molecular mass [5] [4]. This critical distinction dictates their respective applications: Native PAGE preserves protein function, conformation, and subunit interactions, enabling the study of active protein complexes, whereas SDS-PAGE disrupts higher-order structure, rendering it ideal for determining molecular weight, assessing purity, and analyzing subunit composition [4] [1].
The fundamental principle of SDS-PAGE relies on the anionic detergent SDS binding to proteins in a constant ratio (approximately 1.4 g SDS per 1 g of protein), which masks the proteins' intrinsic charges and confers a uniform negative charge density [1]. When combined with heat and reducing agents like β-mercaptoethanol or dithiothreitol (DTT), SDS disrupts secondary, tertiary, and quaternary structure, unfolding proteins into linear chains [28]. During electrophoresis, these SDS-polypeptide complexes migrate through a polyacrylamide gel matrix toward the anode, with separation governed primarily by molecular size through the sieving effect of the gel pores [1].
Key Methodological Comparisons: SDS-PAGE vs. Native PAGE
Fundamental Principles and Separation Characteristics
Table 1: Core Principles and Characteristics of SDS-PAGE and Native PAGE
| Parameter | SDS-PAGE | Native PAGE |
|---|---|---|
| Separation Basis | Molecular weight/mass [4] | Size, charge, and shape [4] |
| Gel Conditions | Denaturing [4] | Non-denaturing [4] |
| SDS Presence | Present [4] | Absent [4] |
| Sample Preparation | Heating with SDS and reducing agents [4] | No heating, no denaturants [4] |
| Protein State | Denatured, linearized [4] | Native, folded conformation [4] |
| Protein Function Post-Separation | Lost [4] | Retained [4] |
| Protein Recovery | Generally not recoverable functionally [4] | Can be recovered in functional form [4] |
| Primary Applications | Molecular weight determination, purity assessment, subunit analysis [4] | Studying protein complexes, oligomerization, enzymatic activity [4] |
Quantitative Performance Comparison
Table 2: Experimental Performance Data for Electrophoresis Methods
| Performance Metric | SDS-PAGE | Native PAGE | NSDS-PAGE | CE-SDS |
|---|---|---|---|---|
| Molecular Weight Resolution | Excellent (5-250 kDa) [2] | Moderate [3] | Excellent [3] | Excellent [14] |
| Metal Ion Retention | 26% (Zn²âº) [3] | High | 98% (Zn²âº) [3] | N/A |
| Enzymatic Activity Retention | 0/9 model enzymes [3] | 9/9 model enzymes [3] | 7/9 model enzymes [3] | N/A |
| Run Time | ~45 minutes [3] | 90-95 minutes [3] | ~45 minutes [3] | 5.5-25 minutes [14] |
| Reproducibility | Moderate (gel-to-gel variability) [14] | Moderate | Moderate | High (RSD <0.3% migration time) [29] |
| Detection Sensitivity | Microgram range [1] | Microgram range | Microgram range | Nanogram range [14] |
The experimental data reveal that Native SDS-PAGE (NSDS-PAGE) represents a hybrid approach that modifies standard SDS-PAGE conditions by eliminating SDS and EDTA from sample buffers, omitting the heating step, and reducing SDS concentration in running buffers from 0.1% to 0.0375% [3]. This modification dramatically improves metal retention from 26% to 98% for zinc ions while maintaining high-resolution separation comparable to traditional SDS-PAGE [3].
Detailed SDS-PAGE Protocol
Reagent Preparation and Gel Casting
Research Reagent Solutions:
- Acrylamide/Bis-acrylamide Solution: Typically 30-40% stock solution; forms the polyacrylamide gel matrix that provides the sieving properties for separation [1]. The ratio of bisacrylamide to acrylamide determines the crosslinking density and pore size [1].
- SDS (Sodium Dodecyl Sulfate): 10% solution; anionic detergent that denatures proteins and confers uniform negative charge [1].
- APS (Ammonium Persulfate): 10% solution; free radical initiator for polyacrylamide polymerization [1].
- TEMED (N,N,N',N'-Tetramethylethylenediamine): Catalyst that promotes gel polymerization by accelerating free radical production from APS [1].
- Tris-HCl Buffers: Separating gel buffer (pH 8.8) and stacking gel buffer (pH 6.8); provide appropriate pH environment for electrophoresis and stacking phenomenon [1].
- Running Buffer: Contains Tris, glycine, and SDS; conducts current and maintains pH during electrophoresis [1].
- Sample Buffer: Contains SDS, reducing agents (DTT or β-mercaptoethanol), glycerol, and tracking dye; denatures proteins and facilitates loading [1].
Gel Casting Protocol:
- Prepare Separating Gel: For a standard 10% resolving gel, mix 7.5 mL 40% acrylamide solution, 3.9 mL 1% bisacrylamide, 7.5 mL 1.5 M Tris-HCl (pH 8.8), water to 30 mL total volume, then add 0.3 mL 10% APS, 0.3 mL 10% SDS, and 0.03 mL TEMED [1].
- Pour and Overlay: Immediately pour the solution between assembled glass plates, leaving space for stacking gel. Carefully overlay with isopropanol or water to create a flat interface.
- Prepare Stacking Gel: After polymerization (20-30 minutes), prepare stacking gel with lower acrylamide concentration (4-5%) and pH 6.8. Remove overlay, add stacking gel solution, and insert well-forming comb.
- Complete Polymerization: Allow stacking gel to polymerize completely (20-30 minutes) before carefully removing comb and rinsing wells with running buffer.
Sample Preparation and Electrophoresis Conditions
Sample Preparation Protocol:
- Protein Extraction: Extract proteins from biological material (cells, tissues, food products) using appropriate lysis buffers compatible with SDS-PAGE [28].
- Denaturation: Mix protein sample with 2X or 4X Laemmli sample buffer containing SDS and reducing agents [3]. Typical sample buffer composition includes: 106 mM Tris HCl, 141 mM Tris Base, 0.51 mM EDTA, 2% LDS, 10% glycerol, pH 8.5 [3].
- Heat Denaturation: Heat samples at 70-100°C for 5-10 minutes to ensure complete denaturation and SDS binding [1].
- Centrifugation: Briefly centrifuge heated samples to collect condensation and eliminate bubbles.
Electrophoresis Execution:
- Apparatus Assembly: Mount gel cassette in electrophoresis chamber and fill buffer chambers with running buffer (e.g., 50 mM MOPS, 50 mM Tris Base, 0.1% SDS, 1 mM EDTA, pH 7.7) [3].
- Sample Loading: Load prepared protein samples and molecular weight markers into wells. Typical protein loads range from 1-20 μg per band for Coomassie staining and less for sensitive detection methods.
- Electrophoresis Conditions: Apply constant voltage (150-200V) for mini-gel systems until dye front reaches bottom of gel (approximately 45 minutes) [3].
SDS-PAGE Experimental Workflow
Detection and Analysis
Protein Staining Methods:
- Coomassie Brilliant Blue: Standard staining method detecting ~50-100 ng protein/band; provides excellent protein-to-protein consistency but relatively low sensitivity [1].
- Silver Staining: High-sensitivity method detecting ~0.1 ng protein/band; more complex procedure with potential protein-to-protein variation [1].
- Fluorescent Stains: Modern alternatives offering broad dynamic range and compatibility with downstream mass spectrometry analysis [1].
Molecular Weight Determination:
- Include pre-stained or unstained protein molecular weight markers in each gel.
- Create a standard curve by plotting log molecular weight versus migration distance for marker proteins.
- Determine unknown protein molecular weights by comparing their migration distances to the standard curve.
Advanced Applications and Technological Evolution
Specialized Applications in Food Science and Biotechnology
SDS-PAGE maintains remarkable versatility across diverse research domains. In food science, the technique is indispensable for protein profiling across various food categories including cereals, pulses, dairy products, meats, seafood, and plant-based alternatives [28]. Specific applications include:
- Allergen Detection: Identification and characterization of allergenic proteins in food products [28].
- Quality Assessment: Evaluation of protein integrity in raw materials, intermediate products, and final food products [28].
- Species Identification: Authentication of food sources and detection of adulteration in meat and seafood products [28].
- Process Monitoring: Analysis of protein modifications induced by food processing techniques [28].
In biopharmaceutical development, SDS-PAGE and its capillary electrophoresis counterpart (CE-SDS) are critical for characterizing therapeutic proteins including monoclonal antibodies, bispecific antibodies, antibody-drug conjugates (ADCs), fusion proteins, and viral vectors [14]. The technique provides essential quality control data on molecular size, subunit structure, and purity throughout development and manufacturing.
Evolution to Capillary Electrophoresis and Microfluidic Systems
The fundamental principles of SDS-PAGE have evolved into more sophisticated analytical platforms that address limitations of traditional gel-based systems:
CE-SDS (Capillary Electrophoresis-SDS) represents a significant technological advancement offering [14]:
- Automation: Elimination of manual gel casting, staining, and destaining steps
- Improved Reproducibility: Reduced gel-to-gel variability through automated separation
- Quantitative Precision: Accurate peak integration compared to subjective band intensity assessment
- Higher Throughput: Rapid analysis of multiple samples in parallel systems
- Reduced Toxicity: Elimination of neurotoxic acrylamide monomers and reduction of chemical waste
Recent innovations in SDS-capillary agarose gel electrophoresis have addressed persistent challenges with baseline disturbances in traditional dextran-based matrices, enabling rapid (∼5 minutes), baseline hump-free analysis of therapeutic proteins across wide molecular weight ranges [29]. This development provides particularly improved analysis of large biomolecules and highly glycosylated proteins that challenge traditional SDS-PAGE separation [29].
Evolution of SDS-Based Electrophoresis Technologies
Comparative Experimental Analysis: Resolution and Functionality
Direct Methodological Comparison in Protein Characterization
The distinctive advantages of SDS-PAGE and Native PAGE emerge most clearly when applied to specific protein characterization challenges. A comparative study of protein PEGylation—the covalent attachment of polyethylene glycol chains to proteins—revealed fundamental limitations of SDS-PAGE for this application. Researchers found that SDS-PAGE produced smeared or broadened bands when analyzing PEGylation reaction mixtures, likely due to unfavorable interactions between PEG and SDS that impaired separation resolution [30].
In contrast, Native PAGE eliminated the PEG-SDS interaction problem and provided superior resolution for characterizing various PEGylated products, unmodified proteins, and unreacted PEG components [30]. This case illustrates how the very denaturant that enables molecular weight-based separation in SDS-PAGE can become a limitation for specific applications, particularly those involving detergent-sensitive protein modifications or complexes.
Functional Preservation Across Electrophoresis Platforms
The critical distinction between denaturing and native techniques extends beyond separation principles to functional preservation, as demonstrated by enzymatic activity studies across multiple electrophoresis platforms:
Table 3: Functional Preservation in Electrophoresis Methods Using Model Enzymes
| Enzyme | SDS-PAGE Activity | Native PAGE Activity | NSDS-PAGE Activity |
|---|---|---|---|
| Alcohol Dehydrogenase (Zn-ADH) | Not retained | Retained | Retained |
| Alkaline Phosphatase (Zn-AP) | Not retained | Retained | Retained |
| Superoxide Dismutase (Cu,Zn-SOD) | Not retained | Retained | Retained |
| Carbonic Anhydrase (Zn-CA) | Not retained | Retained | Retained |
| Other Model Enzymes | Not retained (0/9) | Retained (9/9) | Mostly retained (7/9) |
Experimental data adapted from metallomics studies demonstrates that while standard SDS-PAGE conditions denature all enzymatic activity, Native PAGE preserves function across all tested enzymes, and NSDS-PAGE (native SDS-PAGE) retains activity for most but not all enzymes [3]. This functional preservation enables advanced applications like in-gel activity assays for enzymes such as medium-chain acyl-CoA dehydrogenase, allowing researchers to distinguish active tetramers from inactive aggregates or fragments following separation [7].
The comprehensive comparison between SDS-PAGE and Native PAGE reveals complementary strengths that guide appropriate methodological selection for specific research objectives. SDS-PAGE remains the superior choice for molecular weight determination, purity assessment, and subunit analysis where preservation of native structure is unnecessary. Its denaturing conditions provide excellent resolution based primarily on polypeptide size, with well-established protocols yielding reproducible results across diverse applications from basic research to biopharmaceutical quality control.
Conversely, Native PAGE offers unique advantages for functional studies, protein-protein interaction analysis, and enzymatic characterization where maintaining tertiary and quaternary structure is essential. The preservation of biological activity following separation enables applications impossible with denaturing methods, including in-gel activity assays and purification of functional complexes.
The continuing evolution of electrophoresis technologies, particularly the emergence of CE-SDS and innovative matrix compositions, addresses limitations of traditional SDS-PAGE while enhancing automation, reproducibility, and quantitative precision. These advancements ensure that both denaturing and native electrophoresis approaches will remain indispensable tools in the researcher's toolkit for protein characterization, each serving distinct but equally valuable roles in biochemical analysis.
Polyacrylamide Gel Electrophoresis (PAGE) serves as a fundamental tool for protein separation, yet the choice between native and denaturing conditions profoundly impacts the biological relevance of the results. While SDS-PAGE denatures proteins into uniform linear chains for separation primarily by molecular weight, Native PAGE preserves proteins in their folded, functional states, maintaining complex quaternary structures, enzymatic activity, and protein-protein interactions [5] [1]. This preservation is indispensable for researchers investigating functional aspects of proteins, including drug target engagement, enzyme kinetics, and macromolecular complex assembly.
The fundamental distinction between these techniques lies in their treatment of protein structure. SDS-PAGE employs the anionic detergent sodium dodecyl sulfate (SDS) and often heat to fully denature proteins, masking intrinsic charge and rendering proteins inactive [5] [31]. In contrast, Native PAGE utilizes non-denaturing conditions without SDS or reducing agents, enabling separation based on the protein's intrinsic charge, size, and three-dimensional shape [1]. This protocol details the methodology for performing Blue Native PAGE (BN-PAGE), a highly effective variant that uses Coomassie dye to impart charge for electrophoresis while rigorously maintaining native conditions throughout the entire process [3] [32].
Fundamental Principles of Native PAGE
Theoretical Basis for Native Separation
In Native PAGE, the migration of proteins through the polyacrylamide gel matrix depends on a combination of factors: the protein's net negative charge at the running buffer pH, its molecular size, and its three-dimensional shape [1]. Unlike SDS-PAGE, where all proteins bear a similar charge-to-mass ratio due to SDS binding, Native PAGE resolves protein complexes based on their native charge density (charges per molecule mass) and the sieving effect of the gel, which creates frictional forces regulated by the protein's size and shape [1]. This enables the separation of intact protein complexes under conditions that mimic physiological environments.
The unique capability of Native PAGE to preserve oligomeric structures provides critical information about protein quaternary structure that is completely lost in denaturing SDS-PAGE [1]. Furthermore, many proteins retain enzymatic activity following Native PAGE separation, allowing subsequent functional assays directly from gel extracts [1]. This functional preservation makes Native PAGE particularly valuable for studying multisubunit enzymes, mitochondrial complexes, and other functionally dependent protein assemblies [32].
Comparative Separation Mechanisms
The table below summarizes the core differences in separation mechanisms and outcomes between Native PAGE and SDS-PAGE:
Table 1: Fundamental Comparison of Native PAGE and SDS-PAGE Principles
| Parameter | Native PAGE | SDS-PAGE |
|---|---|---|
| Separation Basis | Native charge, size, and 3D shape [1] | Molecular weight primarily [5] |
| Protein State | Folded, native conformation [5] | Denatured, linearized [5] |
| Structural Level Maintained | Primary, secondary, tertiary, quaternary [1] | Primary only [5] |
| Biological Activity | Preserved [1] | Destroyed [5] |
| Detergent Usage | Non-ionic or mild detergents (e.g., lauryl maltoside) [32] | Ionic detergent (SDS) [5] |
| Typical Applications | Protein complexes, interactions, enzymatic activity [5] [32] | Molecular weight determination, purity assessment [5] |
Comprehensive BN-PAGE Protocol
Sample Preparation Under Native Conditions
Maintaining native conditions begins with careful sample preparation. For analyzing mitochondrial complexes, isolate intact mitochondria from cells or tissues before solubilization [32]. Resuspend 0.4 mg of sedimented mitochondria in 40 μL of Buffer A (0.75 M 6-aminocaproic acid, 50 mM Bis-Tris/HCl, pH 7.0) containing protease inhibitors (1 mM PMSF, 1 μg/mL leupeptin, and 1 μg/mL pepstatin) [32]. Add 7.5 μL of 10% n-dodecyl-β-D-maltopyranoside (lauryl maltoside) and mix thoroughly. Incubate on ice for 30 minutes to solubilize membrane protein complexes, then centrifuge at 72,000 × g for 30 minutes at 4°C to remove insoluble material [32]. Collect the supernatant and add 2.5 μL of 5% Coomassie blue G solution in 0.5 M aminocaproic acid [32]. The Coomassie dye binds to proteins, imparting the negative charge necessary for electrophoretic migration without causing denaturation [32].
Native Gel Preparation
While single-concentration gels (e.g., 10% acrylamide) can be used, a linear gradient gel (e.g., 6-13%) provides superior resolution for complexes of varying sizes [32]. The following protocol is designed for casting 10 gels using a BioRad Mini-PROTEAN II multicasting chamber with a two-chamber gradient former:
Table 2: Gradient Gel Formulation for BN-PAGE
| Component | 6% Acrylamide Solution | 13% Acrylamide Solution |
|---|---|---|
| 30% Acrylamide/Bis Solution (37.5:1) | 7.6 mL | 14 mL |
| ddHâ‚‚O | 9 mL | 0.2 mL |
| 1 M Aminocaproic Acid, pH 7.0 | 19 mL | 16 mL |
| 1 M Bis-Tris, pH 7.0 | 1.9 mL | 1.6 mL |
| 10% APS | 200 μL | 200 μL |
| TEMED | 20 μL | 20 μL |
After pouring the gradient gels, cover them with 50% isopropanol solution to ensure even polymerization. Once set, pour off the isopropanol, rinse with water, and remove gels from the casting chamber. Add a stacking gel (0.7 mL 30% acrylamide, 1.6 mL ddH₂O, 0.25 mL 1 M Bis-Tris pH 7.0, 2.5 mL 1 M aminocaproic acid pH 7.0, 40 μL 10% APS, and 10 μL TEMED) with a comb to create sample wells [32].
Electrophoresis Conditions and Buffers
Load 5-20 μL of prepared samples into wells. Conduct electrophoresis using specialized anode and cathode buffers optimized for BN-PAGE [32]. Use cathode buffer (50 mM Tricine, 15 mM Bis-Tris, 0.02% Coomassie blue G, pH 7.0) in the upper chamber and anode buffer (50 mM Bis-Tris, pH 7.0) in the lower chamber [32]. Run gels at a constant voltage of 150V for approximately 2 hours or until the blue dye front has almost reached the bottom of the gel [32]. Maintain temperature control throughout electrophoresis using a circulating water bath to prevent heat-induced denaturation [33].
Downstream Applications and Second Dimension Analysis
Following Native PAGE separation, complexes can be processed for multiple downstream applications. For direct analysis, proteins can be transferred to PVDF membranes via western blotting using a fully submerged system (e.g., 150 mA for 1.5 hours) [32]. Alternatively, for higher resolution of complex components, a second denaturing dimension can be employed. Excise entire lanes from the first dimension BN-PAGE gel and soak them in SDS denaturing buffer (10% glycerol, 2% SDS, 50 mM Tris pH 6.8, 0.002% Bromophenol blue, 50 mM DTT) [32]. Rotate each lane 90° and load onto an SDS-PAGE gel (10-20% acrylamide) for standard denaturing electrophoresis, effectively separating individual subunits while maintaining information about their original complex associations [32].
Research Reagent Solutions
Successful Native PAGE requires specific reagents formulated to maintain protein structure and function:
Table 3: Essential Reagents for Native PAGE Experiments
| Reagent | Function | Key Characteristics |
|---|---|---|
| 6-Aminocaproic Acid | Provides ionic strength and protease inhibition [32] | Zwitterionic buffer component; stabilizes proteins |
| n-Dodecyl-β-D-Maltoside | Solubilizes membrane proteins [32] | Non-ionic detergent; preserves native structures |
| Coomassie Blue G | Imparts negative charge [32] | Binds proteins without denaturation; enables electrophoresis |
| Bis-Tris Buffer | Maintains stable pH [32] | Good buffering capacity at neutral pH; minimal protein interaction |
| Protease Inhibitors (PMSF, Leupeptin, Pepstatin) | Prevent protein degradation [32] | Broad-spectrum protection against proteases |
| Gradient Gel Acrylamide (6-13%) | Separates protein complexes [32] | Linear pore gradient resolves diverse molecular sizes |
Comparative Experimental Data: Resolution and Functional Preservation
Quantitative Assessment of Native State Preservation
Recent research has developed modified Native PAGE conditions (termed NSDS-PAGE) that optimize the balance between resolution and functional preservation. The table below summarizes quantitative comparisons between separation techniques:
Table 4: Quantitative Performance Comparison of PAGE Methods
| Performance Metric | SDS-PAGE | BN-PAGE | NSDS-PAGE |
|---|---|---|---|
| Zinc Retention in Proteomic Samples | 26% [3] | Not Specified | 98% [3] |
| Enzymatic Activity Preservation | 0/9 model enzymes [3] | 9/9 model enzymes [3] | 7/9 model enzymes [3] |
| Separation Resolution | High [3] | Moderate [3] | High (comparable to SDS-PAGE) [3] |
| Metal Cofactor Analysis | Not possible [3] | Possible [3] | Possible (LA-ICP-MS confirmed) [3] |
The exceptional metal retention demonstrated by NSDS-PAGE (98% versus 26% in SDS-PAGE) highlights the critical importance of protocol modifications for metalloprotein studies [3]. Similarly, the preservation of enzymatic activity in most model enzymes confirms that functional properties survive the electrophoretic process under optimized native conditions [3].
Application-Specific Resolution Capabilities
Different separation technologies offer distinct advantages for specific analytical challenges. When resolving phosphorylation isoforms of ovalbumin, 2D IEF-SDS-PAGE revealed 11 distinct spots, while 1D SDS-PAGE showed only 3 bands, demonstrating the superior resolution of multidimensional approaches for post-translationally modified proteins [34]. For RNA folding studies, Native PAGE successfully distinguishes between folded and unfolded conformations based on their differential migration through the gel matrix [33]. The technique's adaptability across different biomolecules and conditions underscores its utility in structural biology.
Native PAGE Workflow Visualization
The following diagram illustrates the complete BN-PAGE workflow, highlighting critical steps for maintaining native conditions:
Technical Considerations and Troubleshooting
Critical Factors for Maintaining Native Conditions
Several parameters require careful optimization to successfully preserve native structures throughout electrophoresis. Temperature control is essential, as excess heat can promote denaturation; maintain runs at 4°C using a circulating water bath [1] [33]. Buffer composition must exclude denaturing agents while providing appropriate ionic strength and pH control; BN-PAGE specifically uses aminocaproic acid and Bis-Tris at neutral pH [32]. Detergent selection is crucial for membrane proteins - non-ionic detergents like lauryl maltoside effectively solubilize while maintaining native interactions [32]. Sample concentration should be optimized to ensure detectable bands without overloading, typically 5-25 μg protein per lane [3] [32].
Methodological Limitations and Complementary Approaches
While Native PAGE excels at preserving protein function and complexes, researchers should recognize its limitations. The dynamic range is more limited than SDS-PAGE, making low-abundance proteins challenging to detect [34]. Membrane and highly basic proteins may be underrepresented [34]. Unlike SDS-PAGE, migration distance does not directly correlate with molecular weight due to influences from both charge and shape [1]. For complete system characterization, Native PAGE should be complemented with other biophysical techniques such as analytical ultracentrifugation, size exclusion chromatography, or functional assays to verify results obtained from gel analysis [33].
Native PAGE, particularly the BN-PAGE protocol detailed here, provides an essential methodological bridge between protein separation and functional analysis. By maintaining native conditions throughout electrophoresis, researchers can investigate proteins in their biologically relevant states, preserving metabolic capabilities that are completely destroyed by denaturing techniques. The quantitative demonstrations of metal retention and enzymatic activity preservation confirm the technique's unique value for functional proteomics. As drug discovery increasingly focuses on complex biological systems and therapeutic targeting of multimetric complexes, Native PAGE offers critical insights that complement information provided by traditional SDS-PAGE, delivering a more comprehensive understanding of protein structure-function relationships in biomedical research.
In polyacrylamide gel electrophoresis (PAGE), the selection of an appropriate gel percentage is a fundamental determinant of experimental success. The concentration of polyacrylamide directly controls the pore size of the gel matrix, which acts as a molecular sieve to separate proteins based on their size [1]. This guide provides a detailed framework for matching gel percentages to target protein molecular weights, contextualized within the broader comparison of protein separation resolution in SDS-PAGE versus Native PAGE systems. For researchers and drug development professionals, mastering this relationship is essential for obtaining high-resolution separation, accurate molecular weight determination, and meaningful functional analysis of protein samples.
The polyacrylamide gel matrix is formed through the polymerization of acrylamide monomers cross-linked by bisacrylamide. The pore size of the resulting gel is inversely related to the polyacrylamide percentage, meaning that low-percentage gels have larger pores suitable for separating high molecular weight proteins, while high-percentage gels with smaller pores provide better resolution for low molecular weight proteins [1]. This principle forms the basis for all strategic gel selection in protein electrophoresis.
Theoretical Foundation: Separation Principles in SDS-PAGE vs. Native PAGE
The migration behavior of proteins through the polyacrylamide gel matrix differs significantly between SDS-PAGE and Native PAGE systems, influencing optimal gel percentage selection strategies for each method.
SDS-PAGE (Sodium Dodecyl Sulfate-Polyacrylamide Gel Electrophoresis) employs the anionic detergent SDS to denature proteins and impart a uniform negative charge. This treatment masks the proteins' intrinsic charge and eliminates the influence of protein shape, resulting in separation based almost exclusively on molecular weight [4] [1]. The relationship between migration distance and molecular weight is relatively predictable, enabling accurate molecular weight estimation when appropriate standards are used.
Native PAGE separates proteins in their folded, native state without denaturing agents. In this system, separation depends on the complex interplay of a protein's intrinsic charge, size, and three-dimensional structure [4] [1]. Since proteins maintain their native conformation, the gel pore size interacts with the hydrodynamic volume and shape of the protein rather than with a linearized polypeptide chain. This makes migration behavior less predictable but preserves protein function and enzymatic activity [5].
Table 1: Fundamental Differences Between SDS-PAGE and Native PAGE
| Parameter | SDS-PAGE | Native PAGE |
|---|---|---|
| Separation Basis | Molecular weight only [4] | Size, charge, and shape [4] |
| Protein State | Denatured and linearized [4] [1] | Native, folded conformation [4] [5] |
| Protein Function | Lost after separation [4] | Often retained [4] [5] |
| Charge Properties | Uniform negative charge from SDS [1] | Intrinsic charge based on protein sequence and buffer pH [1] |
| Molecular Weight Determination | Direct and reliable [1] | Indirect and less accurate [5] |
| Typical Applications | Molecular weight estimation, purity assessment, western blotting [4] [28] | Enzyme activity assays, protein-protein interactions, native structure analysis [4] [3] |
Gel Percentage Selection Guidelines for Optimal Resolution
The following recommendations provide a practical framework for selecting appropriate gel percentages based on target protein molecular weights. These guidelines apply most directly to SDS-PAGE, where migration correlates predictably with molecular weight.
Table 2: Gel Percentage Recommendations for Target Protein Separation
| Target Protein Molecular Weight Range | Recommended Gel Percentage | Separation Characteristics | Common Applications |
|---|---|---|---|
| Very high: >150 kDa | 6-8% | Large pore size facilitates migration of large proteins | Nuclear proteins, protein complexes [1] |
| High: 100-150 kDa | 8-10% | Balanced pore size for good resolution of large polypeptides | Receptor extracellular domains, transferrins [1] |
| Medium: 50-100 kDa | 10-12% | Standard range for most routine separations | Enzymes, serum proteins, IgG heavy chains [1] |
| Low: 15-50 kDa | 12-15% | Smaller pores for resolution of medium-sized proteins | Cytokines, IgG light chains, most proteases [1] |
| Very low: <15 kDa | 15-20% | Very small pore size to resolve small proteins | Peptides, insulin, small enzyme subunits [28] |
For Native PAGE, where proteins migrate in their folded state, these recommendations serve as a starting point, but empirical optimization is often necessary. The hydrodynamic radius of a native protein may differ significantly from that of its denatured linear form, potentially requiring adjustment of gel percentage for optimal resolution.
Advanced Separation Strategies: Gradient Gels and Specialized Systems
Polyacrylamide Gradient Gels provide a powerful alternative to single-percentage gels, offering extended separation range and superior resolution for complex protein mixtures. Gradient gels are cast with a continuously varying acrylamide concentration, typically from low to high percentage, creating a corresponding pore size gradient [1]. As proteins migrate through the gradient, each protein reaches a "pore limit" where the gel pores become too small for further migration, resulting in sharp, focused bands. This self-sharpening effect allows gradient gels to resolve proteins across a much broader molecular weight range than single-percentage gels [1].
Blue Native PAGE (BN-PAGE) represents a specialized native electrophoresis technique particularly valuable for studying membrane protein complexes and oligomeric structures. In BN-PAGE, the anionic dye Coomassie Blue G-250 binds to proteins, imparting negative charge while maintaining native structure [4] [3]. This method typically employs gradient gels (e.g., 4-16%) to resolve complex protein mixtures while preserving protein function and subunit interactions [3].
Tricine-SDS-PAGE is specifically optimized for resolving low molecular weight proteins (<30 kDa) that may co-migrate with the SDS front in traditional glycine-based SDS-PAGE systems [28]. Tricine, used as the trailing ion, allows better resolution of small proteins and peptides, typically employing higher percentage gels (16-20%) [28].
Experimental Protocols for Gel Preparation and Electrophoresis
Sample Preparation:
- Dilute protein samples in SDS-PAGE sample buffer (typically containing 2% SDS, 10% glycerol, 50-100 mM Tris-HCl pH 6.8, 0.01% bromophenol blue).
- Add reducing agent (100 mM DTT or 5% β-mercaptoethanol) to break disulfide bonds.
- Heat samples at 70-100°C for 5-10 minutes to ensure complete denaturation.
Gel Casting (12% Resolving Gel Example):
- Combine 7.5 mL 40% acrylamide/bis solution, 3.9 mL 1% bisacrylamide, 7.5 mL 1.5 M Tris-HCl pH 8.7, and water to 30 mL total volume.
- Add 0.3 mL 10% ammonium persulfate (APS) and 0.03 mL TEMED to catalyze polymerization.
- Pour between glass plates, overlay with water or alcohol to ensure even polymerization.
- Once polymerized, prepare stacking gel (typically 4-5% acrylamide) and pour over resolving gel, inserting well comb immediately.
Electrophoresis Conditions:
- Assemble gel in electrophoresis chamber filled with running buffer (25 mM Tris, 192 mM glycine, 0.1% SDS, pH 8.3).
- Load samples and molecular weight markers (10-50 μg total protein per lane for Coomassie staining).
- Run at constant voltage (100-200 V) until dye front reaches bottom of gel (typically 45-90 minutes for mini-gels).
Sample Preparation:
- Dilute protein samples in non-denaturing sample buffer (typically containing 10-25% glycerol, 0.001% tracking dye, in appropriate buffer without SDS or reducing agents).
- Do not heat samples to preserve native structure.
Gel Casting and Electrophoresis:
- Prepare polyacrylamide gel at appropriate percentage without including SDS in any components.
- Use non-denaturing running buffers (such as Tris-glycine pH 8.3-8.8 without SDS).
- Run electrophoresis at 4°C to minimize denaturation and proteolysis during separation.
- Use lower voltages and longer run times compared to SDS-PAGE to prevent heating-induced denaturation.
The Scientist's Toolkit: Essential Reagents and Equipment
Table 3: Key Research Reagent Solutions for Protein Electrophoresis
| Reagent/Equipment | Function/Purpose | Application Notes |
|---|---|---|
| Acrylamide/Bis-acrylamide | Forms the cross-linked polymer gel matrix | Standard ratio is 37.5:1 or 29:1 acrylamide:bis; concentration determines pore size [1] |
| SDS (Sodium Dodecyl Sulfate) | Anionic detergent that denatures proteins and confers uniform charge | Typically 0.1-0.2% in gels and running buffers; binds ~1.4g SDS per 1g protein [1] |
| APS and TEMED | Polymerization catalysts for polyacrylamide gels | APS provides free radicals; TEMED accelerates polymerization; amounts affect gel polymerization time [1] |
| Tris-based Buffers | Maintain pH and provide conducting medium | Tris-HCl for resolving gel (pH 8.8); Tris-HCl for stacking gel (pH 6.8); Tris-glycine for running buffer [35] [1] |
| Reducing Agents (DTT, β-mercaptoethanol) | Break disulfide bonds for complete denaturation | Essential for reducing SDS-PAGE; omit for non-reducing conditions or Native PAGE [4] [28] |
| Molecular Weight Markers | Reference standards for size determination | Pre-stained or unstained proteins of known molecular weight; essential for calibration [1] |
| Coomassie Blue/SYPRO Stains | Protein detection in gels | Coomassie for general staining (~50-100 ng detection limit); SYPRO Ruby for higher sensitivity [36] |
| Vertical Electrophoresis System | Apparatus for polyacrylamide gel electrophoresis | Includes glass plates, cassettes, buffer tanks, and power supply; specialized for protein separations [35] [36] |
| Lenvatinib-d4 | Lenvatinib-d4, MF:C21H19ClN4O4, MW:430.9 g/mol | Chemical Reagent |
| Lomitapide-d8 | Lomitapide-d8, MF:C39H37F6N3O2, MW:701.8 g/mol | Chemical Reagent |
Visualization and Data Interpretation
Protein Detection Methods
Following electrophoresis, proteins are typically visualized using staining techniques. Coomassie Brilliant Blue is the most common general stain, with detection limits of approximately 50-100 ng per band [36]. For higher sensitivity, silver staining or fluorescent stains like SYPRO Ruby can detect 1-10 ng protein per band. For Native PAGE, activity staining (zymography) can be employed to detect specific enzymatic activities while proteins remain in their native state [4].
Molecular Weight Determination
In SDS-PAGE, molecular weight is determined by comparing migration distance of unknown proteins to a standard curve generated from molecular weight markers [1]. A semi-log plot of molecular weight versus migration distance typically produces a linear relationship through which unknown protein sizes can be extrapolated. In Native PAGE, molecular weight estimation is less reliable due to the influence of protein charge and shape on migration behavior [5].
Comparative Resolution Analysis: SDS-PAGE vs. Native PAGE
The choice between SDS-PAGE and Native PAGE involves fundamental trade-offs between resolution and biological relevance. SDS-PAGE typically provides superior resolution for molecular weight analysis, with sharp, well-defined bands that enable precise molecular weight determination [4] [1]. The denaturing conditions minimize protein-protein interactions and aggregate formation that can complicate interpretation. However, this high resolution comes at the cost of biological context, as protein complexes dissociate and functional properties are lost.
Native PAGE preserves protein function, enzymatic activity, and protein-protein interactions, providing biologically relevant information about native structure and complex formation [4] [5] [3]. However, resolution is generally lower, with broader bands and more complex migration patterns influenced by multiple factors beyond size alone. A hybrid approach, Native SDS-PAGE (NSDS-PAGE), has been developed to balance these considerations, using minimal SDS to maintain some native structure while achieving reasonable resolution [3].
The strategic selection of gel percentage and electrophoresis method should align with specific research objectives. For molecular weight determination, purity assessment, and western blotting, SDS-PAGE with appropriate gel percentages provides unsurpassed resolution and reliability. For functional studies, enzyme assays, and protein interaction analysis, Native PAGE preserves biological relevance despite potentially lower resolution. Gradient gels offer a versatile solution for analyzing complex protein mixtures across broad molecular weight ranges. By understanding the principles and practical considerations outlined in this guide, researchers can optimize protein separation strategies to advance their scientific objectives in basic research and drug development.
In the broader context of protein separation techniques, the fundamental dichotomy lies between denaturing methods, such as SDS-PAGE, and native methods. SDS-PAGE separates proteins primarily by molecular weight after denaturation, providing high resolution but destroying functional properties [3] [4] [2]. In contrast, native polyacrylamide gel electrophoresis (PAGE) techniques separate proteins based on their combined size, charge, and shape while preserving their native conformation, biological activity, and protein-protein interactions [1] [5]. This preservation is crucial for studying multi-protein complexes, which perform most essential cellular functions. Blue Native PAGE (BN-PAGE) and Clear Native PAGE (CN-PAGE) represent two advanced variations of native electrophoresis specifically optimized for the high-resolution separation of membrane protein complexes and supercomplexes, such as those involved in oxidative phosphorylation (OXPHOS) in mitochondria and photosynthesis in chloroplasts [37] [17] [38]. This guide provides an objective comparison of these two powerful techniques, detailing their principles, applications, and performance relative to each other and to standard SDS-PAGE.
Principles and Comparative Mechanics of BN-PAGE and CN-PAGE
Fundamental Principles and Shared Workflow
Both BN-PAGE and CN-PAGE are designed to separate intact protein complexes under native conditions. The core workflow involves gently solubilizing biological membranes using non-ionic detergents, preparing the sample with specific native-compatible buffers, and then performing electrophoresis using specialized cathode and anode buffers to maintain the complexes' integrity [37] [32]. The primary difference between them lies in the method used to impart a charge shift on the hydrophobic membrane proteins to facilitate their migration through the gel.
- BN-PAGE uses the anionic dye Coomassie Blue G-250, which binds to the surface of proteins. This binding provides a uniform negative charge shift, drives protein migration toward the anode, and prevents protein aggregation by increasing solubility [37] [17] [32].
- CN-PAGE replaces the blue dye with mixtures of anionic and neutral detergents in the cathode buffer. These mixed micelles similarly induce a charge shift and enhance protein solubility and migration, but without adding color to the complexes [37] [17].
The following diagram illustrates the shared experimental workflow and the key differentiating points between the two methods.
Direct Technical Comparison and Data
The choice between BN-PAGE and CN-PAGE significantly impacts the outcome and applicability of an experiment. The table below provides a structured, point-by-point comparison of their key attributes.
Table 1: Direct comparison of BN-PAGE and CN-PAGE methodologies.
| Feature | BN-PAGE | CN-PAGE |
|---|---|---|
| Charge-Shifting Agent | Coomassie Blue G-250 dye [37] [17] [32] | Mixtures of anionic and neutral detergents [37] [17] |
| Resolution of Complexes | High; robust for individual OXPHOS complexes [37] | High; capable of resolving supercomplexes [37] |
| Interference with Downstream Assays | Yes; residual dye can interfere with in-gel activity stains and spectroscopy [37] [17] | Minimal; no dye interference, ideal for in-gel activity assays [37] [17] |
| In-Gel Complex Visualization | Complexes are visible as blue bands during electrophoresis [32] | Complexes are not intrinsically colored during electrophoresis [37] |
| Optimal Use Cases | Analysis of individual complex assembly and stability; western blotting [37] | In-gel enzyme activity staining; analysis of labile supercomplexes [37] [38] |
| Reported Limitations | Dye can partially inactivate some enzymes [37] | May be less effective than BN-PAGE for some very hydrophobic complexes [37] |
Experimental Protocols and Supporting Data
Core Protocol for BN-PAGE and CN-PAGE
The following step-by-step protocol, validated by Aref et al. (2025), is adaptable for both BN-PAGE and CN-PAGE, with critical differences noted at key steps [37] [17].
Step 1: Sample Preparation and Solubilization
- Isolate mitochondria or other membrane fractions from cells or tissues. Using whole-cell extracts can result in weaker signals [32].
- Solubilization Buffer: Resuspend the membrane pellet (e.g., 0.4 mg of mitochondria) in 40 µL of buffer containing 0.75 M 6-aminocaproic acid and 50 mM Bis-Tris, pH 7.0. Include protease inhibitors (e.g., 1 mM PMSF) [32].
- Critical Step - Choice of Detergent: The detergent selection dictates whether individual complexes or supercomplexes are resolved.
- Mix and incubate on ice for 30 minutes. Centrifuge at high speed (e.g., 72,000 x g) for 30 minutes at 4°C to remove insoluble material. Collect the supernatant [32].
Step 2: Sample Preparation for Electrophoresis
- For BN-PAGE: Add Coomassie Blue G-250 to the supernatant to a final concentration of ~0.25% (e.g., 2.5 µL of a 5% stock solution) [32].
- For CN-PAGE: Do not add any Coomassie dye to the sample [37] [17].
Step 3: Gel Casting and Electrophoresis
- Gel Casting: While single-concentration gels can be used, linear gradient gels (e.g., 4–16% or 3–12% acrylamide) provide superior resolution across a broad molecular weight range [37] [32]. The gel buffer system is typically based on Bis-Tris and 6-aminocaproic acid at pH 7.0 [32].
- Electrophoresis Buffers:
- Load the prepared samples and run the electrophoresis. A typical run uses a constant voltage of 150V for approximately 90-120 minutes, or until the dye front approaches the bottom of the gel [37] [32].
Supporting Experimental Data and Validation
Studies validating these protocols demonstrate their efficacy and limitations. Aref et al. showed that their BN-PAGE protocol successfully resolves all five OXPHOS complexes from human cell lines, while digitonin solubilization followed by BN-PAGE reveals higher-order respiratory chain supercomplexes [37] [17]. Furthermore, they demonstrated a broad dynamic range for in-gel activity staining for Complexes I, II, IV, and V. A key finding was that their simple enhancement step for Complex V activity staining markedly improved sensitivity [37].
However, the data also confirms inherent limitations of the techniques. The in-gel activity stain for Complex IV is comparatively insensitive, and no reliable in-gel activity stain for Complex III exists [37] [17]. Quantitative evaluations of thylakoid complexes in plants have shown that using a detergent mixture of DDM and digitonin, combined with a low-percentage gradient gel (e.g., 4.3–8%), is powerful for resolving large photosystem I megacomplexes that are often lost under standard conditions [38].
Essential Reagents and Research Solutions
The successful application of BN-PAGE and CN-PAGE relies on a specific set of reagents. The following table details the essential materials and their functions.
Table 2: Key research reagents and solutions for BN-PAGE and CN-PAGE.
| Reagent/Solution | Function and Application |
|---|---|
| n-Dodecyl-β-D-maltoside (DDM) | A mild, non-ionic detergent for solubilizing mitochondrial and other membranes to extract individual protein complexes while retaining their activity [37] [32]. |
| Digitonin | A very mild, non-ionic detergent used to gently solubilize membranes, preserving weak protein-protein interactions in supercomplexes (e.g., respirasomes) [37] [17]. |
| Coomassie Blue G-250 | Anionic dye used in BN-PAGE to bind protein surfaces, impart negative charge, and prevent aggregation [37] [32]. |
| 6-Aminocaproic Acid | A zwitterionic salt used in the solubilization and gel buffers. It provides ionic strength but has zero net charge at pH 7.0, minimizing interference with electrophoresis [37] [17]. |
| Bis-Tris | A common buffering agent used in native electrophoresis systems due to its stability and compatibility with native protein structures at pH 7.0 [37] [32]. |
| Protease Inhibitors (e.g., PMSF) | Added to all buffers to prevent proteolytic degradation of protein complexes during the extraction and separation process [32]. |
| Linear Gradient Gels (e.g., 3-12%) | Polyacrylamide gels with a gradient of increasing concentration provide a pore-size sieve that separates a very wide range of protein complex sizes effectively [37] [32]. |
BN-PAGE and CN-PAGE are indispensable, complementary tools in the protein separation toolkit. When framed within the broader thesis of SDS-PAGE versus native PAGE, they occupy a specialized niche for the functional analysis of multi-protein complexes. The experimental data confirms that BN-PAGE offers a robust, widely applicable method for analyzing complex assembly and composition, while CN-PAGE excels in applications where preserving maximum enzymatic activity for functional assays is paramount, such as in-gel activity staining. The choice between them is not a matter of superiority but of strategic alignment with the specific research objective—whether it is to determine the structural composition of a complex or to probe its biological function directly in the gel.
Determining Molecular Weight vs. Studying Protein Complexes and Interactions
In proteomics research, the choice of electrophoresis technique is fundamental to the experimental outcome. SDS-PAGE (Sodium Dodecyl Sulfate-Polyacrylamide Gel Electrophoresis) and Native PAGE represent two foundational approaches with distinct applications: determining molecular weight and studying protein complexes, respectively [39] [40]. SDS-PAGE provides high-resolution separation based primarily on polypeptide chain mass, while Native PAGE preserves higher-order protein structures, enabling the analysis of functional complexes and interactions [3] [41]. This guide objectively compares their performance, supported by experimental data, to inform researchers and drug development professionals in selecting the optimal technique for their specific objectives.
Core Principles and Separation Mechanisms
SDS-PAGE: Denaturing Separation by Mass
SDS-PAGE employs the anionic detergent sodium dodecyl sulfate (SDS) and heat to denature proteins. SDS binds uniformly to polypeptide backbones, masking intrinsic charges and imparting a negative charge proportional to molecular mass [39]. During electrophoresis, proteins migrate through a polyacrylamide gel matrix acting as a molecular sieve, separating based primarily on molecular weight rather than charge or shape [39] [12]. This denaturation destroys functional properties, including enzymatic activity and non-covalently bound cofactors, but enables precise size determination [3].
Native PAGE: Preserving Native Structure and Interactions
Native PAGE separates proteins under non-denaturing conditions without SDS. Proteins retain their native conformation, biological activity, and quaternary structure [41] [40]. Separation depends on a combination of intrinsic charge, hydrodynamic size, and molecular shape [12]. This preservation allows for the identification of protein-protein interactions, analysis of oligomeric states, and in-gel activity assays [7] [40]. Variants like Blue-Native PAGE (BN-PAGE) use Coomassie dye to impart charge for separation, while Clear-Native PAGE (CN-PAGE) offers further refinement for specific applications [40].
Table 1: Fundamental Principles of SDS-PAGE vs. Native PAGE
| Feature | SDS-PAGE | Native PAGE |
|---|---|---|
| Separation Basis | Molecular mass | Charge, size, and shape |
| Protein State | Denatured and linearized | Native and folded |
| Detergent Used | SDS (denaturing) | Mild, non-ionic (e.g., Dodecylmaltoside) |
| Quaternary Structure | Disassembled | Preserved |
| Functional Activity Post-Electrophoresis | Lost | Retained |
Comparative Performance and Experimental Data
Resolution and Analytical Capabilities
SDS-PAGE excels in analytical resolution, cleanly separating proteins with mass differences as small as 2% and effectively resolving complex mixtures into individual polypeptide subunits [39]. Its strength lies in determining protein purity, expression levels, and molecular weight with high accuracy [39].
Native PAGE, while offering lower resolution for complex proteomic mixtures, provides superior functional resolution [3] [40]. It can distinguish between different oligomeric states of a protein (e.g., monomers, dimers, tetramers) and separate stable supercomplexes, providing insights not possible with denaturing methods [7] [40].
Quantitative Data from Comparative Studies
Experimental data highlights the performance differences. A study on the Zn-proteome demonstrated that while standard SDS-PAGE retained only 26% of Zn²⺠bound to proteins, a modified Native SDS-PAGE protocol retained 98% of metal ions, crucial for studying metalloproteins [3]. Furthermore, in activity assays, seven out of nine model enzymes retained function after Native SDS-PAGE, whereas all nine were denatured during standard SDS-PAGE [3].
Research on Medium-Chain Acyl-CoA Dehydrogenase (MCAD) utilized a high-resolution clear native PAGE (hrCN-PAGE) in-gel activity assay. This method successfully differentiated active tetramers from inactive, lower molecular mass forms caused by pathogenic variants, a distinction impossible with standard spectrophotometric assays that only measure total activity [7].
Table 2: Experimental Performance Comparison
| Application/Outcome | SDS-PAGE Performance | Native PAGE Performance |
|---|---|---|
| Molecular Weight Determination | High accuracy | Not applicable/Inaccurate |
| Detection of Protein Oligomers | No (disassembles complexes) | Yes |
| Post-Electrophoresis Enzyme Activity | Not retained [3] | Retained [3] [7] |
| Metal Cofactor Retention | Low (26% for Zn²âº) [3] | High (98% for Zn²âº) [3] |
| Identification of Transient Interactions | No | Yes, with crosslinking [42] |
Detailed Experimental Protocols
Protocol for Molecular Weight Determination via SDS-PAGE
This standard protocol is adapted from Laemmli's method for determining protein molecular weight and analyzing purity [39].
- Sample Preparation: Mix protein sample with SDS-containing loading buffer (e.g., Laemmli buffer). A reducing agent like β-mercaptoethanol or DTT is often added to break disulfide bonds. Heat the mixture at 70–100°C for 5–10 minutes to fully denature proteins [39].
- Gel Selection: Choose an appropriate acrylamide concentration. For example, use a 12% gel for proteins in the 40–100 kDa range, or a 4–20% gradient gel for a broader molecular weight range [39] [12].
- Electrophoresis: Load samples and molecular weight markers into wells. Run the gel using a discontinuous buffer system (e.g., Tris-Glycine with SDS) at a constant voltage of 100–150V for approximately 40–60 minutes, or until the dye front reaches the bottom [39] [12].
- Post-Electrophoresis Analysis: Visualize proteins by staining with Coomassie Blue, silver stain, or fluorescent dyes. Compare the migration distance (Rf) of target protein bands to the standard curve generated from molecular weight markers to estimate size [39].
Protocol for Studying Complexes via BN-PAGE
This protocol for Blue-Native PAGE is used to isolate and study native protein complexes and interactions [40].
- Sample Preparation (Critical Step): Solubilize protein complexes gently using mild, non-ionic detergents. Dodecylmaltoside (DDM), Triton X-100, or digitonin are common choices, with the specific detergent and detergent-to-protein ratio significantly impacting which complexes are preserved [40]. Keep samples at 4°C to maintain complex stability.
- Additive for Charge Transfer: Add Coomassie Blue G-250 dye to the sample or cathode buffer. The dye binds to protein complexes, providing the negative charge necessary for electrophoretic migration without denaturation [40].
- Gel Electrophoresis: Use a native gradient gel (e.g., 4–16% acrylamide). Run the gel with an anode buffer (without Coomassie) and a dark blue cathode buffer (with Coomassie). Apply a constant voltage, typically starting at 100V and later increasing to 150-500V, for 1-2 hours at 4°C [40].
- In-Gel Functional Assays:
- For Activity: Incubate the gel in a reaction mixture containing specific substrates and colorimetric agents. For an oxidoreductase like MCAD, the gel is stained with a solution containing octanoyl-CoA (substrate) and nitro blue tetrazolium (NBT), which forms a purple precipitate upon reduction, revealing active enzyme bands [7].
- For Complex Identification: Specific protein complexes can be identified by western blotting (if complexes remain intact during transfer) or by cutting out gel bands for mass spectrometric analysis [40].
Research Reagent Solutions
The following reagents are essential for successfully executing the described electrophoresis methods.
Table 3: Essential Reagents for Protein Electrophoresis
| Reagent | Function | Key Consideration |
|---|---|---|
| Sodium Dodecyl Sulfate (SDS) | Denatures proteins and confers uniform negative charge for size-based separation in SDS-PAGE [39]. | High purity is critical for consistent results. |
| Acrylamide/Bis-Acrylamide | Forms the porous gel matrix that acts as a molecular sieve [12]. | Concentration determines pore size and resolution range. |
| Coomassie Blue G-250 | Imparts negative charge to native protein complexes in BN-PAGE without significant denaturation [40]. | Excess dye can dissociate some complexes; concentration must be optimized. |
| Dodecylmaltoside (DDM) | Mild, non-ionic detergent for solubilizing membrane protein complexes in Native PAGE [40]. | Preferred for solubilizing individual respiratory complexes. |
| Digitonin | Mild, non-ionic detergent for solubilizing membrane protein complexes [40]. | Preferred for preserving supercomplexes (e.g., in respiratory chains). |
| Nitrobluetetrazolium (NBT) | Tetrazolium salt used in in-gel activity assays; reduces to a purple formazan precipitate upon accepting electrons [7] [43]. | Allows visual localization of enzyme activity after native PAGE. |
Experimental Workflow and Pathway Visualization
The diagrams below illustrate the core decision pathway for selecting an electrophoresis method and the subsequent experimental workflows.
Diagram 1: Decision pathway for selecting between SDS-PAGE and Native PAGE based on research objectives.
Diagram 2: Comparative experimental workflows for SDS-PAGE (denaturing) and Native PAGE (non-denaturing) techniques.
Advanced Applications and Integrated Techniques
Two-Dimensional (2-D) Electrophoresis
Combining Native PAGE and SDS-PAGE in a 2-D system provides a powerful tool for interaction studies. Native PAGE is run in the first dimension to preserve complexes, followed by SDS-PAGE in the second dimension to denature and separate constituent polypeptides [41]. Proteins involved in an interaction migrate with abnormal mobility in the first dimension, allowing identification by comparing 2-D maps with and without binding partners [41]. This approach has been successfully used to detect interactions like that between interleukin-2 (IL-2) and its receptor within complex protein extracts [41].
Complexome Profiling
Quantitative complexome profiling involves separating native protein complexes by methods like CN-PAGE, fractionating the gel, and analyzing the fractions with quantitative mass spectrometry [44]. This establishes abundance profiles for proteins across a molecular weight gradient, enabling the identification of putative interaction partners and changes in complex abundance or composition under different conditions, such as diurnal cycles in plants [44]. This provides a systems-level view of protein assembly states.
SDS-PAGE and Native PAGE are complementary, not competing, technologies in the protein separation toolkit. SDS-PAGE remains the gold standard for determining molecular weight and analyzing denatured proteins with high resolution. In contrast, Native PAGE is indispensable for investigating the functional architecture of proteomes, revealing protein-protein interactions, oligomeric states, and enzymatic activities. The choice between them is dictated by the scientific question: SDS-PAGE reveals what proteins are made of, while Native PAGE shows what proteins do together. For a comprehensive understanding, researchers often employ these techniques in tandem, such as in two-dimensional electrophoresis, to bridge the gap between protein identity and functional complexomics.
The choice of protein separation method, specifically Sodium Dodecyl Sulfate-Polyacrylamide Gel Electrophoresis (SDS-PAGE) versus Native PAGE, serves as a critical foundation that dictates the feasibility, quality, and type of all subsequent analytical techniques. Within the context of proteomic research and drug development, separation is rarely an end goal; it is a preparatory step for downstream applications such as immunodetection, functional studies, or structural characterization. SDS-PAGE employs denaturing conditions, using detergent to unfold proteins and separate them primarily by molecular mass [5]. Conversely, Native PAGE separates proteins in their folded, native state based on a combination of charge, size, and shape, preserving their biological activity and complex structures [5]. This fundamental difference in the initial separation principle has a profound and deterministic impact on the compatibility and effectiveness of Western blotting, activity assays, and mass spectrometry. This guide objectively compares the performance of these two separation methods in downstream applications, supported by experimental data and detailed methodologies.
Fundamental Principles of SDS-PAGE and Native PAGE
The operational distinctions between SDS-PAGE and Native PAGE stem from their treatment of protein structure. The table below summarizes their core principles:
Table 1: Core Principles of SDS-PAGE vs. Native PAGE
| Feature | SDS-PAGE | Native PAGE |
|---|---|---|
| Protein State | Denatured and linearized | Native, folded structure |
| Separation Basis | Primarily molecular weight | Native charge, size, and shape |
| Key Reagents | SDS, reducing agents (e.g., β-mercaptoethanol) | No denaturing agents; may use Coomassie for charge shift (BN-PAGE) |
| Biological Activity | Destroyed | Preserved |
| Protein Complexes | Disassembled into subunits | Intact oligomeric states maintained |
In SDS-PAGE, the anionic detergent SDS binds uniformly to the protein backbone, masking the protein's intrinsic charge and imparting a negative charge proportional to its mass. This allows separation based almost exclusively on molecular weight [5] [3]. This process inevitably disrupts higher-order structure, rendering proteins inactive but ideal for molecular weight estimation and subunit analysis.
Native PAGE avoids denaturants, allowing proteins to migrate through the gel in their functional conformation. This makes it indispensable for studying native protein properties. A variant known as Blue-Native (BN)-PAGE uses Coomassie dye to confer a negative charge on native proteins, enabling the separation of membrane protein complexes and oligomers [3].
Figure 1. Workflow showing how the initial separation method determines the state of proteins and their compatibility with downstream applications.
Downstream Compatibility and Experimental Data
The separation method directly dictates the success of downstream applications. The following table provides a comparative overview of their compatibility, supported by experimental findings.
Table 2: Downstream Application Compatibility and Performance Data
| Downstream Application | SDS-PAGE Compatibility | Native PAGE Compatibility | Supporting Experimental Data |
|---|---|---|---|
| Western Blotting | Excellent. High-resolution separation enhances antibody specificity and accuracy of molecular weight determination [45]. | Good. Confirms native identity but molecular weight estimation is less accurate [5]. | A database of 10,000 human proteins used SDS-PAGE with MS to establish accurate electrophoretic migration patterns, crucial for antibody validation in Western blotting [9]. |
| Activity Assays | Not Compatible. Denaturation destroys enzymatic activity and protein-protein interactions [5] [3]. | Excellent. Biological function is fully preserved post-separation. | A study on Zn²âº-metalloproteins showed SDS-PAGE destroyed all activity, while BN-PAGE preserved it in all nine tested enzymes. A modified method (NSDS-PAGE) preserved activity in 7 of 9 enzymes [3]. |
| Mass Spectrometry (MS) | Excellent. Denatured proteins are ideal for in-gel digestion and peptide identification [9]. | Compatible. Requires specialized protocols to handle non-covalent modifications and complexes. | SDS-PAGE coupled with MS has been used to create extensive migration databases and characterize post-translational modifications and splicing events [9]. |
| Metal/ Cofactor Retention | Poor. Denaturation and chelators (EDTA) strip bound metal ions. | Excellent. Native conditions preserve non-covalent cofactor binding. | In a pig kidney proteome study, Zn²⺠retention was 26% with SDS-PAGE but increased to 98% using modified (NSDS-PAGE) conditions that mimic native principles [3]. |
Experimental Protocols for Key Findings
Protocol: Assessing Metalloprotein Activity Post-Electrophoresis
This protocol is derived from a study investigating zinc retention and enzyme activity [3].
- Sample Preparation: Prepare pig kidney epithelial cell (LLC-PK1) lysates. Partially purify proteins via Sephadex G-25 gel filtration and DEAE anion-exchange chromatography. Use model Zn²âº-enzymes like alcohol dehydrogenase (ADH) and carbonic anhydrase (CA) as controls.
- Electrophoresis:
- SDS-PAGE: Use standard denaturing conditions with MOPS-SDS running buffer and LDS sample buffer with a heating step (70°C for 10 min) [3].
- BN-PAGE: Follow manufacturer's protocol (Invitrogen) using specific anode/cathode buffers and sample buffer without detergents [3].
- NSDS-PAGE (Modified): Use a running buffer with reduced SDS (0.0375%) and no EDTA. The sample buffer should lack SDS/EDTA, and the heating step should be omitted [3].
- Activity Staining: Following electrophoresis, incubate the gel in an appropriate substrate and detection solution for the enzyme of interest. For example, use Tris-HCl buffer containing Nitro Blue Tetrazolium (NBT) and phenazine methosulfate (PMS) for dehydrogenase activity. The development of a colored precipitate indicates retained enzymatic activity.
- Metal Detection: Use laser ablation-inductively coupled plasma-mass spectrometry (LA-ICP-MS) to directly map metal distribution (e.g., Zn²âº) across the gel. Alternatively, use a fluorophore like TSQ for in-gel staining of zinc [3].
Protocol: Validating Antibody Specificity Using a Migration Database
This protocol leverages public data for accurate Western blotting [9].
- Protein Separation: Perform SDS-PAGE on your sample (e.g., cell lysate) under standardized, denaturing conditions.
- Western Blotting: Transfer separated proteins to a membrane and probe with your target antibody using standard immunodetection methods.
- Data Query and Validation:
- Access the public database of electrophoretic migration patterns (e.g., https://pumba.dcsr.unil.ch/).
- Query your protein of interest to find its accurate, experimentally determined molecular weight from SDS-PAGE analyses of multiple human cell lines.
- Compare the migration distance and calculated molecular weight of your detected band with the database value. A match increases confidence in antibody specificity, while a significant discrepancy may indicate non-specific binding or the presence of a proteoform.
Essential Research Reagent Solutions
The following table details key reagents and their critical functions in the context of these electrophoretic methods and downstream applications.
Table 3: Key Research Reagents and Their Functions
| Reagent / Material | Function in SDS-PAGE | Function in Native PAGE |
|---|---|---|
| SDS (Sodium Dodecyl Sulfate) | Denatures proteins and imparts uniform negative charge for size-based separation. | Typically omitted to preserve native structure. |
| Coomassie G-250 | Used for post-electrophoresis protein staining. | In BN-PAGE, binds to proteins superficially to provide charge for electrophoresis without denaturation. |
| Primary Antibodies | Must recognize linear epitopes (stretches of amino acids) exposed in denatured proteins. | Must recognize conformational (3D) epitopes present on the native protein surface. |
| Mass Spectrometry-Grade Trypsin | Enzyme used for in-gel digestion of denatured proteins into peptides for LC-MS/MS analysis. | Digestion may be less efficient due to the compact native structure, requiring optimization. |
| EDTA (Ethylenediaminetetraacetic acid) | Often included in buffers to chelate metal ions and prevent protease activity. | Omission is critical for experiments requiring functional metalloproteins. |
The choice between SDS-PAGE and Native PAGE is not a matter of which technique is superior, but which is most appropriate for the specific downstream analytical goal. This guide provides a clear, data-driven framework for this decision.
Choose SDS-PAGE when your primary goals involve determining protein molecular weight, analyzing subunit composition, performing routine Western blotting with antibodies validated for linear epitopes, or preparing samples for bottom-up mass spectrometry identification. Its high resolution and reproducibility under denaturing conditions make it the workhorse for these applications.
Choose Native PAGE when the preservation of biological function is paramount. This includes studying enzyme kinetics, protein-protein interactions, oligomeric states, and the role of non-covalent cofactors like metal ions. Its superior compatibility with activity assays makes it indispensable for functional proteomics.
Emerging techniques like NSDS-PAGE attempt to bridge the gap between high resolution and native state preservation [3], highlighting the ongoing innovation in this field. By aligning the initial separation strategy with the final analytical objective, researchers can ensure robust, reliable, and meaningful results in their protein characterization workflows.
Resolution Challenges and Solutions: Troubleshooting Common Issues in Both Techniques
Diagnosing and Resolving Poor Band Separation and Smearing in SDS-PAGE
In molecular biology and biopharmaceutical development, polyacrylamide gel electrophoresis (PAGE) serves as a fundamental tool for protein analysis. Two primary variants—sodium dodecyl sulfate-polyacrylamide gel electrophoresis (SDS-PAGE) and native PAGE—offer complementary approaches for researchers studying protein characteristics. SDS-PAGE denatures proteins using an ionic detergent, enabling separation primarily by molecular weight, while native PAGE maintains proteins in their folded, functional state, separating them based on combined factors of size, charge, and shape [1] [5]. This distinction is crucial for researchers and drug development professionals selecting the appropriate method for their specific applications, whether determining protein purity and molecular weight or studying functional protein complexes and interactions.
The resolution of protein bands—their sharpness and distinct separation—is paramount for accurate analysis. Poorly separated or smeared bands can compromise experimental results, leading to misinterpretation of protein size, quantity, or purity. This guide systematically diagnoses the root causes of these common issues in SDS-PAGE, provides evidence-based troubleshooting protocols, and objectively compares the resolution capabilities of SDS-PAGE against native PAGE to inform method selection in research and development pipelines.
Fundamental Principles of SDS-PAGE vs. Native PAGE
Understanding the mechanistic differences between SDS-PAGE and native PAGE is essential for diagnosing separation issues and selecting the appropriate technique for your research goals.
SDS-PAGE employs the anionic detergent sodium dodecyl sulfate (SDS) to denature protein samples. When proteins are heated with SDS and a reducing agent like beta-mercaptoethanol or DTT, they unfold into linear polypeptide chains. SDS binds uniformly along the backbone, masking the protein's intrinsic charge and imparting a strong negative charge that is proportional to the protein's mass [46] [12]. This process allows separation to occur almost exclusively by molecular size as the SDS-protein complexes migrate through the polyacrylamide gel matrix under an electric field. Smaller proteins navigate the pores more easily and migrate farther, while larger proteins are impeded [1]. This makes SDS-PAGE ideal for determining molecular weight, assessing purity, and analyzing subunit composition.
Native PAGE, in contrast, omits denaturing agents. Proteins remain in their native, folded conformation, preserving their biological activity, complex quaternary structure, and intrinsic electrical charge [5]. Separation depends on a combination of the protein's net charge (at the running buffer pH), size, and three-dimensional shape. This technique is particularly valuable for studying functional properties, such as enzymatic activity, protein-protein interactions, and oligomeric states [1] [5].
The following table summarizes the core differences between these two techniques:
Table 1: Core Principles and Applications of SDS-PAGE vs. Native PAGE
| Feature | SDS-PAGE | Native PAGE |
|---|---|---|
| Protein State | Denatured and linearized | Native, folded structure preserved |
| Separation Basis | Primarily molecular weight/size | Combined effect of charge, size, and shape |
| Charge Profile | Uniform negative charge from SDS | Intrinsic charge of the protein is maintained |
| Reducing Agent | Required (DTT, BME) to break disulfide bonds | Typically omitted |
| Biological Activity | Lost during denaturation | Often retained post-separation |
| Primary Applications | Molecular weight determination, purity assessment, western blotting | Enzyme activity assays, protein complex analysis, interaction studies |
Troubleshooting Poor Band Separation and Smearing in SDS-PAGE
Poor band resolution and smearing are among the most frequent challenges faced in SDS-PAGE, often stemming from issues in sample preparation, gel composition, or electrophoresis conditions. The table below outlines common problems, their root causes, and validated solutions.
Table 2: Troubleshooting Guide for Poor Band Separation and Smearing in SDS-PAGE
| Problem & Indications | Root Cause | Proven Solution | Supporting Data/Principle |
|---|---|---|---|
| Smeared Bands (Diffuse, blurry bands) [47] [48] | Voltage too high: Excess heat denatures the gel and causes band diffusion [47]. | Run gel at lower voltage (e.g., 10-15 V/cm) for a longer duration [47]. | Standard practice is ~150V for a mini-gel; higher voltages generate excessive heat [47]. |
| Incomplete Denaturation: Proteins aren't fully unfolded, leading to heterogeneous migration [49] [50]. | Boil samples at 95-100°C for 5 minutes in sample buffer. After boiling, immediately place on ice to prevent renaturation [49]. | Ensures uniform SDS binding and linearization of proteins [46]. | |
| Protein Overload: Too much protein per well causes aggregation and streaking [49] [48]. | Load an appropriate amount of protein. Validate optimal load for each protein-antibody pair [49]. | Excess protein can aggregate and prevent clean separation by size [48]. | |
| High Salt Concentration: Ions interfere with current flow and protein migration [48]. | Dialyze sample, precipitate with TCA, or use a desalting column [48]. | High salt can cause band distortion and smearing [48]. | |
| Poor Band Separation (Bands too close, unclear, or overlapping) [47] | Incorrect Gel Percentage: Pore size is mismatched to target protein size [49]. | Use lower % acrylamide for high MW proteins; higher % for low MW proteins. Consider gradient gels for broad MW ranges [49] [48]. | Low % gels have larger pores, better for large proteins; high % gels have smaller pores, better for small proteins [49] [12]. |
| Incomplete Polymerization: Uneven pore formation in the gel [49]. | Ensure TEMED and APS are fresh and added in correct concentrations. Allow gel to polymerize completely before use [49]. | Incomplete polymerization creates an inconsistent gel matrix, hindering resolution [49]. | |
| Improper/Irregular Running Buffer: Incorrect ionic strength or pH disrupts current and protein mobility [47]. | Prepare fresh running buffer with correct salt concentrations and confirm pH is 8.3-8.8 [47] [49]. | Buffer ions conduct current and maintain optimal pH for separation; old or wrong buffers hinder this [47] [46]. | |
| "Smiling" Bands (Bands curve upward at the edges) [47] [48] | Uneven Heat Distribution: The center of the gel runs hotter than the edges, causing faster migration in the center [47] [48]. | Run the gel in a cold room, use a compatible ice pack in the apparatus, or lower the voltage [47] [49]. | Heat is an unwanted side-effect of current; cooling ensures even migration [47]. |
| Vertical Streaking (Straight, vertical smears within a lane) [48] | Protein Precipitation: Part of the protein sample precipitates in the well [48]. | Centrifuge samples before loading. For hydrophobic proteins, add 4-8 M urea to the sample buffer [48]. | Particulates or aggregated protein will not enter the gel uniformly. |
| Diffuse Bands at Gel Periphery (Edge Effect) [47] | Empty Wells: Lanes at the periphery of the gel are left empty. | Load all wells. If no sample is available, load ladder or a dummy protein sample (e.g., BSA) in empty wells [47]. | Empty wells disrupt the uniform electric field across the gel, distorting bands in adjacent lanes [47]. |
Workflow for Systematic Diagnosis and Resolution
The following diagram maps the logical troubleshooting process for resolving poor band separation and smearing, guiding you from problem identification to solution.
Experimental Protocols for Optimal Resolution
Standard Protocol for High-Resolution SDS-PAGE
This protocol is designed to minimize the common issues of smearing and poor separation.
Materials & Reagents:
- Sample Buffer (Laemmli Buffer): Tris-HCl, SDS, glycerol, bromophenol blue, and a reducing agent (DTT or β-mercaptoethanol) [46]. The SDS denatures proteins, while the reducing agent cleaves disulfide bonds.
- Running Buffer: Tris-glycine-SDS, pH 8.3 [46].
- Polyacrylamide Gel: Consisting of a stacking gel (pH ~6.8, lower % acrylamide) and a resolving gel (pH ~8.8, % acrylamide chosen based on target protein size) [46] [12].
Methodology:
- Sample Preparation: Mix protein samples with 1X sample buffer. Heat at 95-100°C for 5 minutes to ensure complete denaturation. Centrifuge briefly to collect condensation [49] [50].
- Gel Casting: Prepare resolving gel solution with acrylamide/bis-acrylamide, APS, and TEMED. Pour and overlay with water-saturated butanol or isopropanol for a flat interface. Once polymerized, prepare and pour the stacking gel, inserting the comb without introducing bubbles [1].
- Gel Loading: Place gel cassette into the electrophoresis chamber and fill with running buffer. Load equal volumes of prepared samples and molecular weight markers into wells. Do not leave outer wells empty to prevent the "edge effect" [47].
- Electrophoresis: Connect to power supply. Run at a constant voltage of 150V for a mini-gel until the dye front reaches the bottom (typically 1-1.5 hours). For heat-sensitive issues, run at 100-120V for longer or in a cold room [47] [49].
- Termination and Analysis: Turn off power when the run is complete. Proceed to staining (e.g., Coomassie, silver) or western blot transfer.
Advanced Technique: Phos-tag SDS-PAGE
For resolving specific post-translational modifications like phosphorylation, which can cause multiple banding patterns, Phos-tag SDS-PAGE is a powerful tool. This technique incorporates a phosphate-binding molecule (Phos-tag) into the polyacrylamide gel. The Phos-tag reagent binds to phosphorylated residues, retarding the migration of phosphorylated proteins compared to their non-phosphorylated counterparts [51]. This allows for clear separation and visualization of different phosphorylation states of a protein, which would otherwise appear as smears or poorly resolved clusters in traditional SDS-PAGE [51].
The Scientist's Toolkit: Essential Reagents for SDS-PAGE
Table 3: Key Research Reagents for SDS-PAGE Experiments
| Reagent / Material | Critical Function | Technical Notes & Optimization Tips |
|---|---|---|
| SDS (Sodium Dodecyl Sulfate) | Denatures proteins and confers a uniform negative charge, enabling separation by size alone [46]. | Ensure purity and use fresh solutions; insufficient SDS causes smearing. |
| DTT or β-Mercaptoethanol (BME) | Reducing agents that break disulfide bonds, ensuring complete protein unfolding [46] [12]. | Must be fresh; old or oxidized agents lead to incomplete reduction and band artifacts [48]. |
| Acrylamide/Bis-Acrylamide | Forms the cross-linked porous gel matrix that acts as a molecular sieve [1]. | Percentage determines pore size. Choose based on protein MW: 8-10% for standard, 12-15% for small proteins [49] [12]. |
| APS & TEMED | Catalysts for acrylamide polymerization (APS provides free radicals, TEMED is the accelerator) [1]. | Must be fresh for complete and consistent gel polymerization [49]. |
| Tris-Glycine Buffer System | Running buffer ions conduct current. The discontinuous pH system stacks proteins before they enter the resolving gel [46]. | Always prepare fresh and confirm pH (8.3 for running buffer). Overused buffer leads to poor resolution [47] [49]. |
| Molecular Weight Markers | Essential standards for estimating the size of unknown proteins and monitoring run progress. | Pre-stained markers allow real-time tracking. Unstained markers offer higher accuracy for size determination [1]. |
| Oclacitinib-13C-d3 | Oclacitinib-13C-d3|Stable Isotope|RUO |
When selecting an electrophoresis method, the choice between SDS-PAGE and native PAGE hinges on the research objective. SDS-PAGE is unequivocally superior for achieving resolution based strictly on polypeptide chain molecular weight. Its power lies in its ability to denature complexes and mask intrinsic charges, providing a high-resolution separation that is ideal for determining molecular weight, assessing sample purity, identifying proteins via western blotting, and analyzing subunit composition. The troubleshooting guidelines provided here directly address the factors that compromise this resolution—such as incomplete denaturation, improper gel percentage, and suboptimal running conditions.
Conversely, native PAGE excels in resolving proteins based on their combined charge-to-mass ratio and native conformation. Its superior resolution capability is applied to different questions: separating and identifying functional protein complexes, studying oligomerization states, and analyzing enzymes without loss of activity [5]. While native PAGE can produce exceptionally sharp bands, smearing or poor separation in this technique would point to different issues, such as protein aggregation or incorrect buffer pH, which falls outside the scope of this SDS-focused troubleshooting guide.
For researchers requiring maximum resolution for molecular weight analysis, SDS-PAGE, when meticulously optimized using the protocols and troubleshooting steps outlined above, remains the robust and definitive method. The advent of capillary electrophoresis-SDS (CE-SDS) offers a more automated, quantitative, and reproducible platform for size-based analysis, particularly in biopharmaceutical development [14]. However, the accessibility, visual clarity, and established workflow of traditional SDS-PAGE ensure its continued role as a fundamental technique in research laboratories worldwide.
In the critical comparison of protein separation resolution between SDS-PAGE and Native PAGE, band distortion artifacts represent a significant methodological challenge that can compromise data interpretation and reproducibility. "Smiling effects" and edge effects, characterized by upward-curving bands at the gel edges, occur when proteins migrate faster at the sides of the gel than in the center [52]. These distortions directly impact the accuracy of molecular weight estimation and quantitative analysis, potentially leading to erroneous conclusions in both basic research and drug development applications. The underlying causes of these phenomena differ between denaturing and native electrophoretic techniques, reflecting their distinct separation mechanisms. While SDS-PAGE separates proteins primarily by molecular weight through uniform SDS coating [5] [1], Native PAGE separation depends on the native charge, size, and shape of proteins [5] [1], making each technique susceptible to different distortion mechanisms. Understanding and addressing these artifacts is therefore essential for maximizing the reliability of protein separation data in comparative studies.
Causes and Mechanisms of Band Distortion
Band distortion in polyacrylamide gel electrophoresis arises from multiple factors that create uneven migration patterns across the gel matrix. These factors can be categorized into equipment-related issues and sample-specific properties, with some mechanisms affecting SDS-PAGE and Native PAGE differently due to their distinct biochemical principles.
Equipment and Setup Factors: In both SDS-PAGE and Native PAGE, uneven heating across the gel surface represents a primary cause of smiling effects. Inadequate heat dissipation allows the center of the gel to become warmer than the edges during electrophoresis, increasing migration rates in the warmer central region and creating downward-curving bands [52]. Conversely, excessive cooling can cause faster migration at the cooler edges, producing upward-curving bands. Improper alignment of glass plates or buffer leaks creates uneven electrical field strength across the gel, further contributing to distorted migration patterns. These issues are compounded by variations in gel polymerization, particularly with improperly prepared or degraded ammonium persulfate (APS) and TEMED catalysts that create non-uniform pore sizes [52].
Sample and Buffer-Related Factors: Sample-specific properties differentially affect the two electrophoretic techniques. In SDS-PAGE, incomplete denaturation or inadequate SDS binding can produce aberrant migration, particularly for membrane proteins with hydrophobic domains that bind variable amounts of detergent [53]. The presence of residual secondary or tertiary structure creates resistance during migration, while overloading of protein samples (≥30 μg per lane for standard mini-gels) exceeds the gel's sieving capacity, causing band spreading and distortion [52]. In Native PAGE, the preservation of native protein structure introduces additional variables, as protein charge, size, and shape collectively influence migration [5] [1]. The absence of denaturing agents means that variations in buffer ionic strength and pH can selectively alter protein charge densities, creating inconsistent migration across the gel. Salt contamination in samples generates localized changes in conductivity, while carbon dioxide absorption from the atmosphere can alter buffer pH over time, particularly in Native PAGE where precise pH maintenance is critical for preserving native protein structure and function [3].
Table 1: Primary Causes of Band Distortion in SDS-PAGE vs. Native PAGE
| Cause Category | Specific Factor | Impact on SDS-PAGE | Impact on Native PAGE |
|---|---|---|---|
| Equipment & Setup | Uneven heating/cooling | High impact on migration rate | High impact on migration rate |
| Improper buffer circulation | Moderate impact | High impact due to pH sensitivity | |
| Non-uniform gel polymerization | High impact on sieving | High impact on sieving | |
| Sample Properties | Incomplete denaturation | High impact on mobility | Not applicable |
| Variable detergent binding | High impact for membrane proteins [53] | Not applicable | |
| Protein aggregation | Creates smearing | Creates smearing and precipitation | |
| Salt contamination | Alters local conductivity | Alters local conductivity and structure | |
| Buffer Conditions | Incorrect ionic strength | Moderate impact | High impact on native charge |
| pH fluctuations | Moderate impact | Very high impact on protein charge |
Experimental Comparison: Resolution and Artifact Analysis
Quantitative comparison of SDS-PAGE and Native PAGE performance under controlled conditions reveals distinct resolution capabilities and susceptibility to band distortion artifacts. Experimental data from systematic studies provides insight into how each technique handles complex protein mixtures while maintaining band integrity.
Methodology for Comparative Analysis: In a direct comparison employing human bronchial smooth muscle cells (HBSMC), researchers analyzed supernatant and precipitate fractions using both denaturing SDS-PAGE and nondenaturing 2DE (a native technique) followed by quantitative LC-MS/MS [54]. For SDS-PAGE, samples were prepared with standard Laemmli buffer containing SDS and reducing agents, heated at 70-100°C for 10 minutes to ensure complete denaturation [1] [23]. Native PAGE conditions omitted SDS and reducing agents while maintaining physiological pH to preserve protein structure and interactions [54]. Both methods employed 12% polyacrylamide gels with identical dimensions (8 × 8 cm), run at constant voltage (200V for SDS-PAGE, 150V for Native PAGE) for approximately 45 minutes [3] [54]. Gels were stained with Coomassie Brilliant Blue and imaged using standardized flatbed scanners, with band sharpness quantified using image analysis software [52].
Resolution and Artifact Assessment: The experimental results demonstrated that SDS-PAGE provided superior band sharpness for denatured polypeptides, with relative standard deviations of ≤5% for migration distance measurements across triplicate runs [9]. However, SDS-PAGE showed greater susceptibility to smiling effects when heat distribution was suboptimal, with temperature gradients of just 2°C increasing migration variation between center and edge lanes by 12-15% [52]. Native PAGE exhibited more consistent migration patterns with minimal smiling effects under proper buffer circulation, but showed broader bands (15-20% wider than SDS-PAGE) due to the inherent heterogeneity of native protein structures and complexes [5] [54].
Table 2: Quantitative Comparison of Band Distortion in SDS-PAGE vs. Native PAGE
| Parameter | SDS-PAGE Performance | Native PAGE Performance | Measurement Method |
|---|---|---|---|
| Band Sharpness | 0.92 ± 0.03 (normalized intensity) | 0.78 ± 0.05 (normalized intensity) | Band width at half-height |
| Migration Reproducibility | ≤5% RSD across replicates | 8-12% RSD across replicates | Coefficient of variation in Rf |
| Temperature Sensitivity | High (12-15% variation with 2°C gradient) | Moderate (8-10% variation with 2°C gradient) | Center vs. edge migration difference |
| Molecular Weight Accuracy | High for standard globular proteins | Variable due to charge/shape factors | Apparent vs. formula MW deviation |
| Artifact Frequency | 25% of runs showed minimal smiling | 15% of runs showed minimal smiling | Visual inspection of band curvature |
The data from HBSMC analyses revealed that SDS-PAGE enabled assignment of 2552 proteins from the supernatant fraction with percent abundance ranging from 3.5% to 2×10^-4% [54]. In contrast, Native PAGE identified 4323 proteins from the same supernatant with percent abundance ranging from 3.6% to 1×10^-5%, suggesting that the isoelectric focusing step in native 2DE improved detection sensitivity for low-abundance proteins [54]. However, Native PAGE could not effectively analyze precipitate fractions containing membrane proteins, highlighting a significant limitation for comprehensive proteomic applications [54].
Protocols for Artifact Minimization
Standardized SDS-PAGE Protocol with Distortion Controls
Sample Preparation: Dilute protein samples in Laemmli buffer containing 1% SDS, 5% β-mercaptoethanol, 10% glycerol, and 0.002% bromophenol blue in 62.5 mM Tris-HCl (pH 6.8) [23]. Heat samples at 70°C for 10 minutes (95°C for membrane proteins) to ensure complete denaturation without excessive protein aggregation [53] [1]. Centrifuge at 12,000 × g for 5 minutes to remove insoluble material that could cause smearing.
Gel Preparation: Prepare resolving gel (10% acrylamide for 20-100 kDa proteins) in 375 mM Tris-HCl (pH 8.8) with 0.1% SDS [1]. Use freshly prepared ammonium persulfate (10%) and TEMED for consistent polymerization. Overlay with isopropanol to create a flat interface. After polymerization, replace isopropanol with stacking gel (4% acrylamide in 125 mM Tris-HCl, pH 6.8) and insert combs without bubbles [23].
Electrophoresis Conditions: Assemble gel apparatus with Tris-Glycine running buffer (25 mM Tris, 192 mM glycine, 0.1% SDS, pH 8.3) [1]. Load molecular weight markers (5 μL) and samples (10-20 μg protein per lane) in alternating lanes to control for edge effects. Run at constant voltage (80V) until samples enter resolving gel, then increase to 120V for standard mini-gels. Maintain temperature at 15-20°C using a circulating water bath to prevent smiling effects from uneven heating [52].
Native PAGE Protocol for Optimal Resolution
Sample Preparation: Suspend proteins in nondenaturing buffer (50 mM BisTris, 50 mM NaCl, 10% glycerol, 0.001% Ponceau S, pH 7.2) without heating or reducing agents [3]. For membrane proteins, use mild detergents like digitonin (0.5-1%) to solubilize while preserving native complexes [3].
Gel Preparation: Prepare native gradient gels (4-16% acrylamide) in 50 mM BisTris-HCl (pH 7.0) using the same polymerization catalysts as SDS-PAGE [3]. Avoid SDS and other denaturing agents throughout the process. For high-resolution separation of complexes, include 0.02% Coomassie G-250 in the cathode buffer to provide charge for migration without denaturation [3].
Electrophoresis Conditions: Use anode buffer (50 mM BisTris, 50 mM Tricine, pH 6.8) and cathode buffer (50 mM BisTris, 50 mM Tricine, 0.02% Coomassie G-250, pH 6.8) [3]. Run at constant voltage (150V) for 90-95 minutes at 4°C to maintain protein stability. Monitor migration with native protein standards rather than denatured markers [3].
Troubleshooting Workflow for Band Distortion
The following diagram illustrates a systematic approach to diagnosing and addressing band distortion in protein electrophoresis:
Research Reagent Solutions for Optimal Electrophoresis
The following reagents and equipment are essential for minimizing band distortion and achieving high-resolution separation in both SDS-PAGE and Native PAGE:
Table 3: Essential Research Reagents for Preventing Band Distortion
| Reagent/Equipment | Specification | Function in Distortion Prevention |
|---|---|---|
| Acrylamide/Bis-acrylamide | 29:1 or 37.5:1 ratio, electrophoresis grade | Consistent pore formation, uniform sieving [1] |
| APS & TEMED | Freshly prepared 10% APS, refrigerated TEMED | Complete and uniform gel polymerization [1] |
| SDS | >99% purity, low heavy metal content | Uniform protein charge and denaturation [23] |
| Tris Buffers | Molecular biology grade, pH accuracy ±0.1 | Stable pH maintenance during separation [1] |
| DTT/β-Mercaptoethanol | Fresh reducing agents, aliquoted and frozen | Complete disulfide bond reduction [23] |
| Temperature Control | Circulating water bath with precise thermostat | Even heat distribution, prevention of smiling effects [52] |
| Molecular Weight Standards | Pre-stained and unstained protein ladders | Migration reference for distortion detection [1] |
| Coomassie G-250 | Electrophoresis grade for native PAGE | Charge shift without denaturation [3] |
Band distortion artifacts present significant challenges in both SDS-PAGE and Native PAGE, but systematic approach to experimental design and troubleshooting can effectively minimize these issues. The smiling effects and edge effects that compromise separation resolution stem from identifiable factors including uneven temperature distribution, improper apparatus assembly, and suboptimal sample preparation. Through implementation of standardized protocols, careful attention to buffer systems, and appropriate temperature control, researchers can significantly improve band sharpness and migration reproducibility. The complementary strengths of SDS-PAGE for molecular weight determination and Native PAGE for protein interaction studies underscore the importance of technique-specific optimization. As electrophoretic methods continue to play fundamental roles in proteomic research and drug development, maintaining rigorous standards for artifact prevention remains essential for generating reliable, reproducible data in protein separation science.
The choice between sodium dodecyl sulfate-polyacrylamide gel electrophoresis (SDS-PAGE) and Native PAGE represents a fundamental crossroads in protein analysis, with sample preparation being the critical determinant of success. These techniques serve distinct purposes in biochemical research: SDS-PAGE separates denatured proteins primarily by molecular weight, while Native PAGE preserves proteins in their folded, functional state, separating them based on a combination of charge, size, and shape [5] [1]. For researchers and drug development professionals, understanding how to optimize sample preparation is paramount to achieving high-resolution separation, accurate data interpretation, and reliable downstream analysis.
This guide provides a detailed comparison of sample preparation methodologies for these two techniques, focusing on the core parameters that govern separation resolution: denaturation efficiency, protein loading amounts, and buffer composition. Within the broader thesis of comparing protein separation resolution, we will demonstrate how tailored sample preparation protocols directly impact the quality of electrophoretic results and the biological relevance of the obtained data.
Fundamental Principles: Denatured vs. Native States
The primary distinction between SDS-PAGE and Native PAGE lies in the preservation of protein structure. In SDS-PAGE, the anionic detergent SDS denatures proteins by binding to the polypeptide backbone, masking intrinsic charges and conferring a uniform negative charge density. This process, especially when combined with heating and reducing agents, unfolds proteins into linear chains, ensuring separation is proportional to polypeptide chain length [5] [1]. Consequently, SDS-PAGE is ideal for determining molecular weight, assessing purity, and analyzing subunit composition.
In contrast, Native PAGE is performed without denaturing agents, preserving the protein's higher-order structure (secondary, tertiary, and quaternary), biological activity, and interactions with cofactors [5] [3]. Separation depends on the protein's intrinsic charge at the running buffer pH and its hydrodynamic size, which is influenced by its folded conformation [1]. This makes Native PAGE indispensable for studying functional properties, protein-protein interactions, enzyme activity, and oligomerization states.
Table 1: Core Principles of SDS-PAGE vs. Native PAGE
| Parameter | SDS-PAGE | Native PAGE |
|---|---|---|
| Protein State | Denatured and linearized | Native, folded |
| Primary Separation Basis | Molecular mass | Charge, size, and shape |
| Biological Activity | Lost | Preserved |
| Key Detergent | SDS present | No SDS (or minimal in some variants) |
| Typical Reducing Agent | β-mercaptoethanol or DTT (in reducing SDS-PAGE) | Absent |
| Information Gained | Polypeptide size, subunit composition | Oligomeric state, functional interactions |
SDS-PAGE Sample Preparation: A Denaturation-Focused Workflow
Key Reagents and Their Roles in Denaturation
The efficiency of protein denaturation is the most critical factor for successful SDS-PAGE.
- SDS (Sodium Dodecyl Sulfate): This anionic detergent binds to hydrophobic regions of the protein at a relatively constant ratio (~1.4 g SDS per 1 g of protein), unfolding the structure and imparting a uniform negative charge. This masks the protein's intrinsic charge and allows migration based primarily on size [1].
- Reducing Agents (DTT or β-mercaptoethanol): These compounds break disulfide bonds between cysteine residues, ensuring complete dissociation of protein subunits into individual polypeptides [28]. "Reducing SDS-PAGE" utilizes these agents, while "non-reducing SDS-PAGE" omits them to preserve disulfide-linked structures [28].
- Heat Treatment: Samples are typically heated at 70–100°C for 5-10 minutes after mixing with SDS-PAGE sample buffer. This step accelerates denaturation, ensures complete SDS binding, and inactivates proteases [12].
Optimizing Loading Amounts and Buffer Composition
Protein loading amounts depend on gel thickness and detection method. For standard mini-gels (1.0 mm thick), a load of 5–25 μg of total protein per lane is common for Coomassie staining, while smaller amounts (1–10 μg) are sufficient for sensitive western blotting [3]. Overloading can cause band broadening and distortion, while underloading results in faint or undetectable bands [12].
The standard Laemmli buffer system is a discontinuous system, meaning the stacking and resolving gels have different pore sizes and pH levels to concentrate proteins into sharp bands before separation [12] [1]. A typical SDS sample buffer includes Tris-HCl (for pH), SDS (for denaturation and charge), glycerol (to add density for loading), and a tracking dye like bromophenol blue [1].
Native PAGE Sample Preparation: Preserving Native Structure
Key Reagents and Strategies for Native State Preservation
The core principle of Native PAGE sample preparation is the deliberate omission of denaturants.
- No SDS or Reducing Agents: SDS is excluded from the sample and running buffers to prevent protein unfolding and dissociation of complexes [5]. The sample buffer is typically a mild, nondenaturing buffer such as Tris-HCl or Bis-Tris.
- No Heat Denaturation: Samples are kept at low temperatures (often 4°C) and are never boiled, as heat would disrupt weak non-covalent interactions essential for native structure [3].
- Coomassie G-250 Additive: In some Native PAGE systems (e.g., NativePAGE), a low concentration of the dye Coomassie G-250 is used. It binds non-specifically to proteins without denaturing them, imparting a slight negative charge that aids the migration of basic proteins toward the anode [55].
Optimizing Conditions for Complex Stability
Loading recommendations for Native PAGE are similar to SDS-PAGE, but the native state requires extra care. The running buffer must have a pH that maintains protein solubility and complex integrity, and the electrophoresis apparatus should be kept cool to minimize denaturation during the run [1]. The choice of buffer pH is critical, as it determines the net charge of the native protein and thus its direction and rate of migration.
Advanced Modifications: NSDS-PAGE and Technical Variations
Native SDS-PAGE (NSDS-PAGE)
A hybrid approach, termed Native SDS-PAGE (NSDS-PAGE), has been developed to balance the high resolution of SDS-PAGE with the retention of some native properties. This method uses drastically reduced SDS concentrations (0.0375% in the running buffer versus the standard 0.1%) and omits EDTA and the heating step from sample preparation [3]. Remarkably, this modification allowed for the retention of 98% of Zn²⺠bound in proteomic samples, compared to only 26% with standard SDS-PAGE, and seven out of nine model enzymes retained their activity post-electrophoresis [3].
Table 2: Quantitative Comparison of Standard vs. Native SDS-PAGE Conditions
| Component | Standard SDS-PAGE [3] | Native SDS-PAGE (NSDS-PAGE) [3] |
|---|---|---|
| SDS in Running Buffer | 0.1% | 0.0375% |
| EDTA | Present | Omitted |
| Sample Heating | 70°C for 10 min | Omitted |
| Coomassie in Sample Buffer | Not specified | 0.01875% |
| Metal Retention (Zn²âº) | 26% | 98% |
| Enzyme Activity Retention | Denatured (0/9 active) | Mostly preserved (7/9 active) |
Specialized Gel and Buffer Systems
- Tricine SDS-PAGE: For superior resolution of low molecular weight proteins and peptides (< 10 kDa, down to 2 kDa), the Tricine buffer system replaces the trailing glycine ion with tricine. This prevents convective mixing with SDS micelles, resulting in sharper bands for small proteins [55].
- Zymogram Gels: These specialized Native PAGE gels are copolymerized with a substrate like gelatin or casein. After electrophoresis, the gel is incubated in a renaturing and developing buffer. Proteases that remain active will digest the substrate in their vicinity, appearing as clear bands against a stained background, allowing for their detection and characterization [55].
Research Reagent Solutions
Table 3: Essential Materials for Protein Electrophoresis
| Reagent / Material | Function | Key Considerations |
|---|---|---|
| Acrylamide/Bis-acrylamide | Forms the porous gel matrix for size-based separation. | Pore size is controlled by total acrylamide % (\%T) and crosslinker ratio (\%C) [1]. |
| SDS (Sodium Dodecyl Sulfate) | Denatures proteins and confers uniform negative charge (for SDS-PAGE). | Purity is critical for consistent binding and migration [5]. |
| DTT or β-Mercaptoethanol | Reduces disulfide bonds (for reducing SDS-PAGE). | Must be fresh; added to sample buffer just before use [12]. |
| Tris-based Buffers | Provides appropriate pH for electrophoresis and protein stability. | Discontinuous systems use different pH in stacking vs. resolving gels [1]. |
| Coomassie G-250 | Imparts charge for migration in some Native PAGE systems; also used for staining. | Binds proteins non-specifically without denaturation in NativePAGE [55]. |
| Ammonium Persulfate (APS) & TEMED | Catalyzes the polymerization of acrylamide gels. | Fresh APS is required for efficient and consistent gel polymerization [1]. |
| Protein Molecular Weight Markers | Calibrates gel for estimating protein size. | Pre-stained markers allow real-time tracking; unstained markers offer higher accuracy [12]. |
Experimental Protocols for Comparison
Protocol: Standard Denaturing SDS-PAGE
- Sample Preparation: Mix protein sample with 2X or 4X Laemmli sample buffer (containing SDS, Tris, glycerol, tracking dye, and a reducing agent like DTT). A typical ratio is 1:1 [12].
- Denaturation: Heat the mixture at 95–100°C for 5–10 minutes [12]. Centrifuge briefly to collect condensation.
- Gel Loading: Load 5–25 μg of protein per well of a standard mini-gel, alongside an appropriate protein ladder [3].
- Electrophoresis: Run the gel in Tris-Glycine-SDS running buffer at a constant voltage (e.g., 200V for 35-45 minutes) until the dye front reaches the bottom [3].
Protocol: Native PAGE (and NSDS-PAGE)
- Sample Preparation: Mix protein sample with a nondenaturing sample buffer (e.g., Tris-HCl, glycerol, and optionally Coomassie G-250 for NSDS-PAGE). Do not heat the sample [3].
- Gel Equilibration: Pre-run the NativePAGE or standard Bis-Tris gel for a short time in ddHâ‚‚O or the designated running buffer to remove storage contaminants [3].
- Gel Loading: Load the sample. Amounts are comparable to SDS-PAGE but must be determined empirically for the native system.
- Electrophoresis: Run the gel in a nondenaturing running buffer (e.g., MOPS/Tris without SDS for strict Native PAGE, or with 0.0375% SDS for NSDS-PAGE) at a constant voltage (e.g., 200V), keeping the apparatus cool [3].
Workflow and Decision Pathway
The following diagram illustrates the critical decision points in sample preparation for SDS-PAGE and Native PAGE, guiding researchers to the optimal protocol based on their experimental goals.
The optimization of sample preparation—specifically the control of denaturation through heat and detergents, the careful determination of loading amounts, and the precise formulation of buffers—is the cornerstone of achieving high-resolution protein separation. The choice between SDS-PAGE and Native PAGE dictates a mutually exclusive path: one leading to detailed polypeptide analysis at the expense of native structure, and the other preserving functional complexity while offering less resolution based solely on mass.
For researchers, this comparison underscores that there is no universal "best" method, only the most appropriate one for a given scientific question. By applying the optimized protocols and understanding the role of each reagent as outlined in this guide, scientists can reliably prepare samples that yield clear, interpretable, and biologically relevant results, thereby advancing discovery in proteomics and drug development.
Protein gel electrophoresis is a cornerstone technique in biochemical research and biopharmaceutical development. The two primary methods, Sodium Dodecyl Sulfate-Polyacrylamide Gel Electrophoresis (SDS-PAGE) and Native PAGE, serve distinct purposes based on their separation mechanisms and the nature of the information required about the protein sample [4]. SDS-PAGE separates proteins based primarily on molecular weight under denaturing conditions, making it ideal for determining protein size, assessing purity, and verifying expression levels [4] [28]. In contrast, Native PAGE separates proteins based on both their size and intrinsic charge under non-denaturing conditions, preserving protein complexes, native structure, and biological activity [4] [15]. The fundamental difference lies in the use of the denaturing agent SDS: SDS-PAGE employs SDS to denature proteins and impart a uniform negative charge, while Native PAGE avoids denaturants to maintain proteins in their native state [4] [2].
The resolution of a protein separation—how clearly individual protein bands are distinguished from one another—is critically dependent on the optimization of electrophoretic parameters. Voltage, temperature, and run time interact in complex ways that directly impact band sharpness, migration consistency, and the accuracy of molecular weight determinations [56] [57]. For researchers in drug development, where characterizing therapeutic proteins like monoclonal antibodies, fusion proteins, and vaccines is essential, optimizing these parameters is crucial for obtaining reliable, reproducible data for regulatory filings [14]. This guide provides a detailed comparison of parameter optimization strategies for SDS-PAGE versus Native PAGE, supported by experimental data and practical protocols.
Fundamental Principles and Separation Mechanisms
SDS-PAGE Separation Mechanism
SDS-PAGE employs the anionic detergent sodium dodecyl sulfate (SDS) to denature protein samples. During preparation, proteins are heated with SDS and reducing agents like dithiothreitol (DTT) or β-mercaptoethanol, which disrupts tertiary and quaternary structures by breaking disulfide bonds [4] [28]. SDS binds to hydrophobic regions of the denatured polypeptides at a relatively constant ratio of approximately 1.4g SDS per 1g protein [4]. This SDS coating masks the proteins' intrinsic charges and imparts a uniform negative charge density, meaning all proteins migrate toward the anode when an electric field is applied [2]. Separation occurs primarily based on molecular weight as polypeptides sieve through the porous polyacrylamide gel matrix, with smaller molecules migrating faster than larger ones [4]. This molecular weight-based separation makes SDS-PAGE invaluable for determining protein size, assessing purity, and analyzing subunit composition.
Native PAGE Separation Mechanism
Native PAGE operates without denaturing agents, preserving proteins in their native, folded conformation [4] [15]. During separation, proteins migrate based on both their inherent charge and size [2]. The charge-to-mass ratio, overall three-dimensional structure, and the protein's isoelectric point (pI) relative to the buffer pH all influence migration mobility [4]. Since no SDS is present to standardize charge, differently charged proteins of identical molecular weight will migrate at different rates [15]. This preservation of native state allows Native PAGE to maintain protein function, including enzymatic activity and the integrity of protein complexes and non-covalently bound cofactors such as metal ions [3]. Consequently, Native PAGE is the method of choice for studying protein-protein interactions, oligomeric states, and functional characterization.
Comparative Workflow Visualization
The diagram below illustrates the key procedural differences between SDS-PAGE and Native PAGE workflows, highlighting how sample preparation and buffer composition critically influence the final separation outcome.
Critical Parameter Optimization: Comparative Analysis
Voltage and Electric Field Considerations
The application of voltage drives protein migration through the gel matrix, but optimal settings differ significantly between SDS-PAGE and Native PAGE due to their distinct buffer compositions and separation mechanisms.
In SDS-PAGE, two-stage voltage application is often recommended. An initial low voltage (50-60V) is applied as proteins move through the stacking gel, serving to line up proteins into sharp bands before they enter the resolving gel [57]. Once proteins enter the resolving gel, the voltage is increased to approximately 5-15V per centimeter of gel length [57]. For standard mini-gels, this typically translates to 100-150V, while larger formats may require up to 200-300V [56]. Constant current mode is often preferred for SDS-PAGE as it helps maintain a consistent rate of heat generation, preventing band distortion or "smiling" caused by uneven heating across the gel [56]. As resistance naturally increases during the run due to buffer ion depletion, the power supply in constant current mode automatically increases voltage to maintain the set current, promoting uniform migration [56] [57].
For Native PAGE, lower voltages are generally recommended due to the absence of SDS and the need to preserve protein conformation. The procedure is typically performed at 4°C to dissipate heat and maintain protein stability [4]. One common protocol runs Native PAGE at a constant 150V for approximately 90-95 minutes [3]. The lower ionic strength buffers used in Native PAGE are more susceptible to heating effects, making temperature control through moderated voltage particularly important [3]. The table below summarizes key parameter differences:
Table 1: Comparative Optimization Parameters for SDS-PAGE vs. Native PAGE
| Parameter | SDS-PAGE | Native PAGE |
|---|---|---|
| Typical Voltage | 100-300V [56] [57] | 150V [3] |
| Preferred Power Supply Mode | Constant Current [56] | Information Missing |
| Temperature | Room Temperature [4] | 4°C [4] |
| Run Time | ~45 minutes [3] | ~90 minutes [3] |
| Buffer System | MOPS/Tris with SDS [3] | BisTris/Tricine without SDS [3] |
| Sample Preparation | Heating with SDS & reducing agents [4] | No heat, no denaturants [4] |
Temperature Management Strategies
Temperature control is crucial in both electrophoresis forms but for different reasons. In SDS-PAGE, heat generation is a double-edged sword. Moderate heat assists in maintaining protein denaturation and ensures consistent SDS binding [57]. However, excessive heat causes gel deformation, leading to distorted bands that curve upward ("smiling" effect), and can even prevent proper transfer during subsequent western blotting [57]. While SDS-PAGE is typically run at room temperature [4], high-voltage runs may require active cooling through ice baths or cold room operation to manage Joule heating [57].
In Native PAGE, temperature control is fundamentally linked to protein stability. The method is specifically run at 4°C to protect labile protein structures and maintain enzymatic activity [4] [3]. The lower temperature helps dissipate heat that could otherwise denature proteins or disrupt weak non-covalent interactions essential for complex integrity [3]. Recent advances in thermal gel electrophoresis have explored temperature as a tunable parameter to control matrix viscosity and enhance resolution of native proteins [58].
Run Time and Buffer Composition
Run time is directly influenced by the chosen voltage and the specific buffer system employed. A standard SDS-PAGE run with a 12% Bis-Tris mini-gel at 200V typically completes in approximately 45 minutes [3]. The ubiquitous Tris-Glycine buffer system with 0.1% SDS is suitable for a broad mass range (6-400 kDa) [58]. Alternative buffer systems like Tris-Tricine are preferred for lower molecular weight proteins (1-40 kDa), while Tris-Acetate provides better resolution for high molecular weight proteins (40-500 kDa) [58].
Native PAGE requires longer run times—approximately 90-95 minutes under standard conditions [3]—due to the lower voltages employed and the more complex migration mechanism based on both size and charge. The buffer composition is critical for maintaining native protein structure and function. Common systems include BisTris/Tricine at pH 6.8 for anode and cathode buffers, sometimes supplemented with Coomassie G-250 in the cathode buffer [3]. Blue Native PAGE (BN-PAGE) uses Coomassie dye to impart charge for separation, while Clear Native PAGE (CN-PAGE) relies on the intrinsic protein charge [4].
Advanced Applications and Emerging Technologies
Innovations in Electrophoresis Methodology
Recent methodological advances address limitations in both SDS-PAGE and Native PAGE. Native SDS-PAGE (NSDS-PAGE) represents a hybrid approach that modifies standard SDS-PAGE conditions by eliminating SDS and EDTA from sample buffers, omitting the heating step, and reducing SDS concentration in the running buffer from 0.1% to 0.0375% [3]. This protocol dramatically increases the retention of bound metal ions (Zn²⺠retention increased from 26% to 98%) and preserves enzymatic activity in seven of nine model enzymes, while maintaining high-resolution separation comparable to traditional SDS-PAGE [3].
Capillary Electrophoresis SDS (CE-SDS) has emerged as an automated, quantitative alternative to traditional slab gel SDS-PAGE, offering superior resolution, reproducibility, and reduced toxic waste [14]. This method provides precise peak integration, eliminates gel-to-gel variability, and enables analysis of various biotherapeutics including monoclonal antibodies, bispecific antibodies, ADCs, and fusion proteins [14]. Recent innovations like tetrahydroxyborate cross-linked agarose matrices have addressed baseline disturbances, enabling rapid (∼5 minutes), hump-free analysis of therapeutic proteins across a wide molecular weight range [29].
Microfluidic thermal gel transient isotachophoresis (TG-tITP) represents a cutting-edge approach for native protein analysis, achieving two-fold higher resolution than native PAGE while requiring 15,000-fold less protein loading and providing five-fold faster analysis times [58]. This method utilizes temperature-responsive polymers whose viscosity can be controlled with temperature, enabling precise tuning of separation parameters to maximize resolution [58].
Research Reagent Solutions
The table below outlines essential reagents and their functions for implementing optimized SDS-PAGE and Native PAGE protocols:
Table 2: Essential Research Reagents for Protein Electrophoresis
| Reagent | Function | Application Specificity |
|---|---|---|
| SDS (Sodium Dodecyl Sulfate) | Denatures proteins; imparts uniform negative charge [4] | SDS-PAGE only [4] |
| DTT or β-Mercaptoethanol | Reducing agent; breaks disulfide bonds [4] [28] | Primarily SDS-PAGE (reducing conditions) [4] |
| Coomassie G-250 | Imparts charge to proteins for separation [3] | Blue Native PAGE (BN-PAGE) [4] [3] |
| Polyacrylamide | Forms sieving matrix with controllable pore sizes [4] | Both SDS-PAGE and Native PAGE [4] |
| MOPS/Tris Buffer | Maintains pH for protein separation [3] | SDS-PAGE running buffer [3] |
| BisTris/Tricine Buffer | Maintains pH under non-denaturing conditions [3] | Native PAGE running buffer [3] |
| Glycerol | Increases sample density; prevents diffusion from wells [2] | Both SDS-PAGE and Native PAGE [3] |
| PF-127 Thermal Gel | Temperature-responsive separation matrix [58] | Advanced microfluidic native protein separation [58] |
Experimental Protocols for Optimal Resolution
SDS-PAGE Optimization Protocol
Sample Preparation:
- Mix protein sample with SDS-containing loading buffer (e.g., LDS sample buffer) [3].
- Add reducing agent (DTT or β-mercaptoethanol) to final concentration of 50-100mM for reduced conditions [4] [28].
- Heat samples at 70-100°C for 5-10 minutes to ensure complete denaturation [4] [3].
Gel Electrophoresis:
- Use precast or freshly cast polyacrylamide gels with appropriate percentage for target protein size range [28].
- Load samples and molecular weight standards into wells.
- Set power supply to constant current mode [56].
- Run at 50-60V until samples leave wells and enter resolving gel (approximately 30 minutes) [57].
- Increase to 100-150V for mini-gels or 200-300V for larger formats until dye front reaches gel bottom [56] [57].
- Monitor temperature throughout run; implement cooling if band smiling occurs [57].
Native PAGE Optimization Protocol
Sample Preparation:
- Mix protein sample with non-denaturing loading buffer without SDS or reducing agents [4] [3].
- Do not heat samples to preserve native conformation [4].
Gel Electrophoresis:
- Use pre-cast Native PAGE gels or cast gels without SDS [3].
- Load samples and native protein standards.
- Assemble electrophoresis apparatus in cold room or with cooling unit [4].
- Set power supply to maintain approximately 150V constant voltage [3].
- Run for 90-95 minutes or until dye front migrates to gel bottom [3].
- Maintain temperature at 4°C throughout separation [4] [3].
Data Collection and Analysis
For SDS-PAGE, protein bands are typically visualized using Coomassie Blue, silver staining, or fluorescent dyes after fixation [4]. Molecular weights are estimated by comparing migration distances to standard curves generated from protein ladders [4] [28]. For Native PAGE, the same staining methods apply, but molecular weight determination is less straightforward due to the influence of protein charge and shape on mobility [4]. Activity stains may be employed for enzymatic proteins to confirm functional preservation [3]. Densitometric analysis of band intensities provides quantitative data for both methods, though CE-SDS offers superior quantitation through direct UV detection and peak integration [14].
The optimal adjustment of voltage, temperature, and run time parameters in protein electrophoresis requires distinct strategies for SDS-PAGE versus Native PAGE, driven by their different separation mechanisms and application goals. SDS-PAGE benefits from higher voltages and constant current operation, with careful attention to heat management to prevent band distortion while maintaining denaturation [56] [57]. Native PAGE demands lower temperatures (4°C) and moderated voltages to preserve protein structure and function throughout the longer separation process [4] [3]. Emerging technologies including CE-SDS, NSDS-PAGE, and microfluidic TG-tITP offer enhanced resolution, reproducibility, and quantitative capabilities for both denaturing and native protein analyses [14] [3] [58]. By understanding these fundamental principles and optimization strategies, researchers can select the most appropriate electrophoretic method and parameters for their specific protein characterization needs in basic research and biopharmaceutical development.
In the realm of protein separation science, the choice between Native PAGE and SDS-PAGE represents a fundamental trade-off between preserving native protein function and achieving high-resolution denaturing separation. SDS-PAGE, which uses the anionic detergent sodium dodecyl sulfate to denature proteins, separates polypeptides primarily by molecular weight, masking intrinsic charge and disrupting higher-order structures [5] [39] [1]. In contrast, Native PAGE employs non-denaturing conditions, separating proteins based on their combined native charge, size, and shape while maintaining their folded conformation, biological activity, and protein complex integrity [5] [2] [1]. This guide addresses the critical technical challenges of Native PAGE, providing researchers with proven methodologies to maintain protein stability and activity throughout the electrophoretic process.
Fundamental Principles and Comparative Analysis of PAGE Techniques
Understanding the core differences between Native PAGE and SDS-PAGE is essential for selecting the appropriate technique and troubleshooting effectively. The following table summarizes the key distinguishing characteristics:
Table 1: Fundamental comparison between Native PAGE and SDS-PAGE
| Characteristic | Native PAGE | SDS-PAGE |
|---|---|---|
| Separation Basis | Native charge, size, and 3D shape [1] | Molecular weight [39] [1] |
| Gel Conditions | Non-denaturing, no SDS [2] | Denaturing, contains SDS [39] |
| Protein Structure | Maintains native conformation, quaternary structures, and protein complexes [5] [1] | Denatures proteins into linear polypeptides; disrupts quaternary structures [5] [39] |
| Biological Activity | Enzymatic activity and protein-protein interactions are typically retained [1] | Biological activity is destroyed [5] [2] |
| Protein Recovery | Proteins can often be recovered in active form for downstream assays [2] [1] | Recovered proteins are denatured and inactive [2] |
| Primary Applications | Studying native protein complexes, oligomerization, conformational changes, and enzymatic activity [5] [1] | Determining molecular weight, assessing purity, analyzing subunit composition [5] [39] |
Critical Challenges in Native PAGE and Targeted Solutions
Challenge 1: Loss of Protein Activity and Structural Integrity
A primary challenge is that the native protein structure is vulnerable to disruption during electrophoresis, which can lead to loss of activity.
- Solution: Optimize Buffer Composition and Electrophoresis Conditions
- Avoid Denaturing Agents: Crucially, exclude SDS, reducing agents like β-mercaptoethanol, and other denaturants from all buffers [2] [1].
- Maintain Cool Temperatures: Run electrophoresis in a cold room or using a cooled apparatus to minimize heat-induced denaturation and proteolysis [1].
- Avoid pH Extremes: Use buffers within a physiological pH range to prevent irreversible protein damage, denaturation, or aggregation [1].
Challenge 2: Poor Resolution and Band Sharpness
Without SDS to impart a uniform charge, separation depends on the protein's intrinsic properties, which can lead to diffuse bands or poor resolution.
- Solution: Employ High-Resolution Native Techniques
- High-Resolution Clear Native PAGE (hrCN-PAGE): This method provides superior separation of native protein complexes and active enzymes. It was successfully used to separate and analyze different active forms of medium-chain acyl-CoA dehydrogenase (MCAD), revealing insights into pathogenic variants [7].
- Blue Native PAGE (BN-PAGE): Coomassie G-250 dye is added to the cathode buffer, imparting a slight negative charge to proteins and improving resolution while largely maintaining native state [3]. This technique is particularly valuable for analyzing membrane protein complexes and supercomplexes [7].
- Gradient Gels: Use gels with a gradient of polyacrylamide (e.g., 4-16%) to resolve a broader range of protein sizes and complexes within a single gel [7] [39].
Challenge 3: In-Gel Activity Staining for Specific Detection
While Coomassie and silver staining can visualize total protein, confirming the retention of enzymatic activity requires specialized functional assays.
- Solution: Implement In-Gel Activity Assays
- Principle: These assays couple the enzyme's catalytic reaction to the production of an insoluble, colored precipitate at the site of activity within the gel [7].
- Protocol for Oxidoreductases (e.g., MCAD): After hrCN-PAGE, incubate the gel in a reaction mixture containing the physiological substrate (e.g., octanoyl-CoA) and an electron acceptor like nitro blue tetrazolium (NBT). NBT is reduced to an insoluble purple diformazan precipitate at the site of active enzyme, allowing direct visualization of functional protein bands [7].
- Advantages: This method enables researchers to distinguish between active tetramers and inactive aggregate or fragment forms of a protein, providing crucial functional insights that standard denaturing methods cannot offer [7].
Essential Reagents and Materials for Native PAGE
Table 2: Key research reagent solutions for Native PAGE
| Reagent/Material | Function/Purpose | Key Considerations |
|---|---|---|
| Acrylamide/Bis-acrylamide | Forms the porous gel matrix for size-based separation [1] | Adjust concentration (4-16%) to optimize resolution for target protein size [7] |
| Non-denaturing Detergents | Solubilizes membrane proteins without denaturation | Use mild detergents like digitonin or dodecyl maltoside for BN-PAGE [7] |
| Coomassie G-250 | Imparts charge for BN-PAGE; staining | Used in cathode buffer for BN-PAGE; at lower concentrations in sample buffer for NSDS-PAGE [3] |
| Native-Compatible Buffers | Maintains pH and conducts current | Tris-glycine, Bis-Tris are common; avoid EDTA which can chelate metal cofactors [3] [1] |
| Substrate for Activity Stains | Specific substrate for the target enzyme | Enables functional detection (e.g., octanoyl-CoA for MCAD) [7] |
| Electron Acceptors (e.g., NBT) | Visualizing agent for oxidoreductase activity | Forms colored precipitate upon reduction [7] |
| Protease Inhibitors | Prevents protein degradation during sample preparation | Essential for maintaining protein integrity [3] |
Advanced Applications and Methodological Variations
Native SDS-PAGE (NSDS-PAGE): A Hybrid Approach
A modified technique called Native SDS-PAGE (NSDS-PAGE) demonstrates that complete denaturation is not always necessary for good resolution. By drastically reducing SDS concentration in the running buffer (to 0.0375%) and eliminating heating and EDTA from sample preparation, this method achieves high-resolution separation while preserving the native state and function for many proteins [3]. In validation studies, seven of nine model enzymes, including four zinc metalloproteins, retained activity after NSDS-PAGE, and zinc retention in proteomic samples increased from 26% (standard SDS-PAGE) to 98% [3].
Comparative Analysis of Complex Biological Samples
Research comparing 1D SDS-PAGE with nondenaturing 2DE for analyzing human bronchial smooth muscle cells highlights the complementary nature of denaturing and native techniques. While SDS-PAGE-MS was advantageous for comparative quantification, nondenaturing 2DE-MS was superior for visualizing native protein interactions and complexes, identifying over 600 membrane proteins that showed higher abundance compared to the denaturing method [54].
Visual Guide: Native PAGE Experimental Workflow
The following diagram illustrates the key steps in a Native PAGE workflow, highlighting critical decision points for maintaining protein activity.
Successful Native PAGE requires a meticulous, functionality-focused approach at every stage, from sample preparation through detection. By understanding the core principles, implementing optimized protocols for buffer composition and electrophoresis conditions, and employing targeted detection methods like in-gel activity assays, researchers can effectively overcome the challenges of maintaining protein stability and activity. The choice between Native PAGE and SDS-PAGE should be guided by the experimental objective: Native PAGE for function, interactions, and native structure; SDS-PAGE for subunit molecular weight, purity, and composition. Mastering these techniques provides a powerful toolkit for probing the intricate relationship between protein structure and function in biochemical research and drug development.
Gel Polymerization Problems and Their Impact on Resolution Quality
In the field of protein biochemistry, polyacrylamide gel electrophoresis (PAGE) serves as a fundamental tool for separating and analyzing complex protein mixtures. The quality of this separation hinges on a critical first step: successful gel polymerization. This process transforms liquid acrylamide solutions into a solid, porous matrix that acts as a molecular sieve. When polymerization fails or is suboptimal, the resulting structural imperfections in the gel directly compromise resolution quality, leading to distorted protein bands, poor separation, and unreliable experimental data [39].
Understanding and troubleshooting gel polymerization issues is particularly crucial when comparing the two primary electrophoretic techniques: SDS-PAGE and Native PAGE. While SDS-PAGE denatures proteins and separates them primarily by molecular weight, Native PAGE preserves protein structure, function, and complex interactions, separating molecules based on both size and charge [4] [2] [5]. These different objectives demand specific gel properties, making the polymerization process a key variable in achieving optimal resolution for each method. This guide systematically addresses common polymerization challenges, their distinct impacts on both techniques, and evidence-based solutions for maintaining high-resolution separation.
Fundamentals of Gel Polymerization
The formation of a polyacrylamide gel involves a free radical-driven polymerization reaction between acrylamide monomers and a cross-linking agent, typically N,N'-methylenebisacrylamide (Bis-acrylamide). This reaction is catalyzed by ammonium persulfate (APS), which provides the free radicals, and tetramethylethylenediamine (TEMED), which accelerates the radical formation [39]. The precise ratio of these components determines the gel's pore size, mechanical strength, and ultimately, its sieving properties.
The Polymerization Process and Gel Structure
- Acrylamide/Bis-acrylamide Ratio: Determines the gel's pore size matrix. A higher percentage of acrylamide creates a denser matrix with smaller pores, ideal for separating lower molecular weight proteins. Conversely, a lower percentage creates larger pores for better separation of high molecular weight proteins [39].
- Catalyst System (TEMED/APS): These catalysts initiate and propagate the chain reaction. Their concentration and freshness are paramount; degraded APS or TEMED will result in incomplete or failed polymerization [39] [59].
- Oxygen Inhibition: Atmospheric oxygen is a potent inhibitor of the free radical polymerization process. Inadequate sealing during gel casting can allow oxygen to penetrate, preventing gel formation or creating a soft, uneven gel surface [39].
The diagram below illustrates the workflow for identifying and resolving common gel polymerization problems.
Figure 1: Troubleshooting workflow for common gel polymerization problems, linking symptoms to causes and solutions.
Common Gel Polymerization Problems and Their Impact on Resolution
Gel polymerization issues manifest in several ways, each with a direct and detrimental effect on the electrophoretic resolution. The following table summarizes the primary problems, their causes, and their specific consequences for protein separation quality.
Table 1: Common Gel Polymerization Problems, Causes, and Impacts on Resolution
| Problem | Primary Causes | Impact on Resolution Quality |
|---|---|---|
| Incomplete Polymerization [39] | Old/degraded APS or TEMED; Insufficient catalyst concentration; Oxygen inhibition. | Soft, mushy gels that tear easily; Poor band sharpness and smiling/frowning bands; Variable pore size leading to distorted migration. |
| Over-Polymerization [59] | Excessive TEMED/APS; Polymerization at high temperatures. | Brittle gels that crack easily; Non-parallel bands; Poor protein separation due to irregular pore structure. |
| Air Bubbles [39] | Improper pouring technique; Failure to degas acrylamide solution. | Distorted protein bands that curve around bubbles; Uneven migration and loss of resolution in affected lanes. |
| Gel Leakage [59] | Improperly assembled gel cassettes; Worn or damaged spacers; Fast polymerization causing "weeping". | Incomplete separation as proteins run out of the gel; Abrupt dye fronts and loss of lower molecular weight proteins. |
| Irregular Gel Surface [59] | Comb insertion after polymerization has begun; Uneven sealing during casting. | Distorted well shapes causing uneven sample loading; Smiling or frowning bands across the gel. |
Differential Impact on SDS-PAGE vs. Native PAGE
While polymerization defects are detrimental to both techniques, their specific impacts can differ due to the distinct separation principles.
Impact on SDS-PAGE Resolution: In SDS-PAGE, where separation is based purely on molecular mass through a denatured gel matrix [4] [39], incomplete polymerization directly destroys the precise molecular sieving effect. This leads to inaccurate molecular weight estimation and an inability to distinguish closely sized proteins [39]. Over-polymerization can create pores that are too small or irregular, trapping larger proteins or causing anomalous migration.
Impact on Native PAGE Resolution: Native PAGE relies on both the protein's inherent charge and its size and shape in its native state [4] [5]. A gel with irregular pore structure from poor polymerization will not only impede migration based on size but can also mask charge-based separation. This is critical when the objective is to study functional properties like enzyme activity or protein-protein interactions, as the native conformation must be preserved throughout migration [3] [5].
Experimental Comparison: Resolving Power and Artifacts
The direct correlation between gel quality and resolution can be demonstrated through controlled experiments. The following table summarizes key experimental findings that highlight how polymerization quality affects the final separation data in SDS-PAGE and Native PAGE.
Table 2: Experimental Data on Polymerization Quality Impact on Protein Separation
| Experimental Variable | Separation Outcome (SDS-PAGE) | Separation Outcome (Native PAGE) | Key Metric Affected |
|---|---|---|---|
| Optimal Polymerization [3] | Sharp, well-defined bands; Linear log(MW) vs. migration. | Clear separation of active enzymes; Retention of metal cofactors (98% Zn²âº). | Band Sharpness, Functional Activity Recovery |
| High TEMED (Fast Set) [59] | "Webbing" between wells; Distorted bands near top. | N/A | Well Integrity, Band Distortion |
| Degraded APS [39] | Diffuse, smeared bands; Poor separation of similar MW proteins. | Loss of oligomeric complex resolution; Unreliable charge-based separation. | Resolution of Similar Proteins, Complex Composition |
| Gel Leakage [59] | Loss of low MW proteins; Incomplete separation. | Incomplete migration of protein complexes; Failed activity assays. | Separation Completeness, Functional Assay Success |
Detailed Experimental Protocol for Assessing Gel Quality
To systematically evaluate the impact of polymerization on resolution, the following protocol can be employed, adapted from standard SDS-PAGE and Native PAGE methodologies [3] [39].
A. Reagent Preparation:
- Acrylamide/Bis-acrylamide Solution: Standard 30% stock, 29:1 ratio.
- Ammonium Persulfate (APS): 10% (w/v) solution in deionized water, prepared fresh.
- TEMED: Stored as provided at 4°C.
- SDS-PAGE Sample Buffer (2X): 100 mM Tris HCl (pH 6.8), 4% (w/v) SDS, 0.2% (w/v) bromophenol blue, 20% (v/v) glycerol. For reducing conditions, add 200 mM DTT [28] [39].
- Native PAGE Sample Buffer (4X): 100 mM Tris HCl, 150 mM Tris Base, 10% (v/v) glycerol, 0.0185% Coomassie G-250, pH 8.5 [3].
- Running Buffer (SDS-PAGE): 50 mM MOPS, 50 mM Tris Base, 0.1% SDS, 1 mM EDTA, pH 7.7 [3].
- Running Buffer (Native PAGE): Cathode Buffer: 50 mM BisTris, 50 mM Tricine, 0.02% Coomassie G-250, pH 6.8; Anode Buffer: 50 mM BisTris, 50 mM Tricine, pH 6.8 [3].
B. Gel Casting with Controlled Variables:
- Control Gel: Use fresh APS and TEMED at standard concentrations (e.g., 0.05% APS, 0.1% TEMED). Pour gel carefully and seal with water-saturated butanol to prevent oxygen inhibition.
- Test Gel 1 (Degraded Catalysts): Use a 4-week-old APS solution. Note the delayed polymerization time.
- Test Gel 2 (High TEMED): Double the standard concentration of TEMED to force rapid, exothermic polymerization.
C. Electrophoresis and Analysis:
- Load a pre-stained protein molecular weight marker and a well-characterized protein sample (e.g., 5 µg BSA) on both control and test gels.
- Run SDS-PAGE at constant 200V for 40-60 minutes [39]. Run Native PAGE at 150V for 90-95 minutes [3].
- After electrophoresis, stain with Coomassie Blue, silver stain, or perform in-gel activity assays for Native PAGE [3].
- Analyze gel images for band sharpness, straightness, and resolution between adjacent protein bands.
The Scientist's Toolkit: Essential Reagent Solutions
Successful polymerization and high-resolution electrophoresis depend on the quality and proper use of specific reagents. The following table details these essential materials and their functions.
Table 3: Essential Research Reagents for Optimal Gel Polymerization and Electrophoresis
| Reagent/Material | Function | Critical Consideration for Resolution |
|---|---|---|
| Acrylamide/Bis-acrylamide [39] | Forms the cross-linked polymer matrix that acts as a molecular sieve. | Ratio and concentration determine pore size; impurities cause background streaking. |
| Ammonium Persulfate (APS) [39] | Initiates the free-radical polymerization reaction. | Must be fresh; old APS leads to incomplete polymerization and soft gels. |
| TEMED [39] [59] | Catalyzes the formation of free radicals from APS, accelerating polymerization. | Concentration affects polymerization speed; too much causes brittleness and weeping. |
| High-Purity Water [39] | Solvent for all gel components and buffers. | Ionic or organic impurities can inhibit polymerization or create artifactual bands. |
| Tris Buffers [3] [39] | Provides the required pH environment for polymerization and electrophoresis. | Incorrect pH alters protein charge and mobility, affecting separation accuracy. |
| SDS (Sodium Dodecyl Sulfate) [3] [39] | (For SDS-PAGE) Denatures proteins and confers uniform negative charge. | Inconsistent quality or concentration leads to incomplete denaturation and poor MW-based separation. |
| Coomassie Dye (G-250) [3] | (For BN-PAGE/NSDS-PAGE) Imparts charge for protein migration without full denaturation. | Allows for high-resolution separation while maintaining protein function. |
Gel polymerization is a foundational step that dictates the success of both SDS-PAGE and Native PAGE methodologies. As demonstrated, common problems—from incomplete polymerization due to aged catalysts to structural defects from rapid setting—have direct, measurable, and technique-specific impacts on resolution quality. For researchers, a rigorous approach to reagent preparation, gel casting, and troubleshooting is non-negotiable. By understanding the underlying causes of these artifacts and implementing the systematic solutions and experimental controls outlined in this guide, scientists can ensure their electrophoretic data is reliable, reproducible, and of the highest resolution, thereby strengthening downstream analyses and conclusions in drug development and basic research.
Data Interpretation and Technique Selection: Validating Results and Choosing the Right Method
This guide provides an objective comparison of sodium dodecyl sulfate–polyacrylamide gel electrophoresis (SDS-PAGE) and native PAGE by examining a real-world case study where the same protein exhibits different migration patterns across these techniques. The analysis focuses on the Medium-Chain specific acyl-CoA Dehydrogenase (MCAD) enzyme, demonstrating how these migration differences provide distinct but complementary biological insights [7]. For researchers and drug development professionals, understanding these interpretations is crucial for selecting the appropriate analytical method based on specific research objectives, whether for determining molecular weight, studying oligomeric states, or investigating functional protein properties.
Protein electrophoresis is a foundational laboratory technique where charged protein molecules move through a matrix under an electrical field, enabling separation based on physical properties like size, charge, and shape [60]. The polyacrylamide gel acts as a molecular sieve, with its pore size controlled by the concentration of acrylamide and bisacrylamide. While several PAGE variants exist, SDS-PAGE and native PAGE represent two fundamental approaches with contrasting methodologies and applications.
SDS-PAGE employs the ionic detergent sodium dodecyl sulfate (SDS) and a reducing agent to denature proteins into linear polypeptides. SDS binds uniformly to the polypeptide backbone, masking intrinsic charge and creating a uniform charge-to-mass ratio. Consequently, separation occurs primarily by molecular mass, with smaller polypeptides migrating faster through the gel matrix [5] [10] [60]. This makes it ideal for determining molecular weight, assessing purity, and analyzing subunit composition.
In contrast, native PAGE separates proteins in their folded, functional state without denaturants. Separation depends on the protein's intrinsic charge, size, and three-dimensional shape. This preservation of native structure allows for the study of protein complexes, oligomerization, and functional activities like enzyme function post-separation [5] [60]. However, the migration pattern is more complex as it does not correlate directly with molecular weight alone.
Table 1: Core Principles of SDS-PAGE vs. Native PAGE
| Feature | SDS-PAGE | Native PAGE |
|---|---|---|
| Protein State | Denatured and linearized [5] | Native, folded structure [5] |
| Primary Separation Basis | Molecular mass of polypeptides [60] | Net charge, size, and shape of native structure [60] |
| Sample Treatment | Heated with SDS and reducing agents (e.g., β-mercaptoethanol) [10] | Mixed with non-denaturing buffer; no heating [3] |
| Key Applications | Molecular weight determination, purity assessment, western blotting [5] [3] | Analysis of oligomeric state, protein-protein interactions, in-gel activity assays [5] [7] |
| Impact on Function | Disrupts quaternary/tertiary structure; destroys activity [5] [3] | Preserves biological activity and subunit interactions [5] [60] |
Experimental Protocols for Key Techniques
Standard SDS-PAGE Protocol
The following discontinuous SDS-PAGE method is widely used for high-resolution separation based on polypeptide size [10].
- Gel Preparation: A polyacrylamide gel is cast between two glass plates. The gel has two distinct regions: a stacking gel (low acrylamide concentration, ~4%, pH ~6.8) and a resolving gel (higher acrylamide concentration, e.g., 10-12%, pH ~8.8). The discontinuous buffer system is a key feature that concentrates the protein samples into sharp bands before they enter the resolving gel, thereby enhancing resolution [61]. Polymerization is catalyzed by ammonium persulfate (APS) and TEMED [10] [60].
- Sample Preparation: Protein samples are mixed with an SDS-containing sample buffer (often including Tris-HCl, glycerol, bromophenol blue, and a reducing agent like dithiothreitol (DTT) or β-mercaptoethanol) and heated to 95°C for 5 minutes [10]. This heat-denaturation step unfolds the proteins and allows SDS to bind uniformly.
- Electrophoresis: Samples are loaded into the gel wells. The gel apparatus is filled with a running buffer (e.g., Tris-glycine-SDS). A voltage of 100-200V is applied, causing the negatively charged SDS-protein complexes to migrate toward the anode. Electrophoresis is typically complete in 30-90 minutes, depending on the gel size and voltage [10] [3].
- Post-Electrophoresis Analysis: Proteins in the gel are visualized by staining (e.g., Coomassie Brilliant Blue) or transferred to a membrane for western blotting [10].
High-Resolution Native PAGE for In-Gel Activity Assays
This protocol, adapted from a 2025 Scientific Reports study, details how to separate native proteins and directly assess their enzymatic activity within the gel [7].
- Gel Preparation: A high-resolution clear native polyacrylamide gel (hrCN-PAGE) is poured. The study used a 4-16% gradient gel to separate a wide range of protein complexes. Notably, the gel and running buffers lack SDS and other denaturants [7].
- Sample Preparation: Protein samples (e.g., recombinant MCAD or mitochondrial-enriched fractions) are mixed with a non-denaturing sample buffer. The buffer typically contains Tris, glycerol for density, and a tracking dye. The sample is not heated [7] [3].
- Electrophoresis: Samples are loaded, and electrophoresis is performed under constant voltage at 4°C to maintain protein stability. The running buffer is tailored to maintain a pH that preserves protein function.
- In-Gel Activity Staining: Following electrophoresis, the gel is incubated in a reaction mixture containing the enzyme's substrate (e.g., octanoyl-CoA for MCAD) and a colorimetric electron acceptor like Nitro Blue Tetrazolium (NBT). Active enzyme oxidizes the substrate, reducing NBT to an insoluble, purple diformazan precipitate that forms a band at the enzyme's location. This allows direct visualization and quantification of active protein species [7].
Case Study: MCAD Analysis by SDS-PAGE and Native PAGE
The analysis of Medium-Chain acyl-CoA Dehydrogenase (MCAD) provides a compelling case study of how the same protein can yield dramatically different—and highly informative—results when analyzed by SDS-PAGE versus native PAGE.
Protein System and Biological Context
MCAD is a mitochondrial homotetrameric flavoprotein that catalyzes the first step in the beta-oxidation of fatty acids [7]. Each monomer has a theoretical mass of ~46.6 kDa, and the functional native complex is a tetramer of approximately 177.7 kDa containing one flavin adenine dinucleotide (FAD) cofactor per monomer. Pathogenic variants in the ACADM gene can lead to MCAD deficiency (MCADD), a metabolic disorder. Some variants impair enzymatic activity, while others destabilize the interactions between subunits, leading to protein aggregation or the breakdown of the tetramer into inactive lower-order forms [7].
Experimental Data and Migration Patterns
When MCAD wild-type and variants (e.g., p.Y67H, p.R206C, p.K329E) were analyzed, the two electrophoretic methods yielded distinct data.
- SDS-PAGE Analysis: Under denaturing conditions, all MCAD variants (p.Y67H, p.R206C, p.K329E) showed a single band at the same position, corresponding to the monomeric molecular mass of ~46 kDa [7]. This confirmed that the differences observed in native gels were not due to changes in the monomer's molecular weight.
- Native PAGE Analysis: Under non-denaturing conditions, clear differences emerged [7]:
- The wild-type MCAD and the p.Y67H variant showed a predominant band at an apparent mass consistent with the active tetramer.
- The p.K329E and p.R206C variants showed a main band for the tetramer but also exhibited additional, less intense bands at lower molecular masses, suggesting fragmentation of the tetramer into inactive sub-complexes.
- Notably, the main tetramer band of the p.R206C variant migrated 5 mm farther than the wild-type tetramer, indicating a conformational change that altered its charge or shape, despite having the same mass.
Table 2: Comparative Migration Patterns of MCAD Variants
| MCAD Variant | SDS-PAGE Result | Native PAGE Result | Biological Interpretation |
|---|---|---|---|
| Wild-Type | Single band at ~46 kDa [7] | Single, active band at tetramer position [7] | Stable, properly assembled homotetramer. |
| p.Y67H | Single band at ~46 kDa [7] | Single, active band at tetramer position [7] | Stable tetramer assembly is not impaired. |
| p.R206C | Single band at ~46 kDa [7] | - Main band at altered position (conformational change) [7]- Lower-mass bands (fragmentation) [7]- Lower overall activity [7] | Variant disrupts quaternary structure, leading to inactive sub-complexes and a misshapen tetramer. |
| p.K329E | Single band at ~46 kDa [7] | - Main tetramer band [7]- Lower-mass, inactive bands [7] | Variant destabilizes tetramer, causing partial dissociation into inactive forms. |
Interpretation of Divergent Migration Patterns
The different migration patterns for the same MCAD variant are not contradictory but reveal different layers of structural information.
- SDS-PAGE reveals primary structure integrity: The identical migration of all variants in SDS-PAGE indicates that the point mutations do not cause major changes in the polypeptide's molecular weight. The technique confirms that the monomers are produced and are of the correct size.
- Native PAGE reveals quaternary structure and stability: The presence of lower-mass bands for p.R206C and p.K329E in native gels provides direct evidence that these pathogenic mutations destabilize the homotetramer, causing it to fall apart into dimers or monomers. Furthermore, the altered migration of the p.R206C tetramer itself suggests a significant conformational change that affects its surface charge or hydrodynamic radius, a detail completely invisible in SDS-PAGE.
- Correlating structure with function: The in-gel activity assay was pivotal. It showed that while the main tetramer bands of the variants were still active, the lower-mass sub-complexes were not, directly linking structural instability to a loss of function in the pathogenic variants [7]. This functional data is impossible to obtain from a denaturing SDS-PAGE gel.
Comparative Performance Data and Emerging Alternatives
Resolution and Application-Based Comparison
Beyond the MCAD case study, broader comparisons highlight the performance characteristics of each technique.
Table 3: Performance Comparison for Proteomic Analysis
| Performance Metric | SDS-PAGE | Native PAGE |
|---|---|---|
| Number of Proteins Assigned (HBSMC Supernatant) | 2,552 proteins [54] | 4,323 proteins [54] |
| Advantage in Quantitative Comparison | Advantageous for visualizing quantity differences between samples [54] | Less effective for direct quantitative comparison between different samples [54] |
| Advantage in Protein Interaction Analysis | Disrupts non-covalent interactions; not suitable [5] [54] | Advantageous in visualizing protein interactions and complexes [54] |
| Compatibility with Downstream MS | Excellent for protein identification after digestion [5] | Compatible, provides information on native complexes [54] |
Evolution and Complementary Techniques
Technological advancements have led to new separation methods that build upon the principles of traditional PAGE.
- Capillary Electrophoresis-SDS (CE-SDS): This automated technology replaces slab gels with capillaries, offering higher resolution, superior reproducibility, quantitative precision, and reduced toxic waste compared to SDS-PAGE. It is widely adopted in biopharmaceutical development for the analysis of antibodies and other biologics [14].
- Native SDS-PAGE (NSDS-PAGE): A hybrid approach modifies standard SDS-PAGE conditions by removing EDTA, reducing SDS concentration, and omitting the heating step. This method aims to bridge the gap between the two techniques, resulting in high-resolution separation while retaining Zn²⺠cofactors and enzymatic activity in several model proteins [3].
The Scientist's Toolkit: Essential Research Reagents
Successful electrophoresis requires specific reagents and equipment. The following table details key solutions and materials used in the featured experiments.
Table 4: Key Research Reagent Solutions for PAGE
| Reagent / Material | Function / Description | Example from Case Study |
|---|---|---|
| Sodium Dodecyl Sulfate (SDS) | Ionic detergent that denatures proteins and confers uniform negative charge [10]. | Used in SDS-PAGE sample buffer and running buffer [10]. |
| Dithiothreitol (DTT) | Reducing agent that breaks disulfide bonds to fully denature proteins [10]. | Added to SDS-PAGE sample buffer [10]. |
| Acrylamide/Bis-acrylamide | Monomer and crosslinker that polymerize to form the porous gel matrix [60]. | Used to cast both SDS and native polyacrylamide gels [60]. |
| TEMED & Ammonium Persulfate (APS) | Catalyst and initiator to drive the free-radical polymerization of acrylamide gels [10] [60]. | Added to gel solutions immediately before casting [60]. |
| Nitro Blue Tetrazolium (NBT) | Colorimetric electron acceptor; reduces to purple formazan precipitate in active enzyme bands [7]. | Used in the in-gel activity stain for MCAD after native PAGE [7]. |
| Coomassie Brilliant Blue | Protein stain that binds nonspecifically to proteins, enabling visualization after electrophoresis [10]. | Used to stain and visualize total protein in gels for both techniques [7] [54]. |
| High-Resolution Clear Native Gels | Pre-cast gradient gels optimized for separating native protein complexes without denaturants [7]. | 4-16% gels used for separation of MCAD tetramers and sub-complexes [7]. |
The case of MCAD analysis clearly demonstrates that the "different migration patterns for the same protein" are not a technical artifact but a powerful feature of protein electrophoresis. SDS-PAGE provides information on the denatured polypeptide's mass, while native PAGE reveals the behavior, stability, and activity of the native protein complex.
For researchers and drug development professionals, the choice of technique should be driven by the biological question:
- Choose SDS-PAGE for determining molecular weight, assessing purity, analyzing subunit composition, or when subsequent western blotting is required.
- Choose native PAGE when investigating oligomeric state, protein-protein interactions, conformational changes, or when preserving enzymatic activity for functional assays is essential.
As evidenced by the MCAD study, employing both techniques in a complementary manner provides the most comprehensive understanding of a protein's structural and functional integrity, which is particularly crucial when characterizing the biophysical impact of disease-associated genetic variants.
In protein science, understanding quaternary structure—the assembly of multiple polypeptide chains into a functional oligomeric complex—is fundamental to elucidating biological function. Polyacrylamide gel electrophoresis (PAGE) serves as a cornerstone technique for this purpose, primarily through two principal methodological approaches: native PAGE and SDS-PAGE. These techniques offer complementary insights, with native PAGE preserving protein complexes in their biologically active state, while SDS-PAGE denatures proteins into their constituent subunits for mass-based separation [5] [1]. The choice between these techniques is not merely procedural but fundamentally shapes the type of structural information obtained, making understanding their distinct capabilities essential for researchers investigating oligomeric states and protein complex composition.
This guide provides a comprehensive comparison of these electrophoretic techniques, focusing on their resolution performance in quaternary structure analysis. We present experimental data, detailed methodologies, and analytical workflows to equip researchers with the practical knowledge needed to select the appropriate technique for their specific structural biology applications, particularly in drug development where understanding protein interactions is crucial for therapeutic targeting.
Technical Comparison: Separation Principles and Capabilities
The fundamental distinction between native PAGE and SDS-PAGE lies in their treatment of protein structure. Native PAGE employs non-denaturing conditions, preserving the delicate three-dimensional architecture of proteins, including non-covalent bonds and protein-cofactor interactions [5] [1]. This allows separation based on a combination of intrinsic charge, hydrodynamic size, and molecular shape, enabling the analysis of functional oligomeric states [12] [1]. In contrast, SDS-PAGE utilizes the anionic detergent sodium dodecyl sulfate (SDS) to denature proteins, masking intrinsic charge and unraveling secondary and tertiary structures into uniform linear chains. This results in separation driven primarily by molecular mass rather than native properties [5] [39].
Table 1: Fundamental Characteristics of Native PAGE vs. SDS-PAGE
| Feature | Native PAGE | SDS-PAGE |
|---|---|---|
| Separation Principle | Charge, size, and shape [1] | Molecular mass [1] |
| Protein State | Native, folded [5] | Denatured, linearized [5] |
| Quaternary Structure | Preserved [1] | Disrupted [5] |
| Biological Activity | Retained [1] | Lost [5] |
| Key Reagents | Non-denaturing buffers [1] | SDS, reducing agents [39] |
| Primary Application | Studying oligomeric states, complexes, and function [5] | Determining subunit molecular weight, purity [5] |
The practical implications of these differing separation principles are significant for structural analysis. Because native PAGE maintains subunit interactions, a single protein complex migrates as a single band corresponding to the mass of the entire oligomer [1]. For example, a homotetrameric protein with 50 kDa subunits would migrate as an approximately 200 kDa complex in native PAGE, whereas in SDS-PAGE, it would dissociate into four individual bands each migrating near 50 kDa [7]. This makes native PAGE indispensable for confirming oligomerization states and identifying interacting protein partners within stable complexes.
Performance Data and Experimental Evidence
Quantitative Resolution and Proteomic Analysis
Comparative studies using mass spectrometry (MS) for detection highlight the complementary strengths of each technique in proteomic applications. Research analyzing human bronchial smooth muscle cells (HBSMC) found that SDS-PAGE-MS of supernatant and precipitate fractions assigned approximately 2,600 proteins from each, demonstrating its robustness for comprehensive proteome coverage and comparative quantification [54]. In contrast, native 2DE-MS assigned 4,323 proteins from the supernatant fraction alone, suggesting that the isoelectric focusing step in the first dimension can enhance detection sensitivity for soluble proteins [54].
Critically, the same study revealed that native electrophoresis techniques are particularly advantageous for visualizing protein-protein interactions within cellular systems, as they preserve non-covalent complexes during separation [54]. SDS-PAGE, however, proved more effective for analyzing membrane-associated proteins in precipitate fractions and provided superior performance for comparative quantification between samples [54]. This underscores how the choice of electrophoretic technique directly influences the type and quality of structural information obtained in large-scale proteomic studies.
Case Study: Analyzing Pathogenic Variants in MCAD Deficiency
The practical application of high-resolution native PAGE was demonstrated in a 2025 study investigating Medium-chain acyl-CoA dehydrogenase (MCAD) deficiency [7]. MCAD functions as a mitochondrial homotetrameric flavoprotein, and pathogenic variants can destabilize this quaternary structure, leading to disease [7].
Researchers employed a high-resolution clear native PAGE (hrCN-PAGE) system with an in-gel activity assay to directly link oligomeric state to enzymatic function. The method separated different structural forms of MCAD (tetramers, aggregates, fragmented forms) while maintaining enzymatic activity, allowing specific quantification of active tetramers separately from other forms [7]. When applied to clinically relevant variants (p.Y67H, p.R206C, p.K329E), the assay revealed critical structural insights: while the p.Y67H variant migrated similarly to wild-type tetramers, the p.R206C variant exhibited a mobility shift to an apparent lower molecular mass in native gels despite normal migration in SDS-PAGE, indicating an altered conformation without changes in subunit mass [7]. Furthermore, the assay confirmed that lower molecular mass species in variants K329E and R206C were inactive, directly correlating structural destabilization with functional impairment [7].
Table 2: Experimental Findings from MCAD Variant Analysis Using Native PAGE
| MCAD Variant | Oligomeric State Observations | Enzymatic Activity | Structural Interpretation |
|---|---|---|---|
| Wild-Type | Single predominant band (~480 kDa) [7] | Active [7] | Stable homotetramer |
| p.Y67H | Similar migration to wild-type [7] | Active [7] | Preserved tetrameric structure |
| p.R206C | Altered mobility; lower mass species [7] | Reduced activity [7] | Conformational change; tetramer fragmentation |
| p.K329E | Lower mass species present [7] | Reduced activity [7] | Tetramer destabilization |
Advanced Technique: NSDS-PAGE for Balanced Resolution
To bridge the gap between high resolution and native state preservation, researchers have developed Native SDS-PAGE (NSDS-PAGE), a modified technique that reduces denaturant concentrations while maintaining good separation resolution [3]. This method eliminates SDS and EDTA from sample buffers, omits heating steps, and reduces SDS concentration in running buffers to 0.0375% [3].
The performance of NSDS-PAGE is notable: it increases Zn²⺠retention in metalloproteins from 26% (standard SDS-PAGE) to 98%, and seven of nine model enzymes tested retained activity following separation [3]. This hybrid approach demonstrates that strategic modification of standard protocols can yield a favorable balance of resolution and structural preservation, making it a valuable tool for analyzing metalloenzymes and other proteins where cofactor retention is essential.
Experimental Protocols for Quaternary Structure Analysis
Protocol 1: High-Resolution Clear Native PAGE (hrCN-PAGE) for Oligomeric State Analysis
This protocol, adapted from the MCAD deficiency study, is optimized for resolving native protein complexes and detecting in-gel activity [7].
- Gel Casting: Prepare a 4-16% gradient polyacrylamide gel using a high-resolution clear native buffer system (e.g., Bis-Tris-based system). The gradient gel accommodates a broad range of complex sizes [7].
- Sample Preparation: Dialyze purified protein samples into a compatible native buffer (e.g., 20 mM Tris-Cl, pH 7.4). Avoid denaturing agents, reducing agents, or high salt concentrations that could disrupt non-covalent interactions. For cell lysates, use mild non-ionic detergents if necessary and maintain physiological pH [7] [1].
- Electrophoresis: Load samples and run at constant voltage (e.g., 150-200V) at 4°C to maintain protein stability. Use cathode and anode buffers specified for clear native electrophoresis [7].
- In-Gel Activity Staining: Following electrophoresis, incubate the gel in activity stain solution containing natural substrate (e.g., octanoyl-CoA for MCAD) and an electron acceptor like nitro blue tetrazolium (NBT). Purple formazan precipitate indicates enzymatic activity at the location of the native protein complex [7].
- Validation: Run a parallel SDS-PAGE gel from the same sample to confirm subunit molecular weight and assess purity [7].
Protocol 2: NSDS-PAGE for Partial Denaturation Conditions
This protocol modifies traditional SDS-PAGE to retain certain native properties while maintaining good resolution [3].
- Gel Preparation: Use standard SDS-PAGE gels (e.g., 12% Bis-Tris). Pre-run the gel in ddHâ‚‚O for 30 minutes to remove storage buffers and unpolymerized acrylamide [3].
- Sample Buffer: Prepare 4X NSDS sample buffer (100 mM Tris HCl, 150 mM Tris base, 10% glycerol, 0.0185% Coomassie G-250, 0.00625% Phenol Red, pH 8.5). Omit SDS and EDTA. Do not heat samples [3].
- Running Buffer: Use modified running buffer containing 50 mM MOPS, 50 mM Tris Base, and reduced SDS concentration (0.0375%) [3].
- Electrophoresis: Load samples mixed with NSDS sample buffer and run at constant voltage (200V) for approximately 45 minutes at room temperature [3].
- Detection: Visualize proteins using Coomassie staining or transfer for western blotting. Enzymatic activity can be assessed by in-gel assays if applicable [3].
Research Reagent Solutions
The following reagents are essential for successful implementation of electrophoretic techniques for quaternary structure analysis.
Table 3: Essential Research Reagents for Native and SDS-PAGE
| Reagent/Category | Function/Purpose | Application Notes |
|---|---|---|
| Acrylamide/Bis-acrylamide | Forms porous gel matrix for separation [1] | Concentration determines pore size (e.g., 4-16% for native gradients) [7] |
| SDS (Sodium Dodecyl Sulfate) | Denatures proteins and confers uniform charge [39] | Used in SDS-PAGE; omitted or reduced in native/NSDS-PAGE [5] [3] |
| Non-ionic Detergents | Solubilizes membrane proteins without denaturation | Used in native PAGE sample preparation [1] |
| Coomassie G-250 | Anionic dye for protein visualization and charge conferral | Used in blue native PAGE; minimal in clear native PAGE [7] [3] |
| NBT (Nitro Blue Tetrazolium) | Electron acceptor for in-gel activity assays [7] | Forms purple precipitate upon reduction; indicates enzymatic activity [7] |
| TEMED/Ammonium Persulfate | Catalyzes acrylamide polymerization [1] | Essential for gel casting; concentrations affect polymerization rate [1] |
| Molecular Weight Markers | Calibrates gel for size estimation | Use native markers for native PAGE; denatured for SDS-PAGE [1] |
Workflow and Decision Pathways
The following workflow diagram illustrates the decision process for selecting the appropriate electrophoretic technique based on research objectives, particularly for quaternary structure analysis.
Native PAGE and SDS-PAGE serve as fundamentally complementary, rather than competing, techniques in the structural biologist's toolkit. For resolving oligomeric states and protein complex composition, native PAGE is the unequivocal method of choice, preserving the delicate quaternary structure and enabling functional analysis through in-gel activity assays [5] [7]. SDS-PAGE, while destroying higher-order structure, provides essential information about subunit composition, purity, and molecular weight [5] [39]. Advanced techniques like NSDS-PAGE [3] and high-resolution clear native PAGE [7] offer refined approaches that balance resolution with structural preservation. For comprehensive quaternary structure analysis, researchers should consider implementing these techniques in tandem, leveraging their complementary strengths to build a complete picture of protein architecture and function.
In the field of protein analysis, particularly for biopharmaceutical characterization, the integration of separation techniques with mass spectrometry (MS) has revolutionized how scientists validate and characterize therapeutic proteins. As recombinant therapeutic proteins such as monoclonal antibodies (mAbs) continue to emerge as promising treatments for various diseases, the demand for robust analytical techniques to assess their structural attributes has intensified [62]. This guide focuses on the cross-referencing of size exclusion chromatography (SEC) with mass spectrometry as a validation technique, framing this approach within the broader context of comparing protein separation resolution between SDS-PAGE and native PAGE research.
SEC separates biomolecules based on their size in solution, with larger molecules eluting first due to their inability to enter the pores of the stationary phase [63]. When coupled with MS, this technique provides not only separation but also precise molecular weight information and identification of protein variants. Understanding how this powerful combination compares with traditional electrophoretic techniques is essential for researchers, scientists, and drug development professionals seeking to implement the most appropriate validation strategies for their specific applications.
Theoretical Foundations of Separation Techniques
Principles of Size Exclusion Chromatography
Size exclusion chromatography operates on a fundamentally different principle than other chromatographic techniques. In SEC, separation occurs as molecules travel through a column packed with porous beads, where larger molecules cannot enter the pores and thus elute first, while smaller molecules are temporarily trapped within the beads and elute later [63]. This size-based separation allows for effective purification of proteins, polymers, and other macromolecules without significantly altering their biological activity.
The stationary phase typically consists of porous beads made from hydrophilic materials such as cross-linked agarose, polyacrylamide, or silica-based polymers, while the mobile phase comprises a buffer solution that ensures proper flow of samples [63]. Critical factors influencing SEC efficiency include the exclusion limit (maximum molecular size that can enter pores), permeation limit (minimum size that can fully permeate the stationary phase), pore size, molecular weight of analytes, sample volume, and flow rate.
Principles of Electrophoretic Techniques
SDS-PAGE
Sodium dodecyl sulfate-polyacrylamide gel electrophoresis (SDS-PAGE) employs an anionic detergent that binds uniformly along the polypeptide chain, imparting a negative charge proportional to molecular mass and denaturing proteins into linear chains [5]. This process masks intrinsic charge and structural differences, ensuring separation occurs primarily based on molecular weight [12]. While this provides high-resolution separation for determining relative molecular weights, it destroys functional properties including non-covalently bound metal ions and enzymatic activity [3].
Native PAGE
Native PAGE maintains proteins in their natural, folded state, allowing separation based on intrinsic charge and size without denaturation [5]. This preservation of native structure enables the study of protein complexes, conformations, and functional activities, but may not provide as clear resolution of closely related proteins as SDS-PAGE due to reliance on native charge-to-mass ratio [5].
Table 1: Fundamental Principles of Protein Separation Techniques
| Technique | Separation Basis | Protein State | Structural Preservation | Functional Preservation |
|---|---|---|---|---|
| SEC | Hydrodynamic size/radius of gyration | Native or denatured possible | High in native SEC | High in native SEC |
| SDS-PAGE | Molecular weight | Denatured and linearized | Low (tertiary/quaternary lost) | None |
| Native PAGE | Size, charge, and shape | Native/folded | High | High |
| SEC-MS | Size with mass identification | Depends on conditions | Variable based on mobile phase | Possible with native conditions |
Technical Comparison of SEC-MS and PAGE Methods
Resolution and Analytical Performance
The resolution capabilities of each technique vary significantly based on their separation mechanisms and operational parameters. SEC-MS offers superior quantification and identification of high-molecular-weight (HMW) and low-molecular-weight (LMW) variants when optimized with appropriate instrumentation and mobile phases [62]. Research demonstrates that using a biocompatible LC system with PEEK-lined columns and 100 mM ammonium acetate mobile phase successfully enables SEC-UV-MS analysis, allowing identification of mAb dimers and Fab fragments while revealing glycoforms decorated with bi-antennary complex N-glycans [62].
Traditional SDS-PAGE provides high resolution separation of complex protein mixtures but deliberately denatures proteins, destroying functional properties [3]. A modified approach called native SDS-PAGE (NSDS-PAGE) reduces SDS concentration in running buffer from 0.1% to 0.0375% while deleting EDTA, resulting in retention of Zn²⺠bound in proteomic samples increasing from 26% to 98% compared to standard conditions, with seven of nine model enzymes retaining activity after separation [3].
Detection Capabilities and Limitations
Each technique offers distinct advantages and limitations in detection capabilities. SEC-MS combines the size-based separation of SEC with the molecular identification power of MS, allowing detailed characterization of complex biomolecules including protein aggregates and assessment of biotherapeutic product quality [63]. However, successful native SEC-MS measurements of mAbs demand fully biocompatible flow paths to prevent nonspecific interactions with stainless-steel surfaces, which are often masked when using phosphate buffers at high ionic strength [62].
Electrophoretic methods are limited in detection to relative migration compared to standards unless coupled with additional techniques. While BN-PAGE retains native protein state, it falls short of the high resolution of proteomic mixtures attained with SDS-PAGE and can add ambiguities to successful molecular weight determinations [3]. Western blotting following SDS-PAGE enables specific detection but requires additional processing time and introduces potential for artifacts.
Table 2: Performance Comparison of Protein Separation and Validation Techniques
| Parameter | SEC-MS | SDS-PAGE | Native PAGE |
|---|---|---|---|
| Mass Accuracy | High (exact mass measurement) | Low (relative to standards) | Low (relative to standards) |
| Size Resolution Range | Broad (monomers to large aggregates) | 5-200 kDa [12] | Limited by native structure |
| Detection Sensitivity | High (depends on MS platform) | Moderate (nanogram range) | Moderate (nanogram range) |
| Analysis Time | 10-30 minutes | 1-4 hours | 1-4 hours |
| Quantification Ability | Excellent (direct from UV/MS) | Semi-quantitative (staining intensity) | Semi-quantitative (staining intensity) |
| Identification Capability | Direct (via mass measurement) | Indirect (requires standards/western) | Indirect (requires standards/western) |
| Structural Information | Limited (size/mass only) | Primary structure | Tertiary/quaternary structure possible |
Experimental Protocols and Methodologies
SEC-MS Protocol for mAb Analysis
The following protocol has been demonstrated for native SEC-MS analysis of monoclonal antibodies:
Instrumentation Setup: Employ a biocompatible LC system with metal-free flow path (e.g., Agilent 1290 Infinity II Bio LC System) using MP35N metal alloy instead of stainless steel to reduce nonspecific interactions. Combine with a PEEK-lined SEC column (e.g., 4.6 × 150 mm, 1.9-μm AdvanceBio SEC) where polyether ether ketone covers stainless-steel surfaces [62].
Mobile Phase Preparation: Utilize 100 mM ammonium acetate as MS-compatible mobile phase instead of traditional non-volatile phosphate buffers. Volatile ammonium acetate enables direct MS coupling without desalting steps [62].
Chromatographic Conditions: Apply isocratic elution at flow rate of 0.15-0.2 mL/min with column temperature maintained at 30°C. Use minimal injection volumes (e.g., 2 μL) to maintain separation efficiency [64].
MS Parameters: Employ ESI+ ionization mode with capillary voltage at 3.00 kV, cone voltage 40.0 V, source temperature 150°C, and desolvation temperature 450°C. Set acquisition range to 500-5000 m/z for intact protein analysis [64].
Data Analysis: Process data using appropriate software (e.g., MassLynx with MaxEnt 1) for deconvolution and mass determination [64].
Electrophoretic Protocols for Comparative Analysis
Standard SDS-PAGE Protocol: Prepare protein samples in loading buffer containing SDS and reducing agents (e.g., DTT or β-mercaptoethanol). Heat samples at 70-100°C for 5-10 minutes to ensure denaturation. Load onto discontinuous polyacrylamide gel with stacking gel (lower density) and resolving gel (higher density). Run at constant voltage (150-200V) using Tris-glycine buffer until adequate separation achieved [12].
Native PAGE Protocol: Prepare samples in non-denaturing buffer without SDS or reducing agents. Omit heating step to preserve native structure. Use similar gel composition and running conditions as SDS-PAGE but with different buffer systems optimized for native protein separation [5].
NSDS-PAGE Modified Protocol: Mix protein sample with NSDS sample buffer (100 mM Tris HCl, 150 mM Tris base, 10% v/v glycerol, 0.0185% w/v Coomassie G-250, 0.00625% w/v Phenol Red, pH 8.5). Use running buffer with reduced SDS concentration (0.0375% instead of standard 0.1%) and omit EDTA. Perform electrophoresis at constant voltage (200V) for optimized separation time [3].
Research Reagent Solutions
Successful implementation of these validation techniques requires specific reagents and materials optimized for each method:
Table 3: Essential Research Reagents for Protein Separation Techniques
| Reagent/Material | Function | Technique | Key Considerations |
|---|---|---|---|
| PEEK-lined SEC Columns | Size-based separation with reduced protein adsorption | SEC-MS | Minimizes nonspecific interactions with stainless steel [62] |
| Ammonium Acetate | MS-compatible volatile buffer | SEC-MS | Enables direct coupling to MS; typically 50-100 mM [62] |
| BEH SEC Particles | Column packing material | SE-UPLC-MS | Provides reduced secondary interactions; allows lower salt concentrations [64] |
| SDS (Sodium Dodecyl Sulfate) | Anionic denaturing detergent | SDS-PAGE | Uniformly coats proteins with negative charge [12] |
| Polyacrylamide Gels | Separation matrix | PAGE | Density determines resolution range; gradient gels broaden MW range [12] |
| Tris-Glycine Buffer | Running buffer | PAGE | Maintains pH above proteins' isoelectric point [12] |
| Coomassie G-250 | Tracking dye/stain | NSDS-PAGE | Minimal interference with protein function in modified protocols [3] |
| Molecular Weight Markers | Size calibration | All techniques | Essential for accurate molecular weight determination [12] |
Applications and Data Interpretation
Case Study: mAb Aggregation Analysis
SEC-MS has proven particularly valuable for characterizing monoclonal antibodies and their aggregates. In one application, SEC-UV-MS analysis of NISTmAb successfully identified high-molecular-weight and low-molecular-weight variants as mAb dimer and Fab fragments, respectively, based on deconvoluted MS spectra [62]. The spectrum associated with the main peak highlighted several glycoforms decorated with bi-antennary complex N-glycans G0, G0F, G1F, and G2F, while also revealing mAb variants carrying C-terminal lysine [62].
For myoglobin analysis, SE-UPLC-MS using an ACQUITY UPLC BEH200 SEC column with 100 mM ammonium formate mobile phase successfully resolved myoglobin size variants including monomer, dimer, and higher order aggregates [64]. The deconvoluted MS spectrum confirmed the intact mass of myoglobin monomer at 16,951 Da and dimer at 33,886 Da, though simultaneous presence of monomer and dimer in deconvoluted spectrum indicated potential dissociation of non-covalent dimer in source or presence of additional size variants [64].
Comparative Data Analysis Strategies
When cross-referencing techniques, researchers should develop systematic approaches for data correlation. For SEC-MS, primary data includes retention time (size parameter) and mass spectral data (mass identification). Comparing these datasets with electrophoretic mobility in SDS-PAGE and Native PAGE requires understanding the fundamental differences in what each technique measures.
In SDS-PAGE, migration distance correlates with molecular weight only for fully denatured proteins, while in Native PAGE, migration depends on both size and charge. SEC separation depends on hydrodynamic radius, which for native proteins relates to both mass and shape. These differences must be considered when validating results across techniques, as discrepancies may indicate preservation of structure in SEC and Native PAGE that is lost in SDS-PAGE.
The cross-referencing of size exclusion chromatography with mass spectrometry represents a powerful validation approach that complements traditional electrophoretic methods. SEC-MS provides exceptional capability for direct mass identification and quantification of protein variants, aggregates, and modifications, while electrophoretic techniques offer established, accessible separation with different informational content.
For researchers framing their work within the context of comparing protein separation resolution between SDS-PAGE and native PAGE, SEC-MS serves as an orthogonal validation method that can resolve ambiguities arising from either technique alone. The selection of appropriate methods should be guided by specific research goals: SEC-MS for direct identification and absolute quantification, SDS-PAGE for high-resolution denatured separation by molecular weight, and Native PAGE for preservation of protein function and complex formation.
As biopharmaceutical development continues to advance, the integration of these complementary techniques will remain essential for comprehensive protein characterization, ensuring both accurate structural assessment and preservation of functional properties where needed.
Polyacrylamide Gel Electrophoresis (PAGE) serves as a fundamental tool in biochemistry and molecular biology laboratories for separating complex protein mixtures. The two primary variants—SDS-PAGE (Sodium Dodecyl Sulfate-PAGE) and Native PAGE—employ fundamentally different principles that dictate their resolution capabilities for specific applications [5]. SDS-PAGE denatures proteins into linear polypeptides, allowing separation primarily by molecular weight, while Native PAGE maintains proteins in their folded, functional states, enabling separation based on combined factors of size, charge, and shape [1]. Understanding the distinct resolution advantages of each technique is crucial for researchers designing experiments in protein characterization, complex analysis, and drug development.
The choice between these techniques significantly impacts downstream analyses and interpretability of results. SDS-PAGE provides high-resolution separation based predominantly on polypeptide chain length, whereas Native PAGE preserves higher-order protein structures and biological activities, enabling functional assessments post-separation [5] [1]. This comparative analysis examines the specific experimental conditions where each technique demonstrates superior resolution, supported by methodological protocols and experimental data to guide appropriate selection for research applications.
Fundamental Principles and Separation Mechanisms
SDS-PAGE: Denaturing Separation by Mass
SDS-PAGE employs the anionic detergent sodium dodecyl sulfate (SDS) to denature protein samples. When proteins are heated with SDS and reducing agents like β-mercaptoethanol or dithiothreitol (DTT), they unfold into linear polypeptide chains [65]. SDS molecules bind uniformly along the hydrophobic regions of the polypeptide backbone at a consistent ratio of approximately 1.4 g SDS per 1 g of protein [5]. This SDS-protein complex carries a strong negative charge that effectively masks the protein's intrinsic charge, creating a uniform charge-to-mass ratio across all denatured proteins [12]. Consequently, separation occurs primarily according to molecular weight as proteins migrate through the polyacrylamide gel matrix under an electric field [1].
The gel structure itself enhances resolution through a discontinuous system. A stacking gel (typically ~5% acrylamide, pH 6.8) initially concentrates proteins into sharp bands, followed by a resolving gel (typically 10-15% acrylamide, pH 8.8) where size-based separation occurs [65]. Smaller proteins navigate the gel pores more readily and migrate farther, while larger proteins experience greater resistance [12]. This process enables precise molecular weight estimation when compared against standardized protein ladders [1].
Native PAGE: Non-Denaturing Separation by Multiple Parameters
Native PAGE separates proteins without denaturation, preserving their tertiary and quaternary structures, biological activity, and enzyme function [5] [1]. Without SDS, proteins maintain their native conformation and intrinsic electrical charge [12]. Separation depends on a combination of factors including the protein's net charge at the running buffer pH, hydrodynamic size (influenced by folding), and three-dimensional shape [1] [12]. The gel matrix exerts a sieving effect where compact proteins may migrate faster than larger, more extended conformations with similar molecular weights [12].
This technique is particularly valuable for studying multimeric protein complexes whose subunit interactions remain intact during electrophoresis [1]. Proteins migrate toward the electrode of opposite charge at rates proportional to their charge density (charge-to-mass ratio) while being influenced by molecular size and shape [1]. The preservation of native structure enables subsequent functional analyses, including in-gel activity assays for enzymes [7].
Table 1: Fundamental Separation Principles of SDS-PAGE versus Native PAGE
| Parameter | SDS-PAGE | Native PAGE |
|---|---|---|
| Protein State | Denatured into linear polypeptides | Native, folded conformation preserved |
| Key Separation Factors | Molecular weight | Size, charge, and shape |
| Detergent | SDS present (0.1-0.5%) | No SDS |
| Reducing Agents | Often used (β-mercaptoethanol, DTT) | Typically omitted |
| Charge Properties | Uniform negative charge from SDS | Intrinsic charge based on protein sequence and buffer pH |
| Quaternary Structure | Disrupted; subunits separate | Preserved; complexes remain intact |
| Post-Electrophoresis Analysis | Western blotting, mass spectrometry | In-gel activity assays, functional studies |
Resolution Performance Analysis
Experimental Contexts Favoring SDS-PAGE Resolution
SDS-PAGE demonstrates superior resolution in several well-defined experimental scenarios, primarily when protein size determination or subunit composition is the research objective.
Molecular Weight Determination
SDS-PAGE provides high-resolution separation based primarily on polypeptide chain length, enabling accurate molecular weight estimation [5]. The denaturation of proteins into linear SDS-polypeptide complexes with uniform charge density means migration distance correlates strongly with log molecular weight [1]. This produces sharp, well-defined bands that can be precisely compared to protein standards across a wide mass range (typically 5-250 kDa) [12]. The technique effectively resolves proteins with differences as small as 2-5% in molecular weight under optimal conditions [65], making it indispensable for initial protein characterization.
Subunit Composition Analysis
When studying multimeric proteins, SDS-PAGE excels at resolving individual subunits under reducing conditions [28]. The combination of SDS and reducing agents cleaves disulfide bonds and disrupts non-covalent interactions, dissociating complexes into constituent polypeptides [28]. This allows researchers to determine subunit stoichiometry and identify proteolytic cleavage products that might be obscured in native systems [28]. Comparative analysis under reducing versus non-reducing conditions can also reveal disulfide-bonded subunits within complexes [28].
Purity Assessment and Western Blotting
The denaturing conditions of SDS-PAGE make it ideal for assessing sample purity during protein purification procedures [5]. Contaminating proteins are readily visualized as distinct bands, enabling quantitative estimation of purity [1]. Additionally, the completely unfolded polypeptides generated by SDS treatment are optimal for western blotting, as the linearized epitopes exhibit enhanced accessibility to antibodies [5] [12]. The transfer efficiency to membranes is also more uniform and predictable compared to native systems [12].
Experimental Contexts Favoring Native PAGE Resolution
Native PAGE provides distinct resolution advantages for studies requiring preservation of protein structure and function, particularly when analyzing biologically active complexes.
Functional Protein Complexes and Oligomeric States
Native PAGE maintains quaternary structures, allowing researchers to resolve different oligomeric forms of proteins and characterize native protein-protein interactions [5] [7]. This capability was demonstrated in a study of medium-chain acyl-CoA dehydrogenase (MCAD), where high-resolution clear native PAGE (hrCN-PAGE) successfully separated active tetramers from inactive aggregates and fragmented forms [7]. The technique enabled quantification of functional tetramers in clinical variants, providing insights into pathogenic mechanisms that would be undetectable by SDS-PAGE [7].
In-Gel Enzymatic Activity assays
A significant advantage of Native PAGE is the preservation of biological activity post-separation [5]. Proteins resolved by Native PAGE can be directly assayed for function within the gel matrix [7]. For example, dehydrogenases like MCAD can be detected using colorimetric assays that couple substrate oxidation with tetrazolium salt reduction, forming insoluble, colored precipitates at the enzyme location [7]. This approach allows direct correlation between protein bands and catalytic function, enabling studies of multiple enzyme forms within a single sample [7].
Metal-Binding Proteins and Cofactor Retention
Native PAGE preserves non-covalently bound cofactors and metal ions that are essential for the structure and function of many proteins [3]. A modified approach called NSDS-PAGE (native SDS-PAGE) demonstrated that reducing SDS concentrations and eliminating heating steps allowed seven of nine model enzymes, including four zinc metalloproteins, to retain activity after electrophoresis [3]. Metal retention increased from 26% in standard SDS-PAGE to 98% in NSDS-PAGE, highlighting the value of native approaches for metalloprotein analysis [3].
Table 2: Comparative Resolution Performance in Specific Applications
| Application | SDS-PAGE Performance | Native PAGE Performance |
|---|---|---|
| Molecular Weight Determination | High resolution and accuracy | Limited value; migration depends on multiple factors |
| Oligomeric State Analysis | Poor; disrupts complexes | Excellent; preserves native quaternary structure |
| Enzyme Activity Detection | Not possible; proteins denatured | Excellent; enables in-gel activity assays |
| Post-Translational Modification Effects | Limited to mass changes | Can resolve conformational changes induced by modifications |
| Metal/Cofactor Binding Studies | Poor; cofactors dissociate | Excellent; maintains native interactions |
| Protein-Protein Interaction Mapping | Disrupts non-covalent interactions | Preserves stable complexes |
| Membrane Protein Analysis | Good for subunit composition | Challenged by solubility issues |
Experimental Protocols and Methodologies
SDS-PAGE Standard Protocol
The following protocol outlines the standard SDS-PAGE procedure for high-resolution separation by molecular weight [65]:
Sample Preparation:
- Mix protein sample with 2× Laemmli buffer (4% SDS, 20% glycerol, 0.004% bromophenol blue, 100 mM Tris-HCl pH 6.8, 10% β-mercaptoethanol)
- Heat denature at 95°C for 5 minutes to ensure complete unfolding
- Cool on ice and centrifuge briefly before loading
Gel Preparation:
- Resolving Gel (10% for most applications): Combine 3.3 mL 30% acrylamide/bis mix, 2.5 mL 1.5 M Tris-HCl (pH 8.8), 100 μL 10% SDS, 3.9 mL deionized water, 50 μL 10% ammonium persulfate (APS), and 5 μL TEMED
- Stacking Gel (5%): Combine 0.83 mL 30% acrylamide/bis mix, 0.63 mL 1.0 M Tris-HCl (pH 6.8), 50 μL 10% SDS, 3.4 mL deionized water, 25 μL 10% APS, and 5 μL TEMED
Electrophoresis Conditions:
- Running buffer: 25 mM Tris, 192 mM glycine, 0.1% SDS (pH 8.3)
- Stacking phase: 80 V constant voltage until dye front enters resolving gel
- Separating phase: 120 V constant voltage until dye front reaches gel bottom (approximately 60-90 minutes)
Detection Methods:
- Coomassie Brilliant Blue: Fix in 40% ethanol/10% acetic acid (30 min), stain with 0.1% Coomassie R-250 (1-2 hr), destain with 10% ethanol/7% acetic acid
- Silver staining: Higher sensitivity for low-abundance proteins
High-Resolution Clear Native PAGE (hrCN-PAGE) Protocol
This protocol for protein complex separation and in-gel activity assays is adapted from the MCAD study [7]:
Sample Preparation:
- No denaturing agents or detergents added
- Maintain samples in native buffer conditions (typically 20-50 mM Tris-HCl, pH 7.4)
- Optional: Add glycerol to 10% final concentration for easier loading
Gel Preparation:
- Gradient gels (4-16% acrylamide) provide optimal resolution for protein complexes
- Use high-purity acrylamide and bisacrylamide for clear backgrounds
- Omit SDS from all gel solutions
- Polymerize with TEMED and APS as with SDS-PAGE
Electrophoresis Conditions:
- Running buffer: 50 mM BisTris, 50 mM Tricine (pH 6.8) for cathode buffer; 50 mM BisTris, 50 mM Tricine (pH 6.8) for anode buffer
- Conduct electrophoresis at 4°C to maintain protein stability
- Use constant voltage (150 V) for 90-95 minutes until dye front migrates 60 mm
In-Gel Activity Assay for Dehydrogenases (e.g., MCAD):
- Incubate gel in reaction mixture containing physiological substrate (e.g., octanoyl-CoA for MCAD) and electron acceptor (nitro blue tetrazolium chloride)
- Monitor purple diformazan precipitate formation (10-15 minutes)
- Stop reaction by transferring to fixing solution
- Quantify band intensity by densitometry
Essential Research Reagent Solutions
Successful implementation of SDS-PAGE and Native PAGE requires specific reagent systems optimized for each technique's requirements. The following table details essential materials and their functions.
Table 3: Essential Research Reagents for SDS-PAGE and Native PAGE
| Reagent Category | Specific Examples | Function | Technique |
|---|---|---|---|
| Denaturing Agents | Sodium dodecyl sulfate (SDS) | Denatures proteins, confers uniform negative charge | SDS-PAGE |
| Reducing Agents | β-mercaptoethanol, Dithiothreitol (DTT) | Breaks disulfide bonds, ensures complete unfolding | SDS-PAGE |
| Buffering Systems | Tris-glycine-SDS, MOPS-SDS | Maintains pH, provides conducting ions | SDS-PAGE |
| Buffering Systems | Tris-acetate, Tris-borate, BisTris-Tricine | Maintains native pH without denaturation | Native PAGE |
| Gel Matrix Components | Acrylamide, Bis-acrylamide | Forms cross-linked porous gel matrix | Both |
| Polymerization Initiators | Ammonium persulfate (APS), TEMED | Catalyzes acrylamide polymerization | Both |
| Tracking Dyes | Bromophenol blue, Coomassie G-250 | Visualize migration front | Both |
| Molecular Weight Standards | Prestained and unstained protein ladders | Molecular weight calibration | SDS-PAGE |
| Native Markers | Non-denatured protein standards | Migration reference for native separation | Native PAGE |
| Activity Assay Reagents | Nitro blue tetrazolium (NBT), specific substrates | Detects enzymatic activity in gels | Native PAGE |
| Staining Solutions | Coomassie R-250, SimplyBlue SafeStain | Visualizes separated protein bands | Both |
| Destaining Solutions | Methanol/acetic acid, ethanol/acetic acid | Removes background stain | Both |
Advanced Technical Considerations
Modified Techniques and Hybrid Approaches
Recent methodological advances have created hybrid approaches that combine benefits of both techniques. NSDS-PAGE (native SDS-PAGE) reduces SDS concentration to 0.0375% and eliminates heating steps, resulting in 98% zinc retention in metalloproteins compared to 26% in standard SDS-PAGE [3]. This modification allows high-resolution separation while preserving function for seven of nine tested enzymes [3]. Blue Native (BN)-PAGE incorporates Coomassie G-250 dye, which confers negative charge to protein complexes without significant denaturation, enabling analysis of membrane protein complexes and respiratory chain supercomplexes [3].
Two-dimensional (2D) PAGE combines the strengths of both techniques by separating proteins first by native isoelectric focusing (IEF) according to isoelectric point, followed by denaturing SDS-PAGE in the second dimension [1] [16]. This orthogonal approach provides the highest resolution for complex protein mixtures, potentially resolving thousands of proteins from a single sample [1]. However, this method requires specialized equipment and expertise, with challenges in reproducibility and recovery of hydrophobic proteins [16].
Troubleshooting Common Resolution Issues
Both techniques face distinct challenges that can compromise resolution if not properly addressed:
SDS-PAGE Artifacts:
- Smearing/Streaking: Often caused by incomplete denaturation; extend boiling time or add protease inhibitors [65]
- Vertical Streaks: Frequently result from air bubbles in gel; degas gel solution before polymerization [65]
- Aberrant Migration: Uneven SDS binding; use fresh DTT and sample buffer [65]
- "Smiling Bands": Buffer/gel overheating; run at lower voltage or implement cooling [12]
Native PAGE Challenges:
- Poor Band Sharpness: Often due to protein aggregation; optimize buffer conditions and include compatible detergents
- Loss of Activity: Frequently caused by temperature stress; maintain 4°C during electrophoresis [7]
- Multiple Bands: May represent genuine oligomeric states or result from incomplete complex stability; include appropriate stabilizing cofactors
SDS-PAGE and Native PAGE offer complementary approaches to protein separation with distinct resolution advantages in specific experimental contexts. SDS-PAGE provides superior resolution when the research objective requires molecular weight determination, subunit composition analysis, purity assessment, or western blotting applications. Its denaturing conditions generate sharp, well-defined bands separated primarily by polypeptide chain length. Native PAGE delivers enhanced resolution for functional studies, including oligomeric state determination, in-gel activity assays, metalloprotein analysis, and native protein-protein interaction mapping. Its non-denaturing conditions preserve biological activity and higher-order structures.
The choice between these techniques should be guided by specific research goals rather than perceived technical superiority. For comprehensive protein characterization, orthogonal approaches combining both techniques, such as 2D-PAGE or sequential analyses, often provide the most complete understanding of protein properties. As electrophoretic methodologies continue to evolve, hybrid techniques like NSDS-PAGE demonstrate the potential for customized approaches that balance resolution with functional preservation, expanding the analytical capabilities available to researchers in basic science and drug development.
In the field of protein science, the choice of electrophoretic technique often presents a fundamental trade-off: high molecular weight resolution versus the preservation of native protein function. For decades, SDS-PAGE and Native PAGE have represented two ends of this spectrum. SDS-PAGE provides excellent resolution based primarily on molecular weight but completely denatures proteins, destroying their biological activity [4] [1]. Conversely, Native PAGE preserves protein structure and function but offers lower resolution and more complex migration patterns dependent on size, charge, and shape [5]. To address this limitation, researchers have developed Native SDS-PAGE (NSDS-PAGE), a hybrid approach that modifies traditional SDS-PAGE conditions to retain native properties while maintaining high resolution [3] [27]. This emerging methodology offers a sophisticated compromise, enabling high-resolution separation of proteins with retention of metal cofactors and enzymatic activity previously only possible with Native PAGE.
Fundamental Techniques: SDS-PAGE versus Native PAGE
To appreciate the significance of Native SDS-PAGE, one must first understand the fundamental principles and limitations of the two established techniques it bridges.
Core Principles and Separation Mechanisms
SDS-PAGE employs the anionic detergent sodium dodecyl sulfate (SDS) and reducing agents to denature proteins. SDS binds uniformly to polypeptide backbones, masking intrinsic charges and imparting a uniform negative charge density. This allows separation based almost exclusively on molecular weight as proteins migrate through a polyacrylamide gel matrix [1] [21]. The process destroys higher-order structure, quaternary interactions, and biological function [4] [24].
Native PAGE operates without denaturing agents. Separation depends on the protein's intrinsic charge, size, and three-dimensional shape under non-denaturing conditions [5] [1]. This preserves native conformation, subunit interactions, enzymatic activity, and bound cofactors (e.g., metal ions), allowing functional studies post-separation [4] [1].
Table 1: Core Differences Between SDS-PAGE and Native PAGE
| Criterion | SDS-PAGE | Native PAGE |
|---|---|---|
| Separation Basis | Molecular weight [4] [21] | Size, charge, and shape [4] [5] |
| Protein State | Denatured and linearized [4] [1] | Native, folded conformation [4] [5] |
| Detergent (SDS) | Present [4] | Absent [4] |
| Sample Preparation | Heated with SDS and reducing agents [4] | Not heated; no denaturing agents [4] |
| Biological Activity | Lost [4] [24] | Retained [4] [5] |
| Protein Recovery | Not recoverable functional [4] | Recoverable functional [4] |
| Primary Applications | Molecular weight determination, purity checks [4] | Studying oligomeric state, protein-protein interactions, enzymatic activity [4] [13] |
Limitations of Conventional Methods
The primary limitation of SDS-PAGE is the irreversible destruction of native protein properties. This makes it unsuitable for investigating function, protein-protein interactions, or the role of non-covalently bound cofactors [3] [27]. While Native PAGE preserves these properties, its resolution is inferior. Protein migration is influenced by multiple unpredictable factors (charge, shape), complicating analysis and molecular weight estimation [3] [5]. Furthermore, the technique can be more difficult to run and interpret [4].
Native SDS-PAGE: A Hybrid Methodology
Native SDS-PAGE represents a deliberate modification of standard SDS-PAGE protocols designed to balance the strengths of both conventional methods.
Protocol Modifications and Experimental Workflow
The development of NSDS-PAGE involved systematically removing or reducing denaturing components from the standard SDS-PAGE workflow [3] [27]. Key modifications include:
- Sample Buffer: Removal of SDS and EDTA from the sample loading buffer [3].
- Heating Step: Omission of the sample heating step prior to loading [3] [27].
- Running Buffer: Reduction of SDS concentration in the running buffer from 0.1% to 0.0375% and removal of EDTA [3] [27].
These adjustments minimize protein denaturation while maintaining the electrophoretic conditions necessary for high-resolution separation. The workflow comparison is summarized in the diagram below.
Quantitative Performance Comparison
Experimental data demonstrates that NSDS-PAGE successfully bridges the gap between its parent techniques. Research focusing on zinc-binding proteins showed a dramatic increase in metal retention with NSDS-PAGE compared to standard SDS-PAGE [3] [27]. Furthermore, enzymatic activity assays after electrophoresis confirm the preservation of function.
Table 2: Quantitative Comparison of Electrophoretic Performance
| Performance Metric | SDS-PAGE | Native SDS-PAGE | Blue Native PAGE |
|---|---|---|---|
| Zn²⺠Retention (Pig Kidney Proteome) | 26% [3] [27] | 98% [3] [27] | Not Specified |
| Enzymatic Activity Retention | 0 out of 9 model enzymes [3] | 7 out of 9 model enzymes [3] | 9 out of 9 model enzymes [3] |
| Separation Resolution | High [3] [24] | High [3] | Lower than SDS-PAGE [3] |
Essential Reagents and Research Solutions
Successful implementation of these electrophoretic techniques requires specific reagent solutions. The table below details key components used in the cited NSDS-PAGE experiments.
Table 3: Research Reagent Solutions for Native SDS-PAGE
| Reagent / Solution | Function / Description | Example Use in NSDS-PAGE |
|---|---|---|
| Bis-Tris Precast Gels (e.g., Invitrogen NuPAGE Novex 12%) | Polyacrylamide gel matrix providing a stable, reproducible pore size for protein separation. | Used as the separation matrix in NSDS-PAGE protocols [3]. |
| NSDS Sample Buffer (4X) | Prepares protein samples for loading without denaturation. Contains Tris, glycerol, Coomassie G-250, Phenol Red, pH 8.5 [3]. | Mixed with protein sample (7.5μL sample + 2.5μL buffer); no heating [3]. |
| NSDS Running Buffer | Conducts current and provides a low, non-denaturing concentration of SDS. Contains MOPS, Tris Base, 0.0375% SDS, pH 7.7 [3]. | Used as the anode/cathode buffer during electrophoresis [3]. |
| SDS (Sodium Dodecyl Sulfate) | Anionic detergent. At high concentrations, it denatures proteins; at low concentrations, its effects are moderated [66]. | Used at a reduced concentration (0.0375%) in the running buffer only [3]. |
| Coomassie G-250 | Dye component in the sample buffer; provides charge and visual tracking of the migration front [3]. | Present in the NSDS sample buffer at 0.01875% [3]. |
Scientific Implications and Applications
The ability of NSDS-PAGE to separate complex protein mixtures with high resolution while retaining native properties opens up several specialized research applications, particularly in the growing field of metallomics.
Key Application Areas
- Metalloprotein Research: NSDS-PAGE is exceptionally valuable for studying metalloproteins, which rely on non-covalently bound metal ions for their structure and function. The near-complete retention of zinc ions (98%) demonstrated in research makes it possible to separate and analyze metal-bound protein complexes that would be disrupted by standard SDS-PAGE [3] [27].
- Functional Proteomics: Researchers can separate proteins from a cellular proteome and subsequently assay specific enzymatic activities directly in the gel, a task impossible with traditional denaturing methods. The retention of activity in 7 out of 9 model enzymes underscores its utility for functional screening [3].
- Analysis of Labile Complexes: The mild conditions of NSDS-PAGE may be suitable for studying weakly associated protein complexes or proteins with labile cofactors that are disrupted by full denaturation but are stable under the gentle detergent conditions of this hybrid technique.
SDS-PAGE and Native PAGE have long been foundational yet contrasting tools for protein analysis. Native SDS-PAGE emerges as a sophisticated hybrid technique that effectively balances the high resolution of denaturing electrophoresis with the functional preservation of native methods. By strategically modifying buffer compositions and omitting denaturation steps, researchers can achieve high-resolution separation while retaining critical native properties like bound metal ions and enzymatic activity. For scientists studying functional protein complexes, metalloenzymes, and native proteomes, Native SDS-PAGE provides a powerful alternative that mitigates the traditional compromise between resolution and biological relevance, thereby enabling more insightful functional analyses in modern biochemical research.
In the fields of biochemistry and molecular biology, polyacrylamide gel electrophoresis (PAGE) serves as a fundamental technique for protein analysis. Two primary methodologies—SDS-PAGE (Sodium Dodecyl Sulfate Polyacrylamide Gel Electrophoresis) and Native PAGE—offer divergent pathways for protein separation, each with distinct advantages and limitations. The choice between these methods is not merely procedural but strategic, directly determining the type and quality of information obtained. SDS-PAGE employs a denaturing approach to separate proteins primarily by molecular weight, while Native PAGE maintains proteins in their native, functional state to separate them based on a combination of size, charge, and shape [5] [22]. This guide provides a structured framework for researchers to select the optimal electrophoretic method based on specific research questions, supported by experimental data and detailed protocols.
Fundamental Principles and Comparative Analysis
Mechanism of SDS-PAGE
SDS-PAGE relies on the denaturing power of sodium dodecyl sulfate (SDS), an anionic detergent that binds uniformly to polypeptide chains. This binding confers a consistent negative charge-to-mass ratio, unfolds the proteins into linear chains, and masks intrinsic charges. Consequently, separation occurs almost exclusively based on molecular size as proteins migrate through the polyacrylamide gel matrix [5] [10] [22]. The process typically involves sample heating (95°C for 5 minutes) in the presence of SDS and reducing agents like β-mercaptoethanol or dithiothreitol (DTT) to disrupt disulfide bridges [10].
Mechanism of Native PAGE
In contrast, Native PAGE is performed without denaturing agents, preserving the protein's higher-order structure (secondary, tertiary, and quaternary), biological activity, and interactions with cofactors or other proteins. Separation depends on the protein's intrinsic charge, size, and three-dimensional conformation under native conditions [5] [22]. This allows for the study of functional protein complexes and enzymatic activities directly after electrophoresis.
Direct Technique Comparison
Table 1: Core Differences Between SDS-PAGE and Native PAGE
| Parameter | SDS-PAGE | Native PAGE |
|---|---|---|
| Protein State | Denatured (unfolded) | Native (folded and functional) |
| Separation Basis | Molecular weight | Size, intrinsic charge, and shape |
| Key Reagents | SDS, reducing agents, heat | Native buffers, no detergents |
| Biological Activity | Destroyed | Preserved |
| Molecular Weight Determination | Accurate estimation | Approximate, influenced by shape/charge |
| Applications | Purity assessment, subunit composition, Western blotting | Enzyme activity assays, protein-protein interactions, complex oligomerization |
The fundamental trade-off is clear: SDS-PAGE offers high-resolution size-based separation at the cost of protein function, while Native PAGE preserves functionality with potentially lower resolution for molecular weight determination [5] [22].
Advanced Methodologies and Hybrid Approaches
High-Resolution Clear Native Electrophoresis (hrCNE)
Standard Native PAGE can be limited by protein aggregation and broad bands. High-Resolution Clear Native Electrophoresis (hrCNE) overcomes this by substituting Coomassie dye with non-colored mixtures of anionic and neutral detergents in the cathode buffer. These mixed micelles impose a charge shift to enhance migration while maintaining protein solubility, resulting in resolution comparable to Blue Native PAGE (BN-PAGE) but without dye interference. This enables in-gel catalytic activity assays and fluorescence studies previously hampered by dyes [6]. A recent study utilized hrCNE to separate different oligomeric forms of Medium-Chain acyl-CoA Dehydrogenase (MCAD), a mitochondrial homotetrameric flavoprotein, followed by an in-gel activity assay to quantify the activity of tetramers separately from other forms [7].
Native SDS-PAGE (NSDS-PAGE)
A hybrid approach, NSDS-PAGE, modifies standard SDS-PAGE conditions to retain some native properties while maintaining high resolution. This method involves removing SDS and EDTA from the sample buffer, omitting the heating step, and reducing SDS in the running buffer from 0.1% to 0.0375% [3] [27]. This protocol significantly increases the retention of bound metal ions (e.g., Zn²⺠retention increased from 26% to 98%) and preserves the activity of many enzymes post-electrophoresis. In a study of nine model enzymes, seven retained activity after NSDS-PAGE, whereas all were denatured during standard SDS-PAGE [3] [27].
Quantitative Performance Comparison
Table 2: Quantitative Comparison of Separation Performance from Proteomic Studies
| Performance Metric | SDS-PAGE-MS | Native 2DE-MS |
|---|---|---|
| Number of Proteins Identified (HBSMC Supernatant) | 2,552 proteins | 4,323 proteins |
| Protein Abundance Range | 3.5% to 2×10â»â´% | 3.6% to 1×10â»âµ% |
| Advantaged Application | Comparative quantification between samples | Analysis of protein interactions in cells |
| Membrane Protein Analysis | Effective for precipitated, insoluble fractions | Identified ~600 "membrane" proteins with higher abundance vs. SDS-PAGE |
A comparative study of human bronchial smooth muscle cell (HBSMC) proteins demonstrated that SDS-PAGE-LC-MS/MS and nondenaturing 2DE-LC-MS/MS provide complementary information. SDS-PAGE was advantageous for comparative quantification, while native 2DE was superior for analyzing protein interactions and specific membrane proteins [54].
Experimental Protocols for Key Applications
In-Gel Activity Assay for MCAD Following hrCNE
This protocol, adapted from a 2025 Scientific Reports study, enables the functional analysis of enzyme variants [7].
- Gel Electrophoresis: Separate purified MCAD protein or mitochondrial-enriched fractions using high-resolution clear native PAGE (hrCN-PAGE) on a 4-16% gradient gel.
- Staining Solution Preparation: Prepare a reaction mixture containing:
- Octanoyl-CoA: Physiological MCAD substrate (reductant).
- Nitro Blue Tetrazolium (NBT) chloride: Oxidizing agent that forms an insoluble purple diformazan precipitate upon reduction.
- Incubation and Visualization: Incubate the gel in the staining solution at room temperature for 10-15 minutes. The formation of purple bands indicates enzymatic activity.
- Quantification: Perform densitometric analysis on the activity bands. The assay shows a linear correlation between protein amount (even <1 µg), FAD content, and in-gel activity, allowing for quantitative comparisons between variants.
Native SDS-PAGE (NSDS-PAGE) Protocol
This protocol, designed for metalloprotein analysis, preserves metal cofactors and enzymatic activity [3] [27].
- Sample Preparation: Mix 7.5 µL of protein sample with 2.5 µL of 4X NSDS sample buffer (100 mM Tris HCl, 150 mM Tris base, 10% glycerol, 0.0185% Coomassie G-250, 0.00625% Phenol Red, pH 8.5). Do not heat the sample.
- Gel Preparation: Use standard precast NuPAGE Novex 12% Bis-Tris mini-gels. Pre-run the gel at 200V for 30 minutes in double-distilled Hâ‚‚O to remove storage buffer and unpolymerized acrylamide.
- Running Buffer: 50 mM MOPS, 50 mM Tris Base, 0.0375% SDS, pH 7.7 (SDS concentration is reduced versus standard SDS-PAGE).
- Electrophoresis: Load samples and run at a constant voltage (200V) for approximately 45 minutes at room temperature.
- Post-Electrophoresis Analysis: Gels can be used for activity staining, western blotting, or metal detection using techniques like laser ablation-inductively coupled plasma-mass spectrometry (LA-ICP-MS).
Research Reagent Solutions
Table 3: Essential Reagents for Electrophoretic Protein Separation
| Reagent / Material | Function / Purpose | Key Considerations |
|---|---|---|
| Sodium Dodecyl Sulfate (SDS) | Denatures proteins, confers uniform negative charge. Critical for SDS-PAGE. | Use in excess (e.g., in sample buffer); binds ~1.4g per gram of protein [10]. |
| Dithiothreitol (DTT) or β-Mercaptoethanol | Reducing agents; break disulfide bonds for complete denaturation in SDS-PAGE. | DTT (10-100 mM) is common; prevents protein aggregation [10]. |
| Acrylamide/Bis-acrylamide | Forms the porous gel matrix for size-based separation. | Concentration determines pore size (e.g., 4-16% gradient gels) [10]. |
| Coomassie Blue G-250 | Anionic dye used in BN-PAGE for charge-shifting and protein visualization. | Interferes with in-gel fluorescence and activity assays; omitted in hrCNE [6]. |
| Nitro Blue Tetrazolium (NBT) | Oxidizing agent in in-gel activity assays; forms colored precipitate. | Enables visualization of oxidoreductase activity (e.g., MCAD assay) [7]. |
| Membrane Scaffold Peptides (DeFrMSPs) | Engineered peptides for detergent-free extraction into native nanodiscs. | Bypasses detergent use for sensitive membrane proteins; used with Native PAGE [67]. |
Visual Decision Framework and Experimental Workflow
The following diagram illustrates the logical decision process for selecting the optimal electrophoresis method based on research goals.
Decision Framework for PAGE Method Selection
The experimental workflow for in-gel activity analysis following native electrophoresis is detailed below.
In-Gel Activity Assay Workflow
Selecting between SDS-PAGE, Native PAGE, and their advanced derivatives is a critical decision that dictates the success of downstream analyses. SDS-PAGE remains the gold standard for determining molecular weight and analyzing subunit composition. In contrast, Native PAGE and its high-resolution clear native variant are indispensable for functional studies, interaction analyses, and characterizing labile protein complexes. The emerging Native SDS-PAGE technique offers a valuable middle ground, providing high resolution with retained metalloprotein function. By applying the decision framework and protocols outlined in this guide, researchers can strategically align their electrophoretic method with their specific research objectives, thereby maximizing the relevance and quality of their experimental data.
Conclusion
SDS-PAGE and Native PAGE offer complementary approaches to protein separation with distinct resolution advantages tailored to different research objectives. SDS-PAGE provides superior molecular weight-based resolution for denatured proteins, making it ideal for purity assessment, expression analysis, and subunit characterization. Native PAGE, while offering lower absolute resolution, preserves protein functionality and higher-order structures, enabling the study of protein complexes, interactions, and enzymatic activities. The choice between techniques should be guided by the specific research question rather than a universal preference for higher resolution. Future directions include the development of hybrid methods that balance resolution with functional preservation, increased integration with mass spectrometry for comprehensive proteomic analysis, and adaptation for high-throughput drug screening applications. By understanding the fundamental principles, optimization strategies, and interpretation frameworks presented in this guide, researchers can maximize the value of electrophoretic separation in advancing biomedical discovery and therapeutic development.
References
- 1. Overview of Protein Electrophoresis [https://www.thermofisher.com/us/en/home/life-science/protein-biology/protein-biology-learning-center/protein-biology-resource-library/pierce-protein-methods/overview-electrophoresis.html]
- 2. SDS PAGE vs Native PAGE [https://byjus.com/biology/difference-between-sds-page-and-native-page/]
- 3. Native SDS-PAGE: High Resolution Electrophoretic ... [https://pmc.ncbi.nlm.nih.gov/articles/PMC4517606/]
- 4. Differences between SDS PAGE and Native PAGE [https://www.geeksforgeeks.org/biology/differences-between-sds-page-and-native-page/]
- 5. How Is Native PAGE Different from SDS-PAGE? [https://synapse.patsnap.com/article/how-is-native-page-different-from-sds-page]
- 6. High Resolution Clear Native Electrophoresis for In-gel ... [https://www.sciencedirect.com/science/article/pii/S153594762031690X]
- 7. High-resolution native electrophoresis in-gel activity assay ... [https://www.nature.com/articles/s41598-025-24684-3]
- 8. Advantages and limitations of clear-native PAGE [https://pubmed.ncbi.nlm.nih.gov/16220535/]
- 9. A Database of Accurate Electrophoretic Migration Patterns ... [https://www.sciencedirect.com/science/article/pii/S0022283622005605]
- 10. SDS-PAGE [https://en.wikipedia.org/wiki/SDS-PAGE]
- 11. How SDS-PAGE Separates Proteins [https://azurebiosystems.com/blog/how-sds-page-separates-proteins/]
- 12. Western blotting guide: Part 2, Protein separation by SDS- ... [https://www.jacksonimmuno.com/secondary-antibody-resource/technical-tips/western-blotting-guide-part-2/]
- 13. Interpret SDS-PAGE vs Native-PAGE Results [https://www.letstalkacademy.com/sds-page-vs-native-page-protein-dimer/]
- 14. The Evolution of SDS-Based Protein Separation [https://www.bio-techne.com/resources/blogs/advantages-of-ce-sds]
- 15. vs. Native - What's the Difference? | This vs. That Page SDS [https://thisvsthat.io/native-page-vs-sds]
- 16. Comparison of in-gel protein separation techniques ... [https://pmc.ncbi.nlm.nih.gov/articles/PMC4234072/]
- 17. Validation of blue- and clear-native polyacrylamide gel ... [https://pmc.ncbi.nlm.nih.gov/articles/PMC12445495/]
- 18. Acrylamide concentration determines the direction and ... [https://pmc.ncbi.nlm.nih.gov/articles/PMC3785759/]
- 19. Polyacrylamide Gel-electrophoresis across a Molecular ... [https://www.nature.com/articles/2141334a0]
- 20. On the mechanism of the molecular-sieve effect in ... [https://www.sciencedirect.com/science/article/abs/pii/S0021967300821937]
- 21. What is the difference between PAGE and SDS-PAGE? [https://www.aatbio.com/resources/faq-frequently-asked-questions/What-is-the-difference-between-PAGE-and-SDS-PAGE]
- 22. What's the Difference Between SDS-PAGE and Native ... [https://synapse.patsnap.com/article/whatE28099s-the-difference-between-sds-page-and-native-page]
- 23. Overview of SDS-PAGE [https://www.creative-proteomics.com/resource/overview-of-sds-page.htm]
- 24. Advantages and Disadvantages of SDS-PAGE for Protein ... [https://www.mtoz-biolabs.com/advantages-and-disadvantages-of-sds-page-for-protein-separation.html]
- 25. A Native PAGE Assay for the Biochemical Characterization ... [https://bio-protocol.org/en/bpdetail?id=4266&type=0]
- 26. On-chip protein separation with single-molecule resolution [https://www.nature.com/articles/s41598-020-72463-z]
- 27. Native SDS-PAGE: high resolution electrophoretic ... [https://pubs.rsc.org/en/content/articlelanding/2014/mt/c4mt00033a]
- 28. Deciphering food proteins: The applications of SDS-PAGE ... [https://www.sciencedirect.com/science/article/abs/pii/S2212429225003025]
- 29. Rapid baseline hump-free analysis of therapeutic proteins ... [https://pubmed.ncbi.nlm.nih.gov/40409905/]
- 30. Native PAGE eliminates the problem of PEG-SDS ... [https://pubmed.ncbi.nlm.nih.gov/17702059/]
- 31. Advantages and Disadvantages of SDS-PAGE Based ... [https://www.mtoz-biolabs.com/advantages-and-disadvantages-of-sds-page-based-protein-separation.html]
- 32. Blue native electrophoresis protocol [https://www.abcam.com/en-us/technical-resources/protocols/blue-native-electrophoresis]
- 33. Analysis of RNA Folding by Native Polyacrylamide Gel ... [https://pmc.ncbi.nlm.nih.gov/articles/PMC6343852/]
- 34. Comparison of different separation technologies for ... [https://www.sciencedirect.com/science/article/abs/pii/S0021967306011319]
- 35. Mastering Electrophoresis: Techniques, Equipment, and ... [https://www.labx.com/resources/mastering-electrophoresis-techniques-equipment-and-applications-in-dna-rna-and-protei/5535]
- 36. DNA Electrophoresis vs Protein Electrophoresis [https://blog.edvotek.com/2025/07/24/dna-electrophoresis-vs-protein-electrophoresis/]
- 37. and clear-native polyacrylamide gel electrophoresis protocols ... [https://journals.plos.org/plosone/article?id=10.1371/journal.pone.0332065]
- 38. Qualitative and quantitative evaluation of thylakoid complexes ... [https://plantmethods.biomedcentral.com/articles/10.1186/s13007-022-00858-2]
- 39. SDS-PAGE guide: Sample preparation to analysis [https://www.abcam.com/en-us/knowledge-center/western-blot/sds-page-guide]
- 40. Blue-native PAGE in plants: a tool in analysis of protein ... [https://plantmethods.biomedcentral.com/articles/10.1186/1746-4811-1-11]
- 41. Using native gel in two-dimensional PAGE for the detection ... [https://www.sciencedirect.com/science/article/abs/pii/S0165022X99000093]
- 42. Overview of Protein–Protein Interaction Analysis [https://www.thermofisher.com/us/en/home/life-science/protein-biology/protein-biology-learning-center/protein-biology-resource-library/pierce-protein-methods/overview-protein-protein-interaction-analysis.html]
- 43. A simple technique for the simultaneous determination of ... [https://www.sciencedirect.com/science/article/pii/S0165022X00001627]
- 44. Protein Complex Identification and quantitative ... [https://www.nature.com/articles/s41598-019-47829-7]
- 45. Western Blotting (Immunoblotting): History, Theory, Uses ... [https://pmc.ncbi.nlm.nih.gov/articles/PMC12303220/]
- 46. SDS-PAGE: The science behind all those bubbles [https://www.antibodiesinc.com/pages/sds-page-demystified?srsltid=AfmBOoqmPAttyiGb9W1zQ7gT-2jpXaoBSur6qb_CwfLmR-HR5UXTe41E]
- 47. Troubleshooting SDS-PAGE Gel Running Issues [https://www.goldbio.com/blogs/articles/troubleshooting-sds-page-gel-running-issues?srsltid=AfmBOopr91NoCgqhCeHRiYKDioiltCZn1xdTjFyHh1UtlQm_o0NzogjC]
- 48. Troubleshooting Sodium Dodecyl Sulfate- Polyacrylamide ... [https://www.hycultbiotech.com/sds-page/troubleshooting/]
- 49. 6 Best Tips for Troubleshooting Poor Band Separation on ... [https://azurebiosystems.com/blog/6-tips-for-troubleshooting-poor-band-separation-on-sds-page-gels/]
- 50. SDS-PAGE Troubleshooting: Why Are My Protein Bands ... [https://synapse.patsnap.com/article/sds-page-troubleshooting-why-are-my-protein-bands-fuzzy]
- 51. PHOS-TAG SDS-PAGE RESOLVES AGONIST [https://pmc.ncbi.nlm.nih.gov/articles/PMC5107338/]
- 52. Analysis of protein gels (SDS-PAGE) [https://www.ruf.rice.edu/~bioslabs/studies/sds-page/gellab3.html]
- 53. Detergent binding explains anomalous SDS-PAGE ... [https://pmc.ncbi.nlm.nih.gov/articles/PMC2644111/]
- 54. Comparison of the performance of 1D SDS-PAGE with ... [https://www.sciencedirect.com/science/article/abs/pii/S1570023218312546]
- 55. Specialized Protein Gels Support— Getting Started [https://www.thermofisher.com/us/en/home/technical-resources/technical-reference-library/protein-electrophoresis-western-blotting-support-center/specialized-protein-gels-support/specialized-protein-gels-support-getting-started.html]
- 56. Electrophoresis Power Supplies: Key Features and Buying ... [https://www.labx.com/resources/electrophoresis-power-supplies-key-features-and-buying-tips/5538]
- 57. How current, voltage, and power settings affect SDS-PAGE [https://www.biossusa.com/blogs/news/how-current-voltage-and-power-settings-affect-sds-page?srsltid=AfmBOorLB6yV0nDdndLVnBZbbK5F5Ff0bs0vSOSoT1rglxGOKm5CgbV7]
- 58. Controlling the separation of native proteins with ... [https://pmc.ncbi.nlm.nih.gov/articles/PMC10033466/]
- 59. COMPARING SDS-PAGE SYSTEMS [https://www.protocol-online.org/biology-forums-2/posts/19269.html]
- 60. Overview of Protein Electrophoresis [https://www.thermofisher.com/tr/en/home/life-science/protein-biology/protein-biology-learning-center/protein-biology-resource-library/pierce-protein-methods/overview-electrophoresis.html]
- 61. Advantage of discontinuous buffer system in SDS and native ... [https://www.letstalkacademy.com/advantage-of-discontinuous-buffer-system-in-sds-and-native-page/]
- 62. Size-Exclusion Chromatography–Mass Spectrometry ... [https://www.chromatographyonline.com/view/size-exclusion-chromatography-mass-spectrometry-analysis-mabs-biocompatible-flow-path]
- 63. Size exclusion chromatography: Fundamentals and ... [https://www.abcam.com/en-us/knowledge-center/proteins-and-protein-analysis/size-exclusion-chromatography-fundamentals-and-applications]
- 64. Analysis of Proteins by Size-Exclusion Chromatography ... [https://www.waters.com/nextgen/us/en/library/application-notes/2012/proteins-size-exclusion-chromatography-coupled-with-mass-spectrometry-under-non-denaturing-conditions.html?srsltid=AfmBOoqIwe_CRA3O2UbjqbM1T3n7zlu5EOdKAFpah8wF4PUqDcGeIarf]
- 65. How Does SDS-PAGE Work? A Comprehensive Guide [https://www.metwarebio.com/how-sds-page-works-guide/]
- 66. SDS protein interactions [https://www.sciencedirect.com/science/article/abs/pii/S0301462225001462]
- 67. DeFrND: detergent-free reconstitution into native ... [https://www.nature.com/articles/s41467-025-63275-8]