Mastering SDS-PAGE for Western Blotting: A Complete Guide to Optimal Sample Preparation and Separation
This comprehensive guide details the critical role of SDS-PAGE in Western blotting sample preparation for researchers and drug development professionals.
Mastering SDS-PAGE for Western Blotting: A Complete Guide to Optimal Sample Preparation and Separation
Abstract
This comprehensive guide details the critical role of SDS-PAGE in Western blotting sample preparation for researchers and drug development professionals. It covers foundational principles of protein separation by molecular weight, step-by-step methodological protocols for gel electrophoresis, systematic troubleshooting for common issues like smearing and poor transfer, and essential validation techniques using controls and markers. The article synthesizes established knowledge with practical optimization strategies to ensure reproducible, high-quality results in protein analysis for biomedical research.
SDS-PAGE Fundamentals: The Science Behind Protein Separation
In western blotting and other protein analysis techniques, Sodium Dodecyl Sulfate (SDS) plays an indispensable role by fundamentally modifying the physical properties of proteins to enable separation based on molecular weight. This anionic detergent performs two critical functions: it denatures complex protein structures into linear polypeptides and imparts a uniform negative charge to all proteins, effectively masking their intrinsic electrical charges [1] [2] [3]. This transformation is fundamental to SDS-Polyacrylamide Gel Electrophoresis (SDS-PAGE), ensuring that proteins migrate through the gel matrix at rates determined solely by their molecular size rather than their native charge or three-dimensional conformation [4]. Within the context of western blotting sample preparation, this principle guarantees that the electrophoretic separation accurately reflects protein size, which is crucial for subsequent identification and analysis using specific antibodies.
The Molecular Mechanism of SDS Action
Charge Uniformization Through SDS Binding
SDS molecules interact with protein structures in a highly consistent and predictable manner. The detergent binds to the protein backbone at an approximate ratio of 1.4 grams of SDS per 1 gram of protein, creating a negatively charged micelle-like structure around the polypeptide chain [2] [4]. Each SDS molecule contributes a sulfate group with a strong negative charge, effectively overwhelming any positively or negatively charged amino acid residues that constitute the native protein [3]. This extensive SDS coating ensures that all proteins in a mixture carry a uniform negative charge density, meaning the charge-to-mass ratio becomes essentially identical across different protein species [1] [4]. Consequently, when subjected to an electric field during electrophoresis, all proteins migrate toward the positive anode at rates determined exclusively by their ability to navigate the gel matrix pores, which correlates directly with molecular size [2].
Protein Denaturation and Linearization
The denaturing capability of SDS arises from its amphipathic molecular structure, featuring both a hydrophobic hydrocarbon tail and a hydrophilic sulfate head group [3]. The hydrophobic regions of SDS molecules interact strongly with nonpolar segments of proteins, while the ionic components disrupt hydrogen bonds and other non-covalent interactions that maintain secondary and tertiary structures [2] [3]. This combined action effectively unfolds native protein conformations into random coil structures, eliminating variations in molecular shape that would otherwise influence migration through the gel matrix [4]. For complete linearization, especially in proteins with disulfide bridges, reducing agents such as Dithiothreitol (DTT) or β-mercaptoethanol (BME) are added to break covalent bonds between cysteine residues, ensuring all proteins assume similar linear configurations [3] [5]. The resulting polypeptide-SDS complexes are linear molecules approximately 18 Angstroms wide with lengths proportional to their molecular weights, creating ideal conditions for molecular weight-based separation [4].
Diagram 1: Molecular mechanism of SDS action on proteins, showing transformation from native folded state to linear SDS-protein complex with uniform charge.
Quantitative Data on SDS-PAGE Separation
Gel Composition and Molecular Weight Separation Ranges
The polyacrylamide gel matrix serves as a molecular sieve, with its pore size determining the effective separation range for proteins of different sizes. The table below summarizes the relationship between acrylamide concentration and separable molecular weight ranges:
Table 1: Acrylamide Concentrations and Optimal Protein Separation Ranges [4]
| Acrylamide Percentage (%) | Effective Separation Range (kDa) |
|---|---|
| 7% | 50 - 500 kDa |
| 8 - 15% | 10 - 250 kDa |
| 10% | 20 - 300 kDa |
| 12% | 10 - 200 kDa |
| 12.5% | For Rab GTPases |
| 15% | 3 - 100 kDa |
| Gradient (5-20%) | Proteins with subtle MW differences |
For specific applications, gel composition can be optimized further. For instance, 7.5% acrylamide gels are recommended for analyzing large proteins like LRRK1 and LRRK2, while 12.5% gels provide better resolution for smaller proteins such as Rab GTPases [6]. The bis-acrylamide to acrylamide crosslinking ratio is typically maintained at approximately 1:35 to create the three-dimensional network that forms the molecular sieve [3].
Critical Buffer Components and Recipes
The discontinuous buffer system developed by Laemmli is essential for achieving sharp protein bands during SDS-PAGE. The following table outlines key buffer compositions and their functions:
Table 2: Essential Buffer Systems and Components in SDS-PAGE [7] [5] [8]
| Buffer/Component | Composition | Function |
|---|---|---|
| 2X Laemmli Sample Buffer | 4% SDS, 5% 2-mercaptoethanol, 20% glycerol, 0.004% bromophenol blue, 0.125 M Tris HCl, pH 6.8 | Denatures proteins, provides density for loading, visual tracking |
| RIPA Lysis Buffer | 150 mM NaCl, 1% NP-40 or Triton X-100, 0.5% sodium deoxycholate, 0.1% SDS, 50 mM Tris, pH 8.0 | Efficiently extracts proteins from cells and tissues |
| Stacking Gel | ~4% acrylamide, Tris-HCl, pH 6.8 | Concentrates proteins into sharp bands before separation |
| Separating Gel | 8-15% acrylamide, Tris-HCl, pH 8.8 | Separates proteins based on molecular weight |
| Running Buffer | Tris-Glycine-SDS, pH 8.3 | Conducts current and maintains SDS coating on proteins |
The pH transition between stacking gel (pH 6.8) and separating gel (pH 8.8) is crucial for the discontinuous buffer system to function properly [4]. At pH 6.8, glycine molecules in the running buffer exist predominantly in zwitterionic form with minimal net charge, migrating slowly until they reach the higher pH of the separating gel where they become fully negatively charged and migrate faster, leaving the proteins to separate by size [4].
Research Reagent Solutions for SDS-PAGE
Table 3: Essential Research Reagents for SDS-PAGE and Western Blotting [7] [6] [9]
| Reagent Category | Specific Examples | Primary Function |
|---|---|---|
| Detergents/Lysis Buffers | RIPA, NP-40, Tris-HCl, Triton X-100 | Solubilize and extract proteins from cellular or tissue samples |
| Reducing Agents | Dithiothreitol (DTT), β-mercaptoethanol (BME) | Break disulfide bonds to completely linearize proteins |
| Protease Inhibitors | PMSF (1 mM), Aprotinin (2 µg/mL), Leupeptin (1-10 µg/mL) | Prevent protein degradation during sample preparation |
| Phosphatase Inhibitors | Sodium fluoride (5-10 mM), Orthovanadate (1 mM) | Preserve phosphorylation states for phospho-protein analysis |
| Gel Polymerization Agents | Ammonium persulfate (APS), TEMED | Catalyze acrylamide polymerization to form the gel matrix |
| Protein Assays | BCA, Bradford | Quantify protein concentration for equal loading across gels |
| Molecular Weight Markers | Prestained protein ladders (10-180 kDa, 10-250 kDa) | Provide reference for estimating protein molecular weights |
Experimental Protocol for SDS-PAGE Sample Preparation
Sample Lysis and Protein Extraction
Proper sample preparation begins with efficient cell lysis and protein extraction. For adherent cells cultured in a 100mm dish, aspirate the culture medium and wash cells with ice-cold phosphate-buffered saline (PBS) [7] [9]. Add 1 mL of appropriate ice-cold lysis buffer (such as RIPA buffer for total protein extraction) containing freshly added protease and phosphatase inhibitors [7] [5]. Scrape adherent cells using a cell scraper and transfer the suspension to a microcentrifuge tube. For suspension cells, pellet by centrifugation at 2,500 × g for 10 minutes, wash with PBS, and resuspend the pellet in lysis buffer [7]. Incubate the cell suspension on ice for 10-30 minutes with occasional agitation to ensure complete lysis [9] [5]. Clarify the lysate by centrifugation at 14,000 × g for 15 minutes at 4°C and transfer the supernatant to a new tube [7].
Protein Quantification and Denaturation
Determine protein concentration using a bicinchoninic acid (BCA) assay or Bradford assay according to manufacturer protocols [7] [9]. The BCA assay is particularly advantageous as it is compatible with samples containing up to 5% detergents and demonstrates less protein-to-protein variation compared to Bradford assays [7]. Normalize samples to the lowest protein concentration by adding additional lysis buffer. For denaturation, mix normalized lysate with an equal volume of 2X Laemmli sample buffer [5]. For reduced conditions, include DTT or β-mercaptoethanol at final concentrations of 50-100 mM [3] [5]. Heat samples at 70-95°C for 5-10 minutes to complete denaturation [7] [9]. Avoid heating at 100°C for extended periods as this may promote proteolysis [7]. Load 10-50 μg of total protein per lane for optimal separation and detection [9] [8].
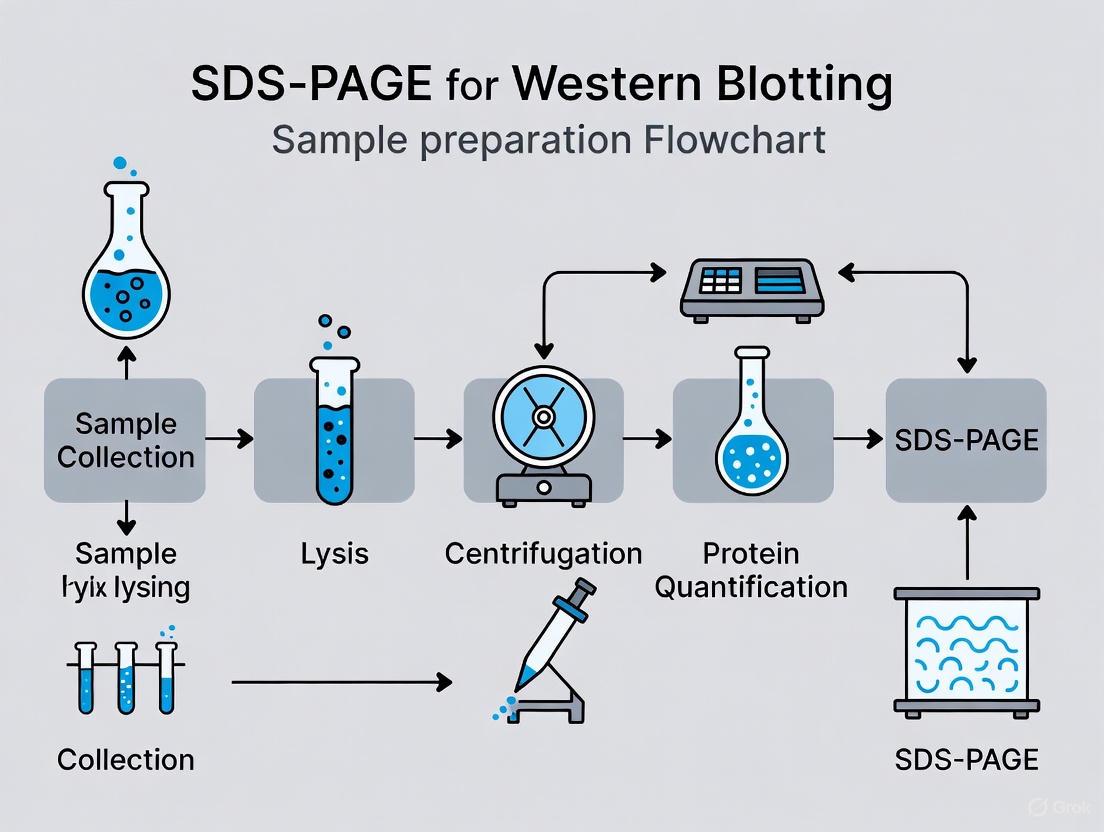
Diagram 2: Complete workflow for SDS-PAGE sample preparation, highlighting critical steps that ensure protein integrity and quantification accuracy.
Troubleshooting Common SDS-PAGE Issues
Protein Degradation and Poor Resolution
Protein degradation during sample preparation manifests as smeared bands across the gel. To prevent degradation, always prepare samples on ice or at 4°C and add fresh protease and phosphatase inhibitors to lysis buffers immediately before use [7] [5]. Aprotinin (targeting trypsin, chymotrypsin, and plasmin) should be used at 2 µg/mL, leupeptin (targeting lysosomal proteases) at 1-10 µg/mL, and PMSF (targeting serine proteases) at 1 mM concentration [5]. Incomplete denaturation appears as multiple bands for a single protein or vertical smearing. Ensure samples are properly heated (70-95°C for 5-10 minutes) in Laemmli buffer containing adequate SDS and reducing agents [7] [5]. Overheating samples (e.g., extended periods at 100°C) can promote proteolysis and should be avoided [7].
Irregular Band Patterns and Migration Artifacts
Uneven or distorted protein bands often result from improper sample loading or gel polymerization issues. To avoid distorted bands, be careful not to touch the bottom of wells with pipette tips during sample loading [9] [8]. Ensure complete polymerization of both stacking and resolving gels by allowing 30-60 minutes for polymerization at room temperature [6]. Poor stacking of proteins with insufficient concentration at the stacking-resolving gel interface can be addressed by verifying the pH of both stacking (pH 6.8) and resolving (pH 8.8) gels [4]. The discontinuous buffer system relies on the differential mobility of chloride and glycine ions at different pH levels to concentrate proteins into sharp bands before they enter the resolving gel [4].
The fundamental principle of SDS imparting uniform charge and denaturing proteins forms the cornerstone of reliable SDS-PAGE and western blotting. Through its dual mechanism of charge masking and protein linearization, SDS enables true molecular weight-based separation that is critical for accurate protein analysis. The experimental protocols outlined, when followed with attention to critical parameters such as buffer composition, protein quantification, and complete denaturation, ensure reproducible and interpretable results. Understanding these core principles allows researchers to effectively troubleshoot experimental challenges and optimize conditions for specific protein targets, ultimately enhancing the reliability of western blotting data in biomedical research and drug development.
Within the framework of investigating western blotting sample preparation, the polyacrylamide gel matrix stands as the fundamental component that enables the precise size-based separation of proteins. This application note details the core principles and methodologies of Sodium Dodecyl Sulfate-Polyacrylamide Gel Electrophoresis (SDS-PAGE), a technique that leverages this matrix to separate denatured proteins exclusively by their molecular weight [10] [11]. The reliability of SDS-PAGE makes it an indispensable first step in western blotting, forming the basis for accurate protein detection and analysis in research and drug development [12].
The principle of SDS-PAGE relies on a two-step process. First, proteins are denatured and uniformly coated with the negatively charged SDS detergent, which masks the proteins' intrinsic charges and confers a uniform charge-to-mass ratio [10] [13]. Second, these SDS-bound proteins are electrophoretically driven through a cross-linked polyacrylamide gel. This gel acts as a molecular sieve, where smaller proteins navigate the porous network more easily and migrate faster, while larger proteins are hindered and migrate more slowly [11]. This process results in the separation of a complex protein mixture into discrete bands based on molecular size [10].
Table 1: Key Reagents for SDS-PAGE Sample Preparation and Their Functions
| Reagent Category | Example Reagents | Function in Sample Preparation |
|---|---|---|
| Lysis Buffers | RIPA Buffer, NP-40 Buffer, T-PER [12] [7] | Solubilizes proteins from cells or tissues; choice depends on protein subcellular location and need for denaturing conditions [12]. |
| Detergent | Sodium Dodecyl Sulfate (SDS) [10] | Denatures proteins and confers a uniform negative charge, negating the influence of native protein charge on migration [10] [13]. |
| Reducing Agents | Dithiothreitol (DTT), β-Mercaptoethanol [10] [7] | Breaks disulfide bonds in proteins to fully unfold the polypeptide chains for accurate size-based separation [10]. |
| Protease/Phosphatase Inhibitors | PMSF, Aprotinin, Sodium Fluoride, Sodium Orthovanadate [12] [7] | Added to lysis buffers to prevent protein degradation and dephosphorylation by endogenous enzymes released during cell disruption [12]. |
| Sample Buffer | Laemmli Buffer [12] [10] | Contains SDS, reducing agent, glycerol to density-load samples, and a tracking dye (e.g., bromophenol blue) to monitor electrophoresis progress [12]. |
Theoretical Foundation of the Molecular Sieve
The Polyacrylamide Gel Matrix
The polyacrylamide gel is created through the co-polymerization of acrylamide monomers and a cross-linking agent, most commonly methylenebisacrylamide [10]. The porosity of the resulting gel network, and thus its sieving properties, is determined by the concentration of acrylamide. A higher percentage of acrylamide creates a denser matrix with smaller pores, which is more effective at separating smaller proteins. Conversely, a lower percentage gel has larger pores and is better suited for resolving larger proteins [10] [13].
The standard SDS-PAGE setup employs a discontinuous gel system, which incorporates two distinct gel layers stacked vertically: a stacking gel and a separating gel (also called the resolving gel) [10]. The stacking gel, with a lower acrylamide concentration (typically 4-5%) and neutral pH, serves to concentrate all protein samples into a sharp, unified band before they enter the separating gel. The separating gel, with a higher acrylamide concentration (typically 8-15%) and basic pH (pH ~8.8), is where the actual size-based separation of proteins occurs [10]. This discontinuous system is critical for achieving high-resolution bands.
The Role of SDS in Protein Denaturation and Charge Uniformity
The key to separating proteins purely by size lies in the action of Sodium Dodecyl Sulfate (SDS). This anionic detergent binds to the hydrophobic regions of proteins in a constant ratio, approximately 1.4 g of SDS per 1.0 g of protein [10]. This extensive SDS coating accomplishes two critical goals: it disrupts nearly all the secondary and tertiary structure of the protein, linearizing the polypeptide chain, and it imparts a large, uniform negative charge that overwhelms the protein's inherent charge [10] [13]. Consequently, when an electric field is applied, all SDS-bound proteins migrate towards the anode with a mobility dependent solely on their molecular size, as the charge-to-mass ratio is nearly identical for all species [11].
Diagram 1: Protein denaturation and SDS-binding workflow. This process ensures proteins are linearized and uniformly charged, allowing separation by molecular weight alone.
Experimental Protocol for SDS-PAGE
Sample Preparation for Western Blotting
Proper sample preparation is the most critical factor for a successful western blot, as it directly impacts the quality of separation on the polyacrylamide gel [14] [7]. The overarching goal is to extract, denature, and reduce proteins without degradation or modification.
Cell Culture Lysate Preparation (Adherent Cells) [7]:
- Lysis: Place the cell culture dish on ice, wash cells with ice-cold PBS, and aspirate. Add ice-cold lysis buffer (e.g., RIPA buffer) supplemented with protease and phosphatase inhibitors (~1 mL per 10â· cells). Gently shake on ice for 5 minutes [7].
- Clarification: Scrape the lysate and transfer it to a microcentrifuge tube. Centrifuge at ~14,000 x g for 15 minutes at 4°C to pellet insoluble debris [7].
- Protein Quantification: Transfer the supernatant to a new tube. Determine protein concentration using a compatible assay, such as the BCA assay, which is tolerant of many detergents and denaturing agents found in lysis buffers [12] [7].
- Sample Denaturation: Dilute the protein lysate with an appropriate volume of sample buffer (e.g., 2X Laemmli buffer) containing SDS and a reducing agent (e.g., DTT). A common final volume is 10-20 µL. Heat the samples at 70°C for 10 minutes (or 95°C for 5 minutes) to fully denature the proteins [10] [7].
Tissue Lysate Preparation [7]:
- Homogenization: Dissect the tissue of interest and weigh it. Add ice-cold lysis buffer (e.g., T-PER or RIPA) at a ratio of ~50 mg tissue to 1,000 µL of buffer. Homogenize the tissue thoroughly on ice using a Dounce homogenizer, sonicator, or mechanical homogenizer [14] [7].
- Clarification and Quantification: Centrifuge the homogenate at 10,000 x g for 5 minutes to pellet debris. Transfer the supernatant and determine protein concentration as described for cell lysates [7].
Table 2: Lysis Buffer Selection Guide Based on Protein Localization [12] [7]
| Target Protein Location | Recommended Buffer Type | Key Characteristics |
|---|---|---|
| Whole Cell (Mild Lysis) | NP-40 or Triton X-100 Buffer | Non-denaturing detergents that preserve protein-protein interactions and native epitopes [12]. |
| Whole Cell (Strong Lysis) | RIPA Buffer | Contains ionic detergents (SDS, deoxycholate) effective for membrane-bound, nuclear, and mitochondrial proteins [12] [7]. |
| Cytoplasmic | Tris-HCl or NP-40-based Buffer | Mild buffers designed to lyse the plasma membrane while leaving nuclei intact [12]. |
| Membrane-Bound Proteins | RIPA Buffer | The combination of detergents helps solubilize hydrophobic membrane proteins [12]. |
| Nuclear | RIPA Buffer | Effective at disrupting the nuclear envelope; sample may require sonication or nuclease treatment to reduce viscosity from DNA [12]. |
Gel Electrophoresis and Protein Separation
The prepared samples are then loaded into the wells of the polyacrylamide gel for separation.
Gel Preparation and Electrophoresis [10]:
- Assemble the Gel Cast: Secure clean glass plates with spacers in a casting stand. The protocol below is for a discontinuous Tris-Glycine gel.
- Prepare and Cast the Separating Gel: Mix components for the separating gel (e.g., 1.5 M Tris-HCl pH 8.8, acrylamide/bis-acrylamide, 10% SDS, APS, and TEMED). Pour the solution between the glass plates, leaving space for the stacking gel. Overlay with a water-saturated alcohol (e.g., isopropanol) to create a flat interface. Allow the gel to polymerize completely [10].
- Prepare and Cast the Stacking Gel: After discarding the alcohol overlay, prepare the stacking gel solution (e.g., 0.5 M Tris-HCl pH 6.8, a lower percentage of acrylamide, SDS, APS, and TEMED). Pour it on top of the polymerized separating gel and immediately insert a sample comb. Allow to polymerize [10].
- Load Samples and Run Electrophoresis: Once set, remove the comb and place the gel into the electrophoresis chamber filled with running buffer (e.g., Tris-Glycine-SDS). Load equal amounts of total protein (e.g., 10-40 µg) from your prepared samples and a molecular weight marker (protein ladder) into the wells. Apply a constant voltage (e.g., 80-150 V) until the dye front migrates to the bottom of the gel [10] [7].
Diagram 2: SDS-PAGE workflow showing sample stacking and separation. Proteins are first focused into a sharp band in the stacking gel before being separated by size in the resolving gel.
Applications in Protein Analysis and Quality Control
The primary application of SDS-PAGE in the context of western blotting sample preparation is to separate proteins by molecular weight prior to transfer to a membrane. However, its utility extends far beyond this single step.
- Protein Purity and Integrity Assessment: SDS-PAGE is routinely used to analyze the purity of protein samples during purification and to check for protein degradation, which is visible as smearing or unexpected lower molecular weight bands on the gel [13].
- Molecular Weight Estimation: By comparing the migration distance of an unknown protein to that of standard proteins in a molecular weight marker, researchers can estimate the apparent molecular weight of the protein of interest [10].
- Analysis of Protein Complexes: Comparing samples run under reducing (with DTT/β-ME) and non-reducing (without reducing agent) conditions allows researchers to infer the presence of disulfide-bonded subunits within a protein complex [10] [13].
Troubleshooting Guide
Table 3: Common SDS-PAGE Issues and Solutions
| Problem | Potential Cause | Recommended Solution |
|---|---|---|
| Smearing Bands | Protein degradation; Overloaded sample. | Keep samples on ice; use fresh protease inhibitors. Load less protein [12] [7]. |
| Atypical Band Migration | Improper sample denaturation; Incomplete reduction. | Ensure samples are heated adequately (70-95°C). Use fresh reducing agent (DTT/β-ME) [10]. |
| Poor Resolution | Incorrect acrylamide percentage; Air bubbles in gel. | Choose gel % appropriate for target protein size. Pour gels carefully to avoid bubbles [10]. |
| No Bands | Insensitive staining; Low protein abundance. | Use more sensitive stain (e.g., silver stain) or load more protein. For western blotting, optimize antibody detection [10]. |
| Wavy Bands | Excess salt in sample; Uneven cooling. | Desalt samples or use sample clean-up. Ensure even heat dissipation during run [12]. |
Sodium Dodecyl Sulfate–Polyacrylamide Gel Electrophoresis (SDS-PAGE) is a cornerstone technique for protein separation based on molecular weight, and its efficacy in western blotting sample preparation hinges on a discontinuous buffer system utilizing two distinct gel layers [15] [16]. This system is ingeniously designed to overcome the key challenge of achieving high-resolution separation: if protein samples entered the resolving gel spread out over their entire loading volume, the result would be a smeared, uninterpretable band [15]. The discontinuous system solves this by leveraging differences in gel composition, pH, and buffer chemistry to concentrate the protein samples into a sharp, unified line before they begin the actual separation, thereby ensuring the sharply defined bands critical for accurate analysis in research and drug development [15] [17].
The foundation of this process is the detergent SDS, which plays two critical roles. First, it unfolds proteins by disrupting non-covalent bonds, causing them to lose their higher-order structures and become linear polypeptides [15] [16]. Second, SDS binds to the proteins with high affinity, effectively coating them with a uniform negative charge [15] [16]. This negates the proteins' intrinsic electrical charges, ensuring that their migration through the gel is determined solely by molecular weight, not by charge [16].
The Distinct Roles of Stacking and Resolving Gels
The discontinuous gel system comprises two layers with unique chemical and physical properties that work in concert. The table below summarizes the core differences between these two layers.
Table 1: Key Characteristics of Stacking and Resolving Gels
| Parameter | Stacking Gel | Resolving Gel |
|---|---|---|
| Primary Function | To concentrate and align all protein samples into a sharp band before they enter the resolving gel [15] [17] | To separate the focused proteins based on their molecular weight [15] [17] |
| Typical Acrylamide Percentage | Low (around 4-5%) [17] [16] | Higher (ranging from 8% to 20%, depending on target protein size) [18] [19] |
| pH Environment | Lower pH (6.8) [15] [17] | Higher pH (8.8) [15] [17] |
| Pore Size | Larger pores for freer protein movement [15] | Smaller pores, creating a molecular sieve that retards larger proteins more than smaller ones [15] [16] |
The Crucial Role of Glycine and the Stacking Mechanism
The mechanism of stacking is driven by the unique chemistry of glycine, an amino acid in the running buffer, and its interaction with the different pH environments of the two gels [15].
In the running buffer (pH 8.3), glycine exists predominantly as a negatively charged glycinate anion [15]. When the electric current is applied, these anions enter the stacking gel (pH 6.8). At this lower pH, a significant proportion of glycine molecules become zwitterions—neutral molecules with both positive and negative charges [15]. As a result, their electrophoretic mobility drops dramatically.
This sets up a critical dynamic with the highly mobile chloride ions (Clâ») from the Tris-HCl in the stacking gel. The chloride ions race ahead as a "leading ion" front, while the slow-moving glycine zwitterions form a "trailing ion" front [15]. The protein-SDS complexes, whose electrophoretic mobility is intermediate, are squeezed into a narrow, sharply defined zone between these two fronts. This process effectively "stacks" all proteins into a thin line, which is then ushered into the resolving gel [15].
Upon reaching the resolving gel (pH 8.8), the glycine zwitterions are rapidly deprotonated, regaining their negative charge and high mobility as glycinate anions. These anions then speed past the protein layer, depositing the now-concentrated proteins as a tight band at the top of the resolving gel, where the actual separation based on size begins [15].
Diagram: Ion Dynamics in Discontinuous SDS-PAGE
Experimental Protocol for Gel Casting and Electrophoresis
Reagent Preparation
The following table lists the essential reagents and their functions for preparing discontinuous SDS-PAGE gels.
Table 2: Key Research Reagent Solutions for SDS-PAGE
| Reagent / Component | Function in the Protocol |
|---|---|
| Acrylamide/Bis-acrylamide (30%) | Forms the polyacrylamide polymer matrix that acts as a molecular sieve [18] [16]. |
| Tris-HCl Buffer | Provides the buffering environment at specific pH levels (1.5 M, pH 8.8 for resolving gel; 0.5 M, pH 6.8 for stacking gel) [15] [18]. |
| Sodium Dodecyl Sulfate (SDS) | Anionic detergent that denatures proteins and confers a uniform negative charge [15] [16]. |
| Ammonium Persulfate (APS) | Initiator of the free-radical polymerization of acrylamide [18] [16]. |
| TEMED | Catalyst that acts with APS to accelerate acrylamide polymerization [18] [16]. |
| Glycine | Key amino acid in running buffer whose charge-state changes drive the stacking mechanism [15]. |
| Isopropanol | Layered on unpolymerized resolving gel to create a flat, oxygen-free interface [16]. |
Step-by-Step Gel Casting and Running Protocol
Part A: Casting the Discontinuous Gel This protocol is adapted for casting a standard 1.0 mm thick mini-gel system [18].
- Assemble Gel Cassette: Clean and assemble glass plates and spacers in the casting stand [16].
- Prepare Resolving Gel: Mix components for the resolving gel (see Table 3 for volumes). Add 10% APS and TEMED last, as they immediately initiate polymerization. Mix gently [18] [16].
- Pour Resolving Gel: Using a pipette, immediately transfer the resolving gel solution into the cassette. Leave space for the stacking gel (approx. 2.5 cm from the top) [18].
- Layer with Isopropanol: Carefully overlay the resolving gel with isopropanol to exclude air and ensure a flat surface [16]. Allow 30-45 minutes for complete polymerization [18].
- Prepare and Pour Stacking Gel: After polymerization, pour off the isopropanol and rinse with water. Mix the stacking gel components (Table 3), add APS and TEMED, and pour directly onto the polymerized resolving gel [18] [16].
- Insert Comb: Immediately insert a clean comb into the stacking gel, avoiding bubbles. Allow 20-30 minutes to polymerize fully [18].
Table 3: SDS-PAGE Gel Recipe for a 10% Resolving Gel (Volumes for 2 gels)
| Component | Resolving Gel (10%) | Stacking Gel (4-5%) |
|---|---|---|
| Hâ‚‚O | 4.0 mL | 3.78 mL |
| 30% Acrylamide Mix | 3.3 mL | 0.99 mL |
| 1.5 M Tris-HCl (pH 8.8) | 2.5 mL | - |
| 0.5 M Tris-HCl (pH 6.8) | - | 1.9 mL |
| 10% SDS | 100 µL | 75 µL |
| 10% APS | 50 µL | 37.5 µL |
| TEMED | 5 µL | 7.5 µL |
| Total Volume | ~10 mL | ~6.75 mL |
Part B: Sample Preparation and Electrophoresis
- Prepare Protein Samples: Mix protein lysate with Laemmli buffer (containing SDS, reducing agents like DTT or β-mercaptoethanol, glycerol, and tracking dye) [15] [12]. Heat samples at 95°C for 5-10 minutes to ensure complete denaturation [16].
- Load Gel: Place the polymerized gel into the electrophoresis chamber and fill with running buffer (25 mM Tris, 192 mM glycine, 0.1% SDS, pH 8.3) [19]. Carefully load equal amounts of protein (20-50 µg for cell lysates) and a molecular weight marker into the wells [19].
- Run Electrophoresis: Connect the power supply (cathode at the top, anode at the bottom) and run at a constant voltage. A standard setting is 100-150 V until the dye front reaches the bottom of the gel (approx. 1-2 hours) [19]. Bubbles will form at the electrodes due to the electrolysis of water, confirming the circuit is complete [15].
- Downstream Processing: Following electrophoresis, the gel can be stained for direct protein visualization or used for western blotting, where proteins are transferred to a membrane for antibody-based detection [12] [20].
Optimization and Technical Considerations
Choosing the Correct Acrylamide Percentage
The resolution of proteins is critically dependent on the acrylamide percentage of the resolving gel. The appropriate percentage should be selected based on the molecular weight of the target protein(s) to achieve optimal separation [18] [19].
Table 4: Gel Percentage Selection Guide Based on Protein Size
| Target Protein Size (kDa) | Recommended Gel Percentage |
|---|---|
| 4 - 40 | 15 - 20% [18] [19] |
| 12 - 45 | 15% [18] [19] |
| 10 - 70 | 12.5% [18] [19] |
| 15 - 100 | 10% [18] [19] |
| 25 - 200 | 8% [18] |
| > 200 | 4 - 6% [19] |
For samples containing proteins of widely varying sizes, gradient gels (e.g., 4-20% acrylamide) are recommended as they provide a broad separation range and sharper bands across the entire gel [19].
Troubleshooting Common Issues
- Smearing or Poor Resolution: This can result from incomplete denaturation of proteins. Ensure samples are heated sufficiently with SDS and reducing agents [16]. Overloading protein can also cause smearing.
- Atypical Migration: If a protein runs at a molecular weight different from expected, consider post-translational modifications (e.g., glycosylation, phosphorylation) which can alter SDS binding and mobility [15].
- Wavy Bands: This is often due to excess heat during the run. Running the gel at a lower voltage or in a cold room can improve band straightness [12].
The discontinuous SDS-PAGE system, with its strategic use of stacking and resolving gels, remains an indispensable tool for protein analysis. A deep understanding of the underlying principles—the pH-induced changes in glycine charge and the creation of a mobility gradient—enables researchers to reliably produce the sharp, well-separated protein bands essential for accurate western blotting. Proper execution of the gel casting protocol, combined with informed optimization of parameters like acrylamide percentage, ensures robust and reproducible results, forming a critical foundation for successful research and diagnostic applications.
Within the framework of advanced research on SDS-PAGE for western blotting sample preparation, a meticulous understanding of the core chemical components is paramount for success. This application note provides an in-depth analysis of the three fundamental reagent classes—SDS, reducing agents, and buffer systems—that govern protein denaturation, stability, and electrophoretic mobility. For researchers and drug development professionals, optimizing these components is not a mere preliminary step but a critical process that directly impacts the resolution, specificity, and reproducibility of protein analysis, thereby influencing downstream conclusions in biomarker discovery and therapeutic development.
The Core Chemical Trio: Functions and Mechanisms
The integrity of an SDS-PAGE experiment hinges on the synergistic action of SDS, reducing agents, and buffering systems. Each component addresses a specific challenge in preparing a complex protein mixture for size-based separation.
Sodium Dodecyl Sulfate (SDS): The Denaturing Charge Conferrer
SDS is a strong anionic detergent that serves two primary, interdependent functions in sample preparation [21]. First, it binds to the hydrophobic regions of proteins, disrupting hydrogen bonds and van der Waals forces. This action effectively unfolds or denatures proteins, dismantling their secondary and tertiary structures to produce linear polypeptide chains [22]. Second, SDS coats the protein backbone at a relatively constant ratio of about 1.4 g SDS per 1.0 g protein [21]. Given its negatively charged sulfate head group, this uniform coating imparts a uniform negative charge to all proteins [22]. Consequently, the intrinsic charge of a protein is masked, and all proteins gain a similar charge-to-mass ratio. This allows separation by polyacrylamide gel electrophoresis (PAGE) to proceed primarily on the basis of molecular weight rather than native charge or shape [23] [22].
Reducing Agents: The Disulfide Bond Disruptors
While SDS unfolds most of a protein's structure, it cannot break covalent disulfide bonds that stabilize tertiary and quaternary structures. Reducing agents, such as β-mercaptoethanol (β-ME) or Dithiothreitol (DTT), are incorporated into the sample buffer for this purpose [24]. These compounds reduce disulfide bridges between cysteine residues, converting cystine into two cysteine molecules [24]. This action ensures that multimeric protein complexes are dissociated into individual subunits and that all proteins are converted to their fully linear, monomeric forms. This is a prerequisite for accurate molecular weight determination, as a protein's migration distance will otherwise reflect its oligomeric state rather than the mass of its polypeptide chain(s).
Buffer Systems: The pH and Environment Regulators
Buffers are essential for maintaining a stable pH throughout the sample preparation and electrophoresis process, which is critical for controlling protein charge and migration. The sample buffer, typically Laemmli buffer, contains Tris-HCl to maintain a stable pH during denaturation [24]. The entire system operates within a specific pH range to ensure that SDS remains negatively charged and proteins are fully denatured. The correct ionic strength, provided by components like NaCl, is also vital for minimizing protein aggregation and unwanted ionic interactions [25].
Table 1: Key Components of SDS-PAGE Sample Buffer and Their Functions
| Component | Primary Function | Mechanism of Action | Key Consideration |
|---|---|---|---|
| SDS (Sodium Dodecyl Sulfate) | Denature proteins and impart negative charge [21] [22] | Binds protein backbone, masking intrinsic charge; unfolds 2° and 3° structure [24] | Binding can vary slightly with hydrophobicity or PTMs (e.g., glycosylation) [21] |
| Reducing Agent (e.g., DTT, β-ME) | Reduce disulfide bonds [24] | Breaks S-S bonds, dissociating multimers and linearizing subunits [24] | Essential for accurate MW determination of disulfide-linked proteins; can be omitted for "non-reduced" analysis |
| Glycerol | Increase sample density [21] [24] | Allows sample to sink to bottom of gel well during loading [24] | Prevents sample diffusion and ensures even loading across wells |
| Tracking Dye (e.g., Bromophenol Blue) | Visualize migration [21] [24] | Provides a visible front to monitor electrophoresis progress [24] | Small size migrates faster than proteins, signaling when to stop run |
Experimental Protocol for Sample Preparation
The following detailed protocol is designed for the preparation of protein lysates from mammalian cell culture, a common starting point for western blotting in research and drug development pipelines.
Reagent Preparation
- Lysis Buffer Selection: Choose an appropriate lysis buffer based on the subcellular localization of your target protein [7] [24]. RIPA buffer is suitable for membrane-bound, nuclear, or mitochondrial proteins, while NP-40 Lysis Buffer is milder and recommended for whole-cell or cytoplasmic extracts [7] [24].
- Inhibitor Cocktail: Freshly add protease and phosphatase inhibitors to the lysis buffer to prevent protein degradation and post-translational modification loss [7] [24]. A typical cocktail includes PMSF (1 mM for serine proteases), EDTA (1-5 mM for metalloproteases), Sodium Fluoride (5-10 mM), and Orthovanadate (1 mM) [24].
- 2X Laemmli Sample Buffer: Prepare a standard 2X reducing sample buffer containing 4% SDS, 10% glycerol, 0.125 M Tris HCl (pH 6.8), 0.004% Bromophenol Blue, and 5% β-mercaptoethanol or 100 mM DTT [24].
Cell Lysis and Protein Extraction
- Wash and Aspirate: For adherent cells, place the culture dish on ice, carefully aspirate the media, and wash the cell monolayer with ice-cold Phosphate-Buffered Saline (PBS) [7] [24].
- Add Lysis Buffer: Aspirate the PBS and add ice-cold lysis buffer (~1 mL per 10â· cells or a 100 mm plate) [7].
- Scrape and Recover: Using a cell scraper, dislodge the cells from the plate and transfer the suspension to a pre-chilled microcentrifuge tube.
- Incubate and Centrifuge: Agitate the lysate gently for 30 minutes at 4°C to complete lysis. Centrifuge at approximately 14,000 x g for 15 minutes at 4°C to pellet insoluble debris [7] [8].
- Collect Supernatant: Transfer the clarified supernatant (the protein lysate) to a new tube placed on ice. Discard the pellet.
Protein Quantification and Sample Denaturation
- Determine Concentration: Quantify the protein concentration of the lysate using a compatible protein assay, such as the BCA assay or Bradford assay [7] [8]. The BCA assay is particularly advantageous as it is compatible with samples containing up to 5% detergents and shows less protein-to-protein variability [7].
- Dilute and Mix: Dilute the lysate to the desired concentration and mix an equal volume of lysate with an equal volume of 2X Laemmli Sample Buffer [24]. A typical total protein load is 10-50 μg per lane [8] [24].
- Denature and Reduce: Heat the mixture at 95-100°C for 5 minutes in a heat block or water bath to fully denature and reduce the proteins [8] [24].
- Brief Spin: Centrifuge the denatured samples at high speed for 1 minute to collect any condensation before loading onto the gel [23].
The Discontinuous Buffer System in SDS-PAGE
The standard SDS-PAGE setup employs a sophisticated discontinuous buffer system that utilizes different pH values and gel densities to concentrate proteins into a sharp stack before they enter the resolving gel, leading to superior band resolution [21].
Diagram 1: Discontinuous SDS-PAGE Buffer Mechanism
In the stacking gel (pH ~6.8), glycine from the running buffer exists primarily as a zwitterion with minimal net charge, causing it to migrate slowly [21]. Chloride ions (Clâ») from the Tris-HCl in the gel are highly mobile. This creates a steep voltage gradient between the fast Clâ» front (leading ion) and the slow glycine front (trailing ion). Proteins, with their intermediate mobility, are compressed into a razor-thin zone between these two fronts [21]. Upon reaching the resolving gel (pH ~8.8), glycine gains a strong negative charge and ionizes into glycinate anions, allowing it to migrate rapidly [21]. The proteins, now deposited at the top of the dense resolving gel and no longer compressed, begin to separate based solely on their molecular weight as they are sieved through the polyacrylamide matrix.
Troubleshooting and Optimization Guide
Even with a sound understanding of the principles, optimization is often required for challenging protein targets.
Table 2: Troubleshooting Common Sample Preparation Issues
| Problem | Potential Cause | Recommended Solution |
|---|---|---|
| Smeared Bands | Incomplete denaturation or reduction; high salt concentration [25] | Add fresh reducing agent; ensure boiling for 5 min at 95-100°C; reduce salt concentration to <500 mM [25] |
| Multiple/Unexpected Bands | Protein degradation, oxidation, or dephosphorylation [25] | Use fresh protease/phosphatase inhibitors; include fresh reducing agents in buffer [25] |
| Weak or No Signal | Over- or under-loading of protein; incomplete transfer | Quantify protein concentration accurately before loading (e.g., BCA assay) [7] [25] |
| Protein Running at Incorrect MW | Post-translational modifications (e.g., glycosylation, phosphorylation) affecting SDS binding [21] | Consider if PTMs are expected; use bioinformatics tools to predict protein behavior [25] |
Advanced Optimization Strategies
- Gel Percentage Selection: The optimal acrylamide concentration depends on the molecular weight of your target protein. Use lower percentages (e.g., 8-10%) for high molecular weight proteins (>100 kDa) and higher percentages (e.g., 12-15%) for low molecular weight proteins (<50 kDa) [25] [8]. Gradient gels (e.g., 4-20%) can resolve a broad size range simultaneously.
- Alternative Conditions: Some antibodies recognize conformational epitopes that are destroyed by denaturation. For such targets, native PAGE (omitting SDS and reducing agents) or non-reducing SDS-PAGE (omitting the reducing agent only) may be necessary [7] [24].
- Heating Temperature: While 95-100°C is standard, excessive heat can promote protein aggregation or proteolysis for some sensitive proteins. A lower denaturation temperature of 70°C for 10 minutes can be a effective alternative [7].
Research Reagent Solutions
A successful western blot begins with high-quality, specific reagents. The following toolkit is essential for the sample preparation workflow.
Table 3: Essential Research Reagent Solutions for SDS-PAGE Sample Preparation
| Reagent Category | Specific Examples | Critical Function in Workflow |
|---|---|---|
| Lysis Buffers | RIPA Buffer, NP-40 Lysis Buffer, T-PER [7] [8] [24] | Solubilize proteins from cells/tissues; choice depends on protein localization and solubility [7] [24] |
| Protease & Phosphatase Inhibitors | PMSF, Aprotinin, Leupeptin, Sodium Fluoride, Sodium Orthovanadate [7] [24] | Preserve protein integrity and phosphorylation states by inhibiting endogenous enzymes [7] [24] |
| Sample (Loading) Buffer | Laemmli Buffer (2X, 4X, 6X), Reducing or Non-Reducing formulations [8] [24] | Denature, reduce, and color-tag proteins for electrophoresis; density agent ensures proper gel loading [21] [24] |
| Reducing Agents | Dithiothreitol (DTT), β-Mercaptoethanol (β-ME), Tris(2-carboxyethyl)phosphine (TCEP) [24] | Linearize proteins by breaking disulfide bonds for accurate molecular weight analysis [24] |
| Protein Assay Kits | BCA Assay, Bradford Assay [7] [8] | Accurately determine protein concentration for equal loading across gel lanes, essential for quantification [7] [25] |
Choosing the Right Gel Percentage for Your Target Protein Size
Within the framework of optimizing western blotting sample preparation, the selection of an appropriate polyacrylamide gel concentration for sodium dodecyl sulfate-polyacrylamide gel electrophoresis (SDS-PAGE) is a critical foundational step. SDS-PAGE separates proteins based solely on their molecular weight, a process enabled by the denaturing action of SDS, which confers a uniform negative charge and linearizes the proteins [26]. The polyacrylamide gel acts as a molecular sieve, where the pore size, determined by the gel percentage, dictates the resolution of proteins within specific molecular weight ranges [27]. Selecting an incorrect gel percentage is a prevalent source of poor band separation, leading to inaccurate molecular weight determination and compromised detection in subsequent western blotting. This guide provides detailed protocols and data to enable researchers and drug development professionals to make informed decisions for optimal protein separation.
The Principle of Protein Separation by SDS-PAGE
The core principle of SDS-PAGE is the separation of denatured proteins according to their molecular weight as they migrate through a polyacrylamide gel matrix under an electric field [26]. The anionic detergent SDS plays a dual role: it denatures proteins by breaking non-covalent interactions, unfolding them into linear chains, and it coats the polypeptides with a uniform negative charge [26]. This process negates the influence of a protein's inherent charge or complex three-dimensional structure, ensuring that migration is dependent primarily on size [27].
The polyacrylamide gel, formed through the polymerization of acrylamide and a cross-linker, creates a porous mesh. The size of these pores is inversely related to the percentage of acrylamide; a higher percentage gel creates a tighter mesh with smaller pores, while a lower percentage gel creates a more open matrix with larger pores [27]. Consequently, smaller proteins migrate more rapidly through the gel matrix, while larger proteins are impeded and migrate more slowly [26]. The following diagram illustrates the workflow and the logical relationship between protein size and gel percentage.
Gel Percentage Selection Guide
Choosing the correct acrylamide concentration is paramount for achieving high-resolution separation. As a general rule, low molecular weight proteins are best resolved on high-percentage gels, whereas large proteins require lower-percentage gels for sufficient resolution [28]. Using a gel with a pore size that is too small for a large protein will result in the protein being trapped near the top of the gel, while a small protein run on a low-percentage gel may migrate too quickly and poorly separate from other small proteins [27]. The tables below provide specific recommendations for single-concentration gels based on the molecular weight of your target protein.
Table 1: Recommended Gel Percentages for Protein Separation
| Protein Size (kDa) | Recommended Gel Percentage (%) | Protein Size (kDa) | Recommended Gel Percentage (%) |
|---|---|---|---|
| 4 - 40 | 20% [29] | 10 - 70 | 12.5% [28] |
| 12 - 45 | 15% [28] [29] | 15 - 100 | 10% [28] [29] |
| 25 - 200 | 7.5% [29] | 50 - 200 | 8% [28] |
| >200 | 4-6% [28] | >200 | 5% [29] |
For experiments targeting a single protein or proteins of similar size, a single-concentration gel is sufficient and recommended. However, when analyzing multiple proteins with significantly differing molecular weights, gradient gels are necessary [28] [29]. Gradient gels contain an increasing concentration of acrylamide from top to bottom, creating a pore size gradient that provides optimal separation for a very wide range of protein sizes on a single gel [28] [26]. The following decision chart provides a visual guide for selecting the appropriate gel type and percentage.
Experimental Protocols
Protocol: Casting a Single-Percentage Resolving Gel
This protocol details the preparation of a polyacrylamide resolving gel, adapted from general laboratory methods [29]. The recipe table below is formatted for a 10 mL gel, sufficient for a standard mini-gel format.
Table 2: Resolving Gel Recipes for Different Acrylamide Percentages
| Reagent | Order | 5% | 7.5% | 10% | 12% | 15% |
|---|---|---|---|---|---|---|
| dHâ‚‚O | 1 | 5.61 mL | 4.78 mL | 3.98 mL | 3.28 mL | 2.34 mL |
| 1.5 M Tris-HCl, pH 8.8 | 2 | 2.5 mL | 2.5 mL | 2.5 mL | 2.5 mL | 2.5 mL |
| 10% (w/v) SDS | 3 | 100 µL | 100 µL | 100 µL | 100 µL | 100 µL |
| 30% Acrylamide/Bis (29.2:0.8) | 4 | 1.67 mL | 2.5 mL | 3.3 mL | 4.0 mL | 5.0 mL |
| 10% (w/v) Ammonium Persulfate (APS) | 5 | 50 µL | 50 µL | 50 µL | 50 µL | 50 µL |
| TEMED | 6 | 5 µL | 5 µL | 5 µL | 5 µL | 5 µL |
Procedure:
- Clean and Assemble: Clean the glass plates and spacers thoroughly and assemble the gel cassette according to the manufacturer's instructions [29].
- Mix Resolving Gel: In a beaker or conical flask, combine dHâ‚‚O, Tris-HCl (pH 8.8), SDS, and Acrylamide/Bis solution in the volumes specified in Table 2 for your desired gel percentage. Caution: Acrylamide is a potent neurotoxin; wear gloves and appropriate personal protective equipment.
- Initiate Polymerization: Immediately before pouring, add 10% APS and TEMED. Swirl gently to mix. Do not vortex. TEMED catalyzes polymerization, so work quickly from this point.
- Pour the Gel: Using a pipette, immediately transfer the gel solution into the gap between the glass plates. Leave sufficient space for the stacking gel (comb height plus ~1 cm).
- Overlay: Carefully overlay the gel solution with water-saturated butan-1-ol or deionized water to expel air and create a flat, even interface.
- Polymerize: Allow the gel to polymerize completely for 15-60 minutes at room temperature. A distinct schlieren line will appear between the gel and the overlay once polymerization is complete.
Protocol: Preparing and Loading Samples for SDS-PAGE
Proper sample preparation is critical for clear and accurate results. Common issues like smearing, distortion, and poor resolution often originate at this stage [30] [31] [27].
Sample Preparation:
- Denature Protein: Mix the protein sample with an equal volume of 2X Laemmli sample buffer (containing SDS and a reducing agent like DTT or β-mercaptoethanol). The final concentration of reducing agent should be less than 50 mM for DTT or less than 2.5% for β-mercaptoethanol to prevent artifacts [30].
- Heat Denature: Heat the samples at 98°C for 5 minutes to fully denature the proteins [27]. Critical step: After heating, immediately place the samples on ice to prevent gradual cooling and protein renaturation [27].
- Brief Centrifuge: Centrifuge the samples briefly to collect condensation.
Gel Loading:
- Prepare Gel: Once the resolving gel has polymerized, pour off the overlay. Rinse the gel surface with deionized water and remove any residual liquid with a tissue wick.
- Pour Stacking Gel: Prepare and pour the stacking gel (see Table 3 for recipe), insert the comb, and allow it to polymerize for ~30 minutes [29].
- Load Samples: Install the gel in the electrophoresis apparatus and fill the tank with 1X running buffer (25 mM Tris base, 192 mM glycine, 0.1% SDS, pH 8.3) [28].
- Rinse Wells: Before loading, rinse the wells with a small amount of running buffer to remove unpolymerized acrylamide and air bubbles, which can cause sample leakage and distorted bands [31].
- Load Carefully: Load 10-50 µg of cell lysate or 10-100 ng of purified protein per lane [28]. Do not overfill wells; a maximum of 3/4 of the well's capacity is a general rule [31]. Include a prestained protein ladder in one lane for molecular weight reference.
- Run Gel: Connect the power supply and run the gel at a constant voltage of 100-150 V for 40-60 minutes, or until the dye front reaches the bottom of the gel [26].
Table 3: Stacking Gel Recipe (5 mL)
| Reagent | Order | Volume |
|---|---|---|
| dHâ‚‚O | 1 | 3.05 mL |
| 0.5 M Tris-HCl, pH 6.8 | 2 | 1.25 mL |
| 10% (w/v) SDS | 3 | 50 µL |
| 30% Acrylamide/Bis (29.2:0.8) | 4 | 650 µL |
| 10% (w/v) APS | 5 | 25 µL |
| TEMED | 6 | 10 µL |
The Scientist's Toolkit: Essential Reagents and Materials
Table 4: Key Research Reagent Solutions for SDS-PAGE
| Item | Function & Application Notes |
|---|---|
| Acrylamide/Bis Solution (30%) | Pre-mixed monomer and cross-linker for forming the polyacrylamide gel matrix. Handle with extreme care as it is a neurotoxin. [29] |
| Tris-HCl Buffer (1.5 M, pH 8.8) | Provides the appropriate alkaline pH for the resolving gel, crucial for the stacking and separation principles of discontinuous SDS-PAGE. [29] |
| Tris-HCl Buffer (0.5 M, pH 6.8) | Provides the lower pH environment required for the stacking gel to concentrate proteins before they enter the resolving gel. [29] |
| 10% SDS (Sodium Dodecyl Sulfate) | Anionic detergent used to denature proteins and confer a uniform negative charge. Added to both gels and running buffer. [28] [26] |
| Ammonium Persulfate (APS) & TEMED | Catalysts for the polymerization reaction of acrylamide. APS is the initiator, and TEMED is the accelerator. Must be fresh for efficient polymerization. [29] [27] |
| Protein Molecular Weight Marker | A set of proteins of known size run alongside samples to estimate the molecular weight of unknown proteins. Available prestained (to monitor run and transfer) or unstained (for accurate size determination). [28] [32] |
| Electrophoresis Running Buffer | Typically 1X Tris-Glycine-SDS buffer (25 mM Tris, 192 mM glycine, 0.1% SDS). Conducts current and maintains pH and SDS concentration during the run. Should be fresh for optimal results. [28] [27] |
| 2X Laemmli Sample Buffer | Contains SDS, glycerol (for density), a reducing agent (DTT/BME), and bromophenol blue (tracking dye). Prepares the protein sample for denaturing gel electrophoresis. [30] |
| Dcpib | Dcpib, CAS:82749-70-0, MF:C22H28Cl2O4, MW:427.4 g/mol |
| DC-S239 | DC-S239, MF:C15H15N3O5S, MW:349.4 g/mol |
Troubleshooting Common Issues
Poor band separation and distortion can stem from various issues in sample preparation, gel formulation, and electrophoresis conditions. The table below summarizes common problems and their solutions.
Table 5: Troubleshooting Poor Band Separation and Other Common Issues
| Observed Problem | Potential Cause | Recommended Solution |
|---|---|---|
| Poor Band Separation/ Smearing | Incorrect gel percentage for protein size [27]. | Refer to Table 1 and select an appropriate gel percentage. Use a gradient gel for wide size ranges [28]. |
| Incomplete protein denaturation [27]. | Ensure proper heating (5 min, 98°C) and immediate cooling on ice. Check SDS and reducing agent concentrations [27]. | |
| Too much protein loaded per lane [30] [27]. | Reduce the sample load. For mini-gels, a maximum of 0.5 µg per band or 10–15 µg of cell lysate per lane is recommended [30]. | |
| Vertical Smiling/ Frowning Bands | Gel running too hot (smiling) or uneven current [26]. | Run the gel at a lower voltage for a longer duration or use a cooling apparatus [27]. |
| Bands Not Straight/ Lane Widening | High salt concentration in sample (>100 mM) [30]. | Dialyze samples or use a concentrator to desalt and reduce salt concentration below 100 mM [30]. |
| DNA contamination [30]. | Shear genomic DNA by sonication or pass samples through a fine-gauge needle to reduce viscosity [30]. | |
| No Bands or Weak Bands | Insufficient protein transfer or low protein [30]. | Check transfer efficiency by staining the gel post-transfer. Increase the amount of protein loaded [30]. |
| Protein Aggregation in Well | Protein precipitation or aggregation [31]. | Ensure sample solubility by adequate homogenization. Add 4-8M urea for hydrophobic proteins. Add DTT/BME to lysis solution [31]. |
| Sample Leaking from Well | Air bubbles in well or overfilling [31]. | Rinse wells with running buffer before loading. Do not load a well more than 3/4 of its capacity [31]. |
| Insufficient glycerol in loading buffer [31]. | Check that the sample buffer contains enough glycerol (or sucrose) to make the sample denser than the running buffer. |
Proven SDS-PAGE Protocol: From Sample Prep to Electrophoresis
Optimal Protein Extraction and Quantification Methods (Bradford, BCA)
Within the framework of SDS-PAGE and western blotting research, the accuracy of experimental results is fundamentally dependent on two critical upstream processes: effective protein extraction and precise protein quantification. Protein extraction involves the liberation of proteins from their biological matrix (cells or tissues) into a soluble form, while maintaining their integrity and preventing degradation [7]. Protein quantification is the subsequent precise measurement of protein concentration, which is essential for loading equal amounts of protein across gel lanes, thereby ensuring valid comparisons and reliable downstream analysis [33]. The failure to optimize these initial steps can introduce significant variability, compromise detection sensitivity, and lead to erroneous interpretations in western blotting.
The Bradford and Bicinchoninic Acid (BCA) assays represent two of the most prevalent colorimetric methods for determining protein concentration. Despite sharing a common purpose, their underlying chemical principles differ substantially, informing their specific applications and limitations. The Bradford assay operates on a single-step mechanism where the Coomassie Brilliant Blue G-250 dye binds primarily to basic amino acids (arginine, lysine) in proteins under acidic conditions [34] [35]. This binding induces a shift in the dye's absorbance maximum from 465 nm (reddish-brown) to 595 nm (blue), with the intensity of the blue color being proportional to the protein concentration [35].
In contrast, the BCA assay is a two-step process that occurs under alkaline conditions. First, proteins reduce Cu²⺠to Cu¹⺠in a reaction known as the biuret reaction. Second, the bicinchoninic acid (BCA) reagent chelates the cuprous ion (Cu¹âº), forming a stable, water-soluble purple-colored complex that exhibits a strong absorbance peak at 562 nm [36] [37] [38]. The extent of this color formation is dependent not only on specific amino acids (cysteine, cystine, tyrosine, and tryptophan) but also on the peptide backbone itself, which contributes to greater uniformity across different proteins compared to the Bradford method [36] [38].
Comparative Analysis: Bradford vs. BCA Assays
Selecting the appropriate quantification assay is a critical decision that depends on the nature of the protein sample, the buffer composition, and the required precision. The table below provides a detailed comparison of the key characteristics of the Bradford and BCA assays to guide this selection.
Table 1: Comprehensive comparison of the Bradford and BCA protein quantification assays.
| Parameter | Bradford Assay | BCA Assay |
|---|---|---|
| Fundamental Principle | Dye-binding to basic amino acids; color shift from brown (465 nm) to blue (595 nm) [34] [35] | Protein-mediated reduction of Cu²⺠to Cu¹âº; chelation by BCA to form purple complex (562 nm) [36] [37] |
| Key Chemical Basis | Ionic/hydrophobic interactions with Arg, Lys, His, Tyr [34] | Biuret reaction; reduction by peptide bonds and specific amino acids (Cys, Cys, Tyr, Trp) [36] [38] |
| Detection Range | 1–200 μg/mL (microplate) [34] | 20–2,000 μg/mL (standard protocol) [36] [37] |
| Sensitivity | High (detects as low as 1–20 μg/mL) [35] | Moderate (detects as low as 5–25 μg/mL) [36] [35] |
| Dynamic Range | Narrower [35] | Broader [35] |
| Assay Time | Rapid (~5–10 minutes) [35] | Longer (30 min at 37°C to 2 hours at RT) [36] [37] [35] |
| Compatibility with Detergents | Low tolerance; high concentrations interfere significantly [35] | High tolerance; compatible with most ionic and non-ionic detergents (e.g., up to 5%) [36] [7] |
| Protein-to-Protein Variation | High variability; response depends on amino acid composition [36] [35] | More consistent; less affected by protein compositional differences [36] [35] |
| Interfering Substances | Detergents (SDS, Triton X-100), strong bases [34] | Reducing agents (DTT, β-mercaptoethanol), copper chelators (EDTA, EGTA) [36] |
The choice between these two assays can be streamlined into a logical decision-making process. The following workflow diagram outlines the key questions to ask when selecting the optimal method for your samples.
Diagram 1: Protein assay selection workflow.
Protein Extraction for Western Blotting
Effective protein extraction is the foundational step that dictates the success of all subsequent procedures. The primary goal is to solubilize proteins completely while preserving their native state or ensuring proper denaturation for SDS-PAGE, and most critically, preventing proteolytic degradation.
Lysis Buffer Selection
The choice of lysis buffer is dictated by the subcellular localization of the target protein and the required protein state (native or denatured) for downstream analysis. The table below summarizes recommended buffers for different scenarios.
Table 2: Recommended lysis buffers for protein extraction from mammalian cells and tissues.
| Target Protein Location | Recommended Buffer | Buffer Description & Key Characteristics |
|---|---|---|
| Whole Cell (Total Protein) | M-PER or T-PER Reagent [7] | Mild, non-denaturing detergent in a bicine buffer. Preserves protein-protein interactions and enzymatic activity. |
| Membrane-Bound, Nuclear, or Mitochondrial | RIPA Lysis Buffer [7] | Harsh, iconic detergent buffer (contains NaCl, NP-40/Triton X-100, sodium deoxycholate, and SDS). Effective for solubilizing difficult proteins. |
| Cytoplasmic | NP-40 Lysis Buffer [7] | Moderate, non-ionic detergent buffer (Tris, NaCl, EDTA, NP-40). Ideal for extracting cytoplasmic proteins while leaving nuclei intact. |
Standardized Extraction Protocol
The following protocol is optimized for the extraction of total protein from adherent mammalian cell cultures for western blotting [7].
Materials Required:
- Ice-cold Phosphate-Buffered Saline (PBS)
- Appropriate ice-cold lysis buffer (see Table 2)
- Protease and Phosphatase Inhibitor Cocktail (e.g., Halt Cocktail, Pierce Tablets)
- Cell scraper
- Microcentrifuge tubes
- Refrigerated microcentrifuge
Procedure:
- Inhibit Proteolysis: Add protease and phosphatase inhibitor cocktail to the lysis buffer immediately before use (e.g., 10 µL of 100X cocktail per 1 mL of buffer) [7].
- Wash Cells: Place the culture dish on ice. Aspirate the culture medium and gently wash the cell monolayer with ice-cold PBS to remove serum proteins.
- Lyse Cells: Aspirate the PBS completely. Add ice-cold lysis buffer (~100–200 µL per 10ⶠcells or for a 6-well plate) to the cells. Tilt the plate to ensure complete coverage [7].
- Harvest Lysate: Using a cell scraper, dislodge the cells and transfer the lysate to a pre-chilled microcentrifuge tube. Incubate on ice for 5–15 minutes with occasional vortexing.
- Clarify Lysate: Centrifuge the lysate at approximately 14,000 × g for 15 minutes at 4°C to pellet insoluble cell debris and genomic DNA [7].
- Collect Soluble Protein: Carefully transfer the supernatant (the soluble protein extract) to a new pre-chilled microcentrifuge tube. Discard the pellet.
- Store: The protein extract can be aliquoted and stored at -80°C for long-term preservation. Avoid repeated freeze-thaw cycles.
Protein Quantification Protocols
Following extraction, precise quantification of the protein concentration in the clarified lysate is mandatory for loading consistent amounts of protein onto SDS-PAGE gels.
BCA Assay Protocol (Microplate Format)
The BCA assay is highly recommended for general-purpose protein quantification, especially when using detergent-containing lysis buffers like RIPA [7].
Materials Required:
- Pierce BCA Protein Assay Kit (Reagents A and B) [36]
- Bovine Serum Albumin (BSA) standards (e.g., 2 mg/mL stock)
- 1X PBS or the same buffer used for sample preparation
- Clear 96-well microplate
- Microplate reader capable of measuring absorbance at 562 nm
Procedure:
- Prepare Standard Curve: Serially dilute the BSA stock in the same buffer as your unknown samples to create a standard curve covering the range of 0 to 2000 µg/mL. A typical 8-point curve includes 0, 25, 125, 250, 500, 750, 1000, and 1500 µg/mL standards [38].
- Prepare Working Reagent (WR): Mix 50 parts of BCA Reagent A with 1 part of BCA Reagent B (50:1, A:B ratio). Prepare sufficient volume for 200 µL per well [7] [38].
- Pipette Samples: Add 25 µL of each standard and unknown sample replicate into the wells of the microplate.
- Add Working Reagent: Add 200 µL of the WR to each well. Mix the plate thoroughly on a plate shaker for 30 seconds to ensure homogeneity [7].
- Incubate: Cover the plate and incubate at 37°C for 30 minutes. Alternatively, incubation can be performed at room temperature for 2 hours for higher sensitivity [36] [37].
- Measure Absorbance: Cool the plate to room temperature. Measure the absorbance of each well at 562 nm using a microplate reader [7] [38].
- Calculate Concentration: Generate a standard curve by plotting the average absorbance of each BSA standard against its known concentration. Use the linear regression equation of the standard curve to calculate the protein concentration of the unknown samples, factoring in any dilutions made.
Bradford Assay Protocol (Microplate Format)
The Bradford assay is ideal for quick, sensitive quantification of samples in compatible, detergent-free buffers.
Materials Required:
- Coomassie Brilliant Blue G-250 dye reagent (Bradford Reagent)
- Bovine Serum Albumin (BSA) standards
- 1X PBS or compatible buffer
- Clear 96-well microplate
- Microplate reader capable of measuring absorbance at 595 nm
Procedure:
- Prepare Standard Curve: Prepare BSA standards in the range of 0 to 200 µg/mL (e.g., 0, 10, 20, 40, 80, 120, 160, 200 µg/mL) using a buffer compatible with the dye [34].
- Pipette Samples: Add 5–10 µL of each standard and unknown sample into the microplate wells.
- Add Dye Reagent: Add 250 µL of Bradford dye reagent to each well. Mix thoroughly immediately after addition.
- Incubate: Incubate the plate at room temperature for at least 5 minutes. The color is stable but may begin to fade after approximately 1 hour [37] [34].
- Measure Absorbance: Read the absorbance at or near 595 nm using a microplate reader [34].
- Calculate Concentration: Generate a standard curve and calculate the unknown sample concentrations as described for the BCA assay.
The Scientist's Toolkit: Essential Research Reagents
A successful western blotting experiment relies on a suite of specialized reagents. The following table catalogs the essential materials required for the protein extraction and quantification workflows described in this document.
Table 3: Essential research reagents and materials for protein extraction and quantification.
| Item | Function/Application | Example Product (Supplier) |
|---|---|---|
| Protease/Phosphatase Inhibitor Cocktail | Prevents co-purifying proteases and phosphatases from degrading target proteins and altering phosphorylation states during extraction. | Halt Cocktail (Thermo Fisher) [7] |
| RIPA Lysis Buffer | A robust, denaturing lysis buffer for efficient extraction of total protein, particularly effective for membrane-bound and nuclear proteins. | RIPA Lysis Buffer (Cell Signaling Technology) [7] |
| BCA Protein Assay Kit | A detergent-compatible kit for accurate colorimetric quantification of total protein concentration based on bicinchoninic acid. | Pierce BCA Protein Assay Kit (Thermo Fisher) [36] [7] |
| Bovine Serum Albumin (BSA) Standards | A highly pure, stable protein used to generate a standard curve for relative protein quantification in colorimetric assays. | Albumin Standard (Thermo Fisher) [38] |
| SDS Sample Buffer (Loading Buffer) | Denatures proteins and imparts a negative charge for separation by SDS-PAGE. Contains SDS, a buffer, and a tracking dye. | Laemmli Sample Buffer (Bio-Rad) [39] |
| SDS-PAGE Gel | A polyacrylamide gel matrix used to separate denatured proteins based on their molecular weight under an electric field. | Precast Protein Gels (Various suppliers) |
| Nitrocellulose or PVDF Membrane | A porous membrane to which separated proteins are transferred from the gel for subsequent antibody probing. | Nitrocellulose Membrane (Cell Signaling Technology) [39] |
| Degrasyn | Degrasyn, CAS:856243-80-6, MF:C19H18BrN3O, MW:384.3 g/mol | Chemical Reagent |
| Dehydrocholic Acid | Dehydrocholic Acid, CAS:81-23-2, MF:C24H34O5, MW:402.5 g/mol | Chemical Reagent |
Troubleshooting and Best Practices
Even with optimized protocols, researchers may encounter challenges. Adhering to best practices can prevent common issues and ensure data integrity.
- Addressing Interference in BCA Assays: The BCA assay is susceptible to interference from reducing agents and copper chelators. If your sample contains DTT, β-mercaptoethanol, or EDTA, consider [36]:
- Dilution: Diluting the sample to a point where the interfering substance no longer affects the assay.
- Reagent Adjustment: Increasing the amount of Reagent B (Cu²âº) in the working reagent to compensate for chelators (e.g., 4 mL Reagent B per 100 mL Reagent A instead of 2 mL).
- Protein Precipitation: Precipitating proteins using cold acetone or TCA to remove interfering substances, then redissolving the pellet in a compatible buffer.
- Ensuring Accurate Pipetting: Viscous or foamy samples, particularly those containing SDS, can lead to significant pipetting errors. To mitigate this, use a single pipette tip per sample and withdraw the sample only once, avoiding repeated aspirations with the same tip [38].
- Validating the Standard Curve: The accuracy of quantification hinges on a high-quality standard curve. Always use a fresh serial dilution of the standard protein (typically BSA) and ensure the correlation coefficient (R²) of the curve is greater than 0.95 [34]. For precise quantification of an unknown protein, select a standard protein that is similar in composition to your sample (e.g., use bovine gamma globulin for antibody samples) [38].
- Sample Preparation for Electrophoresis: After quantification, prepare samples for SDS-PAGE by mixing the protein lysate with SDS sample buffer and a reducing agent (e.g., DTT). Heat the samples at 70–100°C for 5–10 minutes to ensure complete denaturation [7] [39]. It is critical to load equal masses of protein (e.g., 20–40 µg) per lane, not equal volumes, to enable direct comparison.
The journey to a successful and publication-quality western blot begins long before the electrophoresis power supply is turned on. It is rooted in the rigorous optimization of protein extraction and quantification. The BCA assay emerges as the more robust and versatile choice for most western blotting applications, particularly due to its superior tolerance for the detergents essential for effective protein solubilization and its reduced protein-to-protein variability [36] [35]. Conversely, the Bradford assay offers a valuable tool for rapid, sensitive quantification of samples in simple, detergent-free buffers [35]. By understanding the principles, advantages, and limitations of each method, and by adhering to the detailed protocols and best practices outlined in this document, researchers can establish a solid foundation for their SDS-PAGE and western blotting experiments, ensuring the generation of reliable, reproducible, and meaningful scientific data.
Within the framework of SDS-PAGE for western blotting sample preparation, proper protein denaturation is a critical prerequisite for obtaining reliable and interpretable results. The processes of boiling and the use of reducing agents work in concert to dismantle the native structure of proteins, ensuring they are linearized and uniformly coated with sodium dodecyl sulfate (SDS). This is essential for achieving separation based primarily on molecular weight during electrophoresis [40] [26]. Failure to optimize these steps can lead to protein aggregation, degradation, or incomplete denaturation, which subsequently compromises band resolution, antibody recognition in western blotting, and the accuracy of molecular weight estimation [40] [41]. This application note provides detailed protocols and data-driven guidelines to standardize sample denaturation for research and drug development applications.
The Role of Denaturation in SDS-PAGE
The fundamental goal of sample preparation for SDS-PAGE is to convert complex, three-dimensional protein structures into linear, negatively charged polypeptides. This transformation is achieved through a combination of chemical and physical treatments.
The anionic detergent SDS plays a dual role: it disrupts hydrogen bonds and hydrophobic interactions, effectively unfolding the protein, and it binds to the polypeptide backbone at a relatively constant ratio of approximately 1.4 g SDS per 1 g of protein [42]. This binding confers a uniform negative charge density, masking the protein's intrinsic charge and allowing migration through the polyacrylamide gel to be determined almost solely by molecular size [26] [43]. The rate of migration is inversely proportional to the logarithm of the molecular weight, enabling size estimation [42].
However, SDS alone is insufficient to break down all structural elements. Disulfide bonds, which covalently link cysteine residues, can maintain tertiary or quaternary structure. The addition of reducing agents, such as Dithiothreitol (DTT) or β-mercaptoethanol (BME), is necessary to reduce these disulfide bonds, separating polypeptide chains and enabling complete linearization [40] [41]. The final step, heat denaturation (boiling), provides the kinetic energy required to overcome stabilizing interactions and ensures that proteins are fully denatured before entering the gel [41]. The synergy of SDS, reducing agents, and heat is what makes SDS-PAGE a powerful tool for protein analysis.
Optimized Boiling Protocols
While a standard boiling condition of 95–100°C for 5 minutes is effective for many proteins, a one-size-fits-all approach can be detrimental to specific protein classes [40]. The following protocols and table summarize optimized conditions tailored to different protein characteristics.
Standard Boiling Protocol
This protocol is suitable for most routine proteins, particularly small to medium-sized soluble proteins.
- Materials: Protein lysate, Laemmli sample buffer (1X final concentration; containing 2% SDS, glycerol, bromophenol blue, and 62.5 mM Tris-HCl at pH 6.8) [42], reducing agent (e.g., 100 mM DTT or 5% β-mercaptoethanol), heating block or water bath.
- Method:
- Mix the protein lysate with an equal volume of 2X Laemmli sample buffer. For a final volume of 25 µL, combine 12.5 µL of lysate with 12.5 µL of 2X buffer [43].
- Add a reducing agent if not already present in the buffer. For example, add DTT to a final concentration of 10-100 mM or β-mercaptoethanol to 1-5% [43].
- Vortex the mixture briefly and centrifuge to collect the contents at the bottom of the tube.
- Heat the samples at 95–100°C for 5 minutes in a heating block or boiling water bath [40].
- Briefly centrifuge the boiled samples (e.g., 3 minutes) to pellet any insoluble debris and remove condensation [40] [43].
- The samples are now ready to be loaded onto an SDS-PAGE gel or stored at -20°C for later use.
Specialized Boiling Conditions
Table 1: Optimized Denaturation Conditions for Specific Protein Types
| Protein Type | Temperature | Duration | Key Rationale | Protocol Reference |
|---|---|---|---|---|
| Standard Proteins | 95–100 °C | 5 min | Ensures complete denaturation for accurate molecular weight separation. | [40] |
| Large Proteins (>150 kDa) | 70 °C | 5–10 min | Prevents aggregation that can hinder gel entry and migration. | [40] |
| Heat-Sensitive Proteins | 70 °C | 5–10 min | Reduces risk of degradation or loss of antigenicity for sensitive epitopes. | [40] |
| Phosphorylated Proteins | Avoid Boiling | 15–30 min (RT) | Preserves phosphorylation-sensitive epitopes degraded by high heat. | [40] |
Method for Heat-Sensitive & Large Proteins: Follow the standard protocol, but incubate at 70°C for 5-10 minutes instead of boiling [40]. This lower temperature facilitates SDS binding and partial denaturation while minimizing aggregation and degradation.
Method for Phosphorylated Proteins:
- Mix the protein lysate with Laemmli sample buffer containing a reducing agent.
- Omit the heating step. Instead, incubate the mixture at room temperature for 15-30 minutes to allow for denaturation without damaging sensitive epitopes [40].
- Centrifuge and load the sample as usual.
Reducing Agent Usage
Reducing agents are critical for complete denaturation, and the choice of agent can impact the results.
- Dithiothreitol (DTT): A strong reducing agent, often used at a final concentration of 10-100 mM. It is preferred for more complete reduction of stubborn disulfide bonds [41]. However, DTT is less stable than β-mercaptoethanol over the long term.
- β-mercaptoethanol (BME): A commonly used reducing agent, typically added to a final concentration of 1-5% (v/v) to the sample buffer [43]. It is effective for most applications but has a stronger odor.
For routine work, either agent is sufficient. If incomplete reduction is suspected (evidenced by high molecular weight smears or bands), substituting or increasing the concentration of DTT may be beneficial [41]. To prevent reformation of disulfide bonds after heating, a supplemental addition of DTT or BME can be made post-boil, or EDTA can be added to the buffer to chelate metals and inhibit oxidation [44].
The Scientist's Toolkit: Essential Reagents
Table 2: Key Research Reagent Solutions for Sample Denaturation
| Reagent / Solution | Core Function | Typical Composition / Notes |
|---|---|---|
| Laemmli Sample Buffer | Denatures proteins, provides charge, and adds density for gel loading. | 62.5 mM Tris-HCl (pH 6.8), 2% SDS, 10% glycerol, 0.002% bromophenol blue [42]. Often sold as a 2X or 4X concentrate. |
| SDS (Sodium Dodecyl Sulfate) | Primary denaturant; binds proteins and imparts uniform negative charge. | Anionic detergent used at 0.1-4% in buffers [26] [42]. Critical for masking intrinsic protein charge. |
| DTT (Dithiothreitol) | Reducing agent; breaks disulfide bonds. | Stronger reducing agent. Use at 10-100 mM final concentration. Prepare fresh for optimal activity [41]. |
| β-mercaptoethanol (BME) | Reducing agent; breaks disulfide bonds. | Common alternative to DTT. Use at 1-5% (v/v) final concentration [43]. |
| Protease Inhibitors | Prevents protein degradation during sample preparation. | Added to lysis buffers to inhibit endogenous proteases, preserving protein integrity. |
| Delapril | Delapril, CAS:83435-66-9, MF:C26H32N2O5, MW:452.5 g/mol | Chemical Reagent |
| Delphinidin Chloride | Delphinidin Chloride, CAS:528-53-0, MF:C15H11ClO7, MW:338.69 g/mol | Chemical Reagent |
Integrated Experimental Workflow
The sample denaturation process is one key step in a larger workflow for preparing samples for western blotting. The following diagram illustrates the critical decision points from sample collection to gel loading.
Troubleshooting Denaturation Issues
Incomplete or improper denaturation is a common source of poor results in SDS-PAGE and western blotting. The table below outlines common issues, their causes, and solutions.
Table 3: Troubleshooting Guide for Sample Denaturation
| Observed Issue | Potential Cause | Recommended Solution |
|---|---|---|
| Protein Aggregation | High temperature causing large proteins to clump. | For proteins >150 kDa, reduce heating temperature to 70°C for 5-10 min [40]. |
| Loss of Antigenicity | Heat-sensitive epitopes denatured. | Use reduced temperature (70°C) or room temperature incubation instead of boiling [40]. |
| Incomplete Denaturation | Inadequate heat, missing/inactive reducing agent. | Ensure proper boiling temperature/duration; use fresh DTT or β-mercaptoethanol [40] [41]. |
| High MW Smears/Bands | Reducing agent oxidized and inactivated. | Add fresh DTT/β-mercaptoethanol after heating or include EDTA in the buffer [44]. |
| Poor Resolution/Streaking | Insufficient SDS binding or protein precipitation. | Ensure correct SDS concentration; centrifuge sample post-boil before loading [42] [44]. |
Robust and reproducible western blotting begins with meticulous sample preparation. The denaturation step, governed by the precise application of heat and reducing agents, is foundational. By moving beyond a single standard protocol and adopting the protein-specific strategies outlined here—such as lower heat for large proteins and room-temperature preparation for phosphoproteins—researchers and drug development professionals can significantly enhance the quality of their SDS-PAGE separations. This, in turn, ensures more reliable downstream analysis, accurate quantification, and valid scientific conclusions.
In the context of western blotting sample preparation research, sodium dodecyl sulfate-polyacrylamide gel electrophoresis (SDS-PAGE) remains an indispensable technique for separating complex protein mixtures by molecular weight. The foundation of a successful western blot lies in the quality of the polyacrylamide gel, whose properties are determined during the casting process. The polymerization reaction between acrylamide and bis-acrylamide, catalyzed by ammonium persulfate (APS) and tetramethylethylenediamine (TEMED), creates the porous matrix essential for protein separation. Mastering this process is critical for researchers and drug development professionals who require precise, reproducible protein analysis. This application note provides a detailed protocol and troubleshooting guide for reliable gel casting, ensuring optimal performance for subsequent western blotting applications.
The Chemistry of Gel Polymerization
The formation of a polyacrylamide gel is a vinyl addition polymerization reaction that creates a three-dimensional network through the cross-linking of acrylamide monomers with N,N'-methylenebisacrylamide (bis-acrylamide) [42]. This process is fundamentally a free radical-based cascade reaction, initiated by the synergistic action of APS and TEMED [45].
The polymerization mechanism proceeds through three distinct phases:
- Initiation: APS, a strong oxidizing agent, decomposes in water to produce sulfate free radicals. TEMED, a tertiary amine, acts as an accelerator by catalyzing the decomposition of APS and transferring unpaired electrons to the reaction, thereby dramatically increasing the rate of free radical generation [42] [45].
- Chain Elongation: These generated free radicals react with acrylamide monomers, converting them into free radical intermediates. These activated monomers then react with inactive acrylamide monomers in a chain propagation reaction, forming long, linear polymer chains.
- Cross-Linking and Termination: Throughout the elongation process, the bis-acrylamide cross-linker, which contains two reactive double bonds, incorporates into the growing polymer chains, creating a porous mesh. The polymerization reaction terminates when the free radicals are consumed, either by combining with another radical or by reacting with an inhibitor [42].
The efficiency of this reaction is highly dependent on pH, with optimal performance occurring between pH 8.0 and 9.0, which is the standard pH range for SDS-PAGE resolving gel buffers [45]. Understanding this chemical foundation is crucial for troubleshooting polymerization failures and optimizing gel consistency.
Materials and Reagents
Research Reagent Solutions
The following table details the essential materials and their specific functions in the gel casting process [18] [42] [46].
| Item | Function and Specification |
|---|---|
| Acrylamide/Bis-Acrylamide (30-40%) | Pre-mixed neurotoxic monomer and cross-linker that forms the gel matrix. Standard ratio is 29:1 or 37.5:1 (acrylamide:bis). |
| Tris-HCl Buffer (1.5 M, pH 8.8) | Buffering agent for the resolving gel, providing the optimal alkaline pH for polymerization and protein separation. |
| Tris-HCl Buffer (0.5/1.0 M, pH 6.8) | Buffering agent for the stacking gel, with a lower pH and acrylamide concentration for sample concentration. |
| Sodium Dodecyl Sulfate (SDS), 10% | Anionic detergent that confers a uniform negative charge to proteins, masking their intrinsic charge. |
| Ammonium Persulfate (APS), 10% | Initiator that provides free radicals to start the polymerization cascade. Must be prepared fresh for reliable results. |
| Tetramethylethylenediamine (TEMED) | Catalyst that accelerates the rate of free radical generation from APS. It is typically added last to the gel solution. |
| Isopropanol | Anhydrous alcohol used to overlay the resolving gel to exclude oxygen and ensure a flat, even polymerization surface. |
Equipment
- Gel casting apparatus (e.g., Mini-PROTEAN Tetra Cell Casting Module) including glass plates, spacers, and combs [46].
- Precision pipettes and tips.
- Serological pipettes.
- Reagent reservoirs (e.g., 15 mL or 50 mL conical tubes).
- Timer.
Safety Note: Acrylamide is a potent neurotoxin and suspected carcinogen. Always wear appropriate personal protective equipment, including gloves, and handle all solutions containing acrylamide in a fume hood. TEMED is flammable and has a strong, unpleasant odor; it should also be handled under a fume hood [42] [46].
Step-by-Step Gel Casting Protocol
Preparation of the Resolving Gel
- Assemble Casting Apparatus: Thoroughly clean the short and spacer plates with 70% ethanol or isopropanol and assemble the gel cassette within the casting module according to the manufacturer's instructions. Ensure a tight seal to prevent leakage [18] [46].
- Prepare Resolving Gel Mixture: In a 15 mL conical tube, combine all reagents for the desired acrylamide percentage except for APS and TEMED (see Table 1 for volumes). Vortex the mixture gently to ensure it is well-mixed [18] [46].
- Initiate Polymerization: Add the specified volume of 10% APS to the mixture, followed immediately by TEMED. Mix gently but swiftly by inverting the tube or using a serological pipette. Do not vortex after adding APS and TEMED, as this can introduce air bubbles that inhibit polymerization [18].
- Cast the Resolving Gel: Using a serological pipette, immediately transfer the resolving gel solution into the gap between the glass plates. Fill the cassette to approximately 2.5 cm below the top of the shorter glass plate to leave space for the stacking gel and comb [18].
- Overlay with Isopropanol: Slowly pipette a layer of isopropanol (or water-saturated butanol) on top of the unpolymerized resolving gel. This step is critical for excluding atmospheric oxygen, which inhibits polymerization, and for creating a flat, even interface [18] [47].
- Polymerize: Allow the gel to polymerize undisturbed at room temperature for 30-45 minutes. Polymerization is complete when a distinct schlieren line is visible between the polymerized gel and the isopropanol layer. Gently tilting the cassette will confirm that the gel has solidified if the meniscus remains stationary [18] [46].
Preparation of the Stacking Gel
- Remove Overlay and Rinse: Once the resolving gel has set, pour off the isopropanol layer. Use a lint-free tissue to wick away any residual liquid, and then rinse the top of the gel several times with deionized water to remove all traces of isopropanol. Wick away the final rinse completely [18].
- Prepare Stacking Gel Mixture: In a new tube, combine the stacking gel reagents (see Table 2) excluding APS and TEMED and mix. Then, add the specified volumes of 10% APS and TEMED, mixing quickly [18] [42].
- Cast the Stacking Gel and Insert Comb: Pour the stacking gel solution directly onto the polymerized resolving gel, filling the cassette completely. Immediately insert a clean, dry comb into the liquid stacking gel, being careful to avoid trapping air bubbles under the teeth. The comb should be slightly over-inserted to displace excess gel solution, which can be wiped away with a tissue [18].
- Final Polymerization: Allow the stacking gel to polymerize for 20-30 minutes. A refractive line will become visible between the stacking and resolving gels once polymerization is complete [46].
- Final Preparation: Carefully remove the comb by pulling it straight up in a slow, steady, vertical motion to prevent damage to the wells. Rinse each well thoroughly with deionized water to remove any unpolymerized acrylamide [18] [47]. The gel is now ready for immediate use or can be stored correctly.
Gel Storage Guidelines
For short-term storage, wrap the entire gel cassette in damp tissue paper (squeezed to remove excess water) and then seal it in a plastic wrap or bag. Label the package with the gel percentage, thickness, and date. Store at 4°C and use within one week for best results [18] [42] [46].
Formulations and Recipes
Quantitative Data for Gel Preparation
Table 1: Resolving Gel Formulations for a 15 mL Volume (for 4 x 0.75-mm gels)
| Component | 8% Gel | 10% Gel | 12% Gel | 15% Gel |
|---|---|---|---|---|
| 30% Acrylamide/Bis | 4.0 mL | 5.0 mL | 6.0 mL | 7.5 mL |
| 1.5 M Tris-HCl (pH 8.8) | 3.75 mL | 3.75 mL | 3.75 mL | 3.75 mL |
| 10% SDS | 150 µL | 150 µL | 150 µL | 150 µL |
| Deionized Hâ‚‚O | 7.02 mL | 6.02 mL | 5.02 mL | 3.52 mL |
| 10% APS | 75 µL | 75 µL | 75 µL | 75 µL |
| TEMED | 7.5 µL | 7.5 µL | 7.5 µL | 7.5 µL |
Table 2: Stacking Gel Formulation for a 5 mL Volume
| Component | Volume |
|---|---|
| 30% Acrylamide/Bis | 0.83 mL |
| 1.0 M Tris-HCl (pH 6.8) | 0.63 mL |
| 10% SDS | 50 µL |
| Deionized Hâ‚‚O | 3.4 mL |
| 10% APS | 25 µL |
| TEMED | 5 µL |
Table 3: Acrylamide Percentage and Protein Separation Range
| % Acrylamide in Resolving Gel | Effective Separation Range (kDa) |
|---|---|
| 8% | 25 - 200 |
| 10% | 15 - 100 |
| 12.5% | 10 - 70 |
| 15% | 12 - 45 |
Troubleshooting Polymerization and Casting Issues
Even with a meticulous protocol, issues can arise. The following table outlines common problems, their causes, and solutions [47] [48].
| Observation | Possible Cause | Recommended Solution |
|---|---|---|
| Gel does not polymerize | Degraded APS; Insufficient TEMED; Temperature too low. | Prepare fresh 10% APS solution; Ensure TEMED is not expired; Cast gels at room temperature [48] [46]. |
| Gel polymerizes too slowly/fast | Incorrect APS/TEMED ratios; Old reagents. | Optimize volumes of APS and TEMED; Use fresh reagents and adjust concentration if needed [48]. |
| Wavy or slanted well bottoms | Uneven overlay of resolving gel; Improper comb removal. | Ensure isopropanol is layered evenly and gently; Remove comb slowly and vertically immediately after polymerization [47]. |
| Samples leaking from wells | Damaged wells during comb removal; Old, cracked gel. | Remove comb after placing the gel in the running chamber filled with buffer; Use freshly cast gels [47]. |
| Smeared or distorted bands | Voltage too high; Air bubbles in gel; Salt concentration in sample too high. | Run gel at a lower voltage (e.g., 100-150V); Degas gel solution before adding APS/TEMED; Desalt protein samples [49] [48]. |
| Non-parallel protein bands | Uneven gel polymerization; Non-linear gel interface. | Ensure proper mixing of gel solutions; Use an isopropanol overlay to create a flat resolving gel surface [47]. |
Integration with Western Blotting Workflow
The successful casting of a high-quality SDS-PAGE gel is the first critical technical step in a western blotting experiment, directly impacting the clarity and reliability of the final result. A well-polymerized gel with sharp, parallel wells ensures that proteins are properly separated before transfer to a membrane. This process begins with meticulous sample preparation, where proteins are denatured in Laemmli buffer containing SDS and a reducing agent like DTT or β-mercaptoethanol, and heated at 70-95°C for 5-10 minutes to ensure linearization [42] [7]. The sample is then loaded into the hand-cast gel for electrophoretic separation.
Following electrophoresis, the separated proteins are transferred from the gel to a membrane for immunodetection. Imperfections in the gel, such as uneven polymerization, air bubbles, or smeared bands, will propagate through the entire workflow, leading to poor transfer efficiency, high background noise, and inconclusive or non-reproducible data. Therefore, mastery of the gel casting protocol detailed in this application note is not an isolated skill but a fundamental prerequisite for generating publication-quality western blot data in research and diagnostic contexts.
In the context of SDS-PAGE for western blotting sample preparation research, precise sample loading represents a critical foundational step that directly impacts experimental validity and reproducibility. Inaccurate loading techniques introduce significant variability that can compromise downstream protein separation, transfer efficiency, and ultimately, the reliability of immunodetection results. For researchers and drug development professionals, mastering these techniques is essential for generating quantitative data that accurately reflects biological phenomena rather than technical artifacts. This application note details standardized methodologies to achieve consistent sample loading while minimizing common pitfalls such as spillover and uneven distribution, thereby enhancing data quality throughout the western blotting workflow.
The Critical Role of Sample Preparation in Loading Accuracy
Proper sample preparation establishes the foundation for precise loading in SDS-PAGE. The process begins with protein extraction using appropriate lysis buffers (e.g., RIPA or NP-40) containing protease and phosphatase inhibitors to prevent degradation and maintain protein modifications [50] [9]. Following extraction, accurate protein quantification using colorimetric assays like Bradford or BCA is essential for normalizing concentrations across samples [51] [9]. Without this normalization step, subsequent efforts to load equal protein amounts become meaningless, potentially leading to misinterpretation of expression differences.
The prepared protein extract is then combined with Laemmli buffer, which contains several key components: glycerol to increase density for well settlement, SDS to denature proteins and impart uniform charge, bromophenol blue as a migration tracking dye, and a reducing agent such as beta-mercaptoethanol or DTT to break disulfide bonds [51]. This combination ensures proteins are properly denatured and reduced to their primary structure, allowing for accurate molecular weight separation during electrophoresis. Researchers should maintain a consistent 1:1 volume ratio of normalized protein extract to Laemmli buffer to maintain sample integrity and loading accuracy [51].
Techniques for Accurate Sample Loading and Spillover Prevention
Table 1: Recommended Protein Loading Amounts for Mini-Gels
| Sample Type | Recommended Amount | Purpose | Considerations |
|---|---|---|---|
| Cell Lysate | 10–40 µg | Routine target protein detection | Avoid exceeding well capacity; optimize for target abundance [9] [52] |
| Purified Protein | 10–500 ng | Detection of isolated proteins | Lower amounts often sufficient due to reduced complexity [9] |
| Molecular Weight Marker | 5 µL prestained ladder | Size estimation and transfer monitoring | Provides visual reference for run progress and transfer efficiency [52] |
Sample Well Preparation and Loading Technique
Utilize Appropriate Loading Tips: Specialized gel loading tips or micro-syringes enable precise delivery of samples into wells without introducing bubbles [52]. These tools feature elongated, fine diameters that access well bottoms without contact, facilitating smooth sample settlement.
Mind Well Capacity: Load approximately 80% or less of the total well volume to prevent spillover into adjacent lanes [52]. Overloading represents one of the most common causes of spillover, which leads to cross-contamination between samples and poorly resolved bands.
Maintain Consistent Technique: Avoid touching the bottom of wells with pipette tips, as this can create distorted bands and uneven loading [9] [52]. Hold the pipette at a consistent angle and depress the plunger smoothly to ensure uniform sample delivery across all wells.
Sample Organization and Strategic Loading
Strategic Sample Arrangement: When working with unique samples (e.g., wild type versus knock-out), avoid loading them in adjacent lanes to minimize potential impact from any spillover [52]. Place crucial experimental samples with adequate spacing and utilize border lanes for controls or markers.
Include Appropriate Controls: Always incorporate molecular weight markers for size reference and positive controls for antibody validation [52]. For quantitative comparisons, loading controls such as actin, GAPDH, or tubulin are essential to verify equal protein loading across lanes [52].
Diagram 1: Sample loading techniques impact on western blot results. Proper techniques prevent spillover and distortion.
Pre-Electrophoresis Sample Handling
Complete Denaturation: After thawing samples on ice, boil them at 100°C for 10 minutes immediately before loading to ensure complete denaturation [9]. Incomplete denaturation can cause abnormal migration patterns and affect separation accuracy.
Brief Centrifugation: Spin down samples briefly (5 minutes at 13,000 rpm) after boiling to collect condensation and ensure homogeneous distribution [50]. This simple step prevents air bubble introduction during loading and promotes consistent protein concentrations across replicates.
Quantitative Loading Verification Methods
Table 2: Protein Quantification Methods for Sample Normalization
| Method | Principle | Dynamic Range | Compatibility |
|---|---|---|---|
| Bradford Assay | Coomassie dye binding shift | 1-20 µg [51] | Compatible with most buffers; detergents may interfere |
| BCA Assay | Biuret reaction with bicinchoninic acid | 0.2-50 µg [9] | More tolerant of detergents than Bradford |
| Spectrophotometric (A280) | UV absorbance by aromatic residues | 0.1-100 µg | Requires pure samples without nucleic acid contamination |
Verifying loading accuracy extends beyond the loading process itself. After electrophoresis but prior to transfer, several verification methods can assess loading precision:
Total Protein Staining: Use reversible protein stains like Ponceau S on the membrane after transfer to visualize total protein pattern and confirm even loading across lanes [53]. This method provides immediate feedback on loading consistency before proceeding with immunodetection.
Loading Control Immunodetection: Incorporate antibodies against constitutive proteins (e.g., actin, tubulin, GAPDH) during the detection phase to normalize for potential loading variations [52]. This approach is particularly crucial when comparing protein expression across different samples or experimental conditions.
Densitometric Analysis: Utilize imaging software to quantify band intensities from total protein stains or loading controls, enabling statistical validation of loading precision and normalization of target protein signals [26].
Troubleshooting Common Loading Issues
Diagram 2: Troubleshooting guide for common sample loading issues in SDS-PAGE.
The Scientist's Toolkit: Research Reagent Solutions
Table 3: Essential Reagents for Precise Sample Loading
| Reagent/Material | Function | Application Notes |
|---|---|---|
| Lysis Buffers (RIPA, NP-40) | Protein extraction from cells/tissues | Supplement with protease/phosphatase inhibitors; match to protein localization [50] [9] |
| Protein Assay Kits (Bradford, BCA) | Protein quantification | Essential for normalization; BCA more compatible with detergents [51] [9] |
| Laemmli Buffer | Sample denaturation and loading | Contains SDS, glycerol, tracking dye; use with reducing agents for complete denaturation [51] |
| Specialized Gel Loading Tips | Precise sample delivery | Long, fine tips prevent well contact and bubble formation [52] |
| Molecular Weight Markers | Size reference and transfer monitoring | Prestained markers allow visualization during and after transfer [52] |
| Loading Controls | Normalization antibodies | Antibodies against constitutive proteins (actin, tubulin, GAPDH) verify equal loading [52] |
| Deltakephalin | Tyrosyl-threonyl-glycyl-phenylalanyl-leucyl-threonine Peptide | Research-grade peptide Tyrosyl-threonyl-glycyl-phenylalanyl-leucyl-threonine for metabolic and therapeutic studies. For Research Use Only. Not for human consumption. |
| Demecolcine | Demecolcine, CAS:477-30-5, MF:C21H25NO5, MW:371.4 g/mol | Chemical Reagent |
Precise sample loading represents a technical skill that merges meticulous preparation with consistent execution. The methodologies outlined in this application note provide researchers with a standardized framework for achieving loading accuracy while minimizing spillover in SDS-PAGE for western blotting. By implementing these techniques—including proper sample preparation, strategic loading practices, and verification methods—scientists can significantly enhance the reliability and reproducibility of their protein analysis data. In drug development and basic research contexts, such attention to technical fundamentals ultimately supports more robust conclusions regarding protein expression, modifications, and interactions, strengthening the scientific validity of research outcomes.
Within the framework of a thesis investigating western blotting sample preparation, the SDS-Polyacrylamide Gel Electrophoresis (SDS-PAGE) step is a critical determinant of success. Achieving clear resolution during this phase is non-negotiable for accurate protein analysis, which in turn impacts all downstream conclusions in drug development and basic research. This application note provides a detailed protocol focusing on the optimization of three interdependent parameters: voltage, time, and buffer selection. Proper manipulation of these conditions is essential for producing sharp, well-resolved protein bands and ensuring the reliability and reproducibility of experimental data.
Principles of SDS-PAGE Optimization
The fundamental goal of SDS-PAGE is to separate denatured proteins based solely on their molecular weight. This process relies on the application of an electric field to drive negatively charged protein-SDS complexes through a porous polyacrylamide gel matrix. The key to optimization lies in balancing the speed of separation with the maintenance of conditions that preserve band integrity.
The relationship between the electrical parameters is defined by the equation Power (P) = Current (I) x Voltage (V). Resistance (R) in the system, governed largely by the buffer composition, interacts with these parameters via Ohm's Law (V = I x R) [54]. Heat generation is an inevitable byproduct of this process and must be carefully managed, as excessive heat causes gel deformation, leading to "smiling" bands or warped gels where bands curve upwards at the edges [55] [54]. The choice between constant voltage, constant current, or constant power on modern power supplies offers different strategies for managing this heat and ensuring consistent migration [54].
Optimizing Voltage and Run Time
Selecting appropriate voltage and run time is a compromise between speed and resolution. A systematic approach is recommended to prevent common artifacts like smearing or smiling bands.
General Guidelines and Strategies
A two-phase electrophoretic run is widely recommended for optimal results [54]. The protocol begins with a low-voltage stacking phase (approximately 50-60 V for 30 minutes), which aligns all proteins at the interface between the stacking and resolving gels, creating a sharp starting line. This is followed by a higher-voltage resolving phase for the actual separation. A standard rule of thumb for this second phase is to apply 5-15 volts per centimeter of gel length [54]. For standard mini-gels, this often translates to 100-150 V, with run times typically between 45 minutes to 2 hours. Larger gels may require voltages approaching 300 V [54].
The table below summarizes common issues related to voltage and time and their solutions.
Table 1: Troubleshooting Voltage and Time-Related Issues in SDS-PAGE
| Issue Observed | Possible Cause | Recommended Solution |
|---|---|---|
| Smeared Bands | Voltage too high [55] | Run gel at 10-15 V/cm; use lower voltage for a longer time [55]. |
| 'Smiling' Bands | Excessive heat generation [55] [54] | Run gel in a cold room, use an ice bath, or lower voltage [55] [25]. |
| Protein Bands Run Off Gel | Gel run for too long [55] | Stop electrophoresis when the dye front reaches the bottom of the gel [55]. |
| Poor Band Resolution | Gel run time too short [55] | Increase run time, especially for high molecular weight proteins [55]. |
| Samples Migrating Out of Wells Before Run Starts | Delay between loading and applying voltage [55] | Start electrophoresis immediately after loading the final sample [55]. |
Electrical Mode Selection
Most modern power supplies allow control over voltage, current, or power. Each mode offers distinct advantages for managing the electrophoresis run:
- Constant Voltage: This is often the preferred method. As the run progresses and buffer ions are depleted, resistance increases. Under constant voltage, the current will decrease, which inherently limits the production of heat during the later stages of the run [54].
- Constant Current: While this setting can provide more consistent run times across multiple experiments, it has a significant drawback. To maintain a constant current as resistance increases, the voltage must also rise. This leads to increased heat production later in the run, elevating the risk of gel deformation and "smiling" bands [54]. If using constant current, it is imperative to employ cooling measures.
- Constant Power: This mode attempts to maintain a balance by keeping the product of voltage and current constant. However, as "constant" conditions are hard to define with two fluctuating variables, it can be less predictable [54].
The following workflow diagram outlines the key decision points for establishing optimal running conditions.
Buffer Selection and Formulation
The running buffer is not merely a conductive medium; it is a critical chemical component that maintains the pH and charge conditions necessary for proper protein denaturation and migration.
Standard Buffer Composition
The most common buffer system for SDS-PAGE is the Tris-Glycine buffer, which operates under discontinuous conditions to sharpen protein bands [25]. A standard 10X stock solution can be prepared as follows and diluted to 1X for use:
Table 2: Standard 10X Tris-Glycine-SDS Running Buffer Recipe
| Component | Molecular Weight | Final Concentration (10X) | Amount per Liter (10X) |
|---|---|---|---|
| Tris Base | 121.14 g/mol | 250 mM | 30.3 g |
| Glycine | 75.07 g/mol | 1.92 M | 144.0 g |
| SDS (Sodium Dodecyl Sulfate) | 288.38 g/mol | 1% (w/v) | 10.0 g |
Preparation Protocol:
- Add approximately 800 mL of distilled water to a suitable container.
- Add the pre-weighed Tris base, glycine, and SDS to the water.
- Stir until all components are completely dissolved.
- Add distilled water to a final volume of 1.0 L [56].
- Dilute the 10X stock to 1X with distilled water prior to use in the electrophoresis tank.
Buffer-Related Issues and Compatibility
Improper buffer preparation or use can introduce several problems. Key considerations include:
- Ion Concentration: Incorrect salt concentration in the running buffer can lead to altered conductivity, causing proteins to migrate too fast or too slow and resulting in poor resolution [55]. Always ensure reagents are accurately weighed.
- Detergent Interference: The presence of nonionic detergents (e.g., Triton X-100, NP-40) from lysis buffers in the sample can interfere with SDS binding. It is critical to maintain a ratio of SDS to nonionic detergent of at least 10:1 to prevent band smearing and distortion [30].
- Salt Concentration in Samples: High salt concentrations in protein samples (>100 mM) can increase conductivity, leading to lane widening, distorted bands, and uneven migration. If necessary, dialyze samples or use desalting columns to reduce salt content before loading [30].
The Scientist's Toolkit: Essential Reagents and Materials
Successful execution of an optimized SDS-PAGE protocol requires a suite of reliable reagents and materials. The following table details the key components for the electrophoresis step.
Table 3: Research Reagent Solutions for SDS-PAGE
| Item | Function/Description | Key Considerations |
|---|---|---|
| SDS Running Buffer | Provides ions for conductivity and maintains pH for protein charge and separation [57] [56]. | Tris-glycine is standard; Tricine buffers are better for low molecular weight peptides (<5 kDa) [25]. |
| Polyacrylamide Gels | Forms the porous matrix that separates proteins by size. | Gradient gels resolve a wider MW range [57]. Choose acrylamide % based on target protein size (e.g., 12% for 40-100 kDa) [25]. |
| Protein Molecular Weight Marker | Calibrates gel and estimates size of unknown proteins. | Prestained markers allow real-time tracking. Biotinylated markers are compatible with HRP-based detection [58]. |
| Power Supply | Provides the electric field for electrophoresis. | Must be capable of constant voltage, current, and power output for flexibility in optimization [54]. |
| Electrophoresis Apparatus | Holds gel and buffer, forms the circuit. | Includes inner and outer buffer chambers with cathode and anode connections [25]. |
| Sample Buffer (e.g., Laemmli) | Denatures proteins and provides negative charge & dye for tracking. | Contains SDS, reducing agent (DTT/β-ME), glycerol, and tracking dye [57] [7]. |
| Deracoxib | Deracoxib API|CAS 169590-41-4 For Research | Deracoxib is a selective COX-2 inhibitor for veterinary medicine research. This product is for Research Use Only and not for human or veterinary use. |
Mastering the running conditions for SDS-PAGE is a foundational skill in proteomics research. As detailed in this protocol, clear resolution is achieved not by focusing on a single parameter, but by systematically optimizing the interplay between voltage, time, and buffer chemistry. Adhering to the guidelines for a staged electrophoretic run, selecting the appropriate electrical mode to manage heat, and using a properly formulated running buffer will consistently yield high-quality gels. This reliability at the separation stage is a prerequisite for robust and interpretable western blot data, ultimately strengthening the validity of research findings in drug development and molecular biology.
Solving Common SDS-PAGE Problems: A Troubleshooting Guide
Diagnosing and Fixing Smiling, Smiling, and Distorted Bands
In the context of using SDS-PAGE for western blotting sample preparation research, achieving sharp, well-resolved protein bands is fundamental to accurate protein analysis. The phenomenon of "smiling" and distorted bands during SDS-PAGE gel electrophoresis represents a significant technical challenge that can compromise data integrity, particularly for researchers and scientists in drug development where quantitative accuracy is paramount. These artifacts typically arise from improper experimental conditions during the gel electrophoresis phase of western blotting, including thermal gradients, voltage issues, and buffer inconsistencies [59] [60]. This application note provides a systematic framework for diagnosing, troubleshooting, and resolving these specific band distortion issues through optimized protocols and preventive strategies, ensuring reliable and reproducible protein separation for western blot analysis.
Understanding Band Distortions
Band distortions in SDS-PAGE gels manifest in several distinct forms, each indicating specific underlying issues in the electrophoresis process:
Smiling Bands: Characterized by upward-curving bands at the edges of the gel, this phenomenon occurs when excessive heat generation during electrophoresis causes uneven expansion of the gel, resulting in curved migration paths [59]. The "smiling" effect is particularly pronounced when running gels at high voltages without adequate cooling systems.
Smeared Bands: appearing as diffuse, poorly resolved streaks rather than sharp bands, smearing indicates incomplete protein separation and can result from multiple factors including overloading of protein samples, insufficient running time, or protein degradation [59] [61].
Distorted Peripheral Bands: Often termed the "edge effect," this distortion specifically affects the outermost lanes of the gel and typically results from empty wells adjacent to these lanes or uneven buffer distribution [59]. The distorted migration pattern compromises accurate molecular weight determination and quantitation.
Troubleshooting Guide
The following tables provide a systematic approach to diagnosing and resolving common band distortion issues in SDS-PAGE.
Table 1: Troubleshooting Smiling and Curved Bands
| Possible Cause | Underlying Principle | Corrective Action | Preventive Measures |
|---|---|---|---|
| Excessive Heat Generation | High voltage increases current flow, generating heat that causes gel expansion and uneven migration [59]. | Run gel at lower voltage (10-15 V/cm) for longer duration [59]. | Implement cooling with ice packs or run in cold room [59] [8]. |
| Inconsistent Temperature | Thermal gradients across gel create varying migration resistance. | Ensure even buffer distribution and level gel apparatus. | Use power supply with constant voltage mode and monitor buffer temperature. |
| Improper Buffer Conductivity | Irregular ion distribution creates uneven electrical fields. | Prepare fresh running buffer at correct concentration and pH [59]. | Use standardized buffer recipes and avoid serial reuse of buffers. |
Table 2: Troubleshooting Smeared and Poorly Resolved Bands
| Possible Cause | Underlying Principle | Corrective Action | Preventive Measures |
|---|---|---|---|
| Protein Overloading | Excess protein saturates gel matrix, overwhelming separation capacity. | Reduce protein load (10-40 µg recommended for lysates) [9]. | Pre-determine protein concentration via BCA/Bradford assay [7] [9]. |
| Insufficient Running Time | Incomplete separation prevents proper band resolution. | Extend run time until dye front approaches bottom (optimize for target protein size) [59]. | Use prestained markers to track migration. |
| Incorrect Gel Concentration | Pore size mismatch with target protein size range impedes separation. | Use appropriate acrylamide percentage for protein size (e.g., 10-12% for average proteins) [9] [62]. | Implement gradient gels for broad molecular weight ranges. |
| Protein Degradation | Proteolytic fragments create multiple banding patterns and smears. | Add fresh protease/phosphatase inhibitors to lysis buffer [7] [9]. | Keep samples on ice throughout preparation. |
Table 3: Troubleshooting Distorted Peripheral Bands and Edge Effects
| Possible Cause | Underlying Principle | Corrective Action | Preventive Measures |
|---|---|---|---|
| Empty Peripheral Wells | Uneven electrical field distribution at gel edges causes distorted migration. | Load all wells with samples, ladder, or dummy loading buffer [59]. | Plan experiments to utilize all wells or distribute samples evenly. |
| Uneven Gel Polymerization | Inconsistent acrylamide cross-linking creates migration irregularities. | Ensure complete, uniform polymerization before use. | Standardize gel preparation protocol with consistent TEMED/APS volumes. |
| Improper Buffer Levels | Uneven buffer contact creates resistance variations. | Confirm equal buffer levels in both chambers submerging entire gel. | Check for apparatus leaks and maintain consistent buffer volumes. |
Experimental Protocols
Optimized SDS-PAGE Running Protocol to Prevent Band Distortions
Principle: Controlled electrophoretic conditions maintain even thermal distribution and consistent protein migration for optimal band resolution [59] [60].
Materials:
- Pre-cast or freshly prepared polyacrylamide gel
- SDS-PAGE running buffer (e.g., Tris-Glycine-SDS)
- Protein samples (prepared in Laemmli buffer)
- Prestained protein molecular weight marker
- Electrophoresis chamber with cooling capability
- Power supply
Procedure:
- Assembly: Mount gel securely in electrophoresis chamber, ensuring no leaks.
- Buffer Fill: Fill inner and outer chambers with freshly prepared running buffer, completely submerging the gel.
- Sample Loading: Load equal protein masses (10-40 µg for cell lysates) in wells, including molecular weight marker in one lane. Fill empty wells with loading buffer to prevent edge effect [59].
- Electrophoresis Conditions:
- Initial run: 80-100V constant voltage through stacking gel
- Main separation: 120-150V constant voltage through resolving gel
- For high-resolution needs: 100V constant voltage for entire run
- Temperature Control: Run in cold room (4°C) or with integrated cooling unit to maintain temperature below 30°C.
- Completion: Stop electrophoresis when dye front reaches approximately 1cm from gel bottom.
Troubleshooting Notes:
- If smiling occurs, reduce voltage by 20-30% and extend run time.
- If smearing persists, verify protein quantification accuracy and reduce load by 25%.
- For persistent edge effects, rotate gel 180° in apparatus to identify chamber-specific issues.
Sample Preparation Protocol to Prevent Band Artifacts
Principle: Proper sample integrity and composition ensure clean protein separation without degradation or interference [7] [9].
Materials:
- Appropriate lysis buffer (RIPA, NP-40, or T-PER)
- Fresh protease and phosphatase inhibitor cocktails
- BCA or Bradford protein assay kit
- Laemmli sample buffer (2X or 4X) with reducing agent (DTT or β-mercaptoethanol)
- Heat block or water bath
Procedure:
- Cell Lysis: Lyse cells or tissues in ice-cold lysis buffer with freshly added protease inhibitors (10µL/mL of 100X cocktail) [7].
- Clarification: Centrifuge lysate at 14,000 x g for 15 minutes at 4°C. Transfer supernatant to new tube.
- Protein Quantification: Determine protein concentration using BCA assay (compatible with detergents) [7].
- Sample Preparation:
- Storage: Immediately load onto gel or store at -80°C for future use.
Critical Steps:
- Never heat samples for native PAGE
- Avoid repeated freeze-thaw cycles of prepared samples
- Use heating temperature of 70°C if protein degradation is suspected [7]
Visualization of Troubleshooting Pathways
The following workflow provides a systematic diagnostic approach for identifying and resolving band distortion issues in SDS-PAGE.
Figure 1: Diagnostic workflow for SDS-PAGE band distortion issues. This flowchart provides a systematic approach to identifying and resolving common band artifacts based on their visual characteristics and underlying causes.
Research Reagent Solutions
The following table outlines essential reagents and materials for optimal SDS-PAGE performance and prevention of band distortions.
Table 4: Essential Research Reagents for Optimal SDS-PAGE
| Reagent/Material | Function | Optimization Tips |
|---|---|---|
| Protease Inhibitor Cocktail | Prevents protein degradation during extraction that causes smearing [7]. | Use fresh inhibitors added directly to lysis buffer; consider specific cocktails for phosphorylated proteins [9]. |
| BCA Protein Assay | Accurately quantifies protein to prevent overloading [7]. | Preferred over Bradford for samples containing detergents; provides greater protein-to-protein uniformity [7]. |
| SDS Sample Buffer (Laemmli) | Denatures proteins and provides charge for electrophoresis [8]. | Include fresh reducing agents (DTT/BME); heat at 70-95°C for 5-10 minutes [7] [9]. |
| Appropriate Gel Matrix | Separates proteins by molecular size [62]. | Use 4-12% gradient gels for broad range or specific percentages based on protein size [9] [62]. |
| Fresh Running Buffer | Maintains consistent pH and conductivity during separation [59]. | Prepare fresh Tris-Glycine-SDS buffer; avoid reuse as ion depletion causes uneven migration [59]. |
| Cooling Apparatus | Dissipates heat to prevent smiling artifacts [59]. | Use built-in cooling or external ice bath; run in cold room for high-voltage procedures. |
Band distortions in SDS-PAGE, including smiling, smearing, and edge effects, represent manageable technical challenges with systematic approaches to diagnosis and correction. Through controlled electrophoretic conditions, optimized sample preparation, and appropriate reagent selection, researchers can achieve high-resolution protein separation essential for reliable western blot analysis in drug development research. The protocols and troubleshooting guides presented here provide a comprehensive framework for maintaining the integrity of protein data, ensuring that SDS-PAGE remains a robust and reproducible foundation for protein analysis in research and development settings.
In western blotting sample preparation research, protein smearing during SDS-PAGE represents a fundamental breakdown in sample integrity that compromises subsequent analysis. This phenomenon indicates improper protein separation, leading to diffuse, poorly resolved bands that hinder accurate molecular weight determination and protein identification. Within the broader thesis context of optimizing western blotting protocols for pharmaceutical development, understanding smearing origins becomes paramount for generating reproducible, high-quality data essential for diagnostic and therapeutic applications.
The principal causes of smearing originate from two major categories: (1) inadequate protein denaturation that prevents uniform charge-to-mass ratios, and (2) buffer composition issues including high salt concentrations that alter electrophoretic mobility. This application note systematically addresses these causes through evidence-based troubleshooting protocols and quantitative guidelines designed for research scientists and drug development professionals requiring rigorous protein analysis.
Fundamental Mechanisms: How Sample Preparation Affects Electrophoretic Migration
2.1 The Foundation of SDS-PAGE Separation Principles
SDS-PAGE separates proteins based almost exclusively on molecular weight by overcoming inherent variations in protein charge and structure [27] [25]. This process requires two critical transformations: (1) complete protein unfolding to eliminate tertiary structure effects, and (2) uniform negative charge acquisition through SDS binding. The anionic detergent SDS binds to proteins at a constant weight ratio of approximately 1.4g SDS per 1.0g protein, creating a uniform charge-to-mass ratio that enables migration through the polyacrylamide gel matrix based primarily on size [63] [25]. Any deviation from complete denaturation or uniform SDS binding results in aberrant migration patterns, including smearing.
2.2 Systematic Troubleshooting Workflow
The following workflow diagram outlines a logical pathway for diagnosing and resolving smearing issues in SDS-PAGE, connecting observable symptoms with their underlying causes and appropriate corrective actions:
Comprehensive Analysis of Smearing Causes and Solutions
3.1 Quantitative Guidelines for Troubleshooting Smearing
The following table synthesizes quantitative data from multiple sources to provide researchers with specific thresholds and corrective actions for addressing smearing causes:
Table 1: Systematic Troubleshooting Guide for SDS-PAGE Smearing
| Primary Cause | Specific Manifestations | Recommended Solutions | Quantitative Thresholds |
|---|---|---|---|
| Improper Denaturation | Diffuse smearing across molecular weights; poor band resolution | Increase boiling time to 5 minutes at 98°C [27]; Place samples immediately on ice after heating [27]; Add fresh reducing agents (DTT <50 mM, β-ME <2.5%) [30] | Final SDS concentration sufficient to maintain 3:1 SDS:protein ratio [63] |
| High Salt Concentration | Lane widening, distorted bands, smiling effect [30] [64] | Perform dialysis or buffer exchange; Concentrate and resuspend in lower-salt buffer [30] | Keep salt concentration <100 mM [30]; For specific salts (e.g., NaCl, guanidine HCl) keep <500 mM [25] |
| Protein Overloading | Clustered bands near top of gel; poor resolution; bleeding between lanes [27] [65] | Reduce protein load; Validate optimal concentration for each protein-antibody pair [27] | 0.5 μg per band for purified proteins; 10-15 μg cell lysate per mini-gel lane [30]; 10 μg per well general guidance [65] |
| Protease Degradation | Multiple unexpected bands; degradation patterns [63] [25] | Heat samples immediately after buffer addition (75°C for 5 min) [63]; Add protease inhibitors to sample buffer [25] | As little as 1 pg protease can cause significant degradation [63] |
| Excessive Voltage | Horizontal smearing; curved "smiling" bands [64] | Reduce voltage to 10-15 V/cm; Run at lower voltage for longer duration [64] | Standard practice: ~150V for 1-1.5 hours [64] |
| Detergent Interference | Streaking, dumbbell-shaped bands [30] | Maintain SDS:nonionic detergent ratio at 10:1 or greater; Use detergent removal columns [30] | Critical for Triton X-100, NP-40, Tween 20 [30] |
3.2 Sample Preparation-Specific Considerations
Beyond the comprehensive factors outlined in Table 1, several subtle but impactful sample preparation issues require specific attention:
- Nucleic Acid Contamination: Viscous samples containing unsheared genomic DNA can cause protein aggregation and smearing. Treatment with Benzonase nuclease (which lacks proteolytic activity) prior to adding sample buffer eliminates viscosity issues. Physical shearing through vigorous vortexing or sonication provides an alternative approach [63].
- Incomplete Solubilization: Certain protein classes including membrane proteins and histones may not completely dissolve in standard SDS sample buffer. Addition of 6-8 M urea or nonionic detergents such as Triton X-100 improves solubilization. For hydrophobic proteins, adding 4-8 M urea to the lysate solution before loading prevents aggregation in wells [63] [65].
- Sample Handling Artifacts: Keratin contamination from skin or dander appears as heterogeneous bands at 55-65 kDa on reducing SDS gels and can be misinterpreted as smearing. Contamination occurs through contact with skin or dandruff flakes entering lysis buffer. Running sample buffer alone without protein identifies buffer contamination, while aliquoting and storing buffers at -80°C prevents recurrence [63].
Detailed Experimental Protocols
4.1 Protocol 1: Optimization of Protein Denaturation
Purpose: To ensure complete protein denaturation and prevent smearing from residual secondary/tertiary structure.
Materials:
- SDS sample buffer (62.5 mM Tris-HCl, pH 6.8, 2% SDS, 10% glycerol)
- Fresh reducing agents (DTT, β-mercaptoethanol, or TCEP)
- Heat block or water bath
- Ice bath
Procedure:
- Prepare SDS sample buffer with fresh reducing agent at these final concentrations:
- Dithiothreitol (DTT): 20-50 mM
- β-mercaptoethanol: 1-2.5%
- Tris(2-carboxyethyl)phosphine (TCEP): 20-50 mM [30]
- Mix protein sample with SDS sample buffer at a 1:1 to 1:4 ratio, ensuring sufficient SDS is present (maintain 3:1 SDS:protein ratio) [63].
- Heat samples at 98°C for 5 minutes [27]. For proteins susceptible to Asp-Pro bond cleavage at high temperatures, use 75°C for 5 minutes as a gentler alternative [63].
- Immediately transfer samples to ice for at least 2 minutes to prevent renaturation [27].
- Briefly centrifuge (17,000 × g for 2 minutes) to remove insoluble material [63].
- Load supernatant immediately onto gel.
Troubleshooting Notes: If smearing persists, empirically test boiling times from 3-10 minutes, as some proteins require longer denaturation while others degrade with excessive heating. Always include a positive control of well-characterized protein standards.
4.2 Protocol 2: Salt and Detergent Concentration Normalization
Purpose: To reduce high salt and detergent concentrations that cause band distortion and smearing.
Materials:
- Dialysis devices (e.g., Slide-A-Lyzer MINI Dialysis Device, 0.5 mL)
- Protein concentrators (e.g., Pierce Protein Concentrators PES, 0.5 mL)
- Low-salt buffer (e.g., 50 mM Tris-HCl, pH 6.8)
Procedure: Dialysis Method:
- Transfer protein sample to dialysis device according to manufacturer instructions.
- Dialyze against 500× volume of low-salt buffer (50 mM Tris-HCl, pH 6.8) for 2 hours at 4°C with stirring.
- Change dialysis buffer and continue dialysis for additional 2 hours or overnight.
- Recover sample from dialysis device and add appropriate volume of SDS sample buffer.
Concentrator Method:
- Load sample into protein concentrator according to manufacturer instructions.
- Centrifuge at recommended speed until volume reduced by 80-90%.
- Resuspend concentrated sample in low-salt buffer.
- Add appropriate volume of SDS sample buffer.
Validation: Measure conductivity of processed sample to confirm salt concentration below 100 mM [30]. For detergent-contaminated samples, use detergent removal columns or SDS-PAGE Sample Prep Kits when nonionic detergents interfere with SDS binding [30].
4.3 Protocol 3: Protein Load Titration for Optimal Resolution
Purpose: To determine the optimal protein load that prevents overloading and smearing while maintaining detection sensitivity.
Materials:
- Protein assay reagents (Bradford, Lowry, or BCA)
- Standardized protein samples
- Precast or hand-cast SDS-PAGE gels
Procedure:
- Determine protein concentration of samples using standardized protein assay.
- Prepare a series of dilutions to create a loading range:
- Add constant volume of each dilution to SDS sample buffer.
- Denature all samples simultaneously using optimized denaturation protocol.
- Load equal volumes across gel lanes, including appropriate molecular weight markers.
- Run electrophoresis under standard conditions.
- Visualize with Coomassie staining or transfer for western blotting.
Interpretation: Identify the protein concentration that provides sharp, well-resolved bands without background smearing or over-saturation. This optimal load should be used for all subsequent experiments with similar samples.
Essential Research Reagents and Materials
Table 2: Research Reagent Solutions for Preventing SDS-PAGE Smearing
| Reagent/Category | Specific Examples | Function & Application Guidelines |
|---|---|---|
| Reducing Agents | Dithiothreitol (DTT), β-mercaptoethanol, Tris(2-carboxyethyl)phosphine (TCEP) | Break disulfide bonds; ensure complete unfolding; Use fresh aliquots at final concentrations: DTT/TCEP <50 mM, β-ME <2.5% [30] |
| Protease Inhibitors | PMSF, protease inhibitor cocktails, EDTA | Prevent protein degradation during sample preparation; add to lysis buffer; particularly crucial for sensitive samples [25] |
| Detergents & Solubilizers | Triton X-100, NP-40, Urea (4-8 M) | Improve solubility of membrane proteins and hydrophobic aggregates; use at minimum effective concentration [63] [65] |
| Salt Reduction Tools | Slide-A-Lyzer MINI Dialysis Devices, Pierce Protein Concentrators | Remove excess salts and small molecules; achieve final salt concentration <100 mM [30] |
| Nucleic Acid Digestion | Benzonase Nuclease (recombinant endonuclease) | Degrade DNA/RNA to reduce sample viscosity without proteolytic activity [63] |
| Gel Loading Aids | Colored stacking gels with tartrazine or brilliant blue FCF [66], Laemmli buffer with glycerol | Visualize well boundaries; ensure proper sample loading with sufficient density to sink into wells [25] [66] |
Effective management of SDS-PAGE smearing requires systematic attention to sample preparation parameters that govern protein integrity and electrophoretic behavior. The protocols and guidelines presented here provide researchers with evidence-based approaches for addressing the principal causes of smearing, from improper denaturation to high salt concentrations. Implementation of these standardized methods enhances reproducibility and reliability in western blotting applications, particularly in pharmaceutical development where consistent protein analysis is critical for diagnostic and therapeutic advancement. Through diligent application of these troubleshooting principles, researchers can significantly improve data quality, thereby supporting robust scientific conclusions in protein biochemistry research.
Optimizing Transfer Efficiency for High and Low Molecular Weight Proteins
Within the broader context of SDS-PAGE for western blotting sample preparation research, efficient transfer of proteins from gels to membranes represents a critical methodological challenge. This step is particularly problematic when targeting proteins at the extreme ends of the molecular weight spectrum. While standard protocols perform adequately for mid-range proteins (30-250 kDa), they often fail to provide sufficient resolution and transfer efficiency for both high molecular weight (HMW) and low molecular weight (LMW) targets [67] [68]. This application note details optimized electrophoretic and transfer methodologies to address the unique challenges posed by these distinct protein classes, enabling reliable detection across a broad molecular weight range for research and drug development applications.
Key Challenges and Separation Principles
Fundamental Challenges in Protein Transfer
The efficient transfer of proteins is governed by their differential migration through polyacrylamide gel matrices under electric fields. HMW proteins (>150 kDa) exhibit restricted mobility through gel pores, often resulting in incomplete transfer and retention within the gel matrix [68] [69]. Conversely, LMW proteins (<25 kDa) migrate rapidly and are susceptible to over-transfer, where they pass completely through standard pore-size membranes, resulting in signal loss [67] [70]. These fundamental physical constraints necessitate specialized approaches for different molecular weight categories.
Gel Chemistry and Buffer System Selection
The choice of gel chemistry and buffer systems fundamentally determines separation efficiency. Traditional Tris-glycine gels provide adequate resolution for proteins between 30-250 kDa but perform poorly outside this range [67]. For HMW proteins (>150 kDa), Tris-acetate gels with their more open matrix structure (e.g., 3-8%) facilitate improved migration and separation [68]. For LMW proteins (<25 kDa), Tris-Tricine buffer systems replace glycine with tricine, which alters ion migration dynamics and stacking behavior, significantly enhancing resolution of small proteins and peptides [67] [70]. The differences in pK values and ionic mobility between glycine and tricine underlie this improved performance, with tricine enabling better segregation of sub-30 kDa proteins before they enter the separating gel layer [67].
Figure 1: Experimental workflow for optimizing transfer efficiency of high and low molecular weight proteins, highlighting critical decision points for gel selection, transfer conditions, and membrane choices.
Optimized Protocols for High Molecular Weight Proteins
Gel Electrophoresis for HMW Proteins
For optimal separation of HMW proteins (150-300 kDa), use low-percentage Tris-acetate gels (3-8%) rather than standard Tris-glycine gels [68]. These gels feature a more open matrix structure that allows HMW proteins to migrate further, improving resolution. Prepare the separation gel with 4.24 mL H~2~O, 2.0 mL 1.5 M Tris-HCl (pH 8.8), 1.6 mL 30% acrylamide/bis-acrylamide, 80 µL 10% SDS, 80 µL 10% ammonium persulfate, and 5 µL TEMED [69]. Load at least 20 µg of total protein per lane and electrophorese at 150 V for approximately 1.5 hours using pre-chilled running buffer [69]. For extended run times, surround the tank with ice packs to prevent overheating, which can cause band distortion and smiling effects [25] [69].
Transfer Protocol for HMW Proteins
Following electrophoresis, equilibrate the gel in transfer buffer for 40 minutes [69]. For wet transfer systems, use Towbin buffer (25 mM Tris, 192 mM glycine, pH 8.3) with 20% methanol [71] [72]. Activate PVDF membranes with 99.5% methanol for 15 seconds before immersing in transfer buffer [69]. Assemble the transfer stack and perform wet transfer at 500 mA for 1 hour at 4°C [69]. For dry transfer systems like the iBlot, increase transfer times to 8-10 minutes instead of the standard 7 minutes to accommodate slower migration of HMW proteins [68]. When not using ideal Tris-acetate gels, a 5-10 minute pre-transfer equilibration in 20% ethanol can improve HMW protein transfer efficiency by removing buffer salts and adjusting gel size [68].
Table 1: Optimized Transfer Conditions for High Molecular Weight Proteins
| Parameter | Standard Conditions | Optimized HMW Conditions | Rationale |
|---|---|---|---|
| Gel Type | 4-20% Tris-glycine | 3-8% Tris-acetate | More open matrix structure improves HMW protein migration [68] |
| Transfer Time | 30-60 minutes | 1-2 hours (wet); 8-10 min (dry) | Extended time compensates for slower migration [68] [69] |
| Transfer Buffer | Towbin + 20% methanol | Towbin + 20% methanol | Methanol enhances protein binding to membrane [72] |
| Current/Voltage | 200-250 mA | 500 mA (wet); 25V (dry) | Higher current drives larger proteins from gel [68] [69] |
| Temperature | Room temperature | 4°C | Prevents overheating during extended transfers [69] |
Optimized Protocols for Low Molecular Weight Proteins
Gel Electrophoresis for LMW Proteins
For LMW proteins (<25 kDa), Tris-Tricine SDS-PAGE provides superior resolution compared to standard glycine-based systems [67] [70]. Use a 15-16.5% Tricine gel for proteins under 10 kDa, and a 10-12% gel for proteins between 10-30 kDa [70]. The stacking gel buffer should be Tris-HCl (pH 6.8), with a resolving gel buffer of Tris-HCl (pH 8.45), and running buffer consisting of 100 mM Tris, 100 mM Tricine, and 0.1% SDS [70]. For proteins under 5 kDa, adding 6 M urea to the gel mixture further enhances resolution [67]. Load 20-40 µg of total protein per lane and run at 150 V for approximately 1 hour [70]. The Tricine system shifts the upper stacking limit down to 30 kDa, preventing overloading at the gel layer interface and providing clear, sharp bands for small proteins [67].
Transfer Protocol for LMW Proteins
Following electrophoresis, immerse the gel in transfer buffer for 10-20 minutes [70]. For LMW proteins, use a PVDF membrane with 0.2 µm pore size (rather than standard 0.45 µm) to better retain small proteins [67] [70]. Activate the PVDF membrane with 99.5% methanol for 15 seconds [70]. Add 20% methanol to the transfer buffer but omit SDS, as SDS coats small proteins with negative charges, increasing their passage through membranes [67] [70]. For wet transfer systems, transfer at 200 mA for 1 hour at 4°C [70]. For semi-dry systems, shorten transfer times to 15-30 minutes at 10-15 V to prevent over-transfer [72]. Soaking the gel in SDS-free buffer or water for 5 minutes prior to transfer can help remove excess SDS from small proteins [67].
Table 2: Optimized Transfer Conditions for Low Molecular Weight Proteins
| Parameter | Standard Conditions | Optimized LMW Conditions | Rationale |
|---|---|---|---|
| Gel Type | Tris-glycine | Tris-Tricine | Superior stacking and resolution of proteins <30 kDa [67] [70] |
| Transfer Time | 60 minutes | 30-60 minutes | Reduced time prevents over-transfer [70] [72] |
| Membrane Pore Size | 0.45 µm | 0.2 µm PVDF | Enhanced retention of small proteins [67] [70] |
| Methanol in Buffer | 20% | 20% (optimize 0-20%) | Balance between protein binding and gel pore size [70] [72] |
| SDS in Buffer | Sometimes added | Omit | Reduces negative charge on proteins, slowing transfer [67] [70] |
Alternative Transfer Methodologies
Heat-Mediated Transfer
An alternative approach for efficient transfer of both HMW and LMW proteins utilizes heated transfer buffer (70-75°C) from which methanol has been omitted [73]. This method increases gel permeability, enabling complete transfer of proteins ranging from 9-184 kDa in just 10-20 minutes [73]. Following SDS-PAGE, heat transfer buffer to 70-75°C and assemble the transfer stack as usual. Perform electrophoretic transfer for 10 minutes for 0.75 mm gels or 20 minutes for 1.5 mm gels [73]. This approach demonstrates superior transfer efficiency for both HMW and LMW proteins compared to conventional methods at room temperature and avoids the use of methanol, which can reduce pore size and hinder HMW protein transfer [73].
Comparison of Transfer Methods
Three primary electroblotting methods are available for protein transfer, each with distinct advantages and limitations. Wet or tank transfer, where the gel-membrane sandwich is completely immersed in buffer, offers high efficiency for a broad range of protein sizes (14-116 kDa) and is particularly effective for HMW proteins, though it requires extended transfer times (30-120 minutes) and substantial buffer volumes [71]. Semi-dry transfer, with buffer restricted to filter paper stacks, provides faster transfer times (7-60 minutes) with less buffer consumption, making it suitable for medium-sized proteins but less efficient for HMW targets [71] [72]. Dry electroblotting uses specialized buffer-soaked stacks and requires no additional buffer, enabling very rapid transfers (as few as 3 minutes) while maintaining high efficiency across a broad molecular weight range [71].
Table 3: Comparison of Western Blot Transfer Methods for Different Protein Sizes
| Transfer Method | Typical Transfer Time | Optimal Protein Range | Advantages | Limitations |
|---|---|---|---|---|
| Wet/Tank Transfer | 30-120 minutes | Broad range: 14-116 kDa; best for HMW proteins [71] | High transfer efficiency; suitable for multiple gels [71] | Long transfer times; extensive cleanup [71] |
| Semi-Dry Transfer | 10-60 minutes | Medium range: 30-120 kDa [72] | Faster transfer; less buffer required [71] | Lower efficiency for HMW proteins; gel dehydration risk [71] |
| Dry Transfer | 3-10 minutes | Broad range: 10-300 kDa [71] | Fastest method; no buffer preparation [71] | Requires specialized transfer stacks [71] |
| Heat-Mediated Transfer | 10-20 minutes | Broad range: 9-184 kDa [73] | Rapid; no methanol required; efficient for HMW & LMW [73] | Requires temperature control [73] |
The Scientist's Toolkit: Essential Reagents and Materials
Table 4: Essential Research Reagent Solutions for Optimized Protein Transfer
| Reagent/Material | Function | Application Notes |
|---|---|---|
| Tris-Acetate Gels (3-8%) | Separation of HMW proteins | More open matrix allows better HMW protein migration [68] |
| Tris-Tricine Gels (10-16.5%) | Separation of LMW proteins | Tricine buffer provides superior resolution of proteins <30 kDa [67] [70] |
| PVDF Membrane (0.2 µm) | Retention of LMW proteins | Smaller pore size prevents passage of small proteins [67] [70] |
| PVDF Membrane (0.45 µm) | Standard protein transfer | Suitable for most proteins; methanol activation required [70] [69] |
| Nitrocellulose Membrane (0.2 µm) | Alternative for LMW proteins | Cost-effective option for small proteins [72] |
| Towbin Transfer Buffer | Standard electrophoretic transfer | 25 mM Tris, 192 mM glycine, pH 8.3 with 20% methanol [71] [72] |
| Methanol-Free Transfer Buffer | Heat-mediated transfer | 0.025 mM Tris, 192 mM glycine; used with heated transfer [73] |
| Protease/Phosphatase Inhibitors | Sample preparation | Prevents protein degradation during lysis [7] |
| BCA Protein Assay | Protein quantification | Compatible with detergents; greater protein-to-protein uniformity [7] |
Troubleshooting and Technical Considerations
Common Optimization Challenges
Several common issues arise when transferring proteins at molecular weight extremes. For HMW proteins, incomplete transfer manifests as protein retention in the gel despite antibody specificity. This can be addressed by increasing transfer time, using lower percentage gels, adding SDS (0.01-0.1%) to the transfer buffer, or implementing an ethanol equilibration step before transfer [68] [73]. For LMW proteins, over-transfer results in weak or absent signals despite adequate loading. Solutions include reducing transfer time, using smaller pore-size membranes (0.2 µm), optimizing methanol concentration (0-20%), or omitting SDS from the transfer buffer [67] [70]. Smearing or distorted bands may indicate overheating during electrophoresis - using pre-chilled buffers and ice packs can alleviate this issue [25] [69].
Validation of Transfer Efficiency
Multiple methods exist to validate successful protein transfer. Stain-free imaging technology allows direct visualization and quantitation of proteins in gels before transfer and on membranes after transfer [72]. Traditional methods include staining post-transfer gels with Coomassie Brilliant Blue to detect retained proteins, or staining membranes with reversible dyes like Ponceau S to visualize transferred proteins [72]. Pre-stained molecular weight standards provide a convenient visual reference for transfer progression and completeness [25]. Implementing appropriate positive and negative controls, including samples with known expression of target proteins and no-primary antibody controls, helps distinguish transfer failures from detection issues [25].
Figure 2: Troubleshooting workflow for addressing common transfer efficiency problems with high and low molecular weight proteins, including specific optimization strategies and validation methods.
Optimizing protein transfer efficiency for both high and low molecular weight targets requires a tailored approach that addresses the distinct physical challenges presented by each extreme of the molecular weight spectrum. The methodologies presented herein - employing Tris-acetate gels with extended transfer times for HMW proteins, and Tris-Tricine gels with reduced transfer times and smaller pore membranes for LMW proteins - provide robust solutions to these persistent challenges in western blotting. By implementing these specialized techniques within the broader context of SDS-PAGE sample preparation research, scientists can achieve reliable detection across an expanded molecular weight range, thereby enhancing the quality and reproducibility of protein analysis in both basic research and drug development applications.
Antibody Titration and Blocking Buffer Selection to Enhance Signal-to-Noise
Within the framework of SDS-PAGE for western blotting sample preparation, the critical steps that follow protein separation and transfer are pivotal to assay success. The specificity and clarity of a western blot are fundamentally governed by two optimization processes: the precise titration of antibodies and the judicious selection of an appropriate blocking buffer. These steps are intrinsically linked to the final signal-to-noise ratio, a key metric determining the reliability and quantitative potential of the assay [74]. Inadequate blocking or suboptimal antibody concentrations result in elevated background noise or diminished target signal, potentially leading to misinterpretation of data [75] [30]. This application note provides detailed protocols and structured data to guide researchers and drug development professionals in systematically optimizing these parameters to achieve robust, publication-quality results.
The Critical Role of Blocking and Antibody Concentration
Purpose of Blocking
Following protein transfer, the membrane possesses a high affinity for proteins. The blocking step is imperative to saturate these remaining binding sites with an inert protein solution, thereby preventing the nonspecific binding of detection antibodies in subsequent steps [75] [53]. Effective blocking enhances the assay's sensitivity by reducing background interference, directly improving the signal-to-noise ratio [75]. Conversely, insufficient blocking leads to high background, while excessive blocking can mask antigen-antibody interactions or inhibit detection enzymes [75].
Need for Antibody Titration
Antibody concentration is a major determinant of blot quality [76]. A concentration that is too low may fail to saturate the target antigen, resulting in a weak or absent signal [30]. An excessively high concentration, however, can promote non-specific binding, leading to high background, non-specific bands, or "burnt-out" signals in chemiluminescent detection due to rapid substrate depletion [30] [76]. Therefore, determining the optimal working dilution for each primary and secondary antibody through systematic titration is not merely recommended but essential for rigorous assay development [77] [76].
Blocking Buffer Selection and Optimization
Types of Blocking Buffers
No single blocking agent is ideal for every application, as each antibody-antigen pair has unique characteristics [75]. The choice depends on the specific assay requirements, including the target protein, antibody characteristics, and detection system. The table below summarizes common blocking agents and their applications.
Table 1: Common Blocking Buffers and Their Applications
| Blocking Agent | Typical Concentration | Benefits | Considerations and Contraindications |
|---|---|---|---|
| Non-Fat Dry Milk | 3-5% (w/v) [74] | Inexpensive; readily available; effective for many targets [75]. | Contains casein (a phosphoprotein) and biotin; avoid with phospho-specific antibodies and biotin-streptavidin detection systems [75] [74]. May mask some antigens [75]. |
| Bovine Serum Albumin (BSA) | 2-10% (w/v) [75] [74] | Good for phosphoprotein detection and biotin-streptavidin systems; a purer protein source than milk [75]. | Can be a weaker blocker than milk, potentially leading to more non-specific binding [75]. Avoid if the primary antibody is raised against bovine proteins [74]. |
| Normal Serum | 5% (v/v) [74] | Ideal blocking agent when the secondary antibody is raised against the same species as the serum. Reduces cross-reactivity [74]. | Never use serum from the same species as the primary antibody, as this will cause significant background [74]. |
| Specialized Commercial Blockers | As per manufacturer | Often optimized for specific techniques (e.g., fluorescence); may block faster (<15 min); serum- and biotin-free options available [75]. | More expensive than traditional options; performance may vary [75] [74]. |
Buffer and Detergent Considerations
- Buffer Selection: The blocking agent is typically diluted in Tris-buffered saline (TBS) or phosphate-buffered saline (PBS).
- Detergents: Adding a non-ionic detergent like Tween-20 (0.05%-0.2%) to the blocking and wash buffers helps minimize background by disrupting hydrophobic interactions [75] [30]. However, caution is advised as high detergent concentrations can elute weak-binding antibodies from the membrane [75].
Experimental Protocol: Blocking Buffer Comparison
The following protocol allows for the systematic comparison of multiple blocking buffers to identify the optimal one for a specific target.
Required Reagents [78]:
- Membrane with transferred proteins (e.g., nitrocellulose or PVDF)
- Multiple blocking buffers for testing (e.g., 5% non-fat milk, 2% BSA, specialized commercial blockers)
- Corresponding wash buffers (TBS-T or PBS-T)
- Primary antibody against target protein
- Appropriate HRP- or fluorophore-conjugated secondary antibody
- Detection substrate (chemiluminescent or fluorescent)
Methodology:
- Post-Transfer: After protein transfer, cut the membrane into strips, each containing the full set of lanes (e.g., molecular weight marker and sample dilution series) [78].
- Blocking: Incubate each membrane strip in a different blocking buffer with gentle agitation for 1 hour at room temperature. Use a sufficient volume (≥0.4 mL/cm² of membrane) [78].
- Primary Antibody Incubation: Dilute the primary antibody in each respective blocking buffer (often with 0.1% Tween-20 added) [78]. Incubate with the membranes for 1 hour at room temperature or overnight at 4°C.
- Washing: Wash membranes 3-4 times for 5 minutes each with the appropriate wash buffer (TBS-T or PBS-T) [78].
- Secondary Antibody Incubation: Dilute the labeled secondary antibody in the respective blocking buffer and incubate for 1 hour at room temperature protected from light if using fluorescence [78].
- Washing and Detection: Repeat the washing step. Proceed with appropriate detection (e.g., chemiluminescent substrate or direct fluorescence imaging).
Expected Outcomes: As demonstrated in one study, the detection of pAKT was most sensitive with 2% BSA and a specialized blocking buffer, whereas 5% non-fat milk provided the lowest background but at the cost of detection sensitivity [75]. This highlights the critical trade-off that optimization seeks to balance.
Antibody Titration Protocol
Titration should be performed for every new antibody and whenever a new batch is received, especially for polyclonal antibodies [76].
Methodology:
- Prepare the Membrane: Use a membrane with a uniform sample load, such as a cell lysate with known expression of your target, run across multiple lanes.
- Block the Membrane: Choose a standard blocking buffer (e.g., 5% BSA in TBS-T for phosphoproteins).
- Prepare Antibody Dilutions: Following the manufacturer's recommendation as a starting point, prepare a series of doubling dilutions of the primary antibody in the chosen blocking buffer.
- Example: If the datasheet suggests 1:1000, test 1:250, 1:500, 1:1000, 1:2000, and 1:4000 [76].
- Incubate and Detect: Cut the membrane into strips and incubate each with a different antibody dilution. Keep all other conditions (time, temperature, washing, secondary antibody concentration, detection) identical.
- Titrate Secondary Antibody: If background remains high after optimizing the primary antibody, repeat the process with the secondary antibody. The recommended starting dilution for many fluorescent secondaries is 1:20,000 [78].
Table 2: Troubleshooting Common Issues Related to Blocking and Antibodies
| Problem | Possible Cause | Solution |
|---|---|---|
| High Background | Incompatible or insufficient blocking [30]. | Increase blocking agent concentration or time; switch blocking buffer (e.g., from milk to BSA for phosphoproteins); add 0.05-0.1% Tween-20 to buffers [30] [76]. |
| Antibody concentration too high [30]. | Titrate down the primary and/or secondary antibody concentration. | |
| Weak or No Signal | Antigen masked by blocking buffer [30]. | Decrease the concentration of protein in the blocking buffer or try a different blocking agent. |
| Antibody concentration too low [30]. | Titrate up the primary antibody concentration; check antibody activity. | |
| Non-Specific Bands | Improper antibody specificity or concentration [30]. | Titrate the primary antibody to a lower concentration; include positive and negative controls to validate specificity [79] [77]. |
The Scientist's Toolkit: Essential Research Reagents
Table 3: Key Research Reagent Solutions for Optimization
| Item | Function/Purpose |
|---|---|
| Non-Fat Dry Milk | A cost-effective, general-purpose blocking agent for many western blotting applications [75]. |
| Bovine Serum Albumin (BSA) | A purer protein blocker, essential for experiments involving phosphoprotein detection or biotin-streptavidin systems [75] [74]. |
| Tween-20 | A non-ionic detergent added to blocking and wash buffers to reduce background by preventing non-specific binding [75] [53]. |
| TBS Buffer (Tris-Buffered Saline) | The preferred buffer for blocking and washing when detecting phosphoproteins or using alkaline phosphatase (AP)-conjugated antibodies [75] [74]. |
| HRP-Conjugated Secondary Antibodies | Used for chemiluminescent detection; concentration must be optimized to prevent "burnt-out" bands or weak signals [76]. |
| Fluorescently-Conjugated Secondary Antibodies | Enable multiplexing and avoid the need for enzyme substrates; often require different, detergent-free blocking buffers to minimize autofluorescence [75] [53]. |
| Chemiluminescent Substrate | A critical detection reagent; sensitivity and signal duration vary between products, affecting the final signal-to-noise ratio [76]. |
| PVDF Membrane | A robust membrane with high protein retention, ideal for experiments requiring stripping and reprobing [80] [76]. |
Achieving a high signal-to-noise ratio in western blotting is a deliberate process grounded in the systematic optimization of blocking conditions and antibody concentrations. As detailed in these protocols, there is no universal formula; the optimal conditions must be empirically determined for each specific target and antibody pair. By adopting the structured approaches outlined here—comparing blocking buffers and performing antibody titrations—researchers can significantly enhance the specificity, sensitivity, and reproducibility of their western blot data, thereby strengthening the foundation for scientific conclusions and drug development decisions.
Workflow Diagram
Optimization Workflow for Western Blotting
Resolving Issues of Weak Signal, High Background, and Non-Specific Bands
In the context of a broader thesis on using SDS-PAGE for western blotting sample preparation research, this application note addresses three pervasive challenges that compromise data integrity: weak signal, high background, and non-specific bands. These issues frequently originate from suboptimal sample preparation and protocol conditions, presenting significant barriers to accurate protein analysis for researchers, scientists, and drug development professionals. This document provides detailed, evidence-based methodologies to identify, troubleshoot, and resolve these problems, ensuring reliable and reproducible western blot results. The protocols and troubleshooting guides summarized herein integrate quantitative data and standardized experimental procedures to establish robust western blotting practices.
Troubleshooting Guide: Causes and Solutions
The following tables catalog the primary causes and validated solutions for weak signal, high background, and non-specific bands in western blotting.
Table 1: Troubleshooting Weak or No Signal
| Possible Cause | Recommended Solution | Reference |
|---|---|---|
| Insufficient antigen | Load more protein (10-50 µg per lane is standard); confirm concentration with BCA or Bradford assay. | [8] [81] |
| Inefficient transfer | Verify transfer efficiency by staining gel post-transfer; for high MW proteins, add 0.01-0.05% SDS to transfer buffer; for low MW proteins, add 20% methanol. | [30] |
| Low antibody concentration | Increase primary antibody concentration; perform a dot blot to check antibody activity. | [30] |
| Antigen masked by blocker | Decrease protein concentration in blocking buffer or switch blocking buffer type (e.g., from milk to BSA). | [30] |
| HRP inhibition | Avoid sodium azide in buffers with HRP-conjugated antibodies. | [30] |
| Overheating during sample prep | Heat samples at 70°C for 10 minutes instead of 100°C to avoid proteolysis. | [7] [30] |
Table 2: Troubleshooting High Background
| Possible Cause | Recommended Solution | Reference |
|---|---|---|
| High antibody concentration | Titrate and decrease concentration of primary and/or secondary antibody. | [82] [30] |
| Incomplete blocking | Increase blocking time (1-2 hours at RT or overnight at 4°C) or increase blocking agent concentration (e.g., 5% milk or BSA). | [82] [30] |
| Ineffective blocking buffer | For phosphoproteins or biotin-streptavidin systems, switch from milk to BSA; use engineered commercial blocking buffers. | [83] [30] |
| Insufficient washing | Increase wash number, duration, and volume; include 0.05% Tween-20 in wash buffer (TBST). | [82] [84] |
| Membrane handling issues | Keep membrane wet at all times; ensure proper activation of PVDF with methanol; wear gloves to prevent contamination. | [30] |
Table 3: Troubleshooting Non-Specific Bands
| Possible Cause | Recommended Solution | Reference |
|---|---|---|
| Low antibody specificity | Use antibodies validated for western blotting; increase antibody dilution and incubate at 4°C overnight to increase specificity. | [85] [30] |
| Protein degradation | Always work on ice; add fresh protease and phosphatase inhibitors to lysis buffer. | [7] [81] |
| Sample overload | Reduce amount of protein loaded per lane (e.g., 10-15 µg of cell lysate). | [30] |
| Incomplete denaturation | Ensure sample buffer contains SDS and reducing agents (DTT, β-ME); boil samples at 95-100°C for 5 minutes. | [86] [81] |
| Antibody cross-reactivity | For multiplexing, use primary antibodies from distantly related species and highly cross-adsorbed secondary antibodies. | [30] |
Experimental Protocols for Optimal Sample Preparation
Cell Lysis and Protein Extraction
Proper cell lysis is the critical first step to preserve protein integrity and prevent artifacts.
Materials:
- Ice-cold PBS
- Appropriate lysis buffer (See Table 4) with freshly added protease/phosphatase inhibitors (e.g., 1 mM PMSF, 1-10 µg/mL Leupeptin, 1 mM Sodium Orthovanadate)
- Cell scraper for adherent cells
- Microcentrifuge tubes
- Refrigerated microcentrifuge
Procedure for Adherent Cells [7] [81]:
- Place culture dish on ice and aspirate media.
- Wash cells gently with ice-cold PBS and aspirate.
- Add ice-cold lysis buffer (∼1 mL per 10ⷠcells or a 100 mm plate).
- Scrape cells thoroughly and transfer the suspension to a microcentrifuge tube.
- Agitate the lysate for 30 minutes at 4°C.
- Centrifuge at ∼14,000 x g for 15 minutes at 4°C to pellet insoluble debris.
- Transfer the supernatant (clarified lysate) to a new tube placed on ice.
Protein Concentration Assay (BCA Method)
Accurate protein quantification ensures equal loading across lanes.
Materials:
- BCA Protein Assay Kit
- BSA standards
- Microplate or cuvettes
- Plate reader or spectrophotometer
Procedure [7]:
- Prepare diluted BSA standards according to kit instructions.
- Prepare Working Reagent by mixing 50 parts Reagent A with 1 part Reagent B.
- Pipette 25 µL of each standard and unknown sample replicate into a microplate well.
- Add 200 µL of BCA Working Reagent to each well and mix thoroughly.
- Cover the plate and incubate at 37°C for 30 minutes.
- Cool the plate to room temperature and measure the absorbance at or near 562 nm.
- Plot a standard curve and determine the protein concentration of each sample.
Sample Preparation for Denaturing SDS-PAGE
Denaturing samples ensures proteins are linearized for accurate separation by molecular weight.
Materials:
- Laemmli SDS-Sample Buffer (2X)
- Reducing agent (e.g., DTT or β-mercaptoethanol)
- Heat block or water bath
-
- Combine the calculated volume of protein lysate with an equal volume of 2X Laemmli buffer.
- Add reducing agent if required (final concentration of DTT should be less than 50 mM).
- Heat the samples at 95-100°C for 5 minutes to denature proteins.
- Briefly centrifuge samples to collect condensation before loading onto the gel.
The Scientist's Toolkit: Key Research Reagent Solutions
Table 4: Essential Reagents for Western Blot Sample Preparation
| Reagent Category | Specific Examples | Function and Application Notes | |
|---|---|---|---|
| Lysis Buffers | NP-40 Buffer, RIPA Buffer, Tris-HCl | NP-40 for whole cell/cytoplasmic extracts; RIPA for membrane-bound, nuclear, or mitochondrial proteins. | [7] [81] |
| Protease Inhibitors | PMSF (1 mM), Aprotinin (2 µg/mL), Leupeptin (1-10 µg/mL), EDTA (1-5 mM) | Prevents protein degradation; must be added fresh to lysis buffer before use. | [81] |
| Phosphatase Inhibitors | Sodium Fluoride (5-10 mM), Sodium Orthovanadate (1 mM) | Preserves protein phosphorylation states during lysis. | [81] |
| Sample Buffer | Laemmli Buffer (2X), LDS Sample Buffer | Denatures proteins and provides negative charge for electrophoresis; contains SDS, reducing agents, glycerol, and tracking dye. | [8] [81] |
| Reducing Agents | DTT (<50 mM), β-Mercaptoethanol (<2.5%) | Breaks disulfide bonds to fully linearize proteins for accurate MW separation. | [30] [81] |
| Blocking Agents | Non-Fat Dry Milk (5%), BSA (5%) | Blocks nonspecific binding sites on the membrane. Use BSA for phosphoproteins and biotin-streptavidin systems. | [84] [30] |
Effective resolution of weak signal, high background, and non-specific bands in western blotting hinges on meticulous sample preparation within the SDS-PAGE framework. By systematically implementing the detailed protocols and troubleshooting strategies outlined in this application note—including optimized lysis conditions, precise protein quantification, controlled denaturation, and appropriate reagent selection—researchers can significantly enhance the specificity, sensitivity, and overall quality of their data. Adherence to these standardized methodologies provides a reliable pathway to obtaining publication-ready western blots, thereby advancing research and drug development objectives.
Ensuring Accuracy: Controls, Markers, and Quantitative Analysis
The Critical Role of Molecular Weight Markers for Size Calibration
Molecular weight markers, also referred to as protein standards or ladders, are indispensable tools in SDS-PAGE (Sodium Dodecyl Sulfate-Polyacrylamide Gel Electrophoresis) and western blotting workflows. These compounds consist of purified proteins with known molecular weights, enabling researchers to estimate the size of unknown proteins and monitor the progress of electrophoretic separation and transfer efficiency [87] [25]. In the context of western blotting sample preparation, accurate molecular weight calibration serves as a critical control, confirming that the protein of interest has been correctly separated and transferred, thereby ensuring the reliability of subsequent antibody detection and data interpretation. This application note details the types, selection criteria, and protocols for effectively utilizing molecular weight markers to achieve precise size calibration in protein analysis.
Principles of Size Calibration in SDS-PAGE
In SDS-PAGE, proteins are denatured and coated with the anionic detergent SDS, which confers a uniform negative charge proportional to the protein's length [25]. When an electric field is applied, these proteins migrate through a polyacrylamide gel matrix, which acts as a molecular sieve. Smaller proteins navigate the pores more readily and migrate faster, while larger proteins are impeded and travel shorter distances [25] [88].
The molecular weight marker, run in a parallel lane, provides a reference scale of proteins with known sizes. By plotting the logarithm of the molecular weight of these standards against their migration distance (Rf value), a standard curve is generated [25]. The migration distance of an unknown protein sample is then interpolated against this curve to estimate its molecular weight, validating its identity or revealing potential post-translational modifications such as cleavage or glycosylation.
Figure 1: SDS-PAGE Workflow for Protein Separation. Proteins are denatured and negatively charged before being separated by size within a polyacrylamide gel matrix under an electric field.
Types of Molecular Weight Markers and Their Applications
Selecting the appropriate molecular weight marker is crucial for experimental success. Markers are categorized based on their physical properties and intended applications, each offering distinct advantages.
Classification by Physical Properties
- Prestained Markers: These proteins are covalently conjugated to colored or fluorescent dyes [87]. They allow for real-time monitoring of electrophoresis progress and assessment of transfer efficiency to the membrane during western blotting [32]. However, the attached dye can cause a slight shift in apparent molecular weight.
- Unstained Markers: Comprising pure, unmodified proteins, these markers provide the most accurate molecular weight determination as their migration is not altered by dyes [87] [32]. Visualization requires post-electrophoresis staining with Coomassie Blue, silver stain, or other protein dyes [89].
- Western Blotting Markers: Specialized standards, such as the MagicMark XP and iBright Prestained Protein Ladder, contain recombinant proteins fused to an IgG-binding domain [87] [32]. When detected with the same secondary antibodies as the target protein, they become visible directly on the blot, eliminating the need to align the membrane with gel images.
Specialty Markers
- High/Low Range Markers: Optimized for resolving very large (e.g., 31-460 kDa with HiMark standards) or very small proteins [32].
- Native Markers: Used for non-denaturing PAGE, where protein separation depends on both size and charge, preserving native protein complexes [87] [32].
- Isoelectric Focusing (IEF) Markers: A set of proteins with defined isoelectric points (pI) for calibrating IEF gels [32].
Table 1: Common Types of Molecular Weight Markers and Their Key Characteristics
| Marker Type | Key Features | Primary Applications | Visualization Method |
|---|---|---|---|
| Prestained [87] [32] | Proteins conjugated to dyes; allows real-time monitoring | SDS-PAGE, Western blot transfer efficiency | Colorimetric, Fluorescence |
| Unstained [87] [32] | Pure proteins for high-accuracy size determination | Precise MW analysis, Coomassie/silver staining | Post-staining (e.g., Coomassie) |
| Western Blotting [87] [32] | Recombinant proteins with IgG-binding sites | Direct detection on blot with secondary antibodies | Chemiluminescence, Fluorescence |
| Specialty (High/Low Range) [32] | Optimized for specific MW ranges (e.g., 1-40 kDa or 30-460 kDa) | Analysis of very large or very small proteins | Varies by product |
Selecting the Appropriate Molecular Weight Marker
Choosing the right marker requires careful consideration of the experimental goals and downstream applications. The following decision workflow outlines the key selection criteria to ensure optimal results. A systematic approach to selection ensures that the marker provides the necessary information, whether it's a simple verification of protein separation or precise molecular weight determination for publication.
Figure 2: Decision Workflow for Selecting Molecular Weight Markers. A guided pathway for choosing the most appropriate protein standard based on protein size, application, and required data.
Key Selection Criteria
- Target Protein Size: The marker's range must bracket the expected size of your target protein. Broad-range markers (e.g., 10-250 kDa) are suitable for routine analyses, while high-range or low-range markers are essential for extremely large or small proteins, respectively [90]. For proteins larger than 200 kDa, low-percentage gels (4-6%) are recommended for sufficient resolution [88].
- Downstream Application: For western blotting, prestained or IgG-binding markers are highly beneficial as they transfer to the membrane and provide an internal size reference directly on the blot [90]. For precise molecular weight determination from a stained gel, unstained markers are the gold standard [32].
- Required Information: If the goal is simply to monitor electrophoresis and transfer, a prestained ladder suffices. If accurate molecular weight calculation is required for confirming a protein's identity or detecting shifts, an unstained ladder is necessary [90].
Detailed Experimental Protocol for Size Calibration
Materials and Reagents
Table 2: Research Reagent Solutions for SDS-PAGE with Molecular Weight Markers
| Item | Function/Description | Example/Note |
|---|---|---|
| Protein Marker [87] [32] | Provides molecular weight reference | Choose type (prestained/unstained) and range based on experimental needs. |
| SDS-PAGE Gel [25] [88] | Polyacrylamide matrix for size-based separation | Choose percentage based on target protein size (e.g., 8% for 50-200 kDa, 12% for 10-70 kDa). |
| SDS Running Buffer [88] | Conducts current and maintains pH for migration | Typically Tris-Glycine with 0.1% SDS, pH 8.3. |
| Sample Loading Buffer [25] [91] | Denatures proteins and provides density for loading | Contains SDS, reducing agent (DTT/β-mercaptoethanol), glycerol, and tracking dye. |
| Staining Solution [89] [91] | Visualizes proteins in gel or membrane | Coomassie Blue, Silver Stain, or fluorescent dyes. |
Step-by-Step Protocol
- Gel Selection and Preparation: Choose an appropriate polyacrylamide gel percentage based on your target protein's size (refer to Table 1 in the introduction). While pre-cast gels offer convenience, hand-cast gels can be prepared using an acrylamide/bis-acrylamide solution, with polymerization initiated by ammonium persulfate (APS) and TEMED [91].
- Sample and Marker Preparation: Dilute your protein samples in SDS sample loading buffer. A standard loading buffer contains SDS, a reducing agent (like DTT or β-mercaptoethanol), glycerol, and a tracking dye [91]. Denature the samples and the molecular weight marker by heating at 95-100°C for 3-5 minutes, unless the marker's instructions specify otherwise [91]. Briefly centrifuge to collect condensation.
- Loading and Electrophoresis:
- Assemble the electrophoresis apparatus and fill the chambers with running buffer.
- Load equal amounts of total protein (typically 10-50 µg for cell lysates) into the wells [88].
- In a dedicated lane, load the recommended volume of the prepared molecular weight marker (e.g., 5 µL for a 1.0 mm mini-gel) [32].
- Connect the power supply and run the gel at a constant voltage (e.g., 100-150 V) until the dye front approaches the bottom of the gel [88] [91].
- Visualization and Analysis:
- For Unstained Markers & Samples: After electrophoresis, carefully remove the gel and stain it with Coomassie Brilliant Blue or a more sensitive silver stain to visualize the protein bands [89] [91]. Destain the gel until the background is clear and protein bands, including those of the marker, are sharply defined.
- For Prestained Markers: The marker bands will be visible during and after the run, allowing you to monitor progress directly.
- For Western Blotting: Transfer the proteins from the gel to a membrane. If using an IgG-binding marker, it will be visualized during the immunodetection step alongside your target protein [32].
- Molecular Weight Determination: Measure the migration distance of each marker band from the top of the resolving gel. Plot the logarithm (log10) of their known molecular weights against their migration distances to create a standard curve. Measure the migration distance of your unknown protein band and use the standard curve to estimate its molecular weight [25].
Troubleshooting Common Issues
Even with a well-designed experiment, issues can arise. The following table outlines common problems related to molecular weight markers and their resolutions.
Table 3: Troubleshooting Guide for Molecular Weight Marker and SDS-PAGE Issues
| Issue | Potential Cause | Solution |
|---|---|---|
| Weak/Faint or No Bands [91] | Insufficient protein/marker loaded; expired or improperly prepared staining reagents. | Increase loading concentration; use fresh staining solutions; include protease inhibitors to prevent degradation. |
| Smeared Bands [25] [91] | Incomplete denaturation; sample overload; high salt concentration. | Ensure proper heating (95-100°C for 5 min) in sample buffer; reduce protein load; desalt samples if necessary. |
| Inaccurate Size Estimation [90] | Using prestained markers for precise measurement; incorrect gel percentage. | Use unstained markers for accurate MW determination; select a gel percentage optimized for your protein's size range. |
| "Smiling" or "Bulging" Bands [25] | Gel overheating during run; incorrect buffer pH. | Run gel at a lower voltage; use a cooling system; check running buffer composition and pH. |
| Poor Transfer of Marker in Western Blot | Large proteins not efficiently transferred. | Optimize transfer time and conditions (e.g., use wet transfer for high MW proteins); verify using prestained markers. |
Molecular weight markers are fundamental to the integrity of protein analysis by SDS-PAGE and western blotting. Their critical role in size calibration, process monitoring, and quality control cannot be overstated. By understanding the different types of markers available and selecting the one that best aligns with the experimental objectives—whether it's a prestained ladder for tracking western transfer or an unstained standard for precise molecular weight confirmation—researchers can ensure the generation of robust, reliable, and interpretable data. Adherence to optimized protocols for marker use and a systematic approach to troubleshooting further solidifies the foundation of any successful protein characterization study in biomedical research and drug development.
In quantitative Western blotting, the accurate comparison of protein levels across different samples hinges on the ability to account for variations in the total amount of protein loaded in each gel lane. Loading controls serve as internal standards to normalize these technical variations, ensuring that observed differences reflect true biological changes rather than experimental artifacts [92]. These controls are essential for mitigating the "edge effect" and correcting for pipetting inaccuracies during sample preparation [92]. The two predominant strategies for normalization involve using antibodies against housekeeping proteins or employing total protein stains.
Housekeeping proteins are constitutively expressed proteins presumed to maintain stable expression levels across various biological conditions [92]. In contrast, total protein staining provides a global assessment of all proteins transferred to a membrane, offering a direct measure of total protein load in each lane [93]. This application note, framed within a broader thesis on SDS-PAGE for Western blotting sample preparation, details the implementation, advantages, and limitations of both approaches to guide researchers in selecting and applying the most appropriate normalization method for their experimental context.
Housekeeping Proteins as Loading Controls
Definition and Rationale
Housekeeping proteins are gene products involved in fundamental cellular maintenance and are ubiquitously expressed across different cell and tissue types [92]. The underlying principle for their use as loading controls is that their expression levels remain constant and are unaffected by experimental treatments or pathological states. By probing for such a protein, researchers can measure the relative abundance of their target protein against a stable internal reference, thereby normalizing for potential differences in sample loading and transfer efficiency.
Commonly Used Housekeeping Proteins
- β-Actin: A structural protein involved in cell motility and integrity. It is highly conserved and abundantly expressed, making it a very common loading control [92].
- Glyceraldehyde 3-phosphate dehydrogenase (GAPDH): A key enzyme in glycolysis. Despite its role in metabolism, it is frequently used as a loading control in various experimental setups [92].
- β-Tubulin: A major component of microtubules. Like β-actin, it is a structural protein with generally high and constitutive expression [92].
Limitations and Considerations
A growing body of evidence challenges the assumption of invariant expression for traditional housekeeping proteins. Their expression can be significantly influenced by numerous factors [92] [93]:
- Experimental treatments: Drug interventions, hypoxia, and other manipulations can alter their expression levels.
- Cell and tissue specificity: Expression can vary dramatically between different cell lines, tissues, and developmental stages.
- Cellular processes: Processes such as cellular differentiation and proliferation can change their abundance.
Relying on a single, variable housekeeping protein for normalization can introduce systematic errors and lead to inaccurate data interpretation by masking or exaggerating true biological effects [93]. Therefore, empirical validation of expression stability is required under specific experimental conditions before use.
Protocol for Normalization with Housekeeping Proteins
Materials:
- Primary antibody against the housekeeping protein (e.g., β-Actin, GAPDH)
- HRP-conjugated or fluorescently-labeled secondary antibody
- Standard Western blotting reagents and equipment
Procedure:
- Perform Western Blotting: Carry out SDS-PAGE and protein transfer following standard protocols [50] [94].
- Divide the Membrane: If the target protein and the housekeeping protein have distinct molecular weights, the membrane can be cut horizontally to allow simultaneous probing.
- Simultaneous Immunodetection: Incubate the membrane with a cocktail of primary antibodies targeting both the protein of interest and the housekeeping protein. Ensure the antibodies are from different host species to prevent cross-reactivity of secondary antibodies.
- Incubate with Secondary Antibodies: Use species-specific secondary antibodies conjugated to different fluorophores (for fluorescent detection) or a single secondary antibody if the primary antibodies are from the same host species and the membrane was cut.
- Image and Quantify: Detect the signal for both the target band and the housekeeping protein band.
- Calculate Normalized Value: For each lane, divide the signal intensity of the target protein band by the signal intensity of the housekeeping protein band. This yields the normalized value for the target protein.
Workflow for Housekeeping Protein Normalization
Total Protein Staining as a Loading Control
Definition and Rationale
Total protein staining (TPS) is a method that visualizes and quantifies the total amount of protein in each lane of a blot, thereby using the entire proteome as an internal loading control [93]. This approach normalizes the signal of a specific target protein to the total protein content loaded in that lane, circumventing the potential variability associated with a single housekeeping protein.
Advantages Over Housekeeping Proteins
Total protein staining offers several key advantages [93]:
- Direct Measurement: It directly quantifies the protein loaded in each lane, accounting for pipetting errors and transfer inefficiencies.
- Global Normalization: It normalizes against the vast majority of proteins in the sample, making it less susceptible to biological fluctuations that affect individual proteins.
- Visual Confirmation: It allows for visual verification of uniform protein transfer across the membrane and reveals any anomalies like air bubbles or uneven transfer.
- Broad Applicability: It is universally applicable across different experimental conditions, cell types, and tissues without requiring prior validation of protein stability.
Protocol for Normalization with Total Protein Staining
Materials:
- Reversible total protein stain (e.g., Azure TotalStain Q, compatible with downstream immunodetection)
- Required buffers for staining and destaining
Procedure:
- Complete Protein Transfer: Following SDS-PAGE, transfer proteins to a membrane using standard electroblotting techniques [94].
- Verify Transfer (Optional but Recommended): Perform a rapid stain with a reversible total protein stain to visualize the transferred protein pattern, check for uniformity, and identify any transfer issues [93].
- Destain (If Using a Reversible Stain): Completely remove the stain according to the manufacturer's instructions to ensure it does not interfere with subsequent antibody detection.
- Proceed with Immunodetection: Block the membrane and incubate with primary and secondary antibodies against your target protein as in a standard Western blot protocol [50].
- Image Total Protein and Target Signal: After immunodetection, the membrane must be imaged for the total protein stain. For fluorescent total protein stains, this is typically done post-Western blot, as the stain is imaged in a different channel than the fluorescent antibody signal. For colorimetric or chemiluminescent detection, the total protein stain is usually performed and imaged first, then the stain is removed, and finally, immunodetection is performed.
- Quantify and Normalize: Quantify the total protein signal for each entire lane. Then, for each lane, divide the signal intensity of the target protein band by the total protein signal for that lane to obtain the normalized value.
Workflow for Total Protein Normalization
Quantitative Comparison of Normalization Methods
The table below summarizes the key characteristics of housekeeping protein and total protein staining normalization methods to aid in selection.
Table 1: Comparison of Loading Control Normalization Methods
| Feature | Housekeeping Proteins | Total Protein Staining |
|---|---|---|
| Principle | Normalization to a single, constitutively expressed protein [92] | Normalization to the total proteome loaded per lane [93] |
| Key Advantage | Technically simple, widely accepted | Not reliant on the stability of a single protein; accounts for total loading [93] |
| Major Limitation | Expression can vary with experimental conditions, tissue type, and development [92] [93] | Potential signal interference if not properly reversed; requires additional step |
| Reproducibility | Lower, due to biological variability of the control protein | Higher, as it is a direct technical measurement [93] |
| Validation Need | Required for each new experimental system | Not required, universally applicable |
| Cost | Lower (uses existing antibodies) | Higher (requires purchase of specific stains) |
| Ideal Use Case | Preliminary studies, when target and control molecular weights are distinct | Quantitative studies requiring high accuracy, when housekeeping protein stability is unknown |
The Scientist's Toolkit: Essential Reagents and Materials
Successful implementation of loading controls requires specific reagents. The following table lists key materials.
Table 2: Essential Research Reagents for Loading Controls
| Item | Function | Examples / Notes |
|---|---|---|
| Anti-Housekeeping Protein Antibodies | Primary antibodies for immunodetection of internal control proteins. | β-Actin, GAPDH, β-Tubulin antibodies [92]. Must be validated for Western blot. |
| Reversible Total Protein Stain | Stains all proteins on the membrane for quantification and transfer verification. | Azure TotalStain Q [93]. Must be compatible with subsequent immunodetection. |
| HRP or Fluorescent Secondary Antibodies | Species-specific antibodies for signal generation from primary antibodies. | Critical for the sensitivity of housekeeping protein detection [50] [94]. |
| Lysis Buffer with Detergent | For efficient extraction of proteins from cells or tissues. | RIPA buffer, NP-40 buffer [50]. Contains protease inhibitors to prevent degradation. |
| SDS-PAGE Gel & Running Buffer | For separation of proteins by molecular weight. | Pre-cast gels (e.g., 4-20% gradient) ensure consistent results [95]. |
| Transfer Buffer & Membranes | For transferring separated proteins from gel to a solid support. | Nitrocellulose or PVDF membranes are standard [94]. |
Both housekeeping proteins and total protein stains are critical tools for reliable Western blot normalization. While housekeeping proteins are convenient, their potential for variable expression necessitates careful validation. Total protein staining has emerged as a more robust and reliable strategy, particularly for quantitative studies where accuracy is paramount, as it normalizes against the entire protein load and directly accounts for technical variations [93]. The choice of method should be guided by the experimental context, the need for precision, and the known behavior of potential control proteins under the specific conditions being studied. By implementing these loading control strategies effectively, researchers can significantly enhance the reliability and interpretability of their Western blot data.
Using Positive and Negative Controls to Confirm Antibody Specificity
Within the framework of SDS-PAGE for western blotting sample preparation, the confirmation of antibody specificity is not merely a supplementary step but a foundational requirement for generating reliable and interpretable data. The process of SDS-PAGE (Sodium Dodecyl Sulfate-Polyacrylamide Gel Electrophoresis) separates denatured proteins based solely on molecular weight, creating a landscape where antibodies must specifically recognize their target epitopes amidst a complex mixture of transferred proteins [26] [25]. Without proper controls, observed signals may represent specific target detection, non-specific binding, cross-reactivity, or methodological artifacts, ultimately compromising data validity and experimental conclusions.
The critical importance of antibody validation has been emphasized by initiatives such as the International Working Group for Antibody Validation (IWGAV), which has established guidelines to improve standards for antibody use [79]. Furthermore, the reproducibility crisis in life sciences research has been partially attributed to inconsistent antibody performance and insufficient validation practices, highlighting the need for rigorous experimental design [79] [96]. For researchers and drug development professionals, implementing a comprehensive control strategy is essential for ensuring that western blot results accurately reflect biological truth rather than methodological variance.
This application note provides detailed methodologies for establishing and implementing a complete control system to verify antibody specificity in western blotting, with all procedures contextualized within the SDS-PAGE sample preparation workflow that forms the basis of reproducible protein analysis.
The Critical Role of Controls in Western Blotting
Controls in western blotting serve as internal diagnostics that verify every aspect of the experimental process, from sample preparation through final detection. They are indispensable for distinguishing valid results from technical artifacts, thereby ensuring that observed differences in protein expression or modification reflect biology rather than methodological inconsistency.
The use of appropriate controls helps identify unexpected sources of error, both random and systemic, allowing researchers to troubleshoot issues before they compromise results [97]. In quantitative western blot analysis, where the goal is to generate numerically comparable data across samples, controls become even more critical for normalization and validation of measurement linearity [98] [96]. For publication-quality work, the inclusion of proper controls is often mandatory, as many journal editors and referees require strong evidence to support conclusions [97] [79].
Table 1: Essential Control Types for Antibody Specificity Verification
| Control Type | Primary Function | Interpretation of Results |
|---|---|---|
| Positive Control Lysate | Verifies protocol functionality and antibody performance [97] | Positive signal: Procedure working; Negative signal: Protocol or antibody issue [99] |
| Negative Control Lysate | Identifies non-specific antibody binding and false positives [97] | No signal: Antibody specific; Signal present: Non-specific binding detected [100] |
| Loading Control | Confirms equal protein loading and transfer across lanes [97] | Consistent signal: Equal loading; Variable signal: Loading or transfer inconsistency [97] |
| No Primary Antibody Control | Detects non-specific secondary antibody binding [97] | No signal: Specific secondary binding; Signal present: Secondary antibody issues [25] |
| Isotype Control | Verifies specific binding through Fc regions [100] | No signal: Specific primary binding; Signal present: Fc-mediated non-specific binding [100] |
Establishing Foundational Controls
Positive Control Lysates
Positive controls are perhaps the most fundamental component of antibody validation, serving to demonstrate that the entire western blotting procedure—from electrophoresis to detection—is functioning correctly.
Definition and Purpose: A positive control lysate is derived from a cell line or tissue sample known to express the target protein [97]. When this control yields the expected signal, it indicates that the protocol and reagents are properly optimized [97] [99]. Conversely, a negative result in the positive control lane suggests fundamental problems with the procedure or the antibody itself [97].
Selection Criteria: When selecting positive controls, cell lysates are generally preferred over tissue lysates because protein expression levels in tissue may be easily affected by individual differences or heterogeneity, potentially causing batch-to-batch variability [97]. For novel targets without well-characterized expression, several approaches can identify suitable positive controls:
- Consult antibody datasheets for suggested controls [97]
- Examine citations and product reviews for successfully used tissues or cells [97]
- Search protein expression databases such as Swiss-Prot, Omnigene, GeneCards, or Human Protein Atlas [97] [79]
- Conduct literature searches on PubMed to identify expressing systems [97]
Special Considerations: For modified targets such as phosphorylation-specific proteins, additional considerations apply. It is recommended to use a total antibody as a control, and for proteins regulated by drug treatment, employing a control antibody from the same signaling pathway can validate that the pathway has been successfully activated [97].
Practical Application:
- Sample Preparation: Prepare positive control lysates using appropriate lysis buffers (e.g., RIPA for nuclear/mitochondrial/membrane proteins, NP-40 for whole cell extracts) [101].
- Quantification: Determine protein concentration using BCA or Bradford assays before mixing with Laemmli buffer [101] [102].
- Loading: Load 10-50 μg of protein per lane alongside experimental samples [101].
- Electrophoresis: Perform SDS-PAGE using an appropriate acrylamide percentage based on protein size [101] [25].
Negative Control Lysates
Negative controls provide the complementary half of the specificity verification system, enabling researchers to confirm that observed signals represent specific antibody-target interactions rather than non-specific binding.
Definition and Purpose: A negative control lysate originates from a cell line or tissue sample known not to express the target protein [97] [99]. This control checks for non-specific binding of the primary antibody and helps identify false-positive results [97] [100]. The absence of signal in the negative control lane, coupled with appropriate signal in the positive control, provides strong evidence of antibody specificity.
Optimal Negative Controls: The most rigorous negative controls utilize validated knockout cell lines or tissue samples where the gene encoding the target protein has been deleted or silenced [97] [79]. Genetic knockout validation is increasingly considered the "gold standard" for western blotting specificity confirmation [79]. When naturally non-expressing tissues or cells are used as negative controls, this should be verified through multiple independent sources.
Implementation Protocol:
- Knockout Validation: Use CRISPR/Cas9 or other gene editing technologies to generate knockout cell lines [97] [79].
- Lysate Preparation: Prepare negative control lysates using the same methods as experimental and positive control samples to ensure consistency [101].
- Parallel Processing: Process negative controls alongside experimental samples throughout the entire western blot procedure [97].
- Interpretation: Compare negative control lanes with experimental samples—bands present in experimental lanes but absent in negative controls likely represent specific detection [97].
Table 2: Database Resources for Control Selection
| Resource Name | Primary Utility | URL/Reference |
|---|---|---|
| GeneCards | Comprehensive human gene database with expression data | www.genecards.org [79] |
| Human Protein Atlas | Maps human proteins in cells, tissues, and organs | www.proteinatlas.org [79] |
| Expression Atlas | Gene and protein expression data across species and conditions | www.ebi.ac.uk/gxa/home [79] |
| Cancer Cell Line Encyclopedia | Genetic characterization of human cancer models | https://portals.broadinstitute.org/ccle [79] |
Specialized Controls for Comprehensive Validation
Loading Controls for Normalization
Loading controls serve the dual purpose of verifying consistent protein loading across samples and providing a reference for quantitative normalization.
Principle and Purpose: Loading controls are typically housekeeping proteins that exhibit high-level, constitutive expression in the cells or tissues being studied [97]. Their consistent expression across samples confirms that protein loading is equivalent across the gel, ensuring that any differences in target protein signal reflect true biological variation rather than technical inconsistency [97] [100]. Additionally, loading controls can identify issues with transfer efficiency, particularly the "edge effect" where proteins in outer lanes transfer differently than those in the center of the gel [97].
Selection Criteria: Choosing an appropriate loading control requires careful consideration of several factors:
- Molecular Weight: The loading control should have a different molecular weight than the target protein to prevent overlapping signals [97] [100].
- Cellular Localization: The subcellular localization should match the fraction being analyzed (e.g., nuclear proteins for nuclear extracts) [97] [99].
- Expression Stability: Expression should remain consistent across experimental conditions—some traditional loading controls may vary under certain treatments [97].
Common Loading Controls:
- Beta-Actin (42 kDa): Widely used for whole cell and cytoplasmic fractions, but not suitable for skeletal muscle samples [97].
- GAPDH (36 kDa): Common cytoplasmic marker, but expression may increase under hypoxia or diabetes [97].
- Alpha-Tubulin/Beta-Tubulin (50-55 kDa): Cytoskeletal proteins, but expression may vary with antimicrobial drugs [97].
- Lamin B1 (66 kDa): Nuclear envelope protein, not suitable for samples where the nuclear envelope is removed [97].
- VDAC1/Porin (30 kDa): Mitochondrial membrane protein [97].
- Histone H3 (15 kDa): Nuclear protein [97].
Methodology:
- Simultaneous Detection: For fluorescent western blotting, loading controls and target proteins can be detected simultaneously using different fluorophores [97].
- Sequential Detection: For chemiluminescent detection, membranes are typically probed sequentially, often requiring stripping and reprobing between detections [101].
- Normalization: Quantify band intensity using densitometry software and normalize target protein signal to loading control signal to correct for loading variations [97] [98].
Additional Essential Controls
Beyond the fundamental positive, negative, and loading controls, several additional controls address specific potential sources of error in western blotting.
No Primary Antibody Control:
- Purpose: This control identifies non-specific binding caused by the secondary antibody alone [97] [25]. It is particularly important when optimizing multiplexed western blots, as it confirms secondary antibodies do not interfere with each other or cause off-target binding [97].
- Implementation: The protocol follows the standard western blot procedure with one modification—antibody dilution buffer containing no primary antibody is used instead of the primary antibody solution [97]. The secondary antibody incubation proceeds as usual [97].
- Interpretation: Any signal development indicates non-specific secondary antibody binding, requiring optimization of secondary antibody concentration or blocking conditions [97] [25].
Isotype Control:
- Purpose: This control verifies that signal results from specific antigen binding rather than Fc receptor interactions, especially important for lysates rich in immune cells that contain Fc receptors [100].
- Implementation: An antibody of the same isotype but irrelevant specificity is used at the same concentration as the primary antibody [100].
- Interpretation: Signal development with the isotype control suggests Fc-mediated non-specific binding, necessitating protocol modification [100].
Recombinant Protein Controls:
- Purpose: Particularly valuable when studying recombinant proteins, as folding may differ from the endogenous native form, potentially affecting antibody access to the epitope [97].
- Implementation: Full-length recombinant proteins make ideal positive controls as they should separate identically to the natural protein and can be used as standards for quantification [100].
Experimental Design and Workflow Integration
Comprehensive Experimental Workflow
Implementing a systematic approach to control integration throughout the western blot workflow ensures consistent validation at each procedural step. The following diagram illustrates this integrated control strategy:
Diagram 1: Integrated control strategy within the western blot workflow. Green elements represent positive controls, blue represents loading/transfer controls, and red represents negative controls.
Quantitative Western Blot Considerations
For researchers requiring quantitative data from western blots, additional validation steps are necessary to ensure measurements fall within the linear range of detection.
Linear Range Determination: A critical but often overlooked aspect of quantitative western blotting is determining the linear range for each antibody [96]. This involves running a dilution series of samples to identify the range where signal intensity responds linearly to protein amount [96]. The microwestern array technique enables rapid evaluation of suitable conditions for quantitative western blotting, with up to 192 antibody/dilution/replicate combinations on a single standard-size gel [96].
Key Quantitative Parameters:
- Linear Range: For quantitatively valid antibodies, linear range typically spans between 8-fold and 64-fold—with most at 16-fold, which captures most biologically relevant changes in protein levels [96].
- Limit of Detection: Typically ranges from 0.2–0.4 mg/mL of total protein in the lysate [96].
- Antibody Dilution: Requires optimization for quantitative work; while 1:1000 is a common starting point, some antibodies may require dilutions as high as 1:250 or as low as 1:4000 for rigorous quantitation [96].
Table 3: Troubleshooting Control Results
| Control Result Pattern | Potential Interpretation | Recommended Action |
|---|---|---|
| Positive control: No signalExperimental: No signal | Protocol failure or antibody issue [97] | Verify reagent quality, check protocol steps, try alternative antibody [97] |
| Positive control: Signal presentExperimental: No signal | Target not expressed in samples [97] | Verify sample identity, use more sensitive detection [97] |
| Negative control: Signal presentExperimental: Signal present | Non-specific antibody binding [97] [100] | Optimize antibody concentration, improve blocking, try different antibody [97] [100] |
| No primary control: Signal present | Secondary antibody non-specificity [97] [25] | Optimize secondary concentration, change blocking buffer, try different secondary [97] |
| Loading control: Variable signal | Unequal loading or transfer [97] | Repeat with standardized loading, check transfer efficiency [97] |
Research Reagent Solutions
The following table details essential materials and reagents required for implementing comprehensive antibody specificity controls in western blotting.
Table 4: Essential Research Reagents for Control Experiments
| Reagent Category | Specific Examples | Primary Function |
|---|---|---|
| Positive Control Lysates | Cell lysates from expressing lines (e.g., HAP1 wild-type) [97]; Overexpression lysates [99]; Recombinant proteins [100] | Verify protocol functionality and antibody performance [97] |
| Negative Control Lysates | Knockout cell lysates (e.g., β-actin knockout HAP1) [97]; Tissue-specific negative controls [100] | Identify non-specific antibody binding [97] |
| Loading Control Antibodies | Anti-β-actin [97]; Anti-GAPDH [97]; Anti-tubulin [97] [99]; Anti-lamin B1 [97] | Normalize for protein loading and transfer variations [97] |
| Secondary Antibody Controls | Species-matched secondary antibodies [97] [25] | Detect non-specific secondary antibody binding [97] |
| Molecular Weight Markers | Prestained protein standards [101] [25]; All-blue markers [101] | Estimate protein size and monitor electrophoresis/transfer [25] |
| Transfer Quality Controls | Ponceau S stain [100] [101]; Coomassie blue [26] | Visualize total protein pattern and confirm transfer efficiency [100] |
The integration of a comprehensive control system is fundamental to confirming antibody specificity and ensuring the generation of reliable, interpretable data in western blotting. By implementing positive controls, negative controls, loading controls, and specialized antibody controls within a systematic workflow, researchers can verify that observed results reflect biological reality rather than methodological artifacts. This approach is particularly critical in the context of SDS-PAGE sample preparation, where the separation of denatured proteins establishes the foundation for specific detection.
As the scientific community continues to address challenges with research reproducibility, the rigorous validation of antibodies through appropriate controls becomes increasingly important. The protocols and guidelines presented in this application note provide a framework for researchers and drug development professionals to establish robust antibody validation practices, ultimately contributing to the generation of more reliable and reproducible scientific data.
Assessing Transfer Efficiency with Ponceau S and Post-Transfer Gel Staining
Within the framework of SDS-PAGE for western blotting sample preparation research, confirming the efficiency of protein transfer from the gel to the membrane is a critical quality control checkpoint. Inaccurate assessment of transfer efficiency can lead to the misinterpretation of experimental results, as issues may be incorrectly attributed to immunodetection rather than the transfer process itself. This application note details two complementary techniques for evaluating transfer efficiency: Ponceau S staining of the blotting membrane and post-transfer Coomassie Blue staining of the polyacrylamide gel. Ponceau S staining provides a rapid, reversible method for visualizing protein patterns on the membrane itself, allowing for direct assessment of transfer uniformity and the potential for subsequent total protein normalization [103] [104]. Conversely, staining the gel after transfer with Coomassie Blue reveals any proteins that failed to emigrate, offering a direct measure of transfer completeness [105]. Used in tandem, these methods provide a robust strategy for troubleshooting and validating the electroblotting step, ensuring the integrity of data in downstream drug development applications.
Principles of Transfer Assessment
Ponceau S Staining: A Reversible Membrane Check
Ponceau S is a red anionic azo dye that binds nonspecifically to proteins via electrostatic interactions with positively charged amino acid residues such as lysine and arginine, as well as through non-covalent binding to hydrophobic protein regions [103]. Its key advantage is reversibility; the stain can be completely washed away with Tris-Buffered Saline with Tween (TBST) or deionized water, leaving the proteins accessible for subsequent immunodetection without interference [103] [106]. This property makes it an ideal tool for directly visualizing the success of the transfer onto nitrocellulose or PVDF membranes immediately after blotting. Researchers can quickly identify common transfer artifacts such as air bubbles (which appear as clear, blank circles), uneven contact between gel and membrane, or incomplete transfer of proteins of specific molecular weights [103] [107]. Furthermore, the resulting image of the total protein pattern can be used for normalization, a method increasingly recommended over housekeeping protein normalization due to its superior reliability across diverse experimental conditions [104].
Post-Transfer Gel Staining: A Measure of Completeness
After electroblotting, staining the polyacrylamide gel with Coomassie Brilliant Blue provides a direct visual report of transfer efficiency by highlighting any residual proteins that were not successfully transferred to the membrane [105]. Coomassie Blue is another anionic dye that binds to proteins primarily through hydrophobic and van der Waals interactions, fixed within the gel matrix by a solution containing acetic acid and methanol [108]. A well-transferred gel will show little to no protein staining, particularly in the regions of interest, indicating that most proteins have migrated out of the gel. The persistence of significant Coomassie-stained bands, especially those corresponding to the target protein's molecular weight, indicates incomplete transfer. However, it is crucial to note that Coomassie staining is an irreversible process that fixes the proteins in the gel, rendering it incompatible with further protein transfer or analysis from that gel [105]. Therefore, this method is purely a diagnostic tool for assessing the blotting process.
The following workflow diagram illustrates the strategic application of these two staining methods within a typical western blotting procedure.
Experimental Protocols
Protocol 1: Ponceau S Staining of Nitrocellulose or PVDF Membranes
This protocol describes a standard method for staining a western blot membrane with Ponceau S to assess transfer efficiency and uniformity [103] [107].
Research Reagent Solutions
| Reagent/Material | Function/Explanation |
|---|---|
| Ponceau S Staining Solution | A reversible, red anionic dye for visualizing total protein on membranes. Compatible with subsequent immunoblotting. |
| Nitrocellulose or PVDF Membrane | The solid support matrix to which proteins are transferred during electroblotting. |
| Distilled Water (dHâ‚‚O) | Used for brief rinsing steps to remove residual buffer and to destain the background. |
| TBST (Tris-Buffered Saline with Tween) | Used for complete destaining of the membrane before proceeding to the blocking step. |
Step-by-Step Procedure
- Post-Transfer Membrane Rinse (Optional): Following protein transfer, briefly rinse the membrane in a container with distilled water to eliminate any residual transfer buffer substances [103].
- Staining: Cover the entire membrane with sufficient Ponceau S staining solution (e.g., 0.1% w/v Ponceau S in 5% v/v acetic acid) and incubate for 5 minutes at room temperature with gentle agitation [103] [105].
- Washing and Visualization: Pour off the stain (which can often be reused) and rinse the membrane thoroughly with distilled water until the background is clear and red/pink protein bands are sharply visible [107].
- Documentation: Immediately capture an image of the stained membrane against a clear background. Note: Stain intensity fades over time, so prompt documentation is vital for accurate record-keeping and later analysis [103].
- Destaining: Wash the membrane with TBST buffer for at least three washes, 10 minutes per wash on a shaker, to completely remove the Ponceau S dye. If any stain remains visible, continue washing until the membrane is clear [103]. The membrane is now ready for the standard blocking step.
Protocol 2: Coomassie Blue Staining of Post-Transfer Gels
This protocol is used to stain the polyacrylamide gel after transfer to confirm that proteins have been efficiently transferred out of the gel [108] [105].
Research Reagent Solutions
| Reagent/Material | Function/Explanation |
|---|---|
| Coomassie Brilliant Blue R-250 | A sensitive anionic dye that binds tightly to proteins, fixing them in the gel matrix. |
| Fixing/Destaining Solution | A solution of water, acetic acid, and methanol (e.g., 40/10/50 v/v) that fixes proteins and removes unbound dye. |
| Polyacrylamide Gel | The gel used for SDS-PAGE separation, now with a reduced protein load after electroblotting. |
Step-by-Step Procedure
- Post-Transfer Gel Handling: After the transfer is complete, carefully retrieve the gel from the transfer sandwich.
- Fixing and Staining: Wash the gel three times with distilled water. Then, cover the gel with Coomassie Blue staining solution (e.g., 0.25% Coomassie Brilliant Blue R-250 in 40% dHâ‚‚O, 10% acetic acid, 50% methanol). Incubate for 4 hours to overnight at room temperature with slow agitation [108].
- Destaining: Transfer the gel to a destaining solution (e.g., 67.5% dHâ‚‚O, 7.5% acetic acid, 25% methanol). Place the gel on a shaker and replace the rinse mixture with fresh solution several times until the background is clear and the blue protein bands are distinct [108].
- Documentation: Capture an image of the stained gel. The presence of prominent bands, particularly in the molecular weight region of your target protein, indicates incomplete transfer.
Data Presentation and Analysis
Comparison of Staining Properties
The choice between Ponceau S and Coomassie Blue staining depends on the experimental objective. The table below summarizes their key characteristics for easy comparison.
Table 1: Characteristics of Ponceau S and Coomassie Blue Stains for Transfer Assessment
| Parameter | Ponceau S Stain | Coomassie Blue Stain |
|---|---|---|
| Primary Use | Visualizing protein on the membrane post-transfer [103] | Visualizing residual protein in the gel post-transfer [105] |
| Compatibility with Immunoblotting | Fully compatible; stain is reversible [103] [105] | Not compatible; stain is irreversible and fixes proteins [105] |
| Sensitivity (Detection Limit) | ~200 ng per band [105] | ~50 ng per band [105] |
| Typical Staining Duration | 5-10 minutes [105] | 2 hours to overnight [108] [105] |
| Key Advantage | Quick quality control; usable for total protein normalization [104] | Direct confirmation of transfer completeness [105] |
Interpreting Staining Results and Troubleshooting
The patterns observed during Ponceau S staining provide immediate diagnostic information about the transfer process. The table below lists common issues and their probable causes.
Table 2: Troubleshooting Guide for Ponceau S Staining Results
| Observation | Potential Cause | Recommended Solution |
|---|---|---|
| Weak or No Bands | Insufficient protein loaded or incomplete transfer [103] [107]. | Load more protein, verify protein quantification, extend transfer time, especially for high molecular weight proteins [103] [68]. |
| Blank Areas/Circles | Air bubbles trapped between gel and membrane during transfer setup [103] [107]. | Use a roller or serological pipette to gently but thoroughly remove all air bubbles when assembling the transfer sandwich [103]. |
| Smeared Bands | Problems during electrophoresis, such as outdated reducing agent, insufficient SDS, or protein overload [107]. | Use fresh 2-mercaptoethanol, ensure sufficient SDS in all buffers, and reduce the amount of sample loaded per lane [107]. |
| High Background Signal | Incomplete destaining of Ponceau S or issues in subsequent steps (unrelated to transfer) [103]. | Ensure thorough washing with TBST or water after staining. If background persists after immunodetection, optimize blocking and antibody concentrations [103]. |
Integrating Ponceau S membrane staining and post-transfer Coomassie Blue gel staining into the western blotting workflow provides a comprehensive and robust system for assessing protein transfer efficiency. Ponceau S offers a rapid, reversible check for transfer uniformity and is suitable for total protein normalization, while Coomassie Blue delivers definitive evidence of transfer completeness by revealing residual protein. For researchers in drug development and basic science, where quantitative accuracy is paramount, the systematic application of these diagnostic stains ensures that the critical transfer step is not a hidden source of error, thereby strengthening the reliability and reproducibility of western blot data.
Within the framework of research on western blotting sample preparation, the choice of protein separation method is a critical foundational step. Polyacrylamide Gel Electrophoresis (PAGE) serves as the core technique for resolving complex protein mixtures, with SDS-PAGE and Native PAGE representing two fundamentally different approaches. SDS-PAGE, which denatures proteins to separate them by molecular weight, is the cornerstone of western blotting sample preparation [25] [109]. In contrast, Native PAGE separates proteins in their folded, functional state based on a combination of size, charge, and shape, providing complementary information about native protein complexes [110] [111]. This application note provides a detailed comparative analysis of these techniques, including protocols and integration strategies, to guide researchers and drug development professionals in selecting the optimal method for their specific applications.
Fundamental Principles and Comparative Analysis
Core Mechanistic Differences
The primary distinction between these techniques lies in their treatment of protein structure. SDS-PAGE employs the anionic detergent sodium dodecyl sulfate (SDS) and reducing agents to denature proteins, linearize polypeptide chains, and impart a uniform negative charge density [110] [111]. This creates conditions where separation occurs almost exclusively based on molecular weight, as the SDS-protein complexes migrate through the polyacrylamide gel matrix toward the anode with smaller proteins moving faster than larger ones [111] [11].
In contrast, Native PAGE maintains proteins in their native conformation by omitting denaturing agents. Separation depends on the protein's intrinsic charge, size, and three-dimensional structure, allowing the preservation of enzyme activity, protein-protein interactions, and non-covalently bound cofactors [110] [112] [111]. The migration in Native PAGE is influenced by both the net charge at the running buffer pH and the hydrodynamic size of the folded protein [25].
Direct Technique Comparison
Table 1: Comprehensive Comparison of SDS-PAGE and Native PAGE Characteristics
| Parameter | SDS-PAGE | Native PAGE |
|---|---|---|
| Separation Basis | Molecular weight primarily [110] [113] | Size, charge, and shape [110] [112] |
| Protein State | Denatured and linearized [110] [111] | Native, folded conformation [110] [112] |
| Detergent (SDS) | Present (0.1-0.2%) [110] [114] | Absent [110] |
| Reducing Agents | Typically present (DTT, BME) [110] | Absent [110] |
| Sample Preparation | Heating at 70-100°C [110] [111] | No heating [110] |
| Net Protein Charge | Consistently negative [110] | Positive or negative (intrinsic charge) [110] |
| Typical Running Temperature | Room temperature [110] | 4°C [110] |
| Protein Function Post-Separation | Lost [110] | Retained [110] |
| Protein Recovery | Generally not recoverable [110] | Recoverable for functional studies [110] |
| Primary Applications | Molecular weight determination, western blotting, purity assessment [110] [109] | Enzyme activity assays, protein-protein interactions, oligomeric state determination [110] [112] |
Table 2: Strategic Application Guide Based on Research Objectives
| Research Goal | Recommended Technique | Rationale |
|---|---|---|
| Western Blotting | SDS-PAGE [25] [109] | Denaturation facilitates efficient transfer to membranes and antibody recognition of linear epitopes |
| Molecular Weight Determination | SDS-PAGE [110] [111] | Provides accurate molecular weight estimates independent of native charge or shape |
| Enzyme Activity Assays | Native PAGE [110] [111] | Preserves catalytic function and native conformation |
| Protein-Protein Interactions | Native PAGE [112] [111] | Maintains quaternary structure and complex formation |
| Metal Cofactor Retention | Native PAGE or NSDS-PAGE [114] | Preserves non-covalent metal binding essential for function |
| Oligomeric State Analysis | Native PAGE [115] | Maintains subunit associations; can be combined with SDS-PAGE for comparative analysis |
Experimental Protocols
Standard SDS-PAGE Protocol for Western Blotting
Principle: SDS denatures proteins and confers uniform negative charge, allowing separation by molecular weight within a polyacrylamide gel matrix under an electric field [111].
Materials & Reagents:
- Protein Samples: Cell lysates, tissue homogenates, or purified proteins
- SDS Sample Buffer: 62.5 mM Tris-HCl (pH 6.8), 2% SDS, 10% glycerol, 0.01% bromophenol blue [111]
- Reducing Agent: 5% β-mercaptoethanol or 100 mM DTT (added fresh) [110]
- Polyacrylamide Gel: Pre-cast or hand-cast gels (8-15% depending on protein size) [25] [111]
- Running Buffer: 25 mM Tris, 192 mM glycine, 0.1% SDS (pH 8.3) [111]
- Molecular Weight Markers: Pre-stained or unstained protein standards [25]
Procedure:
- Sample Preparation: Mix protein samples with SDS sample buffer containing reducing agent. Heat at 70-100°C for 5-10 minutes to denature proteins [110] [111]. Centrifuge briefly to collect condensation.
Gel Setup: Assemble electrophoresis apparatus according to manufacturer instructions. Fill inner and outer chambers with running buffer to cover electrodes [25].
Sample Loading: Using a microsyringe, load equal amounts of protein (10-50 μg) and molecular weight markers into wells. Include appropriate controls [25].
Electrophoresis: Connect power supply and run at constant voltage (150-200V for mini-gels) until the dye front reaches the bottom of the gel (approximately 45-60 minutes) [114].
Post-Electrophoresis Processing: For western blotting, proceed to protein transfer. For gel staining, carefully separate gel plates and process for Coomassie, silver, or fluorescent staining [25].
Troubleshooting Common Issues:
- Smiling Bands: Caused by uneven heating; ensure adequate cooling and check buffer composition [25]
- Smeared Bands: Indicates incomplete denaturation; ensure fresh reducing agents and adequate heating time [25]
- Uneven Migration: Check for buffer pH errors or uneven gel polymerization [25]
Standard Native PAGE Protocol
Principle: Proteins are separated in their native state through a polyacrylamide gel matrix based on their intrinsic charge, size, and shape under non-denaturing conditions [110] [111].
Materials & Reagents:
- Native Sample Buffer: 50 mM BisTris, 50 mM NaCl, 10% glycerol, 0.001% Ponceau S (pH 7.2) [114]
- Native Running Buffer: Cathode buffer (50 mM BisTris, 50 mM Tricine, pH 6.8) and anode buffer (50 mM BisTris, 50 mM Tricine, pH 6.8) [114]
- Polyacrylamide Gel: Pre-cast or hand-cast native gels (4-16% gradient commonly used) [114]
- Native Molecular Weight Markers: Unstained protein standards with known native molecular weights
Procedure:
- Sample Preparation: Mix protein samples with native sample buffer. Do not heat samples. Keep samples at 4°C to maintain protein stability [110].
Gel Setup: Pre-run the native gel for approximately 30 minutes at 100V to establish equilibrium conditions. Maintain temperature at 4°C throughout the procedure using a cooled electrophoresis unit or cold room [110].
Sample Loading: Load samples and native molecular weight markers into wells. Take care not to overload wells to prevent distortion of protein bands.
Electrophoresis: Run at constant voltage (150V for mini-gels) for extended time (90-95 minutes) until the dye front approaches the bottom of the gel [114].
Post-Electrophoresis Analysis: Proteins can be recovered by passive diffusion or electro-elution for functional studies. Alternatively, activity staining or western blotting with specific antibodies can be performed [111].
Advanced Technique: Native SDS-PAGE (NSDS-PAGE)
Principle: A modified SDS-PAGE method that reduces denaturing conditions to maintain some native protein properties while providing higher resolution than traditional Native PAGE [114].
Protocol Modifications from Standard SDS-PAGE:
- Sample Buffer: Omit SDS and EDTA from sample buffer; do not heat samples [114]
- Running Buffer: Reduce SDS concentration to 0.0375% (compared to standard 0.1%) and omit EDTA [114]
- Electrophoresis Conditions: Similar to standard SDS-PAGE (200V for 30-45 minutes) [114]
Applications: Particularly valuable for metalloprotein analysis, with studies showing 98% zinc retention compared to 26% in standard SDS-PAGE [114]. Seven of nine model enzymes tested retained activity after NSDS-PAGE separation [114].
Research Reagent Solutions
Table 3: Essential Reagents for PAGE-Based Protein Separation
| Reagent/Category | Specific Examples | Function & Application Notes |
|---|---|---|
| Detergents | Sodium Dodecyl Sulfate (SDS) | Denatures proteins and confers negative charge for SDS-PAGE [110] [111] |
| Reducing Agents | Dithiothreitol (DTT), β-mercaptoethanol | Breaks disulfide bonds for complete denaturation in SDS-PAGE [110] |
| Gel Matrix Components | Acrylamide, bis-acrylamide | Forms cross-linked polyacrylamide gel matrix; concentration determines pore size [111] |
| Polymerization Initiators | Ammonium persulfate (APS), TEMED | Catalyzes acrylamide polymerization reaction [111] |
| Buffering Systems | Tris-glycine, Bis-Tris, Tricine | Maintains pH during electrophoresis; discontinuous systems enhance resolution [25] [111] |
| Tracking Dyes | Bromophenol blue, Phenol red | Visualizes migration progress during electrophoresis [114] |
| Molecular Weight Standards | Pre-stained and unstained protein ladders | Calibrates gel for molecular weight determination [25] [111] |
| Specialized Dyes (Native PAGE) | Coomassie G-250 (BN-PAGE) | Imparts mild negative charge to proteins in Blue Native PAGE [114] |
Integration with Downstream Applications
Western Blotting with SDS-PAGE
SDS-PAGE is the preferred separation method prior to western blotting, as the denatured, linearized proteins transfer more efficiently to membranes and are more accessible for antibody binding [25] [109]. The accurate molecular weight determination provided by SDS-PAGE also facilitates initial protein identification when comparing to expected sizes [109].
Critical Considerations for Western Blotting:
- Transfer Efficiency: Proteins must be completely transferred from gel to membrane for detection [109]
- Antibody Specificity: Confirmation of target protein identity requires appropriate positive and negative controls [25]
- Loading Controls: Housekeeping proteins (e.g., β-actin) normalize for sample loading variations between wells [25]
Structural and Functional Analysis with Native PAGE
Native PAGE excels in applications requiring preservation of protein function or determination of oligomeric states. A classic example involves comparing migration patterns between Native PAGE and non-reducing SDS-PAGE to distinguish non-covalent versus disulfide-linked protein complexes [115]. When a protein migrates as a 120 kDa species in Native PAGE but as 60 kDa in non-reducing SDS-PAGE, this indicates a non-covalent dimeric structure (two 60 kDa subunits) [115].
SDS-PAGE and Native PAGE offer complementary approaches for protein separation, each with distinct advantages for specific research applications. SDS-PAGE remains the gold standard for western blotting sample preparation, providing high-resolution separation by molecular weight that facilitates accurate protein identification and quantification. Native PAGE preserves native protein structure and function, enabling studies of protein complexes, enzymatic activity, and metal cofactor retention. The recently developed NSDS-PAGE method offers a promising hybrid approach, maintaining higher resolution while preserving some functional properties. Researchers should select the appropriate technique based on their specific objectives, considering that SDS-PAGE is ideal for analytical applications like western blotting, while Native PAGE is superior for functional studies and complex analysis.
Conclusion
Effective SDS-PAGE is the cornerstone of successful Western blotting, dictating the reliability of all subsequent detection and analysis. By mastering the foundational principles, adhering to meticulous protocols, proactively troubleshooting, and rigorously validating results with appropriate controls, researchers can generate robust, reproducible data. As protein analysis continues to drive discoveries in disease mechanisms and drug development, optimizing this initial separation step remains paramount for achieving accurate quantification and ensuring the integrity of biomedical research findings.
References
- 1. SDS-PAGE & Protein Separation Role of SDS Explained [https://www.letstalkacademy.com/sds-page-protein-separation-role-of-sds-explained/]
- 2. SDS-PAGE: A Cornerstone of Protein Analysis in Modern ... [https://www.metwarebio.com/sds-page-protein-analysis/]
- 3. Protein Electrophoresis Using SDS-PAGE: A Detailed ... [https://www.goldbio.com/blogs/articles/protein-electrophoresis-sds-page-overview?srsltid=AfmBOoohswvKeL_956S4QIyvOqLOzk76EPaJn_GsShstL6DwwT6avbNn]
- 4. How SDS-PAGE Works: 7 Key Points Every Scientist ... [https://bitesizebio.com/580/how-sds-page-works/]
- 5. Western Blot Sample Preparation Protocol [https://www.novusbio.com/support/support-by-application/western-blot-sample-preparation?srsltid=AfmBOormf_CqWHF2iI2LKZiwhLDtkt-0AuqHDi5kmSxhLm-GW7Si0v2w]
- 6. SDS-PAGE and Western Blotting [https://www.protocols.io/view/sds-page-and-western-blotting-gy6gbxzbx.html]
- 7. Western Blot Sample Preparation Protocol [https://www.thermofisher.com/us/en/home/life-science/protein-biology/protein-biology-learning-center/protein-gel-electrophoresis-information/western-blot-protocols/western-blot-sample-preparation.html]
- 8. SDS-PAGE and Western Blot Protocol [https://www.bostonbioproducts.com/resources/western-blotting-protocol/]
- 9. Western blot protocol [https://www.abcam.com/en-us/technical-resources/protocols/western-blot]
- 10. SDS-PAGE [https://en.wikipedia.org/wiki/SDS-PAGE]
- 11. How SDS-PAGE Separates Proteins [https://azurebiosystems.com/blog/how-sds-page-separates-proteins/]
- 12. Western Blot: The Complete Guide [https://www.antibodies.com/applications/western-blotting]
- 13. Deciphering food proteins: The applications of SDS-PAGE ... [https://www.sciencedirect.com/science/article/abs/pii/S2212429225003025]
- 14. Western Blotting Sample Preparation [https://www.sigmaaldrich.com/US/en/technical-documents/protocol/protein-biology/western-blotting/western-blotting-sample-preparation?srsltid=AfmBOor95lObWgJ0YPYHLLlnGG9VEWIvVHPniYtIDZh5nlx-DDYmCdZW]
- 15. SDS-PAGE: The science behind all those bubbles [https://www.antibodiesinc.com/pages/sds-page-demystified?srsltid=AfmBOopa3CXdw9hPW5EiUqLBfvG5WG-GmjC-7nc39Gzh5AVN0vuDmGWH]
- 16. Protein Electrophoresis Using SDS-PAGE: A Detailed ... [https://www.goldbio.com/blogs/articles/protein-electrophoresis-sds-page-overview?srsltid=AfmBOopX8ZdHvJS-V0BTegP3sIBaPkk438PiasfSEocYa-GJDVgROUGi]
- 17. What is the difference between stacking gel and resolving ... [https://www.aatbio.com/resources/faq-frequently-asked-questions/What-is-the-difference-between-stacking-gel-and-resolving-gel-in-SDS-PAGE]
- 18. An Easy SDS-PAGE Gel Recipe & 10-Step Protocol [https://bitesizebio.com/59429/sds-page-gel-recipe/]
- 19. Western Blot SDS-PAGE [https://www.novusbio.com/support/support-by-application/western-blot-sds-page?srsltid=AfmBOoqDDxy5hSYGaR7gtL6D6aMEl1X9pEdDh5k0ulTf64Ihc0dV7y3i]
- 20. A time-saving one-step polyacrylamide gel with a colored ... [https://www.sciencedirect.com/science/article/abs/pii/S0003269724002240]
- 21. SDS-PAGE: The science behind all those bubbles [https://www.antibodiesinc.com/pages/sds-page-demystified?srsltid=AfmBOopVOQh0qcsZ2GkKe1ZtYkJs3oUvxi0Mb2DMFSBrI8o8Gufogk1S]
- 22. How to Master SDS-PAGE and Western Blot in 5 Easy Steps [https://www.neobiotechnologies.com/resources/sds-page-western-blot/?srsltid=AfmBOor36b_GbHJDAB1UjQSWr3a3KpI6sHwAV0s3OeyTZZMPWeRZNfA-]
- 23. The principle and method of polyacrylamide gel ... [https://www.mblbio.com/bio/g/support/method/sds-page.html]
- 24. Western Blot Sample Preparation Protocol [https://www.novusbio.com/support/support-by-application/western-blot-sample-preparation?srsltid=AfmBOooGtDUBEFewQeG6Vo8_G7hE3njrucZI3QP4VNgITwJ13Szy2sNb]
- 25. Western blotting guide: Part 2, Protein separation by SDS- ... [https://www.jacksonimmuno.com/secondary-antibody-resource/technical-tips/western-blotting-guide-part-2/]
- 26. SDS-PAGE guide: Sample preparation to analysis [https://www.abcam.com/en-us/knowledge-center/western-blot/sds-page-guide]
- 27. 6 Best Tips for Troubleshooting Poor Band Separation on ... [https://azurebiosystems.com/blog/6-tips-for-troubleshooting-poor-band-separation-on-sds-page-gels/]
- 28. Western Blot SDS-PAGE [https://www.novusbio.com/support/support-by-application/western-blot-sds-page?srsltid=AfmBOorXtNr7YCds3UoKASJU9pcZCmBQafpCWq6uPT4X98m-lhtrkKJH]
- 29. How to choose an acrylamide gel concentration for western ... [https://hellobio.com/how-to-choose-an-acrylamide-gel-concentration-for-western-blot/]
- 30. Western Blot Troubleshooting [https://www.thermofisher.com/us/en/home/life-science/protein-biology/protein-biology-learning-center/protein-gel-electrophoresis-information/western-blot-troubleshooting.html]
- 31. Troubleshooting SDS-PAGE Sample Preparation Issues [https://www.goldbio.com/blogs/articles/troubleshooting-sds-page-sample-preparation-issues?srsltid=AfmBOoqVDNDdI1VJbfin8PqHK2lupKZ0fia1IkC0WbSq9Qs76-bya_wM]
- 32. Protein Standards & Ladders [https://www.thermofisher.com/us/en/home/life-science/protein-biology/protein-gel-electrophoresis/protein-standards-ladders.html]
- 33. Current Status of Protein Quantification Technologies [https://www.bioprocessintl.com/assays/current-status-of-protein-quantification-technologies]
- 34. Bradford protein assay [https://www.abcam.com/en-us/knowledge-center/western-blot/bradford-assay]
- 35. Bradford vs BCA Assay: Which to Choose? [https://opentrons.com/applications/bradford-assay/bradford-vs-bca?srsltid=AfmBOorYQDohqHvhvkNmeMBofjakLR8uM33p1dX5SKT0HIZ3cnaJiW0P]
- 36. Pierceâ„¢ BCA Protein Assay Kits 1 Kit (1 L) | Buy Online [https://www.thermofisher.com/order/catalog/product/23225]
- 37. BCA Protein Assay Kits Simplify Protein Measurements [https://racinecountyeye.com/2025/05/29/bca-protein-assay-kits-guide/]
- 38. Pierce BCA Protein Assay Protocol [https://www.protocols.io/view/pierce-bca-protein-assay-protocol-dyti7wke.html]
- 39. Western Blotting Protocol [https://www.cellsignal.com/learn-and-support/protocols/protocol-western?srsltid=AfmBOorsRVSkGkkce5awloJ37Io13Aq5jknR_8NX4dJuR8Rip1StM7-b]
- 40. Boiling Proteins for Western Blotting: Optimal Conditions ... [https://www.assaygenie.com/blog/boiling-proteins-for-western-blotting-optimal-conditions-and-best-practices/?srsltid=AfmBOoqXikW7BUiCM8BHEWWCd0QmaSMGibSGBkEKPKQoM5OxjYg7c-mg]
- 41. Foolproof Guide to SDS-Page Ladder Migration [https://azurebiosystems.com/blog/sds-page-troubleshooting-protein-separation-but-my-ladder-is-fine/]
- 42. How Does SDS-PAGE Work? A Comprehensive Guide [https://www.metwarebio.com/how-sds-page-works-guide/]
- 43. SDS-PAGE Protocol [https://www.rockland.com/resources/sds-page-protocol/?srsltid=AfmBOooWVL1kt1VVF7dFL7L8a4aUbDy48AJLyi0EorARBP1oSACvTEAx]
- 44. SDS-PAGE Electrophoresis FAQ [https://microbiosci.creative-biogene.com/sds-page-electrophoresis-faq.html]
- 45. Titanium Dioxide Photocatalytic Polymerization of Acrylamide ... [https://pmc.ncbi.nlm.nih.gov/articles/PMC4750088/]
- 46. A Complete Guide to Handcasting SDS-PAGE Gels [https://blog.abclonal.com/blog/a-complete-guide-to-handcasting-sds-page-gels]
- 47. Troubleshooting Gel Casting/ Polymerization Issues in ... [https://www.goldbio.com/blogs/articles/troubleshooting-gel-casting-polymerization-issues-in-sds-page?srsltid=AfmBOooSasaKzdSYk7HF-_SfSeDVzgFL9pYqoUhMOKfCYR0K33PzPuJk]
- 48. Troubleshooting Sodium Dodecyl Sulfate- Polyacrylamide ... [https://www.hycultbiotech.com/sds-page/troubleshooting/]
- 49. Troubleshooting SDS-PAGE Gel Running Issues [https://www.goldbio.com/blogs/articles/troubleshooting-sds-page-gel-running-issues?srsltid=AfmBOormuSNkwvwGx0DHM-6vvTW5WgZx7J2iPI4A6lsovxFs06sm_AAG]
- 50. Western blotting guide: Part 1, Introduction and Sample ... [https://www.jacksonimmuno.com/secondary-antibody-resource/technical-tips/western-blotting-guide-part-1/]
- 51. Western Blot - StatPearls - NCBI Bookshelf - NIH [https://www.ncbi.nlm.nih.gov/sites/books/NBK542290/]
- 52. Electrophoresis in western blot [https://www.abcam.com/en-us/technical-resources/guides/western-blot-guide/electrophoresis]
- 53. Western Blotting: Products, Protocols, & Applications [https://www.thermofisher.com/us/en/home/life-science/protein-biology/protein-biology-learning-center/protein-biology-resource-library/pierce-protein-methods/overview-western-blotting.html]
- 54. How current, voltage , and power settings affect SDS - PAGE – Bioss [https://www.biossusa.com/blogs/news/how-current-voltage-and-power-settings-affect-sds-page]
- 55. Troubleshooting SDS-PAGE Gel Running Issues [https://www.goldbio.com/blogs/articles/troubleshooting-sds-page-gel-running-issues?srsltid=AfmBOopIfmQqzYlURvgNk5JkbCZHIo6tzoIszBk6Qpzm2YtP84plFQbS]
- 56. - SDS SDS PAGE (10x) Preparation... | AAT Bioquest Running Buffer [https://www.aatbio.com/resources/buffer-preparations-and-recipes/sds-page-10x-sds-running-buffer]
- 57. - SDS : Protein Analysis Made Easy PAGE [https://www.numberanalytics.com/blog/sds-page-protein-analysis-made-easy]
- 58. Western Blotting Protocol [https://www.cellsignal.com/learn-and-support/protocols/protocol-western?srsltid=AfmBOopu_qQe7omOQW71GyAdlKEKdF8OZ_5NO2OnYJKZGbvJKZHEmOLu]
- 59. Troubleshooting SDS-PAGE Gel Running Issues [https://www.goldbio.com/blogs/articles/troubleshooting-sds-page-gel-running-issues?srsltid=AfmBOorC7huenkTTXP2G-IjACHr0c8b7KhrnGGbt2PRSlbZtqsQBrWMI]
- 60. Western Blot: Technique, Theory, and Trouble Shooting [https://pmc.ncbi.nlm.nih.gov/articles/PMC3456489/]
- 61. Western Blot Troubleshooting Guide | Boster Bio [https://www.bosterbio.com/protocol-and-troubleshooting/western-blot-troubleshooting?srsltid=AfmBOop185OI-Am4-pkRHmeHK0YjCdmA090M0m5sm3WPg58y-WEkIWAs]
- 62. SDS-PAGE Optimization for Western Blot [https://www.bosterbio.com/protocol-and-troubleshooting/western-blotting-optimization/sds-page?srsltid=AfmBOoo4hFPMhUQK1BnAmwb7AEYEZ1TA7iBI92iCB_YvrFVV06rI3WQ0]
- 63. Common artifacts and mistakes made in electrophoresis [https://pmc.ncbi.nlm.nih.gov/articles/PMC7295095/]
- 64. Troubleshooting SDS-PAGE Gel Running Issues [https://www.goldbio.com/blogs/articles/troubleshooting-sds-page-gel-running-issues?srsltid=AfmBOorRMk6wbeHJUWj83skvfR1Ga1AinXhFeMka9gPCv8wMtXN7JHMD]
- 65. Troubleshooting SDS-PAGE Sample Preparation Issues [https://www.goldbio.com/blogs/articles/troubleshooting-sds-page-sample-preparation-issues?srsltid=AfmBOoo2bbOXGl5lbsU6Ev8m2J2TsdjsC56xFA428t0_2M70ltjAokmV]
- 66. Sodium dodecyl sulfate-polyacrylamide gel electrophoresis ... [https://www.sciencedirect.com/science/article/pii/S000326972200207X]
- 67. Tech Tips | In search of low molecular weight proteins [https://www.ptglab.com/news/blog/tech-tips-in-search-of-low-molecular-weight-proteins/?srsltid=AfmBOoriESYp-7VW3NxTlYkG4d-arq85-jG9CMxRPBcRbeL15Txa0NYT]
- 68. Successful Transfer High Molecular Weight Proteins during ... [https://www.thermofisher.com/us/en/home/life-science/protein-biology/protein-biology-learning-center/protein-biology-resource-library/protein-biology-application-notes/successful-transfer-high-mw-proteins-western-blotting.html]
- 69. Western blot protocol for high molecular weight proteins [https://www.abcam.com/en-us/technical-resources/protocols/western-blot-for-high-molecular-weights]
- 70. Western blot protocol for low molecular weight proteins [https://www.abcam.com/en-us/technical-resources/protocols/western-blot-protocol-for-low-molecular-weight-proteins]
- 71. Western Blot Transfer Methods [https://www.thermofisher.com/us/en/home/life-science/protein-biology/protein-biology-learning-center/protein-biology-resource-library/pierce-protein-methods/western-blot-transfer-methods.html]
- 72. Six Tips for Efficient Transfer of Your Proteins [https://www.bioradiations.com/six-tips-for-efficient-transfer-of-your-proteins/]
- 73. Western blotting of high and low molecular weight proteins ... [https://pmc.ncbi.nlm.nih.gov/articles/PMC7337971/]
- 74. Western blotting guide: Part 4, Membrane blocking [https://www.jacksonimmuno.com/secondary-antibody-resource/immuno-techniques/western-blotting-guide-part-4/]
- 75. Blocking Buffers for Western Blot and ELISA [https://www.thermofisher.com/us/en/home/life-science/protein-biology/protein-biology-learning-center/protein-biology-resource-library/pierce-protein-methods/blocking-buffers-western-blot-elisa.html]
- 76. 7 Tips For Optimizing Your Western Blotting Experiments [https://www.ptglab.com/news/blog/7-tips-for-optimizing-your-western-blotting-experiments/?srsltid=AfmBOoqtTEF9dJhRspnHF-UpvnByg7xR4qVB9J7nhkonRQ7m0iyw8UMz]
- 77. Western blotting guide: Part 5, Primary Antibodies [https://www.jacksonimmuno.com/secondary-antibody-resource/immuno-techniques/western-blotting-guide-part-5/]
- 78. Blocking Buffer Optimization Protocol [https://www.licorbio.com/support/contents/applications/western-blots/blocking-buffer-optimization-protocol.html]
- 79. Antibody validation for Western blot: By the user, for the user [https://pmc.ncbi.nlm.nih.gov/articles/PMC6983856/]
- 80. Stripping and Reprobing Western Blots [https://www.thermofisher.com/us/en/home/life-science/protein-biology/protein-biology-learning-center/protein-biology-resource-library/pierce-protein-methods/stripping-reprobing-western-blots.html]
- 81. Western Blot Sample Preparation Protocol [https://www.novusbio.com/support/support-by-application/western-blot-sample-preparation?srsltid=AfmBOopCw8X-hr3F2oieAYOQuaUuBgNFqZP9m9rI94n65Gx60PZW_maN]
- 82. A Scientist's Guide to Conquering High Background in ... [https://www.clyte.tech/post/guide-to-conquering-high-background-in-western-blotting?srsltid=AfmBOopJPP4Wd8pjUYfNHvuF-jDBxZtoEpAGAhdyRhMSMaNi56QpIdz9]
- 83. Getting Rid of the Noise: Western Blot Blocking [https://azurebiosystems.com/blog/getting-rid-of-the-noise-western-blot-blocking/]
- 84. Western Blotting Protocol [https://www.cellsignal.com/learn-and-support/protocols/protocol-western?srsltid=AfmBOorWB1hzFJ3GKVpWSuUoCaBkAj61-05kJRni2jl-VwzLg4351BES]
- 85. Western Blot Troubleshooting: Non-specific bands [https://azurebiosystems.com/blog/western-blot-troubleshooting-what-to-do-about-non-specific-bands/]
- 86. SDS-PAGE Troubleshooting: Why Are My Protein Bands ... [https://synapse.patsnap.com/article/sds-page-troubleshooting-why-are-my-protein-bands-fuzzy]
- 87. Protein Markers [https://www.sigmaaldrich.com/US/en/products/protein-biology/protein-electrophoresis-and-western-blotting/protein-markers?srsltid=AfmBOopHHLqQXRi_E1azAJICFlAvGEpAkCWjZJUGoo4hMNN0xzYheHk1]
- 88. Western Blot SDS-PAGE [https://www.novusbio.com/support/support-by-application/western-blot-sds-page?srsltid=AfmBOopN3FFmG9x5QW45H-uRNTBenXarDrojQAYQlB14i772strNVrc_]
- 89. How to Validate Protein Purity Using SDS-PAGE [https://synapse.patsnap.com/article/how-to-validate-protein-purity-using-sds-page]
- 90. Choosing the Right Molecular Weight Marker for SDS-PAGE [https://bitesizebio.com/8419/choosing-the-right-molecular-weight-marker-for-sds-page/]
- 91. SDS-PAGE Protocol & Troubleshooting - Creative Biolabs [https://www.creativebiolabs.net/sds-page.htm]
- 92. Loading Controls for Western Blotting [https://www.sigmaaldrich.com/US/en/technical-documents/technical-article/protein-biology/western-blotting/loading-controls-western-blotting?srsltid=AfmBOoqvG-8WkcttMnguOOvuFgLeI3444YRRM2zSI-EkUbyYxQcPHwR5]
- 93. Verify Transfer & Normalize Western Blots for Reliable Data [https://azurebiosystems.com/blog/the-key-to-consistent-western-blots-totalstain-q-for-reliable-data/]
- 94. How to Master SDS-PAGE and Western Blot in 5 Easy Steps [https://www.neobiotechnologies.com/resources/sds-page-western-blot/?srsltid=AfmBOoq7hHvzXbfMiVULzbR0nin0cQ8lYnpysnxjtQ5F01BagGHuL7m1]
- 95. SDS-PAGE Protocol [https://www.rockland.com/resources/sds-page-protocol/?srsltid=AfmBOori_wpsWod2o0k9eoOiuwscfh0yeGj78VzbQwGpI7m0AnlgMN--]
- 96. Validating Antibodies for Quantitative Western Blot ... [https://www.nature.com/articles/s41598-018-29436-0]
- 97. Recommended controls for western blot [https://www.abcam.com/en-us/technical-resources/guides/western-blot-guide/recommended-controls-for-western-blot]
- 98. A systematic approach to quantitative Western blot analysis [https://www.sciencedirect.com/science/article/pii/S000326971930750X]
- 99. Positive and Negative Controls [https://www.rockland.com/resources/positive-and-negative-controls/?srsltid=AfmBOoqzbALALjdYB-gD1Rz7Rg00s0GUOVRoueobb749SNxgdloZuC3D]
- 100. Loading controls and antibody validation for Western blot ... [https://azurebiosystems.com/blog/loading-controls-antibody-validation-western-blot-quantification/]
- 101. General Western Blot Protocol Overview [https://www.novusbio.com/support/support-by-application/western-blot/protocol.html?srsltid=AfmBOoqzDZdsnDGZ52Q8ldlx2djCgnkcoeX3jUSmWYfNGn59xbYZSeDj]
- 102. How to Master SDS-PAGE and Western Blot in 5 Easy Steps [https://www.neobiotechnologies.com/resources/sds-page-western-blot/?srsltid=AfmBOooHhQBJj0uWDx-VQlOrbvc0Q5jR6Xui5TUjiPqX2DJajjp8Eljg]
- 103. Ponceau S staining: Purpose, protocol, and tips [https://www.abcam.com/en-us/knowledge-center/western-blot/ponceau-s-staining-western-blot]
- 104. Ponceau S Staining for Total Protein Normalization - PMC [https://pmc.ncbi.nlm.nih.gov/articles/PMC6954006/]
- 105. A Tale of Two Stains: Ponceau S vs Coomassie Blue - CST Blog [https://blog.cellsignal.com/a-tale-of-two-stains-ponceau-s-vs-coomassie-blue]
- 106. Western blotting guide: Part 3, Electroblotting – Protein ... [https://www.jacksonimmuno.com/secondary-antibody-resource/technical-tips/western-blotting-guide-part-3/]
- 107. Ponceau S Staining: Easy Guide to Fix 7 Western Blot Issues [https://bitesizebio.com/72803/ponceau-s-staining/]
- 108. Protein transfer and visualization in western blot [https://www.abcam.com/en-us/technical-resources/guides/western-blot-guide/protein-transfer-and-visualization-in-western-blot]
- 109. How to Master SDS-PAGE and Western Blot in 5 Easy Steps [https://www.neobiotechnologies.com/resources/sds-page-western-blot/?srsltid=AfmBOopqDCp4a3YnW-vQiTjogWNfMzneCgBphcf7n08esM2FAaXYVscR]
- 110. Differences between SDS PAGE and Native PAGE [https://www.geeksforgeeks.org/biology/differences-between-sds-page-and-native-page/]
- 111. Overview of Protein Electrophoresis [https://www.thermofisher.com/us/en/home/life-science/protein-biology/protein-biology-learning-center/protein-biology-resource-library/pierce-protein-methods/overview-electrophoresis.html]
- 112. How Is Native PAGE Different from SDS-PAGE? [https://synapse.patsnap.com/article/how-is-native-page-different-from-sds-page]
- 113. What is the difference between PAGE and SDS-PAGE? [https://www.aatbio.com/resources/faq-frequently-asked-questions/What-is-the-difference-between-PAGE-and-SDS-PAGE]
- 114. Native SDS-PAGE: High Resolution Electrophoretic ... [https://pmc.ncbi.nlm.nih.gov/articles/PMC4517606/]
- 115. Interpret SDS-PAGE vs Native-PAGE Results [https://www.letstalkacademy.com/sds-page-vs-native-page-protein-dimer/]