Mastering SDS-PAGE for Accurate Protein Molecular Weight Determination: A Complete Protocol and Troubleshooting Guide
This comprehensive guide details the Sodium Dodecyl Sulfate Polyacrylamide Gel Electrophoresis (SDS-PAGE) protocol for precise protein molecular weight determination, tailored for researchers, scientists, and drug development professionals.
Mastering SDS-PAGE for Accurate Protein Molecular Weight Determination: A Complete Protocol and Troubleshooting Guide
Abstract
This comprehensive guide details the Sodium Dodecyl Sulfate Polyacrylamide Gel Electrophoresis (SDS-PAGE) protocol for precise protein molecular weight determination, tailored for researchers, scientists, and drug development professionals. It covers the foundational principles of protein denaturation and separation, a step-by-step methodological workflow from sample preparation to analysis, systematic troubleshooting for common issues like poor band separation, and validation strategies including comparison with advanced techniques like CE-SDS. The article also explores critical applications in biopharmaceutical development, such as biosimilarity assessment and purity analysis, providing an essential resource for robust and reproducible protein analysis in research and quality control.
The Core Principles of SDS-PAGE: How Proteins are Separated by Molecular Weight
In molecular weight determination research, Sodium Dodecyl Sulfate-Polyacrylamide Gel Electrophoresis (SDS-PAGE) stands as a fundamental technique for protein analysis. The critical component enabling this method is SDS, which performs two essential functions: complete protein denaturation and impartment of a uniform negative charge. This dual role allows researchers to separate proteins based primarily on molecular weight rather than inherent charge or structural properties. Within the broader thesis context of SDS-PAGE protocol optimization, understanding SDS's mechanism provides the foundation for accurate protein characterization, purity assessment, and downstream applications in drug development [1] [2].
Core Principles of SDS Action
SDS operates through specific molecular interactions that transform native proteins into linearized, uniformly charged molecules amenable to electrophoretic separation by mass.
Protein Denaturation Mechanism
SDS molecules contain a hydrophobic tail and an ionic head group, enabling interactions with both non-polar and polar protein regions [2]. The hydrophobic regions interact with and unfold hydrophobic protein domains, while the ionic portions disrupt non-covalent interactions maintaining secondary and tertiary structures [2]. This results in the denaturation of protein molecules to their primary structure, effectively linearizing the polypeptide chains.
Imparting Uniform Negative Charge
As a potent anionic detergent, SDS binds to hydrophobic regions of proteins in a constant ratio of approximately 1.4 g SDS per 1 g of protein [1] [2]. This binding confers a uniform negative charge to all protein molecules, effectively nullifying their intrinsic charge differences that depend on amino acid composition and pH [2]. The resulting charge-to-mass ratio becomes essentially identical across different proteins, ensuring migration in an electric field correlates directly with molecular weight rather than native charge characteristics [1].
Table 1: Core Functions of SDS in Protein Electrophoresis
| Function | Mechanism | Outcome |
|---|---|---|
| Protein Denaturation | Hydrophobic interactions disrupt 2° and 3° structure; ionic interactions disrupt non-covalent bonds | Linearized polypeptide chains |
| Charge Uniformity | SDS molecules bind proportionally to protein mass (~1.4:1 ratio) | Identical charge-to-mass ratio across different proteins |
| Molecular Weight-Based Separation | Elimination of charge and structural influences | Migration distance inversely proportional to log(MW) |
Comprehensive SDS-PAGE Protocol for Molecular Weight Determination
Reagent Preparation
Table 2: Essential Research Reagent Solutions for SDS-PAGE
| Reagent/Solution | Composition | Function in Protocol |
|---|---|---|
| SDS Sample Buffer | Tris-HCl, glycerol, SDS, bromophenol blue, with or without β-mercaptoethanol/DTT | Denatures proteins, provides density for loading, tracking dye |
| Reducing Agents (DTT/BME) | Dithiothreitol or β-mercaptoethanol at 0.1-0.5 M | Breaks disulfide bridges for complete unfolding |
| Running Buffer | Tris-base, glycine, SDS (0.1% or 0.0375%) [3] | Conducts current, maintains pH, provides SDS during separation |
| Polyacrylamide Gel | Acrylamide/bis-acrylamide (typically 29:1), TEMED, APS | Sieving matrix for size-based separation |
| Staining Solutions | Coomassie Brilliant Blue, Silver Stain, or fluorescent dyes (SYPRO Ruby) | Visualizes separated protein bands |
Step-by-Step Experimental Methodology
Sample Preparation:
- Combine protein sample with SDS-PAGE sample buffer (typical ratio 3:1 or 4:1) [3]
- For reduced conditions, include 50-100 mM DTT or 5% β-mercaptoethanol [2]
- Heat mixture at 95°C for 5-10 minutes to complete denaturation [1] [2]
- Centrifuge briefly to collect condensation before loading
Gel Preparation and Electrophoresis:
- Prepare resolving gel (typically 8-15% acrylamide) with pH ~8.8 for optimal separation
- Layer with isopropanol to create flat interface during polymerization
- Prepare stacking gel (typically 4-5% acrylamide) with pH ~6.8 to concentrate samples
- Insert comb to create wells for sample loading
- Load prepared samples and molecular weight standards into wells
- Run electrophoresis at constant voltage (100-200V) using Tris-glycine-SDS running buffer until dye front reaches bottom [1]
Visualization and Analysis:
- Stain gel with Coomassie Blue (sensitivity: 50-100 ng) or silver stain (sensitivity: 1 ng) [1]
- Measure migration distances of protein bands and standard proteins
- Plot standard curve of log(MW) versus migration distance (Rf)
- Calculate molecular weight of unknown proteins using standard curve equation: log(MW) = a - b × Rf [1]
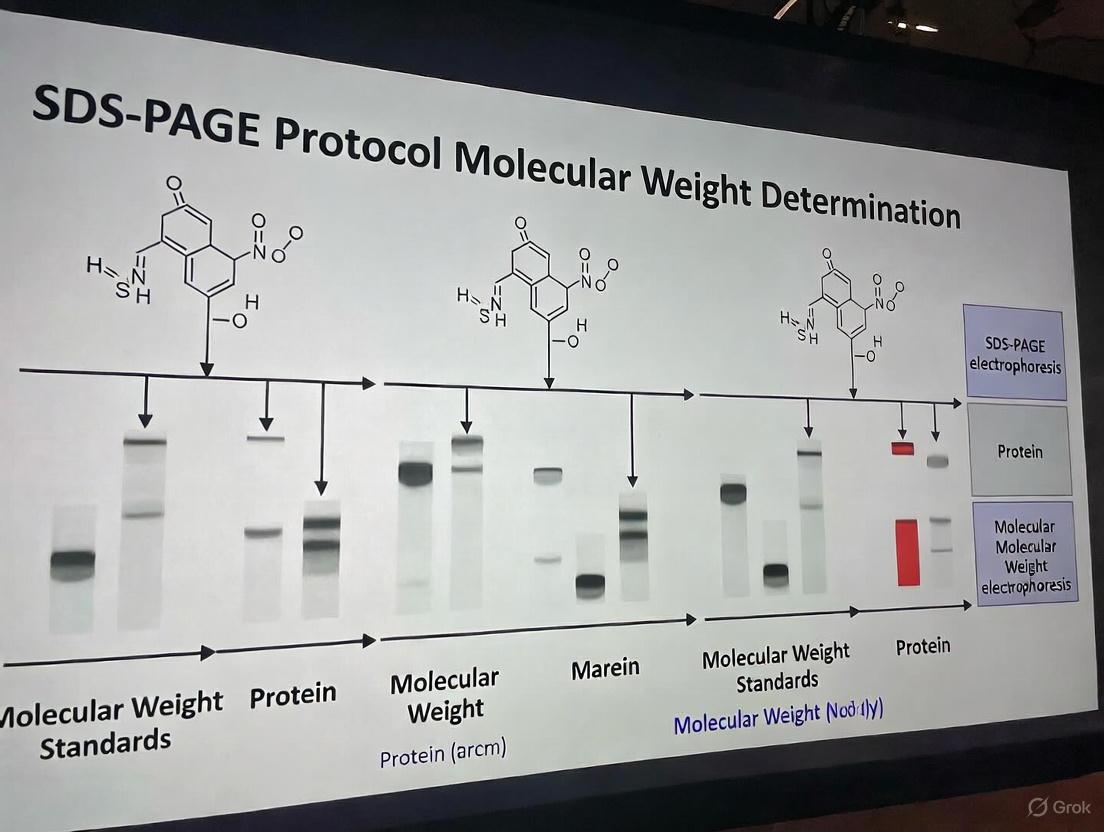
Diagram 1: SDS-PAGE Workflow for Molecular Weight Determination
Technical Considerations and Applications
Critical Experimental Factors
Gel Concentration Selection: The appropriate acrylamide concentration depends on target protein size range. Lower percentage gels (6-10%) better separate high molecular weight proteins (>100 kDa), while higher percentages (12-15%) provide superior resolution for smaller proteins (<50 kDa) [1]. Gradient gels can accommodate broader molecular weight ranges in a single run.
Buffer Composition Variations: Traditional SDS-PAGE uses running buffer with 0.1% SDS, while Native SDS-PAGE (NSDS-PAGE) modifications reduce SDS to 0.0375% in running buffer and eliminate SDS and EDTA from sample buffer to preserve some functional properties [3]. This adaptation demonstrates how SDS concentration manipulation can serve different research objectives.
Research Applications in Drug Development
SDS-PAGE provides critical data throughout biopharmaceutical development pipelines:
- Purity Assessment: Detection of impurity bands during therapeutic protein purification [1]
- Expression Optimization: Comparison of recombinant protein expression levels under various conditions [1]
- Post-Translational Modification Screening: Identification of potential modifications (phosphorylation, glycosylation) through mobility shifts [1]
- Quality Control: Verification of protein integrity in raw materials and final products [4]
- Allergen Detection: Identification of contaminating proteins in biopharmaceutical production systems [4]
Table 3: Troubleshooting Common SDS-PAGE Issues
| Issue | Potential Causes | Solutions |
|---|---|---|
| Poor Resolution | Incorrect gel percentage, improper buffer pH, insufficient stacking | Optimize gel concentration for target MW range, verify buffer pH |
| Band Smiling | Excessive heat during electrophoresis | Reduce voltage, use cooling system during run |
| Atypical Migration | Incomplete denaturation, post-translational modifications | Ensure proper heating (95°C, 5-10 min), use fresh reducing agents |
| High Background | Insufficient washing, over-staining | Optimize staining/destaining times, increase wash steps |
The foundational role of SDS in protein denaturation and charge normalization establishes it as an indispensable reagent for molecular weight determination research. Through its dual mechanisms of action, SDS enables the precise electrophoretic separation that underpins protein characterization across diverse scientific disciplines, particularly in pharmaceutical development where accurate molecular weight assessment is critical for therapeutic protein validation and quality control.
The polyacrylamide gel matrix is the cornerstone of sodium dodecyl sulfate-polyacrylamide gel electrophoresis (SDS-PAGE), a fundamental technique for separating proteins based on their molecular weight. This matrix functions as a tunable molecular sieve, enabling high-resolution separation of complex protein mixtures that is critical for molecular weight determination research [5]. The gel is formed through the co-polymerization of acrylamide monomers and the cross-linking agent N,N'-methylenebisacrylamide (Bis), creating a three-dimensional network with precisely controlled pore sizes [5] [6]. The polymerization reaction is catalyzed by ammonium persulfate (APS) and accelerated by the catalyst N,N,N',N'-tetramethylethylenediamine (TEMED) [6].
In SDS-PAGE, the anionic detergent SDS plays a crucial role by binding to proteins at a ratio of approximately 1.4 g SDS per 1 g of protein, which confers a uniform negative charge and denatures proteins into linear chains [5] [6] [7]. This process masks intrinsic charge differences and eliminates the influence of protein shape, ensuring that separation occurs primarily based on molecular size as proteins migrate through the gel matrix under an electric field [5] [7]. The discontinuous buffer system, comprising stacking and separating gels with different pore sizes and pH values, further enhances separation resolution by initially concentrating protein samples into sharp bands before they enter the separating gel [5] [6].
The Scientist's Toolkit: Essential Reagents and Materials
Successful SDS-PAGE requires precise preparation and understanding of key reagents. The table below details essential materials for polyacrylamide gel electrophoresis.
Table 1: Essential Research Reagents for SDS-PAGE
| Reagent/Material | Function and Purpose |
|---|---|
| Acrylamide/Bis-acrylamide | Forms the gel matrix; acrylamide polymerizes into chains while bis-acrylamide cross-links them, creating a sieving network with controllable pore size [5] [6]. |
| SDS (Sodium Dodecyl Sulfate) | Anionic detergent that denatures proteins and confers a uniform negative charge, ensuring separation is based on molecular weight rather than native charge or shape [5] [7]. |
| APS & TEMED | Ammonium persulfate (APS) and N,N,N',N'-Tetramethylethylenediamine (TEMED) catalyze and accelerate the gel polymerization reaction [6] [8]. |
| Tris-HCl Buffers | Provides the appropriate pH environment for electrophoresis (e.g., pH 6.8 for stacking gel, pH 8.8 for separating gel) [6]. |
| Tris-Glycine-SDS Running Buffer | Conducts current and maintains pH during electrophoresis; essential for protein migration [6]. |
| Reducing Agents (DTT, β-mercaptoethanol) | Breaks disulfide bonds in proteins, ensuring complete denaturation and linearization [5]. |
| Laemmli Sample Buffer | Contains SDS, reducing agents, glycerol, and a tracking dye to prepare protein samples for loading [6] [7]. |
| Protein Molecular Weight Marker | A mixture of proteins of known sizes run alongside samples to estimate the molecular weight of unknown proteins [5] [7]. |
| Staining Solutions (Coomassie, Silver Stain) | Used to visualize separated protein bands post-electrophoresis [6] [7]. |
| Dazmegrel | Dazmegrel, CAS:76894-77-4, MF:C16H17N3O2, MW:283.32 g/mol |
| Dazoxiben Hydrochloride | Dazoxiben Hydrochloride, CAS:74226-22-5, MF:C12H13ClN2O3, MW:268.69 g/mol |
Experimental Protocol for SDS-PAGE
This section provides a detailed methodology for casting and running polyacrylamide gels for molecular weight determination.
Gel Casting Procedure
Table 2: SDS-PAGE Gel Recipes for Different Percentages (for 15 mL total volume) [9] [6]
| Component | 8% Resolving Gel | 10% Resolving Gel | 12% Resolving Gel | 5% Stacking Gel |
|---|---|---|---|---|
| 30% Acrylamide/Bis Mix | 4.0 mL | 5.0 mL | 6.0 mL | 2.5 mL |
| 1.5 M Tris-HCl (pH 8.8) | 3.75 mL | 3.75 mL | 3.75 mL | - |
| 1.0 M Tris-HCl (pH 6.8) | - | - | - | 3.78 mL |
| 10% (w/v) SDS | 150 µL | 150 µL | 150 µL | 150 µL |
| Deionized Water | 7.0 mL | 6.0 mL | 5.0 mL | 8.4 mL |
| 10% (w/v) APS | 75 µL | 75 µL | 75 µL | 75 µL |
| TEMED | 7.5 µL | 7.5 µL | 7.5 µL | 15 µL |
10-Step Casting Protocol [9] [6]:
- Assemble Glass Plates: Clean and assemble the gel cassette according to the manufacturer's instructions.
- Prepare Resolving Gel Mixture: In a beaker or flask, combine all components for the resolving gel from Table 2 except APS and TEMED. Mix gently.
- Initiate Resolving Gel Polymerization: Add APS and TEMED to the mixture, swirl gently to combine, and pour immediately between the glass plates, leaving space for the stacking gel.
- Overlay with Solvent: Carefully overlay the gel solution with isopropanol or water to create a flat, even interface.
- Polymerize: Allow the gel to polymerize completely for 20-30 minutes. A distinct schlieren line will appear after polymerization.
- Prepare Stacking Gel Mixture: Pour off the overlay, rinse with water, and prepare the stacking gel mixture (without APS and TEMED).
- Initiate Stacking Gel Polymerization: Add APS and TEMED to the stacking gel, mix, and pour onto the polymerized resolving gel.
- Insert Comb: Immediately insert a clean comb into the stacking gel, avoiding air bubbles.
- Polymerize Stacking Gel: Allow the stacking gel to polymerize for 15-20 minutes.
- Store or Use: The gel can be used immediately or wrapped in moist tissue paper, sealed in plastic film, and stored at 4°C for up to a few weeks.
Sample Preparation and Electrophoresis
- Sample Denaturation: Mix the protein sample with an equal volume of 2X Laemmli buffer (typically containing 4% SDS, 20% glycerol, 0.004% bromophenol blue, 100 mM Tris-HCl pH 6.8, and 10% β-mercaptoethanol) [6]. Heat the mixture at 95-100°C for 5-10 minutes to ensure complete denaturation [6] [8].
- Gel Setup: Place the polymerized gel into the electrophoresis chamber and fill the inner and outer chambers with Tris-glycine-SDS running buffer [6].
- Sample Loading: Centrifuge the denatured samples briefly and load carefully into the wells. Include a well for the protein molecular weight marker [7].
- Electrophoresis Run: Connect the apparatus to a power supply. Run the gel at a constant voltage of 80 V until the dye front enters the resolving gel, then increase to 120 V until the dye front reaches the bottom of the gel [6]. Cooling the apparatus with an ice bath or a cooling unit is recommended to prevent heat-induced artifacts [6].
Application Notes: Molecular Weight Determination and Purity Assessment
Optimizing Separation and Determining Molecular Weight
The choice of gel percentage is critical for achieving optimal resolution of proteins within a specific molecular weight range.
Table 3: Gel Percentage Selection Guide for Optimal Protein Separation [9] [7]
| Size of Protein (kDa) | Recommended Acrylamide Percentage |
|---|---|
| 4 - 40 | 20% |
| 12 - 45 | 15% |
| 10 - 70 | 12.5% |
| 15 - 100 | 10% |
| 25 - 200 | 8% |
To determine the molecular weight of an unknown protein:
- Calculate the Relative Front (Rf) for each band in the standard and sample: Rf = (Migration distance of protein) / (Migration distance of dye front) [6].
- Plot a standard curve using the Rf values of the protein ladder versus the logarithm of their known molecular weights.
- Interpolate the Rf value of the unknown protein band on the standard curve to estimate its molecular weight [5] [6].
Assessing Protein Sample Purity and Integrity
SDS-PAGE is indispensable for evaluating protein sample purity during purification and for analyzing subunit composition [5] [7]. A pure protein sample typically appears as a single, sharp band on the gel. Multiple bands suggest the presence of contaminating proteins, while a smeared appearance may indicate protein degradation or incomplete denaturation [5]. The use of reducing agents like DTT is crucial for analyzing multi-subunit proteins, as it dissociates subunits linked by disulfide bonds, allowing for accurate determination of individual subunit weights [5] [7].
Workflow Visualization
The following diagram illustrates the logical workflow and key separation principles of the SDS-PAGE protocol.
Within the framework of molecular weight determination research, the Sodium Dodecyl Sulfate-Polyacrylamide Gel Electrophoresis (SDS-PAGE) protocol is a foundational method. Its resolving power, however, hinges critically on a clever biochemical strategy: the discontinuous buffer system. This system employs two distinct gel layers—stacking and resolving—each with different chemical and physical properties, to concentrate protein samples into extremely sharp bands before separation by size. This technical note details the principle, components, and a standardized protocol for implementing this essential system to achieve high-resolution protein analysis, a cornerstone of drug development and basic research.
Principles of the Discontinuous Buffer System
The discontinuous buffer system is designed to overcome the band-broadening that would occur if a protein sample were applied directly to a resolving gel. It ensures that all proteins enter the resolving gel simultaneously as a thin, concentrated band, which is a prerequisite for sharp final separations [10]. This is achieved through strategic differences in pH, gel pore size, and ionic composition between the stacking and resolving gels [11].
The core mechanism relies on the creation of a steep voltage gradient that herds protein molecules. The system uses three types of ions present in the gel and running buffers [10] [12]:
- Leading Ion: Chloride (Clâ»), from Tris-HCl in the gels. This small, highly mobile anion has a high electrophoretic mobility.
- Trailing Ion: Glycinate (Glyâ»), from glycine in the running buffer. Its charge state is highly dependent on pH.
- Protein Ions: Proteins coated with the anionic detergent SDS, giving them a uniform negative charge.
In the stacking gel (pH ~6.8), glycine from the running buffer (pH ~8.3) exists predominantly in its zwitterionic form, carrying no net charge and thus moving very slowly [10]. The chloride ions, being small and fully charged, move rapidly towards the anode. This creates an ion discontinuity, setting up a narrow, high-voltage gradient between the fast-moving chloride front and the slow-moving glycine front. The SDS-coated proteins, with a mobility intermediate between these two ions, are compressed or "stacked" into a very tight zone as they migrate [10] [13].
When this ion front reaches the resolving gel (pH ~8.8), the environment changes dramatically. The higher pH causes glycine to shed protons and become predominantly the negatively charged glycinate anion, which now has a high electrophoretic mobility [10]. Consequently, the glycinate ions speed past the protein molecules. The proteins, now deposited as a sharp band at the top of the resolving gel and freed from the voltage gradient, begin to separate based on their molecular weight as they migrate through the sieving matrix of the higher-percentage polyacrylamide [10] [11].
Table 1: Composition and Function of Gel Layers in the Discontinuous Buffer System.
| Gel Layer | Typical pH | Acrylamide Concentration | Primary Function | Key Ionic Events |
|---|---|---|---|---|
| Stacking Gel | 6.8 [10] | 4-5% [11] | Concentrate protein samples into a sharp band | Glycine is a zwitterion (slow); Clâ» is the leading ion [10] |
| Resolving Gel | 8.8 [10] | 8-15% (varies by target protein size) [5] | Separate proteins by molecular weight | Glycine becomes glycinate anion (fast); proteins are sieved by size [10] |
The following workflow diagram illustrates the entire process of SDS-PAGE, from sample preparation to final separation.
The Scientist's Toolkit: Essential Reagents and Materials
Successful execution of the discontinuous buffer SDS-PAGE protocol requires a specific set of reagents and equipment. The table below details the key components and their critical functions in the procedure [14] [12].
Table 2: Essential Research Reagent Solutions and Materials for Discontinuous Buffer SDS-PAGE.
| Item | Function / Role in the Protocol |
|---|---|
| Acrylamide / Bis-acrylamide | Forms the cross-linked polyacrylamide gel matrix that acts as a molecular sieve [11] [5]. |
| Tris-HCl Buffer | Provides the buffering capacity at different pH levels (6.8 for stacking, 8.8 for resolving gel) [10]. |
| Sodium Dodecyl Sulfate (SDS) | Anionic detergent that denatures proteins and confers a uniform negative charge, masking intrinsic charge differences [11] [5]. |
| Ammonium Persulfate (APS) & TEMED | Catalytic system that initiates and accelerates the polymerization of acrylamide [11] [5]. |
| Glycine | Key trailing ion in the running buffer; its pH-dependent charge state is fundamental to the stacking mechanism [10]. |
| Sample Loading Buffer (Laemmli Buffer) | Contains SDS, glycerol, a tracking dye, and a reducing agent to denature, charge, and prepare the sample for loading [10]. |
| Protein Molecular Weight Marker | A mixture of proteins of known sizes run alongside samples to estimate the molecular weight of unknown proteins [11] [5]. |
| Coomassie Brilliant Blue Stain | Anionic dye that binds to proteins non-specifically, allowing visualization of separated bands post-electrophoresis [14]. |
| Vertical Gel Electrophoresis Unit | Apparatus comprising gel cassettes, buffer chambers, and electrodes to conduct the electrophoresis safely [12]. |
| Power Supply | Provides the controlled electrical current required to drive protein migration through the gel [14]. |
| DB07107 | DB07107 |
| DB-766 | DB-766, CAS:423165-22-4, MF:C34H34N6O3, MW:574.7 g/mol |
Detailed Experimental Protocol
Gel Casting: Resolving and Stacking Gels
Materials:
- 30% Acrylamide/Bis-acrylamide solution (37.5:1)
- 1.5 M Tris-HCl, pH 8.8 (Resolving Gel buffer)
- 1.0 M Tris-HCl, pH 6.8 (Stacking Gel buffer)
- 10% (w/v) Sodium Dodecyl Sulfate (SDS)
- 10% (w/v) Ammonium Persulfate (APS) - prepare fresh
- N,N,N',N'-Tetramethylethylenediamine (TEMED)
- Butanol or water (for overlaying)
- Gel casting apparatus (glass plates, spacers, comb)
Methodology:
- Assemble the gel cassette according to the manufacturer's instructions to create a leak-proof mold.
- Prepare the resolving gel mixture based on the desired percentage for your target protein's molecular weight. A typical 10% resolving gel formula is provided as an example [11]. Table 3 offers a guide for choosing the appropriate gel percentage.
- Mix components gently to avoid introducing air bubbles. Add TEMED last, as it initiates polymerization.
- Pour the resolving gel into the cassette, leaving space for the stacking gel.
- Overlay with water or butanol to create a flat, even interface and prevent oxygen from inhibiting polymerization.
- Allow to polymerize completely (approximately 30 minutes at room temperature). A distinct schlieren line will be visible after polymerization.
- Pour off the overlay, rinse the gel surface with deionized water, and thoroughly remove any residual liquid.
- Prepare the stacking gel (typically 4-5% acrylamide). A standard 5% stacking gel formula is provided in Table 4.
- Pour the stacking gel onto the polymerized resolving gel and immediately insert a clean comb.
- Allow the stacking gel to polymerize for at least 30 minutes before use. Gels can be used immediately or stored wrapped in moist paper towels within a sealed bag at 4°C for a few days.
Table 3: Guidelines for Resolving Gel Percentage Selection Based on Target Protein Size.
| Acrylamide Percentage | Effective Separation Range (kDa) | Common Application |
|---|---|---|
| 8% | 30 - 200 [5] | Separation of high molecular weight proteins |
| 10% | 15 - 100 [5] | Standard separation for a broad range of proteins |
| 12% | 10 - 70 | Standard separation for mid-to-low molecular weight proteins |
| 15% | 5 - 50 [5] | Optimal for low molecular weight proteins |
Table 4: Example Recipes for Discontinuous SDS-PAGE Gels.
| Component | 10% Resolving Gel (for 10 ml) | 5% Stacking Gel (for 5 ml) |
|---|---|---|
| Water | 4.0 mL | 3.4 mL |
| 1.5 M Tris-HCl (pH 8.8) | 2.5 mL | - |
| 1.0 M Tris-HCl (pH 6.8) | - | 0.63 mL |
| 30% Acrylamide Solution | 3.3 mL | 0.83 mL |
| 10% SDS | 0.1 mL | 0.05 mL |
| 10% APS | 0.1 mL | 0.05 mL |
| TEMED | 0.004 mL | 0.005 mL |
Sample Preparation and Electrophoresis
Materials:
- Protein sample
- 2X Laemmli Sample Buffer (contains Tris, SDS, glycerol, Bromophenol Blue, and ß-mercaptoethanol or DTT) [10]
- Heating block or water bath
- Microcentrifuge
Methodology:
- Mix protein sample with an equal volume of 2X Laemmli Sample Buffer. If analyzing reduced samples, include a reducing agent like DTT or ß-mercaptoethanol in the buffer to break disulfide bonds [12].
- Denature the samples by heating at 85-100°C for 2-5 minutes [12]. This ensures complete linearization and SDS binding.
- Briefly centrifuge the samples (e.g., 12,000g for 30 seconds) to collect condensation [14].
- Assemble the gel in the electrophoresis tank and fill the inner and outer chambers with Tris-Glycine-SDS Running Buffer (e.g., 25 mM Tris, 192 mM glycine, 0.1% SDS, pH 8.3) [12].
- Load the samples and protein molecular weight markers into the wells carefully to avoid cross-contamination.
- Run the electrophoresis with constant voltage. For a standard mini-gel, begin at 80-90 V until the dye front enters the resolving gel, then increase to 120-150 V until the dye front reaches the bottom of the gel [14] [12]. Table 5 provides standard electrophoresis conditions.
- Terminate the run and proceed with protein visualization (e.g., Coomassie staining) or downstream analysis like Western blotting.
Table 5: Standard Electrophoresis Conditions for Mini-Gel Systems.
| Parameter | Condition | Notes |
|---|---|---|
| Initial Voltage | 80 - 90 V | Applied while samples are in the stacking gel |
| Final Voltage | 120 - 150 V | Increased after dye front enters the resolving gel |
| Run Time | ~90 minutes | Until dye front reaches the gel bottom [12] |
| Expected Current | Start: 30-40 mA, End: 8-12 mA (per gel) [12] | Varies based on gel size and buffer concentration |
The discontinuous buffer system, with its strategic use of stacking and resolving gels, remains a masterpiece of biochemical engineering that is fundamental to high-resolution SDS-PAGE. By first concentrating disparate protein samples into a sharp, unified band and then resolving them by size in a separate optimized matrix, this technique provides the clarity and precision required for accurate molecular weight determination, purity assessment, and expression analysis. Mastery of the underlying principles and meticulous execution of the protocol detailed herein are indispensable for researchers in molecular biology and drug development, ensuring reliable and reproducible data that drives scientific discovery forward.
Sodium Dodecyl Sulfate-Polyacrylamide Gel Electrophoresis (SDS-PAGE) represents a foundational methodology in molecular biology and biochemistry for separating proteins based on their molecular weights. This technique enables researchers to analyze protein samples for purity, estimate molecular mass, and facilitate subsequent analytical procedures such as Western blotting. The successful implementation of SDS-PAGE relies critically on the precise function of several key chemical components that together create the electrophoretic system. This application note details the core reagents—Tris, Glycine, TEMED, and Ammonium Persulfate—within the context of molecular weight determination research, providing researchers and drug development professionals with comprehensive protocols and technical specifications necessary for experimental reproducibility and accuracy.
Core Component Specifications and Functions
The following table summarizes the key reagents essential for SDS-PAGE, their primary functions, and critical properties that researchers must consider for successful experimental design and execution.
Table 1: Essential Research Reagent Solutions for SDS-PAGE
| Reagent | Chemical Formula / Composition | Primary Function in SDS-PAGE | Key Properties & Handling Notes |
|---|---|---|---|
| Tris Buffer | Câ‚„Hâ‚â‚NO₃ / MW: 121.14 g/mol [15] | pH stabilization; charge carrier in electrophoretic system [16] | pKa ~8.1; effective buffering range pH 7-9 [16]; component of both gel and running buffer |
| Glycine | NHâ‚‚CHâ‚‚COOH / MW: 75.07 g/mol [15] | Leading ion in discontinuous buffer system; facilitates protein stacking [16] | Charge state pH-dependent (zwitterion at pH 6.8, anion at pH 8.8) [16]; critical for creating ion fronts |
| TEMED | C₆Hâ‚₆Nâ‚‚ / MW: 116.21 g/mol [17] | Polymerization catalyst with APS; initiates gel formation [17] [16] | Highly flammable; causes severe skin/eye damage [18]; store tightly capped at 4°C [18]; purity ≥99% [17] |
| Ammonium Persulfate (APS) | (NH₄)₂S₂O₈ | Polymerization initiator; generates free radicals for acrylamide cross-linking [16] | Typically prepared as 10% w/v solution in water; short shelf life once dissolved |
| SDS (Sodium Dodecyl Sulfate) | Câ‚â‚‚Hâ‚‚â‚…Oâ‚„NaS / MW: 288.38 g/mol [15] | Protein denaturant; confers uniform negative charge [16] | 1% w/v in running buffer [15]; unfolds proteins and masks intrinsic charge |
Chemical Properties and Formulations
Quantitative Formulations for SDS-PAGE Buffers
Precise reagent concentrations are critical for establishing the appropriate ionic strength, pH, and electrophoretic conditions required for reproducible protein separation. The following table provides standardized formulations for key SDS-PAGE solutions.
Table 2: Standard SDS-PAGE Buffer Formulations
| Buffer/Solution | Component | Quantity per Liter | Final Concentration | pH | Purpose |
|---|---|---|---|---|---|
| 10X Running Buffer [15] | Tris Base | 30.285 g | 0.25 M | 8.3 [19] | Maintains stable pH during electrophoresis; provides ion conductivity |
| Glycine | 144.4 g | 1.923 M | Creates discontinuous buffer system with Tris | ||
| SDS | 10 g | 1% w/v | Maintains protein denaturation and negative charge during migration | ||
| Sample Loading Buffer [20] | Tris-HCl | - | 62.5 mM | 6.8 | Stabilizes sample pH |
| SDS | - | 2% w/v | Denatures and charges proteins | ||
| Glycerol | - | 35% v/v | Adds density for well loading | ||
| Bromophenol Blue | - | 0.05% w/v | Visualizes migration front | ||
| β-Mercaptoethanol | - | 4% v/v | Reduces disulfide bonds |
Component-Specific Mechanisms in Electrophoresis
Tris (Câ‚„Hâ‚â‚NO₃): This buffering agent maintains the stable pH environment required for consistent electrophoretic mobility. With a pKa of 8.1, Tris provides optimal buffering capacity in the pH range (8.3-8.8) most critical for SDS-PAGE separation [16]. The chloride ions from Tris-HCl in the gel matrix function as leading ions in the discontinuous buffer system, creating the voltage gradient essential for protein stacking at the interface between the stacking and resolving gels.
Glycine (NHâ‚‚CHâ‚‚COOH): Glycine plays a dynamic role in the discontinuous buffer system due to its pH-dependent charge state. In the running buffer (pH 8.3), glycine exists primarily as glycinate anions [16]. Upon entering the stacking gel at pH 6.8, these anions transition to zwitterions with negligible net charge, dramatically reducing their electrophoretic mobility. This creates a trailing ion front that effectively concentrates protein samples into sharp bands before they enter the resolving gel.
TEMED (N,N,N',N'-Tetramethylethylenediamine) and Ammonium Persulfate: These catalysts work in concert to initiate and propagate the free radical polymerization of acrylamide into a cross-linked gel matrix. APS decomposes in aqueous solution to produce sulfate free radicals, which are stabilized by TEMED, an organic base that donates electrons to accelerate the radical formation process [16]. This catalytic system creates the porous polyacrylamide network through which proteins are sieved according to size.
Experimental Protocols
Protocol 1: Preparation of SDS-PAGE Running Buffer (10X)
Objective: Prepare a 10X concentrated running buffer stock solution for SDS-PAGE electrophoresis.
Materials:
- Tris base (MW: 121.14 g/mol)
- Glycine (MW: 75.07 g/mol)
- Sodium dodecyl sulfate (SDS, MW: 288.38 g/mol)
- Distilled water
- Measuring balance, beaker (1-2 L), magnetic stirrer
Methodology:
- Prepare 800 mL of distilled water in a suitable container [15].
- Add 30.285 g of Tris base to the solution and stir until completely dissolved [15].
- Add 144.4 g of Glycine to the solution and stir until completely dissolved [15].
- Add 10 g of SDS to the solution and stir until completely dissolved [15].
- Add distilled water until the final volume reaches 1.0 L [15].
- Store at room temperature; dilute to 1X concentration with distilled water before use.
Technical Notes:
- The final 1X working solution contains 25 mM Tris, 192 mM glycine, and 0.1% SDS at pH approximately 8.3 [19].
- Commercial pre-mixed formulations are available as powder packets that dissolve directly in 500 mL water to yield 1X solution [19].
- Solution should appear clear; if cloudiness appears, warm slightly and mix until clear.
Protocol 2: Polyacrylamide Gel Polymerization
Objective: Catalyze the polymerization of acrylamide solution into a cross-linked gel matrix for protein separation.
Materials:
- Acrylamide/bis-acrylamide solution
- TEMED (N,N,N',N'-Tetramethylethylenediamine)
- Ammonium persulfate (APS)
- Tris-HCl buffer (appropriate pH for resolving or stacking gel)
Methodology:
- Prepare the acrylamide monomer solution with the desired concentration (typically 8-15% resolving gel) in appropriate Tris buffer.
- Add 0.05-0.1% v/v TEMED to the acrylamide solution and mix gently [16].
- Prepare a 10% w/v solution of ammonium persulfate in distilled water.
- Add APS solution to the acrylamide/TEMED mixture to a final concentration of 0.05-0.1% w/v [16].
- Mix gently and quickly pour between glass plates, avoiding bubble formation.
- Allow complete polymerization (typically 20-30 minutes) before use.
Technical Notes:
- Polymerization time varies with temperature and reagent concentrations; higher TEMED/APS concentrations accelerate polymerization.
- TEMED is highly corrosive; use appropriate personal protective equipment including gloves and eye protection [18].
- Oxygen inhibits polymerization; ensure minimal air exposure during mixing and pouring.
- For consistent results, prepare APS solution fresh weekly and store at 4°C.
Safety Considerations for TEMED Handling
TEMED requires special safety precautions due to its hazardous properties [18]:
- Storage: Store tightly capped under nitrogen gas at 4°C, segregated from oxidizing materials and acids [18].
- Handling: Use in well-ventilated areas or fume hoods; avoid contact with skin, eyes, and clothing. Wear impervious protective clothing, gloves, and eye protection [18].
- First Aid: For eye contact, immediately flush with plenty of water for at least 15 minutes and seek medical attention. For skin contact, flush with plenty of soap and water for at least 15 minutes while removing contaminated clothing [18].
- Flammability: Highly flammable liquid and vapor; keep away from heat, sparks, and open flames [18].
System Workflow and Mechanism Visualization
The following diagram illustrates the sequential processes and key component interactions in SDS-PAGE separation:
SDS-PAGE Separation Mechanism and Workflow
The precise interplay of Tris, glycine, TEMED, and ammonium persulfate creates the foundation for reliable SDS-PAGE analysis, enabling accurate molecular weight determination essential for proteomics research and drug development. Tris establishes the stable pH environment, glycine enables the discontinuous buffer system for sharp band formation, while TEMED and ammonium persulfate catalyze the formation of the sieving matrix. Mastery of these components' properties, formulations, and handling requirements—particularly the safety considerations for TEMED—ensures experimental reproducibility and high-quality protein separation. Researchers should adhere to the specified protocols and safety guidelines to optimize their SDS-PAGE results for molecular weight determination applications.
A Step-by-Step SDS-PAGE Protocol and Its Applications in Biomedicine
Within the framework of molecular weight determination research, the Sodium Dodecyl Sulfate-Polyacrylamide Gel Electrophoresis (SDS-PAGE) protocol stands as a foundational methodology. The accuracy of molecular weight (MW) estimation hinges critically on the complete denaturation and uniform charge masking of all protein constituents in a sample. SDS-PAGE operates on the principle that the anionic detergent SDS denatures proteins, binding to them to impart a uniform negative charge, thereby rendering their separation dependent almost entirely on polypeptide chain length during electrophoresis [21] [22]. However, intrinsic protein properties and suboptimal sample preparation can compromise this ideal behavior, leading to inaccurate MW estimation, poor resolution, and artifactual results. This application note provides a detailed protocol and strategic framework for optimizing the sample preparation phase—specifically denaturation, reduction, and loading buffer composition—to ensure reliable and reproducible protein separation for precise molecular weight determination.
The Role of Sample Buffer Components
The sample buffer is a critical cocktail of reagents, each designed to overcome specific structural features of native proteins to facilitate their separation based solely on molecular weight. A thorough understanding of each component's function is essential for both troubleshooting and optimization.
Core Components and Their Mechanisms
SDS (Sodium Dodecyl Sulfate): This anionic detergent is paramount for molecular weight-based separation. It acts by binding to the hydrophobic regions of proteins, disrupting hydrogen bonds and van der Waals forces, thereby destroying most of the secondary and tertiary structures [21] [23]. The binding of SDS, on average, confers a uniform negative charge to the polypeptide chains, masking the proteins' intrinsic charge. This results in a consistent charge-to-mass ratio, allowing proteins to migrate through the polyacrylamide gel matrix primarily according to their molecular weight [21] [22]. For complex samples, heating to at least 60°C or higher is recommended to facilitate SDS penetration, particularly for membrane proteins [23].
Reducing Agents (DTT or β-Mercaptoethanol): Covalent disulfide (-S-S-) bonds, common in tertiary and quaternary structures, are not disrupted by SDS alone [23]. Reducing agents such as Dithiothreitol (DTT) or β-mercaptoethanol (BME) are required to cleave these disulfide linkages. They function by reducing the bonds to free sulfhydryl (-SH) groups, thereby breaking down the final vestiges of complex protein structure into individual polypeptide subunits [21] [23]. DTT is often preferred due to its lower odor and greater effectiveness in some denaturing conditions [23].
Glycerol: Added to the sample buffer to increase its density, glycerol ensures that the protein samples sink to the bottom of the gel wells during loading, preventing them from diffusing into the surrounding running buffer [23]. Inadequate glycerol concentration is a common cause of sample leakage from wells [24].
Tracking Dye: A small anionic molecule like bromophenol blue is included to provide a visual reference for the progress of electrophoresis. It migrates ahead of the smallest proteins, and the run is typically stopped once the dye front approaches the bottom of the gel [21] [23].
Buffer (Tris-HCl): The sample buffer contains a buffer, typically Tris at pH 6.8, to maintain a stable pH environment. This is crucial for the stacking process in discontinuous gel systems, where proteins are concentrated into a sharp zone before entering the resolving gel [23].
Table 1: Essential Components of SDS-PAGE Sample Buffer and Their Functions
| Component | Primary Function | Typical Concentration | Role in MW Determination |
|---|---|---|---|
| SDS | Denatures proteins; imparts uniform negative charge [23] | 1-2% [23] | Ensures migration is based on size, not intrinsic charge |
| Reducing Agent (DTT/BME) | Reduces disulfide bonds [21] [23] | 50-160 mM DTT or 0.55 M BME [21] [23] | Breaks multimeric complexes into single polypeptides |
| Glycerol | Increases sample density for well loading [23] | 10-20% [21] [23] | Prevents sample loss and ensures accurate volume loading |
| Tracking Dye | Visualizes migration progress [23] | ~0.05 mg/mL [23] | Monitors electrophoresis without interfering with separation |
| Tris Buffer | Maintains stable pH [23] | 10-100 mM, pH 6.8 [23] | Critical for the stacking gel concentration process |
Optimized Denaturation and Reduction Protocol
The following protocol is designed to achieve complete and consistent denaturation of protein samples for accurate molecular weight analysis. The procedure assumes the use of a standard 2X Laemmli-style sample buffer.
Reagents and Solutions
- 2X Sample Buffer: 2% SDS, 20% glycerol, 20 mM Tris-Cl (pH 6.8), 160 mM DTT (or 0.55 M β-mercaptoethanol), 0.1 mg/mL bromophenol blue [23].
- Protein Sample: Pre-adjusted to a known concentration.
- Molecular Weight Standards: A set of pre-stained or unstained proteins of known molecular weights.
Step-by-Step Procedure
Sample and Buffer Mixing: In a sterile microcentrifuge tube, mix your protein sample with an equal volume of 2X sample buffer [21] [23]. For a pre-prepared lysate already in a sample buffer, add β-mercaptoethanol to a final concentration of 0.55 M (e.g., 1 µL of stock BME per 25 µL of lysate) [21]. Vortex the mixture thoroughly.
Denaturation and Reduction: Place the tightly capped microcentrifuge tubes in a heating block or water bath set to 95°C for 5 minutes [21] [25]. This heating step is critical as it provides the thermal energy required to shake up the molecules, facilitating SDS binding to hydrophobic regions and completing the denaturation process [23].
Cooling and Clarification: After heating, briefly centrifuge the samples for 2-3 minutes at high speed (e.g., 10,000-14,000 x g) in a microcentrifuge. This step pellets any insoluble debris or aggregated material, ensuring a clean supernatant is loaded onto the gel [21].
Gel Loading: Load the clarified supernatant into the wells of a pre-cast or hand-cast polyacrylamide gel. Always include a lane for molecular weight standards. A general guideline for complex mixtures is to load 10–20 µg of total protein for Coomassie staining and 1–10 µg for western blotting, though this may require optimization based on target protein abundance [21] [24] [23].
Electrophoresis: Assemble the electrophoresis unit, fill with 1X running buffer, and run at a constant voltage (e.g., 150-200 V) until the dye front reaches the bottom of the gel [21].
The workflow for the complete sample preparation process is outlined below.
Troubleshooting and Optimization Strategies
Even with a standard protocol, researchers may encounter issues that compromise molecular weight accuracy. The following table addresses common problems and their solutions, with a focus on sample preparation.
Table 2: Troubleshooting Common Sample Preparation Issues in SDS-PAGE
| Problem | Potential Causes | Optimization Strategies |
|---|---|---|
| Smearing or Streaking | Protein aggregation/precipitation; Insufficient heating; Overloading [24] [23] | Ensure fresh reducing agent; Optimize heating time/temperature; Reduce loading amount; Add urea (4-8 M) for hydrophobic proteins [24] |
| Atypical Band Migration | Incomplete denaturation (strong charged proteins); Residual structure [21] [23] | Confirm heating at 95°C; Verify SDS concentration; Use fresh sample buffer; Be cautious with glycoproteins or extreme pI proteins [21] |
| Sample Leaks from Well | Low glycerol density; Air bubbles in well; Overfilled well [24] | Increase glycerol to 10-20%; Rinse wells with buffer to dislodge bubbles; Do not load more than 3/4 of well capacity [24] [23] |
| No or Faint Bands | Underloading; Inefficient transfer (for WB); Protein degradation [24] | Increase loading amount; Check protein concentration with assay; Add protease inhibitors during extraction [24] |
| Multiple Bands for Pure Protein | Proteolysis; Incomplete reduction; Protein isoforms [24] | Work on ice with inhibitors; Use fresh DTT/BME; Research protein post-translational modifications |
Advanced Optimization: The Case of Native SDS-PAGE
For specific applications where retaining metal cofactors or enzymatic activity is desirable alongside size-based separation, a modified approach termed Native SDS-PAGE (NSDS-PAGE) can be employed. This method involves omitting SDS and reducing agents from the sample buffer and eliminating the heating step [3]. Furthermore, the SDS concentration in the running buffer is significantly reduced (e.g., to 0.0375%) [3]. Research has shown that this protocol allows for high-resolution separation while preserving the bound metal ions in metalloproteins and the activity of many enzymes, bridging the gap between fully denaturing SDS-PAGE and native electrophoresis techniques [3].
The Scientist's Toolkit: Key Research Reagent Solutions
Successful and reproducible SDS-PAGE relies on a set of core reagents and materials. The following table details these essential components.
Table 3: Essential Research Reagents and Materials for SDS-PAGE Sample Preparation
| Item | Function/Description | Example Application Note |
|---|---|---|
| SDS (Sodium Dodecyl Sulfate) | Anionic detergent for protein denaturation and charge masking [21] [23] | Use high-purity grade for consistent binding and migration. |
| DTT (Dithiothreitol) | Reducing agent for breaking disulfide bonds; preferred over BME for lower odor [23] | Prepare fresh stock solutions or use stabilized formulations. |
| Protease Inhibitor Cocktails | Prevents protein degradation during and after cell lysis. | Essential for working with sensitive or easily degraded proteins. |
| Protein Assay Kits (e.g., BCA) | Accurately determines protein concentration for equivalent loading [24] | Critical for quantitative comparisons between samples. |
| Precast Gels | Polyacrylamide gels of varying percentages for consistent results [22] [26] | Choose gel percentage based on target protein MW (see Table 1). |
| Molecular Weight Markers | Pre-stained or unstained standards for in-gel MW estimation [21] | Include in every run for calibration and transfer monitoring. |
| DC_517 | DC_517, MF:C33H35N3O2, MW:505.6 g/mol | Chemical Reagent |
| DCG066 | DCG066|G9a Histone Methyltransferase Inhibitor | DCG066 is a novel small-molecule inhibitor of the G9a histone methyltransferase for leukemia research. This product is For Research Use Only. Not for human use. |
The fidelity of molecular weight determination via SDS-PAGE is inextricably linked to the efficacy of the initial sample preparation. Meticulous optimization of denaturation using SDS and heat, coupled with the complete reduction of disulfide bonds using agents like DTT, is non-negotiable for achieving accurate and interpretable results. By understanding the role of each component in the loading buffer, systematically following a robust protocol, and applying targeted troubleshooting strategies, researchers can overcome common pitfalls. This ensures that the separation observed truly reflects the molecular weights of the protein subunits, thereby solidifying the role of SDS-PAGE as a reliable cornerstone in protein analysis for basic research and drug development.
In molecular weight determination research using SDS-PAGE (sodium dodecyl sulfate-polyacrylamide gel electrophoresis), selecting the appropriate polyacrylamide gel concentration is a fundamental prerequisite for obtaining high-resolution protein separation. The principle of SDS-PAGE relies on the fact that proteins denatured by SDS migrate through a polyacrylamide gel matrix at rates inversely proportional to their molecular weights [11]. The gel matrix acts as a molecular sieve, with its pore size determined by the concentration of acrylamide and bisacrylamide; higher percentages create smaller pores that better resolve smaller proteins, while lower percentages with larger pores are optimal for separating larger proteins [11] [27]. This application note provides detailed guidance and protocols to enable researchers to make informed decisions about gel composition based on their protein size of interest, ensuring accurate and reproducible results in molecular weight determination studies.
Protein Size and Gel Percentage Optimization
The relationship between protein size and optimal acrylamide concentration is well-established in electrophoretic separation science. The polyacrylamide gel matrix serves as a molecular sieve, with pore size inversely related to the acrylamide percentage [11] [27]. Higher percentage gels with smaller pores are ideal for resolving lower molecular weight proteins, while lower percentage gels with larger pores provide better separation for higher molecular weight proteins [11] [28]. The following table provides specific guidance for selecting gel percentages based on the molecular weight of the target protein(s).
Table 1: Recommended Gel Percentages for Optimal Protein Separation
| Protein Size Range (kDa) | Recommended Gel Percentage (%) | Separation Characteristics |
|---|---|---|
| 4–40 | 20 | Optimal for very small proteins and peptides [29] [28] |
| 12–45 | 15 | Ideal for small proteins [29] [28] |
| 10–70 | 12–12.5 | Standard range for small to medium proteins [29] [28] |
| 15–100 | 10 | Standard range for medium-sized proteins [29] [28] |
| 25–200 | 7.5–8 | Broad range for medium to large proteins [29] [28] |
| 50–500 | 7 | Wide separation range for large proteins [27] |
| 30–300 | 10 | Intermediate range [27] |
| 10–200 | 12 | Intermediate range [27] |
| 3–100 | 15 | Wide range focusing on small proteins [27] |
| >200 | 5 | Very large proteins [29] |
For samples containing proteins with a broad molecular weight range, gradient gels (e.g., 4-20%) are recommended as they provide a continuous pore size increase from top to bottom, allowing optimal separation of both high and low molecular weight proteins on a single gel [11] [28]. The gradient gel eliminates the need for a stacking gel and can yield sharper protein bands [28].
Experimental Protocol: Casting Discontinuous SDS-Polyacrylamide Gels
Reagent Preparation
Table 2: Essential Reagents for SDS-PAGE Gel Preparation
| Reagent | Function | Safety Considerations |
|---|---|---|
| Acrylamide/Bis-acrylamide (29:1 or 37.5:1) | Forms the porous gel matrix | Potent neurotoxin; always wear gloves [29] |
| Ammonium Persulfate (APS) | Polymerization initiator | Prepare fresh solution for optimal polymerization |
| TEMED (N,N,N',N'-Tetramethylethylenediamine) | Polymerization catalyst | Use in a fume hood; accelerates gel setting |
| Tris-HCl Buffer (pH 6.8 and 8.8) | Maintains pH for stacking and separation | |
| SDS (Sodium Dodecyl Sulfate) | Imparts uniform negative charge to proteins | |
| Butanol or Isopropanol (water-saturated) | Creates an airtight seal over the resolving gel |
Step-by-Step Gel Casting Procedure
Part A: Preparing the Resolving Gel
- Assemble the gel cassette according to manufacturer's instructions, ensuring it is properly sealed to prevent leakage [29].
- Prepare the resolving gel mixture based on the percentage required for your target protein (refer to Table 1). A standard 10% resolving gel recipe for a mini-gel is provided in Table 3 [30].
- Add APS and TEMED last to initiate polymerization, mix thoroughly, and immediately pipette the solution into the gel cassette, leaving appropriate space for the stacking gel (approximately 1 cm below the top of the plates) [29] [31].
- Carefully overlay the gel solution with water-saturated butan-1-ol or water to exclude oxygen and create a flat interface [29] [31].
- Allow complete polymerization for 15-60 minutes at room temperature. A distinct refractive interface will form between the gel and the overlay liquid once polymerization is complete [29].
Part B: Preparing the Stacking Gel
- Pour off the overlay liquid and use a filter paper wick to remove any residual liquid from the set resolving gel [29].
- Prepare the stacking gel solution (typically 4-5% acrylamide). A standard recipe is provided in Table 3 [29] [30].
- Add APS and TEMED to the stacking gel solution, mix, and pipette directly onto the surface of the polymerized resolving gel.
- Immediately insert a clean comb into the stacking gel solution, avoiding air bubbles.
- Allow the stacking gel to polymerize completely for 20-30 minutes [29].
- Carefully remove the comb and rinse wells with deionized water or running buffer to remove any unpolymerized acrylamide.
Table 3: Example Gel Recipes for Discontinuous SDS-PAGE (10 mL Resolving Gel, 5 mL Stacking Gel)
| Reagent | 10% Resolving Gel | 4% Stacking Gel |
|---|---|---|
| dHâ‚‚O | 4.0 mL | 3.05 mL |
| 1.5 M Tris-HCl (pH 8.8) | 2.5 mL | - |
| 0.5 M Tris-HCl (pH 6.8) | - | 1.25 mL |
| 30% Acrylamide/Bis Solution | 3.3 mL | 0.65 mL |
| 10% SDS | 100 µL | 50 µL |
| 10% Ammonium Persulfate (APS) | 50 µL | 25 µL |
| TEMED | 5 µL | 10 µL |
Electrophoresis and Troubleshooting
Sample Preparation and Running Conditions
- Prepare protein samples by diluting them in Laemmli buffer (typically containing SDS and a reducing agent like β-mercaptoethanol or DTT) [30] [31].
- Denature samples by heating at 95°C for 5 minutes [30] [31].
- Load equal amounts of protein (15-40 µg for a mini-gel well) and include an appropriate molecular weight marker in one lane [32] [28].
- Assemble the electrophoresis apparatus and fill with running buffer (e.g., Tris-Glycine-SDS buffer) [30].
- Run the gel at a constant voltage of 100-200V until the dye front reaches the bottom of the gel [30].
Troubleshooting Common Issues
Table 4: Common SDS-PAGE Issues and Solutions
| Issue | Potential Cause | Solution |
|---|---|---|
| Smiling Bands | Buffer/gel overheating during run | Check running voltage; ensure adequate cooling [32] |
| Smeared Bands | Incomplete denaturation or high salt concentration | Add fresh reducing agent; ensure proper heating; reduce salt concentration [32] |
| Vertical Streaking | Sample debris or overloading | Centrifuge samples before loading; reduce protein amount [32] |
| Diffuse Bands | Slow polymerization or old reagents | Prepare fresh APS; ensure correct TEMED amount [29] |
| Uneven Band Migration | Improper buffer formulation | Prepare fresh running buffer with correct pH and composition [32] |
The Scientist's Toolkit: Essential Research Reagent Solutions
Table 5: Key Reagents for SDS-PAGE-Based Molecular Weight Determination
| Reagent/Category | Specific Examples | Function in Protocol |
|---|---|---|
| Lysis Buffers | RIPA Buffer, NP-40 Lysis Buffer, Triton X-100 Buffer | Extract proteins from cells or tissues while maintaining integrity [30] |
| Sample Buffers | Laemmli SDS-Sample Buffer (Reducing/Non-Reducing) | Denature proteins and impart uniform negative charge for separation by size [30] |
| Running Buffers | Tris-Glycine-SDS, MOPS-SDS, MES-SDS | Conduct current and maintain pH during electrophoresis [30] [28] |
| Molecular Weight Markers | Prestained/Unstained Protein Ladders | Provide size calibration for estimating unknown protein molecular weights [11] [28] |
| Polymerization System | Acrylamide/Bis-acrylamide, APS, TEMED | Form the cross-linked polyacrylamide gel matrix [11] [30] |
| Gel Staining Reagents | Coomassie Blue, Silver Stain, SimplyBlue SafeStain | Visualize separated protein bands after electrophoresis [11] |
| Geranic acid | Geranic Acid|High-Purity Reagent for Research | |
| Declopramide | Declopramide|CAS 891-60-1|For Research | Declopramide is for research use only. This small molecule is a DNA repair inhibitor investigated for colorectal cancer and IBD studies. Not for human use. |
In the context of molecular weight determination research using SDS-PAGE, the precise configuration of electrical parameters is fundamental to achieving accurate and reproducible protein separation. Electrophoresis conditions directly influence resolution, band sharpness, and the reliability of molecular weight estimates [7]. This application note details the principles and protocols for optimizing voltage, current, and power settings to ensure high-quality results for researchers, scientists, and drug development professionals.
The separation of proteins in SDS-PAGE relies on the application of an electric field to drive negatively charged protein-SDS complexes through a polyacrylamide gel matrix [7]. The configuration of this electric field—whether maintained at constant current, constant voltage, or constant power—profoundly impacts the rate of migration, heat generation, and ultimately, the clarity of the final protein band pattern [33] [34]. Understanding these parameters is therefore critical for any research involving protein characterization, purity assessment, or western blotting preparation.
Theoretical Foundations of Electrical Parameters
The relationship between voltage, current, and power during electrophoresis is governed by fundamental physical laws. A clear grasp of these relationships allows researchers to make informed decisions when configuring their experiments.
Fundamental Electrical Relationships
Ohm's Law defines the relationship between voltage (V), current (I), and resistance (R): V = I × R [33] [34]. In SDS-PAGE, resistance is influenced by the ionic strength of the buffer, the conductivity of the gel, and temperature [34]. As electrolytes in the running buffer are consumed during the run, resistance typically increases [34].
Power (P), measured in watts, represents the rate of energy conversion and is calculated as: P = I × V [33]. This relationship is critical because the power consumed during electrophoresis is directly converted into heat, a key factor that must be managed for successful experiments [34].
The Role of Heat (Joule Heating)
Heat generation, or Joule heating, is an inevitable consequence of electrophoresis and represents a primary challenge in method optimization [34]. While mild heating can assist in denaturing proteins that were not fully denatured during sample preparation, excessive heat causes multiple problems [33] [34]. These include gel expansion leading to uneven protein migration (manifesting as "smiling" or "frowning" bands), warped gels, and in extreme cases, protein degradation or denaturation that can render proteins undetectable in subsequent western blotting [33] [34] [35]. The management of Joule heating is therefore central to selecting appropriate electrical settings.
Configuration Modes: Principles and Consequences
Modern power supplies offer three primary modes of operation, each with distinct advantages and disadvantages for SDS-PAGE applications. The choice of mode affects run consistency, heat production, and the need for researcher intervention.
Table 1: Comparison of Electrophoresis Configuration Modes
| Configuration Mode | Principles During Electrophoresis | Advantages | Disadvantages | Recommended Applications |
|---|---|---|---|---|
| Constant Current [33] [34] | Current (I) is fixed. As resistance (R) increases, voltage (V) must rise (per V = I × R). Power (P) also increases. | Consistent protein migration rate; predictable run time; sharper bands due to faster runs [34]. | Voltage and heat increase during the run, risking "smiling bands" or warped gels [33] [34]. | When run time consistency is prioritized and cooling methods (ice bath, cold room) are employed [33]. |
| Constant Voltage [33] [34] | Voltage (V) is fixed. As resistance (R) increases, current (I) decreases (per I = V/R). Power (P) decreases. | Safer; limits heat production; multiple chambers can run from one power pack [34]. | Migration slows down late in the run, requiring potential adjustments to running time; may cause diffuse bands [33] [34]. | Standard laboratory practice; when running multiple chambers; for safer operation with less risk of overheating [34]. |
| Constant Power [33] [34] | Power (P) is fixed. As resistance (R) increases, the relationship between V and I fluctuates to maintain P = I × V. | Limits heat production while maintaining more consistent migration than constant voltage [33]. | Unpredictable migration rate; longer run times; potentially diffuse bands [33] [34]. | When heat generation is a major concern but consistent migration is less critical [34]. |
The following decision pathway aids in selecting the appropriate configuration mode based on experimental priorities:
Detailed Experimental Protocol for Molecular Weight Determination
This protocol provides a step-by-step methodology for configuring electrophoresis conditions to achieve optimal protein separation for molecular weight analysis.
Materials and Reagent Solutions
Table 2: Essential Research Reagents and Materials for SDS-PAGE
| Item | Function/Description | Example Formulation/Notes |
|---|---|---|
| Acrylamide/Bis Solution (30%) [36] [14] | Forms the polyacrylamide gel matrix that acts as a molecular sieve. | Neurotoxin in unpolymerized form. Wear gloves and work in a fume hood [36]. |
| Tris-HCl Buffer [36] [14] | 1.5 M, pH 8.8 for resolving gel; 0.5 M, pH 6.8 for stacking gel. Maintains pH for optimal separation. | |
| SDS (Sodium Dodecyl Sulfate) [7] [14] | Anionic detergent that denatures proteins and confers uniform negative charge. | Typically used at 10% solution. Critical for size-based separation [7]. |
| Ammonium Persulfate (APS) & TEMED [36] [14] | Catalyze the polymerization of acrylamide. | Add immediately before casting gels. TEMED quantity affects polymerization rate [36]. |
| Protein Molecular Weight Marker [14] | Contains proteins of known sizes for estimating molecular weight of unknown proteins. | Pre-stained or unstained standards available. Essential for calibration [14]. |
| SDS-PAGE Running Buffer [35] [14] | Conducts current and maintains pH during electrophoresis. | Typically Tris-Glycine with 0.1% SDS. Improper concentration causes poor resolution [35]. |
| Loading Buffer (Laemmli Buffer) [7] [14] | Denatures proteins, adds charge, and provides dye to track migration. | Contains SDS, glycerol, bromophenol blue, and β-mercaptoethanol/DTT [7]. |
| Coomassie Stain Solution [14] | Binds to proteins for visualization post-electrophoresis. | Anionic dye that stains proteins blue. Sensitivity can be enhanced with colloidal stains [14]. |
Step-by-Step Electrophoresis Procedure
Gel Casting: Assemble glass plates and spacers in the casting apparatus. Prepare the resolving gel mixture (e.g., for a 10% gel: 4.1 mL dH₂O, 2.5 mL 1.5 M Tris-HCl pH 8.8, 3.3 mL 30% acrylamide, 50 µL 10% SDS). Just before pouring, add 100 µL 10% APS and 10 µL TEMED, mix without shaking, and pipette between the glass plates. Overlay with ethanol or isopropanol and allow to polymerize for ~30 minutes. Pour off the alcohol, rinse, and remove excess liquid. Prepare the stacking gel (e.g., 2.7 mL dH₂O, 0.5 mL 0.5 M Tris-HCl pH 6.8, 0.8 mL 30% acrylamide, 20 µL 10% SDS), add 40 µL APS and 4 µL TEMED, pour over the resolving gel, insert the comb, and allow to polymerize for at least one hour [36] [14].
Sample Preparation: Mix protein samples with an appropriate volume of loading buffer. Denature the samples by heating at 95–100°C for 5–10 minutes in a boiling water bath or heat block. Centrifuge briefly at 12,000 × g to collect condensation [14].
Apparatus Assembly: Remove the comb and assemble the cast gel into the electrophoresis chamber. Fill both the inner and outer chambers with freshly prepared running buffer [14].
Sample Loading: Load prepared samples and molecular weight markers into the wells. To prevent the "edge effect," which causes distorted bands in peripheral lanes, do not leave any wells empty. If necessary, load ladder or control protein samples in unused wells [35].
Electrophoresis Run Configuration: Connect the chamber to the power supply. The following workflow illustrates the run configuration for optimal results:
- Post-Electrophoresis Analysis: After the run, disconnect the power supply. Remove the gel from the apparatus and carefully separate the glass plates. The gel can be stained for visualization (e.g., with Coomassie Blue for 15 minutes with shaking, followed by destaining until background is clear and bands are visible) or used for downstream applications like western blotting [14].
Troubleshooting and Optimization
Even with a sound protocol, issues can arise. The following table addresses common problems related to electrical configuration:
Table 3: Troubleshooting Common SDS-PAGE Issues
| Problem | Possible Cause | Solution |
|---|---|---|
| "Smiling" or "Frowning" Bands [33] [34] [35] | Excessive heat generation during the run, often from high voltage or current. | Run the gel at a lower voltage for a longer time; use a cold room or ice bath for cooling; consider switching to constant voltage mode [33] [35]. |
| Smeared Bands [35] | Voltage set too high. | Run the gel at 10–15 Volts/cm; use a lower voltage for a longer run time [35]. |
| Poor Band Resolution [35] [7] | Insufficient run time; incorrect gel percentage; improper buffer. | Run the gel until the dye front nears the bottom; choose a gel percentage appropriate for your protein's size (e.g., 8% for 25-200 kDa, 10% for 15-100 kDa); ensure running buffer is correctly prepared [35] [7]. |
| Very Fast Sample Migration [35] | Running buffer too diluted; very high voltage. | Prepare running buffer with the proper salt concentration; adjust voltage to standard practice (~150 V) [35]. |
| Diffuse Bands [34] | Using constant voltage or constant power mode with long run times. | If sharper bands are critical, switch to constant current mode with adequate cooling [34]. |
| Protein Samples Migrating Out of Wells Before Run [35] | Long delay between loading samples and applying current. | Minimize the time between loading the first sample and starting the run [35]. |
The careful configuration of voltage, current, and power settings is a critical component of the SDS-PAGE protocol for molecular weight determination. The choice between constant current, constant voltage, and constant power involves trade-offs between run time consistency, heat management, and band sharpness. By understanding the principles outlined in this application note and adhering to the detailed protocol, researchers can optimize their electrophoresis conditions to obtain reliable, high-resolution protein separation, thereby ensuring the accuracy and reproducibility of their research outcomes in drug development and basic science.
Following the electrophoresis phase of SDS-PAGE, the subsequent processing of the gel is critical for visualizing the separated proteins and determining their molecular weights. This application note details the protocols for staining, visualizing protein bands, and calculating molecular weight, which are essential steps in the broader context of molecular weight determination research for drug development. These procedures allow researchers to analyze protein composition, assess sample purity, and estimate the size of target proteins with an accuracy typically ranging from 5% to 10% [37]. The guidance provided herein is designed to ensure reproducibility and precision in results, which are fundamental requirements for scientific and industrial applications.
Staining and Visualization of Protein Bands
After electrophoresis, proteins within the gel are separated but not visible. Staining is therefore employed to visualize these protein bands for analysis. The choice of staining method depends on the required sensitivity, the amount of protein present, and the need for compatibility with downstream applications.
Staining Protocols
Coomassie Brilliant Blue Staining Coomassie staining is a widely used method due to its simplicity, robustness, and compatibility with subsequent mass spectrometry analysis [7]. The following table summarizes the typical solutions used in the Coomassie staining protocol:
Table 1: Reagents for Coomassie Brilliant Blue Staining
| Solution | Composition | Purpose |
|---|---|---|
| Fixing Solution | 40% Ethanol, 10% Acetic Acid [6] | Precipitates and immobilizes proteins in the gel. |
| Staining Solution | 0.1% Coomassie R-250, 40% Ethanol, 10% Acetic Acid [6] | Binds non-specifically to proteins, creating blue bands. |
| Destaining Solution | 10% Ethanol, 7% Acetic Acid [6] | Removes excess dye from the gel background. |
A standard protocol is as follows [6]:
- Fixation: Following electrophoresis, immerse the gel in Fixing Solution for 30 minutes with gentle agitation.
- Staining: Replace the fixative with Staining Solution and incubate for 1-2 hours with agitation.
- Destaining: Transfer the gel to Destaining Solution. Replace the solution several times over 1-2 hours until the background is clear and protein bands are sharply defined. For faster destaining, the gel can be placed in a sealed container with a few folds of absorbent tissue or a destaining sponge to wick away the dye.
Silver Staining Silver staining offers approximately 100 times greater sensitivity than Coomassie staining, enabling the detection of low-abundance proteins (as little as 0.1 ng) [6]. Given its high sensitivity, it is crucial to use high-purity water and reagents to avoid background staining.
A generalized protocol involves these key steps [6]:
- Fixation: Incubate the gel in a solution of 50% ethanol and 5% acetic acid for 30 minutes.
- Sensitization: Treat the gel with a 0.02% sodium thiosulfate solution for 1 minute.
- Staining: Impregnate the gel with 0.1% silver nitrate (often with formaldehyde) for 20 minutes.
- Development: Develop the stained gel in a solution of 2% sodium carbonate (with formaldehyde) until the desired band intensity is achieved.
- Termination: Stop the development reaction by incubating the gel in 5% acetic acid for 10 minutes.
Table 2: Comparison of Protein Staining Methods
| Parameter | Coomassie Brilliant Blue | Silver Stain |
|---|---|---|
| Mechanism | Non-covalent binding to proteins | Reduction of silver ions to metallic silver on protein surfaces |
| Typical Detection Limit | 10-100 ng [6] | 0.1-1 ng [6] |
| Compatibility with Mass Spectrometry | Excellent [7] | Possible, but requires specific protocols to avoid modification |
| Complexity & Cost | Low | High |
| Time to Complete | 3-5 hours | 4-6 hours |
Gel Documentation and Imaging
Once stained, gels should be imaged promptly to prevent band diffusion [6]. Gel documentation systems are used to capture high-resolution images of the protein bands. For accurate quantification via densitometry, it is critical that the protein band signals are within the linear range of the detection method and are not saturated [38]. If saturation occurs, reducing the exposure time or the amount of protein loaded can rectify the issue.
Molecular Weight Calculation
SDS-PAGE enables the estimation of a protein's molecular weight by comparing its migration distance to that of standard proteins of known molecular weights run on the same gel under identical conditions [37] [31].
Determining Relative Migration Distance (Rf)
The first step is to calculate the Relative Migration Distance (Rf) for each band of the protein standard and for the unknown protein band(s). The Rf is determined using the formula [37] [38] [39]:
Rf = (Migration distance of the protein) / (Migration distance of the dye front)
The migration distance is measured from the top of the separating gel to the center of the protein band of interest. These measurements can be made manually with a ruler or using specialized software [37].
Generating a Standard Curve
A standard curve is created by plotting the Rf values of the protein standards on the X-axis against the logarithm of their known molecular weights (Log(MW)) on the Y-axis [37] [38]. For a well-denatured sample and an appropriate gel percentage, this plot should generate a linear relationship [37]. The stronger this linear relationship (as indicated by an R² value close to 1), the more accurate the molecular weight determination will be [38].
Table 3: Example Data for Standard Curve Generation
| Standard Protein | Molecular Weight (kDa) | Log(MW) | Migration Distance (cm) | Rf Value |
|---|---|---|---|---|
| Myosin | 200 | 2.30 | 1.5 | 0.20 |
| Phosphorylase B | 100 | 2.00 | 2.2 | 0.29 |
| BSA | 70 | 1.85 | 2.9 | 0.39 |
| Ovalbumin | 50 | 1.70 | 3.8 | 0.51 |
| Carbonhydrase | 30 | 1.48 | 5.1 | 0.68 |
| Trypsin Inhibitor | 20 | 1.30 | 6.5 | 0.87 |
Calculating the Unknown Molecular Weight
Once the standard curve is established and a line of best fit is drawn, the equation of this line is used to calculate the molecular weight of the unknown protein.
- Calculate Log(MW): Using the Rf value of the unknown protein, interpolate from the standard curve or use the line's equation to calculate the Log(MW). For a linear plot with equation y = mx + c, where y is Log(MW), m is the slope, and c is the y-intercept, the calculation is straightforward [37].
- Determine Molecular Weight: The final molecular weight is calculated by taking the inverse logarithm of the result: MW = 10^Log(MW) [37].
Example of Calculation: If the linear equation from the standard curve is y = -2.0742x + 2.8 and an unknown protein has an Rf (x) of 0.7084:
- Log(MW) = (-2.0742 × 0.7084) + 2.8 = 1.3305
- Molecular Weight = 10^1.3305 ≈ 21.4 kDa [37]
Workflow and Data Analysis
The entire post-run process, from visualization to final calculation, follows a logical sequence to ensure accurate data generation. The following workflow diagram illustrates the key steps and decision points.
Diagram 1: Post-run analysis workflow for molecular weight determination.
The Scientist's Toolkit: Essential Research Reagents
Successful execution of the post-run protocols requires specific reagents and materials. The following table details the key solutions and their functions.
Table 4: Essential Research Reagents for Post-Run Processing
| Reagent / Material | Function / Purpose |
|---|---|
| Coomassie Staining Solution | Visualizes protein bands by non-covalent binding; suitable for standard sensitivity requirements [7] [6]. |
| Silver Staining Kit | Provides high-sensitivity detection for low-abundance proteins; includes all necessary components for a multi-step process [6]. |
| Destaining Solution | Removes non-specifically bound dye from the gel matrix, reducing background and improving band contrast [6]. |
| Molecular Weight Standards (Ladder) | Contains a mixture of proteins of known molecular weights; essential for generating the standard curve for molecular weight estimation [37] [40]. |
| Gel Documentation System | Captures high-resolution images of stained gels for permanent record keeping and quantitative densitometry analysis [7]. |
| Decylubiquinone | Decylubiquinone, CAS:55486-00-5, MF:C19H30O4, MW:322.4 g/mol |
| 16-Deethylindanomycin | 16-Deethylindanomycin, CAS:106803-22-9, MF:C29H39NO4, MW:465.6 g/mol |
Troubleshooting Common Issues
Several issues can arise during post-run processing that affect the clarity of results and the accuracy of molecular weight determination.
- Smiling or Frowning Bands: Often caused by uneven heating during electrophoresis due to incorrect buffer composition or excessive voltage. Ensure running buffer is correctly prepared and monitor voltage settings [7] [32].
- Smeared Bands: Typically a result of incomplete denaturation of the protein sample. Ensure the sample buffer contains fresh reducing agent (DTT or β-mercaptoethanol) and that the sample is boiled for a sufficient time (e.g., 5 minutes at 95-100°C) [6] [32].
- High Background in Staining: For Coomassie staining, ensure adequate destaining time and change the destaining solution frequently. For silver staining, use high-purity water and ensure all glassware is meticulously clean [6].
- Non-Linear Standard Curve: A sigmoidal or non-linear standard curve suggests that the gel percentage was not appropriate for the molecular weight range of the samples, or that the protein standards were not fully denatured [37]. Using a gradient gel can help resolve a wider size range on a single gel [7].
Within the framework of molecular weight determination research, SDS-PAGE (Sodium Dodecyl Sulfate-Polyacrylamide Gel Electrophoresis) remains a foundational analytical technique. Its utility, however, extends far beyond simple molecular weight estimation, playing a critical role in the demanding fields of biopharmaceutical development and quality control. This application note details three critical protocols where SDS-PAGE is indispensable: assessing protein purity, establishing biosimilarity for monoclonal antibodies (mAbs), and conducting forced degradation studies for stability profiling. The reproducibility, robustness, and relative simplicity of SDS-PAGE make it a cornerstone for researchers, scientists, and drug development professionals tasked with ensuring the quality, efficacy, and safety of biologic therapeutics. We will explore detailed methodologies, data interpretation, and how SDS-PAGE integrates with orthogonal analytical techniques to provide a comprehensive product characterization.
Application Note 1: Purity Assessment of Recombinant Proteins
Protocol: SDS-PAGE for Purity Analysis
Principle: SDS-PAGE separates proteins based on their molecular mass. The anionic detergent SDS denatures proteins and confers a uniform negative charge, allowing migration through a polyacrylamide gel matrix under an electric field to be determined primarily by size [5].
Gel Preparation: A discontinuous gel system is used.
- Resolving Gel: Prepare a 12% polyacrylamide solution by mixing 30% acrylamide/bis-acrylamide, 1.5 M Tris-HCl (pH 8.8), 10% SDS, 10% ammonium persulfate (APS), and TEMED. Pour the solution between glass plates and overlay with deionized water to ensure a flat interface. Polymerization typically takes 20-30 minutes [14].
- Stacking Gel: Once the resolving gel has polymerized, pour off the water. Prepare a 4% stacking gel solution with 1.0 M Tris-HCl (pH 6.8), 10% SDS, APS, and TEMED. Insert a comb immediately and allow to polymerize for at least 30 minutes [14].
Sample Preparation:
- Mix the protein sample with an equal volume of 2X Laemmli sample buffer [12].
- For reduced conditions, add β-mercaptoethanol (final concentration 2.5%) or dithiothreitol (DTT) to a final concentration of 50 mM to break disulfide bonds [12] [5].
- Heat the samples at 85°C for 2-5 minutes [12] or 100°C for 5-10 minutes [14] to ensure complete denaturation. Centrifuge briefly at 12,000g to pellet any insoluble material.
Electrophoresis:
- Assemble the gel cassette in the electrophoresis chamber filled with 1X Tris-Glycine-SDS running buffer [12].
- Load prepared samples and a pre-stained protein molecular weight marker into the wells.
- Run the gel at a constant voltage of 125-150 V until the dye front reaches the bottom of the gel (approximately 90 minutes) [12] [14].
Staining and Visualization:
- After electrophoresis, disassemble the cassette and place the gel in Coomassie Brilliant Blue staining solution for 15-60 minutes with gentle agitation [14].
- Destain the gel with a solution of methanol, acetic acid, and water until the background is clear and protein bands are visible [14].
- For permanent records and quantification, image the gel using a white light transilluminator or a flatbed scanner [41].
Data Interpretation and Quantification
A pure protein sample is indicated by the presence of a single, sharp band on the gel. Multiple bands or smeared lanes suggest the presence of impurities, degradation products, or heterogeneous glycosylation [5]. Protein purity can be quantified using densitometry analysis software like ImageJ/Fiji [41].
- Densitometry Protocol:
- Image Acquisition: Scan the stained gel as a grayscale TIFF image at 300-600 dpi [41].
- Background Subtraction: Open the image in ImageJ and use the "Subtract Background" function with a rolling ball radius of 50-200 pixels [41].
- Define Lanes and Bands: Use the "Gel Analyzer" tool to define lanes and automatically detect bands, or manually draw rectangular Regions of Interest (ROIs) around each band [41].
- Quantification: The software calculates the integrated density (area × mean pixel intensity) for each band. Purity is expressed as the percentage of the integrated density of the target band relative to the total integrated density of all bands in the lane [41].
Table 1: Troubleshooting Common SDS-PAGE Purity Assessment Issues
| Issue | Potential Cause | Solution |
|---|---|---|
| Smeared bands | Incomplete denaturation, protein degradation, overloading | Ensure fresh reducing agent and proper heating; avoid repeated freeze-thaw cycles; reduce loading amount [5]. |
| High background | Incomplete destaining, expired staining reagents | Increase destaining time; use fresh staining solution [14]. |
| Multiple bands in a pure sample | Proteolytic cleavage, protein aggregation | Use protease inhibitors during purification; include fresh reducing agent [5]. |
| Aberrant band migration | Improper SDS binding, glycosylation | For highly glycosylated proteins, consider complementary methods like capillary electrophoresis [42]. |
Application Note 2: Biosimilarity Testing of Monoclonal Antibodies
Protocol: Comparative Analysis under Reducing and Non-Reducing Conditions
Objective: To demonstrate analytical similarity between a biosimilar and its originator monoclonal antibody (mAb) by comparing their fragmentation and subunit patterns under controlled conditions [42] [43].
Sample Preparation (Critical Step):
- Prepare both the biosimilar and originator mAbs (sourced from different regions if applicable) at the same concentration (e.g., 1-2 mg/mL).
- For non-reduced analysis, mix the mAb with non-reducing SDS sample buffer (containing iodoacetamide to alkylate free thiols). Do not add a reducing agent [42]. This allows visualization of the intact antibody, disulfide-linked fragments, and any covalent aggregates.
- For reduced analysis, mix the mAb with SDS sample buffer containing a reducing agent (e.g., DTT or β-mercaptoethanol) to break disulfide bonds, separating the mAb into its constituent light chains (L, ~25 kDa) and heavy chains (H, ~50 kDa) [42] [5].
- Heat all samples at 85°C for 2-5 minutes [12].
Electrophoresis:
- Use a pre-cast gradient gel (e.g., 4-20% or 8-16%) for optimal resolution across a broad molecular weight range [5].
- Load the reduced and non-reduced samples of both the biosimilar and originator in adjacent lanes, but do not place reduced and non-reduced samples in immediately adjacent lanes to prevent carry-over of reducing agent [12].
- Include a pre-stained protein ladder.
- Run the gel as described in Section 2.1.
Analysis: The resulting banding patterns for the biosimilar and originator mAbs should be highly similar. Under non-reducing conditions, the main band should be the intact IgG at ~150 kDa. Under reducing conditions, the characteristic doublet of heavy and light chains should align perfectly between the two products [42] [43].
Orthogonal Method Integration
While SDS-PAGE provides a powerful visual comparison, regulatory biosimilarity assessment requires orthogonal techniques for a comprehensive profile [42] [43].
- Size-Exclusion Chromatography (SEC): Used to quantify soluble aggregates (High Molecular Weight species, HMW) and fragments (Low Molecular Weight species, LMW), which are Critical Quality Attributes (CQAs) [42] [43].
- Capillary Electrophoresis-SDS (CE-SDS): An automated, quantitative counterpart to SDS-PAGE with superior resolution and reproducibility, often used for formal release testing [42].
- Isoelectric Focusing (IEF): Analyzes charge heterogeneity (acidic and basic variants) caused by post-translational modifications like deamidation and C-terminal lysine clipping [43].
Table 2: Key Analytical Techniques for Biosimilarity Assessment
| Technique | Attribute Measured | Role in Biosimilarity |
|---|---|---|
| SDS-PAGE | Purity, fragmentation, subunit integrity | Initial, low-cost comparability of size-based variants under reducing and non-reducing conditions [42] [43]. |
| CE-SDS | Purity and impurity quantification | Validated, high-resolution method for precise quantification of LMW and HMW species [42]. |
| SEC | Soluble aggregates and fragments | Quantifies non-covalent aggregates (HMW) and fragments (LMW) in native conditions [43]. |
| icIEF | Charge variant profile | Monitors critical modifications like deamidation (increasing acidic variants) that can impact stability and activity [43]. |
The following workflow illustrates how SDS-PAGE is integrated with other analytical methods in a comprehensive biosimilarity assessment strategy.
Diagram 1: Biosimilarity assessment workflow. SDS-PAGE is part of an orthogonal analytical strategy to comprehensively compare critical quality attributes of biosimilar and originator products [42] [43].
Application Note 3: Forced Degradation Studies
Protocol: Thermal Stress to Elucidate Degradation Pathways
Objective: To accelerate and identify potential degradation pathways of a therapeutic protein, thereby validating the stability-indicating nature of analytical methods and informing formulation development [44] [42].
Stress Conditions:
- Thermal Stress: Inculate the protein (e.g., a monoclonal antibody at 1-10 mg/mL) at two different temperatures: a physiologically relevant temperature (e.g., 37°C) and a more severe stress temperature (e.g., 50°C, typically 10-20°C below its melting temperature, Tm). Sample at multiple time points (e.g., 0, 3, 7, 14 days) [42] [43].
- Other Stresses: Include oxidative stress (e.g., hydrogen peroxide), acidic/basic pH, and mechanical agitation, as recommended by regulatory guidances [44].
SDS-PAGE Analysis:
- After each stress interval, remove aliquots and immediately freeze at -80°C or analyze directly to halt degradation.
- Prepare both reduced and non-reduced samples from the stressed aliquots and the unstressed control (time zero) as per Section 3.1.
- Run all samples on the same SDS-PAGE gel to enable direct comparison.
Data Interpretation: Monitor for time- and temperature-dependent changes:
- Increase in LMW Bands: Indicates fragmentation, often seen in the hinge region of mAbs [42].
- Increase in HMW Smear at Gel Top: Indicates the formation of large, covalent aggregates that cannot enter the gel [42].
- Changes in Heavy/Light Chain Ratios (reduced): May suggest selective degradation of one subunit [42].
Quantitative Analysis and Regulatory Context
Forced degradation studies are a regulatory expectation for marketing applications and are typically performed during Phase III clinical development [44]. The goal is not to establish acceptance criteria but to challenge analytical methods and understand degradation pathways.
Table 3: Forced Degradation Profile of an Anti-VEGF Biosimilar and Originator Under Thermal Stress [42] [43]
| Stress Condition | Analytical Technique | Observation | Interpretation |
|---|---|---|---|
| 37°C, 14 days | SE-UPLC (SEC) | ~1.3% decrease in monomer; ~1.2% increase in HMW aggregates | Mild aggregation under accelerated conditions [43]. |
| 50°C, 14 days | SE-UPLC (SEC) | ~11.6% decrease in monomer; significant increase in HMW aggregates | Pronounced aggregation under severe stress [43]. |
| 50°C, 14 days | nrCE-SDS / SDS-PAGE | Increase in LMW fragments; decrease in intact IgG | Time/temperature-dependent covalent fragmentation [42]. |
| 50°C, 14 days | rCE-SDS / SDS-PAGE | Increase in total impurities; decrease in light/heavy chains | Fragmentation impacts subunit integrity [42]. |
| 50°C, 14 days | icIEF / Peptide Mapping | Increase in acidic charge variants (e.g., +39%) | Post-translational modifications such as deamidation of asparagine and formation of N-terminal pyroglutamate [42] [43]. |
The following flowchart outlines the strategic process for designing and interpreting a forced degradation study.
Diagram 2: Forced degradation study workflow. SDS-PAGE analysis of stressed samples helps identify and characterize degradation products, informing product understanding and stability-indicating method validation [42] [44] [43].
The Scientist's Toolkit: Essential Reagents and Materials
Table 4: Key Research Reagent Solutions for SDS-PAGE-Based Applications
| Item | Function / Role | Example / Note |
|---|---|---|
| Pre-cast Gels (Tris-Glycine) | Provide consistency, save time; based on Laemmli system with modified pH for optimal performance [12]. | Novex Tris-Glycine Gels (4-20% gradient recommended for mAb analysis). |
| SDS Sample Buffer (2X) | Denatures proteins and provides uniform negative charge for separation by mass [12]. | Contains SDS, Tris-HCl, glycerol, and tracking dye. |
| Reducing Agents | Breaks disulfide bonds to analyze protein subunits. | Dithiothreitol (DTT) or β-mercaptoethanol; use fresh [12] [5]. |
| Alkylating Agent | Blocks reformation of disulfide bonds in non-reduced samples. | Iodoacetamide (IAM); used in non-reduced CE-SDS sample prep [42]. |
| Molecular Weight Marker | Allows estimation of protein size and monitoring of run progress. | Pre-stained, broad-range ladders (e.g., 10-250 kDa). |
| Running Buffer (10X) | Provides conductive medium for electrophoresis. | Tris-Glycine-SDS buffer, diluted to 1X before use [12]. |
| Staining Solution | Visualizes separated protein bands on the gel. | Coomassie Brilliant Blue; sensitive fluorescent stains are alternatives. |
| Image Analysis Software | Enables densitometry and quantification of band intensity. | ImageJ/Fiji (open source) or commercial gel documentation systems [41]. |
| Deferiprone | Deferiprone, CAS:30652-11-0, MF:C7H9NO2, MW:139.15 g/mol | Chemical Reagent |
| Delamanid | Delamanid|MDR-TB Research Compound|RUO | Delamanid is a nitroimidazole-class antibiotic for research on multidrug-resistant tuberculosis (MDR-TB). This product is For Research Use Only. Not for human consumption. |
Troubleshooting Poor Band Separation and Optimizing Your SDS-PAGE Results
Within molecular weight determination research, sodium dodecyl sulfate-polyacrylamide gel electrophoresis (SDS-PAGE) serves as a fundamental technique for protein separation. However, poor band separation remains a frequent challenge that can compromise experimental accuracy. This application note systematically addresses six critical troubleshooting areas to resolve poor band separation, providing researchers with detailed protocols and analytical frameworks to ensure reliable protein characterization in drug development workflows.
Comprehensive Troubleshooting Framework
The following table summarizes the primary factors contributing to poor band separation in SDS-PAGE and their respective solutions:
| Troubleshooting Area | Specific Issue | Recommended Solution |
|---|---|---|
| Sample Preparation | Incomplete protein denaturation leading to structural influences on migration [45] [46] | Increase boiling time to 5 minutes at 95-100°C [45] [46]; Immediately place samples on ice after boiling to prevent renaturation [45] |
| Insufficient reducing agent | Freshly prepare β-mercaptoethanol (0.55M final concentration) or DTT [47] [48] | |
| Electrophoresis Parameters | Excessive heat generation causing "smiling" bands and distorted migration [49] [48] | Run gel at lower voltage (10-15 V/cm) for longer duration [49]; Use cooled apparatus or cold room [45] |
| Run time too short for target protein size | Run until dye front reaches bottom of gel; extend time for high molecular weight proteins [49] | |
| Protein Loading | Protein overload causing aggregation and poor resolution [45] [48] | Load appropriate amount (0.5-17.5 µg per lane; validate for each protein-antibody pair) [47] [45] |
| Large sample volume spreading lanes | Concentrate samples via TCA precipitation if needed [50] | |
| Gel Polymerization | Incomplete polymerization creating irregular matrix [45] [48] | Ensure fresh ammonium persulfate and TEMED [50] [48]; Allow complete polymerization (20-30 minutes) [46] |
| Irregular gel interface | Carefully overlay separating gel with water or butanol for even surface [46] [50] | |
| Acrylamide Concentration | Pore size inappropriate for target protein size [45] [50] | Use lower percentage (6-10%) for high molecular weight proteins; higher percentage (12-15%) for low molecular weight proteins [49] [50] |
| Broad protein separation range needed | Implement gradient gels (4-20%) for optimal resolution across multiple sizes [46] [48] | |
| Buffer Conditions | Improper ion concentration affecting current flow [49] [48] | Prepare fresh running buffer with correct salt concentration [45] |
| High salt concentration in samples | Dialyze samples or use desalting columns [48] |
Detailed Experimental Protocols
Optimal Sample Preparation Methodology
Proper sample preparation is crucial for achieving accurate separation by molecular weight. The following protocol ensures complete denaturation and linearization of protein structures:
- Reagent Preparation: Prepare 2X or 5X SDS-PAGE sample buffer containing 2% SDS, 10% glycerol, 0.55M β-mercaptoethanol or 100mM DTT, 0.01% bromophenol blue in appropriate Tris buffer [47] [50].
- Sample Denaturation: Mix protein sample with equal volume of 2X sample buffer (for 1X final concentration). Heat at 95-100°C for 3-5 minutes in a heat block to ensure complete denaturation [45] [46].
- Cooling and Clarification: Immediately transfer heated samples to ice to prevent renaturation. Centrifuge at 15,000 rpm for 1-3 minutes to pellet any debris [47] [46].
- Loading: Use supernatant for gel loading. Load molecular weight markers in at least one lane for calibration [47] [46].
Gel Selection and Preparation Protocol
Selecting appropriate acrylamide concentration is essential for optimal separation efficiency based on target protein size:
Gel Concentration Guidelines:
Gel Casting Procedure:
- Assemble gel casting apparatus with clean glass plates and spacers [46].
- Prepare resolving gel solution with appropriate acrylamide percentage [50].
- Add TEMED and ammonium persulfate immediately before pouring [50].
- Pour resolving gel and overlay with water or butanol to ensure even polymerization [46] [50].
- After polymerization (20-30 minutes), remove overlay and pour stacking gel (typically 4-5% acrylamide) [46] [50].
- Insert comb avoiding air bubbles and allow to polymerize completely (10-30 minutes) [46] [50].
Electrophoresis Execution Protocol
Proper electrophoresis conditions are critical for maintaining protein denaturation and ensuring uniform migration:
- Apparatus Setup: Mount polymerized gel in electrophoresis chamber. Fill inner and outer chambers with 1X running buffer (25mM Tris, 192mM glycine, 0.1% SDS, pH 8.3) [47] [50].
- Sample Loading: Rinse wells with running buffer before loading. Load samples and molecular weight markers. Load empty wells with sample buffer to prevent edge effects [49] [50].
- Electrophoresis Parameters: Run gel at constant voltage (150V for mini-gels) until dye front reaches bottom (45-90 minutes) [47]. For heat-sensitive proteins, reduce voltage to 100-125V and extend run time [49] [45].
- Post-Electrophoresis Processing: Turn off power supply. Remove gel from plates for staining (Coomassie or silver stain) or transfer for western blotting [47] [50].
Visual Guide to Troubleshooting Logic
The following workflow diagram illustrates the systematic approach to diagnosing and resolving poor band separation in SDS-PAGE:
Research Reagent Solutions
The following table outlines essential reagents and materials required for optimal SDS-PAGE performance:
| Reagent/Material | Function | Critical Specifications |
|---|---|---|
| Acrylamide/Bis-acrylamide | Forms crosslinked gel matrix for molecular sieving [45] [46] | 30:0.8-30:1.2 ratio; High purity; Filtered and degassed solution [50] |
| SDS (Sodium Dodecyl Sulfate) | Denatures proteins and confers negative charge [46] [50] | High purity (>99%); 0.1% in running buffer; 1-2% in sample buffer [50] |
| Tris-Glycine Buffer | Maintains pH and conducts current [50] | 25mM Tris, 192mM glycine, 0.1% SDS, pH 8.3 [47] [50] |
| TEMED & Ammonium Persulfate | Catalyzes acrylamide polymerization [50] [48] | Freshly prepared APS (10%); TEMED stored properly [50] |
| β-mercaptoethanol or DTT | Reduces disulfide bonds for complete unfolding [47] [45] | 0.55M final concentration in sample buffer [47] |
| Molecular Weight Markers | Provides size calibration reference [47] [46] | Pre-stained for western transfer; Unstained for direct staining [47] |
Effective resolution of poor band separation in SDS-PAGE requires methodical investigation across sample preparation, electrophoresis conditions, and gel matrix parameters. By implementing these detailed troubleshooting protocols and maintaining strict attention to reagent quality and procedural细节, researchers can achieve reliable protein separation for accurate molecular weight determination essential to drug development research.
Managing Gel Temperature and Electrophoresis Parameters to Prevent 'Smiling' Bands
The "smiling band" effect, characterized by upward-curving protein bands at the edges of an SDS-PAGE gel, represents a common artifact that compromises data quality in molecular weight determination research. This phenomenon primarily results from uneven heat distribution across the gel during electrophoresis, where the center becomes warmer than the edges, causing faster migration in central lanes. This application note provides detailed protocols for optimizing electrophoretic parameters and temperature control systems to ensure uniform band migration, thereby enhancing the reliability of molecular weight analyses critical to drug development research.
Sodium dodecyl sulfate-polyacrylamide gel electrophoresis (SDS-PAGE) serves as a foundational technique in molecular biology and proteomics research, enabling the separation of complex protein mixtures by molecular weight under denaturing conditions. The accuracy of molecular weight determination depends fundamentally on uniform migration of protein standards and samples across all gel lanes. However, the smiling band artifact (Figure 1) introduces systematic errors in molecular weight calculations by creating inconsistent migration patterns [51].
This phenomenon, technically known as the "edge effect," occurs when excessive heat generation during electrophoresis causes non-uniform gel expansion, with the center lanes migrating faster than the peripheral lanes [51] [52]. The resulting curved bands compromise the precision of molecular weight determination, particularly problematic in quantitative proteomics and comparative expression studies. For researchers in drug development, where small molecular weight differences can indicate significant post-translational modifications or proteolytic processing, preventing this artifact is essential for data integrity.
The Science of Temperature-Induced Band Distortion
Fundamental Mechanisms
During SDS-PAGE, an electrical current passes through the running buffer, creating resistance that generates heat as an unavoidable side effect [51]. This Joule heating effect varies across the gel matrix: the center retains more heat due to reduced heat dissipation, while edges cool more efficiently through contact with the glass plates and surrounding buffer. This thermal gradient creates differential migration rates, with proteins moving faster in the warmer, less dense central regions [52].
The fundamental relationship between temperature and electrophoretic mobility stems from several factors:
- Buffer viscosity decreases with increasing temperature, reducing resistance to protein migration
- Ionic mobility increases at higher temperatures, enhancing conductivity in central lanes
- Gel matrix expansion occurs non-uniformly, creating larger pores in warmer regions
The use of Tris-glycine running buffer (pH 8.3), while optimal for discontinuous gel systems, exacerbates this effect due to its relatively high conductivity and consequent heat generation during extended electrophoretic runs [53] [54].
Experimental Evidence
Comparative studies demonstrate that gels run at 150V without cooling exhibit up to 15% faster migration in center lanes compared to edge lanes, with temperature differentials exceeding 5°C between these regions. This gradient produces the characteristic smiling pattern that distorts molecular weight estimation [51] [52].
Research Reagent Solutions
The following reagents and equipment constitute essential components for effective temperature management in SDS-PAGE:
Table 1: Essential Research Reagents and Equipment for Temperature Management
| Item | Function in Temperature Control | Application Notes |
|---|---|---|
| Tris-Glycine-SDS Running Buffer | Conducts current while maintaining pH 8.3; composition affects heat generation [53] [54] | Higher concentrations may increase current and heat; prepare fresh for optimal conductivity |
| Pre-cast Polyacrylamide Gels | Consistent matrix quality affects uniform heat distribution [52] | Choose percentages appropriate for target protein size (e.g., 8-10% for standard separations) |
| Magnetic Stirrer & Stir Bar | Eliminates buffer temperature gradients during runs [52] | Essential for large format gels; prevents localized heating |
| Recirculating Chiller | Actively controls buffer temperature | For high-voltage or long-run applications |
| Ice Packs | Passive cooling method | Place in buffer chambers; effective for mini-gel systems |
Optimization Protocols
Temperature Management Procedures
Protocol 1: Active Cooling Method for High-Resolution Applications
- Apparatus Setup: Place the assembled electrophoresis chamber in a cold room (4°C) or connect to a recirculating chiller set to maintain temperature at 10-15°C [52]
- Buffer Preparation: Pre-chill 1X running buffer to 4°C before adding to the chamber [51]
- Buffer Circulation: Place a magnetic stir bar in the lower buffer chamber and position the entire chamber on a magnetic stirrer during electrophoresis to ensure uniform buffer temperature distribution [52]
- Monitoring: Run the gel at constant voltage (recommended settings in Table 2) and monitor buffer temperature with a submerged thermometer, ensuring it remains below 20°C throughout the run
Protocol 2: Passive Cooling for Standard Applications
- Ice Incubation: Prior to electrophoresis, incubate the sealed gel cassette at 4°C for 15 minutes
- Ice Pack Application: Place reusable ice packs in the buffer chamber surrounding the gel cassette, ensuring they do not contact the electrodes [51]
- Buffer Replacement: Replace 25% of the running buffer with pre-chilled buffer every 30 minutes during extended runs to maintain temperature control
Electrophoresis Parameter Optimization
Table 2: Voltage Parameters for Optimal Band Linearity
| Gel Size | Initial Voltage (Stacking) | Final Voltage (Resolving) | Maximum Temperature | Run Duration |
|---|---|---|---|---|
| Mini-gel (8x8 cm) | 80 V [55] | 120-150 V [56] [55] | <20°C [52] | 45-90 min [56] |
| Midi-gel (8x13 cm) | 100 V | 150 V | <20°C | 90-120 min |
| Large gel (15x18 cm) | 100 V | 150-200 V [3] | <20°C | 2-4 hours |
Protocol 3: Staged Voltage Application
- Initial Stacking Phase: Apply 80-100V constant voltage during the stacking phase to allow proteins to concentrate without significant heat generation [55]
- Resolving Phase Transition: Once samples enter the resolving gel (evident by dye front movement), increase voltage to the optimal level for separation (Table 2)
- Extended Run Alternative: For heat-sensitive samples, use a lower voltage (100-120V) throughout the entire run, extending the duration by 25-50% to achieve complete separation [51]
Complementary Technical Considerations
Gel Loading Practices:
- Load protein standards in both edge and center lanes to monitor smile effect across the gel
- Fill empty wells with 1X loading buffer to prevent edge effect distortion in adjacent sample lanes [51] [55]
- Ensure consistent sample volume and composition across all wells to maintain uniform electrical resistance
Apparatus Maintenance:
- Regularly inspect electrodes for uniformity to ensure consistent current distribution
- Verify that gel cassettes sit evenly in the apparatus to prevent buffer leakage and irregular current flow
- Ensure buffer levels remain equal across chambers throughout the run
Workflow Integration
The following diagram illustrates the decision pathway for selecting appropriate smile-effect prevention strategies based on experimental requirements:
Effective management of gel temperature and electrophoretic parameters provides an essential strategy for preventing smiling bands in SDS-PAGE, thereby ensuring accurate molecular weight determination in research applications. Implementation of the protocols described herein—particularly the combination of active cooling methods with optimized voltage settings—enables researchers to maintain uniform band migration across all gel lanes. For drug development professionals requiring precise molecular weight analyses, these methods significantly enhance data reliability while maintaining the practical throughput necessary for screening applications. Consistent application of these temperature control measures represents a critical component of robust SDS-PAGE protocol within molecular weight determination research.
Within the context of molecular weight determination research using SDS-PAGE, achieving precise and reliable results fundamentally depends on appropriate protein loading. Insufficient protein may yield no detectable bands, while overloading can cause numerous analytical issues including distorted bands, smearing, and aggregation artifacts that compromise accurate molecular weight estimation [7] [57]. For researchers and drug development professionals, these technical challenges are particularly critical when characterizing therapeutic proteins where aggregation is a key quality attribute linked to potential immunogenicity [58]. This Application Note provides detailed methodologies and quantitative guidelines to optimize protein load, minimize aggregation, and ensure data integrity in SDS-PAGE experiments.
The principle of SDS-PAGE relies on sodium dodecyl sulfate (SDS) binding to proteins at an approximately constant ratio of 1.4 grams SDS per gram of protein, denaturing them and imparting a uniform negative charge [57] [59]. This charge uniformity ensures migration through the polyacrylamide gel matrix is primarily dependent on molecular weight rather than inherent charge or protein shape [7] [59]. However, this fundamental principle can be disrupted when protein loads are excessive or aggregates form, leading to inaccurate molecular weight determination and purity assessment.
Theoretical Background: Overloading and Aggregation
Consequences of Gel Overloading
Exceeding the optimal protein load per lane directly impacts resolution and band morphology. As a general guideline, the maximum protein loading per well for a mixture of proteins is approximately 40 µg [57]. Beyond this threshold, several artifacts may appear:
- Smiling or frowning bands resulting from uneven current distribution, excessive sample quantities, or extended run times [7]
- Horizontal band spreading and loss of resolution between adjacent bands
- Incomplete separation where proteins of different sizes fail to resolve adequately [7]
- Precipitation at the well interface, particularly with proteins prone to aggregation
The minimum detectable protein depends on the staining method: 0.1 µg for Coomassie Brilliant Blue staining and as little as 2 ng for silver staining [57]. For purified proteins, 1.0 µg is generally sufficient for visualization on a Coomassie-stained gel, while 10 µg may be required for proteins in complex lysates [60].
Protein Aggregation: Mechanisms and Impacts
Protein aggregates represent assemblies of protein molecules beyond the desired monomeric species, varying in size (nanometers to micrometers), morphology (spherical to fibrillar), and intermolecular bonding (covalent versus non-covalent) [58]. In SDS-PAGE, aggregates may manifest as:
- High molecular weight smears at the top of the separating gel
- Discrete high molecular weight bands not corresponding to expected species
- Precipitation at the well interface
- Inconsistent band intensities across replicates
Aggregates can form during sample preparation through exposure to heat, mechanical stresses, or air-liquid interfaces [58]. Certain proteins, particularly those with hydrophobic regions or multi-domain structures, demonstrate higher aggregation propensity. In drug development, aggregate analysis is crucial as they may increase immunogenicity risk [58].
Optimization Guidelines
Quantitative Loading Parameters
Table 1: Protein Load Recommendations Based on Application and Detection Method
| Application Context | Recommended Load | Gel Percentage | Key Considerations |
|---|---|---|---|
| Purified Protein Analysis (Coomassie) | 0.1 µg - 1.0 µg per band [57] | 8-20% depending on protein size [60] | Higher purity allows lower detection limits |
| Complex Lysate Analysis (Coomassie) | Up to 10 µg total protein [60] | 4-20% gradient recommended [60] | Multiple bands require higher total load |
| Western Blot Pre-analysis | 2-20 µg total protein | 8-12% typically used | Transfer efficiency affects required load |
| Silver Staining Detection | As low as 2 ng per band [57] | Optimized for protein size range | Linear dynamic range less than Coomassie |
Gel Percentage Selection Based on Protein Size
Table 2: Gel Percentage Guidelines for Optimal Separation Efficiency
| Target Protein Size Range | Recommended Gel Percentage | Separation Characteristics |
|---|---|---|
| 100-500 kDa | 4-8% gels [60] | Larger pores facilitate big protein migration |
| 10-200 kDa | 4-20% gradient gels [60] | Broad range resolution ideal for unknowns |
| 15-100 kDa | 10% gels [7] | Standard workhorse for most applications |
| 25-200 kDa | 8% gels [7] | Optimal for larger proteins |
| < 30 kDa | 12-20% gels | Enhanced resolution of small proteins |
Gradient gels provide superior resolution across a wide molecular weight range as they create a pore size gradient that sharpens protein bands during migration [7]. For proteins smaller than 15 kDa, special consideration is needed as they may migrate with the dye front or exhibit anomalous migration.
Experimental Protocols
Sample Preparation for SDS-PAGE
Materials Required:
- Protein sample
- Loading buffer (2X or 4X concentration) [61]
- Reducing agent (β-mercaptoethanol or DTT)
- Heating block or water bath
- Microcentrifuge tubes
Procedure:
- Sample Dilution: Dilute protein sample in appropriate buffer. For initial experiments, prepare multiple dilutions (e.g., 1:1, 1:2, 1:5) to identify optimal loading concentration.
- Buffer Preparation: Combine protein sample with loading buffer. For 2X loading buffer, use 1:1 ratio (v/v) of sample to buffer [61]. For 4X loading buffer, use 3:1 ratio (v/v) of sample to buffer [61].
- Reducing Agent Addition: Add β-mercaptoethanol to a final concentration of 0.55M (e.g., 1 μL stock BME per 25 μL lysate) [60]. Alternative: Use dithiothreitol (DTT) at 50-100 mM final concentration.
- Denaturation: Heat samples at 95°C for 5 minutes in a heating block or water bath [60] [14].
- Clarification: Centrifuge heated samples at 12,000g for 30 seconds to pellet insoluble debris [14].
- Loading: Load 5-35 μL per lane depending on protein concentration and well size [60].
Critical Considerations:
- For samples containing KCl or other salts that may cause SDS precipitation, dilute samples or perform methanol precipitation before resuspension in 1X sample buffer [57].
- If sample buffer turns yellow, pH is incorrect. Add NaOH or Tris base to return to blue color [57].
- Do not store loading buffer with β-mercaptoethanol for more than two weeks as reducing capacity diminishes [61].
Pilot Experiment for Load Optimization
Objective: Determine optimal protein load for a new protein sample or system.
Materials:
- Protein sample of unknown concentration
- BCA or Bradford protein assay reagents
- Molecular weight standards
- SDS-PAGE gel appropriate for expected protein size
- Staining and destaining solutions
Procedure:
- Protein Quantification: Determine approximate protein concentration using colorimetric assay (e.g., BCA method) [62].
- Sample Series Preparation: Prepare a dilution series covering a wide concentration range (e.g., 0.5, 1, 2, 5, 10, 20, 40 μg total protein).
- Electrophoresis: Run samples alongside molecular weight standards.
- Visualization and Analysis: Stain gel and evaluate:
- Band sharpness and resolution
- Presence of smearing or aggregation at the top of the gel
- Linearity of band intensity with load
- Saturation of staining for abundant proteins
Interpretation: Identify the load that provides clear, sharp bands without evidence of overloading (smearing, distorted band morphology) or underloading (faint, undetectable bands).
Advanced Applications and Troubleshooting
The Scientist's Toolkit: Essential Research Reagents
Table 3: Key Reagents for SDS-PAGE Optimization and Aggregate Analysis
| Reagent/Equipment | Function in SDS-PAGE | Application Notes |
|---|---|---|
| SDS (Sodium Dodecyl Sulfate) | Denatures proteins and imparts uniform negative charge [7] [59] | Critical for mass-based separation; binding ratio ~1.4g SDS/g protein [57] [59] |
| β-mercaptoethanol or DTT | Reducing agent breaks disulfide bonds [60] [59] | Essential for complete denaturation; final concentration 0.55M for BME [60] |
| Polyacrylamide Gel | Sieving matrix separates proteins by size [59] | Pore size controlled by acrylamide concentration [7] |
| Tris-Glycine Buffer | Running buffer maintains pH and conductivity [60] [59] | Standard discontinuous system enhances band sharpness [57] |
| Coomassie Brilliant Blue | Protein stain for visualization [14] | Detection limit ~0.1 µg; compatible with mass spectrometry [7] [57] |
| Silver Stain | High-sensitivity protein detection [7] | Detection limit ~2 ng; greater sensitivity than Coomassie [57] |
| Molecular Weight Standards | Reference for size determination [60] [59] | Essential for molecular weight estimation |
Troubleshooting Common Issues
Problem: Smiling or Frowning Bands
- Cause: Uneven heating across gel, improper buffer composition, or uneven current distribution [7]
- Solution: Ensure uniform buffer levels in both chambers, check power supply connections, and avoid excessive voltage
Problem: Protein Aggregation at Gel Top
- Cause: Insufficient denaturation, protein overload, or presence of insoluble material
- Solution: Increase heating time to 5-10 minutes at 95°C, add fresh reducing agent, centrifuge samples before loading, and consider urea or higher SDS concentration
Problem: High Background Staining
- Cause: Incomplete destaining or protein overload
- Solution: Increase destaining time with multiple changes of destain solution, ensure proper gel fixation before staining, and reduce protein load
Problem: Anomalous Migration
- Cause: Some proteins (e.g., tubulin) do not bind SDS at standard ratio [57]
- Solution: Compare multiple gel percentages, check buffer pH, and consider alternative detergents for problematic proteins
Complementary Techniques for Aggregate Analysis
While SDS-PAGE detects SDS-soluble aggregates, orthogonal techniques are necessary for comprehensive aggregate characterization [58] [63]:
- Dynamic Light Scattering (DLS): Measures hydrodynamic size distribution in solution without separation [58] [63]
- Analytical Ultracentrifugation (AUC): Provides high-resolution size distribution under minimal perturbation [58] [63]
- Size Exclusion Chromatography (SEC): Separates aggregates from monomers under native conditions
Optimizing protein load in SDS-PAGE represents a critical methodological foundation for accurate molecular weight determination and protein characterization. By implementing the quantitative guidelines and systematic approaches outlined in this Application Note, researchers can avoid the common pitfalls of overloading and aggregation that compromise data quality. The provided protocols enable evidence-based determination of optimal loading conditions tailored to specific experimental requirements, while troubleshooting guidance addresses frequently encountered challenges. For drug development professionals, these optimized methodologies are particularly valuable for characterizing therapeutic proteins where aggregation assessment carries direct implications for product quality and safety. Through careful attention to protein load parameters and appropriate use of complementary analytical techniques, SDS-PAGE remains an indispensable tool for molecular weight determination research.
Ensuring Complete Gel Polymerization and Using Fresh Buffers
In molecular weight determination research, the integrity of the SDS-PAGE (sodium dodecyl sulfate–polyacrylamide gel electrophoresis) process fundamentally relies on two critical pillars: complete gel polymerization and the use of properly formulated fresh buffers. SDS-PAGE serves as a cornerstone method for protein separation by molecular mass, with applications spanning from basic research to drug development [31]. The discontinuous electrophoretic system developed by Laemmli separates proteins with molecular masses between 5 and 250 kDa by combining SDS—which masks proteins' intrinsic charge and confers similar charge-to-mass ratios—with a polyacrylamide gel matrix that serves as a molecular sieve [31]. The successful execution of this technique depends profoundly on precise gel formation and buffer composition, factors that directly impact protein separation efficiency, band resolution, and analytical reproducibility.
A comprehensive understanding of gel polymerization chemistry and buffer management constitutes an essential component of the researcher's toolkit. Incomplete polymerization or degraded buffers manifest in numerous operational failures including poor band resolution, distorted migration patterns, and compromised molecular weight determinations. This application note delineates detailed methodologies for ensuring complete gel polymerization, establishes protocols for buffer preparation and storage, and provides troubleshooting frameworks for common artifacts encountered in SDS-PAGE workflows for molecular weight analysis.
The Chemistry of Gel Polymerization
Polyacrylamide Gel Formation Mechanism
Polyacrylamide gel formation occurs through a free radical-initiated vinyl addition polymerization reaction [64]. This process fundamentally differs from the gellation mechanism of agarose matrices, which form through non-covalent hydrogen bonding and electrostatic interactions [64]. The polyacrylamide polymerization reaction requires three essential components: acrylamide monomers that form the polymer backbone, bis-acrylamide (N,N'-methylenebisacrylamide) that crosslinks polymer chains to create a porous matrix, and an initiation system typically composed of ammonium persulfate (APS) as the radical source and tetramethylethylenediamine (TEMED) as the catalyst [31].
The initiation system functions synergistically: TEMED induces free radical formation from APS, and these free radicals subsequently transfer electrons to the acrylamide and bis-acrylamide monomers, radicalizing them and initiating chain propagation [64]. As polymerization proceeds, the growing polymer chains become cross-linked by bis-acrylamide molecules, forming the three-dimensional network whose pore size determines the sieving properties of the final gel [64] [31]. The porosity and thus separation characteristics of the gel can be precisely controlled by varying the ratio of acrylamide to bis-acrylamide, with higher crosslinking densities creating smaller pores suitable for separating lower molecular weight proteins [31].
Optimizing Polymerization Conditions
Table 1: Critical Factors for Complete Gel Polymerization
| Factor | Optimal Condition | Effect on Polymerization | Troubleshooting |
|---|---|---|---|
| TEMED Concentration | Appropriate for gel thickness and acrylamide % | Catalyzes radical formation; insufficient TEMED causes slow or incomplete polymerization | Use fresh TEMED; increase concentration for high % gels |
| Ammonium Persulfate (APS) | Freshly prepared or properly stored | Radical initiator; degraded APS results in failed polymerization | Aliquot and store at -20°C; use within 1 month at 4°C [65] |
| Oxygen Exposure | Minimal during pouring and setting | Oxygen inhibits polymerization by scavenging free radicals | Overlay with isopropanol or water-saturated butanol [31] |
| Temperature | Room temperature (20-25°C) | Affects polymerization rate; cold temperatures significantly slow the process | Pre-warm solutions in cold lab environments |
| Acrylamide Quality | Fresh, uncontaminated solution | Aged or contaminated acrylamide may not polymerize properly | Filter discolored solutions; prepare fresh stock solutions regularly |
Complete polymerization requires careful attention to these parameters. The exclusion of oxygen proves particularly critical, as oxygen molecules act as free radical scavengers that terminate the polymerization reaction [31]. The standard practice of overlaying the gel solution with water-saturated butanol or isopropanol serves not only to create a flat meniscus but also to create a barrier against atmospheric oxygen [65] [31]. Isopropanol in particular provides superior oxygen exclusion compared to water, potentially resulting in faster and more complete polymerization [65].
Practical Protocols for Gel Preparation and Polymerization
Gel Casting and Polymerization Workflow
Step-by-Step Gel Preparation Protocol
Assemble Glass Plates: Clean glass plates thoroughly and assemble with spacers (typically 0.75 mm or 1.5 mm thickness) in a casting stand that temporarily seals the underside of the cassette [31].
Prepare Separating Gel Solution: For a standard 10% separating gel, mix the following components in the order listed:
- 3.3 mL of 30% acrylamide/bis-acrylamide solution (29:1 ratio)
- 2.5 mL of 1.5 M Tris-HCl (pH 8.8)
- 4.1 mL deionized water
- 100 µL of 10% SDS solution [31]
Initiate Polymerization: Add 50 µL of 10% ammonium persulfate (freshly prepared or properly stored) and 5 µL of TEMED. Mix gently by swirling to avoid introducing air bubbles [31].
Cast the Separating Gel: Immediately pipette the solution between the glass plates, leaving appropriate space for the stacking gel (approximately 1 cm below the bottom of the comb teeth).
Overlay with Isopropanol: Carefully overlay the gel solution with isopropanol or water-saturated butanol to exclude oxygen and create a flat meniscus [65] [31].
Polymerize: Allow complete polymerization for 30-60 minutes at room temperature. A distinct refractive interface will appear between the polymerized gel and the overlay solution when polymerization is complete.
Prepare and Cast Stacking Gel: After discarding the overlay and rinsing with deionized water, prepare the stacking gel solution (typically 4-5% acrylamide):
- 830 µL of 30% acrylamide/bis-acrylamide solution
- 630 µL of 0.5 M Tris-HCl (pH 6.8)
- 3.4 mL deionized water
- 50 µL of 10% SDS solution Add 25 µL of 10% APS and 5 µL TEMED, mix, and pour over the polymerized separating gel.
Insert Comb: Immediately insert a clean comb without introducing air bubbles. Allow 30 minutes for complete polymerization of the stacking gel.
Final Preparation: Gently remove the comb and rinse wells with 1X SDS running buffer to remove unpolymerized acrylamide and well debris [12].
Gel Storage Considerations
Pre-cast gels can be stored for extended periods when properly maintained. Commercial pre-cast gels such as Novex Tris-Glycine gels typically have a shelf life of 4-8 weeks when stored at 4°C [12]. For laboratory-poured gels, storage for up to two weeks at 4°C is possible when gels are wrapped in moist paper towels and sealed in plastic bags or containers to prevent dehydration [65]. Gels should never be frozen, as freezing destroys the gel matrix [12].
Buffer Preparation, Storage, and Management
Critical Buffer Components and Functions
Table 2: SDS-PAGE Buffer System Components and Storage Guidelines
| Buffer Component | Function | Preparation | Storage Conditions & Stability |
|---|---|---|---|
| Tris-Glycine SDS Running Buffer | Provides electrolytes for current conduction; maintains pH ~8.3 during electrophoresis [12] | 25 mM Tris, 192 mM glycine, 0.1% SDS, pH 8.3 [12] [31] | Stable at room temperature; can be reused 2-3 times with proper labeling [65] |
| Tris-Glycine SDS Sample Buffer | Denatures proteins; provides SDS coating and tracking dye [12] | 62.5 mM Tris-HCl, pH 6.8, 2% SDS, 10% glycerol, 0.01% bromophenol blue [12] | Stable for months at room temperature; add reducing agents freshly |
| Reducing Agents (DTT, β-mercaptoethanol) | Cleaves disulfide bonds for complete protein unfolding [12] [31] | DTT: 10-100 mM; β-ME: 2.5-5% [12] [31] | DTT aliquots stable at -20°C; add immediately before use to prevent reoxidation |
| Ammonium Persulfate (APS) | Free radical initiator for gel polymerization [31] | 10% solution in deionized water [65] | Aliquots stable at -20°C for long-term; 4°C for ~1 month [65] |
| Separating Gel Buffer | Creates pH 8.8 environment for protein separation [31] | 1.5 M Tris-HCl, pH 8.8, 0.4% SDS [31] | Stable for months at 4°C; filter if precipitate forms |
| Stacking Gel Buffer | Creates pH 6.8 environment for sample stacking [31] | 0.5 M Tris-HCl, pH 6.8, 0.4% SDS [31] | Stable for months at 4°C; filter if precipitate forms |
Buffer Preparation and Quality Control
The discontinuous buffer system is fundamental to SDS-PAGE operation, relying on the differential mobility of leading chloride ions and trailing glycine ions in pH gradients to concentrate proteins into sharp bands before separation [31]. Proper preparation and maintenance of these buffers directly impact electrophoretic performance:
Running Buffer Preparation: For 1X Tris-glycine SDS running buffer, dilute 100 mL of 10X concentrate to 1000 mL with deionized water [12]. Verify pH is approximately 8.3. Inadequate buffer ionic strength, indicated by unusually fast migration rates, necessitates fresh preparation [66].
Sample Buffer Management: Prepare samples using 2X Tris-glycine SDS sample buffer diluted 1:1 with protein solution [12]. For reduced samples, add DTT to 1X final concentration (from 10X stock) immediately before heating at 85°C for 2 minutes [12]. Avoid heating at 100°C, which can promote proteolysis [12].
Buffer Reuse Policy: When reusing running buffer, implement a tracking system with marked stripes on containers to monitor usage cycles [65]. Discard buffer if discoloration, precipitation, or unusual migration patterns occur.
Troubleshooting Common Polymerization and Buffer Issues
Problem Diagnosis and Resolution Workflow
Specific Troubleshooting Guidelines
Smeared Bands: Vertical smearing or diffuse bands often results from excessive voltage during electrophoresis [66]. Implement lower voltage (10-15 volts per cm of gel length) for extended run times to improve band sharpness [66]. Additionally, verify that samples were properly heated (85°C for 2 minutes) and centrifuged before loading to remove insoluble material [12].
Smiling Bands (Upward Curving): This phenomenon occurs when excessive heat generation during electrophoresis causes uneven gel expansion [66]. Mitigation strategies include running gels in a cold room, using ice packs in the buffer chambers, or reducing voltage for longer run times [66].
Poor Band Resolution: Inadequate separation between protein bands can stem from multiple factors:
- Insufficient run time: Continue electrophoresis until the bromophenol blue tracking dye approaches approximately 1 cm from the gel bottom [66]
- Improper acrylamide concentration: Use lower percentage gels for high molecular weight proteins and higher percentages for better resolution of low molecular weight proteins [66]
- Buffer degradation: Remake running buffer if ion concentration is suboptimal, as improper conductivity affects migration [66]
Edge Effects: Distorted bands in peripheral lanes result from the "edge effect" when outer wells are left empty [66]. Always load protein ladder or control samples in outer wells rather than leaving them empty [66].
Sample Diffusion from Wells: If samples migrate out of wells before electrophoresis begins, this indicates excessive delay between loading and applying current [66]. Minimize the interval between loading the first sample and initiating electrophoresis, and load samples quickly when processing multiple gels [66].
The Scientist's Toolkit: Essential Research Reagent Solutions
Table 3: Essential Reagents for SDS-PAGE Molecular Weight Determination
| Reagent/Chemical | Critical Function | Usage Notes & Quality Control |
|---|---|---|
| Acrylamide/Bis-acrylamide | Forms the porous gel matrix for molecular sieving [31] | Standard ratio 29:1 or 37.5:1; filter if discolored; prepare fresh solutions periodically |
| Ammonium Persulfate (APS) | Free radical initiator for polymerization reaction [31] | Use 10% solution; aliquot and freeze at -20°C for long-term storage; stable 1 month at 4°C [65] |
| TEMED | Catalyzes radical formation from APS [31] | Use at room temperature; tightly sealed to prevent amine group degradation |
| SDS (Sodium Dodecyl Sulfate) | Denatures proteins and confers negative charge [31] | Use high-purity grade; concentration critical (0.1-0.5% in gels, 0.1% in running buffer) [31] |
| Tris Buffer | Maintains pH in both stacking and separating gels [12] [31] | High-purity Tris base; check pH carefully (6.8 for stacking, 8.8 for separating gel) |
| Glycine | Trailing ion in discontinuous buffer system [12] [31] | Electrophoresis grade; essential for stacking effect in Laemmli system |
| DTT or β-mercaptoethanol | Reducing agents for disulfide bond cleavage [12] [31] | DTT preferred for less odor; add fresh before use; avoid long-term storage of reduced samples [12] |
| Protein Molecular Weight Markers | Reference standards for molecular weight estimation [31] | Include both colored and visible markers; store aliquoted at -20°C; avoid repeated freeze-thaw cycles |
Robust and reproducible molecular weight determination via SDS-PAGE demands scrupulous attention to both gel polymerization chemistry and buffer management. The methodologies detailed in this application note provide researchers with a comprehensive framework for optimizing these critical parameters. Through implementation of standardized polymerization protocols, rigorous buffer preparation and storage practices, and systematic troubleshooting approaches, laboratories can achieve consistently high-quality protein separations with reliable molecular weight estimations. These foundational techniques support the broader research objectives in drug development and protein characterization by ensuring the reliability of one of molecular biology's most fundamental analytical tools.
Within the framework of thesis research focused on precise molecular weight determination via SDS-PAGE, the optimization of gel matrix properties is paramount. This application note details the critical role of the acrylamide-to-bisacrylamide crosslinker ratio in controlling polyacrylamide gel pore size, directly impacting separation resolution and accuracy. We provide a structured, quantitative overview of standard and optimized crosslinker formulations, alongside detailed protocols for their preparation and evaluation. These guidelines are designed to empower researchers, particularly in pharmaceutical development, to fine-tune electrophoretic conditions for superior protein characterization, ensuring reliable molecular weight data for critical downstream analyses.
Sodium dodecyl sulfate-polyacrylamide gel electrophoresis (SDS-PAGE) is the cornerstone technique for determining protein molecular weight (Mr) [11] [67]. The principle relies on the sieving properties of the polyacrylamide gel matrix, through which SDS-denatured, linearized proteins migrate at rates inversely proportional to the logarithm of their Mr [68]. The porosity of this matrix is not determined by the total acrylamide concentration alone; it is critically governed by the ratio of acrylamide monomer to the crosslinking agent, N,N'-methylenebisacrylamide (bisacrylamide) [11] [67].
Bisacrylamide links polyacrylamide chains, forming a three-dimensional network. The density and architecture of this network define the effective pore size of the gel [68]. An optimal pore size range is crucial for high-resolution separation, a factor especially significant for membrane proteins—which comprise over 20% of the human genome and the majority of drug targets—as their anomalous migration on SDS-PAGE can confound identification [69]. Fine-tuning the crosslinker ratio allows researchers to adjust this porosity, thereby optimizing the separation for specific Mr ranges and enhancing the reliability of molecular weight determination in research.
Quantitative Data: Crosslinker Ratios and Their Effects
The following tables summarize standard and specialized crosslinker ratios used in polyacrylamide gel electrophoresis.
Table 1: Standard Crosslinker Ratios for Common SDS-PAGE Applications
| Application / Gel Type | Typical Acrylamide:Bisacrylamide Ratio | Key Characteristics and Purpose |
|---|---|---|
| Standard Protein Separation | 37.5:1 (e.g., 29:1 or 19:1 mixes available) [70] | A common starting point, providing a robust gel matrix suitable for a wide range of protein sizes. |
| General Gel Formulation | ~35:1 [68] | A standard ratio that offers a balance between gel integrity and appropriate pore size for routine analyses. |
Table 2: Impact of Crosslinker Ratio on Gel Properties
| Crosslinker Proportion | Impact on Gel Matrix Pore Size | Effect on Protein Separation & Gel Handling |
|---|---|---|
| High Bisacrylamide (Higher crosslinker proportion) | Forms a denser, tighter mesh with smaller average pore size [11]. | Improved resolution of low molecular weight proteins; gel may become more brittle [11]. |
| Low Bisacrylamide (Lower crosslinker proportion) | Forms a looser mesh with larger average pore size [11]. | Better separation of high molecular weight proteins; gel may be more fragile and sticky [11]. |
Experimental Protocols
Protocol: Optimizing Crosslinker Ratio for Specific Molecular Weight Ranges
This protocol guides the systematic evaluation of different crosslinker ratios to achieve optimal resolution for a target protein or Mr range.
I. Research Reagent Solutions & Essential Materials
Table 3: Key Reagents for Gel Optimization Experiments
| Reagent / Material | Function | Notes for Optimization |
|---|---|---|
| Acrylamide Monomer | Forms the backbone polymer of the gel matrix. | Use high-purity, electrophoretic grade. |
| Bisacrylamide (N,N'-methylenebisacrylamide) | Crosslinking agent that defines gel pore architecture. | The key variable for optimization. |
| Ammonium Persulfate (APS) | Initiator of the free-radical polymerization reaction. | Prepare a fresh 10% (w/v) solution in water. |
| TEMED (N,N,N',N'-Tetramethylethylenediamine) | Catalyst that accelerates the polymerization reaction. | Add last; quantity and freshness control gelation time. |
| Tris Buffer | Standard buffer for Laemmli SDS-PAGE systems [12]. | Resolving gel: pH 8.8; Stacking gel: pH 6.8 [68] [67]. |
| SDS (Sodium Dodecyl Sulfate) | Denaturing agent that confers uniform negative charge to proteins [68] [67]. | Include in resolving gel, stacking gel, and running buffer for SDS-PAGE. |
| Protein Molecular Weight Marker | Standard for estimating apparent molecular weight and assessing resolution. | Should span the Mr range of interest, including your target proteins. |
II. Procedure
- Formulate Gel Solutions: Prepare resolving gel solutions with identical total acrylamide percentage (%T) but varying acrylamide-to-bisacrylamide ratios (e.g., 29:1, 37.5:1, 49:1). Keep all other components (Tris, SDS, water) constant.
- Catalyze and Cast Gels: To each solution, add APS and TEMED to initiate polymerization. Pour the gels immediately between glass plates, overlay with isopropanol or water for a flat surface, and allow to polymerize completely [68].
- Prepare Stacking Gel: After resolving gel polymerization, pour a standard stacking gel (e.g., 4% T, 29:1 ratio) on top of each resolving gel and insert a comb.
- Sample Preparation and Loading: Prepare protein samples and molecular weight markers by heating at 85-100°C for 2-5 minutes in SDS sample buffer containing a reducing agent like DTT [12] [67]. Load equal amounts of protein and markers into the wells of each gel.
- Electrophoresis: Run the gels in 1X Tris-Glycine-SDS running buffer at constant voltage (e.g., 125 V for mini-gels) until the dye front reaches the bottom [12].
- Visualization and Analysis: Stain gels with Coomassie Blue or a similar stain. For faint bands, a post-staining treatment with alcohols (e.g., 60-100% ethanol) can reversibly enhance contrast by up to 500% for improved analysis [71]. Analyze the sharpness, separation, and migration of bands in the different gels to identify the optimal ratio.
Workflow: From Hypothesis to Optimized Gel Formulation
The following diagram outlines the logical workflow for designing a crosslinker optimization experiment.
The Scientist's Toolkit: Key Reagent Solutions
Table 4: Essential Reagents for Crosslinker Ratio Studies
| Reagent / Material | Primary Function | Optimization Considerations |
|---|---|---|
| Acrylamide & Bisacrylamide Stock | Pre-mixed solutions (e.g., 40% with specified ratio) provide consistency. | Using a stock solution ensures accurate and reproducible ratios between experiments. |
| Tris-Glycine-SDS Running Buffer | Conducts current and maintains pH for protein migration [12]. | The discontinuous buffer system (stacking/resolving gel) is key for sharp band formation [67]. |
| Reducing Agent (DTT or BME) | Cleaves disulfide bonds to fully denature proteins into subunits [68]. | Critical for accurate Mr determination; add fresh before heating samples [12]. |
| Protein Stain (e.g., Coomassie) | Visualizes separated protein bands post-electrophoresis. | For faint bands, alcohol treatment can shrink the gel and increase contrast up to 534% [71]. |
Fine-tuning the acrylamide-to-bisacrylamide crosslinker ratio is a powerful, yet often overlooked, strategy for advanced SDS-PAGE optimization. Moving beyond standardized "one-size-fits-all" formulations allows researchers to engineer gel matrices with pore sizes specifically tailored to their target proteins. This is particularly vital for proteins known to migrate anomalously, such as helical membrane proteins, where gel concentration (and by extension, pore size) has been shown to dictate the direction and magnitude of migration shifts [69].
The protocols and data provided herein establish a clear framework for systematically exploring crosslinker chemistry. By adopting this approach, scientists in basic research and drug development can significantly enhance the resolution and accuracy of molecular weight determinations. This level of precision strengthens downstream analyses, from western blot identification to the preparatory stages of mass spectrometry, ultimately contributing to more reliable and reproducible protein characterization.
Validating Your Results and Comparing SDS-PAGE with Orthogonal Techniques
Within the framework of thesis research focusing on the SDS-PAGE protocol for molecular weight determination, the rigorous validation of the analytical method is paramount. The reliability of experimental data, crucial for downstream conclusions in drug development and basic research, hinges on establishing that the SDS-PAGE method is fit for its intended purpose [72] [73]. This application note provides detailed protocols and assessment criteria for evaluating four key performance characteristics of the SDS-PAGE method: Specificity, Linearity, Precision, and Robustness. By systematically validating these parameters, researchers and scientists can ensure the generation of accurate, reproducible, and reliable protein molecular weight data.
Specificity in SDS-PAGE Analysis
Principle and Assessment
Specificity is the ability of an analytical method to unequivocally assess the analyte of interest in the presence of other components that may be expected to be present in the sample matrix [72] [74]. In the context of SDS-PAGE for molecular weight determination, specificity ensures that the observed protein band corresponds solely to the target protein and is free from interference by impurities, degradation products, or components of the sample buffer.
The primary approach for demonstrating specificity in SDS-PAGE involves the analysis of a blank sample matrix and comparing its profile to that of the sample containing the target protein [74]. A specific method will show no signal in the blank at the migration position of the target protein, while a clear, sharp band is visible in the sample lane.
Experimental Protocol for Specificity Testing
Materials:
- Purified protein sample of interest
- Sample buffer (Laemmli buffer): 62.5 mM Tris-HCl, pH 6.8, 2% SDS, 10% glycerol, 0.01% bromophenol blue [6]
- Reducing agent: 5% β-mercaptoethanol or 100 mM DTT (freshly added) [75]
- Sample matrix without the target protein (e.g., lysis buffer, formulation buffer)
Procedure:
- Prepare Samples:
- Test Sample: Mix a known amount of the purified protein (e.g., 5 µg) with an equal volume of 2x Laemmli buffer containing reducing agent.
- Blank Matrix: Mix the sample matrix (without the target protein) with an equal volume of 2x Laemmli buffer containing reducing agent.
- Denature: Heat both samples at 95°C for 5 minutes to ensure complete denaturation [6].
- Centrifuge: Cool samples on ice and then centrifuge at 14,000-16,000 g for 1 minute to pellet any insoluble material [76].
- Electrophoresis: Load the supernatant of both samples into separate wells of a polyacrylamide gel. Include a molecular weight marker in an adjacent well.
- Run Gel: Perform electrophoresis using standard conditions (e.g., 80V through stacking gel, 120V through separating gel) until the dye front reaches the bottom [6].
- Stain and Destain: Visualize proteins using Coomassie Brilliant Blue or silver staining [6].
Acceptance Criterion: The blank matrix lane should show no detectable protein bands at the migration position corresponding to the target protein. The target protein lane should display a single, sharp band without significant smearing or trailing, indicating no interference from the matrix and minimal degradation [74].
Linearity and Range for Molecular Weight Calibration
Principle and Assessment
Linearity refers to the ability of an analytical procedure to produce test results that are directly proportional to the concentration of the analyte within a given range [73] [74]. In SDS-PAGE, the principle of linearity is applied indirectly for molecular weight determination. A linear relationship is established between the logarithm of the molecular weight (Log MW) of standard proteins and their relative mobility (Rf) in the gel. The range is the interval of molecular weights over which this linear relationship holds with acceptable accuracy and precision [73].
The linearity of the molecular weight calibration curve is typically assessed by analyzing a set of standard proteins with known molecular weights, spanning the intended range of the method. A linear regression analysis is performed on the Log MW versus Rf data.
Experimental Protocol for Linearity and Range Assessment
Materials:
- Prestained or unstained protein molecular weight marker, covering the desired range (e.g., 10-250 kDa) [77]
- SDS-PAGE gel with an appropriate acrylamide concentration for the target size range (see Table 1) [77]
- Standard electrophoresis reagents
Procedure:
- Gel Preparation: Cast and polymerize an SDS-PAGE gel with a separating gel concentration appropriate for the protein size range under investigation (see Table 1).
- Sample Preparation: Prepare the molecular weight marker according to the manufacturer's instructions. Typically, this involves mixing with sample buffer and heating.
- Electrophoresis: Load the molecular weight marker and run the gel under standard conditions.
- Staining and Destaining: If an unstained marker is used, stain the gel with Coomassie Blue or a more sensitive stain to visualize the protein bands [6].
- Data Analysis:
- Measure the migration distance of each protein standard from the well to the center of the band.
- Calculate the Relative Front (Rf) for each standard: Rf = Migration distance of protein / Migration distance of dye front.
- Plot the Log10 of the molecular weight of each standard against its Rf value.
- Perform a linear regression analysis to obtain the equation of the calibration line and the coefficient of determination (R²).
Table 1: Recommended Acrylamide Concentrations for Separating Proteins of Different Sizes [77]
| Protein Size (kDa) | Percentage Acrylamide/Bisacrylamide in Gel |
|---|---|
| < 25 | 15% |
| 25 - 50 | 12% |
| 50 - 100 | 10% |
| > 100 | 8% |
Table 2: Example Data for Molecular Weight Standard Curve Generation
| Protein Standard | Molecular Weight (kDa) | Log (MW) | Migration Distance (cm) | Rf |
|---|---|---|---|---|
| 1 | 250 | 2.40 | 2.1 | 0.35 |
| 2 | 100 | 2.00 | 3.5 | 0.58 |
| 3 | 75 | 1.88 | 4.2 | 0.70 |
| 4 | 50 | 1.70 | 5.1 | 0.85 |
| 5 | 25 | 1.40 | 5.7 | 0.95 |
Acceptance Criterion: The calibration curve should demonstrate a linear relationship with a coefficient of determination (R²) typically greater than 0.95-0.98 over the specified molecular weight range [73]. The range is validated if the accuracy and precision of molecular weight estimation for unknown proteins within this range meet pre-defined limits (e.g., ±10% of the expected molecular weight).
Precision of SDS-PAGE Migration
Principle and Assessment
Precision expresses the closeness of agreement between a series of measurements obtained from multiple sampling of the same homogeneous sample under prescribed conditions [73]. It is usually expressed as standard deviation (SD) or relative standard deviation (RSD, also known as coefficient of variation). For SDS-PAGE molecular weight determination, precision is assessed at different levels:
- Repeatability: Precision under the same operating conditions over a short interval of time (intra-assay precision) [73].
- Intermediate Precision: Precision within the same laboratory, accounting for variations like different analysts, different days, or different equipment (inter-assay precision) [73].
Experimental Protocol for Precision Testing
Materials:
- A homogeneous purified protein sample or a standardized protein mixture
- SDS-PAGE reagents and gels
- Molecular weight markers
Procedure for Repeatability:
- Sample Replication: Prepare a single, homogeneous protein sample. Denature an aliquot as described in Section 2.2.
- Intra-gel Run: Load the same amount (e.g., 10 µg) of this denatured sample into six separate wells of the same SDS-PAGE gel [73].
- Electrophoresis: Run the gel, stain, and destain.
- Data Analysis:
- Measure the migration distance for the protein band in each of the six lanes.
- Calculate the Rf for each replicate.
- Use the calibration curve (from Section 3.2) to estimate the molecular weight for each replicate.
- Calculate the mean, standard deviation (SD), and relative standard deviation (RSD) of the six molecular weight estimates.
Procedure for Intermediate Precision:
- Inter-gel/Different Analyst: Repeat the entire "Repeatability" experiment on three different days, using reagents prepared independently, and if possible, with two different analysts.
- Inter-gel/Same Analyst: Alternatively, a single analyst can run the same homogeneous sample across three different gels on the same day.
- Data Analysis:
- For each run (e.g., three runs with six replicates each), calculate the mean molecular weight estimate.
- Calculate the overall mean, SD, and RSD across all runs and replicates (e.g., 18 data points) to assess intermediate precision.
Table 3: Example Data Structure for Precision Assessment
| Precision Level | Run/Analyst | n (replicates) | Mean MW (kDa) | Standard Deviation (SD) | RSD (%) |
|---|---|---|---|---|---|
| Repeatability | Day 1, Analyst A | 6 | 50.2 | 0.5 | 1.0 |
| Intermediate Precision | Day 1, Analyst A | 6 | 50.2 | 0.5 | 1.0 |
| Day 2, Analyst A | 6 | 49.8 | 0.7 | 1.4 | |
| Day 3, Analyst B | 6 | 50.5 | 0.6 | 1.2 | |
| Pooled Data | All Runs | 18 | 50.2 | 0.6 | 1.2 |
Acceptance Criterion: The acceptance criteria for precision are method-dependent. For molecular weight estimation by SDS-PAGE, an RSD of less than 5% for repeatability and less than 10% for intermediate precision is often considered acceptable, though project-specific requirements may dictate stricter limits.
Robustness of the SDS-PAGE Method
Principle and Assessment
Robustness is a measure of a method's capacity to remain unaffected by small, deliberate variations in method parameters [72] [74]. It provides an indication of the method's reliability during normal usage and identifies critical parameters that must be tightly controlled. For SDS-PAGE, factors that may be investigated include gel composition, buffer pH and concentration, SDS concentration, electrophoresis conditions (voltage, time), and sample preparation details (heating time, reducing agent concentration) [72].
Robustness is typically evaluated using an experimental design (e.g., a factorial design) where key parameters are varied around their specified values, and the impact on method performance (e.g., estimated molecular weight, band sharpness) is assessed [72].
Experimental Protocol for Robustness Testing
Materials: Standard SDS-PAGE reagents.
Procedure:
- Identify Factors: Select critical factors to test (e.g., gel concentration, running buffer pH, sample heating time).
- Define Ranges: Set a "high" and "low" level for each factor, bracketing the standard condition (see Table 4 for examples).
- Experimental Design: Use a factorial design to efficiently test the combinations. For example, for three factors, use a 2³ design resulting in 8 experiments, each performed in duplicate.
- Execute Experiments: For each experimental run, prepare and analyze a standardized protein sample (as in Section 4.2).
- Data Analysis: For each experiment, record the estimated molecular weight of the target protein and note any qualitative changes in band appearance (sharpness, smearing). Statistical analysis (e.g., ANOVA) can be used to determine which factors have a significant effect on the results.
Table 4: Example Factors and Levels for SDS-PAGE Robustness Testing
| Factor | Standard Condition | Low Level (-) | High Level (+) |
|---|---|---|---|
| Separating Gel Conc. | 12% | 11.5% | 12.5% |
| Running Buffer pH | 8.3 | 8.1 | 8.5 |
| Sample Heating Time | 5 minutes | 3 minutes | 7 minutes |
| Voltage (Separating Gel) | 120 V | 110 V | 130 V |
Acceptance Criterion: The method is considered robust if small variations in the tested parameters do not cause a significant change in the estimated molecular weight (e.g., within ±10% of the value obtained under standard conditions) and do not lead to a critical loss of band resolution or sharpness [74].
The Scientist's Toolkit: Key Research Reagent Solutions
Table 5: Essential Materials and Reagents for SDS-PAGE Method Validation
| Item | Function/Description |
|---|---|
| Acrylamide/Bis-acrylamide | Forms the polyacrylamide gel matrix. The ratio and concentration determine gel pore size and resolution [78]. Safety Note: Neurotoxic—wear gloves [77]. |
| SDS (Sodium Dodecyl Sulfate) | Anionic detergent that denatures proteins and confers a uniform negative charge, allowing separation based primarily on molecular weight [76] [75]. |
| TEMED & APS | Catalysts (TEMED) and initiator (Ammonium Persulfate) for the free-radical polymerization of acrylamide [78]. |
| Tris Buffers | Provides the required pH for gel polymerization (Tris-HCl, pH 6.8 for stacking gel; pH 8.8 for separating gel) and running buffer (Tris-Glycine, pH ~8.3) [76] [78]. |
| β-Mercaptoethanol or DTT | Reducing agents that break disulfide bonds in proteins, ensuring complete unfolding and denaturation [75]. Safety Note: β-Mercaptoethanol is harmful and has a penetrating smell [77]. |
| Laemmli Sample Buffer | Contains SDS, reducing agent, glycerol (for density), and tracking dye (bromophenol blue) to prepare samples for loading [6]. |
| Molecular Weight Markers | A mixture of proteins of known molecular weights, essential for constructing the calibration curve for molecular weight estimation [77]. |
| Coomassie Brilliant Blue | A dye used for staining proteins in the gel after electrophoresis, allowing visualization [6]. |
Method Validation Workflow and Robustness Assessment
The following diagrams illustrate the logical workflow for method validation and the experimental design for robustness testing.
Method Validation Workflow
Robustness Testing Design
Within the context of molecular weight determination research, the sodium dodecyl sulfate-polyacrylamide gel electrophoresis (SDS-PAGE) protocol has long been a fundamental biochemical assay for analyzing protein purity and apparent molecular weight [14]. This technique separates proteins based on their molecular size through a polyacrylamide gel matrix under the influence of an electric field. However, the evolution of analytical instrumentation has led to the development of capillary electrophoresis-sodium dodecyl sulfate (CE-SDS), which performs a similar separation but within a capillary format, offering significant advancements in automation and reproducibility [79]. This application note provides a detailed comparative analysis of these two techniques, focusing on their operational methodologies, performance characteristics, and applicability in modern biopharmaceutical development, particularly for researchers and drug development professionals engaged in therapeutic protein characterization.
Principles and Mechanisms
SDS-PAGE Protocol Fundamentals
The SDS-PAGE technique operates on the principle that SDS, an anionic detergent, linearizes proteins by disrupting their noncovalent bonds and imparts a uniform negative charge proportional to their molecular mass [14] [80]. This process negates the influence of a protein's intrinsic charge, ensuring that separation during electrophoresis depends solely on molecular size through a sieving polyacrylamide gel matrix. Smaller proteins migrate more rapidly through the gel pores, while larger proteins migrate more slowly, resulting in distinct bands corresponding to different molecular weights [14]. Visualization typically requires post-separation staining with dyes like Coomassie Brilliant Blue, which binds to proteins and makes them visible as blue bands on a clear background [14].
CE-SDS Operational Principles
CE-SDS functions on a similar foundational principle of size-based separation following SDS complexation but utilizes a capillary filled with a replaceable polymer-based sieving matrix instead of a cross-linked gel [79] [80]. Samples are injected into the capillary inlet, often electrokinetically, and separation occurs under a high-voltage electric field. A critical advantage is the direct, real-time detection of separated proteins via UV absorbance near the distal end of the capillary, eliminating the need for staining and destaining procedures required for SDS-PAGE [79] [81]. This provides a quantitative electropherogram output where peaks correspond to protein components based on their migration time [80].
Figure 1: Comparative Workflows of SDS-PAGE and CE-SDS. This diagram illustrates the fundamental procedural differences between the manual-intensive SDS-PAGE protocol and the automated CE-SDS process, highlighting the additional staining and imaging steps required for SDS-PAGE versus the direct detection and automated analysis in CE-SDS.
Methodologies and Experimental Protocols
Detailed SDS-PAGE Protocol
Principle: Analyze protein purity and apparent molecular weight by separation in a polyacrylamide gel matrix based on molecular size following SDS denaturation [14].
Materials: Reagents: 30% Acrylamide, 1.5 M Tris-HCl (pH 8.8), 1 M Tris-HCl (pH 6.8), 10% SDS, 10% Ammonium Persulfate, TEMED, Protein Marker, Loading Buffer, Running Buffer, Coomassie Stain Solution, Destain Solution [14]. Instruments and Consumables: Electrophoresis Chamber (glass plates, casting stand, comb), Centrifuge, Water Bath, Power Supply, Gel Documentation Camera System [14].
Procedure:
- Casting the Gel: Assemble glass plates and spacers. Mix resolving gel components (e.g., acrylamide, Tris-HCl pH 8.8, SDS, APS, TEMED) and pour into plates. Overlay with water and allow to polymerize for 30 minutes. Drain water, pour stacking gel (acrylamide, Tris-HCl pH 6.8, SDS, APS, TEMED), insert comb, and polymerize for at least 1 hour [14].
- Sample Preparation: Dilute protein solution with loading buffer. Incubate tubes in boiling water for 10 minutes to denature proteins. Centrifuge at 12,000g for 30 seconds [14].
- Running the Gel: Assemble the cast gel into the electrophoresis chamber filled with running buffer. Load prepared samples into wells. Run gel initially at 90V until dye front enters the resolving gel, then increase to 150V until the dye front reaches the bottom [14].
- Staining and Destaining: Remove gel from apparatus and place into incubation plate. Submerge in Coomassie stain solution for 15 minutes with gentle shaking. Pour off stain, add destain solution, and destain with gentle shaking until background is clear and protein bands are visible [14].
- Analysis: Illuminate and photograph the gel using a white light transilluminator and gel documentation system. Use software to estimate molecular weight by comparing band migration distances to a protein marker [14].
Detailed CE-SDS Protocol
Principle: Perform quantitative, high-resolution separation of SDS-denatured proteins based on molecular size in a polymer-sieving matrix-filled capillary with direct UV detection [80] [79].
Materials: Reagents: SDS Sample Buffer, Reducing Agent (e.g., β-mercaptoethanol) for reduced analysis, Replaceable Sieving Polymer Matrix, Capillary Conditioning Solutions [79] [80]. Instruments and Consumables: Capillary Electrophoresis System (e.g., Beckman PA800, ProteinSimple Maurice), Bare Fused-Silica or Coated Capillaries, Auto-sampler Vials, Data Processing Software [80] [81].
Procedure:
- Sample Preparation: Dilute antibody/protein sample to 1.0 mg/mL with SDS sample buffer. For reduced analysis, add a reducing agent. For non-reduced analysis, heat samples at 70°C for 3-5 minutes [80] [79].
- System Setup and Injection: Install the capillary cartridge according to the instrument manual. Condition the capillary with sieving matrix. Inject prepared samples electrokinetically (e.g., at 5 kV for 20 seconds) [80].
- Separation and Detection: Apply separation voltage (e.g., 500 V/cm for 35 minutes). Proteins migrate through the capillary filled with SDS-gel buffer. Detect separated proteins in real-time via UV absorbance at 220 nm [80].
- Data Analysis: Software (e.g., 32 Karat) automatically records electropherograms, identifies peaks based on migration time, and calculates relative quantitation (% peak area) for each species [80].
Comparative Data Analysis
Performance and Operational Comparison
Table 1: Direct comparison of key performance metrics and operational characteristics between SDS-PAGE and CE-SDS.
| Aspect | SDS-PAGE | CE-SDS |
|---|---|---|
| Automation Level | Manual process [79] | Highly automated [79] |
| Separation Medium | Polyacrylamide gel [14] | Polymer-based sieving matrix [79] |
| Typical Run Time | Several hours [79] | Minutes to an hour (e.g., 5.5-35 min) [79] [80] |
| Throughput | Lower | Higher [79] |
| Detection Method | Staining (e.g., Coomassie) and imaging [14] | Direct UV absorbance [79] [80] |
| Data Output | Gel image with bands [14] | Electropherogram with peaks [80] |
| Quantitation | Semi-quantitative [79] [14] | Fully quantitative [79] |
| Reproducibility | Variable, dependent on manual steps [79] | High, due to automation and pre-assembled cartridges [79] |
| Sample Consumption | Microliter range | Nanoliter range [82] |
Analytical Capabilities and Data Quality
A direct comparison study analyzing the same IgG antibody sample in normal and heat-stressed states using both techniques revealed significant differences in analytical performance. CE-SDS demonstrated superior resolution and a significantly higher signal-to-noise ratio, allowing for easier identification and quantitation of low-level impurities and degradation species, such as light chains, heavy chains, and non-glycosylated heavy chain (NGHC) fragments [80]. Notably, CE-SDS could readily detect and quantify the NGHC peak, a critical quality attribute for therapeutic antibodies that was not resolved by SDS-PAGE under the tested conditions [80]. The reproducibility of CE-SDS was also excellent, with consistent results across multiple consecutive injections of the same sample [80]. In terms of molecular weight (MW) determination trueness, a comparative study found that the selection of the MW marker was more critical than the platform itself, with deviations exceeding 10% possible depending on the marker used. The trueness (relative to reference MW) for model proteins ranged between 1.00-1.11 for CE-SDS and 0.93-1.03 for SDS-PAGE, indicating comparable performance when experimental conditions are controlled [83].
Table 2: Comparison of key applications and performance in protein characterization, particularly for biologics.
| Parameter | SDS-PAGE | CE-SDS |
|---|---|---|
| Purity Analysis | Yes, semi-quantitative [14] | Yes, quantitative [84] [80] |
| MW Determination | Yes, relative to marker [14] | Yes, relative to marker [83] |
| Trueness (MW) | 0.93 - 1.03 (model proteins) [83] | 1.00 - 1.11 (model proteins) [83] |
| NGHC Quantitation | Not reliably detected [80] | Accurately detected and quantified [81] [80] |
| Fragment Analysis | Possible, but lower resolution [80] | High-resolution separation and quantitation [80] |
| Glycoform Assessment | Limited | Possible with specific treatments [81] |
| PEGylated Protein Analysis | Possible | Effective for monitoring PEGylation efficiency [81] |
| Regulatory Compliance | Accepted | Recognized in USP <129> for mAbs [79] |
Figure 2: Data Output and Information Content Comparison. This diagram contrasts the typical results from SDS-PAGE (a gel image with bands) and CE-SDS (an electropherogram with peaks), emphasizing the superior resolution and quantitation of specific variants like the non-glycosylated heavy chain (NGHC) by CE-SDS.
The Scientist's Toolkit: Essential Research Reagent Solutions
Table 3: Key reagents and materials required for performing SDS-PAGE and CE-SDS analyses.
| Item | Function/Description | Application |
|---|---|---|
| Acrylamide/Bis Solution | Forms the cross-linked polyacrylamide gel matrix for size-based separation. | SDS-PAGE [14] |
| Tris-HCl Buffer | Provides the appropriate pH environment for gel polymerization and electrophoresis running buffer. | SDS-PAGE [14] |
| Coomassie Stain | Anionic dye that binds non-specifically to proteins, enabling visualization after separation. | SDS-PAGE [14] |
| Pre-assembled CE Cartridge | Integrated capillary and polymer matrix for separation, minimizing manual setup and improving reproducibility. | CE-SDS [79] |
| Replaceable Sieving Polymer | Linear polymer matrix in capillary providing the molecular sieving effect for separation; replaceable between runs. | CE-SDS [79] [80] |
| SDS Sample Buffer | Contains SDS to denature proteins and impart uniform charge, and a tracking dye to monitor migration. | SDS-PAGE & CE-SDS [14] [80] |
| Molecular Weight Marker | Pre-stained or unstained proteins of known molecular weights for calibration and apparent MW determination. | SDS-PAGE & CE-SDS [83] [14] |
| Reducing Agent (e.g., DTT) | Breaks disulfide bonds for reduced analysis, separating heavy and light chains of antibodies. | SDS-PAGE & CE-SDS [81] |
The comparative analysis demonstrates that while SDS-PAGE remains a valuable, accessible, and low-cost tool for initial protein characterization, CE-SDS offers transformative advantages for modern biopharmaceutical development. The automation, quantitative data, superior resolution for detecting critical quality attributes (e.g., NGHC), high reproducibility, and regulatory suitability of CE-SDS make it the definitive choice for quality control and in-depth characterization of therapeutic proteins like monoclonal antibodies [79] [80] [84]. For molecular weight determination research, the transition from SDS-PAGE to CE-SDS represents a significant advancement in obtaining reliable, precise, and efficient analytical data to support robust scientific conclusions and regulatory submissions.
Within the framework of SDS-PAGE protocol development for molecular weight determination, this application note details the integration of orthogonal analytical techniques to comprehensively profile the degradation of therapeutic proteins. While SDS-PAGE provides fundamental size-based separation, combining it with Size-Exclusion Ultra-Performance Liquid Chromatography (SE-UPLC) and Liquid Chromatography-Tandem Mass Spectrometry (LC-MS/MS) creates a powerful, multi-tiered characterization workflow [42]. This approach is critical for researchers and drug development professionals who must identify and quantify degradation products, such as fragments and aggregates, and pinpoint specific molecular degradation pathways like deamidation and oxidation [42] [85]. The correlation of data from these orthogonal methods—each based on different separation principles—ensures a robust assessment of biosimilarity and product stability, which is a regulatory requirement for biotherapeutics [86].
The Orthogonal Analytical Workflow
The core principle of this workflow is the use of multiple, complementary techniques to analyze the same stressed samples. Each technique provides a different perspective on degradation, and together they offer a complete picture of protein stability.
Workflow Diagram
The following diagram illustrates the sequential and integrated nature of these orthogonal techniques for comprehensive degradation profiling.
Role of SDS-PAGE in the Workflow
SDS-PAGE serves as the foundational technique in this workflow. It provides an initial, rapid assessment of protein integrity and apparent molecular weight. The procedure involves:
- Sample Preparation: Mixing the protein sample with a loading buffer containing SDS and a reducing agent (e.g., DTT or 2-mercaptoethanol). The SDS denatures the protein and imparts a uniform negative charge, while the reducing agent breaks disulfide bonds [87] [4] [14].
- Gel Electrophoresis: Loading the denatured samples onto a polyacrylamide gel. An electric field is applied, causing proteins to migrate based primarily on their molecular weight [4].
- Analysis: After separation, the gel is stained (e.g., with Coomassie Blue) to visualize protein bands. Changes in banding patterns—such as the appearance of lower molecular weight bands (fragments) or high molecular weight smears (aggregates)—offer a first indication of degradation [14].
However, SDS-PAGE has limitations, including semi-quantitative results and an inability to identify the chemical nature of modifications. This is where SE-UPLC and LC-MS/MS provide critical additional data [42].
Key Orthogonal Techniques & Experimental Protocols
Size-Exclusion UPLC (SE-UPLC)
SE-UPLC separates native proteins based on their hydrodynamic volume in solution, making it ideal for quantifying soluble aggregates and fragments without the denaturing conditions of SDS-PAGE [42].
Experimental Protocol:
- Column: Equilibrate a size-exclusion UPLC column (e.g., BEH SEC column) with a mobile phase compatible with native protein structure (e.g., phosphate buffer).
- Sample Preparation: Dilute stressed and control protein samples to a predetermined concentration (e.g., 1-2 mg/mL) in the mobile phase. Centrifuge to remove any insoluble material.
- Chromatography: Inject the sample and run an isocratic or shallow gradient elution. Monitor the eluent with a UV detector (e.g., 280 nm).
- Data Analysis: Identify peaks corresponding to high molecular weight (HMW) aggregates, the main monomeric species, and low molecular weight (LMW) fragments. Quantify the relative percentage of each species based on peak area [42].
Liquid Chromatography-Tandem Mass Spectrometry (LC-MS/MS)
LC-MS/MS provides unparalleled specificity in identifying and localizing specific chemical modifications on proteins, such as post-translational modifications (PTMs) that result from stress [42] [85].
Experimental Protocol:
- Enzymatic Digestion: Denature, reduce, and alkylate the stressed protein. Digest it into peptides using a sequence-specific protease like trypsin.
- LC Separation: Inject the peptide mixture onto a reversed-phase LC column (e.g., C18) and separate using a gradient of water and acetonitrile, typically with formic acid as an ion-pairing agent.
- MS/MS Analysis: The eluting peptides are ionized (e.g., by ESI) and analyzed by a tandem mass spectrometer. The instrument performs data-dependent acquisition, selecting precursor ions for fragmentation.
- Data Processing: Use database search algorithms to match the acquired MS/MS spectra against the protein sequence. Identify and quantify modifications like deamidation (e.g., of asparagine in the PENNY peptide) and N-terminal pyroglutamic acid formation by their characteristic mass shifts [42].
Data Correlation and Interpretation
Correlating data from SDS-PAGE, SE-UPLC, and LC-MS/MS is essential for a definitive degradation profile. The following table summarizes the complementary quantitative data obtained from a forced degradation study of a monoclonal antibody under thermal stress (37°C and 50°C for up to 14 days) [42].
Table 1: Quantitative Data from Orthogonal Analysis of Thermally Stressed mAb
| Analytical Technique | Attribute Measured | Control Sample | After 14 days at 50°C | Key Findings |
|---|---|---|---|---|
| SDS-PAGE (Reducing) | Main Band (Light & Heavy Chains) | ~98% | Decrease | Confirmed fragmentation; increase in LMW species [42]. |
| Low Molecular Weight (LMW) Fragments | ~2% | Increase | ||
| SE-UPLC | Monomer Peak | >99% | ~92% | Quantified increase in soluble aggregates [42]. |
| High Molecular Weight (HMW) Aggregates | <1% | ~8% | ||
| LC-MS/MS (Peptide Mapping) | Unmodified PENNY Peptide | >95% | ~70% | Identified specific sites of deamidation [42]. |
| Deamidated PENNY Peptide | <5% | ~30% | ||
| N-terminal pE Formation | Baseline | Significant Increase | Detected cyclization at heavy chain N-terminus [42]. |
Interpretation of Correlated Data:
- A time- and temperature-dependent increase in LMW species observed in SE-UPLC and as faint bands in SDS-PAGE is corroborated by LC-MS/MS, which can identify specific cleavage sites or modifications leading to instability [42].
- The formation of HMW aggregates quantified by SE-UPLC may correlate with a decrease in the monomeric band intensity in SDS-PAGE. LC-MS/MS can help rule out non-covalent aggregates that would not be detected under denaturing SDS-PAGE conditions [42].
- LC-MS/MS provides the molecular identity behind subtle shifts in SE-UPLC retention times or SDS-PAGE mobility, such as confirming that a slight increase in apparent molecular weight is due to oxidation rather than aggregation.
The Scientist's Toolkit: Essential Research Reagent Solutions
The successful implementation of these protocols relies on specific, high-quality reagents and materials.
Table 2: Essential Materials for Degradation Profiling
| Reagent/Material | Function | Application Notes |
|---|---|---|
| SDS-PAGE Loading Buffer (with DTT/2-ME) | Denatures proteins, breaks disulfide bonds, and provides dye for tracking. | Essential for reducing SDS-PAGE to analyze heavy and light chains separately [42] [14]. |
| Precast Polyacrylamide Gels | Matrix for size-based separation of proteins. | Gradient gels (e.g., 4-20%) offer superior resolution for complex mixtures [87]. |
| SE-UPLC Column (e.g., BEH SEC) | Separates native proteins by hydrodynamic size. | Critical for accurate quantification of aggregates and fragments in formulation buffer [42]. |
| Trypsin, Sequencing Grade | Proteolytically digests proteins into peptides for LC-MS/MS. | Ensures specific cleavage and minimizes autolysis, which is vital for reproducible peptide mapping [42] [85]. |
| LC-MS/MS Grade Solvents | Mobile phase for chromatographic separation. | High-purity solvents (water, acetonitrile) with additives (formic acid) are necessary for optimal LC performance and MS sensitivity [88]. |
The orthogonal correlation of SDS-PAGE with SE-UPLC and LC-MS/MS establishes a powerful paradigm for the comprehensive degradation profiling of therapeutic proteins. This multi-tiered analytical strategy moves beyond simple molecular weight confirmation to provide a deep understanding of degradation pathways, encompassing fragmentation, aggregation, and specific chemical modifications. For researchers in drug development, adopting this workflow is indispensable for demonstrating biosimilarity, validating product stability, and ensuring the safety and efficacy of biotherapeutic products, thereby successfully bridging the gap from foundational research to regulatory submission.
The ICH Q2(R2) guideline provides a framework for the validation of analytical procedures for drug substances and products, including biopharmaceuticals. This guideline outlines key validation criteria to ensure that analytical methods are suitable for their intended purpose, covering aspects such as accuracy, precision, specificity, and linearity [89]. For biopharmaceutical development, where characterization of therapeutic proteins is critical, SDS-PAGE (Sodium Dodecyl Sulfate-Polyacrylamide Gel Electrophoresis) serves as a fundamental analytical technique for determining protein molecular weight and purity. When properly validated according to ICH Q2(R2) principles, SDS-PAGE provides reliable data that supports regulatory submissions and ensures product quality throughout the drug development lifecycle.
The application of ICH Q2(R2) to SDS-PAGE protocols requires careful consideration of the guideline's validation parameters within the context of electrophoretic separation. This involves establishing a validated method that demonstrates specificity for the target protein, precision across multiple experiments, and a linear range for molecular weight determination using standard proteins. The following sections provide detailed protocols and application notes for implementing ICH Q2(R2)-compliant SDS-PAGE methods for molecular weight determination of biopharmaceutical proteins.
ICH Q2(R2) Validation Parameters for SDS-PAGE
For SDS-PAGE to be considered validated under ICH Q2(R2), specific performance characteristics must be experimentally demonstrated. The table below summarizes these key validation parameters and their application to SDS-PAGE methodology:
Table 1: ICH Q2(R2) Validation Parameters Applied to SDS-PAGE
| Validation Parameter | ICH Q2(R2) Requirement | Application to SDS-PAGE |
|---|---|---|
| Accuracy | Closeness between measured and accepted reference value | Comparison of measured molecular weight to reference standard using known protein standards |
| Precision | Closeness between a series of measurements | Multiple runs of the same protein sample on different gels and days to determine reproducibility (typically 5-10% CV) |
| Specificity | Ability to assess analyte unequivocally | Resolution of target protein from degradants, impurities, or matrix components; use of reducing and non-reducing conditions |
| Linearity | Ability to obtain results proportional to analyte concentration | Plot of log(MW) versus migration distance (Rf) producing a linear standard curve (R² > 0.95) |
| Range | Interval between upper and lower levels of analyte | Molecular weight range appropriate for gel percentage (e.g., 15-100 kDa for 10% gel) |
| Detection Limit | Lowest amount of analyte detected | Minimal protein amount producing a visible band (e.g., 10-50 ng for Coomassie; 1-10 ng for silver stain) |
| Quantitation Limit | Lowest amount of analyte quantified | Minimal protein amount for reliable densitometric quantification |
The validation process begins with defining the analytical target profile, which for SDS-PAGE typically includes molecular weight determination with an accuracy of 5-10% [37] [90], purity assessment, and identity confirmation. Specific acceptance criteria should be established prospectively for each validation parameter based on the intended use of the method in biopharmaceutical development.
Materials and Reagents
Research Reagent Solutions
Table 2: Essential Reagents for Validated SDS-PAGE
| Reagent/Material | Function | Validation Considerations |
|---|---|---|
| SDS (Sodium Dodecyl Sulfate) | Anionic detergent that denatures proteins and confers uniform negative charge | High purity (>99%); consistent protein-to-SDS binding ratio (1.4g SDS/g protein) [7] |
| Reducing Agents (DTT, β-mercaptoethanol) | Breaks disulfide bonds for complete unfolding | Fresh preparation; concentration optimization to ensure complete reduction [37] |
| Polyacrylamide Gel | Molecular sieve for size-based separation | Consistent polymerization; appropriate percentage for target protein size range [91] [7] |
| Molecular Weight Standards | Calibration references for molecular weight determination | Well-characterized proteins covering linear range; stability data [37] [91] |
| Electrophoresis Buffer (Tris-Glycine) | Conducts current and maintains pH during separation | Precise pH (8.3) and conductivity; fresh preparation to prevent degradation |
| Staining Solutions (Coomassie, Silver Stain) | Visualizes separated protein bands | Consistent sensitivity; linear response for quantification [91] [7] |
Validated SDS-PAGE Protocol for Molecular Weight Determination
Sample Preparation
Proper sample preparation is critical for accurate molecular weight determination. The protocol must be standardized and controlled to ensure reproducibility:
Protein Denaturation: Mix protein samples with SDS-PAGE sample buffer (62.5 mM Tris-HCl, pH 6.8, 2% SDS, 10% glycerol, 0.01% bromophenol blue) containing 50 mM DTT or 5% β-mercaptoethanol as reducing agent [37] [7].
Heat Denaturation: Heat samples at 95°C for 5-10 minutes to ensure complete denaturation. Avoid excessive heating that may cause protein degradation.
Protein Load Optimization: Load appropriate protein amounts (typically 0.5-5 μg for Coomassie staining, less for silver stain) based on linear detection range. Include molecular weight standards and appropriate controls in each gel.
Gel Electrophoresis
The electrophoresis conditions must be controlled to ensure precise and reproducible separation:
Gel Selection: Choose appropriate acrylamide concentration based on target protein size:
- 12-15% gels for proteins 10-60 kDa
- 10% gels for proteins 15-100 kDa
- 8% gels for proteins 25-200 kDa [7]
- Gradient gels (e.g., 4-20%) for broad molecular weight range
Electrophoresis Conditions:
- Assemble gel apparatus with running buffer (25 mM Tris, 192 mM glycine, 0.1% SDS, pH 8.3)
- Load samples and standards in randomized fashion to minimize position effects
- Run at constant voltage (100-150 V) until dye front reaches bottom of gel (approximately 40-60 minutes) [7]
- Maintain consistent temperature (4-25°C) throughout run
Protein Detection and Visualization
Post-electrophoresis processing must be standardized for accurate analysis:
Staining Protocol:
- Coomassie Staining: Incubate gel in 0.1% Coomassie Brilliant Blue R-250 (in 40% methanol, 10% acetic acid) for 1 hour with gentle agitation
- Destaining: Remove excess stain with multiple changes of destaining solution (40% methanol, 10% acetic acid) until background is clear and bands are visible [91]
- Alternative Stains: Silver stain or fluorescent stains may be used for enhanced sensitivity with appropriate validation
Gel Documentation:
- Capture high-resolution digital images under consistent lighting conditions
- Include grayscale standards for densitometric calibration
- Ensure image is not saturated to maintain quantitative accuracy
Data Analysis and Regulatory Compliance
Molecular Weight Calculation
Accurate molecular weight determination requires precise measurement and calculation:
Migration Distance Measurement:
- Measure migration distance from top of separating gel to each protein band (standards and samples)
- Calculate relative migration (Rf) for each band: Rf = migration distance of protein / migration distance of dye front [37]
Standard Curve Generation:
- Plot log(MW) of standards versus Rf values
- Generate linear regression curve: y = mx + b, where y = log(MW), x = Rf [37]
- Verify linearity with R² > 0.95 across the measurement range
Unknown Protein Molecular Weight:
- Calculate Rf for unknown protein bands
- Interpolate molecular weight from standard curve: MW = 10^(m*Rf + b) [37]
- Report mean ± standard deviation from multiple replicates (minimum n=3)
Validation Documentation
Comprehensive documentation is essential for regulatory compliance:
Validation Protocol: Prospective document outlining experimental design, acceptance criteria, and statistical methods
Validation Report: Summary of collected data, statistical analysis, and conclusion regarding method validity
Standard Operating Procedure: Detailed step-by-step protocol for routine use of the validated method
Troubleshooting and Method Optimization
Even properly validated methods may encounter issues during routine use. The table below addresses common SDS-PAGE problems and their solutions:
Table 3: Troubleshooting Guide for Validated SDS-PAGE
| Issue | Potential Causes | Solutions | Impact on Validation |
|---|---|---|---|
| Blurry Bands | Incomplete denaturation, protein aggregation, improper gel polymerization | Extend heating time during denaturation, add fresh reducing agents, ensure complete gel polymerization | Affects accuracy and precision of molecular weight determination |
| Smiling/Frowning Bands | Uneven heating, buffer ion depletion, uneven gel thickness | Use cooling during electrophoresis, prepare fresh running buffer, ensure even gel casting | Impacts migration distance measurement and standard curve linearity |
| High Background | Insufficient destaining, contaminated reagents | Extend destaining time with multiple changes, prepare fresh solutions | Reduces sensitivity and affects quantification accuracy |
| Non-linear Standard Curve | Inappropriate gel percentage, incomplete protein denaturation | Select appropriate gel percentage for protein size range, ensure complete reduction and denaturation | Prevents accurate molecular weight interpolation |
| Poor Band Resolution | Incorrect voltage, old running buffer, improper sample load | Optimize voltage (100-150 V), use fresh running buffer, adjust protein load | Affects specificity and ability to distinguish closely sized proteins |
Experimental Workflow and Signaling Pathways
The following workflow diagram illustrates the complete validated SDS-PAGE process for molecular weight determination:
Diagram 1: Validated SDS-PAGE Workflow
Implementation of SDS-PAGE for molecular weight determination under ICH Q2(R2) guidelines provides a validated framework that ensures data reliability and regulatory compliance throughout biopharmaceutical development. By establishing method validation parameters specifically tailored to electrophoretic separation—including accuracy, precision, specificity, and linearity—researchers can generate robust molecular weight data with defined accuracy ranges of 5-10% [37] [90]. The protocols and application notes detailed in this document provide a comprehensive approach for meeting regulatory standards while maintaining scientific rigor in protein characterization. Proper documentation, troubleshooting, and continuous method verification ensure that the SDS-PAGE method remains in a validated state throughout its lifecycle, supporting the development of safe and effective biopharmaceutical products.
Conclusion
SDS-PAGE remains a cornerstone technique for protein molecular weight determination, providing a robust, accessible, and highly informative foundation for biomedical research and biopharmaceutical development. Mastering its principles, from the precise chemistry of the discontinuous buffer system to the optimization of electrophoresis parameters, is essential for generating reliable and reproducible data. Effective troubleshooting of common issues like poor band separation ensures data integrity, while validation against orthogonal methods like CE-SDS strengthens analytical findings for regulatory submissions. As the field advances, the integration of SDS-PAGE with high-resolution techniques and automated platforms will continue to enhance its utility in characterizing complex biologics, assessing biosimilarity, and ensuring the quality and stability of next-generation therapeutics, solidifying its indispensable role in the scientific and clinical toolkit.
References
- 1. Applications and Advantages of SDS-PAGE in Protein ... [https://www.mtoz-biolabs.com/applications-and-advantages-of-sds-page-in-protein-molecular-weight-determination.html]
- 2. Protein Electrophoresis Using SDS-PAGE: A Detailed ... [https://www.goldbio.com/blogs/articles/protein-electrophoresis-sds-page-overview?srsltid=AfmBOorFFUQmzR4Xlln3zDjFetDNGk6F-P1sVSRHVjOMJm8_s1thjT4j]
- 3. Native SDS-PAGE: High Resolution Electrophoretic ... [https://pmc.ncbi.nlm.nih.gov/articles/PMC4517606/]
- 4. Deciphering food proteins: The applications of SDS-PAGE ... [https://www.sciencedirect.com/science/article/abs/pii/S2212429225003025]
- 5. SDS-PAGE: A Cornerstone of Protein Analysis in Modern ... [https://www.metwarebio.com/sds-page-protein-analysis/]
- 6. How Does SDS-PAGE Work? A Comprehensive Guide [https://www.metwarebio.com/how-sds-page-works-guide/]
- 7. SDS-PAGE guide: Sample preparation to analysis [https://www.abcam.com/en-us/knowledge-center/western-blot/sds-page-guide]
- 8. Protocol for Polyacrylamide Gel Electrophoresis (PAGE) [https://www.creative-proteomics.com/resource/protocol-for-polyacrylamide-gel-electrophoresis-page.htm]
- 9. An Easy SDS-PAGE Gel Recipe & 10-Step Protocol [https://bitesizebio.com/59429/sds-page-gel-recipe/]
- 10. SDS-PAGE: The science behind all those bubbles [https://www.antibodiesinc.com/pages/sds-page-demystified?srsltid=AfmBOoqMegmSpe-YV-0vh08oObXt7i3WIaj3Q7Q8RXvNtU-sHOabqFhK]
- 11. Overview of Protein Electrophoresis [https://www.thermofisher.com/us/en/home/life-science/protein-biology/protein-biology-learning-center/protein-biology-resource-library/pierce-protein-methods/overview-electrophoresis.html]
- 12. One-Dimensional SDS and Non-Denaturing Gel ... [https://www.thermofisher.com/us/en/home/references/protocols/proteins-expression-isolation-and-analysis/sds-page-protocol/one-dimensional-sds-and-non-denaturing-gel-electrophoresis.html]
- 13. The gradient-like separation and reduced running time with ... [https://www.sciencedirect.com/science/article/abs/pii/S0003269722002457]
- 14. SDS-PAGE Protocol [https://neutab.creative-biolabs.com/sds-page-analysis.htm]
- 15. SDS-PAGE SDS Running Buffer (10x) [https://www.novoprolabs.com/tools/buffer-preparations-and-recipes/sds-page-sds-running-buffer-10x]
- 16. SDS-PAGE: The science behind all those bubbles [https://www.antibodiesinc.com/pages/sds-page-demystified?srsltid=AfmBOorXoZw2BI9cgYAZLRx9KybE7DwKzYcDUkr1X0QTScZayP-XjOC6]
- 17. TEMED - FAQs [https://www.thermofisher.com/store/v3/products/faqs/17919]
- 18. TEMED: Safety Data Sheet, National Diagnostics [https://www.nationaldiagnostics.com/safety_data/sds_product12.php?cat_num=EC-503]
- 19. Tris-Glycine Buffer pH 8.3, pHast Packâ„¢, powder [https://www.sigmaaldrich.com/US/en/product/sial/ppb015?srsltid=AfmBOoq8T8OipRDukvm4B3Aqu3s4tQIY26GG-imA_ghkHdHFOanNzsVO]
- 20. Protein Molecular Weight Marker (MB-201-0200) [https://www.rockland.com/categories/supporting-reagents/protein-molecular-weight-marker-MB-201-0200/?srsltid=AfmBOopEoGl4S5Jj6QJ6_VJrrDTJx0FxJDVzxF_UomPtf8ycgvHpF0cY]
- 21. SDS-PAGE Protocol [https://www.rockland.com/resources/sds-page-protocol/?srsltid=AfmBOoovzqHsiEXNlD_zF8FfWqQwxXfm8nXo00HunESM5PLwhVaI1Abd]
- 22. 13.11: Lab Technique - SDS-PAGE [https://bio.libretexts.org/Courses/West_Los_Angeles_College/Biotechnology/13%3A_Biotechnology_Lab_Protocols/13.11%3A_Lab_Technique_-_SDS-PAGE]
- 23. Preparing protein samples for sds-page [https://www.ruf.rice.edu/~bioslabs/studies/sds-page/denature.html]
- 24. Troubleshooting SDS-PAGE Sample Preparation Issues [https://www.goldbio.com/blogs/articles/troubleshooting-sds-page-sample-preparation-issues?srsltid=AfmBOoqk5oFXO3VZW2xbqOBMwWzWfD5ifeeqeOgRMbuV6PECfhu6n8EB]
- 25. SDS Page Protocol [https://www.neobiotechnologies.com/protocol/sds-page-protocol/?srsltid=AfmBOorP6yZudNZGOPFs6t__XR1GbfuY1GakpMm8LaeqkSilDI-jPcx7]
- 26. SDS-PAGE Optimization for Western Blot [https://www.bosterbio.com/protocol-and-troubleshooting/western-blotting-optimization/sds-page?srsltid=AfmBOor-usSrtVWht6052zCPPAABu9oMV7q3ICcX8KiVFTzhkYfI8pR9]
- 27. SDS-PAGE Optimization for Western Blot [https://www.bosterbio.com/protocol-and-troubleshooting/western-blotting-optimization/sds-page?srsltid=AfmBOorYKZJ6nOea9vpXPlRru1N3ktRen3dzWfR1Fea3leVCOr7mn7PI]
- 28. Electrophoresis in western blot [https://www.abcam.com/en-us/technical-resources/guides/western-blot-guide/electrophoresis]
- 29. How to choose an acrylamide gel concentration for western ... [https://hellobio.com/how-to-choose-an-acrylamide-gel-concentration-for-western-blot/]
- 30. SDS-PAGE and Western Blot Protocol [https://www.bostonbioproducts.com/resources/western-blotting-protocol/]
- 31. SDS-PAGE [https://en.wikipedia.org/wiki/SDS-PAGE]
- 32. Western blotting guide: Part 2, Protein separation by SDS- ... [https://www.jacksonimmuno.com/secondary-antibody-resource/technical-tips/western-blotting-guide-part-2/]
- 33. How current, voltage, and power settings affect SDS-PAGE [https://www.biossusa.com/blogs/news/how-current-voltage-and-power-settings-affect-sds-page?srsltid=AfmBOoo__2A2eBoFFle4--L52B76lZsOsPN9eWOCiyuicbCKiZkL-nl0]
- 34. Constant Current or Voltage in SDS-PAGE [https://bitesizebio.com/51744/constant-current-or-voltage-in-sds-page/]
- 35. Troubleshooting SDS-PAGE Gel Running Issues [https://www.goldbio.com/blogs/articles/troubleshooting-sds-page-gel-running-issues?srsltid=AfmBOoq-m8E7gtqimBplv7bg1fzyflIMwlMbox_18SNwGIYl5Wh4jO17]
- 36. SDS PAGE [https://www.protocols.io/view/sds-page-g7hubzj6x.html]
- 37. Determining Protein Molecular Weight with SDS-PAGE [https://info.gbiosciences.com/blog/bid/196974/determining-protein-molecular-weight-with-sds-page-an-overview-of-the-process]
- 38. How to Analyse Western Blots [https://hellobio.com/how-to-analyse-western-blots/]
- 39. Using Rf value to calculate molecular weight [https://stjohnslabs.com/blog/using-rf-value-to-calculate-molecular-weight?srsltid=AfmBOoqNdFhFSfMTkW6O2oL5nplZd-n1m0b95xOiCxJiSbN7Fre9z5XC]
- 40. Western Blot SDS-PAGE [https://www.novusbio.com/support/support-by-application/western-blot-sds-page?srsltid=AfmBOoq9hIOO6zfwA8vVWVHp4cRXRnhrTatHLQp7O8D2blNzF6Lc82G-]
- 41. Protein quantification in SDS‑PAGE gels by densitometry ... [https://www.protocols.io/view/protein-quantification-in-sds-page-gels-by-densito-g8aubzsex.html]
- 42. Assessing the Comparability of Degradation Profiles ... [https://pmc.ncbi.nlm.nih.gov/articles/PMC12472202/]
- 43. Comparative Forced Degradation Study of Anticomplement ... [https://www.mdpi.com/1424-8247/18/4/579]
- 44. Forced Degradation Studies: Regulatory Considerations ... [https://www.biopharminternational.com/view/forced-degradation-studies-regulatory-considerations-and-implementation]
- 45. 6 Best Tips for Troubleshooting Poor Band Separation on ... [https://azurebiosystems.com/blog/6-tips-for-troubleshooting-poor-band-separation-on-sds-page-gels/]
- 46. The principle and method of polyacrylamide gel ... [https://www.mblbio.com/bio/g/support/method/sds-page.html]
- 47. SDS-PAGE Protocol [https://www.rockland.com/resources/sds-page-protocol/?srsltid=AfmBOor7EtVy3DJceStbLitdBxFDjxDGlCuyyFdZkuilX_H3Z39X2YiY]
- 48. Troubleshooting Sodium Dodecyl Sulfate- Polyacrylamide ... [https://www.hycultbiotech.com/sds-page/troubleshooting/]
- 49. Troubleshooting SDS-PAGE Gel Running Issues [https://www.goldbio.com/blogs/articles/troubleshooting-sds-page-gel-running-issues?srsltid=AfmBOopFTJZxOKpLolj3G3B343-igIfq5nPNkprrpzAVJdewdsDAYFOm]
- 50. Protein analysis SDS PAGE [https://www.qiagen.com/us/knowledge-and-support/knowledge-hub/bench-guide/protein/protein-analysis/protein-analysis-sds-page]
- 51. Troubleshooting SDS-PAGE Gel Running Issues [https://www.goldbio.com/blogs/articles/troubleshooting-sds-page-gel-running-issues?srsltid=AfmBOoqMejJh5sUQTPGGYXzY-Vd14_8l1kbLNh2HSY0eUiEGsz-rGLIB]
- 52. Tips for Optimal SDS-PAGE Separation [https://www.rockland.com/resources/tips-for-optimal-sds-page-separation/?srsltid=AfmBOorBRPAMoZPUvC_2WXMePOxTAsFkeiZv4FYvecmnPAXlWK5PZSlH]
- 53. SDS-PAGE: The science behind all those bubbles [https://www.antibodiesinc.com/pages/sds-page-demystified?srsltid=AfmBOoqouhN3UzCyqicsSsOys7MXxjRQHS3I8JPWjjp2Sc_0Xr44rydl]
- 54. Western Blot SDS-PAGE [https://www.novusbio.com/support/support-by-application/western-blot-sds-page?srsltid=AfmBOorRFlgL3lGA6DYl4sQd10bwQyl7l0IOH7XYBOEqsmf5EFzm4hg-]
- 55. Optimizing Gel Electrophoresis: Best Practices for Sample ... [https://www.gelepchina.com/news/optimizing-gel-electrophoresis-best-practices-for-sample-volume-voltage-and-timing/]
- 56. SDS-PAGE Protocol [https://www.rockland.com/resources/sds-page-protocol/?srsltid=AfmBOoocrjC16LbC9y1ywY6XvgR28WQppbPNEyBc-mmTm6c7eDStmiAj]
- 57. SDS-PAGE - Mullins Lab - [https://mullinslab.ucsf.edu/sds-page/]
- 58. Strategies for the Assessment of Protein Aggregates ... [https://pmc.ncbi.nlm.nih.gov/articles/PMC3063870/]
- 59. Overview of SDS-PAGE [https://www.creative-proteomics.com/resource/overview-of-sds-page.htm]
- 60. SDS-PAGE Protocol [https://www.rockland.com/resources/sds-page-protocol/?srsltid=AfmBOoox4g0IrVw9X1NCdOAG3QTLpB5k56XaOmIXqT0xCQ-P24efj6Fl]
- 61. 4X Protein Loading Buffer [https://www.licorbio.com/support/contents/reagents/loading-buffer/4x-protein-loading-buffer.html]
- 62. | BIT - iGEM 2025 [https://2025.igem.wiki/bit/results]
- 63. Challenges in the Determination of Protein Aggregates ... [https://www.chromatographyonline.com/view/challenges-determination-protein-aggregates-part-ii]
- 64. Agarose Gels Do Not Polymerise! [https://bitesizebio.com/10248/agarose-gels-do-not-polymerise/]
- 65. SDS-PAGE Tips and Tricks to Save You Time [https://bitesizebio.com/28798/sds-page-tips-tricks-save-time/]
- 66. Troubleshooting SDS-PAGE Gel Running Issues [https://www.goldbio.com/blogs/articles/troubleshooting-sds-page-gel-running-issues?srsltid=AfmBOor0xC0CcehEu7dq6b16CGiOWXDGJPMV7I92IidMVRwmbPEvJjJo]
- 67. Polyacrylamide Gel Electrophoresis, How It Works, ... [https://www.technologynetworks.com/analysis/articles/polyacrylamide-gel-electrophoresis-how-it-works-technique-variants-and-its-applications-359100]
- 68. Protein Electrophoresis Using SDS-PAGE: A Detailed ... [https://www.goldbio.com/blogs/articles/protein-electrophoresis-sds-page-overview?srsltid=AfmBOopzwG9KUeEcDKu5uSiQ3PYgCKw99eRuStaH_OR1CTX1nj5B6klR]
- 69. Acrylamide concentration determines the direction and ... [https://pmc.ncbi.nlm.nih.gov/articles/PMC3785759/]
- 70. Analysis of RNA by Analytical Polyacrylamide Gel ... [https://www.sciencedirect.com/science/article/pii/B9780124200371000166]
- 71. Fast reversible single-step method for enhanced band ... [https://pmc.ncbi.nlm.nih.gov/articles/PMC4672689/]
- 72. Achieving Robustness in Analytical Methods [https://www.numberanalytics.com/blog/achieving-robustness-in-analytical-methods]
- 73. Performance Characteristics In Analytical Method Validation [https://gmpinsiders.com/performance-characteristics-method-validation/]
- 74. The 6 Key Aspects of Analytical Method Validation [https://www.elementlabsolutions.com/uk/chromatography-blog/post/6-key-aspects-of-analytical-method-validation]
- 75. SDS PAGE: Principle, Protocol, And Reliable Application [https://chemistnotes.com/biochemistry/sds-page-principle/]
- 76. The principle and method of polyacrylamide gel electrophoresis... [https://ruo.mbl.co.jp/bio/e/support/method/sds-page.html]
- 77. Sodium-Dodecyl-Sulfate-polyacrylamid gel electrophoresis [https://www.hycultbiotech.com/sds-page/]
- 78. One-dimensional SDS-Polyacrylamide Gel Electrophoresis ... [https://www.sciencedirect.com/science/chapter/bookseries/pii/B9780124201194000124]
- 79. Resolve SDS-PAGE Disadvantages with CE-SDS [https://www.bio-techne.com/instruments/ice/advantages-ce-sds-over-sds-page]
- 80. Comparing SDS-PAGE and CE-SDS for Antibody Purity ... [https://www.bioprocessintl.com/qa-qc/comparing-sds-page-and-ce-sds-for-antibody-purity-analysis]
- 81. CE-SDS: Old Dog, New Tricks? [https://biopharmaspec.com/blog/ce-sds-biopharmaceutical-development/]
- 82. Advantages and Disadvantages of Protein Isoform Analysis ... [https://www.mtoz-biolabs.com/advantages-and-disadvantages-of-protein-isoform-analysis-by-ce-sds.html]
- 83. A comparative study of CE-SDS, SDS-PAGE, and Simple ... [https://pubmed.ncbi.nlm.nih.gov/33185281/]
- 84. Applications of CE SDS Gel in Development ... [https://pubmed.ncbi.nlm.nih.gov/18803223/]
- 85. Orthogonal liquid chromatography–mass spectrometry ... [https://www.sciencedirect.com/science/article/abs/pii/S002196731730331X]
- 86. Multidimensional Separation Techniques for ... [https://www.chromatographyonline.com/view/multidimensional-separation-techniques-characterization-biotherapeutics]
- 87. SDS Page Protocol [https://www.neobiotechnologies.com/protocol/sds-page-protocol/?srsltid=AfmBOopLtrIi3ujzznKFpSrD9DFomaxM6hLSQVfibABL1NsuFUk2EzYT]
- 88. A rapid, reproducible, on-the-fly orthogonal array ... [https://pmc.ncbi.nlm.nih.gov/articles/PMC2883886/]
- 89. ICH Q2(R2) Validation of analytical procedures [https://www.ema.europa.eu/en/ich-q2r2-validation-analytical-procedures-scientific-guideline]
- 90. Determination of Protein Molecular Weights on SDS-PAGE [https://pubmed.ncbi.nlm.nih.gov/30426411/]
- 91. Analysis of SDS-PAGE Gel Electrophoresis Results [https://www.mtoz-biolabs.com/analysis-of-sds-page-gel-electrophoresis-results.html]